Exhibit 99.2

Management’s discussion and analysis
for the quarter ended March 31, 2013
| | | | |
FIRST QUARTER UPDATE | | | 4 | |
CONSOLIDATED FINANCIAL RESULTS | | | 8 | |
OUTLOOK FOR 2013 | | | 13 | |
LIQUIDITY AND CAPITAL RESOURCES | | | 14 | |
FINANCIAL RESULTS BY SEGMENT | | | | |
URANIUM | | | 16 | |
FUEL SERVICES | | | 20 | |
NUKEM | | | 21 | |
ELECTRICITY | | | 23 | |
OUR OPERATIONS AND DEVELOPMENT PROJECT | | | 25 | |
URANIUM 2013 Q1 UPDATES | | | 26 | |
FUEL SERVICES 2013 Q1 UPDATES | | | 27 | |
QUALIFIED PERSONS | | | 28 | |
ADDITIONAL INFORMATION | | | 28 | |
This management’s discussion and analysis (MD&A) includes information that will help you understand management’s perspective of our unaudited condensed consolidated interim financial statements and notes for the quarter ended March 31, 2013 (interim financial statements). The information is based on what we knew as of April 30, 2013 and updates the annual MD&A included in our 2012 annual financial review.
As you review this MD&A, we encourage you to read our interim financial statements as well as our audited consolidated financial statements and notes for the year ended December 31, 2012 and annual MD&A. You can find more information about Cameco, including our audited consolidated financial statements and our most recent annual information form, on our website at cameco.com, on SEDAR at sedar.com or on EDGAR at sec.gov. You should also read our annual information form before making an investment decision about our securities.
The financial information in this MD&A and in our financial statements and notes are prepared according to International Financial Reporting Standards (IFRS), unless otherwise indicated.
Unless we have specified otherwise, all dollar amounts are in Canadian dollars.
Throughout this document, the termswe, us, ourandCamecomean Cameco Corporation and its subsidiaries, including NUKEM Energy Gmbh (NUKEM), unless otherwise indicated.
Caution about forward-looking information
Our MD&A includes statements and information about our expectations for the future. When we discuss our strategy, plans, future financial and operating performance, or other things that have not yet taken place, we are making statements considered to be forward-looking information or forward-looking statements under Canadian and United States securities laws. We refer to them in this MD&A as forward-looking information.
Key things to understand about the forward-looking information in this MD&A:
| • | It typically includes words and phrases about the future, such as: anticipate, believe, estimate, expect, plan, will, intend, goal, target, forecast, project, strategy and outlook (see examples below). |
| • | It represents our current views, and can change significantly. |
| • | It is based on a number of material assumptions, including those we have listed on page 3, which may prove to be incorrect. |
| • | Actual results and events may be significantly different from what we currently expect, due to the risks associated with our business. We list a number of these material risks on pages 2 and 3. We recommend you also review our annual information form and our annual MD&A, which include a discussion of other material risks that could cause actual results to differ significantly from our current expectations. |
| • | Forward-looking information is designed to help you understand management’s current views of our near and longer term prospects, and it may not be appropriate for other purposes. We will not necessarily update this information unless we are required to by securities laws. |
Examples of forward-looking information in this MD&A
| • | the discussion under the headingOur strategy,including our strategy for increasing annual uranium supply to 36 million pounds by 2018 |
| • | our expectations about 2013 and future global uranium supply, consumption, demand, and nuclear generating capacity, including the discussion under the headingUranium market update |
| • | our expectation that existing cash balances and operating cash flows will meet anticipated 2013 capital requirements without the need for any significant additional funding |
| • | the outlook for each of our operating segments for 2013, and our consolidated outlook for the year |
| • | our expectation that we will continue to invest in expanding our production capacity at our existing mines and advancing projects as we pursue our growth strategy |
| • | our expectation that our operating and investment activities in 2013 will not be constrained by the financial covenants in our unsecured revolving credit facility |
| • | our uranium price sensitivity analysis |
| • | our expectations about changes to Saskatchewan uranium royalty systems |
| • | our expectations relating to our tax dispute with Canada Revenue Agency (CRA) and future tax reassessments by CRA |
| • | forecast production at our uranium operations from 2013 to 2017 |
| • | our future plans for each of our uranium operating properties and development project |
| • | our expectations regarding Cigar Lake |
Material risks
| • | actual sales volumes or market prices for any of our products or services are lower than we expect for any reason, including changes in market prices or loss of market share to a competitor |
| • | we are adversely affected by changes in foreign currency exchange rates, interest rates or tax rates, or we are unsuccessful in our dispute with the CRA |
| • | our production costs are higher than planned, or necessary supplies are not available, or not available on commercially reasonable terms |
| • | our estimates of production, purchases, costs, decommissioning or reclamation expenses, or our tax expense estimates, prove to be inaccurate |
| • | we are unable to enforce our legal rights under our existing agreements, permits or licences, or are subject to litigation or arbitration that has an adverse outcome |
| • | there are defects in, or challenges to, title to our properties |
| • | our mineral reserve and resource estimates are not reliable, or we face unexpected or challenging geological, hydrological or mining conditions |
| • | we are affected by environmental, safety and regulatory risks, including increased regulatory burdens or delays |
| • | we cannot obtain or maintain necessary permits or approvals from government authorities |
| • | we are affected by political risks in a developing country where we operate |
| • | we are affected by terrorism, sabotage, blockades, civil unrest, social or political activism, accident or a deterioration in political support for, or demand for, nuclear energy |
| • | we are impacted by changes in the regulation or public perception of the safety of nuclear power plants, which adversely affect the construction of new plants, the relicensing of existing plants and the demand for uranium |
2 CAMECO CORPORATION
| • | there are changes to government regulations or policies that adversely affect us, including tax and trade laws and policies |
| • | our uranium and conversion suppliers fail to fulfill delivery commitments |
| • | our Cigar Lake development, mining or production plans are delayed or do not succeed, including as a result of any difficulties encountered with the jet boring mining method or our inability to acquire any of the required jet boring equipment |
| • | our McArthur River development, mining or production plans are delayed or do not succeed |
| • | we are affected by natural phenomena, including inclement weather, fire, flood and earthquakes |
| • | our operations are disrupted due to problems with our own or our customers’ facilities, the unavailability of reagents, equipment, operating parts and supplies |
| | critical to production, equipment failure, lack of tailings capacity, labour shortages, labour relations issues (including an inability to renew agreements with unionized employees at McArthur River, Key Lake or the Port Hope conversion facility), strikes or lockouts, underground floods, cave ins, ground movements, tailings dam failures, transportation disruptions or accidents, or other development and operating risks |
| • | NUKEM’s actual uranium sales volume, cash flows and revenue in 2013 and in the future are lower than expected due to losses in connection with spot market purchases, counterparty default on payment or other obligations, counterparty insolvency or other risks |
| • | departure of key personnel at NUKEM could have an adverse effect on continuing operations |
Material assumptions
| • | our expectations regarding sales and purchase volumes and prices for uranium, fuel services and electricity |
| • | our expectations regarding the demand for uranium, the construction of new nuclear power plants and the relicensing of existing nuclear power plants not being more adversely affected than expected by changes in regulation or in the public perception of the safety of nuclear power plants |
| • | our expected production level and production costs |
| • | the assumptions regarding market conditions upon which we have based our capital expenditure expectations |
| • | our expectations regarding spot prices and realized prices for uranium, and other factors discussed on page 18,Price sensitivity analysis: uranium |
| • | our expectations regarding tax rates and payments, the outcome of the dispute with the CRA, foreign currency exchange rates and interest rates |
| • | our decommissioning and reclamation expenses |
| • | our mineral reserve and resource estimates, and the assumptions upon which they are based, are reliable |
| • | the geological, hydrological and other conditions at our mines |
| • | the success of our Cigar Lake development, mining and production plans, including the success of the jet boring mining method at Cigar Lake and that we will be able to obtain the additional jet boring systems we require on schedule |
| • | the success of our McArthur River development, mining and production plans |
| • | our ability to continue to supply our products and services in the expected quantities and at the expected times |
| • | our ability to comply with current and future environmental, safety and other regulatory requirements, and to obtain and maintain required regulatory approvals |
| • | our operations are not significantly disrupted as a result of political instability, nationalization, terrorism, sabotage, blockades, civil unrest, breakdown, natural disasters, governmental or political actions, litigation or arbitration proceedings, the unavailability of reagents, equipment, operating parts and supplies critical to production, labour shortages, labour relations issues (including an inability to renew agreements with unionized employees at McArthur River, Key Lake or the Port Hope conversion facility), strikes or lockouts, underground floods, cave ins, ground movements, tailings dam failure, lack of tailings capacity, transportation disruptions or accidents or other development or operating risks |
| • | NUKEM’s actual uranium sales volume, cash flows and revenue in 2013 and in the future will be consistent with our expectations |
| • | key personnel will remain with NUKEM |
2013 FIRST QUARTER REPORT 3
Our strategy
Over the last several years, we have expanded in anticipation of significant growth in the nuclear space. Since the 2011 events in Japan, we have experienced a marked slowdown in our industry and drop in the uranium price – all against a backdrop of greater global economic uncertainty. While the long-term outlook remains positive, we expect uncertainty to continue over the near to medium term.
To ensure we remain competitive and optimize our earnings through this challenging economic period, we intensified the review of our cost structure during the first quarter.
This detailed review led us to some restructuring decisions, which resulted in a reduction in the workforce and created some restructuring costs. Our goal is to make the company a more efficient, streamlined and standardized organization – prepared to weather the current uncertainty in the market, increase our focus on execution, and be ready for the sustained long-term growth we expect.
We are still planning for growth, but at a slower pace. Our strategy is to increase annual uranium supply to 36 million pounds by 2018, subject to market conditions, and to invest in opportunities across the nuclear fuel cycle that we expect will complement and enhance our business. Lead-times in our industry are long, so we are preparing our assets today to make sure we can be among the first to respond when the market signals new production is needed.
We plan to achieve our growth with a focus on enhancing our nearer term financial picture by spreading our capital spending over a longer period and decreasing project related expenses. The projects we are pursuing to contribute to our target of 36 million pounds of annual supply by 2018 are those that provide the most certainty in the near-term, and are primarily brownfield development and expansions at operating properties, as well as our Cigar Lake development project.
Of course, all of our project decisions will depend upon market conditions and profitability. We continue to monitor the market closely, and will adjust our plans in response to market signals.
You can read more about our strategy in our 2012 annual MD&A.
First quarter update
Starting this quarter,IFRS 11 – Joint Arrangements requires that we account for our interest in Bruce Power Limited Partnership (BPLP) using equity accounting. Our quarterly results for 2012 have been restated for comparative purposes.
Our performance
| | | | | | | | | | | | |
HIGHLIGHTS ($ MILLIONS EXCEPT WHERE INDICATED) | | THREE MONTHS
ENDED MARCH 31 | | | CHANGE | |
| | 2013 | | | 2012 | | |
Revenue | | | 444 | | | | 466 | | | | (5 | )% |
Gross Profit | | | 95 | | | | 150 | | | | (37 | )% |
Net earnings attributable to equity holders | | | 9 | | | | 129 | | | | (93 | )% |
$ per common share (diluted) | | | 0.02 | | | | 0.33 | | | | (94 | )% |
Adjusted net earnings (non-IFRS, see page 8) | | | 27 | | | | 121 | | | | (78 | )% |
$ per common share (adjusted and diluted) | | | 0.07 | | | | 0.31 | | | | (77 | )% |
Cash provided by operations (after working capital changes) | | | 269 | | | | 374 | | | | (28 | )% |
FIRST QUARTER
Net earnings attributable to equity holders (net earnings) this quarter were $9 million ($0.02 per share diluted) compared to $129 million ($0.33 per share diluted) in the first quarter of 2012. In addition to the items noted below, net earnings were impacted by mark-to-market losses on foreign exchange derivatives.
4 CAMECO CORPORATION
On an adjusted basis, our earnings this quarter were $27 million ($0.07 per share diluted) compared to $121 million ($0.31 per share diluted) (non-IFRS measure, see page 8) in the first quarter of 2012, mainly due to:
| • | lower earnings from our uranium segment based on lower sales volumes and lower realized prices |
| • | lower earnings from our electricity segment based on lower generation and higher operating costs |
| • | higher expenditures for administration due to the addition of NUKEM’s administration and advisory fee, and costs for corporate restructuring as described inOur strategy on page 4. |
SeeFinancial results by segment on page 8 for more detailed discussion.
Operations update
| | | | | | | | | | | | | | |
| | | | | THREE MONTHS
ENDED MARCH 31 | | | | |
HIGHLIGHTS | | | | 2013 | | | 2012 | | | CHANGE | |
| Uranium | | Production volume (million lbs) | | | 5.9 | | | | 4.8 | | | | 23 | % |
| | Sales volume (million lbs) | | | 5.1 | | | | 8.2 | | | | (38 | )% |
| | Average realized price ($US/lb) | | | 48.42 | | | | 48.69 | | | | (1 | )% |
| | ($Cdn/lb) | | | 48.25 | | | | 49.32 | | | | (2 | )% |
| | Revenue ($ millions) | | | 247 | | | | 406 | | | | (39 | )% |
| | Gross profit ($ millions) | | | 84 | | | | 143 | | | | (41 | )% |
| Fuel services | | Production volume (million kgU) | | | 4.7 | | | | 4.5 | | | | 4 | % |
| | Sales volume (million kgU) | | | 3.4 | | | | 2.9 | | | | 17 | % |
| | Average realized price ($Cdn/kgU) | | | 19.60 | | | | 20.57 | | | | (5 | )% |
| | Revenue ($ millions) | | | 66 | | | | 60 | | | | 10 | % |
| | Gross profit ($ millions) | | | 11 | | | | 11 | | | | — | |
| NUKEM1 | | Sales volume U3O8(million lbs) | | | 2.3 | | | | — | | | | — | |
| | Sales volume UF6 (million KgU) | | | 0.3 | | | | — | | | | — | |
| | Average realized price uranium ($Cdn/lb) | | | 43.64 | | | | — | | | | — | |
| | Average realized price fuel services products ($Cdn/kgU) | | | 12.24 | | | | — | | | | — | |
| | Revenue ($ millions) | | | 131 | | | | — | | | | — | |
| | Gross profit ($ millions) | | | 4 | | | | — | | | | — | |
| Electricity | | Output (100%) (TWh) | | | 5.5 | | | | 6.0 | | | | (8 | )% |
| | Average realized price ($Cdn/MWh) | | | 53.00 | | | | 55.00 | | | | (4 | )% |
| | Revenue (100%) | | | 288 | | | | 334 | | | | (14 | )% |
| | Our share of earnings (loss) before taxes ($ millions) | | | (1 | ) | | | 24 | | | | (104 | )% |
| 1 | SeeNUKEM on page 21 for details of the purchase price allocation. |
Production in our uranium segment this quarter was 23% higher compared to the first quarter of 2012, mainly due to higher production at McArthur River/Key Lake and Inkai. SeeUranium 2013 Q1 updates starting on page 26 for more information.
Key highlights:
| • | We continued to make progress towards first production at Cigar Lake. See page 27 for more information. |
| • | We completed the acquisition of NUKEM. SeeNUKEM on page 21 for more information. |
| • | The government of Saskatchewan announced changes to the provincial royalty system to encourage continued investment in Saskatchewan’s uranium mining industry. SeeRoyaltieson page 19 for more information. |
| • | The Canadian government announced the signing of the final agreement required to implement theCanada-India Nuclear Cooperation Agreement, which, once brought into force, will allow us to export Canadian-origin uranium to India. |
2013 FIRST QUARTER REPORT 5
Production in our fuel services segment was 4% higher this quarter than in the first quarter of 2012. We increased our annual production target in 2013, which is anticipated to result in higher quarterly production over comparable periods in 2012.
As expected in our electricity segment, BPLP’s generation was 8% lower for the quarter compared to the same period last year due to an increase in the number of outage days. The capacity factor this quarter was 78% compared to 85% in the first quarter of 2012.
Uranium market update
Since the previous quarter, the uranium market has seen little change. Near to medium-term uncertainty continues to impede a recovery, with neither buyers nor suppliers seeming to feel much pressure to contract. Most suppliers have significant commitments out to 2016, and utilities are well covered for a similar period. As a result, over this quarter, volumes contracted have remained low, and uranium prices have been relatively stable.
As we have noted in previous quarters, we believe the market will remain in this ‘wait-and-see’ mode until catalyzed by events such as reactor restarts in Japan and a significant return to long-term contracting by utilities. We expect to see both of these catalysts realized, though the timing remains unclear. In our view, utilities are beginning to move into the window of time during which they would normally begin contracting for requirements in 2016, and, as the regulatory process is worked through in Japan, we believe reactors will be restarted in 2013. The process began in January, when the Nuclear Regulatory Authority (NRA) issued draft safety guidelines outlining the proposed requirements for restart. The guidelines have now been released for public comment, with the final guidelines expected in July. We are in frequent contact with our Japanese utility customers and understand that they are investing significantly to prepare their nuclear assets to meet the requirements for restart.
While we watch to see how the near term will evolve, we believe the long-term picture for nuclear continues to be strong. Our current estimates project nuclear generating capacity will reach about 510 gigawatts by 2022 from today’s 392 gigawatts, which represents average annual growth of 3%. Of this expected growth, approximately 65 new reactors (65 gigawatts of generating capacity) are under construction today. Much of this growth is coming from India and China, which together plan to bring eight new reactors online this year. Canada recently finalized the details of the Nuclear Cooperation Agreements with both countries, enabling Canada, and Cameco, to take part in the opportunity these countries represent to the nuclear industry by allowing deliveries of Canadian material.
The other side of the equation is supply, which faces challenges both from primary and secondary sources. Secondary sources, which have historically kept supply in balance with demand, continue to diminish, particularly with the end of the Russian Highly Enriched Uranium commercial agreement this year. The end of this agreement will remove more pounds from the market than our total annual production, and there is no secondary source of similar scale expected. But future primary supply is also starting to suffer as a number of projects were cancelled or deferred in 2012 while the uranium spot price remained at a level well below that required to incentivize new projects. This primary supply uncertainty comes at a time when demand growth is on the horizon. However, the reduction in future primary supply does not directly impact the near-term market and there are indications that some supply projects, primarily driven by sovereign interests, may proceed despite market conditions.
Despite the current challenging industry environment, we are well positioned to continue to succeed. We have advantages like extensive mineral reserves and resources, low cost operations, a strong sales contract portfolio, experienced employees and a growth strategy that will allow us to remain competitive in challenging environments, while maintaining the ability to respond quickly with additional production when the market signals that more supply is required.
Caution about forward-looking information relating to our uranium market update
This discussion of our expectations for the nuclear industry, including its growth profile and future global uranium supply and demand and nuclear generating capacity, is forward-looking information that is based upon the assumptions and subject to the material risks discussed under the headingCaution about forward-looking information beginning on page 2.
6 CAMECO CORPORATION
Industry Prices
| | | | | | | | | | | | | | | | |
| | | MAR 31
2013 | | | DEC 31
2012 | | | MAR 31
2012 | | | DEC 31
2011 | |
Uranium ($US/lb U3O8) 1 | | | | | | | | | | | | | | | | |
Average spot market price | | | 42.25 | | | | 43.38 | | | | 51.05 | | | | 51.88 | |
Average long-term price | | | 56.50 | | | | 56.50 | | | | 60.00 | | | | 62.00 | |
Fuel services ($US/kgU as UF6)1 | | | | | | | | | | | | | | | | |
Average spot market price | | | | | | | | | | | | | | | | |
North America | | | 10.50 | | | | 10.50 | | | | 6.63 | | | | 8.00 | |
Europe | | | 11.00 | | | | 11.00 | | | | 7.00 | | | | 8.25 | |
Average long-term price | | | | | | | | | | | | | | | | |
North America | | | 16.75 | | | | 16.75 | | | | 16.75 | | | | 16.75 | |
Europe | | | 17.25 | | | | 17.25 | | | | 17.25 | | | | 17.25 | |
| | | | |
Note: the industry does not publish UO2prices. | | | | | | | | | | | | | | | | |
Electricity ($/MWh) | | | | | | | | | | | | | | | | |
Average Ontario electricity spot price | | | 29.00 | | | | 23.00 | | | | 20.00 | | | | 32.00 | |
| 1 | Average of prices reported by TradeTech and Ux Consulting (Ux) |
On the spot market, where purchases call for delivery within one year, the volume reported for the first quarter of 2013 was just over 12 million pounds. This compares to almost 11 million pounds in the first quarter of 2012.
At the end of the quarter, the average spot price was $42.25 (US) per pound. On April 29, 2013, Ux reported a spot price of $40.50 (US) per pound.
The long-term uranium price held relatively firm during the quarter. Long-term contracts usually call for deliveries to begin more than two years after the contract is finalized, and use a number of pricing formulas, including fixed prices adjusted by inflation indices, and market referenced prices (spot and long-term indicators quoted near the time of delivery).
Spot and long-term UF6conversion prices also held firm during the quarter.
SHARES AND STOCK OPTIONS OUTSTANDING
At April 29, 2013, we had:
| • | 395,397,017 common shares and one Class B share outstanding |
| • | 10,428,357 stock options outstanding, with exercise prices ranging from $15.79 to $54.38 |
DIVIDEND POLICY
Our board of directors has established a policy of paying a quarterly dividend of $0.10 ($0.40 per year) per common share. This policy will be reviewed from time to time based on our cash flow, earnings, financial position, strategy and other relevant factors.
2013 FIRST QUARTER REPORT 7
Financial results
This section of our MD&A discusses our performance, financial condition and outlook for the future.
Consolidated financial results
Starting this quarter,IFRS 11 – Joint Arrangements requires that we account for our interest in BPLP using equity accounting. Our quarterly results for 2012 have been restated for comparative purposes. SeeNew Standards and Interpretations on page 29 for more information.
| | | | | | | | | | | | |
HIGHLIGHTS ($ MILLIONS EXCEPT WHERE INDICATED) | | THREE MONTHS
ENDED MARCH 31 | | | CHANGE | |
| | 2013 | | | 2012 | | |
Revenue | | | 444 | | | | 466 | | | | (5 | )% |
Gross profit | | | 95 | | | | 150 | | | | (37 | )% |
Net earnings attributable to equity holders | | | 9 | | | | 129 | | | | (93 | )% |
$ per common share (basic) | | | 0.02 | | | | 0.33 | | | | (94 | )% |
$ per common share (diluted) | | | 0.02 | | | | 0.33 | | | | (94 | )% |
Adjusted net earnings (non-IFRS, see page 8) | | | 27 | | | | 121 | | | | (78 | )% |
$ per common share (adjusted and diluted) | | | 0.07 | | | | 0.31 | | | | (77 | )% |
Cash provided by operations (after working capital changes) | | | 269 | | | | 374 | | | | (28 | )% |
Net earnings
In the first quarter of 2013, our net earnings were $9 million ($0.02 per share diluted), a decrease of $120 million compared to $129 million ($0.33 per share diluted) in 2012. In addition to the items noted below, net earnings were impacted by mark-to-market losses on foreign exchange derivatives.
On an adjusted basis, our earnings this quarter were $27 million ($0.07 per share diluted) compared to $121 million ($0.31 per share diluted) (non-IFRS measure, see page 8) in the first quarter of 2012. This decline was largely the result of:
| • | lower earnings from our uranium business based on decreased sales volumes as a result of uranium deliveries being heavily weighted to the second half of the year, and lower realized prices (due mainly to a lower spot price compared to the first quarter of 2012) |
| • | lower earnings in the electricity business as a result of lower generation and higher operating costs |
In addition to these factors, which were expected and described in ourOutlook for 2013 in our annual MD&A, we incurred higher expenditures for administration due to the addition of NUKEM’s administration and advisory fee, and costs for corporate restructuring as described inOur strategy on page 4.
Adjusted net earnings (non-IFRS measure)
Adjusted net earnings is a measure that does not have a standardized meaning or a consistent basis of calculation under IFRS (non-IFRS measure). We use this measure as a more meaningful way to compare our financial performance from period to period. We believe that, in addition to conventional measures prepared in accordance with IFRS, certain investors use this information to evaluate our performance. Adjusted net earnings is our net earnings attributable to equity holders, adjusted to better reflect the underlying financial performance for the reporting period. The adjusted earnings measure reflects the matching of the net benefits of our hedging program with the inflows of foreign currencies in the applicable reporting period, and has been adjusted for impairment charges on non-producing properties.
Adjusted net earnings is non-standard supplemental information and should not be considered in isolation or as a substitute for financial information prepared according to accounting standards. Other companies may calculate this measure differently, so you may not be able to make a direct comparison to similar measures presented by other companies.
8 CAMECO CORPORATION
The table below reconciles adjusted net earnings with our net earnings.
| | | | | | | | |
($ MILLIONS) | | THREE MONTHS
ENDED MARCH 31 | |
| | 2013 | | | 2012 | |
Net earnings attributable to equity holders | | | 9 | | | | 129 | |
| | | | | | | | |
Adjustments | | | | | | | | |
Adjustments on derivatives1(pre-tax) | | | 25 | | | | (11 | ) |
Income taxes on adjustments to derivatives | | | (7 | ) | | | 3 | |
| | | | | | | | |
Adjusted net earnings | | | 27 | | | | 121 | |
| | | | | | | | |
| 1 | In 2008, we opted to discontinue hedge accounting for our portfolio of foreign currency forward sales contracts. Since then, we have adjusted our gains or losses on derivatives to reflect what our earnings would have been had hedge accounting been applied. |
The table that follows describes what contributed to the changes in adjusted net earnings this quarter.
| | | | | | | | |
($ MILLIONS) | | THREE MONTHS
ENDED MARCH 31 | |
Adjusted net earnings –2012 | | | | | 121 | |
| Change in gross profit by segment | | (we calculate gross profit by deducting from revenue the cost of products and services sold, and depreciation and amortization (D&A), net of hedging benefits) | |
Uranium | | Lower sales volume | | | (54 | ) |
| | Lower realized prices ($US) | | | (1 | ) |
| | Foreign exchange impact on realized prices | | | (4 | ) |
| | Hedging benefits | | | (8 | ) |
| | change –uranium | | | (67 | ) |
Fuel services | | Higher sales volume | | | 2 | |
| | Lower realized prices ($Cdn) | | | (3 | ) |
| | Lower costs | | | 1 | |
| | Hedging benefits | | | (1 | ) |
| | | | | | |
| | change –fuel services | | | (1 | ) |
NUKEM (new) | | Gross profits | | | 4 | |
| | change –NUKEM | | | 4 | |
| Other changes | | | | |
| Lower earnings from equity investment in BPLP | | | (25 | ) |
| Higher administration expenditures | | | (17 | ) |
| Lower exploration expenditures | | | 3 | |
| Lower income taxes | | | 10 | |
| Other | | | (1 | ) |
Adjusted net earnings – 2013 | | | 27 | |
SeeFinancial results by segment on page 16 for more detailed discussion.
Quarterly trends
| | | | | | | | | | | | | | | | | | | | | | | | | | | | | | | | |
HIGHLIGHTS ($ MILLIONS EXCEPT PER SHARE AMOUNTS) | | 2013 | | | 2012 | | | 2011 | |
| | Q1 | | | Q4 | | | Q3 | | | Q2 | | | Q1 | | | Q41 | | | Q31 | | | Q21 | |
Revenue | | | 444 | | | | 846 | | | | 296 | | | | 283 | | | | 466 | | | | 971 | | | | 527 | | | | 425 | |
Net earnings attributable to equity holders | | | 9 | | | | 41 | | | | 79 | | | | 4 | | | | 129 | | | | 265 | | | | 39 | | | | 55 | |
$ per common share (basic) | | | 0.02 | | | | 0.10 | | | | 0.20 | | | | 0.01 | | | | 0.33 | | | | 0.67 | | | | 0.10 | | | | 0.14 | |
$ per common share (diluted) | | | 0.02 | | | | 0.10 | | | | 0.20 | | | | 0.01 | | | | 0.33 | | | | 0.67 | | | | 0.10 | | | | 0.14 | |
Adjusted net earnings (non-IFRS, see page 8) | | | 27 | | | | 233 | | | | 49 | | | | 31 | | | | 121 | | | | 249 | | | | 104 | | | | 72 | |
$ per common share (adjusted and diluted) | | | 0.07 | | | | 0.59 | | | | 0.12 | | | | 0.08 | | | | 0.31 | | | | 0.63 | | | | 0.26 | | | | 0.18 | |
Cash provided by operations (after working capital changes) | | | 269 | | | | 286 | | | | 36 | | | | (117 | ) | | | 374 | | | | 258 | | | | 192 | | | | 23 | |
| 1 | IFRS 11 – Joint Arrangements requires that we account for our interest in BPLP using equity accounting. Our quarterly results prior to the first quarter of 2012 have not been restated and account for our interest in BPLP using proportionate consolidation. |
2013 FIRST QUARTER REPORT 9
The table that follows presents the differences between net earnings and adjusted net earnings for the previous seven quarters.
| | | | | | | | | | | | | | | | | | | | | | | | | | | | | | | | |
($ MILLIONS) | | 2013 | | | 2012 | | | 2011 | |
| | Q1 | | | Q4 | | | Q3 | | | Q2 | | | Q1 | | | Q42 | | | Q32 | | | Q22 | |
Net earnings attributable to equity holders | | | 9 | | | | 41 | | | | 79 | | | | 4 | | | | 129 | | | | 265 | | | | 39 | | | | 55 | |
Adjustments | | | | | | | | | | | | | | | | | | | | | | | | | | | | | | | | |
Adjustments on derivatives1 (pre-tax) | | | 25 | | | | 33 | | | | (40 | ) | | | 36 | | | | (11 | ) | | | (22 | ) | | | 88 | | | | 22 | |
Income taxes on adjustments to derivatives | | | (7 | ) | | | (9 | ) | | | 10 | | | | (9 | ) | | | 3 | | | | 6 | | | | (23 | ) | | | (5 | ) |
Impairment charge on non-producing property | | | — | | | | 168 | | | | — | | | | — | | | | — | | | | — | | | | — | | | | — | |
Adjusted net earnings (non-IFRS, see page 8) | | | 27 | | | | 233 | | | | 49 | | | | 31 | | | | 121 | | | | 249 | | | | 104 | | | | 72 | |
| 1 | In 2008, we opted to discontinue hedge accounting for our portfolio of foreign currency forward sales contracts. Since then, we have adjusted our gains or losses on derivatives to reflect what our earnings would have been had hedge accounting been applied. |
| 2 | IFRS 11 – Joint Arrangements requires that we account for our interest in BPLP using equity accounting. Our quarterly results prior to the first quarter of 2012 have not been restated and account for our interest in BPLP using proportionate consolidation. |
Key things to note:
| • | Our financial results are strongly influenced by the performance of our uranium segment, which accounted for 56% of consolidated revenues in the first quarter of 2013. |
| • | The timing of customer requirements, which tend to vary from quarter to quarter, drives revenue in the uranium and fuel services segments. |
| • | Net earnings do not trend directly with revenue due to unusual items and transactions that occur from time to time. We use adjusted net earnings, a non-IFRS measure, as a more meaningful way to compare our results from period to period (see page 8 for more information). |
| • | Cash from operations tends to fluctuate as a result of the timing of deliveries and product purchases in our uranium and fuel services segments. |
| • | Quarterly results are not necessarily a good indication of annual results due to the variability in customer requirements noted above. |
ADMINISTRATION
| | | | | | | | | | | | |
($ MILLIONS) | | THREE MONTHS
ENDED MARCH 31 | | | CHANGE | |
| | 2013 | | | 2012 | | |
Direct administration | | | 44 | | | | 35 | | | | 26 | % |
Restructuring charges | | | 3 | | | | — | | | | — | |
Stock-based compensation | | | 9 | | | | 4 | | | | 125 | % |
Total administration | | | 56 | | | | 39 | | | | 44 | % |
Direct administration costs were $9 million higher for the first quarter compared to the same period last year. The increase primarily reflects the addition of NUKEM’s administration ($4 million) and advisory fee ($3 million). In 2013 we have also recognized certain costs for restructuring. SeeOur Strategy on page 4.
Stock based compensation was $5 million higher than in 2012 due to the timing of awarding options. In 2012, options were issued in May due to a trading blackout, compared to being issued in March in 2013.
EXPLORATION
In the first quarter, uranium exploration expenses were $20 million, a decrease of $3 million compared to the first quarter of 2012 as a result of decreased activity at our Kintyre property in Australia. Our exploration efforts in 2013 are focused on Canada, Australia, Kazakhstan and the United States.
10 CAMECO CORPORATION
INCOME TAXES
We recorded an income tax recovery of $28 million in first quarter of 2013 compared to a recovery of $9 million in the first quarter of 2012. The change in the net recovery was in part due to a decline in pre-tax earnings in 2013. The distribution of earnings between jurisdictions was also different compared to 2012. In 2013, we recorded losses of $128 million in Canada compared to $82 million in 2012, whereas earnings in foreign jurisdictions declined to $109 million from $202 million. The tax rate in Canada is higher than the average of the rates in the foreign jurisdictions in which we operate.
On an adjusted basis, we recorded an income tax recovery of $21 million this quarter compared to a recovery of $11 million in the first quarter of 2012 due to lower pre-tax adjusted earnings.
| | | | | | | | |
| | | THREE MONTHS
ENDED MARCH 31 | |
($ MILLIONS) | | 2013 | | | 2012 | |
Pre-tax Adjusted Earnings1 | | | | | | | | |
Canada2 | | | (104 | ) | | | (93 | ) |
Foreign | | | 109 | | | | 202 | |
| | | | | | | | |
Total pre-tax adjusted earnings | | | 5 | | | | 109 | |
| | | | | | | | |
Adjusted Income Taxes1 | | | | | | | | |
Canada2 | | | (26 | ) | | | (20 | ) |
Foreign | | | 5 | | | | 9 | |
| | | | | | | | |
Adjusted income tax expense (recovery) | | | (21 | ) | | | (11 | ) |
| | | | | | | | |
Effective tax rate | | | (394 | )% | | | (11 | )% |
| | | | | | | | |
| 1 | Pre-tax adjusted earnings and adjusted income taxes are non-IFRS measures. |
| 2 | Our IFRS-based measures have been adjusted by the amounts reflected in the table in adjusted net earnings (non-IFRS measure on page 8). |
CRA DISCLOSURE
Since 2008, the Canada Revenue Agency (CRA) has disputed the offshore marketing company structure and related transfer pricing methodology we used for certain intercompany uranium sale and purchase agreements, and issued notices of reassessment for our 2003 through 2007 tax returns. We believe the ultimate resolution of this matter will not be material to our financial position, results of operations and cash flows in the year(s) of resolution.
There have been no fact changes in this case since we first disclosed it in 2008. However, in 2013, we were required to report separately the cash payment to CRA of approximately $27 million for taxes, interest and instalment penalties. Until 2013, we had not been required to make any significant cash tax payments due to the availability of elective deductions and tax loss carryovers. However, we were required to make small cash payments for interest and instalment penalties, which totaled about $13 million. These amounts were not reported separately as they were not material in any given year. Transfer pricing is a complex area of tax law, and it is difficult to predict the outcome of a case like ours as there are only a handful of reported court decisions on transfer pricing in Canada. However, tax authorities generally test two things:
| • | the governance (structure) |
As the majority of our customers are located outside Canada, we established an offshore marketing subsidiary. For this subsidiary to be able to enter into sales agreements, it must be backed up by a supply of uranium, which is made possible by our intercompany purchase and sales agreements as well as uranium supply agreements with third parties. We have arm’s-length transfer price arrangements in place, which expose both parties to the risks and the rewards accruing to it under this portfolio of purchase and sales contracts.
With respect to the contract prices, they are generally comparable to those established in sales contracts between arm’s-length buyers and sellers at the time. Based on an analysis of our contract portfolio and other contracts entered into at the time, we have recorded a cumulative tax provision of $65 million, where an argument could be made that our transfer price may have fallen outside of an appropriate range of pricing in uranium contracts for the period from 2003 to March 31, 2013.
2013 FIRST QUARTER REPORT 11
We are confident that we will be successful in our case; however, the Canadian Income Tax Act includes provisions that require certain companies to pay 50% of the cash tax plus related interest and instalment penalties at the time of reassessment. For the years 2003 through 2007, the CRA issued notices of reassessment for approximately $1.3 billion of additional income for Canadian tax purposes, which would result in a related tax expense of about $380 million. Once elective deductions and tax loss carryovers were applied to the amounts reassessed in 2012, as well as interest and instalment penalties, the resulting amount payable was approximately $54 million, 50% of which, or $27 million, we remitted in 2013. Adding the $13 million remitted in previous years brings the total cash paid to CRA to $40 million. No transfer pricing penalties have been assessed.
Using the methodology we believe the CRA will continue to apply, and including the $1.3 billion already reassessed, we expect to receive notices of reassessment for a total of approximately $4.9 billion in income as taxable in Canada for the years 2003 through 2012, which would result in a related tax expense of approximately $1.4 billion. Cash taxes payable would be between $800 million and $850 million. In addition, we estimate there would be interest and instalment penalties applied that would be material to Cameco. We would be responsible for remitting 50% of the cash taxes, or between $400 million and $425 million, plus related interest and instalment penalties assessed, which would be material to Cameco.
Under the Canadian Tax Act, the amount required to be remitted each year will depend on the amount of income reassessed in that year and the availability of elective deductions and tax loss carryovers; however, we expect it will generally follow the schedule in the table below.
| | | | | | | | | | | | | | | | |
MARCH 31, 2013 ($ MILLIONS) | | 2003 - 2013 | | | 2014 - 2016 | | | 2017 -
2023 | | | TOTAL | |
50% of cash taxes payable in the period1 | | | 18 | | | | 50 – 75 | | | | 325 - 350 | | | | 400 - 425 | |
| 1 | These amounts do not include interest and instalment penalties, which totaled approximately $22 million to March 31, 2013. |
In light of our view of the likely outcome of the case as described above, we expect to recover the amounts remitted to CRA, including the $40 million already paid.
The case on the 2003 reassessment is expected to go to trial in the fall of 2014. If this timing is adhered to, we expect to have a Tax Court decision in 2015.
Caution about forward-looking information relating to our CRA tax dispute
This discussion of our expectations relating to our tax dispute with CRA and future tax reassessments by CRA, including the amounts of future additional taxable income, additional tax expense, cash taxes payable and interest and possible penalties thereon and related remittances, and timing of a Tax Court decision, is forward-looking information that is based upon the assumptions and subject to the material risks discussed under the headingCaution about forward-looking information beginning on page 2 and also on the more specific assumptions and risks listed below. Actual outcomes may vary significantly.
Assumptions
| • | the CRA will reassess us for the years 2008 through 2012 using a similar methodology as for the years 2003 through 2007, with the time lag for the reassessments for each year being similar to what has occurred to date |
| • | we will be able to apply elective deductions and tax loss carryovers to the extent anticipated |
| • | the CRA will not seek to impose transfer pricing penalties in addition to interest charges and instalment penalties |
| • | we will be substantially successful in our dispute with the CRA and the cumulative tax provision of $65 million to date will be adequate to satisfy any tax liability resulting from the outcome of the dispute to date. |
Material risks that could cause actual results to differ materially
| • | the CRA reassesses us for years 2008 through 2012 using a different methodology than for years 2003 through 2007, or we are unable to utilize elective deductions and loss carryovers to the same extent as anticipated, resulting in the required cash payments to CRA pending the outcome of the dispute being higher than expected |
| • | the time lag for the reassessments for each year is different than for those to date |
| • | the CRA may seek to impose transfer pricing penalties |
| • | we are unsuccessful and the outcome of our dispute with CRA results in significantly higher cash taxes, interest charges and penalties than the amount of our cumulative tax provision, which could have a material adverse effect on our liquidity, financial position, results of operations and cash flows |
| • | cash tax payable increases due to unanticipated adjustments by CRA not related to transfer pricing |
12 CAMECO CORPORATION
FOREIGN EXCHANGE
At March 31, 2013:
| • | The value of the US dollar relative to the Canadian dollar was $1.00 (US) for $1.02 (Cdn), up from $1.00 (US) for $0.99 (Cdn) at December 31, 2012. The exchange rate averaged $1.00 (US) for $1.01 (Cdn) over the quarter. |
| • | We had foreign currency contracts of $1.3 billion (US) and €142 million at March 31, 2013. The mark-to-market loss on all foreign exchange contracts was $17 million compared to a $15 million gain at December 31, 2012. The average exchange rate for USD currency contracts was $1.00 (US) for $1.01 (Cdn) and €1.00 (EUR) for $1.30 (US) for EUR currency contracts. |
Outlook for 2013
Our outlook for 2013 reflects the growth expenditures necessary to help us achieve our strategy. Our consolidated outlook for revenue and direct administration costs have increased due to the inclusion of NUKEM. Our outlook for sales volumes from our fuel services segment has also changed and we explain the change below. We do not provide an outlook for the items in the table that are marked with a dash.
SeeFinancial results by segment on page 16 for details.
2013 FINANCIAL OUTLOOK
NUKEM is included in the consolidated amounts and our outlook for the NUKEM segment has been added to the table below. BPLP is not included in consolidated amounts due to a change in accounting. SeeConsolidated financial results on page 8 for details.
| | | | | | | | | | |
| | | CONSOLIDATED | | URANIUM | | FUEL SERVICES | | NUKEM | | ELECTRICITY |
Production | | — | | 23.3 million lbs | | 15 to 16 million kgU | | — | | — |
Sales volume | | — | | 31 to 33 million lbs | | Increase 5% to 10% | | 9 to 11 million lbs U3O8, 0.5 million SWU | | — |
Capacity factor | | — | | — | | — | | — | | 88% |
Revenue compared to 2012 | | Increase 25% to 30% | | Increase 0% to 5%1 | | Increase 5% to 10% | | $500 to $600 million | | Decrease 5% to 10% |
NUKEM Operating cash flows | | — | | — | | — | | $100 to $125 million | | — |
NUKEM gross profit | | — | | — | | — | | 3% to 5% | | — |
Average unit cost of sales (including D&A) | | — | | Increase 0% to 5%2 | | Decrease 0% to 5% | | — | | Increase 25% to 30% |
Direct administration costs compared to 20123 | | Increase 0% to 5% | | — | | — | | $10 to 12 million | | — |
Exploration costs compared to 2012 | | — | | Decrease 5% to 10% | | — | | — | | — |
Tax rate | | Recovery of 15% to 20% | | — | | — | | Expense of 30% to 35% | | — |
Capital expenditures | | $655 million4 | | — | | — | | — | | $93 million (our share) |
| 1 | Based on a uranium spot price of $40.50 (US) per pound (the Ux spot price as of April 29, 2013), a long-term price indicator of $57.00 (US) per pound (the Ux long-term indicator on April 29, 2013) and an exchange rate of $1.00 (US) for $1.00 (Cdn). |
| 2 | This increase is based on the unit cost of sale for produced material and committed long-term purchases. If we decide to make discretionary purchases in 2013 then we expect the overall unit cost of product sold to increase further. |
| 3 | Direct administration costs do not include stock-based compensation expenses. See page 10 for more information. |
| 4 | Does not include our share of capital expenditures at BPLP. |
We now expect an increase of 5% to 10% for sales volumes in our fuel services segment (previously an increase of up to 5%), due to increased fuel services production (15 to 16 million KgU compared to 13 to 14 million KgU in 2012) and increased sales commitments in 2013.
2013 FIRST QUARTER REPORT 13
In our uranium and fuel services segments, our customers choose when in the year to receive deliveries, so our quarterly delivery patterns, sales volumes and revenue, can vary significantly. We expect our uranium deliveries for the second quarter will be greater than the first quarter. Uranium sales for the balance of 2013 are expected to be more heavily weighted (about 60%) to the second half of the year. However, not all delivery notices have been received to date, which could alter the delivery pattern. Typically, we receive notices six months in advance of the requested delivery date.
SENSITIVITY ANALYSIS
For the rest of 2013:
| • | a change of $5 (US) per pound in both the Ux spot price ($40.50 (US) per pound on April 29, 2013) and the Ux long-term price indicator ($57.00 (US) per pound on April 29, 2013) would change revenue by $56 million and net earnings by $30 million |
| • | a change of $5/MWh in the electricity spot price would change our 2013 net earnings by $1 million based on the assumption that the spot price will remain below the floor price of $52.34/MWh provided under BPLP’s agreement with the Ontario Power Authority (OPA) |
| • | a one-cent change in the value of the Canadian dollar versus the US dollar would change revenue by $9 million and adjusted net earnings by $5 million, with a decrease in the value of the Canadian dollar versus the US dollar having a positive impact. This sensitivity is based on an exchange rate of $1.00 (US) for $1.00 (Cdn). |
Liquidity and capital resources
Our financial objective is to make sure we have the cash and debt capacity to fund our operating activities, investments and growth. We expect our existing cash balances and operating cash flows will meet our anticipated 2013 capital requirements without the need for significant additional funding.
We have large, creditworthy customers that continue to need uranium even during weak economic conditions, and we expect the uranium contract portfolio we have built to provide a solid revenue stream for years to come.
We expect to continue investing in expanding our production capacity over the next several years. We have a number of alternatives to fund this continued growth including using our current cash balances, drawing on our existing credit facilities, entering new credit facilities, using our operating cash flow, and raising additional capital through debt or equity financings. We are always considering our financing options so that we can take advantage of favourable market conditions when they arise.
We have an ongoing dispute with CRA regarding our offshore marketing company structure and related transfer pricing arrangements. See page 11 for more information. Until this dispute is settled, we expect to make cash payments to CRA for 50% of the cash taxes payable and the related interest and installment penalties. We have provided an estimate of the amount and timing of the expected cash taxes payable in the table on page 11.
CASH FROM OPERATIONS
Cash from operations was $105 million lower this quarter than in 2012, due largely to lower uranium deliveries. Working capital required $52 million more in 2013, largely as a result of an increase in uranium inventories during the quarter. Not including working capital requirements, our operating cash flows this quarter were lower by $53 million, based on lower profits in our uranium segment. SeeFinancial results by segment on page 16 for details.
INVESTING ACTIVITIES
On January 9, 2013, the acquisition of NUKEM Energy GmbH was completed and we paid €107 million ($140 million (US)) on closing.
14 CAMECO CORPORATION
DEBT
We use debt to provide additional liquidity. We have sufficient borrowing capacity with unsecured lines of credit totaling about $2.1 billion at March 31, 2013, up $0.2 billion as at December 31, 2012. The increase is due to the inclusion of NUKEM’s undrawn credit facility of €100 million ($128 million (US)), increases in letters of credit for our US operations, and changes in foreign exchange rates. At March 31, 2013, we had approximately $730 million outstanding in letters of credit.
DEBT COVENANTS
We are bound by certain covenants in our unsecured revolving credit facility. The financially related covenants place restrictions on total debt, including guarantees. As at March 31, 2013, we met these financial covenants and do not expect our operating and investment activities for the remainder of 2013 to be constrained by them.
LONG-TERM CONTRACTUAL OBLIGATIONS AND OFF-BALANCE SHEET ARRANGEMENTS
We had two kinds of off-balance sheet arrangements at December 31, 2012:
There have been no material changes to our long-term contractual obligations or financial assurances since December 31, 2012, including payments due for the next five years and thereafter. However, our purchase commitments have increased by $1.4 billion (US) due to the inclusion of NUKEM commitments. Our long-term contractual obligations do not include our sales commitments. Please see our annual MD&A for more information.
The table below shows NUKEM’s purchase commitments.
| | | | | | | | | | | | | | | | | | | | |
MARCH 31, 2013 ($ MILLIONS) | | 2013 | | | 2014 AND
2015 | | | 2016 AND
2017 | | | 2018 AND
BEYOND | | | TOTAL | |
NUKEM purchase commitments | | | 449 | | | | 409 | | | | 315 | | | | 235 | | | | 1,408 | |
BALANCE SHEET
| | | | | | | | | | | | |
($ MILLIONS) | | MAR 31, 2013 | | | DEC 31, 2012 | | | CHANGE | |
Cash and short-term investments | | | 577 | | | | 799 | | | | (28 | )% |
Total debt | | | 1,353 | | | | 1,360 | | | | (1 | )% |
Inventory | | | 742 | | | | 564 | | | | 32 | % |
Total cash and short-term investments at March 31, 2013 were $577 million, or 28% lower than at December 31, 2012 due to a higher rate of capital expenditures and completion of the acquisition of NUKEM Energy GmbH in January. Net debt March 31, 2013 was $776 million.
Total debt decreased by $7 million to $1,353 million at March 31, 2013. Of this total, $60 million was classified as current, down $7 million compared to December 31, 2012. See notes 16 and 17 of our audited annual financial statements for more detail.
Total product inventories increased to $742 million, including NUKEM’s inventories ($141 million). Uranium inventories increased as sales were lower than production and purchases in the first three months of the year.
Fuel services inventories increased as sales were also lower than production and purchases.
2013 FIRST QUARTER REPORT 15
Financial results by segment
Uranium
| | | | | | | | | | | | |
| | | THREE MONTHS
ENDED MARCH 31 | | | | |
HIGHLIGHTS | | 2013 | | | 2012 | | | CHANGE | |
Production volume (million lbs) | | | 5.9 | | | | 4.8 | | | | 23 | % |
Sales volume (million lbs) | | | 5.1 | | | | 8.2 | | | | (38 | )% |
Average spot price ($US/lb) | | | 42.71 | | | | 51.73 | | | | (17 | )% |
Average long-term price ($US/lb) | | | 56.50 | | | | 60.33 | | | | (6 | )% |
Average realized price | | | | | | | | | | | | |
($US/lb) | | | 48.42 | | | | 48.69 | | | | (1 | )% |
($Cdn/lb) | | | 48.25 | | | | 49.32 | | | | (2 | )% |
Average unit cost of sales ($Cdn/lb) (including D&A) | | | 31.90 | | | | 31.99 | | | | — | |
Revenue ($ millions) | | | 247 | | | | 406 | | | | (39 | )% |
Gross profit ($ millions) | | | 84 | | | | 143 | | | | (41 | )% |
Gross profit (%) | | | 34 | | | | 35 | | | | (3 | )% |
FIRST QUARTER
Production volumes this quarter were 23% higher compared to the first quarter of 2012, due mainly to higher production at McArthur River/Key Lake and Inkai. SeeUranium 2013 Q1 updates starting on page 26 for more information.
Uranium revenues were down 39% due to a 38% decrease in sales volumes and a 2% decrease in the Canadian dollar average realized price.
Our realized prices this quarter were lower than the first quarter of 2012, mainly due to lower US dollar prices under market related contracts. In the first quarter of 2013, the uranium spot price averaged $42.71 (US), 17% lower than the $51.73 (US) in the first quarter of 2012.
Total cost of sales (including D&A) decreased by 38% ($163 million compared to $263 million in 2012). This was mainly the result of a 38% decrease in sales volumes, and lower royalty charges due to the slightly lower realized price and reduced deliveries of Saskatchewan-produced material. In the first quarter of 2013, total royalty charges were $14 million compared to $33 million in the first quarter of 2012.
The net effect was a $59 million decrease in gross profit for the quarter.
The table on the following page shows the costs of produced and purchased uranium incurred in the reporting periods (which are non-IFRS measures, see the paragraphs below the table). These costs do not include selling costs such as royalties, transportation and commissions, nor do they reflect the impact of opening inventories on our reported cost of sales.
16 CAMECO CORPORATION
| | | | | | | | | | | | |
| | | THREE MONTHS
ENDED MARCH 31 | | | | |
($CDN/LB) | | 2013 | | | 2012 | | | CHANGE | |
Produced | | | | | | | | | | | | |
Cash cost | | | 19.12 | | | | 22.39 | | | | (15 | )% |
Non-cash cost | | | 8.44 | | | | 7.51 | | | | 12 | % |
| | | | | | | | | | | | |
Total production cost | | | 27.56 | | | | 29.90 | | | | (8 | )% |
| | | | | | | | | | | | |
Quantity produced (million lbs) | | | 5.9 | | | | 4.8 | | | | 23 | % |
Purchased | | | | | | | | | | | | |
Cash cost | | | 33.44 | | | | 34.64 | | | | (3 | )% |
Quantity purchased (million lbs) | | | 2.3 | | | | 1.4 | | | | 64 | % |
Totals | | | | | | | | | | | | |
Produced and purchased costs | | | 29.21 | | | | 30.97 | | | | (6 | )% |
Quantities produced and purchased (million lbs) | | | 8.2 | | | | 6.2 | | | | 32 | % |
Cash cost per pound, non-cash cost per pound and total cost per pound for produced and purchased uranium presented in the above table are non-IFRS measures. These measures do not have a standardized meaning or a consistent basis of calculation under IFRS. We use these measures in our assessment of the performance of our uranium business. We believe that, in addition to conventional measures prepared in accordance with IFRS, certain investors use this information to evaluate our performance and ability to generate cash flow.
These measures are non-standard supplemental information and should not be considered in isolation or as a substitute for measures of performance prepared according to accounting standards. These measures are not necessarily indicative of operating profit or cash flow from operations as determined under IFRS. Other companies may calculate these measures differently so you may not be able to make a direct comparison to similar measures presented by other companies.
To facilitate a better understanding of these measures, the following table presents a reconciliation of these measures to our unit cost of sales for the first quarters of 2013 and 2012.
CASH AND TOTAL COST PER POUND RECONCILIATION
| | | | | | | | | | | | |
| | | THREE MONTHS
ENDED MARCH 31 | | | | |
($ MILLIONS) | | 2013 | | | 2012 | | | CHANGE | |
Cost of product sold | | | 144.0 | | | | 231.1 | | | | (38 | )% |
Add / (subtract) | | | | | | | | | | | | |
Royalties | | | (14.4 | ) | | | (33.4 | ) | | | (57 | )% |
Standby charges | | | (8.1 | ) | | | (7.1 | ) | | | 14 | % |
Other selling costs | | | 2.8 | | | | (1.9 | ) | | | (247 | )% |
Change in inventories | | | 65.4 | | | | (32.7 | ) | | | (300 | )% |
| | | | | | | | | | | | |
Cash operating costs (a) | | | 189.7 | | | | 156.0 | | | | 22 | % |
Add / (subtract) | | | | | | | | | | | | |
Depreciation and amortization | | | 19.5 | | | | 31.9 | | | | (39 | )% |
Change in inventories | | | 30.3 | | | | 4.1 | | | | 639 | % |
| | | | | | | | | | | | |
Total operating costs (b) | | | 239.5 | | | | 192.0 | | | | 25 | % |
| | | | | | | | | | | | |
Uranium produced & purchased (millions lbs)(c) | | | 8.2 | | | | 6.2 | | | | 32 | % |
| | | | | | | | | | | | |
Cash costs per pound (a ÷ c) | | | 23.14 | | | | 25.16 | | | | (8 | )% |
Total costs per pound (b ÷ c) | | | 29.21 | | | | 30.97 | | | | (6 | )% |
| | | | | | | | | | | | |
2013 FIRST QUARTER REPORT 17
PRICE SENSITIVITY ANALYSIS: URANIUM
The table and graph below arenot forecasts of prices we expect to receive. The prices we actually realize will be different from the prices shown in the table and graph. They are designed to indicate how the portfolio of long-term contracts we had in place in our uranium segment on March 31, 2013 would respond to different spot prices. In other words, we would realize these prices only if the contract portfolio remained the same as it was on March 31, 2013, and none of the assumptions we list below change.
We intend to update this table and graph each quarter in our MD&A to reflect deliveries made and changes to our contract portfolio each quarter. As a result, we expect the table and graph to change from quarter to quarter.
EXPECTED REALIZED URANIUM PRICE SENSITIVITY UNDER VARIOUS SPOT PRICE ASSUMPTIONS
(rounded to the nearest $1.00)
| | | | | | | | | | | | | | | | | | | | | | | | | | | | |
SPOT PRICES ($US/LB U3O8) | | $20 | | | $40 | | | $60 | | | $80 | | | $100 | | | $120 | | | $140 | |
2013 | | | 45 | | | | 47 | | | | 52 | | | | 58 | | | | 64 | | | | 70 | | | | 75 | |
2014 | | | 45 | | | | 48 | | | | 56 | | | | 64 | | | | 73 | | | | 82 | | | | 89 | |
2015 | | | 41 | | | | 46 | | | | 56 | | | | 66 | | | | 76 | | | | 86 | | | | 95 | |
2016 | | | 42 | | | | 48 | | | | 58 | | | | 69 | | | | 80 | | | | 90 | | | | 98 | |
2017 | | | 42 | | | | 47 | | | | 57 | | | | 67 | | | | 78 | | | | 87 | | | | 95 | |
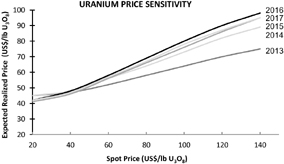
The table and graph illustrate the mix of long-term contracts in our March 31, 2013 portfolio, and are consistent with our contracting strategy. Both have been updated to reflect deliveries made and contracts entered into up to March 31, 2013.
Our portfolio includes a mix of fixed-price and market-related contracts, which we target at a 40:60 ratio. Those that are fixed at lower prices or have low ceiling prices will yield prices that are lower than current market prices. In 2012, a number of older contracts expired and we are starting to deliver into more favourably priced contracts.
Our portfolio is affected by more than just the spot price. We made the following assumptions (which are not forecasts) to create the table:
Sales
| • | sales volumes on average of 32 million pounds per year |
Deliveries
| • | customers take the maximum quantity allowed under each contract (unless they have already provided a delivery notice indicating they will take less) |
| • | deliveries include our best estimate of quantities under requirements-based contracts |
| • | we defer a portion of deliveries under existing contracts for 2013 |
| • | the average long-term price indicator is the same as the average spot price for the entire year (a simplified approach for this purpose only). Since 1996, the long-term price indicator has averaged 16% higher than the spot price. This differential has varied significantly. Assuming the long-term price is at a premium to spot, the prices in the table and graph will be higher. |
18 CAMECO CORPORATION
ROYALTIES
The government of Saskatchewan has recently approved changes to both the basic and tiered royalty systems for uranium as described below.
The basic royalty is equal to 5% of gross sales of Saskatchewan uranium (gross sales) and is reduced by the Saskatchewan resource credit (SRC), which, effective April 1, 2013, is equal to 0.75% of gross sales. Prior to the changes approved by the government on March 20, 2013, the SRC was equal to 1% of gross sales.
The government has also changed tiered royalties from a revenue-based system to a modified profit-based system retroactive to January 1, 2013. Under the new system, a 10% tiered royalty will be charged on profit up to $22/kg U3O8 ($9.98/lb) and a 15% tiered royalty will be charged on profit in excess of $22/kg U3O8. Profit will be determined as gross sales less certain operating costs, exploration costs and actual capital costs. Costs will be deductible as incurred at the discretion of the producer, subject to transitional rules.
The overall structure is expected to be positive over the next 15 years, although the magnitude of the impact will not be known until the provincial regulations are finalized. The exact timing of this step will not impact the date the new tiered royalty system takes effect.
In addition, as a resource corporation in Saskatchewan, we pay a corporate resource surcharge equal to 3% of gross sales.
2013 FIRST QUARTER REPORT 19
Fuel services
(includes results for UF6, UO2and fuel fabrication)
| | | | | | | | | | | | |
| | | THREE MONTHS
ENDED MARCH 31 | | | | |
HIGHLIGHTS | | 2013 | | | 2012 | | | CHANGE | |
Production volume (million kgU) | | | 4.7 | | | | 4.5 | | | | 4 | % |
Sales volume (million kgU) | | | 3.4 | | | | 2.9 | | | | 17 | % |
Average realized price ($Cdn/kgU) | | | 19.60 | | | | 20.57 | | | | (5 | )% |
Average unit cost of sales ($Cdn/kgU) (including D&A) | | | 16.27 | | | | 16.65 | | | | (2 | )% |
Revenue ($ millions) | | | 66 | | | | 60 | | | | 10 | % |
Gross profit ($ millions) | | | 11 | | | | 11 | | | | — | |
Gross profit (%) | | | 17 | | | | 18 | | | | (6 | )% |
FIRST QUARTER
Total revenue increased by 10% due to a 17% increase in sales volumes, offset by a 5% decrease in realized price.
The total cost of products and services sold (including D&A) increased by 15% ($55 million compared to $48 million in the first quarter of 2012) due to the increase in sales volumes, offset by a decrease in the average unit cost of sales. When compared to 2012, the average unit cost of sales was 2% lower due to the mix of fuel services products sold.
The net effect was no change in gross profit.
20 CAMECO CORPORATION
NUKEM
| | | | | | | | | | | | |
| | | THREE MONTHS
ENDED MARCH 31 | | | | |
($ MILLIONS EXCEPT WHERE INDICATED) | | NUKEM | | | PURCHASE
ACCOUNTING | | | CONSOLIDATED | |
Uranium sales (million lbs) | | | 2.3 | | | | — | | | | 2.3 | |
Conversion sales (million kgU) | | | 0.3 | | | | — | | | | 0.3 | |
Revenue | | | 132 | | | | (1 | ) | | | 131 | |
Cost of product sold (including D&A) | | | 103 | | | | 24 | | | | 127 | |
Gross profit | | | 29 | | | | (25 | ) | | | 4 | |
Net earnings | | | 14 | | | | (17 | ) | | | (3 | ) |
Adjustments on derivatives1 | | | 2 | | | | — | | | | 2 | |
Adjusted net earnings1 | | | 16 | | | | (17 | ) | | | (1 | ) |
Cash provided by operations | | | 99 | | | | — | | | | 99 | |
| 1 | Adjustments relate to unrealized gains and losses on foreign currency forward sales contracts (non-IFRS measure, see page 8). |
On January 9, 2013, we completed the acquisition of NUKEM Energy GmbH (NUKEM) from Advent International (Advent) and other shareholders. NUKEM is one of the world’s leading traders and brokers of nuclear fuel products and services.
NUKEM was acquired for cash consideration of €107 million ($140 million (US)). We also assumed NUKEM’s net debt which amounted to about €79 million ($104 million (US)) on January 9, 2013. Acquisition related costs of $4 million (2012) and an advisory fee of $3 million (2013) have been expensed and included in administration expense in the consolidated statement of earnings. We received the economic benefits of owning NUKEM as of January 1, 2012; however, in accordance with accounting requirements, our financial reporting will reflect results from January 9, 2013 forward.
The purchase agreement also includes an earn-out provision that could provide Advent with a share of NUKEM’s earnings under certain conditions for the years 2012 through 2014. The earn-out is based on NUKEM exceeding certain minimum threshold levels of earnings before interest, taxes, depreciation and amortization (EBITDA), as specified and defined in the purchase agreement. The EBITDA is derived from NUKEM’s audited financial statements. For 2012, the earn-out amount was $8 million (US) as EBITDA for the year exceeded the payout threshold of $115 million (US). If payable, the next earn-out payment will be made in 2015.
For accounting purposes, the purchase price is allocated to the assets and liabilities acquired based on their fair values as of the acquisition date. The purchase price allocation is provided in the table on the next page. We believe that these values are representative of the transaction; however, it is possible that the final allocation will differ.
Much of the purchase price was related to nuclear fuel inventories and the portfolio of sales and purchase contracts acquired. The amounts attributed to inventory and contracts were based on market values as at the acquisition date. They will be charged to earnings in the period(s) in which related transactions occur. The amount categorized as goodwill reflects the value assigned to the expected future earnings capabilities of the organization. This is the earnings potential that we anticipate will be realized through new business arrangements. Goodwill is not amortized and is tested for impairment at least annually.
2013 FIRST QUARTER REPORT 21
PURCHASE PRICE ALLOCATION
| | | | |
| | | $US MILLIONS | |
Net assets | | | | |
Working capital | | | (22 | ) |
Inventory | | | 165 | |
Sales, purchase contracts and other intangibles | | | 88 | |
Goodwill | | | 88 | |
Debt | | | (117 | ) |
Deferred taxes | | | (54 | ) |
| | | | |
Net assets acquired | | | 148 | |
| | | | |
Financed by | | | | |
Cash | | | 140 | |
Additional consideration (earn-out provision) | | | 8 | |
| | | | |
Liabilities and equity | | | 148 | |
| | | | |
FIRST QUARTER
During the first three months of 2013, NUKEM delivered 2.3 million pounds of uranium and 0.3 million kgU of conversion services. On a consolidated basis, NUKEM contributed $131 million in revenues, $4 million in gross profit and an adjusted net loss (non-IFRS measure, see page 8) of $1 million as administrative and financing charges more than offset gross profits in the quarter. NUKEM’s contribution to our earnings is significantly impacted by our purchase price accounting. Excluding the impact of the purchase accounting, NUKEM’s adjusted net earnings (non-IFRS measure, see page 8) were $16 million for the quarter. NUKEM generated strong cash flows of $99 million from its operating activities during the first quarter due largely to a drawdown of inventory and the collection of accounts receivable.
As noted above, much of the NUKEM purchase price was attributable to inventories and the portfolio of contracts. With respect to nuclear fuel inventories, amounts assigned were based on market values as of the date of acquisition. As these quantities are delivered to NUKEM’s customers, we will adjust the cost of product sold to reflect the values at the acquisition date, regardless of NUKEM’s historic costs.
As of the date of the purchase agreement, had NUKEM’s sales and purchase contracts been settled, it would have realized significant financial benefit and as a result, we paid a premium to acquire the portfolio. Accordingly, a portion of the purchase price has been attributed to the various contracts. In our accounting for NUKEM, we will amortize the amounts assigned to the portfolio in the periods in which NUKEM transacts under the relevant contracts. The net effect is a reduction in reported profit margins relative to NUKEM’s results. We expect the majority of the amount allocated to the contract portfolio will be amortized within two years.
22 CAMECO CORPORATION
Electricity
BPLP (100% – not prorated to reflect our 31.6% interest)
| | | | | | | | | | | | |
HIGHLIGHTS ($ MILLIONS EXCEPT WHERE INDICATED) | | THREE MONTHS
ENDED MARCH 31 | | | CHANGE | |
| | 2013 | | | 2012 | | |
Output—terawatt hours (TWh) | | | 5.5 | | | | 6.0 | | | | (8 | )% |
Capacity factor (the amount of electricity the plants actually produced for sale as a percentage of the amount they were capable of producing) | | | 78 | % | | | 85 | % | | | (8 | )% |
Realized price ($/MWh) | | | 53 | | | | 55 | 1 | | | (4 | )% |
Average Ontario electricity spot price ($/MWh) | | | 29 | | | | 20 | | | | 45 | % |
Revenue | | | 288 | | | | 334 | | | | (14 | )% |
Operating costs (net of cost recoveries) | | | 283 | | | | 255 | | | | 11 | % |
Cash costs | | | 229 | | | | 201 | | | | 14 | % |
Non-cash costs | | | 54 | | | | 54 | | | | — | |
Income before interest and finance charges | | | 5 | | | | 79 | | | | (94 | )% |
Interest and finance charges | | | 6 | | | | — | | | | — | |
Cash from operations | | | 295 | | | | 129 | | | | 129 | % |
Capital expenditures | | | 70 | | | | 39 | | | | 79 | % |
Distributions | | | 100 | | | | 30 | | | | 233 | % |
Capital calls | | | 7 | | | | 16 | | | | (56 | )% |
Operating costs ($/MWh) | | | 51 | | | | 42 | 1 | | | 21 | % |
| 1 | Based on actual generation of 6.0 TWh plus deemed generation of 0.1 TWh in the first quarter. |
OUR EARNINGS (LOSS) FROM BPLP
| | | | | | | | | | | | |
HIGHLIGHTS ($ MILLIONS EXCEPT WHERE INDICATED) | | THREE MONTHS
ENDED MARCH 31 | | | CHANGE | |
| | 2013 | | | 2012 | | |
BPLP’s earnings (loss) before taxes (100%) | | | (1 | ) | | | 79 | | | | (101 | )% |
Cameco’s share of pretax earnings before adjustments (31.6%) | | | — | | | | 25 | | | | — | |
Proprietary adjustments | | | (1 | ) | | | (1 | ) | | | — | |
Earnings (loss) before taxes from BPLP | | | (1 | ) | | | 24 | | | | (104 | )% |
FIRST QUARTER
Total electricity revenue decreased 14% this quarter due to lower output and lower realized price. Realized prices reflect spot sales, revenue recognized under BPLP’s agreement with the OPA, and financial contract revenue. BPLP recognized revenue of $124 million this quarter under its agreement with the OPA, compared to $185 million in the first quarter of 2012. The equivalent of about 77% of BPLP’s output was sold under financial contracts this quarter, compared to 62% in the first quarter of 2012. From time to time, BPLP enters the market to lock in gains under these contracts. Gains on BPLP’s contract activity in the first quarter of 2013 were lower than the same period in 2012.
The capacity factor was 78% this quarter, down from 85% in the first quarter of 2012. There were 70 planned and nine unplanned outage days in the quarter, compared to 46 planned and five unplanned outage days in the first quarter of 2012.
Operating costs were $283 million compared to $255 million in 2012 due to higher maintenance costs incurred primarily as a result of more planned outage days in the first quarter.
The result was a $1 million loss before taxes in the first quarter of 2013 compared to $79 million in earnings before taxes in the first quarter of 2012.
2013 FIRST QUARTER REPORT 23
BPLP distributed $100 million to the partners in the first quarter. Our share was $32 million. BPLP capital calls to the partners in the first quarter were $7 million. Our share was $2 million. The partners have agreed that BPLP will distribute excess cash monthly, and will make separate cash calls for major capital projects.
FLOOR PRICE AGREEMENT EXTENSION
Bruce Power and the OPA reached an agreement to amend the Bruce Power Refurbishment Implementation Agreement to extend the floor price from the original Bruce B unit end of life dates between 2016 and 2019, to between 2019 and 2020. It does not change the price of the Bruce B floor.
24 CAMECO CORPORATION
Our operations and development project
Uranium – production overview
Production in our uranium segment this quarter was 1.1 million pounds higher compared to the first quarter of 2012. SeeUranium 2013 Q1 updatesstarting on page 26 for more information.
URANIUM PRODUCTION
| | | | | | | | | | | | |
CAMECO’S SHARE (MILLION LBS) | | THREE MONTHS
ENDED MARCH 31 | | | CHANGE | |
| | 2013 | | | 2012 | | |
McArthur River/Key Lake | | | 3.5 | | | | 2.9 | | | | 21 | % |
Rabbit Lake | | | 1.1 | | | | 1.0 | | | | 10 | % |
Smith Ranch-Highland | | | 0.3 | | | | 0.2 | | | | 50 | % |
Crow Butte | | | 0.2 | | | | 0.2 | | | | — | |
Inkai | | | 0.8 | | | | 0.5 | | | | 60 | % |
Total | | | 5.9 | | | | 4.8 | | | | 23 | % |
Outlook
We have geographically diverse sources of production. Subject to market conditions, our plan is to focus primarily on advancing our brownfield projects and the process to extract uranium from the Talvivaara mine to achieve annual supply of 36 million pounds by 2018. We expect to purchase about 900,000 pounds of supply under our agreement with Talvivaara when all regulatory approvals are received, work on the extraction process is complete, and once they ramp up to full production. We expect production to start in the first half of 2014.
CAMECO’S SHARE OF PRODUCTION – ANNUAL FORECAST TO 2017
| | | | | | | | | | | | | | | | | | | | |
CURRENT FORECAST (MILLION LBS) | | 2013 | | | 2014 | | | 2015 | | | 2016 | | | 2017 | |
McArthur River/Key Lake | | | 13.2 | | | | 13.1 | | | | 13.1 | | | | 13.1 | | | | 13.1 | |
Rabbit Lake | | | 4.2 | | | | 4.2 | | | | 4.2 | | | | 4.2 | | | | 4.2 | |
US ISR | | | 2.6 | | | | 2.9 | | | | 2.9 | | | | 3.0 | | | | 3.0 | |
Inkai1 | | | 2.9 | | | | 2.9 | | | | 2.9 | | | | 2.9 | | | | 2.9 | |
Cigar Lake | | | 0.3 | | | | 1.8 | | | | 5.5 | | | | 7.9 | | | | 8.2 | |
| | | | | | | | | | | | | | | | | | | | |
Total share of production | | | 23.2 | | | | 24.9 | | | | 28.6 | | | | 31.1 | | | | 31.4 | |
| | | | | | | | | | | | | | | | | | | | |
Cameco’s share of Inkai’s production on which profits are generated2 | | | | | | | | | | | | | | | | | | | | |
Inkai1 | | | 3.0 | | | | 3.0 | | | | 3.0 | | | | 3.0 | | | | 3.0 | |
| | | | | | | | | | | | | | | | | | | | |
Total2 | | | 23.3 | | | | 25.0 | | | | 28.7 | | | | 31.2 | | | | 31.5 | |
| | | | | | | | | | | | | | | | | | | | |
| 1 | In 2011, we signed a memorandum of agreement (2011 MOA) with Kazatomprom to increase annual production to 5.2 million pounds (100% basis). Under the 2011 MOA, we will have the right to purchase 2.9 million pounds of Inkai’s annual production and receive profits on 3.0 million pounds. |
| 2 | We have adjusted the production table to reflect the share of Inkai’s production we will use to calculate our profits under the 2011 MOA, as described in the note above. |
Our 2013 and future annual production targets for Inkai assume, and we expect, that Inkai will obtain the necessary government permits and approvals to produce at an annual rate of 5.2 million pounds (100% basis), including an amendment to the resource use contract.
There is no certainty Inkai will receive these permits or approvals. If Inkai does not, or if the permits and approvals are delayed, Inkai may be unable to achieve its 2013 and future annual production targets and we may have to re-categorize some of Inkai’s mineral reserves as resources.
2013 FIRST QUARTER REPORT 25
This forecast is forward-looking information. It is based on the assumptions and subject to the material risks discussed on pages 2 and 3, and specifically on the assumptions and risks listed here. Actual production may be significantly different from this forecast.
Assumptions
| • | we achieve our forecast production for each operation, which requires, among other things, that our mining plans succeed, processing plants and equipment are available and function as designed, we have sufficient tailings capacity and our mineral reserve estimates are reliable |
| • | we obtain or maintain the necessary permits and approvals from government authorities |
| • | our production is not disrupted or reduced as a result of natural phenomena, labour disputes, political risks, blockades or other acts of social or political activism, shortage or lack of supplies critical to production, equipment failures or other development and operation risks |
Material risks that could cause actual results to differ materially
| • | we do not achieve forecast production levels for each operation because of a change in our mining plans, processing plants or equipment are not available or do not function as designed, lack of tailings capacity or for other reasons |
| • | we cannot obtain or maintain necessary permits or approvals from government authorities |
| • | natural phenomena, labour disputes (including an inability to renew agreements with unionized employees at McArthur River and Key Lake), political risks, blockades or other acts of social or political activism, shortage or lack of supplies critical to production, equipment failures or other development and operation risks disrupt or reduce our production |
Uranium 2013 Q1 updates
Operating properties
McArthur River/Key Lake
Production update
Production for the quarter was 21% higher compared to the same period last year due to the timing of the annual maintenance shutdown. The mill will be shut down for three weeks in May to complete planned work. We expect our share of production this year will be 13.2 million pounds U3O8.
Operations update
We are continuing to advance the underground exploration drifts to the southwest and northeast directions and will focus on developing zone 4 and areas at the south end of the underground mine workings.
We are continuing to advance work on the environmental assessment for the Key Lake extension project. We plan to submit the final environmental impact statement for review by the provincial and federal regulators and pursue the required regulatory approvals in 2013.
Rabbit Lake
Production update
Production remains on track for the year. To ensure the most efficient operation of the mill throughout the year, we continually manage ore supply and, therefore, experience large variations in mill production from quarter to quarter.
Smith Ranch-Highland and Crow Butte
Production update
At our US operations, production for the quarter was slightly higher than the first quarter of 2012.
Our ability to bring new wellfields into production in both Wyoming and Nebraska continues to be affected by the lengthened review process to obtain regulatory approvals. The operating environment is becoming more complex as public interest and regulatory oversight increase.
26 CAMECO CORPORATION
Operations update
At Smith Ranch-Highland, we are finishing construction of the satellite plant and the first wellfields at North Butte, with production expected to begin in the second quarter. North Butte is expected to contribute approximately 300,000 pounds in 2013 and rampup to a target annual production rate of more than 700,000 pounds per year by 2015.
Inkai
Production update
Production was 60% higher for the quarter compared to the same period last year. We have continued to bring on new wellfields to maintain a higher head grade in the wellfield production mix, which has resulted in the higher first quarter production. The higher head grade and other improvements to the extraction processes allow the Inkai operation to produce at its design capacity of 5.2 million pounds per year.
Development project
Cigar Lake
Production update
We continued to make solid progress at Cigar Lake in the first quarter and expect commissioning in ore in mid-2013, with the first packaged pounds in the fourth quarter.
Operations update
During the quarter, the first jet boring unit completed a successful test program in waste rock. The second jet boring unit is expected to be shipped to site and moved underground in the second quarter.
Installation of the underground and surface infrastructure required to begin commissioning in ore in mid-2013 is ongoing and progressing well.
Licensing
Cigar Lake’s licence from the Canadian Nuclear Safety Commission (CNSC) expires at the end of 2013. The current licence allows for various mine construction activities as well as mining of ore for commissioning purposes. We made an application to the CNSC in 2012 to amend the current licence, ahead of its expiry date. The application included a request for a ten-year term. The CNSC held a public hearing on April 3, 2013. We expect a decision during the second quarter and anticipate that Cigar Lake will have the full operating licence in mid-2013.
Fuel services 2013 Q1 updates
Port Hope conversion services
Cameco Fuel Manufacturing Inc.
Springfields Fuels Ltd. (SFL)
Production update
Fuel services produced 4.7 million kgU in the first quarter, 4% higher than the same period last year. We increased our production target in 2013 to between 15 million and 16 million kgU, so quarterly production is anticipated to be higher than comparable periods in 2012.
Labour relations
The current collective agreements with unionized employees at the Port Hope conversion facility will expire on June 30, 2013. Bargaining began in April 2013. There is risk to production if we are unable to reach an agreement and a work stoppage occurs.
2013 FIRST QUARTER REPORT 27
Qualified persons
The technical and scientific information discussed in this MD&A for our material properties (McArthur River/Key Lake, Inkai and Cigar Lake) was approved by the following individuals who are qualified persons for the purposes of NI 43-101:
McArthur River/Key Lake
| • | David Bronkhorst, vice-president, Saskatchewan mining south, Cameco |
Cigar Lake
| • | Grant Goddard, vice-president, Saskatchewan mining north, Cameco |
Inkai
• Alain G. Mainville, director, mineral resources management, Cameco
Additional information
Related party transactions
We buy significant amounts of goods and services for our Saskatchewan mining operations from northern Saskatchewan suppliers to support economic development in the region. One of these suppliers is Points Athabasca Contracting Ltd. (PACL). In the first quarter, we paid PACL $11 million for construction and contracting services (first quarter of 2012 – $13 million). These transactions were carried out in the normal course of business. A member of Cameco’s board of directors is the president of PACL.
Critical accounting estimates
Because of the nature of our business, we are required to make estimates that affect the amount of assets and liabilities, revenues and expenses, commitments and contingencies we report.
We base our estimates on our experience, our best judgment, guidelines established by the Canadian Institute of Mining, Metallurgy and Petroleum and on assumptions we believe are reasonable.
Controls and procedures
As of March 31, 2013, we carried out an evaluation under the supervision and with the participation of our management, including our chief executive officer (CEO) and chief financial officer (CFO), of the effectiveness of our disclosure controls and procedures. There are inherent limitations to the effectiveness of any system of disclosure controls and procedures, including the possibility of human error and the circumvention or overriding of the controls and procedures. Accordingly, even effective disclosure controls and procedures can only provide reasonable assurance of achieving their control objectives.
Based upon that evaluation and as of March 31, 2013, the CEO and CFO concluded that:
| • | the disclosure controls and procedures were effective to provide reasonable assurance that information required to be disclosed in the reports we file and submit under applicable securities laws is recorded, processed, summarized and reported as and when required |
| • | such information is accumulated and communicated to our management, including our CEO and CFO, as appropriate to allow timely decisions regarding required disclosure |
There has been no change in our internal control over financial reporting during the quarter ended March 31, 2013 that has materially affected, or is reasonably likely to materially affect, our internal control over financial reporting.
Management has excluded NUKEM from its assessment of internal control over financial reporting as of March 31, 2013 because we acquired NUKEM during the first quarter of 2013. The total assets and total revenues of NUKEM represented approximately 7% and 29%, respectively, of our consolidated financial statement amounts as of and for the quarter ended March 31, 2013.
28 CAMECO CORPORATION
New standards and interpretations
The following new standards and amendments to existing standards were required to be applied for our accounting periods beginning on or after January 1, 2013, unless otherwise noted. These standards did not have a material impact on the financial statements.
| • | IFRS 7 Financial Instruments: Disclosures |
| • | IFRS 10 Consolidated Financial Statements |
| • | IFRS 12 Disclosure of Interests in Other Entities |
| • | IFRS 13 Fair Value Measurement |
| • | IAS 1 Presentation of Financial Statements(effective for annual periods beginning on or after July 1, 2012) |
In addition, the following two accounting changes required a restatement of prior period results:
| • | IFRS 11 Joint Arrangements (IFRS 11)—Under IFRS 11, we classify our interests in joint arrangements as either joint operations or joint ventures depending on our rights to the assets and obligations for the liabilities of the arrangements, the legal form of any separate vehicles, the contractual terms of the arrangements and other facts and circumstances. In accordance with IFRS 11, we have re-evaluated our involvement in joint arrangements at January 1, 2013 and as a result, we have changed our classification conclusion with respect to our investment in BPLP and have determined that our investment should be classified as a joint venture. Accordingly, we applied equity accounting to the investment commencing on January 1, 2013. Previously, the investee was accounted for as a jointly controlled entity using the proportionate consolidation method. |
| • | RevisedIAS 19 Employee Benefits (IAS 19R)—The revisions to IAS 19 have accelerated the recognition of past service costs and replaced interest cost and expected return on plan assets with a measure of net interest on the defined benefit asset or liability. In addition, IAS 19R has resulted in a change in the accounting for both plan administration costs and assets earning no return in refundable tax accounts. These revisions have resulted in adjustments to both our, and BPLP’s defined benefit obligation balances. The adoption of this revised standard did not have a material impact on our financial statements. |
Refer to our 2012 Annual MD&A for a description of each of the above accounting standards and amendments to existing standards.
A number of new standards, interpretations and amendments to existing standards are not yet effective for the year ended December 31, 2013, and have not been applied in preparing these consolidated financial statements. Please refer to our 2012 annual MD&A for a brief description of each accounting pronouncement. We are assessing the impact of the following standards and amendments on our financial statements:
| • | IFRS 9, Financial Instruments |
| • | IAS 32, Financial Instruments: Presentation |
2013 FIRST QUARTER REPORT 29