Exhibit 99.2

Management’s discussion and analysis
for the quarter ended June 30, 2014
SECOND QUARTER UPDATE | 4 | |||
CONSOLIDATED FINANCIAL RESULTS | 8 | |||
OUTLOOK FOR 2014 | 15 | |||
LIQUIDITY AND CAPITAL RESOURCES | 16 | |||
FINANCIAL RESULTS BY SEGMENT | ||||
URANIUM | 18 | |||
FUEL SERVICES | 21 | |||
NUKEM | 22 | |||
OUR OPERATIONS | 23 | |||
URANIUM Q2 UPDATES | 23 | |||
FUEL SERVICES Q2 UPDATES | 25 | |||
QUALIFIED PERSONS | 25 | |||
ADDITIONAL INFORMATION | 25 |
This management’s discussion and analysis (MD&A) includes information that will help you understand management’s perspective of our unaudited condensed consolidated interim financial statements and notes for the quarter ended June 30, 2014 (interim financial statements). The information is based on what we knew as of July 30, 2014 and updates our first quarter and annual MD&A included in our 2013 annual report.
As you review this MD&A, we encourage you to read our interim financial statements as well as our audited consolidated financial statements and notes for the year ended December 31, 2013 and annual MD&A. You can find more information about Cameco, including our audited consolidated financial statements and our most recent annual information form, on our website at cameco.com, on SEDAR at sedar.com or on EDGAR at sec.gov. You should also read our annual information form before making an investment decision about our securities.
The financial information in this MD&A and in our financial statements and notes are prepared according to International Financial Reporting Standards (IFRS), unless otherwise indicated.
Unless we have specified otherwise, all dollar amounts are in Canadian dollars.
Throughout this document, the termswe, us, ourandCameco mean Cameco Corporation and its subsidiaries, including NUKEM Energy Gmbh (NUKEM), unless otherwise indicated.
Caution about forward-looking information
Our MD&A includes statements and information about our expectations for the future. When we discuss our strategy, plans, future financial and operating performance, or other things that have not yet taken place, we are making statements considered to beforward-looking information orforward-looking statements under Canadian and United States securities laws. We refer to them in this MD&A asforward-looking information.
Key things to understand about the forward-looking information in this MD&A:
| • | It typically includes words and phrases about the future, such as: anticipate, believe, estimate, expect, plan, will, intend, goal, target, forecast, project, strategy and outlook (see examples below). |
| • | It represents our current views, and can change significantly. |
| • | It is based on a number ofmaterial assumptions, including those we have listed on page 3, which may prove to be incorrect. |
| • | Actual results and events may be significantly different from what we currently expect, due to the risks associated with our business. We list a number of thesematerial risks on pages 2 and 3. We recommend you also review our annual information form and annual and first quarter MD&A, which includes a discussion of othermaterial risks that could cause actual results to differ significantly from our current expectations. |
| • | Forward-looking information is designed to help you understand management’s current views of our near and longer term prospects, and it may not be appropriate for other purposes. We will not necessarily update this information unless we are required to by securities laws. |
Examples of forward-looking information in this MD&A
| • | the discussion under the headingOur strategy |
| • | our expectations about 2014 and future global uranium supply, consumption, demand and number of new reactors, including the discussion under the headingUranium market update |
| • | our expectations for uranium deliveries in the third and fourth quarters of 2014 |
| • | the discussion of our expectations relating to our tax dispute with Canada Revenue Agency (CRA), including our estimate of the amount and timing of expected cash taxes and transfer pricing penalties payable to CRA |
| • | our consolidated outlook for the year and the outlook for our operating segments for 2014 |
| • | our expectation that existing cash balances and operating cash flows would be sufficient to meet our anticipated 2014 capital requirements without the need for any significant additional funding |
| • | our expectation that our operating and investment activities in 2014 will not be constrained by the financial covenants in our unsecured revolving credit facility |
| • | our uranium price sensitivity analysis |
| • | our future plans and expectations for each of our uranium operating properties and fuel services operating sites |
| • | our plan for up to 1 million packaged pounds (100% basis) in 2014 from milling Cigar Lake ore at AREVA’s McClean Lake mill |
Material risks
| • | actual sales volumes or market prices for any of our products or services are lower than we expect for any reason, including changes in market prices or loss of market share to a competitor |
| • | we are adversely affected by changes in foreign currency exchange rates, interest rates or tax rates |
| • | our production costs are higher than planned, or necessary supplies are not available, or not available on commercially reasonable terms |
| • | our estimates of production, purchases, costs, decommissioning or reclamation expenses, or our tax expense estimates, prove to be inaccurate |
| • | we are unable to enforce our legal rights under our existing agreements, permits or licences |
| • | we are subject to litigation or arbitration that has an adverse outcome, including lack of success in our dispute with CRA |
| • | there are defects in, or challenges to, title to our properties |
| • | our mineral reserve and resource estimates are not reliable, or we face unexpected or challenging geological, hydrological or mining conditions |
| • | we are affected by environmental, safety and regulatory risks, including increased regulatory burdens or delays |
| • | we cannot obtain or maintain necessary permits or approvals from government authorities |
| • | we are affected by political risks in a developing country where we operate |
| • | we are affected by terrorism, sabotage, blockades, civil unrest, social or political activism, accident or a deterioration in political support for, or demand for, nuclear energy |
| • | we are impacted by changes in the regulation or public perception of the safety of nuclear power plants, which adversely affect the construction of new plants, the relicensing of existing plants and the demand for uranium |
2 CAMECO CORPORATION
| • | there are changes to government regulations or policies that adversely affect us, including tax and trade laws and policies |
| • | our uranium and conversion suppliers fail to fulfil delivery commitments |
| • | our Cigar Lake mining or production plans are delayed or do not succeed, including as a result of any difficulties with the jet boring mining method or freezing the deposit to meet production targets, or any difficulties with the McClean Lake mill modifications or commissioning or milling of Cigar Lake ore, or our inability to acquire any of the required jet boring equipment |
| • | our McArthur River development, mining or production plans are delayed or do not succeed for any reason |
| • | we are affected by natural phenomena, including inclement weather, fire, flood and earthquakes |
| • | our operations are disrupted due to problems with our own or our customers’ facilities, the unavailability of reagents, equipment, operating parts and supplies critical to production, equipment failure, lack of tailings capacity, labour shortages, labour relations issues (including an inability to renew agreements with unionized employees at McArthur River and Key Lake), strikes or lockouts, underground floods, cave- ins, ground movements, tailings dam failures, transportation disruptions or accidents, or other development and operating risks |
Material assumptions
| • | our expectations regarding sales and purchase volumes and prices for uranium and fuel services |
| • | our expectations regarding the demand for uranium, the construction of new nuclear power plants and the relicensing of existing nuclear power plants not being more adversely affected than expected by changes in regulation or in the public perception of the safety of nuclear power plants |
| • | our expected production level and production costs |
| • | the assumptions regarding market conditions upon which we have based our capital expenditures expectations |
| • | our expectations regarding spot prices and realized prices for uranium, and other factors discussed on page 20,Price sensitivity analysis: uranium |
| • | our expectations regarding tax rates and payments, foreign currency exchange rates and interest rates |
| • | our expectations about the outcome of the dispute with CRA |
| • | our decommissioning and reclamation expenses |
| • | our mineral reserve and resource estimates, and the assumptions upon which they are based, are reliable |
| • | the geological, hydrological and other conditions at our mines |
| • | our Cigar Lake mining and production plans succeed, including the additional jet boring equipment is acquired on schedule, the jet boring mining method works as anticipated and the deposit freezes as planned |
| • | mill modifications and commissioning of the McClean Lake mill are completed as planned and the mill is able to process Cigar Lake ore as expected, including our expectation of processing up to 1 million packaged pounds (100% basis) in 2014 |
| • | our McArthur River development, mining and production plans succeed |
| • | our ability to continue to supply our products and services in the expected quantities and at the expected times |
| • | our ability to comply with current and future environmental, safety and other regulatory requirements, and to obtain and maintain required regulatory approvals |
| • | our operations are not significantly disrupted as a result of political instability, nationalization, terrorism, sabotage, blockades, civil unrest, breakdown, natural disasters, governmental or political actions, litigation or arbitration proceedings, the unavailability of reagents, equipment, operating parts and supplies critical to production, labour shortages, labour relations issues (including an inability to renew agreements with unionized employees at McArthur River and Key Lake), strikes or lockouts, underground floods, cave-ins, ground movements, tailings dam failure, lack of tailings capacity, transportation disruptions or accidents or other development or operating risks |
2014 SECOND QUARTER REPORT 3
Our strategy
Our strategy is to profitably produce at a pace aligned with market signals, while maintaining the flexibility to respond to market conditions as they evolve. We remain focused on taking advantage of the long-term growth we see coming in our industry to increase long-term shareholder value.
We plan to:
| • | carry out all of our business with a focus on safety, people and the environment |
| • | ensure continued reliable, low-cost production from our flagship operation, McArthur River/Key Lake and seek to expand that production |
| • | ensure continued reliable, low-cost production at Inkai |
| • | successfully bring on and ramp up production at Cigar Lake |
| • | manage the rest of our production facilities and potential sources of supply in a manner that retains the flexibility to respond to market signals and take advantage of value adding opportunities within our own portfolio and the uranium market |
| • | manage and allocate capital in a way that balances growing the long-term value of the business and returns to shareholders, while maintaining a strong balance sheet and our investment grade rating |
You can read more about our strategy in our 2013 annual MD&A.
Second quarter update
On January 31, 2014, we announced the sale of our 31.6% limited partnership interest in Bruce Power Limited Partnership (BPLP) and related entities for $450 million. The sale closed on March 27, 2014 and has been accounted for as being completed effective January 1, 2014.
Under IFRS, we are required to report the results from discontinued operations separately from continuing operations. We have included our operating earnings from BPLP, and the financial impact of the sale, in discontinued operations.
Throughout this document, for comparison purposes, all results for “earnings from continuing operations” and “cash from continuing operations” have been revised to exclude BPLP. The impact of BPLP is shown separately as a discontinued operation.
Our performance
HIGHLIGHTS ($ MILLIONS EXCEPT WHERE INDICATED) | THREE MONTHS ENDED JUNE 30 | CHANGE | SIX MONTHS ENDED JUNE 30 | CHANGE | ||||||||||||||||||||
| 2014 | 2013 | 2014 | 2013 | |||||||||||||||||||||
Revenue | 502 | 421 | 19 | % | 921 | 865 | 6 | % | ||||||||||||||||
Gross profit | 136 | 99 | 37 | % | 243 | 194 | 25 | % | ||||||||||||||||
Net earnings attributable to equity holders | 127 | 34 | 274 | % | 259 | 43 | 502 | % | ||||||||||||||||
$ per common share (diluted) | 0.32 | 0.09 | 256 | % | 0.65 | 0.11 | 491 | % | ||||||||||||||||
Adjusted net earnings (non-IFRS, see page 9) | 79 | 61 | 30 | % | 115 | 88 | 31 | % | ||||||||||||||||
$ per common share (adjusted and diluted) | 0.20 | 0.15 | 33 | % | 0.29 | 0.22 | 32 | % | ||||||||||||||||
Cash provided by (used in) continuing operations (after working capital changes) | (25 | ) | (33 | ) | 24 | % | (18 | ) | 207 | (109 | )% | |||||||||||||
SECOND QUARTER
Net earnings attributable to equity holders (net earnings) this quarter were $127 million ($0.32 per share diluted) compared to $34 million ($0.09 per share diluted) in the second quarter of 2013. In addition to the items noted below, our net earnings were affected by mark-to-market gains on foreign exchange derivatives compared to losses in 2013.
4 CAMECO CORPORATION
On an adjusted basis, our earnings this quarter were $79 million ($0.20 per share diluted) compared to $61 million ($0.15 per share diluted) (non-IFRS measure, see page 9) in the second quarter of 2013. The change was mainly due to:
| • | higher earnings from our uranium segment based on higher sales volumes and higher Canadian dollar average realized prices |
| • | a favourable settlement of $28 million with respect to a dispute regarding a long-term supply contract with a utility customer |
partially offset by:
| • | settlement costs of $12 million with respect to the early redemption of our Series C debentures |
| • | lower tax recoveries due to a decline in pre-tax losses in Canada |
SeeFinancial results by segment on page 18 for more detailed discussion.
FIRST SIX MONTHS
Net earnings in the first six months of the year were $259 million ($0.65 per share diluted) compared to $43 million ($0.11 per share diluted) in the first six months of 2013. In addition to the items noted below, net earnings were impacted by a gain on the sale of our interest in BPLP of $127 million and mark-to-market gains on foreign exchange derivatives compared to losses in 2013.
On an adjusted basis, our earnings for the first six months of this year were $115 million ($0.29 per share diluted) compared to $88 million ($0.22 per share diluted) (non-IFRS measure, see page 9) for the first six months of 2013, mainly due to:
| • | higher earnings from our uranium business based on higher sales volumes and higher Canadian dollar average realized prices |
| • | a favourable settlement of $28 million with respect to a dispute regarding a long-term supply contract with a utility customer |
partially offset by:
| • | an early termination fee of $18 million incurred as a result of the cancellation of our toll conversion agreement with Springfields Fuels Ltd. (SFL), which was to expire in 2016 |
| • | settlement costs of $12 million with respect to the early redemption our Series C debentures |
SeeFinancial results by segment on page 18 for more detailed discussion.
Operations update
| THREE MONTHS ENDED JUNE 30 | SIX MONTHS ENDED JUNE 30 | |||||||||||||||||||||||||
HIGHLIGHTS | 2014 | 2013 | CHANGE | 2014 | 2013 | CHANGE | ||||||||||||||||||||
Uranium | Production volume (million lbs) | 4.0 | 4.4 | (9 | )% | 9.7 | 10.3 | (6 | )% | |||||||||||||||||
| Sales volume (million lbs) | 7.4 | 6.4 | 16 | % | 14.3 | 11.6 | 23 | % | ||||||||||||||||||
| Average realized price ($US/lb) | 45.93 | 46.30 | (1 | )% | 46.26 | 47.24 | (2 | )% | ||||||||||||||||||
| ($Cdn/lb) | 50.76 | 47.35 | 7 | % | 50.67 | 47.75 | 6 | % | ||||||||||||||||||
| Revenue ($ millions) | 376 | 305 | 23 | % | 724 | 552 | 31 | % | ||||||||||||||||||
| Gross profit ($ millions) | 110 | 91 | 21 | % | 229 | 174 | 32 | % | ||||||||||||||||||
Fuel services | Production volume (million kgU) | 3.8 | 4.8 | (21 | )% | 7.8 | 9.6 | (19 | )% | |||||||||||||||||
| Sales volume (million kgU) | 3.3 | 4.0 | (18 | )% | 5.1 | 7.3 | (30 | )% | ||||||||||||||||||
| Average realized price ($Cdn/kgU) | 21.28 | 16.45 | 29 | % | 21.68 | 17.89 | 21 | % | ||||||||||||||||||
| Revenue ($ millions) | 70 | 65 | 8 | % | 110 | 131 | (16 | )% | ||||||||||||||||||
| Gross profit ($ millions) | 16 | 10 | 60 | % | 18 | 21 | (14 | )% | ||||||||||||||||||
NUKEM | Sales volume U3O8(million lbs) | �� | 1.5 | 1.2 | 25 | % | 2.2 | 3.5 | (37 | )% | ||||||||||||||||
| Average realized price ($Cdn/lb) | 41.63 | 44.40 | (6 | )% | 41.01 | 44.26 | (7 | )% | ||||||||||||||||||
| Revenue ($ millions) | 62 | 53 | 17 | % | 94 | 183 | (49 | )% | ||||||||||||||||||
| Gross profit ($ millions) | 13 | 3 | 333 | % | 10 | 8 | 25 | % | ||||||||||||||||||
2014 SECOND QUARTER REPORT 5
Production in our uranium segment this quarter was 9% lower compared to the second quarter of 2013, due to an extension of the planned annual maintenance shutdown at Key Lake in the second quarter of 2014, and lower production at Crow Butte and Inkai. SeeUranium Q2 updates starting on page 23 for more information.
Key highlights:
| • | the environmental assessment (EA) for the Key Lake extension project was reviewed and approved by the Canadian Nuclear Safety Commission (CNSC), allowing Key Lake to increase tailings capacity and increase production to 25 million pounds per year |
| • | on July 16, we announced that we had temporarily stopped mine production at Cigar Lake in order to allow localized areas of the orebody to freeze more thoroughly |
Production in our fuel services segment was 21% lower this quarter than in the second quarter of 2013 due to lower planned annual production in 2014.
Also of note this quarter:
During the quarter, we arrived at a favourable settlement in a dispute with a utility customer regarding damages owed under a long-term supply contract. While the contract is effective for the years 2011 through 2017, the settlement of $28 million, reflected in our financial statements asother income, relates only to the deliveries that were refused by the customer in 2012 and 2013. For the remainder of the contract, the customer will be responsible for either buying the full yearly contract quantity, or compensating us for any loss if they do not accept delivery of the full quantities.
In July 2014, a decision was made by the majority partner of GE-Hitachi Global Laser Enrichment (GLE) to significantly reduce funding to GLE. In accordance with the provisions of IAS 36Impairment of Assets, we consider this to be an indicator that our investment in GLE could potentially be impaired and accordingly, we are required to estimate the asset’s recoverable amount. We are in the process of evaluating how our investment in GLE will be impacted as a result of this decision. The carrying value of our investment in GLE at June 30, 2014 is $165 million (US).
Uranium market update
Through the first half of 2014, market conditions continued along the same trend as in 2013. On the supply side, production cutbacks and project deferrals have contributed positively to long-term fundamentals, while the near-term market continues to be adequately supplied. As a result, downward pressure continued on both spot and long-term uranium prices. Utilities remain well covered and we expect little improvement over the near to medium term.
While there has been no fundamental change to market conditions, there have been developments that solidify the positive long-term outlook, including the approval of a new energy policy in Japan that confirms nuclear power will remain an important electricity source for the country. The Nuclear Regulatory Authority (NRA) has continued to clarify the process for utilities to begin restarting the country’s idled nuclear reactors. Restart applications for 19 reactors have been submitted to the NRA by nine utilities, demonstrating utilities’ commitment to bring their nuclear generating capacity back online. Sendai units 1 and 2, operated by Kyushu Electric Power, have now successfully passed the NRA safety inspection, and have entered into a period of public comment, prior to potential restart approval. While the initial restarts will be a positive industry development, we expect it will take some time for a significant number of reactors to resume operations and begin to consume the inventory that Japanese utilities have built up over the past several years.
Long-term fundamentals remain positive, as nuclear growth continues around the world. Approximately 70 new reactors are under construction, and we expect a net increase of 91 reactors over the next decade. This reactor growth is expected to drive an increase in annual uranium consumption, from today’s 170 million pounds to about 240 million pounds over the same time period. This demand fundamental, combined with the timing, development, and execution of new supply projects, along with the continued performance of existing supply, will determine the pace of market recovery.
Caution about forward-looking information relating to our uranium market update
This discussion of our expectations for the nuclear industry, including its growth profile and future global uranium supply, demand and consumption, and net increase in reactors, is forward-looking information that is based upon the assumptions and subject to the material risks discussed under the headingCaution about forward-looking information beginning on page 2.
6 CAMECO CORPORATION
Industry Prices
| JUN 30 2014 | MAR 31 2014 | JUN 30 2013 | MAR 31 2013 | |||||||||||||
Uranium ($US/lb U3O8) 1 | ||||||||||||||||
Average spot market price | 28.23 | 34.00 | 39.60 | 42.25 | ||||||||||||
Average long-term price | 44.50 | 46.00 | 57.00 | 56.50 | ||||||||||||
Fuel services ($US/kgU as UF6)1 | ||||||||||||||||
Average spot market price | ||||||||||||||||
North America | 7.25 | 7.63 | 10.00 | 10.50 | ||||||||||||
Europe | 7.50 | 8.00 | 10.38 | 11.00 | ||||||||||||
Average long-term price | ||||||||||||||||
North America | 16.00 | 16.00 | 16.75 | 16.75 | ||||||||||||
Europe | 17.00 | 17.00 | 17.25 | 17.25 | ||||||||||||
Note: the industry does not publish UO2prices.
| 1 | Average of prices reported by TradeTech and Ux Consulting (Ux) |
On the spot market, where purchases call for delivery within one year, the volume reported for the second quarter of 2014 was approximately 8 million pounds. This compares to approximately 10 million pounds in the second quarter of 2013.
At the end of the quarter, the average reported spot price declined to $28.23 (US) per pound, and the average reported long-term price declined to $44.50 (US) per pound.
Long-term contracts usually call for deliveries to begin more than two years after the contract is finalized, and use a number of pricing formulas, including fixed prices escalated over the term of the contract, and market referenced prices (spot and long-term indicators quoted near the time of delivery).
Spot UF6 conversion prices declined during the quarter, while long-term UF6 conversion prices held firm.
| SHARES AND STOCK OPTIONS OUTSTANDING | DIVIDEND POLICY | |
At July 29, 2014, we had:
• 395,785,122 common shares and one Class B share outstanding
• 8,465,905 stock options outstanding, with exercise prices ranging from $19.37 to $54.38 | Our board of directors has established a policy of paying a quarterly dividend of $0.10 ($0.40 per year) per common share. This policy will be reviewed from time to time based on our cash flow, earnings, financial position, strategy and other relevant factors. | |
2014 SECOND QUARTER REPORT 7
Financial results
This section of our MD&A discusses our performance, financial condition and outlook for the future.
Consolidated financial results
| HIGHLIGHTS | THREE MONTHS ENDED JUNE 30 | SIX MONTHS ENDED JUNE 30 | ||||||||||||||||||||||
($ MILLIONS EXCEPT WHERE INDICATED) | 2014 | 2013 | CHANGE | 2014 | 2013 | CHANGE | ||||||||||||||||||
Revenue | 502 | 421 | 19 | % | 921 | 865 | 6 | % | ||||||||||||||||
Gross profit | 136 | 99 | 37 | % | 243 | 194 | 25 | % | ||||||||||||||||
Net earnings attributable to equity holders | 127 | 34 | 274 | % | 259 | 43 | 502 | % | ||||||||||||||||
$ per common share (basic) | 0.32 | 0.09 | 256 | % | 0.65 | 0.11 | 491 | % | ||||||||||||||||
$ per common share (diluted) | 0.32 | 0.09 | 256 | % | 0.65 | 0.11 | 491 | % | ||||||||||||||||
Adjusted net earnings (non-IFRS, see page 9) | 79 | 61 | 30 | % | 115 | 88 | 31 | % | ||||||||||||||||
$ per common share (adjusted and diluted) | 0.20 | 0.15 | 33 | % | 0.29 | 0.22 | 32 | % | ||||||||||||||||
Cash provided by (used in) continuing operations (after working capital changes) | (25 | ) | (33 | ) | 24 | % | (18 | ) | 207 | (109 | )% | |||||||||||||
Net earnings
Net earnings attributable to equity holders (net earnings) this quarter were $127 million ($0.32 per share diluted) compared to $34 million ($0.09 per share diluted) in the second quarter of 2013. In addition to the items noted below, our net earnings were affected by mark-to-market gains on foreign exchange derivatives compared to losses in 2013.
On an adjusted basis, our earnings this quarter were $79 million ($0.20 per share diluted) compared to $61 million ($0.15 per share diluted) (non-IFRS measure, see page 9) in the second quarter of 2013. The change was mainly due to:
| • | higher earnings from our uranium segment based on higher sales volumes and higher Canadian dollar average realized prices |
| • | a favourable settlement of $28 million with respect to a dispute regarding a long-term supply contract with a utility customer |
partially offset by:
| • | settlement costs of $12 million with respect to the early redemption of our Series C debentures |
| • | lower tax recoveries due to a decline in pre-tax losses in Canada |
Net earnings in the first six months of the year were $259 million ($0.65 per share diluted) compared to $43 million ($0.11 per share diluted) in the first six months of 2013. In addition to the items noted below, net earnings were impacted by a gain on the sale of our interest in BPLP of $127 million and mark-to-market gains on foreign exchange derivatives compared to losses in 2013.
On an adjusted basis, our earnings for the first six months of this year were $115 million ($0.29 per share diluted) compared to $88 million ($0.22 per share diluted) (non-IFRS measure, see page 9) for the first six months of 2013, mainly due to:
| • | higher earnings from our uranium business based on higher sales volumes and higher Canadian dollar average realized prices |
| • | a favourable settlement of $28 million with respect to a dispute regarding a long-term supply contract with a utility customer |
partially offset by:
| • | an early termination fee of $18 million incurred as a result of the cancellation of our toll conversion agreement with SFL, which was to expire in 2016 |
| • | settlement costs of $12 million with respect to the early redemption of our Series C debentures |
SeeFinancial results by segment on page 18 for more detailed discussion.
8 CAMECO CORPORATION
Adjusted net earnings (non-IFRS measure)
Adjusted net earnings is a measure that does not have a standardized meaning or a consistent basis of calculation under IFRS (non-IFRS measure). We use this measure as a more meaningful way to compare our financial performance from period to period. We believe that, in addition to conventional measures prepared in accordance with IFRS, certain investors use this information to evaluate our performance. Adjusted net earnings is our net earnings attributable to equity holders, adjusted to better reflect the underlying financial performance for the reporting period. The adjusted earnings measure reflects the matching of the net benefits of our hedging program with the inflows of foreign currencies in the applicable reporting period, and has been adjusted for pre-tax adjustments on derivatives, NUKEM purchase price inventory write-down, impairment charge on non-producing property, income taxes on adjustments, and the after tax gain on the sale of our interest in BPLP.
Adjusted net earnings is non-standard supplemental information and should not be considered in isolation or as a substitute for financial information prepared according to accounting standards. Other companies may calculate this measure differently, so you may not be able to make a direct comparison to similar measures presented by other companies.
The table on the following page reconciles adjusted net earnings with our net earnings.
| THREE MONTHS ENDED JUNE 30 | SIX MONTHS ENDED JUNE 30 | |||||||||||||||
($ MILLIONS) | 2014 | 2013 | 2014 | 2013 | ||||||||||||
Net earnings attributable to equity holders | 127 | 34 | 259 | 43 | ||||||||||||
|
|
|
|
|
|
|
| |||||||||
Adjustments | ||||||||||||||||
Adjustments on derivatives1(pre-tax) | (66 | ) | 36 | (23 | ) | 61 | ||||||||||
Income taxes on adjustments to derivatives | 18 | (9 | ) | 6 | (16 | ) | ||||||||||
Gain on interest in BPLP (after tax) | — | — | (127 | ) | — | |||||||||||
|
|
|
|
|
|
|
| |||||||||
Adjusted net earnings | 79 | 61 | 115 | 88 | ||||||||||||
|
|
|
|
|
|
|
| |||||||||
| 1 | We do not apply hedge accounting for our portfolio of foreign currency forward sales contracts. However, we have adjusted our gains or losses on derivatives to reflect what our earnings would have been had hedge accounting been in place. |
2014 SECOND QUARTER REPORT 9
The table below shows what contributed to the change in adjusted net earnings this quarter.
| THREE MONTHS | SIX MONTHS | |||||||||
($ MILLIONS) | ENDED JUNE 30 | ENDED JUNE 30 | ||||||||
Adjusted net earnings– 2013 | 61 | 88 | ||||||||
|
|
|
| |||||||
| Change in gross profit by segment | (we calculate gross profit by deducting from revenue the cost of products and services sold, and depreciation and amortization (D&A), net of hedging benefits) | |||||||||
Uranium | Higher sales volume | 14 | 41 | |||||||
Lower realized prices ($US) | (3 | ) | (14 | ) | ||||||
| Foreign exchange impact on realized prices | 28 | 56 | ||||||||
Higher costs | (19 | ) | (28 | ) | ||||||
Hedging benefits | (2 | ) | (19 | ) | ||||||
|
|
|
| |||||||
change –uranium | 18 | 36 | ||||||||
|
|
|
| |||||||
Fuel services | Lower sales volume | (2 | ) | (6 | ) | |||||
Higher realized prices ($Cdn) | 16 | 19 | ||||||||
Higher costs | (8 | ) | (16 | ) | ||||||
Hedging benefits | (1 | ) | (1 | ) | ||||||
|
|
|
| |||||||
change –fuel services | 5 | (4 | ) | |||||||
|
|
|
| |||||||
NUKEM | Gross profit | 10 | 2 | |||||||
|
|
|
| |||||||
change –NUKEM | 10 | 2 | ||||||||
|
|
|
| |||||||
Other changes | ||||||||||
Lower administration expenditures | 6 | 17 | ||||||||
Lower exploration expenditures | 7 | 13 | ||||||||
Loss on disposal of assets | (7 | ) | (5 | ) | ||||||
Debenture redemption premium | (12 | ) | (12 | ) | ||||||
Foreign exchange | (25 | ) | (15 | ) | ||||||
Loss on equity accounted investments | (3 | ) | (11 | ) | ||||||
Contract termination fee (SFL) | — | (18 | ) | |||||||
Partial arbitration award | 28 | 28 | ||||||||
Higher income taxes | (12 | ) | — | |||||||
Other | 3 | (4 | ) | |||||||
|
|
|
| |||||||
Adjusted net earnings– 2014 | 79 | 115 | ||||||||
|
|
|
| |||||||
SeeFinancial results by segment on page 18 for more detailed discussion.
Quarterly trends
HIGHLIGHTS ($ MILLIONS EXCEPT PER SHARE AMOUNTS) | 2014 | 2013 | 2012 | |||||||||||||||||||||||||||||
| Q2 | Q1 | Q4 | Q3 | Q2 | Q1 | Q41 | Q31 | |||||||||||||||||||||||||
Revenue | 502 | 419 | 977 | 597 | 421 | 444 | 846 | 296 | ||||||||||||||||||||||||
Net earnings attributable to equity holders | 127 | 132 | 64 | 211 | 34 | 9 | 41 | 79 | ||||||||||||||||||||||||
$ per common share (basic) | 0.32 | 0.33 | 0.16 | 0.53 | 0.09 | 0.02 | 0.10 | 0.20 | ||||||||||||||||||||||||
$ per common share (diluted) | 0.32 | 0.33 | 0.16 | 0.53 | 0.09 | 0.02 | 0.10 | 0.20 | ||||||||||||||||||||||||
Adjusted net earnings (non-IFRS, see page 9) | 79 | 36 | 150 | 208 | 61 | 27 | 233 | 49 | ||||||||||||||||||||||||
$ per common share (adjusted and diluted) | 0.20 | 0.09 | 0.38 | 0.53 | 0.15 | 0.07 | 0.59 | 0.12 | ||||||||||||||||||||||||
Earnings from continuing operations | 127 | 3 | 29 | 164 | 33 | 8 | 7 | 47 | ||||||||||||||||||||||||
$ per common share (basic) | 0.32 | 0.01 | 0.07 | 0.41 | 0.08 | 0.02 | 0.02 | 0.12 | ||||||||||||||||||||||||
$ per common share (diluted) | 0.32 | 0.01 | 0.07 | 0.41 | 0.08 | 0.02 | 0.02 | 0.12 | ||||||||||||||||||||||||
Cash provided by (used in) continuing operations (after working capital changes) | (25 | ) | 7 | 163 | 154 | (33 | ) | 240 | 281 | 43 | ||||||||||||||||||||||
| 1 | Our quarterly results have been revised in accordance withIFRS 11 – Joint Arrangements andIAS 19 – Employee Benefits. |
Key things to note:
| • | our financial results are strongly influenced by the performance of our uranium segment, which accounted for 75% of consolidated revenues in the second quarter of 2014 |
10 CAMECO CORPORATION
| • | the timing of customer requirements, which tend to vary from quarter to quarter, drives revenue in the uranium and fuel services segments |
| • | Net earnings do not trend directly with revenue due to unusual items and transactions that occur from time to time. We use adjusted net earnings, a non-IFRS measure, as a more meaningful way to compare our results from period to period (see page 9 for more information). |
| • | cash from operations tends to fluctuate as a result of the timing of deliveries and product purchases in our uranium and fuel services segments |
| • | quarterly results are not necessarily a good indication of annual results due to seasonal variability in customer requirements |
The table that follows presents the differences between net earnings and adjusted net earnings for the previous seven quarters.
HIGHLIGHTS ($ MILLIONS EXCEPT PER SHARE AMOUNTS) | 2014 | 2013 | 2012 | |||||||||||||||||||||||||||||
| Q2 | Q1 | Q4 | Q3 | Q2 | Q1 | Q42 | Q32 | |||||||||||||||||||||||||
Net earnings attributable to equity holders | 127 | 132 | 64 | 211 | 34 | 9 | 41 | 79 | ||||||||||||||||||||||||
Adjustments | ||||||||||||||||||||||||||||||||
Adjustments on derivatives1 (pre-tax) | (66 | ) | 44 | 36 | (41 | ) | 36 | 25 | 33 | (40 | ) | |||||||||||||||||||||
NUKEM purchase price inventory write-down | — | — | (3 | ) | 17 | — | — | — | — | |||||||||||||||||||||||
Impairment charge on non-producing property | — | — | 70 | 15 | — | — | 168 | — | ||||||||||||||||||||||||
Income taxes on adjustments | 18 | (12 | ) | (17 | ) | 6 | (9 | ) | (7 | ) | (9 | ) | 10 | |||||||||||||||||||
Gain on sale of BPLP (after tax) | — | (127 | ) | — | — | — | — | — | — | |||||||||||||||||||||||
Adjusted net earnings (non-IFRS, see page 9) | 79 | 36 | 150 | 208 | 61 | 27 | 233 | 49 | ||||||||||||||||||||||||
| 1 | We do not apply hedge accounting for our portfolio of foreign currency forward sales contracts. However, we have adjusted our gains or losses on derivatives to reflect what our earnings would have been had hedge accounting been in place. |
| 2 | Our quarterly results have been revised in accordance withIFRS 11 – Joint Arrangements andIAS 19 – Employee Benefits. |
Discontinued operation
On March 27, 2014, we completed the sale of our 31.6% limited partnership interest in BPLP. The aggregate sale price for our interest in BPLP and certain related entities was $450 million. The sale has been accounted for effective January 1, 2014. We realized an after tax gain of $127 million on this divestiture. See note 4 to the interim financial statements for more information.
| THREE MONTHS ENDED JUNE 30 | SIX MONTHS ENDED JUNE 30 | |||||||||||||||
($ MILLIONS) | 2014 | 2013 | 2014 | 2013 | ||||||||||||
Share of earnings from BPLP and related entities | 1.0 | 2.2 | ||||||||||||||
Tax expense | — | (0.2 | ) | — | (0.5 | ) | ||||||||||
|
|
|
|
|
|
|
| |||||||||
| 0.8 | — | 1.7 | ||||||||||||||
Gain on disposal of BPLP and related entities | — | — | 144.9 | — | ||||||||||||
Tax expense on disposal | — | (17.7 | ) | — | ||||||||||||
|
|
|
|
|
|
|
| |||||||||
| — | — | 127.2 | — | |||||||||||||
|
|
|
|
|
|
|
| |||||||||
Net earnings from discontinued operations | — | 0.8 | 127.2 | 1.7 | ||||||||||||
|
|
|
|
|
|
|
| |||||||||
Corporate expenses
ADMINISTRATION
| THREE MONTHS ENDED JUNE 30 | SIX MONTHS ENDED JUNE 30 | |||||||||||||||||||||||
($ MILLIONS) | 2014 | 2013 | CHANGE | 2014 | 2013 | CHANGE | ||||||||||||||||||
Direct administration | 35 | 37 | (5 | )% | 74 | 81 | (9 | )% | ||||||||||||||||
Restructuring charges | — | 2 | (100 | )% | — | 5 | (100 | )% | ||||||||||||||||
Stock-based compensation | 1 | 4 | (75 | )% | 8 | 13 | (38 | )% | ||||||||||||||||
|
|
|
|
|
|
|
|
|
|
|
| |||||||||||||
Total administration | 36 | 43 | (16 | )% | 82 | 99 | (17 | )% | ||||||||||||||||
|
|
|
|
|
|
|
|
|
|
|
| |||||||||||||
2014 SECOND QUARTER REPORT 11
Direct administration costs were $2 million lower for the second quarter compared to the same period last year and $7 million lower for the first six months due to the NUKEM advisory fee paid in 2013 ($3 million), as well as reduced spending on projects compared to the second quarter of 2013.
Stock based compensation in the first six months was $5 million lower than in 2013 due to a change in the compensation program.
EXPLORATION
In the second quarter, uranium exploration expenses were $9 million, a decrease of $7 million compared to the second quarter of 2013. Exploration expenses for the first six months of the year decreased to $24 million from $37 million in 2013 as a result of decreased activity in Australia and a more focused effort on our core projects in Saskatchewan.
INCOME TAXES
We recorded an income tax recovery of $6 million in the second quarter of 2014 compared to a recovery of $45 million in the second quarter of 2013. The change in the net recovery was due to additional earnings in the second quarter of 2014 combined with a change in the distribution of earnings between jurisdictions. In 2014, we recorded losses of $49 million in Canada compared to $199 million in 2013, while earnings in foreign jurisdictions decreased to $170 million from $187 million. The tax rate in Canada is higher than the average of the rates in the foreign jurisdictions in which our subsidiaries operate.
On an adjusted basis, we recorded an income tax recovery of $23 million this quarter compared to a recovery of $35 million in the second quarter of 2013 due to higher pre-tax adjusted earnings and a change in the distribution of earnings between jurisdictions.
In the first six months of 2014, we recorded an income tax recovery of $51 million compared to a recovery of $73 million in 2013. The change in the net recovery was due to additional earnings in the first six months of 2014 combined with a change in the distribution of earnings between jurisdictions. In 2014, we recorded losses of $242 million in Canada compared to $328 million in 2013, while earnings in foreign jurisdictions increased to $321 million from $295 million. The tax rate in Canada is higher than the average of the rates in the foreign jurisdictions in which our subsidiaries operate.
On an adjusted basis, we recorded an income tax recovery of $57 million for the first 6 months, the same as in 2013.
| THREE MONTHS ENDED JUNE 30 | SIX MONTHS ENDED JUNE 30 | |||||||||||||||
($ MILLIONS) | 2014 | 2013 | 2014 | 2013 | ||||||||||||
Pre-tax adjusted earnings1 | ||||||||||||||||
Canada2 | (116 | ) | (156 | ) | (266 | ) | (262 | ) | ||||||||
Foreign | 171 | 181 | 323 | 292 | ||||||||||||
|
|
|
|
|
|
|
| |||||||||
Total pre-tax adjusted earnings | 55 | 25 | 57 | 30 | ||||||||||||
|
|
|
|
|
|
|
| |||||||||
Adjusted income taxes1 | ||||||||||||||||
Canada2 | (29 | ) | (36 | ) | (66 | ) | (64 | ) | ||||||||
Foreign | 6 | 1 | 9 | 7 | ||||||||||||
|
|
|
|
|
|
|
| |||||||||
Adjusted income tax expense (recovery) | (23 | ) | (35 | ) | (57 | ) | (57 | ) | ||||||||
|
|
|
|
|
|
|
| |||||||||
Effective tax rate | (42 | )% | (140 | )% | (100 | )% | (190 | )% | ||||||||
|
|
|
|
|
|
|
| |||||||||
| 1 | Pre-tax adjusted earnings and adjusted income taxes are non-IFRS measures. |
| 2 | Our IFRS-based measures have been adjusted by the amounts reflected in the table in adjusted net earnings (non-IFRS measure on page 9). |
CRA DISCLOSURE
As previously reported, since 2008, the Canada Revenue Agency (CRA) has disputed the offshore marketing company structure and related transfer pricing methodology we used for certain intercompany uranium sale and purchase agreements, and issued notices of reassessment for our 2003 through 2009 tax returns. We continue to believe the ultimate resolution of this matter will not be material to our financial position, results of operations and cash flows in the year(s) of resolution. During the quarter, we received the reassessment for the 2009 taxation year and made associated payments to CRA.
12 CAMECO CORPORATION
Transfer pricing is a complex area of tax law, and it is difficult to predict the outcome of a case like ours as there are only a handful of reported court decisions on transfer pricing in Canada. However, tax authorities generally test two things:
| • | the governance (structure) of the corporate entities involved in the transactions |
| • | the price at which goods and services are sold by one member of a corporate group to another |
The majority of our customers are located outside Canada and we established a marketing structure involving foreign companies including Cameco Europe Ltd., which entered into intercompany purchase and sale agreements with Cameco as well as uranium supply agreements with third parties. Cameco and Cameco Europe Ltd. made reasonable efforts to put arm’s length transfer pricing arrangements in place, and these arrangements expose both parties to the risks and rewards accruing to them under this portfolio of purchase and sales contracts.
The intercompany contract prices are generally comparable to those established in sales contracts between arm’s-length buyers and sellers entered into at that time. We have recorded a cumulative tax provision of $76 million, where an argument could be made that our transfer price may have fallen outside of an appropriate range of pricing in uranium contracts for the period from 2003 to June 30, 2014.
We are confident that we will be successful in our case; however, for the years 2003 through 2009, CRA issued notices of reassessment for approximately $2.8 billion of additional income for Canadian tax purposes, which would result in a related tax expense of about $820 million. The Canadian Income Tax Act includes provisions that require larger companies like us to pay 50% of the cash tax plus related interest and penalties at the time of reassessment. To date, under these provisions, after applying elective deductions and tax loss carryovers, we have been required to pay a net amount of $215 million to CRA, which includes the amounts shown in the table below.
YEAR ($ MILLIONS) | CASH TAXES | INTEREST AND INSTALMENT PENALTIES | TRANSFER PRICING PENALTIES | TOTAL | ||||||||||||
Prior to 2013 | — | 13 | — | 13 | ||||||||||||
2013 | 1 | 9 | 36 | 46 | ||||||||||||
2014 | 106 | 50 | — | 156 | ||||||||||||
|
|
|
|
|
|
|
| |||||||||
Total | 107 | 72 | 36 | 215 | ||||||||||||
|
|
|
|
|
|
|
| |||||||||
Using the methodology we believe CRA will continue to apply, and including the $2.8 billion already reassessed, we expect to receive notices of reassessment for a total of approximately $5.7 billion of additional income as taxable in Canada for the years 2003 through 2013, which would result in a related tax expense of approximately $1.6 billion. As well, CRA may continue to apply transfer pricing penalties to taxation years subsequent to 2007. As a result, we estimate that cash taxes and transfer pricing penalties would be between $1.25 billion and $1.3 billion. In addition, we estimate there would be interest and instalment penalties applied that would be material to us. We would be responsible for remitting 50% of the cash taxes and transfer pricing penalties (between $625 million and $650 million), plus related interest and instalment penalties assessed, which would be material to us.
Under the Canadian federal and provincial tax legislation, the amount required to be remitted each year will depend on the amount of income reassessed in that year and the availability of elective deductions and tax loss carryovers. The estimated amounts summarized in the table below reflect actual amounts paid and estimated future payments to CRA.
$ MILLIONS | 2003 - 2013 | 20142 | 2015 - 2016 | 2017 - 2023 | TOTAL | |||||||||||||||
50% of cash taxes and transfer pricing penalties payable in the period1 | 37 | 115 - 175 | 410 - 435 | 0 - 25 | 625 - 650 | |||||||||||||||
| 1 | These amounts do not include interest and instalment penalties, which totaled approximately $72 million to June 30, 2014. |
| 2 | These amounts include $106 million already paid in 2014. |
2014 SECOND QUARTER REPORT 13
In light of our view of the likely outcome of the case as described above, we expect to recover the amounts remitted to CRA, including the $215 million already paid to date.
Our appeal of the 2003 reassessment is expected to be heard in the Tax Court of Canada in 2015. If this timing is adhered to, we expect to have a Tax Court decision by 2016.
Caution about forward-looking information relating to our CRA tax dispute
This discussion of our expectations relating to our tax dispute with CRA and future tax reassessments by CRA is forward-looking information that is based upon the assumptions and subject to the material risks discussed under the headingCaution about forward-looking information beginning on page 2 and also on the more specific assumptions and risks listed below. Actual outcomes may vary significantly.
Assumptions
| • | CRA will reassess us for the years 2010 through 2013 using a similar methodology as for the years 2003 through 2009, and the reassessments will be issued on the basis we expect |
| • | we will be able to apply elective deductions and tax loss carryovers to the extent anticipated |
| • | CRA will seek to impose transfer pricing penalties (10% of the income adjustment) in addition to interest charges and instalment penalties |
| • | we will be substantially successful in our dispute with CRA and the cumulative tax provision of $76 million to date will be adequate to satisfy any tax liability resulting from the outcome of the dispute to date |
Material risks that could cause actual results to differ materially
| • | CRA reassesses us for years 2010 through 2013 using a different methodology than for years 2003 through 2009, or we are unable to utilize elective deductions and loss carryovers to the same extent as anticipated, resulting in the required cash payments to CRA pending the outcome of the dispute being higher than expected |
| • | the time lag for the reassessments for each year is different than we currently expect |
| • | we are unsuccessful and the outcome of our dispute with CRA results in significantly higher cash taxes, interest charges and penalties than the amount of our cumulative tax provision, which could have a material adverse effect on our liquidity, financial position, results of operations and cash flows |
| • | cash tax payable increases due to unanticipated adjustments by CRA not related to transfer pricing |
FOREIGN EXCHANGE
At June 30, 2014:
| • | The value of the US dollar relative to the Canadian dollar was $1.00 (US) for $1.07 (Cdn), down from $1.00 (US) for $1.11 (Cdn) at March 31, 2014. The exchange rate averaged $1.00 (US) for $1.09 (Cdn) over the quarter. |
| • | We had foreign currency contracts of $1.5 billion (US) and €76 million at June 30, 2014. The mark-to-market gain on all foreign exchange contracts was $23 million compared to a $57 million loss at March 31, 2014. The average exchange rate for USD currency contracts was $1.00 (US) for $1.09 (Cdn) and €1.00 for $1.37 (US) for EUR currency contracts. |
14 CAMECO CORPORATION
Outlook for 2014
Our strategy is to profitably produce at a pace aligned with market signals, while maintaining the ability to respond to conditions as they evolve.
Our outlook for 2014 reflects the expenditures necessary to help us achieve our strategy. Our outlook for capital expenditures, uranium production, exploration costs, and NUKEM’s sales volumes, revenue and average unit cost of sales has changed as explained below. We do not provide an outlook for the items in the table that are marked with a dash.
SeeFinancial results by segment on page 18 for details.
2014 FINANCIAL OUTLOOK
| CONSOLIDATED | URANIUM | FUEL SERVICES | NUKEM | |||||||||||||
Production | — |
| 22.8 to 23.3 million lbs |
|
| 12 to 13 million kgU |
| — | ||||||||
Sales volume | — |
| 31 to 33 million lbs |
|
| Decrease 5% to 10% |
|
| 7 to 9 million lbs U3O8 |
| ||||||
Revenue compared to 2013 |
| Increase 5% to 10% |
|
| Increase 5% to 10% | 1 |
| Decrease 5% to 10% |
|
| Decrease 15% to 20% |
| ||||
Average unit cost of sales (including D&A) | — |
| Increase 0% to 5% | 2 |
| Increase 0% to 5% |
|
| Decrease 15% to 20% |
| ||||||
Direct administration costs compared to 20133 |
| Increase 0% to 5% |
| — | — |
| Increase 0% to 5% |
| ||||||||
Exploration costs compared to 2013 | — |
| Decrease 25% to 30% |
| — | — | ||||||||||
Tax rate |
| Recovery of 30% to 35% |
| — | — |
| Expense of 30% to 35% |
| ||||||||
Capital expenditures | $ | 550 million | — | — | — | |||||||||||
| 1 | Based on a uranium spot price of $28.50 (US) per pound (the Ux spot price as of July 28, 2014), a long-term price indicator of $44.00 (US) per pound (the Ux long-term indicator on July 28, 2014) and an exchange rate of $1.00 (US) for $1.08 (Cdn). |
| 2 | This increase is based on the unit cost of sale for produced material and committed long-term purchases. If we make discretionary purchases in 2014, then we expect the overall unit cost of sales could be different. |
| 3 | Direct administration costs do not include stock-based compensation expenses. See page 11 for more information. |
We now expect production in our uranium segment to be 22.8 million to 23.3 million pounds (previously 23.8 million to 24.3 million pounds) due to a shift in the production schedule at Cigar Lake, to allow localized areas of the deposit to freeze more thoroughly. See page 23 for more information.
In the NUKEM segment, we have amended our outlook for sales volumes, revenues and the average unit cost of sales due to the ongoing weakness in the uranium market. We now expect our uranium sales volumes to be in the range of 7 million to 9 million pounds (previously 9 million to 11 million pounds) and have reduced our revenue expectations accordingly. In addition, the decline in the uranium spot price is expected to have a positive impact on our unit cost of sales and we now expect a decline of 15% to 20% (previously an increase of 0% to 5%). The decline in unit cost is expected to offset the impact of the lower sales.
Exploration costs are now expected to be 25% to 30% lower than 2013 (previously 35% to 40% lower), due to increased exploration and evaluation costs at Inkai, as well as the effect of the weakening of the Canadian dollar.
Capital expenditures are now expected to be $550 million (previously $495 million) due to increased project costs at Key Lake and the shift in the production schedule at Cigar Lake noted above. With the shift in the production schedule, we now expect the commencement of commercial production will be delayed. As a result, the capital cost at Cigar Lake will increase due to the longer period over which all of the operating expenditures are capitalized rather than expensed or charged to inventory.
In our uranium and fuel services segments, our customers choose when in the year to receive deliveries, so our quarterly delivery patterns, sales volumes and revenue can vary significantly. However, the majority of delivery notices have been received for 2014, reducing the variability of our delivery pattern for the remainder of the year. We expect our uranium deliveries for the third quarter will be similar to the second quarter. Fourth quarter deliveries are expected to be slightly higher.
2014 SECOND QUARTER REPORT 15
SENSITIVITY ANALYSIS
For the rest of 2014:
| • | a change of $5 (US) per pound in both the Ux spot price ($28.50 (US) per pound on July 28, 2014) and the Ux long-term price indicator ($44.00 (US) per pound on July 28, 2014) would change revenue by $43 million and net earnings by $22 million |
| • | a one-cent change in the value of the Canadian dollar versus the US dollar would effectively change revenue by $4 million and adjusted net earnings by $1 million, with a decrease in the value of the Canadian dollar versus the US dollar having a positive impact. This sensitivity is based on an exchange rate of $1.00 (US) for $1.00 (Cdn). |
Liquidity and capital resources
Our financial objective is to make sure we have the cash and debt capacity to fund our operating activities, investments and growth. We expect our existing cash balances and operating cash flows will meet our anticipated 2014 capital requirements without the need for significant additional funding.
We have large, creditworthy customers that continue to need uranium even during weak economic conditions, and we expect the uranium contract portfolio we have built to provide a solid revenue stream for years to come.
We expect to continue investing in maintaining and prudently expanding our production capacity over the next several years. We have a number of alternatives to fund future capital requirements, including using our current cash balances, drawing on our existing credit facilities, entering new credit facilities, using our operating cash flow, and raising additional capital through debt or equity financings. We are always considering our financing options so we can take advantage of favourable market conditions when they arise.
We have an ongoing dispute with CRA regarding our offshore marketing company structure and related transfer pricing arrangements. See page 12 for more information. Until this dispute is settled, we expect to make cash payments to CRA for 50% of the cash taxes payable and the related interest and penalties. We have provided an estimate of the amount and timing of the expected cash taxes and transfer pricing penalties payable in the table on page 13.
CASH FROM CONTINUING OPERATIONS
Cash from continuing operations was $8 million higher this quarter than in 2013, due largely to higher uranium deliveries and a decrease in working capital requirements, partially offset by an increase in income taxes paid. Working capital required $61 million less than in 2013. Not including working capital requirements, our operating cash flows this quarter were lower by $53 million.
Cash from continuing operations was $225 million lower in the first six months of 2014 than for the same period in 2013, due largely to an increase in income taxes paid and an increase in working capital requirements. Working capital required $117 million more in 2014, largely as a result of a decrease in accounts payable during the period. Not including working capital requirements, our operating cash flows in the first six months were lower by $109 million.
DEBT
We use debt to provide additional liquidity. We have sufficient borrowing capacity with unsecured lines of credit totaling about $2.3 billion at June 30, 2014, up $0.1 billion from March 31, 2014. At June 30, 2014, we had approximately $910 million outstanding in letters of credit.
In the second quarter, we issued $500 million in Series G debentures bearing interest at 4.19% per year, maturing on June 24, 2024. On July 16, 2014, we redeemed Series C debentures in aggregate principal amount of $300 million.
In total, considering the early redemption of the Series C debentures, we have $1.5 billion in senior unsecured debentures outstanding:
| • | $500 million bearing interest at 5.67% per year, maturing on September 2, 2019 |
| • | $400 million bearing interest at 3.75% per year, maturing on November 14, 2022 |
| • | $500 million bearing interest at 4.19% per year, maturing on June 24, 2024 |
| • | $100 million bearing interest at 5.09% per year, maturing on November 14, 2042 |
16 CAMECO CORPORATION
DEBT COVENANTS
We are bound by certain covenants in our unsecured revolving credit facility. The financially related covenants place restrictions on total debt, including guarantees. As at June 30, 2014, we met these financial covenants and do not expect our operating and investment activities for the remainder of 2014 to be constrained by them.
LONG-TERM CONTRACTUAL OBLIGATIONS AND OFF-BALANCE SHEET ARRANGEMENTS
We had two kinds of off-balance sheet arrangements at June 30, 2014:
| • | purchase commitments |
| • | financial assurances |
There have been no material changes to our long-term contractual obligations since December 31, 2013, or to our purchase commitments since March 31, 2014. Our long-term contractual obligations do not include our sales commitments. Please see our first quarter MD&A for more information.
FINANCIAL ASSURANCES
At June 30, 2014 our financial assurances totaled $910 million compared to $808 million at March 31, 2014. The increase is mainly due to increased requirements for decommissioning letters of credit for Rabbit Lake and McArthur River.
BALANCE SHEET
($ MILLIONS) | JUN 30, 2014 | DEC 31, 2013 | CHANGE | |||||||||
Cash, short-term investments and bank overdraft | 744 | 188 | 296 | % | ||||||||
Total debt | 1,800 | 1,344 | 34 | % | ||||||||
Inventory | 999 | 913 | 9 | % | ||||||||
Total cash and short-term investments at June 30, 2014 were $744 million, or 296% higher than at December 31, 2013 due to completion of the sale of BPLP in March, and the issuance of the Series G debentures in June. Net debt at June 30, 2014 was $1,056 million.
Total debt increased by $456 million to $1,800 million at June 30, 2014. Of this total, $310 million was classified as current, an increase of $260 million compared to December 31, 2013 due to the early redemption of our Series C debentures. See note 8 of our interim financial statements for more detail.
Total product inventories increased to $999 million, including NUKEM’s inventories ($257 million). The increase was largely due to an increase in NUKEM’s inventory and was partially offset by a decrease in inventories in our uranium segment. Inventories in our uranium segment decreased as sales were higher than production and purchases in the first six months of the year.
Fuel services inventories increased as sales were lower than production and purchases.
2014 SECOND QUARTER REPORT 17
Financial results by segment
Uranium
HIGHLIGHTS | THREE MONTHS ENDED JUNE 30 | CHANGE | SIX MONTHS ENDED JUNE 30 | CHANGE | ||||||||||||||||||||
| 2014 | 2013 | 2014 | 2013 | |||||||||||||||||||||
Production volume (million lbs) | 4.0 | 4.4 | (9 | )% | 9.7 | 10.3 | (6 | )% | ||||||||||||||||
Sales volume (million lbs) | 7.4 | 6.4 | 16 | % | 14.3 | 11.6 | 23 | % | ||||||||||||||||
Average spot price ($US/lb) | 28.97 | 40.18 | (28 | )% | 31.95 | 41.45 | (23 | )% | ||||||||||||||||
Average long-term price ($US/lb) | 44.83 | 57.00 | (21 | )% | 46.75 | 56.75 | (18 | )% | ||||||||||||||||
Average realized price | ||||||||||||||||||||||||
($US/lb) | 45.93 | 46.30 | (1 | )% | 46.26 | 47.24 | (2 | )% | ||||||||||||||||
($Cdn/lb) | 50.76 | 47.35 | 7 | % | 50.67 | 47.75 | 6 | % | ||||||||||||||||
Average unit cost of sales ($Cdn/lb) (including D&A) | 35.86 | 33.25 | 8 | % | 34.63 | 32.65 | 6 | % | ||||||||||||||||
Revenue ($ millions) | 376 | 305 | 23 | % | 724 | 552 | 31 | % | ||||||||||||||||
Gross profit ($ millions) | 110 | 91 | 21 | % | 229 | 174 | 32 | % | ||||||||||||||||
Gross profit (%) | 29 | 30 | (3 | )% | 32 | 32 | — | |||||||||||||||||
SECOND QUARTER
Production volumes this quarter were 9% lower compared to the second quarter of 2013 due to an extension of the planned annual maintenance shutdown at Key Lake in the second quarter of 2014, and lower production at Crow Butte and Inkai. SeeUranium Q2 updates starting on page 23 for more information.
Uranium revenues were up 23% due to a 16% increase in sales volumes and a 7% increase in the Canadian dollar average realized price. Sales in the second quarter were higher than in 2013 due to a change in the timing of deliveries, which can vary significantly and are driven by customer requests.
Our realized prices this quarter were higher than the second quarter of 2013, primarily as a result of the weakening of the Canadian dollar compared to 2013. In the second quarter of 2014, the exchange rate on the average realized price was $1.00 (US) for $1.11 (Cdn) over the quarter, compared to $1.00 (US) for $1.02 (Cdn) in the second quarter of 2013.
Total cost of sales (including D&A) increased by 24% ($266 million compared to $214 million in 2013). This was mainly the result of a 16% increase in sales volumes and an increase in the cost of purchased and produced material.
In the second quarter, our cost of purchased material was higher than the average spot price for the quarter. When uranium prices were higher than they are today, we entered back-to-back purchase and sale arrangements that, while profitable, required we purchase material at a price higher than the current spot price.
Previously, our most significant long-term purchase contract was the Russian HEU commercial agreement, which ended in 2013. With that source of supply no longer available, and until Cigar Lake ramps up to full production, to meet our delivery commitments, we will make use of our inventories and we may purchase material where it is beneficial to do so. We expect our purchases will result in profitable sales; however, the cost of purchased material may be higher or lower than our other sources of supply, depending on market conditions.
The net effect was a $19 million increase in gross profit for the quarter.
The table on the following page shows the costs of produced and purchased uranium incurred in the reporting periods (which are non-IFRS measures, see the paragraphs below the table). These costs do not include selling costs such as royalties, transportation and commissions, nor do they reflect the impact of opening inventories on our reported cost of sales.
18 CAMECO CORPORATION
FIRST SIX MONTHS
Production volumes for the first six months of the year were 6% lower than in the previous year due to lower production from McArthur/Key Lake, Rabbit Lake, Crow Butte and Inkai. SeeUranium Q2 updates starting on page 23 for more information.
For the first six months of 2014, uranium revenues increased 31% compared to 2013, due to a 23% increase in sales volumes, and a 6% increase in the Canadian dollar average realized price. Sales in the first six months were higher than in 2013 due to a change in the timing of deliveries, which can vary significantly and are driven by customer requests.
Our realized prices for the first six months of 2014 were higher than 2013, primarily as a result of the weakening of the Canadian dollar compared to 2013. For the first six months of 2014, the exchange rate on the average realized price was $1.00 (US) for $1.10 (Cdn), compared to $1.00 (US) for $1.01 (Cdn) for the same period in 2013.
Total cost of sales (including D&A) increased by 31% ($495 million compared to $377 million in 2013) mainly due to a 23% increase in sales volumes and an increase in non-cash costs. For the first six months of 2014, total non-cash costs were $109 million compared to $66 million for the same period in 2013, due to the completion of several capital projects at our production facilities. As discussed in our annual MD&A, upon project completion, we begin to depreciate the asset, which increases the non-cash portion of our production costs.
The net effect was a $55 million increase in gross profit for the first six months.
The table below shows the costs of produced and purchased uranium incurred in the reporting periods (which are non-IFRS measures, see the paragraphs below the table). These costs do not include selling costs such as royalties, transportation and commissions, nor do they reflect the impact of opening inventories on our reported cost of sales.
($CDN/LB) | THREE MONTHS ENDED JUNE 30 | CHANGE | SIX MONTHS ENDED JUNE 30 | CHANGE | ||||||||||||||||||||
| 2014 | 2013 | 2014 | 2013 | |||||||||||||||||||||
Produced | ||||||||||||||||||||||||
Cash cost | 26.24 | 23.00 | 14 | % | 23.03 | 20.78 | 11 | % | ||||||||||||||||
Non-cash cost | 14.72 | 9.34 | 58 | % | 12.25 | 8.83 | 39 | % | ||||||||||||||||
|
|
|
|
|
|
|
|
|
|
|
| |||||||||||||
Total production cost | 40.96 | 32.34 | 27 | % | 35.28 | 29.61 | 19 | % | ||||||||||||||||
|
|
|
|
|
|
|
|
|
|
|
| |||||||||||||
Quantity produced (million lbs) | 4.0 | 4.4 | (9 | )% | 9.7 | 10.3 | (6 | )% | ||||||||||||||||
Purchased | ||||||||||||||||||||||||
Cash cost | 58.15 | 24.05 | 142 | % | 44.76 | 28.45 | 57 | % | ||||||||||||||||
Quantity purchased (million lbs) | 0.3 | 2.6 | (88 | )% | 1.6 | 4.9 | (67 | )% | ||||||||||||||||
Totals | ||||||||||||||||||||||||
Produced and purchased costs | 42.16 | 29.26 | 44 | % | 36.62 | 29.24 | 25 | % | ||||||||||||||||
Quantities produced and purchased (million lbs) | 4.3 | 7.0 | (39 | )% | 11.3 | 15.2 | (26 | )% | ||||||||||||||||
Cash cost per pound, non-cash cost per pound and total cost per pound for produced and purchased uranium presented in the above table are non-IFRS measures. These measures do not have a standardized meaning or a consistent basis of calculation under IFRS. We use these measures in our assessment of the performance of our uranium business. We believe that, in addition to conventional measures prepared in accordance with IFRS, certain investors use this information to evaluate our performance and ability to generate cash flow.
These measures are non-standard supplemental information and should not be considered in isolation or as a substitute for measures of performance prepared according to accounting standards. These measures are not necessarily indicative of operating profit or cash flow from operations as determined under IFRS. Other companies may calculate these measures differently, so you may not be able to make a direct comparison to similar measures presented by other companies.
2014 SECOND QUARTER REPORT 19
To facilitate a better understanding of these measures, the following table presents a reconciliation of these measures to our unit cost of sales for the second quarters and the first six months of 2014 and 2013.
CASH AND TOTAL COST PER POUND RECONCILIATION
($ MILLIONS) | THREE MONTHS ENDED JUNE 30 | SIX MONTHS ENDED JUNE 30 | ||||||||||||||
| 2014 | 2013 | 2014 | 2013 | |||||||||||||
Cost of product sold | 204.6 | 167.2 | 385.6 | 311.2 | ||||||||||||
Add / (subtract) | ||||||||||||||||
Royalties | (21.0 | ) | (17.6 | ) | (35.2 | ) | (32.1 | ) | ||||||||
Standby charges | (9.7 | ) | (9.1 | ) | (19.0 | ) | (17.2 | ) | ||||||||
Other selling costs | (3.2 | ) | 0.8 | (5.5 | ) | 3.6 | ||||||||||
Change in inventories | (48.3 | ) | 22.4 | (30.9 | ) | 87.9 | ||||||||||
Cash operating costs (a) | 122.4 | 163.7 | 295.0 | 353.4 | ||||||||||||
Add / (subtract) | ||||||||||||||||
Depreciation and amortization | 60.9 | 46.7 | 109.2 | 66.1 | ||||||||||||
Change in inventories | (2.0 | ) | (5.6 | ) | 9.6 | 24.9 | ||||||||||
|
|
|
|
|
|
|
| |||||||||
Total operating costs (b) | 181.3 | 204.8 | 413.8 | 444.4 | ||||||||||||
|
|
|
|
|
|
|
| |||||||||
Uranium produced & purchased (millions lbs)(c) | 4.3 | 7.0 | 11.3 | 15.2 | ||||||||||||
Cash costs per pound (a ÷ c) | 28.47 | 23.39 | 26.11 | 23.25 | ||||||||||||
Total costs per pound (b ÷ c) | 42.16 | 29.26 | 36.62 | 29.24 | ||||||||||||
PRICE SENSITIVITY ANALYSIS: URANIUM
The table below and graph on the following page are not forecasts of prices we expect to receive. The prices we actually realize will be different from the prices shown in the table and graph. They are designed to indicate how the portfolio of long-term contracts we had in place on June 30, 2014 would respond to different spot prices. In other words, we would realize these prices only if the contract portfolio remained the same as it was on June 30, 2014, and none of the assumptions we list below change.
We intend to update this table and graph each quarter in our MD&A to reflect deliveries made and changes to our contract portfolio each quarter. As a result, we expect the table and graph to change from quarter to quarter.
EXPECTED REALIZED URANIUM PRICE SENSITIVITY UNDER VARIOUS SPOT PRICE ASSUMPTIONS
(rounded to the nearest $1.00)
SPOT PRICES ($US/LB U3O8) | $20 | $40 | $60 | $80 | $100 | $120 | $140 | |||||||||||||||||||||
2014 | 46 | 47 | 52 | 56 | 61 | 66 | 70 | |||||||||||||||||||||
2015 | 41 | 46 | 55 | 65 | 74 | 84 | 91 | |||||||||||||||||||||
2016 | 42 | 47 | 57 | 68 | 78 | 88 | 96 | |||||||||||||||||||||
2017 | 41 | 47 | 57 | 67 | 77 | 86 | 94 | |||||||||||||||||||||
2018 | 42 | 48 | 58 | 68 | 78 | 87 | 94 | |||||||||||||||||||||
20 CAMECO CORPORATION
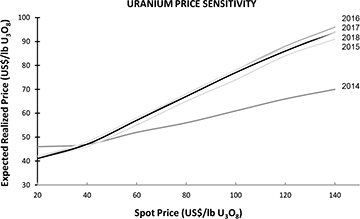
The table and graph illustrate the mix of long-term contracts in our June 30, 2014 portfolio, and are consistent with our marketing strategy. Both have been updated to reflect deliveries made and contracts entered into up to June 30, 2014.
Our portfolio includes a mix of fixed-price and market-related contracts, which we target at a 40:60 ratio. Those that are fixed at lower prices or have low ceiling prices will yield prices that are lower than current market prices.
Our portfolio is affected by more than just the spot price. We made the following assumptions (which are not forecasts) to create the table:
Sales
| • | sales volumes on average of 30 million pounds per year, with commitment levels through 2016 higher than in 2017 and 2018 |
Deliveries
| • | deliveries include best estimates of requirements contracts and contracts with volume flex provisions |
| • | we defer a portion of deliveries under existing contracts for 2014 |
Annual inflation
| • | is 1.5% in Canada and 2% in the US |
Prices
| • | the average long-term price indicator is the same as the average spot price for the entire year (a simplified approach for this purpose only). Since 1996, the long-term price indicator has averaged 18% higher than the spot price. This differential has varied significantly. Assuming the long-term price is at a premium to spot, the prices in the table and graph will be higher. |
Fuel services
(includes results for UF6, UO2and fuel fabrication)
HIGHLIGHTS | THREE MONTHS ENDED JUNE 30 | CHANGE | SIX MONTHS ENDED JUNE 30 | CHANGE | ||||||||||||||||||||
| 2014 | 2013 | 2014 | 2013 | |||||||||||||||||||||
Production volume (million kgU) | 3.8 | 4.8 | (21 | )% | 7.8 | 9.6 | (19 | )% | ||||||||||||||||
Sales volume (million kgU) | 3.3 | 4.0 | (18 | )% | 5.1 | 7.3 | (30 | )% | ||||||||||||||||
Average realized price ($Cdn/kgU) | 21.28 | 16.45 | 29 | % | 21.68 | 17.89 | 21 | % | ||||||||||||||||
Average unit cost of sales ($Cdn/kgU) (including D&A) | 16.46 | 13.98 | 18 | % | 18.19 | 15.03 | 21 | % | ||||||||||||||||
Revenue ($ millions) | 70 | 65 | 8 | % | 110 | 131 | (16 | )% | ||||||||||||||||
Gross profit ($ millions) | 16 | 10 | 60 | % | 18 | 21 | (14 | )% | ||||||||||||||||
Gross profit (%) | 23 | 15 | 53 | % | 16 | 16 | — | |||||||||||||||||
SECOND QUARTER
Total revenue increased by 8% due to a 29% increase in realized price, offset by an 18% decrease in sales volume. Realized prices were higher primarily due to the mix of fuel services products sold compared to 2013.
2014 SECOND QUARTER REPORT 21
The total cost of products and services sold (including D&A) decreased by 2% ($54 million compared to $55 million in the second quarter of 2013) due to the decrease in sales volumes, offset by an increase in the average unit cost of sales. When compared to 2013, the average unit cost of sales was 18% higher due to the mix of fuel services products sold.
The net effect was a $6 million increase in gross profit.
FIRST SIX MONTHS
In the first six months of the year, total revenue decreased by 16% due to a 30% decrease in sales volumes, offset by a 21% increase in realized price.
The total cost of sales (including D&A) decreased 15% ($93 million compared to $110 million in 2013) due to a 30% decrease in sales volume offset by a 21% increase in the average unit cost of sales. The increase in the average unit cost of sales was due to the mix of fuel services products sold.
The net effect was a $3 million decrease in gross profit.
NUKEM
($ MILLIONS EXCEPT WHERE INDICATED) | THREE MONTHS ENDED JUNE 30 | CHANGE | SIX MONTHS ENDED JUNE 30 | CHANGE | ||||||||||||||||||||
| 2014 | 2013 | 2014 | 2013 | |||||||||||||||||||||
Uranium sales (million lbs) | 1.5 | 1.2 | 25 | % | 2.2 | 3.5 | (37 | )% | ||||||||||||||||
Revenue | 62 | 53 | 17 | % | 94 | 183 | (49 | )% | ||||||||||||||||
Cost of product sold (including D&A) | 49 | 50 | (2 | )% | 84 | 175 | (52 | )% | ||||||||||||||||
Gross profit | 13 | 3 | 333 | % | 10 | 8 | 25 | % | ||||||||||||||||
Net earnings | 7 | 3 | 133 | % | — | — | — | |||||||||||||||||
Adjustments on derivatives1 | — | (5 | ) | — | 1 | (3 | ) | 133 | % | |||||||||||||||
Adjusted net earnings (loss)1 | 7 | (2 | ) | 450 | % | 1 | (3 | ) | 133 | % | ||||||||||||||
| 1 | Adjustments relate to unrealized gains and losses on foreign currency forward sales contracts (non-IFRS measure, see page 9). |
SECOND QUARTER
During the three months ended June 30, 2014, NUKEM delivered 1.5 million pounds of uranium, an increase of 0.3 million pounds due to timing of customer requirements. NUKEM revenues amounted to $62 million compared to $53 million in 2013 due to the increase in deliveries. The realized price for uranium was lower than the second quarter of 2013 due to a decline in the spot price.
Gross profit amounted to $13 million, an increase of $10 million compared to the second quarter of 2013 due primarily to a lower per unit cost of product sold. The unit cost of uranium sold was lower due to the decline in the spot price. On a percentage basis, gross profits were 21% in 2014 compared to 6% in the prior year.
Adjusted net earnings for the second quarter of 2014 were $7 million, an increase of $9 million compared to a loss of $2 million in 2013.
FIRST SIX MONTHS
During the six months ended June 30, 2014, NUKEM delivered 2.2 million pounds of uranium, a decrease of 1.3 million pounds due to timing of customer requirements and generally lower activity in the market. NUKEM revenues amounted to $94 million due to the decline in deliveries and a lower realized price attributable to the decline in spot price relative to the prior year.
Gross profit amounted to $10 million, an increase of $2 million compared to the first half of 2013. While sales were significantly lower in the current year, they were at higher margins. On a percentage basis, gross profits were 11% in 2014 compared to 4% in the prior year.
Adjusted net earnings for the first six months of 2014 amounted to $1 million, compared to a loss of $3 million in 2013.
22 CAMECO CORPORATION
Our operations
Uranium – production overview
Production in our uranium segment this quarter was 0.4 million pounds lower than the second quarter of 2013. Production in the first half of the year was 0.6 million pounds lower than the same period in 2013. See below for more information.
URANIUM PRODUCTION
CAMECO’S SHARE (MILLION LBS) | THREE MONTHS ENDED JUNE 30 | CHANGE | SIX MONTHS ENDED JUNE 30 | CHANGE | 2014 PLAN | |||||||||||||||||||||||
| 2014 | 2013 | 2014 | 2013 | |||||||||||||||||||||||||
McArthur River/Key Lake | 2.1 | 2.7 | (22 | )% | 5.9 | 6.3 | (6 | )% | 13.1 | |||||||||||||||||||
Rabbit Lake | 0.6 | 0.4 | 50 | % | 1.1 | 1.5 | (27 | )% | 4.1 | |||||||||||||||||||
Smith Ranch-Highland | 0.5 | 0.3 | 67 | % | 1.0 | 0.6 | 67 | % | 2.0 | |||||||||||||||||||
Crow Butte | 0.1 | 0.2 | (50 | )% | 0.3 | 0.4 | (25 | )% | 0.6 | |||||||||||||||||||
Inkai | 0.7 | 0.8 | (13 | )% | 1.4 | 1.5 | (7 | )% | 3.0 | |||||||||||||||||||
Cigar Lake | — | — | — | — | — | — | 0 - 0.5 | |||||||||||||||||||||
|
|
|
|
|
|
|
|
|
|
|
|
|
| |||||||||||||||
Total | 4.0 | 4.4 | (9 | )% | 9.7 | 10.3 | (6 | )% | 22.8 - 23.3 | |||||||||||||||||||
|
|
|
|
|
|
|
|
|
|
|
|
|
| |||||||||||||||
Uranium Q2 updates
Operating properties
McArthur River/Key Lake
Production update
Production for the quarter was 22% lower compared to the same period last year, due to an extension of the planned annual maintenance shutdown in the second quarter of 2014. Production for the first six months was 6% lower compared to 2013.
Operations update
Commissioning of the zone 4 north freezewall is underway, and production from the area is expected to begin this year.
Licensing and production capacity update
On July 16, 2014, the CNSC approved the Key Lake extension EA for increasing our tailings capacity, and increasing Key Lake’s nominal annual production rate to 25 million pounds per year. With the approved EA and once the Key Lake extension project is complete, mill production can be increased to closely follow production from the McArthur River mine, which is licensed to produce 21 million pounds per year.
Labour relations
The current collective agreements with unionized employees at McArthur River and Key Lake expired on December 31, 2013. Bargaining began in November, 2013 and the parties are at the conciliation stage, with the next set of meetings scheduled for late August. Neither party will be in a legal strike/lockout position until August 30, 2014. Operations continue as usual at both sites. There is risk to production if we are unable to reach an agreement and a work stoppage occurs.
Cigar Lake
Production update
In the first quarter, we announced the start of mine production at Cigar Lake and reported that 350 tonnes of ore slurry had been shipped from the mine to storage tanks at the McClean Lake mill. We have now delivered about 1,000 tonnes of ore from the mine to the mill for storage.
2014 SECOND QUARTER REPORT 23
Operations update
As reported on July 16, 2014, as part of the ongoing commissioning process, we have been assessing the current state of ground freezing and determined that freezing has not advanced as quickly as expected in some localized areas of the mine. Given that the McClean Lake mill has not yet started processing Cigar Lake ore, we have temporarily stopped jet-boring to allow the ore body to freeze more thoroughly in those localized areas. The additional freezing will allow more continuous production at the mine once the mill is operational. We do not expect there will be any material impact to costs as a result.
As a consequence of the interruption to the mining sequence and the resulting ore delivery schedule to the mill, we now expect to produce up to 1 million packaged pounds (100% basis) in 2014, depending on the mill startup and rampup, as well as the continued success of mining operations at Cigar Lake once they resume.
AREVA has reported that the modifications to the McClean Lake mill are complete and commissioning is in progress.
Our long-term annual production target of 18 million pounds U3O8 at Cigar Lake by 2018 will not be impacted.
Caution about forward-looking information relating to Cigar Lake
This discussion of our expectations for Cigar Lake, including our plan for up to 1 million packaged pounds (100%) in 2014, and our target annual production of 18 million pounds U3O8 at Cigar Lake by 2018 is forward-looking information that is based upon the assumptions and subject to the material risks discussed under the headingCaution about forward-looking information beginning on page 2.
Rabbit Lake
Production update
Production was 50% higher in the second quarter and 27% lower in the first six months, compared to the same periods last year. Lower ore grades from the mine and the scheduled timing of planned production stopes had an impact on production in the first half of 2014. The timing of the planned summer maintenance shutdown has been modified and we remain on track to achieve our annual production target.
Smith Ranch-Highland and Crow Butte
Production update
Production was 20% higher for the quarter and 30% higher for the first six months as compared to 2013, due to the addition of the North Butte satellite operation.
Operations update
On June 16, Uranerz Energy Corporation sent its first shipment of uranium-loaded resin from the Nichols Ranch in-situ recovery uranium project to our Smith Ranch uranium processing facilities. The resin is being processed into uranium concentrates, pursuant to a toll processing agreement established in 2011.
Inkai
Production update
Production was 13% lower in the second quarter and 7% lower in the first six months of 2014, compared to the same periods last year, due to abnormally heavy snowfall and rapid spring melt.
It has taken longer than anticipated to bring new wellfields into production following the wet spring season. The delay in recovering the current quarterly production shortfall is not expected to impact our annual production target of 3.0 million pounds of U3O8 (our share).
Projects under evaluation
Millennium
Licensing update
During the second quarter, we temporarily suspended final environment assessment approval and licensing activities at Millennium, as we wait for clarity in both the market and on regulatory issues related to the project.
24 CAMECO CORPORATION
Fuel services Q2 updates
Port Hope conversion services
Cameco Fuel Manufacturing Inc.
Springfields Fuels Ltd. (SFL)
Production update
Fuel services produced 3.8 million kgU in the second quarter, 21% lower than the same period last year. Production for the first half of the year was 7.8 million kgU, 19% lower compared to last year. We decreased our production target in 2014 to between 12 million and 13 million kgU, so quarterly production is anticipated to be lower than comparable periods in 2013.
Qualified persons
The technical and scientific information discussed in this MD&A for our material properties (McArthur River/Key Lake, Inkai and Cigar Lake) was approved by the following individuals who are qualified persons for the purposes of NI 43-101:
McArthur River/Key Lake
| • | David Bronkhorst, vice-president, mining and technology, Cameco |
Cigar Lake
| • | Scott Bishop, manager, technical services, Cameco |
Inkai
| • | Ken Gullen, technical director, international Cameco |
Additional information
Critical accounting estimates
Due to the nature of our business, we are required to make estimates that affect the amount of assets and liabilities, revenues and expenses, commitments and contingencies we report. We base our estimates on our experience, our best judgment, guidelines established by the Canadian Institute of Mining, Metallurgy and Petroleum and on assumptions we believe are reasonable.
Controls and procedures
As of June 30, 2014, we carried out an evaluation under the supervision and with the participation of our management, including our chief executive officer (CEO) and chief financial officer (CFO), of the effectiveness of our disclosure controls and procedures. There are inherent limitations to the effectiveness of any system of disclosure controls and procedures, including the possibility of human error and the circumvention or overriding of the controls and procedures. Accordingly, even effective disclosure controls and procedures can only provide reasonable assurance of achieving their control objectives.
Based upon that evaluation and as of June 30, 2014, the CEO and CFO concluded that:
| • | the disclosure controls and procedures were effective to provide reasonable assurance that information required to be disclosed in the reports we file and submit under applicable securities laws is recorded, processed, summarized and reported as and when required |
| • | such information is accumulated and communicated to our management, including our CEO and CFO, as appropriate to allow timely decisions regarding required disclosure |
There has been no change in our internal control over financial reporting during the quarter ended June 30, 2014 that has materially affected, or is reasonably likely to materially affect, our internal control over financial reporting.
2014 SECOND QUARTER REPORT 25
New standards and interpretations
We were required to apply the following new standards and amendments to existing standards for our accounting periods beginning on or after January 1, 2014. These standards did not have a material impact on the financial statements.
| • | IAS 32, Financial Instruments: Presentation |
| • | IFRIC 21, Levies |
| • | IAS 36, Impairment of Assets |
Refer to our 2013 Annual MD&A for a description of each of the above accounting standards and amendments to existing standards.
The following new standards and amendments are not yet effective for the year ended December 31, 2014, and have not been applied in preparing these consolidated financial statements.
IFRS 9,Financial Instruments(IFRS 9)—In July, 2014, the International Accounting Standards Board (IASB) issued IFRS 9, IFRS 9 replaces the current multiple classification and measurement models for financial assets and liabilities with a single model that has only two classification categories: amortized cost and fair value. The basis of classification depends on the entity’s business model and the contractual cash flow characteristics of the financial asset or liability. It also introduces additional changes relating to financial liabilities and aligns hedge accounting more closely with risk management.
IFRS 9 is effective for annual periods beginning on or after January 1, 2018, with early adoption of the new standard permitted. We do not intend to early adopt IFRS 9. The extent of the impact of adoption of IFRS 9 has not yet been determined.
IFRS 15,Revenue from Contracts with Customers(IFRS 15)—In May 2014, the IASB issued IFRS 15. IFRS 15 is effective for periods beginning on or after January 1, 2017 and is to be applied retrospectively. IFRS 15 clarifies the principles for recognizing revenue from contracts with customers. We intend to adopt IFRS 15 in our financial statements for the annual period beginning January 1, 2017. The extent of the impact of adoption of IFRS 15 has not yet been determined.
IAS16,Property, Plant and Equipment (IAS 16) and IAS 38,Intangible Assets (IAS 38)—In May 2014, the IASB issued amendments to IAS16Property, plant and equipment (IAS 16) and IAS 38Intangible assets (IAS 38). The amendments are effective for annual periods beginning on or after January 1, 2016 and are to be applied prospectively. The amendments clarify the factors to be considered in assessing the technical or commercial obsolescence and the resulting depreciation period of an asset and state that a depreciation method based on revenue, is not appropriate. We intend to adopt the amendments to IAS 16 and IAS 38 in our financial statements for the annual period beginning January 1, 2016.
IFRS 11,Joint Arrangements(IFRS 11)—In May 2014, the IASB issued amendments to IFRS 11Joint Arrangements (IFRS 11). The amendments in IFRS 11 are effective for annual periods beginning on or after January 1, 2016 and are to be applied prospectively. The amendments clarify the accounting for the acquisition of interests in joint operations and require the acquirer to apply the principles of business combinations accounting in IFRS 3Business Combinations. We intend to adopt the amendments to IFRS 11 in our financial statements for the annual period beginning January 1, 2016.
26 CAMECO CORPORATION