EXHIBIT 99.1
Cameco Corporation
2015 Annual Information Form
March 29, 2016

Cameco Corporation
2015 Annual information form
March 29, 2016
Contents
Important information about this document | 1 | |||
About Cameco | 4 | |||
Operations and projects | 15 | |||
Uranium – operating properties | 16 | |||
Uranium – projects under evaluation | 64 | |||
Fuel services – refining | 68 | |||
Fuel services – conversion and fuel manufacturing | 69 | |||
NUKEM GmbH | 71 | |||
Mineral reserves and resources | 72 | |||
Sustainable development | 80 | |||
The regulatory environment | 89 | |||
Risks that can affect our business | 98 | |||
Legal proceedings | 117 | |||
Investor information | 118 | |||
Governance | 124 | |||
Appendix A | 129 | |||
- i -
Important information about this document
This annual information form (AIF) for the year ended December 31, 2015 provides important information about Cameco Corporation. It describes our history, our markets, our operations and projects, our mineral reserves and resources, sustainability, our regulatory environment, the risks we face in our business and the market for our shares, among other things.
It also incorporates by reference:
• our management’s discussion and analysis (MD&A) for the year ended December 31, 2015 (2015 MD&A), which is available on SEDAR (sedar.com) and on EDGAR (sec.gov) as an exhibit to our Form 40-F
• our audited consolidated financial statements for the year ended December 31, 2015 (2015 financial statements), which is also available on SEDAR and on EDGAR as an exhibit to our Form 40-F. | Throughout this document, the termswe,us, our, the company and Cameco mean Cameco Corporation and its subsidiaries. |
We have prepared this document to meet the requirements of Canadian securities laws, which are different from what US securities laws require.
Reporting currency and financial information
Unless we have specified otherwise, all dollar amounts are in Canadian dollars. Any references to $(US) mean United States (US) dollars.
The financial information in this AIF has been presented in accordance with International Financial Reporting Standards (IFRS).
Caution about forward-looking information
Our AIF and the documents incorporated by reference include statements and information about our expectations for the future. When we discuss our strategy, plans and future financial and operating performance, or other things that have not yet taken place, we are making statements considered to be forward-looking information or forward-looking statements under Canadian and US securities laws. We refer to them in this AIF as forward-looking information.
Key things to understand about the forward-looking information in this AIF:
| • | It typically includes words and phrases about the future, such asbelieve,estimate,anticipate,expect,plan,intend,predict,goal,target, forecast, project, scheduled, potential,strategyandproposed (see examples on page 2). |
| • | It is based on a number of material assumptions, including those we have listed below, which may prove to be incorrect. |
| • | Actual results and events may be significantly different from what we currently expect, because of the risks associated with our business. We list a number of these material risks below. We recommend you also review other parts of this document, includingRisks that can affect our business starting on page 98, and our 2015 MD&A, which include a discussion of other material risks that could cause our actual results to differ from current expectations. |
Forward-looking information is designed to help you understand management’s current views of our near and longer term prospects. It may not be appropriate for other purposes. We will not necessarily update this forward-looking information unless we are required to by securities laws.
| 2015 ANNUAL INFORMATION FORM Page 1 | ||
Examples of forward-looking information in this AIF
| • | our expectations about 2016 and future global uranium supply, consumption, demand, number of reactors and nuclear generating capacity |
| • | our expectations about 2016 and future consumption for conversion services |
| • | the discussion of our expectations relating to our Canada Revenue Agency (CRA) and Internal Revenue Service (IRS) transfer pricing disputes including our estimate of |
the amount and timing of expected cash taxes and transfer pricing penalties |
| • | our expectations for future tax payments and rates |
| • | our expectations for future royalty payments |
| • | our future plans and expectations for each of our uranium properties and fuel services sites, including the McArthur River expansion |
| • | our mineral reserve and resource estimates |
Material risks
| • | actual sales volumes or market prices for any of our products or services are lower than we expect for any reason, including changes in market prices or loss of market share to a competitor |
| • | we are adversely affected by changes in currency exchange rates, interest rates, royalty rates or tax rates |
| • | our production costs are higher than planned, or necessary supplies are not available, or not available on commercially reasonable terms |
| • | our estimates of production, purchases, costs, decommissioning or reclamation expenses, or our tax expense estimates, prove to be inaccurate |
| • | we are unable to enforce our legal rights under our existing agreements, permits or licences |
| • | we are subject to litigation or arbitration that has an adverse outcome, including lack of success in our disputes with tax authorities |
| • | we are unsuccessful in our dispute with CRA and this results in significantly higher cash taxes, interest charges and penalties than the amount of our cumulative tax provision |
| • | we are unable to utilize letters of credit to the extent anticipated in our dispute with CRA |
| • | there are defects in, or challenges to, title to our properties |
| • | our mineral reserve and resource estimates are not reliable, or we face challenging or unexpected geological, hydrological or mining conditions |
| • | we are affected by environmental, safety and regulatory risks, including increased regulatory burdens or delays |
| • | we cannot obtain or maintain necessary permits or approvals from government authorities |
| • | we are affected by political risks |
| • | we are affected by terrorism, sabotage, blockades, civil unrest, social or political activism, accident or a deterioration in political support for, or demand for, nuclear energy |
| • | we are impacted by changes in the regulation or public perception of the safety of nuclear power plants, which adversely affect the construction of new plants, the relicensing of existing plants and the demand for uranium |
| • | there are changes to government regulations or policies that adversely affect us, including tax and trade laws and policies |
| • | our uranium suppliers fail to fulfill delivery commitments |
| • | our Cigar Lake development, mining or production plans are delayed or do not succeed for any reason, including as a result of any difficulties with freezing the deposit to meet production targets, or any difficulties with the McClean Lake mill modifications or expansion or milling of Cigar Lake ore |
| • | the production increase approval at McClean Lake is delayed or not obtained, or there is a labour dispute at the McClean Lake mill |
| • | our McArthur River development, mining or production plans are delayed or do not succeed for any reason |
| • | we are affected by natural phenomena, including inclement weather, fire, flood and earthquakes |
| • | our operations are disrupted due to problems with our own or others’ facilities, the unavailability of reagents, equipment, operating parts and supplies critical to production, equipment failure, lack of tailings capacity, labour shortages, labour relations issues (including an inability to renew the collective bargaining agreement with unionized employees at the Port Hope conversion facility), strikes or lockouts, underground floods, cave-ins, ground movements, tailings dam failures, transportation disruptions or accidents or other development and operating risks |
| 2015 ANNUAL INFORMATION FORM Page 2 | ||
Material assumptions
| • | our expectations regarding sales and purchase volumes and prices for uranium and fuel services |
| • | our expectations regarding the demand for, and supply of, uranium, the construction of new nuclear power plants and the relicensing of existing nuclear power plants not being more adversely affected than expected by changes in regulation or in the public perception of the safety of nuclear power plants |
| • | our expected production levels and production costs |
| • | the assumptions regarding market conditions and other factors upon which we have based our capital expenditures expectations |
| • | our expectations regarding spot prices and realized prices for uranium |
| • | our expectations regarding tax rates and payments, currency exchange rates and interest rates |
| • | our expectations about the outcome of disputes with tax authorities |
| • | we are able to utilize letters of credit to the extent anticipated in our dispute with CRA |
| • | our decommissioning and reclamation expenses |
| • | our mineral reserve and resource estimates and the assumptions upon which they are based are reliable |
| • | our understanding of the geological, hydrological and other conditions at our mines |
| • | our Cigar Lake development, mining and production plans succeed and the deposit freezes as planned |
| • | modification and expansion of the McClean Lake mill is completed as planned, and the mill is able to process Cigar Lake ore as expected |
| • | the production increase approval at McClean Lake is obtained and there is no labour dispute at the McClean Lake mill |
| • | our McArthur River development, mining and production plans succeed |
| • | our ability to continue to supply our products and services in the expected quantities and at the expected times |
| • | our ability to comply with current and future environmental, safety and other regulatory requirements, and to obtain and maintain required regulatory approvals |
| • | our operations are not significantly disrupted as a result of political instability, nationalization, terrorism, sabotage, blockades, civil unrest, social or political activism, breakdown, natural disasters, governmental or political actions, litigation or arbitration proceedings, the unavailability of reagents, equipment, operating parts and supplies critical to production, equipment failure, labour shortages, labour relations issues (including an ability to renew the collective bargaining agreement with unionized employees at the Port Hope conversion facility), strikes or lockouts, underground floods, cave-ins, ground movements, tailings dam failures, lack of tailings capacity, transportation disruptions or accidents or other development or operating risks |
| 2015 ANNUAL INFORMATION FORM Page 3 | ||
About Cameco
Our head office is in Saskatoon, Saskatchewan. We are one of the world’s largest uranium producers, with uranium assets on three continents. Nuclear energy plants around the world use our uranium products to generate one of the cleanest sources of electricity available today.
Strategy
Our strategy remains focused on taking advantage of the long-term growth we see coming in our industry, while maintaining the ability to respond to market conditions as they evolve. You can find more information about our strategy in our 2015 MD&A.
Cameco Corporation
2121 – 11th Street West
Saskatoon, Saskatchewan
Canada S7M 1J3
Telephone: 306.956.6200
This is our head office, registered office and principal place of business.
We are publicly listed on the Toronto and New York stock exchanges, and had a total of 4,005 employees at December 31, 2015.
Business segments
URANIUM
| ||
We are one of the world’s largest uranium producers, and in 2015 accounted for about 18% of the world’s production. We have controlling ownership of the world’s largest high-grade reserves, with ore grades up to 100 times the world average, and low-cost operations.
Product
• uranium concentrates (U3O8)
Mineral reserves and resources
Mineral reserves
• approximately 410 million pounds proven and probable
Mineral resources
• approximately 377 million pounds measured and indicated
• approximately 381 million pounds inferred | Operating properties
• McArthur River and Key Lake, Saskatchewan
• Cigar Lake, Saskatchewan
• Rabbit Lake, Saskatchewan
• Smith Ranch-Highland, Wyoming
• Crow Butte, Nebraska
• Inkai, Kazakhstan
Projects under evaluation
• Millennium, Saskatchewan
• Yeelirrie, Australia
• Kintyre, Australia
Global exploration
• focused on three continents
• approximately 1.6 million hectares of land
| |
| 2015 ANNUAL INFORMATION FORM Page 4 | ||
FUEL SERVICES
| ||
We are an integrated uranium fuel supplier, offering refining, conversion and fuel manufacturing services.
Products
• uranium trioxide (UO3)
• uranium hexafluoride (UF6) (control about 20% of world conversion capacity)
• uranium dioxide (UO2)
• fuel bundles, reactor components and monitoring equipment used by CANDU reactors
| Operations
• Blind River refinery, Ontario (refines uranium concentrates to UO3)
• Port Hope conversion facility, Ontario (converts UO3 to UF6 or UO2)
• Cameco Fuel Manufacturing Inc. (CFM), Ontario (manufactures fuel bundles and reactor components) | |
NUKEM
| ||
| Our ownership of NUKEM GmbH (NUKEM) provides us with access to one of the world’s leading traders of uranium and uranium-related products. | Activity
• physical trading uranium concentrates, conversion and enrichment services
• recovery of natural and enriched non-standard uranium from western facilities and other sources
| |
For information about our revenue and gross profit by business segment for the years ended December 31, 2015 and 2014, see our 2015 MD&A as follows:
| • | uranium – page 43 |
| • | fuel services – page 45 |
| • | NUKEM – page 45. |
Other fuel cycle investments
| ||
ENRICHMENT
We have a 24% interest in Global Laser Enrichment (GLE) in North Carolina, with General Electric (51%) and Hitachi Ltd. (25%). GLE is testing a third-generation technology that, if successful, will use lasers to commercially enrich uranium. Having operational control of both uranium production and enrichment facilities would offer operational synergies that could significantly enhance profit margins. |
| 2015 ANNUAL INFORMATION FORM Page 5 | ||
The nuclear fuel cycle
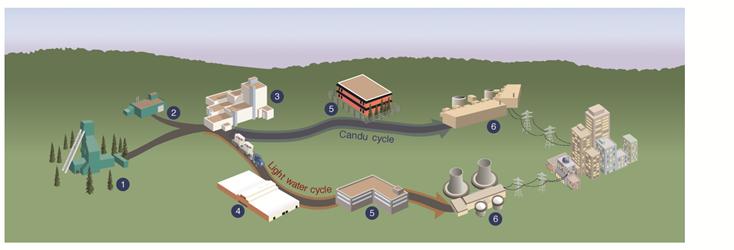
Our operations and investments span the nuclear fuel cycle, from exploration to fuel manufacturing.
| 1 | Mining |
Once an orebody is discovered and defined by exploration, there are three common ways to mine uranium, depending on the depth of the orebody and the deposit’s geological characteristics:
| • | Open pit miningis used if the ore is near the surface. The ore is usually mined using drilling and blasting. |
| • | Underground mining is used if the ore is too deep to make open pit mining economical. Tunnels and shafts provide access to the ore. |
| • | In situ recovery (ISR) does not require large scale excavation. Instead, holes are drilled into the ore and a solution is used to dissolve the uranium. The solution is pumped to the surface where the uranium is recovered. |
| 1 | Milling |
Ore from open pit and underground mines is processed to extract the uranium and package it as a powder typically referred to asuranium concentrates (U3O8) oryellowcake. The leftover processed rock and other solid waste (tailings) is placed in an engineered tailings facility.
| 2 | Refining |
Refining removes the impurities from the uranium concentrate and changes its chemical form touranium trioxide (UO3).
| 3 | Conversion |
For light water reactors, the UO3 is converted touranium hexafluoride (UF6) gas to prepare it for enrichment. For heavy water reactors like the CANDU reactor, the UO3 is converted into powdereduranium dioxide (UO2).
| 4 | Enrichment |
Uranium is made up of two main isotopes: U-238 and U-235. Only U-235 atoms, which make up 0.7% of natural uranium, are involved in the nuclear reaction (fission). Most of the world’s commercial nuclear reactors require uranium that has an enriched level of U-235 atoms.
The enrichment process increases the concentration of U-235 to between 3% and 5% by separating U-235 atoms from the U-238. Enriched UF6 gas is then converted to powdered UO2.
| 5 | Fuel manufacturing |
Natural or enriched UO2 is pressed into pellets, which are baked at a high temperature. These are packed into zircaloy or stainless steel tubes, sealed and then assembled into fuel bundles.
| 6 | Generation |
Nuclear reactors are used to generate electricity.U-235 atoms in the reactor fuel fission, creating heat that generates steam to drive turbines. The fuel bundles in the reactor need to be replaced as the U-235 atoms are depleted, typically after one or two years depending upon the reactor type. The used – orspent – fuel is stored or reprocessed.
Spent fuel management
The majority of spent fuel is safely stored at the reactor site. A small amount of spent fuel is reprocessed. The reprocessed fuel is used in some European and Japanese reactors.
| 2015 ANNUAL INFORMATION FORM Page 6 | ||
Major developments
2013 | 2014 | 2015 | ||
January
• We complete the acquisition of NUKEM.
May
• We begin production at North Butte uranium mine in Wyoming.
June
• We receive an eight-year operating licence for Cigar Lake.
July
• We enter into a three-year collective agreement with approximately 250 unionized employees at our conversion facility in Port Hope, Ontario.
October
• We receive 10-year operating licences for McArthur River, Key Lake and Rabbit Lake.
December
• Inkai receives approval to increase annual production from blocks 1 and 2 to 5.2 million pounds (100% basis). |
January
• We enter into an agreement to sell our 31.6% limited partnership interest in BPLP to BPC Generation Infrastructure Trust, one of the limited partners in BPLP.
March
• We complete the sale of our 31.6% limited partnership interest in BPLP to BPC Generation Infrastructure Trust.
• We begin ore production at Cigar Lake.
June
• We issue $500 million of 4.19% unsecured debentures due in 2024.
July
• We redeem $300 million of unsecured debentures due in 2015.
September
• We enter into a four-year collective agreement with approximately 535 unionized employees at our McArthur River/Key Lake operations.
October
• McClean Lake mill starts producing uranium concentrates from ore mined at Cigar Lake. |
May
• We begin commercial production at Cigar Lake.
June
• We enter into a three-year collective agreement with approximately 100 unionized employees at our fuel manufacturing operations in Port Hope and Cobourg, Ontario. |
| 2015 ANNUAL INFORMATION FORM Page 7 | ||
How Cameco was formed
Cameco Corporation was incorporated under theCanada Business Corporations Act on June 19, 1987.
We were formed when two crown corporations were privatized and their assets merged:
| • | Saskatchewan Mining Development Corporation (uranium mining and milling operations) |
| • | Eldorado Nuclear Limited (uranium mining, refining and conversion operations) (now Canada Eldor Inc.). |
There are constraints and restrictions on ownership of shares in the capital of Cameco (Cameco shares) set out in our company articles, and a related requirement to maintain offices in Saskatchewan. These are requirements of theEldorado Nuclear Limited Reorganization and Divestiture Act (Canada), as amended, andThe Saskatchewan Mining Development Corporation Reorganization Act, as amended, and are described on pages 119 and 120.
We have made the following amendments to our articles:
| 2002 | • increased the maximum share ownership for individual non-residents to 15% from 5% • increased the limit on voting rights of non-residents to 25% from 20% | |
| 2003 | • allowed the board to appoint new directors between shareholder meetings as permitted by theCanada Business Corporations Act, subject to certain limitations • eliminated the requirement for the chairman of the board to be ordinarily resident in the province of Saskatchewan | |
We have three main subsidiaries:
• Cameco Europe Ltd. (Cameco Europe), a Swiss company we have 100% ownership of through subsidiaries
• NUKEM Investments GmbH, a German company we have 100% ownership of through subsidiaries
• Joint Venture Inkai Limited Liability Partnership (Inkai), a limited liability partnership in Kazakhstan, which we own a 60% interest in.
At December 31, 2015, we do not have any other subsidiaries that are material, either individually or collectively. |
For more information
You can find more information about Cameco on SEDAR (sedar.com), EDGAR (sec.gov) and on our website (cameco.com/investors).
See our most recent management proxy circular for additional information, including how our directors and officers are compensated and any loans to them, principal holders of our securities, and securities authorized for issue under our equity compensation plans. We expect the circular for our May 2016 annual meeting of shareholders to be available in April 2016.
See our 2015 financial statements and 2015 MD&A for additional financial information. |
| 2015 ANNUAL INFORMATION FORM Page 8 | ||
Our markets
Demand
As has been the case in recent years, a lot happened over the course of 2015, although the general state of the market did not see much change.
Making positive news for nuclear, as usual, was China. Not only did the country continue with its rapid reactor new build program and bring eight reactors online, but Chinese companies also signed agreements with Argentina, Romania and the UK for new reactors, illustrating the country’s commitment to nuclear and its intent to become a major international player in the nuclear industry.
Undoubtedly, the biggest headline of 2015 was the long-awaited first reactor restarts in Japan. Sendai units 1 and 2 were the first reactors in Japan to restart since 2013, and it is hoped they are the first of many to come.
New builds in the UK and US continued to be bright spots for the industry, in addition to a number of reactor life extensions approved in Japan, and the US, with utilities now considering additional extensions that could see reactor lives reaching 80 years.
However, these positive developments could not outweigh the more powerful influence of a continued sluggish global economy, concerns around growth in China, and flat electricity demand. These more general drivers had help from industry specific factors as well, such as slower new reactor construction, eight reactor shutdowns, the continued high level of inventories held by market participants, and France’s policy to reduce nuclear in their energy mix to 50% by 2025 becoming law.
In addition, supply performed relatively well, with only minor disruptions and one curtailment, unlike 2014, which saw six projects tempered or curtailed.
The end result was a market seemingly indifferent to the events that occurred throughout the year.
Market contracting activity was modest. Spot volumes were normal, but long-term contracting was well below historical averages and current consumption levels – about half of current annual reactor consumption estimates, similar to 2014.Long-term contracting is a key factor in the timing of market recovery, and its pace will depend on the respective coverage levels, market views and risk appetite of both buyers and sellers.
In Japan, Sendai units 1 and 2 restarted in August and October respectively. In addition, the court injunction against the Takahama units was overturned in December 2015, clearing the way for Takahama unit 3 to restart on January 29, 2016 with unit 4 expected to restart later in the first quarter. On March 9, 2016, another court injunction was issued, forcing unit 3 to be taken offline and unit 4 to stay offline. On March 14, 2016, Kansai Electric Power Co. filed an appeal and is seeking authorization to operate Takahama units 3 and 4 while the appeal is pending.
| 2015 ANNUAL INFORMATION FORM Page 9 | ||
Over the long term, Japan’s energy policy states that nuclear will make up 20 to 22% of the energy mix in the country. The billions of dollars in investment being made by Japan’s utilities suggest a high degree of confidence in reactors coming back online and meeting this target; however, public sentiment towards nuclear in Japan remains somewhat uncertain.
In other regions, China’s remarkable nuclear growth program remains on track and the United Kingdom’s plans for new reactor construction continues to move forward. India and South Korea are also among several key regions growing their nuclear generation fleet.
Overall, the anticipated increase in nuclear plants from 439 (representing approximately 400 gigawatts) today to 497 (representing 485 gigawatts) by 2025 illustrates a promising growth picture.
The demand for U3O8 is directly linked to the level of electricity generated by nuclear power plants. As the number of reactors grows, so too does the demand for uranium.
World annual uranium fuel consumption has increased from 75 million pounds U3O8 in 1980 to an estimated 160 million pounds in 2015. We expect global uranium consumption to increase to about 170 million pounds in 2016 and global production to be approximately 165 million pounds.
Over the next decade, we expect world demand to grow at an average annual growth rate of about 3%, totaling approximately 2.1 billion pounds from 2016-2025. As a result of that growth, by 2025, we expect annual world consumption to be approximately 220 million pounds.
The demand for UF6conversion services is directly linked to the level of electricity generated by light water moderated nuclear power plants.
The demand for UO2 conversion services is linked to the level of electricity generated by heavy water moderated nuclear power plants such as CANDU reactors.
We expect world consumption for conversion services to increase similar to uranium.
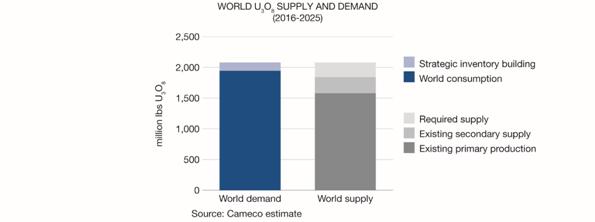
Supply
Uranium supply sources includeprimary production(production from mines that are currently in commercial operation) andsecondary supply sources(excess inventories, uranium made available from defence stockpiles and the decommissioning of nuclear weapons, re-enriched depleted uranium tails, and used reactor fuel that has been reprocessed).
To meet global demand over the next 10 years, we estimate:
| • | approximately 75% of global uranium supply to come from existing primary production |
| • | approximately 15% will come from existing secondary supply sources |
| • | approximately 10% will come from new sources of supply. |
Primary production
While the uranium production industry is international in scope, there are only a small number of companies operating in relatively few countries. In addition, there are barriers to entry and bringing on and ramping up production can take between seven and 10 years. A number of new projects have been cancelled or delayed, and some existing production has been discontinued due to the low uranium prices that have persisted since the 2011 events at the Fukushima-Daiichi nuclear power plant in Japan. Today’s uranium prices are not high enough to incent new mine production and not high enough to keep some current mines in operation. While some new mines may be brought on regardless of price as a result of sovereign interests or to cover existing commitments, overall, we expect supply to decrease over time due to the global lack of investment.
Without new investment, we expect existing primary production to decrease over the next decade, falling to 140 million pounds by 2025 and highlighting the need for new primary supply.
We estimate world mine production in 2015 was about 158 million pounds U3O8, up 8% from 146 million pounds in 2014:
| • | 93% of the estimated world production came from eight countries: Kazakhstan (39%), Canada (22%), Australia (9%), Niger (7%), Russia (5%), Namibia (5%), Uzbekistan (4%), and China (3%) |
| • | Over 65% of the estimated world production was marketed by four producers. We accounted for about 18% of that production (28.4 million pounds). |
| 2015 ANNUAL INFORMATION FORM Page 10 | ||
Secondary sources
Uranium consumption has outstripped uranium production nearly every year since 1985.
A number of secondary sources have covered the shortfall, but most of these sources are finite and will not meet long-term needs:
| • | The US government makes some of its inventories available to the market, although in smaller quantities. |
| • | Utilities, mostly in Europe and some in Japan and Russia, use reprocessed uranium and plutonium from used reactor fuel. |
| • | Re-enriched depleted uranium tails and uranium from underfeeding are also generated using excess enrichment capacity. |
Uranium from nuclear disarmament
Trade restraints and policies
The importation of Russian uranium into the US market is regulated by the amendedUSEC Privatization Actand by the Agreement Suspending the Antidumping Action against Russian Uranium Products (the Russian Suspension Agreement), which together impose annual quotas of approximately 12-13 million pounds U3O8equivalent on imports of Russian uranium. These quotas on Russian uranium, expressed in kgU as LEU and administered by the US Department of Commerce, were set at the equivalent of 20% of annual US reactor demand and are scheduled to expire at the end of 2020.
The US has regulated the importation of Russian uranium since the early 1990s, when it entered into the Russian Suspension Agreement as part of uranium antidumping proceedings.
The US restrictions do not affect the sale of Russian uranium to other countries. About 75%of world uranium demand is from utilities in countries that are not affected by the US restrictions. Utilities in some countries, however, adopt policies that limit the amount of Russian uranium they will buy. The Euratom Supply Agency in Europe must approve all uranium related contracts for members of the EU, and limits the use of certain nuclear fuel supplies from any one source to maintain security of supply, although these limits do not apply to uranium sold separately from enriched uranium product.
Uranium from US inventories
We estimate that the US Department of Energy (DOE) has an excess uranium inventory of roughly 125 million pounds U3O8 equivalent. We expect a sizeable portion of this uranium will be available to the market over the next two decades, although a significant portion of the inventory requires either further processing or the development of commercial arrangements before it can be brought to market.
DOE Excess Uranium Inventory Management Plan
In March 2008, the DOE issued a policy statement and a general framework for managing this inventory, including the need to dispose of it without disrupting the commercial markets. In December of that year, it released theExcess Uranium Inventory Management Plan,which stated that it will dispose of the surplus annually, in amounts of 10% or less of annual US nuclear fuel requirements. It can exceed this limit in certain situations, however (during initial core loads for new reactors, for example).
The DOE’sExcess Uranium Inventory Management Plan was last updated in 2013 and the plan is for it to be redistributed and updated every five years, with the next installment scheduled for 2018. Under the newExcess Uranium Inventory Management Plan, the DOE has increased the allowable amount of material disposed of in any given year to equal 15% or less of annual US nuclear fuel requirements. DOE sales will continue to be governed by Secretarial Determinations (issued every 2 years), which require that any such sales not have a material adverse impact on the US uranium, conversion and enrichment industries. The most recent Secretarial Determination was issued on May 1, 2015 (2015 Secretarial Determination).
DOE vs. ConverDyn
In June 2014, ConverDyn filed a lawsuit against the DOE alleging that their issuance of a May 2014 Secretarial Determination (2014 Secretarial Determination) was unlawful and that the DOE’s transfer of uranium under that Secretarial Determination also violated other parts of theUSEC Privatization Act, which governs the DOE’s sale of its excess uranium inventories. On May 1, 2015 the DOE issued the 2015 Secretarial Determination and subsequently filed a “Motion for Judgment on the Pleadings,” in essence asking the court to dismiss the ConverDyn lawsuit against DOE uranium transfers because the 2015 Secretarial Determination moots the case against the 2014 Secretarial Determination. On July 9, 2015 the court ordered that
| 2015 ANNUAL INFORMATION FORM Page 11 | ||
they must first resolve the premise that the ConverDyn lawsuit has been rendered moot by the 2015 Secretarial Determination before moving forward on the merits of the case. A Status Hearing was scheduled for November 2, 2015, but has since been delayed until mid-2016.
US Congressional Legislation
On May 21, 2015, theExcess Uranium Transparency and Accountability Act was introduced into the House and Senate. The purpose of the bipartisan bill is to restrict the DOE’s inventory sales under a codified structure, bringing transparency and accountability to the process by which the DOE disposes of its excess uranium inventory. The heart of the bill is an annual cap on DOE’s uranium transfers of 2,100 MTU (5.5 million pounds U3O8) for calendar years 2016 through 2023 and 2,700 MTU (7.1 million pounds U3O8) for calendar years 2024 and each year thereafter. The limit includes uranium in all forms. It is expected that if new legislation is introduced the limit could be amended.
Conversion services
We control about 20% of world UF6 conversion capacity and are a supplier of UO2 for Canadian-made CANDU reactors.
Marketing
We sell uranium and fuel services (as uranium concentrates, UO2, UF6, conversion services or fuel fabrication) to nuclear utilities in Belgium, Canada, China, Finland, France, Germany, India, Japan, South Korea, Spain, Sweden, Taiwan, and the US. We are a supplier of UO2 to CANDU reactors operated in Canada and other countries.
Uranium is not traded in meaningful quantities on a commodity exchange. Utilities buy the majority of their uranium and fuel services products under long-term contracts with suppliers, and meet the rest of their needs on the spot market.
In June 2010, the government of Canada signed a civil nuclear co-operation agreement with India to export nuclear technology, equipment and uranium to support India’s growing nuclear energy industry. Licensing arrangements for these exports were ratified by the two governments in 2013. In 2015, we signed a long-term agreement with the Department of Atomic Energy of India to supply approximately seven million pounds of uranium.
In February 2012, the governments of Canada and China announced an agreement on the terms of a protocol that would facilitate the export of Canadian uranium to China. These arrangements were subsequently ratified by the two governments in 2012 and Canadian uranium can be exported to China.
In November 2013, the government of Canada signed a nuclear co-operation agreement with Kazakhstan. The nuclearco-operation agreement and related administration agreements were ratified and came into force in August 2014.
Our sales commitments
In 2015, 46% of our U3O8 sales were to five customers.
We currently have commitments to supply about 190 million pounds of U3O8 under long-term contracts with 41 customers worldwide. Our five largest customers account for 47% of these commitments, and 31% of our committed sales volume is attributed to purchasers in the Americas (US, Canada and Latin America), 49% in Asia and 20% in Europe. We are heavily committed under long-term uranium contracts through 2018, so we are being selective when considering new commitments.
Our subsidiary NUKEM also signs long-term contracts and has uranium and uranium-related products under contract until 2022.
Our purchase commitments
In addition, we are active in the spot market buying and selling uranium where it is beneficial for us. Our NUKEM business segment enhances our ability to participate, as they are one of the world’s leading traders of uranium and uranium-related products. We undertake activity in the spot market prudently, looking at the spot price and other business factors to decide whether it is appropriate to purchase or sell into the spot market. We have also bought uranium under long-term contracts, and may do so again in the future. At December 31, 2015, we had firm commitments to buy about 38 million pounds of uranium equivalent from 2016 to 2028.
| 2015 ANNUAL INFORMATION FORM Page 12 | ||
Our marketing strategy
The purpose of our marketing strategy is to deliver value. Our approach is to secure a solid base of earnings and cash flow by maintaining a balanced contract portfolio that optimizes our realized price.
Because we deliver large volumes of uranium every year, our net earnings and operating cash flows are affected by changes in the uranium price. Market prices are influenced by the fundamentals of supply and demand, geopolitical events, disruptions in planned supply and other market factors.
We target a ratio of 40% fixed-price contracts and 60% market-related in our portfolio of long-term contracts. This is a balanced and flexible approach that allows us to adapt to market conditions, reduce the volatility of our future earnings and cash flow, and that we believe delivers the best value to shareholders over the long term.
Over time, this strategy has allowed us to add increasingly favourable contracts to our portfolio that will enable us to participate in increases in market prices in the future.
Fixed price contracts are typically based on the industry long-term price indicator at the time the contract is accepted and escalated over the term of the contract.
Market-related contracts are different from fixed-price contracts in that they may be based on either the spot price or thelong-term price, and that price is as quoted at the time of delivery rather than at the time the contract is accepted. These contracts can sometimes provide for small discounts, often include floor prices, and some include ceiling prices, all of which are also escalated over the term of the contract.
Our extensive portfolio of long-term sales contracts – and the long-term, trusting relationships we have with our customers – are core strengths for us.
Volumes and pricing
The Ux Consulting estimate for global spot market sales in 2015 was about 49 million pounds of U3O8, compared to 43 million pounds of U3O8 in 2014. The Ux Consulting estimate for global long-term contracting in 2015 was about 80 million pounds of U3O8, compared to 77 million pounds of U3O8 in 2014. Neither buyers nor suppliers are under significant pressure to contract, and suppliers are likely hesitant to lock in meaningful volumes at current price levels.
The industry average spot price (TradeTech and Ux Consulting) on December 31, 2015 was $34.23 (US) per pound U3O8, or 4% lower than the December 31, 2014 average of $35.50 (US).
The industry average long-term price (TradeTech and Ux Consulting) was $44.00 (US) per pound U3O8on December 31, 2015, or 11% lower than the December 31, 2014 average of $49.50 (US).
Fuel services
The majority of our fuel services contracts are at a fixed price per kgU, escalated over the term of the contract, and reflect the market at the time the contract is accepted.
For conversion services, we compete with three other primary commercial suppliers, in addition to the secondary supplies described above, to meet global demand.
We have a similar marketing strategy for UF6 conversion services. We sell our conversion services to utilities in the Americas, Europe and Asia and primarily through long-term contracts. We currently have UF6 conversion services commitments of approximately 65 million kilograms of UF6 conversion services under long-term contracts with 33 customers worldwide. Our five largest customers account for 59% of these commitments, and of our committed UF6 conversion services volume, 34% is attributed to purchasers in the Americas, 29% in Asia and 37% in Europe.
In 2016, we plan to produce 8 million to 9 million kgU.
NUKEM
We acquired NUKEM in January 2013. NUKEM has access to contracted volumes and inventories in diverse geographic locations as well as scope for opportunistic trading of uranium and uranium products. This enables NUKEM to provide a wide range of solutions to its customers that may fall outside the scope of typical uranium sourcing and selling arrangements. Its trading strategy is non-speculative and seeks to match quantities and pricing structures under its long-term supply and delivery contracts, minimizing exposure to uranium related price fluctuations and locking in profits.
| 2015 ANNUAL INFORMATION FORM Page 13 | ||
NUKEM’s main customers are commercial nuclear power plants using enriched uranium fuel, typically large utilities that are either government-owned or large-scale utilities with multi-billion market capitalization and strong credit ratings. NUKEM also trades with converters, enrichers, other traders and investors. NUKEM has uranium and uranium-related products under contract until 2022.
| 2015 ANNUAL INFORMATION FORM Page 14 | ||
Operations and projects
Uranium | ||||
Operating properties | ||||
McArthur River/Key Lake | 16 | |||
Cigar Lake | 31 | |||
Inkai | 47 | |||
Rabbit Lake | 60 | |||
Smith Ranch-Highland | 62 | |||
Crow Butte | 63 | |||
Projects under evaluation | ||||
Millennium | 64 | |||
Yeelirrie | 65 | |||
Kintyre | 66 | |||
Exploration | 67 | |||
Fuel services | ||||
Refining | ||||
Blind River refinery | 68 | |||
Conversion and fuel manufacturing | ||||
Port Hope conversion services | 69 | |||
Cameco Fuel Manufacturing Inc. | 70 | |||
NUKEM | ||||
NUKEM GmbH | 71 | |||
Uranium production
Cameco’s share (million lbs U3O8) | 2014 | 2015 | 2016 | |||||||||
McArthur River/Key Lake | 13.3 | 13.3 | 14.0 | |||||||||
Cigar Lake | 0.2 | 5.7 | 8.0 | 1 | ||||||||
Rabbit Lake | 4.2 | 4.2 | 3.6 | |||||||||
Smith Ranch-Highland | 2.1 | 1.4 | 1.2 | |||||||||
Crow Butte | 0.6 | 0.4 | 0.2 | |||||||||
Inkai | 2.9 | 3.4 | 3.0 | |||||||||
|
|
|
|
|
| |||||||
Total | 23.3 | 28.4 | 30.0 | 1 | ||||||||
|
|
|
|
|
| |||||||
| 1 | Our 2016 plan for packaged production from Cigar Lake is subject to regulatory approval for an annual production limit increase at the McClean Lake mill. SeeUranium – operating properties – Cigar Lake on page 31 for more information. |
| 2015 ANNUAL INFORMATION FORM Page 15 | ||
Uranium – operating properties
 | McArthur River/Key Lake
McArthur River is the world’s largest high-grade uranium mine, and Key Lake is the largest uranium mill in the world.
Ore grades at the McArthur River mine are 100 times the world average, which means it can produce more than 18 million pounds per year by mining only 150 to 200 tonnes of ore per day. We are the operator.
McArthur River is one of our three material uranium properties. |
| Location | Saskatchewan, Canada | |
| Ownership | 69.805% - McArthur River | |
| 83.33% - Key Lake | ||
| End product | uranium concentrates | |
| ISO certification | ISO 14001 certified | |
| Mine type | underground | |
Estimated mineral reserves (our share) | 234.9 million pounds (proven and probable) average grade U3O8– 10.94% | |
Estimated mineral resources (our share) | 3.9 million pounds (measured and indicated) average grade U3O8 – 3.77% 40.9 million pounds (inferred) average grade U3O8 – 7.72% | |
| Mining methods | primary: raiseboring secondary: blasthole stoping and boxhole boring | |
| Licensed capacity | mine: 25 million pounds per year mill: 25 million pounds per year | |
Total production 2000 to 2015 (100% basis) 1983 to 2002 | 291.1 million pounds (McArthur River/Key Lake) 209.8 million pounds (Key Lake) | |
| 2015 production (our share) | 13.3 million pounds | |
| 2016 forecast production (our share) | 14.0 million pounds | |
| Estimated mine life | 2033 (based on current mineral reserves) | |
Estimated decommissioning cost (100% basis) | $48 million - McArthur River $218 million - Key Lake | |
Business structure
| McArthur River is owned by a joint venture (MRJV) between two companies: | Key Lake is owned by a joint venture between the same two companies: | |
• Cameco – 69.805% | • Cameco – 83 1⁄3% | |
• AREVA Resources Canada Inc. (AREVA) – 30.195% | • AREVA – 16 2⁄3% | |
| 2015 ANNUAL INFORMATION FORM Page 16 | ||
History
| 1976 | • Canadian Kelvin Resources Ltd. and Asamera Oil Corporation Ltd. form an exploration joint venture, which includes the lands that the McArthur River mine is situated on | |
| 1977 | • Saskatchewan Mining Development Corporation (SMDC), one of our predecessor companies, acquires a 50% interest | |
| 1980 | • McArthur River joint venture is formed
• SMDC becomes the operator
• Active surface exploration begins
• Between 1980 and 1988 SMDC reduces its interest to 43.991% | |
| 1988 | • Eldorado Resources Limited merges with SMDC to form Cameco
• We become the operator
• Deposit discovered by surface drilling | |
| 1988-1992 | • Surface drilling reveals significant mineralization of potentially economic uranium grades, in a 1,700 metre zone at between 500 to 640 metres | |
| 1992 | • We increase our interest to 53.991% | |
| 1993 | • Underground exploration program receives government approval – program consists of shaft sinking (completed in 1994) and underground development and drilling | |
| 1995 | • We increase our interest to 55.844% | |
| 1997-1998 | • Federal authorities issue construction licences for McArthur River after reviewing the environmental impact statement, holding public hearings, and receiving approvals from the governments of Canada and Saskatchewan | |
| 1998 | • We acquire all of the shares of Uranerz Exploration and Mining Ltd. (UEM), increasing our interest to 83.766%
• We sell half of the shares of UEM to AREVA, reducing our interest to 69.805%, and increasing AREVA’s to 30.195% | |
| 1999 | • Federal authorities issue the operating licence and provincial authorities give operating approval, and mining begins in December | |
| 2003 | • Production is temporarily suspended in April because of a water inflow
• Mining resumes in July | |
| 2009 | • UEM distributes equally to its shareholders:
• its 27.922% interest in the McArthur River joint venture, giving us a 69.805% direct interest, and AREVA a 30.195% direct interest
• its 33 1⁄3% interest in the Key Lake joint venture, giving us an 83 1⁄3% direct interest, and AREVA a 16 2⁄3% direct interest | |
| 2013 | • Federal authorities granted a 10-year renewal of the McArthur River and Key Lake operating licences | |
| 2014 | • After a two-week labour disruption, we enter into a four-year collective agreement with unionized employees at McArthur River and Key Lake operations | |
| 2015 ANNUAL INFORMATION FORM Page 17 | ||
Technical report
This project description is based on the project’s technical report:McArthur River Operation, Northern Saskatchewan, Canada, dated November 2, 2012 (effective August 31, 2012) except for some updates that reflect developments since the technical report was published. The report was prepared for us in accordance with CanadianNational Instrument 43-101 – Standards of Disclosure for Mineral Projects (NI 43-101), by or under the supervision of David Bronkhorst, P. Eng., Alain G. Mainville, P. Geo., Gregory M. Murdock, P. Eng., and Leslie D. Yesnik, P. Eng.; fourqualified persons within the meaning ofNI 43-101. The following description has been prepared under the supervision of David Bronkhorst, P. Eng., Alain G. Mainville, P. Geo., and Baoyao Tang, P. Eng. They are allqualified persons within the meaning of NI 43-101, but are not independent of us.
The conclusions, projections and estimates included in this description are subject to the qualifications, assumptions and exclusions set out in the technical report, except as such qualifications, assumptions and exclusions may be modified in this AIF. We recommend you read the technical report in its entirety to fully understand the project. You can download a copy from SEDAR (sedar.com) or from EDGAR (sec.gov). | For information about uranium sales see pages 12 to 13, environmental matters see Safety, Health and Environment starting on page 81, and taxes see page 96.
For a description of royalties payable to the province of Saskatchewan on the sale of uranium extracted from orebodies within the province, see page 96.
For a description of risks that might affect access, title or the right or ability to perform work on the property, see Regulatory risks starting at page 106, Environmental risks starting at page 112, and Legal and other risks starting at page 114.
|
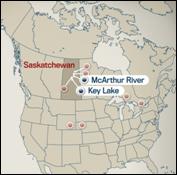
About the McArthur River property
Location
The McArthur River mine site is located near Toby Lake, approximately 620 kilometres north of Saskatoon. The mine site is in close proximity to other uranium production operations: the Key Lake mill is 80 kilometres northeast by road, the Cigar Lake mine is 46 kilometres northeast by air and the Rabbit Lake mine/mill is 95 kilometres northeast by air.
Access
Access to the property is by an all-weather gravel road and by air. Supplies are transported by truck from Saskatoon and elsewhere. There is a 1.6 kilometre unpaved air strip and an air terminal one kilometre east of the mine site, on the surface lease.
Saskatoon, a major population centre south of the McArthur River property, has highway and air links to the rest of North America.
Leases
Surface lease
The MRJV acquired the right to use and occupy the lands necessary to mine the deposit under a surface lease agreement with the province of Saskatchewan. The most recent agreement was signed in November 2010. It covers 1,425 hectares and has a term of 33 years.
We are required to report annually on the status of the environment, land development and progress on northern employment and business development.
Mineral lease
We have the right to mine the deposit under ML-5516, granted to us by the province of Saskatchewan. The lease covers 1,380 hectares and expires in March 2024. We have the right to renew the lease for further 10-year terms.
Mineral claims
A mineral claim gives us the right to explore for minerals and to apply for a mineral lease. There are 21 mineral claims, totaling 83,438 hectares, surrounding the deposit. The mineral claims are in good standing until 2018, or later.
| 2015 ANNUAL INFORMATION FORM Page 18 | ||
Environment, Social and Community Factors
The climate is typical of the continental sub-arctic region of northern Saskatchewan. Summers are short and cool even though daily temperatures can sometimes reach above 30°C. The mean daily temperature for the coldest month is below -20°C, and winter daily temperatures can reach below -40°C.
The deposit is 40 kilometres inside the eastern margin of the Athabasca Basin in northern Saskatchewan. The topography and environment are typical of the taiga forested lands in the Athabasca Basin.
We are committed to building long-lasting and trusting relationships with the communities in which we operate. One of the ways we implement this commitment is through our Five Pillar CSR Strategy. For more information, see Sustainable development at page 80.
No communities are in the immediate vicinity of McArthur River. The community of Wollaston Lake is approximately 120 kilometres by air to the east of the mine site. The community of Pinehouse is approximately 300 kilometres south of the mine by road.
Athabasca Basin community resident employees and contractors fly from various pick-up points in smaller planes to the mine. Other employees and contractors fly to the mine from Saskatoon with pick-up points in Prince Albert and La Ronge.
Geological Setting
The deposit is in the southeastern portion of the Athabasca Basin in northern Saskatchewan, within the southwest part of the Churchill structural province of the Canadian Shield.
The crystalline basement rocks underlying the deposit are members of the Aphebian-age Wollaston Domain, metasedimentary sequence. These rocks are overlain by flat lying sandstones and conglomerates of the Helikian Athabasca Group. These sediments consist of the A, B, C and D units of the Manitou Falls Formation, and a basal conglomerate containing pebbles and cobbles of quartzite. These sediments are over 500 metres thick in the deposit area.
Mineralization
McArthur River’s mineralization is structurally controlled by a northeast-southwest trending reverse fault (the P2 fault), which dips 40-65 degrees to the southeast. The fault has thrust a wedge of basement rock into the overlying sandstone. There is a vertical displacement of more than 80 metres at the northeast end of the fault, which decreases to 60 metres at the southwest end.
The deposit consists of nine distinct mineralized areas and three under-explored surface defined mineralized showings over a strike length of 2,700 metres. Five of these have been well defined with underground drilling, namely Zones 1 to 4 and Zone 4 South. The remaining seven, McA South (1), McA North (1-4), Zone A and Zone B, are based mostly on surface drilling.
The width of the mineralization varies. The main part of the mineralization, generally at the upper part of the wedge, averages 12.7 metres in width and attains a maximum width of 28 metres (Zone 2). The height of the mineralization ranges from 50 metres to 120 metres.
With the exception of Zone 2, the mineralization occurs in both the sandstone and basement rock along the faulted edge of the basement wedge. Zone 2 occurs deeper in the basement rock in a unique area of the deposit, where a massive footwall quartzite unit lies close to the main fault zone.
Although all of the rocks at McArthur River are altered to some degree, the alteration is greatest in or near faults that are often associated with mineralization. Chloritization is common and most intense within a metre of mineralization in the pelitic hanging wall basement rocks above the P2 fault. The predominant alteration characteristic of the sandstone is pervasive silicification, which increases in intensity 375 metres below the surface, and continues to the unconformity. This brittle sandstone is strongly fractured along the path of the main fault zone, resulting in poor ground conditions and high permeability to water.
In general, the high-grade mineralization, characterized by botryoidal uraninite masses and subhedral uraninite aggregates, constitutes the earliest phase of mineralization in the deposit. Pyrite, chalcopyrite, and galena were also deposited during the initial mineralizing event. Later stage, remobilized uraninite occurs as disseminations, veinlets, and fracture coatings within chlorite breccia zones, and along the margins of silt beds in the Athabasca sandstone.
| 2015 ANNUAL INFORMATION FORM Page 19 | ||
Deposit Type
McArthur River is an unconformity-associated uranium deposit. The geological model was confirmed by underground drilling, development and production activities. Similar deposits include: Rabbit Lake, Key Lake, Cluff Lake, Midwest Lake, McClean Lake, Cigar Lake and Maurice Bay in the Athabasca uranium district (Saskatchewan, Canada), Kiggavik (Lone Gull) Thelon Basin district (Nunavut, Canada), Jabiluka, Ranger, Koongarra and Nabarlek, Alligator River district (Northern Territory, Australia). Although these deposits belong to the unconformity-associated model, all are different. Uranium mineralization in the Nunavut and Australian deposits is all hosted in the basement lithologies whereas in the Athabasca deposits, mineralization is present in both the basement and overlying sandstone. Another key difference is that the Athabasca deposits are of considerably higher grade.
Unconformity-associated uranium deposits comprise massive pods, veins, and/or disseminations of uraninite spatially associated with unconformities between Proterozoic siliciclastic basins and metamorphic basement. The siliciclastic basins are relatively flat-lying, un-metamorphosed, late Paleoproterozoic to Mesoproterozoic, fluvial red-bed strata. The underlying basement rocks comprise tectonically interleaved Paleoproterozoic metasedimentary and Archean to Proterozoic granitoid rocks. Uranium as uraninite (commonly in the form of pitchblende) is the sole commodity in the monometallic sub-type and principle commodity in the polymetallicsub-type that includes variable amounts of Ni, Co, As and traces of Au, Pt, Cu and other elements. Some deposits include both sub-types and transitional types, with the monometallic tending to bebasement-hosted, and the polymetallic generally hosted by basal siliciclastic strata and paleo-weathered basement at the unconformity.
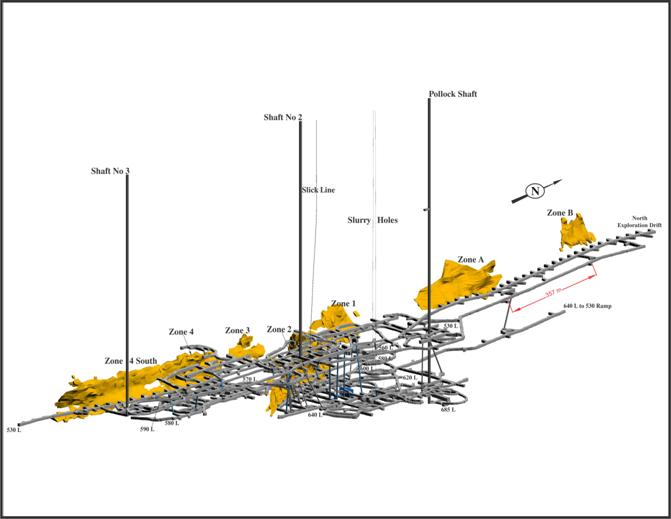
Orthogonal View of Underground Development and Mineralized Zones Looking Northwest
| 2015 ANNUAL INFORMATION FORM Page 20 | ||
About the McArthur River mine
McArthur River is a producing property with sufficient surface rights to meet current mining operation needs.
We began construction and development of the McArthur River mine in 1997 and completed it on schedule. Mining began in December 1999 and commercial production on November 1, 2000.
McArthur River currently has six areas with delineated mineral reserves and mineral resources (Zones 1 to 4, Zone 4 South and Zone B) and three additional areas with delineated mineral resources (Zone A and McA North (1-2)). We are currently mining Zone 2 and Zone 4.
We started mining Zone 2 in 1999. It is divided into four panels (panels 1, 2, 3 and 5) based on the configuration of the freezewall around the ore. As the freezewall is expanded, the inner connecting freezewalls are decommissioned in order to recover the uranium that was inaccessible around the active freeze pipes. Panel 5 represents the upper portion of Zone 2, overlying part of the other panels. The majority of the remaining Zone 2 proven mineral reserves are in panel 5.
Zone 4 is divided into three mining areas: central, north and south. We are actively mining the central and north areas.
Permits
We need three key permits to operate the McArthur River mine:
| • | Uranium Mine Operating Licence – renewed in 2013 and expires on October 31, 2023 (from the Canadian Nuclear Safety Commission (CNSC)) |
| • | Approval to Operate Pollutant Control Facilities – renewed in 2014 and expires on October 31, 2016 (from the Saskatchewan Ministry of Environment) |
| • | Water Rights Licence and Approval to Operate Works – amended in 2011 and valid for an undefined term (from the Saskatchewan Watershed Authority). |
Infrastructure
Surface facilities are 550 metres above sea level. The site includes:
• an underground mine with three shafts: one full surface shaft and two ventilation shafts
• 1.6 kilometre airstrip and air terminal
• waste rock stockpiles
• water containment ponds and treatment plant
• a freshwater pump house
• a powerhouse | • electrical substations
• standby electrical generators
• a warehouse
• freeze plants
• a concrete batch plant
• an administration and maintenance shop building
• a permanent residence and recreation complex
• an ore slurry load out facility. |
To support changes that optimize the production schedule, we plan to expand mine infrastructure (seeMcArthur River production expansion on pages 23 and 24 for more information).
Water, power and heat
Toby Lake, which is nearby and easy to access, has enough water to satisfy all surface water requirements. Collection of groundwater entering our shafts is sufficient to meet all underground process water requirements. The site is connected to the provincial power grid, and it has standby generators in case there is an interruption in grid power.
McArthur River operates throughout the year despite cold winter conditions. During the winter, we heat the fresh air necessary to ventilate the underground workings using propane-fired burners.
Employees
Employees are recruited with preference given to residents of northern Saskatchewan.
Mining method
We use a number of innovative methods and techniques to mine the McArthur River deposit.
| 2015 ANNUAL INFORMATION FORM Page 21 | ||
Ground freezing
The sandstone that overlays the deposit and basement rocks is water-bearing, with large volumes of water under significant pressure. We use ground freezing to form an impermeable wall around the area being mined. This prevents the water in the sandstone from entering the mine, and helps stabilize weak rock formations. Ground freezing reduces, but does not eliminate, the risk of water inflows. To date, we have isolated six mining areas with freezewalls.
Raisebore mining
Raisebore mining is an innovative non-entry approach that we adapted to meet the unique challenges at McArthur River. It involves:
| • | drilling a series of overlapping holes through the ore zone from a raisebore chamber in waste rock above the mineralization |
| • | collecting the broken ore at the bottom of the raises using line-of-sight remote-controlled scoop trams, and transporting it to a grinding circuit |
| • | once mining is complete, filling each raisebore hole with concrete |
| • | when all the rows of raises in a chamber are complete, removing the equipment and filling the entire chamber with concrete |
| • | starting the process again with the next raisebore chamber. |
In 2013, the CNSC granted approval for the use of two secondary extraction methods: blasthole stoping and boxhole boring.
We have used approved mining methods to successfully extract over 290 million pounds U3O8 (100% basis) since we began mining in 1999. Raisebore mining is scheduled to remain the primary extraction method over the life of mine, although we now expect to mine a significant portion of the remaining reserves with blasthole stoping.
Blasthole stoping
Similar to raiseboring, blasthole stoping requires establishing drill access above the mineralization and extraction access below the mineralization. We begin each stope with a single raisebore hole (explained above). The stope is then formed by expanding the circumference of the raise by drilling longholes around the raisebore hole and blasting the ore. The blasted material funnels into the raisebore hole and drops to the extraction level below. The broken rock is collected on the lower level and removed by line-of-sight remote-controlled scoop trams, then transported to the grinding circuit. Once a stope is mined out, it is backfilled with concrete to maintain ground stability and allow the next stope (or raise) to be mined. This mining method has been used extensively in the mining industry, including uranium mining.
We continue to employ blasthole stoping only in areas where the longholes can be accurately drilled, and where stable stopes can be excavated without jeopardizing the integrity of the freezewall.
Our use of blasthole stoping as an ore extraction method has increased as a result of the significant productivity improvements we have achieved with this method. The amount of ore extracted from a single stope can be equivalent to four to eight raisebore holes, resulting in more efficient mining, less waste rock handling, less backfill placement and lower backfill dilution in the ore shipped to Key Lake.
Boxhole boring
Boxhole boring is similar to the raisebore method, but the drilling machine is located below the mineralization, so development is not required above the mineralization. This method is currently being used at only a few mines around the world, but had not been used for uranium mining prior to testing at McArthur River.
Test mining to date has identified this as a viable mining option; however, only a minor amount of ore is scheduled to be extracted using this method.
Initial mine processing for transport to Key Lake Mill
Ore processing at McArthur River was commissioned in 2000 following a lengthy period of testing, design, procurement, and construction. Since commissioning, numerous changes have been made to the McArthur River ore processing and water treatment circuits to improve their operational reliability and efficiency.
We carry out initial processing of the extracted ore at McArthur River:
| • | the underground circuit grinds the ore and mixes it with water to form a slurry |
| • | the slurry is pumped 680 metres to the surface and stored in one of four ore slurry holding tanks |
| • | it is blended and thickened, removing excess water |
| • | the final slurry, at an average grade of 15% U3O8, is pumped into transport truck containers and shipped to Key Lake mill on an 80 kilometre all-weather road. |
| 2015 ANNUAL INFORMATION FORM Page 22 | ||
Water from this process, including water from underground operations, is treated on the surface. Any excess treated water is released into the environment.
Tailings
McArthur River does not have a tailings management facility because it ships the ore slurry to Key Lake for milling.
Waste
The waste rock piles are confined to a small footprint on the surface lease. These are separated into three categories:
| • | clean rock (includes mine development waste, crushed waste, and various piles for concrete aggregate and backfill) |
| • | mineralized waste and low grade ore (>0.03% U3O8) – stored on engineered lined pads |
| • | waste with acid-generating potential – stored on engineered lined pads – for concrete aggregate. |
Water inflows
Production was temporarily suspended on April 6, 2003, as increased water inflow due to a rock fall in a new development area (located just above the 530 metre level) began to flood portions of the mine. We resumed mining in July 2003 and sealed off the excess water inflow in July 2004.
In November 2008, there was a small water inflow in the lower Zone 4 development area on the 590 metre level. We captured and controlled the inflow, and did not have to alter our mining plan. We completed a freezewall in this area in 2010, and are now mining in the area.
These two inflows have strongly influenced mine design, inflow risk mitigation and inflow preparedness.
Pumping capacity and treatment limits
Our standard for this mine is to secure pumping capacity of at least one and a half times the estimated maximum sustained inflow. We review our dewatering system and requirements at least once a year and before we begin work on any new zone. We believe we have sufficient pumping, water treatment and surface storage capacity to handle the estimated maximum sustained inflow. As our mine plan is advanced, we plan to make improvements in our dewatering system and to expand our water treatment capacity.
Production
| • | 2015:19.1 million pounds of U3O8 was produced by milling McArthur River ore at Key Lake (our share was 13.3 million pounds). Average mill metallurgical recovery was 99.35%. |
| • | Forecast:20 million pounds of U3O8 (our share 14 million pounds) (which includes processing downblended material at Key Lake) in 2016, and we plan to reach an annual capacity of 22 million pounds of U3O8 (100% basis) by 2018. The total life-of-mine mill production forecast as of December 31, 2015 is estimated to be 334 million pounds of U3O8 (our share 233 million pounds) based on an overall milling recovery of 99.2% (which does not include processing downblended material at Key Lake). |
Payback
Payback of capital for us, including all actual costs, was achieved in 2010, on an undiscounted pre-tax basis. Operating cash flow is forecast to be sufficient to cover all planned capital expenditures.
Recent activity
We began mining Zone 4 North in 2014. We are using both raisebore and blasthole mining methods in this area. This has significantly improved production efficiencies compared to boxhole boring or raiseboring alone.
McArthur River production expansion
In 2012, we completed the feasibility study on theMcArthur River extension project and based on the positive results, we revised our mine plan to incorporate a mine expansion.
In 2015, the CNSC approved our application to increase McArthur River’s licensed annual production to 25 million pounds (100% basis), to allow flexibility to match the approved Key Lake mill capacity. The licence conditions handbooks for these operations now allow both operations to produce up to 25 million pounds (100% basis) per year.
| 2015 ANNUAL INFORMATION FORM Page 23 | ||
In support of our strategy to maintain the flexibility to respond to market conditions as they evolve, we continue to advance projects that are necessary to sustain and increase production when the market signals that additional production is needed. In order to successfully meet the planned production in the life of mine schedule, we must continue to successfully transition into new mine areas through mine development and investment in support infrastructure. We plan to:
| • | improve our dewatering system and expand our water treatment capacity, as required to mitigate capacity losses should mine developments increase background water volumes |
| • | expand the concrete distribution systems and batch plant capacity. |
Freeze plant and distribution systems will have to be expanded as new mining areas are developed and brought into production. Freeze plant capacity is expected to be expanded in three stages as follows:
| • | Expansion of the existing freeze plant: Expansion of the existing freeze plant from 800 tonnes to 1,300 tonnes was completed and commissioned in 2014. |
| • | South freeze plant: A modular freeze plant with initial capacity of 750 tonnes of freeze capacity is planned for the south mining areas and is scheduled to be completed by 2017. |
| • | North freeze plant: A freeze plant with capacity up to 1,250 tonnes is planned for the north mining areas and is scheduled to be completed by 2020. Final sizing will be determined after the completion of Zone A delineation drilling. |
Key Lake mill
Location and access
In northern Saskatchewan, 570 kilometres north of Saskatoon. The site is 9 kilometres long and 5 kilometres wide. It is connected to McArthur River by an 80 kilometre all-weather road. There is a 1.6 kilometre unpaved air strip and an air terminal on the east edge of the site.
Permits
We need four key permits to operate the Key Lake mill:
| • | Uranium Mill Operating Licence – renewed in 2013 and expires on October 31, 2023 (from the CNSC) |
| • | Approval to Operate Pollutant Control Facilities – renewed in 2014 and expires on November 30, 2021 (from the Saskatchewan Ministry of Environment) |
| • | Water Rights Licences to use ground water and approval to operate works – last updated in 2008 and expires April 1, 2032 (from the Saskatchewan Watershed Authority) |
| • | Approvals to Operate Works for dewatering wells – last issued/amended in 2015 with no expiry noted (from the Saskatchewan Watershed Authority). |
In 2014, the CNSC approved the environmental assessment (EA) for theKey Lake extension project,a project which involves increasing our tailings capacity and Key Lake’s nominal annual production rate. The licence conditions handbook now allows the Key Lake mill to produce up to 25.0 million pounds (100% basis) per year.
With the approved EA and once theKey Lake extension project is complete, mill production can be increased to closely follow production from the McArthur River mine. There will be differences in a given production year between mine and mill production due to the addition of mineralized material stockpiled at Key Lake, processing downblended material (see page 88), year-to-year inventory changes and recovery rate.
Supply
Our share of McArthur River ore is milled at Key Lake. We do not have a formal toll milling agreement with the Key Lake joint venture.
In June 1999, the Key Lake joint venture (Cameco and UEM) entered into a toll milling agreement with AREVA to process their total share of McArthur River ore. The terms of the agreement (as amended in January 2001) include the following:
| • | processing is at cost, plus a toll milling fee |
| • | the Key Lake joint venture owners are responsible for decommissioning the Key Lake mill and for certain capital costs, including the costs of any tailings management associated with milling AREVA’s share of McArthur River ore. |
| 2015 ANNUAL INFORMATION FORM Page 24 | ||
With the UEM distribution in 2009 (seeHistory on page 17 for more information), we made the following changes to the agreement:
| • | the fees and expenses related to AREVA’s pro-rata share of ore produced just before the UEM distribution (16.234% – the first ore stream) have not changed. AREVA is not responsible for any capital or decommissioning costs related to the first ore stream. |
| • | the fees and expenses related to AREVA’s pro-rata share of ore produced as a result of the UEM distribution (an additional 13.961% – the second ore stream) have not changed. AREVA’s responsibility for capital and decommissioning costs related to the second ore stream are, however, as a Key Lake joint venture owner under the original agreement. |
The agreement was amended again in 2011 and now requires:
| • | milling of the first ore stream at the Key Lake mill until May 31, 2028 |
| • | milling of the second ore stream at the Key Lake mill for the entire life of the McArthur River project. |
Process and recovery
The Key Lake mill uses a seven-step process:
| • | blend McArthur River ore with low grade mineralized material to lower the grade |
| • | dissolve the uranium using a leaching circuit |
| • | clarify the uranium in solution using a counter current decantation circuit |
| • | concentrate it using a solvent extraction circuit |
| • | precipitate it with ammonia |
| • | thicken, dewater and dry/roast it in a calcining kiln |
| • | package it as 98% U3O8(yellowcake). |
Key Lake has been achieving annual milling recovery of 98.7% or better over the past 10 years and the forecast is for 99.2% in 2016.
Waste rock
There are five large rock stockpiles at the Key Lake site:
| • | three contain non-mineralized waste rock. These will be decommissioned when the site is closed. |
| • | two contain low-grade mineralized material. These are used to lower the grade of the McArthur River ore before it enters the milling circuit. |
Treatment of effluent
We modified Key Lake’s effluent treatment process to satisfy our licence and permit requirements.
Tailings capacity
There are two tailings management facilities at the Key Lake site:
| • | an above-ground impoundment facility, where tailings are stored within compacted till embankments. We have not deposited tailings here since 1996, and are looking at several options for decommissioning this facility in the future. |
| • | the Deilmann pit, which was mined out in the 1990s. Tailings from processing McArthur River ore are deposited in the Deilmann tailings management facility (TMF). |
In 2009, regulators approved our plan for the long-term stabilization of the Deilmann TMF pitwalls. We implemented the plan, and work was completed in 2013.
In 2014, the CNSC approved an increase in Key Lake’s tailings capacity. We now expect to have sufficient tailings capacity to mill all the known McArthur River mineral reserves and resources, should they be converted to reserves, with additional capacity to toll mill ore from other regional deposits.
Mill revitalization
The Key Lake mill began operating in 1983. We have a revitalization plan to maintain and increase its annual uranium production capability to closely follow annual production rates from the McArthur River mine. The plan includes upgrading circuits with new technology to simplify operations and improve environmental performance. We have been refurbishing or replacing selected areas of the existing infrastructure since 2006. Our new acid, oxygen and steam plants are operational. We received approval from the CNSC to increase tailings capacity – seeTailings capacity, above.
| 2015 ANNUAL INFORMATION FORM Page 25 | ||
The current focus is on the product-end of the mill, including solvent extraction (SX), ammonium sulphate crystallization and calcining circuits. We continue to construct and commission a new calciner circuit, and expect to begin operating with the new calciner in 2016. The existing calciner circuit will remain in place until operational reliability of the new calciner is achieved. The calciner replacement project was planned in a way that temporarily allows us to use either calciner, which will help to mitigate risks to our production rate during the commissioning phase.
Decommissioning and financial assurances
In 2003, we prepared apreliminary decommissioning plan for both McArthur River and Key Lake, which were approved by the CNSC and the Saskatchewan Ministry of the Environment. In 2008, when we renewed our CNSC licence, we revised the accompanyingpreliminary decommissioning cost estimates. In 2013, when we again renewed our CNSC licence, we revised the accompanyingpreliminary decommissioning cost estimates.Our Key Lakepreliminary decommissioning cost estimatewas further revised and submitted to the CNSC in 2014 and we received final approval from the CNSC in January 2015. These documents include our estimated cost for implementing the decommissioning plan and addressing known environmental liabilities.
We, along with our joint venture participant, have letters of credit posted as financial assurances with the government of Saskatchewan to cover the amount in the 2013preliminary decommissioning cost estimatefor McArthur River ($48 million) and the 2015preliminary decommissioning cost estimatefor Key Lake ($218 million).
Operating and capital costs
The following is a summary of the capital and operating cost estimates for the life of mine, stated in constant 2016 dollars and reflecting a forecast life-of-mine mill production of 334 million pounds U3O8:
Operating Costs ($Cdn million) | Total (2016 – 2033) | |||
McArthur River Mining | ||||
Site administration | $ | 1,115.00 | ||
Mining costs | 1,807.00 | |||
Process | 319.00 | |||
Corporate overhead | 199.00 | |||
|
| |||
Total mining costs | $ | 3,440.00 | ||
|
| |||
Key Lake Milling | ||||
Administration | $ | 1,040.00 | ||
Milling costs | 1,425.00 | |||
Corporate overhead | 133.00 | |||
|
| |||
Total milling costs | $ | 2,598.00 | ||
|
| |||
Total operating costs | $ | 6,038.00 | ||
|
| |||
Total operating cost per pound U3O8 | $ | 18.09 | ||
|
| |||
Note: presented as total cost to the McArthur River Joint Venture (100% basis)
Estimated operating costs to the McArthur River Joint Venture consist of annual expenditures at McArthur River to mine the mineral reserves, process it underground, including grinding, density control and pumping the resulting slurry to surface for transportation to Key Lake.
Operating costs at Key Lake consist of costs for receipt of the slurry, up to and including precipitation of the uranium into yellowcake, including cost of disposal of impurities to the Deilmann TMF.
| 2015 ANNUAL INFORMATION FORM Page 26 | ||
Capital Costs ($Cdn million) | Total (2016 – 2033) | |||
McArthur River Mine Development | $ | 442.00 | ||
McArthur River Mine Capital | ||||
Freeze infrastructure | $ | 285.00 | ||
Ventilation | 41.00 | |||
Concrete batching and delivery | 64.00 | |||
Other mine capital | 509.00 | |||
|
| |||
Total mine capital | $ | 899.00 | ||
|
| |||
Key Lake Mill Sustaining | ||||
Revitalization | $ | 19.00 | ||
Mill capital | 242.00 | |||
|
| |||
Total mill capital | $ | 261.00 | ||
|
| |||
Total capital costs | $ | 1,602.00 | ||
|
| |||
Note: presented as total cost to the McArthur River Joint Venture (100% basis)
Estimated capital costs to the McArthur River Joint Venture include sustaining costs for both McArthur River and Key Lake, as well as underground development at McArthur River to bring mineral reserves into production. Overall, the largest capital at McArthur River is mine development. Other significant capital includes freeze infrastructure costs.
Our expectations and plans regarding McArthur River/Key Lake, including forecasts of operating and capital costs, and mine life, are forward-looking information and are based specifically on the risks and assumptions discussed on pages 2 and 3. We may change operating or capital spending plans in 2016, depending upon uranium markets, our financial position, results of operation or other factors. Estimates of expected future production and capital and operating costs are inherently uncertain, particularly beyond one year, and may change materially over time.
Exploration, drilling, sampling, processing and estimates
There are no historical estimates within the meaning of NI 43-101 to report. The original McArthur River resource estimates were derived from surface diamond drilling from 1980 to 1992. In 1988 and 1989, this drilling first revealed significant uranium mineralization. By 1992, we had delineated the mineralization over a strike length of 1,700 metres at depths of between 530 to 640 metres. Data included assay results from 42 drillholes. The very high grade found in the drillholes justified the development of an underground exploration project in 1993.
Exploration
In total, exploration drilling of the McArthur River deposit to date consists of over 1,383 drillholes and 271,560 metres. Drilling has been carried out from both surface and underground in order to locate and delineate mineralization. Surface exploration drilling is initially used in areas where underground access is not available and is used to guide the underground exploration programs. The deposit consists of nine distinct mineralized areas and three under-explored surface defined mineralized showings over a potential strike length of 2,700 metres. Five of these have been well defined with underground drilling, namely Zones 1 to 4 and Zone 4 South. Five are based entirely on surface drilling, namely McA North (2-4), McA South (1), and Zone B. McA North (1) and Zone A have undergone some underground exploration drilling (results pending). Underground drilling is to continue on Zone B in 2016. Under-explored mineralized showings, as well as other mineralized occurrences, will be pursued if warranted.
Drilling
Surface drilling
We have carried out surface drilling since 2004, to test the extension of mineralization identified from the historical surface drillholes, to new targets along the strike, and to evaluate the P2 trend northeast and southwest of the mine. Surface drilling has delineated mineralization over a strike length of 1,700 metres, generally at between 500 metres to 640 metres below the surface. Surface drilling since 2004 has extended the potential strike length to 2,700 metres.
| 2015 ANNUAL INFORMATION FORM Page 27 | ||
As of December 31, 2015, we had drilled 258 surface drillholes (both conventional and directional drilling) for a total of approximately 171,400 metres along the P2 trend.
We have completed preliminary drill tests of the P2 trend at 200 metre intervals over 11.5 kilometres (4.3 kilometres northeast and 6.4 kilometres southwest of the McArthur River deposit) of the total 13.75 kilometres strike length of the P2 trend. Surface exploration drilling in 2015 focused on additional evaluation in the southern part of the P2 trend south of the P2 main mineralization. No further work is planned on the P2 trend in 2016.
Underground drilling
In 1993, regulators approved an underground exploration program, consisting of shaft sinking, lateral development and drilling. We completed the shaft in 1994.
We have drilled more than 1,126 underground drillholes since 1993, resulting in over 101,340 metres to get detailed information along 1,600 metres of the surface delineation. This data was used to estimate the mineral reserves and resources in five mineralized zones (Zones 1 to 4 and Zone 4 South). The drilling was primarily completed from the 530 and 640 metre levels. Data from hundreds of freezeholes and raisebore pilot holes support the estimate. Where there were no underground drillholes (Zone B and McA North (2) in the northeastern part of the deposit), we used surface exploration drillholes to estimate mineral resources.
Other data
In addition to the exploration drilling, geological data is also collected from the underground probe and grout, service, drain, freezeholes and geotechnical programs.
Recent activity
In 2013, we continued advancing the underground exploration drifts in the southwest and northeast directions and focused on developing Zone 4 and areas at the southwest end of the underground mine workings. The delineation drilling program on Zone A progressed through the year.
In 2014, we completed the planned development advance of the underground exploration drifts and underground delineation drilling.
In 2015, we continued the advancement of our underground exploration drifts in the southwest and northeast directions. The delineation drilling program on Zone A also progressed throughout the year.
In 2016, we plan to conduct additional underground drilling to further delineate Zone A and Zone B and identify additional mineral resources in the deposit.
Sampling, analysis and data verification
Surface samples
| • | GPS or mine site surveying instruments are used in the field to verify the location of surface drillholes. |
| • | Holes are generally drilled every 12 to 25 metres, on sections that are 50 to 200 metres apart. Drilled depths average 670 metres. |
| • | Vertical holes generally intersect mineralization at angles of 25 to 45 degrees, resulting in true widths being 40 to 70% of the drilled width. Angled holes usually intercept it perpendicularly, giving true width. |
| • | All holes are radiometrically probed, where possible. |
| • | A geologist examines the surface drillhole core in the field, determines its overall characteristics, including mineralization, logs the information, and takes samples that have noteworthy alteration, structures and radiometric anomalies. |
| • | Basement sampling procedures depend on the length of the interval sampled, and attempts are made to avoid having samples cross lithological boundaries. |
| • | All core with radioactivity greater than a set threshold is split and sampled for assay. |
| • | We measure the uranium grade by assaying core. Core recovery is generally considered excellent with some local exceptions. The quality and representativeness of the surface drillhole samples is adequate for estimating mineral resources and mine planning, but we often validate surface drillhole results against underground drilling results in the same vicinity. |
| 2015 ANNUAL INFORMATION FORM Page 28 | ||
Underground samples
| • | Holes are drilled in stations 30 metres apart. Each station is drilled with three fans of holes, covering 10 metres across the deposit. |
| • | Uranium grade is calculated from the adjusted radiometric probe readings. Radiometric probing is at 0.1 metre spacing in radioactive zones and 0.5 metre spacing in unmineralized zones. The drillhole fans give the gamma probes representative access across the entire deposit. |
| • | A small portion of the data we obtain is from assays, which we use to estimate mineral resources. It is collected to determine the U3O8 content past the probe limit of a hole, or to provide correlation samples to compare against a probed interval. In these cases, we log the core, photograph it, and then sample it for uranium analysis. We sample the entire interval instead of splitting the core. This provides very high-quality samples in these areas. |
| • | Core recovery in these areas can be excellent to poor. |
| • | The quality and representativeness of the underground drillhole samples is adequate for estimating mineral resources and mine planning. |
Analysis
We record the following for each sample:
• hole number, date and core logger name
• sample number
• from and to intervals and length
• recovered length | • core diameter
• rock type, alteration, and mineralization. |
We place each sample in a plastic bag and write its number on the bag. We place the bags in a metal or plastic shipping drum, which is scanned by the radiation department and shipped to the Saskatchewan Research Council Geoanalytical Laboraties (SRC) in Saskatoon for analysis. SRC is independent of the participants of the McArthur River Joint Venture.
SRC personnel:
| • | verify the sample information |
| • | sort the samples by radioactivity |
| • | dry, crush and grind them in secure facilities or in the main laboratory, if they have minimal radioactivity |
| • | dilute the samples and carry out a chemical analysis |
| • | prepare and analyse a quality control sample with each batch |
| • | analyse one of every 40 samples in duplicate. |
Quality control and data verification
A data and quality assurance coordinator on staff is responsible for reviewing the quality of geochemical data received from laboratory contractors. The coordinator reviews the analyses provided by the lab using the results of standard reference materials as a benchmark, and, together with project geologists, determines whether it is necessary to reassay.
We use several quality control measures and data verification procedures:
| • | enter surveyed drillhole collar coordinates and hole deviations in the database, display them in plan views and sections and visually compare them to their planned location |
| • | visually validate core logging information on plan views and sections, and verify it against photographs of the core or the core itself |
| • | compare downhole radiometric probing results with core radioactivity and drilling depth measurements |
| • | validate uranium grade based on radiometric probing with sample assay results, when available |
| • | compare the information in the database against the original data, including paper logs, deviation survey films, assay certificates and original probing data files. |
Quality assurance and quality control for underground drillhole information focuses on ensuring quality probing results. We do this by:
| • | using a software program to check for data errors such as overlapping intervals and out of range values |
| • | entering surveyed drillhole collar coordinates and downhole deviations into the database and visually validating and comparing to the planned location of the holes |
| • | checking the calibration of probes before using them and periodically duplicating probe runs |
| 2015 ANNUAL INFORMATION FORM Page 29 | ||
| • | comparing downhole radiometric probing results with radioactivity measurements made on the core and drilling depth measurements |
| • | validating uranium grades based on radiometric probing with sample assay results once available. |
Since 2000, we have regularly compared information collected from production activities, such as freezeholes, raisebore pilot holes, radiometric scanning of scoop tram buckets and mill feed sampling, to the drillhole data. Reconciling the uranium block model with mine production is a very good indicator that estimated grades in the block model accurately reflect the mined grades.
In 2014, we completed at Cigar Lake a thorough test program of the McArthur River radiometric probes to demonstrate that consistent count rates were being obtained between probes. A total of eight surface freezeholes were probed multiple times with each probe to compare count rates. This test demonstrated that probes with the same equipment configurations and GM tubes produced very consistent count rates. The reliability of the probe readings was last confirmed in January 2015 by comparison with the results of an independent non-Cameco test using a series of probes built by a different manufacturer.
Sample security
Samples include chain of custody documentation that accompanies the samples during transportation to the laboratory for analysis.
All samples collected from McArthur River are prepared and analysed under the close supervision of a qualified geoscientist at the SRC, which is a restricted access laboratory licensed by the CNSC.
We store and ship all samples in compliance with regulations. We consider it unlikely that samples are tampered with because of the high grade of the ore and the process used: the core is scanned immediately after it is received at a sample preparation laboratory and grade is estimated at that point.
Accuracy
We are satisfied with the quality of data obtained from surface exploration and underground drilling at McArthur River and consider it valid for estimating mineral resources and mineral reserves. Results of the quality control measures and data verification procedures are reflected by the fact that for the last five years, our estimation of tonnage, grade and pounds showed differences of 9%, 5% and 4% respectively compared to production.
Mineral reserve and resource estimates
Please see page 72 for our mineral reserve and resource estimates for McArthur River.
| 2015 ANNUAL INFORMATION FORM Page 30 | ||
Uranium – operating properties
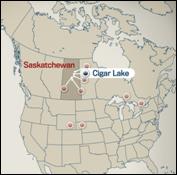 | Cigar Lake
Cigar Lake is the world’s highest grade uranium mine, with grades that are 100 times the world average. We are a 50% owner and the mine operator. Cigar Lake uranium is milled at AREVA’s McClean Lake mill.
Cigar Lake is one of our three material uranium properties. |
| Location | Saskatchewan, Canada | |
| Ownership | 50.025% | |
| End product | uranium concentrates | |
| ISO Certification | ISO 14001 certified | |
| Mine type | underground | |
Estimated mineral reserves (our share) | 110.9 million pounds (proven and probable) average grade U3O8– 16.70% | |
Estimated mineral resources (our share) | 1.6 million pounds (measured and indicated), average grade U3O8– 7.38% 51.6 million pounds (inferred), average grade U3O8– 16.43% | |
| Mining method | jet boring (JBS) | |
| Licensed capacity | mine: 18 million pounds per year mill: currently 13 million pounds per year; an application was submitted in 2016 to increase licensed capacity to 24 million pounds per year | |
| Total production December, 2013 to 2015 | 11.6 million pounds (100% basis) | |
2015 production (our share) | 5.7 million pounds | |
2016 forecast production (our share) | 8.0 million pounds1 | |
| Estimated mine life | 2028 (based on current mineral reserves) | |
| Estimated decommissioning cost (100% basis) | $49 million | |
| 1 | Our 2016 production plan is subject to regulatory approval for a production increase at the McClean Lake mill. |
Business structure
Cigar Lake is owned by a joint venture of four companies (CLJV):
| • | Cameco – 50.025% (operator) |
| • | AREVA – 37.100% |
| • | Idemitsu Canada Resources Ltd. – 7.875% |
| • | TEPCO Resources Inc. – 5.000% |
| 2015 ANNUAL INFORMATION FORM Page 31 | ||
History
| 1976 | • Canadian Kelvin Resources and Asamera Oil Corporation form an exploration joint venture, which includes the lands that the Cigar Lake mine is being built on | |
| 1977 | • Saskatchewan Mining Development Corporation (SMDC), one of our predecessor companies, acquires a 50% interest | |
| 1980 | • Waterbury Lake joint venture formed, includes lands now called Cigar Lake | |
| 1981 | • Deposit discovered by surface drilling – it was delineated by a surface drilling program between 1982 and 1986 | |
| 1985 | • Reorganization of the Waterbury Lake joint venture—Cigar Lake Mining Corporation becomes the operator of the Cigar Lake lands and a predecessor to AREVA becomes the operator of the remaining Waterbury Lands
• SMDC has a 50.75% interest | |
| 1987-1992 | • Test mining, including sinking shaft 1 to 500 metres and lateral development on 420 metre, 465 metre and 480 metre levels | |
| 1988 | • Eldorado Resources Limited merges with SMDC to form Cameco | |
| 1993-1997 | • Canadian and Saskatchewan governments authorize the project to proceed to regulatory licensing stage, based on recommendation of the joint federal-provincial panel after public hearings on the project’s environmental impact | |
| 2000 | • Jet boring mining system tested in waste and frozen ore | |
| 2001 | • Joint venture approves a feasibility study and detailed engineering begins in June | |
| 2002 | • Joint venture is reorganized, new joint venture agreement is signed, Rabbit Lake and JEB toll milling agreements are signed, and we replace Cigar Lake Mining Corporation as Cigar Lake mine operator | |
| 2004 | • Environmental assessment process is complete
• CNSC issues a construction licence | |
| 2005 | • Development begins in January | |
| 2006 | • Two water inflow incidents delay development:
• in April, shaft 2 floods
• in October, underground development areas flood
• In November, we begin work to remediate the underground development areas | |
| 2008 | • Remediation interrupted by another inflow in August, preventing the mine from being dewatered | |
| 2009 | • Remediation of shaft 2 completed in May
• We seal the 2008 inflow in October | |
| 2010 | • We finish dewatering the underground development areas in February, establish safe access to the 480 metre level, the main working level of the mine, and backfill the 465 metre level
• We substantially complete clean-up, inspection, assessment and securing of underground development and resume underground development in the south end of the mine | |
| 2011 | • We begin to freeze the ground around shaft 2 and restart freezing the orebody from underground and from the surface
• We resume the sinking of shaft 2 and early in 2012 achieve breakthrough to the 480 metre level, establishing a second means of egress for the mine
• We receive regulatory approval of our mine plan and begin work on our Seru Bay project
• Agreements are signed by the Cigar Lake and McClean Lake joint venture participants to mill all Cigar Lake ore at the McClean Lake mill and the Rabbit Lake toll milling agreement is terminated | |
| 2012 | • We achieve breakthrough to the 500 metre level in shaft 2
• We assemble the first jet boring system unit underground and move it to a production tunnel where we commence preliminary commissioning | |
| 2013 | • CNSC issues an eight-year operating licence
• We begin jet boring in ore
| |
| 2014 | • First Cigar Lake ore shipped to McClean Lake mill
• McClean Lake mill starts producing uranium concentrate from Cigar Lake ore | |
| 2015 ANNUAL INFORMATION FORM Page 32 | ||
| 2015 | • We declared commercial production in May |
Technical report
This project description is based on the project’s technical report:Cigar Lake Operation,Northern Saskatchewan, Canada, dated March 29, 2016 (effective December 31, 2015). The report was prepared for us in accordance withNI 43-101, by or under the supervision of C. Scott Bishop, P. Eng., Alain G. Mainville, P. Geo., and Leslie D. Yesnik, P. Eng. They are all qualified persons within the meaning of NI 43-101, but are not independent of us.
The conclusions, projections and estimates included in this description are subject to the qualifications, assumptions and exclusions set out in the technical report. We recommend you read the technical report in its entirety to fully understand the project. You can download a copy from SEDAR (sedar.com) or from EDGAR (sec.gov). | For information about uranium sales see pages 12 to 13, environmental matters seeSafety, Health and the Environment starting on page 81, and taxes see page 96.
For a description of royalties payable to the province of Saskatchewan on the sale of uranium extracted from orebodies within the province, see page 96.
For a description of risks that might affect access, title or the right or ability to perform work on the property, see Regulatory risks starting at page 106, Environmental risks starting at page 112, and Legal and other risks starting at page 114. | |
About the Cigar Lake property
We began developing the Cigar Lake underground mine in 2005, but development was delayed due to water inflows. In October 2014, the McClean Lake mill produced the first uranium concentrate from ore mined at the Cigar Lake operation. Commercial production was declared in May 2015.
Location
The Cigar Lake mine site is located near Waterbury Lake approximately 660 kilometres north of Saskatoon. The mine site is in close proximity to other uranium production operations: McClean Lake mill is 69 km northeast by road, Rabbit Lake mine/mill is 87 km east by road and McArthur River mine is 46 km southwest by air from the mine site.
Access
Access to the property is by an all-weather road and by air. Site activities occur year round, including supply deliveries. There is an unpaved airstrip and air terminal east of the mine site.
Saskatoon, a major population centre south of the Cigar Lake deposit, has highway and air links to the rest of North America.
Leases
Surface lease
The CLJV acquired the right to use and occupy the lands necessary to mine the deposit under a surface lease agreement with the province of Saskatchewan. The lease covers approximately 1,042 hectares and expires in May 2044.
We are required to report annually on the status of the environment, land development and progress on northern employment and business development.
Mineral lease
We have the right to mine the deposit under ML-5521, granted to the CLJV by the province of Saskatchewan. The lease covers 308 hectares and expires December 1, 2021. The CLJV has the right to renew the lease for further 10-year terms.
Mineral claims
A mineral claim gives us the right to explore for minerals and to apply for a mineral lease. There are 25 mineral claims (Nos. S-106540 to 106564), totaling 92,740 hectares, adjoining the mineral lease and surrounding the site. The mineral claims are in good standing until 2023.
| 2015 ANNUAL INFORMATION FORM Page 33 | ||
Environment, Social and Community Factors
The climate is typical of the continental sub-arctic region of northern Saskatchewan. Summers are short and cool even though daily temperatures can sometimes reach above 30°C. The mean daily temperature for the coldest month is below -20°C, and winter daily temperatures can reach below -40°C.
The deposit is 40 kilometres west of the eastern margin of the Athabasca Basin in northern Saskatchewan. The topography and environment are typical of the taiga forested lands in the Athabasca Basin. This area is covered with 30 to 50 metres of overburden. Vegetation is dominated by black spruce and jack pine. There is a lake known as “Cigar Lake” which, in part, overlays the deposit.
We are committed to building long-lasting and trusting relationships with the communities in which we operate. One of the ways we implement this commitment is through our Five Pillar CSR Strategy. For more information, see Sustainable development at page 80.
The closest inhabited site is Points North Landing, 50 km northeast by road. The community of Wollaston Lake is approximately 80 km by air to the east of the mine site.
Athabasca Basin community resident employees and contractors fly from various pickup points in smaller planes to the mine site. Other employees and contractors fly to site from Saskatoon with pickup points in Prince Albert and La Ronge.
Geological Setting
The deposit is at the unconformity contact separating late Paleoproterozoic to Mesoproterozoic sandstone of the Athabasca Group from middle Paleoproterozoic metasedimentary gneiss and plutonic rocks of the Wollaston Group. The Key Lake, McClean Lake and Collins Bay deposits all have a similar structural setting. While Cigar Lake shares many similarities with these deposits (general structural setting, mineralogy, geochemistry, host rock association and the age of the mineralization), it is distinguished from other similar deposits by its size, very high grade, and the high degree of clay alteration.
Cigar Lake’s geological setting is similar to McArthur River’s: the sandstone, which overlays the deposit and basement rocks, is water-bearing, with large volumes of water at significant pressure. Unlike McArthur River, however, the deposit is flat lying.
Mineralization
The Cigar Lake deposit has the shape of a flat- to cigar-shaped lens and is approximately 1,950 metres in length, 20 to 100 metres in width, and ranges up to 13.5 metres thick, with an average thickness of about 5.4 metres. It occurs at depths ranging between 410 to 450 metres below the surface. Phase 1, the eastern part of Cigar Lake, is approximately 670 metres long by 100 metres wide and Phase 2, the western part, is approximately 1,280 metres long by 75 metres wide.
The deposit has two distinct styles of mineralization:
| • | high-grade mineralization at the unconformity which includes all of the mineral resources and mineral reserves |
| • | fracture controlled, vein-like mineralization which is located either higher up in the sandstone or in the basement rock mass. |
Most of the uranium metal is in the high-grade mineralization at the unconformity, which has massive clays and high-grade uranium concentrations. This is currently the only economically viable style of mineralization, in the context of the selected mining method and ground conditions.
The unconformity mineralization consists primarily of three dominant rock and mineral facies occurring in varying proportions: quartz, clay (primarily chlorite with lesser illite) and metallic minerals (oxides, arsenides, sulphides). In the relatively higher grade Phase 1 area, the ore consists of approximately 50% clay matrix, 20% quartz and 30% metallic minerals, visually estimated by volume. In this area, the unconformity mineralization is overlain by a weakly mineralized contiguous clay cap one to 10 metres thick. In the relatively lower grade Phase 2 area, the proportions change to approximately 20% clay, 60% quartz and 20% metallic minerals.
Deposit Type
Cigar Lake is an unconformity-related uranium deposit. Deposits of this type are believed to have formed through an oxidation-reduction reaction at a contact where oxygenated fluids meet with reducing fluids.
| 2015 ANNUAL INFORMATION FORM Page 34 | ||
About the Cigar Lake operation
Cigar Lake is a developed producing property with sufficient surface rights to meet current mining operation needs.
Permits
Please see page 41 for more information about regulatory approvals for Cigar Lake.
Infrastructure
Surface facilities are 490 metres above sea level. The site includes:
• an underground mine with two shafts
• access road joining the provincial highway and McClean Lake
• site roads and site grading
• airport and terminal
• employee residence and construction camp
• Shaft No. 1 and No. 2 surface facilities
• freeze plants and brine distribution equipment
• surface freeze pads
• water supply, storage and distribution for industrial water, potable water and fire suppression
• propane, diesel and gasoline storage and distribution
• electrical power substation and distribution
| • compressed air supply and distribution
• mine water storage ponds and water treatment
• sewage collection and treatment
• surface and underground pumping system installation
• waste rock stockpiles
• garbage disposal landfill
• administration, maintenance and warehousing facilities
• underground tunnels
• ore load out facility
• concrete batch plant
• Seru Bay pipeline
• emergency power generating facilities.
|
The Cigar Lake mine site contains all the necessary services and facilities to operate a remote underground mine, including personnel accommodation, access to water, airport, site roads and other necessary buildings and infrastructure.
Water, power and heat
Waterbury Lake, which is nearby, provides water for the industrial activities and the camp. The site is connected to the provincial electricity grid, and it has standby generators in case there is an interruption in grid power.
Cigar Lake operates throughout the year despite cold winter conditions. During the winter, we use propane-fired burners to heat the fresh air necessary to ventilate the underground workings.
Employees
Employees are recruited with preference given to residents of northern Saskatchewan.
Mining methods
We use the JBS method to mine the Cigar Lake deposit.
| 2015 ANNUAL INFORMATION FORM Page 35 | ||
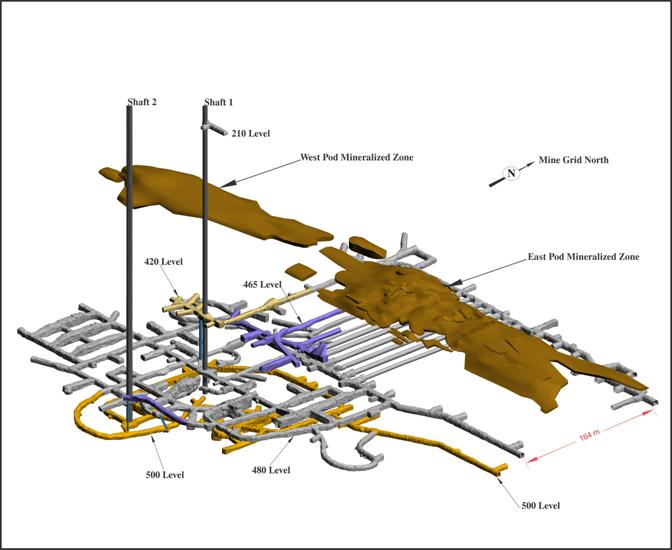
Orthogonal View of Underground Development and Mineralized Zones Looking Northwest
Bulk freezing
The sandstone that overlays the deposit and basement rocks is water-bearing, with large volumes of water under significant pressure. We freeze the ore zone and surrounding ground in the area to be mined to prevent water from entering the mine and to help stabilize weak rock formations. This system freezes the deposit and underlying basement rock in two to four years, depending on water content and geological conditions. To manage our risks and meet our production schedule, the area being mined must meet specific ground freezing requirements before we begin jet boring. Bulk freezing reduces but does not eliminate the risk of water inflows.
Prior to the mine inflow events in 2006, we had been pursuing a strategy of bulk freezing exclusively from underground. Following mine remediation and a surface freeze test program in 2010, we shifted to a hybrid freezing strategy combining freezing from both surface and underground. However, based on additional studies and experience gained with surface freezing since the 2010 test, we decided in 2015 to pursue a strategy of freezing exclusively from surface. The expected benefits of this strategy include:
| • | reduction in risk to mine development |
| • | allowing surface freeze to start before development of underground production tunnels |
| • | simplifies underground operations with ground freezing infrastructure and activities located on surface. |
| 2015 ANNUAL INFORMATION FORM Page 36 | ||
Artificial ground freezing is accomplished by drilling a systematic grid of boreholes through the orebody from surface. A network of supply and return pipes on surface convey a calcium chloride brine to and from each hole. The warm brine returning from each hole is chilled to a temperature of -30ºC at the surface freeze plant and recirculated.
Jet boring
After many years of test mining, we selected the jet boring mining system, a non-entry mining method, which we have developed and adapted specifically for this deposit. This method involves:
| • | drilling a pilot hole into the frozen orebody, inserting a high pressure water jet and cutting a 4.5 to 6 metre diameter cavity out of the frozen ore resulting in cylindrical void with a height corresponding to the thickness of the ore body up to 13.5 metres |
| • | collecting the ore and water mixture (slurry) from the cavity and pumping it to storage (sump storage), allowing it to settle |
| • | using a clamshell, transporting the ore from the sump storage to a grinding and processing circuit, eventually loading a tanker truck with ore slurry for transport to the mill |
| • | filling each cavity in the orebody with concrete once mining is complete |
| • | starting the process again with the next cavity. |
This is a non-entry method, which means mining is carried out from headings in the basement rock below the deposit, so employees are not exposed to the ore. This mining approach is highly effective at managing worker exposure to radiation levels. Combined with ground freezing and the cuttings collection and hydraulic conveyance system, jet boring reduces radiation exposure to acceptable levels that are below regulatory limits.
Ore shipment started in March 2014 and the McClean Lake mill started producing uranium concentrates from the ore in October 2014.
The mine equipment fleet is currently comprised of three JBS units plus other equipment to support mine development, drilling and other services, and is sufficient to meet the needs of the mine plan for the next few years. The current mine plan, with its underlying productivity assumptions, assumes that a fourth JBS unit is required later in the mine life. We are currently investigating if there are opportunities for productivity improvements that could negate the need for the fourth JBS unit.
As we ramp up production, there may be some technical challenges, which could affect our production plans including, but not limited to, variable or unanticipated ground conditions, ground movement and cave-ins, water inflows and variable dilution, recovery values, performance of the water treatment system, mining productivity and equipment reliability. There is a risk that the ramp up to full production may take longer than planned and that the full production rate may not be achieved on a sustained and consistent basis. We are confident we will be able to solve challenges that may arise, but failure to do so would have a significant impact on our business.
Mine development
Mine development for construction and operation uses two basic approaches: for good quality, competent rock mass, drill and blast with conventional ground support is applied. Most permanent areas of the mine which contain the majority of the installed equipment and infrastructure are hosted in competent rock mass and are excavated and supported conventionally. The production tunnels immediately below the orebody are primarily in poor, weak rock mass and are excavated and supported using the New Austrian Tunnelling Method (NATM). NATM was adopted as the primary method of developing new production cross-cuts, replacing the former Mine Development System (MDS).
NATM, as applied at Cigar Lake, involves a multi-stage sequential mechanical excavation, extensive external ground support and a specialized shotcrete liner. The liner system incorporates yielding elements which permit controlled deformation required to accommodate additive pressure from mining and ground freezing activities. The production tunnels have an inside diameter of five metres and are circular in profile.
Since 2010, when the mine was dewatered, significant spalling, cracking and deterioration of the tunnel segments was identified in all four crosscuts excavated with the former MDS tunnel boring technique. Steps were taken to halt the deterioration and the affected area was reinforced. Two geotechnical consultants were retained to provide advice on the need for any possible further tunnel reinforcement or change in excavation and ground support methodology. Based on their recommendations, we have retrofitted the 781 and 737 production tunnels using NATM techniques, which effectively extended
| 2015 ANNUAL INFORMATION FORM Page 37 | ||
their life to allow the safe recovery of the ore above them. The remaining two MDS crosscuts at Cigar Lake will be permanently decommissioned and backfilled in 2016. They were originally intended to be used for ground freezing and are no longer required.
We plan our mine development to take place away from known groundwater sources whenever possible. In addition, we assess all planned mine development for relative risk and apply extensive additional technical and operating controls for all higher risk development.
Mine access
There are two main levels in the mine: the 480 and 500 metre levels. Both levels are located in the basement rocks below the unconformity. Mining is conducted from the 480 metre level which is located approximately 40 metres below the ore zone. The main underground processing and infrastructure facilities are located on this level. The 500 metre level is accessed via a ramp from the 480 metre level. The 500 metre level provides for the main ventilation exhaust drift for the mine, the mine dewatering sump and additional processing facilities. All construction required for production has been completed.
Processing
Cigar Lake ore slurry is processed in two steps:
High density ore slurry – The ore slurry produced by the jet boring mining system is pumped to Cigar Lake’s underground crushing, grinding and thickening facility. The resulting finely ground, high density ore slurry is pumped to surface storage tanks, thickened and loaded into truck mounted containers like the ones used at McArthur River.
Processing – The containers of ore slurry are trucked to AREVA’s McClean Lake mill, 70 kilometres to the northeast for processing. SeeToll Milling Agreementbelow for a discussion of this arrangement.
Recovery and Metallurgical Testing
Extensive metallurgical test work was performed on core samples of Cigar Lake ore over a seven year period from 1992 to 1999. This work was used to design the McClean Lake mill circuits relevant to Cigar Lake ore and associated modifications. Samples used for metallurgical test work may not be representative of the deposit as a whole. Additional test work, completed in 2012 with drill core samples, verified that a high uranium recovery rate could be achieved regardless of the variability of the ore. Test work also concluded that more hydrogen gas evolution took place than previously anticipated, which resulted in modifications to the leaching circuit. Leaching modifications began in 2013 and were completed in 2014, with mill start-up in September 2014.
The 1992 – 1999 work was performed in France at AREVA’s (formerly Cogema) SEPA test centre. The results of this test work have provided the core process criteria for the design of the additions and modifications required at the McClean Lake mill for processing Cigar Lake ore. A range of ore grades, as high as 26% uranium, have been processed at the McClean Lake milling facility. Based on the test results and 2015 mill performance, an overall uranium recovery of 98.5% is expected. Anticipated losses are distributed as follows:
| • | leach residue loss: 0.5% – 0.8% |
| • | counter current decantation soluble loss: 0.3 – 0.5% |
| • | solvent extraction loss: 0.2 – 0.4%. |
There is a risk that elevated arsenic concentration in the mill feed may result in increased leaching circuit solution temperatures. Additional test work is planned for 2016 to confirm how the mill process will respond to periods with elevated arsenic in the mill feed.
Tailings
Cigar Lake site does not have a tailings management facility. The ore is processed at the McClean Lake mill. SeeToll Milling Agreementbelow for a discussion of the McClean Lake tailings management facility.
| 2015 ANNUAL INFORMATION FORM Page 38 | ||
Waste
The waste rock piles are separated into three categories:
| • | clean rock – will remain on the mine site for use as aggregate for roads, concrete backfill and future site reclamation |
| • | mineralized waste (>0.03% U3O8) – will be disposed of underground at the Cigar Lake mine |
| • | waste with acid-generating potential – temporarily stored on engineered lined pads. |
The latter two stockpiles are contained on lined pads; however, no significant mineralized waste has been identified in development to date.
Water discharged from the mine had historically been treated and released to Aline Creek. We began discharging treated water to Seru Bay in August 2013 following receipt of approval from the CNSC and the Saskatchewan Ministry of Environment (SMOE).
Production
Total packaged production from Cigar Lake was 11.3 million pounds U3O8 in 2015; our share was 5.7 million pounds. The operation exceeded our forecast of 10 million pounds (100% basis) as a result of higher productivity and our intention to adjust annual production as necessary, based on our operating experience during ramp up.
The mining plan is designed to extract all of the current mineral reserves. The following is a general summary of the production schedule guideline and parameters on a 100% basis:
| Total mill production | • 218.3 million pounds of U3O8, based on current mineral reserves and an overall milling recovery of 98.5% • Full annual production of 18 million pounds of U3O81 | |
| Total mine production | • 599 thousand tonnes of ore (excludes mineral reserves already mined) | |
| Average annual mine production | • 100 to 200 tonnes per day during peak production, depending on ore grade | |
| Average mill feed grade | • 16.7% U3O8 | |
| 1 | In 2016, AREVA submitted an application to increase the authorized annual production of the mill to 24 million pounds U3O8. |
Commercial production
Commercial production signals a transition in the accounting treatment for costs incurred at the mine. Cigar Lake met all of the criteria for commercial production, including cycle time and process specifications, in the second quarter of 2015. Therefore, effective May 1, 2015, we began charging all production costs, including depreciation, to inventory and subsequently recognizing them in cost of sales as the product is sold.
Production Increases
In order to accommodate processing all of Cigar Lake’s current mineral reserves and ramp up to the target production rate of 18 million pounds U3O8 per year, the McClean Lake mill requires expansion and a licence increase, which is currently set at 13 million pounds U3O8per year. Construction to expand the facility is currently underway and expected to be completed in 2016. AREVA has submitted an application to the CNSC to increase the mill’s licensed production capacity from 13 million pounds to 24 million pounds U3O8 per year.
During processing of Cigar Lake ore slurry at the McClean Lake mill, tailings are generated. The residue is treated in the McClean Lake mill tailings neutralization area. An upgraded tailings neutralization area is currently under construction and expected to be complete before the end of 2016.
Payback
Payback for us, including total capital invested, is estimated to be achieved in 2022, on an undiscounted pre-tax basis. All future capital expenditures are forecasted to be covered by operating cash flow.
| 2015 ANNUAL INFORMATION FORM Page 39 | ||
Reclamation and financial assurances
In 2002, ourpreliminary decommissioning plan for Cigar Lake was approved by the CNSC and the SMOE. We revised this plan and the accompanyingpreliminary decommissioning cost estimatewhen we renewed our federal licence in 2008. We revised this plan and the accompanyingpreliminary decommissioning cost estimateagain when we received our operating licence in 2013.
We, along with our joint venture participants have letters of credit posted as financial assurances with the government of Saskatchewan, to cover the amount in the 2013preliminary decommissioning cost estimate($49 million).
The reclamation and remediation activities associated with waste rock and tailings at the McClean Lake mill are covered by the plans and cost estimates for this facility.
Water inflow and mine rehabilitation
Cigar Lake water inflow incidents
From 2006 through 2008, the Cigar Lake project suffered several setbacks as a result of three water inflow incidents. The first occurred in April of 2006 resulting in the flooding of the then partially completed Shaft No. 2. The two subsequent incidents involved inflows in the mine workings connected to Shaft No. 1 and resulted in flooding of the mine workings completed to that point in time. We developed and successfully executed recovery and remediation plans for all three inflows. Through 2010 and 2011, we developed a comprehensive plan and successfully proceeded with remediation to restore the underground workings at Cigar Lake. Successful re-entry into the main mine workings was achieved in early 2010 and work to secure the mine was completed in 2011.
The mine is fully remediated, and entered commercial production in 2015. Lessons learned from the inflows have been applied to the subsequent mine plan and development in order to reduce the risk of future inflows and improve our ability to manage water inflows.
Increased pumping capacity
As of early 2012, we have increased the installed mine dewatering capacity to 2,500 cubic metres per hour. Mine water treatment capacity has been increased to 2,550 cubic metres per hour, and regulatory approval to discharge routine andnon-routine treated water to Seru Bay is in place. As a result, we believe we have sufficient pumping, water treatment and surface storage capacity to handle the estimated maximum inflow.
Current status of development
Construction of all major permanent underground development and process facilities required for the duration of the mine life is complete. A number of underground access drifts and production cross-cuts remain to be driven as part of ongoing mine development to sustain production rates.
On surface, construction of all permanent infrastructure required to achieve nameplate capacity has been completed. As mine production progresses, a significant expansion to the surface freeze plant capacity will be required. It is planned to be completed in 2018.
The McClean Lake mill is being expanded to process and package all Cigar Lake ore. Construction of the expanded facility began in 2013 and is expected to be completed in 2016. Mill operation will continue during the construction stages in order to meet the Cigar Lake production schedule.
Toll milling agreement
The McClean Lake joint venture has agreed to process Cigar Lake’s ore slurry at its McClean Lake mill, according to the terms in its agreement with the Cigar Lake joint venture:JEB toll milling agreement(effective January 1, 2002 and amended and restated effective November 30, 2011). The McClean Lake joint venture has agreed to dedicate at the McClean Lake mill the necessary mill capacity to process and package 18 million pounds of Cigar Lake uranium concentrate annually.
The Cigar Lake joint venture will pay a toll milling fee and its share of milling expenses.
| 2015 ANNUAL INFORMATION FORM Page 40 | ||
The McClean Lake mill started receiving Cigar Lake ore in March 2014 and produced its first drum of Cigar Lake yellowcake in October 2014. All of Cigar Lake’s ore slurry from current mineral reserves will be processed at the McClean Lake mill, operated by AREVA. The McClean Lake mill requires modification and expansion to process and package all of the Cigar Lake’s current mineral reserves. In 2014, the McClean Lake mill completed the first stage of mill upgrades. These initial modifications primarily focused on upgrades to the existing leach circuit and associated hydrogen mitigation systems to allow them to process high-grade ore.
In order to meet Cigar Lake’s ramp up schedule, the McClean Lake mill must be expanded. These upgrades include: a second solvent extraction circuit to accommodate the increased uranium pregnant aqueous flows; an expanded tailings neutralization circuit; an additional crystallization plant to handle the increased ammonium sulphate flow; and new diesel generators. Construction of the expanded facility is scheduled to be completed in 2016.
The McClean Lake joint venture commenced work in 2012 to optimize its tailings management facility to accommodate all of Cigar Lake’s current mineral reserves. Subject to a capped contribution of $4.6 million from the Cigar Lake joint venture, the McClean Lake joint venture is responsible for the cost to optimize its tailings management facility.
The McClean Lake joint venture is responsible for all costs of decommissioning the McClean Lake mill. As well, the joint venture is responsible for the liabilities associated with tailings produced from processing Cigar Lake ore at the McClean Lake mill.
Regulatory approvals
There are three key permits that are required to operate the mine.
Operating and processing licences
Federally, Cigar Lake holds a “Uranium Mine Licence” from the CNSC with a corresponding Licence Conditions Handbook (LCH). Provincially, Cigar Lake holds an “Approval to Operate Pollutant Control Facilities” from the SMOE and a “Water Rights Licence to Use Surface Water and Approval to Operate Works” from the Saskatchewan Watershed Authority.
The CNSC licence was issued for an eight-year term in June 2013 and expires on June 30, 2021. The SMOE approval was renewed in 2012 and expires on December 31, 2017. The Saskatchewan Watershed Authority water rights licence was obtained in 1988 and was last amended in July 2011. It is valid for an undefined term.
The current Cigar Lake LCH authorizes an annual production rate up to 18 million pounds per year. In 2016, AREVA submitted an application to increase authorized annual production of the McClean Lake mill to 24 million pounds per year.
Water treatment/effluent discharge system
The mine dewatering system was designed and constructed to handle both routine and non-routine water treatment and effluent discharge, and it has been approved and licensed by the CNSC and the SMOE.
We began discharging treated water to Seru Bay in August 2013 following the receipt of regulatory approvals.
We continue to optimize our mine water treatment process and system to attain the effluent concentrations that form part of the licensing basis, including detailed technical work as required.
Operating and capital costs
The following is a summary of the Cigar Lake operating and capital cost estimates for the remaining life of mine, stated in constant 2016 dollars and reflecting a forecast life-of-mine mill production of 218.3 million pounds:
Operating Costs ($Cdn million) | Total (2016 – 2028) | |||
Cigar Lake Mining | ||||
Site administration | $ | 650.00 | ||
Mining costs | 1,185.90 | |||
Process | 209.10 | |||
Corporate overhead | 134.00 | |||
|
| |||
Total mining costs | $ | 2,179.00 | ||
|
| |||
| 2015 ANNUAL INFORMATION FORM Page 41 | ||
McClean Lake Milling | ||||
Administration | $ | 507.60 | ||
Milling costs | 1,064.60 | |||
Corporate overhead | 62.60 | |||
Toll milling | 279.50 | |||
|
| |||
Total milling costs | $ | 1,914.30 | ||
|
| |||
Total operating costs | $ | 4,093.30 | ||
|
| |||
Total operating cost per pound U3O8 | $ | 18.75 | ||
|
|
Note: presented as total cost to the CLJV (100% basis)
Operating costs consist of annual expenditures at Cigar Lake to mine the ore, treat the ore underground, including crushing, grinding and density control, followed by pumping the resulting slurry to surface for transportation to McClean Lake.
Operating costs at McClean Lake consist of the cost of offloading and leaching the Cigar Lake ore slurry into uranium solution and further processing into calcined U3O8 product.
Capital Costs ($Cdn million) | Total (2016 – 2028) | |||
Cigar Lake Mine Development | $ | 438.50 | ||
Cigar Lake Mine Capital | ||||
Sustaining capital | $ | 181.50 | ||
Capacity replacement capital | 287.10 | |||
Growth capital | 15.00 | |||
Reclamation | 1.70 | |||
|
| |||
Total mine capital | $ | 923.80 | ||
|
| |||
McClean Lake mill modifications | $ | 105.60 | ||
McClean Lake mill sustaining capital | 208.70 | |||
|
| |||
Total mill capital | $ | 314.30 | ||
|
| |||
Total capital costs | $ | 1,238.10 | ||
|
| |||
Note: presented as total cost to the CLJV (100% basis)
Estimated capital costs to the CLJV include sustaining capital for Cigar Lake and McClean Lake mill, as well as underground development at Cigar Lake to bring mineral reserves into production. Overall, the largest capital cost at Cigar Lake is surface freeze drilling and brine distribution infrastructure. Other significant capital includes tunnel outfitting and mine development costs.
Our expectations and plans regarding Cigar Lake, including forecasts of operating and capital costs, mine life and payback are forward-looking information, and are based specifically on the risks and assumptions discussed on pages 2 and 3. We may change operating or capital spending plans in 2016, depending on uranium markets, our financial position, results of operation and other factors. Estimates of expected future production and capital and operating costs are inherently uncertain, particularly beyond one year, and may change materially over time.
Exploration, drilling, sampling, processing and estimates
There are no historical estimates within the meaning of NI 43-101 to report. The Cigar Lake uranium deposit was discovered in 1981 by surface exploration drilling.
We focus most of our exploration activities on mineral lease ML-5521. AREVA is responsible for exploration activity on the 25 surrounding mineral claims. The data from the exploration program on the 25 mineral claims is not part of the database used for the estimate of the mineral resources and mineral reserves at Cigar Lake.
| 2015 ANNUAL INFORMATION FORM Page 42 | ||
Exploration
After the 2006 water inflow events, it was recognized that more detailed geophysical information in the immediate deposit area was required. Since 2006, a number of geophysical surveys over the Cigar Lake deposit provided additional knowledge on geological structures and fault zones. In the fall of 2007, a supplementary geophysical program was conducted over a portion of the Phase 1 area of the deposit to identify major structures within the sandstone column. This has allowed for better mine planning and mitigation of potential risk.
Drilling
Surface drilling – mineral lease
The last diamond drillhole of the 1981 program was located south of the Cigar lake and was the discovery hole for the Cigar Lake uranium deposit. The deposit was subsequently delineated by surface drilling during the period 1982 to 1986, and followed by several small campaigns of drilling for geotechnical and infill holes to 2007. Additional diamond drilling campaigns over Phase 1 and Phase 2 were conducted by us between 2007 and 2012, which targeted a broad range of technical objectives, including geotechnical, geophysical, delineation and ground freezing. Since 2012, diamond drilling managed by us has mainly focused on surface ground freezing programs at Phase 1.
Average drill depths for surface delineation holes range from approximately 460 m to 500 m, with the majority of surface freeze holes drilled to a depth of approximately 462 m. Delineation drilling in the Phase 1 area has been done at a nominal drillhole fence spacing of 25 to 50 m (east-west), with holes at 20 to 25 m (north-south) spacing on the fences. However, the central portion of the Phase 1 deposit has had surface freezeholes installed at a nominal 6 x 6 m pattern.
The Phase 2 area was historically drilled at a nominal drillhole fence spacing of 200 m, with holes at 20 m spacing on the fences. An additional 32 infill drillholes were completed in 2011 and 2012 by Cameco for select areas of Phase 2, locally reducing the drillhole spacing down to an approximate 15 x 15 m pattern.
In 2015, a surface geotechnical drill program was conducted by us over the western portion of the Phase 1 deposit. Down-hole cross-well seismic was conducted within these boreholes in an attempt to image major fault structures and geotechnical characteristics of this portion of the deposit. The majority of exploration and delineation drilling completed by us on the surface of the mineral lease consists of wireline diamond drilling recovering NQ size (47.6 millimetres) drill core. All surface freezehole core is of PQ size (85.0 millimetres).
Drilling results have been used to delineate and interpret the 3-dimensional geometry of the mineralized areas, thelitho-structural settings, the geotechnical conditions, and to estimate the distribution and content of uranium and other elements within the Phase 1 mineral resource and reserve and Phase 2 mineral resource.
In 2016, we plan to continue the surface freezehole drilling program and have initiated a surface delineation drilling program over the Phase 2 deposit.
Surface drilling – mineral claims
In 2006, drilling discovered the Cigar East zone that is located outside ML-5521, approximately 650 metres east of Phase 1 mineralization. Further exploration has been conducted in this area since 2006 and has delineated a zone of unconformity style uranium mineralization approximately 210 metres in length and 30 metres in width. No mineral resource has been reported for the Cigar East zone.
Underground drilling – mineral lease
Diamond drilling from underground is primarily to ascertain rock mass characteristics in advance of development and mining. Cigar Lake Mining Corporation, the previous operator, and Cameco have conducted underground geotechnical drilling since 1989 at Cigar Lake, with the exception of the period from 2007 to 2009 during which time the mine was flooded. For 2016, no underground development is scheduled.
Freezeholes were drilled from underground into the deposit for the purposes of freezing the ground prior to mining. A total of 83 holes at a spacing of 1.0 to 1.5 m were drilled in two periods of drilling in 1991 and again in 1999. Generally, these upward holes were rotary drilled holes from which no core was recovered; however, in a limited number of cases, core was recovered and sampled. Freezehole drilling started up again in late 2004 with the start of the construction phase of development. During this phase, over 300 freeze and temperature monitoring holes were drilled. The latter freezeholes were all drilled by percussion methods so no core was available for assays. No underground freezeholes have been drilled since 2006. None of
| 2015 ANNUAL INFORMATION FORM Page 43 | ||
the underground freezeholes are currently used for freezing purpose and for mineral resource and reserve estimation.
Sampling, analysis and data verification
Sampling
Vertical surface drilling generally represented the true thickness of the zone since the mineralization is flat. All holes were core drilled and gamma probed whenever possible. Cigar Lake uses a high-flux gamma probe designed and constructed by alphaNUCLEAR (aN), a member of the Cameco group of companies. This high-flux gamma probe utilizes two Geiger Müller tubes to detect the amount of gamma radiation emanating from the surroundings. The count rate obtained from the high-flux probe is compared against chemical assay results to establish a correlation to convert corrected probe count rates into equivalent %U3O8 grades. The consistency between probe data and chemical assays demonstrates that secular equilibrium exists within the deposit.
To validate the core depth, the down-hole gamma survey results were compared to hand-held scintillometer surveys on core. Down-hole gamma surveys and hand-held scintillometer surveys guided sampling of drill core for assay purposes. In the early stages of exploration drilling, sampling intervals were of various lengths, up to 50 centimetres, based on geological differences in the character of the mineralization. Starting in 1983, sampling intervals were fixed at a standard interval of 50 centimetres. All sample results have since been composited to the standard interval of 50 centimetres for mineral resources estimation purpose. On each of the upper and lower contacts of the mineralized zone, at least one additional 50 centimetres sample was taken to ensure that the zone was fully sampled at the 0.10% U3O8 cut-off .Starting in 1983, all drilling and sample procedures were standardized and documented. This gives us a high degree of confidence in the accuracy and reliability of results of all phases of the work.
When sampled, the entire core from each sample interval was taken for assay, except for some of the earliest sampling in 1981 and 1982. This reduced the sample bias inherent when splitting core. Core recovery throughout the deposit has generally been very good. However, in areas of poor core recovery uranium grade determination is based on radiometric probe results.
The typical sample collection process at our operations included the following procedures:
| • | marking the sample intervals on the core boxes, at the nominal 50 cm sample length, by a geologist |
| • | collection of the samples in plastic bags, taking the entire core |
| • | documentation of the sample location, including assigning a sample number, and description of the sample, including radiometric values from a hand-held device |
| • | bagging and sealing, with sample tags inside bags and sample numbers on the bags |
| • | placement of samples in steel drums for shipping. |
Analysis
Since 2002, sample preparation has been done at SRC, which is independent of the participants of CLJV. It involves jaw crushing to 60% @-2 mm and splitting out a 100 – 200 g sub-sample using a riffle splitter. The sub-sample is pulverized to 90% @ -106 microns using a puck and ring grinding mill. The pulp is then transferred to a labelled plastic snap top vial. Assaying by SRC involved digesting an aliquot of pulp in a 100 ml volumetric flask in concentrated 3:1 HCI:HNO3, on a hot plate for approximately one hour. The lost volume is then made up using deionized water prior to analysis by ICP-OES. Instruments used in the analysis are calibrated using certified commercial solutions.
Quality control and data verification
The quality assurance and quality control procedures used during the early drilling programs were typical for the time. The majority of uranium assays in the database were obtained from Loring Laboratories Ltd., which is independent of the participants of CLJV. For uranium assays up to 5% U3O8, 12 standards and two blanks were run with each batch of samples and for uranium assays over 5% U3O8, a minimum of four standards were run with each batch of samples.
More recent sample preparation and assaying is being completed under the close supervision of a qualified geoscientist at SRC and includes preparing and analysing standards, duplicates and blanks. A standard is prepared and analysed for each batch of samples and one out of every 40 samples is analysed in duplicate.
| 2015 ANNUAL INFORMATION FORM Page 44 | ||
The original database, which forms part of the database used for the current mineral resource and mineral reserve estimates, was compiled by previous operators. Many of the original signed assay certificates are available and have been reviewed by Cameco geologists.
In 2013, Cigar Lake implemented an SQL server based centralized geological data management system to manage all drillhole and sample related data. All core logging, sample collection, downhole probing and sample dispatching activities are carried out and managed within this system. All assay and geochemical analytical results obtained from the external laboratory are uploaded directly into the centralized database, thereby mitigating potential for manual data transfer errors.
Additional data quality control measures taken include:
| • | entering surveyed drillhole collar coordinates and downhole deviations into the database and visually validating and comparing to the planned location of the holes |
| • | random survey spot checks of drillhole collar locations, which were reviewed in detail if differences were encountered(non-material collar location discrepancies were identified late in the May 2012 Phase 2 mineral resource estimate process, and will be addressed in the next Phase 2 mineral resource estimate update) |
| • | using a software program to check for data errors such as overlapping intervals and out of range values |
| • | comparing downhole radiometric probing results with radioactivity measurements made on the core and drilling depth measurements |
| • | validating uranium grades based on radiometric probing with sample assay results once available. |
In 2014, we completed a thorough test program of our high-flux probes to demonstrate that consistent count rates were being obtained between probes. A total of eight surface freezeholes were probed multiple times with each probe to compare count rates. This test demonstrated that probes with the same equipment configurations and GM tubes produced very consistent count rates. The reliability the probe readings was last confirmed in January 2015 by comparison with the results of an independent non-Cameco test using a series of probes built by a different manufacturer. For drillholes completed prior to 2011, the reliance on down-hole radiometric probing for determination of uranium grades for mineral resource estimation is minimal. Boreholes completed prior to 2011 were consistently sampled to obtain U3O8 chemical assays when uranium mineralization was encountered.
We are satisfied with the quality of data obtained from the exploration and freezehole drilling programs and consider it valid for estimating mineral resources and mineral reserves. Results of the quality control measures and data verification procedures are reflected by the fact that since 2014, the mineral reserves estimate is within 7% on tonnage, 5% on grade and 2% on uranium content of the mill feed and inventories.
Sample security
Current sampling protocols dictate that all samples are collected and prepared under the close supervision of a qualified geoscientist in a restricted core processing facility. The core samples are collected and transferred from the core boxes to high-strength plastic sample bags, then sealed. The sealed bags are then placed in steel drums and shipped under the Transport of Dangerous Goods regulations through the Cameco warehouse facilities directly to the laboratory.
We are satisfied with all aspects of sample preparation and assaying. The sampling records are meticulously documented and samples are whole core assayed to reduce bias. The assaying was done to a high standard and the QA/QC procedures employed by the laboratories are adequate.
We are not aware of the historic security measures in place at the time of the deposit delineation – 1981 to 1986. Sample security is largely defined by regulation and, since 1987, all samples have been stored and shipped in compliance with regulations. We believe that sample security was and is maintained throughout the process. There has been no indication of significant inconsistencies in the data used for the latest update of the mineral reserve and resource estimates.
Exploration, development and production
In 2016, we expect to produce 16.0 million packaged pounds at Cigar Lake; our share is 8.0 million pounds. In 2016, we also expect to:
| • | extend the current surface freeze pad and advance planning for freeze plant infrastructure expansion to support future production |
| 2015 ANNUAL INFORMATION FORM Page 45 | ||
| • | advance underground development according to the new mine plan and backfill drifts no longer required for underground freezing operations |
| • | continue ramping up towards the planned full annual production rate of 18 million pounds (100% basis) in 2017. |
We are conducting delineation drilling from surface to confirm and upgrade resources contained in the Phase 2 area. Approximately 65,000 metres of diamond drilling is planned over a three-year period, starting in 2016, in order to complete a detailed geological and geotechnical interpretation, a resource estimate, and a technical study for the western portion of the deposit.
In 2017, we expect to reach full annual production of 18 million pounds (100% basis, 9 million pounds our share). The McClean Lake mill’s operating licence currently has an annual production limit of 13 million pounds. AREVA has submitted an application to the CNSC to increase the mill’s licensed annual production limit; our 2016 and 2017 production outlook for Cigar Lake is therefore subject to AREVA securing the regulatory approvals necessary to increase mill production. As the collective agreement at McClean Lake mill expires in 2016, our production outlook also assumes there is no labour dispute with the union.
Mineral reserve and resource estimates
Please see page 72 for our mineral reserve and resource estimates for Cigar Lake.
| 2015 ANNUAL INFORMATION FORM Page 46 | ||
Uranium – operating properties
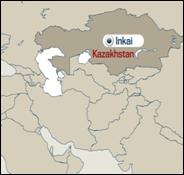 | Inkai
Inkai is a very significant uranium deposit, located in Kazakhstan. There are two production areas (blocks 1 and 2) and an exploration area (block 3). The operator is Joint Venture Inkai Limited Liability Partnership, which we jointly own (60%) with Kazatomprom (40%).
Inkai is one of our three material uranium properties. |
| Location | South Kazakhstan | |
| Ownership | 60% | |
| End product | uranium concentrates | |
| Certifications | BSI OHSAS 18001 ISO 14001 certified | |
Estimated mineral reserves (our share)1 | 43.1 million pounds (proven and probable) average grade U3O8 – 0.07% | |
Estimated mineral resources (our share) 2 | 30.3 million pounds (indicated) average grade U3O8– 0.08% 144.3 million pounds (inferred) average grade U3O8 – 0.05% | |
| Mining method | in situ recovery (ISR) | |
| Licensed capacity | 5.2 million pounds per year (our share 3.0 million pounds per year) | |
| Total production 2009 to 2015 | 31.8 million pounds (100% basis) | |
2015 production (our share) | 3.4 million pounds | |
2016 forecast production (our share) | 3.0 million pounds | |
| Estimated mine life | 2030 (based on current licence term) | |
Estimated decommissioning cost (100% basis) | $9 million (US) | |
| 1 | Our share of uranium in the mineral reserves is based on our interest in planned production (57.5%) assuming an annual production rate of 5.2 million pounds, which differs from our ownership interest (60%). |
| 2 | Our share of uranium in the mineral resources is based on our interest in potential production (57.5%), which differs from our ownership interest (60%). Mineral resources that are not mineral reserves have no demonstrated economic viability. |
| 2015 ANNUAL INFORMATION FORM Page 47 | ||
Business structure
Inkai is a Kazakhstan limited liability partnership between two companies:
| • | Cameco – 60% |
| • | JSC NAC KazAtomProm (Kazatomprom) – 40% (a Kazakhstan Joint Stock Company owned by the Republic of Kazakhstan) |
History
| 1976-78 | • Deposit is discovered
• Exploration drilling continues until 1996 | |
| 1979 | • Regional and local hydrogeology studies begin
• Borehole tests characterize the four aquifers within the Inkai deposit (Uvanas, Zhalpak, Inkuduk and Mynkuduk) | |
| 1988 | • Pilot test in the northeast area of block 1 begins, lasts 495 days and recovers 92,900 pounds of uranium | |
| 1993 | • First Kazakhstan estimates of uranium reserves for block 1 | |
| 1996 | • First Kazakhstan estimates of uranium reserves for block 2
• Kazakhstan regulators registers Inkai, a joint venture among us, Uranerzbergbau-GmbH and KATEP | |
| 1997-1998 | • Kazatomprom is established
• KATEP transfers all of its interest in the Inkai joint venture to Kazatomprom | |
| 1998 | • We acquire all of Uranerzbergbau-GmbH’s interest in the Inkai joint venture, increasing our interest to 66 2/3%
• We agree to transfer a 6 2/3% interest to Kazatomprom, reducing our holdings to a 60% interest | |
| 1999 | • Inkai receives a mining licence for block 1 and an exploration licence for blocks 2 and 3 from the government of Kazakhstan | |
| 2000 | • Inkai and the government of Kazakhstan sign a subsoil use contract (called theresource use contract), which covers the licences issued in 1999 (see above) | |
| 2002 | • Test mining operations at block 2 begins | |
| 2005 | • Construction of ISR commercial processing facility at block 1 begins | |
| 2006 | • Complete test mine expansion at block 2 | |
| 2007 | • Sign Amendment No.1 to the resource use contract, extending the exploration period at blocks 2 and 3 | |
| 2008 | • Commission front half of the main processing plant in the fourth quarter, and begin processing solution from block 1 | |
| 2009 | • Sign Amendment No. 2 to the resource use contract, which approves the mining licence at block 2, extends the exploration licence for block 3 to July 13, 2010, and requires Inkai to adopt the new tax code and meet the Kazakhstan content thresholds for human resources, goods, works and services
• Commission the main processing plant, and started commissioning the first satellite plant | |
| 2010 | • Receive regulatory approval for commissioning of the main processing plant
• File a notice of potential commercial discovery at block 3
• Receive approval in principle for the extension of the block 3 exploration licence for a five-year appraisal period that expires July 2015, and an increase in annual production from blocks 1 and 2 to 3.9 million pounds (100% basis) | |
| 2011 | • Receive regulatory approval for commissioning of the first satellite plant
• Sign Amendment No. 3 to the resource use contract, which extends the exploration licence for block 3 to July 2015 and provides government approval to increase annual production from blocks 1 and 2 to 3.9 million pounds (100% basis)
• Sign a memorandum of agreement with Kazatomprom to increase annual production from blocks 1 and 2 from 3.9 million pounds to 5.2 million pounds (100% basis) | |
| 2012 | • Sign a memorandum of agreement with Kazatomprom setting the framework to increase annual production from blocks 1 and 2 to 10.4 million pounds (100% basis), to extend the term of Inkai’s resource use contract through 2045 and to cooperate on the development of uranium conversion capacity, with the primary focus on uranium refining rather than uranium conversion. For more information on this agreement see page 53. | |
| 2013 | • Sign Amendment No. 4 to the resource use contract, which provides government approval to increase annual production from blocks 1 and 2 to 5.2 million pounds (100% basis) | |
| 2015 ANNUAL INFORMATION FORM Page 48 | ||
Technical report
This project description is based on the project’s technical report:Inkai Operation,South Kazakhstan Oblast, Republic of Kazakhstan, dated March 31, 2010 (effective December 31, 2009) except for some updates that reflect developments since the technical report was published. The report was prepared for us in accordance with NI 43-101, by or under the supervision of Charles J. Foldenauer, P. Eng. and Alain G. Mainville, P. Geo., twoqualified persons within the meaning of NI 43-101. The following description has been prepared under the supervision of Alain G. Mainville, P. Geo., Darryl Clark, P. Geo., Bryan Soliz, P. Geo., and Lawrence Reimann, P. Eng. They are allqualified persons within the meaning of NI 43-101, but are not independent of us.
The conclusions, projections and estimates included in this description are subject to the qualifications, assumptions and exclusions set out in the technical report, except as such qualifications, assumptions and exclusions may be modified in this AIF. We recommend you read the technical report in its entirety to fully understand the project. You can download a copy from SEDAR (sedar.com) or from EDGAR (sec.gov). | For information about environmental matters, seeSafety, Health and theEnvironment starting on page 81.
For a description of royalties payable to the government of Kazakhstan on the sale of uranium extracted from orebodies within the country and taxes, see pages 96 and 97.
For a description of risks that might affect access, title or the right or ability to perform work on the property, see Political risks starting at page 104, Regulatory risks starting at page 106, Environmental risks starting at page 112, and Legal and other risks starting at page 114. |
About the Inkai property
Location
The Inkai mine is located in the Suzak District of South Kazakhstan Oblast, Kazakhstan near the town of Taikonur, 370 kilometres north of the city of Shymkent and 125 kilometres east of the city of Kyzyl-Orda.
Access
The road to Taikonur is the primary road for transporting people, supplies and uranium product to and from the mine. It is a paved and gravel road that crosses the Karatau Mountains. Railroad transportation is available from Almaty to Shymkent, then northwest to Shieli, Kyzyl-Orda and beyond. A rail line also runs from the town of Taraz to a Kazatomprom facility to the south of Taikonur.
Licences
Inkai holds the rights to three contiguous licence blocks, blocks 1, 2 and 3, based on the licences it has received and itsresource use contract with the Kazakhstan government. Inkai has to meet certain obligations to maintain these rights. See page 53 for more information.
Environment, Social and Community Factors
Inkai lies in the Betpak Dala Desert, which has an arid climate, minimal precipitation and relatively high evaporation. The average precipitation varies from 130 to 140 millimetres per year, and 22 to 40% of this is snow. The surface elevation within the Inkai property boundary ranges from 130 to 250 metres above mean sea level.
The area also has typically strong winds. The prevailing winds are northeast. Dust storms are not uncommon. The major water systems in the area include the Shu, Sarysu and Boktykaryn rivers.
The resource use contract prescribes that a certain level of employees be Kazakh. See Resource use contract on page 53 for more information.
Inkai must give preference to local producers, as long as the goods, works and services comply with the requirements of the respective project documentation and Kazakhstan law. See Kazakhstan government and legislation – local content – on page 55 for more information.
We are committed to building long-lasting and trusting relationships with the communities in which we operate. One of the ways we implement this commitment is through our Five Pillar CSR Strategy. For more information, see Sustainable development at page 80.
| 2015 ANNUAL INFORMATION FORM Page 49 | ||
Geological Setting
The geology of south-central Kazakhstan is comprised of a large relatively flat basin of Cretaceous to Neogene age continental clastic sedimentary rocks. The Cretaceous-Cainozoic Chu-Sarysu basin extends for more than 1,000 kilometres from the foothills of the Tien Shan Mountains on the south and southeast sides, and merges into the flats of the Aral Sea depression to the northwest. The basin is up to 250 kilometres wide, bordered by the Greater Karatau Mountains on the southwest and the Chu-Ili uplift and Central Kazakhstan uplands on the northeast. It is composed of gently dipping to nearly flat lying fluvial-derived unconsolidated sediments composed of inter-bedded sand, silt, and local clay horizons.
The Inkai deposit is hosted within the Inkuduk and Mynkuduk formations, which are made up of feldspathic sandstones orsub-arkoses, typically containing 50 to 60% quartz, 10 to 15% feldspar, and 5 to 10% clay. The redox boundary can be readily recognised in core by a distinct colour change from gray on the reduced side to yellowish stains on the oxidized side, stemming from the oxidation of pyrite to limonite. In cross-section, the redox boundary is often “C” shaped forming the classic “roll-front”. The sands have a high horizontal permeability.
Mineralization
Seven mineralized zones have been identified on blocks 1 and 2, including three zones in the Mynkuduk horizon and four zones in the Inkuduk horizon.
Mineralization includes sooty pitchblende (85%) and coffinite (15%). The pitchblende occurs as micron-sized globules and spherical aggregates. The coffinite occurs as small crystals. Both uranium minerals are commonly associated with pyrite, and occur in pores on interstitial materials like clay minerals, as films around and in cracks within sand grains, and as pseudomorphic replacements of rare organic matter.
Most of the mineralization in block 1 is in the Mynkuduk horizon, of Turonian age, which unconformably overlays Permian argillites. Made up of fine to medium sands with occasional layers of clay or silt, this horizon is at a depth of 500 metres. The surface projection of the Mynkuduk horizon has an overall length of about 31 kilometres at an average width of 160 metres. The lower part of the Inkuduk horizon, which sits above the Mynkuduk horizon, is also locally mineralized.
In block 2, mineralization is mainly in the middle and lower Inkuduk horizons, between 350 and 420 metres below the surface. For the Inkuduk horizons, the overall length is about 66 kilometres at an average width of 160 metres.
Block 3 update
Exploration work on the northern flank (block 3) of the Inkai deposit has identified extensive mineralization hosted by several horizons in the lower and middle parts of the Upper Cretaceous stratigraphic level and traced along 25 kilometres from block 2 of the Inkai deposit in the southwest through to the Mynkuduk deposit in the northeast. This discovery requires further assessment of its commercial viability. In February 2010, Inkai filed a notice of the discovery with regulators.
In April 2011, Inkai received government approval to amend the block 3 licence to provide for a five-year appraisal period, which expired July 2015, to carry out delineation drilling, uranium resource estimation, construction and operation of a test leach facility and to complete a feasibility study. In June 2011, Inkai paid a $2.7 million (US) commercial discovery bonus to the state. In 2011, Inkai continued delineation drilling, began infrastructure development and completed engineering for a test leach facility for the block 3 assessment program.
In April 2012, Inkai received regulatory approval for the detailed block 3 delineation and test leach work programs. In 2012, Inkai continued delineation drilling, started technological drilling at test wellfields and started construction of the test leach facility. In 2013, Inkai completed exploration drilling, continued construction of the test leach facility and test wellfields, and started work on an appraisal of mineral potential according to Kazakhstan standards.
In 2014, Inkai continued construction of the test leach facility and test wellfields, and advanced work on a preliminary appraisal of the mineral potential according to Kazakhstan standards. Inkai also paid a $3.2 million (US) commercial discovery bonus to the state in 2014.
In 2015, Inkai completed construction of the test leach facility and began pilot production from test wellfields, as well as advancing work on a preliminary appraisal of the mineral potential of block 3 according to Kazakhstan standards.
In 2016, Inkai expects to continue with pilot production from the test leach facility and continue working on a final appraisal of the mineral potential according to Kazakhstan standards.
| 2015 ANNUAL INFORMATION FORM Page 50 | ||
Our application for an extension of the block 3 evaluation period is still pending final approval from the Ministry of Energy of the Republic of Kazakhstan.
Deposit type
The Inkai uranium deposit is a roll-front type deposit. Roll-front deposits are a common example of stratiform deposits that form within permeable sandstones in localized reduced environments. The Cretaceous-Cenozoic sediments host several stacked and relatively continuous, sinuous “roll-fronts”, or oxidation-reduction (redox) fronts hosted in the more porous and permeable sand and silt units. Microcrystalline uraninite, coffinite and pyrite are deposited during diagenesis by ground water in a crescent-shaped lens that cut across bedding and form at the interface between oxidized and reduced ground. Sandstone host rocks are medium to coarse grained; highly permeable at time of mineralization, subsequently restricted by cementation and alteration. There are several uranium deposits and active ISR uranium mines at these regional oxidation roll-fronts, developed along a regional system of superimposed mineralization fronts.
About the Inkai operation
Inkai is a developed mineral property with sufficient surface rights to meet future mining operation needs for the current mineral reserves.
Licences
Inkai needs a number of licences to operate the Inkai mine:
| • | Licence Series AY 1370D, April 20, 1999, expires in 2024 |
For uranium extraction in block 1 (16.6 square kilometres)
| • | Licence Series AY 1371D, April 20, 1999 |
For exploration and uranium extraction in block 2 (230 square kilometres) (expires in 2030) and for exploration in block 3 (240 square kilometres) (our application for an extension of the block 3 deposit evaluation period is still pending final approval from the Ministry of Energy of the Republic of Kazakhstan).
Other material licences
| • | Licence for performance of activity related to handling of radioactive substances (including extraction and processing of natural uranium)(issued January 18, 2010 by the Kazakhstan Ministry of Energy and Mineral Resources (MEMR)) and renewed on July 31, 2012 by the Ministry of Industry and New Technologies (MINT)) |
| • | Licence for operation of mining production and mineral raw material processing (issued December 23, 2009 by the MEMR) |
| • | Licence for transportation of radioactive substances within the territory of the Republic of Kazakhstan (issued November 18, 2008 by the MEMR) |
| • | Licence for dealing with radioactive wastes (issued July 12, 2012 by MINT). |
These licences are all currently in force and have an indefinite term. Inkai’s material environmental permits are described on page 53.
Infrastructure
| Block 1 | Block 2 | Block 3 | ||
• main processing plant, which includes a product recovery, drying and packaging facility
• administrative office, shops, garage, laboratory, emergency response building, low-level radioactive waste and domestic landfills, engineering and construction offices
• a camp for 400 employees
• catering and leisure facilities | • satellite processing plant that produces uranium loaded ion exchange resin
• office, small shops, and a food services facility | • test leach plant and associated facilities |
| 2015 ANNUAL INFORMATION FORM Page 51 | ||
Water, power and heat
Groundwater wells provide sufficient water for all planned industrial activities. Shallow wells on site have potable water for use at the camp. The site is connected to the Kazakh power grid. Operations continue throughout the year despite cold winters (lows of -35°C) and hot summers (highs of +40°C).
Employees
Taikonur has a population of about 450 people who are mainly employed in uranium development and exploration. Whenever possible, Inkai hires personnel from Taikonur and surrounding villages.
Mining method
Inkai uses conventional and well-established ISR technology. It has a very efficient process for uranium recovery, developed after extensive test work and operational experience. The process involves five major steps:
| • | leach the uranium in-situ with sulphuric acid-based lixiviate solution |
| • | recover it from solution with ion exchange resin (takes place at both main and satellite processing plants) |
| • | precipitate it with hydrogen peroxide |
| • | thicken, dewater, and dry it |
| • | package it in drums. |
The recoverability of uranium has been achieved as planned since the commissioning of the main processing plant. For the last two years Inkai recovered by leaching 98% and 110%, respectively, of the uranium budgeted.
Production
| Total processing plant production | Based on current mineral reserves, we expect Inkai to produce a total of 63.7 million pounds U3O8 (100% basis, recovered by the processing plant). | |
| Average annual processing plant production | The processing plant has the capacity to produce at an annual rate of 5.2 million pounds per year (100% basis) depending on the grade of the production solution. Inkai has expanded the existing satellite plant capacity in order to support this production rate even at a lower grade. | |
Production increases
In April 2011, Inkai received government approval to produce 3.9 million pounds per year (100% basis).
In August 2011, we entered into a memorandum of agreement (2011 MOA) with Kazatomprom to increase annual uranium production at Inkai from blocks 1 and 2 to 5.2 million pounds (100% basis). Under the 2011 MOA, our share of Inkai’s annual production will be 2.9 million pounds with the processing plant at full capacity. We will also be entitled to receive profits on 3.0 million pounds.
In December 2013, Inkai received government approval to produce 5.2 million pounds per year (100% basis).
During 2015, the subsoil use law in Kazakhstan was amended to allow producers to produce within 20% (above or below) their licensed capacity in a year.
Production expansion
In 2012, we entered into a memorandum of agreement (2012 MOA) with Kazatomprom setting out a framework to:
| • | increase Inkai’s annual production from blocks 1 and 2 to 10.4 million pounds (our share 5.2 million pounds) and sustain it at that level |
| • | extend the term of Inkai’s resource use contract through 2045. |
Kazatomprom is pursuing a strategic objective to develop uranium processing capacity in Kazakhstan to complement its leading uranium mining operations. Kazatomprom’s primary focus is now on uranium refining, which is an intermediate step in the uranium conversion process.
We expect to pursue further expansion of production at Inkai at a pace measured to market opportunities. Discussions continue with Kazatomprom.
| 2015 ANNUAL INFORMATION FORM Page 52 | ||
Sales
Under Kazakhstan’s transfer pricing law (which came into effect on January 1, 2009), sales are based on the current uranium spot price. Inkai has forward uranium sales contracts with each of its joint venture participants – us and Kazatomprom.
Funding
As of December 31, 2015, Inkai had fully repaid the outstanding loan under our agreement to fund its project development costs related to blocks 1 and 2. In 2015, Inkai paid the remaining $0.8 million (US) in interest on the loan and repaid $55 million (US) of principal.
We are currently advancing funds for Inkai’s work on block 3. As of December 31, 2015, there was $148 million (US) of principal outstanding on the loan in relation to block 3. Under the loan agreement, Inkai is to repay us from the net sales proceeds from block 3 production.
Payback
Payback of capital for Inkai was achieved during 2015, on an undiscounted pre-tax basis, including all prior costs.
Resource use contract
In 2000, Inkai and the government of Kazakhstan signed the resource use contract, which covers the licences issued in 1999 (resource use contract). Inkai has to meet the obligations under these licences and the resource use contract to maintain its rights to blocks 1, 2 and 3.
In 2007, Inkai and the relevant government authority signed Amendment No.1 to the resource use contract to extend the exploration period at blocks 2 and 3.
In 2009, Inkai and the relevant government authority signed Amendment No. 2 to the resource use contract, which:
| • | extended the exploration period for block 3 to July 13, 2010 |
| • | approved mining at block 2 |
| • | combined blocks 1 and 2 for mining and reporting purposes |
| • | required Inkai to adopt the new tax code that took effect January 1, 2009 |
| • | required Inkai to adopt current Kazakh legal and policy requirements for subsoil users to procure goods, works and services under certain prescribed procedures and foster greater local content |
| • | prescribed that a certain level of employees be Kazakh: over the life of the resource use contract, 100% of the workers, at least 70% of engineering and construction staff and at least 60% of the management staff must be Kazakh. |
In 2011, Inkai and the relevant government authority signed Amendment No. 3 to the resource use contract which:
| • | approved an increase to annual production from blocks 1 and 2 to 3.9 million pounds (100% basis) |
| • | amended the block 3 licence for a five-year appraisal period to July 2015 to carry out delineation drilling, uranium resource estimation, construction and operation of a test leach facility, and to complete a feasibility study. |
In December 2013, Inkai and the relevant government authority signed Amendment No. 4 to the resource use contract which approves an increase to annual production from blocks 1 and 2 to 5.2 million pounds (100% basis).
Work programs
Inkai is required to follow the work program appended to the resource use contract, which applies to mining operations over the life of the mine.To comply with the subsoil law, Inkai developed a life of mine work plan and submitted it to the relevant government authority who approved it in April 2011 as part of the approval of Amendment No. 3 to the resource use contract (seeProject documentation on page 55). An updated work program was submitted to the relevant government authority in 2012 in support of the Amendment No. 4 application and was approved in December 2013.
Environment
Inkai has to comply with environmental requirements during all stages of the project, and develop an environmental impact assessment for examination by a state environmental expert before making any legal, organizational or economic decisions that could have an effect on the environment and public health.
Under Kazakhstan law, Inkai needs an environmental permit to operate. Inkai has a permit for environmental emissions and discharges that is valid until December 31, 2016 and an emissions permit for drilling activities that is valid until December 31, 2016. Inkai also holds certain water permits.
| 2015 ANNUAL INFORMATION FORM Page 53 | ||
Insurance
Inkai carries environmental insurance, as required by the resource use contract.
Decommissioning
Inkai’s decommissioning obligations are largely defined by the resource use contract. It has deposited the required contributions into a separate bank account as security to ensure it will meet its obligations. Contributions are capped at $500,000 (US). Inkai has funded the full amount.
Under the resource use contract, Inkai must submit a plan for decommissioning the mine to the government six months before mining activities are complete. It developed a preliminary decommissioning plan to estimate total decommissioning costs, and updates the plan every five years, or when there is a significant change at the operation that could affect decommissioning estimates. The preliminary decommissioning estimate is $9 million (US).
Groundwater is not actively restored post-mining in Kazakhstan. See page 83 for additional details.
Kazakhstan government and legislation
Subsoil law
The principal legislation governing subsoil exploration and mining activity in Kazakhstan is theSubsoil Use Law dated June 24, 2010, which took effect July 7, 2010, and was most recently amended in 2016 (thesubsoil law). It replaces theLaw on the Subsoil and Subsoil Use, dated January 27, 1996, as amended (theold law).
In general, Inkai’s licences are governed by the version of the subsoil law that was in effect when the licences were issued in April 1999, and new legislation applies to Inkai only if it does not worsen Inkai’s position. Changes to legislation related to national security, among other criteria, however, are exempt from the stabilization clause in the resource use contract. The Kazakhstan government interprets the national security exemption broadly.
The subsoil law defines the framework and procedures connected with the granting of subsoil rights, and the regulation of the activities of subsoil users. The subsoil, including the mineral resources it contains, belongs to the state. Resources brought to the surface belong to the subsoil user, unless otherwise provided by contract or law. The state has pre-emptive and approval rights with regards to strategic deposits with some exceptions (for example, for inter-group transfers in certain circumstances), if a subsoil user transfers its subsoil rights or if there is a transfer (direct or indirect) of an ownership interest in a subsoil user.
Subsoil rights go into effect when a contract with the relevant government authority is finalized and registered. The subsoil user is given, among other things, the exclusive right to conduct mining operations, to build production and social facilities, to freely dispose of its share of production and to negotiate extensions of the contract pursuant to restrictions and requirements set out by the subsoil law.
On March 12, 2010, the Kazakhstan Ministry of Industry and New Technologies (MINT) replaced the Kazakhstan Ministry of Energy and Mineral Resources (MEMR). MEMR was designated as the “competent authority” under the old law. In August 2014, the Ministry of Energy replaced MINT and is the current competent authority under the subsoil law. We refer to the competent authority as therelevant government authority.
To date, the new subsoil law has not had a significant impact on Inkai, however, we continue to assess the impact. Some of the general impact is described below:
Stabilization clause
The general stability provision has been changed in the subsoil law.Under the old law,changes in legislation that worsened the position of the subsoil user did not apply to resource use contracts signed before the changes were adopted.
Under the subsoil law,contracts are only protected from changes in legislation if the changes worsen the results of business operations of the subsoil user. The subsoil law expands the list of exceptions from stabilization to include taxation and customs regulation. These are in addition to exceptions in the old law for defence, national security, environmental protection and health.
With the subsoil law, the government continues to weaken its stabilization guarantee. The government is broadly applying the national security exception to encompass security over strategic national resources.
Amendment No. 2 to the resource use contract eliminated the tax stabilization provision that applied to Inkai.
| 2015 ANNUAL INFORMATION FORM Page 54 | ||
The resource use contract contains significantly broader stabilization provisions than the subsoil law, and these contract provisions currently apply to us.
Transfer of subsoil rights and pre-emptive rights
The subsoil law strengthens the state’s control over transactions involving subsoil rights and the direct and indirect ownership interests in a subsoil user.
Like the old law, transfers of subsoil rights, transfers of shares (interests) in subsoil users and the grant of security over subsoil rights require consent of the relevant government authority. The subsoil law expands the list of transactions that require consent and also spells out in more detail the circumstances, documentation and information that must accompany the request for consent. It also contains a new provision requiring notification to the relevant government authority within five business days of completion of the transaction.
Similar to the old law, the state has a priority right on terms not worse than those offered by other buyers. However, this right is now limited to strategic deposits.
Failing to obtain the state’s waiver of its pre-emptive right or the consent of the relevant government authority or to provide the completion notification, are grounds for the state to invalidate a transfer.
Dispute resolution
The dispute resolution procedure in the subsoil law does not specifically disallow international arbitration. Instead it states that if a dispute related to a resource use contract cannot be resolved by negotiation, the parties can resolve the dispute according to the laws of Kazakhstan and international treaties ratified by the Republic of Kazakhstan.
The resource use contract allows for international arbitration. We believe the subsoil law does not affect this right.
Contract termination
Under the old law,the relevant government authority could terminate a contract if, for example, the subsoil user materially breached its obligations established by the contract or work program.
Under the subsoil law, the relevant government authority can unilaterally terminate a contract before it expires if:
| • | a subsoil user does not fix more than two breaches of its contractual obligations specified in a notification of the relevant government authority within a specific period |
| • | subsoil rights or direct and indirect ownership interests in a subsoil user are transferred without consent of the relevant government authority |
| • | less than 30% of the financial obligations under a contract are fulfilled during the previous two years |
| • | activities of a subsoil user exploring or developing a strategic deposit entails such changes in the economic interests of the state that it poses a threat to national security and the subsoil user does not satisfy the relevant government authority’s request to amend the contract in this regard. |
Under the resource use contract, if Inkai materially breaches its obligations, the relevant government authority has to notify Inkai of the breach and provide a reasonable period to fix it before it can terminate the contract.We believe that the terms of the resource use contract should continue to apply unless the state seeks to apply the national security or environmental protection exception to stabilization.
Local content
Subsoil users must procure goods, works and services in compliance with the subsoil law. Procurement is carried out through a specially created register of the goods, works and services and of the entities (producers) providing them. Subsoil users must give preference to local producers, as long as the goods, works and services comply with the requirements of the respective project documentation and Kazakhstan law on technical regulation. The subsoil law also allows a statutory tender commission, which oversees tender procedures, to conditionally discount local producers’ bids by 20% relative to foreign bidders. This new local content provision applies to Inkai. However, due to Kazakhstan’s accession to the World Trade Organization, the above local content requirements shall apply to the goods procured by Inkai only until January 1, 2021.
Project documentation
Subsoil users who received subsoil rights before the subsoil law was introduced were required to:
| • | develop new project documentation to be approved by July 7, 2011 |
| • | develop a new work program in accordance with the project documentation to be approved by January 7, 2012. |
| 2015 ANNUAL INFORMATION FORM Page 55 | ||
Inkai submitted the required documentation and received approval of the new life of mine work program as part of the April 14, 2011 approval of Amendment No. 3 to the resource use contract.
The subsoil law repealed the previous requirement for annual work plans. Instead, expected exploration and/or production volumes for each year are now set out in one work program. Inkai revised its work program to support the application to increase the annual production rate to 5.2 million pounds (100% basis).
Strategic deposits
According to the Governmental ResolutionOn Approval of the List of Subsoil (Deposit) Areas having Strategic Importance dated October 4, 2011, 362 various deposits are considered to be strategic deposits, including all three of Inkai’s blocks.
Under the subsoil law, if any actions by a subsoil user relating to a strategic deposit leads to a change in the economic interests of the state that creates a threat to national security, the relevant government authority has the right to demand a change to a contract that will restore the economic interests of the state. The parties have to agree on and make the change within a specific time period, or the relevant government authority can unilaterally terminate the contract.
Currency control regulations
In 2009, specific amendments to existing currency regulations were adopted. These amendments are aimed at preventing possible threats to the economic security and stability of the Kazakh financial system. The President of Kazakhstan was granted the power to establish a special currency regime that can:
| • | require foreign currency holders to deposit a certain portion of their foreign currency interest free with a resident Kazakhstan bank or the National Bank of Kazakhstan |
| • | require the permission of the National Bank of Kazakhstan for currency transactions |
| • | require the sale of foreign currency received by residents |
| • | restrict overseas transfers of foreign currency. |
While the special currency regime has not been imposed, it has the potential to prevent Kazakh companies, like Inkai, from being able to pay dividends to their shareholders abroad or repatriating any or all of its profits in foreign currency. It can also impose additional administrative procedures, and Kazakh companies could be required to hold a portion of their foreign currency in local banks.
Operating and capital costs
The following is a summary of the capital and operating cost estimates for the remaining life of mine, stated in constant 2016 dollars and reflecting a forecast life-of-mine production of 63.7 million pounds U3O8 and a 250 Tenge to 1 US dollar exchange rate assumption:
Operating Costs ($US million) | Total (2016 – 2030) | |||
Site administration | $ | 228.60 | ||
Processing costs | 150.60 | |||
Mining costs | 387.60 | |||
Corporate overhead | 174.10 | |||
|
| |||
Total operating costs | $ | 940.90 | ||
|
| |||
Average cost per pound U3O8 | $ | 14.63 | ||
|
| |||
Note: presented as total cost to the Joint Venture Inkai Limited Liability Partnership (100% basis)
Estimated operating costs consist of annual expenditures to mine and process the mineral reserves into U3O8 as well as site administration and corporate overhead costs.
Capital Costs ($US million) | Total (2016 – 2030) | |||
Total wellfield development | $ | 215.80 | ||
Construction and maintenance capital | 58.70 | |||
Sustaining capital | 11.50 | |||
|
| |||
Total capital costs | $ | 286.00 | ||
|
| |||
Note: presented as total cost to the Joint Venture Inkai Limited Liability Partnership (100% basis)
| 2015 ANNUAL INFORMATION FORM Page 56 | ||
Estimated capital costs includes wellfield development to mine the mineral reserves as well as construction and maintenance capital along with sustaining capital.
Our expectations and plans regarding Inkai, including forecasts of operating and capital costs, and mine life areforward-looking information, and are based specifically on the risks and assumptions discussed on pages 2 and 3. We may change operating or capital spending plans in 2016, depending on uranium markets, our financial position, results of operation and other factors. Estimates of expected future production and capital and operating costs are inherently uncertain, particularly beyond one year, and may change materially over time.
Exploration, drilling, sampling, processing and estimates
We did not do any exploration drilling in blocks 1 and 2, and relied instead on historic data to estimate mineral reserves and resources. There are no historical estimates within the meaning of NI 43-101 to report.
Exploration
Historical drilling
| • | Historical drilling at Inkai included 4,898 holes in blocks 1 and 2, and 510 in block 3. |
| • | Drilling was vertical, on a grid at prescribed density of 3.2 to 1.6 kilometre line spacing and 200 to 50 metre (3.2-1.6 kilometres x 200-50 metres) hole spacing. Additional drilling at grids of 800-400 x 200-50 metres and 200-100 x 50-25 metre grid increased the level of geological knowledge and confidence. |
| • | Vertical holes were drilled with a triangular drill bit for use in unconsolidated formations down to a certain depth and the rest of the holes were cored. |
| • | JSC Volkovgeology, a subsidiary of Kazatomprom, compiled the data for block 1 of the Inkai deposit as well as some of the data for block 2 to produce a report in 1991. |
Exploration drilling
| • | All exploration drilling has been confined to block 3. |
| • | Inkai’s exploration and mineral resource evaluation department oversees exploration, including the strategic direction of the drilling program and management of contractors. Inkai has retained a contractor, JSC Volkovgeology, to direct and coordinate day-to-day drilling activities, and to ensure drilling quality, core recovery, surveying, geological logging, sampling, assaying and daily data processing. |
| • | Drilling carried out at block 3 includes 4,129 exploration-delineation drillholes, of which 489 are historic drillholes and 3,640 were drilled by Inkai from 2006 to 2013. |
| • | In addition, a total of 79 hydrogeological test wells were drilled between 2010 and 2013. There are 18 historic hydrogeological wells at block 3. |
| • | No further holes were drilled in 2014 or 2015. |
Recent activity
| • | The first phase of the drilling program from 2006 through 2009 was focused on drilling on an 800 x 50 metre grid pattern in the southwestern part of block 3. Also, the mineralization trends were followed along the northwestern border using sparser (800 to 1600 x 100 to 200 metre) drilling patterns. |
| • | The second phase of the drilling program from January to October 2010 was aimed at developing an 800 x 50 metre infill drilling grid pattern throughout the mineralized trend identified along the northwestern border, as well as the trend developed along the southern border. |
| • | The third phase of drilling started in October 2010 and continued throughout 2011, 2012 and 2013. Progressively tightening drilling grids (from 800 x 50 metre to 400 x 50 metre to 200 x 50 metre) were used to delineate mineralization in the southwestern and western parts of block 3. |
| • | Hydrogeological testing work (one well and multiwell aquifer pump tests) was conducted in 2010, 2011 and 2012 in the southwestern, western and central parts of block 3 to establish the hydrogeological characteristics of the aquifers of the hosting mineralized horizons, as well as their relationship to the surrounding aquitards and other aquifers. These hydrogeological characteristics and relationships are geotechnical parameters important for the ISR method of mining. |
| • | Results of exploration and delineation: |
| 2015 ANNUAL INFORMATION FORM Page 57 | ||
| • | traced the presence of mineralization throughout block 3 with greater certainty. There was a significant increase in the extent of mineralization in many places, compared to results of predecessors, which were based on sparser historical drilling grids. |
| • | encountered more complex morphology of the mineralized zones of block 3 |
| • | used the mineralization delineation from 800 x 50 metre and 200 x 50 metre drilling grids in block 3 to form a preliminary estimate of the mineralization for most of the area covered |
| • | led to a preliminary estimate in 2011 of the mineralization on the southwestern corner of block 3, which was reviewed and approved by the State Reserve Commission |
| • | confirmed the need for additional drilling to close off mineralization zones and better define their morphology and continuity |
| • | Inkai has drilled a total of 154 technological wells (monitoring, injection and production wells) on the two sites identified for conducting ISR tests in two separate horizons (Inkuduk and Mynkuduk) |
| • | interim report on exploration results and estimate in 2014 of the mineralization at block 3, which was reviewed and approved by the State Reserve Commission. |
Sampling analysis and data verification
Sampling
| • | Detailed sampling procedures guide the sampling interval within the mineralization. Holes are drilled on progressively tightening grids: 3.2 to 1.6 kilometre x 200-50 metre, 800-400 metre x 200-50 metre and 200-100 metre x 50-25 metre. When core recoveries are higher than 70% and radioactivity greater than 40 micro-roentgen per hour, core samples are taken at irregular intervals of 0.2 to 1.2 metres. Sample intervals are also differentiated by barren or low permeability material. |
| • | The drillholes are nearly vertical and the mineralized horizons are almost horizontal, so the mineralized intercepts represent the true thickness of the mineralization. |
| • | Inkai’s geophysical crews survey the drillholes, logging radiometric, electrical (spontaneous potential and resistivity), caliper and deviation data. For greater accuracy, they collect downhole data only from open or uncased holes. |
| • | Sampling is done sectionally from half of the core, which is divided along its axis and cleared from the clay envelope. The average core sample length is 0.4 metres. |
| • | The split core is tested for grainsize and carbonate content. |
| • | Since gamma probing of the drillholes is used to estimate mineral resources, assays from core sampling are used only when core recovery is at least 70%, for correlation. |
| • | Core recovery is generally considered to be acceptable given the unconsolidated state of the mineralized material. |
Analysis
| • | The core samples for uranium and radium determination are ground down to 1.0 mm grain size and are further subdivided by one or three times quartering until the final representative weight of samples and duplicates is reached (0.2 kg). |
| • | The laboratory tests for uranium and radium were performed by the Central Analytical Laboratory (CAL) of JSC Volkovgeology, a company related to Kazatomprom, the other owner of Inkai. The laboratory is certified and licensed by the Kazakh government. |
| • | The uranium content was determined by using the X-ray spectrum. The radium content was determined by the complex gamma-X-ray spectrum. |
Quality control and data verification
| • | Our geoscientists, including a qualified person as such term is defined in NI 43-101, have witnessed core handling, logging and sampling used at the Inkai mine and consider the methodologies to be very satisfactory and the results representative and reliable. |
| • | We confirmed the correlation between radioactive readings and calculated radium grades. |
| • | We carried out a data verification process that validated the historic Kazakh mineral resource and reserve estimate. |
| • | All drilling, logging, core drilling, and subsequent core splitting and assaying, were completed under the direction of various geological expeditions of the USSR Ministry of Geology and later under the supervision of JSC Volkovgeology. |
| 2015 ANNUAL INFORMATION FORM Page 58 | ||
| • | Based on numerous QA/QC controls applied by JSC Volkovgeology, including internal checks and inter-laboratory checks, the repeatability of the results for uranium and radium confirms the accuracy required and no significant systematic deviations were found. |
| • | Sampling and analysis procedures have been examined by an independent consultant and found to be detailed and thorough. |
| • | Geologists with Inkai, JSC Volkovgeology, the State Reserves Commission and Cameco, have validated the current database a number of times. Our geologists consider it relevant and reliable. |
| • | The findings are supported by results of the leach tests, past and recent production, and wellfield drilling results on blocks 1 and 2 and exploration drilling in block 3. |
Sample security
Inkai’s current sampling process follows the strict regulations imposed by the Kazakhstan government, and includes the highest level of security measures, quality assurance and quality control. We have not been able to locate the documents describing sample security for historic Kazakhstan exploration on blocks 1, 2 and 3, but we believe the security measures taken to store and ship samples were of the same high quality.
Accuracy
We consider the historic Kazakhstan exploration data adequate and reliable for estimating mineral reserves and resources, based on the 2003 and 2007 validation of Kazakhstan estimated uranium reserves for blocks 1 and 2 (seesampling and analysis).We consider the exploration data from Inkai’s exploration program at block 3 reliable for appraising the mineral potential according to Kazakhstan standards.
Mineral reserve and resource estimates
Please see page 72 for our mineral reserve and resource estimates for Inkai.
| 2015 ANNUAL INFORMATION FORM Page 59 | ||
Uranium – operating properties
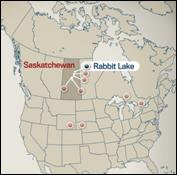 | Rabbit Lake
The Rabbit Lake operation, which opened in 1975, is the longest operating uranium production facility in North America, and the second largest uranium mill in the world. |
| Location | Saskatchewan, Canada | |
| Ownership | 100% | |
| End product | uranium concentrates | |
| ISO certification | ISO 14001 certified | |
| Mine type | underground | |
| Estimated mineral reserves | 11.9 million pounds (proven and probable) average grade U3O8 – 0.59% | |
| Estimated mineral resources | 26.7 million pounds (indicated) average grade U3O8– 0.86% 33.7 million pounds (inferred) average grade U3O8– 0.58% | |
| Mining method | vertical blasthole stoping | |
| Licensed capacity | mill: maximum 16.9 million pounds per year; currently 11 million | |
| Total production 1975 to 2015 | 202.2 million pounds | |
| 2015 production | 4.2 million pounds | |
| 2016 forecast production | 3.6 million pounds | |
| Estimated decommissioning cost | $203 million | |
Business structure
We own 100% of Rabbit Lake.
Permits
We need three key permits to operate the Rabbit Lake mining and milling complex:
| • | Uranium Mine Operating Licence– expires on October 31, 2023 (from the CNSC) |
| • | Approval to Operate Pollutant Control Facilities– expires on October 31, 2016 (from the Saskatchewan Ministry of the Environment) |
| • | Water Rights Licence and Approval to Operate Works – valid for an undefined term (from the Saskatchewan Watershed Authority). |
Production
2015 production was 4.2 million pounds U3O8.
Our 2016 forecast production is 3.6 million pounds U3O8.
| 2015 ANNUAL INFORMATION FORM Page 60 | ||
Operations
Development and production continued at Eagle Point mine. This mine is underground and is part of the Rabbit Lake operation.
At the mill we continued to improve the efficiency of the mill operation schedule.
On December 17, 2015, we announced that underground mining activities at the Eagle Point mine were being restricted due to a rock fall in an inactive area of the mine. As a precautionary measure, non-essential personnel were removed from the mine while the condition of the affected area was evaluated. Mine production was suspended, although milling of previously mined and transported ore continued through to year end.
The assessment determined that repairs were necessary to support the ground in the affected area of the mine. The repairs were completed, along with some further assessments of mine stability in other areas of the mine and normal operations resumed on February 3, 2016.
Exploration
In 2015, we continued our underground drilling program to delineate resources northeast of the current mine workings and below active mining areas.
We plan to continue our underground drilling reserve replacement program in areas of interest north and northeast of the current mine workings in 2016. The drilling will be carried out from underground locations.
Tailings
Under our current licence, we expect to have sufficient tailings capacity to support milling of Eagle Point ore until aboutlate-2017, based upon expected ore tonnage, milling rates and tailings properties.
Our plan to fully utilize the available tailings capacity of the Rabbit Lake In-Pit Tailings Management facility requires regulatory approval in 2016 for which we submitted our required applications. With these regulatory approvals and after we complete the necessary work on the existing pit, we expect to then have sufficient tailings capacity to support milling of Eagle Point ore until at least 2021 based upon expected ore tonnage, milling rates, tailings properties, and the conversion of some mineral resources to mineral reserves.
Site reclamation
We are proceeding with our multi-year, site wide reclamation plan. In 2015, we spent over $700,000 to reclaim facilities that are no longer in use, and plan to spend over $500,000 in 2016.
Mill renewal
We have been working on upgrades to the Rabbit Lake mill and associated facilities since 2006:
| • | 2006 – reduced mill effluent concentrations of uranium |
| • | 2008 – replaced the mill-distributed control system and improved the mill’s secondary containment |
| • | 2009 – reduced mill effluent concentrations of molybdenum and selenium |
| • | 2010 – replaced the converter and heat recovery equipment in the acid plant |
| • | 2011 – replaced the three acid plant towers in the acid plant and completed ongoing upgrades to mill processing equipment and tanks |
| • | 2012 – continued the replacement of mill and site electrical infrastructure |
| • | 2013 – rebuilt mill sulfur furnace |
| • | 2014 – significant repairs to various mill structural steel components and rebuilding of key mill roof sections |
| • | 2015 – continued steel and roof work. |
| 2015 ANNUAL INFORMATION FORM Page 61 | ||
Uranium – operating properties
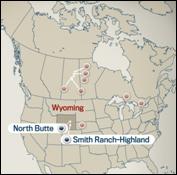 | Smith Ranch-Highland & Satellite Facilities
We operate Smith Ranch and Highland as a combined operation. Each has its own processing facility, but the Smith Ranch central plant currently processes all the uranium, including uranium from satellite facilities. The Highland plant is currently idle. Together, they form the largest uranium production facility in the United States. | |
| Location | Wyoming, US | |
| Ownership | 100% | |
| End product | uranium concentrates | |
| ISO certification | ISO 14001 certified | |
| Estimated mineral reserves | Smith Ranch-Highland: 6.2 million pounds (proven and probable), average grade U3O8 – 0.09% North Butte-Brown Ranch: 1.8 million pounds (proven and probable), average grade U3O8 – 0.08% | |
| Estimated mineral resources | Smith Ranch-Highland: 19.8 million pounds (measured and indicated), average grade U3O8 – 0.06% 7.7 million pounds (inferred), average grade U3O8 – 0.05% North Butte-Brown Ranch: 8.8 million pounds (measured and indicated), average grade U3O8 – 0.07% 0.4 million pounds (inferred), average grade U3O8 – 0.07% | |
| Mining method | in situ recovery (ISR) | |
| Licensed capacity | wellfields: 3 million pounds per year processing plants: 5.5 million pounds per year including Highland mill | |
| Total production 2002 to 2015 | 21.8 million pounds | |
| 2015 production | 1.4 million pounds | |
| 2016 forecast production | 1.2 million pounds | |
| Estimated decommissioning cost | Smith Ranch-Highland $206 million (US); North Butte $22 million (US) | |
Business structure
We own 100% of Smith Ranch-Highland through a wholly owned subsidiary.
See our 2015 MD&A for more information.
| 2015 ANNUAL INFORMATION FORM Page 62 | ||
Uranium – operating properties
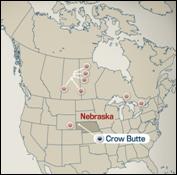 | Crow Butte
Crow Butte was discovered in 1980 and began production in 1991. | |
| Location | Nebraska, US | |||
| Ownership | 100% | |||
| End product | uranium concentrates | |||
| ISO certification | ISO 14001 certified | |||
| Estimated mineral reserves | 0.7 million pounds (proven) | |||
| average grade U3O8 – 0.08% | ||||
| Estimated mineral resources | 15.2 million pounds (measured and indicated) | |||
| average grade U3O8 – 0.25% | ||||
2.9 million pounds (inferred) average grade U3O8 – 0.12% | ||||
| Mining method | in situ recovery (ISR) | |||
| Licensed capacity | 2.0 million pounds per year | |||
| (processing plant and wellfields) | ||||
| Total production 2002 to 2015 | 10.1 million pounds | |||
| 2015 production | 0.4 million pounds | |||
| 2016 forecast production | 0.2 million pounds | |||
| Estimated decommissioning cost | $46 million (US) | |||
Business structure
We own 100% of Crow Butte through a wholly owned subsidiary.
See our 2015 MD&A for more information.
| 2015 ANNUAL INFORMATION FORM Page 63 | ||
Uranium – projects under evaluation
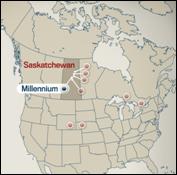 | Millennium
Millennium is a uranium deposit in northern Saskatchewan. We are the operator. | |
| Location | Saskatchewan, Canada | |||
| Ownership | 69.9% | |||
| End product | uranium concentrates | |||
| Mine type | underground | |||
| Estimated mineral resources | 53.0 million pounds (indicated) | |||
| (our share) | average grade U3O8 – 2.39% | |||
20.2 million pounds (inferred) average grade U3O8 – 3.19% | ||||
Business structure
Millennium is owned by a joint venture of two companies:
| • | Cameco – 69.9% (operator) |
| • | JCU Exploration (Canada) Co. Ltd. – 30.1% |
See our 2015 MD&A for more information.
| 2015 ANNUAL INFORMATION FORM Page 64 | ||
Uranium – projects under evaluation
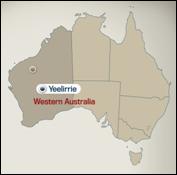 | Yeelirrie
Yeelirrie is a near-surface calcrete-style deposit that is amenable to open pit mining techniques. We are the operator. | |
| Location | Western Australia | |||
| Ownership | 100% | |||
| End product | uranium concentrates | |||
| Mine type | open pit | |||
| Estimated mineral resources | 127.3 million pounds (measured and indicated) | |||
| average grade U3O8 – 0.16% | ||||
Business structure
Yeelirrie is owned 100% by a Cameco subsidiary.
See our 2015 MD&A for more information.
| 2015 ANNUAL INFORMATION FORM Page 65 | ||
Uranium – projects under evaluation
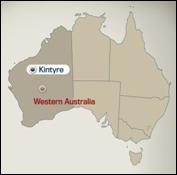 | Kintyre
Kintyre is a uranium deposit that is amenable to open pit mining techniques. We are the operator. | |
| Location | Western Australia | |
| Ownership | 70% | |
| End product | uranium concentrates | |
| Mine type | open pit | |
| Estimated mineral resources | 37.5 million pounds (indicated) average grade U3O8 – 0.62% | |
| (our share) | 4.2 million pounds (inferred) average grade U3O8 – 0.53% | |
Business structure
Kintyre is owned by two companies:
| • | A Cameco subsidiary – 70% |
| • | Mitsubishi Development Pty Ltd. – 30% |
See our 2015 MD&A for more information.
| 2015 ANNUAL INFORMATION FORM Page 66 | ||
Exploration
In 2015, we continued our exploration strategy of focusing on the most prospective projects in our portfolio. Exploration is key to ensuring our long-term growth.
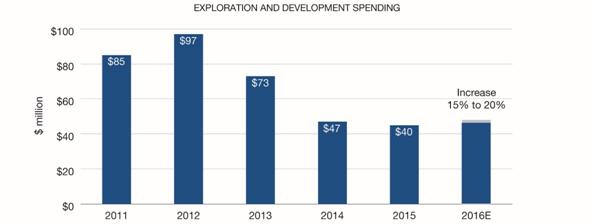
2015 UPDATE
Brownfield exploration
Brownfield exploration is uranium exploration near our existing operations, and includes expenses for advanced exploration projects where uranium mineralization is being defined.
In 2015, we spent $2 million on four brownfield exploration projects, $4 million on our projects under evaluation in Australia, and $2 million at Inkai and on our US operations.
Regional exploration
We spent approximately $32 million on regional exploration programs (including support costs), primarily in Saskatchewan and Australia.
PLANNING FOR THE FUTURE
We plan to maintain an active uranium exploration program and continue to focus on our core projects in Saskatchewan under our long-term exploration strategy.
Brownfield exploration
In 2016, we plan to spend approximately $5 million on brownfield exploration and $4 million on projects under evaluation.
Regional exploration
We plan to spend approximately $36 million on 24 projects in Canada and Australia, the majority of which are at drill target stage. Among the larger expenditures planned is $7 million on the Read Lake project, which is adjacent to McArthur River in Saskatchewan. We will also spend a total of $2 million in Kazakhstan and on US operations.
| 2015 ANNUAL INFORMATION FORM Page 67 | ||
Fuel services – refining
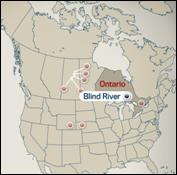 | Blind River refinery
Blind River is the world’s largest commercial uranium refinery, refining uranium concentrates from mines around the world into UO3. | |
| Location | Ontario, Canada | |
| Ownership | 100% | |
| End product | UO3 | |
| ISO certification | ISO 14001 certified | |
| Licensed capacity | 24 million kgU as UO3 per year (subject to the completion of certain equipment upgrades) | |
| 2015 production | 8.4 million kgU of UO3 | |
| Estimated decommissioning cost | $39 million | |
Markets
UO3 is shipped to Port Hope for conversion into either UF6 or UO2.
Capacity
In 2012, the CNSC granted an increase to our annual licensed production capacity from 18 million kgU per year as UO3 to 24 million kgU as UO3, subject to the completion of certain equipment upgrades. These upgrades will be advanced based on market conditions.
Licensing
In February 2012, the CNSC granted our Blind River refinery a 10-year operating licence.
| 2015 ANNUAL INFORMATION FORM Page 68 | ||
Fuel services – conversion and fuel manufacturing
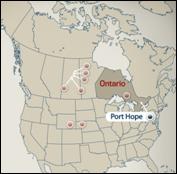 | Port Hope conversion services
Port Hope is the only uranium conversion facility in Canada and a supplier of UO2 for Canadian-made CANDU reactors. | |
| Location | Ontario, Canada | |
| Ownership | 100% | |
| End product | UF6, UO2 | |
| ISO certification | ISO 14001 certified | |
| Licensed capacity | 12.5 million kgU as UF6 per year | |
| 2.8 million kgU as UO2 per year | ||
| Estimated decommissioning cost | $102 million (an updated estimate is currently under regulatory review) | |
Cameco Fuel Manufacturing Inc. (CFM)
CFM produces fuel bundles and reactor components for CANDU reactors.
| ||
| Location | Ontario, Canada | |
| Ownership | 100% | |
| End product | CANDU fuel bundles and components | |
| ISO certification | ISO 9001 certified, ISO 14001 certified | |
| Licensed capacity | 1.2 million kgU as UO2as finished bundles | |
| Estimated decommissioning cost | $20 million | |
Port Hope and CFM produced a total of 9.7 million kgU in 2015.
Licensing
In February 2012, the CNSC approved a five-year operating licence for the Port Hope conversion facility and a ten-year licence for CFM.
The current operating licence for the Port Hope conversion facility expires in February 2017. The CNSC relicensing process will take place in 2016.
Conversion services
At its UO2 plant, Port Hope produces UO2powder, used to make pellets for Canadian and Korean CANDU reactors and blanket fuel for light water nuclear reactors.
At its UF6 plant, Port Hope converts UO3 to UF6, and then ships it to enrichment plants primarily in the United States and Europe. There, it is processed to become low enriched UF6, which is subsequently converted to enriched UO2 and used as reactor fuel for light water nuclear reactors.
| 2015 ANNUAL INFORMATION FORM Page 69 | ||
Anhydrous hydrofluoric acid (AHF) is a primary feed material for the production of UF6. We have agreements with multiple suppliers of AHF to provide us with diversity of supply.
Environment
In 2009, we completed a site-wide environmental investigation of subsurface contamination and a site-wide risk assessment to identify contaminants that could pose a potential risk to the environment. We used the results to develop an environmental management plan to mitigate potential risks. In 2010, we enhanced the plan by adding a number of groundwater retrieval wells. In 2011, we added four additional wells. The environmental management plan met expectations between 2012 and 2015. In 2014, we also met with the regulatory authorities to discuss and agree on the adequacy of the environmental management plan and opportunities to further enhance it through the Vision in Motion project.
Port Hope conversion facility clean-up and modernization (Vision in Motion)
The Vision in Motion project is currently in the feasibility stage and will continue with the CNSC licensing process in 2016, which is required to advance the project.
Labour relations
The current collective agreements for our unionized employees at the Port Hope conversion facility expires on June 30, 2016. We will commence the bargaining process in early 2016.
Fuel manufacturing
CFM’s main business is making fuel bundles for CANDU reactors. CFM presses UO2 powder into pellets that are loaded into tubes, manufactured by CFM, and then assembled into fuel bundles. These bundles are ready to insert into a CANDU reactor core.
Manufacturing services agreements
A substantial portion of CFM’s business is the supply of fuel bundles to the Bruce Power A and B nuclear units in Ontario. We supply the UO2 for these fuel bundles.
Labour relations
In June 2015, unionized employees at CFM’s operations in Port Hope and Cobourg, Ontario accepted a new three-year collective agreement. The previous agreement expired on June 1, 2015.
| 2015 ANNUAL INFORMATION FORM Page 70 | ||
NUKEM GmbH
NUKEM is one of the world’s leading traders of uranium and uranium-related products.
| Offices | Alzenau, Germany (Headquarters, NUKEM GmbH) | |
| Connecticut, US (subsidiary NUKEM Inc.) | ||
| Ownership | 100% | |
| Activity | trading of uranium and uranium-related products | |
| 2015 sales | 10.71 million lbs U3O8 | |
| 2016 forecast sales | 9 to 10 million lbs U3O8 | |
| 1 | Includes sales of 0.9 million pounds and revenue of $19.3 million between our uranium, fuel services and NUKEM segments. |
For more information, see our 2015 MD&A.
| 2015 ANNUAL INFORMATION FORM Page 71 | ||
Mineral reserves and resources
Our mineral reserves and resources are the foundation of our company and fundamental to our success.
We have interests in a number of uranium properties. The tables in this section show our estimates of the proven and probable reserves, and measured, indicated and inferred resources at those properties. However, only three of the uranium properties listed in those tables are material uranium properties for us: McArthur River, Cigar Lake and Inkai.
We estimate and disclose mineral reserves and resources in five categories, using the definitions adopted by the Canadian Institute of Mining, Metallurgy and Petroleum, and in accordance with NI 43-101. You can find out more about these categories at cim.org.
About mineral resources
Mineral resources that are not mineral reserves have no demonstrated economic viability but do have reasonable prospects for eventual economic extraction. They fall into three categories: measured, indicated and inferred. Our reported mineral resources do not include mineral reserves.
| • | Measured and indicated mineral resources can be estimated with sufficient confidence to allow the appropriate application of technical, economic, marketing, legal, environmental, social and governmental factors to support evaluation of the economic viability of the deposit. |
| • | measured resources: we can confirm both geological and grade continuity to support detailed mine planning. |
| • | indicated resources: we can reasonably assume geological and grade continuity to support mine planning. |
| • | Inferred mineral resources are estimated on the basis of limited geological evidence and sampling, sufficient to imply but not verify geological and grade continuity. They have a lower level of confidence than that applied to an indicated mineral resource and cannot be directly converted to a mineral reserve. We do not have enough confidence to evaluate their economic viability in a meaningful way. |
Our share of uranium in the mineral resource tables below is based on our respective ownership interests, except for Inkai which is based on our interest in potential production (57.5%), which differs from our ownership interest (60%).
About mineral reserves
Mineral reserves are the economically mineable part of measured and/or indicated mineral resources demonstrated by at least a preliminary feasibility study. The reference point at which mineral reserves are defined is the point where the ore is delivered to the processing plant. Mineral reserves fall into two categories:
| • | proven reserves: the economically mineable part of a measured resource for which at least a preliminary feasibility study demonstrates that economic extraction is justified. |
| • | probable reserves: the economically mineable part of a measured and/or indicated resource for which at least a preliminary feasibility study demonstrates that economic extraction can be justified. |
We use current geological models, constant dollar average uranium prices of $57 to $59 (US) per pound U3O8 and current or projected operating costs and mine plans to estimate our mineral reserves, allowing for dilution and mining losses. We apply our standard data verification process for every estimate.
Our share of uranium in the mineral reserves table below is based on our respective ownership interests, except for Inkai which is based on our interest in planned production (57.5%) assuming an annual production rate of 5.2 million pounds, which differs from our ownership interest (60%).
Qualified persons
The technical and scientific information discussed in this AIF, including mineral reserve and resource estimates, for our material properties (McArthur River/Key Lake, Cigar Lake and Inkai) were approved by the following individuals who are qualified persons for the purposes of NI 43-101:
| 2015 ANNUAL INFORMATION FORM Page 72 | ||
| McArthur River/Key Lake | Cigar Lake | |
• Alain G. Mainville, director, mineral resources management, Cameco
• David Bronkhorst, vice-president, mining and technology, Cameco
• Baoyao Tang, technical superintendent, McArthur River, Cameco
Inkai
• Alain G. Mainville, director, mineral resources management, Cameco
• Darryl Clark, general director, JV Inkai
• Lawrence Reimann, manager, technical services, Cameco Resources
• Bryan Soliz, principal geologist, mineral resources management, Cameco | • Alain G. Mainville, director, mineral resources management, Cameco
• Scott Bishop, manager, technical services, Cameco
• Leslie D. Yesnik, general manager, Cigar Lake, Cameco | |
Important information about mineral reserve and resource estimates
Although we have carefully prepared and verified the mineral reserve and resource figures in this document, the figures are estimates, based in part on forward-looking information.
Estimates are based on our knowledge, mining experience, analysis of drilling results, the quality of available data and management’s best judgment. They are, however, imprecise by nature, may change over time, and include many variables and assumptions including:
| • | geological interpretation |
| • | extraction plans |
| • | commodity prices and currency exchange rates |
| • | recovery rates |
| • | operating and capital costs. |
There is no assurance that the indicated levels of uranium will be produced, and we may have to re-estimate our mineral reserves based on actual production experience. Changes in the price of uranium, production costs or recovery rates could make it unprofitable for us to operate or develop a particular site or sites for a period of time. See page 1 for information about forward-looking information, and page 98 for a discussion of the risks that can affect our business.
Please see pages 78, 79 and 80 for the specific assumptions, parameters and methods used for the McArthur River, Cigar Lake and Inkai mineral reserve and resource estimates.
Our estimate of mineral resources and mineral reserves may be materially affected by the occurrence of one or more the risks described under the headingReserve and resource estimates are not precise on page 109. In addition to those risks, our estimates of mineral resources and mineral resources for certain properties may be materially affected by the occurrence of one or more the following risks or factors:
McArthur River and Cigar Lake Mineral Resource and Reserve Estimates
| • | Water inflows – seeFlooding at our Saskatchewan mines at page 99. |
| • | Technical challenges – seeTechnical challenges at Cigar Lake and McArthur River at page 100. |
Inkai Mineral Resource and Reserve Estimates
| • | The outcome of our current discussions with Kazatomprom. |
| • | Political risks – see page 104. |
The extent to which our estimates of mineral resources and mineral reserves may be affected by the foregoing issues could vary from material gains to material losses.
| 2015 ANNUAL INFORMATION FORM Page 73 | ||
Important information for US investors
While the terms measured, indicated and inferred mineral resources are recognized and required by Canadian securities regulatory authorities, the US Securities and Exchange Commission (SEC) does not recognize them. Under US standards, mineralization may not be classified as a ‘reserve’ unless it has been determined at the time of reporting that the mineralization could be economically and legally produced or extracted. US investors should not assume that:
| • | any or all of a measured or indicated mineral resource will ever be converted into proven or probable mineral reserves |
| • | any or all of an inferred mineral resource exists or is economically or legally mineable, or will ever be upgraded to a higher category. Under Canadian securities regulations, estimates of inferred resources may not form the basis of feasibility or pre-feasibility studies. Inferred resources have a great amount of uncertainty as to their existence and economic and legal feasibility. |
The requirements of Canadian securities regulators for identification of “reserves” are also not the same as those of the SEC, and mineral reserves reported by us in accordance with Canadian requirements may not qualify as reserves under SEC standards.
Other information concerning descriptions of mineralization, mineral reserves and resources may not be comparable to information made public by companies that comply with the SEC’s reporting and disclosure requirements for US domestic mining companies, including Industry Guide 7.
Mineral reserves
As at December 31, 2015 (100% basis – only the second last column shows Cameco’s share)
Proven and probable (tonnes in thousands; pounds in millions)
| Proven | Probable | Total mineral reserves | ||||||||||||||||||||||||||||||||||||||||||||
Property | Mining method | Tonnes | Grade %U3O8 | Content (lbs U3O8) | Tonnes | Grade %U3O8 | Content (lbs U3O8) | Tonnes | Grade %U3O8 | Content (lbs U3O8) | Cameco’s share of content (lbs U3O8) | Metallurgical recovery (%) | ||||||||||||||||||||||||||||||||||
Cigar Lake | underground | 226.1 | 21.93 | 109.3 | 375.7 | 13.55 | 112.3 | 601.8 | 16.70 | 221.6 | 110.9 | 98.5 | ||||||||||||||||||||||||||||||||||
Key Lake | open pit | 61.1 | 0.52 | 0.7 | 61.1 | 0.52 | 0.7 | 0.6 | 98.7 | |||||||||||||||||||||||||||||||||||||
McArthur River | underground | 1,195.3 | 9.62 | 253.5 | 199.8 | 18.84 | 83.0 | 1,395.1 | 10.94 | 336.5 | 234.9 | 98.7 | ||||||||||||||||||||||||||||||||||
Rabbit Lake | underground | 10.6 | 0.34 | 0.1 | 902.9 | 0.59 | 11.8 | 913.5 | 0.59 | 11.9 | 11.9 | 97 | ||||||||||||||||||||||||||||||||||
Crow Butte | ISR | 412.5 | 0.08 | 0.7 | 412.5 | 0.08 | 0.7 | 0.7 | 85 | |||||||||||||||||||||||||||||||||||||
Inkai | ISR | 1,139.5 | 0.08 | 2.1 | 50,476.4 | 0.07 | 72.9 | 51,615.9 | 0.07 | 75.0 | 43.1 | 85 | ||||||||||||||||||||||||||||||||||
North Butte-Brown Ranch | ISR | 644.2 | 0.08 | 1.2 | 373.8 | 0.08 | 0.7 | 1,018.0 | 0.08 | 1.8 | 1.8 | 60 | ||||||||||||||||||||||||||||||||||
Smith Ranch-Highland | ISR | 1,127.8 | 0.10 | 2.5 | 1,871.0 | 0.09 | 3.8 | 2,998.8 | 0.09 | 6.2 | 6.2 | 80 | ||||||||||||||||||||||||||||||||||
|
|
|
|
|
|
|
|
|
|
|
|
|
|
|
|
|
|
|
|
|
| |||||||||||||||||||||||||
Total | 4,817.2 | — | 370.1 | 54,199.5 | — | 284.4 | 59,016.7 | — | 654.5 | 410.2 | ||||||||||||||||||||||||||||||||||||
|
|
|
|
|
|
|
|
|
|
|
|
|
|
|
|
|
|
|
|
|
| |||||||||||||||||||||||||
Notes
ISR - in situ recovery
Estimates in the above table:
| • | use constant dollar average uranium prices of $57 to $59 (US) per pound U3O8 |
| • | are based on an average exchange rate of $1(US) = $1.15 to $1.25 (Cdn). |
Totals may not add up due to rounding.
METALLURGICAL RECOVERY
We report mineral reserves as the quantity of contained ore supporting our mining plans, and provide an estimate of the metallurgical recovery for each uranium property. The estimate of the amount of valuable product that can be physically
| 2015 ANNUAL INFORMATION FORM Page 74 | ||
recovered by the metallurgical extraction process is obtained by multiplying quantity of contained metal (content) by the planned metallurgical recovery percentage. The content and our share of uranium in the table above are before accounting for estimated metallurgical recovery.
Changes this year
The table below shows the change in our share of mineral reserves for each property in 2015. The change was primarily the result of production, which removed 30 million pounds from our mineral inventory. However, the decrease was partially offset due to the replacement of raiseboring with blasthole stoping in some areas of McArthur River, as well as additional information from drilling surface freezeholes at Cigar Lake, which both resulted in higher reserves when the related probable reserves were converted to proven reserves.
(thousands of pounds U3O8) | December 31, 2014 | Throughput(1) | Additions (deletions)(2) | December 31, 2015 | ||||||||||||
Proven mineral reserves | ||||||||||||||||
Cigar Lake | 54,431 | (5,822 | ) | 6,087 | 54,696 | |||||||||||
Crow Butte | 1,679 | (469 | ) | (510 | ) | 700 | ||||||||||
Inkai | 1,504 | (297 | ) | 0 | 1,207 | |||||||||||
Key Lake | 622 | (38 | ) | 0 | 584 | |||||||||||
McArthur River | 143,312 | (12,573 | ) | 46,264 | 177,003 | |||||||||||
North Butte-Brown Ranch | 1,370 | (660 | ) | 442 | 1,152 | |||||||||||
Rabbit Lake | 187 | (103 | ) | (5 | ) | 79 | ||||||||||
Smith Ranch-Highland | 2,369 | (1,288 | ) | 1,378 | 2,459 | |||||||||||
|
|
|
|
|
|
|
| |||||||||
Total | 205,474 | (21,250 | ) | 53,656 | 237,880 | |||||||||||
|
|
|
|
|
|
|
| |||||||||
Probable mineral reserves | ||||||||||||||||
Cigar Lake | 63,062 | 0 | (6,900 | ) | 56,162 | |||||||||||
Inkai | 44,140 | (3,649 | ) | 1,403 | 41,894 | |||||||||||
McArthur River | 97,651 | (640 | ) | (39,085 | ) | 57,926 | ||||||||||
North Butte-Brown Ranch | 1,494 | 0 | (802 | ) | 692 | |||||||||||
Rabbit Lake | 14,988 | (4,290 | ) | 1,145 | 11,843 | |||||||||||
Smith Ranch-Highland | 2,367 | 0 | 1,391 | 3,758 | ||||||||||||
Total | 223,702 | (8,579 | ) | (42,848 | ) | 172,275 | ||||||||||
|
|
|
|
|
|
|
| |||||||||
Total mineral reserves | 429,176 | (29,829 | ) | 10,808 | 410,155 | |||||||||||
|
|
|
|
|
|
|
| |||||||||
Notes
| (1) | Throughput corresponds to mill feed. The difference between 2015 mill feed and Cameco’s share of pounds U3O8 produced in 2015 is due to mill recovery, mill inventory and processing of low-grade material. |
| (2) | Additions and (deletions) come from reassessing geological data, gathering data from drilling, mining and milling, and reclassifying material as either a mineral reserve or a mineral resource as applicable. |
| 2015 ANNUAL INFORMATION FORM Page 75 | ||
Mineral resources
As at December 31, 2015 (100% basis – only the last column shows Cameco’s share)
Measured and indicated(tonnes in thousands; pounds in millions)
| Measured | Indicated | Total measured and indicated | ||||||||||||||||||||||||||||||||
Property | Mining method | Tonnes | Grade % U3O8 | Content (lbs U3O8) | Tonnes | Grade % U3O8 | Content (lbs U3O8) | Content (lbs U3O8) | Cameco’s share (lbs U3O8) | |||||||||||||||||||||||||
Cigar Lake | underground | 2.7 | 6.06 | 0.4 | 17.5 | 7.59 | 2.9 | 3.3 | 1.6 | |||||||||||||||||||||||||
Kintyre | open pit | — | — | — | 3,897.7 | 0.62 | 53.5 | 53.5 | 37.5 | |||||||||||||||||||||||||
McArthur River | underground | 62.0 | 3.83 | 5.2 | 4.8 | 3.02 | 0.3 | 5.6 | 3.9 | |||||||||||||||||||||||||
Millennium | underground | — | — | — | 1,442.6 | 2.39 | 75.9 | 75.9 | 53.0 | |||||||||||||||||||||||||
Wheeler River | underground | — | — | — | 166.4 | 19.13 | 70.2 | 70.2 | 21.1 | |||||||||||||||||||||||||
Rabbit Lake | underground | — | — | — | 1,402.7 | 0.86 | 26.7 | 26.7 | 26.7 | |||||||||||||||||||||||||
Tamarack | underground | — | — | — | 183.8 | 4.42 | 17.9 | 17.9 | 10.3 | |||||||||||||||||||||||||
Yeelirrie | open pit | 24,013.5 | 0.17 | 92.4 | 12,626.5 | 0.13 | 34.9 | 127.3 | 127.3 | |||||||||||||||||||||||||
Crow Butte | ISR | 1,418.2 | 0.21 | 6.6 | 1,354.9 | 0.29 | 8.6 | 15.2 | 15.2 | |||||||||||||||||||||||||
Gas Hills - Peach | ISR | 687.2 | 0.11 | 1.7 | 3,626.1 | 0.15 | 11.6 | 13.3 | 13.3 | |||||||||||||||||||||||||
Inkai | ISR | — | — | — | 31,366.1 | 0.08 | 52.6 | 52.6 | 30.3 | |||||||||||||||||||||||||
North Butte-Brown Ranch | ISR | 232.6 | 0.08 | 0.4 | 5,530.3 | 0.07 | 8.4 | 8.8 | 8.8 | |||||||||||||||||||||||||
Ruby Ranch | ISR | — | — | — | 2,215.3 | 0.08 | 4.1 | 4.1 | 4.1 | |||||||||||||||||||||||||
Shirley Basin | ISR | 89.2 | 0.16 | 0.3 | 1,638.2 | 0.11 | 4.1 | 4.4 | 4.4 | |||||||||||||||||||||||||
Smith Ranch - Highland | ISR | 1,241.9 | 0.11 | 2.9 | 14,338.1 | 0.05 | 16.9 | 19.8 | 19.8 | |||||||||||||||||||||||||
|
|
|
|
|
|
|
|
|
|
|
|
|
|
|
| |||||||||||||||||||
Total | 27,747.4 | — | 109.9 | 79,811.2 | — | 388.7 | 498.5 | 377.2 | ||||||||||||||||||||||||||
|
|
|
|
|
|
|
|
|
|
|
|
|
|
|
| |||||||||||||||||||
Inferred (tonnes in thousands; pounds in millions)
Property | Mining method | Tonnes | Grade % U3O8 | Content (lbs U3O8) | Cameco’s share (lbs U3O8) | Notes ISR –in situ recovery Mineral resources do not include amounts Mineral resources do not have | ||||||||||||||
Cigar Lake | underground | 284.7 | 16.43 | 103.1 | 51.6 | |||||||||||||||
Fox Lake | underground | 386.7 | 7.99 | 68.1 | 53.3 | |||||||||||||||
Kintyre | open pit | 517.1 | 0.53 | 6.0 | 4.2 | |||||||||||||||
McArthur River | underground | 344.2 | 7.72 | 58.6 | 40.9 | |||||||||||||||
Millennium | underground | 412.4 | 3.19 | 29.0 | 20.2 | |||||||||||||||
Wheeler River | underground | 842.5 | 2.38 | 44.1 | 13.2 | |||||||||||||||
Rabbit Lake | underground | 2,645.6 | 0.58 | 33.7 | 33.7 | |||||||||||||||
Tamarack | underground | 45.6 | 1.02 | 1.0 | 0.6 | |||||||||||||||
Crow Butte | ISR | 1,135.2 | 0.12 | 2.9 | 2.9 | |||||||||||||||
Gas Hills - Peach | ISR | 3,307.5 | 0.08 | 6.0 | 6.0 | |||||||||||||||
Inkai | ISR | 250,958.6 | 0.05 | 251.0 | 144.3 | |||||||||||||||
North Butte-Brown Ranch | ISR | 294.5 | 0.07 | 0.4 | 0.4 | |||||||||||||||
Ruby Ranch | ISR | 56.2 | 0.14 | 0.2 | 0.2 | |||||||||||||||
Shirley Basin | ISR | 508.0 | 0.10 | 1.1 | 1.1 | |||||||||||||||
Smith Ranch - Highland | ISR | 6,861.0 | 0.05 | 7.7 | 7.7 | |||||||||||||||
|
|
|
|
|
|
|
| |||||||||||||
Total | 268,599.9 | — | 613.0 | 380.5 | ||||||||||||||||
|
|
|
|
|
|
|
| |||||||||||||
| 2015 ANNUAL INFORMATION FORM Page 76 | ||
Changes this year
The table below shows the change in our share of mineral resources for each property in 2015. The change was mostly the result of:
| • | the addition of 4.5 million pounds U3O8 to indicated resources and 8 million pounds to inferred resources at Rabbit Lake from additional drilling, and from a revision to the equivalent grade formula |
| • | first time reporting for the Fox Lake deposit, on the Read Lake property near McArthur River, adding 53 million pounds U3O8 to inferred resources |
| • | the addition of 13 million pounds U3O8 of inferred resources from the Gryphon deposit on the Wheeler River property |
| • | a revised pit shell defining the mineral resources at Kintyre. |
(thousands of pounds U3O8) | December 31, 2014 | Additions (deletions) | December 31, 2015 | |||||||||
Measured mineral resources | ||||||||||||
Cigar Lake | 617 | (436 | ) | 181 | ||||||||
Crow Butte | 6,026 | 569 | 6,595 | |||||||||
Gas Hills – Peach | 1,667 | 0 | 1,667 | |||||||||
McArthur River | 5,522 | (1,862 | ) | 3,660 | ||||||||
North Butte-Brown Branch | 400 | 0 | 400 | |||||||||
Shirley Basin | 304 | 0 | 304 | |||||||||
Smith Ranch-Highland | 4,481 | (1,572 | ) | 2,909 | ||||||||
Yeelirrie | 92,382 | 0 | 92,382 | |||||||||
|
|
|
|
|
| |||||||
Total | 111,399 | (3,301 | ) | 108,098 | ||||||||
|
|
|
|
|
| |||||||
Indicated mineral resources | ||||||||||||
Cigar Lake | 1,748 | (280 | ) | 1,468 | ||||||||
Crow Butte | 8,599 | 0 | 8,599 | |||||||||
Gas Hills – Peach | 11,632 | 0 | 11,632 | |||||||||
Inkai | 29,991 | 265 | 30,256 | |||||||||
Kintyre | 38,657 | (1,193 | ) | 37,464 | ||||||||
McArthur River | 1,859 | (1,637 | ) | 222 | ||||||||
Millennium | 53,040 | 0 | 53,040 | |||||||||
North Butte – Brown Ranch | 8,357 | 0 | 8,357 | |||||||||
Wheeler River | 21,060 | 0 | 21,060 | |||||||||
Rabbit Lake | 22,177 | 4,530 | 26,707 | |||||||||
Ruby Ranch | 4,078 | 0 | 4,078 | |||||||||
Shirley Basin | 4,085 | 0 | 4,085 | |||||||||
Smith Ranch-Highland | 17,055 | (154 | ) | 16,901 | ||||||||
Tamarack | 10,288 | 0 | 10,288 | |||||||||
Yeelirrie | 34,935 | 0 | 34,935 | |||||||||
|
|
|
|
|
| |||||||
Total | 267,561 | 1,531 | 269,092 | |||||||||
|
|
|
|
|
| |||||||
Total measured and indicated mineral resources | 378,960 | (1,770 | ) | 377,190 | ||||||||
|
|
|
|
|
| |||||||
| 2015 ANNUAL INFORMATION FORM Page 77 | ||
(thousands of pounds U3O8) | December 31, 2014 | Additions (deletions)(1) | December 31, 2015 | |||||||||
Inferred mineral resources | ||||||||||||
Cigar Lake | 52,545 | (953 | ) | 51,592 | ||||||||
Crow Butte | 2,893 | 0 | 2,893 | |||||||||
Fox Lake | 53,284 | 53,284 | ||||||||||
Gas Hills – Peach | 6,041 | 0 | 6,041 | |||||||||
Inkai | 145,940 | (1,607 | ) | 144,333 | ||||||||
Kintyre | 6,719 | (2,525 | ) | 4,194 | ||||||||
McArthur River | 39,872 | 1,026 | 40,898 | |||||||||
Millennium | 20,243 | 0 | 20,243 | |||||||||
North Butte/Brown Ranch | 422 | 0 | 422 | |||||||||
Wheeler River | 330 | 12,911 | 13,241 | |||||||||
Rabbit Lake | 25,855 | 7,852 | 33,707 | |||||||||
Ruby Ranch | 167 | 0 | 167 | |||||||||
Shirley Basin | 1,132 | 0 | 1,132 | |||||||||
Smith Ranch-Highland | 7,878 | (150 | ) | 7,728 | ||||||||
Tamarack | 591 | 0 | 591 | |||||||||
|
|
|
|
|
| |||||||
Total inferred mineral resources | 310,628 | 69,838 | 380,466 | |||||||||
|
|
|
|
|
| |||||||
Notes
| (1) | Additions and (deletions) come from reassessing geological data, gathering data from drilling, mining and milling, and reclassifying material as either a mineral reserve or a mineral resource, as applicable. |
| (2) | Mineral resources do not include amounts that have been identified as mineral reserves. |
Key assumptions, parameters and methods
McArthur River
Key assumptions
| • | Mineral reserves have been estimated with an average allowance of approximately 18% dilution from backfill and mineralized waste mined and a mining recovery of 97.7%. Mineral resources do not include such allowances. |
| • | Mineral resources are estimated at a minimum mineralized thickness of 1.0 metre and at a minimum grade of 0.1% to 0.5% U3O8 depending upon the underground extraction methods. Mineral reserves are estimated at a cut-off grade of 0.78% U3O8. |
| • | A constant dollar average uranium price of $58 (US) per pound U3O8 with a $1.00 (US) = $1.15 (Cdn) fixed exchange rate was used to estimate mineral reserves. |
Key parameters
| • | The uranium grade is determined from assay samples where available, or by converting radiometric probing values to equivalent % U3O8 based on a correlation between radiometric counts and assay values. |
| • | Densities are determined using formulas based on density measurements of drill core and chemical assay grades. |
| • | Mineral reserves at McArthur River are estimated based on the use of raisebore, boxhole and blasthole stope mining methods combined with freeze curtains. |
| • | The production schedule assumes 19.6 million pounds U3O8 (which includes processing downblended material at Key Lake) until 2017. Between 2018 and 2031, an average annual production of 22 million pounds U3O8 is forecast (which includes processing downblended material at Key Lake). Estimated production then begins to decrease in two distinct steps towards the end of the mine life. |
Key methods
| • | Mineral resources were estimated using cross-sectional method and 3-dimensional block models and mineral reserves were estimated with 3-dimensional block models. |
| 2015 ANNUAL INFORMATION FORM Page 78 | ||
| • | The models were created from the geological interpretation on section and plan derived from surface and underground drillhole information. Estimates of block grade and density were obtained with ordinary kriging or inverse squared distance methods. |
| • | The mining application used was Maptek Vulcan. |
Cigar Lake
Key assumptions
| • | Mineral reserves have been estimated with an average allowance of 26% dilution at 0% U3O8, inclusive of 0.5 m of dilution material above and below the planned cavity. |
| • | Mineral reserves have been estimated based on 90% mining recovery. Mineral resources do not include such allowances. |
| • | Mining rate assumed to vary between 100 and 200 tonnes per day and a full mill production rate of approximately 18 million pounds U3O8 per year. |
| • | Areas being mined must meet specific ground freezing requirements before jet boring begins. |
| • | A constant dollar average uranium price of $58.69 (US) per pound U3O8 with a $1.00 (US) = $1.16 (Cdn) fixed exchange rate was used to estimate the mineral reserves. |
Key parameters
| • | Grades of U3O8 were obtained from chemical assaying of drill core or from equivalent %U3O8 grades obtained from radiometric probing results. In areas of poor core recovery (< 75%) or missing samples, the grade was determined from probing. |
| • | A correlation between uranium, nickel, cobalt and clay content and density was applied where the density was not directly measured for each sample. |
| • | Mineral resources have been estimated using a minimum mineralization thickness of 1.0 metre and a minimum grade of 1.0% U3O8. |
| • | Mineral reserves have been estimated on the basis of designed JBS cavities containing greater than 9,000 lbs of recovered uranium. |
Key methods
| • | The geological interpretation of the orebody was done on section and plan views and in 3D derived from drillhole information. Mineral resources and mineral reserves were estimated using a 3-dimensional block model. Geostatistical conditional simulation (with sequential Gaussian simulation) and inverse distance squared were used to estimate the grade and density of the different areas. |
| • | The mining applications used were Maptek Vulcan and Leapfrog Geo. |
Inkai
| • | The estimated mineral resources and reserves at Inkai are located in blocks 1 and 2. |
| • | The resource models follow the Kazakhstan State Committee of Mineral Reserves (GKZ) guide and use theGrade-Thickness (GT) estimation method on 2-dimensional blocks in plan. They were created by JSC Volkovgeology, a subsidiary of Kazatomprom which is responsible for prospecting, exploration and development of uranium deposits in Kazakhstan. We performed a validation of the Kazakh reserves estimate for block 1 in 2003, and confirmed the estimated pounds of uranium to within 2.5% of the Kazakh estimate. The Kazakh estimate was also validated by an independent consulting firm in 2005. In 2007, we and an independent consulting firm verified the block 2 Kazakh mineral reserves estimate and obtained results that were consistent with the Kazakh estimate. |
| • | Historic drilling pattern densities over blocks 1 and 2 were sufficient to satisfy the Kazakhstan State Reserve Commission requirements in defining reserves in the C2, C1 and B categories within block 1 and C2 and C1 categories within block 2. |
| • | Our reconciliation of the Kazakh classification system to the CIM standard definitions are set out in Section 6.3 (Table 6-4) of the Inkai technical report. We correlate Kazakhstan’s reserves categories B, C1 and C2 to NI 43-101 mineral resource categories of measured, indicated and inferred. We plan to review this correlation in light of the alignment of the Kazakh resources classification code with the Committee for Mineral Reserves International Reporting Standards (CRIRSCO) template and of the acceptance of the Russian NAEN code by the Canadian Securities Administrators. |
| 2015 ANNUAL INFORMATION FORM Page 79 | ||
Key assumptions
| • | Dilution and mining loss are not relevant factors because Inkai uses in situ recovery as the uranium extraction method. The recovery obtained from the in situ leaching process is included in the metallurgical recovery. |
| • | Mineral reserves have been estimated at a minimum grade-thickness of 0.130 m% U3O8. |
| • | A constant dollar average uranium price of $59 (US) per pound U3O8 with a $1.00 (US) = $1.15 (Cdn) fixed exchange rate was used to estimate mineral reserves. |
Key parameters
| • | Grades (%U3O8) were obtained from downhole gamma radiometric probing of drillholes, checked against assay results and prompt-fission neutron probing results in order to account for disequilibrium. |
| • | An average density of 1.70 t/m3 was used, based on historical and current sample measurements. |
| • | In situ recovery production rates are planned at a full production rate of 5.2 million lbs of U3O8 per year based on 85% recovery. |
Key methods
| • | The geological interpretation of the orebody outline was done on section and plan views derived from drillhole and core information. |
| • | Mineral resources and mineral reserves were estimated with the grade-thickness method using 2-dimensional block models. |
| • | The mining applications used were AtomGeo and Maptek Vulcan. |
Sustainable development
We want to bring the multiple benefits of clean, safe and reliable nuclear energy to the world, and are committed to delivering our products responsibly.
For us, sustainable development is a management philosophy and process that helps us:
| • | build trust, credibility and corporate reputation |
| • | gain and protect community support to operate and grow |
| • | attract and retain employees |
| • | manage risk |
| • | drive innovation and continual improvement to build competitive advantage. |
Rather than viewing sustainable development as an “add-on” to traditional business activity, we see it as an integral component to the way we do business. We aim to integrate sustainable development principles and practices at each level of our operations, including featuring them in our objectives and our approach to compensation.
We have developed a corporate social responsibility policy (CSR policy) that defines our standards and expectations for sustainable development throughout the company. Under the CSR policy:
| • | our goal is to be recognized as a leader in corporate social responsibility by proactively addressing the social, environmental and financial aspects of our business with key stakeholders; and |
| • | we seek to integrate corporate social responsibility in our day to day business, and achieve strong performance in our four key measures of success: a safe, healthy and rewarding workplace, a clean environment, supportive communities and outstanding financial performance. |
We seek to implement our CSR policy by including commitments based upon these four key measures of success:
Safe, healthy and rewarding workplace
We are committed to having a safe, healthy and rewarding workplace that reflects the diversity of the communities in which we operate. One of the ways we implement this commitment is through our safety, health, environment and quality policy. See Safety, Health and Environment starting at page 81 for more information about this policy.
| 2015 ANNUAL INFORMATION FORM Page 80 | ||
Clean environment
We are committed to continually improving our overall environmental performance throughout the lifecycle of our operations. See Safety, Health and Environment starting at page 81 for how we implement this commitment.
Supportive communities
We are committed to building long-lasting and trusting relationships with the communities in which we operate. One of the ways we implement this commitment is through our Five Pillar CSR Strategy, which is described below.
Outstanding financial performance
We are committed to managing our business in a way that ensures long term financial stability and profitability.
Our CSR policy describes further what we do to implement these commitments.
Our chief executive officer is responsible for ensuring compliance with our CSR policy and implementation of its supporting policies and programs.
Five Pillar CSR Strategy
Over more than 26 years of operation and partnership in northern Saskatchewan, we have developed a comprehensive Five Pillar CSR Strategy aimed at ensuring the support of the communities with whom we work, all across our operations globally. The strategy is flexible and is implemented by our global operations at a local level to reflect the needs of the local communities.
While developed in part as a result of some of the socio-economic obligations that are contained in our surface lease agreements with the Saskatchewan government, the bulk of the strategy has evolved as a result of the commercial benefits we see from ensuring strong support among local communities wherever we operate. The pillars are:
1. TheWorkforce Development pillar delivers programming that aims to build educational and skills capacity in local communities. The goal of this pillar is to ensure that students stay in school, have the means to attend post-secondary education, and receive training to facilitate employment opportunities in our industry.
2. TheBusiness Development pillar is designed to promote the involvement of locally-owned businesses in contracting opportunities at our operations, and to provide additional jobs, revenue streams and capacity building at the local community level. We work with local contractors in a variety of ways, including by providing updates on contracting opportunities. In northern Saskatchewan, we also have a Northern Preferred Supplier program, which gives preference to majority-owned northern companies and helps to build a long-term relationship between northern contractors and ourselves.
3. TheCommunity Engagement pillaris designed with the objective to ensure that we secure support for our operations from local communities and satisfy the obligations placed on us by regulators and laws. While the main activities here are focused specifically on the communities in closest proximity to our operations, in northern Saskatchewan, we also ensure that the greater region is kept informed of our operations, whether it is through our yearly community tours or community focused websites.
4. TheCommunity Investment pillar is designed to help local communities with much-needed funding for community programming and infrastructure. Through this pillar, we look to support community initiatives that are focused on youth, education and literacy, health and wellness and community development.
5. TheEnvironmental Stewardship pillar, the most recent addition to the strategy, is designed to support our overall environmental programming. It is intended to provide communities with a voice in both the formal environmental assessment regulatory process, as well as ongoing monitoring activities.
Safety, Health and Environment
We introduced our safety, health, environment and quality (SHEQ) policy (SHEQ Policy) in 1991. We have refined our approach over the years and have since developed our overall integrated SHEQ management system.
The SHEQ Policy, which was reviewed and reissued in 2015, includes our statement of principles and identifies the seven programs that comprise the SHEQ management system, which implements the SHEQ Policy and supports these principles.
| 2015 ANNUAL INFORMATION FORM Page 81 | ||
Our principles
| • | prevent injury, ill health and pollution |
| • | comply with and move beyond legal and other requirements |
| • | keep risks at levels as low as reasonably achievable, accounting for social and economic factors |
| • | ensure quality of processes, products and services |
| • | continually improve our overall performance. |
SHEQ management system
The seven programs that comprise Cameco’s SHEQ management system are as follows:
| • | Quality management program |
| • | Safety and health management program |
| • | Radiation protection program |
| • | Environmental management program |
| • | Management system audit program |
| • | Emergency preparedness and response program |
| • | Contractor management program. |
We benchmark our system against those used by other companies in the mining and nuclear power generation sectors. On behalf of the board, the safety, health and environment committee oversees our SHEQ Policy and management system as well as our safety and environmental performance. Our chief executive officer is responsible for ensuring this system is established and maintained across the company.
Our SHEQ management system is centralized and managed at the corporate level. It is implemented across the corporation as a whole with a focus on our operations.
Corporate SHEQ activity at our operations focuses on consistent application of programs and procedures, and providing support for identified issues. Each of our sites is responsible for conducting internal audits to make sure their programs meet Cameco standards and comply with regulatory requirements. The SHEQ management system is also part of our program to manage environmental risks at our operations and meet the requirements of ISO 14001. All of our operating sites are ISO 14001 certified. In addition, we have now transitioned from individual site-based ISO 14001 certifications to a single corporate certification. We expect to roll the majority of our operations into this single certification.
In 2015, we invested:
| • | $77 million in environmental protection, monitoring and assessment programs, approximately the same amount as in 2014 |
| • | $31 million in health and safety programs (29% more than 2014 as a result of spending on ventilation improvements at McArthur River). |
Spending on environmental programs is expected to increase slightly in 2016, while spending on health and safety programs is expected to decrease towards the amount spent in 2014.
There were no environmentally significant incidents in 2015.
In 2015, we continued to achieve solid and improving safety performance at our operations.
Focus on the environment
Our business by its nature has an impact on the environment, so environmental performance is a key area of focus for us.
Our focus in this regard is reinforced by our systematic approach to SHEQ issues. We have integrated this approach into activities at our operating properties and our planning process for major projects. We also have conceptual decommissioning plans in place for all of our operating sites.
We report our performance annually. You can find this information on our website (cameco.com) and in our sustainable development report, which is also available on our website.
| 2015 ANNUAL INFORMATION FORM Page 82 | ||
Reducing our impact
We have been carrying out our long-term plan to reduce the impact we have on the environment. This includes assessing, monitoring and reducing our effect on air, water and land, optimizing the amount of energy we consume, and managing the effects of waste.
We are investing in management systems and safety initiatives to achieve operational excellence and reliability, and this continues to improve our safety and environmental performance and operating efficiency. We have also incorporated life cycle value assessment (LCVA) into our project management and engineering processes to ensure social, environmental and financial risks have been more fully considered when designing new facilities.
Like other large industrial organizations, we use chemicals in our operations that could be hazardous to our health and the environment if they are not handled correctly. We train our employees in the proper use of hazardous substances and in emergency response techniques.
We work with communities who are affected by our activities by informing them of what we are doing and to obtain feedback and further input, to build and sustain their trust. In Saskatchewan, we participate in the Athabasca Working Group and Northern Saskatchewan Environmental Quality Committee.
In Ontario, we liaise with the community by regularly holding educational and environment-focused activities including through our Community Forum series, our presence at the Port Hope Fair, our regular community newsletters and ongoing communication with local elected officials and community leaders.
Land
Cameco’s North American operating sites affect a relatively small area compared to what would be required to generate the same amount of energy using other technologies.
Our mines in northern Saskatchewan are underground mines so the impact on the surface land is minimal. We use ISR mining in our US operations to extract uranium from underground non-potable, brackish aquifers, so the impact on the surface there is also minimal.
Water
We look to improve processes and adopt new technologies to improve how we manage water, and the effect it has on receiving water bodies. At McArthur River, we reduced our consumption of surface water by approximately 50% as a result of increased recycling initiatives. Another example of environmental improvement was the restoration of the Hammer Lake outlet and access road decommissioning, including the replacement of culverts with an open channel to improve fish passage and fish habitat.
United States
The ISR method we use in our US operations involves extracting uranium from underground non-potable aquifers by dissolving the uranium with a carbonate-based water solution and pumping it to a processing facility on the surface. After mining has been completed, an ISR wellfield must be restored according to regulatory requirements. This generally involves restoring the groundwater to its pre-mining state or equivalent class of use water standard. In the US, we are not only working to improve the groundwater restoration process, but also on waste reduction programs. We are also involved in industry leading research and innovation in groundwater restoration at in situ recovery operations.
We have 10 wellfields under restoration. See page 86 for more information.
Kazakhstan
The ISR mining method we use at Inkai uses an acid in the mining solution to extract uranium from undergroundnon-potable aquifers. The injection and recovery system is engineered to prevent the mining solution from migrating to the aquifer above the orebody, which has water with higher purity.
Kazakhstan does not require active restoration of post-mining groundwater. After a number of decommissioning steps are taken, natural attenuation of the residual acid in the mined out horizon, as a passive form of groundwater restoration, has been accepted. Attenuation is a combination of neutralization of the groundwater residual acid content by interaction with the host
| 2015 ANNUAL INFORMATION FORM Page 83 | ||
rock minerals and other chemical reactions which immobilize residual groundwater contaminants in the mined-out subsoil horizon. This approach is considered acceptable because it results in water quality similar to the pre-mining baseline status.
Air
The table below shows our most recent data on our greenhouse gas emissions. We follow the general guidelines outlined by theIntergovernmental Panel on Climate Change to qualify greenhouse gas emissions.
| 2015 | 2014 | 2013 | ||||||||||
Greenhouse gas emissions(1) of tonnes of CO2 equivalent (CO2e) | 505,330 | (2) | 548,247 | 519,263 | ||||||||
Notes
| (1) | Greenhouse gas emissions include carbon dioxide, methane, nitrous oxide, sulphur hexafluoride, hydrofluorocarbons (HFCs), and perfluorocarbons (PFCs) expressed as a carbon equivalent (CO2e). |
| (2) | This number is a preliminary estimate and the final number will be available in our 2016 sustainable development report. |
While greenhouse gas emissions were slowly increasing since 2005, 2015 saw a reduction to below 2013 numbers due in part to our reduced project activity. As expected, the expansion of our operations has caused increases in fuel consumption, and therefore emissions.
Port Hope
In 2011, we lowered emissions of uranium and hydrofluoric acid to the air by installing new equipment and changing the operating procedures. Our fuel services division has since focused on improving the monitoring of some emission sources and in 2014 established a process for setting an objective for reducing uranium in air emissions. These efforts are seeing positive results. Further, after installing a scrubber in 2014, we managed to sustain a nearly 50% reduction in uranium in air emissions in 2015.
McArthur River
McArthur River has a large refrigeration plant that produces cold brine used for freezing the area of the deposit to be mined. The plant uses refrigerants, but they are not ozone-depleting chemicals that harm the earth’s atmosphere.
Cigar Lake
Cigar Lake has a large refrigeration plant that produces cold brine used for freezing the area of the deposit to be mined. The plant uses refrigerants, but they are not ozone-depleting chemicals that harm the earth’s atmosphere.
Rabbit Lake
While our current emissions meet all regulatory requirements, substantial upgrades to the acid plant at Rabbit Lake have resulted in more than a 60% reduction in the mean SO2 stack emissions (to 85 kg/day from 300 kg/day).
Waste
Our mines and mills in northern Saskatchewan account for most of the tailings and waste rock our operations generate.
We treat the mill tailings at Rabbit Lake and Key Lake to stabilize contaminants before depositing them in tailings management facilities (in mined-out open pits near the mills).
We divert groundwater and surface water around the tailings management facilities, monitor the water to make sure it is not impacted by the tailings, and treat it if necessary. We monitor runoff and treat water from waste rock piles as needed. We stockpile some waste rock to blend with higher grade ores. We contour other waste rock piles and revegetate them before decommissioning the site. We plan to continue to monitor groundwater after the facility has been decommissioned.
In 2015, we took steps to address legacy waste at several of our operations. In particular, our legacy waste management plan within fuel services included the shipment of over 4,000 historically contaminated drums to a licensed facility. This is about 20% of the total number of drums remaining for disposal. In addition, all of our Saskatchewan mining operations addressed historical laydown areas of contaminated material.
| 2015 ANNUAL INFORMATION FORM Page 84 | ||
Complying with environmental regulations
Our business is required to comply with laws and regulations that are designed to protect the environment and control the management of hazardous wastes and materials. Some laws and regulations focus on environmental issues in general, and others are specifically related to mining and the nuclear sector. They change often, with requirements increasing, and existing standards are being applied more stringently. While this dynamic promotes continuous improvement, it can increase expenses and capital expenditures, or limit or delay our activities.
Government legislation and regulation in various jurisdictions establish standards for system performance, standards, objectives and guidelines for air and water quality emissions, and other design or operational requirements for the various SHEQ components of our operations and the mines that we plan to develop. In addition, we must complete an environmental assessment before we begin developing a new mine or start processing activities, or make any significant change to our operations. Once we have permanently stopped mining and processing activities, we are required to decommission and reclaim the operating site to the satisfaction of the regulators, and we may be required to actively manage former mining properties for many years.
Canada
Not only is there ongoing regulatory oversight by the Canadian Nuclear Safety Commission (CNSC), the Saskatchewan Ministry of the Environment, the Ontario Ministry of the Environment, and Environment Canada, but there is also public scrutiny of the impact our operations have on the environment.
The CNSC, an independent regulatory authority established by the federal government under theNuclear Safety and Control Act (NSCA), is our main federal regulator in Canada. It regulates our compliance with the NSCA and is the federal lead for environmental assessments required to be carried out under theCanadian Environmental Assessment Act, 2012, which was introduced as part of the federal government’s responsible resource development policy.
The primary objectives of an environmental assessment are to ensure that:
| • | potential adverse environmental effects are considered before proceeding with a project |
| • | projects that cause unjustifiable, significant adverse environmental effects are not permitted to proceed |
| • | appropriate measures are implemented, where necessary, to mitigate risk. |
Plans to expand production or build new mines in Saskatchewan are subject to this process. In certain cases, a review panel may be appointed and public hearings held.
Over the past few years, CNSC audits of our operations have focused on the following SHEQ programs:
• radiation protection
• environmental monitoring
• fire protection
• operational quality assurance
• organization and management systems effectiveness | • transportation systems
• geotechnical monitoring
• training
• ventilation systems. |
Improving our environmental performance is challenging and we have a number of activities underway:
| • | improving uranium emissions from different systems at the Port Hope conversion facility to meet the newly established objective |
| • | focusing on maintaining our excellent water quality while increasing production at our facilities. |
Efforts like these often require additional environmental studies near the operations, and we will continue to undertake these as required.
It can take a significant amount of time for regulators to make requested changes to a licence or grant a requested approval because the activity may require an environmental assessment or an extensive review of supporting technical data, management programs and procedures. We are improving the quality of our proposals and submissions and have introduced
| 2015 ANNUAL INFORMATION FORM Page 85 | ||
a number of programs to ensure we continue to comply with regulatory requirements, but this has also increased our capital expenditures and our operating costs.
As our SHEQ management system matures, regulators continue to review our programs and recommend ways to improve our SHEQ performance. These recommendations are generally procedural and do not involve large capital costs, although systems applications can be significant and result in higher operating costs.
We believe that regulatory expectations of the CNSC and other federal and provincial regulators will continue to evolve, and lead to changes to both requirements and the regulatory framework. This will likely increase our expenses.
United States
Our ISR operations in the US have to meet federal, state and local regulations governing air emissions, water discharges, handling and disposal of hazardous materials and site reclamation, among other things.
Mining activities have to meet comprehensive environmental regulations from the US Nuclear Regulatory Commission (NRC), Bureau of Land Management, Environmental Protection Agency (EPA) and state environmental agencies. The process of obtaining mine permits and licences generally takes several years, and involves environmental assessment reports, public hearings and comments. We have the permits and licences for the US operations that we need to meet our 2016 production plans.
After mining is complete, ISR wellfields have to be restored according to regulatory requirements. This generally involves restoring the groundwater to its pre-mining state or equivalent class of use water standard. Restoration of Crow Butte wellfields is regulated by the Nebraska Department of Environmental Quality and the NRC. Restoration of SmithRanch-Highland wellfields is regulated by the Wyoming Department of Environmental Quality and the NRC.
The EPA is proposing to add new health and environmental protection standards to regulate by-product materials produced by uranium in situ recovery. The proposed rule includes surface and subsurface standards, with a primary focus on groundwater protection, restoration and stability. One of the most significant proposed requirements is that groundwater must be monitored for 30 years after restoration. We are working with other industry participants and associations to respond to the proposed requirements, including making written submissions and appearing at the EPA hearings in 2015. In our view, as argued in written submissions and in the EPA hearings, the proposed rulemaking will result in a regulatory framework that is more subjective and arbitrary than protective. The rulemaking is currently proceeding despite the history of performance of in situ facilities, the use of a cost-benefit analysis that is in our opinion inadequate, and scientific research that is expected to come shortly that we believe will shed light on the issues being raised. The EPA is expected to publish the new rule in December 2016.
See page 89 for the status of wellfield restoration and regulatory approvals.
Kazakhstan
In its resource use contract with the Kazakhstan government, Inkai committed to conducting its operations according to good international mining practices. It complies with the environmental requirements of Kazakhstan legislation and regulations, and, as an industrial company, it must also reduce, control or eliminate various kinds of pollution and protect natural resources. Inkai is required to submit annual reports on pollution levels to the Kazakhstan environmental, tax and statistics authorities. The authorities conduct tests to validate Inkai’s results.
Environmental protection legislation in Kazakhstan has evolved rapidly, especially in recent years. As the subsoil use sector has evolved, there has been a trend towards greater regulation, heightened enforcement and greater liability fornon-compliance. The most significant development was the adoption of theEcological Code, dated January 9, 2007 and in effect as of February 3, 2007. This code replaced the three main laws that had related to environmental protection. Amendments were made to the code in December 2011 that include more stringent environmental protection regulations, particularly relating to the control of greenhouse gas emissions, obtaining environmental permits, state monitoring requirements and other similar matters.
| 2015 ANNUAL INFORMATION FORM Page 86 | ||
Inkai is required to comply with environmental requirements during all stages of the project, and must develop an environmental impact assessment for examination by a state environmental expert before making any legal, organizational or economic decisions that could have an effect on the environment and public health.
Under theEcological Code, Inkai needs an environmental permit to operate. The permit certifies the holder’s right to discharge emissions into the environment, provided that it complies with the requirements of the permit and theEcological Code. Inkai has a permit for environmental emissions and discharges that is valid until December 2016 and an emissions permit for drilling activities that is valid until December 2016. Inkai also holds the required permits under theWater Code.
Government authorities and the courts enforce compliance with these permits, and violations can result in the imposition of administrative, civil or criminal penalties, the suspension or stopping of operations, orders to pay compensation, orders to remedy the effects of violations and orders to take preventive steps against possible future violations. In certain situations, the issuing authority may suspend or revoke the permits.
Inkai has environmental insurance, as required by theEcological Code and the resource use contract. Inkai also has voluntary civil liability insurance for environment protection.
Nuclear waste management and decommissioning
Once we have permanently stopped mining and processing activities, we are required to decommission the operating sites. This includes reclaiming all waste rock and tailings management facilities and the other areas of the site affected by our activities to the satisfaction of regulatory authorities.
Estimating decommissioning and reclamation costs
We develop conceptual decommissioning plans for our operating sites and use them to estimate our decommissioning costs. We also submit them to regulators to determine the amount of financial assurance we must provide to secure our decommissioning obligations. Our plans include reclamation techniques that we believe generate reasonable environmental and radiological performance. Regulators give “conceptual approval” to a decommissioning plan if they believe the concept is reasonable.
We started conducting reviews of our conceptual decommissioning plans for all Canadian sites in 1996. We typically review them every five years, or when we amend or renew an operating licence. We review our cost estimates for both accounting purposes and licence applications. For our US sites, they are reviewed annually. A preliminary decommissioning plan has been established for Inkai. The plan is updated every five years or as significant changes take place, which would affect the decommissioning estimate.
As properties approach or go into decommissioning, regulators review the detailed decommissioning plans. This can result in additional regulatory process, requirements, costs and financial assurances.
At the end of 2015, our estimate of total decommissioning and reclamation costs was $975 million. This is the undiscounted value of the obligation and is based on our current operations. We had accounting provisions of $917 million at the end of 2015 (the present value of the $975 million). Since we expect to incur most of these expenditures at the end of the useful lives of the operations they relate to, our expected costs for decommissioning and reclamation for the next five years are not material.
We provide financial assurances for decommissioning and reclamation as letters of credit to regulatory authorities, as required. We had a total of $1 billion in letters of credit supporting our reclamation liabilities at the end of 2015. All of our North American operations have letters of credit in place that provide financial assurance in connection with our preliminary plans for decommissioning for the sites.
Please also see note 17 to our 2015 financial statements for our estimate of decommissioning and reclamation costs and related letters of credit.
| 2015 ANNUAL INFORMATION FORM Page 87 | ||
Canada
Decommissioning estimates
(100% basis)
McArthur River | $ | 48 million | ||
Rabbit Lake | $ | 203 million | ||
Key Lake | $ | 218 million | ||
Cigar Lake | $ | 49 million |
As part of the licensing process in 2013 for McArthur River, Rabbit Lake, Key Lake and Cigar Lake, the preliminary decommissioning plans for each facility were updated and submitted to the CNSC staff. Our Key Lake decommissioning estimate was further revised and submitted to the CNSC in 2014 and we received final approval of the decommissioning estimate from the CNSC in January 2015. Letters of credit for McArthur River, Key Lake, Rabbit Lake, and Cigar Lake are in place and reflect the current decommissioning cost estimate.
The reclamation and remediation activities associated with waste rock and tailings from processing Cigar Lake ore and uranium solution are covered in the plans and cost estimates for the facility that will be processing it.
Decommissioning estimates
(100% basis)
| Port Hope | $102 million (an updated estimate is currently under regulatory review) | |
| Blind River | $39 million | |
| CFM | $20 million |
We renewed our licences for Port Hope, Blind River and CFM in 2012. As part of that process, in 2011, the preliminary decommissioning plans for each facility were accepted by the CNSC staff and all three letters of credit were updated in April 2012 after the licence renewals were granted.
Historical waste
When Cameco was formed, we assumed ownership and primary responsibility for managing the waste already existing at the time of the reorganization. This historical waste was all in Ontario, at the historical facilities, which include the Port Hope Conversion Facility, Blind River Refinery, Port Granby Waste Management Facility, Welcome Waste Management Facility and the Centre Pier in Port Hope.
In March 2004, we reached an agreement to transfer two historical facilities and their associated liabilities to the Government of Canada: the Welcome Waste Management Facility and the Port Granby Waste Management Facility. We transferred the Welcome Waste Management Facility and the Port Granby Waste Management Facility to Natural Resources Canada on March 31, 2010 and March 29, 2012, respectively.
In March 2012, we entered into a settlement with Canada Eldor Inc., the entity established by the federal government to assume the historical liabilities and obligations of Eldorado Nuclear Limited, regarding liability for historical waste located at the historical facilities. We are now responsible for all liabilities and costs and expenses related to historical waste and the remaining historical facilities owned or leased by us, which are the Port Hope Conversion Facility, the Blind River Refinery and the Centre Pier in Port Hope.
Recycling uranium byproducts
We have arrangements with two facilities for processing certain uranium-bearing byproducts from Blind River and Port Hope. An agreement has been in place with the White Mesa mill in Blanding, Utah for a number of years. Arrangements for recycling of this material are also in place at our Key Lake mill. We received regulatory approval from the Saskatchewan government for this process in 2003, and were advised by the CNSC in 2011 that the project could proceed. Recycled byproduct material has been successfully processed at Key Lake since 2014.
| 2015 ANNUAL INFORMATION FORM Page 88 | ||
United States
After mining has been completed, an ISR wellfield has to be restored according to regulatory requirements. This generally involves restoring the groundwater to its pre-mining state or equivalent class of water standard.
For wellfield restoration to be complete, regulatory approval is required. It is difficult for us to estimate the timing for wellfield restoration due to the uncertainty in timing for receiving final regulatory approval.
Crow Butte
Restoration of Crow Butte wellfields is regulated by the Nebraska Department of Environmental Quality and the NRC. There are five wellfields being restored at Crow Butte. The groundwater at mine unit #1 has been restored topre-mining quality standards, all wells are plugged and the piping removed.
Our estimated cost of decommissioning the property is $46 million (US). We have provided the State of Nebraska with a $46 million (US) letter of credit as security for decommissioning the property.
Smith Ranch-Highland
Restoration of Smith Ranch-Highland wellfields is regulated by the Wyoming Department of Environmental Quality and NRC. There are seven wellfields being restored at Smith Ranch-Highland, one wellfield in stability, and two wellfields (mine unit A and mine unit B) that have been fully restored.
The restoration of mine unit B has been approved by the Wyoming Department of Environmental Quality, and we will need to submit an application for an Alternate Concentration Limit to the NRC for approval.
Our estimated cost of decommissioning the property is $228 million (US), including North Butte. We have provided the State of Wyoming with $240 million (US) in letters of credit as security for decommissioning the property.
Kazakhstan
Inkai is subject to decommissioning liabilities, largely defined by the terms of the resource use contract. Inkai has established a separate bank account and made the required contributions to the account as security for decommissioning. Contributions are set as a percentage of gross revenue and are capped at $500,000 (US). Inkai has funded the full amount.
Under the resource use contract, Inkai must submit a plan for decommissioning the mining facility to the government six months before mining activities are complete. Inkai has established a preliminary plan and an estimate of total decommissioning costs of $9 million (US). It updates the plan every five years, or when there is a significant change at the operation that could affect decommissioning estimates.
Groundwater is not actively restored post-mining in Kazakhstan. See page 83 for additional details.
The regulatory environment
This section, and the sectionComplying with environmental regulations starting on page 85, discuss some of the more significant government controls and regulations that have a material effect on our business. A significant part of our economic value depends on our ability to comply with the extensive and complex laws and regulations that govern our activities. We are not aware of any proposed legislation or changes to existing legislation that could have a material effect on our business.
International treaty on the non-proliferation of nuclear weapons
The Treaty on the Non-Proliferation of Nuclear Weapons (NPT) is an international treaty that was established in 1970. It has three objectives:
| • | to prevent the spread of nuclear weapons and weapons technology |
| • | to foster the peaceful uses of nuclear energy |
| • | to further the goal of achieving general and complete disarmament. |
| 2015 ANNUAL INFORMATION FORM Page 89 | ||
The NPT establishes a safeguards system under the responsibility of the International Atomic Energy Agency. Almost all countries are signatories to the NPT, including Canada, the US, the United Kingdom and France. We are therefore subject to the NPT and comply with the International Atomic Energy Agency’s requirements.
Industry regulation and permits
Canada
Our Canadian operations have regulatory obligations to both the federal and provincial governments. There are four main regulatory agencies that issue licences and approvals:
| • | CNSC (federal) |
| • | Fisheries and Oceans Canada (federal) |
| • | Saskatchewan Ministry of Environment |
| • | Ontario Ministry of Environment. |
Environment Canada (federal) is also a main regulatory agency, but does not issue licences and approvals.
Uranium industry regulation
The government of Canada recognizes the special importance of the uranium industry to Canada’s national interest, and regulates the industry through legislation and regulations, and exerts additional control through government policy.
Federal legislation applies to any work or undertaking in Canada for the development, production or use of nuclear energy or for the mining, production, refinement, conversion, enrichment, processing, reprocessing, possession or use of a nuclear substance. Federal policy requires that any property or plant used for any of these purposes must be legally and beneficially owned by a company incorporated in Canada.
Mine ownership restrictions
The federal government has instituted a policy that restricts ownership of Canadian uranium mining properties to:
| • | a minimum of 51% ownership by residents |
| • | a basic maximum limit of 49% ownership by non-residents of uranium properties at the first stage of production. |
The government may grant exceptions. For example, resident ownership may be less than 51% if the property is Canadian-controlled. Exceptions will only be granted in cases where it is demonstrated that Canadian partners cannot be found, and it must receive Cabinet approval.
The government issued a letter to the Canadian uranium industry on December 23, 1987, outlining the details of this ownership policy. On March 3, 2010, the government announced its intention to liberalize the foreign investment restrictions on Canada’s uranium mining sector to “ensure that unnecessary regulation does not inhibit the growth of Canada’s uranium mining industry by unduly restricting foreign investment”. After striking an expert panel to study the issue and soliciting feedback from various stakeholders, the federal government stated in October 2011 that it would not be changing the policy.
In 2013, it was announced that the proposed Canada-EU Trade Agreement (CETA) contemplates that the Canadian uranium mine ownership requirement would be waived for all European companies. However, at this time CETA has not yet been ratified and remains an agreement in principle and this waiver will not come into effect until such time as CETA is ratified and implemented.
Cameco ownership restriction
We are subject to ownership restrictions under theEldorado Nuclear Limited Reorganization and Divestiture Act, which restricts the issue, transfer and ownership, including joint ownership, of Cameco shares to prevent both residents andnon-residents of Canada from owning or controlling more than a certain percentage of shares. See pages 119 and 120 for more information.
Industry governance
TheNuclear Safety and Control Act (NSCA) is the primary federal legislation governing the control of the mining, extraction, processing, use and export of uranium in Canada. It authorizes the CNSC to make regulations governing all aspects of the development and application of nuclear energy, including uranium mining, milling, conversion, fuel fabrication and
| 2015 ANNUAL INFORMATION FORM Page 90 | ||
transportation. It grants the CNSC licensing authority. A person may only possess or dispose of nuclear substances and build, operate and decommission its nuclear facilities according to the terms and conditions of a CNSC licence. Licensees must satisfy specific conditions of the licence in order to maintain the right to operate their nuclear facilities.
The NSCA emphasizes the importance of environmental as well as health and safety matters, and requires licence applicants and licensees to have adequate provisions for protection.
Regulations made under the NSCA include those dealing with the specific licence requirements of facilities, radiation protection, physical security for all nuclear facilities and the transport of radioactive materials. The CNSC has also issued regulatory documents to assist licensees in complying with regulatory requirements, such as decommissioning, emergency planning, and optimizing radiation protection measures.
All of our Canadian operations are governed primarily by licences granted by the CNSC and are subject to all federal statutes and regulations that apply to us, and all the laws that generally apply in the province where the operation is located, unless there is a conflict with the terms and conditions of the licence or the federal laws that apply to us.
Uranium export
We must secure export licences and export permits from the CNSC and the Department of Foreign Affairs and International Trade in order to export our uranium. These arrangements are governed by the bi-lateral andmulti-lateral agreements that are in place between governments.
Land tenure
Most of our uranium reserves and resources are located in the province of Saskatchewan:
| • | amineral claim from the province gives us the right to explore for minerals (other government approvals are required to carry out surface exploration) |
| • | acrown lease with the province gives us the right to mine the minerals on the property |
| • | asurface lease with the province gives us the right to use the land for surface facilities and mine shafts while mining and reclaiming the land. |
A mineral claim has a term of two years, with the right to renew for successive one-year periods. Generally, the holder has to spend a certain amount on exploration to keep the mineral claim in good standing. If we spend more than the amount required, the extra amount can be applied to future years.
A holder of a mineral claim in good standing has the right to convert it into a crown lease. A crown lease is for 10 years, with a right to renew for additional 10-year terms. The lessee must spend a certain amount on work during each year of the crown lease. The lease cannot be terminated unless the lessee defaults on any terms of the lease, or under any provisions ofThe Crown Minerals Act(Saskatchewan) or regulations under it, including any prescribed environmental concerns. Crown leases can be amended unilaterally by the lessor by an amendment toThe Crown Minerals Act(Saskatchewan) orThe Mineral Disposition Regulations, 1986(Saskatchewan).
A surface lease can be for up to 33 years, as necessary for operating the mine and reclaiming the land. The province also uses surface leases to specify other requirements relating to environmental and radiation protection as well as socioeconomic objectives.
United States
Uranium industry regulation
In the US, uranium recovery is regulated primarily by the NRC according to theAtomic Energy Act of 1954, as amended. Its primary function is to:
| • | ensure employees, the public and the environment are protected from radioactive materials |
| • | regulate most aspects of the uranium recovery process. |
The NRC’s regulations for uranium recovery facilities are codified inTitle 10 of the Code of Federal Regulations(10 CFR). It issues Domestic Source Material Licences under 10 CFR, Part 40. TheNational Environmental Policy Act (NEPA) governs the review of licence applications, which is implemented through 10 CFR, Part 51.
| 2015 ANNUAL INFORMATION FORM Page 91 | ||
At Smith Ranch-Highland and Crow Butte, safety is regulated by the federal Occupational Safety and Health Administration.
Other governmental agencies are also involved in the regulation of the uranium recovery industry.
The NRC also regulates the export of uranium from the US and the transport of nuclear materials within the US. It does not review or approve specific sales contracts. It also grants export licences to ship uranium outside the US.
Wyoming
The uranium recovery industry is also regulated by the Wyoming Department of Environmental Quality, the Land Quality Division according to theWyoming Environmental Quality Act (WEQA) and theLand Quality DivisionNon-Coal Rules and Regulations under the WEQA. According to the state act, the Wyoming Department of Environmental Quality issues a permit to mine. The Land Quality Division administers the permit.
The state also administers a number of Environmental Protection Agency (EPA) programs under the Clean Air Actand theClean Water Act.Some of the programs, like theUnderground Injection Control Regulations, are incorporated in theLand Quality Division Non-Coal Rules and Regulations. Wyoming currently requires wellfield decommissioning to the standard of pre-mining use.
Nebraska
The uranium recovery industry is regulated by the NRC, and the Nebraska Department of Environmental Quality according to theNebraska Environmental Protection Act. The Nebraska Department of Environmental Quality issues a permit to mine. The state requires wellfield groundwater be restored to the class of use water standard.
Land tenure
Our uranium reserves and resources in the US are held by subsidiaries that are located in Wyoming and Nebraska. The right to mine or develop minerals is acquired either by leases from the owners (private parties or the state) or mining claims located on property owned by the US federal government. Our subsidiaries acquire surface leases that allow them to install wellfields and conduct ISR mining.
Kazakhstan
SeeKazakhstan government and legislation starting on page 54.
Taxes and Royalties
Transfer pricing disputes
We have been reporting on our transfer pricing disputes with Canada Revenue Agency (CRA) since 2008, when it originated, and with the United States Internal Revenue Service (IRS) since the first quarter of 2015. Below, we discuss the general nature of transfer pricing disputes and, more specifically, the ongoing disputes we have.
Transfer pricing is a complex area of tax law, and it is difficult to predict the outcome of cases like ours. However, tax authorities generally test two things:
| • | the governance (structure) of the corporate entities involved in the transactions |
| • | the price at which goods and services are sold by one member of a corporate group to another. |
We have a global customer base and we established a marketing and trading structure involving foreign subsidiaries, including Cameco Europe Limited (CEL), which entered into various intercompany arrangements, including purchase and sale agreements, as well as uranium purchase and sale agreements with third parties. Cameco and its subsidiaries made reasonable efforts to put arm’s length transfer pricing arrangements in place, and these arrangements expose the parties to the risks and rewards accruing to them under these contracts. The intercompany contract prices are generally comparable to those established in comparable contracts between arm’s-length parties entered into at that time.
For the years 2003 to 2010, CRA has shifted CEL’s income (as recalculated by CRA) back to Canada and applied statutory tax rates, interest and instalment penalties, and, from 2007 to 2009, transfer pricing penalties; CRA has also indicated they intend to issue a reassessment relating to the 2010 transfer pricing penalty. The IRS also allocated a portion of CEL’s income for the years 2009 through 2012 to the US, resulting in such income being taxed in multiple jurisdictions. Taxes of
| 2015 ANNUAL INFORMATION FORM Page 92 | ||
approximately $320 million for the 2003 – 2015 years have already been paid in a jurisdiction outside Canada and the US. Bilateral international tax treaties contain provisions that generally seek to prevent taxation of the same income in both countries. As such, in connection with these disputes, we are considering our options including remedies under international tax treaties that would limit double taxation; however, there is a risk that we will not be successful in eliminating all potential double taxation. The expected income adjustments under our tax disputes are represented by the amounts claimed by CRA and IRS and are described below.
CRA dispute
Since 2008, CRA has disputed our corporate structure and the related transfer pricing methodology we used for certain intercompany uranium sale and purchase agreements. To the end of 2014, we received notices of reassessment for our 2003 through 2009 tax returns, and, in the fourth quarter of 2015, we received a notice of reassessment for our 2010 tax year. We have recorded a cumulative tax provision of $50 million, where an argument could be made that our transfer price may have fallen outside of an appropriate range of pricing in uranium contracts for the period from 2003 through 2015. We have reduced the provision to reflect management’s revised estimate, which takes into account additional contract information. We are confident that we will be successful in our case and continue to believe the ultimate resolution of this matter will not be material to our financial position, results of operations and cash flows in the year(s) of resolution.
For the years 2003 through 2010, CRA issued notices of reassessment for approximately $3.4 billion of additional income for Canadian tax purposes, which would result in a related tax expense of about $1.1 billion. CRA has also issued notices of reassessment for transfer pricing penalties for the years 2007 through 2010 in the amount of $292 million. The Canadian income tax rules include provisions that require larger companies like us to remit or otherwise secure 50% of the cash tax plus related interest and penalties at the time of reassessment. To date, under these provisions, after applying elective deductions, we have paid a net amount of $263 million cash. In addition, we have provided $340 million in letters of credit (LC) to secure 50% of the cash taxes and related interest amounts reassessed in 2015. The amounts paid or secured are shown in the table below.
YEAR PAID ($ MILLIONS) | CASH TAXES | INTEREST AND INSTALMENT PENALTIES | TRANSFER PRICING PENALTIES | TOTAL | CASH REMITTANCE | SECURED BY LC | ||||||||||||||||||
Prior to 2013 | — | 13 | — | 13 | 13 | — | ||||||||||||||||||
2013 | 1 | 9 | 36 | 46 | 46 | — | ||||||||||||||||||
2014 | 106 | 47 | — | 153 | 153 | — | ||||||||||||||||||
2015 | 202 | 71 | 79 | 352 | 20 | 332 | ||||||||||||||||||
20161 | 8 | — | 31 | 39 | 31 | 8 | ||||||||||||||||||
|
|
|
|
|
|
|
|
|
|
|
| |||||||||||||
Total | 317 | 140 | 146 | 603 | 263 | 340 | ||||||||||||||||||
|
|
|
|
|
|
|
|
|
|
|
| |||||||||||||
| 1 | The $8 million LC provided in 2016 is for a 2015 reassessment. |
Using the methodology we believe CRA will continue to apply, and including the $3.4 billion already reassessed, we expect to receive notices of reassessment for a total of approximately $7.0 billion of additional income taxable in Canada for the years 2003 through 2015, which would result in a related tax expense of approximately $2.1 billion. As well, CRA may continue to apply transfer pricing penalties to taxation years subsequent to 2010. As a result, we estimate that cash taxes and transfer pricing penalties for these years would be between $1.65 billion and $1.70 billion. In addition, we estimate there would be interest and instalment penalties applied that would be material to us. While in dispute, we would be responsible for remitting or otherwise providing security for 50% of the cash taxes and transfer pricing penalties (between $825 million and $850 million), plus related interest and instalment penalties assessed, which would be material to us.
Under the Canadian federal and provincial tax rules, the amount required to be paid or secured each year will depend on the amount of income reassessed in that year and the availability of elective deductions and tax loss carryovers. Recently, the CRA decided to disallow the use of any loss carry-backs for any transfer pricing adjustment, starting with the 2008 tax year. This does not impact the anticipated income tax expense for a particular year, but does impact the timing of any required security or payment. As noted above, for the 2010 tax year, as an alternative to paying cash, we used letters of credit to satisfy our obligations related to the reassessed income tax and related interest amounts. We expect to be able to continue to provide
| 2015 ANNUAL INFORMATION FORM Page 93 | ||
security in the form of letters of credit to satisfy these requirements. The estimated amounts summarized in the table below reflect actual amounts paid or secured and estimated future amounts owing based on the actual and expected reassessments for the years 2003 through 2015, and include the expected timing adjustment for the inability to use any loss carry-backs starting in 2008. We will update this table annually to include the estimated impact of reassessments expected for completed years subsequent to 2015.
$ MILLIONS | 2003-2015 | 2016-2017 | 2018-2023 | TOTAL | ||||||||||||
50% of cash taxes and transfer pricing penalties paid, secured or owing in the period | ||||||||||||||||
Cash payments | 156 | 155 - 180 | 30 - 55 | 335 - 360 | ||||||||||||
Secured by letters of credit | 264 | 95 - 120 | 20 - 45 | 425 - 450 | ||||||||||||
|
|
|
|
|
|
|
| |||||||||
Total paid1 | 420 | 255 - 280 | 65 - 90 | 825 - 850 | ||||||||||||
|
|
|
|
|
|
|
| |||||||||
| 1 | These amounts do not include interest and instalment penalties, which totaled approximately $140 million to December 31, 2015. |
In light of our view of the likely outcome of the case as described above, we expect to recover the amounts remitted, including the $603 million already paid or otherwise secured to date.
We are expecting the trial for the 2003, 2005 and 2006 reassessments to commence in October 2016, with final arguments in April 2017. If this timing is adhered to, we expect to receive a Tax Court decision within six to 18 months after the trial is complete.
IRS dispute
In the fourth quarter of 2015, we received a Revenue Agents Report (RAR) from the IRS for the tax years 2010 to 2012. Similar to the 2009 RAR received in the first quarter of 2015, the IRS is challenging the transfer pricing used under certain intercompany transactions pertaining to the 2010 to 2012 tax years for certain of our US subsidiaries. The 2009 and 2010 to 2012 RARs list the adjustments proposed by the IRS and calculate the tax and any penalties owing based on the proposed adjustments.
The current position of the IRS is that a portion of the non-US income reported under our corporate structure and taxed in non-US jurisdictions should be recognized and taxed in the US on the basis that:
| • | the prices received by our US mining subsidiaries for the sale of uranium to CEL are too low |
| • | the compensation earned by Cameco Inc., one of our US subsidiaries, is inadequate. |
The proposed adjustments result in an increase in taxable income in the US of approximately $419 million (US) and a corresponding increased income tax expense of approximately $122 million (US) for the 2009 through 2012 taxation years, with interest being charged thereon. In addition, the IRS proposed cumulative penalties of approximately $8 million (US) in respect of the adjustment.
We believe that the conclusions of the IRS in the RARs are incorrect and we are contesting them in an administrative appeal, during which we are not required to make any cash payments. Until this matter progresses further, we cannot provide an estimation of the likely timeline for a resolution of the dispute.
We believe that the ultimate resolution of this matter will not be material to our financial position, results of operations and cash flows in the year(s) of resolution.
Overview of disputes
The table below provides an overview of some of the key points with respect to our CRA and IRS tax disputes.
| 2015 ANNUAL INFORMATION FORM Page 94 | ||
CRA | IRS | |||
| Basis for dispute | • Corporate structure/governance
• Transfer pricing methodology used for certain intercompany uranium sale and purchase agreements
• Allocates Cameco Europe Ltd. (CEL) income (as adjusted) for 2003 through 2010 to Canada (same income we paid tax on in foreign jurisdictions and includes income that IRS is proposing to tax) | • Income earned on sales of uranium by the US mines to CEL is inadequate
• Compensation earned by Cameco Inc., one of our US subsidiaries, is inadequate
• Allocates a portion of CEL’s income for the years 2009 through 2012 to the US (a portion of the same income we paid tax on in foreign jurisdictions and which the CRA is proposing to tax)
| ||
| Years under consideration | • CRA reassessed 2003 to 2010
• Auditing 2011 to 2012 | • IRS has proposed adjustments for 2009 through 2012 | ||
| Timing of resolution | • Expect our appeal of the 2003, 2005 and 2006 reassessments to commence in October 2016, with final arguments expected in April 2017
• Expect Tax Court decision six to 18 months after completion of trial | • Contesting proposed adjustments in an administrative appeal
• We cannot yet provide an estimate as to the timeline for resolution | ||
| Required payments | • Expect to provide security in form of letters of credit and/or make cash payments for 50% of cash taxes, interest and penalties as reassessed
• Paid $263 million in cash to date
• Secured $340 million using letters of credit | • No security or cash payments required while under administrative appeal | ||
Caution about forward-looking information relating to our CRA and IRS tax disputes
This discussion of our expectations relating to our tax disputes with CRA and IRS and future tax reassessments by CRA and IRS is forward-looking information that is based upon the assumptions and subject to the material risks discussed under the heading Caution about forward-looking information beginning on page 1 and also on the more specific assumptions and risks listed below. Actual outcomes may vary significantly.
Assumptions
| • | CRA will reassess us for the years 2011 through 2015 using a similar methodology as for the years 2003 through 2010, and the reassessments will be issued on the basis we expect |
| • | we will be able to apply elective deductions and utilize letters of credit to the extent anticipated |
| • | CRA will seek to impose transfer pricing penalties (in a manner consistent with penalties charged in the years 2007 through 2010) in addition to interest charges and instalment penalties |
| • | we will be substantially successful in our dispute with CRA and the cumulative tax provision of $50 million to date will be adequate to satisfy any tax liability resulting from the outcome of the dispute to date |
| • | IRS may propose adjustments for later years subsequent to 2012 |
| • | we will be substantially successful in our dispute with IRS |
Material risks that could cause actual results to differ materially
| • | CRA reassesses us for years 2011 through 2015 using a different methodology than for years 2003 through 2010, or we are unable to utilize elective deductions or letters of credit to the extent anticipated, resulting in the required cash payments or security provided to CRA pending the outcome of the dispute being higher than expected |
| • | the time lag for the reassessments for each year is different than we currently expect |
| • | we are unsuccessful and the outcomes of our dispute with CRA and/or IRS result in significantly higher cash taxes, interest charges and penalties than the amount of our cumulative tax provision, which could have a material adverse effect on our liquidity, financial position, results of operations and cash flows |
| • | cash tax payable increases due to unanticipated adjustments by CRA or IRS not related to transfer pricing |
| • | IRS proposes adjustments for years 2013 through 2015 using a different methodology than for 2009 through 2012 |
| • | we are unable to effectively eliminate all double taxation |
| 2015 ANNUAL INFORMATION FORM Page 95 | ||
Canadian royalties
We pay royalties on the sale of all uranium extracted at our mines in the province of Saskatchewan.
Two types of royalties are paid:
| • | Basic royalty: This royalty is calculated as 5% of gross sales of uranium, less the Saskatchewan resource credit of 0.75%. |
| • | Profit royalty: A 10% royalty is charged on profit up to and including $22.70/kg U3O8 ($10.30/lb) and a 15% royalty is charged on profit in excess of $22.70/kg U3O8. Profit is determined as revenue less certain operating, exploration, reclamation and capital costs. Both exploration and capital costs are deductible at the discretion of the producer. |
As a resource corporation in Saskatchewan, we also pay a corporate resource surcharge of 3.0% of the value of resource sales.
During the period from 2013 to 2015, transitional rules for the new profit royalty regime were applied whereby only 50% of capital costs were deductible. The remaining 50% was accumulated and will now be deductible beginning in 2016. In addition, the capital allowance related to Cigar Lake under the previous system was grandfathered and is also now deductible beginning in 2016. Based on the expected application of transitional and grandfathered capital allowance deductions, we anticipate that only the first tier of the profit royalty (10%) will apply in 2016 and 2017. As capital pools are depleted, we expect to also be subject to the top tier of the profit royalty (15%) in 2018.
Canadian income taxes
We are subject to federal income tax and provincial taxes in Saskatchewan and Ontario. Current income tax expense for 2015 was $14.6 million.
Royalties are fully deductible for income tax purposes. However, for Ontario tax purposes up to and including April 22, 2015, we were charged an additional tax on Crown royalties (ACRT), at normal Ontario corporate tax rates, if the royalty deduction exceeded a notional Ontario resource allowance. Effective April 23, 2015, Ontario harmonized with the federal government thereby eliminating the Ontario notional resource allowance and the ACRT. In 2015, we incurred a tax expense of $0.6 million prior to the harmonization.
Our Ontario fuel services operations are eligible for a manufacturing and processing tax credit.
US taxes
Our subsidiaries in Wyoming and Nebraska pay severance taxes, property taxes and Ad Valorem taxes in those states. They incurred $5.2 million (US) in taxes in 2015.
Our US subsidiaries are subject to US federal and state income tax. They may also be subject to the Alternative Minimum Tax (AMT) at a rate of 20%. We can carry forward AMT paid in prior years indefinitely, and apply it as credit against future regular income taxes.
Kazakhstan taxes
The resource use contract lists the taxes, duties, fees, royalties and other governmental charges Inkai has to pay.
On January 1, 2009, a new tax code of the Republic of Kazakhstan went into effect that includes a number of changes to the taxation regime of subsoil users. The most significant changes involve eliminating the stable tax regime, imposing a mineral extraction tax and changing the payment rate for commercial discovery.
Tax stabilization eliminated
In October 2009, at the request of the Kazakhstan Ministry of Energy and Mineral Resources, Inkai signed an amendment to the resource use contract to adopt the new tax code, eliminating the tax stabilization provision. While we do not expect this to have a material impact on Inkai at this time, eliminating the tax stabilization provision could be material in the future. See page 53 for more information about the resource use contract.
Corporate income tax rate
Inkai is subject to corporate income tax at a rate of 20%.
| 2015 ANNUAL INFORMATION FORM Page 96 | ||
Mineral extraction tax
The tax code includes aTax on Production of Useful Minerals, a mineral extraction tax replacing the previous royalty. The mineral extraction tax must be paid on each type of mineral and certain other substances that are extracted. The rate used to calculate the mineral extraction tax on uranium is currently 18.5%.
Payment for commercial discovery
Under the resource use contract, a one-time commercial discovery bonus of 0.05% of the value of Kazakh-defined recoverable reserves is paid when there is confirmation that Kazakh-defined recoverable reserves are located in a particular licence area. Under the tax code, the rate increased to 0.1%.
Excess profits tax
The tax code has changed the calculation of excess profits tax. Inkai believes it will not have to pay this tax for the foreseeable future.
| 2015 ANNUAL INFORMATION FORM Page 97 | ||
Risks that can affect our business
There are risks in every business.
The nature ofour business means we face many kinds of risks and hazards – some that relate to the nuclear energy industry in general, and others that apply to specific properties, operations or planned operations. These risks could have a significant impact on our business, earnings, cash flows, financial condition, results of operations or prospects.
The following section describes the risks that are most material to our business. This is not, however, a complete list of the potential risks we face – there may be others we are not aware of, or risks we feel are not material today that could become material in the future. Our risk policy and process involves a broad, systematic approach to identifying, assessing, reporting and managing the significant risks we face in our business and operations. However, there is no assurance that we will be successful in preventing the harm that any of these risks could cause.
Please also see the risk discussion in our 2015 MD&A.
Types of risk
Operational | 98 | |||
Political | 104 | |||
Regulatory | 106 | |||
Financial | 107 | |||
Environmental | 112 | |||
Legal and other | 114 | |||
Industry | 115 | |||
1 – Operational risks
General operating risks and hazards
We are subject to a number of operational risks and hazards, many of which are beyond our control.
These risks and hazards include:
• environmental damage (including hazardous emissions from our refinery and conversion facilities, such as a release of UF6 or a leak of anhydrous hydrogen fluoride used in the UF6 conversion process)
• industrial and transportation accidents, which may involve radioactive or other hazardous materials
• labour shortages, disputes or strikes
• cost increases for labour, contracted or purchased materials, supplies and services
• shortages of required equipment, materials and supplies (including the availability of acid for Inkai’s operations in Kazakhstan and anhydrous hydrofluoric acid at our conversion facilities)
• transportation disruptions
• electrical power interruptions | • equipment failures
• catastrophic accident
• fires
• blockades or other acts of social or political activism
• regulatory constraints and non-compliance with laws and licences
• natural phenomena, such as inclement weather conditions, floods and earthquakes
• unusual or unexpected geological or hydrological conditions
• underground floods
• ground movement or cave-ins
• tailings pipeline or dam failures
• adverse mining conditions
• technological failure of mining methods. |
| 2015 ANNUAL INFORMATION FORM Page 98 | ||
There is no assurance that any of the above risks will not result in:
• damage to or destruction of our properties and facilities located on these properties
• personal injury or death
• environmental damage
• delays in, or interruptions of, our exploration or development activities or transportation of our products | • delays in, interruptions of, or decrease in production at our operations
• costs, expenses or monetary losses
• legal liability
• adverse government action. |
Any of these events could result in one or more of our operations becoming unprofitable, cause us not to receive an adequate return on invested capital, or have a material and adverse effect on our earnings, cash flows, financial condition, results of operations or prospects.
Insurance coverage
We buy insurance to cover losses or liabilities arising from some of the operating risks and hazards listed above. We believe we have a reasonable amount of coverage for the risks we choose to insure against. There is no assurance, however, that this coverage will be adequate in all circumstances, that it will continue to be available, that premiums will be economically feasible, or that we will maintain this coverage. Like other nuclear energy and mining companies, we do not have insurance coverage for certain environmental losses or liabilities and other risks, either because it is not available, or because it cannot be purchased at a reasonable cost. We may also be required to increase the amount of our insurance coverage due to changes in the regulation of the nuclear industry.
Not having the right insurance coverage or the right amount of coverage, or having to increase the amount of coverage or choosing not to insure against certain risks, could have a material and adverse effect on our earnings, cash flows, financial condition, results of operations or prospects.
Flooding at our Saskatchewan mines
All of our operating mines in Saskatchewan have had water inflows.
McArthur River
The sandstone that overlays the basement rocks of the McArthur River deposit contains large volumes of water at significant pressure. Ground freezing at McArthur River generally prevents water from flowing into the area being mined and reduces, but does not eliminate the risk of water inflows. There are technical challenges with the groundwater and rock properties.
We temporarily suspended production at our McArthur River mine in April 2003 because increased water inflow from an area of collapsed rock in a new development area began to flood portions of the mine. This caused a major setback in the development of new mining zones.
Cigar Lake
The Cigar Lake deposit has hydro-geological characteristics and technical challenges that are similar to those at McArthur River. We have had three water inflows at Cigar Lake since 2006 (please see page 40 for details).
These water inflows have caused:
| • | a significant delay in development and production at the property |
| • | a significant increase in capital costs |
| • | the need to notify many of our customers of the interruption in planned uranium supply. |
Rabbit Lake
We temporarily reduced our underground activities at Rabbit Lake in November 2007, because there was an increase in water flow from a mining area while an equipment upgrade was limiting surface water-handling system capacity. Rabbit Lake resumed normal mining operations in late December 2007, after the source of the water inflow was plugged.
| 2015 ANNUAL INFORMATION FORM Page 99 | ||
There is no guarantee that there will not be water inflows at McArthur River, Cigar Lake or Rabbit Lake in the future.
A water inflow could have a material and adverse effect on us, including:
| • | significant delays or interruptions in production or lower production |
| • | significant delays or interruptions in mine development or remediation activities |
| • | loss of mineral reserves |
| • | a material increase in capital or operating costs. |
It could also have a material and adverse effect on our earnings, cash flows, financial condition, results of operations or prospects. The degree of impact depends on the magnitude, location and timing of the flood or water inflow. Floods and water inflows are generally not insurable.
Technical challenges at Cigar Lake and McArthur River
The unique nature of the deposits at Cigar Lake and McArthur River pose many technical challenges, including groundwater management, unstable rock properties, radiation protection, ore-handling and transport and other mining-related challenges.
As we ramp up production at Cigar Lake, there may be some technical challenges, which could affect our production plans, including, but not limited to, variable or unanticipated ground conditions, ground movement and cave-ins, water inflows and variable dilution, recovery values, performance of the water treatment system, mining productivity, and equipment reliability. There is a risk that the ramp up to full production may take longer than planned and that the full production rate may not be achieved on a sustained and consistent basis.
There is also a risk to our plan to achieve the full Cigar Lake production rate of 18 million pounds per year by 2017 if AREVA is unable to complete and commission the required mill upgrades and expansion on schedule.
The areas being mined at Cigar Lake must meet specific ground freezing requirements before we begin jet boring. We have identified greater variation of the freeze rates of different geological formations encountered in the mine, based on information obtained through surface freeze drilling.
If we are unable to resolve any of these technical challenges, it could have a material and adverse effect on our earnings, cash flows, financial condition, results of operations or prospects.
Reliance on development and expansion projects to sustain production and fuel growth
Our ability to sustain and increase our uranium production depends in part on successfully developing new mines and/or expanding existing operations. Cigar Lake and the McArthur River expansion are our major projects for increasing production.
Several factors affect the economics and success of these projects:
• capital and operating costs
• metallurgical recoveries
• the accuracy of reserve estimates
• government regulations
• availability of appropriate infrastructure, particularly power and water | • future uranium prices
• the accuracy of feasibility studies
• acquiring surface or other land rights
• receiving necessary government permits. |
Generally development projects have no operating history that can be used to estimate future cash flows. We have to invest a substantial amount of capital and time to develop a project and achieve commercial production. A change in costs or construction schedule can affect the economics of a project. Actual costs could increase significantly and economic returns could be materially different from our estimates. We could fail to obtain the necessary governmental approvals for construction or operation. In any of these situations, a project might not proceed according to its original timing, or at all.
| 2015 ANNUAL INFORMATION FORM Page 100 | ||
It is not unusual in the nuclear energy or mining industries for new or expanded operations to experience unexpected problems during start-up or ramp-up, resulting in delays, higher capital expenditures than anticipated and reductions in planned production. Delays, additional costs or reduced production could have a material and adverse effect on our earnings, cash flows, financial condition, results of operations or prospects.
There is no assurance we will be able to complete the development of new mines, or expand existing operations, economically or on a timely basis.
Replacement of depleted reserves
The McArthur River and Cigar Lake mines are currently our main sources of mined uranium concentrates. We must replace mineral reserves depleted by production at these and our other mines to maintain or increase our annual production levels over the long term. Reserves can be replaced by expanding known orebodies, locating new deposits or making acquisitions. Substantial expenditures are required to establish new mineral reserves. We may not be able to sustain or increase production if:
| • | we do not identify, discover or acquire other deposits |
| • | we do not find extensions to existing ore bodies |
| • | we do not convert resources to reserves at our mines or other projects. |
This could have a material and adverse effect on our ability to maintain production to or beyond currently contemplated mine lives, as well as a material and adverse effect on our earnings, cash flows, financial condition, results of operations or prospects.
Although we have successfully replenished reserves in the past through ongoing exploration, development and acquisition programs, there is no assurance that we will be successful in our current or future exploration, development or acquisition efforts.
Tailings management
Our Saskatchewan mills produce tailings. Managing these tailings is integral to uranium production.
If sloughing, regulatory, or other issues prevent us from maintaining or increasing the existing tailings management capacity at our Saskatchewan mills, or if these issues prevent AREVA from maintaining or increasing tailing capacity at the McClean Lake mill, uranium production could be constrained and this could have a material and adverse effect on our earnings, cash flows, financial condition or results of operations.
Aging facilities
Our Port Hope fuel services facilities are aging. This exposes us to a number of risks, including the potential for higher maintenance and operating costs, the need for significant capital expenditures to upgrade and refurbish these facilities, the potential for decreases or delays in, or interruption of, fuel services production, and the potential for environmental damage.
These risks could have a material and adverse effect on our earnings, cash flows, financial condition or results of operations.
Labour and employment
People are core to our business. We compete with other nuclear energy and mining companies for talented, quality people, and we may not always be able to fill positions on a timely basis. There is a limited pool of skilled people and competition is intense. We also experience employee turnover because of an aging workforce.
If we cannot attract and train qualified successors for our senior and operating positions, it could reduce the efficiency of our operations and have an adverse effect on our earnings, cash flows, financial condition or results of operations.
| 2015 ANNUAL INFORMATION FORM Page 101 | ||
We have unionized employees and face the risk of strikes. At December 31, 2015, we had 4,005 employees (including employees of our subsidiaries). This includes 855 unionized employees at McArthur River, Key Lake, Port Hope and at CFM’s facilities, who are members of four different locals of the United Steelworkers trade union.
Collective agreements
| • | The collective agreements with the bargaining unit employees at our conversion facilities at Port Hope expires June 2016. |
| • | The collective agreement with the bargaining unit employees at the McArthur River and Key Lake operations expires December 31, 2017. |
| • | The collective agreement with the bargaining unit employees at CFM expires June 2018. |
We cannot predict whether we will reach new collective agreements with these and other employees without a work stoppage or work interruptions while negotiations are underway.
From time to time, the mining or nuclear energy industry experiences a shortage of tradespeople and other skilled or experienced personnel globally, regionally or locally. We have a comprehensive strategy to attract and retain high calibre people, but there is no assurance this strategy will protect us from the effects of a labour shortage.
A lengthy work interruption or labour shortage could have an adverse effect on our earnings, cash flows, financial condition or results of operations.
Joint ventures
We participate in McArthur River, Key Lake, Cigar Lake, Inkai, Millennium, Kintyre and GLE through joint ventures with third parties. Some of these joint ventures are unincorporated and some are incorporated (like Inkai and GLE). We have other joint ventures and may enter into more in the future.
There are risks associated with joint ventures, including:
| • | disagreement with a joint venture participant about how to develop, operate or finance a project |
| • | a joint venture participant not complying with a joint venture agreement |
| • | possible litigation between joint venture participants about joint venture matters |
| • | the inability to exert control over decisions related to a joint venture we do not have a controlling interest in. |
Our joint venture participant in Kazakhstan is a state entity, so its actions and priorities could be dictated by government policies instead of commercial considerations.
These risks could result in legal liability, affect our ability to develop or operate a project under a joint venture, or have a material and adverse effect on our earnings, cash flows, financial condition or results of operations.
Toll Milling Arrangements
Cigar Lake ore is processed at the McClean Lake mill. AREVA has submitted an application to the CNSC to increase the mill’s licensed annual production limit to 24 million pounds. The current collective agreement between AREVA and unionized employees at the McClean Lake operation expires in May 2016. There is a risk to our 2016 Cigar Lake production plan, and to our plan to achieve the full production rate of 18 million pounds per year in 2017 if AREVA is unable to secure the regulatory approvals necessary to increase production or if AREVA is unable to reach an agreement with the union and there is a labour dispute.
Mine Concentration Risk
Our main sources of uranium production are our mines at McArthur River (47% of 2015 production) and Cigar Lake (20% of 2015 uranium production). Unless we acquire or develop additional major sources of uranium production, any disruption in or reduction in production from either or both of these mines could have a material and adverse effect on our earnings, cash flows, financial condition, results of operations or prospects.
| 2015 ANNUAL INFORMATION FORM Page 102 | ||
Supplies and contractors
Supplies
We buy reagents and other production inputs and supplies from suppliers around the world. If there is a shortage of any of these supplies, including parts and equipment, or their costs rise significantly, it could limit or interrupt production or increase production costs. It could also have an adverse effect on our ability to carry out operations or have a material and adverse effect on our earnings, cash flows, financial condition or results of operations. We examine our entire supply chain as necessary to identify areas to diversify or add inventory where we may be vulnerable, but there is no assurance that we will be able to mitigate the risk.
Contractors
In some cases we rely on a single contractor to provide us with reagents or other production inputs and supplies. Relying on a single contractor is a security supply risk because we may not receive quality service, timely service, or service that otherwise meets our needs. These risks could have a material and adverse effect on our earnings, cash flows, financial condition or results of operations.
Uranium exploration is highly speculative
Uranium exploration is highly speculative and involves many risks, and few properties that are explored are ultimately developed into producing mines.
Even if mineralization is discovered, it can take several years in the initial phases of drilling until a production decision is possible, and the economic feasibility of developing an exploration property may change over time. We are required to make a substantial investment to establish proven and probable mineral reserves, to determine the optimal metallurgical process to extract minerals from the ore, to construct mining and processing facilities (in the case of new properties) and to extract and process the ore. We might abandon an exploration project because of poor results or because we feel that we cannot economically mine the mineralization.
Given these uncertainties, there is no assurance that our exploration activities will be successful and result in new reserves to expand or replace our current mineral reserves.
Infrastructure
Mining, processing, development and exploration can only be successful with adequate infrastructure. Reliable roads, bridges, power sources and water supply are important factors that affect capital and operating costs and the ability to deliver products on a timely basis.
Our activities could be negatively affected if unusual weather, interference from communities, government or others, aging, sabotage or other causes affect the quality or reliability of the infrastructure.
A lack of adequate infrastructure could have a material and adverse effect on our earnings, cash flows, financial condition or results of operations.
Information Technology Systems
We are dependent on information technology systems in the conduct of our operations. These systems could be subject to network disruptions caused by a variety of sources including computer viruses, security breaches and cyber-attacks. Such a disruption could have a material and adverse effect on our earnings, cash flows, financial condition or results of operations.
| 2015 ANNUAL INFORMATION FORM Page 103 | ||
2 – Political risks
Foreign investments and operations
We do business in countries and jurisdictions outside of Canada and the United States, including the developing world. Doing business in these countries poses risks because they have different economic, cultural, regulatory and political environments. Future economic and political conditions could also cause the governments of these countries to change their policies on foreign investments, development and ownership of resources, or impose other restrictions, limitations or requirements that we may not foresee today.
Risks related to doing business in a foreign country can include:
• uncertain legal, political and economic environments
• strong governmental control and regulation
• lack of an independent judiciary
• war, terrorism and civil disturbances
• crime, corruption, making improper payments or providing benefits that may violate Canadian or United States law or laws relating to foreign corrupt practices
• unexpected changes in governments and regulatory officials
• uncertainty or disputes as to the authority of regulatory officials
• changes in a country’s laws or policies, including those related to mineral tenure, mining, imports, exports, tax, duties and currency
• cancellation or renegotiation of permits or contracts | • royalty and tax increases or other claims by government entities, including retroactive claims
• expropriation and nationalization
• delays in obtaining the necessary permits or the inability to obtain or maintain them
• currency fluctuations
• high inflation
• joint venture participants falling out of political favour
• restrictions on local operating companies selling their production offshore, and holding US dollars or other foreign currencies in offshore bank accounts
• import and export regulations, including restrictions on the export of uranium
• limitations on the repatriation of earnings
• increased financing costs. |
If one or more of these risks occur, it could have a material and adverse effect on our earnings, cash flows, financial condition, results of operations or prospects.
We also risk being at a competitive disadvantage to companies from countries that are not subject to Canadian or United States law or laws relating to foreign corrupt practices.
We enter into joint venture arrangements with local participants from time to time to mitigate political risk. There is no assurance that these joint ventures will mitigate our political risk in a foreign jurisdiction.
We assess the political risk associated with each of our foreign investments and have political risk insurance to mitigate part of the losses that can arise from some of these risks. From time to time, we assess the costs and benefits of maintaining this insurance and may decide not to buy this coverage in the future. There is no assurance that the insurance will be adequate to cover every loss related to our foreign investments, that coverage will continue to be available or that premiums will be economically feasible. These losses could have a material and adverse effect on our earnings, cash flows, financial condition, results of operations or prospects if they are not adequately covered by insurance.
Kazakhstan
Inkai has a contract with the Kazakhstan government and was granted licences to conduct mining and exploration activities there. Its ability to conduct these activities, however, depends on licences being renewed and other government approvals being granted.
To maintain and increase production at Inkai, we need ongoing support, agreement and co-operation from Kazatomprom and from the government. Kazakh foreign investment, environmental and mining laws and regulations are complex and still developing, so it can be difficult to predict how they will be applied. Inkai’s best efforts may
| 2015 ANNUAL INFORMATION FORM Page 104 | ||
therefore not always reflect full compliance with the law, and non-compliance can lead to an outcome that is disproportionate to the nature of the breach.
Subsoil law
Amendments to the subsoil law in 2007 allow the government to reopen resource use contracts in certain circumstances, and in 2011, the Kazakhstan government passed a resolution that classified 362 blocks, including all three Inkai blocks, as strategic deposits. These actions may increase the government’s ability to expropriate Inkai’s properties in certain situations. In 2009, at the request of the Kazakhstan government, Inkai amended the resource use contract to adopt a new tax code, even though the government had agreed to tax stabilization provisions in the original contract.
A new subsoil use law which went into effect in 2010 and was amended most recently in 2016 weakens the stabilization guarantee of the prior law. This development reflects increased political risk in Kazakhstan.
Nationalization
Industries like mineral production are regarded as nationally or strategically important, but there is no assurance they will not be expropriated or nationalized. Government policy can change to discourage foreign investment and nationalize mineral production, or the government can implement new limitations, restrictions or requirements.
There is no assurance that our assets in Kazakhstan and other countries will not be nationalized, taken over or confiscated by any authority or body, whether the action is legitimate or not. While there are provisions for compensation and reimbursement of losses to investors under these circumstances, there is no assurance that these provisions would restore the value of our original investment or fully compensate us for the investment loss. This could have a material and adverse effect on our earnings, cash flows, financial condition, results of operations or prospects.
Government regulations
Our operations in Kazakhstan may be affected in varying degrees by government regulations restricting production, price controls, export controls, currency controls, taxes and royalties, expropriation of property, environmental, mining and safety legislation, and annual fees to maintain mineral properties in good standing. There is no assurance that the laws in Kazakhstan protecting foreign investments will not be amended or abolished, or that these existing laws will be enforced or interpreted to provide adequate protection against any or all of the risks described above. There is also no assurance that the resource use contract can be enforced or will provide adequate protection against any or all of the risks described above.
Block 3 Exploration Licence Expiry
The block 3 exploration area at the Inkai mine is governed by an exploration licence granted by the Kazakhstan government. Amendment No. 3 to Inkai’s resource use contract amended Inkai’s block 3 licence, granted a five-year appraisal period to July 2015 to carry out delineation drilling, uranium resource estimation, construction and operation of a test leach facility, and to complete a feasibility study. In 2015, under the terms of the licence, Inkai completed construction of the test leach facility and continued working on a final appraisal of block 3’s mineral potential according to Kazakhstan standards.
We are currently working to extend the term of the block 3 exploration licence. Although the Kazakhstan government has extended the term of the licence in the past, there is no assurance that a further extension will be granted or what the terms and conditions of such an extension would be. If an extension is not granted, the licence for block 3 may expire. This may result in the loss of block 3 without compensation.
In addition, as of December 31, 2015, Cameco (through a subsidiary) has advanced loans in the principal amount of $148 million (US) to fund Inkai’s work on block 3. If an extension of the exploration licence is not granted or if the block 3 deposit cannot be successfully developed, there is a risk we may not be repaid.
See pages 54 to 56 for a more detailed discussion of the regulatory and political environment in Kazakhstan.
| 2015 ANNUAL INFORMATION FORM Page 105 | ||
Australia
Western Australian Government’s uranium policy
State governments in Australia have prohibited uranium mining or uranium exploration from time to time, and from 2002 to 2008, uranium mining was banned in Western Australia, where our Kintyre and Yeelirrie projects are located. A prohibition or restriction on uranium exploration or mining in the future that interferes with the development of Kintyre or Yeelirrie could have a material and adverse effect on our earnings, cash flows, financial condition, results of operations or prospects.
State Agreement with Western Australian Government
The Yeelirrie project is governed by a State Agreement with the Western Australian Government. State Agreements are entered into in respect of major Western Australian mining projects, and provide a framework to facilitate approval and development of those projects. It is a requirement under the Yeelirrie State Agreement that we submit to the Government for approval detailed proposals for the development of a uranium mining project and associated infrastructure in respect of Yeelirrie by no later than June 30, 2018.
There is a risk that, if market conditions are such that the development of the Yeelirrie project would not be economically feasible at that time, we will be unable to submit the required development proposals under the State Agreement by June 30, 2018.
If we do require an extension of the deadline to submit the proposals under the State Agreement, we may make such a request of the Western Australian Government between April 1, 2018 and May 31, 2018. Although a number of extensions of the deadline for submitting proposals under the State Agreement have been granted by the government previously, there is no assurance that further extensions will be granted.
If an extension of the deadline is not granted and we do not submit the development proposals by the deadline of June 30, 2018, then the required approvals under the State Agreement are unlikely to be obtained. Without such approvals, the State Agreement will terminate and cease, and the Yeelirrie project tenements and titles granted under the State Agreement will expire. This may result in the loss of the Yeelirrie project without compensation for the loss of the investment.
3 – Regulatory risks
Government laws and regulation
Our business activities are subject to extensive and complex laws and regulations.
There are laws and regulations for uranium exploration, development, mining, milling, refining, conversion, fuel manufacturing, transport, exports, imports, taxes and royalties, labour standards, occupational health, waste disposal, protection and remediation of the environment, decommissioning and reclamation, safety, hazardous substances, emergency response, land use, water use and other matters.
Significant financial and management resources are required to comply with these laws and regulations, and this will likely continue as laws and government regulations become more and more strict. We are unable to predict the ultimate cost of compliance or its effect on our business because legal requirements change frequently, are subject to interpretation and may be enforced to varying degrees.
Some of our operations are regulated by government agencies that exercise discretionary powers conferred by statute. If these agencies do not apply their discretionary authority consistently, then we may not be able to predict the ultimate cost of complying with these requirements or their effect on operations.
Existing, new or changing laws, regulations and standards of regulatory enforcement could increase costs, lower, delay or interrupt production or affect decisions about whether to continue with existing operations or development projects. This could have a material and adverse effect on our earnings, cash flows, financial condition, results of operations or prospects.
| 2015 ANNUAL INFORMATION FORM Page 106 | ||
If we do not comply with the laws and regulations that apply to our business, or it is alleged we do not comply then regulatory or judicial authorities could take any number of enforcement actions, including:
| • | corrective measures that require us to increase capital or operating expenditures or install additional equipment |
| • | remedial actions that result in temporary or permanent shut-down or reduction of our operations |
| • | requirements that we compensate communities that suffer loss or damage because of our activities |
| • | civil or criminal fines or penalties. |
Legal and political circumstances are different outside North America, which can change the nature of regulatory risks in foreign jurisdictions when compared with regulatory risks associated with operations in North America.
Permitting and licensing
All mining projects and processing facilities around the world require government approvals, licences or permits, and our operations and development projects in Canada, the US, Kazakhstan and Australia are no exception. Depending on the location of the project, this can be a complex and time consuming process involving multiple government agencies.
We have to obtain and maintain many approvals, licences and permits from the appropriate regulatory authorities, but there is no assurance that they will grant or renew them, approve any additional licences or permits for potential changes to our operations in the future or in response to new legislation, or that they will process any of the applications on a timely basis. Stakeholders, like environmental groups, non-government organizations (NGOs) and aboriginal groups claiming rights to traditional lands, can raise legal challenges. A significant delay in obtaining or renewing the necessary approvals, licences or permits, or failure to receive the necessary approvals, licences or permits, could interrupt our operations or prevent them from operating, which could have a material and adverse effect on our earnings, cash flows, financial condition, results of operations or prospects.
4 – Financial risks
Volatility and sensitivity to prices
Since a significant portion of our revenues come from the sale of uranium and conversion services, our earnings and cash flow are closely related to, and sensitive to, fluctuations in the long and short-term market prices of U3O8 and uranium conversion services.
Many factors beyond our control affect these prices, including the following, among others:
| • | demand for nuclear power |
| • | forward contracts of U3O8 supplies for nuclear power plants |
| • | political and economic conditions in countries producing and buying uranium |
| • | reprocessing of used reactor fuel and the re-enrichment of depleted uranium tails |
| • | sales of excess civilian and military inventories of uranium by governments and industry participants |
| • | levels of uranium production and production costs |
| • | significant interruptions in production or delays in expansion plans or new mines going into production |
| • | investment and hedge fund activity in the uranium market. |
We cannot predict the effect that any one or all of these factors will have on the price of U3O8 and uranium conversion services. Prices have fluctuated widely in the last several years, and there have been significant declines in U3O8 prices since 2011.
| 2015 ANNUAL INFORMATION FORM Page 107 | ||
The table below shows the range in spot prices over the last five years.
Range of spot uranium prices US$/lb of U3O8 | ||||||||||||||||||||
| 2011 | 2012 | 2013 | 2014 | 2015 | ||||||||||||||||
High | $ | 72.63 | $ | 52.13 | $ | 43.88 | $ | 39.50 | $ | 39.45 | ||||||||||
Low | 49.13 | 41.75 | 34.50 | 28.23 | 34.23 | |||||||||||||||
Spot UF6 conversion values US$/kg U | ||||||||||||||||||||
High | $ | 13.00 | $ | 10.50 | $ | 10.50 | $ | 8.25 | $ | 8.25 | ||||||||||
Low | 8.00 | 6.63 | 8.50 | 7.25 | 6.88 | |||||||||||||||
The next table shows the range in term prices over the last five years.
Range of term uranium prices US$/lb of U3O8 | ||||||||||||||||||||
| 2011 | 2012 | 2013 | 2014 | 2015 | ||||||||||||||||
High | $ | 71.50 | $ | 61.25 | $ | 57.00 | $ | 50.00 | $ | 49.50 | ||||||||||
Low | 62.00 | 56.50 | 50.00 | 44.00 | 44.00 | |||||||||||||||
Term UF6 conversion values US$/kg U | ||||||||||||||||||||
High | $ | 16.75 | $ | 16.75 | $ | 16.75 | $ | 16.00 | $ | 16.00 | ||||||||||
Low | 15.25 | 16.75 | 16.00 | 16.00 | 13.50 | |||||||||||||||
Notes
| (1) | Spot and term uranium prices are the average of prices published monthly by Ux Consulting and from The Nuexco Exchange Value, published by TradeTech. |
| (2) | Spot and term UF6 conversion values are the average of the North American prices published monthly by Ux Consulting and from The Nuexco Conversion Value, published by TradeTech. |
If prices for U3O8 or uranium conversion services fall below our own production costs for a sustained period, continued production or conversion at our sites may cease to be profitable. This would have a material and adverse effect on our earnings, cash flows, financial condition, results of operations or prospects.
Declines in U3O8 prices could also delay or deter a decision to build or begin commercial production at one or more of our development projects, or adversely affect our ability to finance these development projects. Either of these could have an adverse effect on our future earnings, cash flows, financial condition, results of operations or prospects.
A sustained decline in U3O8 prices may require us to write down our mineral reserves and mineral resources, and any significant write downs may lead to material write downs of our investment in the mining properties affected, and an increase in charges for amortization, reclamation and closures.
In our uranium segment, we use a uranium marketing strategy as a way to reduce volatility in our future earnings and cash flow from exposure to fluctuations in uranium prices. It involves building a portfolio that consists of fixed-price contracts and market-related contracts with terms of 5 to 10 years (on average). This strategy can create opportunity losses because we may not benefit fully if there is a significant increase in U3O8 prices. This strategy also creates currency risk since we receive payment under the majority of our sales contracts in US$. There is no assurance that our contracting strategy will be successful.
Through our uranium segment and NUKEM, we participate in the uranium spot market from time to time, making purchases so we can put material into higher priced contracts. There are, however, risks associated with spot market purchases, including the risk of losses, which could have an adverse effect on our earnings, cash flows, financial condition or results of operations.
| 2015 ANNUAL INFORMATION FORM Page 108 | ||
Reserve, resource, production, capital and operating cost estimates
Reserve and resource estimates are not precise
Our mineral reserves and resources are the foundation of our uranium mining operations. They dictate how much uranium concentrate we can produce, and for how many years.
The uranium mineral reserves and resources reported in this AIF are estimates, and are therefore subjective. There is no assurance that the indicated tonnages or grades of uranium will be mined or milled or that we will receive the uranium price we used in estimating these reserves.
While we believe that the mineral reserve and resource estimates included in this AIF are well established and reflect management’s best estimates, reserve and resource estimates, by their nature, are imprecise, do not reflect exact quantities and depend to a certain extent on statistical inferences that may ultimately prove unreliable. The volume and grade of reserves we actually recover, and rates of production from our current mineral reserves, may be less than the estimate of the reserves. Fluctuations in the market price of uranium, changing exchange rates and operating and capital costs can make reserves uneconomic to mine in the future and ultimately cause us to reduce our reserves.
Short-term operating factors relating to mineral reserves, like the need for orderly development of orebodies or the processing of different ore grades, can also prompt us to modify reserve estimates or make reserves uneconomic to mine in the future, and can ultimately cause us to reduce our reserves. Reserves also may have to be re-estimated based on actual production experience.
Mineral resources may ultimately be reclassified as proven or probable mineral reserves if they demonstrate profitable recovery. Estimating reserves or resources is always affected by economic and technological factors, which can change over time, and experience in using a particular mining method. There is no assurance that any resource estimate will ultimately be reclassified as proven or probable reserves. If we do not obtain or maintain the necessary permits or government approvals, or there are changes to applicable legislation, it could cause us to reduce our reserves.
Mineral resource and reserve estimates can be uncertain because they are based on data from limited sampling and drilling and not from the entire orebody. As we gain more knowledge and understanding of an orebody, the resource and reserve estimate may change significantly, either positively or negatively.
If our mineral reserve or resource estimates for our uranium properties are inaccurate or are reduced in the future, it could:
| • | require us to write down the value of a property |
| • | result in lower uranium concentrate production than previously estimated |
| • | require us to incur increased capital or operating costs, or |
| • | require us to operate mines or facilities unprofitably. |
This could have a material and adverse effect on our earnings, cash flows, financial condition or results of operations or prospects.
Production, capital and operating cost estimates may be inaccurate
We prepare estimates of future production, capital costs and operating costs for particular operations, but there is no assurance we will achieve these estimates. Estimates of expected future production, capital costs and operating costs are inherently uncertain, particularly beyond one year, and could change materially over time.
Production, capital cost and operating cost estimates for:
| • | McArthur River assume that development, mining and production plans proceed as expected |
| • | Cigar Lake assume that development, mining and production plans proceed as expected |
| • | Inkai assume that development, mining and production plans proceed as expected. |
| 2015 ANNUAL INFORMATION FORM Page 109 | ||
Production estimates for uranium refining, conversion and fuel manufacturing assume there is no disruption or reduction in supply from us or third party sources, and that estimated rates and costs of processing are accurate, among other things.
Our actual production and costs may vary from estimates for a variety of reasons, including, among others:
• actual ore mined varying from estimated grade, tonnage, dilution, metallurgical and other characteristics
• mining and milling losses greater than planned
• short-term operating factors relating to the ore, such as the need for sequential development of orebodies and the processing of new or different ore grades
• risk and hazards associated with mining, milling, uranium refining, conversion and fuel manufacturing
• failure of mining methods and plans
• failure to obtain and maintain the necessary regulatory and participant approvals
• natural phenomena, such as inclement weather conditions or floods | • labour shortages or strikes
• development, mining or production plans for McArthur River are delayed or do not succeed for any reason
• development, mining or production plans for Cigar Lake are delayed or do not succeed for any reason, including as a result of any difficulties with freezing the deposit to meet production targets, or any difficulties with the McClean Lake mill modifications or expansion or milling Cigar Lake ore
• the production increase approval at McClean Lake is delayed or not obtained or there is a labour dispute at the McClean Lake mill
• development, mining or production plans for Inkai are delayed or do not succeed for any reason
• delays, interruption or reduction in production or construction activities due to fires, failure or unavailability of critical equipment, shortage of supplies, underground floods, earthquakes, tailings dam failures, lack of tailings capacity, ground movements and cave-ins, or other difficulties. |
Operating costs may also be affected by a variety of factors including: changing waste to ore ratios, ore grade metallurgy, labour costs, costs of supplies and services (for example, fuel and power), general inflationary pressures and currency exchange rates.
Failure to achieve production or cost estimates or a material increase in costs could have a material and adverse effect on our earnings, cash flows, financial condition or results of operations.
Currency fluctuations
Our earnings and cash flow may also be affected by fluctuations in the exchange rate between the Canadian and US dollar. Our sales of uranium and conversion services are mostly denominated in US dollars, while the production costs of both are denominated primarily in Canadian dollars. Our consolidated financial statements are expressed in Canadian dollars.
Any fluctuations in the exchange rate between the US dollar and Canadian dollar can result in favourable and unfavourable foreign currency exposure, which can have a material effect on our future earnings, cash flows, financial condition or results of operations, as has been the case in the past. While we use a hedging program to limit any adverse effects of fluctuations in foreign exchange rates, there is no assurance that these hedges will eliminate the potential material negative impact of fluctuating exchange rates.
Customers
Our main business relates to the production and sale of uranium concentrates (our uranium segment) and providing uranium conversion services (our fuel services segment). We rely heavily on a small number of customers to purchase a significant portion of our uranium concentrates and conversion services.
From 2016 through 2018, we expect:
| • | in our uranium segment, our five largest customers to account for 49% of our contracted supply of U3O8 |
| 2015 ANNUAL INFORMATION FORM Page 110 | ||
| • | in our fuel services segment, our five largest UF6 conversion customers to account for 54% of our contracted supply of UF6 conversion services. |
We are a supplier of UO2 used by Canadian CANDU heavy water reactors. Our sales to our largest customer accounted for 38% of our UO2 sales in 2015.
In addition, revenues in 2015 from one customer of our uranium, conversion and NUKEM segments represented $320 million (12%) of our total revenues from those businesses. Sales for the Bruce A and B reactors represent a substantial portion of our fuel manufacturing business.
If we lose any of our largest customers or if any of them curtails their purchases, it could have a material and adverse effect on our earnings, cash flows, financial condition or results of operations.
Counterparty and credit risk
Our business operations expose us to the risk of counterparties not meeting their contractual obligations, including:
| • | customers |
| • | suppliers |
| • | financial institutions and other counterparties to our derivative financial instruments and hedging arrangements relating to foreign currency exchange rates and interest rates |
| • | financial institutions which hold our cash on deposit |
| • | insurance providers. |
Credit risk is the risk that counterparties will not be able to pay for services provided under the terms of the contract. If a counterparty to any of our significant contracts defaults on a payment or other obligation or becomes insolvent, it could have a material and adverse effect on our cash flows, earnings, financial condition or results of operations.
Uranium products, conversion and fuel services
In our uranium and fuel services segments, we manage the credit risk of our customers for uranium products, conversion and fuel services by:
| • | monitoring their creditworthiness |
| • | asking for pre-payment or another form of security if they pose an unacceptable level of credit risk. |
As of December 31, 2015, 93% of our forecast revenue under contract for the period 2016 to 2018 is with customers whose creditworthiness meets our standards for unsecured payment terms.
Other
We manage the credit risk on our derivative and hedging arrangements, cash deposits and insurance policies by dealing with financial institutions and insurers that meet our credit rating standards and by limiting our exposure to individual counterparties.
We diversify or increase inventory in our supply chain to limit our reliance on a single contractor, or limited number of contractors. We also monitor the creditworthiness of our suppliers to manage the risk of suppliers defaulting on delivery commitments.
There is no assurance, however, that we will be successful in our efforts to manage the risk of default or credit risk.
Liquidity and financing
Nuclear energy and mining are extremely capital intensive businesses, and companies need significant ongoing capital to maintain and improve existing operations, invest in large scale capital projects with long lead times, and manage uncertain development and permitting timelines and the volatility associated with fluctuating uranium and input prices.
We believe our current financial resources are sufficient to support the exploration and development projects we have planned for 2016. If we expand these projects or our programs overall, we may need to raise additional financing through joint ventures, debt financing, equity financing or other means.
| 2015 ANNUAL INFORMATION FORM Page 111 | ||
There is no assurance that we will obtain the financing we need, when we need it. Volatile uranium markets, a claim against us, a significant event disrupting our business or operations, or other factors may make it difficult or impossible for us to obtain debt or equity financing on favourable terms, or at all.
Operating and capital plans
We establish our operating and capital plans based on the information we have at the time, including expert opinions. There is no assurance, however, that these plans will not change as new information becomes available or there is a change in expert opinion.
Pre-feasibility and feasibility studies contain estimated capital and operating costs, production and economic returns and other estimates that may be significantly different than actual results, and there is no assurance that they will not be different than anticipated or than what was disclosed in the studies. Our estimates may also be different from those of other companies, so they should not be used to project operating profit.
Internal controls
We use internal controls over financial reporting to provide reasonable assurance that we authorize transactions, safeguard assets against improper or unauthorized use, and record and report transactions properly. This gives us reasonable assurance that our financial reporting is reliable, and prepared in accordance with IFRS.
It is impossible for any system to provide absolute assurance or guarantee reliability, regardless of how well it is designed or operated. We continue to evaluate our internal controls to identify areas for improvement and provide as much assurance as reasonably possible. We conduct an annual assessment of our internal controls over financial reporting and produce an attestation report of their effectiveness by our independent auditors to meet the requirement of Section 404 of the Sarbanes-Oxley Act of 2002.
If we do not satisfy the requirements for internal controls on an ongoing, timely basis, it could negatively affect investor confidence in our financial reporting, which could have an impact on our business and the trading price of our common shares. If a deficiency is identified and we do not introduce new or better controls, or have difficulty implementing them, it could harm our financial results or our ability to meet reporting obligations.
Carrying values of assets
We evaluate the carrying value of our assets to decide whether current events and circumstances indicate whether or not we can recover the carrying amount. This involves comparing the estimated fair value of our reporting units to their carrying values.
We base our fair value estimates on various assumptions, however, the actual fair values can be significantly different than the estimates. If we do not have any mitigating valuation factors or experience a decline in the fair value of our reporting units, it could ultimately result in an impairment charge.
5 – Environmental risks
Complex legislation and environmental, health and safety risk
Our activities have an impact on the environment, so our operations are subject to extensive and complex laws and regulations relating to the protection of the environment, employee health and safety and waste management. We also face risks that are unique to uranium mining, processing and fuel manufacturing. Laws to protect the environment as well as employee health and safety are becoming more stringent for members of the nuclear energy industry.
Our facilities operate under various operating and environmental approvals, licences and permits that have conditions that we must meet as part of our regular business activities. In a number of instances, our right to continue operating these facilities depends on our compliance with these conditions.
| 2015 ANNUAL INFORMATION FORM Page 112 | ||
Our ability to obtain approvals, licences and permits, maintain them, and successfully develop and operate our facilities may be adversely affected by the real or perceived impact of our activities on the environment and human health and safety at our development projects and operations and in the surrounding communities. The real or perceived impact of activities of other nuclear energy or mining companies can also have an adverse effect on our ability to secure and maintain approvals, licences and permits.
Our compliance with laws and regulations relating to the protection of the environment, employee health and safety, and waste management requires significant expenditures and can cause delays in production or project development. This has been the case in the past and may be so in the future. Failing to comply can lead to fines and penalties, temporary or permanent suspension of development and operational activities, clean-up costs, damages and the loss of, or the inability to obtain, key approvals, permits and licences. We are exposed to these potential liabilities for our current development projects and operations as well as operations that have been closed. There is no assurance that we have been or will be in full compliance with all of these laws and regulations, or with all the necessary approvals, permits and licences.
Laws and regulations on the environment, employee health and safety, and waste management continue to evolve and this can create significant uncertainty around the environmental, employee health and safety, and waste management costs we incur. If new legislation and regulations are introduced in the future, they could lead to additional capital and operating costs, restrictions and delays at existing operations or development projects, and the extent of any of these possible changes cannot be predicted in a meaningful way.
Environmental and regulatory review is a long and complex process that can delay the opening, modification or expansion of a mine, conversion facility or refining facility, or extend decommissioning activities at a closed mine or other facility.
Our ability to foster and maintain the support of local communities and governments for our development projects and operations is critical to the conduct and growth of our business, and we do this by engaging in dialogue and consulting with them about our activities and the social and economic benefits they will generate. There is no assurance, however, that this support can be fostered or maintained. There is an increasing level of public concern relating to the perceived effect that nuclear energy and mining activities have on the environment and communities affected by the activities. Some NGOs are vocal critics of the nuclear energy and mining industries, and oppose globalization, nuclear energy and resource development. Adverse publicity generated by these NGOs or others, related to the nuclear energy industry or the extractive industry in general, or our operations in particular, could have an adverse effect on our reputation or financial condition and may affect our relationship with the communities we operate in. While we are committed to operating in a socially responsible way, there is no guarantee that our efforts will mitigate this risk.
These risks could delay or interrupt our operations or project development activities, delay, interrupt or lower our production and have a material and adverse effect on our earnings, cash flows, financial condition, results of operations or prospects.
Decommissioning and reclamation obligations
Environmental regulators are demanding more and more financial assurances so that the parties involved, and not the government, bear the cost of decommissioning and reclaiming sites.
We have filed conceptual decommissioning plans for some of our properties with the regulators. We review these plans for Canadian facilities every five years, or at the time of an amendment or renewal of an operating licence. Plans for our US sites are reviewed every year. Regulators review our conceptual plans on a regular basis. As the sites approach or go into decommissioning, regulators review the detailed decommissioning plans, and this can lead to additional requirements, costs and financial assurances. It is not possible to predict what level of decommissioning and reclamation and financial assurances regulators may require in the future.
If we must comply with additional regulations, or the actual cost of decommissioning and reclamation in the future is significantly higher than our current estimates, this could have a material and adverse effect on our future earnings, cash flows, financial condition or results of operations.
| 2015 ANNUAL INFORMATION FORM Page 113 | ||
6 – Legal and other risks
Litigation
We are currently subject to litigation or threats of litigation, and may be involved in disputes with other parties in the future that result in litigation. This litigation may involve joint venture participants, suppliers, governments, regulators, tax authorities or other persons.
We cannot accurately predict the outcome of any litigation. If a dispute cannot be resolved favourably, it may delay or interrupt our operations or project development activities and have a material and adverse effect on our earnings, cash flows, financial condition, results of operations or prospects. SeeLegal proceedings on page 117 for more information.
We are also currently involved in tax litigation with CRA and have received two RARs from the IRS. SeeTransfer pricing disputesat pages 92 to 95. In addition, we are subject to the risk that CRA or the IRS may challenge or seek to reassess our income tax returns on a similar basis for other previously reported periods, and the risk that CRA, the IRS or other tax authorities in other countries may seek to challenge or reassess our income tax returns on a different basis for the same periods or other previously reported periods. Substantial success for CRA would be material, and other unfavourable outcomes of challenges or reassessments initiated by the IRS or the tax authorities in other countries could be material, to our cash flows, financial condition, results of operations or prospects.
Legal rights
If a dispute arises at our foreign operations, it may be under the exclusive jurisdiction of foreign courts, or we may not be successful in subjecting foreign persons to the jurisdiction of courts in Canada. We could also be hindered or prevented from enforcing our rights relating to a government entity or instrumentality because of the doctrine of sovereign immunity.
The dispute resolution provision of the resource use contract for Inkai stipulates that any dispute between the parties is to be submitted to international arbitration. There is no assurance, however, that a particular government entity or instrumentality will either comply with the provisions of this or any other agreements, or voluntarily submit a dispute to arbitration. If we are unable to enforce our rights under these agreements, this could have a material and adverse effect on our earnings, cash flows, financial condition or results of operations.
Defects in title
We have investigated our rights to explore and exploit all of our material properties, and those rights are in good standing to the best of our knowledge. There is no assurance, however, that these rights will not be revoked or significantly altered to our detriment, or that our rights will not be challenged by third parties, including local governments and by indigenous groups, such as First Nations and Métis in Canada.
Indigenous rights, title claims and consultation
Managing indigenous rights, title claims and consultation is an integral part of our exploration, development and mining activities, and we are committed to managing them effectively. Cameco has signed agreements, or is in negotiations, with the communities closest to our operations to help mitigate the risks associated with potential First Nations and Métis land or consultation claims that could impact our operations. These agreements provide substantial socioeconomic opportunities to these communities and also provide us with support for our operations from those communities. There is no assurance, however, that we will not face material adverse consequences because of the legal and factual uncertainties inherent with indigenous rights, title claims and consultation.
Saskatchewan
Exploration, development, mining, milling and decommissioning activities at our various properties in Saskatchewan may be affected by claims by the First Nations and Métis, and related consultation issues.
| 2015 ANNUAL INFORMATION FORM Page 114 | ||
We also face similar issues with our exploration activities in other provinces and countries.
It is generally acknowledged that under historical treaties, First Nations in northern Saskatchewan ceded title to most traditional lands in the region in exchange for treaty benefits and reserve lands. Some First Nations in Saskatchewan, however, assert that their treaties are not an accurate record of their agreement with the Canadian government and that they did not cede title to the minerals when they ceded title to their traditional lands.
Fuel fabrication defects and product liability
We fabricate nuclear fuel bundles, other reactor components and monitoring equipment. These products are complex and may have defects that can be detected at any point in their product life cycle. Flaws in the products could materially and adversely affect our reputation, which could result in a significant cost to us and have a negative effect on our ability to sell our products in the future. We could also incur substantial costs to correct any product errors, which could have an adverse effect on our operating margins. While we have introduced significant automation to limit the potential for quality issues, there is no guarantee that we will detect all defects or errors in our products.
It is possible that some customers may demand compensation if we deliver defective products. If there are a significant number of product defects, it could have a significant impact on our operating results.
Agreements with some customers may include specific terms limiting our liability to customers. Even if there are limited liability provisions in place, existing or future laws, or unfavourable judicial decisions may make them ineffective. We have not experienced any material product liability claims to date, however, they could occur in the future because of the nature of nuclear fuel products. A successful product liability claim could result in significant monetary liability and could seriously disrupt our fuel manufacturing business and the company overall.
7 – Industry risks
Major nuclear incident risk
Although the safety record of nuclear reactors has generally been very good, there have been accidents and other unforeseen problems in the former USSR, the United States, Japan and in other countries. The consequences of a major incident can be severe and include loss of life, property damage and environmental damage. An accident or other significant event at a nuclear plant could result in increased regulation, less public support for nuclear energy, lower demand for uranium and lower uranium prices. This could have a material and adverse effect on our earnings, cash flows, financial condition, results of operations or prospects.
Public acceptance of nuclear energy is uncertain
Maintaining the demand for uranium at current levels and achieving any growth in demand in the future will depend on society’s acceptance of nuclear technology as a means of generating electricity.
On March 11, 2011, a significant earthquake struck the northeast coast of Japan, producing a tsunami and causing massive damage and destruction along the Pacific coastline of Japan. This included damage to the Fukushima-Daiichi nuclear power plant, located in the town of Okuma, about 210 kilometres north of Tokyo. The plant suffered a series of power and equipment failures affecting the cooling water systems and released radioactive material into the environment. The incident at the Fukushima-Daiichi nuclear power plant has called into question public confidence in nuclear energy in Japan and elsewhere around the world. This had an immediate and sustained negative impact on uranium prices and the share price of companies involved in the uranium industry.
Prior to the events of March 11, 2011, Japan had 54 nuclear reactors, which represented 12% of global nuclear generating capacity. As of March 11, 2016, Japan has two reactors operating. Before any of the reactors can be restarted, they must demonstrate an ability to meet new safety standards that were developed by Japan’s newly established Nuclear Regulatory Authority (NRA).
Germany has decided to revert to its previous phase out policy, shutting down eight of its reactors and plans to shut down the remaining nine reactors by 2022.
| 2015 ANNUAL INFORMATION FORM Page 115 | ||
Lack of public acceptance of nuclear technology would have an adverse effect on the demand for nuclear power and potentially increase the regulation of the nuclear power industry. We may be impacted by changes in regulation and public perception of the safety of nuclear power plants, which could adversely affect the construction of new plants, the re-licensing of existing plants, the demand for uranium and the future prospects for nuclear generation. These events could have a material adverse effect on our earnings, cash flows, financial condition, results of operations or prospects.
Industry Concentration Risk
We are concentrated in the nuclear fuel business, with our primary focus on uranium mining. As such, we are sensitive to changes in, and our performance and future prospects, will depend to a greater extent on, the overall condition of the nuclear energy industry and the public acceptance of nuclear energy. We may be susceptible to increased risks, compared to diversified metals trading companies or diversified mining companies, as a result of the fact that our operations are concentrated in the nuclear fuel business.
Because we derive the majority of our revenues from sales of nuclear fuel, our results of operations and cash flows will fluctuate as the price of nuclear fuel increases or decreases. See “Financial risks—Volatility and sensitivity to prices”. A sustained period of declining nuclear fuel prices would materially and adversely affect our results of operations and cash flows. Additionally, if the market price for nuclear fuel declines or remains at relatively low levels for a sustained period of time, we may have to revise our operating plans, including reducing operating costs and capital expenditures, terminating or suspending mining operations at one or more of our properties and discontinuing certain exploration and development plans. In a sustained period of low prices, we may be unable to decrease our costs in an amount sufficient to offset reductions in revenues, and may incur losses.
Alternate sources of energy
Nuclear energy competes with other sources of energy like oil, natural gas, coal and hydro-electricity. These sources are somewhat interchangeable with nuclear energy, particularly over the longer term.
If lower prices of oil, natural gas, coal and hydro-electricity are sustained over time, it may result in lower demand for uranium concentrates and uranium conversion services, which could lead to lower uranium prices. Growth of the uranium and nuclear power industry will depend on continuing and growing acceptance of nuclear technology to generate electricity. Unique political, technological and environmental factors affect the nuclear industry, exposing it to the risk of public opinion, which could have a negative effect on the demand for nuclear power and increase the regulation of the nuclear power industry. An accident at a nuclear reactor anywhere in the world could affect the acceptance of nuclear energy and the future prospects for nuclear generation, which could have a material and adverse effect on our future earnings, cash flows, financial condition, results of operations or prospects.
Industry competition and international trade restrictions
The international uranium industry, which includes supplying uranium concentrates and providing uranium conversion services, is highly competitive. We market uranium to utilities, and directly compete with a relatively small number of uranium mining and enrichment companies in the world. Their supply may come from mining uranium, excess inventories, including inventories made available from decommissioning of nuclear weapons, reprocessed uranium and plutonium derived from used reactor fuel, and from using excess enrichment capacity to re-enrich depleted uranium tails.
The supply of uranium is affected by a number of international trade agreements and policies. These and any similar future agreements, governmental policies or trade restrictions are beyond our control and may affect the supply of uranium available in the US, Europe and Asia, the world’s largest markets for uranium. If we cannot supply uranium to these important markets, it could have a material and adverse effect on our earnings, cash flows, financial condition or results of operations.
| 2015 ANNUAL INFORMATION FORM Page 116 | ||
For conversion services, we compete with three other primary commercial suppliers. In addition, we compete with the availability of additional supplies from excess inventories, including those from decommissioning nuclear weapons and using excess enrichment capacity to re-enrich depleted uranium tails.
Any political decisions about the uranium market can affect our future prospects. There is no assurance that the US or other governments will not enact legislation or take other actions that restricts who can buy or supply uranium, or facilitates a new supply of uranium.
Competition for sources of uranium
There is competition for mineral acquisition opportunities throughout the world, so we may not be able to acquire rights to explore additional attractive uranium mining properties on terms that we consider acceptable.
There is no assurance that we will acquire any interest in additional uranium properties, or buy additional uranium concentrates from the decommissioning of nuclear weapons or the release of excess government inventory, that will result in additional uranium concentrates we can sell. If we are not able to acquire these interests or rights, it could have a material and adverse effect on our future earnings, cash flows, financial condition or results of operations. Even if we do acquire these interests or rights, the resulting business arrangements may ultimately prove not to be beneficial.
Deregulation of the electrical utility industry
A significant part of our future prospects is directly linked to developments in the global electrical utility industry.
Deregulation of the utility industry, particularly in the US, Japan and Europe, could affect the market for nuclear and other fuels and could lead to the premature shutdown of some nuclear reactors.
Deregulation has resulted in utilities improving the performance of their reactors to record capacity, but there is no assurance this trend will continue.
Deregulation can have a material and adverse effect on our future earnings, cash flows, financial condition or results of operations.
Legal proceedings
We discuss any legal proceedings that we or our subsidiaries are a party to in note 22 to the 2015 financial statements.
| 2015 ANNUAL INFORMATION FORM Page 117 | ||
Investor information
Share capital
Our authorized share capital consists of:
| • | first preferred shares |
| • | second preferred shares |
| • | common shares |
| • | one class B share. |
Preferred shares
We do not currently have any preferred shares outstanding, but we can issue an unlimited number of first preferred or second preferred shares with no nominal or par value, in one or more series. The board must approve the number of shares, and the designation, rights, privileges, restrictions and conditions attached to each series of first or second preferred shares.
Preferred shares can carry voting rights, and they rank ahead of common shares and the class B share for receiving dividends and distributing assets if the company is liquidated, dissolved or wound up.
First preferred shares
Each series of first preferred shares ranks equally with the shares of other series of first preferred shares. First preferred shares rank ahead of second preferred shares, common shares and the class B share.
Second preferred shares
Each series of second preferred shares ranks equally with the shares of other series of second preferred shares. Second preferred shares rank after first preferred shares and ahead of common shares and the class B share.
Common shares
We can issue an unlimited number of common shares with no nominal or par value. Only holders of common shares have full voting rights in Cameco.
If you hold our common shares, you are entitled to vote on all matters that are to be voted on at any shareholder meeting, other than meetings that are only for holders of another class or series of shares. Each Cameco share you own represents one vote, except where noted below. As a holder of common shares, you are also entitled to receive any dividends that are declared by our board of directors.
Common shares rankafter preferred shares with respect to the payment of dividends and the distribution of assets if the company is liquidated, dissolved or wound up, or any other distribution of our assets among our shareholders if we were to wind up our affairs.
Holders of our common shares have no pre-emptive, redemption, purchase or conversion rights for these shares. Except as described underOwnership and voting restrictions, non-residents of Canada who hold common shares have the same rights as shareholders who are residents of Canada.
As at December 31, 2015, we had 395,792,522 common shares outstanding. These were fully paid and non-assessable.
As of March 1, 2016, there were 8,481,833 stock options outstanding to acquire common shares of Cameco under the company’s stock option plan with exercise prices ranging from $19.30 to $54.38.
In 2015, we granted the following stock options:
March 2, 2015 – 965,823 stock options to acquire common shares of Cameco at an exercise price of $19.30.
| 2015 ANNUAL INFORMATION FORM Page 118 | ||
In 2016, we granted the following stock options:
March 1, 2016 – 1,273,340 stock options to acquire common shares of Cameco at an exercise price of $16.38.
Our articles of incorporation have provisions that restrict the issue, transfer and ownership of voting securities of Cameco (seeOwnership and voting restrictionsbelow).
Class B shares
The province of Saskatchewan holds our one class B share outstanding. It is fully paid and non-assessable.
The one class B share entitles the province to receive notices of and attend all meetings of shareholders, for any class or series.
The class B shareholder can only vote at a meeting of class B shareholders, and only as a class if there is a proposal to:
| • | amend Part 1 of Schedule B of the articles, which states that: |
| • | Cameco’s registered office and head office operations must be in Saskatchewan |
| • | the vice-chairman of the board, chief executive officer (CEO), president, chief financial officer (CFO) and generally all of the senior officers (vice-presidents and above) must live in Saskatchewan |
| • | all annual meetings of shareholders must be held in Saskatchewan |
| • | amalgamate, if it would require an amendment to Part 1 of Schedule B of the articles, or |
| • | amend the articles in a way that would change the rights of class B shareholders. |
The class B shareholder can request and receive information from us to determine whether or not we are complying with Part 1 of Schedule B of the articles.
The class B shareholder does not have the right to receive any dividends declared by Cameco. The class B share ranks after first and second preferred shares, but equally with common shareholders, with respect to the distribution of assets if the company is liquidated, dissolved or wound up. The class B shareholder has no pre-emptive, redemption, purchase or conversion rights with its class B share, and the share cannot be transferred.
Ownership and voting restrictions
The federal government established ownership restrictions when Cameco was formed so we would remain Canadian controlled. There are restrictions on issuing, transferring and owning Cameco common shares whether you own the shares as a registered shareholder, hold them beneficially or control your investment interest in Cameco directly or indirectly. These are described in theEldorado Nuclear Limited Reorganization and Divestiture Act(Canada) (ENL Reorganization Act) and our company articles.
The following is a summary of the restrictions listed in our company articles.
Residents
A Canadian resident, either individually or together with associates, cannot hold, beneficially own or control shares or other Cameco securities, directly or indirectly, representing more than 25% of the votes that can be cast to elect directors.
Non-residents
A non-resident of Canada, either individually or together with associates, cannot hold, beneficially own or control shares or other Cameco securities, directly or indirectly, representing more than 15% of the total votes that can be cast to elect directors.
Voting restrictions
All votes cast at the meeting by non-residents, either beneficially or controlled directly or indirectly, will be counted and pro-rated collectively to limit the proportion of votes cast by non-residents to no more than 25% of the total shareholder votes cast at the meeting.
| 2015 ANNUAL INFORMATION FORM Page 119 | ||
There have been instances in prior years, including 2015, when we have limited the counting of votes by non-residents of Canada at our annual meeting of shareholders to abide by this restriction. This has resulted in non-residents receiving less than one vote per share.
Enforcement
The company articles allow us to enforce the ownership and voting restrictions by:
| • | suspending voting rights |
| • | forfeiting dividends and other distributions |
| • | prohibiting the issue and transfer of Cameco shares |
| • | requiring the sale or disposition of Cameco shares |
| • | suspending all other shareholder rights. |
To verify compliance with restrictions on ownership and voting of Cameco shares, we require existing shareholders, proposed transferees or other subscribers for voting shares to declare their residency, ownership of Cameco shares and other things relating to the restrictions. Nominees such as banks, trust companies, securities brokers or other financial institutions who hold the shares on behalf of beneficial shareholders need to make the declaration on their behalf.
We cannot issue or register a transfer of any voting shares if it would result in a contravention of the resident or non-resident ownership restrictions.
If we believe there is a contravention of our ownership restrictions based on any shareholder declarations filed with us, or our books and records or those of our registrar and transfer agent or otherwise, we can suspend all shareholder rights for the securities they hold, other than the right to transfer them. We can only do this after giving the shareholder 30 days’ notice, unless he or she has disposed of the holdings and we have been advised of this.
Understanding the terms
Please see our articles for the exact definitions ofassociate,resident,non-resident,control, andbeneficial ownership which are used for the restrictions described above.
Other restrictions
TheENL Reorganization Act imposes some additional restrictions on Cameco. We must maintain our registered office and our head office operations in Saskatchewan. We are also prohibited from:
| • | creating restricted shares (these are generally defined as a participating share with restrictive voting rights) |
| • | applying for continuance in another jurisdiction |
| • | enacting articles of incorporation or bylaws that have provisions that are inconsistent with theENL Reorganization Act. |
We must maintain our registered office and head office operations in Saskatchewan underthe Saskatchewan Mining Development Corporation Reorganization Act. This generally includes all executive, corporate planning, senior management, administrative and general management functions.
Credit ratings
Credit ratings provide an independent, professional assessment of a corporation’s credit risk. They are not a comment on the market price of a security or suitability for an individual investor and are, therefore, not recommendations to buy, hold or sell our securities.
We provide rating agencies DBRS Limited (DBRS) and Standard & Poor’s (S&P) with confidential, in-depth information to support the credit rating process.
The credit ratings assigned to our securities by external ratings agencies are important to our ability to raise capital at competitive pricing to support our business operations and liquidity position.
| 2015 ANNUAL INFORMATION FORM Page 120 | ||
The rating agencies may revise or withdraw these ratings if they believe circumstances warrant. A material downgrade in our credit ratings would likely increase our cost of funding significantly and our ability to access funding and capital through the capital markets could be reduced.
We have four series of senior unsecured debentures outstanding:
| • | $500 million of debentures issued on September 2, 2009 that have an interest rate of 5.67% per year and mature on September 2, 2019 |
| • | $400 million of debentures issued on November 14, 2012 that have an interest rate of 3.75% per year and mature on November 14, 2022 |
| • | $100 million of debentures issued on November 14, 2012 that have an interest rate of 5.09% per year and mature on November 14, 2042 |
| • | $500 million of debentures issued on June 24, 2014 that have an interest rate of 4.19% per year and mature on June 24, 2024. |
We have a commercial paper program which is supported by a $1.25 billion unsecured revolving credit facility that matures November 1, 2019. As of December 31, 2015, there were no amounts outstanding under the commercial paper facility.
The table below shows the current DBRS and S&P ratings and the rating trends/outlooks of our commercial paper and senior unsecured debentures:
| Rating Agency | Rating | Rating Trend/Outlook | ||
| Commercial papers | ||||
| DBRS | R-1 (low) | Negative | ||
| S&P | A-1 (low) | Stable | ||
| Senior Unsecured Debentures | ||||
| DBRS | A (low) | Negative | ||
| S&P | BBB+ | Stable |
DBRS uses rating trends to provide guidance regarding the outlook for the rating assigned. The trend is an indication of the likelihood that the rating could change in the future and the direction in which DBRS considers the rating is headed should present tendencies continue, or in some cases, unless challenges are addressed.
S&P uses rating outlooks to assess the potential direction of a long-term credit rating over the intermediate term. The outlook is an indication of the likelihood that the rating could change in the future.
The rating agencies may revise or withdraw these ratings if they believe circumstances warrant.
DBRS identified our current dispute with CRA and the high ore grade and challenging mining conditions at certain key operations as giving rise to higher project development and operating risks than those faced by other miners.
S&P identified our current dispute with CRA as a consideration giving rise to risk.
Commercial paper
Rating scales for commercial paper are meant to indicate the risk that a borrower will not fulfill its near-term debt obligations in a timely manner.
The table below explains the credit ratings of our commercial paper in more detail:
Rating | Ranking | |||
DBRS rates commercial paper by categories ranging from a high ofR-1 to a low ofD | R-1 (low) | • lower end of the R-1 category
• represents “good credit quality”
• third highest of 10 available credit ratings
| ||
S&P rates commercial paper by categories ranging from a high ofA-1 (high) to a low ofD | A-1 (low) | • represents “satisfactory capacity to meet its financial commitments on the obligation”
• third highest of eight available credit ratings | ||
| 2015 ANNUAL INFORMATION FORM Page 121 | ||
Senior unsecured debentures
Long-term debt rating scales are meant to indicate the risk that a borrower will not fulfill its full obligations, with respect to interest and principal, in a timely manner.
The table below explains the credit ratings of our senior unsecured debentures in more detail:
Rating | Ranking | |||
DBRS
rates senior unsecured debentures by categories ranging from a high ofAAA to a low ofD | A (low) | • lower end of the A category
• represents “good credit quality”
• third highest of 10 available credit ratings
• capacity for the payment of financial obligations is substantial, but of lesser credit quality than AA
• may be vulnerable to future events, but qualifying negative factors are considered manageable
• “negative” trend indicates the direction the rating may move if present circumstances continue | ||
S&P
rates senior unsecured debentures by categories ranging from a high ofAAAto a low ofD | BBB+ | • higher end of the BBB category
• exhibits “adequate protection parameters”
• fourth highest of 10 available credit ratings
• adverse economic conditions or changing circumstances are more likely to lead to a weakened capacity to meet financial commitment
• “stable” outlook means the rating is not likely to be changed | ||
Payments to Credit Rating Agencies
Over the last two years, we paid $851,157 in connection with the credit ratings disclosed above, of that $477,500 related to new issuance fees for the ratings of the senior unsecured debentures issued in 2014.
Material contracts
We are required by law to describe our material contracts in this AIF (not including material contracts that we entered into as part of the ordinary course of business) that we entered into before 2015 and remain in effect – there are five, which are described below. We did not enter into any new material contracts in 2015.
Supplemental indentures
We entered into theFourth supplemental indenture with CIBC Mellon Trust Company (CIBC Mellon) on September 2, 2009, relating to the issue of $500 million in unsecured debentures at an interest rate of 5.67% per year and due in 2019.
We entered into theFifth supplemental indenture with CIBC Mellon on November 14, 2012, relating to the issue of $400 million in unsecured debentures at an interest rate of 3.75% per year and due in 2022.
We entered into theSixth supplemental indenture with CIBC Mellon on November 14, 2012, relating to the issue of $100 million in unsecured debentures at an interest rate of 5.09% per year and due in 2042.
We entered into theSeventh supplemental indenture with CIBC Mellon on June 24, 2014, relating to the issue of $500 million in unsecured debentures at an interest rate of 4.19% per year and due in 2024.
SeeSenior unsecured debentures, above for more information about these debentures.
| 2015 ANNUAL INFORMATION FORM Page 122 | ||
US Trust Indenture
We entered into an indenture with The Bank of New York Mellon on May 22, 2012 to set forth the general terms and provisions of debt securities. The terms of this indenture were fully described in our final short form base shelf prospectus dated December 9, 2014. We have not issued any debt securities under this indenture. The specific terms of any offering of debt securities under this indenture would be set forth in a shelf prospectus supplement.
Market for our securities
Our common shares are listed and traded on the Toronto Stock Exchange (TSX) (under the symbol CCO) and the New York Stock Exchange (under the symbol CCJ).
We have a registrar and transfer agent in Canada and the US for our common shares:
| Canada | CST Trust Company P.O. Box 700, Station B Montreal, Quebec H3B 3K3 | US | American Stock Transfer & Trust Company, LLC 6201 15th Avenue Brooklyn, New York United States of America 11219 |
Trading activity
The table below shows the high and low closing prices and trading volume for our common shares on the TSX in 2015.
2015 | High ($) | Low ($) | Volume | |||||||||
January | 19.43 | 16.73 | 20,236,744 | |||||||||
February | 20.14 | 17.95 | 18,319,996 | |||||||||
March | 19.24 | 17.40 | 20,667,284 | |||||||||
April | 21.44 | 17.73 | 22,601,024 | |||||||||
May | 21.31 | 18.35 | 16,753,080 | |||||||||
June | 19.54 | 17.50 | 15,996,052 | |||||||||
July | 18.38 | 16.73 | 18,525,581 | |||||||||
August | 19.19 | 16.45 | 17,506,933 | |||||||||
September | 19.32 | 15.50 | 25,122,052 | |||||||||
October | 19.11 | 15.80 | 22,036,167 | |||||||||
November | 18.30 | 15.93 | 19,591,105 | |||||||||
|
|
|
|
|
| |||||||
December | 17.48 | 15.46 | 21,489,975 | |||||||||
|
|
|
|
|
| |||||||
Dividend policy
The board established a policy of paying quarterly dividends when we launched our initial public offering in 1991. It reviews the dividend policy from time to time in light of our financial position and other factors they consider relevant.
The table below shows the dividends per common share for the last three fiscal years.
| 2015 | 2014 | 2013 | ||||||||||
Cash dividends | $ | 0.40 | $ | 0.40 | $ | 0.40 | ||||||
| 2015 ANNUAL INFORMATION FORM Page 123 | ||
Governance
Directors
Director | Board committees | Principal occupation or employment | ||
Ian Bruce Calgary, Alberta, Canada Director since 2012 | Audit and finance Human resources and compensation Reserves oversight | Corporate director as of 2010
2010 to 2011 – Co-Chairman, Peters & Co. Limited | ||
Daniel Camus Geneva, Switzerland Director since 2011 | Audit and finance Human resources and compensation Safety, health and environment | Corporate director as of 2011
2012 to present – Chief Financial Officer of The Global Fund to Fight Aids, Tuberculosis and Malaria 2005 to 2010 – Head of Strategy and International Activities of Electricité de France SA | ||
John Clappison Toronto, Ontario, Canada Director since 2006 | Audit and finance (Chair) Nominating, corporate governance and risk | Corporate director as of 2006 | ||
James Curtiss Wagener, South Carolina, USA Director since 1994 | Human resources and compensation (Chair) Nominating, corporate governance and risk | April 2008 to present – principal of Curtiss Law | ||
Donald Deranger Prince Albert, Saskatchewan, Canada Director since 2009 | Reserves oversight Safety, health and environment | May 2013 to present – non-executive chair of the board of Points Athabasca Contracting LP 1997 to present – Advisor to First Nations Communities
2001 to May 2013 – President of Points Athabasca Contracting LP
2003 to 2012 – Athabasca Vice Chief of the Prince Albert Grand Council | ||
Catherine Gignac Mississauga, Ontario, Canada Director since 2014 | Reserves oversight (Chair) Audit and finance Safety, health and environment | Corporate director as of 2011
September 2011 to 2015 – principal of Catherine Gignac & Associates
April 2009 to September 2011 – mining equity research analyst with NCP Northland Capital Partners | ||
Tim Gitzel Saskatoon, Saskatchewan, Canada Director since 2011 | None | July 2011 to present – President and Chief Executive Officer
May 2010 to June 2011 – President | ||
James Gowans Surrey, British Columbia, Canada Director since 2009 | Safety, health and environment (Chair) Reserves oversight | January 2016 to present – President and CEO of Arizona Mining Inc., an exploration and development company
August to December 2015 – Senior Advisor to the Chair of the Board of Barrick Gold Corporation
July 2014 to August 2015 – Co-President of Barrick Gold Corporation
January 2014 to July 2014 – Executive Vice-President and Chief Operating Officer of Barrick Gold Corporation
January 2011 to January 2014 – Managing Director, Debswana Diamond Company | ||
| 2015 ANNUAL INFORMATION FORM Page 124 | ||
Director | Board committees | Principal occupation or employment | ||
Nancy Hopkins Saskatoon, Saskatchewan, Canada Director since 1992 | Nominating, corporate governance and risk (Chair) Audit and finance | 1984 to present – Lawyer, partner, McDougall Gauley LLP | ||
Donald Kayne Tsawwassen, British Columbia, Canada Director since 2016 | None | September 2012 to present – Chief Executive Officer of Canfor Pulp Products Incorporated, an integrated forest products company
May 2011 to present – President and Chief Executive Officer of Canfor Corporation
2000 – 2011 – Vice-President, Sales and Marketing, Canfor Corporation | ||
Anne McLellan Edmonton, Alberta, Canada Director since 2006 | Human resources and compensation Nominating, corporate governance and risk Safety, health and environment | May 2015 to present – Chancellor of Dalhousie University July 2006 to present – Senior Advisor at Bennett Jones LLP July 2006 to June 2013 – Distinguished Scholar in Residence at Alberta Institute for American Studies, University of Alberta | ||
Neil McMillan Saskatoon, Saskatchewan, Canada Director since 2002 | Chair | Corporate director as of April 2014 2004 to March 2014 – President and Chief Executive Officer, Claude Resources Inc. | ||
Each director is elected for a term of one year, and holds office until the next annual meeting unless he or she steps down, as required by corporate law.
Officers
Officer | Principal occupation or employment for past five years | |
Neil McMillan Chair of the Board Saskatoon, Saskatchewan, Canada | Corporate director as of April 2014 2004 to March 2014 – President and Chief Executive Officer, Claude Resources Inc. | |
Tim Gitzel President and Chief Executive Officer Saskatoon, Saskatchewan, Canada | Assumed current position July 2011 May 2010 to June 2011 – President | |
Grant Isaac Senior Vice-President and Chief Financial Officer Saskatoon, Saskatchewan, Canada | Assumed current position July 2011 July 2009 to July 2011 – Senior Vice-President, Corporate Services | |
Sean Quinn Senior Vice-President, Chief Legal Officer and Corporate Secretary Saskatoon, Saskatchewan, Canada | Assumed current position April 2014 May 2004 to March 2014 – Vice-President, Law and General Counsel | |
Robert Steane Senior Vice-President and Chief Operating Officer Saskatoon, Saskatchewan, Canada | Assumed current position May 2010 | |
Alice Wong Senior Vice-President and Chief Corporate Officer Saskatoon, Saskatchewan, Canada | Assumed current position July 2011 October 2008 to July 2011 – Vice-President, Safety, Health, Environment, Quality and Regulatory Relations | |
| 2015 ANNUAL INFORMATION FORM Page 125 | ||
To our knowledge, the total number of common shares that the directors and executive officers as a group either: (i) beneficially owned; or (ii) exercised direction or control over, directly or indirectly, was 503,092 as at March 1, 2016. This represents less than 1% of our outstanding common shares.
To the best of our knowledge, none of the directors, executive officers or shareholders that either: (i) beneficially owned; or (ii) exercised direction or control of, directly or indirectly, over 10% of any class of our outstanding securities, nor their associates or affiliates, have or have had within the three most recently completed financial years, any material interests in material transactions which have affected, or will materially affect, the company.
Other information about our directors and officers
None of our directors or officers, or a shareholder with significant holdings that could materially affect control of us, is or was a director or executive officer of another company in the past 10 years that:
| • | was the subject of a cease trade or similar order, or an order denying that company any exemption under securities legislation, for more than 30 consecutive days while the director or executive officer held that role with the company |
| • | was involved in an event that resulted in the company being subject to one of the above orders after the director or executive officer no longer held that role with the company |
| • | while acting in that capacity, or within a year of acting in that capacity, became bankrupt, made a proposal under any legislation relating to bankruptcy or insolvency or was subject to or instituted any proceedings, arrangement or compromise with creditors or had a receiver, receiver manager or trustee appointed to hold the assets of that company, except for: |
| • | Nancy Hopkins who from 2003 to 2014 was a director of Growthworks Canadian Fund Ltd., which has obtained court protection under theCompanies’ Creditors Arrangement Act (Canada) (CCAA); and |
| • | Ian Bruce who has been a director of Laricina Energy Limited (Laricina), a junior oilsands private company, since 2013. Laricina was under a CCAA protection order from March 26, 2015 to February 1, 2016. |
None of them in the past 10 years:
| • | became bankrupt |
| • | made a proposal under any legislation relating to bankruptcy or insolvency |
| • | has been subject to or launched any proceedings, arrangement or compromise with any creditors, or |
| • | had a receiver, receiver manager or trustee appointed to hold any of their assets. |
None of them has ever been subject to:
| • | penalties or sanctions imposed by a court relating to securities legislation or by a securities regulatory authority or has entered into a settlement agreement with a securities regulatory authority, or |
| • | any other penalties or sanctions imposed by a court or regulatory body that would likely be considered important to a reasonable investor in making an investment decision. |
| 2015 ANNUAL INFORMATION FORM Page 126 | ||
About the audit and finance committee
Audit and finance committee charter
See appendix A for a copy of the audit and finance committee charter. You can also find a copy on our website (cameco.com/about/governance/board_committees).
Composition of the audit and finance committee
The committee is made up of five members: John Clappison (chair), Ian Bruce, Daniel Camus, Catherine Gignac and Nancy Hopkins. Each member is independent and financially literate using criteria that meet the standards of the Canadian Securities Administrators as set out in National Instrument 52-110.
Relevant education and experience
John Clappison, a corporate director, is the former managing partner of the Greater Toronto Area office of PricewaterhouseCoopers LLP (PwC). He is our committee chair and currently serves on the boards of two other publicly-traded companies, on one of which he is the chair of the audit committee and one of which he is a member of the audit committee. Mr. Clappison has over 35 years of experience as a practicing chartered accountant and was an audit partner at PwC. He serves on boards of other private and not-for-profit organizations. Mr. Clappison is a chartered accountant and a Fellow of the Chartered Professional Accountants of Ontario.
Ian Bruce, a corporate director, is the former President and CEO of Peters & Co. Limited, an independent investment dealer. He was a past member of the Expert Panel on Securities Regulation for the Minister of Finance of Canada. Mr. Bruce was a board member and chair of the Investment Industry Association of Canada, and also served as a director of the public companies Hardy Oil & Gas plc from 2008 to 2012 and Taylor Gas Liquids Ltd. from 1997 to 2008. He currently serves on the board of two other publicly-traded companies, on one of which he is the chair of the audit committee and one of which he is a member of the audit committee, and three private companies. Mr. Bruce is a Fellow of the Chartered Professional Accountants (CPA) of Alberta, a recognized Specialist in Valuation under Canadian CPA rules and is a Chartered Business Valuator.
Daniel Camus is the former group chief financial officer and former head of strategy and international activities of Electricité de France SA (EDF), a France-based integrated energy operator active in the generation, distribution, transmission, supply and trading of electrical energy with international subsidiaries. He currently serves on the boards of two other publicly-traded companies, on one of which he is the chair of the audit committee. He is the Chief Financial Officer of the humanitarian finance organization, The Global Fund to Fight AIDS, Tuberculosis and Malaria. Mr. Camus received his PhD in Economics from Sorbonne University and an MBA in finance and economics from the Institute d’Études Politiques de Paris.
Catherine Gignac, a corporate director, is a former mining equity research analyst with leading global brokerage firms including, NCP Northland Capital Partners. She currently serves on the boards of two other publicly-traded companies, on one of which she is the chair of its board and on the other she is a member of its audit committee. She has more than 30 years’ experience as a mining equity research analyst and geologist. She held senior positions with leading firms, including Merrill Lynch Canada, RBC Capital Markets, UBS Investment Bank and Dundee Capital Markets Inc. and Loewen Ondaatje McCutcheon Limited. Ms. Gignac was the principal of Catherine Gignac & Associates from 2011 to 2015.
Nancy Hopkins is a partner with the law firm of McDougall Gauley, LLP in Saskatoon where she concentrates her practice on corporate, commercial and tax law. She currently serves on the board of one other publicly-traded company and the Canadian Pension Plan Investment Board. She formerly served on the boards of Canadian Institute of Chartered Accountants (now Chartered Professional Accountants Canada) and the Saskatchewan Airport Authority as well as the board of governors of the University of Saskatchewan. Ms. Hopkins received her bachelor of commerce and law degrees from the University of Saskatchewan, and is an honorary member of the Chartered Professional Accountants of Saskatchewan.
| 2015 ANNUAL INFORMATION FORM Page 127 | ||
Auditors’ fees
The table below shows the fees we paid to the external auditors for services in 2015 and 2014:
| 2015 ($) | % of total fees (%) | 2014 ($) | % of total fees (%) | |||||||||||||
Audit fees | ||||||||||||||||
Cameco | 1,939,000 | 57.3 | 1,743,300 | 48.7 | ||||||||||||
Subsidiaries | 904,900 | 26.7 | 798,900 | 22.4 | ||||||||||||
|
|
|
|
|
|
|
| |||||||||
Total audit fees | 2,843,900 | 84.0 | 2,542,200 | 71.1 | ||||||||||||
|
|
|
|
|
|
|
| |||||||||
Audit-related fees | ||||||||||||||||
Translation services | — | 0.0 | 178,500 | 5.0 | ||||||||||||
Pensions and other | 27,300 | 0.8 | 177,800 | 5.0 | ||||||||||||
|
|
|
|
|
|
|
| |||||||||
Total audit-related fees | 27,300 | 0.8 | 356,300 | 10.0 | ||||||||||||
|
|
|
|
|
|
|
| |||||||||
Tax fees | ||||||||||||||||
Compliance | 150,500 | 4.5 | 307,800 | 8.6 | ||||||||||||
Planning and advice | 362,600 | 10.7 | 367,400 | 10.3 | ||||||||||||
|
|
|
|
|
|
|
| |||||||||
Total tax fees | 513,100 | 15.2 | 675,200 | 18.9 | ||||||||||||
|
|
|
|
|
|
|
| |||||||||
All other fees | — | 0.0 | — | 0.0 | ||||||||||||
|
|
|
|
|
|
|
| |||||||||
Total fees | 3,384,300 | 100.00 | 3,573,700 | 100.0 | ||||||||||||
|
|
|
|
|
|
|
| |||||||||
Approving services
The audit and finance committee must pre-approve all services the external auditors will provide to make sure they remain independent. This is according to our audit and finance committee charter and consistent with our corporate governance practices. The audit and finance committee pre-approves services up to a specific limit. If we expect the fees to exceed the limit, or the external auditors to provide new audit or non-audit services that have not beenpre-approved in the past, then this must be pre-approved separately.
Any service that is not generally pre-approved must be approved by the audit and finance committee before the work is carried out, or by the committee chair, or board chair in his or her absence, as long as the proposed service is presented to the full audit and finance committee at its next meeting.
The committee has adopted a written policy that describes the procedures for implementing these principles.
Interest of experts
Our auditor is KPMG LLP, independent chartered accountants, who have audited our 2015 financial statements.
KPMG LLP are the auditors of Cameco and have confirmed with respect to Cameco that they are independent within the meaning of the relevant rules and related interpretations prescribed by the relevant professional bodies in Canada and any applicable legislation or regulations.
The individuals who are qualified persons for the purposes of NI 43-101 and employees of Cameco are listed underMineral reserves and resourceson page 72. As a group, they beneficially own, directly or indirectly, less than 1% of any class of the outstanding securities of Cameco and our associates and affiliates.
| 2015 ANNUAL INFORMATION FORM Page 128 | ||
Appendix A
Audit and finance committee of the Board of Directors
Mandate
Purpose
The primary purpose of the audit and finance committee (committee) is to assist the board of directors (board) in fulfilling its oversight responsibilities for (a) the accounting and financial reporting processes, (b) the internal controls, (c) the external auditors, including performance, qualifications, independence, and their audit of the corporation’s financial statements, (d) the performance of the corporation’s internal audit function, (e) financial matters and risk management of financial risks as delegated by the board, (f) the corporation’s process for monitoring compliance with laws and regulations (other than environmental and safety laws) and its code of conduct and ethics, and (g) prevention and detection of fraudulent activities. The committee shall also prepare such reports as required to be prepared by it by applicable securities laws.
In addition, the committee provides an avenue for communication between each of the internal auditor, the external auditors, management, and the board. The committee shall have a clear understanding with the external auditors that they must maintain an open and transparent relationship with the committee and that the ultimate accountability of the external auditors is to the board and the committee, as representatives of the shareholders. The committee, in its capacity as a committee of the board, subject to the requirements of applicable law, is directly responsible for the appointment, compensation, retention, and oversight of the external auditors.
The committee has the authority to communicate directly with the external auditors and internal auditor.
The committee shall make regular reports to the board concerning its activities and in particular shall review with the board any issues that arise with respect to the quality or integrity of the corporation’s financial statements, the performance and independence of the external auditors, the performance of the corporation’s internal audit function, or the corporation’s process for monitoring compliance with laws and regulations other than environmental and safety laws.
Composition
The board shall appoint annually, from among its members, a committee and its chair. The committee shall consist of at least three members and shall not include any director employed by the corporation.
Each committee member will be independent pursuant to the standards for independence adopted by the board.
Each committee member shall be financially literate with at least one member having accounting or related financial expertise, using the terms defined as follows:
“Financially literate” means the ability to read and understand a set of financial statements that present a breadth and level of complexity of accounting issues that are generally comparable to the breadth and complexity of issues that can reasonably be expected to be raised by the corporation’s financial statements; and
“Accounting or related financial expertise” means the ability to analyse and interpret a full set of financial statements, including the notes attached thereto, in accordance with Canadian generally accepted accounting principles.
In addition, where possible, at least one member of the committee shall qualify as an “audit committee financial expert” within the meaning of applicable securities law.
Members of the committee may not serve on the audit and finance committees of more than three public companies (including Cameco’s) without the approval of the board.
| 2015 ANNUAL INFORMATION FORM Page 129 | ||
Meetings
The committee will meet at least four times annually and as many additional times as the committee deems necessary to carry out its duties effectively. The committee will meet separately in private with the external auditors, the internal auditor and management at each regularly scheduled meeting.
A majority of the members of the committee shall constitute a quorum. No business may be transacted by the committee except at a meeting of its members at which a quorum of the committee is present.
The committee may invite such officers, directors and employees of the corporation as it may see fit from time to time to attend at meetings of the committee and assist thereat in the discussion and consideration of any matter.
A meeting of the committee may be convened by the chair of the committee, a member of the committee, the external auditors, the internal auditor, the chief executive officer or the chief financial officer. The secretary, who shall be appointed by the committee, shall, upon direction of any of the foregoing, arrange a meeting of the committee. The committee shall report to the board in a timely manner with respect to each of its meetings.
Duties and responsibilities
To carry out its oversight responsibilities, the committee shall:
Financial reporting process
| 1. | Review with management and the external auditors any items of concern, any proposed changes in the selection or application of major accounting policies and the reasons for the change, any identified risks and uncertainties, and any issues requiring management judgement, to the extent that the foregoing may be material to financial reporting. |
| 2. | Consider any matter required to be communicated to the committee by the external auditors under applicable generally accepted auditing standards, applicable law and listing standards, including the external auditors’ report to the committee (and management’s response thereto) on: (a) all critical accounting policies and practices used by the corporation; (b) all material alternative accounting treatments of financial information within generally accepted accounting principles that have been discussed with management, including the ramifications of the use of such alternative treatments and disclosures and the treatment preferred by the external auditors; and (c) any other material written communications between the external auditors and management. |
| 3. | Require the external auditors to present and discuss with the committee their views about the quality, not just the acceptability, of the implementation of generally accepted accounting principles with particular focus on accounting estimates and judgements made by management and their selection of accounting principles. |
| 4. | Discuss with management and the external auditors (a) any accounting adjustments that were noted or proposed (i.e. immaterial or otherwise) by the external auditors but were not reflected in the financial statements, (b) any material correcting adjustments that were identified by the external auditors in accordance with generally accepted accounting principles or applicable law, (c) any communication reflecting a difference of opinion between the audit team and the external auditors’ national office on material auditing or accounting issues raised by the engagement, and (d) any “management” or “internal control” letter issued, or proposed to be issued, by the external auditors to the corporation. |
| 5. | Discuss with management and the external auditors any significant financial reporting issues considered during the fiscal period and the method of resolution. Resolve disagreements between management and the external auditors regarding financial reporting. |
| 6. | Review with management and the external auditors (a) any off-balance sheet financing mechanisms being used by the corporation and their effect on the corporation’s financial statements and (b) the effect of regulatory and accounting initiatives on the corporation’s financial statements, including the potential impact of proposed initiatives. |
| 2015 ANNUAL INFORMATION FORM Page 130 | ||
| 7. | Review with management and the external auditors and legal counsel, if necessary, any litigation, claim or other contingency, including tax assessments, that could have a material effect on the financial position or operating results of the corporation, and the manner in which these matters have been disclosed or reflected in the financial statements. |
| 8. | Review with the external auditors any audit problems or difficulties experienced by the external auditors in performing the audit, including any restrictions or limitations imposed by management, and management’s response. Resolve any disagreements between management and the external auditors regarding these matters. |
| 9. | Review the results of the external auditors’ audit work including findings and recommendations, management’s response, and any resulting changes in accounting practices or policies and the impact such changes may have on the financial statements. |
| 10. | Review and discuss with management and the external auditors the audited annual financial statements and related management discussion and analysis, make recommendations to the board with respect to approval thereof, before being released to the public, and obtain an explanation from management of all significant variances between comparable reporting periods. |
| 11. | Review and discuss with management and the external auditors all interim unaudited financial statements and related interim management discussion and analysis and make recommendations to the board with respect to the approval thereof, before being released to the public. |
| 12. | Obtain confirmation from the chief executive officer and the chief financial officer (and considering the external auditors’ comments, if any, thereon) to their knowledge: |
| (a) | that the audited financial statements, together with any financial information included in the annual MD&A and annual information form, fairly present in all material respects the corporation’s financial condition, cash flow and results of operation, as of the date and for the periods presented in such filings; and |
| (b) | that the interim financial statements, together with any financial information included in the interim MD&A, fairly present in all material respects the corporation’s financial condition, cash flow and results of operation, as of the date and for the periods presented in such filings. |
| 13. | Review news releases to be issued in connection with the audited annual financial statements and related management discussion and analysis and the interim unaudited financial statements and related interim management discussion and analysis, before being released to the public. Discuss the type and presentation of information to be included in news releases (paying particular attention to any use of “pro-forma” or “adjusted” non-GAAP, information). |
| 14. | Review any news release, before being released to the public, containing earnings guidance or financial information based upon the corporation’s financial statements prior to the release of such statements. |
| 15. | Review the appointment of the chief financial officer and have the chief financial officer report to the committee on the qualifications of new key financial executives involved in the financial reporting process. |
| 16. | Consult with the human resources and compensation committee on the succession plan for the chief financial officer and controller. Review the succession plans in respect of the chief financial officer and controller. |
Internal Controls
| 1. | Receive from management a statement of the corporation’s system of internal controls over accounting and financial reporting. |
| 2. | Consider and review with management, the internal auditor and the external auditors, the adequacy and effectiveness of internal controls over accounting and financial reporting within the corporation and any proposed significant changes in them. |
| 3. | Consider and discuss the scope of the internal auditors and external auditors review of the corporation’s internal controls, and obtain reports on significant findings and recommendations, together with management responses. |
| 2015 ANNUAL INFORMATION FORM Page 131 | ||
| 4. | Discuss, as appropriate, with management, the external auditors and the internal auditor, any major issues as to the adequacy of the corporation’s internal controls and any special audit steps in light of material internal control deficiencies. |
| 5. | Review annually the disclosure controls and procedures, including (a) the certification timetable and related process and (b) the procedures that are in place for the review of the corporation’s disclosure of financial information extracted from the corporation’s financial statements and the adequacy of such procedures. Receive confirmation from the chief executive officer and the chief financial officer of the effectiveness of disclosure controls and procedures, and whether there are any significant deficiencies and material weaknesses in the design or operation of internal control over financial reporting which are reasonably likely to adversely affect the corporation’s ability to record, process, summarize and report financial information or any fraud, whether or not material, that involves management or other employees who have a significant role in the corporation’s internal control over financial reporting. In addition, receive confirmation from the chief executive officer and the chief financial officer that they are prepared to sign the annual and quarterly certificates required by applicable securities law. |
| 6. | Review management’s annual report and the external auditors’ report on the assessment of the effectiveness of the corporation’s internal control over financial reporting. |
| 7. | Receive a report, at least annually, from the reserves oversight committee of the board on the corporation’s mineral reserves. |
External Auditors
| (i) | External Auditors’ Qualifications and Selection |
| 1. | Subject to the requirements of applicable law, be solely responsible to select, retain, compensate, oversee, evaluate and, where appropriate, replace the external auditors, who must be registered with agencies mandated by applicable law. The committee shall be entitled to adequate funding from the corporation for the purpose of compensating the external auditors for completing an audit and audit report. |
| 2. | Instruct the external auditors that: |
| (a) | they are ultimately accountable to the board and the committee, as representatives of shareholders; and |
| (b) | they must report directly to the committee. |
| 3. | Ensure that the external auditors have direct and open communication with the committee and that the external auditors meet regularly with the committee without the presence of management to discuss any matters that the committee or the external auditors believe should be discussed privately. |
| 4. | Evaluate the external auditors’ qualifications, performance, and independence. As part of that evaluation: |
| (a) | at least annually, request and review a formal report by the external auditors describing: the firm’s internal quality-control procedures; any material issues raised by the most recent internal quality-control review, or peer review, of the firm, or by any inquiry or investigation by governmental or professional authorities, within the preceding five years, respecting one or more independent audits carried out by the firm, and any steps taken to deal with any such issues; and (to assess the auditors’ independence) all relationships between the external auditors and the corporation, including the amount of fees received by the external auditors for the audit services and for various types of non-audit services for the periods prescribed by applicable law; and |
| (b) | annually review and confirm with management and the external auditors the independence of the external auditors, including the extent of non-audit services and fees, the extent to which the compensation of the audit partners of the external auditors is based upon selling non-audit services, the timing and process for implementing the rotation of the lead audit partner, reviewing partner and other partners providing audit services for the corporation, whether there should be a regular rotation of the audit firm itself, and whether there has been a “cooling off” period of one year for any former employees of the external auditors who are now employees with a financial oversight role, in order to assure compliance with applicable law on such matters; and |
| 2015 ANNUAL INFORMATION FORM Page 132 | ||
| (c) | annually review and evaluate senior members of the external audit team, including their expertise and qualifications. In making this evaluation, the audit and finance committee should consider the opinions of management and the internal auditor. |
Conclusions on the independence of the external auditors should be reported to the board.
| 5. | Review and approve the corporation’s policies for the corporation’s hiring of employees and former employees of the external auditors. Such policies shall include, at minimum, a one-year hiring “cooling off” period. |
| (ii) | Other Matters |
| 6. | Meet with the external auditors to review and approve the annual audit plan of the corporation’s financial statements prior to the annual audit being undertaken by the external auditors, including reviewing the year-to-year co-ordination of the audit plan and the planning, staffing and extent of the scope of the annual audit. This review should include an explanation from the external auditors of the factors considered by the external auditors in determining their audit scope, including major risk factors. The external auditors shall report to the committee all significant changes to the approved audit plan. |
| 7. | Review and approve the basis and amount of the external auditors’ fees with respect to the annual audit in light of all relevant matters. |
| 8. | Review and pre-approve all audit and non-audit service engagement fees and terms in accordance with applicable law, including those provided to the subsidiaries of the corporation by the external auditors or any other person in its capacity as external auditors of such subsidiary. Between scheduled committee meetings, the chair of the committee, on behalf of the committee, is authorised to pre-approve any audit or non-audit service engagement fees and terms. At the next committee meeting, the chair shall report to the committee any such pre-approval given. Establish and adopt procedures for such matters. |
Internal Auditor
| 1. | Review and approve the appointment or removal of the internal auditor. |
| 2. | Review and discuss with the external auditors, management, and internal auditor the responsibilities, budget and staffing of the corporation’s internal audit function. |
| 3. | Review and approve the mandate for the internal auditor and the scope of annual work planned by the internal auditor, receive summary reports of internal audit findings, management’s response thereto, and reports on any subsequent follow-up to any identified weakness. |
| 4. | Ensure that the internal auditor has direct and open communication with the committee and that the internal auditor meets regularly with the committee without the presence of management to discuss any matters that the committee or the internal auditor believe should be discussed privately, such as problems or difficulties which were encountered in the course of internal audit work, including restrictions on the scope of activities or access to required information, and any disagreements with management. |
| 5. | Review and discuss with the internal auditor and management the internal auditor’s ongoing assessments of the corporation’s business processes and system of internal controls. |
| 6. | Review the effectiveness of the internal audit function, including staffing, organizational structure and qualifications of the internal auditor and staff. |
Compliance
| 1. | Monitor compliance by the corporation with all payments and remittances required to be made in accordance with applicable law, where the failure to make such payments could render the directors of the corporation personally liable. |
| 2. | The receipt of regular updates from management regarding compliance with laws and regulations and the process in place to monitor such compliance, excluding, however, legal compliance matters subject to the |
| 2015 ANNUAL INFORMATION FORM Page 133 | ||
| oversight of the safety, health and environment committee of the board. Review the findings of any examination by regulatory authorities and any external auditors’ observations relating to such matters. |
| 3. | Establish and oversee the procedures in the code of conduct and ethics policy to address: |
| (a) | the receipt, retention and treatment of complaints received by the corporation regarding accounting, internal accounting or auditing matters; and |
| (b) | confidential, anonymous submissions by employees of concerns regarding questionable accounting and auditing matters. |
Receive periodically a summary report from the senior vice-president governance, law and corporate secretary on such matters as required by the code of conduct and ethics.
| 4. | Review and recommend to the board for approval a code of conduct and ethics for employees, officers and directors of the corporation. Monitor management’s implementation of the code of conduct and ethics and the international business conduct policy and review compliance therewith by, among other things, obtaining an annual report summarizing statements of compliance by employees pursuant to such policies and reviewing the findings of any investigations of non-compliance. Periodically review the adequacy and appropriateness of such policies and make recommendations to the board thereon. |
| 5. | Monitor management’s implementation of the anti-fraud policy; and review compliance therewith by, among other things, receiving reports from management on: |
| (a) | any investigations of fraudulent activity; |
| (b) | monitoring activities in relation to fraud risks and controls; and |
| (c) | assessments of fraud risk. |
Periodically review the adequacy and appropriateness of the anti-fraud policy and make recommendations to the board thereon.
| 6. | Review all proposed related party transactions and situations involving a director’s, senior officer’s or an affiliate’s potential or actual conflict of interest that are not required to be dealt with by an “independent committee” pursuant to securities law rules, other than routine transactions and situations arising in the ordinary course of business, consistent with past practice. Between scheduled committee meetings, the chair of the committee, on behalf of the committee, is authorised to review all such transactions and situations. At the next committee meeting, the chair shall report the results of such review. Ensure that political and charitable donations conform with policies and budgets approved by the board. |
| 7. | Monitor management of hedging, debt and credit, make recommendations to the board respecting policies for management of such risks, and review the corporation’s compliance therewith. |
| 8. | Approve the review and approval process for the expenses submitted for reimbursement by the chief executive officer. |
| 9. | Oversee management’s mitigation of material risks within the committee’s mandate and as otherwise assigned to it by the nominating, corporate governance and risk committee. |
Financial Oversight
| 1. | Assist the board in its consideration and ongoing oversight of matters pertaining to: |
| (a) | capital structure and funding including finance and cash flow planning; |
| (b) | capital management planning and initiatives; |
| (c) | property and corporate acquisitions and divestitures including proposals which may have a material impact on the corporation’s capital position; |
| (d) | the corporation’s annual budget and two-year business plan; |
| 2015 ANNUAL INFORMATION FORM Page 134 | ||
| (e) | the activities of the corporation’s trading group including financial results, compliance with approval limits, any significant breaches of policies, and risk measures on significant positions and the portfolio in aggregate; |
| (f) | the corporation’s insurance program; |
| (g) | directors’ and officers’ liability insurance and indemnity agreements; and |
| (h) | matters the board may refer to the committee from time to time in connection with the corporation’s capital position. |
Organizational matters
| 1. | The procedures governing the committee shall, except as otherwise provided for herein, be those applicable to the board committees as set forth in Part 7 of the General Bylaws of the corporation. |
| 2. | The members and the chair of the committee shall be entitled to receive remuneration for acting in such capacity as the board may from time to time determine. |
| 3. | The committee shall have the resources and authority appropriate to discharge its duties and responsibilities, including the authority to: |
| (a) | select, retain, terminate, set and approve the fees and other retention terms of special or independent counsel, accountants or other experts, as it deems appropriate; and |
| (b) | obtain appropriate funding to pay, or approve the payment of, such approved fees; |
without seeking approval of the board or management.
| 4. | Any member of the committee may be removed or replaced at any time by the board and shall cease to be a member of the committee upon ceasing to be a director. The board may fill vacancies on the committee by appointment from among its members. If and whenever a vacancy shall exist on the committee, the remaining members may exercise all its powers so long as a quorum remains in office. Subject to the foregoing, each member of the committee shall remain as such until the next annual meeting of shareholders after that member’s election. |
| 5. | The committee shall annually review and assess the adequacy of its mandate and recommend any proposed changes to the nominating, corporate governance and risk committee for recommendation to the board for approval. |
| 6. | The committee shall participate in an annual performance evaluation, the results of which will be reviewed by the board. |
| 7. | The committee shall perform any other activities consistent with this mandate, the corporation’s governing laws and the regulations of stock exchanges, as the committee or the board deems necessary or appropriate. |
| 8. | A standing invitation will be issued to all non-executive directors to attend the financial oversight portion of each committee meeting. |
| 2015 ANNUAL INFORMATION FORM Page 135 | ||