Exhibit 99.2

Management’s discussion and analysis
for the quarter ended June 30, 2016
SECOND QUARTER UPDATE | 4 | |||
CONSOLIDATED FINANCIAL RESULTS | 6 | |||
OUTLOOK FOR 2016 | 13 | |||
LIQUIDITY AND CAPITAL RESOURCES | 15 | |||
FINANCIAL RESULTS BY SEGMENT | ||||
URANIUM | 17 | |||
FUEL SERVICES | 19 | |||
NUKEM | 20 | |||
OUR OPERATIONS | ||||
URANIUM 2016 Q2 UPDATES | 21 | |||
FUEL SERVICES 2016 Q2 UPDATES | 24 | |||
QUALIFIED PERSONS | 24 | |||
ADDITIONAL INFORMATION | 24 | |||
This management’s discussion and analysis (MD&A) includes information that will help you understand management’s perspective of our unaudited condensed consolidated interim financial statements and notes for the quarter ended June 30, 2016 (interim financial statements). The information is based on what we knew as of July 27, 2016 and updates our first quarter and annual MD&A included in our 2015 annual report.
As you review this MD&A, we encourage you to read our interim financial statements as well as our audited consolidated financial statements and notes for the year ended December 31, 2015 and annual MD&A. You can find more information about Cameco, including our audited consolidated financial statements and our most recent annual information form, on our website at cameco.com, on SEDAR at sedar.com or on EDGAR at sec.gov. You should also read our annual information form before making an investment decision about our securities.
The financial information in this MD&A and in our financial statements and notes are prepared according to International Financial Reporting Standards (IFRS), unless otherwise indicated.
Unless we have specified otherwise, all dollar amounts are in Canadian dollars.
Throughout this document, the termswe, us, ourandCamecomean Cameco Corporation and its subsidiaries, including NUKEM Energy Gmbh (NUKEM), unless otherwise indicated.
Caution about forward-looking information
Our MD&A includes statements and information about our expectations for the future. When we discuss our strategy, plans, future financial and operating performance, or other things that have not yet taken place, we are making statements considered to beforward-looking information orforward-looking statements under Canadian and United States securities laws. We refer to them in this MD&A asforward-looking information.
Key things to understand about the forward-looking information in this MD&A:
| • | It typically includes words and phrases about the future, such as: anticipate, believe, estimate, expect, plan, will, intend, goal, target, forecast, project, strategy and outlook (see examples below). |
| • | It represents our current views, and can change significantly. |
| • | It is based on a number ofmaterial assumptions, including those we have listed on page 3, which may prove to be incorrect. |
| • | Actual results and events may be significantly different from what we currently expect, due to the risks associated with our business. We list a number of thesematerial risks on pages 2 and 3. We recommend you also review our annual information form, first quarter and annual MD&A, which includes a discussion of othermaterial risks that could cause actual results to differ significantly from our current expectations. |
| • | Forward-looking information is designed to help you understand management’s current views of our near and longer term prospects, and it may not be appropriate for other purposes. We will not necessarily update this information unless we are required to by securities laws. |
Examples of forward-looking information in this MD&A
| • | the discussion under the heading Our strategy |
| • | our expectations about 2016 and future global uranium supply and demand including the discussion under the heading Uranium market update |
| • | the discussion of our expectations relating to our Canada Revenue Agency (CRA) and Internal Revenue Service (IRS) transfer pricing disputes including our estimate of the amount and timing of expected cash taxes and transfer pricing penalties |
| • | our consolidated outlook for the year and the outlook for our uranium, fuel services and NUKEM segments for 2016 |
| • | our expectations for uranium deliveries for the balance of 2016 |
| • | our price sensitivity analysis for our uranium segment |
| • | our expectation that existing cash balances, operating cash flows, and existing credit facilities will meet our anticipated 2016 capital requirements without the need for any significant additional funding |
| • | our expectation that our operating and investment activities for the remainder of 2016 will not be constrained by the financial-related covenants in our unsecured revolving credit facility |
| • | our expectations for 2016 capital expenditures |
| • | our future plans and expectations for each of our uranium operating properties and fuel services operating sites |
| • | our expectations related to the suspension of production at Rabbit Lake and transitioning the operation to care and maintenance |
Material risks
| • | actual sales volumes or market prices for any of our products or services are lower than we expect for any reason, including changes in market prices or loss of market share to a competitor |
| • | we are adversely affected by changes in currency exchange rates, interest rates, royalty rates, or tax rates |
| • | our production costs are higher than planned, or necessary supplies are not available, or not available on commercially reasonable terms |
| • | our estimates of production, purchases, costs, care and maintenance, decommissioning or reclamation expenses, or our tax expense estimates, prove to be inaccurate |
| • | we are unable to enforce our legal rights under our existing agreements, permits or licences |
| • | we are subject to litigation or arbitration that has an adverse outcome, including lack of success in our disputes with tax authorities |
| • | we are unsuccessful in our dispute with CRA and this results in significantly higher cash taxes, interest charges and penalties than the amount of our cumulative tax provision |
| • | we are unable to utilize letters of credit to the extent anticipated in our dispute with CRA |
| • | there are defects in, or challenges to, title to our properties |
| • | our mineral reserve and resource estimates are not reliable, or we face challenging or unexpected geological, hydrological or mining conditions |
| • | we are affected by environmental, safety and regulatory risks, including increased regulatory burdens or delays |
| • | we cannot obtain or maintain necessary permits or approvals from government authorities |
| • | we are affected by political risks |
| • | we are affected by terrorism, sabotage, blockades, civil unrest, social or political activism, accident or a deterioration in political support for, or demand for, nuclear energy |
| • | we are impacted by changes in the regulation or public perception of the safety of nuclear power plants, which adversely affect the construction of new plants, the relicensing of existing plants and the demand for uranium |
| • | there are changes to government regulations or policies that adversely affect us, including tax and trade laws and policies |
| • | our uranium suppliers fail to fulfil delivery commitments |
| • | our expectations relating to suspending Rabbit Lake production and transitioning the operation to care and maintenance prove to be inaccurate |
| • | our McArthur River development, mining or production plans are delayed or do not succeed for any reason |
| 2 CAMECO CORPORATION |
| • | our Cigar Lake development, mining or production plans are delayed or do not succeed for any reason, including as a result of any difficulties freezing the deposit to meet production targets, or any difficulties with the McClean Lake mill modifications or expansion or milling of Cigar Lake ore |
| • | we are affected by natural phenomena, including inclement weather, fire, flood and earthquakes |
| • | our operations are disrupted due to problems with our own or our suppliers’ or customers’ facilities, the unavailability of reagents, equipment, operating parts and supplies critical to production, equipment failure, lack of tailings capacity, labour shortages, labour relations issues, strikes or lockouts, underground floods, cave-ins, ground movements, tailings dam failures, transportation disruptions or accidents, or other development and operating risks |
Material assumptions
| • | our expectations regarding sales and purchase volumes and prices for uranium and fuel services |
| • | our expectations regarding the demand for uranium, the construction of new nuclear power plants and the relicensing of existing nuclear power plants not being more adversely affected than expected by changes in regulation or in the public perception of the safety of nuclear power plants |
| • | our expected production level and production costs |
| • | the assumptions regarding market conditions upon which we have based our capital expenditures expectations |
| • | our expectations regarding spot prices and realized prices for uranium, and other factors discussed under the heading Price sensitivity analysis: uranium segment |
| • | our expectations regarding tax rates and payments, royalty rates, currency exchange rates and interest rates |
| • | our expectations about the outcome of disputes with tax authorities |
| • | we are able to utilize letters of credit to the extent anticipated in our dispute with CRA |
| • | our decommissioning and reclamation expenses |
| • | our mineral reserve and resource estimates, and the assumptions upon which they are based, are reliable |
| • | our understanding of the geological, hydrological and other conditions at our mines |
| • | our McArthur River development, mining and production plans succeed |
| • | our Cigar Lake development, mining and production plans succeed, and the deposit freezes as planned |
| • | modification and expansion of the McClean Lake mill are completed as planned and the mill is able to process Cigar Lake ore as expected |
| • | that we will be able to implement the transition of the Rabbit Lake operation to care and maintenance within the time line and at the costs anticipated |
| • | our ability to continue to supply our products and services in the expected quantities and at the expected times |
| • | our ability to comply with current and future environmental, safety and other regulatory requirements, and to obtain and maintain required regulatory approvals |
| • | our operations are not significantly disrupted as a result of political instability, nationalization, terrorism, sabotage, blockades, civil unrest, breakdown, natural disasters, governmental or political actions, litigation or arbitration proceedings, the unavailability of reagents, equipment, operating parts and supplies critical to production, labour shortages, labour relations issues, strikes or lockouts, underground floods, cave-ins, ground movements, tailings dam failure, lack of tailings capacity, transportation disruptions or accidents or other development or operating risks |
| 2016 SECOND QUARTER REPORT 3 |
Second quarter update
Our strategy
We are a pure-play nuclear fuel supplier, focused on taking advantage of the long-term growth we see coming in our industry, while maintaining the ability to respond to market conditions as they evolve. Our strategy is to profitably produce from our tier-one assets at a pace aligned with market signals to increase long-term shareholder value, and to do that with an emphasis on safety, people and the environment.
We believe the best way to create value is to focus our investible capital on maintaining a strong balance sheet and on preserving the production flexibility of our tier-one assets. This approach provides us with the opportunity to meet rising demand with increased production from our best margin assets, and helps to mitigate risk during a prolonged period of uncertainty. In the context of continued depressed market conditions, we have positioned our production to come from our lower-cost operations.
Going forward, we plan to:
| • | ensure continued safe, reliable, low-cost production from our tier-one assets – McArthur River/Key Lake, Cigar Lake and Inkai |
| • | complete ramp up of production at Cigar Lake |
| • | continue to evaluate the position of the other sources of supply in our portfolio, including Rabbit Lake and the US operations, and retain the flexibility to respond to market signals and take advantage of value adding opportunities, including expanded production capacity at McArthur River/Key Lake and at Inkai |
| • | maintain our low-cost advantage by focusing on execution and operational excellence |
You can read more about our strategy in our 2015 annual management’s discussion and analysis (MD&A).
Uranium market update
The second quarter of 2016 continued much the same as the first – with demand remaining low and uranium prices depressed. That is as expected, given that there have been no events to catalyze a change in the current state of the market. In Japan, reactors continue to progress towards restart at a very slow pace, facing further challenges in the form of injunctions from the lower courts. Adding pressure to the market were a number of premature reactor retirement announcements in the United States, as well as the vote by the United Kingdom to leave the European Union, which has increased uncertainty around their new build program.
On the other side of the equation, supply continued to be readily available, with secondary supplies abundant and no interruptions to primary supply.
Making positive news for the industry were two new reactor startups – one in China and one in the United States – bringing the total for the year to five.
Longer term, strong fundamentals underpin a positive outlook for the industry. With 60 reactors under construction today and additional units planned over the next decade, uranium demand is expected to increase as those reactors come online. In addition, as future supply continues to be negatively affected by current depressed market conditions and utilities refrain from contracting replacement volumes, we expect to see a shift from the currently over-supplied market we are experiencing today to a demand-driven market that requires more primary supply. Demand growth combined with the timing, development and execution of new supply projects and the continued performance of existing supply, will determine the pace of that shift.
Caution about forward-looking information relating to our uranium market update
This discussion of our expectations for the nuclear industry, including its growth profile, future global uranium supply and demand is forward-looking information that is based upon the assumptions and subject to the material risks discussed under the headingCaution about forward-looking information beginning on page 2.
| 4 CAMECO CORPORATION |
Industry prices at quarter end
| JUN 30 2016 | MAR 31 2016 | DEC 31 2015 | SEP 30 2015 | JUN 30 2015 | MAR 31 2015 | |||||||||||||||||||
Uranium($US/lb U3O8)1 | ||||||||||||||||||||||||
Average spot market price | 26.70 | 28.70 | 34.23 | 36.38 | 36.38 | 39.45 | ||||||||||||||||||
Average long-term price | 40.50 | 43.50 | 44.00 | 44.00 | 46.00 | 49.50 | ||||||||||||||||||
|
|
|
|
|
|
|
|
|
|
|
| |||||||||||||
Fuel services ($US/kgU as UF6)1 | ||||||||||||||||||||||||
Average spot market price | ||||||||||||||||||||||||
North America | 6.75 | 6.75 | 6.88 | 7.00 | 7.50 | 7.50 | ||||||||||||||||||
Europe | 7.25 | 7.25 | 7.38 | 7.50 | 8.00 | 8.00 | ||||||||||||||||||
Average long-term price | ||||||||||||||||||||||||
North America | 12.75 | 12.75 | 13.50 | 15.00 | 16.00 | 16.00 | ||||||||||||||||||
Europe | 14.00 | 14.00 | 14.50 | 16.25 | 17.00 | 17.00 | ||||||||||||||||||
Note: the industry does not publish UO2 prices.
| 1 | Average of prices reported by TradeTech and Ux Consulting (Ux) |
On the spot market, where purchases call for delivery within one year, the volume reported by Ux Consulting (UxC) for the second quarter of 2016 was approximately 9 million pounds. This compares to approximately 11 million pounds in the second quarter of 2015. At the end of the quarter, the average reported spot price was $26.70 (US) per pound, down $2.00 (US) from the previous quarter.
Long-term contracts usually call for deliveries to begin more than two years after the contract is finalized, and use a number of pricing formulas, including fixed prices escalated over the term of the contract, and market referenced prices (spot and long-term indicators) quoted near the time of delivery. The volume of long-term contracting for the second quarter of 2016 continued to be low. The average reported long-term price at the end of the quarter was $40.50 (US) per pound, down $3.00 (US) from the previous quarter.
Spot and long-term UF6 conversion prices held firm during the quarter.
Shares and stock options outstanding
At July 26, 2016, we had:
| • | 395,792,522 common shares and one Class B share outstanding |
| • | 8,706,658 stock options outstanding, with exercise prices ranging from $16.38 to $54.38 |
Dividend policy
Our board of directors has established a policy of paying a quarterly dividend of $0.10 ($0.40 per year) per common share. This policy will be reviewed from time to time based on our cash flow, earnings, financial position, strategy and other relevant factors.
Also of note:
IMPAIRMENT
Production was suspended at our Rabbit Lake operation during the second quarter, requiring us to determine the excess carrying value of the mine and mill over the fair value less costs to sell. As a result, we have recognized an impairment charge for the full carrying value of $124.4 million. See note 4 to the financial statements for more information.
CONTRACTING
In July, we agreed to terminate a long-term supply contract with one of our utility customers, which had product deliveries from 2016 through 2021. The resulting gain on contract settlement of $46.7 million will be reflected in our financial results for the third quarter as other income.
| 2016 SECOND QUARTER REPORT 5 |
Financial results
This section of our MD&A discusses our performance, financial condition and outlook for the future.
Consolidated financial results
CONSOLIDATED HIGHLIGHTS ($ MILLIONS EXCEPT WHERE INDICATED) | THREE MONTHS ENDED JUNE 30 | SIX MONTHS ENDED JUNE 30 | ||||||||||||||||||||||
| 2016 | 2015 | CHANGE | 2016 | 2015 | CHANGE | |||||||||||||||||||
Revenue | 466 | 565 | (18 | )% | 875 | 1,130 | (23 | )% | ||||||||||||||||
Gross profit | 43 | 153 | (72 | )% | 161 | 282 | (43 | )% | ||||||||||||||||
Net earnings (losses) attributable to equity holders | (137 | ) | 88 | (256 | )% | (59 | ) | 79 | (175 | )% | ||||||||||||||
$ per common share (basic) | (0.35 | ) | 0.22 | (259 | )% | (0.15 | ) | 0.20 | (175 | )% | ||||||||||||||
$ per common share (diluted) | (0.35 | ) | 0.22 | (259 | )% | (0.15 | ) | 0.20 | (175 | )% | ||||||||||||||
Adjusted net earnings (losses) (non-IFRS, see page 7) | (57 | ) | 46 | (224 | )% | (64 | ) | 115 | (156 | )% | ||||||||||||||
$ per common share (adjusted and diluted) | (0.14 | ) | 0.12 | (217 | )% | (0.16 | ) | 0.29 | (155 | )% | ||||||||||||||
Cash provided by (used in) operations (after working capital changes) | (51 | ) | (65 | ) | 22 | % | (328 | ) | 68 | (582 | )% | |||||||||||||
NET EARNINGS
Net losses attributable to equity holders this quarter were $137 million (losses of $0.35 per share diluted) compared to net earnings of $88 million ($0.22 per share diluted) in the second quarter of 2015 due to:
| • | impairment of our Rabbit Lake operation |
| • | mark-to-market losses on foreign exchange derivatives compared to gains in the second quarter of 2015 |
| • | lower gross profit from our uranium and NUKEM segments |
| • | higher administration expenditures |
partially offset by:
| • | higher foreign exchange gains |
On an adjusted basis, our losses this quarter were $57 million (losses of $0.14 per share diluted) compared to earnings of $46 million ($0.12 per share diluted) (non-IFRS measure, see page 7) in the second quarter of 2015. The change was mainly due to:
| • | lower gross profit from our uranium and NUKEM segments |
| • | higher administration expenditures |
partially offset by:
| • | higher foreign exchange gains |
SeeFinancial results by segment on page 17 for more detailed discussion.
FIRST SIX MONTHS
Net losses in the first six months of the year were $59 million (losses of $0.15 per share diluted) compared to earnings of $79 million ($0.20 per share diluted) in the first six months of 2015 mainly due to:
| • | impairment of our Rabbit Lake operation |
| • | lower gross profit from our uranium and NUKEM segments |
| • | higher administration costs |
| • | higher foreign exchange losses |
partially offset by:
| • | higher gross profit from our fuel services segment |
| • | mark-to-market gains on foreign exchange derivatives compared to losses in the first six months of 2015 |
| • | higher tax recovery |
| 6 CAMECO CORPORATION |
On an adjusted basis, our losses for the first six months of this year were $64 million (losses of $0.16 per share diluted) compared to earnings of $115 million ($0.29 per share diluted) (non-IFRS measure, see page 7) for the first six months of 2015. Key variances include:
| • | lower gross profit from our uranium and NUKEM segments |
| • | higher administration costs |
| • | higher foreign exchange losses |
partially offset by:
| • | higher gross profit from our fuel services segment |
| • | higher tax recovery |
SeeFinancial results by segment on page 17 for more detailed discussion.
ADJUSTED NET EARNINGS (NON-IFRS MEASURE)
Adjusted net earnings is a measure that does not have a standardized meaning or a consistent basis of calculation under IFRS (non-IFRS measure). We use this measure as a more meaningful way to compare our financial performance from period to period. We believe that, in addition to conventional measures prepared in accordance with IFRS, certain investors use this information to evaluate our performance. Adjusted net earnings is our net earnings attributable to equity holders, adjusted to better reflect the underlying financial performance for the reporting period. The adjusted earnings measure reflects the matching of the net benefits of our hedging program with the inflows of foreign currencies in the applicable reporting period, and has also been adjusted for NUKEM purchase price inventory write-downs and recoveries, impairment charges, write off of assets, and income taxes on adjustments.
Adjusted net earnings is non-standard supplemental information and should not be considered in isolation or as a substitute for financial information prepared according to accounting standards. Other companies may calculate this measure differently, so you may not be able to make a direct comparison to similar measures presented by other companies.
The following table reconciles adjusted net earnings with our net earnings.
| THREE MONTHS ENDED JUNE 30 | SIX MONTHS ENDED JUNE 30 | |||||||||||||||
($ MILLIONS) | 2016 | 2015 | 2016 | 2015 | ||||||||||||
Net earnings (losses) attributable to equity holders | (137 | ) | 88 | (59 | ) | 79 | ||||||||||
|
|
|
|
|
|
|
| |||||||||
Adjustments | ||||||||||||||||
Adjustments on foreign exchange derivatives | (10 | ) | (57 | ) | (126 | ) | 44 | |||||||||
NUKEM purchase price inventory recovery | (6 | ) | — | (6 | ) | (3 | ) | |||||||||
Impairment charge | 124 | — | 124 | 6 | ||||||||||||
Income taxes on adjustments | (28 | ) | 15 | 3 | (11 | ) | ||||||||||
|
|
|
|
|
|
|
| |||||||||
Adjusted net earnings (losses) | (57 | ) | 46 | (64 | ) | 115 | ||||||||||
|
|
|
|
|
|
|
| |||||||||
| 2016 SECOND QUARTER REPORT 7 |
The following table shows what contributed to the change in adjusted net earnings this quarter and the first half of the year.
| THREE MONTHS | SIX MONTHS | |||||||||
($ MILLIONS) | ENDED JUNE 30 | ENDED JUNE 30 | ||||||||
Adjusted net earnings – 2015 | 46 | 115 | ||||||||
Change in gross profit by segment | ||||||||||
(We calculate gross profit by deducting from revenue the cost of products and services sold, and depreciation and amortization (D&A)) | ||||||||||
Uranium | Lower sales volume | (47 | ) | (63 | ) | |||||
| Lower realized prices ($US) | (17 | ) | (27 | ) | ||||||
| Foreign exchange impact on realized prices | 6 | 45 | ||||||||
| Higher costs | (31 | ) | (47 | ) | ||||||
|
|
|
| |||||||
| change – uranium | (89 | ) | (92 | ) | ||||||
|
|
|
| |||||||
Fuel services | Higher (lower) sales volume | 5 | (1 | ) | ||||||
| Higher (lower) realized prices ($Cdn) | (5 | ) | 9 | |||||||
|
|
|
| |||||||
| Higher costs | — | (3 | ) | |||||||
| change – fuel services | — | 5 | ||||||||
|
|
|
| |||||||
NUKEM | Gross profit | (27 | ) | (35 | ) | |||||
|
|
|
| |||||||
| change – NUKEM | (27 | ) | (35 | ) | ||||||
|
|
|
| |||||||
Other changes | ||||||||||
Higher administration expenditures | (12 | ) | (21 | ) | ||||||
Higher exploration expenditures | (1 | ) | (4 | ) | ||||||
Higher income tax recovery | 17 | 20 | ||||||||
Higher loss on disposal of assets | (5 | ) | (8 | ) | ||||||
Lower loss on derivatives | 3 | 16 | ||||||||
Foreign exchange gains (losses) | 18 | (53 | ) | |||||||
Other | (7 | ) | (7 | ) | ||||||
|
|
|
| |||||||
Adjusted net earnings – 2016 | (57 | ) | (64 | ) | ||||||
|
|
|
| |||||||
SeeFinancial results by segment on page 17 for more detailed discussion.
Quarterly trends
HIGHLIGHTS ($ MILLIONS EXCEPT PER SHARE AMOUNTS) | 2016 | 2015 | 2014 | |||||||||||||||||||||||||||||
| Q2 | Q1 | Q4 | Q3 | Q2 | Q1 | Q4 | Q3 | |||||||||||||||||||||||||
Revenue | 466 | 408 | 975 | 649 | 565 | 566 | 889 | 587 | ||||||||||||||||||||||||
Net earnings (losses) attributable to equity holders | (137 | ) | 78 | (10 | ) | (4 | ) | 88 | (9 | ) | 73 | (146 | ) | |||||||||||||||||||
$ per common share (basic) | (0.35 | ) | 0.20 | (0.03 | ) | (0.01 | ) | 0.22 | (0.02 | ) | 0.18 | (0.37 | ) | |||||||||||||||||||
$ per common share (diluted) | (0.35 | ) | 0.20 | (0.03 | ) | (0.01 | ) | 0.22 | (0.02 | ) | 0.18 | (0.37 | ) | |||||||||||||||||||
Adjusted net earnings (losses) (non-IFRS, see page 7) | (57 | ) | (7 | ) | 151 | 78 | 46 | 69 | 205 | 93 | ||||||||||||||||||||||
$ per common share (adjusted and diluted) | (0.14 | ) | (0.02 | ) | 0.38 | 0.20 | 0.12 | 0.18 | 0.52 | 0.23 | ||||||||||||||||||||||
Cash provided by (used in) operations (after working capital changes) | (51 | ) | (277 | ) | 503 | (121 | ) | (65 | ) | 134 | 236 | 263 | ||||||||||||||||||||
Key things to note:
| • | our financial results are strongly influenced by the performance of our uranium segment, which accounted for 55% of consolidated revenues in the second quarter of 2016 |
| • | the timing of customer requirements, which tend to vary from quarter to quarter, drives revenue in the uranium and fuel services segments, meaning quarterly results are not necessarily a good indication of annual results due to seasonal variability |
| • | net earnings do not trend directly with revenue due to unusual items and transactions that occur from time to time. We use adjusted net earnings, a non-IFRS measure, as a more meaningful way to compare our results from period to period (see page 7 for more information). |
| • | cash from operations tends to fluctuate as a result of the timing of deliveries and product purchases in our uranium and fuel services segments |
| 8 CAMECO CORPORATION |
The table that follows presents the differences between net earnings and adjusted net earnings for the previous seven quarters.
HIGHLIGHTS ($ MILLIONS EXCEPT PER SHARE AMOUNTS) | 2016 | 2015 | 2014 | |||||||||||||||||||||||||||||
| Q2 | Q1 | Q4 | Q3 | Q2 | Q1 | Q4 | Q3 | |||||||||||||||||||||||||
Net earnings (losses) attributable to equity holders | (137 | ) | 78 | (10 | ) | (4 | ) | 88 | (9 | ) | 73 | (146 | ) | |||||||||||||||||||
|
|
|
|
|
|
|
|
|
|
|
|
|
|
|
| |||||||||||||||||
Adjustments | ||||||||||||||||||||||||||||||||
Adjustments on foreign exchange derivatives | (10 | ) | (116 | ) | 10 | 112 | (57 | ) | 101 | 10 | 60 | |||||||||||||||||||||
NUKEM purchase price inventory recovery | (6 | ) | — | — | — | — | (3 | ) | (4 | ) | (2 | ) | ||||||||||||||||||||
Impairment charges | 124 | — | 210 | — | — | 6 | 131 | 196 | ||||||||||||||||||||||||
Income taxes on adjustments | (28 | ) | 31 | (59 | ) | (30 | ) | 15 | (26 | ) | (46 | ) | (15 | ) | ||||||||||||||||||
Write-off of assets | — | — | — | — | — | — | 41 | — | ||||||||||||||||||||||||
|
|
|
|
|
|
|
|
|
|
|
|
|
|
|
| |||||||||||||||||
Adjusted net earnings (losses) (non-IFRS, see page 7) | (57 | ) | (7 | ) | 151 | 78 | 46 | 69 | 205 | 93 | ||||||||||||||||||||||
|
|
|
|
|
|
|
|
|
|
|
|
|
|
|
| |||||||||||||||||
Corporate expenses
ADMINISTRATION
| THREE MONTHS ENDED JUNE 30 | SIX MONTHS ENDED JUNE 30 | |||||||||||||||||||||||
($ MILLIONS) | 2016 | 2015 | CHANGE | 2016 | 2015 | CHANGE | ||||||||||||||||||
Direct administration | 59 | 45 | 31 | % | 107 | 84 | 27 | % | ||||||||||||||||
Stock-based compensation | 2 | 4 | (50 | )% | 6 | 8 | (25 | )% | ||||||||||||||||
|
|
|
|
|
|
|
|
|
|
|
| |||||||||||||
Total administration | 61 | 49 | 24 | % | 113 | 92 | 23 | % | ||||||||||||||||
|
|
|
|
|
|
|
|
|
|
|
| |||||||||||||
Direct administration costs were $14 million higher for the second quarter of 2016 compared to the same period last year, and $23 million higher for the first six months. The increase was mainly due to:
| • | one-time costs related to collaboration agreements |
| • | charges related to the consolidation of office space |
| • | legal costs as our CRA dispute progresses towards trial |
| • | restructuring of our NUKEM segment, and corporate office changes resulting from operational changes at Rabbit Lake and our US ISR operations |
We will continue to evaluate corporate office support functions in light of the operational changes at our Rabbit Lake and US ISR operations.
EXPLORATION
In the second quarter, uranium exploration expenses were $12 million, an increase of $1 million compared to the second quarter of 2015. Exploration expenses for the first six months of the year increased by $4 million compared to 2015, to $27 million, due to a planned increase in expenditures.
INCOME TAXES
We recorded an income tax recovery of $65 million in the second quarter of 2016, compared to $5 million in the second quarter of 2015.
On an adjusted basis, we recorded an income tax recovery of $37 million this quarter compared to $20 million in the second quarter of 2015. In 2016, we recorded losses of $151 million in Canada compared to $164 million in 2015, while earnings in foreign jurisdictions decreased to $59 million from $190 million.
In the first six months of 2016, we recorded an income tax recovery of $56 million compared to $50 million in 2015.
On an adjusted basis, we recorded an income tax recovery of $59 million for the first six months compared to $39 million in 2015 due to lower pre-tax adjusted earnings and decreased tax expense in foreign jurisdictions in 2016. We recorded losses of $249 million in Canada during the first six months compared to $267 million for the same period in 2015, while earnings in foreign jurisdictions decreased to $128 million from $342 million.
| 2016 SECOND QUARTER REPORT 9 |
| THREE MONTHS ENDED JUNE 30 | SIX MONTHS ENDED JUNE 30 | |||||||||||||||
($ MILLIONS) | 2016 | 2015 | 2016 | 2015 | ||||||||||||
Pre-tax adjusted earnings1 | ||||||||||||||||
Canada2 | (151 | ) | (164 | ) | (249 | ) | (267 | ) | ||||||||
Foreign | 59 | 190 | 128 | 342 | ||||||||||||
|
|
|
|
|
|
|
| |||||||||
Total pre-tax adjusted earnings | (92 | ) | 26 | (121 | ) | 75 | ||||||||||
|
|
|
|
|
|
|
| |||||||||
Adjusted income taxes1 | ||||||||||||||||
Canada2 | (37 | ) | (33 | ) | (67 | ) | (59 | ) | ||||||||
Foreign | — | 13 | 8 | 20 | ||||||||||||
|
|
|
|
|
|
|
| |||||||||
Adjusted income tax recovery | (37 | ) | (20 | ) | (59 | ) | (39 | ) | ||||||||
|
|
|
|
|
|
|
| |||||||||
| 1 | Pre-tax adjusted earnings and adjusted income taxes are non-IFRS measures. |
| 2 | Our IFRS-based measures have been adjusted by the amounts reflected in the table in adjusted net earnings (non-IFRS measure on page 7). |
TRANSFER PRICING DISPUTES
We have been reporting on our transfer pricing disputes with CRA since 2008, when it originated, and with the IRS since the first quarter of 2015. Below, we discuss the general nature of transfer pricing disputes and, more specifically, the ongoing disputes we have.
Transfer pricing is a complex area of tax law, and it is difficult to predict the outcome of cases like ours. However, tax authorities generally test two things:
| • | the governance (structure) of the corporate entities involved in the transactions |
| • | the price at which goods and services are sold by one member of a corporate group to another |
We have a global customer base and we established a marketing and trading structure involving foreign subsidiaries, including Cameco Europe Limited (CEL), which entered into various intercompany arrangements, including purchase and sale agreements, as well as uranium purchase and sale agreements with third parties. Cameco and its subsidiaries made reasonable efforts to put arm’s-length transfer pricing arrangements in place, and these arrangements expose the parties to the risks and rewards accruing to them under these contracts. The intercompany contract prices are generally comparable to those established in comparable contracts between arm’s-length parties entered into at that time.
For the years 2003 to 2010, CRA has shifted CEL’s income (as recalculated by CRA) back to Canada and applied statutory tax rates, interest and instalment penalties, and, from 2007 to 2010, transfer pricing penalties. The IRS is also proposing to allocate a portion of CEL’s income for the years 2009 through 2012 to the US, resulting in such income being taxed in multiple jurisdictions. Taxes of approximately $320 million for the 2003 – 2015 years have already been paid in a jurisdiction outside Canada and the US. Bilateral international tax treaties contain provisions that generally seek to prevent taxation of the same income in both countries. As such, in connection with these disputes, we are considering our options, including remedies under international tax treaties that would limit double taxation; however, there is a risk that we will not be successful in eliminating all potential double taxation. The expected income adjustments under our tax disputes are represented by the amounts claimed by CRA and IRS and are described below.
CRA dispute
Since 2008, CRA has disputed our corporate structure and the related transfer pricing methodology we used for certain intercompany uranium sale and purchase agreements. To date, we received notices of reassessment for our 2003 through 2010 tax returns. We have recorded a cumulative tax provision of $52 million, where an argument could be made that our transfer price may have fallen outside of an appropriate range of pricing in uranium contracts for the period from 2003 through June 30, 2016. We are confident that we will be successful in our case and continue to believe the ultimate resolution of this matter will not be material to our financial position, results of operations and cash flows in the year(s) of resolution.
| 10 CAMECO CORPORATION |
For the years 2003 through 2010, CRA issued notices of reassessment for approximately $3.4 billion of additional income for Canadian tax purposes, which would result in a related tax expense of about $1.1 billion. CRA has also issued notices of reassessment for transfer pricing penalties for the years 2007 through 2010 in the amount of $292 million. The Canadian income tax rules include provisions that require larger companies like us to remit or otherwise secure 50% of the cash tax plus related interest and penalties at the time of reassessment. To date, under these provisions, after applying elective deductions, we have paid a net amount of $264 million cash. In addition, we have provided $340 million in letters of credit (LC) to secure 50% of the cash taxes and related interest amounts reassessed to date. The amounts paid or secured are shown in the table below.
YEAR PAID ($ MILLIONS) | CASH TAXES | INTEREST AND INSTALMENT PENALTIES | TRANSFER PRICING PENALTIES | TOTAL | CASH REMITTANCE | SECURED BY LC | ||||||||||||||||||
Prior to 2013 | — | 13 | — | 13 | 13 | — | ||||||||||||||||||
2013 | 1 | 9 | 36 | 46 | 46 | — | ||||||||||||||||||
2014 | 106 | 47 | — | 153 | 153 | — | ||||||||||||||||||
2015 | 202 | 71 | 79 | 352 | 20 | 332 | ||||||||||||||||||
2016 | 7 | 2 | 31 | 40 | 32 | 8 | ||||||||||||||||||
|
|
|
|
|
|
|
|
|
|
|
| |||||||||||||
Total | 316 | 142 | 146 | 604 | 264 | 340 | ||||||||||||||||||
|
|
|
|
|
|
|
|
|
|
|
| |||||||||||||
Using the methodology we believe CRA will continue to apply, and including the $3.4 billion already reassessed, we expect to receive notices of reassessment for a total of approximately $7.4 billion of additional income taxable in Canada for the years 2003 through 2015, which would result in a related tax expense of approximately $2.2 billion. As well, CRA may continue to apply transfer pricing penalties to taxation years subsequent to 2010. As a result, we estimate that cash taxes and transfer pricing penalties for these years would be between $1.5 billion and $1.7 billion. In addition, we estimate there would be interest and instalment penalties applied that would be material to us. While in dispute, we would be responsible for remitting or otherwise providing security for 50% of the cash taxes and transfer pricing penalties (between $750 million and $850 million), plus related interest and instalment penalties assessed, which would be material to us.
Under the Canadian federal and provincial tax rules, the amount required to be paid or secured each year will depend on the amount of income reassessed in that year and the availability of elective deductions and tax loss carryovers. In 2015, the CRA decided to disallow the use of any loss carry-backs for any transfer pricing adjustment, starting with the 2008 tax year. This does not impact the anticipated income tax expense for a particular year, but does impact the timing of any required security or payment. For the 2010 tax year, as an alternative to paying cash, we used letters of credit to satisfy our obligations related to the reassessed income tax and related interest amounts. We expect to be able to continue to provide security in the form of letters of credit to satisfy these requirements. The estimated amounts summarized in the table below reflect actual amounts paid or secured and estimated future amounts owing based on the actual and expected reassessments for the years 2003 through 2015, and include the expected timing adjustment for the inability to use any loss carry-backs starting in 2008. We will update this table annually to include the estimated impact of reassessments expected for completed years subsequent to 2015.
$ MILLIONS | 2003-2015 | 2016-2017 | 2018-2023 | TOTAL | ||||||||||||
50% of cash taxes and transfer pricing penalties paid, secured or owing in the period | ||||||||||||||||
Cash payments | 156 | 105 - 130 | 100 - 125 | 360 - 410 | ||||||||||||
Secured by letters of credit | 264 | 50 - 75 | 75 - 100 | 390 - 440 | ||||||||||||
|
|
|
|
|
|
|
| |||||||||
Total paid1 | 420 | 155 - 205 | 175 - 225 | 750 - 850 | ||||||||||||
|
|
|
|
|
|
|
| |||||||||
| 1 | These amounts do not include interest and instalment penalties, which totalled approximately $142 million to June 30, 2016. |
In light of our view of the likely outcome of the case as described above, we expect to recover the amounts remitted, including the $604 million already paid or otherwise secured to date.
We are expecting the trial for the 2003, 2005 and 2006 reassessments to commence in October 2016, with final arguments in March 2017. If this timing is adhered to, we expect to receive a Tax Court decision within six to 18 months after the trial is complete.
| 2016 SECOND QUARTER REPORT 11 |
IRS dispute
We have received Revenue Agents Reports (RAR) from the IRS for the tax years 2009 to 2012. The IRS is challenging the transfer pricing used under certain intercompany transactions pertaining to the 2009 to 2012 tax years for certain of our US subsidiaries. The 2009 to 2012 RARs list the adjustments proposed by the IRS and calculate the tax and any penalties owing based on the proposed adjustments.
The current position of the IRS is that a portion of the non-US income reported under our corporate structure and taxed in non-US jurisdictions should be recognized and taxed in the US on the basis that:
| • | the prices received by our US mining subsidiaries for the sale of uranium to CEL are too low |
| • | the compensation earned by Cameco Inc., one of our US subsidiaries, is inadequate |
The proposed adjustments result in an increase in taxable income in the US of approximately $419 million (US) and a corresponding increased income tax expense of approximately $122 million (US) for the 2009 through 2012 taxation years, with interest being charged thereon. In addition, the IRS proposed cumulative penalties of approximately $8 million (US) in respect of the adjustment.
We believe that the conclusions of the IRS in the RARs are incorrect and we are contesting them in an administrative appeal, during which we are not required to make any cash payments. Until this matter progresses further, we cannot provide an estimation of the likely timeline for a resolution of the dispute.
We believe that the ultimate resolution of this matter will not be material to our financial position, results of operations and cash flows in the year(s) of resolution.
Caution about forward-looking information relating to our CRA and IRS tax disputes
This discussion of our expectations relating to our tax disputes with CRA and IRS and future tax reassessments by CRA and IRS is forward-looking information that is based upon the assumptions and subject to the material risks discussed under the headingCaution about forward-looking information beginning on page 2 and also on the more specific assumptions and risks listed below. Actual outcomes may vary significantly.
Assumptions
| • | CRA will reassess us for the years 2011 through 2015 using a similar methodology as for the years 2003 through 2010, and the reassessments will be issued on the basis we expect |
| • | we will be able to apply elective deductions and utilize letters of credit to the extent anticipated |
| • | CRA will seek to impose transfer pricing penalties (in a manner consistent with penalties charged in the years 2007 through 2010) in addition to interest charges and instalment penalties |
| • | we will be substantially successful in our dispute with CRA and the cumulative tax provision of $52 million to date will be adequate to satisfy any tax liability resulting from the outcome of the dispute to date |
| • | IRS may propose adjustments for later years subsequent to 2012 |
| • | we will be substantially successful in our dispute with IRS |
Material risks that could cause actual results to differ materially
| • | CRA reassesses us for years 2011 through 2015 using a different methodology than for years 2003 through 2010, or we are unable to utilize elective deductions or letters of credit to the extent anticipated, resulting in the required cash payments or security provided to CRA pending the outcome of the dispute being higher than expected |
| • | the time lag for the reassessments for each year is different than we currently expect |
| • | we are unsuccessful and the outcomes of our dispute with CRA and/or IRS result in significantly higher cash taxes, interest charges and penalties than the amount of our cumulative tax provision, which could have a material adverse effect on our liquidity, financial position, results of operations and cash flows |
| • | cash tax payable increases due to unanticipated adjustments by CRA or IRS not related to transfer pricing |
| • | IRS proposes adjustments for years 2013 through 2015 using a different methodology than for 2009 through 2012 |
| • | we are unable to effectively eliminate all double taxation |
FOREIGN EXCHANGE
At June 30, 2016:
| • | The value of the US dollar relative to the Canadian dollar was $1.00 (US) for $1.30 (Cdn), unchanged from March 31, 2016. The exchange rate averaged $1.00 (US) for $1.29 (Cdn) over the quarter. |
| 12 CAMECO CORPORATION |
| • | We had foreign currency forward contracts of $1.0 billion (US), €5 million (EUR), and foreign currency options of $130 million (US). The US currency forward contracts had an average exchange rate of $1.00 (US) for $1.28 (Cdn), US currency option contracts had an average exchange rate range of $1.00 (US) for $1.31 to $1.37 (Cdn), and €1.00 for $1.11 (US) for EUR currency contracts. |
| • | The mark-to-market loss on all foreign exchange contracts was $16 million, compared to a $3 million gain at March 31, 2016. |
Outlook for 2016
Our outlook for 2016 reflects the expenditures necessary to help us achieve our strategy. Our outlook for our consolidated tax rate, and NUKEM’s delivery volumes, revenue and gross profit, has changed. We do not provide an outlook for the items in the table that are marked with a dash.
See2016 Financial results by segment on page 17 for details.
2016 FINANCIAL OUTLOOK
| CONSOLIDATED | URANIUM | FUEL SERVICES | NUKEM | |||||||||||||
Production | — |
| 25.8 million lbs |
|
| 8 to 9 million kgU |
| — | ||||||||
Delivery volume1 | — |
| 30 to 32 million lbs2 |
|
| Decrease up to 5% |
|
| 7 to 8 million lbs U3O8 |
| ||||||
| Revenue compared to 20153 |
| Decrease 5% to 10% |
|
| Decrease 5% to 10%4 |
|
| Increase up to 5% |
|
| Decrease 5% to 10% |
| ||||
| Average unit cost of sales (including D&A) | — |
| Increase up to 5%5 |
| | Increase 10% to | | — | ||||||||
| Direct administration costs compared to 20156 |
| Increase 10% to 15% |
| — | — | — | ||||||||||
Gross profit | — | — | — |
| Gross profit up to 1% |
| ||||||||||
| Exploration costs compared to 2015 | — |
| Increase 15% to 20% |
| — | — | ||||||||||
Tax rate7 |
| Recovery of 175% to 200% |
| — | — | — | ||||||||||
Capital expenditures | $275 million | — | — | — | ||||||||||||
| 1 | Our 2016 outlook for delivery volume does not include sales between our uranium, fuel services and NUKEM segments. |
| 2 | Our uranium delivery volume is based on the volumes we currently have commitments to deliver under contract in 2016. |
| 3 | For comparison of our 2016 outlook and 2015 results for revenue, we do not include sales between our uranium, fuel services and NUKEM segments. |
| 4 | Based on a uranium spot price of $25.00 (US) per pound (the Ux spot price as of July 25, 2016), a long-term price indicator of $38.00 (US) per pound (the Ux long-term indicator on July 25, 2016) and an exchange rate of $1.00 (US) for $1.30 (Cdn). |
| 5 | This increase is based on the unit cost of sale for produced material and committed long-term purchases. If we make discretionary purchases in the remainder of 2016, then we expect the overall unit cost of sales could be different. |
| 6 | Direct administration costs do not include stock-based compensation expenses. See page 9 for more information. |
| 7 | Our outlook for the tax rate is based on adjusted net earnings. |
We have increased our uranium production outlook to 25.8 million pounds U3O8 (previously 25.7 million pounds) to reflect the final 2016 production from Rabbit Lake following the operational changes made in April. SeeUranium 2016 Q2 updates starting on page 21 for more information.
We have decreased our outlook for NUKEM sales volumes to 7 million to 8 million pounds U3O8 (previously 9 million to 10 million pounds) due to continued light activity in the market. This change, along with the inventory write-down that we recognized during the second quarter, has also resulted in a change to our outlook for NUKEM’s revenue and gross profit. We now expect NUKEM’s revenue to decrease 5% to 10% (previously increase 5% to 10%) and gross profit to be a maximum of 1% (previously 4% to 5%).
We have adjusted our outlook for the consolidated tax rate to a recovery of 175% to 200% (previously 50% to 55%) due to the changes to our NUKEM outlook noted above, and a change in the distribution of earnings between jurisdictions.
| 2016 SECOND QUARTER REPORT 13 |
In our uranium and fuel services segments, our customers choose when in the year to receive deliveries, so our quarterly delivery patterns, delivery volumes and revenue can vary significantly. We expect remaining 2016 uranium deliveries to be more heavily weighted to the fourth quarter.
REVENUE AND EARNINGS SENSITIVITY ANALYSIS
For the rest of 2016:
| • | an increase of $5 (US) per pound in both the Ux spot price ($25.00 (US) per pound on July 25, 2016) and the Ux long-term price indicator ($38.00 (US) per pound on July 25, 2016) would increase revenue by $37 million and net earnings by $29 million. Conversely, a decrease of $5 (US) per pound would decrease revenue by $28 million and net earnings by $21 million. |
| • | a one-cent change in the value of the Canadian dollar versus the US dollar would change adjusted net earnings by $5 million, with a decrease in the value of the Canadian dollar versus the US dollar having a positive impact. Cash flow would change by $1 million, with a decrease in the value of the Canadian dollar versus the US dollar having a negative impact. |
PRICE SENSITIVITY ANALYSIS: URANIUM SEGMENT
The following table and graph are not forecasts of prices we expect to receive. The prices we actually realize will be different from the prices shown in the table and graph. They are designed to indicate how the portfolio of long-term contracts we had in place on June 30, 2016 would respond to different spot prices. In other words, we would realize these prices only if the contract portfolio remained the same as it was on June 30, 2016 and none of the assumptions we list below change.
We intend to update this table and graph each quarter in our MD&A to reflect deliveries made and changes to our contract portfolio. As a result, we expect the table and graph to change from quarter to quarter.
Expected realized uranium price sensitivity under various spot price assumptions
(rounded to the nearest $1.00)
SPOT PRICES ($US/lb U3O8) | $ | 20 | $ | 40 | $ | 60 | $ | 80 | $ | 100 | $ | 120 | $ | 140 | ||||||||||||||
2016 | 41 | 43 | 49 | 54 | 60 | 66 | 71 | |||||||||||||||||||||
2017 | 38 | 45 | 56 | 68 | 79 | 88 | 96 | |||||||||||||||||||||
2018 | 39 | 46 | 58 | 69 | 80 | 89 | 97 | |||||||||||||||||||||
2019 | 38 | 47 | 58 | 69 | 79 | 87 | 94 | |||||||||||||||||||||
2020 | 41 | 48 | 59 | 69 | 78 | 86 | 92 |
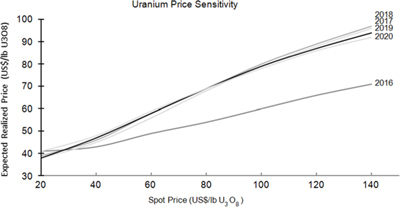
The table and graph illustrate the mix of long-term contracts in our June 30, 2016 portfolio, and are consistent with our marketing strategy. Both have been updated to reflect deliveries made and contracts entered into up to June 30, 2016.
Our portfolio includes a mix of fixed-price and market-related contracts, which we target at a 40:60 ratio. Those that are fixed at lower prices or have low ceiling prices will yield prices that are lower than current market prices.
| 14 CAMECO CORPORATION |
Our portfolio is affected by more than just the spot price. We made the following assumptions (which are not forecasts) to create the table:
Sales
| • | sales volumes on average of 27 million pounds per year, with commitment levels in 2016 through 2018 higher than in 2019 and 2020 |
| • | excludes sales between our uranium, fuel services and NUKEM segments |
Deliveries
| • | deliveries include best estimates of requirements contracts and contracts with volume flex provisions |
Annual inflation
| • | is 2% in the US |
Prices
| • | the average long-term price indicator is the same as the average spot price for the entire year (a simplified approach for this purpose only). Since 1996, the long-term price indicator has averaged 19% higher than the spot price. This differential has varied significantly. Assuming the long-term price is at a premium to spot, the prices in the table and graph will be higher. |
Liquidity and capital resources
Our financial objective is to make sure we have the cash and debt capacity to fund our operating activities, investments and growth.
We have large, creditworthy customers that continue to need uranium even during weak economic conditions, and we expect the uranium contract portfolio we have built to provide a solid revenue stream for years to come.
We expect to continue investing in maintaining our tier-one production capacity and flexibility over the next several years. We have a number of alternatives to fund future capital requirements, including drawing on our existing credit facilities, entering new credit facilities, using our operating cash flow, and raising additional capital through debt or equity financings. We are always considering our financing options so we can take advantage of favourable market conditions when they arise. Due to the cyclical nature of our business, we will need to draw on existing credit facilities during the course of the year. We expect our cash balances, operating cash flows and existing credit facilities to meet our capital requirements during 2016, without the need for significant additional funding.
We have an ongoing transfer pricing dispute with CRA. See page 10 for more information. Until this dispute is settled, we expect to pay cash or provide security in the form of letters of credit for future amounts owing to the Government of Canada for 50% of the cash taxes payable and the related interest and penalties.
CASH FROM OPERATIONS
Cash used in operations was $14 million lower this quarter than in the second quarter of 2015. Contributing to this change was a decrease in working capital requirements, which required $125 million less in 2016 than in 2015. In the second quarter of 2016, inventories remained relatively stable; however in 2015, there was a large increase in inventory, which required more working capital. This was partially offset by the collection of less cash on accounts receivable in the quarter. In addition, gross profits in our operating segments were lower. Not including working capital requirements, our operating cash flows this quarter were lower by $111 million.
Cash used in operations was $396 million higher in the first six months of 2016 than for the same period in 2015 due largely to lower gross profits in our operating segments. As well, the opening balance of accounts receivable was lower in 2016 compared to 2015, resulting in the collection of less cash in the first six months of 2016. Working capital required $226 million more in 2016. Not including working capital requirements, our operating cash flows in the first six months were lower by $170 million.
FINANCING ACTIVITIES
We use debt to provide additional liquidity. We have sufficient borrowing capacity with unsecured lines of credit totalling about $2.7 billion at June 30, 2016, unchanged from March 31, 2016. At June 30, 2016, we had approximately $1.4 billion outstanding in letters of credit, unchanged from March 31, 2016. As expected, due to the cyclical nature of our business, at June 30, 2016, we had approximately $235 million in short-term debt outstanding on our $1.25 billion unsecured revolving credit facility, up from $130 million on March 31, 2016.
Long-term contractual obligations
Since December 31, 2015, there have been no material changes to our long-term contractual obligations. Please see our annual MD&A for more information.
| 2016 SECOND QUARTER REPORT 15 |
Debt covenants
We are bound by certain covenants in our unsecured revolving credit facility. The financially related covenants place restrictions on total debt, including guarantees. As at June 30, 2016, we met these financial covenants and do not expect our operating and investment activities for the remainder of 2016 to be constrained by them.
NUKEM financing arrangements
NUKEM enters into financing arrangements with third parties where future receivables arising from certain sales contracts are sold to financial institutions in exchange for cash. These arrangements require NUKEM to satisfy its delivery obligations under the sales contracts, which are recognized as deferred sales (see notes 5 and 8 to the financial statements for more information). In addition, NUKEM is required to pledge the underlying inventory as security against these performance obligations. As of June 30, 2016, we had $9.5 million ($7.3 million (US)) of inventory pledged as security under financing arrangements, compared with $97.9 million ($70.8 million (US)) at December 31, 2015.
OFF-BALANCE SHEET ARRANGEMENTS
We had three kinds of off-balance sheet arrangements at June 30, 2016:
| • | purchase commitments |
| • | financial assurances |
| • | other arrangements |
Purchase commitments
The following table is based on our purchase commitments at June 30, 2016. These commitments include a mix of fixed price and market-related contracts. Actual payments will be different as a result of changes to our purchase commitments and, in the case of contracts with market-related pricing, the market prices in effect at the time of purchase. We will update this table as required in our MD&A to reflect changes to our purchase commitments and changes in the prices used to estimate our commitments under market-related contracts.
JUNE 30 ($ MILLIONS) | 2016 | 2017 AND 2018 | 2019 AND 2020 | 2021 AND BEYOND | TOTAL | |||||||||||||||
Purchase commitments1 | 469 | 857 | 388 | 378 | 2,092 | |||||||||||||||
| 1 | Denominated in US dollars, converted to Canadian dollars as of June 30, 2016 at the rate of $1.30. |
During the second quarter, our purchase commitments decreased, as we have taken delivery of some of the material under these commitments.
As of June 30, 2016, we had commitments of about $2.1 billion for the following:
| • | approximately 30 million pounds of U3O8 equivalent from 2016 to 2028 |
| • | approximately 3 million kgU as UF6 in conversion services from 2016 to 2019 |
| • | about 0.6 million Separative Work Units (SWU) of enrichment services to meet existing forward sales commitments under agreements with a non-Western supplier |
The suppliers do not have the right to terminate agreements other than pursuant to customary events of default provisions.
Financial assurances
At June 30, 2016 our financial assurances totaled $1.4 billion, unchanged from March 31, 2016.
Other arrangements
We continue to use factoring and other third party arrangements to manage short-term cash flow fluctuations. You can read more about these arrangements in our 2015 annual MD&A.
| 16 CAMECO CORPORATION |
BALANCE SHEET
($ MILLIONS) | JUN 30, 2016 | DEC 31, 2015 | CHANGE | |||||||||
Cash and cash equivalents | 132 | 459 | (71 | )% | ||||||||
Total debt | 1,728 | 1,492 | 16 | % | ||||||||
Inventory | 1,559 | 1,285 | 21 | % | ||||||||
Total cash and cash equivalents at June 30, 2016 were $132 million, or 71% lower than at December 31, 2015, primarily due to capital expenditures of $113 million, dividend payments of $79 million, interest payments of $36 million, and cash used in operations of $328 million, offset by short-term borrowings of $235 million. Net debt at June 30, 2016 was $1,596 million.
Total debt increased $235 million from December 31, 2015 due to drawing on our $1.25 billion unsecured revolving credit facility as a result of the cyclical nature of our business. See note 15 of our audited annual financial statements for more detail.
Total product inventories increased to $1,559 million, including NUKEM’s inventories ($174 million). Inventories increased as sales were lower than production and purchases in the first six months of the year.
Financial results by segment
Uranium
| THREE MONTHS ENDED JUNE 30 | SIX MONTHS ENDED JUNE 30 | |||||||||||||||||||||||||||
HIGHLIGHTS | 2016 | 2015 | CHANGE | 2016 | 2015 | CHANGE | ||||||||||||||||||||||
Production volume (million lbs) | 7.0 | 5.4 | 30 | % | 14.0 | 10.5 | 33 | % | ||||||||||||||||||||
Sales volume (million lbs)1 | 4.6 | 7.3 | (37 | )% | 10.5 | 14.3 | (27 | )% | ||||||||||||||||||||
Average spot price | ($ | US/lb | ) | 27.15 | 36.17 | (25 | )% | 29.50 | 37.26 | (21 | )% | |||||||||||||||||
Average long-term price | ($ | US/lb | ) | 41.50 | 47.50 | (13 | )% | 42.67 | 48.50 | (12 | )% | |||||||||||||||||
Average realized price | ($ | US/lb | ) | 42.91 | 46.57 | (8 | )% | 42.52 | 45.03 | (6 | )% | |||||||||||||||||
| ($ | Cdn/lb | ) | 55.70 | 58.04 | (4 | )% | 57.16 | 55.45 | 3 | % | ||||||||||||||||||
Average unit cost of sales (including D&A) | ($ | Cdn/lb | ) | 47.46 | 40.71 | 17 | % | 43.09 | 38.64 | 12 | % | |||||||||||||||||
Revenue ($ millions)1 | 256 | 424 | (40 | )% | 603 | 791 | (24 | )% | ||||||||||||||||||||
Gross profit ($ millions) | 38 | 127 | (70 | )% | 148 | 240 | (38 | )% | ||||||||||||||||||||
Gross profit (%) | 15 | 30 | (50 | )% | 25 | 30 | (17 | )% | ||||||||||||||||||||
| 1 | There were no significant intersegment transactions in the periods shown. |
SECOND QUARTER
Production volumes this quarter were 30% higher compared to the second quarter of 2015, mainly due to higher production from Cigar Lake, Inkai and Rabbit Lake. SeeUranium 2016 Q2 updates starting on page 21 for more information.
The 40% decrease in uranium revenues was a result of a 37% decrease in sales volume and a 4% decrease in the Canadian dollar average realized price. Sales in the second quarter were lower than in 2015 due to the timing of deliveries, which are driven by customer requests and can vary significantly.
The US dollar average realized price decreased by 8% compared to 2015 mainly due to lower prices on market-related contracts, while the lower Canadian dollar realized prices this quarter were a result of that decrease, partially offset by the weakening of the Canadian dollar compared to 2015. This quarter the exchange rate on the average realized price was $1.00 (US) for $1.30 (Cdn) compared to $1.00 (US) for $1.25 (Cdn) in the second quarter of 2015.
Total cost of sales (including D&A) decreased by 27% ($218 million compared to $297 million in 2015) due to a 37% decrease in sales volume, partially offset by a 17% increase in the unit cost of sales. The increase in the unit cost of sales was mainly the result of care and maintenance costs and severance costs related to the curtailment of production at Rabbit Lake and in the US, partially offset by lower production costs related to higher production from Cigar Lake compared to the second quarter of 2015.
The net effect was an $89 million decrease in gross profit for the quarter.
| 2016 SECOND QUARTER REPORT 17 |
FIRST SIX MONTHS
Production volumes for the first six months of the year were 33% higher than in the previous year due to the addition of production from Cigar Lake and higher production at McArthur/Key Lake, and Inkai, partially offset by lower production at our US operations. SeeUranium 2016 Q2 updates starting on page 21 for more information.
Uranium revenues decreased 24% compared to the first six months of 2015 due to a 27% decrease in sales volumes, partially offset by a 3% increase in the Canadian dollar average realized price, in the first six months.
In our uranium and fuel services segments, our customers choose when in the year to receive deliveries, so our quarterly delivery patterns, sales volumes and revenue can vary significantly. We are on track to meet our 2016 uranium sales targets, and, therefore, expect to deliver between 20 million and 22 million pounds in the remainder of the year.
Our Canadian dollar realized prices for the first six months of 2016 were higher than 2015, primarily as a result of the weakening of the Canadian dollar compared to 2015. For the first six months of 2016, the exchange rate on the average realized price was $1.00 (US) for $1.34 (Cdn) compared to $1.00 (US) for $1.23 (Cdn) for the same period in 2015.
Total cost of sales (including D&A) decreased by 18% ($454 million compared to $552 million in 2015) mainly due to a 27% decrease in sales volume for the first six months, partially offset by a 12% increase in the unit cost of sales. The increase in the unit cost of sales was mainly the result of care and maintenance costs and severance costs related to the curtailment of production at Rabbit Lake and in the US.
The net effect was a $92 million decrease in gross profit for the first six months.
The table below shows the costs of produced and purchased uranium incurred in the reporting periods (which are non-IFRS measures, see the paragraphs below the table). These costs do not include care and maintenance costs, selling costs such as royalties, transportation and commissions, nor do they reflect the impact of opening inventories on our reported cost of sales.
| THREE MONTHS ENDED JUNE 30 | SIX MONTHS ENDED JUNE 30 | |||||||||||||||||||||||
($CDN/LB) | 2016 | 2015 | CHANGE | 2016 | 2015 | CHANGE | ||||||||||||||||||
Produced | ||||||||||||||||||||||||
Cash cost | 15.96 | 26.53 | (40 | )% | 18.32 | 27.28 | (33 | )% | ||||||||||||||||
Non-cash cost | 11.07 | 14.64 | (24 | )% | 11.81 | 13.59 | (13 | )% | ||||||||||||||||
Total production cost | 27.03 | 41.17 | (34 | )% | 30.13 | 40.87 | (26 | )% | ||||||||||||||||
Quantity produced (million lbs) | 7.0 | 5.4 | 30 | % | 14.0 | 10.5 | 33 | % | ||||||||||||||||
Purchased | ||||||||||||||||||||||||
Cash cost | 38.18 | 45.68 | (16 | )% | 49.77 | 46.69 | 7 | % | ||||||||||||||||
Quantity purchased (million lbs) | 0.6 | 4.0 | (85 | )% | 5.7 | 6.6 | (14 | )% | ||||||||||||||||
Totals | ||||||||||||||||||||||||
Produced and purchased costs | 27.91 | 43.09 | (35 | )% | 35.81 | 43.12 | (17 | )% | ||||||||||||||||
Quantities produced and purchased (million lbs) | 7.6 | 9.4 | (19 | )% | 19.7 | 17.1 | 15 | % | ||||||||||||||||
The average cash cost of production this quarter was 40% lower than the comparable period in 2015, primarily due to increasedlow-cost production from Cigar Lake, and the impact of our first quarter production changes at Rabbit Lake.
Although purchased pounds are transacted in US dollars, we account for the purchases in Canadian dollars. In the second quarter, the average cash cost of purchased material in US dollar terms was $29.20 (US) per pound with an average exchange rate of $1.00 (US) for $1.31 (Cdn), compared to $36.48 (US) per pound at an average exchange rate of $1.00 (US) for $1.25 (Cdn) in the second quarter of 2015. For the first six months, the average cash cost of purchased material was $36.18 (US) per pound at an average exchange rate of $1.00 (US) for $1.38 (Cdn), compared to $37.40 per pound at an average exchange rate of 1.00 (US) for $1.25 (Cdn) in the same period in 2015.
Cash cost per pound, non-cash cost per pound and total cost per pound for produced and purchased uranium presented in the above table are non-IFRS measures. These measures do not have a standardized meaning or a consistent basis of calculation under IFRS. We use these measures in our assessment of the performance of our uranium business. We believe that, in addition to conventional measures prepared in accordance with IFRS, certain investors use this information to evaluate our performance and ability to generate cash flow.
| 18 CAMECO CORPORATION |
These measures are non-standard supplemental information and should not be considered in isolation or as a substitute for measures of performance prepared according to accounting standards. These measures are not necessarily indicative of operating profit or cash flow from operations as determined under IFRS. Other companies may calculate these measures differently, so you may not be able to make a direct comparison to similar measures presented by other companies.
To facilitate a better understanding of these measures, the following table presents a reconciliation of these measures to our unit cost of sales for the second quarter and the first six months of 2016 and 2015.
Cash and total cost per pound reconciliation
| THREE MONTHS ENDED JUNE 30 | SIX MONTHS ENDED JUNE 30 | |||||||||||||||
($ MILLIONS) | 2016 | 2015 | 2016 | 2015 | ||||||||||||
Cost of product sold | 165.6 | 251.2 | 368.9 | 455.4 | ||||||||||||
Add / (subtract) | ||||||||||||||||
Royalties | (19.1 | ) | (21.9 | ) | (39.9 | ) | (35.7 | ) | ||||||||
Care and maintenance and severance costs | (38.7 | ) | — | (38.7 | ) | — | ||||||||||
Other selling costs | (3.0 | ) | (3.7 | ) | (2.9 | ) | (5.3 | ) | ||||||||
Change in inventories | 29.8 | 100.4 | 252.8 | 180.2 | ||||||||||||
Cash operating costs (a) | 134.6 | 326.0 | 540.2 | 594.6 | ||||||||||||
Add / (subtract) | ||||||||||||||||
Depreciation and amortization | 52.7 | 45.9 | 85.5 | 96.1 | ||||||||||||
Change in inventories | 24.8 | 33.2 | 79.8 | 46.7 | ||||||||||||
Total operating costs (b) | 212.1 | 405.1 | 705.5 | 737.4 | ||||||||||||
Uranium produced & purchased (million lbs)(c) | 7.6 | 9.4 | 19.7 | 17.1 | ||||||||||||
Cash costs per pound (a ÷ c) | 17.71 | 34.68 | 27.42 | 34.77 | ||||||||||||
Total costs per pound (b ÷ c) | 27.91 | 43.10 | 35.81 | 43.12 | ||||||||||||
Fuel services
(includes results for UF6, UO2 and fuel fabrication)
| THREE MONTHS ENDED JUNE 30 | SIX MONTHS ENDED JUNE 30 | |||||||||||||||||||||||||||
HIGHLIGHTS | 2016 | 2015 | CHANGE | 2016 | 2015 | CHANGE | ||||||||||||||||||||||
Production volume (million kgU) | 2.6 | 3.1 | (16 | )% | 5.9 | 5.7 | 4 | % | ||||||||||||||||||||
Sales volume (million kgU)1 | 2.9 | 2.4 | 21 | % | 5.2 | 5.4 | (4 | )% | ||||||||||||||||||||
Average realized price | ($ | Cdn/kgU | ) | 27.75 | 29.70 | (7 | )% | 27.06 | 25.45 | 6 | % | |||||||||||||||||
Average unit cost of sales (including D&A) | ($ | Cdn/kgU | ) | 21.31 | 21.44 | (1 | )% | 20.90 | 20.39 | 3 | % | |||||||||||||||||
Revenue ($ millions)1 | 81 | 70 | 16 | % | 140 | 136 | 3 | % | ||||||||||||||||||||
Gross profit ($ millions) | 19 | 19 | — | 32 | 27 | 19 | % | |||||||||||||||||||||
Gross profit (%) | 23 | 27 | (15 | )% | 23 | 20 | 15 | % | ||||||||||||||||||||
| 1 | There were no significant intersegment transactions in the periods shown. |
SECOND QUARTER
Total revenue for the second quarter of 2016 increased to $81 million from $70 million for the same period last year. A 21% increase in sales volumes was partially offset by a 7% decrease in average realized price, primarily due to mix of products sold partially offset by the weakening of the Canadian dollar compared to 2015.
The total cost of products and services sold (including D&A) increased by 24% ($62 million compared to $50 million in the second quarter of 2015) due to the increase in sales volumes, partially offset by a decrease in the average unit cost of sales. When compared to 2015, the average unit cost of sales was 1% lower.
Gross profit remained unchanged at $19 million.
| 2016 SECOND QUARTER REPORT 19 |
FIRST SIX MONTHS
In the first six months of the year, total revenue increased by 3% due to a 6% increase in realized price that was the result of the weakening of the Canadian dollar and the mix of products sold, partially offset by a 4% decrease in sales volumes.
The total cost of products and services sold (including D&A) decreased 1% ($108 million compared to $109 million in 2015) due to the 4% decrease in sales volume, partially offset by a 3% increase in the average unit cost of sales, which resulted from an increase in the unit opening inventory rate.
The net effect was a $5 million increase in gross profit.
NUKEM
| THREE MONTHS ENDED JUNE 30 | SIX MONTHS ENDED JUNE 30 | |||||||||||||||||||||||||||
HIGHLIGHTS | 2016 | 2015 | CHANGE | 2016 | 2015 | CHANGE | ||||||||||||||||||||||
Uranium sales (million lbs)1 | 2.4 | 1.5 | 60 | % | 2.4 | 4.0 | (40 | )% | ||||||||||||||||||||
Average realized price | ($ | Cdn/lb | ) | 52.51 | 50.47 | 4 | % | 52.24 | 42.80 | 22 | % | |||||||||||||||||
Cost of product sold (including D&A) | 139 | 70 | 99 | % | 141 | 156 | (10 | )% | ||||||||||||||||||||
Revenue ($ millions)1 | 129 | 81 | 59 | % | 131 | 178 | (26 | )% | ||||||||||||||||||||
Gross profit (loss) ($ millions) | (10 | ) | 11 | (191 | )% | (10 | ) | 22 | (145 | )% | ||||||||||||||||||
Gross profit (loss) (%) | (8 | ) | 14 | (157 | )% | (8 | ) | 12 | (167 | )% | ||||||||||||||||||
| 1 | Includes sales and revenue between our uranium, fuel services and NUKEM segments (nil in Q2 2016, 200,000 pounds in sales and revenue of $10.8 million in Q2 2015); (nil in 2016, 743,000 pounds in sales and revenue of $13.3 million in 2015). |
SECOND QUARTER
During the second quarter of 2016, NUKEM delivered 2.4 million pounds of uranium, an increase of 60% from the same period last year due largely to the timing of customer requirements. The majority of the deliveries in the quarter were under existing contracts with utilities. Activity in the spot market continued to be light, as was the case in the first quarter. Total revenues increased by 59% as a result of higher sales volumes.
NUKEM recorded a gross loss of $10 million in the second quarter of 2016, compared to an $11 million gross profit in the second quarter of 2015. Included in the 2016 gross loss is a $14 million net write-down of inventory. The write-down was a result of a decline in the spot price during the period.
FIRST SIX MONTHS
During the six months ended June 30, 2016, NUKEM delivered 2.4 million pounds of uranium, a decrease of 40%, due to very light market activity with a lack of profitable opportunities, and the timing of customer requirements. Total revenues decreased 26% due to a decrease in sales volumes, partially offset by a 22% increase in average realized price. The increase in realized price was mainly the result of deliveries under contracts negotiated in prior years when market prices were higher.
Gross profit percentage was a loss of 8% for the first six months of 2016, a decrease from a profit of 12% in the same period in 2015. Included in the 2015 margin was a $3 million recovery compared to a $14 million net write-down of inventory in 2016. The write-down in 2016 was a result of a decline in the spot price during the period.
The net effect was a $32 million decrease in gross profit.
| 20 CAMECO CORPORATION |
Our operations
Uranium – production overview
Production in our uranium segment this quarter was 30% higher than the second quarter of 2015. See below for more information.
URANIUM PRODUCTION
| THREE MONTHS | CHANGE | SIX MONTHS | CHANGE | 2016 PLAN | ||||||||||||||||||||||||
| ENDED JUNE 30 | ENDED JUNE 30 | |||||||||||||||||||||||||||
OUR SHARE (MILLION LBS) | 2016 | 2015 | 2016 | 2015 | ||||||||||||||||||||||||
McArthur River/Key Lake | 2.8 | 2.9 | (3 | )% | 5.7 | 5.5 | 4 | % | 12.6 | |||||||||||||||||||
Cigar Lake | 2.0 | 1.2 | 67 | % | 4.3 | 1.6 | 169 | % | 8.0 | |||||||||||||||||||
Inkai | 1.1 | 0.6 | 83 | % | 2.2 | 1.2 | 83 | % | 3.0 | |||||||||||||||||||
Rabbit Lake | 0.7 | 0.2 | 250 | % | 1.1 | 1.1 | — | 1.1 | ||||||||||||||||||||
Smith Ranch-Highland | 0.3 | 0.4 | (25 | )% | 0.6 | 0.9 | (33 | )% | 0.9 | |||||||||||||||||||
Crow Butte | 0.1 | 0.1 | — | 0.1 | 0.2 | (50 | )% | 0.2 | ||||||||||||||||||||
|
|
|
|
|
|
|
|
|
|
|
|
|
| |||||||||||||||
Total | 7.0 | 5.4 | 30 | % | 14.0 | 10.5 | 33 | % | 25.8 | |||||||||||||||||||
|
|
|
|
|
|
|
|
|
|
|
|
|
| |||||||||||||||
Uranium 2016 Q2 updates
MCARTHUR RIVER/KEY LAKE
Production update
Production for the second quarter was 3% lower compared to the same period last year due to a longer mill maintenance shut down. Production for the first six months was slightly higher than last year when unplanned mill maintenance affected our first quarter production.
Operations update
A new calciner has been installed at the Key Lake mill to accommodate an annual production increase to 25 million pounds when the market signals that more production is needed. However, reliability issues have been encountered with the new equipment during commissioning. Since market conditions do not currently support increased production at McArthur River/Key Lake, and as part of our continuing efforts to reduce costs, we have suspended the commissioning of and transition to the new calciner. We are assessing the cost to resolve the issues and expect to complete commissioning at a time when we see the need for the new calcining capacity. The existing calciner has sufficient capacity to meet our 2016 production target of 18 million pounds (12.6 million pounds our share).
CIGAR LAKE
Production update
Total packaged production from Cigar Lake was 67% higher in the second quarter, and 169% higher in the first six months compared to the same periods last year. The increases are related to the scheduled rampup of the operation. We are on track to achieve our target of 16 million pounds of production (8 million pounds our share) in 2016, and full production of 18 million pounds (9 million pounds our share) in 2017.
Operations update
In the second quarter, AREVA’s application to increase the capacity of the McClean Lake mill from 13 million to 24 million pounds of annual production was approved by the Canadian Nuclear Safety Commission.
Labour relations
The unionized employees at AREVA’s McClean Lake mill accepted a new three-year collective agreement during the second quarter. The previous contract expired in May, 2016.
| 2016 SECOND QUARTER REPORT 21 |
INKAI
Production update
Production was 83% higher for the quarter and 83% higher for the first six months compared to the same periods last year, due to the timing of new wellfield development in our 2016 mine plan. The operation remains on track to achieve our planned 2016 production.
JV Inkai restructuring agreement
We signed an agreement with our partner Kazatomprom and JV Inkai to restructure and enhance JV Inkai. We currently own a 60% share of JV Inkai while Kazatomprom holds 40%. Based on previous agreements with Kazatomprom, our current interest in production from JV Inkai is 57.5%. The new agreement replaces the memorandum of agreement we signed with Kazatomprom in September 2012 and, subject to closing, provides as follows:
| • | JV Inkai will have the right to produce 4,000 tonnes of uranium (10.4 million pounds of U3O8) per year (our share 4.2 million pounds), an increase from the current 5.2 million pounds (our share 3.0 million pounds) |
| • | subject to further adjustments tied to the refinery as described below, our ownership interest in JV Inkai will be adjusted to 40%, with Kazatomprom’s share increasing to 60%. However, the agreement ensures that during production rampup, our share of annual production remains at 57.5% on the first 5.2 million pounds. As annual production increases above 5.2 million pounds, we will be entitled to 22.5% of any incremental production, to the maximum annual share of 4.2 million pounds. Once the rampup to 10.4 million pounds annually is complete, our interest in production will be adjusted to match our ownership interest at 40%. |
| • | JV Inkai will have the right to produce from blocks 1, 2 and 3 until 2045 (currently, the lease terms are to 2024 for block 1 and to 2030 for blocks 2 and 3) |
| • | a governance framework that provides protection for us as a minority owner |
| • | the current boundaries of blocks 1, 2 and 3 will be adjusted to match the agreed production profile for JV Inkai to 2045 |
| • | the loan that our subsidiary made to JV Inkai to fund exploration and evaluation of block 3 (currently $161 (US) million) will be restructured to provide for priority repayment |
This agreement is subject to obtaining all required government approvals, including certain amendments to JV Inkai’s existing Resource Use Contract, which is expected to take 18 to 24 months. The government approvals are conditional upon submission of certain technical reports and other documents. The agreement provides for annual production at the Inkai operation to be ramped up to 10.4 million pounds U3O8 over three years following receipt of required approvals.
We, along with our partner Kazatomprom, will also complete a feasibility study for the purpose of evaluating the design, construction and operation of a uranium refinery in Kazakhstan. The agreement includes provisions that would make our proprietary uranium refining technology available to Kazatomprom on a royalty-free basis, and grants Kazatomprom a five-year option to license our proprietary uranium conversion technology for purposes of constructing and operating a UF6 conversion facility in Kazakhstan.
If Cameco and Kazatomprom decide to build the refinery, the agreement also provides that:
| • | our respective ownership interests in the limited liability partnership that will own the refinery will be 71.67% for Kazatomprom and 28.33% for Cameco |
| • | Kazatomprom will have the option to obtain UF6 conversion services at Cameco’s Port Hope facility for a period of 10 years and receive other commercial support |
| • | our ownership interest in JV Inkai is increased to 42.5% upon commissioning of the refinery |
| • | Depending on the level of commercial support we provide, our interest in JV Inkai may be increased to 44% and our ownership stake in the refinery partnership would also be adjusted from 28.33% to 29.33% |
Caution about forward-looking information relating to the JV Inkai Restructuring Agreement
This discussion of our expectations relating to the JV Inkai restructuring agreement is forward-looking information that is based upon the assumptions and subject to the material risks discussed under the headingCaution about forward-looking information beginning on page 2 and also on the more specific assumptions and risks listed below. Actual outcomes may vary significantly.
| 22 CAMECO CORPORATION |
Assumptions
| • | all required governmental approvals will be received to close and give effect to the contemplated transactions, including approval of the Resource Use Contract amendments from Kazakhstan state authorities, and that these approvals will be received on a timely basis |
| • | JV Inkai will be able to achieve its future annual production targets |
| • | anticipated operations and planned exploration, development and production activities are achieved |
Material risks that could cause actual results to differ materially
| • | all required governmental approvals to close, or give effect to, the contemplated transactions, including approval of the Resource Use Contract amendments from Kazakhstan state authorities, are not received or not received on a timely basis |
| • | JV Inkai is unable to achieve its future annual production targets |
| • | anticipated operations and planned exploration, development and production activities, including any ramp up of JV Inkai’s uranium production, are delayed or not achieved for any reason, including due to operating or technical difficulties, regulatory requirements, or political risk |
RABBIT LAKE
Production update
Given the continued depressed market conditions in the near term, we suspended production at our Rabbit Lake operation during the second quarter. Production was 250% higher than the same period last year due to the timing of maintenance in 2015. Production for the first six months was 1.1 million pounds, unchanged from the comparable period in 2015. The facilities are now in care and maintenance.
Production curtailment
We expect to complete the transition of the Rabbit Lake operation to care and maintenance by the end of August, at a cost of about $45 million. We then expect the cost to maintain the site in a safe care and maintenance state for the remainder of the year to be about $15 million. We previously estimated the total cost of transition and care and maintenance activities to be about $35 million in 2016. However, due to an accelerated start for transition of the mill to care and maintenance, and the timing of workforce reductions, additional costs were incurred and categorized as care and maintenance costs. Previously, we expected some of those costs to be categorized as operating or capital costs.
As long as production is suspended, we expect care and maintenance costs to range between $40 million and $45 million annually for the first few years. A workforce of 120 is remaining on site (down from 650) to maintain the facilities and sustain environmental monitoring and reclamation activities. The related severance cost of $11.8 million is included in our cost of sales and reflected in our results.
SMITH RANCH-HIGHLAND AND CROW BUTTE
Production update
At our US operations, total production was 20% lower for the quarter and 36% lower for the first six months compared to the same periods in 2015, due to lower planned production in 2016 compared to 2015.
Production
Amid the continued depressed market conditions, production has been curtailed at Cameco Resources’ US ISR operations by deferring all wellfield development. The change resulted in a reduction of 85 positions, including employees and long-term contractors, with a workforce of 160 remaining to operate the sites. The severance cost was $3.6 million, which is included in our cost of sales and reflected in our second quarter results,
Although we have now taken actions to curtail production, due to the nature of ISR mining and our wellfield restoration requirements, production in the US is expected to decrease over time as head grade and flow rate declines. We continue to expect to produce 1.1 million pounds from our US ISR operations in 2016.
| 2016 SECOND QUARTER REPORT 23 |
Fuel services 2016 Q2 updates
PORT HOPE CONVERSION SERVICES
CAMECO FUEL MANUFACTURING INC. (CFM)
Production update
Fuel services produced 2.6 million kgU in the second quarter, 16% lower than the same period last year due to lower planned production in 2016. Production in the first six months was 4% higher than the same period in 2015.
Labour relations
Approximately 230 unionized employees at the Port Hope conversion facility accepted a new collective agreement. The employees, represented by United Steelworkers locals 13173 and 8562, agreed to a three-year contract that includes a 7% wage increase over the term of the agreement. The previous contract expired on June 30, 2016.
Qualified persons
The technical and scientific information discussed in this document for our material properties (McArthur River/Key Lake, Inkai and Cigar Lake) was approved by the following individuals who are qualified persons for the purposes of NI 43-101:
MCARTHUR RIVER/KEY LAKE
| • | David Bronkhorst, vice-president, mining and technology, Cameco |
CIGAR LAKE
| • | Les Yesnik, general manager, Cigar Lake, Cameco |
INKAI
| • | Darryl Clark, general director, JV Inkai |
Additional information
Critical accounting estimates
Due to the nature of our business, we are required to make estimates that affect the amount of assets and liabilities, revenues and expenses, commitments and contingencies we report. We base our estimates on our experience, our best judgment, guidelines established by the Canadian Institute of Mining, Metallurgy and Petroleum and on assumptions we believe are reasonable.
Controls and procedures
As of June 30, 2016, we carried out an evaluation under the supervision and with the participation of our management, including our chief executive officer (CEO) and chief financial officer (CFO), of the effectiveness of our disclosure controls and procedures. There are inherent limitations to the effectiveness of any system of disclosure controls and procedures, including the possibility of human error and the circumvention or overriding of the controls and procedures. Accordingly, even effective disclosure controls and procedures can only provide reasonable assurance of achieving their control objectives.
Based upon that evaluation and as of June 30, 2016, the CEO and CFO concluded that:
| • | the disclosure controls and procedures were effective to provide reasonable assurance that information required to be disclosed in the reports we file and submit under applicable securities laws is recorded, processed, summarized and reported as and when required |
| • | such information is accumulated and communicated to our management, including our CEO and CFO, as appropriate to allow timely decisions regarding required disclosure |
There has been no change in our internal control over financial reporting during the quarter ended June 30, 2016 that has materially affected, or is reasonably likely to materially affect, our internal control over financial reporting.
| 24 CAMECO CORPORATION |