Exhibit 99.2

Management’s discussion and analysis
for the quarter ended March 31, 2017
| | |
| 4 | | FIRST QUARTER MARKET UPDATE |
| |
| 6 | | CONSOLIDATED FINANCIAL RESULTS |
| |
| 12 | | OUTLOOK FOR 2017 |
| |
| 15 | | LIQUIDITY AND CAPITAL RESOURCES |
| |
| 16 | | FINANCIAL RESULTS BY SEGMENT |
| |
| 19 | | OUR OPERATIONS—FIRST QUARTER UPDATES |
| |
| 20 | | QUALIFIED PERSONS |
| |
| 20 | | ADDITIONAL INFORMATION |
This management’s discussion and analysis (MD&A) includes information that will help you understand management’s perspective of our unaudited condensed consolidated interim financial statements and notes for the quarter ended March 31, 2017 (interim financial statements). The information is based on what we knew as of April 27, 2017 and updates our annual MD&A included in our 2016 annual report.
As you review this MD&A, we encourage you to read our interim financial statements as well as our audited consolidated financial statements and notes for the year ended December 31, 2016 and annual MD&A. You can find more information about Cameco, including our audited consolidated financial statements and our most recent annual information form, on our website at cameco.com, on SEDAR at sedar.com or on EDGAR at sec.gov. You should also read our annual information form before making an investment decision about our securities.
The financial information in this MD&A and in our financial statements and notes are prepared according to International Financial Reporting Standards (IFRS), unless otherwise indicated.
Unless we have specified otherwise, all dollar amounts are in Canadian dollars.
Throughout this document, the terms we, us, our and Cameco mean Cameco Corporation and its subsidiaries, including NUKEM Energy Gmbh (NUKEM), unless otherwise indicated.
Caution about forward-looking information
Our MD&A includes statements and information about our expectations for the future. When we discuss our strategy, plans, future financial and operating performance, or other things that have not yet taken place, we are making statements considered to beforward-looking information orforward-looking statements under Canadian and United States (US) securities laws. We refer to them in this MD&A asforward-looking information.
Key things to understand about the forward-looking information in this MD&A:
| • | | It typically includes words and phrases about the future, such as: anticipate, believe, estimate, expect, plan, will, intend, goal, target, forecast, project, strategy and outlook (see examples below). |
| • | | It represents our current views, and can change significantly. |
| • | | It is based on a number of material assumptions, including those we have listed on page 3, which may prove to be incorrect. |
| • | | Actual results and events may be significantly different from what we currently expect, due to the risks associated with our business. We list a number of thesematerial risks below. We recommend you also review our annual information form, and annual MD&A, which includes a discussion of othermaterial risks that could cause actual results to differ significantly from our current expectations. |
| • | | Forward-looking information is designed to help you understand management’s current views of our near and longer term prospects, and it may not be appropriate for other purposes. We will not necessarily update this information unless we are required to by securities laws. |
Examples of forward-looking information in this MD&A
| • | | the discussion under the heading Our strategy |
| • | | Our expectations about 2017 and future global uranium supply and demand, including the discussion under the headingFirst quarter market update |
| • | | The discussion of our expectations relating to our dispute with Tokyo Electric Power Company Holdings, Inc. (TEPCO) |
| • | | The discussion of our expectations relating to our Canada Revenue Agency (CRA) and Internal Revenue Service (IRS) transfer pricing disputes, including our estimate of the amount and timing of expected cash taxes and transfer pricing penalties |
| • | | Our consolidated outlook for the year and the outlook for our uranium, fuel services and NUKEM segments for 2017 |
| • | | Our expectations for quarterly uranium deliveries and quarterly average realized prices for the remainder of 2017 |
| • | | Our price sensitivity analysis for our uranium segment |
| • | | Our expectation that existing cash balances and operating cash flows will meet our anticipated 2017 capital requirements without the need for any significant additional funding, other than temporary drawings on short-term liquidity during the course of the year |
| • | | Our expectation that our operating and investment activities for the remainder of 2017 will not be constrained by the financial-related covenants in our unsecured revolving credit facility |
| • | | Our future plans and expectations for each of our uranium operating properties and fuel services operating sites |
| • | | Our expectations related to annual Rabbit Lake care and maintenance costs |
Material risks
| • | | actual sales volumes or market prices for any of our products or services are lower than we expect for any reason, including changes in market prices or loss of market share to a competitor |
| • | | we are adversely affected by changes in currency exchange rates, interest rates, royalty rates, or tax rates |
| • | | our production costs are higher than planned, or our cost reduction strategies are unsuccessful, or necessary supplies are not available, or not available on commercially reasonable terms |
| • | | our estimates of production, purchases, costs, care and maintenance, decommissioning or reclamation expenses, or our tax expense estimates prove to be inaccurate |
| • | | we are unable to enforce our legal rights under our existing agreements, permits or licences |
| • | | we are subject to litigation or arbitration that has an adverse outcome, including lack of success in our disputes with tax authorities or with TEPCO |
| • | | we are unsuccessful in our dispute with CRA and/or the IRS and this results in significantly higher cash taxes, interest charges and penalties than the amount of our cumulative tax provision |
| • | | we are unable to utilize letters of credit to the extent anticipated in our dispute with CRA |
| • | | there are defects in, or challenges to, title to our properties |
| • | | our mineral reserve and resource estimates are not reliable, or we face challenging or unexpected geological, hydrological or mining conditions |
| • | | we are affected by environmental, safety and regulatory risks, including increased regulatory burdens or delays |
| • | | the necessary permits or approvals from government authorities are not obtained or maintained, including AREVA Resources Canada Inc.’s (AREVA) renewal of the McClean Lake mill’s operating licence, and the approvals necessary for closing of the 2016 JV Inkai Restructuring Agreement |
2 CAMECO CORPORATION
| • | | we are affected by political risks |
| • | | we are affected by terrorism, sabotage, blockades, civil unrest, social or political activism, accident or a deterioration in political support for, or demand for, nuclear energy |
| • | | we are impacted by changes in the regulation or public perception of the safety of nuclear power plants, which adversely affect the construction of new plants, the relicensing of existing plants and the demand for uranium |
| • | | there are changes to government regulations or policies that adversely affect us, including tax and trade laws and policies |
| • | | our uranium suppliers fail to fulfil delivery commitments or our uranium purchasers fail to fulfil purchase commitments |
| • | | our McArthur River, Cigar Lake, and/or Inkai development, mining or production plans are delayed or do not succeed for any reason |
| • | | any difficulties in milling of Cigar Lake ore at McClean Lake |
| • | | our expectations relating to Rabbit Lake care and maintenance costs prove to be inaccurate |
| • | | we are affected by natural phenomena, including inclement weather, fire, flood and earthquakes |
| • | | our operations are disrupted due to problems with our own or our suppliers’ or customers’ facilities, the unavailability of reagents, equipment, operating parts and supplies critical to production, equipment failure, lack of tailings capacity, labour shortages, labour relations issues, strikes or lockouts, underground floods,cave-ins, ground movements, tailings dam failures, transportation disruptions or accidents, unanticipated consequences of our cost reduction strategies, or other development and operating risks |
Material assumptions
| • | | our expectations regarding sales and purchase volumes and prices for uranium and fuel services, and that the counterparties to our sales and purchase agreements will honour their commitments |
| • | | our expectations regarding the demand for, and supply of, uranium, the pressure for a return to long-term contracting, the construction of new nuclear power plants and the relicensing of existing nuclear power plants not being more adversely affected than expected by changes in regulation or in the public perception of the safety of nuclear power plants |
| • | | our expected production levels and production costs, including our expectations regarding the success of our cost reduction strategies |
| • | | the assumptions regarding market conditions and other factors upon which we have based our capital expenditures expectations |
| • | | our expectations regarding spot prices and realized prices for uranium, and other factors discussed under the headingPrice sensitivity analysis: uranium segment |
| • | | our expectations regarding tax rates and payments, royalty rates, currency exchange rates and interest rates |
| • | | our expectations about the outcome of disputes with tax authorities and with TEPCO |
| • | | we are able to utilize letters of credit to the extent anticipated in our dispute with CRA |
| • | | our decommissioning and reclamation expenses |
| • | | our mineral reserve and resource estimates, and the assumptions upon which they are based, are reliable |
| • | | our understanding of the geological, hydrological and other conditions at our mines |
| • | | our McArthur River, Cigar Lake, and Inkai development, mining and production plans succeed |
| • | | the McClean Lake mill is able to process Cigar Lake ore as expected |
| • | | that annual Rabbit Lake care and maintenance costs will be as expected |
| • | | our ability to continue to supply our products and services in the expected quantities and at the expected times |
| • | | our and our contractors’ ability to comply with current and future environmental, safety and other regulatory requirements, and to obtain and maintain required regulatory approvals, including AREVA’s renewal of the McClean Lake mill’s operating licence, and approvals necessary to close the 2016 JV Inkai Restructuring Agreement |
| • | | our operations are not significantly disrupted as a result of political instability, nationalization, terrorism, sabotage, blockades, civil unrest, social or political activism, breakdown, natural disasters, governmental or political actions, litigation or arbitration proceedings, the unavailability of reagents, equipment, operating parts and supplies critical to production, equipment failure, labour shortages, labour relations issues, strikes or lockouts, underground floods,cave-ins, ground movements, tailings dam failures, lack of tailings capacity, transportation disruptions or accidents, unanticipated consequences of our cost reduction strategies, or other development or operating risks |
2017 FIRST QUARTER REPORT 3
Our strategy
We are a pure-play nuclear fuel supplier, focused on taking advantage of the long-term growth we see coming in our industry, while maintaining the ability to respond to market conditions as they evolve. Our strategy is to focus on ourtier-one assets and profitably produce at a pace aligned with market signals in order to increase long-term shareholder value, and to do that with an emphasis on safety, people and the environment.
In light of today’s oversupplied market and the lingering uncertainty as to how long the weak market conditions will persist, we are focussing our resources on our lowest cost assets, on maintaining a strong balance sheet, and on efficiently managing the company in a low price environment. This approach provides us with the opportunity to meet rising demand with increased production from our best margin assets, and helps to mitigate risk during a prolonged period of uncertainty.
We plan to:
| • | | ensure continued safe, reliable,low-cost production from ourtier-one assets – McArthur River/Key Lake, Cigar Lake and Inkai |
| • | | complete ramp up of production at Cigar Lake |
| • | | continue to evaluate all sources of supply and supply expansion opportunities in our portfolio, in order to retain the flexibility to respond to market signals and take advantage of value adding opportunities |
| • | | focus on maximizing margins through cost management, productivity improvements, and supply discipline |
You can read more about our strategy in our 2016 annual MD&A.
First quarter market update
There were a number of both positive and negative developments in the nuclear industry during the first quarter, though the uranium market is expected to remain oversupplied in the near term. Uranium prices rallied early in January following an announcement by Kazatomprom – the world’s largest uranium producer – that it was planning to cut its 2017 production by 10%. However, the announced cuts were not enough to drive a sustained price increase. The modest momentum was dampened by continued low demand as the majority of utilities remained on the sidelines.
In Japan, positive news emerged from the Osaka High Court when a lower court injunction on the Takahama 3 and 4 reactors was overturned, clearing the way for Kansai Electric Company to restart both facilities in 2017. In addition, an application for an injunction against Shikoku Electric Power Company’s Ikata 3 reactor was rejected by a district court, allowing the plant to continue operating, and Kyushu Electric Power Company’s Genkai 3 and 4 reactors were granted final local approval by the governor of Saga prefecture.
However, these developments were somewhat offset by an announcement that the US division of Westinghouse Electric Company had filed under Chapter 11 of the US Bankruptcy Code due to losses associated with the construction of four AP1000 units in Georgia and South Carolina. The impact of the announcement on new build projects is not yet clear.
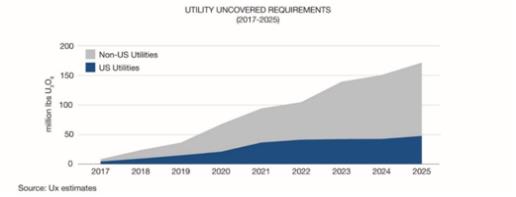
Longer-term, uranium demand is backed by steady reactor growth. As the 57 reactors under construction today come online, including new reactors expected to enter commercial operation in 2017 in Slovakia, Pakistan, South Korea, UAE, India, Russia, and China, and planned units move into the construction phase, we believe increasing demand for uranium will need to be met with new primary supply. We expect that risks to both future and existing supply could decrease the availability of spot material, and increase the pressure for a return to long-term contracting, as estimates suggest there is a significant amount of uranium that needs to be contracted to keep both new and existing reactors running into the next decade.
4 CAMECO CORPORATION
Industry consultants have indicated that cumulative uncovered requirements are expected to total about 800 million pounds over the next nine years. Although uncovered requirements do not ramp up significantly in the near-term, we expect the current price-sensitive sentiment to give way to increasing concerns about the security of future supply. That uncertainty creates an opportunity for producers that are able to weather today’s weak market conditions.
Caution about forward-looking information relating to the nuclear industry
This discussion of our expectations for the nuclear industry, including its growth profile, future global uranium supply, demand, reactor growth, and pressure for long-term contracting is forward-looking information that is based upon the assumptions and subject to the material risks discussed under the headingCaution about forward-looking information beginning on page 2
Industry prices at quarter end
| | | | | | | | | | | | | | | | | | | | | | | | |
| | | MAR 31 | | | DEC 31 | | | SEP 30 | | | JUN 30 | | | MAR 31 | | | DEC 31 | |
| | | 2017 | | | 2016 | | | 2016 | | | 2016 | | | 2016 | | | 2015 | |
Uranium($US/lb U3O8)1 | | | | | | | | | | | | | | | | | | | | | | | | |
Average spot market price | | | 23.88 | | | | 20.25 | | | | 23.00 | | | | 26.70 | | | | 28.70 | | | | 34.23 | |
Average long-term price | | | 33.00 | | | | 30.00 | | | | 37.50 | | | | 40.50 | | | | 43.50 | | | | 44.00 | |
Fuel services ($US/kgU as UF6)1 | | | | | | | | | | | | | | | | | | | | | | | | |
Average spot market price | | | | | | | | | | | | | | | | | | | | | | | | |
North America | | | 5.93 | | | | 5.93 | | | | 5.93 | | | | 6.75 | | | | 6.75 | | | | 6.88 | |
Europe | | | 6.45 | | | | 6.45 | | | | 6.45 | | | | 7.25 | | | | 7.25 | | | | 7.38 | |
Average long-term price | | | | | | | | | | | | | | | | | | | | | | | | |
North America | | | 13.50 | | | | 12.50 | | | | 12.25 | | | | 12.75 | | | | 12.75 | | | | 13.50 | |
Europe | | | 14.00 | | | | 13.00 | | | | 13.00 | | | | 14.00 | | | | 14.00 | | | | 14.50 | |
Note: the industry does not publish UO2 prices.
| 1 | Average of prices reported by TradeTech and Ux Consulting (Ux) |
On the spot market, where purchases call for delivery within one year, the volume reported by Ux Consulting (UxC) for the first quarter of 2017 was approximately 10 million pounds. This compares to approximately nine million pounds in the first quarter of 2016. At the end of the quarter, the average reported spot price was $23.88 (US) per pound, up $3.63 (US) from the previous quarter.
Long-term contracts usually call for deliveries to begin more than two years after the contract is finalized, and use a number of pricing formulas, including fixed prices escalated over the term of the contract, and market referenced prices (spot and long-term indicators) quoted near the time of delivery. The volume of long-term contracting reported by UxC for the first three months of 2017 was approximately 28 million pounds. Although higher than the 11 million pounds reported over the same period in 2016, the volumes continued to be relatively low, and less than required to incent price recovery. The average reported long-term price at the end of the quarter was $33.00 (US) per pound, up $3.00 (US) fromyear-end.
Spot UF6 conversion prices remained the same, while long-term UF6 conversion prices increased during the quarter.
Shares and stock options outstanding
At April 27, 2017, we had:
| | • | | 395,792,732 common shares and one Class B share outstanding |
| | • | | 8,542,083 stock options outstanding, with exercise prices ranging from $14.70 to $54.38 |
Dividend
Our board of directors has established a quarterly dividend of $0.10 ($0.40 per year) per common share. The dividend is reviewed quarterly based on our cash flow, earnings, financial position, strategy and other relevant factors.
2017 FIRST QUARTER REPORT 5
Financial results
This section of our MD&A discusses our performance, financial condition and outlook for the future.
On February 1, 2017, we announced that on January 31, 2017, TEPCO, alleging force majeure, confirmed that it would not withdraw a contract termination notice it provided to Cameco Inc. with respect to a uranium supply agreement, which affects approximately 9.3 million pounds of uranium deliveries through 2028, worth approximately $1.3 billion in revenue to Cameco, including about $126 million in 2017. We see no basis for terminating the agreement. In this MD&A, our 2017 financial outlook and other disclosures relating to our contract portfolio are presented on a basis which excludes this agreement with TEPCO, which is under dispute.
Consolidated financial results
| | | | | | | | | | | | |
| | | THREE MONTHS | | | | |
| HIGHLIGHTS | | ENDED MARCH 31 | | | | |
($ MILLIONS EXCEPT WHERE INDICATED) | | 2017 | | | 2016 | | | CHANGE | |
Revenue | | | 393 | | | | 408 | | | | (4 | )% |
Gross profit | | | 55 | | | | 118 | | | | (53 | )% |
Net earnings (losses) attributable to equity holders | | | (18 | ) | | | 78 | | | | (123 | )% |
$ per common share (basic) | | | (0.05 | ) | | | 0.20 | | | | (125 | )% |
$ per common share (diluted) | | | (0.05 | ) | | | 0.20 | | | | (125 | )% |
Adjusted net losses(non-IFRS, see page 7) | | | (29 | ) | | | (7 | ) | | | (314 | )% |
$ per common share (adjusted and diluted) | | | (0.07 | ) | | | (0.02 | ) | | | (250 | )% |
Cash used in operations (after working capital changes) | | | (8 | ) | | | (277 | ) | | | 97 | % |
NET EARNINGS
The following table shows what contributed to the change in net earnings and adjusted net earnings(non-IFRS measure, see page 7) in the first quarter of 2017, compared to the first quarter of 2016.
| | | | | | | | | | |
| | | | | THREE MONTHS | |
| | | | | ENDED MARCH 31 | |
($ MILLIONS) | | IFRS | | | ADJUSTED | |
Net earnings (losses) – 2016 | | | 78 | | | | (7 | ) |
| | | | | | | | | | |
Change in gross profit by segment | | | | | | | | |
(We calculate gross profit by deducting from revenue the cost of products and services sold, and depreciation and amortization (D&A), net of hedging benefits) | |
Uranium | | Lower sales volume | | | (4 | ) | | | (4 | ) |
| | Lower realized prices ($US) | | | (44 | ) | | | (44 | ) |
| | Foreign exchange impact on realized prices | | | (29 | ) | | | (29 | ) |
| | Lower costs | | | 11 | | | | 11 | |
| | | | | | | | | | |
| | Change – uranium | | | (66 | ) | | | (66 | ) |
| | | | | | | | | | |
Fuel services | | Lower sales volume | | | (4 | ) | | | (4 | ) |
| | Higher realized prices ($Cdn) | | | 12 | | | | 12 | |
| | Higher costs | | | (7 | ) | | | (7 | ) |
| | | | | | | | | | |
| | Change – fuel services | | | 1 | | | | 1 | |
| | | | | | | | | | |
NUKEM | | Gross profit | | | — | | | | — | |
| | | | | | | | | | |
| | Change – NUKEM | | | — | | | | — | |
| | | | | | | | | | |
Other changes | | | | | | | | |
Lower administration expenditures | | | 11 | | | | 11 | |
Lower exploration expenditures | | | 5 | | | | 5 | |
Rabbit Lake reclamation provision | | | (6 | ) | | | — | |
Lower loss on disposal of assets | | | 4 | | | | 4 | |
Lower loss (lower gain) on derivatives | | | (75 | ) | | | 19 | |
Lower foreign exchange losses | | | 32 | | | | 32 | |
Higher (lower) income tax recovery | | | 5 | | | | (21 | ) |
Other | | | (7 | ) | | | (7 | ) |
| | | | | | | | | | |
Net losses – 2017 | | | (18 | ) | | | (29 | ) |
| | | | | | | | | | |
SeeFinancial results by segment beginning on page 16 for more detailed discussion.
6 CAMECO CORPORATION
ADJUSTED NET EARNINGS(NON-IFRS MEASURE)
Adjusted net earnings is a measure that does not have a standardized meaning or a consistent basis of calculation under IFRS(non-IFRS measure). We use this measure as a more meaningful way to compare our financial performance from period to period. We believe that, in addition to conventional measures prepared in accordance with IFRS, certain investors use this information to evaluate our performance. Adjusted net earnings is our net earnings attributable to equity holders, adjusted to better reflect the underlying financial performance for the reporting period. The adjusted earnings measure reflects the matching of the net benefits of our hedging program with the inflows of foreign currencies in the applicable reporting period, and has also been adjusted for NUKEM purchase price inventory adjustments, Rabbit Lake reclamation provisions, impairment charges, and income taxes on adjustments.
Adjusted net earnings isnon-standard supplemental information and should not be considered in isolation or as a substitute for financial information prepared according to accounting standards. Other companies may calculate this measure differently, so you may not be able to make a direct comparison to similar measures presented by other companies.
The following table reconciles adjusted net earnings with our net earnings.
| | | | | | | | |
| | | THREE MONTHS | |
| | | ENDED MARCH 31 | |
($ MILLIONS) | | 2017 | | | 2016 | |
Net earnings (losses) attributable to equity holders | | | (18 | ) | | | 78 | |
| | | | | | | | |
Adjustments | | | | | | | | |
Adjustments on foreign exchange derivatives | | | (22 | ) | | | (116 | ) |
Rabbit Lake reclamation provision | | | 6 | | | | — | |
Income taxes on adjustments | | | 5 | | | | 31 | |
| | | | | | | | |
Adjusted net losses | | | (29 | ) | | | (7 | ) |
| | | | | | | | |
Quarterly trends
| | | | | | | | | | | | | | | | | | | | | | | | | | | | | | | | |
| HIGHLIGHTS | | 2017 | | | 2016 | | | 2015 | |
($ MILLIONS EXCEPT PER SHARE AMOUNTS) | | Q1 | | | Q4 | | | Q3 | | | Q2 | | | Q1 | | | Q4 | | | Q3 | | | Q2 | |
Revenue | | | 393 | | | | 887 | | | | 670 | | | | 466 | | | | 408 | | | | 975 | | | | 649 | | | | 565 | |
Net earnings (losses) attributable to equity holders | | | (18 | ) | | | (144 | ) | | | 142 | | | | (137 | ) | | | 78 | | | | (10 | ) | | | (4 | ) | | | 88 | |
$ per common share (basic) | | | (0.05 | ) | | | (0.36 | ) | | | 0.36 | | | | (0.35 | ) | | | 0.20 | | | | (0.03 | ) | | | (0.01 | ) | | | 0.22 | |
$ per common share (diluted) | | | (0.05 | ) | | | (0.36 | ) | | | 0.36 | | | | (0.35 | ) | | | 0.20 | | | | (0.03 | ) | | | (0.01 | ) | | | 0.22 | |
Adjusted net earnings (losses)(non-IFRS, see page 7) | | | (29 | ) | | | 90 | | | | 118 | | | | (57 | ) | | | (7 | ) | | | 151 | | | | 78 | | | | 46 | |
$ per common share (adjusted and diluted) | | | (0.07 | ) | | | 0.23 | | | | 0.30 | | | | (0.14 | ) | | | (0.02 | ) | | | 0.38 | | | | 0.20 | | | | 0.12 | |
Cash provided by (used in) operations (after working capital changes) | | | (8 | ) | | | 255 | | | | 385 | | | | (51 | ) | | | (277 | ) | | | 503 | | | | (121 | ) | | | (65 | ) |
Key things to note:
| • | | our financial results are strongly influenced by the performance of our uranium segment, which accounted for 66% of consolidated revenues in the first quarter of 2017 |
| • | | the timing of customer requirements, which tend to vary from quarter to quarter, drives revenue in the uranium and fuel services segments, meaning quarterly results are not necessarily a good indication of annual results due to seasonal variability |
| • | | net earnings do not trend directly with revenue due to unusual items and transactions that occur from time to time. We use adjusted net earnings, anon-IFRS measure, as a more meaningful way to compare our results from period to period (see page 7 for more information). |
| • | | cash from operations tends to fluctuate as a result of the timing of deliveries and product purchases in our uranium and fuel services segments |
2017 FIRST QUARTER REPORT 7
The table that follows presents the differences between net earnings and adjusted net earnings for the previous seven quarters.
| | | | | | | | | | | | | | | | | | | | | | | | | | | | | | | | |
| HIGHLIGHTS | | 2017 | | | 2016 | | | 2015 | |
($ MILLIONS EXCEPT PER SHARE AMOUNTS) | | Q1 | | | Q4 | | | Q3 | | | Q2 | | | Q1 | | | Q4 | | | Q3 | | | Q2 | |
Net earnings (losses) attributable to equity holders | | | (18 | ) | | | (144 | ) | | | 142 | | | | (137 | ) | | | 78 | | | | (10 | ) | | | (4 | ) | | | 88 | |
| | | | | | | | | | | | | | | | | | | | | | | | | | | | | | | | |
Adjustments | | | | | | | | | | | | | | | | | | | | | | | | | | | | | | | | |
Adjustments on foreign exchange derivatives | | | (22 | ) | | | 23 | | | | (27 | ) | | | (10 | ) | | | (116 | ) | | | 10 | | | | 112 | | | | (57 | ) |
NUKEM purchase price inventory adjustment | | | — | | | | — | | | | — | | | | (6 | ) | | | — | | | | — | | | | — | | | | — | |
Impairment charges | | | — | | | | 238 | | | | — | | | | 124 | | | | — | | | | 210 | | | | — | | | | — | |
Rabbit Lake reclamation provision | | | 6 | | | | (28 | ) | | | (6 | ) | | | — | | | | — | | | | — | | | | — | | | | — | |
Income taxes on adjustments | | | 5 | | | | 1 | | | | 9 | | | | (28 | ) | | | 31 | | | | (59 | ) | | | (30 | ) | | | 15 | |
| | | | | | | | | | | | | | | | | | | | | | | | | | | | | | | | |
Adjusted net earnings (losses)(non-IFRS, see page 7) | | | (29 | ) | | | 90 | | | | 118 | | | | (57 | ) | | | (7 | ) | | | 151 | | | | 78 | | | | 46 | |
| | | | | | | | | | | | | | | | | | | | | | | | | | | | | | | | |
Corporate expenses
ADMINISTRATION
| | | | | | | | | | | | |
| | | THREE MONTHS | | | | |
| | | ENDED MARCH 31 | | | | |
($ MILLIONS) | | 2017 | | | 2016 | | | CHANGE | |
Direct administration | | | 35 | | | | 48 | | | | (27 | )% |
Stock-based compensation | | | 6 | | | | 4 | | | | 50 | % |
| | | | | | | | | | | | |
Total administration | | | 41 | | | | 52 | | | | (21 | )% |
| | | | | | | | | | | | |
Direct administration costs were $13 million lower for the first quarter of 2017 compared to the same period last year. In 2016, we incurredup-front costs associated with the restructuring of our NUKEM segment, and increased legal costs as our CRA dispute progressed towards trial. In addition, some of the actions we took in 2016 to reduce our costs resulted in lower costs in the first quarter of 2017.
Stock based compensation was $2 million higher than in 2016 due mainly to increased retirement eligibility.
EXPLORATION
In the first quarter, uranium exploration expenses were $10 million, a decrease of $5 million compared to the first quarter of 2016 due to a planned reduction in expenditures.
INCOME TAXES
We recorded an income tax expense of $4 million in the first quarter of 2017, compared to an expense of $9 million in the first quarter of 2016.
On an adjusted basis, we recorded an income tax recovery of $1 million this quarter compared to a recovery of $22 million in the first quarter of 2016, primarily due to a change in the distribution of earnings among foreign jurisdictions. In 2017, we recorded losses of $1 million in Canada compared to losses of $99 million in 2016, while we recorded losses of $29 million in foreign jurisdictions compared to earnings of $69 million last year.
| | | | | | | | |
| | | THREE MONTHS | |
| | | ENDED MARCH 31 | |
($ MILLIONS) | | 2017 | | | 2016 | |
Pre-tax adjusted earnings1 | | | | | | | | |
Canada | | | (1 | ) | | | (99 | ) |
Foreign | | | (29 | ) | | | 69 | |
| | | | | | | | |
Totalpre-tax adjusted earnings | | | (30 | ) | | | (30 | ) |
| | | | | | | | |
Adjusted income taxes1 | | | | | | | | |
Canada | | | (1 | ) | | | (30 | ) |
Foreign | | | — | | | | 8 | |
| | | | | | | | |
Adjusted income tax recovery | | | (1 | ) | | | (22 | ) |
| | | | | | | | |
| 1 | Pre-tax adjusted earnings and adjusted income taxes arenon-IFRS measures. Our IFRS-based measures have been adjusted by the amounts reflected in the table in adjusted net earnings (non-IFRS measure on page 7). |
8 CAMECO CORPORATION
TRANSFER PRICING DISPUTES
We have been reporting on our transfer pricing disputes with CRA since 2008, when it originated, and with the United States Internal Revenue Service (IRS) since the first quarter of 2015. Below, we discuss the general nature of transfer pricing disputes and, more specifically, the ongoing disputes we have.
Transfer pricing is a complex area of tax law, and it is difficult to predict the outcome of cases like ours. However, tax authorities generally test two things:
| • | | the governance (structure) of the corporate entities involved in the transactions |
| • | | the price at which goods and services are sold by one member of a corporate group to another |
We have a global customer base and we established a marketing and trading structure involving foreign subsidiaries, including Cameco Europe Limited (CEL), which entered into various intercompany arrangements, including purchase and sale agreements, as well as uranium purchase and sale agreements with third parties. Cameco and its subsidiaries made reasonable efforts to putarm’s-length transfer pricing arrangements in place, and these arrangements expose the parties to the risks and rewards accruing to them under these contracts. The intercompany contract prices are generally comparable to those established in comparable contracts betweenarm’s-length parties entered into at that time.
For the years 2003 to 2011, CRA has shifted CEL’s income (as recalculated by CRA) back to Canada and applied statutory tax rates, interest and instalment penalties, and, from 2007 to 2010, transfer pricing penalties. There has not yet been a decision regarding a transfer pricing penalty for 2011. The IRS is also proposing to allocate a portion of CEL’s income for the years 2009 through 2012 to the US, resulting in such income being taxed in multiple jurisdictions. Taxes of approximately $350 million for the 2003 – 2016 years have already been paid in a jurisdiction outside Canada and the US. Bilateral international tax treaties contain provisions that generally seek to prevent taxation of the same income in both countries. As such, in connection with these disputes, we are considering our options, including remedies under international tax treaties that would limit double taxation; however, there is a risk that we will not be successful in eliminating all potential double taxation. The expected income adjustments under our tax disputes are represented by the amounts claimed by CRA and IRS and are described below.
CRA dispute
Since 2008, CRA has disputed our corporate structure and the related transfer pricing methodology we used for certain intercompany uranium sale and purchase agreements. To date, we received notices of reassessment for our 2003 through 2011 tax returns. We have recorded a cumulative tax provision of $58 million, where an argument could be made that, based on our methodology, our transfer price may have fallen outside of an appropriate range of pricing in uranium contracts for the period from 2003 through March 31, 2017. We are confident that we will be successful in our case and continue to believe the ultimate resolution of this matter will not be material to our financial position, results of operations and cash flows in the year(s) of resolution.
For the years 2003 through 2011, CRA issued notices of reassessment for approximately $4.1 billion of additional income for Canadian tax purposes, which would result in a related tax expense of about $1.2 billion. CRA has also issued notices of reassessment for transfer pricing penalties for the years 2007 through 2010 in the amount of $292 million. The Canadian income tax rules include provisions that require larger companies like us to remit or otherwise secure 50% of the cash tax plus related interest and penalties at the time of reassessment. To date, under these provisions, after applying elective deductions, we have paid a net amount of $264 million in cash. In addition, we have provided $421 million in letters of credit (LC) to secure 50% of the cash taxes and related interest amounts reassessed after 2014. The amounts paid or secured are shown in the table below.
| | | | | | | | | | | | | | | | | | | | | | | | |
| | | | | | INTEREST | | | TRANSFER | | | | | | | | | | |
| | | | | | AND INSTALMENT | | | PRICING | | | | | | CASH | | | SECURED BY | |
YEAR PAID ($ MILLIONS) | | CASH TAXES | | | PENALTIES | | | PENALTIES | | | TOTAL | | | REMITTANCE | | | LC | |
Prior to 2014 | | | 1 | | | | 22 | | | | 36 | | | | 59 | | | | 59 | | | | — | |
2014 | | | 106 | | | | 47 | | | | — | | | | 153 | | | | 153 | | | | — | |
2015 | | | 202 | | | | 71 | | | | 79 | | | | 352 | | | | 20 | | | | 332 | |
2016 | | | 51 | | | | 38 | | | | 31 | | | | 120 | | | | 32 | | | | 88 | |
2017 | | | — | | | | 1 | | | | — | | | | 1 | | | | — | | | | 1 | |
| | | | | | | | | | | | | | | | | | | | | | | | |
Total | | | 360 | | | | 179 | | | | 146 | | | | 685 | | | | 264 | | | | 421 | |
| | | | | | | | | | | | | | | | | | | | | | | | |
2017 FIRST QUARTER REPORT 9
Using the methodology we believe CRA will continue to apply, and including the $4.1 billion already reassessed, we expect to receive notices of reassessment for a total of approximately $8.1 billion of additional income taxable in Canada for the years 2003 through 2016, which would result in a related tax expense of approximately $2.4 billion. As well, CRA may continue to apply transfer pricing penalties to taxation years subsequent to 2010. As a result, we estimate that cash taxes and transfer pricing penalties for these years would be between $1.75 billion and $1.95 billion. In addition, we estimate there would be interest and instalment penalties applied that would be material to us. While in dispute, we would be responsible for remitting or otherwise providing security for 50% of the cash taxes and transfer pricing penalties (between $875 million and $975 million), plus related interest and instalment penalties assessed, which would be material to us.
Under the Canadian federal and provincial tax rules, the amount required to be paid or secured each year will depend on the amount of income reassessed in that year and the availability of elective deductions and tax loss carryovers. CRA has decided to disallow the use of any loss carry-backs for any transfer pricing adjustment, starting with the 2008 tax year. This does not impact the anticipated income tax expense for a particular year, but does impact the timing of any required security or payment. As noted above, beginning with the 2010 tax year, as an alternative to paying cash, we used letters of credit to satisfy our obligations related to the reassessed income tax and related interest amounts. We believe we will be able to continue to provide security in the form of letters of credit to satisfy these requirements. The estimated amounts summarized in the table below reflect actual amounts paid or secured and estimated future amounts owing based on the actual and expected reassessments for the years 2003 through 2016, and include the expected timing adjustment for the inability to use any loss carry-backs starting in 2008. We will update this table annually to include the estimated impact of reassessments expected for completed years subsequent to 2016.
| | | | | | | | | | | | | | | | |
$ MILLIONS | | 2003-2016 | | | 2017-2018 | | | 2019-2023 | | | TOTAL | |
50% of cash taxes and transfer pricing penalties paid, secured or owing in the period | |
Cash payments | | | 187 | | | | 65 - 90 | | | | 145 - 170 | | | | 390 - 445 | |
Secured by letters of credit | | | 319 | | | | 10 - 35 | | | | 150 - 175 | | | | 480 - 530 | |
| | | | | | | | | | | | | | | | |
Total paid1 | | | 506 | | | | 75 - 125 | | | | 295 - 345 | | | | 875 - 975 | |
| | | | | | | | | | | | | | | | |
| 1 | These amounts do not include interest and instalment penalties, which totaled approximately $179 million to March 31, 2017. |
In light of our view of the likely outcome of the case as described above, we expect to recover the amounts remitted, including the $685 million already paid or otherwise secured to date.
The trial related to the 2003, 2005 and 2006 reassessments commenced in October, 2016. Final arguments are currently scheduled for September, 2017. If this timing is adhered to, we expect to receive a Tax Court decision within six to 18 months after the trial is complete.
IRS dispute
We received Revenue Agents Reports (RARs) from the IRS for the 2009 though 2012 tax years, whereby the IRS has challenged the transfer pricing used under certain intercompany transactions pertaining to the above tax years for certain of our US subsidiaries. The RARs list the adjustments proposed by the IRS and calculate the tax and any penalties owing based on the proposed adjustments.
The audit position of the IRS is that a portion of thenon-US income reported under our corporate structure and taxed innon-US jurisdictions should be recognized and taxed in the US on the basis that:
| • | | the prices received by our US mining subsidiaries for the sale of uranium to CEL are too low |
| • | | the compensation earned by Cameco Inc., one of our US subsidiaries, is inadequate |
The proposed adjustments result in an increase in taxable income in the US of approximately $419 million (US) and a corresponding increased income tax expense of approximately $122 million (US) for the 2009 through 2012 taxation years, with interest being charged thereon. In addition, the IRS proposed cumulative penalties of approximately $8 million (US) in respect of the adjustment.
We believe that the conclusions of the IRS in the RARs are incorrect and we are contesting them in an administrative appeal, during which we are not required to make any cash payments.
We believe that the ultimate resolution of this matter will not be material to our financial position, results of operations and cash flows in the year(s) of resolution.
10 CAMECO CORPORATION
Caution about forward-looking information relating to our CRA and IRS tax dispute
This discussion of our expectations relating to our tax disputes with CRA and IRS and future tax reassessments by CRA and IRS is forward-looking information that is based upon the assumptions and subject to the material risks discussed under the headingCaution about forward-looking information beginning on page 2 and also on the more specific assumptions and risks listed below. Actual outcomes may vary significantly.
Assumptions
| • | | CRA will reassess us for the years 2012 through 2016 using a similar methodology as for the years 2003 through 2011, and the reassessments will be issued on the basis we expect |
| • | | we will be able to apply elective deductions and utilize letters of credit to the extent anticipated |
| • | | CRA will seek to impose transfer pricing penalties (in a manner consistent with penalties charged in the years 2007 through 2010) in addition to interest charges and instalment penalties |
| • | | we will be substantially successful in our dispute with CRA and the cumulative tax provision of $58 million to date will be adequate to satisfy any tax liability resulting from the outcome of the dispute to date |
| • | | IRS may propose adjustments for later years subsequent to 2012 |
| • | | we will be substantially successful in our dispute with IRS |
Material risks that could cause actual results to differ materially
| • | | CRA reassesses us for years 2012 through 2016 using a different methodology than for years 2003 through 2011, or we are unable to utilize elective deductions or letters of credit to the extent anticipated, resulting in the required cash payments or security provided to CRA pending the outcome of the dispute being higher than expected |
| • | | the time lag for the reassessments for each year is different than we currently expect |
| • | | we are unsuccessful and the outcomes of our dispute with CRA and/or IRS result in significantly higher cash taxes, interest charges and penalties than the amount of our cumulative tax provision, which could have a material adverse effect on our liquidity, financial position, results of operations and cash flows |
| • | | cash tax payable increases due to unanticipated adjustments by CRA or IRS not related to transfer pricing |
| • | | IRS proposes adjustments for years 2013 through 2015 using a different methodology than for 2009 through 2012 |
| • | | we are unable to effectively eliminate all double taxation |
FOREIGN EXCHANGE
The exchange rate between the Canadian dollar and US dollar affects the financial results of our uranium and fuel services segments. SeeRevenue, adjusted net earnings, and cash flow sensitivity analysis on page 14 for more information on how a change in the exchange rate will impact our revenue, cash flow, and adjusted net earnings (ANE) (seeNon-IFRS measures on page 7).
We sell the majority of our uranium and fuel services products under long-term sales contracts, which are routinely denominated in US dollars, while our production costs are largely denominated in Canadian dollars. To provide cash flow predictability, we hedge a portion of our net US/Cdn exposure (e.g. total US dollar sales less US dollar expenditures and product purchases) to manage shorter term exchange rate volatility. Our results are therefore affected by the movements in the exchange rate on our hedge portfolio, and on the unhedged portion of our net exposure.
Impact of hedging on IFRS earnings
We do not use hedge accounting under IFRS and, therefore, we are required to report gains and losses on all hedging activity, both for contracts that close in the period and those that remain outstanding at the end of the period. For the contracts that remain outstanding, we must treat them as though they were settled at the end of the reporting period(mark-to-market).
However, we do not believe the gains and losses that we are required to report under IFRS appropriately reflect the intent of our hedging activities, so we make adjustments in calculating our ANE to better reflect the benefits of our hedging program in the applicable reporting period.
Impact of hedging on ANE
The table below provides a summary of our hedge portfolio at March 31, 2017. You can use this information to estimate the expected gains or losses on derivatives for the remainder of 2017 on an ANE basis. However, if we add contracts to the portfolio that are designated for use in 2017 or if there are changes in the US/Cdn exchange rates in the year, those expected gains or losses could change.
You can read more about our hedging program in our 2016 annual MD&A.
2017 FIRST QUARTER REPORT 11
HEDGE PORTFOLIO SUMMARY
| | | | | | | | | | | | | | | | | | | | | | | | |
| MARCH 31, 2017 | | | | | | | | | | | | | | AFTER | | | | |
($ MILLIONS) | | | | | 20171 | | | 2018 | | | 2019 | | | 2019 | | | TOTAL | |
US dollar forward contracts | | | | | | | 308 | | | | 300 | | | | 60 | | | | — | | | | 668 | |
Average contract rate2 | | | (US/Cdn dollar | ) | | | 1.31 | | | | 1.31 | | | | 1.31 | | | | — | | | | 1.31 | |
US dollar option contracts | | | | | | | 50 | | | | 60 | | | | 60 | | | | — | | | | 170 | |
Average contract rate range2 | | | (US/Cdn dollar | ) | | | 1.30 to 1.35 | | | | 1.30 to 1.34 | | | | 1.29 to 1.35 | | | | — | | | | 1.30 to 1.35 | |
Total US dollar hedge contracts | �� | | | | | | 358 | | | | 360 | | | | 120 | | | | — | | | | 838 | |
Effective hedge rate range3 | | | (US/Cdn dollar | ) | | | 1.19 to 1.20 | | | | 1.21 to 1.22 | | | | 1.25 to 1.28 | | | | — | | | | 1.21 to 1.22 | |
Hedge ratio4 | | | | | | | 40 | % | | | 35 | % | | | 12 | % | | | 0 | % | | | 16 | % |
| 1 | Represents hedge contracts for the remainder of the year. See 2017 Financial Outlook for the full-year expected gain/loss on derivatives. |
| 2 | The average contract rate is the average of the rates stipulated in the outstanding contracts. |
| 3 | The effective hedge rate is the exchange rate on the original hedge contract at the time it was established and designated for use. Therefore the effective hedge rate range shown reflects an average of contract exchange rates at the time of designation. |
| 4 | Hedge ratio is calculated by dividing the amount (in foreign currency) of outstanding derivative contracts by estimated future net exposures. |
At March 31, 2017:
| • | | The value of the US dollar relative to the Canadian dollar was $1.00 (US) for $1.33 (Cdn), down from $1.00 (US) for $1.34 (Cdn) at December 31, 2016. The exchange rate averaged $1.00 (US) for $1.32 (Cdn) over the quarter. |
| • | | Themark-to-market loss on all foreign exchange contracts was $12 million compared to a $25 million loss at December 31, 2016. |
For information on the impact of foreign exchange on our intercompany balances, see note 15 to the financial statements.
Outlook for 2017
Our strategy is to focus on ourtier-one assets and profitably produce at a pace aligned with market signals, while maintaining the ability to respond to conditions as they evolve.
Our outlook for 2017 reflects the expenditures necessary to help us achieve our strategy and is based on the assumptions found below the table, including a given uranium spot price, uranium term price, and foreign exchange rate. For more information on how changes in the exchange rate or uranium prices can impact our outlook seeRevenue, adjusted net earnings, and cash flow sensitivity analysis on page 14, andForeign exchange on page 11. Our 2017 financial outlook, and other disclosures relating to our contract portfolio, have been presented on a basis that excludes our contract with TEPCO, which is under dispute. We do not provide an outlook for the items in the table that are marked with a dash.
See 2017 Financial results by segment on page 16 for details.
12 CAMECO CORPORATION
2017 FINANCIAL OUTLOOK
| | | | | | | | | | | | | | | | |
| | | CONSOLIDATED | | | URANIUM | | | FUEL SERVICES | | | NUKEM | |
EXPECTED CONTRIBUTION TO GROSS PROFIT | | | 100 | % | | | 85 | % | | | 14 | % | | | 1 | % |
Production | | | — | | |
| 25.2
million lbs |
| |
| 8 to 9
million kgU |
| | | — | |
Sales/delivery volume1 | | | — | | |
| 30 to 32
million lbs |
2 | |
| 11 to 12
million kgU |
| |
| 5 to 6
million lbs U3O8 |
|
Revenue ($ million)1 | | | 1,950 to 2,080 | | | | 1,470 to 1,570 | 3 | | | 300 to 330 | | | | — | |
Average realized price3 | | | — | | | $ | 49.00/lb | 2 | | | — | | | | — | |
Average unit cost of sales (including D&A) | | | — | | | $ | 36.00-38.00/lb | 4 | | $ | 21.60-22.60/kgU | | | | — | |
Gross profit | | | — | | | | — | | | | — | | | | 3% to 4 | % |
Direct administration costs5 | | $ | 150-160 million | | | | — | | | | — | | | | — | |
Exploration costs | | | — | | | $ | 30 million | | | | — | | | | — | |
Expected loss on derivatives - ANE basis3 | | $ | 45-50 million | | | | — | | | | — | | | | — | |
Tax recovery - ANE basis6 | | $ | 10-20 million | | | | — | | | | — | | | | — | |
Capital expenditures | | $ | 190 million | | | | — | | | | — | | | | — | |
| 1 | Our 2017 outlook for sales/delivery volume does not include sales between our uranium, fuel services and NUKEM segments. |
| 2 | Our uranium sales/delivery volume is based on the volumes we currently have commitments to deliver under contract in 2017. |
| 3 | Based on a uranium spot price of $24.50 (US) per pound (the Ux spot price as of March 31, 2017), a long-term price indicator of $31.00 (US) per pound (the Ux long-term indicator on March 31, 2017) and an exchange rate of $1.00 (US) for $1.30 (Cdn). |
| 4 | Based on the expected unit cost of sale for produced material and committed long-term purchases. If we make discretionary purchases in the remainder of 2017, then we expect the overall unit cost of sales may be affected. |
| 5 | Direct administration costs do not include stock-based compensation expenses. See page 8 for more information. |
| 6 | Our outlook for the tax recovery is based on adjusted net earnings and the other assumptions listed in the table. If other assumptions change then the expected recovery may be affected |
There have been no changes to our financial outlook for 2017.
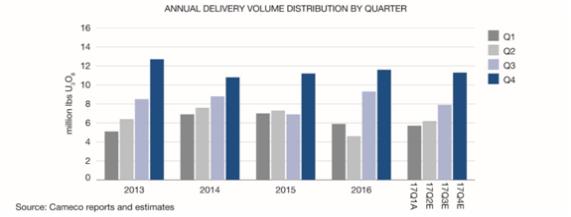
For our second and third quarter deliveries in our uranium segment, we expect pricing to yield a quarterly average realized price similar to the first quarter. In the fourth quarter, we expect pricing on deliveries to result in a higher average realized price. We continue to expect an annual average realized price of $49.00 in 2017.
In our uranium and fuel services segments, our customers choose when in the year to receive deliveries, so our quarterly delivery patterns, sales/delivery volumes and revenue can vary significantly. We are on track for our uranium sales/delivery targets and expect the quarterly distribution of uranium deliveries in 2017 to be weighted to the second half of the year as shown below. However, not all delivery notices have been received to date and the expected delivery pattern could change.
2017 FIRST QUARTER REPORT 13
REVENUE, ADJUSTED NET EARNINGS, AND CASH FLOW SENSITIVITY ANALYSIS
| | | | | | | | | | | | | | |
| | | | | IMPACT ON: | |
FOR 2017 ($ MILLIONS) | | CHANGE | | REVENUE | | | ANE | | | CASH FLOW | |
Uranium spot and term price1 | | $5(US)/lb increase | | | 47 | | | | 32 | | | | 38 | |
| | $5(US)/lb decrease | | | (33 | ) | | | (22 | ) | | | (25 | ) |
Value of Canadian dollar vs US dollar | | One cent decrease in CAD | | | 11 | | | | 6 | | | | 5 | |
| | One cent increase in CAD | | | (11 | ) | | | (6 | ) | | | (5 | ) |
| 1 | Assuming change in both Ux spot price ($24.50 (US) per pound on March 31, 2017) and the Ux long-term price indicator ($31.00 (US) per pound on March 31, 2017) |
PRICE SENSITIVITY ANALYSIS: URANIUM SEGMENT
The following table is not a forecast of prices we expect to receive. The prices we actually realize will be different from the prices shown in the table. It is designed to indicate how the portfolio of long-term contracts we had in place on March 31, 2017 would respond to different spot prices. In other words, we would realize these prices only if the contract portfolio remained the same as it was on March 31, 2017 and none of the assumptions we list below change.
We intend to update this table each quarter in our MD&A to reflect changes to our contract portfolio. As a result, we expect the table to change from quarter to quarter.
Expected realized uranium price sensitivity under various spot price assumptions
(rounded to the nearest $1.00)
| | | | | | | | | | | | | | | | | | | | | | | | | | | | |
| SPOT PRICES | | | | | | | | | | | | | | | | | | | | | |
($US/lb U3O8) | | $20 | | | $40 | | | $60 | | | $80 | | | $100 | | | $120 | | | $140 | |
2017 | | | Provided in financial outlook table and in revenue, adjusted net earnings, and cash flow sensitivity analysis | |
2018 | | | 37 | | | | 45 | | | | 56 | | | | 67 | | | | 77 | | | | 85 | | | | 93 | |
2019 | | | 34 | | | | 44 | | | | 56 | | | | 66 | | | | 75 | | | | 82 | | | | 89 | |
2020 | | | 36 | | | | 45 | | | | 57 | | | | 66 | | | | 74 | | | | 81 | | | | 87 | |
2021 | | | 32 | | | | 43 | | | | 56 | | | | 66 | | | | 75 | | | | 84 | | | | 91 | |
The table illustrates the mix of long-term contracts in our March 31, 2017 portfolio, and is consistent with our marketing strategy. It has been updated to reflect contracts entered into up to March 31, 2017, and it excludes our contract under dispute with TEPCO.
Our portfolio includes a mix of fixed-price and market-related contracts, which we target at a 40:60 ratio. Those that are fixed at higher prices or have high floor prices will yield prices that are higher than current market prices.
Our portfolio is affected by more than just the spot price. We made the following assumptions (which are not forecasts) to create the table:
Sales
| • | | sales volumes on average of 24 million pounds per year, with commitment levels in 2017 through 2019 higher than in 2020 and 2021 |
| • | | excludes sales between our uranium, fuel services and NUKEM segments |
| • | | excludes the contract under dispute with TEPCO |
Deliveries
| • | | deliveries include best estimates of requirements contracts and contracts with volume flex provisions |
Annual inflation
Prices
| • | | the average long-term price indicator is the same as the average spot price for the entire year (a simplified approach for this purpose only). Since 1996, the long-term price indicator has averaged 20% higher than the spot price. This differential has varied significantly. Assuming the long-term price is at a premium to spot, the prices in the table will be higher. |
14 CAMECO CORPORATION
Liquidity and capital resources
Our financial objective is to ensure we have the cash and debt capacity to fund our operating activities, investments and growth.
We have large, creditworthy customers that continue to need uranium even during weak economic conditions, and we expect the uranium contract portfolio we have built to provide a solid revenue stream for years to come.
We expect to continue investing in maintaining ourtier-one production capacity and flexibility over the next several years. We have a number of alternatives to fund future capital requirements, including using our operating cash flow, drawing on our existing credit facilities, entering new credit facilities, and raising additional capital through debt or equity financings. We are always considering our financing options so we can take advantage of favourable market conditions when they arise. Due to the cyclical nature of our business, we may need to temporarily draw on our short-term liquidity during the course of the year. However, apart from these short-term fluctuations, we expect our cash balances and operating cash flows to meet our capital requirements during 2017.
We have an ongoing transfer pricing dispute with CRA. See page 9 for more information. Until this dispute is resolved, we expect to pay cash or provide security in the form of letters of credit for future amounts owing to the Government of Canada for 50% of the cash taxes payable and the related interest and penalties. We have provided an estimate of the amount and timing of the expected cash taxes and transfer pricing penalties paid, secured or owing in the table on page 10.
CASH FROM/USED IN OPERATIONS
Cash used in operations was $269 million lower this quarter than in the first quarter of 2016. Contributing to this change was a decrease in working capital requirements, which required $207 million less in 2017 than in 2016. In the first quarter of 2017, the increase in inventories was much lower than the increase in 2016, which required significantly more working capital. Not including working capital requirements, our operating cash flows this quarter were higher by $62 million.
FINANCING ACTIVITIES
We use debt to provide additional liquidity. We have sufficient borrowing capacity with unsecured lines of credit totalling about $3.0 billion at March 31, 2017, up $0.2 billion from December 31, 2016. At March 31, 2017, we had approximately $1.5 billion outstanding in letters of credit, unchanged from December 31, 2016. At March 31, 2017, we had no short-term debt outstanding on our $1.25 billion unsecured revolving credit facility, unchanged from December 31, 2016. At March 31, 2017, NUKEM had $2 million (US) outstanding on their 75 million (€) multicurrency revolving loan facility in the form of a temporary bank overdraft, compared to nil on December 31, 2016.
Long-term contractual obligations
Since December 31, 2016, there have been no material changes to our long-term contractual obligations. Please see our 2016 annual MD&A for more information.
Debt covenants
We are bound by certain covenants in our unsecured revolving credit facility. The financially related covenants place restrictions on total debt, including guarantees. As at March 31, 2017, we met these financial covenants and do not expect our operating and investment activities for the remainder of 2017 to be constrained by them.
NUKEM financing arrangements
NUKEM enters into financing arrangements with third parties where future receivables arising from certain sales contracts are sold to financial institutions in exchange for cash. These arrangements require NUKEM to satisfy its delivery obligations under the sales contracts, which are recognized as deferred sales (see notes 4 and 6 to the financial statements for more information). In addition, NUKEM is required to pledge the underlying inventory as security against these performance obligations. As of March 31, 2017, we had $4.8 million ($3.6 million (US)) of inventory pledged as security under financing arrangements, compared with $4.9 million ($3.6 million (US)) at December 31, 2016.
2017 FIRST QUARTER REPORT 15
OFF-BALANCE SHEET ARRANGEMENTS
We had three kinds ofoff-balance sheet arrangements at March 31, 2017:
There have been no material changes to our purchase commitments since December 31, 2016. Please see our 2016 annual MD&A for more information.
Financial assurances
At March 31, 2017, our financial assurances totalled $1.5 billion, unchanged from December 31, 2016.
Other arrangements
We continue to use factoring and other third party arrangements to manage short-term cash flow fluctuations. You can read more about these arrangements in our 2016 annual MD&A.
BALANCE SHEET
| | | | | | | | | | | | |
($ MILLIONS) | | MAR 31, 2017 | | | DEC 31, 2016 | | | CHANGE | |
Cash and cash equivalents | | | 244 | | | | 320 | | | | (24 | )% |
Total debt | | | 1,494 | | | | 1,493 | | | | — | |
Inventory | | | 1,372 | | | | 1,288 | | | | 7 | % |
Total cash and cash equivalents at March 31, 2017 were $244 million, or 24% lower than at December 31, 2016, primarily due to capital expenditures of $23 million, dividend payments of $40 million, and interest payments of $14 million. Net debt at March 31, 2017 was $1,250 million.
Total product inventories increased to $1,372 million, including NUKEM’s inventories ($158 million). Inventories increased as sales were lower than production and purchases in the first three months of the year. As of March 31, 2017, we held an inventory of 31.4 million pounds of U3O8 equivalent in our uranium segment (excluding broken ore).
Financial results by segment
Uranium
| | | | | | | | | | | | | | |
| | | | | THREE MONTHS | | | | |
| | | | | ENDED MARCH 31 | | | | |
HIGHLIGHTS | | | | 2017 | | | 2016 | | | CHANGE | |
Production volume (million lbs) | | | | | 6.7 | | | | 7.0 | | | | (4 | )% |
Sales volume (million lbs)1 | | | | | 5.7 | | | | 5.9 | | | | (3 | )% |
Average spot price | | ($US/lb) | | | 23.79 | | | | 31.85 | | | | (25 | )% |
Average long-term price | | ($US/lb) | | | 32.83 | | | | 43.83 | | | | (25 | )% |
Average realized price | | ($US/lb) | | | 34.43 | | | | 42.22 | | | | (18 | )% |
| | ($Cdn/lb) | | | 45.51 | | | | 58.29 | | | | (22 | )% |
Average unit cost of sales (including D&A) | | ($Cdn/lb) | | | 37.72 | | | | 39.71 | | | | (5 | )% |
Revenue ($ millions)1 | | | | | 260 | | | | 347 | | | | (25 | )% |
Gross profit ($ millions) | | | | | 44 | | | | 110 | | | | (60 | )% |
Gross profit (%) | | | | | 17 | | | | 32 | | | | (47 | )% |
| 1 | There were no significant intersegment transactions in the periods shown. |
FIRST QUARTER
Production volumes this quarter were 4% lower compared to the first quarter of 2016, mainly due to planned lower production from Inkai and our US operations, and a lack of production from the suspended Rabbit Lake operation, partially offset by higher production from McArthur River/Key Lake related to the timing of mill maintenance shut downs. SeeUranium 2017 Q1 updates starting on page 19 for more information.
16 CAMECO CORPORATION
Uranium revenues this quarter were down 25% compared to 2016 due to a decrease of 22% in the Canadian dollar average realized price and a decrease in sales volumes of 3%. The spot price for uranium averaged $23.79 (US) per pound in the first quarter of 2017, a decline of 25% compared to the 2016 first quarter average price of $31.85 (US) per pound. Pricing under our contract portfolio in the first quarter was impacted by the disputed TEPCO agreement, weaker uranium prices, and a stronger Canadian dollar than a year ago. The realized foreign exchange rate was $1.32 compared to $1.38 in 2016. While our average realized price outperformed the market, it decreased by 22% compared to last year mainly due to lower prices for uranium delivered under both fixed and market-related contracts. In the second and third quarters, we expect pricing on deliveries to yield a quarterly average realized price similar to the first quarter. In the fourth quarter, we expect pricing on deliveries to result in a higher average realized price. We continue to expect an annual average realized price of $49.00 in 2017.
Total cost of sales (including D&A) decreased by 8% ($216 million compared to $236 million in 2016) due to a 3% decrease in sales volume and a lower unit cost of sales.
The net effect was a $66 million decrease in gross profit for the quarter.
The table below shows the costs of produced and purchased uranium incurred in the reporting periods (which arenon-IFRS measures, see the paragraphs below the table). These costs do not include care and maintenance costs, selling costs such as royalties, transportation and commissions, nor do they reflect the impact of opening inventories on our reported cost of sales.
| | | | | | | | | | | | |
| | | THREE MONTHS | | | | |
| | | ENDED MARCH 31 | | | | |
($CDN/LB) | | 2017 | | | 2016 | | | CHANGE | |
Produced | | | | | | | | | | | | |
Cash cost | | | 14.54 | | | | 20.69 | | | | (30 | )% |
Non-cash cost | | | 10.34 | | | | 12.91 | | | | (20 | )% |
| | | | | | | | | | | | |
Total production cost | | | 24.88 | | | | 33.60 | | | | (26 | )% |
| | | | | | | | | | | | |
Quantity produced (million lbs) | | | 6.7 | | | | 7.0 | | | | (4 | )% |
| | | | | | | | | | | | |
Purchased | | | | | | | | | | | | |
Cash cost | | | 41.47 | | | | 51.06 | | | | (19 | )% |
| | | | | | | | | | | | |
Quantity purchased (million lbs) | | | 1.8 | | | | 5.1 | | | | (65 | )% |
| | | | | | | | | | | | |
Totals | | | | | | | | | | | | |
Produced and purchased costs | | | 28.39 | | | | 40.96 | | | | (31 | )% |
| | | | | | | | | | | | |
Quantities produced and purchased (million lbs) | | | 8.5 | | | | 12.1 | | | | (30 | )% |
| | | | | | | | | | | | |
The average cash cost of production this quarter was 30% lower than the comparable period in 2016, primarily due to the rampup of lower cost production from Cigar Lake, and the impact of our actions in 2016 to curtail production from Rabbit Lake and our US operations, where production costs were higher.
Although purchased pounds are transacted in US dollars, we account for the purchases in Canadian dollars. The average cash cost of purchased material in US dollar terms was $31.34 US per pound this quarter, compared to $36.95 US per pound in the first quarter of 2016. In addition, in the first quarter of 2017, the exchange rate on purchases averaged $1.00 (US) for $1.32 (Cdn), compared to $1.00 (US) for $1.38 (Cdn) in the first quarter of 2016. As a result, the average cash cost of purchased material in Canadian dollar terms decreased by 19% this quarter compared to the same period last year.
Cash cost per pound,non-cash cost per pound and total cost per pound for produced and purchased uranium presented in the above table arenon-IFRS measures. These measures do not have a standardized meaning or a consistent basis of calculation under IFRS. We use these measures in our assessment of the performance of our uranium business. We believe that, in addition to conventional measures prepared in accordance with IFRS, certain investors use this information to evaluate our performance and ability to generate cash flow.
These measures arenon-standard supplemental information and should not be considered in isolation or as a substitute for measures of performance prepared according to accounting standards. These measures are not necessarily indicative of operating profit or cash flow from operations as determined under IFRS. Other companies may calculate these measures differently, so you may not be able to make a direct comparison to similar measures presented by other companies.
2017 FIRST QUARTER REPORT 17
To facilitate a better understanding of these measures, the following table presents a reconciliation of these measures to our unit cost of sales for the first quarter of 2017 and 2016.
Cash and total cost per pound reconciliation
| | | | | | | | |
| | | THREE MONTHS | |
| | | ENDED MARCH 31 | |
($ MILLIONS) | | 2017 | | | 2016 | |
Cost of product sold | | | 182.1 | | | | 203.2 | |
Add / (subtract) | | | | | | | | |
Royalties | | | (10.2 | ) | | | (20.8 | ) |
Care and maintenance costs | | | (10.4 | ) | | | — | |
Other selling costs | | | (0.7 | ) | | | — | |
Change in inventories | | | 11.2 | | | | 222.8 | |
| | | | | | | | |
Cash operating costs (a) | | | 172.0 | | | | 405.2 | |
Add / (subtract) | | | | | | | | |
Depreciation and amortization | | | 33.5 | | | | 32.8 | |
Change in inventories | | | 35.8 | | | | 57.6 | |
| | | | | | | | |
Total operating costs (b) | | | 241.3 | | | | 495.6 | |
| | | | | | | | |
Uranium produced & purchased (million lbs)(c) | | | 8.5 | | | | 12.1 | |
| | | | | | | | |
Cash costs per pound (a ÷ c) | | | 20.24 | | | | 33.49 | |
Total costs per pound (b ÷ c) | | | 28.39 | | | | 40.96 | |
Fuel services
(includes results for UF6, UO2 and fuel fabrication)
| | | | | | | | | | | | | | |
| | | | | THREE MONTHS | | | | |
| | | | | ENDED MARCH 31 | | | | |
HIGHLIGHTS | | | | 2017 | | | 2016 | | | CHANGE | |
Production volume (million kgU) | | | | | 2.6 | | | | 3.3 | | | | (21 | )% |
Sales volume (million kgU)1 | | | | | 1.6 | | | | 2.3 | | | | (30 | )% |
Average realized price | | ($Cdn/kgU) | | | 33.22 | | | | 26.18 | | | | 27 | % |
Average unit cost of sales (including D&A) | | ($Cdn/kgU) | | | 24.67 | | | | 20.38 | | | | 21 | % |
Revenue ($ millions)1 | | | | | 54 | | | | 59 | | | | (8 | )% |
Gross profit ($ millions) | | | | | 14 | | | | 13 | | | | 8 | % |
Gross profit (%) | | | | | 26 | | | | 22 | | | | 18 | % |
| 1 | There were no significant intersegment transactions in the periods shown. |
FIRST QUARTER
Total revenue for the first quarter of 2017 decreased to $54 million from $59 million for the same period last year. This was primarily due to a 30% decrease in sales volumes partially offset by a 27% increase in average realized price compared to 2016.
The total cost of products and services sold (including D&A) decreased by 13% ($40 million compared to $46 million in the first quarter of 2016) due to the decrease in sales volumes partially offset by an increase in the average unit cost of sales. When compared to 2016, the average unit cost of sales was 21% higher due to the mix of products sold.
The net effect was a $1 million increase in gross profit.
18 CAMECO CORPORATION
NUKEM
(financial results include U3O8, UF6, and SWU)
| | | | | | | | | | | | | | |
| | | | | THREE MONTHS | | | | |
| | | | | ENDED MARCH 31 | | | | |
HIGHLIGHTS | | | | 2017 | | | 2016 | | | CHANGE | |
Uranium sales (million lbs)1 | | | | | 2.3 | | | | 0.1 | | | | >100 | % |
Average realized price | | ($Cdn/lb) | | | 33.57 | | | | 39.32 | | | | (15 | )% |
Cost of product sold (including D&A) | | | | | 78 | | | | 2 | | | | >100 | % |
Revenue ($ millions)1 | | | | | 78 | | | | 2 | | | | >100 | % |
Gross profit ($ millions) | | | | | — | | | | — | | | | — | |
Gross profit (%) | | | | | — | | | | — | | | | — | |
| 1 | There were no significant intersegment transactions in the periods shown. |
FIRST QUARTER
During the first quarter of 2017, NUKEM delivered 2.3 million pounds of uranium, a significant increase from the same period last year due to the timing of customer requirements and a greater number of acceptable spot sale opportunities relative to the first quarter of 2016. The majority of the deliveries in the quarter were under existing contracts with utilities but a significant portion related to spot market activity. Total revenues increased to $78 million from $2 million in 2016 as a result of the higher sales volumes.
NUKEM did not record a gross profit in the first quarter of 2017 or 2016. In 2017, an operating margin of $3 million was offset by a write-down of the carrying value of inventory. The write-down was mainly the result of purchases in the quarter under contracts that were previously committed to at prices above the current spot price.
Our operations
Uranium – production overview
Production in our uranium segment this quarter was 4% lower than the first quarter of 2016. See below for more information.
URANIUM PRODUCTION
| | | | | | | | | | | | | | | | |
| | | THREE MONTHS | | | | | | | |
| | | ENDED MARCH 31 | | | | | | | |
OUR SHARE (MILLION LBS) | | 2017 | | | 2016 | | | CHANGE | | | 2017 PLAN | |
McArthur River/Key Lake | | | 3.6 | | | | 2.9 | | | | 24 | % | | | 12.6 | |
Cigar Lake | | | 2.3 | | | | 2.2 | | | | 5 | % | | | 9.0 | |
Inkai | | | 0.7 | | | | 1.1 | | | | (36 | )% | | | 3.1 | |
Rabbit Lake | | | — | | | | 0.4 | | | | (100 | )% | | | — | |
Smith Ranch-Highland | | | 0.1 | | | | 0.3 | | | | (67 | )% | | | 0.4 | |
Crow Butte | | | — | | | | 0.1 | | | | (100 | )% | | | 0.1 | |
| | | | | | | | | | | | | | | | |
Total | | | 6.7 | | | | 7.0 | | | | (4 | )% | | | 25.2 | |
| | | | | | | | | | | | | | | | |
Uranium 2017 Q1 updates
PRODUCTION UPDATE
McArthur River/Key Lake
Production for the first quarter was 24% higher compared to the same period in 2016 due to the timing of planned maintenance. Last year, a planned first quarter mill shut down resulted in lower first quarter production while in 2017, maintenance activities are expected to be completed during an extendedsix-week shut down planned for the third quarter.
Cigar Lake
Total packaged production from Cigar Lake was 5% higher in the first quarter compared to the same period last year. The year-over-year increase is the result of the scheduled rampup of the operation.
2017 FIRST QUARTER REPORT 19
The Canadian Nuclear Safety Commission’s (CNSC) relicensing proceedings for AREVA’s McClean Lake mill are well underway, with the hearings set for June. Its existing eight-year term ends on June 30, 2017, and it has requested a12-year licence term as part of its renewal process.
Inkai
Production was 36% lower for the quarter compared to the same period last year due to the timing of new wellfield development and the planned 10% decrease in production for 2017.
PRODUCTION CURTAILMENT
Smith Ranch-Highland/Crow Butte
At our US operations, total production was 75% lower for the first quarter compared to 2016 as a result of the decision to curtail production and defer all wellfield development at our US operations. Production is expected to steadily trend down as the head grade decreases.
Rabbit Lake
The Rabbit Lake operation is in a safe state of care and maintenance; there was no production in the first quarter of 2017. We are continually weighing the value of maintaining the operation in standby, against the cost of doing so. However, as long as production is suspended, we expect care and maintenance costs to range between $35 million and $40 million annually for the first few years.
Fuel services 2017 Q1 updates
PORT HOPE CONVERSION SERVICES
CAMECO FUEL MANUFACTURING INC. (CFM)
Production update
Fuel services produced 2.6 million kgU in the first quarter, 21% lower than the same period last year due to the timing of scheduled production.
Licensing
In February, the Canadian Nuclear Safety Commission approved a10-year operating licence for the Port Hope conversion facility. The new licence expires on February 28, 2027.
Qualified persons
The technical and scientific information discussed in this document for our material properties (McArthur River/Key Lake, Inkai and Cigar Lake) was approved by the following individuals who are qualified persons for the purposes of NI43-101:
MCARTHUR RIVER/KEY LAKE
| • | | Greg Murdock, mine manager, McArthur River, Cameco |
CIGAR LAKE
| • | | Les Yesnik, general manager, McArthur River/Key Lake, Cameco |
INKAI
| • | | Darryl Clark, president, Cameco Kazakhstan LLP |
Additional information
Critical accounting estimates
Due to the nature of our business, we are required to make estimates that affect the amount of assets and liabilities, revenues and expenses, commitments and contingencies we report. We base our estimates on our experience, our best judgment, guidelines established by the Canadian Institute of Mining, Metallurgy and Petroleum and on assumptions we believe are reasonable.
20 CAMECO CORPORATION
Controls and procedures
As of March 31, 2017, we carried out an evaluation under the supervision and with the participation of our management, including our chief executive officer (CEO) and chief financial officer (CFO), of the effectiveness of our disclosure controls and procedures. There are inherent limitations to the effectiveness of any system of disclosure controls and procedures, including the possibility of human error and the circumvention or overriding of the controls and procedures. Accordingly, even effective disclosure controls and procedures can only provide reasonable assurance of achieving their control objectives.
Based upon that evaluation and as of March 31, 2017, the CEO and CFO concluded that:
| • | | the disclosure controls and procedures were effective to provide reasonable assurance that information required to be disclosed in the reports we file and submit under applicable securities laws is recorded, processed, summarized and reported as and when required |
| • | | such information is accumulated and communicated to our management, including our CEO and CFO, as appropriate to allow timely decisions regarding required disclosure |
There has been no change in our internal control over financial reporting during the quarter ended March 31, 2017 that has materially affected, or is reasonably likely to materially affect, our internal control over financial reporting.
2017 FIRST QUARTER REPORT 21