Exhibit 99.4
Cameco Energizing the World 2017 Annual Report
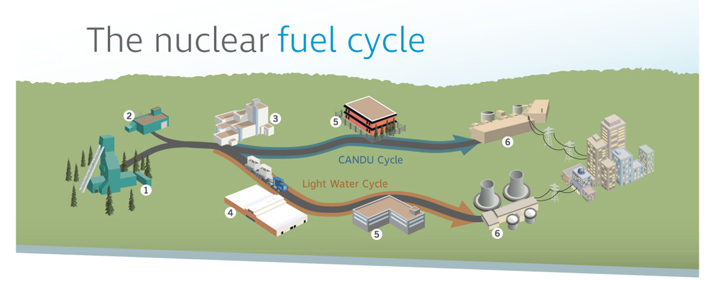
The nuclear fuel cycle 2 3 5 6 CANDU Cycle Light Water Cycle 1 4 5 6
 Mining
Once an orebody is discovered and defined by exploration, there are three common ways to mine uranium, depending on the depth of the orebody and the deposit’s geological characteristics:
| • | Open pit mining is used if the ore is near the surface. The ore is usually mined using drilling and blasting. |
| • | Underground mining is used if the ore is too deep to make open pit mining economical. Tunnels and shafts provide access to the ore. |
| • | In situ recovery (ISR) does not require large scale excavation. Instead, holes are drilled into the ore and a solution is used to dissolve the uranium. The solution is pumped to the surface where the uranium is recovered. |
Milling
Ore from open pit and underground mines is processed to extract the uranium and package it as a powder typically referred to asuranium concentrates(U3O8) oryellowcake. The leftover processed rock and other solid waste (tailings) is placed in an engineered tailings facility.
 Refining
Refining removes the impurities from the uranium concentrate and changes its chemical form touranium trioxide (UO3).
 Conversion
For light water reactors, the UO3 is converted touranium hexafluoride (UF6) gas to prepare it for enrichment. For heavy water reactors like the Candu reactor, the UO3 is converted into powdereduranium dioxide (UO2).
 Enrichment
Uranium is made up of two main isotopes:U-238 andU-235. OnlyU-235 atoms, which make up 0.7% of natural uranium, are involved in the nuclear reaction (fission). Most of the world’s commercial nuclear reactors require uranium that has an enriched level ofU-235 atoms.
The enrichment process increases the concentration ofU-235 to between 3% and 5% by separatingU-235 atoms from theU-238. Enriched UF6 gas is then converted to powdered UO2.
 Fuel manufacturing
Natural or enriched UO2 is pressed into pellets, which are baked at a high temperature. These are packed into zircaloy or stainless steel tubes, sealed and then assembled into fuel bundles.
 Generation
Nuclear reactors are used to generate electricity.U-235 atoms in the reactor fuel fission, creating heat that generates steam to drive turbines. The fuel bundles in the reactor need to be replaced as theU-235 atoms are depleted, typically after one or two years depending upon the reactor type. The used – or spent – fuel is stored or reprocessed.
Spent fuel management
The majority of spent fuel is safely stored at the reactor site. A small amount of spent fuel is reprocessed. The reprocessed fuel is used in some European and Japanese reactors.

Management’s discussion and analysis
February 9, 2018
6 |
2017 PERFORMANCE HIGHLIGHTS | |
| 9 | MARKET OVERVIEW AND 2017 DEVELOPMENTS | |
| 13 | OUR STRATEGY | |
| 21 | MEASURING OUR RESULTS | |
| 22 | FINANCIAL RESULTS | |
| 51 | OPERATIONS AND PROJECTS | |
| 74 | MINERAL RESERVES AND RESOURCES | |
| 79 | ADDITIONAL INFORMATION | |
| 82
| 2017 CONSOLIDATED FINANCIAL STATEMENTS
| |
This management’s discussion and analysis (MD&A) includes information that will help you understand management’s perspective of our audited consolidated financial statements (financial statements) and notes for the year ended December 31, 2017. The information is based on what we knew as of February 7, 2018.
We encourage you to read our audited consolidated financial statements and notes as you review this MD&A. You can find more information about Cameco, including our financial statements and our most recent annual information form, on our website at cameco.com, on SEDAR at sedar.com or on EDGAR at sec.gov. You should also read our annual information form before making an investment decision about our securities.
The financial information in this MD&A and in our financial statements and notes are prepared according to International Financial Reporting Standards (IFRS), unless otherwise indicated.
Unless we have specified otherwise, all dollar amounts are in Canadian dollars.
Throughout this document, the terms we, us, our, the Company and Cameco mean Cameco Corporation and its subsidiaries, including NUKEM Energy GmbH (NUKEM), unless otherwise indicated.
Caution about forward-looking information
Our MD&A includes statements and information about our expectations for the future. When we discuss our strategy, plans, future financial and operating performance, or other things that have not yet taken place, we are making statements considered to beforward-looking information orforward-looking statements under Canadian and United States (US) securities laws. We refer to them in this MD&A asforward-looking information.
Key things to understand about the forward-looking information in this MD&A:
| · | It typically includes words and phrases about the future, such as: anticipate, believe, estimate, expect, plan, will, intend, goal, target, forecast, project, strategy and outlook (see examples below). |
| · | It represents our current views, and can change significantly. |
| · | It is based on a number ofmaterial assumptions, including those we have listed on page 3, which may prove to be incorrect. |
| · | Actual results and events may be significantly different from what we currently expect, due to the risks associated with our business. We list a number of thesematerial risks on pages 2 and 3. We recommend you also review our most recent annual information form, which includes a discussion of othermaterial risks that could cause actual results to differ significantly from our current expectations. |
| · | Forward-looking information is designed to help you understand management’s current views of our near and longer term prospects, and it may not be appropriate for other purposes. We will not necessarily update this information unless we are required to by securities laws. |
Examples of forward-looking information in this MD&A
| · | our expectations about 2018 and future global uranium supply, consumption, demand, contracting volumes and number of reactors, including the discussion under the headingMarket overview and 2017 developments |
| · | the discussion under the headingOur strategy |
| · | our expectations for uranium deliveries in 2018 |
| · | the discussion of our expectations relating to our Canada Revenue Agency (CRA) transfer pricing dispute, including our estimate of the amount and timing of expected cash taxes and transfer pricing penalties |
| · | the discussion of our expectations relating to our dispute with Tokyo Electric Power Company Holdings, Inc. (TEPCO) |
| · | our expectations that we will recognize a gain in the first quarter of approximately $66 million on the change of Joint Venture Inkai LLP’s (JV Inkai) ownership interest |
| · | our consolidated outlook for the year and the outlook for our uranium and fuel services segments for 2018 |
| · | our expectations for future tax payments and rates, including effective tax rates |
| · | our price sensitivity analysis for our uranium segment |
| · | our expectation that existing cash balances and operating cash flows will meet our anticipated 2018 capital requirements |
| · | our expectations for 2018, 2019 and 2020 capital expenditures |
| · | our expectation that in 2018 we will be able to comply with all the covenants in our unsecured revolving credit facility |
| · | future plans and expectations for uranium properties, projects under evaluation, and fuel services operating sites |
| · | our expectations related to care and maintenance costs |
| · | our mineral reserve and resource estimates |
Material risks
| · | actual sales volumes or market prices for any of our products or services are lower than we expect for any reason, including changes in market prices, loss of market share to a competitor or trade restrictions |
| · | we are adversely affected by changes in currency exchange rates, interest rates, royalty rates, or tax rates |
| · | our production costs are higher than planned, or our cost reduction strategies are unsuccessful, or necessary supplies are not available, or not available on commercially reasonable terms |
| · | our estimates of production, purchases, costs, decommissioning, reclamation expenses, or our tax expense prove to be inaccurate |
| · | we are unable to enforce our legal rights under our existing agreements, permits or licences |
| · | we are subject to litigation or arbitration that has an adverse outcome, including lack of success in our dispute with CRA or with TEPCO |
| · | our estimate of the gain on the change in ownership interests for JV Inkai prove to be inaccurate |
| · | we are unsuccessful in our dispute with CRA and this results in significantly higher cash taxes, interest charges and penalties than the amount of our cumulative tax provision |
| · | we are unable to utilize letters of credit to the extent anticipated in our dispute with CRA |
| · | there are defects in, or challenges to, title to our properties |
| · | our mineral reserve and resource estimates are not reliable, or there are unexpected or challenging geological, hydrological or mining conditions |
| · | we are affected by environmental, safety and regulatory risks, including increased regulatory burdens or delays |
| · | necessary permits or approvals from government authorities cannot be obtained or maintained |
| · | we are affected by political risks |
| · | we are affected by terrorism, sabotage, blockades, civil unrest, social or political activism, accident or a deterioration in political support for, or demand for, nuclear energy |
| · | we are impacted by changes in the regulation or public perception of the safety of nuclear power plants, which adversely affect the construction of new plants, the relicensing of existing plants and the demand for uranium |
| 2 | CAMECO CORPORATION |
| · | government regulations or policies that adversely affect us, including tax and trade laws and policies |
| · | our uranium suppliers fail to fulfil delivery commitments or our uranium purchasers fail to fulfil purchase commitments |
| · | our McArthur River and/or Cigar Lake development, mining or production plans are delayed or do not succeed for any reason |
| · | any difficulties in resuming McArthur River production after the end of the production suspension including as a result of failure to reach a new collective agreement |
| · | any difficulties in milling of Cigar Lake ore at the McClean Lake mill or resuming production after the extended Cigar Lake shutdown scheduled for the third quarter |
| · | JV Inkai’s development, mining or production plans are delayed or do not succeed for any reason |
| · | our expectations relating to care and maintenance costs prove to be inaccurate |
| · | we are affected by natural phenomena, including inclement weather, fire, flood and earthquakes |
| · | our operations are disrupted due to problems with our own or our suppliers’ or customers’ facilities, the unavailability of reagents, equipment, operating parts and supplies critical to production, equipment failure, lack of tailings capacity, labour shortages, labour relations issues, strikes or lockouts, underground floods,cave-ins, ground movements, tailings dam failures, transportation disruptions or accidents, unanticipated consequences of our cost reduction strategies, or other development and operating risks |
Material assumptions
| · | our expectations regarding sales and purchase volumes and prices for uranium and fuel services, trade restrictions and that counterparties to our sales and purchase agreements will honour their commitments |
| · | our expectations regarding the demand for and supply of uranium |
| · | our expectations regarding spot prices and realized prices for uranium, and other factors discussed under the headingPrice sensitivity analysis: uranium segment |
| · | that the construction of new nuclear power plants and the relicensing of existing nuclear power plants not being more adversely affected than expected by changes in regulation or in the public perception of the safety of nuclear power plants |
| · | our ability to continue to supply our products and services in the expected quantities and at the expected times |
| · | our expected production level |
| · | our cost expectations, including production costs, purchase costs and the success of our cost reduction strategies |
| · | our expectations regarding tax rates and payments, royalty rates, currency exchange rates and interest rates |
| · | the accounting treatment for the change in ownership interests in JV Inkai is as expected |
| · | our expectations about the outcome of disputes with CRA and with TEPCO |
| · | we are able to utilize letters of credit to the extent anticipated in our dispute with CRA |
| · | our decommissioning and reclamation expenses |
| · | our mineral reserve and resource estimates, and the assumptions upon which they are based, are reliable |
| · | our understanding of the geological, hydrological and other conditions at our uranium properties |
| · | our McArthur River development, mining and production plans succeed, including the resumption of production after the end of the production suspension |
| · | our Cigar Lake development, mining and production plans succeed, including the resumption of production after the end of the extended shutdown scheduled for the third quarter |
| · | the McClean Lake mill is able to process Cigar Lake ore as expected |
| · | that care and maintenance costs will be as expected |
| · | our and our contractors’ ability to comply with current and future environmental, safety and other regulatory requirements, and to obtain and maintain required regulatory approvals |
| · | our operations are not significantly disrupted as a result of political instability, nationalization, terrorism, sabotage, blockades, civil unrest, breakdown, natural disasters, governmental or political actions, litigation or arbitration proceedings, the unavailability of reagents, equipment, operating parts and supplies critical to production, labour shortages, labour relations issues, strikes or lockouts, underground floods,cave-ins, ground movements, tailings dam failure, lack of tailings capacity, transportation disruptions or accidents, unanticipated consequences of our cost reduction strategies, or other development or operating risks |
| MANAGEMENT’S DISCUSSION AND ANALYSIS | 3 |
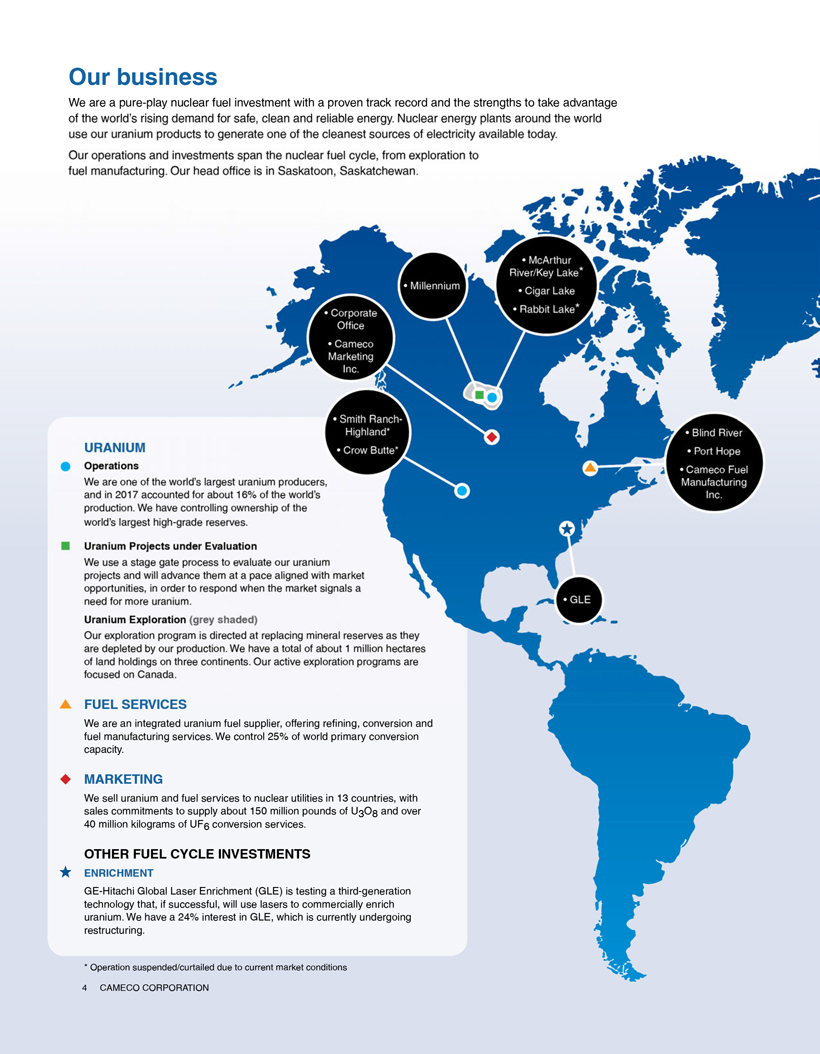
Our business
We are a pure-play nuclear fuel investment with a proven track record and the strengths to take advantage of the world’s rising demand for safe, clean and reliable energy. Nuclear energy plants around the world use our uranium products to generate one of the cleanest sources of electricity available today.
Our operations and investments span the nuclear fuel cycle, from exploration to fuel manufacturing. Our head office is in Saskatoon, Saskatchewan. c.
URANIUM
Operations
We are one of the world’s largest uranium producers, and in 2017 accounted for about 16% of the world’s production. We have controlling ownership of the world’s largest high-grade reserves.
Uranium Projects under Evaluation
We use a stage gate process to evaluate our uranium projects and will advance them at a pace aligned with market opportunities, in order to respond when the market signals a need for more uranium.
Uranium Exploration (grey shaded)
Our exploration program is directed at replacing mineral reserves as they are depleted by our production. We have a total of about 1 million hectares of land holdings on three continents. Our active exploration programs are focused on Canada.
FUEL SERVICES
We are an integrated uranium fuel supplier, offering refining, conversion and fuel manufacturing services. We control 25% of world primary conversion capacity.
MARKETING
We sell uranium and fuel services to nuclear utilities in 13 countries, with sales commitments to supply about 150 million pounds of U3O8 and over 40 million kilograms of UFg conversion services.
OTHER FUEL CYCLE INVESTMENTS
ENRICHMENT
GE-Hitachi Global Laser Enrichment (GLE) is testing a third-generation technology that, if successful, will use lasers to commercially enrich uranium. We have a 24% interest in GLE, which is currently undergoing restructuring.
McArthur River/Key Lake* Cigar Lake Rabbit Lake*
Millennium
Corporate Office Cameco Marketing Inc. Smith Ranch-Highland* Crow Butte*
GLE Blind River Port Hope Cameco Fuel Manufacturing Inc.
* Operation suspended/curtailed due to current market conditions
4 CAMECO CORPORATION
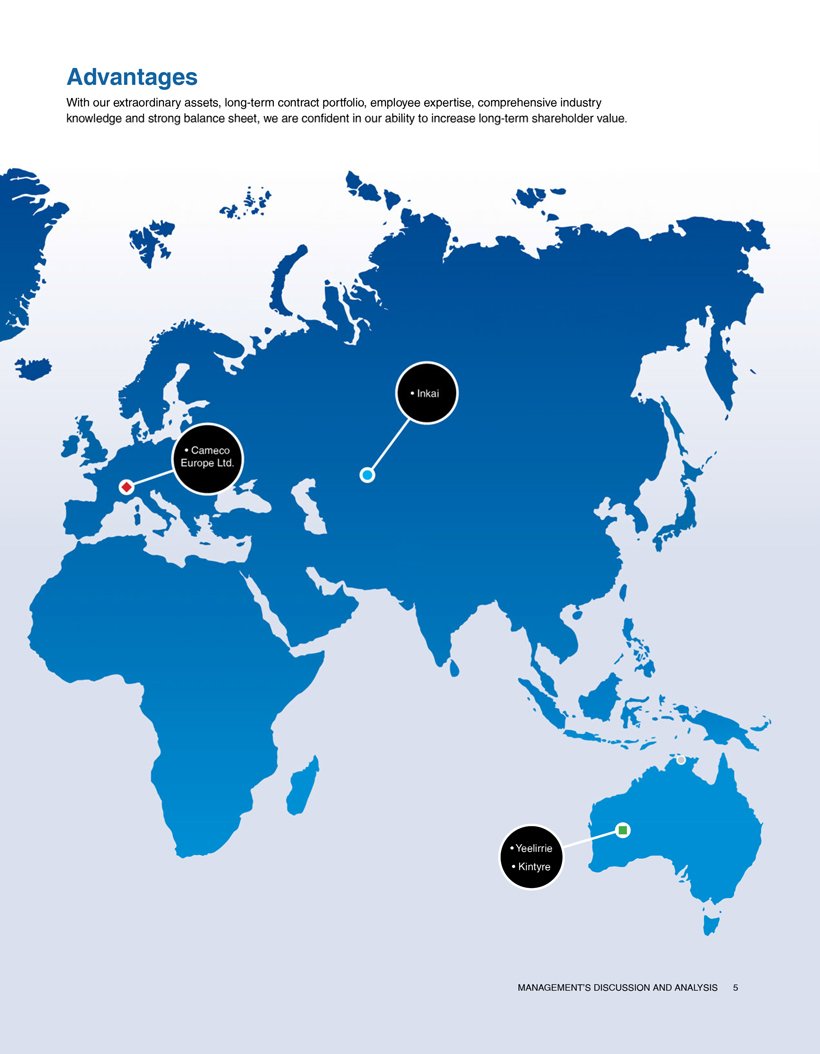
Advantages
With our extraordinary assets, long-term contract portfolio, employee expertise, comprehensive industry knowledge and strong balance sheet, we are confident in our ability to increase long-term shareholder value.
Cameco Europe Ltd. Inkai Yeelirrie Kintyre
MANACEMENT’S DISCUSSION AND ANALYSIS 5
2017 performance highlights
Our focus throughout 2017 continued to be on lowering our costs and improving efficiency amid ongoing difficult uranium market conditions. We continue to anticipate a market shift as demand increases in the form of restarts and new reactors, while current and future supply decreases through curtailments and lack of investment. However, until we see that shift emerge, we will continue to take the necessary actions intended to shield the company from the nearer-term risks we face and that we expect will reward shareholders for their continued patience and support of our strategy to build long-term value.
Financial performance
| HIGHLIGHTS | ||||||||||||
| DECEMBER 31 ($ MILLIONS EXCEPT WHERE INDICATED)
| 2017 | 2016 | CHANGE | |||||||||
Revenue
| 2,157 | 2,431 | (11)% | |||||||||
Gross profit
| 436 | 463 | (6)% | |||||||||
Net loss attributable to equity holders
|
| (205)
|
|
| (62)
|
|
| >(100%)
|
| |||
$ per common share (diluted)
|
| (0.52)
|
|
| (0.16)
|
|
| >(100%)
|
| |||
Adjusted net earnings(non-IFRS, see page 24)
| 59 | 143 | (59)% | |||||||||
$ per common share (adjusted and diluted)
| 0.15 | 0.36 | (58)% | |||||||||
Cash provided by operations (after working capital changes)
| 596 | 312 | 91% | |||||||||
Net loss attributable to equity holders (net loss) and adjusted net earnings were lower in 2017 compared to 2016,in-line with the outlook we provided. See2017 consolidated financial results beginning on page 23 for more information.
Our uranium segment continued to outperform the market
In our uranium segment, annual production was slightly below expectations as a result of both planned and unplanned reductions. Key highlights:
| ● | annual production of 23.8 million pounds—1% lower than the guidance provided in our 2017 third quarter MD&A |
| ● | quarterly production of 6.9 million pounds in the fourth quarter—3% lower than in 2016 due to the curtailment of production at the US operations, lower production at Inkai and from McArthur River/Key Lake |
| ● | achieved ramp up to full production at the Cigar Lake mine and Orano’s (formerly AREVA) McClean Lake mill |
| ● | closed the agreement with our partner Kazatomprom and JV Inkai to restructure and enhance JV Inkai |
| ● | successfully implemented operational changes at our mining operations resulting in capital and operating cost savings |
| ● | announced the temporary production suspension at McArthur River/Key Lake commencing in 2018 |
SeeOur operations and projectsbeginning on page 51 for more information.
Updates on our other segments and investments
Production in 2017 from our fuel services segment was 6% lower than in 2016, as planned, due to weak market conditions for conversion services.
In 2017, the Canadian Nuclear Safety Commission (CNSC) approved a10-year operating licence for Port Hope.
| 6 | CAMECO CORPORATION |
| HIGHLIGHTS
| 2017 | 2016 | CHANGE | |||||||||||||
| Uranium |
Production volume (million lbs)
| 23.8 | 27.0 |
| (12)%
|
| ||||||||||
Sales volume (million lbs)1
| 33.6 | 31.5 | 7% | |||||||||||||
Average realized price
| ($US/lb)
|
| 36.13
|
|
| 41.12
|
|
| (12)%
|
| ||||||
($Cdn/lb)
|
| 46.80
|
|
| 54.46
|
|
| (14)%
|
| |||||||
Revenue ($ millions)1
| 1,574 | 1,718 |
| (8)%
|
| |||||||||||
Gross profit ($ millions)
| 395 | 444 |
| (11)%
|
| |||||||||||
| Fuel services |
Production volume (million kgU)
| 7.9 | 8.4 |
| (6)%
|
| ||||||||||
Sales volume (million kgU)1
| 11.5 | 12.7 |
| (9)%
|
| |||||||||||
Average realized price
| ($Cdn/kgU) | 27.20 | 25.37 | 7% | ||||||||||||
Revenue ($ millions)1
| 313 | 321 |
| (2)%
|
| |||||||||||
Gross profit ($ millions)
| 64 | 63 | 2% | |||||||||||||
| NUKEM |
Sales volume U3O8 (million lbs)1
| 10.0 | 7.1 | 41% | ||||||||||||
Average realized price
| ($Cdn/lb) | 32.25 | 47.90 |
| (33)%
|
| ||||||||||
Revenue ($ millions)1
| 321 | 391 |
| (18)%
|
| |||||||||||
Gross loss ($ millions)2
|
| (15)
|
|
| (28)
|
|
| 46%
|
| |||||||
| 1 | Includes sales and revenue between our uranium, fuel services and NUKEM segments. Please see 2017 Financial results by segment beginning on page 41. |
| 2 | Gross loss includes net inventory write-downs of $9 million in 2017 and $18 million in 2016 due to a decline in the spot price during the year. |
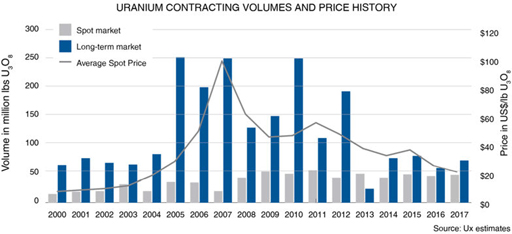
Industry prices
In 2017, the uranium spot price ranged from a high of $24.50 (US) per pound to a low of about $19 (US) per pound, averaging around $22 (US) for the year. Utilities continue to be well covered under existing contracts, and, given the current uncertainties in the market, we expect they and other market participants will continue to be opportunistic in their buying. As a result, contracting is expected to remain discretionary in 2018.
��
| 2017 | 2016 | CHANGE | ||||||||||||
Uranium($US/lb U3O8)1 | ||||||||||||||
Average annual spot market price
|
| 21.78
|
|
| 25.64
|
|
| (15)%
|
| |||||
Average annual long-term price
|
| 31.92
|
|
| 39.00
|
|
| (18)%
|
| |||||
Fuel services ($US/kgU as UF6)1
| ||||||||||||||
Average annual spot market price
| ||||||||||||||
North America
|
| 5.26
|
|
| 6.40
|
|
| (18)%
|
| |||||
Europe
|
| 5.69
|
|
| 6.91
|
|
| (18)%
|
| |||||
Average annual long-term price
| ||||||||||||||
North America
| 14.00 | 12.58 | 11% | |||||||||||
Europe | 14.04 | 13.56 | 4% | |||||||||||
Note: the industry does not publish UO2 prices. | ||||||||||||||
| 1 | Average of prices reported by TradeTech and Ux Consulting (Ux) |
Also of note
TEPCO contract dispute
On January 31, 2017, TEPCO confirmed that it would not accept a uranium delivery scheduled for February 1, 2017, and would not withdraw the contract termination notice it provided to Cameco Inc. on January 24, 2017 with respect to a uranium supply agreement between TEPCO and Cameco Inc. TEPCO alleged that an event of “force majeure” has occurred because it has been unable to operate its nuclear reactors for 18 consecutive months due to the Fukushima nuclear accident in March 2011 and the resulting government regulations. Cameco Inc. sees no basis for terminating the agreement and is pursuing all its legal rights and remedies against TEPCO.
| MANAGEMENT’S DISCUSSION AND ANALYSIS | 7 |
Under the agreement, TEPCO has already received and paid for 2.2 million pounds of uranium since 2014. The termination would affect approximately 9.3 million pounds of uranium deliveries through 2028, worth approximately $1.3 billion in revenue to Cameco, including about $126 million in each of 2017, 2018 and 2019 based on 855,000 pounds of deliveries in each of those years. All estimates and uranium volumes are provided on a consolidated basis for Cameco using expected contract prices and an exchange rate of $1.00 (US) for $1.30 (Cdn) and do not reflect any resale of the cancelled deliveries under the contract with TEPCO.
Three arbitrators have been appointed and based on the current schedule set by them, we expect the case will be heard in the first quarter of 2019. We are seeking $682 million (US) in damages plus interest and legal costs. The $682 million (US) primarily represents the present value of the remaining contracted volumes at the January 2017 contract price less the January 2017 market price of the equivalent volume of uranium concentrates.
The timing for a final decision will be dependent on how long the arbitrators deliberate following the conclusion of the hearing.
In this MD&A, our 2018 financial outlook and other disclosures relating to our contract portfolio are presented on a basis that excludes this agreement with TEPCO, which is under dispute.
JV Inkai restructuring
On December 11, 2017, we announced that the restructuring of JV Inkai outlined in the implementation agreement dated May 27, 2016 with Kazatomprom and JV Inkai closed and would take effect on January 1, 2018. Our ownership interest in JV Inkai is now 40% and Kazatomprom’s is 60%. As a result, we will account for JV Inkai on an equity basis commencing on January 1, 2018.
In addition, we will recognize a gain on the change in ownership interests of approximately $66 million. The resulting gain on restructuring will be reflected in our financial results for the first quarter.
SHARES AND STOCK OPTIONS OUTSTANDING
At February 7, 2018, we had:
● 395,792,732 common shares and one Class B share outstanding
● 8,322,866 stock options outstanding, with exercise prices ranging from $14.70 to $39.53
|
DIVIDEND
In 2017, our board of directors reduced the planned dividend to $0.08 per common share to be paid annually. The decision to declare a dividend by our board will be based on our cash flow, financial position, strategy and other relevant factors including appropriate alignment with the cyclical nature of our earnings. |
| 8 | CAMECO CORPORATION |
Market overview and 2017 developments
Cautiously optimistic
Despite the ongoing market challenges in 2017, we remain cautiously optimistic. We are cautious because we continue to face difficult market conditions and have seen a reduction in global demand expectations, driven by early reactor retirements, delays in reactor construction programs and by changes in governments that have created additional uncertainty for the nuclear industry. At the same time, the industry continues to work its way through supply that was incented during previous price runs. However, we are optimistic because today’s uranium prices are too low to motivate even some of the lowest-cost, profit-driven producers to maintain existing production, let alone invest in new projects that we believe will be required to ensure adequate uranium production is in the market. Additional uranium supply will be needed to support the reactor construction programs currently underway but not yet consuming uranium, the return of idled reactors to the grid, and to satisfy utilities uncovered requirements.
2017: A STORY OF OVERSUPPLY
In 2017, excess uranium supply continued to have a significant impact on the uranium market. Abundant spot material was available to satisfy utilities’ appetite forlow-priced pounds to meet near- tomid-term requirements.
Secondary supplies, consisting largely of government inventories, enricher underfeeding and tailsre-enrichment, where the economics differ considerably from mined production, have been a significant contributor to the supply-demand imbalance in the market. In addition, supply from some producers, whose production decisions are not necessarily driven by the economics of the uranium market, such as large diversified miners and companies mining uranium for strategic or social purposes, has been a contributor to the imbalance. Finally, higher-cost production, though sensitive to the uranium price, continues to be supported by higher prices under long-term contracts and/or advantageous foreign exchange rates. However, in 2017, we started to see evidence that at today’s low uranium prices, not only is some of the higher cost production at risk, even the lowest-cost production faces planned and unplanned risks.
These industry dynamics make it difficult to predict the timing of a market recovery. However, given that Ux Consulting Company, LLC (UxC) reports that over the last five years only 320 million pounds have beenlocked-up in the long-term market, while over 788 million pounds have been consumed in reactors, we remain confident that utilities have a growing gap to fill. As annual supply adjusts and utilities’ annual uncovered requirements grow, we believe the pounds available in the spot market won’t be enough to satisfy demand in the long run.
OPPORTUNITIES FOR THOSE WHO CAN WAIT
MANAGEMENT’S DISCUSSION AND ANALYSIS 9
Like other commodities, the uranium industry is cyclical and the low level of contracting at low prices that we’re seeing today is not new. When prices are low, there is no urgency to contract. The heavy contracting that took place during the previous price run, which drove investment in higher-cost sources of production, contributes to the perception that uranium is abundant and always will be. History demonstrates that the opposite tends to occur when prices rise. After years of low investment in supply, as has been the case so far this decade, security of supply tends to overtake price concerns at some point, and utilitiesre-enter the long-term market to ensure they have the reliable supply of uranium they need to run their reactors.
We believe the backlog of future contracting needs created by thelow-price environment presents a substantial opportunity for suppliers like us that can weather thelow-price part of the cycle. As alow-cost producer, we plan our business with these price cycles in mind.
In our industry, customers don’t come to the market right before they need to load uranium into their reactors. To operate a reactor that could run for more than 60 years, natural uranium and the downstream services have to be purchased years in advance, allowing time for a number of processing steps before it arrives at the power plant as a finished fuel bundle. At present, we believe there is a significant amount of uranium that needs to be contracted to keep reactors running into the next decade.
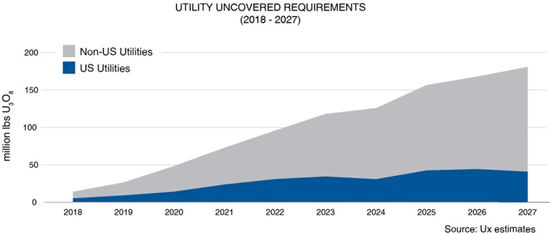
Estimates by industry consultants show cumulative uncovered requirements to be about 730 million pounds over the next ten years. While annual uncovered requirements do not ramp up significantly in the near-term, the longer the delay in the recovery of the long-term market, the less certainty there is around the availability of future supply to fill growing demand. Ultimately, we expect the current price-sensitive sentiment to give way to increasing concerns about the security of future supply.
SUPPLY IS NOT GUARANTEED
Economic difficulties are beginning to take a toll on the supply side. Not only is there a lack of investment in future supply – we are seeing evidence that existing supply is at risk. Higher-cost producers who have been protected from the low market prices under long-term contracts, are beginning to emerge from that protection, some cutting production, and others having to be recapitalized or seeking protection from bankruptcy. Even the lowest-cost producers are deciding to preserve long-term value by leaving uranium in the ground. Overall, based on a number of developments throughout the year, global production is expected to decrease:
| ● | In addition to the curtailments at Rabbit Lake and in the US in 2016, we announced our plan to temporarily suspend production at the McArthur River/Key Lake operation in 2018, removing 18 million pounds from the market. |
| ● | In November, Kazatomprom announced its 2017 uranium production in Kazakhstan would be about 58 million pounds, about 10% less than the nearly 64 million pounds produced in 2016, andin-line with the planned reduction target it announced in January of 2017. In December, it announced a 20% reduction in planned production for 2018 through 2020, which it indicated will result in production volumes similar to 2017. |
| ● | Paladin entered administration seeking to restructure and recapitalize due to its inability to meet its debt repayment obligations. |
| ● | Orano, who was recapitalized by the French government, announced plans to cut production at its Somair mine in Niger in 2018, and along with us, agreed to the temporary suspension of production at McArthur River/Key Lake in 2018. |
| 10 | CAMECO CORPORATION |
| ● | Multiple US ISR projects announced output reductions in 2018. |
| ● | In 2017, reports regarding production at the Husab mine in Namibia continued to raise uncertainty about the timing and even the possibility of reaching name-plate capacity of 15 million pounds annually. |
| ● | In the conversion space, earlier in the year, Honeywell announced a capacity reduction, which was followed by an announcement at the end of the year of its plans to temporarily idle its Metropolis site until business conditions improve. |
Coupled with looming uncovered requirements, we expect the risks to future and existing supply could decrease the availability of spot material and increase the pressure for a return to long-term contracting.
DEMAND SIDE DEVELOPMENTS
There was mixed news for the broader nuclear industry in 2017. On a regional demand basis, some of the more significant positive and negative developments were:
| ● | As part of Bruce Power’s commitment to refurbish its CANDU reactors, in 2017 Bruce Power signed an agreement worth approximately $2 billion with us to extend its fuel supply agreement to 2030. |
| ● | The US division of Westinghouse Electric Company declared bankruptcy, ultimately resulting in the pending abandonment of the two V.C. Summer units under construction in South Carolina. However, completion of the Vogtle units in Georgia was approved. |
| ● | Several additional early reactor retirements were announced in the US due to high costs. However, efforts are being made in several states to enact incentives to support the continued operation of nuclear plants, an issue that has also been taken up at the federal level. |
| ● | In January 2018, two US uranium producers put forward a petition under Section 232 of the Trade Expansion Act due to pressures from state-sponsored (Russia, Kazakhstan, Uzbekistan and China) imports. The petition aims to have 25% of US nuclear reactor requirements sourced from the US and a Buy America policy for US government agencies. Currently less than 5% of US requirements are met by US uranium producers. |
| ● | China continued to face challenges from excess capacity in the energy sector andfirst-of-a-kind reactor delays on its AP1000 and EPR reactors. However, with Xi Jinping continuing as President of China we believe China will continue with its nuclear growth ambitions. A recent report quotes a Bloomberg analyst who anticipates that nuclear installed capacity could increase tenfold between 2016 and 2050 to over 300 GW in China. |
| ● | South Korea’s new government announced its plan tophase-out nuclear power. However, a public panel voted in favour of completing the two reactors under construction that the government had previously suspended. |
| ● | In France, the new government reaffirmed its commitment to reduce its reliance on nuclear by 2025, but later acknowledged that target as unrealistic, postponing the reduction until the 2030 to 2035 timeframe. |
| ● | Construction on the first nuclear plants in Turkey and Bangladesh was started. |
| ● | Egypt signed a contract with Russia to build four reactors. |
| ● | Saudi Arabia is working to prequalify reactor vendors as it moves forward with plans for its first nuclear power plant, marking progress on its ambitions to install 17 gigawatts of nuclear capacity by 2040. |
While 2017 offered some progress in bringing supply and demand closer to equilibrium, uncertainty persists.
WHAT HAS TO CHANGE?
Ultimately, the industry needs to fill the demand gap left by forced and premature shut-downs since March of 2011 by continuing to safely bring reactors online. This means Japanese restarts, successful commissioning of new reactors under construction, and continued development of new construction plans. And we’re seeing positive progress on all fronts:
| ● | Japanese utilities have now successfully navigated through the new, rigorous safety inspection process, with the restart of five reactors and another four expected to restart in 2018. |
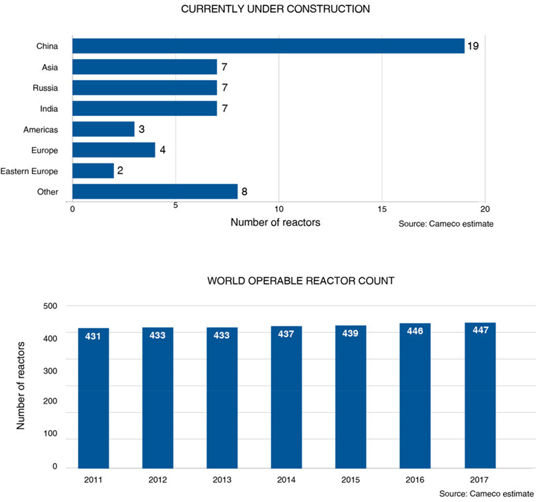
| ● | In 2017, there were four new reactors connected to the grid. Currently there are 57 reactors under construction around the world, the majority of which are expected to come online in the next three years, if startups occur as planned. |
| ● | There is a growing acknowledgment that adherence to global climate change goals requires a material dedication to allnon-emitting energy sources, including nuclear. The World Nuclear Associations target of 25% nuclear in 2050 is an example of this movement. Additionally, as a result of the closure of its nuclear plants, Germany has acknowledged that it will no longer be able to meet its climate goals despite its substantial rollout of renewable energy under the government’s policy. |
| MANAGEMENT’S DISCUSSION AND ANALYSIS | 11 |
Global population is on the rise, and with the world’s need for safe, clean, reliable baseload energy, nuclear remains an important part of the mix. We remain confident in the future of the nuclear industry, while at the same time recognizing that uncertainty persists.
With demand coming on in the form of restarts and new reactors, and supply declining on curtailments and lack of investment, we’re continuing to expect a market shift. Until that time, we will continue to take the actions we believe are necessary to position the company for long-term success. Therefore, we will undertake contracting activity which aligns with the uncertain timing of a market recovery and is intended to ensure we have adequate protection under our contract portfolio, while maintaining exposure to the rewards that come from having uncommitted,low-cost supply to deliver into a strengthening market.
| 12 | CAMECO CORPORATION |
Our strategy
Tier-one focus
Our strategy is set within the context of a challenging market environment, which we expect to give way to strong long-term fundamentals driven by increasing population, electricity demand and clean air concerns.
We are a pure-play nuclear fuel supplier, focused on taking advantage of the long-term growth we see coming in our industry, while maintaining the ability to respond to market conditions as they evolve. Our strategy is to focus on ourtier-one assets and profitably produce at a pace aligned with market signals in order to preserve the value of those assets and increase long-term shareholder value, and to do that with an emphasis on safety, people and the environment.
URANIUM
Uranium production is central to our strategy, as it is the biggest value driver of the nuclear fuel cycle and our business. In accordance with market conditions, and to mitigate risk, we will evaluate the optimal mix of our production, inventory and purchases in order to satisfy our contractual commitments and in order to return the best value possible. During a prolonged period of uncertainty, this could mean leaving our uranium in the ground. As conditions improve, we expect to meet rising demand with production from our best margin operations.
In light of today’s oversupplied market and the lingering uncertainty as to how long the weak market conditions will persist, we are focused on preserving the value of our lowest cost assets, on maintaining a strong balance sheet, on protecting and extending the value of our contract portfolio and on efficiently managing the company in a low price environment. We have undertaken a number of deliberate and disciplined actions. We have reduced supply, resisted selling into a weak spot market, restructured our global marketing organization, streamlined our operations and reduced costs. In 2017, these actions resulted in lower:
| ● | capital expenditures |
| ● | direct administration costs |
| ● | exploration costs |
| ● | uranium average unit cost of sales |
Consistent with these actions, we have reduced our planned 2018 annual dividend to $0.08 per share and it will be paid annually instead of quarterly. In addition, we are temporarily suspending production at our McArthur River/Key Lake operation, which we expect will remove 18 million pounds of uranium from the market in 2018. Although these actions will have a cost in the short-term, they are intended to position us to be able to self-manage the risks we face and ensure ourtier-one assets are available to us in a market that values them appropriately.
FUEL SERVICES
Our fuel services division is a source of profit and supports our uranium segment while allowing us to vertically integrate across the fuel cycle. Our focus is on maintaining and optimizing profitability.
ENRICHMENT
We continue to explore opportunities in the second largest value driver of the fuel cycle. Having operational control of both uranium production and enrichment facilities would offer operational synergies that could enhance profit margins.
NUKEM
In 2017, we made changes to the way our global marketing activities are organized. To betterco-ordinate our marketing activities and reduce costs, all future Canadian and international marketing activities have been consolidated in Saskatoon. These changes have a significant impact on the activities historically performed by NUKEM. We will continue to be active in the spot market when it makes sense for us and in support of our long-term contract portfolio. However, our marketing activities will now largely be undertaken by our new marketing entity, Cameco Marketing Inc., based out of Saskatoon.
Capital allocation – focus on value
Delivering returns to our long-term shareholders is a top priority. We continually evaluate our investment options to ensure we allocate our capital in a way that we believe will:
| ● | create the greatest long-term value for our shareholders |
| ● | allow us to maintain our investment-grade rating |
| ● | allow us to execute on our dividend while ensuring it is appropriately aligned with the cyclical nature of our earnings |
| MANAGEMENT’S DISCUSSION AND ANALYSIS | 13 |
To deliver value, free cash flow must be productively reinvested in the business or returned to shareholders, which requires good execution and disciplined allocation. We have a multidisciplinary capital allocation team that evaluates all possible uses of investable capital.
We start by determining how much cash we have to invest (investable capital), which is based on our expected cash flow from operations minus expenses we consider to be a higher priority, such as dividends and financing costs, and could include others. This investable capital can be reinvested in the company or returned to shareholders.
Amid the uncertain times we are facing today, the objective of our capital allocation is to maximize cash flow, while maintaining our investment-grade rating through close management of our balance sheet metrics, allowing us to self-manage risks. Risks like:
| ● | a market that remains low for longer |
| ● | litigation risk related to the CRA and TEPCO disputes |
| ● | refinancing risk |
With the metrics that inform an investment-grade rating in mind, and in this period of low uranium prices, we have taken steps to improve margin and cash flow by:
| ● | responsibly managing our sources of supply and preserving the value of ourtier-one assets |
| ● | restructuring our activities to reduce our operating, capital, and general and administrative spending |
| ● | reducing our planned annual dividend from $0.40 per share to $0.08 per share in 2018 |
REINVESTMENT
If a decision is made to reinvest capital in sustaining, capacity replacement, or growth, all opportunities are ranked and only those that meet the required risk-adjusted return criteria are considered for investment. We also must identify, at the corporate level, the expected impact on cash flow, earnings, and the balance sheet. All project risks must be identified, including the risks of not investing. Allocation of capital only occurs once an investment has cleared these hurdles.
This may result in some opportunities being held back in favour of higher return investments, and should allow us to generate the best return on investment decisions when faced with multiple prospects, while also controlling our costs. If there are not enough good investment prospects internally or externally, this may result in residual investable capital, which we would then consider returning directly to shareholders.
Given the weak uranium market, our focus for 2018 through 2020 is primarily on sustaining and capacity replacement capital to ensure we have the ability to meet our contractual commitments and to maintain optionality longer term. All growth capital has been curtailed.
RETURN
We believe in returning cash to shareholders, but are also focused on protecting the company and rewarding those shareholders who understand and support our strategy to build long-term value. If we determine the best use of cash is to return it to shareholders, we can do that through a share repurchase or dividend—an annual dividend,one-time supplemental dividend or a progressive dividend. When deciding between these options, we consider a number of factors, including generation of excess cash, growth prospects for the company, growth prospects for the industry, and the nature of the excess cash.
Share buyback: If we were generating excess cash while there were few or no growth prospects for the company or the industry, then a share buyback might make sense. However, our current view is that the long-term fundamentals for Cameco and the industry remain strong.
Dividend: The amount and type of dividend paid, annual, progressive orone-time supplemental is evaluated by our board of directors with careful consideration of our cash flow, financial position, strategy, and other relevant factors including appropriate alignment with the cyclical nature of our earnings.
| 14 | CAMECO CORPORATION |
Marketing strategy – balanced contract portfolio
As with our corporate strategy and approach to capital allocation, the purpose of our marketing strategy is to deliver value. Our approach is to secure a solid base of earnings and cash flow by maintaining a balanced contract portfolio that optimizes our realized price.
Uranium is not traded in meaningful quantities on a commodity exchange. Utilities have historically bought the majority of their uranium and fuel services products under long-term contracts with suppliers, and have met the rest of their needs on the spot market. We sell uranium and fuel services directly to nuclear utilities around the world as uranium concentrates, UO2 and UF6, conversion services, or fuel fabrication. We have a solid portfolio of long-term sales contracts that reflect the long-term, trusting relationships we have with our customers.
In accordance with market conditions, and to mitigate risk, we evaluate the optimal mix of our production, inventory and purchases in order to satisfy our contractual commitments and in order to return the best value possible. During a prolonged period of uncertainty, this could mean leaving our uranium in the ground.
In general, we are always active in the market, buying and selling uranium when it is beneficial for us and in support of our long-term contract portfolio. We undertake activity in the spot and term markets prudently, looking at the prices and other business factors to decide whether it is appropriate to purchase or sell into the spot or term market. Not only is this activity a source of profit, it gives us insight into underlying market fundamentals.
In particular, in 2018, in addition to our purchase commitments, we intend to be active buyers in the spot market. This activity may mean we give up some margin in the near-term, however, we believe it will provide us with the supply flexibility we need to meet our sales commitments and will allow us to preserve the value of ourtier-one assets. Our goal is to protect and extend the value of our contract portfolio on terms that recognize the value of our assets and are consistent with our marketing strategy – providing adequate protection when prices go down and allow us to benefit when prices rise.
LONG-TERM CONTRACTING
We deliver large volumes of uranium every year, therefore our net earnings and operating cash flows are affected by changes in the uranium price. Market prices are influenced by the fundamentals of supply and demand, geopolitical events, disruptions in planned supply and demand, and other market factors.
The objectives of our contracting strategy are to:
| ● | maximize realized price while reducing volatility of our future earnings and cash flow |
| ● | focus on meeting the nuclear industry’s growing annual uncovered requirements with our future uncommitted supply while ensuring adequate regional diversity |
| ● | establish and grow market share with strategic customers |
We target a ratio of 40% fixed-pricing and 60% market-related pricing in our portfolio of long-term contracts, including mechanisms to protect us when the market price is declining and allow us to benefit when market prices go up. This is a balanced and flexible approach that allows us to adapt to market conditions and put a floor on our average realized price, and deliver the best value to shareholders over the long term.
This strategy has allowed us to realize prices higher than the market prices during periods of weak uranium demand, and we expect it will enable us to realize increases linked to higher market prices in the future.
Fixed-price contracts for uranium: are typically based on a term-price indicator at the time the contract is accepted and escalated over the term of the contract.
Market-related contracts for uranium: are different from fixed-price contracts in that they may be based on either the spot price or the long-term price, and that price is as quoted at the time of delivery rather than at the time the contract is accepted. These contracts sometimes provide for discounts, and often include floor prices and/or ceiling prices, which are usually escalated over the term of the contract.
Fuel services contracts: the majority of our fuel services contracts are at a fixed price per kgU, escalated over the term of the contract, and reflect the market at the time the contract is accepted.
| MANAGEMENT’S DISCUSSION AND ANALYSIS | 15 |
OPTIMIZING THE CONTRACT PORTFOLIO
In today’s weak market environment, we have been working with certain customers to optimize the value of our existing contract portfolio. In cases where a customer is seeking relief due to a challenging policy, operating, or economic environment, we evaluate their specific circumstances and assess their long-term sustainability. Where we deem the customer’s long-term demand to be at risk, we may consider options that allow us to benefit from converting that uncertain future value into certain present value. In contrast, where the customer is considered to have a more certain and predictable future, we may offer relief, for example by blending in more market-related volumes in the near term, but only where the customer is willing to extend the terms and conditions of that contract out into the future, and only where it is beneficial to us.
CONTRACT PORTFOLIO STATUS
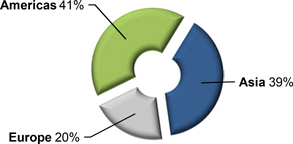
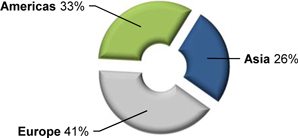
We have commitments to sell almost 150 million pounds of U3O8 with 39 customers worldwide in our uranium segment, and over 40 million kilograms as UF6 conversion with 31 customers worldwide in our fuel services segment. The annual average sales commitments over the next five years in our uranium segment is 22 million pounds, with commitment levels through 2020 higher than in 2021 and 2022.
Customers ��� U3O8:
Five largest customers account for 55% of commitments
COMMITTED U3O8SALES BY REGION
Customers – UF6 conversion:
Five largest customers account for 59% of commitments
COMMITTED UF6SALES BY REGION
MANAGING OUR CONTRACT COMMITMENTS
To meet our delivery commitments, we use our uranium supply, which includes uranium obtained from:
| ● | our existing production |
| ● | purchases under our JV Inkai agreement, under long-term agreements and in the spot market |
| ● | our existing inventory |
| 16 | CAMECO CORPORATION |
We allow sales volumes to varyyear-to-year depending on:
| ● | the level of sales commitments in our long-term contract portfolio |
| ● | our production volumes |
| ● | purchases under existing and/or new arrangements |
| ● | discretionary use of inventories |
| ● | market opportunities |
Focusing on cost efficiency
PRODUCTION COSTS
In order to operate efficiently and cost-effectively, we manage operating costs and improve plant reliability by prudently investing in production infrastructure, new technology, and business process improvements. Like all mining companies, our uranium segment is affected by the cost of inputs such as labour and fuel.
2017 URANIUM OPERATING COSTS BY CATEGORY
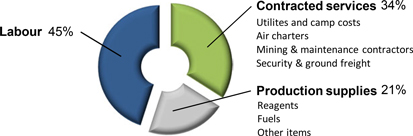
Operating costs in our fuel services segment are mainly fixed. In 2017, labour accounted for about 56% of the total. The largest variable operating cost is for zirconium, followed by energy (natural gas and electricity), maintenance supplies, and anhydrous hydrogen fluoride.
PURCHASES AND INVENTORY COSTS
Our costs are also affected by the purchases of uranium and conversion services we make under long-term contracts and on the spot market.
To meet our delivery commitments, we make use of our mined production and inventories, and we purchase material where it is beneficial to do so. The cost of purchased material may be higher or lower than our other sources of supply, depending on market conditions. The cost of purchased material affects our cost of sales, which is determined by calculating the average of all of our sources of supply, including opening inventory, production, and purchases.
FINANCIAL IMPACT
As greater certainty returns to the uranium market, based on our view that the market will transition from being supply-driven to being demand-driven, we expect uranium prices will rise to reflect the cost of bringing on new primary production to meet growing demand.
We believe the deliberate and disciplined actions we have taken to reduce supply, streamline operations and reduce costs will help shield the company from the nearer term risks we face and will reward shareholders for their continued patience and support of our strategy to build long-term value.
Committed to our values
Our values are at the core of everything we do and define who we are as a company.
SAFETY AND ENVIRONMENT
The safety of people and protection of the environment are the foundations of everything we do, locally and globally.
| MANAGEMENT’S DISCUSSION AND ANALYSIS | 17 |
PEOPLE
We value the contribution of every employee and demonstrate respect for individual dignity, creativity and cultural diversity.
INTEGRITY
We lead by example, earn trust, honour our commitments and conduct our business ethically.
EXCELLENCE
Through leadership, collaboration and innovation, we strive to achieve our full potential and inspire others to reach theirs.
Sustainable development: A key part of our strategy, reflecting our values
Social responsibility, safety of our workforce and the public, as well as environmental protection are top priorities for us. In fact, we have built our corporate objectives around them within our four measures of success: a safe, healthy and rewarding workplace, a clean environment, supportive communities, and outstanding financial performance. Sustainability is at the core of our company culture. It helps us:
| ● | build trust, credibility and corporate reputation |
| ● | gain and enhance community support for our operations and plans |
| ● | attract and retain employees |
| ● | manage risk |
| ● | drive innovation and continual improvement to build competitive advantage |
Given this, we have sustainable development principles and practices embedded throughout our organization, from our overall corporate strategy today-to-day operations.
Consequently, we recognize that changes in our operations and support functions, including the suspension of production at Rabbit Lake and curtailment at the US operations in 2016, the temporary suspension of production at our McArthur River/Key Lake operation in 2018, the reduction of the workforce at our northern Saskatchewan operations and at our corporate office, and the changes made to the way our global marketing activities are organized all have a significant impact on the communities where we operate. While we regret the negative impact that these carefully deliberated decisions have on affected employees and other stakeholders, these actions are deemed necessary for the long-term health of the company in a uranium market that continues to be weak and oversupplied. Improving operational efficiency is part of our strategy to effectively manage costs and remain competitive through these low times, while positioning the company and our stakeholders to benefit as the market improves.
SAFE, HEALTHY, REWARDING WORKPLACE
We are committed to living a strong safety culture, while looking to continually improve. As a result of this commitment, we have a long history of strong safety performance at our operations and across the organization.
2017 Highlights:
| ● | several operations reached significant safety milestones, including the Blind River refinery and the Crow Butte operation passing eleven and ten years respectively without a lost time incident |
| ● | continued low average dose of radiation to workers, including the Cigar Lake operation as it increased production to licensed capacity |
| ● | Port Hope conversion facility, Cameco Fuel Manufacturing and Key Lake made significant improvements in their safety performance over 2016 |
| ● | recognized for several top employer awards |
| ● | continued improvement of safety systems for support groups, such as exploration and corporate facilities |
A CLEAN ENVIRONMENT
We are committed to being a leading environmental performer. We strive to be a leader not only by complying with legal requirements, but also by keeping risks as low as reasonably achievable, and looking for opportunities to continually improve our performance.
We track our progress by monitoring the air, water and land near our operations, and by measuring the amount of energy we use and the amount of waste generated. We use this information to help identify opportunities to improve.
| 18 | CAMECO CORPORATION |
2017 Highlights:
| ● | brought Cigar Lake up to full production without exceeding an environmental limit or having a significant environmental incident |
| ● | while readying to implement the new version of the ISO 14001 standard, added Cameco Fuel Manufacturing to our corporate ISO 14001 certification, which now encompasses all Cameco operations |
| ● | completed the multi-year implementation of an environmental monitoring database for all Cameco operations |
| ● | continued efforts to reduce low level radioactive waste stored at our Fuel Services division facilities |
| ● | successfully managed an extended summer shutdown at Key Lake, McArthur River and Cigar Lake with no significant environmental incidents |
| ● | implemented new Canadian Standards Association (CSA) environmental standards at our Fuel Services Division facilities |
| ● | continued efforts to systematically improve energy conservation and efficiency in our Fuel Services and Saskatchewan facilities |
| ● | continued to carry out industry leading research and innovation in groundwater restoration at our US in situ recovery operations |
SUPPORTIVE COMMUNITIES
Gaining the trust and support of our communities, indigenous people, and governments is necessary to sustain our business. We earn support and trust through excellent safety and environmental performance, by proactively engaging our stakeholders in an open and transparent way, and by making a difference in communities wherever we operate. These efforts are critical to obtaining and maintaining the necessary regulatory approvals.
2017 Highlights:
| ● | over $170 million in procurement from locally owned northern Saskatchewan companies (80% of total) |
| ● | 954 local personnel from northern Saskatchewan (603 Cameco employees, 351 contractors) |
| ● | signed a Collaboration Agreement with the Lac La Ronge Indian Band |
| ● | for the first time in three years, we held a northern leaders roundtable – featuring nearly 50 northern Saskatchewan leaders, discussing the current uranium market |
OUTSTANDING FINANCIAL PERFORMANCE
Long-term financial stability and profitability are essential to our sustainability as a company. We believe that sound governance is the foundation for strong corporate performance.
2017 Highlights:
| ● | continue to achieve an average realized price that outperforms the market |
| ● | ranked 32nd out of 242 Canadian companies by Globe and Mail in governance practices |
Our governance practices
We believe that sound governance is the foundation for strong corporate performance. Our board of directors is responsible for overseeing management and our strategy and business affairs. Its goal is to ensure we operate as a successful business, optimizing financial returns while effectively managing risk.
In 2017, our board consisted of 11 directors who were selected based on their collective ability to contribute expertise to the broad range of issues the board faces when carrying out its responsibilities in overseeing our business and affairs.
WHAT WE DO:
| ● | Independent board – nine of our ten directors (90%) are independent |
| ● | Non-executive chair leads the board – we maintain separate chair and CEO positions and have had anon-executive, independent chair of the board since 2003 |
| ● | Share ownership – we require our directors and executives to own shares, or have an equity interest in Cameco to align their interests with those of our shareholders and share ownership is disclosed |
| ● | Majority voting for directors – the board adopted a majority voting policy in 2006 |
| MANAGEMENT’S DISCUSSION AND ANALYSIS | 19 |
| ● | Strong risk oversight – the board and committees oversee our risk management program and strategic, financial and operational risks |
| ● | Formal assessment process – the directors assess the board, committees and individual directors’ performance |
| ● | Independent third-party review – the director assessment process is augmented by a third-party review every three years |
| ● | Serving on other boards – we limit the number of other public company boards our directors can serve on, and serve on together |
| ● | Director recruitment and board succession – we have term limits and a retirement policy for directors |
| ● | Diverse board – our board has a diverse mix of skills, background and experience and 30% of this year’s director nominees are female |
| ● | Independent advice – board committees have full authority to retain independent advisors to help them carry out their duties and responsibilities |
| ● | Code of conduct and ethics – directors, officers and employees must comply with our code of conduct and confirm their compliance every year |
| ● | Long-standing shareholder engagement – we communicate openly with shareholders and other stakeholders |
| ● | Say on pay – we have held an advisory vote on our approach to executive compensation every year since 2010 |
More information about our shareholder commitment, our governance principles, how our board operates and profiles of each of our directors can be found in our most recent management proxy circular and on our website atcameco.com/about/board-of-directors.
MONITORING AND MEASUREMENT
We take the integration of sustainable development and measurement of our performance seriously. We have been producing a Sustainable Development (SD) Report since 2005, using the Global Reporting Initiative’s Sustainability Framework (GRI). It is our sustainability report card to our stakeholders. It tells them how we’re performing against globally recognized key indicators that measure our social, environmental and economic impacts in the areas that matter most to them. It provides information about our goals, where we’ve met, exceeded or struggled with them, and how we plan to do better. Our most recent SD Report was released in August, 2016. We produced a data update in 2017, with one more coming in 2018. Our next full report is tentatively scheduled for 2019.
All of our operating sites are ISO 14001 compliant. In addition, we have now transitioned from individual site-based ISO 14001 certifications to a single corporate certification. We have begun to roll our operations into this single certification.
Achievements
We are a five-time Gold award winner through the Progressive Aboriginal Relations program as judged by the Canadian Council for Aboriginal Business. We are also proud to have been named one of Canada’s Top 100 Employers, Saskatchewan’s Top Employers, Canada’s Best Diversity Employers, and Canada’s Top Employers for Young People for 2017. We are a leading employer of indigenous peoples in Canada, and have procured nearly $3.6 billion in services from local suppliers in northern Saskatchewan since 2004.
We encourage you to review our SD report atcameco.com/about/sustainability which outlines our commitment to people and the environment in more detail.
| 20 | CAMECO CORPORATION |
Measuring our results
Each year, we set corporate objectives that are aligned with our strategic plan. These objectives fall under our four measures of success, and performance against specific targets under these objectives forms the foundation for a portion of annual employee and executive compensation. See our most recent management proxy circular for more information on how executive compensation is determined.
2017 OBJECTIVES1 | TARGET | RESULTS | ||||
OUTSTANDING FINANCIAL PERFORMANCE | ||||||
| Earnings measure | Achieve targeted adjusted net earnings. | Did not achieve
| ● adjusted net earnings was below the minimum target | |||
| Cash flow measure | Achieve cash flow from operations (after working capital changes).
| Exceeded | ● cash flow from operations was above the target | |||
SAFE, HEALTHY AND REWARDING WORKPLACE | ||||||
| Workplace safety measure | Strive for no injuries at all Cameco-operated sites. Maintain a long-term downward trend in combined employee and contractor injury frequency and severity, and radiation doses.
| Did not achieve | ● injury rates did not meet the planned reduction target for the year
● average radiation doses remained low and stable
| |||
CLEAN ENVIRONMENT | ||||||
| Environmental performance measures | Achieve divisional environmental aspect improvement targets.
| Achieved | ● performance was within the targeted range
● there were no significant environmental incidents in 2017
| |||
SUPPORTIVE COMMUNITIES | ||||||
| Stakeholder support measure | Implement Collaboration Agreements by supporting northern business development opportunities and build corporate reputation.
| Exceeded | ● sourcing of northern services from Northern Saskatchewan vendors was above the target
| |||
| 1 | Detailed results for our 2017 corporate objectives and the related targets will be provided in our 2018 management proxy circular prior to our Annual Meeting of Shareholders on May 16, 2018. |
2018 objectives
OUTSTANDING FINANCIAL PERFORMANCE
|
● Achieve targeted adjusted net earnings and cash flow from operations.
|
|
SAFE, HEALTHY AND REWARDING WORKPLACE
|
● Improve workplace safety performance at all sites.
|
|
CLEAN ENVIRONMENT
|
● Improve environmental performance at all sites.
|
|
SUPPORTIVE COMMUNITIES
|
● Build and sustain strong stakeholder support for our activities.
|
| MANAGEMENT’S DISCUSSION AND ANALYSIS | 21 |
Financial results
This section of our MD&A discusses our performance, financial condition and outlook for the future.
23 |
2017 CONSOLIDATED FINANCIAL RESULTS | |||
| 34 | OUTLOOK FOR 2018 | |||
| 36 | LIQUIDITY AND CAPITAL RESOURCES | |||
| 41 | 2017 FINANCIAL RESULTS BY SEGMENT | |||
| 41 | URANIUM | |||
| 43 | FUEL SERVICES | |||
| 43 | NUKEM | |||
| 45 | FOURTH QUARTER FINANCIAL RESULTS | |||
| 45 | CONSOLIDATED RESULTS | |||
| 48 | URANIUM | |||
| 50 | FUEL SERVICES | |||
| 50 | NUKEM | |||
| 22 | CAMECO CORPORATION |
2017 consolidated financial results
In this MD&A, our 2018 financial outlook and other disclosures relating to our contract portfolio are presented on a basis which excludes the agreement with TEPCO, which is under dispute. SeeAlso of Note on page 7.
| HIGHLIGHTS | CHANGE FROM | |||||||||||||||
| DECEMBER 31 ($ MILLIONS EXCEPT WHERE INDICATED) | 2017 | 2016 | 2015 | 2016 TO 2017 | ||||||||||||
Revenue | 2,157 | 2,431 | 2,754 | (11)% | ||||||||||||
Gross profit | 436 | 463 | 697 | (6)% | ||||||||||||
Net earnings (loss) attributable to equity holders | (205 | ) | (62 | ) | 65 | >100% | ||||||||||
$ per common share (basic) | (0.52 | ) | (0.16 | ) | 0.16 | >100% | ||||||||||
$ per common share (diluted) | (0.52 | ) | (0.16 | ) | 0.16 | >100% | ||||||||||
Adjusted net earnings(non-IFRS, see page 24) | 59 | 143 | 344 | (59)% | ||||||||||||
$ per common share (adjusted and diluted) | 0.15 | 0.36 | 0.87 | (58)% | ||||||||||||
Cash provided by operations (after working capital changes) | 596 | 312 | 450 | 91% | ||||||||||||
Net earnings
Our net earnings normally trend with revenue, but, in recent years, have been significantly influenced by impairment charges due to the continued weakness in the uranium market.
The following table shows what contributed to the change in net earnings in 2017 compared to 2016 and 2015.
($ MILLIONS) | 2017 | 2016 | 2015 | |||||||||||
Net earnings (losses) - previous year | (62 | ) | 65 | 58 | ||||||||||
Change in gross profit by segment (we calculate gross profit by deducting from revenue the cost of products and services sold, and depreciation and amortization (D&A), net of hedging benefits) |
| |||||||||||||
| Uranium | Higher (lower) sales volume | 29 | (16 | ) | (27 | ) | ||||||||
| Lower realized prices ($US) | (222 | ) | (129 | ) | (76 | ) | ||||||||
| Foreign exchange impact on realized prices | (36 | ) | 30 | 245 | ||||||||||
| Lower (higher) costs | 180 | (49 | ) | (136 | ) | |||||||||
| change – uranium | (49 | ) | (164 | ) | 6 | |||||||||
| Fuel services | Lower sales volume | (5 | ) | (4 | ) | (5 | ) | |||||||
| Higher realized prices ($Cdn) | 21 | 25 | 50 | |||||||||||
| Higher costs | (15 | ) | (19 | ) | (22 | ) | ||||||||
| change – fuel services | 1 | 2 | 23 | |||||||||||
| NUKEM | Gross profit | 14 | (70 | ) | 20 | |||||||||
| change – NUKEM | 14 | (70 | ) | 20 | ||||||||||
Other changes | ||||||||||||||
Lower (higher) administration expenditures | 44 | (20 | ) | (10 | ) | |||||||||
Lower (higher) impairment charges | 4 | (147 | ) | 112 | ||||||||||
Lower (higher) exploration expenditures | 13 | (2 | ) | 6 | ||||||||||
Change in Rabbit Lake reclamation provision | (34 | ) | 34 | - | ||||||||||
Lower (higher) loss on disposal of assets | 16 | (21 | ) | 43 | ||||||||||
Change in gains or losses on derivatives | 22 | 315 | (160 | ) | ||||||||||
Change in foreign exchange gains or losses | (17 | ) | (65 | ) | 24 | |||||||||
Lower loss on equity-accounted investments | - | 1 | 16 | |||||||||||
Gain on customer contract settlements in 2016 | (59 | ) | 59 | - | ||||||||||
Contract termination fee (SFL) in 2014 | - | - | 18 | |||||||||||
Arbitration award in 2014 | - | - | (66 | ) | ||||||||||
Debenture redemption premium in 2014 | - | - | 12 | |||||||||||
Change in income tax recovery or expense | (91 | ) | (49 | ) | (32 | ) | ||||||||
Other | (7 | ) | - | (5 | ) | |||||||||
Net earnings (losses) – current year | (205 | ) | (62 | ) | 65 | |||||||||
| MANAGEMENT’S DISCUSSION AND ANALYSIS | 23 |
Impairment charges
In the third quarter, in line with the other disciplined actions we have taken, we made changes to the way our global marketing activities are organized. The changes significantly impact the marketing activities historically performed by NUKEM. As a result, we recognized an impairment charge for the full carrying value of goodwill of $111 million. See note 9 for more information.
During the fourth quarter we announced our plan to temporarily suspend production at the McArthur River/Key Lake operation in 2018. As a result, we havere-evaluated the project to complete the new calciner at Key Lake, which was undertaken to allow for increased production. Given the production suspension, current market conditions, and that we have determined the existing calciner has sufficient capacity to reliably meet our ongoing production requirements, it has been determined that no further investment will be made to complete the project. As a result, we have recognized an impairment charge related to the new calciner of $55 million. See note 8 for more information.
Also during the fourth quarter, we recorded a $184 million write down of our US assets. Due to the continued weakening of the uranium market and the reduction in mineral reserves, we concluded that it was appropriate to recognize an impairment charge for these assets. See note 8 to the financial statements.
Non-IFRS measures
ADJUSTED NET EARNINGS
Adjusted net earnings is a measure that does not have a standardized meaning or a consistent basis of calculation under IFRS(non-IFRS measure). We use this measure as a more meaningful way to compare our financial performance from period to period. We believe that, in addition to conventional measures prepared in accordance with IFRS, certain investors use this information to evaluate our performance. Adjusted net earnings is our net earnings attributable to equity holders, adjusted to better reflect the underlying financial performance for the reporting period. The adjusted earnings measure reflects the matching of the net benefits of our hedging program with the inflows of foreign currencies in the applicable reporting period, and is adjusted for NUKEM purchase price inventory recovery, impairment charges, Rabbit Lake reclamation provision adjustment, and income taxes on adjustments.
Adjusted net earnings isnon-standard supplemental information and should not be considered in isolation or as a substitute for financial information prepared according to accounting standards. Other companies may calculate this measure differently, so you may not be able to make a direct comparison to similar measures presented by other companies.
To facilitate a better understanding of these measures, the table below reconciles adjusted net earnings with our net earnings for the years ended 2017, 2016 and 2015.
| ($ MILLIONS) | 2017 | 2016 | 2015 | |||||||||
Net earnings (loss) attributable to equity holders | (205 | ) | (62 | ) | 65 | |||||||
Adjustments | ||||||||||||
Adjustments on derivatives | (108 | ) | (130 | ) | 166 | |||||||
NUKEM purchase price inventory recovery | - | (6 | ) | (3 | ) | |||||||
Impairment charges | 358 | 362 | 215 | |||||||||
Rabbit Lake reclamation provision adjustment | - | (34 | ) | - | ||||||||
Income taxes on adjustments | 14 | 13 | (99 | ) | ||||||||
Adjusted net earnings | 59 | 143 | 344 | |||||||||
| 24 | CAMECO CORPORATION |
The following table shows what contributed to the change in adjusted net earnings(non-IFRS measure, see above) in 2017 compared to the same period in 2016 and 2015.
| ($ MILLIONS) | 2017 | 2016 | 2015 | |||||||||||
Net earnings - previous year | 143 | 344 | 412 | |||||||||||
Change in gross profit by segment (we calculate gross profit by deducting from revenue the cost of products and services sold, and depreciation and amortization (D&A), net of hedging benefits) |
| |||||||||||||
Uranium | Higher (lower) sales volume | 29 | (16 | ) | (27 | ) | ||||||||
| Lower realized prices ($US) | (222 | ) | (129 | ) | (76 | ) | ||||||||
| Foreign exchange impact on realized prices | (36 | ) | 30 | 245 | ||||||||||
| Lower (higher) costs | 180 | (49 | ) | (136 | ) | |||||||||
change – uranium | (49 | ) | (164 | ) | 6 | |||||||||
Fuel services | Lower sales volume | (5 | ) | (4 | ) | (5 | ) | |||||||
| Higher realized prices ($Cdn) | 21 | 25 | 50 | |||||||||||
| Higher costs | (15 | ) | (19 | ) | (22 | ) | ||||||||
| change – fuel services | 1 | 2 | 23 | |||||||||||
NUKEM | Gross profit | 20 | (72 | ) | 22 | |||||||||
| change – NUKEM | 20 | (72 | ) | 22 | ||||||||||
Other changes | ||||||||||||||
Lower (higher) administration expenditures | 44 | (20 | ) | (10 | ) | |||||||||
Lower (higher) exploration expenditures | 13 | (2 | ) | 6 | ||||||||||
Lower (higher) loss on disposal of assets | 16 | (21 | ) | 1 | ||||||||||
Change in gains or losses on derivatives | 44 | 19 | (40 | ) | ||||||||||
Change in foreign exchange gains or losses | (17 | ) | (65 | ) | 25 | |||||||||
Lower loss on equity-accounted investments | - | - | 16 | |||||||||||
Gain on customer contract settlements in 2016 | (59 | ) | 59 | - | ||||||||||
Contract termination fee (SFL) in 2014 | - | - | 18 | |||||||||||
Arbitration award in 2014 | - | - | (66 | ) | ||||||||||
Debenture redemption premium in 2014 | - | - | 12 | |||||||||||
Change in income tax recovery or expense | (90 | ) | 63 | (76 | ) | |||||||||
Other | (7 | ) | - | (5 | ) | |||||||||
Net earnings - current year | 59 | 143 | 344 | |||||||||||
Average realized prices
| 2017 | 2016 | 2015 | CHANGE FROM 2016 TO 2017 | |||||||||||||||
Uranium1 | $US/lb | 36.13 | 41.12 | 45.19 | (12)% | |||||||||||||
| $Cdn/lb | 46.80 | 54.46 | 57.58 | (14)% | ||||||||||||||
Fuel services | $Cdn/kgU | 27.20 | 25.37 | 23.37 | 7% | |||||||||||||
NUKEM | $Cdn/lb | 32.25 | 47.90 | 48.82 | (33)% | |||||||||||||
| 1 | Average realized foreign exchange rate ($US/$Cdn): 2017 – 1.30, 2016 – 1.32 and 2015 – 1.27. |
| MANAGEMENT’S DISCUSSION AND ANALYSIS | 25 |
Revenue
The following table shows what contributed to the change in revenue for 2017.
| ($ MILLIONS) | ||||
Revenue – 2016 | 2,431 | |||
Uranium | ||||
Higher sales volume | 114 | |||
Lower realized prices ($Cdn) | (258 | ) | ||
Change in intersegment sales | (4 | ) | ||
Fuel services | ||||
Lower sales volume | (29 | ) | ||
Higher realized prices ($Cdn) | 21 | |||
Change in intersegment sales | 1 | |||
NUKEM | ||||
Change in revenue | (70 | ) | ||
Change in intersegment sales | (49 | ) | ||
Revenue – 2017 | 2,157 | |||
See 2017 Financial results by segment on page 41 for more detailed discussion.
THREE-YEAR TREND
In 2016, revenue decreased by 12% compared to 2015 due to lower sales revenues in all of our operating segments as a result of reduced sales volumes in response to market conditions. In addition, we had lower revenues in our uranium and NUKEM segments as a result of the lower US dollar average realized price which was due to lower prices on market-related contracts. This was partially offset by further weakening of the Canadian dollar exchange rate realized on sales during 2016. The realized foreign exchange rate was 1.32 compared to 1.27 in 2015.
In 2017, revenue decreased by 11% compared to 2016 due to a decrease in the uranium spot price, resulting in an overall lower average realized price. In addition, prices on fixed price contracts were lower. This was partially offset by an increase in sales volumes in our uranium segment.
Revenue Outlook for 2018
We expect consolidated revenue to decrease in 2018 (outlook of $1,800 million to $1,930 million), based on currently committed sales volumes, due to a decrease in average realized prices in our uranium segment as a result of lower prices under both fixed and market-related contracts and an expected decrease in sales volumes from NUKEM due to the restructuring of our marketing activities. In addition to our purchase and sales commitments, we will be active buying and selling uranium in the spot market if it makes sense for us. If we make additional sales with deliveries in 2018, we would expect our revenue outlook to increase.
In our uranium and fuel services segments, our customers choose when in the year to receive deliveries. As a result, our quarterly delivery patterns and, therefore, our sales volumes and revenue can vary significantly. We expect the quarterly distribution of uranium deliveries in 2018 to be weighted to the second half of the year as shown below. However, not all delivery notices have been received to date and the expected delivery pattern could change. Typically, we receive notices six months in advance of the requested delivery date.
| 26 | CAMECO CORPORATION |
ANNUAL DELIVERY VOLUME DISTRIBUTION QUARTER
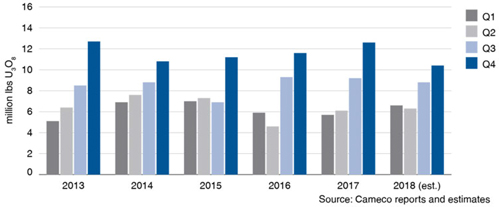
Corporate expenses
ADMINISTRATION
| ($ MILLIONS) | 2017 | 2016 | CHANGE | |||||||||
Direct administration | 151 | 195 | (23)% | |||||||||
Stock-based compensation | 12 | 12 | - | |||||||||
Total administration | 163 | 207 | (21)% | |||||||||
Direct administration costs in 2017 were $44 million lower than in 2016. The decrease was mainly due to higher costs in 2016 related to:
| · | one-time costs related to collaboration agreements |
| · | charges related to the consolidation of office space |
| · | legal costs as our CRA dispute progressed towards trial |
| · | restructuring of our NUKEM segment |
We recorded $12 million in stock-based compensation expenses in 2017 under our stock option, restricted share unit, deferred share unit, performance share unit and phantom stock option plans, the same as in 2016. See note 22 to the financial statements.
Administration outlook for 2018
We expect administration costs (not including stock-based compensation) to be between $120 million to $130 million, lower compared to 2017, due to the restructuring we completed in 2017, our continued actions to reduce costs and lower expected costs related to our CRA litigation.
EXPLORATION
Our 2017 exploration activities focused on Canada and Australia. Our spend decreased from $43 million in 2016 to $30 million in 2017.
Exploration outlook for 2018
We expect exploration expenses to be about $20 million in 2018 due to an overall decrease in activity on our regional exploration projects. The focus for 2018 will be on our core projects in Saskatchewan.
FINANCE COSTS
Finance costs were $111 million, largely unchanged from $112 million in 2016. See note 17 to the financial statements.
FINANCE INCOME
Finance income was $5 million compared to $4 million in 2016.
| MANAGEMENT’S DISCUSSION AND ANALYSIS | 27 |
GAINS AND LOSSES ON DERIVATIVES
In 2017, we recorded $56 million in gains on our derivatives compared to $34 million in 2016. The increase reflects more significant strengthening in the Canadian dollar compared to the US dollar in 2017 compared to 2016. SeeForeign exchange on page 32 and note 24 to the financial statements.
INCOME TAXES
We recorded an income tax recovery of $3 million in 2017 compared to a recovery of $94 million in 2016. The decrease in recovery was primarily due to the change in the distribution of earnings between jurisdictions compared to 2016. See note 19 to the financial statements.
In 2017, we recorded losses of $54 million in Canada compared to losses of $464 million in 2016, while earnings in foreign jurisdictions decreased to a loss of $154 million from earnings of $310 million. The tax rate in Canada is higher than the average of the rates in the foreign jurisdictions in which our subsidiaries operate.
On an adjusted earnings basis, we recognized a tax recovery of $17 million in 2017 compared to a recovery of $107 million in 2016. The table below presents our adjusted earnings and adjusted income tax expenses attributable to Canadian and foreign jurisdictions.
| ($ MILLIONS) | 2017 | 2016 | ||||||
Pre-tax adjusted earnings1 | ||||||||
Canada | (101 | ) | (504 | ) | ||||
Foreign | 143 | 542 | ||||||
Totalpre-tax adjusted earnings | 42 | 38 | ||||||
Adjusted income taxes1 | ||||||||
Canada | (27 | ) | (128 | ) | ||||
Foreign | 10 | 21 | ||||||
Adjusted income tax recovery | (17 | ) | (107 | ) | ||||
| 1 | Pre-tax adjusted earnings and adjusted income taxes arenon-IFRS measures. Our IFRS-based measures have been adjusted by the amounts reflected in the table in adjusted net earnings(non-IFRS measures on page 24). |
TRANSFER PRICING DISPUTES
We have been reporting on our transfer pricing disputes with CRA since 2008, when it originated, and with the IRS since the first quarter of 2015. We have now settled our IRS dispute related to the 2009 through 2012 tax years, and in the third quarter we paid $198,000 (US) comprised of $122,000 (US) taxes owing plus interest.
Below, we discuss the general nature of transfer pricing disputes and, more specifically, the ongoing dispute we have.
Transfer pricing is a complex area of tax law, and it is difficult to predict the outcome of cases like ours. However, tax authorities generally test two things:
| • | the governance (structure) of the corporate entities involved in the transactions |
| • | the price at which goods and services are sold by one member of a corporate group to another |
We have a global customer base and we established a marketing and trading structure involving foreign subsidiaries, including Cameco Europe Limited (CEL), which entered into various intercompany arrangements, including purchase and sale agreements, as well as uranium purchase and sale agreements with third parties. Cameco and its subsidiaries made reasonable efforts to putarm’s-length transfer pricing arrangements in place, and these arrangements expose the parties to the risks and rewards accruing to them under these contracts. The intercompany contract prices are generally comparable to those established in comparable contracts entered into betweenarm’s-length parties at that time.
For the years 2003 to 2011, CRA has shifted CEL’s income (as recalculated by CRA) back to Canada and applied statutory tax rates, interest and instalment penalties, and, from 2007 to 2011, transfer pricing penalties. Taxes of approximately $321 million for the 2003 – 2017 years have already been paid to date in a jurisdiction outside Canada, and we are considering our options under bilateral international tax treaties to limit double taxation of this income. There is a risk that we will not be successful in eliminating all potential double taxation. The expected income adjustments under our CRA tax dispute are represented by the amounts claimed by CRA and are described below.
| 28 | CAMECO CORPORATION |
CRA dispute
Since 2008, CRA has disputed our corporate structure and the related transfer pricing methodology we used for certain intercompany uranium sale and purchase agreements. To date, we received notices of reassessment for our 2003 through 2011 tax returns. We have recorded a cumulative tax provision of $61 million, where an argument could be made that, based on our methodology, our transfer price may have fallen outside of an appropriate range of pricing in uranium contracts for the period from 2003 through 2017. We are confident that we will be successful in our case and continue to believe the ultimate resolution of this matter will not be material to our financial position, results of operations and cash flows in the year(s) of resolution.
For the years 2003 through 2011, CRA issued notices of reassessment for approximately $4.1 billion of additional income for Canadian tax purposes, which would result in a related tax expense of about $1.2 billion. CRA has also issued notices of reassessment for transfer pricing penalties for the years 2007 through 2011 in the amount of $371 million. The Canadian income tax rules include provisions that require larger companies like us to remit or otherwise secure 50% of the cash tax plus related interest and penalties at the time of reassessment. To date, under these provisions, after applying elective deductions, we have remitted a net amount of $303 million in cash. In addition, we have provided $421 million in letters of credit (LC) to secure 50% of the cash taxes and related interest amounts reassessed after 2014. The amounts paid or secured are shown in the table below.
| YEAR PAID ($ MILLIONS) | CASH TAXES | INTEREST AND INSTALMENT PENALTIES | TRANSFER PRICING PENALTIES | TOTAL | CASH REMITTANCE | SECURED BY LC | ||||||||||||||||||
Prior to 2014 | 1 | 22 | 36 | 59 | 59 | - | ||||||||||||||||||
2014 | 106 | 47 | - | 153 | 153 | - | ||||||||||||||||||
2015 | 202 | 71 | 79 | 352 | 20 | 332 | ||||||||||||||||||
2016 | 51 | 38 | 31 | 120 | 32 | 88 | ||||||||||||||||||
2017 | - | 1 | 39 | 40 | 39 | 1 | ||||||||||||||||||
Total | 360 | 179 | 185 | 724 | 303 | 421 | ||||||||||||||||||
Using the methodology we believe CRA will continue to apply, and including the $4.1 billion already reassessed, we expect to receive notices of reassessment for a total of approximately $8.4 billion of additional income taxable in Canada for the years 2003 through 2017, which would result in a related tax expense of approximately $2.5 billion. As well, CRA may continue to apply transfer pricing penalties to taxation years subsequent to 2011. As a result, we estimate that cash taxes and transfer pricing penalties for these years would be between $1.95 billion and $2.15 billion. In addition, we estimate there would be interest and instalment penalties applied that would be material to us. While in dispute, we would be required to remit or otherwise provide security for 50% of the cash taxes and transfer pricing penalties (between $970 million and $1.07 billion), plus related interest and instalment penalties assessed, which would be material to us.
Under the Canadian federal and provincial tax rules, the amount required to be paid or secured each year will depend on the amount of income reassessed in that year and the availability of elective deductions and tax loss carryovers. CRA has decided to disallow the use of any loss carry-backs for any transfer pricing adjustment, starting with the 2008 tax year. This does not impact the anticipated income tax expense for a particular year, but does impact the timing of any required security or payment. As noted above, beginning with the 2010 tax year, as an alternative to remitting cash, we used letters of credit to satisfy our obligations related to the reassessed income tax and related interest amounts. We believe we will be able to continue to provide security in the form of letters of credit to satisfy these requirements. The estimated amounts summarized in the table below reflect actual amounts paid or secured and estimated future amounts owing based on the actual and expected reassessments for the years 2003 through 2017, and include the expected timing adjustment for the inability to use any loss carry-backs starting with the 2008 tax year. We plan to update this table annually to include the estimated impact of reassessments expected for completed years subsequent to 2017.
| MANAGEMENT’S DISCUSSION AND ANALYSIS | 29 |
| $ MILLIONS | 2003-2017 | 2018-2019 | 2020-2023 | TOTAL | ||||||||||||
50% of cash taxes and transfer pricing penalties paid, secured or owing in the period |
| |||||||||||||||
Cash payments | 226 | 65 - 90 | 120 - 145 | 410 - 460 | ||||||||||||
Secured by letters of credit | 319 | 10 - 35 | 230 - 255 | 560 - 610 | ||||||||||||
Total paid1 | 545 | 75 - 125 | 350 - 400 | 970 - 1070 | ||||||||||||
| 1 | These amounts do not include interest and instalment penalties, which totaled approximately $179 million to December 31, 2017. |
In light of our view of the likely outcome of the case as described above, we expect to recover the amounts remitted, including the $724 million already paid or otherwise secured to date.
We have spent a total of about $57 million disputing the CRA reassessments and presenting our appeal in Tax Court. This amount includes legal fees, expert witness fees, consultant fees, filing expenses, and other costs related to the case, from the time we started specifically tracking such costs in 2009, through 2017. The largest expenditures have been incurred in 2016 and 2017 during trial preparation and court proceedings. If the decision of the Tax Court is appealed, additional costs will be incurred.
The trial for the 2003, 2005 and 2006 tax years concluded on September 13, 2017 and we expect to receive a Tax Court decision within six to 18 months of that date. Once the decision is issued, the rules that apply to our case permit either party to appeal the Tax Court decision to the Federal Court of Appeal. The decision of the Federal Court of Appeal can be appealed to the Supreme Court of Canada, but only if the Supreme Court agrees to hear the appeal. An appeal of a Tax Court of Canada decision to the Federal Court of Appeal must be filed within 30 days after the issuance of a Tax Court decision (excluding the months of July and August). The request to appeal a decision of the Federal Court of Appeal to the Supreme Court of Canada must be made within 60 days of issuance of a Federal Court of Appeal decision.
In the event that either party appeals the Tax Court decision, we anticipate that it would take about two years from the date the Tax Court decision is issued to receive a decision from the Federal Court of Appeal. If a further appeal is pursued, it would likely take about two years from the date the Federal Court of Appeal decision is issued to receive a decision from the Supreme Court of Canada.
The total tax amount reassessed for the 2003, 2005 and 2006 tax years was $11 million, and we remitted 50% of such amount at the time the reassessments were issued. In certain circumstances, including where neither party pursues an appeal of the Tax Court decision, CRA would issue revised reassessments for the 2003, 2005 and 2006 tax years that comply with the Tax Court decision. Following those reassessments, the corresponding tax payments or refunds, as applicable, plus interest, would be made or received, as applicable, within a reasonable period. Where one or more appeals are pursued by either party, reassessments might not be issued until after the decision on the final appeal is received. If the Tax Court decision results in an aggregate tax amount in excess of what we have already remitted, and we pursue an appeal of that decision, we may be required to remit additional cash tax amounts not exceeding the remaining unpaid portion of the original $11 million (plus interest) while that appeal is underway. Where the Tax Court decision results in a refund of the remitted portion of the original $11 million (with interest), we may not receive that refund until and unless the Tax Court decision is confirmed after the final appeal.
Once the Tax Court has delivered a decision for the 2003, 2005 and 2006 tax years we will consider how the decision relates to other years in issue (being 2004 and years subsequent to 2006). While the decision would not be legally binding for any year other than the trial years, we expect the ultimate decision for the trial years to be an important factor in resolving the dispute for the other years in issue.
| 30 | CAMECO CORPORATION |
Caution about forward-looking information relating to our CRA tax dispute
This discussion of our expectations relating to our tax dispute with CRA and future tax reassessments by CRA is forward-looking information that is based upon the assumptions and subject to the material risks discussed under the heading Caution about forward-looking information beginning on page 2 and also on the more specific assumptions and risks listed below. Actual outcomes may vary significantly.
Assumptions
| · | CRA will reassess us for the years 2012 through 2017 using a similar methodology as for the years 2003 through 2011, and the reassessments will be issued on the basis we expect |
| · | we will be able to apply elective deductions and utilize letters of credit to the extent anticipated |
| · | CRA will seek to impose transfer pricing penalties (in a manner consistent with penalties charged in the years 2007 through 2011) in addition to interest charges and instalment penalties |
| · | we will be substantially successful in our dispute with CRA and the cumulative tax provision of $61 million to date will be adequate to satisfy any tax liability resulting from the outcome of the dispute to date |
Material risks that could cause actual results to differ materially
| · | CRA reassesses us for years 2012 through 2017 using a different methodology than for years 2003 through 2011, or we are unable to utilize elective deductions or letters of credit to the extent anticipated, resulting in the required cash payments or security provided to CRA pending the outcome of the dispute being higher than expected |
| · | the time lag for the reassessments for each year is different than we currently expect |
| · | we are unsuccessful and the outcome of our dispute with CRA results in significantly higher cash taxes, interest charges and penalties than the amount of our cumulative tax provision, which could have a material adverse effect on our liquidity, financial position, results of operations and cash flows |
| · | cash tax payable increases due to unanticipated adjustments by CRA not related to transfer pricing |
| · | we are unable to effectively eliminate all double taxation |
Tax outlook for 2018
On an adjusted net earnings basis, we expect a tax recovery of $40 to $50 million in 2018 as care and maintenance costs at our McArthur River/Key Lake operation will decrease earnings in Canada.
Our consolidated tax rate is a blend of the statutory rates applicable to taxable income earned or tax losses incurred in Canada and in our foreign subsidiaries. We have a global customer base and we have established a marketing and trading structure involving foreign subsidiaries, which entered into various intercompany purchase and sale arrangements, as well as uranium purchase and sale agreements with third parties. Cameco and its subsidiaries made reasonable efforts to putarm’s-length transfer pricing arrangements in place, and these arrangements expose the parties to the risks and rewards accruing to them under these contracts. The intercompany contract prices are generally comparable to those established in comparable contracts betweenarm’s-length parties entered into at that time. Beginning in 2016, many of the existing intercompany purchase and sale arrangements in our portfolio expired, and were replaced with new intercompany arrangements which reflect current market conditions. In addition, we recently changed our global marketing organization. The existing purchase and sale arrangements will continue to be in place until they expire. As the existing contracts expire, we anticipate that more income will be earned in Canada.
In 2019, we expect our consolidated tax rate will transition to a modest expense, and then, trend toward the Canadian statutory rate in the longer term. The actual effective tax rate will vary fromyear-to-year, primarily due to the actual distribution of earnings among jurisdictions and the market conditions at the time transactions occur under both our intercompany and third-party purchase and sale arrangements.
During December 2017, United States (US) tax reform legislation was substantively enacted. This new legislation will not result in a significant impact on our financial statements as we derecognized the amounts related to our US deferred tax asset in 2015. At that time, it was determined that it was no longer probable that there would be sufficient taxable profit in the future against which the US operating losses and other tax deductions could be used. The change in legislation does however, significantly reduce the value of our unrecognized US deferred tax assets due to the US tax rate decrease. In addition, we have alternative minimum tax credits of US $4,073,479 that will be refunded between 2018 and 2021.
| MANAGEMENT’S DISCUSSION AND ANALYSIS | 31 |
FOREIGN EXCHANGE
The exchange rate between the Canadian dollar and US dollar affects the financial results of our uranium and fuel services segments.
We sell the majority of our uranium and fuel services products under long-term sales contracts, which are routinely denominated in US dollars, while our production costs are largely denominated in Canadian dollars. To provide cash flow predictability we hedge a portion of our net US/Cdn exposure (e.g. total US dollar sales less US dollar expenditures and product purchases) to manage shorter term exchange rate volatility.
Our risk management policy is based on a60-month period and permits us to hedge 35% to 100% of our expected net exposure in the first 12 month period. Our normal practice is to layer in hedge contracts over a three- to four-year period with the hedge percentage being highest in the first 12 months and decreasing hedge percentages in subsequent years. The portion of our net exposure that remains unhedged is subject to prevailing market exchange rates for the period. Therefore, our results are affected by the movements in the exchange rate on our hedge portfolio (explained below), and on the unhedged portion of our net exposure. A weakening Canadian dollar would have a positive effect on the unhedged exposure, and a strengthening Canadian dollar would have a negative effect. SeeRevenue, adjusted net earnings, and cash flow sensitivity analysis on page 35 for more information on how a change in the exchange rate will impact our revenue, cash flow, adjusted net earnings (ANE), and gains and losses on derivatives, presented on an ANE basis.
Impact of hedging on IFRS earnings
We do not use hedge accounting under IFRS and, therefore, we are required to report gains and losses on all hedging activity, both for contracts that close in the period and those that remain outstanding at the end of the period. For the contracts that remain outstanding, we must treat them as though they were settled at the end of the reporting period(mark-to-market).
However, we do not believe the gains and losses that we are required to report under IFRS appropriately reflect the intent of our hedging activities, so we make adjustments in calculating our ANE to better reflect the benefits of our hedging program in the applicable reporting period.
Impact of hedging on ANE
We designate contracts for use in particular periods, based on our expected net exposure in that period. Hedge contracts are layered in over time based on this expected net exposure. The result is that our current hedge portfolio is made up of a number of contracts which are currently designated to net exposures we expect in 2018, 2019 and 2020 and we will recognize the gains or losses in ANE in those periods.
For the purposes of ANE, gains and losses on derivatives are reported based on the difference between the effective hedge rate of the contracts designated for use in the particular period and the exchange rate at the time of settlement. This results in an adjustment to current period IFRS earnings to effectively remove reported gains or losses on derivatives that arise from contracts put in place for use in future periods. The effective hedge rate will lag the market in periods of rapid currency movement. SeeNon-IFRS measures on page 24.
The table below provides a summary of our hedge portfolio at December 31, 2017. You can use this information to estimate the expected gains or losses on derivatives for 2018 on an ANE basis. However, if we add contracts to the portfolio that are designated for use in 2018 or if there are changes in the US/Cdn exchange rates in the year, those expected gains or losses could change.
| 32 | CAMECO CORPORATION |
HEDGE PORTFOLIO SUMMARY
| DECEMBER 31, 2017 ($ MILLIONS) | 2018 | AFTER 2018 | TOTAL | |||||||||||
US dollar forward contracts | ($ millions) | 390 | 195 | 585 | ||||||||||
Average contract rate1 | (US/Cdn dollar) | 1.30 | 1.28 | 1.30 | ||||||||||
US dollar option contracts | ($ millions) | 150 | 185 | 335 | ||||||||||
Average contract rate range1 | (US/Cdn dollar) | 1.27 to 1.31 | 1.26 to 1.31 | 1.26 to 1.31 | ||||||||||
Total US dollar hedge contracts | ($ millions) | 540 | 380 | 920 | ||||||||||
Effective hedge rate range2 | (US/Cdn dollar) | 1.23 to 1.25 | 1.26 to 1.28 | 1.24 to 1.26 | ||||||||||
Hedge ratio3 | 55% | 10% | 19% | |||||||||||
1The average contract rate is the weighted average of the rates stipulated in the outstanding contracts.
2The effective hedge rate is the exchange rate on the original hedge contract at the time it was established and designated for use. Therefore the effective hedge rate range shown reflects an average of contract exchange rates at the time of designation.
3 Hedge ratio is calculated by dividing the amount (in foreign currency) of outstanding derivative contracts by estimated future net exposures.
At December 31, 2017:
| ● | The value of the US dollar relative to the Canadian dollar was $1.00 (US) for $1.25 (Cdn), down from $1.00 (US) for $1.34 (Cdn) at December 31, 2016. The exchange rate averaged $1.00 (US) for $1.30 (Cdn) over the year. |
| ● | Themark-to-market position on all foreign exchange contracts was a $34 million gain compared to a $25 million loss at December 31, 2016. |
We manage counterparty risk associated with hedging by dealing with highly rated counterparties and limiting our exposure. At December 31, 2017, all of our hedging counterparties had a Standard & Poor’s (S&P) credit rating of A or better.
For information on the impact of foreign exchange on our intercompany balances, see note 24 to the financial statements.
| MANAGEMENT’S DISCUSSION AND ANALYSIS | 33 |
Outlook for 2018
Our strategy is to focus on ourtier-one assets and profitably produce at a pace aligned with market signals, in order to preserve the value of those assets and increase long-term shareholder value, and to do that with a focus on safety, people and the environment.
Our outlook for 2018 reflects the expenditures necessary to help us achieve our strategy and is based on the assumptions found below the table, including a given uranium spot price, uranium term price, and foreign exchange rate. For more information on how changes in the exchange rate or uranium prices can impact our outlook seeRevenue, adjusted net earnings, and cash flow sensitivity analysis on page 35, andForeign exchange on page 32.
Our 2018 financial outlook is presented on the basis of equity accounting for our minority ownership interest in JV Inkai. Under equity accounting, our share of the profits earned by JV Inkai on the sale of its production will be included in “income from equity-accounted investees” on our consolidated statement of earnings. Our share of production will be purchased at a discount to the spot price and included at this value in inventory. In addition, JV Inkai capital is not included in our outlook for capital expenditures. Please seeJV Inkai Planning for the future on page 67 andCapital spendingon page 37 for more details.
In addition, the financial outlook and other disclosures relating to our contract portfolio have been presented on a basis that excludes our contract with TEPCO, which is under dispute.
The changes made to the organization of our global marketing activities in 2017, consolidating of all future Canadian and international marketing activities in Saskatoon, had a significant impact on the activities historically performed by NUKEM. As a result, we will no longer provide outlook for NUKEM.
We do not provide an outlook for the items in the table that are marked with a dash.
See2017 Financial results by segment on page 41 for details.
2018 FINANCIAL OUTLOOK
| CONSOLIDATED | URANIUM | FUEL SERVICES | ||||||||||
EXPECTED CONTRIBUTION TO GROSS PROFIT
|
| 100%
|
|
| 85%
|
|
| 15%
|
| |||
Production (owned and operated properties)
|
| -
|
|
| 9.1 million lbs
|
|
| 9 to 10 million kgU
|
| |||
Purchases
|
| -
|
|
| 8 to 9 million lbs1
|
|
| -
|
| |||
Sales/delivery volume2
|
| -
|
|
| 32 to 33 million lbs3
|
|
| 11 to 12 million kgU
|
| |||
Revenue2
|
| $1,800-1,930 million
|
|
| $1,460-1,550 million4
|
|
| $280-310
|
| |||
Average realized price3
|
| -
|
|
| $46.30/lb4
|
|
| -
|
| |||
Average unit cost of sales (including D&A)
|
| -
|
|
| $38.00-40.00/lb5
|
|
| $21.60-22.60/kgU
|
| |||
Direct administration costs6
|
| $120-130 million
|
|
| -
|
|
| -
|
| |||
Exploration costs
|
| -
|
|
| $20 million
|
|
| -
|
| |||
Expected loss on derivatives - ANE basis4
|
| $0-10 million
|
|
| -
|
|
| -
|
| |||
Tax recovery - ANE basis7
|
| $40-50 million
|
|
| -
|
|
| -
|
| |||
Capital expenditures
|
| $90 million
|
|
| -
|
|
| -
|
| |||
| 1 | Based on the volumes we currently have commitments to acquire under contract in 2018. This includes our JV Inkai purchases. |
| 2 | Our 2018 outlook for sales volume and revenue does not include sales between our uranium, fuel services and NUKEM segments. |
| 3 | Based on the volumes we currently have commitments to deliver under contract in 2018. |
| 4 | Based on a uranium spot price of $22.00 (US) per pound (the Ux spot price as of January 31, 2018), a long-term price indicator of $30.00 (US) per pound (the Ux long-term indicator on January 31, 2018) and an exchange rate of $1.00 (US) for $1.25 (Cdn). |
| 5 | Based on the expected unit cost of sales for produced material and committed long-term purchases including our JV Inkai purchases. If we make discretionary purchases in 2018, then we expect the overall unit cost of sales may be affected. |
| 6 | Direct administration costs do not include stock-based compensation expenses. See page 27 for more information. |
| 7 | Our outlook for the tax recovery is based on adjusted net earnings and the other assumptions listed in the table. The outlook does not include our share of taxes on JV Inkai profits as the income from JV Inkai is net of taxes. If other assumptions change then the expected recovery may be affected. |
| 34 | CAMECO CORPORATION |
We now expect sales volumes for 2018 to be between 32 and 33 million pounds (previously 28 to 30 million pounds). The increase in our expected deliveries is primarily due to optimization of our contract portfolio, where we have brought forward deliveries into 2018.
REVENUE, ADJUSTED NET EARNINGS, AND CASH FLOW SENSITIVITY ANALYSIS
| IMPACT ON:
| ||||||||||||||
| FOR 2018 ($ MILLIONS)
| CHANGE
| REVENUE
| ANE
| CASH FLOW
| ||||||||||
Uranium spot and term price1 |
$5(US)/lb increase
| 54 | 32 | 42 | ||||||||||
$5(US)/lb decrease
| (53) | (31) | (41) | |||||||||||
Value of Canadian dollar vs US dollar |
One cent decrease in CAD
| 14 | 4 | 4 | ||||||||||
One cent increase in CAD
| (14) | (4) | (4) | |||||||||||
| 1 | Assuming change in both Ux spot price ($22.00 (US) per pound on January 31, 2018) and the Ux long-term price indicator ($30.00 (US) per pound on January 31, 2018). |
PRICE SENSITIVITY ANALYSIS: URANIUM SEGMENT
The following table is not a forecast of prices we expect to receive. The prices we actually realize will be different from the prices shown in the table. It is designed to indicate how the portfolio of long-term contracts we had in place on December 31, 2017 would respond to different spot prices. In other words, we would realize these prices only if the contract portfolio remained the same as it was on December 31, 2017, and none of the assumptions we list below change.
We intend to update this table each quarter in our MD&A to reflect deliveries made and changes to our contract portfolio. As a result, we expect the table to change from quarter to quarter.
Expected realized uranium price sensitivity under various spot price assumptions
(rounded to the nearest $1.00)
| SPOT PRICES ($US/lb U3O8)
| $20
| $40
| $60
| $80
| $100
| $120
| $140
| |||||||||||||||||||||
2019
|
|
33
|
|
|
43
|
|
|
55
|
|
|
65
|
|
|
74
|
|
|
81
|
|
|
87
|
| |||||||
2020
|
|
31
|
|
|
41
|
|
|
55
|
|
|
64
|
|
|
73
|
|
|
81
|
|
|
87
|
| |||||||
2021
|
|
28
|
|
|
41
|
|
|
55
|
|
|
66
|
|
|
75
|
|
|
84
|
|
|
93
|
| |||||||
2022
|
|
27
|
|
|
41
|
|
|
56
|
|
|
66
|
|
|
76
|
|
|
85
|
|
|
95
|
| |||||||
The table illustrates the mix of long-term contracts in our December 31, 2017 portfolio, and is consistent with our marketing strategy. It has been updated to reflect contracts entered into up to December 31, 2017.
Our portfolio includes a mix of fixed-price and market-related contracts, which we target at a 40:60 ratio. Those that are fixed at lower prices or have low ceiling prices will yield prices that are lower than current market prices.
Our portfolio is affected by more than just the spot price. We made the following assumptions (which are not forecasts) to create the table:
Sales
| · | sales volumes on average of 22 million pounds per year, with commitment levels in 2018 through 2020 higher than in 2021 and 2022 |
| · | excludes sales between our uranium, fuel services and NUKEM segments |
| · | excludes the contract under dispute with TEPCO |
Deliveries
| · | deliveries include best estimates of requirements contracts and contracts with volume flex provisions |
Annual inflation
| · | is 2% in the US |
Prices
| · | the average long-term price indicator is the same as the average spot price for the entire year (a simplified approach for this purpose only). Since 1996, the long-term price indicator has averaged 20% higher than the spot price. This differential has varied significantly. Assuming the long-term price is at a premium to spot, the prices in the table and graph will be higher. |
| MANAGEMENT’S DISCUSSION AND ANALYSIS | 35 |
Liquidity and capital resources
Our financial objective is to ensure we have the cash and debt capacity to fund our operating activities, investments and other financial obligations.
At the end of 2017, we had cash and short-term investments of $592 million, while our total debt amounted to $1.5 billion.
We have large, creditworthy customers that continue to need uranium even during weak economic conditions, and we expect the uranium contract portfolio we have built to continue to provide a solid revenue stream. Over the next five years, we have commitments to deliver an average of 22 million pounds per year, with commitments levels in 2018 through 2020 higher than in 2021 and 2022.
In the currently weak uranium price environment, our focus is on preserving the value of ourtier-one assets and reducing our operating, capital and general and administrative spending. We have a number of alternatives to fund future capital requirements, including using our operating cash flow, drawing on our existing credit facilities, entering new credit facilities, and raising additional capital through debt or equity financings. We are always considering our financing options so we can take advantage of favourable market conditions when they arise. Due to the deliberate cost reduction measures implemented over the past five years, the reduction in our 2018 dividend, and the temporary suspension of production at our McArthur River/Key Lake operation, we expect to generate significant cash flow in 2018. Therefore, we expect our cash balances and operating cash flows to meet our capital requirements during 2018, and will help position us to self-manage risk.
We have an ongoing transfer pricing dispute with CRA. See page 28 for more information. Until this dispute is resolved, we expect to pay cash or provide security in the form of letters of credit for future amounts owing to the Government of Canada for 50% of the cash taxes payable and the related interest and penalties. We have provided an estimate of the amount and timing of the expected cash taxes and transfer pricing penalties paid, secured or owing in the table on page 30.
FINANCIAL CONDITION
| 2017
| 2016
| |||||||
Cash position ($ millions) (cash and cash equivalents) | 592 | 320 | ||||||
Cash provided by operations ($ millions) (net cash flow generated by our operating activities after changes in working capital) | 596 | 312 | ||||||
Cash provided by operations/net debt (net debt is total consolidated debt, less cash position) | 66% | 27% | ||||||
Net debt/total capitalization (total capitalization is net debt and equity) | 16% | 18% | ||||||
CREDIT RATINGS
The credit ratings assigned to our securities by external ratings agencies are important to our ability to raise capital at competitive pricing to support our business operations. We remain focused on maintaining our investment-grade credit rating.
Third-party ratings for our commercial paper and senior debt as of February 7, 2018:
| SECURITY | DBRS
| S&P
| ||||||
Commercial paper
|
|
R-2 (high)
|
|
| A-21
|
| ||
Senior unsecured debentures
|
|
BBB (high)
|
|
| BBB1
|
| ||
Rating trend / rating outlook
|
|
Negative2
|
|
|
Negative3
|
| ||
| 1 | On February 24, 2017, S&P lowered its long term corporate credit rating from BBB+ to BBB and commercial paper toA-2. |
| 2 | On May 26, 2017, DBRS changed Cameco’s rating trend to negative from stable. |
| 3 | On November 14, 2017, S&P changed Cameco’s rating outlook to negative from stable. |
DBRS provides guidance for the outlook of the assigned rating using the rating trend. The rating trend represents their assessment of the likelihood and direction that the rating could change in the future, should present tendencies continue, or in some cases, if challenges are not overcome.
S&P uses rating outlooks to assess the potential direction of a long-term credit rating over the intermediate term. Their outlook indicates the likelihood that the rating could change in the future.
| 36 | CAMECO CORPORATION |
The rating agencies may revise or withdraw these ratings if they believe circumstances warrant. A change in our credit ratings could affect our cost of funding and our access to capital through the capital markets.
Liquidity
| ($ MILLIONS) | 2017
| 2016
| ||||||
Cash and cash equivalents at beginning of year | 320 | 459 | ||||||
Cash from operations | 596 | 312 | ||||||
Investment activities | ||||||||
Additions to property, plant and equipment and acquisitions | (114 | ) | (217 | ) | ||||
Other investing activities | 21 | (1 | ) | |||||
Financing activities | ||||||||
Interest paid | (69 | ) | (71 | ) | ||||
Dividends | (158 | ) | (158 | ) | ||||
Exchange rate on changes on foreign currency cash balances | (4 | ) | (4 | ) | ||||
Cash and cash equivalents at end of year | 592 | 320 | ||||||
CASH FROM OPERATIONS
Cash from operations was 91% higher than in 2016 due in part to a decrease in working capital requirements. This was a result of a decrease in inventory compared to an increase in 2016. Working capital required $156 million less in 2017. In addition, while we had lower gross profits in our operating segments, less cash was required by our hedge portfolio as derivative contracts matured and cost reduction measures resulted in a lower use of cash. Not including working capital requirements, our operating cash flows in the year were up $128 million. See note 21 to the financial statements.
INVESTING ACTIVITIES
Cash used in investing includes acquisitions and capital spending.
Capital spending
We classify capital spending as sustaining, capacity replacement or growth. As a mining company, sustaining capital is the money we spend to keep our facilities running in their present state, which would follow a gradually decreasing production curve, while capacity replacement capital is spent to maintain current production levels at those operations. Growth capital is money we invest to generate incremental production, and for business development.
| CAMECO’S SHARE ($ MILLIONS)
| 2017 PLAN1
| 2017 ACTUAL
| 2018 PLAN
| |||||||||
Sustaining capital | ||||||||||||
McArthur River/Key Lake
| 10 | 12 | 5 | |||||||||
Cigar Lake
| 10 | 10 | 20 | |||||||||
US ISR
| 5 | 3 | - | |||||||||
Inkai
| 10 | 8 | - | |||||||||
Fuel services
| 15 | 11 | 30 | |||||||||
Other
| 5 | 6 | - | |||||||||
Total sustaining capital
| 55 | 50 | 55 | |||||||||
Capacity replacement capital
| ||||||||||||
McArthur River/Key Lake
| 35 | 34 | - | |||||||||
Cigar Lake
| 35 | 30 | 35 | |||||||||
Inkai
| 15 | 12 | - | |||||||||
Total capacity replacement capital
| 85 | 76 | 35 | |||||||||
Growth capital
| ||||||||||||
McArthur River/Key Lake
| 10 | 10 | - | |||||||||
Cigar Lake
| 10 | 2 | - | |||||||||
Inkai
| - | 5 | - | |||||||||
Total growth capital
| 20 | 17 | - | |||||||||
Total uranium & fuel services
| 160 | 143 | 2 | 90 | ||||||||
JV Inkai (our 40% share)3
| - | - | 24 | |||||||||
| 1 | Capital spending outlook was updated to $175 million (from $190 million) in our second quarter MD&A and to $160 million (from $175 million) in our third quarter MD&A. |
| 2 | Total uranium & fuel services capital spending does not include adjustments for revenue from sales ofpre-commercial production from Inkai block 3. |
| 3 | Our share of JV Inkai capital spending for the 2018 plan is shown separately on the basis of equity accounting for our minority ownership interest. JV Inkai cash flows are expected to cover capital expenditures in 2018. |
MANAGEMENT’S DISCUSSION AND ANALYSIS 37
Outlook for investing activities
| CAMECO’S SHARE ($ MILLIONS)
| 2019 PLAN
| 2020 PLAN
| ||||||
Total uranium & fuel services
| 100-150 | 100-150 | ||||||
Sustaining capital
| 55-80 | 55-80 | ||||||
Capacity replacement capital
| 45-70 | 45-70 | ||||||
Growth capital
| - | - | ||||||
We expect total 2018 capital expenditures for uranium and fuel services to be about 37% lower than in 2017 mainly due to the temporary suspension of operations at McArthur River/Key Lake, and the removal of capital spend at JV Inkai which will now be reflected in our overall investment due to the change to equity accounting. Capital expenditures for JV Inkai are expected to be covered by JV Inkai cash flows in 2018.
Major sustaining and capacity replacement expenditures in 2018 include:
| ● | Fuel Services – ramp up of work on our Vision in Motion project |
| ● | Cigar Lake – work to expand freezing capacity and freeze hole drilling |
Our expectation of capital spend in 2019 has been reduced to between $100 million and $150 million (previously $200 million to $250 million) as a result of the operational changes that resulted in cost savings, and removal of JV Inkai capital.
This information regarding currently expected capital expenditures for future periods is forward-looking information, and is based upon the assumptions and subject to the material risks discussed on pages 2 and 3. Our actual capital expenditures for future periods may be significantly different.
FINANCING ACTIVITIES
Cash from financing includes borrowing and repaying debt, and other financial transactions including paying dividends and providing financial assurance.
Long-term contractual obligations
| DECEMBER 31 ($ MILLIONS)
| 2018
| 2019 AND
2020
| 2021 AND
2022
| 2023 AND
BEYOND
| TOTAL
| |||||||||||||||
Long-term debt
| - | 500 | 400 | 600 | 1,500 | |||||||||||||||
Interest on long-term debt
| 69 | 110 | 82 | 144 | 405 | |||||||||||||||
Provision for reclamation
| 37 | 88 | 99 | 828 | 1,052 | |||||||||||||||
Provision for waste disposal
| 2 | 2 | 4 | - | 8 | |||||||||||||||
Other liabilities
| - | - | - | 75 | 75 | |||||||||||||||
Capital commitments
| 23 | - | - | - | 23 | |||||||||||||||
Total
| 131 | 700 | 585 | 1,647 | 3,063 | |||||||||||||||
We have contractual capital commitments of approximately $23 million at December 31, 2017. Certain of the contractual commitments may contain cancellation clauses; however, we disclose the commitments based on management’s intent to fulfil the contracts.
We have unsecured lines of credit of about $2.8 billion, which include the following:
| ● | A $1.25 billion unsecured revolving credit facility that matures November 1, 2021. Each year on the anniversary date, and upon mutual agreement, the facility can be extended for an additional year. In addition to borrowing directly from this facility, we can use up to $100 million of it to issue letters of credit. We may increase the revolving credit facility above $1.25 billion, by increments of no less than $50 million, up to a total of $1.75 billion. The facility ranks equally with all of our other senior debt. At December 31, 2017, there were no amounts outstanding under this facility. |
| ● | At December 31, 2017, we had approximately $1.5 billion outstanding in letters of credit provided by various financial institutions. We use these facilities mainly to provide financial assurance for future decommissioning and reclamation of our operating sites, for our obligations relating to the CRA dispute, and as overdraft protection. |
| 38 | CAMECO CORPORATION |
In total we have $1.5 billion in senior unsecured debentures outstanding:
| ● | $500 million bearing interest at 5.67% per year, maturing on September 2, 2019 |
| ● | $400 million bearing interest at 3.75% per year, maturing on November 14, 2022 |
| ● | $500 million bearing interest at 4.19% per year, maturing on June 24, 2024 |
| ● | $100 million bearing interest at 5.09% per year, maturing on November 14, 2042 |
Debt covenants
Our revolving credit facility includes the following financial covenants:
| ● | our funded debt to tangible net worth ratio must be 1:1 or less |
| ● | other customary covenants and events of default |
Funded debt is total consolidated debt lessnon-recourse debt, $100 million in letters of credit, cash and short-term investments.
Not complying with any of these covenants could result in accelerated payment and termination of our revolving credit facility. At December 31, 2017, we complied with all covenants, and we expect to continue to comply in 2018.
OFF-BALANCE SHEET ARRANGEMENTS
We had three kinds ofoff-balance sheet arrangements at the end of 2017:
| ● | purchase commitments |
| ● | financial assurances |
| ● | other arrangements |
Purchase commitments
We make purchases under long-term contracts where it is beneficial for us to do so and in order to support our long-term contract portfolio. The following table is based on our purchase commitments in our uranium, fuel services and NUKEM segments at December 31, 2017 but does not include purchases of our share of Inkai production. These commitments include a mix of fixed-price and market-related contracts. Actual payments will be different as a result of changes to our purchase commitments and, in the case of contracts with market-related pricing, the market prices in effect at the time of delivery. We will update this table as required in our MD&A to reflect material changes to our purchase commitments and changes in the prices used to estimate our commitments under market-related contracts.
| DECEMBER 31, 2017 ($ MILLIONS) | 2018 | 2019 AND 2020 | 2021 AND 2022 | 2023 AND BEYOND | TOTAL | |||||||||||||||
Purchase commitments1 | 434 | 206 | 120 | 2 | 762 | |||||||||||||||
| 1 | Denominated in US dollars, converted to Canadian dollars at the rate of 1.25. |
As of December 31, 2017, we had committed to $762 million (Cdn) for the following:
| ● | approximately 19 million pounds of U3O8 equivalent from 2018 to 2024 |
| ● | approximately 2 million kgU as UF6 in conversion services in 2018 and 2019 |
| ● | about 0.3 million Separative Work Units (SWU) of enrichment services to meet existing forward sales commitments under agreements with anon-Western supplier |
The suppliers do not have the right to terminate agreements other than pursuant to customary events of default provisions.
Financial assurances
Standby letters of credit mainly provide financial assurance for the decommissioning and reclamation of our mining and conversion facilities as well as for our obligations relating to the CRA dispute. We are required to provide letters of credit to various regulatory agencies until decommissioning and reclamation activities are complete. We are also providing letters of credit until the CRA dispute is resolved. Letters of credit are issued by financial institutions for aone-year term. At December 31, 2017 our financial assurances totaled $1.5 billion unchanged from December 31, 2016.
| MANAGEMENT’S DISCUSSION AND ANALYSIS | 39 |
Other arrangements
We use factoring arrangements where receivables arising from certain sales contracts are sold to a financial institution. Upon the sale, we assign the rights to the accounts receivable to the financial institution without recourse. This arrangement provides immediate access to cash and requires we collect payment from our customers and remit the payments to the financial institution. Expenses incurred under the arrangement are recognized within finance costs in the consolidated statement of earnings.
In addition, we enter into arrangements with third parties where receivables arising from certain sales contracts are sold to financial institutions in exchange for cash. Upon the sale, we assign the rights to the accounts receivable to the financial institution without recourse. These arrangements require us to satisfy our delivery obligations under the sales contracts; however, the customer is responsible for making payment directly to the financial institution. The discount at which the financial institution purchases the receivable is offset against the revenue we record on delivery of the product to the customer.
BALANCE SHEET
| DECEMBER 31, 2017 ($ MILLIONS EXCEPT PER SHARE AMOUNTS) | 2017 | 2016 | 2015 | CHANGE 2016 TO 2017 | ||||||||||
Inventory | 950 | 1,288 | 1,285 | (26)% | ||||||||||
Total assets | 7,779 | 8,249 | 8,795 | (6)% | ||||||||||
Long-term financial liabilities | 2,448 | 2,459 | 2,500 | (0)% | ||||||||||
Dividends per common share | 0.40 | 0.40 | 0.40 | - | ||||||||||
Total product inventories decreased by 26% to $950 million this year due to sales being higher than the quantities produced and purchased during the year. In 2017, total volume of product inventories for the uranium segment decreased by 6% while the average cost of inventory decreased by 11% due to the addition of low cost produced material. This was somewhat offset by material purchased during the year at rates higher than the average cost of inventory. At December 31, 2017, our average cost for uranium was $30.72 per pound, down from $34.69 per pound at December 31, 2016. As of December 31, 2017, we held an inventory of 26.7 million pounds of U3O8 equivalent in our uranium segment (excluding broken ore).
At the end of 2017, our total assets amounted to $7.8 billion, a decrease of $0.5 billion compared to 2016, primarily due to a decrease in property, plant and equipment due to asset impairments. In 2016, the total asset balance decreased by $0.5 billion compared to 2015, also due to asset impairments.
The major components of long-term financial liabilities are long-term debt, the provision for reclamation, deferred sales and financial derivatives. Our balance did not change significantly in 2017 or 2016.
| 40 | CAMECO CORPORATION |
2017 financial results by segment
Uranium
| HIGHLIGHTS | 2017 | 2016 | CHANGE | |||||||||
Production volume (million lbs) | 23.8 | 27.0 | (12)% | |||||||||
Sales volume (million lbs)1 | 33.6 | 31.5 | 7% | |||||||||
Average spot price | ($US/lb) | 21.78 | 25.64 | (15)% | ||||||||
Average long-term price | ($US/lb) | 31.92 | 39.00 | (18)% | ||||||||
Average realized price | ($US/lb) | 36.13 | 41.12 | (12)% | ||||||||
| ($Cdn/lb) | 46.80 | 54.46 | (14)% | |||||||||
Average unit cost of sales (including D&A) | ($Cdn/lb) | 35.04 | 40.39 | (13)% | ||||||||
Revenue ($ millions)1 | 1,574 | 1,718 | (8)% | |||||||||
Gross profit ($ millions) | 395 | 444 | (11)% | |||||||||
Gross profit (%) | 25 | 26 | (4)% | |||||||||
| 1 | Includes sales and revenue between our uranium, fuel services and NUKEM segments (101,000 pounds in sales and revenue of $3.9 million in 2017, nil in 2016). |
Production volumes in 2017 decreased by 12% compared to 2016. Planned lower production from Inkai and our US operations, a lack of production from the suspended Rabbit Lake operation, and lower production from McArthur River/Key Lake due to calciner issues that delayed the mill restart following the extended summer shutdown and an unplanned calciner outage in October were partially offset by higher production from Cigar Lake as a result of the scheduled rampup of the operation. SeeUranium – production overview on page 55 for more information.
Uranium revenues this year were down 8% compared to 2016 due to a decrease of 14% in the Canadian dollar average realized price, partially offset by an increase in sales volumes of 7%. The spot price for uranium averaged $21.78 (US) per pound in 2017, a decline of 15% compared to the 2016 average price of $25.64 (US) per pound. In addition, overall prices were lower than the prior year as a result of lower prices under fixed price contracts.
Total cost of sales (including D&A) decreased by 7% ($1.18 billion compared to $1.27 billion in 2016) due to lower unit cost of sales partially offset by higher sales volumes. The lower unit cost of sales was mainly due to higher costs in 2016 at Rabbit Lake and our US operations associated with curtailing production and lower production costs this year as a result of theramp-up of production at Cigar Lake, and the other measures we have taken to reduce costs. The cost of our purchases have decreased as well.
The net effect was a $49 million decrease in gross profit for the year.
The following table shows the costs of produced and purchased uranium incurred in the reporting periods(non-IFRS measures, see below). These costs do not include selling costs such as royalties, transportation and commissions, nor do they reflect the impact of opening inventories on our reported cost of sales.
| ($CDN/LB) | 2017 | 2016 | CHANGE | |||||||
Produced | ||||||||||
Cash cost | 15.11 | 17.01 | (11)% | |||||||
Non-cash cost | 11.67 | 11.81 | (1)% | |||||||
Total production cost | 26.78 | 28.82 | (7)% | |||||||
Quantity produced (million lbs) | 23.8 | 27.0 | (12)% | |||||||
Purchased | ||||||||||
Cash cost | 37.19 | 49.33 | (25)% | |||||||
Quantity purchased (million lbs) | 6.1 | 8.4 | (27)% | |||||||
Totals | ||||||||||
Produced and purchased costs | 28.90 | 33.69 | (14)% | |||||||
Quantities produced and purchased (million lbs) | 29.9 | 35.4 | (16)% | |||||||
| MANAGEMENT’S DISCUSSION AND ANALYSIS | 41 |
The average cash cost of production was 11% lower in the year than in 2016. The change was primarily due to the rampup of lower cost production from Cigar Lake, and the impact of our actions in 2016 to curtail production from Rabbit Lake and our US operations, where production costs were higher.
Although purchased pounds are transacted in US dollars, we account for the purchases in Canadian dollars. In the year, the average cash cost of purchased material was $37.19 (Cdn), or $29.23 (US) per pound, compared to $36.21 (US) per pound in the same period in 2016.
Cash cost per pound,non-cash cost per pound and total cost per pound for produced and purchased uranium presented in the above table arenon-IFRS measures. These measures do not have a standardized meaning or a consistent basis of calculation under IFRS. We use these measures in our assessment of the performance of our uranium business. We believe that, in addition to conventional measures prepared in accordance with IFRS, certain investors use this information to evaluate our performance and ability to generate cash flow.
These measures arenon-standard supplemental information and should not be considered in isolation or as a substitute for measures of performance prepared according to accounting standards. These measures are not necessarily indicative of operating profit or cash flow from operations as determined under IFRS. Other companies may calculate these measures differently, so you may not be able to make a direct comparison to similar measures presented by other companies.
To facilitate a better understanding of these measures, the following table presents a reconciliation of these measures to our unit cost of sales for the years ended 2017 and 2016 as reported in our financial statements.
CASH AND TOTAL COST PER POUND RECONCILIATION
| ($ MILLIONS) | 2017 | 2016 | ||||||
Cost of product sold | 910.7 | 993.0 | ||||||
Add / (subtract) | ||||||||
Royalties | (66.6 | ) | (115.3 | ) | ||||
Other selling costs | (7.5 | ) | (8.9 | ) | ||||
Care and maintenance and severance costs | (38.3 | ) | (69.6 | ) | ||||
Change in inventories | (211.8 | ) | 74.5 | |||||
Cash operating costs (a) | 586.5 | 873.7 | ||||||
Add / (subtract) | ||||||||
Depreciation and amortization | 267.9 | 281.2 | ||||||
Change in inventories | 9.8 | 37.7 | ||||||
Total operating costs (b) | 864.2 | 1,192.6 | ||||||
Uranium produced & purchased (million lbs) (c) | 29.9 | 35.4 | ||||||
Cash costs per pound (a ÷ c) | 19.62 | 24.68 | ||||||
Total costs per pound (b ÷ c) | 28.90 | 33.69 | ||||||
URANIUM SEGMENT OUTLOOK
In November 2017 we announced our plan to temporarily suspend production at the McArthur River/Key Lake operation in 2018, and therefore, we expect to produce 9.1 million pounds in 2018. In addition, we have commitments under long-term contracts to purchase approximately 8 to 9 million pounds, including our purchases from JV Inkai. We anticipate an average purchase price of $34.70/lb, based on the uranium price and foreign exchange rate assumptions used in our outlook table on page 34.
Based on the contracts we have in place, and not including sales between our segments, we expect to deliver between 32 and 33 million pounds of U3O8 in 2018. We expect the unit cost of sales to be higher than in 2017 (outlook between $38.00/lb to $40.00/lb), primarily due to increased costs for care and maintenance associated with the temporary suspension of production at our McArthur River/Key Lake operation. If we make additional discretionary purchases in 2018 at a cost different than our other sources of supply, then we expect the overall unit cost of sales to be affected.
We expect revenue to be lower than in 2017 as a result of lower average realized price (outlook $1,460 million to $1,550 million).
| 42 | CAMECO CORPORATION |
ROYALTIES
We pay royalties on the sale of all uranium extracted at our mines in the province of Saskatchewan. Two types of royalties are paid:
| ● | Basic royalty: calculated as 5% of gross sales of uranium, less the Saskatchewan resource credit of 0.75%. |
| ● | Profit royalty: a 10% royalty is charged on profit up to and including $22.75/kg U3O8 ($10.26/lb) and a 15% royalty is charged on profit in excess of $22.75/kg U3O8. Profit is determined as revenue less certain operating, exploration, reclamation and capital costs. Both exploration and capital costs are deductible at the discretion of the producer. |
As a resource corporation in Saskatchewan, we also pay a corporate resource surcharge of 3% of the value of resource sales.
During the period from 2013 to 2015, transitional rules for the new profit royalty regime were applied whereby only 50% of capital costs were deductible. The remaining 50% was accumulated and was deductible beginning in 2016. In addition, the capital allowance related to Cigar Lake under the previous system was grandfathered and was also deductible beginning in 2016. The applicable profit royalty tier(s) will depend on both profitability and the optimal use of capital cost deductions.
Fuel services
(includes results for UF6, UO2 and fuel fabrication)
| HIGHLIGHTS | 2017 | 2016 | CHANGE | |||||||||
Production volume (million kgU) | 7.9 | 8.4 | (6)% | |||||||||
Sales volume (million kgU)1 | 11.5 | 12.7 | (9)% | |||||||||
Average realized price | ($Cdn/kgU) | 27.20 | 25.37 | 7% | ||||||||
Average unit cost of sales (including D&A) | ($Cdn/kgU) | 21.66 | 20.36 | 6% | ||||||||
Revenue ($ millions)1 | 313 | 321 | (2)% | |||||||||
Gross profit ($ millions) | 64 | 63 | 2% | |||||||||
Gross profit (%) | 20 | 20 | - | |||||||||
| 1 | Includes sales and revenue between our uranium, fuel services and NUKEM segments (60,000 kgU in sales and revenue of $0.3 million in 2017, 115,000 kgU in sales and revenue of $0.9 million in 2016). |
Total revenue decreased by 2% due to a 9% decrease in sales volumes, partially offset by a 7% increase in the realized price.
The total cost of products and services sold (including D&A) decreased by 3% compared to 2016 to $249 million, as a 9% decrease in sales volumes was partially offset by a 6% increase in the average unit cost of sales (including D&A). When compared to 2016, the average unit cost of sales was 6% higher due to the mix of fuel services products sold.
The net effect was a $1 million increase in gross profit.
FUEL SERVICES OUTLOOK
In 2018, we plan to produce 9 to 10 million kgU, and we expect sales volumes, not including intersegment sales, to be 11 to 12 million kgU. Overall revenue is expected to be lower than 2017 (outlook $280 million to $310 million) due to a lower anticipated average realized price. We expect the average unit cost of sales (including D&A) to increase to between $21.60/kgU and $22.60/kgU.
NUKEM
(financial results include U3O8, UF6, and SWU)
| HIGHLIGHTS | 2017 | 2016 | CHANGE | |||||||||
Sales volume U3O8 (million lbs)1 | 10.0 | 7.1 | 41% | |||||||||
Average realized price | ($Cdn/lb) | 32.25 | 47.90 | (33)% | ||||||||
Cost of product sold (including D&A) | 336 | 419 | (20)% | |||||||||
Revenue ($ millions)1 | 321 | 391 | (18)% | |||||||||
Gross profit (loss) ($ millions) | (15 | ) | (28 | ) | 46% | |||||||
Gross profit (loss) (%) | (5 | ) | (7 | ) | 29% | |||||||
| 1 | Includes sales and revenue between our uranium, fuel services and NUKEM segments (1.7 million pounds in sales and revenue of $49 million in 2017, 48,000 pounds in sales and revenue of $0.4 million in 2016). |
| MANAGEMENT’S DISCUSSION AND ANALYSIS | 43 |
During 2017, NUKEM delivered 10.0 million pounds of uranium, an increase of 2.9 million pounds compared to the previous year due to planned inventory reductions after the restructuring of Cameco’s global marketing activities. Revenues from NUKEM amounted to $321 million. Despite higher sales volumes, revenue decreased by 18% compared to 2016 as a result of a decline in the average realized price in the oversupplied uranium market. Gross loss percentage was 5% for 2017, compared to 7% for 2016.
The net effect was a $13 million increase in gross profit. Included in the 2017 gross loss is a $9 million net write-down of inventory compared to an $18 million write-down in 2016.
NUKEM OUTLOOK
The changes made to the organization of our global marketing activities in 2017, consolidating of all future Canadian and international marketing activities in Saskatoon, had a significant impact on the activities historically performed by NUKEM. As a result, we will no longer provide outlook for NUKEM.
| 44 | CAMECO CORPORATION |
Fourth quarter financial results
Consolidated results
| HIGHLIGHTS | THREE MONTHS ENDED DECEMBER 31 | |||||||||
| ($ MILLIONS EXCEPT WHERE INDICATED) | 2017 | 2016 | CHANGE | |||||||
Revenue | 809 | 887 | (9)% | |||||||
Gross profit | 237 | 157 | 51% | |||||||
Net loss attributable to equity holders | (62 | ) | (144 | ) | 57% | |||||
$ per common share (basic) | (0.16 | ) | (0.36 | ) | 56% | |||||
$ per common share (diluted) | (0.16 | ) | (0.36 | ) | 56% | |||||
Adjusted net earnings(non-IFRS, see page 24) | 181 | 90 | >100% | |||||||
$ per common share (adjusted and diluted) | 0.4 | 6 | 0.2 | 3 | 100% | |||||
Cash provided by operations (after working capital changes) | 320 | 255 | 25% | |||||||
NET EARNINGS
The following table shows what contributed to the change in net earnings and adjusted net earnings(non-IFRS measure, see page 8) in the fourth quarter of 2017 compared to the same period in 2016.
| ($ MILLIONS) | IFRS | ADJUSTED | ||||||||
Net earnings (losses) - 2016 | (144 | ) | 90 | |||||||
Change in gross profit by segment | ||||||||||
| (we calculate gross profit by deducting from revenue the cost of products and services sold, and depreciation and amortization (D&A), net of hedging benefits) | ||||||||||
Uranium | Higher sales volume | 11 | 11 | |||||||
| Higher realized prices ($US) | 23 | 23 | ||||||||
| Foreign exchange impact on realized prices | (29 | ) | (29 | ) | ||||||
| Lower costs | 68 | 68 | ||||||||
| change – uranium | 73 | 73 | ||||||||
Fuel services | Higher sales volume | 3 | 3 | |||||||
| Lower realized prices ($Cdn) | (13 | ) | (13 | ) | ||||||
| Lower costs | 13 | 13 | ||||||||
| change – fuel services | 3 | 3 | ||||||||
NUKEM | Gross profit | 2 | 2 | |||||||
| change – NUKEM | 2 | 2 | ||||||||
Other changes | ||||||||||
Lower administration expenditures | 16 | 16 | ||||||||
Higher impairment charges | (9 | ) | - | |||||||
Lower exploration expenditures | 1 | 1 | ||||||||
Change in Rabbit Lake reclamation provision | (43 | ) | - | |||||||
Lower loss on disposal of assets | 13 | 13 | ||||||||
Change in gains or losses on derivatives | 29 | 4 | ||||||||
Change in foreign exchange gains or losses | (2 | ) | (2 | ) | ||||||
Change in income tax recovery or expense | 5 | (13 | ) | |||||||
Other | (6 | ) | (6 | ) | ||||||
Net earnings (losses) - 2017 | (62 | ) | 181 | |||||||
| MANAGEMENT’S DISCUSSION AND ANALYSIS | 45 |
ADJUSTED NET EARNINGS
We use adjusted net earnings, anon-IFRS measure, as a more meaningful way to compare our financial performance from period to period. See page 24 for more information. The following table reconciles adjusted net earnings with our net earnings.
| THREE MONTHS ENDED DECEMBER 31 | ||||||
| ($ MILLIONS) | 2017 | 2016 | ||||
Net loss attributable to equity holders | (62 | ) | (144) | |||
Adjustments | ||||||
Adjustments on derivatives | (2 | ) | 23 | |||
Impairment charges | 247 | 238 | ||||
Rabbit Lake reclamation provision adjustment | 15 | (28) | ||||
Income taxes on adjustments | (17 | ) | 1 | |||
Adjusted net earnings | 181 | 90 | ||||
ADMINISTRATION
| THREE MONTHS ENDED DECEMBER 31 | ||||||||||
| ($ MILLIONS) | 2017 | 2016 | CHANGE | |||||||
Direct administration | 36 | 49 | (27)% | |||||||
Stock-based compensation | 3 | 6 | (50)% | |||||||
Total administration | 39 | 55 | (29)% | |||||||
Direct administration costs were $36 million in the quarter, $13 million lower than the same period last year due to higher legal costs in 2016 related to our CRA trial, as well as cost reduction actions which reduced administration costs in 2017. Stock-based compensation expenses were $3 million lower than the fourth quarter of 2016. See note 22 to the financial statements.
Quarterly trends
| HIGHLIGHTS | 2017 | 2016 | ||||||||||||||||||||||||||||||
| ($ MILLIONS EXCEPT PER SHARE AMOUNTS) | Q4 | Q3 | Q2 | Q1 | Q4 | Q3 | Q2 | Q1 | ||||||||||||||||||||||||
Revenue | 809 | 486 | 470 | 393 | 887 | 670 | 466 | 408 | ||||||||||||||||||||||||
Net earnings (loss) attributable to equity holders | (62) | (124) | (2) | (18) | (144) | 142 | (137) | 78 | ||||||||||||||||||||||||
$ per common share (basic) | (0.16) | (0.31) | (0.00) | (0.05) | (0.36) | 0.36 | (0.35) | 0.20 | ||||||||||||||||||||||||
$ per common share (diluted) | (0.16) | (0.31) | (0.00) | (0.05) | (0.36) | 0.36 | (0.35) | 0.20 | ||||||||||||||||||||||||
Adjusted net earnings (loss)(non-IFRS, see page 24) | 181 | (50) | (44) | (29) | 90 | 118 | (57) | (7) | ||||||||||||||||||||||||
$ per common share (adjusted and diluted) | 0.46 | (0.13) | (0.11) | (0.07) | 0.23 | 0.30 | (0.14) | (0.02) | ||||||||||||||||||||||||
Cash provided by (used in) operations (after working capital changes) | 320 | 154 | 130 | (8) | 255 | 385 | (51) | (277) | ||||||||||||||||||||||||
Key things to note:
| ● | Our financial results are strongly influenced by the performance of our uranium segment, which accounted for 78% of consolidated revenues in the fourth quarter of 2017 and 66% of consolidated revenues in the fourth quarter of 2016. |
| ● | The timing of customer requirements, which tends to vary from quarter to quarter, drives revenue in the uranium and fuel services segments. |
| ● | Net earnings do not trend directly with revenue due to unusual items and transactions that occur from time to time. We use adjusted net earnings, anon-IFRS measure, as a more meaningful way to compare our results from period to period (see page 24 for more information). |
| ● | Cash from operations tends to fluctuate as a result of the timing of deliveries and product purchases in our uranium and fuel services segments. |
| ● | Quarterly results are not necessarily a good indication of annual results due to the variability in customer requirements noted above. |
| 46 | CAMECO CORPORATION |
The table that follows presents the differences between net earnings and adjusted net earnings for the previous seven quarters.
| HIGHLIGHTS | 2017 | 2016 | ||||||||||||||||||||||||||||||||||
| ($ MILLIONS EXCEPT PER SHARE AMOUNTS) | Q4 | Q3 | Q2 | Q1 | Q4 | Q3 | Q2 | Q1 | ||||||||||||||||||||||||||||
Net earnings (loss) attributable to equity holders | (62) | (124) | (2) | (18) | (144) | 142 | (137) | 78 | ||||||||||||||||||||||||||||
Adjustments | ||||||||||||||||||||||||||||||||||||
Adjustments on derivatives | (2) | (40) | (44) | (22) | 23 | (27) | (10) | (116) | ||||||||||||||||||||||||||||
NUKEM purchase price inventory recovery | - | - | - | - | - | - | (6) | - | ||||||||||||||||||||||||||||
Impairment charges | 247 | 111 | - | - | 238 | - | 124 | - | ||||||||||||||||||||||||||||
Rabbit Lake reclamation provision adjustment | 15 | (9) | (12) | 6 | (28) | (6) | - | - | ||||||||||||||||||||||||||||
Income taxes on adjustments | (17) | 12 | 14 | 5 | 1 | 9 | (28) | 31 | ||||||||||||||||||||||||||||
Adjusted net earnings (losses)(non-IFRS, see page 24) | 181 | (50) | (44) | (29) | 90 | 118 | (57) | (7) | ||||||||||||||||||||||||||||
| MANAGEMENT’S DISCUSSION AND ANALYSIS | 47 |
Fourth quarter financial results by segment
Uranium
| THREE MONTHS ENDED DECEMBER 31 | ||||||||||||||
| HIGHLIGHTS | 2017 | 2016 | CHANGE | |||||||||||
Production volume (million lbs) | 6.9 | 7.1 | (3)% | |||||||||||
Sales volume (million lbs)1 | 12.6 | 11.7 | 8% | |||||||||||
Average spot price | ($US/lb) | 22.32 | 19.00 | 17% | ||||||||||
Average long-term price | ($US/lb) | 30.67 | 32.83 | (7)% | ||||||||||
Average realized price | ($US/lb) | 39.44 | 38.04 | 4% | ||||||||||
| ($Cdn/lb) | 50.04 | 50.51 | (1)% | |||||||||||
Average unit cost of sales (including D&A) | ($Cdn/lb) | 32.91 | 38.29 | (14)% | ||||||||||
Revenue ($ millions)1 | 631 | 589 | 7% | |||||||||||
Gross profit ($ millions) | 216 | 143 | 51% | |||||||||||
Gross profit (%) | 34 | 24 | 42% | |||||||||||
| 1 | Includes sales and revenue between our uranium, fuel services and NUKEM segments (101,000 pounds in sales and revenue of $3.9 million in Q4 2017, nil in Q4 2016). |
Production volumes this quarter were 3% lower compared to the fourth quarter of 2016, due to curtailment of production at the US operations, lower production at Inkai, and from McArthur River/Key Lake. SeeUranium – production overview on page 55 for more information.
Uranium revenues were up 7% due primarily to an 8% increase in sales volumes, as average realized price remained relatively constant.
Total cost of sales (including D&A) decreased by 7% ($415 million compared to $447 million in 2016). This was the result of a 14% decrease in the average unit cost of sales partially offset by an 8% increase in sales volumes. The decrease in the average unit cost of sales compared to last year was mainly due to timing of royalty costs. Also, the rampup of production at Cigar Lake, and the other measures we have taken to reduce costs, have resulted in lower production costs this year. The cost of our purchases have decreased as well.
The net effect was a $73 million increase in gross profit for the quarter.
The following table shows the costs of produced and purchased uranium incurred in the reporting periods (which arenon-IFRS measures, see the paragraphs below the table). These costs do not include selling costs such as royalties, transportation and commissions, nor do they reflect the impact of opening inventories on our reported cost of sales.
| THREE MONTHS ENDED DECEMBER 31 | ||||||||||||
| ($CDN/LB) | 2017 | 2016 | CHANGE | |||||||||
Produced | ||||||||||||
Cash cost | 13.28 | 15.00 | (11)% | |||||||||
Non-cash cost | 12.08 | 10.74 | 12% | |||||||||
Total production cost | 25.36 | 25.74 | (1)% | |||||||||
Quantity produced (million lbs) | 6.9 | 7.1 | (3)% | |||||||||
Purchased | ||||||||||||
Cash cost | 34.74 | 50.49 | (31)% | |||||||||
Quantity purchased (million lbs) | 3.1 | 2.2 | 41% | |||||||||
Totals | ||||||||||||
Produced and purchased costs | 28.27 | 31.59 | (11)% | |||||||||
Quantities produced and purchased (million lbs) | 10.0 | 9.3 | 8% | |||||||||
The average cash cost of production was 11% lower for the quarter than in the comparable period in 2016.
| 48 | CAMECO CORPORATION |
Although purchased pounds are transacted in US dollars, we account for the purchases in Canadian dollars. In the fourth quarter, the average cash cost of purchased material was $34.74 (Cdn) per pound, or $28.41 (US) per pound in US dollar terms, compared to $37.61 (US) per pound in the fourth quarter of 2016.
Cash cost per pound,non-cash cost per pound and total cost per pound for produced and purchased uranium presented in the above table arenon-IFRS measures. These measures do not have a standardized meaning or a consistent basis of calculation under IFRS. We use these measures in our assessment of the performance of our uranium business. We believe that, in addition to conventional measures prepared in accordance with IFRS, certain investors use this information to evaluate our performance and ability to generate cash flow.
These measures arenon-standard supplemental information and should not be considered in isolation or as a substitute for measures of performance prepared according to accounting standards. These measures are not necessarily indicative of operating profit or cash flow from operations as determined under IFRS. Other companies may calculate these measures differently, so you may not be able to make a direct comparison to similar measures presented by other companies.
To facilitate a better understanding of these measures, the following table presents a reconciliation of these measures to our unit cost of sales for the fourth quarters of 2017 and 2016.
CASH AND TOTAL COST PER POUND RECONCILIATION
| THREE MONTHS ENDED DECEMBER 31 | ||||||||
| ($ MILLIONS) | 2017 | 2016 | ||||||
Cost of product sold | 319.2 | 338.4 | ||||||
Add / (subtract) | ||||||||
Royalties | (20.4 | ) | (38.0 | ) | ||||
Other selling costs | (1.8 | ) | (0.3 | ) | ||||
Care and maintenance and severance costs | (9.5 | ) | (10.8 | ) | ||||
Change in inventories | (88.2 | ) | (71.7 | ) | ||||
Cash operating costs (a) | 199.3 | 217.6 | ||||||
Add / (subtract) | ||||||||
Depreciation and amortization | 95.8 | 108.1 | ||||||
Change in inventories | (12.4 | ) | (31.9 | ) | ||||
Total operating costs (b) | 282.7 | 293.8 | ||||||
Uranium produced & purchased (million lbs) (c) | 10.0 | 9.3 | ||||||
Cash costs per pound (a ÷ c) | 19.93 | 23.40 | ||||||
Total costs per pound (b ÷ c) | 28.27 | 31.59 | ||||||
| MANAGEMENT’S DISCUSSION AND ANALYSIS | 49 |
Fuel services
(includes results for UF6, UO2 and fuel fabrication)
| THREE MONTHS ENDED DECEMBER 31 | ||||||||||||||||
| HIGHLIGHTS | 2017 | 2016 | CHANGE | |||||||||||||
Production volume (million kgU) | 2.5 | 1.9 | 32% | |||||||||||||
Sales volume (million kgU)1 | 4.6 | 4.0 | 15% | |||||||||||||
Average realized price | ($Cdn/kgU) | 23.13 | 26.03 | (11)% | ||||||||||||
Average unit cost of sales (including D&A) | ($Cdn/kgU) | 18.43 | 21.17 | (13)% | ||||||||||||
Revenue ($ millions)1 | 107 | 104 | 3% | |||||||||||||
Gross profit ($ millions) | 22 | 19 | 16% | |||||||||||||
Gross profit (%) | 21 | 18 | 17% | |||||||||||||
| 1 | Includes sales and revenue between our uranium, fuel services and NUKEM segments (60,000 kgU in sales and revenue of $0.3 million in Q4 2017, 115,000 kgU in sales and revenue of $0.9 million in Q4 2016). |
Total revenue increased by 3% due to a 15% increase in sales volumes, partially offset by an 11% decrease in average realized price. The decrease in average realized price was due to the mix of products sold.
Despite the increase in sales volume, total cost of sales (including D&A) remained unchanged at $85 million compared to the fourth quarter of 2016 due to a decrease of 13% in the average unit cost of sales, primarily as a result of the mix of products sold.
The net effect was a $3 million increase in gross profit.
NUKEM
(financial results include U3O8, UF6, and SWU)
| THREE MONTHS ENDED DECEMBER 31 | ||||||||||||||||
| HIGHLIGHTS | 2017 | 2016 | CHANGE | |||||||||||||
Uranium sales (million lbs)1 | 4.0 | 3.1 | 29% | |||||||||||||
Average realized price | ($Cdn/lb) | 30.81 | 46.63 | (34)% | ||||||||||||
Cost of product sold (including D&A) | 122 | 195 | (37)% | |||||||||||||
Revenue ($ millions)1 | 124 | 194 | (36)% | |||||||||||||
Gross profit (loss) ($ millions) | 2 | (1 | ) | >100% | ||||||||||||
Gross profit (loss) (%) | 2 | (1 | ) | >100% | ||||||||||||
| 1 | Includes sales and revenue between our uranium, fuel services and NUKEM segments (1.7 million pounds in sales and revenue of $49.0 million in Q4 2017, 48,000 pounds in sales and revenue of $0.4 million in Q4 2016). |
NUKEM delivered 4.0 million pounds of uranium, an increase of 0.9 million pounds compared to 2016. NUKEM revenues amounted to $124 million compared to $194 million in 2016 due to a lower average realized price, partially offset by the increase in uranium volumes delivered due to planned inventory reductions after the restructuring of our global marketing activities. In addition, sales of UF6 and SWU in the fourth quarter 2016 contributed to the higher revenues last year.
Gross profit percentage was 2% in the fourth quarter of 2017, compared to a gross loss of 1% in the fourth quarter of 2016.
The net effect was a $3 million increase in gross profit.
| 50 | CAMECO CORPORATION |
Operations and projects
This section of our MD&A is an overview of the mining properties we operate or have an interest in, our curtailed operations and our projects, what we accomplished this year, our plans for the future and how we manage risk.
| 52 | MANAGING THE RISKS | |||
| 55 | URANIUM – PRODUCTION OVERVIEW | |||
| 55 | PRODUCTION OUTLOOK | |||
| 56 | URANIUM –TIER-ONE OPERATIONS | |||
| 56 | MCARTHUR RIVER MINE / KEY LAKE MILL | |||
| 61 | CIGAR LAKE | |||
| 65 | INKAI | |||
| 68 | URANIUM –TIER-TWO CURTAILED OPERATIONS | |||
| 68 | RABBIT LAKE | |||
| 68 | SMITH RANCH-HIGHLAND | |||
| 68 | CROW BUTTE | |||
| 69 | URANIUM – PROJECTS UNDER EVALUATION | |||
| 69 | MILLENNIUM | |||
| 69 | YEELIRRIE | |||
| 69 | KINTYRE | |||
| 70 | URANIUM – EXPLORATION AND CORPORATE DEVELOPMENT | |||
| 71 | FUEL SERVICES | |||
| 71 | BLIND RIVER REFINERY | |||
| 72 | PORT HOPE CONVERSION SERVICES | |||
| 72 | CAMECO FUEL MANUFACTURING INC. (CFM) | |||
| 73 | NUKEM GMBH | |||
| MANAGEMENT’S DISCUSSION AND ANALYSIS | 51 |
Managing the risks
The nature of our operations means we face many potential risks and hazards that could have a significant impact on our business. Our risk policy and process involves a broad, systematic approach to identifying, assessing, reporting and managing the significant risks we face in our business and operations. The policy establishes clear accountabilities for enterprise risk management. We use a common risk matrix throughout the company and consider any risk that has the potential to significantly affect our ability to achieve our corporate objectives or strategic plan as an enterprise risk. However, there is no assurance we will be successful in preventing the harm any of these risks and hazards could cause. We recommend you read our most recent management proxy circular for more information about our risk oversight.
Below we list the regulatory, environmental and operational risks that generally apply to all of our operations and projects under evaluation. We also talk about how we manage specific risks in each operation or project update. These risks could have a material impact on our business in the near term.
We recommend you also review our annual information form, which includes a discussion of other material risks that could have an impact on our business.
Regulatory risks
A significant part of our economic value depends on our ability to:
| ● | obtain and renew the licences and other approvals we need to operate, to increase production at our mines and to develop new mines. If we do not receive the regulatory approvals we need, or do not receive them at the right time, then we may have to delay, modify or cancel a project, which could increase our costs and delay or prevent us from generating revenue from the project. Regulatory review, including the review of environmental matters, is a long and complex process. |
| ● | comply with the conditions in these licences and approvals. Our right to continue operating facilities, increase production at our mines and develop new mines depends on our compliance with these conditions. |
| ● | comply with the extensive and complex laws and regulations that govern our activities. Environmental legislation imposes strict standards and controls on almost every aspect of our operations and projects, and is not only introducing new requirements, but also becoming more stringent. For example: |
| ● | we must complete the environmental assessment process before we can begin developing a new mine or make any significant change to our operations |
| ● | we may need regulatory approval to make changes to our operational processes, which can take a significant amount of time because it may require an extensive review of supporting technical information. The complexity of this process can be further compounded when regulatory approvals are required from multiple agencies. |
| ● | the federal government’s review of environmental and regulatory processes “to restore public trust” is now firmly underway. This includes reviews of the Canadian Environmental Assessment Act, 2012, along with the Fisheries Act and Navigation Protection Act. Also under review is the Canadian Environmental Protection Act, 1996. Changes to this legislation could impact any future planned projects. |
| ● | Environment Canada has brought forward a national recovery plan for woodland caribou that has the potential to impact economic and social development in northern Saskatchewan. Additional research work has resulted in a report indicating the range in which our northern Saskatchewan operations are located, hosts a secure and self-sustaining population of woodland caribou, perhaps one of the most secure boreal caribou populations in Canada. The research should lead Environment and Climate Change Canada to revise the national recovery plan to recognize the sustainability of the species in northern Saskatchewan; however, potential habitat protection measures could still have an impact on our Saskatchewan operations and projects under evaluation. |
| ● | Environment Canada has been reviewing the Metal Mining Effluent Regulations (MMER). This review could result in new limits for existing MMER substances and proposed limits for new substances that could impact our Saskatchewan operations. |
| ● | The U.S. Environmental Protection Agency (EPA) proposed adding new health and environmental protection standards that could impact Cameco Resources. Particularly concerning is the proposed requirement that groundwater must be monitored for 30 years after restoration. In early 2017, the EPA withdrew its rule, but then proposed a new rule for public comment, which is less onerous though still has a number of problematic aspects. Ultimately, the decision on moving forward with EPA’s new proposal will be decided by the US administration. |
| 52 | CAMECO CORPORATION |
We use significant management and financial resources to manage our regulatory risks.
Environmental risks
We have the safety, health and environmental risks associated with any mining and chemical processing company. Our uranium and fuel services segments also face unique risks associated with radiation.
Laws to protect the environment are becoming more stringent for members of the nuclear energy industry and have inter-jurisdictional aspects (both federal and provincial/state regimes are applicable). Once we have permanently stopped mining and processing activities at an operating site, we are required to decommission the site to the satisfaction of the regulators. We have developed conceptual decommissioning plans for our operating sites and use them to estimate our decommissioning costs. Regulators review and accept our conceptual decommissioning plans on a regular basis. As the site approaches or goes into decommissioning, regulators review the detailed decommissioning plans. This can result in further regulatory process, as well as additional requirements, costs and financial assurances.
Currently, Cameco is in the process of preparing updates to all Saskatchewan operations’ Preliminary Decommissioning Plan (PDP) and Preliminary Decommissioning Cost Estimate (PDCE) documents in accordance with the five year timeline specified in the regulations. An update to the Port Hope Conversion Facility PDP was initiated in 2015 in support of the licence renewal and the PDP was finalized early in the first quarter of 2016. In February 2017, the CNSC granted a licence renewal for 10 years and accepted the updated PDP and financial assurance amount. The financial assurance was amended to $128.6 million in March 2017.
For both Cameco Fuel Manufacturing and the Blind River Refinery, the increase to the financial assurance of $1.5 million and $9.4 million, respectively was considered through a hearing in writing in October 2017 and accepted in November 2017. The financial assurance amendment was completed in December 2017.
In addition, surety costs have increased at our Smith-Ranch Highland site by approximately $32 million. The increase is largely due to an increase in groundwater restoration costs.
At the end of 2017, our estimate of total decommissioning and reclamation costs was $1.04 billion. This is the undiscounted value of the obligation and is based on our current operations. We had accounting provisions of $894 million at the end of 2017 (the present value of the $1.04 billion). Since we expect to incur most of these expenditures at the end of the useful lives of the operations they relate to, our expected costs for decommissioning and reclamation for the next five years are not material.
We provide financial assurances for decommissioning and reclamation such as letters of credit to regulatory authorities, as required. We had a total of about $1.0 billion in letters of credit supporting our reclamation liabilities at the end of 2017. All of our North American operations have letters of credit in place that provide financial assurance in connection with our preliminary plans for decommissioning of the sites.
Some of the sites we own or operate have been under ongoing investigation and/or remediation and planning as a result of historic soil and groundwater conditions. For example, we are addressing issues related to historic soil and groundwater contamination at Port Hope.
We use significant management and financial resources to manage our environmental risks.
We manage environmental risks through our safety, health, environment and quality (SHEQ) management system. Our chief executive officer is responsible for ensuring that our SHEQ management system is implemented. Our board’s safety, health and environment committee also oversees how we manage our environmental risks.
In 2017, we invested:
| ● | $63 million in environmental protection, monitoring and assessment programs, approximately 21% less than in 2016 |
| ● | $23 million in health and safety programs, or 17% less than 2016 |
The decrease in spend in 2017 was largely due to overall cost reductions.
Spending on environmental and health and safety programs is expected to decrease in 2018 as a result of the continued impacts of the decisions to transition Rabbit Lake into care and maintenance and to curtail production at the US operations, as well as the temporary shutdown of the McArthur River and Key Lake operations.
| MANAGEMENT’S DISCUSSION AND ANALYSIS | 53 |
Operational risks
Other operational risks and hazards include:
| ● | environmental damage |
| ● | industrial and transportation accidents |
| ● | labour shortages, disputes or strikes |
| ● | cost increases for labour, contracted or purchased materials, supplies and services |
| ● | shortages of required materials, supplies and equipment |
| ● | transportation disruptions |
| ● | electrical power interruptions |
| ● | equipment failures |
| ● | non-compliance with laws and licences |
| ● | catastrophic accidents |
| ● | fires |
| ● | blockades or other acts of social or political activism |
| ● | natural phenomena, such as inclement weather conditions, floods and earthquakes |
| ● | unusual, unexpected or adverse mining or geological conditions |
| ● | underground floods |
| ● | ground movement orcave-ins |
| ● | tailings pipeline or dam failures |
| ● | technological failure of mining methods |
| ● | unanticipated consequences of our cost reduction strategies |
We have insurance to cover some of these risks and hazards, but not all of them, and not to the full amount of losses or liabilities that could potentially arise.
| 54 | CAMECO CORPORATION |
Uranium – production overview
Production in our uranium segment in the fourth quarter was 6.9 million pounds, 3% lower compared to the same period in 2016 due to lower production at Inkai, and our McArthur River/Key Lake operation due to calciner issues. Production for the year was 23.8 million pounds, 12% lower than in 2016 due to the strategic decisions made to suspend production at Rabbit Lake, curtail production at the US operations, and lower production from McArthur River/Key Lake, partially offset by higher production at Cigar Lake as ramp up was completed. SeeUranium - operationsstarting on page 56 for more information.
Uranium production
| CAMECO SHARE | THREE MONTHS ENDED DECEMBER 31 | YEAR ENDED DECEMBER 31 | ||||||||||||||||||||||||||
| (MILLION LBS) | 2017 | 2016 | 2017 | 2016 | 2017 PLAN1 | 2018 PLAN | ||||||||||||||||||||||
McArthur River/Key Lake | 3.5 | 3.8 | 11.2 | 12.6 | 11.5 | 0.1 | ||||||||||||||||||||||
Cigar Lake | 2.5 | 2.5 | 9.0 | 8.7 | 9.0 | 9.0 | ||||||||||||||||||||||
Inkai | 0.9 | 0.7 | 3.2 | 3.4 | 3.1 | - 2 | ||||||||||||||||||||||
Rabbit Lake | - | - | - | 1.1 | - | - 3 | ||||||||||||||||||||||
Smith Ranch-Highland | - | 0.1 | 0.3 | 0.9 | 0.3 | - 3 | ||||||||||||||||||||||
Crow Butte | - | - | 0.1 | 0.3 | 0.1 | - 3 | ||||||||||||||||||||||
Total | 6.9 | 7.1 | 23.8 | 27.0 | 24.0 | 9.1 | ||||||||||||||||||||||
| 1 | We reduced our initial 2017 production plan to 24.0 million pounds (from 25.2 million pounds) due to reductions at McArthur River/Key Lake and Smith Ranch-Highland in the third quarter. |
| 2 | We expect total production from Inkai to be 6.9 million pounds in 2018. Due to the transition to equity accounting, our share of production, 3.4 million pounds, will be shown as a purchase. Please seeJV Inkai – planning for the future beginning on page 67 for more information. |
| 3 | The Rabbit Lake operation is in a safe and sustainable state of care and maintenance, and we are no longer developing new wellfields at Crow Butte and Smith Ranch-Highland. Please seeUranium –Tier-two curtailed operations beginning on page 68 for more information. |
Production Outlook
We remain focused on taking advantage of the long-term growth we see coming in our industry, while maintaining the ability to respond to market conditions as they evolve. Our strategy is to focus on ourtier-one assets and profitably produce at a pace aligned with market signals in order to preserve the value of those assets and increase long-term shareholder value, and to do that with an emphasis on safety, people and the environment.
Given today’s weak market conditions and to mitigate risk, we plan to:
| ● | ensure we continue to operate safely |
| ● | evaluate the optimal mix of production, inventory and purchases in order to retain the flexibility to deliver long-term value |
| ● | focus on maximizing margins through cost management, productivity improvements, and supply discipline |
| MANAGEMENT’S DISCUSSION AND ANALYSIS | 55 |
Uranium –Tier-one operations
McArthur River mine / Key Lake mill
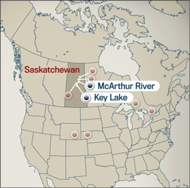 | 2017 Production (our share)
11.2M lbs
2018 Production Outlook (our share)
0.1M lbs
Estimated Reserves (our share)
250.7M lbs
Estimated Mine Life
2038 | Proportion of 2017 U production
|
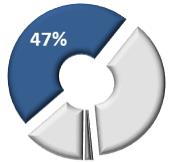
McArthur River is the world’s largest, high-grade uranium mine, and Key Lake is the world’s largest uranium mill.
Ore grades at the McArthur River mine are 100 times the world average, which means it can produce more than 18 million pounds per year by mining only 150 to 200 tonnes of ore per day. We are the operator of both the mine and mill.
In 2018, production at the mine and mill is temporarily suspended.
McArthur River is considered a material uranium property for us.
| Location | Saskatchewan, Canada | |||||||
| Ownership | McArthur River – 69.805% | |||||||
| Key Lake – 83.33% | ||||||||
| Mine type | Underground | |||||||
| Mining methods | Primary: blasthole stoping | |||||||
| Secondary: raiseboring | ||||||||
| End product | Uranium concentrate | |||||||
| Certification | ISO 14001 certified | |||||||
| Estimated reserves | 250.7 million pounds (proven and probable), average grade U3O8: 9.63% | |||||||
| Estimated resources | 4.9 million pounds (measured and indicated), average grade U3O8: 3.00% | |||||||
| 5.9 million pounds (inferred), average grade U3O8: 5.01% | ||||||||
| Licensed capacity | Mine and mill: 25.0 million pounds per year | |||||||
| Licence term | Through October, 2023 | |||||||
| Total packaged production: | 2000 to 2017 | 325.2 million pounds (McArthur River/Key Lake) (100% basis) | ||||||
| 1983 to 2002 |
209.8 million pounds (Key Lake) (100% basis) | |||||||
| 2017 production | 11.2 million pounds (16.1 million pounds on 100% basis) | |||||||
| 2018 production outlook | 0.1 million pounds (0.2 million pounds on 100% basis) | |||||||
| Estimated decommissioning cost | $48 million – McArthur River (100% basis) | |||||||
$218 million – Key Lake (100% basis) | ||||||||
All values shown, including reserves and resources, represent our share only, unless indicated.
BACKGROUND
Mine description
McArthur River currently has six zones with delineated mineral reserves and resources (zones 1 to 4, zones A and B) and one additional area with delineated mineral resources (McArthur north). We are currently mining zone 2 and zone 4.
56 CAMECO CORPORATION
Zone 2 has been actively mined since production began in 1999. The ore zone was initially divided into three freeze panels (panels1-2, 3 and 5). As the freeze wall was expanded, the inner connecting freeze walls were decommissioned in order to recover the inaccessible uranium around the active freeze pipes. The majority of the remaining zone 2 mineral reserves are in the upper portion of panel 5.
Zone 4 is divided into three mining areas: north, central, and south. Prior to the production suspension, we were actively mining the lower central, and north areas. In the final quarter of 2017, we began mining in the upper central area following the successful completion of ground freezing and the first stages of development and construction. Similar to zone 2, the inner connecting freeze walls are decommissioned as new panels are brought on line in order to maximize ore recovery.
Zone 1 freeze hole drilling is on hold for 2018 during the production suspension and will resume following the minestart-up. Following freeze hole drilling, outfitting and freezing will commence prior to production access drift development. Production from zone 1 is expected to begin in 2021.
We have successfully extracted over 325 million pounds (100% basis) since we began mining in 1999.
Mining methods and techniques
We use a number of innovative methods to mine the McArthur River deposit:
Ground freezing
The sandstone that overlays the deposit and metasedimentary basement rocks is water-bearing and more permeable, which results in significant water pressure at mining depths. In order to isolate the high-pressure water, ground freezing is used to form an impermeable wall around the area being mined. This prevents water from entering the mine, and helps stabilize weak rock formations. To date, we have isolated seven mining areas with freeze walls and an eighth mining area is under development.
Blasthole stoping
Our use of blasthole stoping began in 2011 and has expanded; the majority of ore extraction is now carried out with blasthole stoping. The use of this method has allowed the site to improve operating costs by significantly reducing waste rock handling, backfill dilution, and backfill placement. This mining method has been used extensively in the mining industry, including uranium mining. It involves:
| ● | establishing drill access above the ore and extraction access below the ore |
| ● | setting up a raisebore drill in the drill chamber, drilling a pilot hole down to the extraction chamber, attaching a3-metre wide reaming head to the drill string, and pulling it back up through the ore zone |
| ● | expanding the circumference of the raise by drilling longholes around the raisebore hole and blasting the ore |
| ● | funneling the blasted material into the raisebore hole and dropping it to the extraction level below |
| ● | collecting the broken rock byline-of-sight remote-controlled scoop trams, and transporting it to the underground grinding circuit |
| ● | once the stope is mined out, backfilling it with concrete to maintain ground stability and allowing the next stope and/or raise to be mined |
Raisebore mining
Raisebore mining is an innovativenon-entry approach that we adapted to meet the unique challenges at McArthur River, and it has been used since mining began in 1999. It involves:
| ● | establishing a drill chamber above the ore and an extraction chamber below the ore |
| ● | setting up a raisebore drill in the drill chamber, drilling a pilot hole down to the extraction chamber, attaching a3-metre wide reaming head to the drill string, and pulling it back up through the ore zone |
| ● | collecting the high-grade broken ore at the bottom of the raises usingline-of-sight remote-controlled scoop trams, and transporting it to an underground grinding circuit |
| ● | filling each raisebore hole with concrete |
| ● | when a series of overlapping raisebore holes in a chamber is complete, removing the equipment and filling the entire chamber with concrete |
| ● | starting the process again in an adjacent raisebore chamber |
| MANAGEMENT’S DISCUSSION AND ANALYSIS | 57 |
Boxhole mining was tested and approved for use at McArthur River. It is a higher-cost mining method that is not currently being used.
Initial processing
We carry out initial processing of the extracted ore at McArthur River:
| ● | the underground circuit grinds the ore and mixes it with water to form a slurry |
| ● | the slurry is pumped 680 metres to the surface and stored in one of four ore slurry holding tanks |
| ● | it is blended and thickened, removing excess water |
| ● | the final slurry, at an average grade of 12% - 20% U3O8, is pumped into transport truck containers and shipped to Key Lake mill on an 80 kilometreall-weather road |
Water from this process, including water from underground operations, is treated on the surface. Any excess treated water is released into the environment.
Tailings capacity
We expect to have sufficient tailings capacity at Key Lake to mill all the known McArthur River mineral reserves and resources, should they be converted to reserves, with additional capacity to toll mill ore from other regional deposits.
Licensed annual production capacity
The McArthur River mine and Key Lake mill are both licensed to produce up to 25 million pounds (100% basis) per year.
2017 UPDATE
Production
This year, in alignment with our efforts to reduce costs, our production plan included an extended summer shutdown during the third quarter. The shutdown, consisted of a four-week vacation period in July, followed by atwo-week maintenance period at McArthur River and a four-week maintenance period at Key Lake. Production was expected to restart at the end of August, however, work on the calciner at Key Lake took longer than expected. Also, there was additional work required on the calciner in October, resulting in an unplanned outage at Key Lake. As a result, we lowered our 2017 production target to 11.5 million pounds (Cameco’s share) from 12.6 million pounds (Cameco’s share). Production from McArthur River/Key Lake for the year was 16.1 million pounds; our share was 11.2 million pounds. This was 11% lower than 2016 and 3% lower than our previous forecast for the year.
During the year, we reduced the workforce by about 10%, and made changes to the commuter flight services at the site. These measures were made to further reduce costs and improve efficiency at the operation.
Key Lake mill upgrades
The Key Lake mill began operating in 1983 and we have continually upgraded circuits with new technology to simplify operations, improve environmental performance, and allow the mill’s nominal annual production rate to closely follow production from the McArthur River mine. As part of the mill upgrades, a new calciner was installed at the Key Lake mill to accommodate an eventual annual production increase to 25 million pounds. During the fourth quarter we announced our plan to temporarily suspend production at the McArthur River/Key Lake operation in 2018. As a result, we havere-evaluated the project to complete the new calciner at Key Lake, which was undertaken to allow for increased production. Given the production suspension, current market conditions, and that we have determined the existing calciner has sufficient capacity to reliably meet our ongoing production requirements it has been determined that no further investment will be made to complete the project. As a result, we have recognized an impairment charge related to the new calciner of $55 million. See note 9 for more information.
New mining areas
We must bring on new mining zones to sustain production. The two new areas under active development included the upper central portion of zone 4 and zone 1. In the fourth quarter of 2017, sufficient development and construction was complete to enable initial production from the upper central part of zone 4.
| 58 | CAMECO CORPORATION |
In 2017, zone 1 freeze drilling was advanced from 48% to 90% completion. In addition, construction of the brine distribution piping system was advanced to approximately 20% completion. Remaining freeze drilling and brine distribution construction will be deferred until after mine restart.
In 2017, the south freeze plant construction and commissioning was completed followed by a 3 month operating period when chilled brine was supplied to zone 4. The plant has been since shut-down for the care and maintenance period and will be restarted when freezing of Zone 1 is ready to begin.
The mine life of McArthur River/Key Lake has been extended from 2037 to 2038 as a result of the planned temporary production suspension in 2018. SeeMineral reserves and resources on page 74 for more information.
Exploration
In 2017, we continued with underground infill definition drilling of zone B in order to provide the information required for more detailed mining plans. Underground exploration drilling has been halted during the care and maintenance period.
PLANNING FOR THE FUTURE
Production
Due to continued uranium price weakness, and in accordance with our announcement at the end of 2017, we have temporarily suspended production. During January 2018, activities at the mine and mill were focused on putting the operation into a state of safe care and maintenance. As a result of the suspension, and the time required to restart the mine and mill, we do not expect the operation to produce any significant amount of uranium in 2018. The cost to maintain both operations during the suspension is expected to range between $6.5 million and $7.5 million per month.
Expansion potential
Once the market signals that new supply is needed and a decision is made to begin increasing annual production, we will undertake the work necessary to optimize the capacity of both the McArthur River mine and Key Lake mill with a view to achieving annual licensed capacity of 25 million pounds per year (100% basis). We expect that this paced approach will allow us to extract maximum value from the operation as the market transitions.
MANAGING OUR RISKS
Production at McArthur River/Key Lake poses many challenges: control of groundwater, weak rock formations, radiation protection, water inflow, mine area transitioning, and regulatory approvals. Operational experience gained since the start of production has resulted in a significant reduction in risk.
Operational changes
The operational changes we have made, including the extended summer shutdown, the workforce reduction, changes to the commuter flight services at the site, and the temporary suspension of production in 2018, which are intended to achieve cost savings and improve efficiency, carry with them increased risk of production disruption.
Labour relations
The collective agreement with the United Steelworkers local 8914 expired in December 2017, and the collective bargaining process has begun. There is a risk to the restart of operations after the production suspension if we are unable to reach agreement and there is a labour dispute.
Transition to new mining areas
In order to successfully achieve the planned production schedule, we must continue to successfully transition into new mining areas, which includes mine development and investment in critical support infrastructure.
Water inflow risk
The greatest risk is production interruption from water inflows. A 2003 water inflow resulted in a three-month suspension of production. We also had a small water inflow in 2008 that did not impact production.
| MANAGEMENT’S DISCUSSION AND ANALYSIS | 59 |
The consequences of another water inflow at McArthur River would depend on its magnitude, location and timing, but could include a significant interruption or reduction in production, a material increase in costs or a loss of mineral reserves.
We take the following steps to reduce the risk of inflows, but there is no guarantee that these will be successful:
| ● | Ground freezing: Before mining, we drill freezeholes and freeze the ground to form an impermeable freeze wall around the area being mined. Ground freezing reduces but does not eliminate the risk of water inflows. |
| ● | Mine development: We plan for our mine development to take place away from known groundwater sources whenever possible. In addition, we assess all planned mine development for relative risk and apply extensive additional technical and operating controls for all higher risk development. |
| ● | Pumping capacity and treatment limits: Our standard for this project is to secure pumping capacity of at least one and a half times the estimated maximum sustained inflow. We review our dewatering system and requirements at least once a year and before beginning work on any new zone. |
We believe we have sufficient pumping, water treatment and surface storage capacity to handle the estimated maximum sustained inflow.
We also manage the risks listed on pages 52 to 54.
| 60 | CAMECO CORPORATION |
Uranium –Tier-one operations
| Cigar Lake | ||||
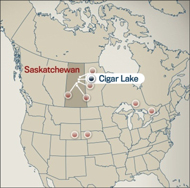 | 2017 Production (our share)
9.0M lbs
2018 Production Outlook (our share)
9.0M lbs
Estimated Reserves (our share)
99.0M lbs
Estimated Mine Life
2028 | Proportion of 2017 U production
| ||
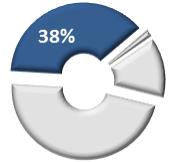
Cigar Lake is the world’s highest grade uranium mine, with grades that are 100 times the world average. We are a 50% owner and the mine operator. Cigar Lake uranium is milled at Orano’s (previously AREVA) McClean Lake mill.
Cigar Lake is considered a material uranium property for us.
| Location | Saskatchewan, Canada | |
| Ownership | 50.025% | |
| Mine type | Underground | |
| Mining method | Jet boring system | |
| End product | Uranium concentrate | |
| Certification | ISO 14001 certified | |
| Estimated reserves | 99.0 million pounds (proven and probable), average grade U3O8: 14.91% | |
| Estimated resources | 49.1 million pounds (measured and indicated), average grade U3O8: 14.48% | |
11.8 million pounds (inferred), average grade U3O8: 5.97% | ||
| Licensed capacity | 18.0 million pounds per year (our share 9.0 million pounds per year) | |
| Licence term | Through June, 2021 | |
| Total packaged production: 2014 to 2017 | 46.9 million pounds (100% basis) | |
| 2017 production | 9.0 million pounds (18.0 million pounds on 100% basis) | |
| 2018 production outlook | 9.0 million pounds (18.0 million pounds on 100% basis) | |
| Estimated decommissioning cost | $49 million (100% basis) | |
All values shown, including reserves and resources, represent our share only, unless indicated.
BACKGROUND
Development
We began developing the Cigar Lake underground mine in 2005, but development was delayed due to water inflows in 2006 and 2008. The underground workings were successfully remediated and secured in 2011 and, in October 2014 the McClean Lake mill produced the first uranium concentrate from ore mined at the Cigar Lake operation. Commercial production was declared in May 2015.
Mine description
Cigar Lake’s geological setting is similar to McArthur River’s: the permeable sandstone, which overlays the deposit and basement rocks, contains large volumes of water at significant pressure. However, unlike McArthur River, the Cigar Lake deposit has the shape of a flat- to cigar-shaped lens. As a result of these challenging geological conditions, we are unable to utilize traditional mining methods that require access above the ore, necessitating the development of anon-entry mining method specifically adapted for this deposit: the Jet Boring system (JBS).
| MANAGEMENT’S DISCUSSION AND ANALYSIS | 61 |
We continue development below the mineralization and we are currently mining in the eastern part of the ore body (referred to as Phase 1). Surface delineation drilling for the western portion (Phase 2) was completed in 2017.
Mining method
Bulk ground freezing
The sandstone that overlays the deposit and basement rocks is water-bearing, and to prevent water from entering the mine, help stabilize weak rock formations, and meet our production schedule, the ore zone and surrounding ground in the area to be mined must meet specific ground freezing requirements before we begin jet boring.
During construction, development and remediation of the underground infrastructure, we employed a hybrid ground freezing approach using a combination of underground and surface freezing. The costs related to each technique are similar; however, there are significant advantages to freezing the ground from the surface. With surface freezing, less mine development is required, which results in less waste rock and greater ground stability, since freeze tunnels are not required between production tunnels. In addition, congestion is reduced and underground development for freeze infrastructure is no longer a critical path mine activity. Based on these advantages, we have elected to proceed exclusively using surface freezing to mine current mineral reserves at Cigar Lake.
Jet boring system (JBS) mining
After many years of test mining, we selected jet boring, anon-entry mining method, which we have developed and adapted specifically for this deposit. This method involves:
| ● | drilling a pilot hole into the frozen orebody, inserting a high pressure water jet and cutting a cavity out of the frozen ore |
| ● | collecting the ore and water mixture (slurry) from the cavity and pumping it to storage (sump storage), allowing it to settle |
| ● | using a clamshell, transporting the ore from sump storage to an underground grinding and processing circuit |
| ● | once mining is complete, filling each cavity in the orebody with concrete |
| ● | starting the process again with the next cavity |
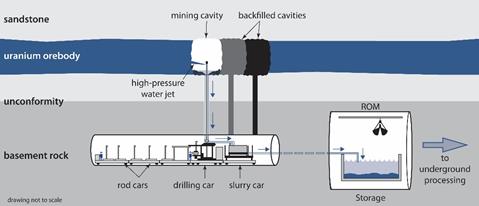
We have divided the orebody into production panels and at least three production panels need to be frozen at one time to achieve the full annual production rate of 18.0 million pounds. One JBS machine will be located below each frozen panel and the three JBS machines required are currently in operation. Two machines actively mine at any given time while the third is moving, setting up, or undergoing maintenance.
Initial processing
We carry out initial processing of the extracted ore at Cigar Lake:
| ● | the underground circuit grinds the ore and mixes it with water to form a slurry |
| ● | the slurry is pumped 500 metres to the surface and stored in one of two ore slurry holding tanks |
| ● | it is blended and thickened, removing excess water |
| ● | the final slurry, at an average grade of approximately 15% U3O8, is pumped into transport truck containers and shipped to McClean Lake mill on a 69 kilometreall-weather road |
| 62 | CAMECO CORPORATION |
Water from this process, including water from underground operations, is treated on the surface. Any excess treated water is released into the environment.
Milling
All of Cigar Lake’s ore slurry is being processed at the McClean Lake mill, operated by Orano. Given the McClean Lake mill’s capacity, it is able to:
| ● | operate at Cigar Lake’s targeted annual production level of 18.0 million pounds U3O8 |
| ● | process and package all of Cigar Lake’s current mineral reserves |
Licensing annual production capacity
The Cigar Lake mine is licensed to produce up to 18.0 million pounds (100% basis) per year. Orano’s McClean Lake mill is licensed to produce 24.0 million pounds annually.
2017 UPDATE
Production
Total packaged production from Cigar Lake was 18.0 million pounds U3O8; our share was 9.0 million pounds, achieving our forecast.
During the year, we:
| ● | implemented an extended summer shutdown, reduced the workforce by about 10%, made changes to the shift rotation schedule, and made changes to the commuter flight services at the site. All of these measures were made to further reduce costs and improve efficiency at the operation. |
| ● | completed a freeze pad extension to enable surface freeze drilling to resume in 2017 |
| ● | advanced the freeze plant expansion project through thepre-feasibility stage and commenced construction |
Underground development
In 2017, we substantially completed two new production crosscuts tunnels to ensure we maintain continuous access to frozen ore inventory once mining in the current crosscuts is complete.
McClean Lake mill update
On June 29, the CNSC approved a10-year renewal of the operating licence for Orano’s McClean Lake mill. The licence is valid until June 30, 2027.
Exploration
In 2017, we completed 16,571 metres of diamond drilling as part of the second year of a three-year surface drilling program to confirm and upgrade mineral resources contained in the western portion of the deposit (Phase 2). The objective of the program is to complete a detailed geological and geotechnical interpretation, a mineral resource estimate, and apre-feasibility study for Phase 2. Sufficient information has been obtained from the first two years of drilling to support completion of thepre-feasibility study.
PLANNING FOR THE FUTURE
Production
In 2018, we expect to produce 18.0 million packaged pounds at Cigar Lake; our share is 9.0 million pounds.
In alignment with our continued efforts to reduce costs, our 2018 production plan for the Cigar Lake mine includes an extended shutdown during the third quarter, which is expected to result in reduced flight and camp costs. The shut-down will consist of a four-week vacation period, preceded by aone- totwo-week maintenance period with minestart-up planned before the end of the third quarter.
| MANAGEMENT’S DISCUSSION AND ANALYSIS | 63 |
In 2018, we expect to:
| ● | resume surface freeze drilling and advance planning and construction for the freeze plant infrastructure expansion in support of future production |
| ● | transition to two new production crosscuts tunnels as per the mine plan, and backfill two crosscut tunnels where production is complete |
MANAGING OUR RISKS
Cigar Lake is a challenging deposit to develop and mine. These challenges include control of groundwater, weak rock formations, radiation protection, chemical ore characteristics, performance of the water treatment system, water inflow, regulatory approvals, surface and underground fires and other mining-related challenges. To reduce this risk, we are applying our operational experience and the lessons we have learned about water inflows at McArthur River and Cigar Lake.
Operational changes
The operational changes we have made, including the extended summer shutdown, the workforce reduction, changes to the shift rotation schedule, and changes to the commuter flight services at the site, which are intended to achieve cost savings and improve efficiency, carry with them increased risk of production disruption.
Transition to new mining areas
In order to successfully achieve the planned production schedule, we must continue to successfully transition into new mining areas, which includes mine development and investment in critical support infrastructure.
Ground freezing
To manage our risks and meet our production schedule, the areas being mined must meet specific ground freezing requirements before we begin jet boring. We have identified greater variation of the freeze rates of different geological formations encountered in the mine, based on new information obtained through surface freeze drilling. As a mitigation measure, we have increased the site freeze capacity to facilitate the mining of ore cavities as planned.
Environmental performance
The Cigar Lake orebody contains elements of concern with respect to the water quality and the receiving environment. The distribution of elements such as arsenic, molybdenum, selenium and others isnon-uniform throughout the ore body, and this can result in complications in attaining effluent concentrations included in the licensing basis. Materialization of this risk could result in a potential deferral of production and additional capital and operating expenses required to modify the water treatment process to ensure environmental performance.
Water inflow risk
A significant risk to development and production is from water inflows. The 2006 and 2008 water inflows were significant setbacks.
The consequences of another water inflow at Cigar Lake would depend on its magnitude, location and timing, but could include a significant delay or disruption in Cigar Lake production, a material increase in costs or a loss of mineral reserves.
We take the following steps to reduce the risk of inflows, but there is no guarantee that these will be successful:
| ● | Bulk freezing: Two of the primary challenges in mining the deposit are control of groundwater and ground support. Bulk freezing reduces but does not completely eliminate the risk of water inflows. |
| ● | Mine development: We plan for our mine development to take place away from known groundwater sources whenever possible. In addition, we assess all planned mine development for relative risk and apply extensive additional technical and operating controls for all higher risk development. |
| ● | Pumping capacity and treatment limits: We have pumping capacity to meet our standard for this operation of at least one and a half times the estimated maximum inflow. |
We believe we have sufficient pumping, water treatment and surface storage capacity to handle the estimated maximum inflow.
We also manage the risks listed on pages 52 to 54.
| 64 | CAMECO CORPORATION |
Uranium –Tier-one operations
Inkai
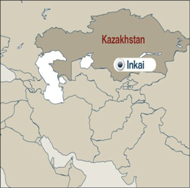 | 2017 Production (our share)
3.2M lbs
2018 Production Outlook (100% basis)
6.9 M lbs
Estimated Reserves (our share)
107.8M lbs
Estimated Mine Life
2045(based on licence term) | Proportion of 2017 U production
|

Inkai is a very significant uranium deposit, located in Kazakhstan. The operator is JV Inkai limited liability partnership, which we jointly own (40%) with Kazatomprom (60%)1.
Inkai is considered a material uranium property for us.
Location | South Kazakhstan | |
Ownership | 40%1 | |
Mine type | In situ recovery (ISR) | |
End product | Uranium concentrate | |
Certifications | BSI OHSAS 18001 | |
ISO 14001 certified | ||
Estimated reserves | 107.8 million pounds (proven and probable), average grade U3O8: 0.03% | |
Estimated resources | 12.8 million pounds (measured and indicated), average grade U3O8: 0.03% | |
30 million pounds (inferred), average grade U3O8: 0.03% | ||
Licensed capacity(wellfields) | 10.4 million pounds per year (our share 4.2 million pounds per year)1 | |
Licence term | Through July 2045 | |
Total packaged production: 2009 to 2017 | 42.3 million pounds (100% basis) | |
2017 production | 3.2 million pounds (5.5 million pounds on 100% basis) | |
2018 production outlook | 6.9 million pounds (100% basis)1 | |
Estimated decommissioning cost (100% basis) | $11 million (US) (100% basis) (this estimate is currently under review) | |
All values shown, including reserves and resources, represent our share only, unless indicated.
| 1 | We signed an agreement with our partner Kazatomprom and JV Inkai to restructure and enhance JV Inkai. Under the agreement, effective January 1, 2018, our ownership interest in the joint venture dropped to 40% and we will equity account for our investment. However, our share of production will gradually be reduced to 40% as JV Inkai increases production as provided for under the agreement. Due to the transition to equity accounting, our share of production will be shown as a purchase. SeeJV Inkai Restructuring Agreement for more information. |
BACKGROUND
Mine description
The Inkai uranium deposit is a roll-front type orebody within permeable sandstones. The more porous and permeable units host several stacked and relatively continuous, sinuous “roll-fronts” oflow-grade uranium forming a regional system. Superimposed over this regional system are several uranium projects and active mines.
Inkai’s mineralization ranges in depths from about 260 metres to 530 metres. The deposit has a surface projection of about 40 kilometres in length, and the width ranges from 40 to 1600 metres. The deposit has hydrogeological and mineralization conditions favorable for use ofin-situ recovery (ISR) technology.
| MANAGEMENT’S DISCUSSION AND ANALYSIS | 65 |
Mining and milling method
JV Inkai uses conventional, well-established, and very efficient ISR technology, developed after extensive test work and operational experience. The process involves five major steps:
| ● | leach the uraniumin-situ by circulating an acid-based solution through the host formation |
| ● | recover it from solution with ion exchange resin (takes place at both main and satellite processing plants) |
| ● | precipitate the uranium with hydrogen peroxide |
| ● | thicken, dewater, and dry it |
| ● | package the uranium peroxide product in drums |
Production
Total 2017 production from Inkai was 5.5 million pounds; our share was 3.2 million pounds, a decrease from 2016, in accordance with Kazatomproms’s planned 10% production decrease for 2017. The subsoil use law in Kazakhstan allows producers to produce within 20% (above or below) of their licensed capacity in a year.
Project funding
We have an outstanding loan for Inkai’s work on block 3 prior to the restructuring and, as of December 31, 2017, the principal and interest amounted to $117 million (US). Under the restructuring agreement, the partners have agreed that JV Inkai will distribute excess cash first as priority repayment of this loan. On January 12, 2018, a payment of $6 million (US) was received.
JV Inkai Restructuring Agreement
In 2016, we signed an agreement with our partner Kazatomprom and JV Inkai to restructure and enhance JV Inkai. The restructuring closed in December 2017 and took effect January 1, 2018. This restructuring was subject to obtaining all required government approvals including an amendment to JV Inkai’s Resource Use Contract, which were obtained. The restructuring consists of the following:
| ● | JV Inkai has the right to produce 10.4 million pounds of U3O8 per year (our share 4.2 million pounds), an increase from the prior licensed annual production of 5.2 million pounds (our share 3.0 million pounds) |
| ● | JV Inkai has the right to produce until 2045 (previously, the licence terms, based on the boundaries prior to the restructuring, were to 2024 and 2030) |
| ● | our ownership interest in JV Inkai is 40% and Kazatomprom’s share is 60%. However, during production rampup, our share of annual production remains at 57.5% on the first 5.2 million pounds. As annual production increases above 5.2 million pounds, we are entitled to 22.5% of any incremental production, to the maximum annual share of 4.2 million pounds. Once the rampup to 10.4 million pounds annually is complete, our share in all production will be 40%, matching our ownership interest. |
| ● | a governance framework that provides protection for us as a minority owner |
| ● | the boundaries of the mining area match the agreed production profile for JV Inkai to 2045 |
| ● | the loan that our subsidiary made to JV Inkai to fund exploration and evaluation of the historically defined block 3 area provides for priority repayment |
We along with Kazatomprom have also completed and reviewed a feasibility study for the purpose of evaluating the design, construction and operation of a uranium refinery in Kazakhstan. In accordance with the agreement, a decision has been made not to proceed with construction of the uranium refinery, as contemplated in the feasibility study. Kazatomprom has, pursuant to its option under the agreement, requested to licence our proprietary conversion technology for the purposes of investigating the feasibility of constructing and operating a UF6 conversion facility in Kazakhstan.
Our 2018 financial outlook is presented on the basis of equity accounting for our minority ownership interest in JV Inkai. Under equity accounting, our share of the profits earned by JV Inkai on the sale of its production will be included in “income from equity-accounted investees” on our consolidated statement of earnings. Our share of production will be purchased at a discount to the spot price and included at this value in inventory. In addition, JV Inkai capital is not included in our outlook for capital expenditures. Please seeJV Inkai Planning for the future below for more details.
| 66 | CAMECO CORPORATION |
Block 3 exploration (prior to restructuring)
In 2017, Inkai completed the test leach on block 3, which resulted in drummed production of 207,065 pounds (not included in Inkai’s annual production). With the restructuring, a portion of block 3 was included in JV Inkai’s new mining area. JV Inkai has the right to mine this new area untilmid-2045.
PLANNING FOR THE FUTURE
Production
We expect total production from Inkai to be 6.9 million pounds in 2018. Due to the transition to equity accounting, our share of production, 3.4 million pounds, will be shown as a purchase at a discount to the spot price and included in inventory at this value at the time of delivery. Our share of the profits earned by JV Inkai on the sale of its production will be included in “income from equity-accounted investees” on our consolidated statement of earnings.
MANAGING OUR RISKS
Political risk
Kazakhstan declared itself independent in 1991 after the dissolution of the Soviet Union. Our investment in JV Inkai is subject to the risks associated with doing business in developing countries, which have significant potential for social, economic, political, legal and fiscal instability. Kazakh laws and regulations are complex and still developing and their application can be difficult to predict. The other owner of JV Inkai is Kazatomprom, an entity owned by the government of Kazakhstan. We have entered into agreements with JV Inkai and Kazatomprom intended to mitigate political risk. This risk includes the imposition of governmental laws or policies that could restrict or hinder JV Inkai repaying the block 3 loan, paying us dividends, or selling us our share of JV Inkai production, or that impose discriminatory taxes or currency controls on these transactions. The restructuring of JV Inkai, which took effect January 1, 2018, was undertaken with the objective to better align the interests of Cameco and Kazatomprom and includes a governance framework that provides for protection for us as a minority owner of JV Inkai. We believe the political risk related to our investment in JV Inkai is manageable.
For more details on this risk, please our most recent annual information form under the heading political risks.
JV Inkai manages risks listed on pages 52 to 54.
| MANAGEMENT’S DISCUSSION AND ANALYSIS | 67 |
Uranium –Tier-two curtailed operations
Rabbit Lake
Located in Saskatchewan, Canada, our 100% owned Rabbit Lake operation, which opened in 1975, is the longest operating uranium production facility in North America, and the second largest uranium mill in the world. Due to market conditions, we suspended production at Rabbit Lake during the second quarter of 2016.
PRODUCTION AND PRODUCTION SUSPENSION
The facilities remained in a state of safe and sustainable care and maintenance throughout 2017. As a result, there was no production in 2017.
We are continually weighing the value of maintaining the operation in standby, against the cost of doing so. However, as long as production is suspended, we expect care and maintenance costs to range between $35 million and $40 million annually for the first few years. The estimated decommissioning cost for the Rabbit Lake mine site is $203 million, based on the preliminary decommissioning cost estimate that has been accepted by the Province of Saskatchewan and the CNSC.
IMPAIRMENT
In 2016, as a result of the production suspension, we recognized an impairment charge for the full carrying value of $124 million.
US ISR Operations
We operate Crow Butte and Smith Ranch-Highland. They each have their own processing facilities, but the Highland plant is currently idle.
PRODUCTION AND CURTAILMENT
At Smith Ranch-Highland, production for the year was 67% lower than in 2016. At Crow Butte, 2017 production was 67% lower than in 2016. Production at both operations was lower due to the decision to curtail production in 2016.
The Nuclear Regulatory Commission licence renewal for Smith Ranch - Highland continues.
FUTURE PRODUCTION
As a result of our decision to defer all wellfield development at the US operations, production will cease in 2018, which is expected to result in production of less than 100,000 pounds.
IMPAIRMENT
During the fourth quarter, we recorded a $184 million write down of our US assets. Due to the continued weakening of the uranium market and the reduction in mineral reserves, we concluded that it was appropriate to recognize an impairment charge for these assets. See note 8 to the financial statements.
MANAGING OUR RISKS
We manage the risks listed on pages 52 to 54.
| 68 | CAMECO CORPORATION |
Uranium – projects under evaluation
Work on our projects under evaluation has been scaled back and will continue at a pace aligned with market signals.
Millennium
Location | Saskatchewan, Canada | |
Ownership | 69.9% | |
End product | Uranium concentrates | |
Potential mine type | Underground | |
Estimated resources (our share) | 53.0 million pounds (indicated), average grade U3O8: 2.39% | |
| 20.2 million pounds (inferred), average grade U3O8: 3.19% | ||
BACKGROUND
The Millennium deposit was discovered in 2000, and was delineated through geophysical survey and surface drilling work between 2000 and 2013.
Yeelirrie
Location | Western Australia | |
Ownership | 100% | |
End product | Uranium concentrates | |
Potential mine type | Open pit | |
Estimated resources | 128.1 million pounds (measured and indicated), average grade U3O8: 0.15% | |
BACKGROUND
The deposit was discovered in 1972 and is a near-surface calcrete-style deposit that is amenable to open pit mining techniques. It is one of Australia’s largest undeveloped uranium deposits.
Kintyre
Location | Western Australia | |
Ownership | 70% | |
End product | Uranium concentrates | |
Potential mine type | Open pit | |
Estimated resources(our share) | 37.5 million pounds (indicated), average grade U3O8: 0.62% | |
| 4.2 million pounds (inferred), average grade U3O8: 0.53% | ||
BACKGROUND
The Kintyre deposit was discovered in 1985 and is amenable to open pit mining techniques.
2017 PROJECT UPDATES
We believe that we have some of the best undeveloped uranium projects in the world. However, in the current market environment our primary focus is on preserving the value of ourtier-one uranium assets. We continue to await a signal from the market that additional production is needed prior to making any new development decisions.
PLANNING FOR THE FUTURE
2018 Planned activity
No work is planned at Millennium, Yeelirrie or Kintyre. Further progress towards a development decision is not expected until market conditions improve.
MANAGING THE RISKS
For all of our projects under evaluation, we manage the risks listed on pages 52 to 54.
| MANAGEMENT’S DISCUSSION AND ANALYSIS | 69 |
Uranium – exploration and corporate development
Our exploration program is directed at replacing mineral reserves as they are depleted by our production, and is key to sustaining our business. However, during this period of weak uranium prices, and as we have ample idled production capacity, we have reduced our spending to focus only on exploration near our existing operations where we have established infrastructure and capacity to expand. In addition, we suspended our exploration in the Northern Territory, Australia. Globally, we have land with exploration and development prospects that are among the best in the world, mainly in Canada, Australia and the US. Our land holdings total 1.0 million hectares (2.5 million acres). In northern Saskatchewan alone, we have direct interests in 640,000 hectares (1.6 million acres) of land covering many of the most prospective exploration areas of the Athabasca Basin.
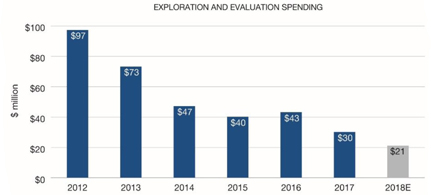
2017 UPDATE
Brownfield exploration
Brownfield exploration is uranium exploration near our existing operations, and includes expenses for advanced exploration on the evaluation of projects where uranium mineralization is being defined.
In 2017, we spent about $10 million on brownfields and projects under evaluation in Saskatchewan and Australia. At Inkai and the US operations we spent $2 million.
Regional exploration
We spent about $18 million on regional exploration programs (including support costs), primarily in Saskatchewan and, to a lesser extent, in Australia.
PLANNING FOR THE FUTURE
We will continue to focus on our core projects in Saskatchewan under our long-term exploration strategy. Long-term, we look for properties that meet our investment criteria. We may partner with other companies through strategic alliances, equity holdings and traditional joint venture arrangements. Our leadership position and industry expertise in both exploration and corporate social responsibility make us a partner of choice.
ACQUISITION PROGRAM
Currently, given the conditions in the uranium market, our extensive portfolio of reserves and resources and our belief that we have ample idle production capacity, our focus is on maintaining our investment-grade rating and preserving the value of ourtier-one assets. We expect that these assets will allow us to meet rising uranium demand with increased production from our best margin operations, and will help to mitigate risk in the event of prolonged uncertainty.
However, we continually evaluate acquisition opportunities within the nuclear fuel cycle that could add to our future supply options, support our sales activities, and complement and enhance our business in the nuclear industry. We will invest when an opportunity is available at the right time and the right price. We strive to pursue corporate development initiatives that will leave us and our shareholders in a fundamentally stronger position. As such, an acquisition opportunity is never assessed in isolation. Acquisitions must compete for investment capital with our own internal growth opportunities. They are subject to our capital allocation process described in the strategy section, starting on page 13.
| 70 | CAMECO CORPORATION |
Fuel services
Refining, conversion and fuel manufacturing
We control about 25% of world UF6 primary conversion capacity and are a supplier of natural UO2. Our focus is on cost-competitiveness and operational efficiency.
Our fuel services segment is strategically important because it helps support the growth of the uranium segment. Offering a range of products and services to customers helps us broaden our business relationships and expand our uranium market share.
Blind River Refinery
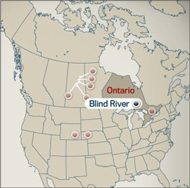 | Licensed Capacity
24.0M kgUof UO3
Licence renewal in
Feb, 2022 |
Blind River is the world’s largest commercial uranium refinery, refining uranium concentrates from mines around the world into UO3.
| Location | Ontario, Canada | |
| Ownership | 100% | |
| End product | UO3 | |
| ISO certification | ISO 14001 certified | |
| Licensed capacity | 18.0 million kgU as UO3 per year, approved to 24.0 million subject to the completion of certain equipment upgrades (advancement depends on market conditions) | |
| Licence term | Through February, 2022 | |
| Estimated decommissioning cost | $48 million | |
| MANAGEMENT’S DISCUSSION AND ANALYSIS | 71 |
Port Hope Conversion Services
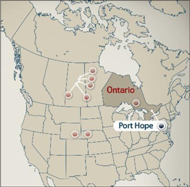 | Licensed Capacity
12.5M kgUof UF6
2.8M kgUof UO2
Licence renewal in Feb, 2027 |
Port Hope is the only uranium conversion facility in Canada and a supplier of UO2 for Canadian-made CANDU reactors.
| Location | Ontario, Canada | |
| Ownership | 100% | |
| End product | UF6, UO2 | |
| ISO certification | ISO 14001 certified | |
| Licensed capacity | 12.5 million kgU as UF6 per year | |
| 2.8 million kgU as UO2 per year | ||
| Licence term | Through February, 2027 | |
| Estimated decommissioning cost | $129 million | |
Cameco Fuel Manufacturing Inc. (CFM)
CFM produces fuel bundles and reactor components for CANDU reactors.
| Location | Ontario,Canada | |
| Ownership | 100% | |
| End product | CANDU fuel bundles and components | |
| ISO certification | ISO 9001 certified, ISO 14001 certified | |
| Licensed capacity | 1.2 million kgU as UO2 as finished bundles | |
| Licence term | Through February, 2022 | |
| Estimated decommissioning cost | $21 million | |
2017 UPDATE
Production
Fuel services produced 7.9 million kgU, 6% lower than 2016. This was a result of our decision to decrease production in response to weak market conditions.
Port Hope conversion facility cleanup and modernization (Vision in Motion)
In 2017, some early implementation aspects of the Vision in Motion project were completed and significant progress with detailed engineering was made. In 2018, detailed engineering will continue and substantial implementation activities will proceed.
Regulatory
The CNSC approved a10-year operating licence which expires on February 28, 2027.
PLANNING FOR THE FUTURE
Production
We plan to production between 9 million and 10 million kgU in 2018.
MANAGING OUR RISKS
We manage the risks listed on pages 52 to 54.
| 72 | CAMECO CORPORATION |
NUKEM
| Ownership | 100% | |
| Activity | Trading of uranium and uranium-related products | |
| 2017 sales | 7.1 million pounds U3O8 | |
BACKGROUND
In 2013, we acquired NUKEM, one of the world’s leading traders of uranium and uranium-related products.
In line with the other disciplined actions we have taken, in 2017, we made changes to the way our global marketing activities are organized. All future Canadian and international marketing activities will be consolidated in Saskatoon. These changes significantly impact the marketing activities historically performed by NUKEM. As a result, in the third quarter, we recognized an impairment charge for the full carrying value of the goodwill of $111 million.
We will continue to be active in the spot market when it makes sense for us and in support of our long-term contract portfolio. However, these activities will now largely be undertaken by our new marketing entity, Cameco Marketing Inc., based in Saskatoon.
| MANAGEMENT’S DISCUSSION AND ANALYSIS | 73 |
Mineral reserves and resources
Our mineral reserves and resources are the foundation of our company and fundamental to our success.
We have interests in a number of uranium properties. The tables in this section show the estimates of the proven and probable mineral reserves, and measured, indicated, and inferred mineral resources at those properties. However, only three of the properties listed in those tables are material uranium properties for us: McArthur River/Key Lake, Cigar Lake and Inkai. Mineral reserves and resources are all reported as of December 31, 2017 except for Inkai which for accounting purposes are reported as of January 1, 2018. Totals reported as of the end of 2017 are identical to those as of January 1, 2018.
We estimate and disclose mineral reserves and resources in five categories, using the definition standards adopted by the Canadian Institute of Mining, Metallurgy and Petroleum Council, and in accordance withNational Instrument43-101 – Standards of Disclosure for Mineral Projects (NI43-101), developed by the Canadian Securities Administrators. You can find out more about these categories at www.cim.org.
About mineral resources
Mineral resources do not have to demonstrate economic viability, but have reasonable prospects for eventual economic extraction. They fall into three categories: measured, indicated and inferred. Our reported mineral resources are exclusive of mineral reserves.
| ● | Measured and indicated mineral resourcescan be estimated with sufficient confidence to allow the appropriate application of technical, economic, marketing, legal, environmental, social and governmental factors to support evaluation of the economic viability of the deposit. |
| ● | measured resources: we can confirm both geological and grade continuity to support detailed mine planning |
| ● | indicated resources: we can reasonably assume geological and grade continuity to support mine planning |
| ● | Inferred mineral resourcesare estimated using limited geological evidence and sampling information. We do not have enough confidence to evaluate their economic viability in a meaningful way. You should not assume that all or any part of an inferred mineral resource will be upgraded to an indicated or measured mineral resource, but it is reasonably expected that the majority of inferred mineral resources could be upgraded to indicated mineral resources with continued exploration. |
Our share of uranium in the following mineral resource tables is based on our respective ownership interests. Mineral resources that are not mineral reserves have no demonstrated economic viability.
About mineral reserves
Mineral reserves are the economically mineable part of measured and/or indicated mineral resources demonstrated by at least a preliminary feasibility study. The reference point at which mineral reserves are defined is the point where the ore is delivered to the processing plant, except for ISR operations where the reference point is where the mineralization occurs under the existing or planned wellfield patterns. Mineral reserves fall into two categories:
| ● | proven reserves: the economically mineable part of a measured resource for which at least a preliminary feasibility study demonstrates that, at the time of reporting, economic extraction could be reasonably justified with a high degree of confidence |
| ● | probable reserves: the economically mineable part of a measured and/or indicated resource for which at least a preliminary feasibility study demonstrates that, at the time of reporting, economic extraction could be reasonably justified with a degree of confidence lower than that applying to proven reserves |
We use current geological models, average uranium prices of $44 to $54 (US) per pound U3O8, depending on the varying production schedules and the annual forecast realized prices, and current or projected operating costs and mine plans to estimate our mineral reserves, allowing for dilution and mining losses. We apply our standard data verification process for every estimate.
Our share of uranium in the mineral reserves table below is based on our respective ownership interests.
| 74 | CAMECO CORPORATION |
PROVEN AND PROBABLE (P+P) RESERVES, MEASURED AND INDICATED (M+I) RESOURCES, INFERRED RESOURCES
(SHOWING CHANGE FROM 2016)
at December 31, 2017
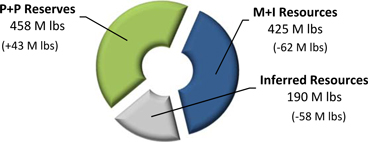
Changes this year
Our share of proven and probable mineral reserves increased from 415 million pounds U3O8 at the end of 2016, to 458 million pounds at the end of 2017. The change was primarily the result of:
| ● | JV Inkai’s amended Resource Use Contract which extended the mine life, increased the annual production level, changed our percent ownership and changed the boundaries of the mining area. This resulted in increases of 40 million pounds in proven mineral reserves, and 25 million pounds in probable mineral reserves. |
partially offset by:
| ● | production, which removed 24.5 million pounds from our mineral inventory |
Measured and indicated mineral resources decreased from 487 million pounds U3O8 at the end of 2016, to 425 million pounds at the end of 2017. Our share of inferred mineral resources is 190 million pounds U3O8, a decrease of 58 million pounds from the end of 2016. The variance in mineral resources was mainly the result of:
| ● | JV Inkai’s amended Resource Use Contract, which resulted in decreases of 23 million pounds and 45 million pounds in measured and indicated resources respectively, and a decrease of 56 million pounds in inferred resources |
partially offset by:
| ● | surface delineation drilling at Cigar Lake Phase 2 which added 7 million pounds to indicated resources |
| ● | transfer of nearly 2 million pounds to resources from reserves for the US ISR operations |
Qualified persons
The technical and scientific information discussed in this MD&A for our material properties (McArthur River/Key Lake, Cigar Lake and Inkai) was approved by the following individuals who are qualified persons for the purposes of NI43-101:
MCARTHUR RIVER/KEY LAKE
| ● | Alain G. Mainville, director, mineral resources management, Cameco |
| ● | Greg Murdock, manager, operations, McArthur River, Cameco |
| ● | Baoyao Tang, superintendent, technical, McArthur River, Cameco |
| ● | Leslie Yesnik, general manager, McArthur River/Key Lake, Cameco |
CIGAR LAKE
| ● | Scott Bishop, manager, technical services, Cameco |
| ● | Jeremy Breker, general manager, Rabbit Lake/Cigar Lake, Cameco |
| ● | Alain G. Mainville, director, mineral resources management, Cameco |
| ● | Leslie Yesnik, general manager, McArthur River/Key Lake, Cameco |
INKAI
| ● | Darryl Clark, president, Cameco Kazakhstan LLP |
| ● | Alain G. Mainville, director, mineral resources management, Cameco |
| ● | Bryan Soliz, principal geologist, Cameco Resources |
| ● | Robert Sumner, principal metallurgist, technical services, Cameco |
| MANAGEMENT’S DISCUSSION AND ANALYSIS | 75 |
Important information about mineral reserve and resource estimates
Although we have carefully prepared and verified the mineral reserve and resource figures in this document, the figures are estimates, based in part on forward-looking information.
Estimates are based on knowledge, mining experience, analysis of drilling results, the quality of available data and management’s best judgment. They are, however, imprecise by nature, may change over time, and include many variables and assumptions, including:
| ● | geological interpretation |
| ● | extraction plans |
| ● | commodity prices and currency exchange rates |
| ● | recovery rates |
| ● | operating and capital costs |
There is no assurance that the indicated levels of uranium will be produced, and we may have tore-estimate our mineral reserves based on actual production experience. Changes in the price of uranium, production costs or recovery rates could make it unprofitable for us to operate or develop a particular site or sites for a period of time. See page 2 for information about forward-looking information.
Please see our mineral reserves and resources section of our annual information form for the specific assumptions, parameters and methods used for McArthur River, Inkai and Cigar Lake mineral reserve and resource estimates.
Important information for US investors
While the terms measured, indicated and inferred mineral resources are recognized and required by Canadian securities regulatory authorities, the US Securities and Exchange Commission (SEC) does not recognize them. Under US standards, mineralization may not be classified as a ‘reserve’ unless it has been determined at the time of reporting that the mineralization could be economically and legally produced or extracted. US investors should not assume that:
| ● | any or all of a measured or indicated mineral resource will ever be converted into proven or probable mineral reserves |
| ● | any or all of an inferred mineral resource exists or is economically or legally mineable, or will ever be upgraded to a higher category. Under Canadian securities regulations, estimates of inferred resources may not form the basis of feasibility orpre-feasibility studies. Inferred resources have a great amount of uncertainty as to their existence and economic and legal feasibility. |
The requirements of Canadian securities regulators for identification of ‘reserves’ are also not the same as those of the SEC, and mineral reserves reported by us in accordance with Canadian requirements may not qualify as reserves under SEC standards.
Other information concerning descriptions of mineralization, mineral reserves and resources may not be comparable to information made public by companies that comply with the SEC’s reporting and disclosure requirements for US domestic mining companies, including Industry Guide 7.
| 76 | CAMECO CORPORATION |
Mineral reserves
As at December 31, 2017, except for Inkai which are as at January 1, 2018 (100% – only the shaded column shows our share)
PROVEN AND PROBABLE
(tonnes in thousands; pounds in millions)
| PROVEN | PROBABLE | TOTAL MINERAL RESERVES | OUR SHARE RESERVES | |||||||||||||||||||||||||||||||||||||||||||||||
| PROPERTY | MINING METHOD | TONNES | GRADE % U3O8 | CONTENT (LBS U3O8) | TONNES | GRADE % U3O8 | CONTENT (LBS U3O8) | TONNES | GRADE % U3O8 | CONTENT (LBS U3O8) | CONTENT (LBS U3O8) | METALLURGICAL RECOVERY (%) | ||||||||||||||||||||||||||||||||||||||
Cigar Lake | UG | 215.6 | 16.88 | 80.2 | 386.6 | 13.81 | 117.7 | 602.1 | 14.91 | 197.9 | 99.0 | 99 | ||||||||||||||||||||||||||||||||||||||
Key Lake | OP | 61.1 | 0.52 | 0.7 | - | - | - | 61.1 | 0.52 | 0.7 | 0.6 | 92 | ||||||||||||||||||||||||||||||||||||||
McArthur River | UG | 1,097.5 | 9.90 | 239.5 | 593.3 | 9.15 | 119.6 | 1,690.7 | 9.63 | 359.1 | 250.7 | 92 | ||||||||||||||||||||||||||||||||||||||
Inkai | ISR | 214,104.1 | 0.04 | 167.5 | 166,913.0 | 0.03 | 102.1 | 381,017.2 | 0.03 | 269.7 | 107.8 | 85 | ||||||||||||||||||||||||||||||||||||||
Total | 215,478.3 | - | 487.9 | 167,892.9 | - | 339.5 | 383,371.2 | - | 827.4 | 458.2 | - | |||||||||||||||||||||||||||||||||||||||
(UG – underground, OP – open pit, ISR – in situ recovery), totals may not add up due to rounding.
Note that the estimates in the above table:
| • | use constant dollar average uranium prices, varying per property, from $44 to $54 (US) per pound U3O8 |
| • | are based on exchange rates of $1.00 US=$1.25 Cdn and 265 Kazakhstan Tenge to $1.00 Cdn |
Our estimate of mineral reserves and mineral resources may be positively or negatively affected by the occurrence of one or more of the material risks discussed under the headingCaution about forward-looking information beginning on page 2, as well as certain property-specific risks. SeeUranium - operations starting on page 56.
Metallurgical recovery
We report mineral reserves as the quantity of contained ore supporting our mining plans, and provide an estimate of the metallurgical recovery for each uranium property. The estimate of the amount of valuable product that can be physically recovered by the metallurgical extraction process is obtained by multiplying the quantity of contained metal (content) by the planned metallurgical recovery percentage. The content and our share of uranium in the table above are before accounting for estimated metallurgical recovery.
| MANAGEMENT’S DISCUSSION AND ANALYSIS | 77 |
Mineral resources
As at December 31, 2017, except for Inkai which are as at January 1, 2018 (100% – only the shaded columns show our share)
MEASURED, INDICATED AND INFERRED
(tonnes in thousands; pounds in millions)
| MEASURED RESOURCES (M) | INDICATED RESOURCES (I) | OUR | INFERRED RESOURCES | OUR SHARE INFERRED CONTENT (LBS U3O8) | ||||||||||||||||||||||||||||||||||||||||||||||||
| PROPERTY | TONNES | GRADE % U3O8 | CONTENT (LBS U3O8) | TONNES | GRADE % U3O8 | CONTENT (LBS U3O8) | TOTAL M+I CONTENT (LBS U3O8) | SHARE TOTAL M+I CONTENT (LBS U3O8) | TONNES | GRADE % U3O8 | CONTENT (LBS U3O8) | |||||||||||||||||||||||||||||||||||||||||
Cigar Lake | 8.7 | 7.35 | 1.4 | 298.8 | 14.69 | 96.8 | 98.2 | 49.1 | 180.0 | 5.97 | 23.7 | 11.8 | ||||||||||||||||||||||||||||||||||||||||
Fox Lake | - | - | - | - | - | - | - | - | 386.7 | 7.99 | 68.1 | 53.3 | ||||||||||||||||||||||||||||||||||||||||
Kintyre | - | - | - | 3,897.7 | 0.62 | 53.5 | 53.5 | 37.5 | 517.1 | 0.53 | 6.0 | 4.2 | ||||||||||||||||||||||||||||||||||||||||
McArthur River | 89.8 | 2.71 | 5.4 | 15.6 | 4.70 | 1.6 | 7.0 | 4.9 | 76.8 | 5.01 | 8.5 | 5.9 | ||||||||||||||||||||||||||||||||||||||||
Millennium | - | - | - | 1,442.6 | 2.39 | 75.9 | 75.9 | 53.0 | 412.4 | 3.19 | 29.0 | 20.2 | ||||||||||||||||||||||||||||||||||||||||
Wheeler River | - | - | - | 166.4 | 19.13 | 70.2 | 70.2 | 18.7 | 842.5 | 2.38 | 44.1 | 11.8 | ||||||||||||||||||||||||||||||||||||||||
Rabbit Lake | - | - | - | 1,836.5 | 0.95 | 38.6 | 38.6 | 38.6 | 2,460.9 | 0.62 | 33.7 | 33.7 | ||||||||||||||||||||||||||||||||||||||||
Tamarack | - | - | - | 183.8 | 4.42 | 17.9 | 17.9 | 10.3 | 45.6 | 1.02 | 1.0 | 0.6 | ||||||||||||||||||||||||||||||||||||||||
Yeelirrie | 27,172.9 | 0.16 | 95.9 | 12,178.3 | 0.12 | 32.2 | 128.1 | 128.1 | - | - | - | - | ||||||||||||||||||||||||||||||||||||||||
Crow Butte | 1,779.4 | 0.18 | 6.9 | 1,354.9 | 0.29 | 8.6 | 15.5 | 15.5 | 1,135.2 | 0.12 | 2.9 | 2.9 | ||||||||||||||||||||||||||||||||||||||||
Gas Hills-Peach | 687.2 | 0.11 | 1.7 | 3,626.1 | 0.15 | 11.6 | 13.3 | 13.3 | 3,307.5 | 0.08 | 6.0 | 6.0 | ||||||||||||||||||||||||||||||||||||||||
Inkai | 36,680.9 | 0.03 | 21.3 | 21,132.2 | 0.02 | 10.7 | 32.0 | 12.8 | 116,394.6 | 0.03 | 75.0 | 30.0 | ||||||||||||||||||||||||||||||||||||||||
| North Butte-Brown Ranch | 910.1 | 0.08 | 1.7 | 5,530.3 | 0.07 | 8.4 | 10.0 | 10.0 | 294.5 | 0.07 | 0.4 | 0.4 | ||||||||||||||||||||||||||||||||||||||||
Ruby Ranch | - | - | - | 2,215.3 | 0.08 | 4.1 | 4.1 | 4.1 | 56.2 | 0.14 | 0.2 | 0.2 | ||||||||||||||||||||||||||||||||||||||||
Shirley Basin | 89.2 | 0.16 | 0.3 | 1,638.2 | 0.11 | 4.1 | 4.4 | 4.4 | 508.0 | 0.10 | 1.1 | 1.1 | ||||||||||||||||||||||||||||||||||||||||
Smith Ranch-Highland | 3,721.3 | 0.10 | 7.9 | 14,372.3 | 0.05 | 17.0 | 24.9 | 24.9 | 6,861.0 | 0.05 | 7.7 | 7.7 | ||||||||||||||||||||||||||||||||||||||||
Total | 71,139.6 | - | 142.5 | 69,889.1 | - | 451.2 | 593.7 | 425.3 | 133,479.0 | - | 307.5 | 189.9 | ||||||||||||||||||||||||||||||||||||||||
Totals may not add up due to rounding.
Note that mineral resources:
| • | do not include amounts that have been identified as mineral reserves |
| • | do not have demonstrated economic viability |
| 78 | CAMECO CORPORATION |
Additional information
Due to the nature of our business, we are required to make estimates that affect the amount of assets and liabilities, revenues and expenses, commitments and contingencies we report. We base our estimates on our experience, our best judgment, guidelines established by the Canadian Institute of Mining, Metallurgy and Petroleum and on assumptions we believe are reasonable.
We believe the following critical accounting estimates reflect the more significant judgments used in the preparation of our financial statements. These estimates affect all of our segments, unless otherwise noted.
Decommissioning and reclamation
In our uranium and fuel services segments, we are required to estimate the cost of decommissioning and reclamation for each operation, but we normally do not incur these costs until an asset is nearing the end of its useful life. Regulatory requirements and decommissioning methods could change during that time, making our actual costs different from our estimates. A significant change in these costs or in our mineral reserves could have a material impact on our net earnings and financial position. See note 14 to the financial statements.
Property, plant and equipment
We depreciate property, plant and equipment primarily using theunit-of-production method, where the carrying value is reduced as resources are depleted. A change in our mineral reserves would change our depreciation expenses, and such a change could have a material impact on amounts charged to earnings.
We assess the carrying values of property, plant and equipment and goodwill every year, or more often if necessary. If we determine that we cannot recover the carrying value of an asset or goodwill, we write off the unrecoverable amount against current earnings. We base our assessment of recoverability on assumptions and judgments we make about future prices, production costs, our requirements for sustaining capital and our ability to economically recover mineral reserves. A material change in any of these assumptions could have a significant impact on the potential impairment of these assets.
In performing impairment assessments of long-lived assets, assets that cannot be assessed individually are grouped together into the smallest group of assets that generates cash inflows that are largely independent of the cash inflows from other assets or groups of assets. Management is required to exercise judgment in identifying these cash generating units.
Taxes
When we are preparing our financial statements, we estimate taxes in each jurisdiction we operate in, taking into consideration different tax rates,non-deductible expenses, valuation of deferred tax assets, changes in tax laws and our expectations for future results.
We base our estimates of deferred income taxes on temporary differences between the assets and liabilities we report in our financial statements, and the assets and liabilities determined by the tax laws in the various countries we operate in. We record deferred income taxes in our financial statements based on our estimated future cash flows, which includes estimates ofnon-deductible expenses, future market conditions, production levels and intercompany sales. If these estimates are not accurate, there could be a material impact on our net earnings and financial position.
Commencement of production stage
When we determine that a mining property has reached the production stage, capitalization of development ceases, and depreciation of the mining property begins and is charged to earnings. Production is reached when management determines that the mine is able to produce at a consistent or sustainably increasing level. This determination is a matter of judgment. See note 2 to the financial statements for further information on the criteria that we used to make this assessment.
| MANAGEMENT’S DISCUSSION AND ANALYSIS | 79 |
Purchase price allocations
The purchase price related to a business combination or asset acquisition is allocated to the underlying acquired assets and liabilities based on their estimated fair values at the time of acquisition. The determination of fair value requires us to make assumptions, estimates and judgments regarding future events. The allocation process is inherently subjective and impacts the amounts assigned to individually identifiable assets and liabilities. As a result, the purchase price allocation impacts our reported assets and liabilities and future net earnings due to the impact on future depreciation and amortization expense and impairment tests.
Determination of joint control
We conduct certain operations through joint ownership interests. Judgment is required in assessing whether we have joint control over the investee, which involves determining the relevant activities of the arrangement and whether decisions around relevant activities require unanimous consent. Judgment is also required to determine whether a joint arrangement should be classified as a joint venture or joint operation. Classifying the arrangement requires us to assess our rights and obligations arising from the arrangement. Specifically, management considers the structure of the joint arrangement and whether it is structured through a separate vehicle. When structured through a separate vehicle, we also consider the rights and obligations arising from the legal form of the separate vehicle, the terms of the contractual arrangements and other facts and circumstances, when relevant. This judgment influences whether we equity account or proportionately consolidate our interest in the arrangement.
Controls and procedures
We have evaluated the effectiveness of our disclosure controls and procedures and internal control over financial reporting as of December 31, 2017, as required by the rules of the US Securities and Exchange Commission and the Canadian Securities Administrators.
Management, including our Chief Executive Officer (CEO) and our Chief Financial Officer (CFO), supervised and participated in the evaluation, and concluded that our disclosure controls and procedures are effective to provide a reasonable level of assurance that the information we are required to disclose in reports we file or submit under securities laws is recorded, processed, summarized and reported accurately, and within the time periods specified. It should be noted that, while the CEO and CFO believe that our disclosure controls and procedures provide a reasonable level of assurance that they are effective, they do not expect the disclosure controls and procedures or internal control over financial reporting to be capable of preventing all errors and fraud. A control system, no matter how well conceived or operated, can provide only reasonable, not absolute, assurance that the objectives of the control system are met.
Management, including our CEO and our CFO, is responsible for establishing and maintaining internal control over financial reporting and conducted an evaluation of the effectiveness of our internal control over financial reporting based on the Internal Control — Integrated Framework (2013) issued by the Committee of Sponsoring Organizations of the Treadway Commission (COSO). Based on this evaluation, management concluded that our internal control over financial reporting was effective as of December 31, 2017. We have not made any change to our internal control over financial reporting during the 2017 fiscal year that has materially affected, or is reasonably likely to materially affect, our internal control over financial reporting.
New standards and interpretations not yet adopted
A number of new standards and amendments to existing standards are not yet effective for the year ended December 31, 2017, and have not been applied in preparing these consolidated financial statements. We do not intend to early adopt any of the following standards or amendments to existing standards, unless otherwise noted.
IFRS 15,Revenue from Contracts with Customers(IFRS 15)–In May 2014, the International Accounting Standards Board (IASB) issued IFRS 15 which is effective for periods beginning on or after January 1, 2018 and is to be applied retrospectively. IFRS 15 clarifies the principles for recognizing revenue from contracts with customers. Our assessment primarily involved reviewing our sales contracts to determine if any performance obligations exist that will need to be separately identified that may affect the timing of when revenue will be recognized under IFRS 15. Based on our assessment, we have not identified any material impacts on the timing and measurement of revenue from our existing revenue recognition practices from the adoption of the new standard, however we do expect to have additional disclosures.
| 80 | CAMECO CORPORATION |
IFRS 9,Financial Instruments(IFRS 9) – In July 2014, the IASB issued IFRS 9 which replaces the existing guidance in IAS 39, Financial Instruments: Recognition and Measurement (IAS 39). IFRS 9 includes revised guidance on the classification and measurement of financial assets, a new expected credit loss model for calculating impairment on financial assets and new hedge accounting requirements. It also carries forward, from IAS 39, guidance on recognition and derecognition of financial instruments.
IFRS 9 is effective for annual periods beginning on or after January 1, 2018, with early adoption of the new standard permitted. We do not apply hedge accounting and do not currently intend to apply hedge accounting upon adoption of IFRS 9. Based on our assessment, we do not expect adoption of the standard to have a material impact on the financial statements, however we do expect to have additional disclosures.
IFRS 16,Leases (IFRS 16) – In January 2016, the IASB issued IFRS 16 which is effective for periods beginning on or after January 1, 2019, with early adoption permitted. IFRS 16 eliminates the current dual model for lessees, which distinguishes betweenon-balance sheet finance leases andoff-balance sheet operating leases. Instead, there is a single,on-balance sheet accounting model that is similar to current finance lease accounting. The extent of the impact of adoption of IFRS 16 has not yet been determined.
IFRIC 23,Uncertainty over Income Tax Treatments(IFRIC 23) – In June 2017, the IASB issued IFRIC 23 which is effective for periods beginning on or after January 1, 2019 with early adoption permitted. IFRIC 23 provides guidance on the accounting for current and deferred tax liabilities and assets in circumstances in which there is uncertainty over income tax treatments. The extent of the impact of the adoption of IFRIC 23 has not yet been determined.
| MANAGEMENT’S DISCUSSION AND ANALYSIS | 81 |
Cameco Corporation
2017 consolidated financial statements
February 7, 2018
| 82 | CAMECO CORPORATION |
Report of management’s accountability
The accompanying consolidated financial statements have been prepared by management in accordance with International Financial Reporting Standards as issued by the International Accounting Standards Board. Management is responsible for ensuring that these statements, which include amounts based upon estimates and judgments, are consistent with other information and operating data contained in the annual financial review and reflect the corporation’s business transactions and financial position.
Management is also responsible for the information disclosed in the management’s discussion and analysis including responsibility for the existence of appropriate information systems, procedures and controls to ensure that the information used internally by management and disclosed externally is complete and reliable in all material respects.
In addition, management is responsible for establishing and maintaining an adequate system of internal control over financial reporting. The internal control system includes an internal audit function and a code of conduct and ethics, which is communicated to all levels in the organization and requires all employees to maintain high standards in their conduct of the Company’s affairs. Such systems are designed to provide reasonable assurance that the financial information is relevant, reliable and accurate and that the Company’s assets are appropriately accounted for and adequately safeguarded. Management conducted an evaluation of the effectiveness of the system of internal control over financial reporting based on the criteria established in “Internal Control – Integrated Framework (2013)” issued by the Committee of Sponsoring Organizations of the Treadway Commission. Based on this evaluation, management concluded that the Company’s system of internal control over financial reporting was effective as at December 31, 2017.
KPMG LLP has audited the consolidated financial statements in accordance with Canadian generally accepted auditing standards and the standards of the Public Company Accounting Oversight Board (United States).
The board of directors annually appoints an audit and finance committee comprised of directors who are not employees of the corporation. This committee meets regularly with management, the internal auditor and the shareholders’ auditors to review significant accounting, reporting and internal control matters. Both the internal and shareholders’ auditors have unrestricted access to the audit and finance committee. The audit and finance committee reviews the consolidated financial statements, the report of the shareholders’ auditors, and management’s discussion and analysis and submits its report to the board of directors for formal approval.
| Original signed by Tim S. Gitzel | Original signed by Grant E. Isaac | |||
| President and Chief Executive Officer | Senior Vice-President and Chief Financial Officer | |||
| February 7, 2018 | February 7, 2018 |
| 2017 CONSOLIDATED FINANCIAL STATEMENTS AND NOTES | 83 |
Independent auditors’ report
To the Shareholders and Board of Directors of Cameco Corporation:
We have audited the accompanying consolidated financial statements of Cameco Corporation, which comprise the consolidated statements of financial position as at December 31, 2017 and December 31, 2016, the consolidated statements of earnings, comprehensive income, changes in equity and cash flows for the years then ended, and notes, comprising a summary of significant accounting policies and other explanatory information.
Management’s responsibility for the consolidated financial statements
Management is responsible for the preparation and fair presentation of these consolidated financial statements in accordance with International Financial Reporting Standards as issued by the International Accounting Standards Board, and for such internal control as management determines is necessary to enable the preparation of consolidated financial statements that are free from material misstatement, whether due to fraud or error.
Auditors’ responsibility
Our responsibility is to express an opinion on these consolidated financial statements based on our audits. We conducted our audits in accordance with Canadian generally accepted auditing standards. Those standards require that we comply with ethical requirements and plan and perform the audit to obtain reasonable assurance about whether the consolidated financial statements are free from material misstatement.
An audit involves performing procedures to obtain audit evidence about the amounts and disclosures in the consolidated financial statements. The procedures selected depend on our judgment, including the assessment of the risks of material misstatement of the consolidated financial statements, whether due to fraud or error. In making those risk assessments, we consider internal control relevant to the entity’s preparation and fair presentation of the consolidated financial statements in order to design audit procedures that are appropriate in the circumstances. An audit also includes evaluating the appropriateness of accounting policies used and the reasonableness of accounting estimates made by management, as well as evaluating the overall presentation of the consolidated financial statements.
We believe that the audit evidence we have obtained in our audits is sufficient and appropriate to provide a basis for our audit opinion.
Opinion
In our opinion, the consolidated financial statements present fairly, in all material respects, the consolidated financial position of Cameco Corporation as at December 31, 2017 and December 31, 2016 and its consolidated financial performance and its consolidated cash flows for the years then ended in accordance with International Financial Reporting Standards as issued by the International Accounting Standards Board.
| Original signed by KPMG LLP |
| Chartered Professional Accountants |
| February 7, 2018 |
| Saskatoon, Canada |
| 84 | CAMECO CORPORATION |
Consolidated statements of earnings
For the years ended December 31 ($Cdn thousands, except per share amounts) | Note | 2017 | 2016 | |||||||||
Revenue from products and services | $ | 2,156,852 | $ | 2,431,404 | ||||||||
Cost of products and services sold | 1,390,233 | 1,596,235 | ||||||||||
Depreciation and amortization | 330,345 | 371,689 | ||||||||||
Cost of sales | 1,720,578 | 1,967,924 | ||||||||||
Gross profit | 436,274 | 463,480 | ||||||||||
Administration | 163,095 | 206,652 | ||||||||||
Impairment charges | 8, 9 | 358,330 | 361,989 | |||||||||
Exploration | 29,933 | 42,579 | ||||||||||
Research and development | 5,660 | 4,952 | ||||||||||
Other operating expense (income) | 14 | 43 | (34,075 | ) | ||||||||
Loss on disposal of assets | 6,947 | 23,168 | ||||||||||
Loss from operations | (127,734 | ) | (141,785 | ) | ||||||||
Finance costs | 17 | (110,608 | ) | (111,906 | ) | |||||||
Gain on derivatives | 24 | 56,250 | 34,407 | |||||||||
Finance income | 5,265 | 4,379 | ||||||||||
Other income (expense) | 18 | (30,410 | ) | 60,671 | ||||||||
Loss before income taxes | (207,237 | ) | (154,234 | ) | ||||||||
Income tax recovery | 19 | (2,519 | ) | (94,355 | ) | |||||||
Net loss | $ | (204,718 | ) | $ | (59,879 | ) | ||||||
Net earnings (loss) attributable to: | ||||||||||||
Equity holders | (204,942 | ) | (61,611 | ) | ||||||||
Non-controlling interest | 224 | 1,732 | ||||||||||
Net loss | $ | (204,718 | ) | $ | (59,879 | ) | ||||||
Loss per common share attributable to equity holders: | ||||||||||||
Basic | 20 | $ | (0.52 | ) | $ | (0.16 | ) | |||||
Diluted | 20 | $ | (0.52 | ) | $ | (0.16 | ) | |||||
See accompanying notes to consolidated financial statements.
| 2017 CONSOLIDATED FINANCIAL STATEMENTS AND NOTES | 85 |
Consolidated statements of comprehensive income
For the years ended December 31 ($Cdn thousands) | Note | 2017 | 2016 | |||||||||
Net loss | $ | (204,718 | ) | $ | (59,879 | ) | ||||||
Other comprehensive income (loss), net of taxes: | ||||||||||||
Items that will not be reclassified to net earnings: | ||||||||||||
Remeasurements of defined benefit liability1 | 23 | (6,216 | ) | (2,109 | ) | |||||||
Items that are or may be reclassified to net earnings: | ||||||||||||
Exchange differences on translation of foreign operations | (44,080 | ) | (77,341 | ) | ||||||||
Unrealized gains onavailable-for-sale assets2 | 5,837 | 3,790 | ||||||||||
Other comprehensive loss, net of taxes | (44,459 | ) | (75,660 | ) | ||||||||
Total comprehensive loss | $ | (249,177 | ) | $ | (135,539 | ) | ||||||
Other comprehensive income (loss) attributable to: | ||||||||||||
Equity holders | $ | (44,449 | ) | $ | (75,826 | ) | ||||||
Non-controlling interest | (10 | ) | 166 | |||||||||
Other comprehensive loss for the year | $ | (44,459 | ) | $ | (75,660 | ) | ||||||
Total comprehensive income (loss) attributable to: | ||||||||||||
Equity holders | $ | (249,391 | ) | $ | (137,437 | ) | ||||||
Non-controlling interest | 214 | 1,898 | ||||||||||
Total comprehensive loss for the year | $ | (249,177 | ) | $ | (135,539 | ) | ||||||
1 Net of tax (2017 - $2,155; 2016 - $834)
2 Net of tax (2017 - $(665); 2016 - $(399))
See accompanying notes to consolidated financial statements.
| 86 | CAMECO CORPORATION |
Consolidated statements of financial position
As at December 31 ($Cdn thousands) | Note | 2017 | 2016 | |||||||||
Assets | ||||||||||||
Current assets | ||||||||||||
Cash and cash equivalents | $ | 591,620 | $ | 320,278 | ||||||||
Accounts receivable | 6 | 396,824 | 242,482 | |||||||||
Current tax assets | 11,408 | 11,552 | ||||||||||
Inventories | 7 | 949,766 | 1,287,939 | |||||||||
Supplies and prepaid expenses | 149,872 | 169,084 | ||||||||||
Current portion of long-term receivables, investments and other | 10 | 36,089 | 10,498 | |||||||||
Total current assets | 2,135,579 | 2,041,833 | ||||||||||
Property, plant and equipment | 8 | 4,191,892 | 4,655,586 | |||||||||
Goodwill and intangible assets | 9 | 70,012 | 203,310 | |||||||||
Long-term receivables, investments and other | 10 | 520,073 | 512,484 | |||||||||
Deferred tax assets | 19 | 861,171 | 835,985 | |||||||||
Totalnon-current assets | 5,643,148 | 6,207,365 | ||||||||||
Total assets | $ | 7,778,727 | $ | 8,249,198 | ||||||||
Liabilities and shareholders’ equity | ||||||||||||
Current liabilities | ||||||||||||
Accounts payable and accrued liabilities | 11 | $ | 258,405 | $ | 312,900 | |||||||
Current tax liabilities | 20,133 | 36,413 | ||||||||||
Dividends payable | 39,579 | 39,579 | ||||||||||
Current portion of other liabilities | 13 | 54,370 | 60,744 | |||||||||
Current portion of provisions | 14 | 38,507 | 19,619 | |||||||||
Total current liabilities | 410,994 | 469,255 | ||||||||||
Long-term debt | 12 | 1,494,471 | 1,493,327 | |||||||||
Other liabilities | 13 | 126,103 | 122,988 | |||||||||
Provisions | 14 | 875,033 | 889,163 | |||||||||
Deferred tax liabilities | 19 | 12,467 | 15,937 | |||||||||
Totalnon-current liabilities | 2,508,074 | 2,521,415 | ||||||||||
Shareholders’ equity | ||||||||||||
Share capital | 1,862,652 | 1,862,646 | ||||||||||
Contributed surplus | 224,812 | 216,213 | ||||||||||
Retained earnings | 2,650,417 | 3,019,872 | ||||||||||
Other components of equity | 121,407 | 159,640 | ||||||||||
Total shareholders’ equity attributable to equity holders | 4,859,288 | 5,258,371 | ||||||||||
Non-controlling interest | 371 | 157 | ||||||||||
Total shareholders’ equity | 4,859,659 | 5,258,528 | ||||||||||
Total liabilities and shareholders’ equity | $ | 7,778,727 | $ | 8,249,198 | ||||||||
Commitments and contingencies [notes 8, 14, 19]
See accompanying notes to consolidated financial statements.
| 2017 CONSOLIDATED FINANCIAL STATEMENTS AND NOTES | 87 |
Consolidated statements of changes in equity
| Attributable to equity holders | ||||||||||||||||||||||||||||||||
| ($Cdn thousands) | Share capital | Contributed surplus | Retained earnings | Foreign currency translation | Available for-sale assets | Total | Non- controlling interest | Total equity | ||||||||||||||||||||||||
Balance at January 1, 2017 | $ | 1,862,646 | $ | 216,213 | $ | 3,019,872 | $ | 156,411 | $ | 3,229 | $ | 5,258,371 | $ | 157 | $ | 5,258,528 | ||||||||||||||||
Net earnings (loss) | - | - | (204,942 | ) | - | - | (204,942 | ) | 224 | (204,718 | ) | |||||||||||||||||||||
Other comprehensive income (loss) | - | - | (6,216 | ) | (44,070 | ) | 5,837 | (44,449 | ) | (10 | ) | (44,459 | ) | |||||||||||||||||||
Total comprehensive income (loss) | - | - | (211,158 | ) | (44,070 | ) | 5,837 | (249,391 | ) | 214 | (249,177 | ) | ||||||||||||||||||||
Share-based compensation | - | 13,960 | - | - | - | 13,960 | - | 13,960 | ||||||||||||||||||||||||
Stock options exercised | 6 | (1 | ) | - | - | - | 5 | - | 5 | |||||||||||||||||||||||
Restricted and performance share units released | - | (5,360 | ) | - | - | - | (5,360 | ) | - | (5,360 | ) | |||||||||||||||||||||
Dividends | - | - | (158,297 | ) | - | - | (158,297 | ) | - | (158,297 | ) | |||||||||||||||||||||
Balance at December 31, 2017 | $ | 1,862,652 | $ | 224,812 | $ | 2,650,417 | $ | 112,341 | $ | 9,066 | $ | 4,859,288 | $ | 371 | $ | 4,859,659 | ||||||||||||||||
Balance at January 1, 2016 | $ | 1,862,646 | $ | 209,115 | $ | 3,241,902 | $ | 233,918 | $ | (561 | ) | $ | 5,547,020 | $ | (1,741 | ) | $ | 5,545,279 | ||||||||||||||
Net earnings (loss) | - | - | (61,611 | ) | - | - | (61,611 | ) | 1,732 | (59,879 | ) | |||||||||||||||||||||
Other comprehensive income (loss) | - | - | (2,109 | ) | (77,507 | ) | 3,790 | (75,826 | ) | 166 | (75,660 | ) | ||||||||||||||||||||
Total comprehensive income (loss) | - | - | (63,720 | ) | (77,507 | ) | 3,790 | (137,437 | ) | 1,898 | (135,539 | ) | ||||||||||||||||||||
Share-based compensation | - | 14,101 | - | - | - | 14,101 | - | 14,101 | ||||||||||||||||||||||||
Restricted and performance share units released | - | (7,003 | ) | - | - | - | (7,003 | ) | - | (7,003 | ) | |||||||||||||||||||||
Dividends | - | - | (158,310 | ) | - | - | (158,310 | ) | - | (158,310 | ) | |||||||||||||||||||||
Balance at December 31, 2016 | $ | 1,862,646 | $ | 216,213 | $ | 3,019,872 | $ | 156,411 | $ | 3,229 | $ | 5,258,371 | $ | 157 | $ | 5,258,528 | ||||||||||||||||
See accompanying notes to consolidated financial statements.
| 88 | CAMECO CORPORATION |
Consolidated statements of cash flows
For the years ended December 31 ($Cdn thousands) | Note | 2017 | 2016 | |||||||||
Operating activities | ||||||||||||
Net loss | $ | (204,718 | ) | $ | (59,879 | ) | ||||||
Adjustments for: | ||||||||||||
Depreciation and amortization | 330,345 | 371,689 | ||||||||||
Deferred charges | (1,101 | ) | (95,873 | ) | ||||||||
Unrealized gain on derivatives | (62,569 | ) | (110,358 | ) | ||||||||
Share-based compensation | 22 | 13,960 | 14,101 | |||||||||
Loss on disposal of assets | 6,947 | 23,168 | ||||||||||
Finance costs | 17 | 110,608 | 111,906 | |||||||||
Finance income | (5,265 | ) | (4,379 | ) | ||||||||
Impairment charges | 8, 9 | 358,330 | 361,989 | |||||||||
Other expense (income) | 18 | 30,522 | (1,630 | ) | ||||||||
Other operating expense (income) | 14 | 43 | (34,075 | ) | ||||||||
Income tax recovery | 19 | (2,519 | ) | (94,355 | ) | |||||||
Interest received | 11,592 | 1,838 | ||||||||||
Income taxes paid | (77,182 | ) | (102,628 | ) | ||||||||
Other operating items | 21 | 87,057 | (69,134 | ) | ||||||||
Net cash provided by operations | 596,050 | 312,380 | ||||||||||
Investing activities | ||||||||||||
Additions to property, plant and equipment | (114,028 | ) | (216,908 | ) | ||||||||
Decrease (increase) in long-term receivables, investments and other | 19,023 | (3,080 | ) | |||||||||
Proceeds from sale of property, plant and equipment | 1,951 | 2,168 | ||||||||||
Net cash used in investing | (93,054 | ) | (217,820 | ) | ||||||||
Financing activities | ||||||||||||
Interest paid | (69,498 | ) | (70,446 | ) | ||||||||
Proceeds from issuance of shares, stock option plan | 4 | - | ||||||||||
Dividends paid | (158,297 | ) | (158,310 | ) | ||||||||
Net cash used in financing | (227,791 | ) | (228,756 | ) | ||||||||
Increase (decrease) in cash and cash equivalents, during the year | 275,205 | (134,196 | ) | |||||||||
Exchange rate changes on foreign currency cash balances | (3,863 | ) | (4,130 | ) | ||||||||
Cash and cash equivalents, beginning of year | 320,278 | 458,604 | ||||||||||
Cash and cash equivalents, end of year | $ | 591,620 | $ | 320,278 | ||||||||
Cash and cash equivalents is comprised of: | ||||||||||||
Cash | $ | 190,174 | $ | 79,730 | ||||||||
Cash equivalents | 401,446 | 240,548 | ||||||||||
Cash and cash equivalents | $ | 591,620 | $ | 320,278 | ||||||||
See accompanying notes to consolidated financial statements.
| 2017 CONSOLIDATED FINANCIAL STATEMENTS AND NOTES | 89 |
Notes to consolidated financial statements
For the years ended December 31, 2017 and 2016
| 1. | Cameco Corporation |
Cameco Corporation is incorporated under the Canada Business Corporations Act. The address of its registered office is 2121 11th Street West, Saskatoon, Saskatchewan, S7M 1J3. The consolidated financial statements as at and for the year ended December 31, 2017 comprise Cameco Corporation and its subsidiaries (collectively, the Company or Cameco) and the Company’s interests in associates and joint arrangements. The Company is primarily engaged in the exploration for and the development, mining, refining, conversion, fabrication and trading of uranium for sale as fuel for generating electricity in nuclear power reactors in Canada and other countries.
| 2. | Significant accounting policies |
| A. | Statement of compliance |
These consolidated financial statements have been prepared in accordance with International Financial Reporting Standards (IFRS) as issued by the International Accounting Standards Board (IASB).
These consolidated financial statements were authorized for issuance by the Company’s board of directors on February 7, 2018.
| B. | Basis of presentation |
These consolidated financial statements are presented in Canadian dollars, which is the Company’s functional currency. All financial information is presented in Canadian dollars, unless otherwise noted. Amounts presented in tabular format have been rounded to the nearest thousand except per share amounts and where otherwise noted.
The consolidated financial statements have been prepared on the historical cost basis except for the following material items which are measured on an alternative basis at each reporting date:
Derivative financial instruments |
Fair value | |
| Available-for-sale financial assets | Fair value | |
| Liabilities for cash-settled share-based payment arrangements | Fair value | |
| Net defined benefit liability | Fair value of plan assets less the present value of the defined benefit obligation
|
The preparation of the consolidated financial statements in conformity with IFRS requires management to make judgments, estimates and assumptions that affect the application of accounting policies and the reported amounts of assets, liabilities, revenue and expenses. Actual results may vary from these estimates.
Estimates and underlying assumptions are reviewed on an ongoing basis. Revisions to accounting estimates are recognized in the period in which the estimates are revised and in any future periods affected. The areas involving a higher degree of judgment or complexity, or areas where assumptions and estimates are significant to the consolidated financial statements are disclosed in note 5.
This summary of significant accounting policies is a description of the accounting methods and practices that have been used in the preparation of these consolidated financial statements and is presented to assist the reader in interpreting the statements contained herein. These accounting policies have been applied consistently to all entities within the consolidated group.
| 90 | CAMECO CORPORATION |
| C. | Consolidation principles |
| i. | Business combinations |
The acquisition method of accounting is used to account for the acquisition of subsidiaries by the Company. The Company measures goodwill at the acquisition date as the fair value of the consideration transferred, including the recognized amount of anynon-controlling interests in the acquiree, less the net recognized amount (generally fair value) of the identifiable assets acquired and liabilities assumed, all measured as of the acquisition date. When the excess is negative, a bargain purchase gain is recognized immediately in earnings. In a business combination achieved in stages, the acquisition date fair value of the Company’s previously held equity interest in the acquiree is also considered in computing goodwill.
Consideration transferred includes the fair values of the assets transferred, liabilities incurred and equity interests issued by the Company. Consideration also includes the fair value of any contingent consideration and share-based compensation awards that are replaced mandatorily in a business combination.
The Company elects on atransaction-by-transaction basis whether to measure anynon-controlling interest at fair value, or at their proportionate share of the recognized amount of the identifiable net assets of the acquiree, at the acquisition date.
Acquisition-related costs are expensed as incurred, except for those costs related to the issue of debt or equity instruments.
| ii. | Subsidiaries |
The consolidated financial statements include the accounts of Cameco and its subsidiaries. Subsidiaries are entities over which the Company has control. Subsidiaries are fully consolidated from the date on which control is transferred to the Company and are deconsolidated from the date that control ceases.
| iii. | Investments in equity-accounted investees |
Cameco’s investments in equity-accounted investees include investments in associates.
Associates are those entities over which the Company has significant influence, but not control or joint control, over the financial and operating policies. Significant influence is presumed to exist when the Company holds between 20% and 50% of the voting power of another entity, but can also arise where the Company holds less than 20% if it has the power to be actively involved and influential in policy decisions affecting the entity.
Investments in associates are accounted for using the equity method. The equity method involves the recording of the initial investment at cost and the subsequent adjusting of the carrying value of the investment for Cameco’s proportionate share of the earnings or loss and any other changes in the associates’ net assets, such as dividends. The cost of the investment includes transaction costs.
Adjustments are made to align the accounting policies of the associate with those of the Company before applying the equity method. When the Company’s share of losses exceeds its interest in an equity-accounted investee, the carrying amount of that interest is reduced to zero, and the recognition of further losses is discontinued except to the extent that the Company has incurred legal or constructive obligations or made payments on behalf of the associate. If the associate subsequently reports profits, Cameco resumes recognizing its share of those profits only after its share of the profits equals the share of losses not recognized.
| iv. | Joint arrangements |
A joint arrangement can take the form of a joint operation or joint venture. All joint arrangements involve a contractual arrangement that establishes joint control.
| 2017 CONSOLIDATED FINANCIAL STATEMENTS AND NOTES | 91 |
A joint operation is a joint arrangement whereby the parties that have joint control of the arrangement have rights to the assets, and obligations for the liabilities, relating to the arrangement. A joint operation may or may not be structured through a separate vehicle. These arrangements involve joint control of one or more of the assets acquired or contributed for the purpose of the joint operation. The consolidated financial statements of the Company include its share of the assets in such joint operations, together with its share of the liabilities, revenues and expenses arising jointly or otherwise from those operations. All such amounts are measured in accordance with the terms of each arrangement.
A joint venture is a joint arrangement whereby the parties that have joint control of the arrangement have rights to the net assets of the arrangement. A joint venture is always structured through a separate vehicle. It operates in the same way as other entities, controlling the assets of the joint venture, earning its own revenue and incurring its own liabilities and expenses. Interests in joint ventures are accounted for using the equity method of accounting, whereby the Company’s proportionate interest in the assets, liabilities, revenues and expenses of jointly controlled entities are recognized on a single line in the consolidated statements of financial position and consolidated statements of earnings. The share of joint ventures results is recognized in the Company’s consolidated financial statements from the date that joint control commences until the date at which it ceases.
| v. | Transactions eliminated on consolidation |
Intra-group balances and transactions, and any unrealized income and expenses arising from intra-group transactions, are eliminated in preparing the consolidated financial statements. Unrealized gains arising from transactions with equity-accounted investees are eliminated against the investment to the extent of the Company’s interest in the investee. Unrealized losses are eliminated in the same manner as unrealized gains, but only to the extent that there is no evidence of impairment.
| D. | Foreign currency translation |
Items included in the financial statements of each of Cameco’s subsidiaries, associates and joint arrangements are measured using their functional currency, which is the currency of the primary economic environment in which the entity operates. The consolidated financial statements are presented in Canadian dollars, which is Cameco’s functional and presentation currency.
| i. | Foreign currency transactions |
Foreign currency transactions are translated into the respective functional currency of the Company and its entities using the exchange rates prevailing at the dates of the transactions. At the reporting date, monetary assets and liabilities denominated in foreign currencies are translated to the functional currency at the exchange rate at that date.Non-monetary items that are measured in terms of historical cost in a foreign currency are translated using the exchange rate at the date of the transaction. The applicable exchange gains and losses arising on these transactions are reflected in earnings with the exception of foreign exchange gains or losses on provisions for decommissioning and reclamation activities that are in a foreign currency, which are capitalized in property, plant and equipment.
| ii. | Foreign operations |
The assets and liabilities of foreign operations, including goodwill and fair value adjustments arising on acquisition, are translated to Canadian dollars at exchange rates at the reporting dates. The revenues and expenses of foreign operations are translated to Canadian dollars at exchange rates at the dates of the transactions.
Foreign currency differences are recognized in other comprehensive income. When a foreign operation is disposed of, in whole, the relevant amount in the foreign currency translation account is transferred to earnings as part of the gain or loss on disposal.
When the settlement of a monetary item receivable from or payable to a foreign operation is neither planned nor likely in the foreseeable future, foreign exchange gains and losses arising from such a monetary item are considered to form part of the net investment in a foreign operation, and are recognized in other comprehensive income and presented within equity in the foreign currency translation account.
| 92 | CAMECO CORPORATION |
| E. | Cash and cash equivalents |
Cash and cash equivalents consists of balances with financial institutions and investments in money market instruments, which have a term to maturity of three months or less at the time of purchase.
| F. | Inventories |
Inventories of broken ore, uranium concentrates, and refined and converted products are measured at the lower of cost and net realizable value.
Cost includes direct materials, direct labour, operational overhead expenses and depreciation. Net realizable value is the estimated selling price in the ordinary course of business, less the estimated costs of completion and selling expenses.
Consumable supplies and spares are valued at the lower of cost or replacement value.
| G. | Property, plant and equipment |
| i. | Buildings, plant and equipment and other |
Items of property, plant and equipment are measured at cost less accumulated depreciation and impairment charges. The cost of self-constructed assets includes the cost of materials and direct labour, borrowing costs and any other costs directly attributable to bringing the assets to the location and condition necessary for them to be capable of operating in the manner intended by management, including the initial estimate of the cost of dismantling and removing the items and restoring the site on which they are located.
When components of an item of property, plant and equipment have different useful lives, they are accounted for as separate items of property, plant and equipment and depreciated separately.
Gains and losses on disposal of an item of property, plant and equipment are determined by comparing the proceeds from disposal with the carrying amount of property, plant and equipment, and are recognized in earnings.
| ii. | Mineral properties and mine development costs |
The decision to develop a mine property within a project area is based on an assessment of the commercial viability of the property, the availability of financing and the existence of markets for the product. Once the decision to proceed to development is made, development and other expenditures relating to the project area are deferred as part of assets under construction and disclosed as a component of property, plant and equipment with the intention that these will be depreciated by charges against earnings from future mining operations. No depreciation is charged against the property until the production stage commences. After a mine property has been brought into the production stage, costs of any additional work on that property are expensed as incurred, except for large development programs, which will be deferred and depreciated over the remaining life of the related assets.
The production stage is reached when a mine property is in the condition necessary for it to be capable of operating in the manner intended by management. The criteria used to assess the start date of the production stage are determined based on the nature of each mine construction project, including the complexity of a mine site. A range of factors is considered when determining whether the production stage has been reached, which includes, but is not limited to, the demonstration of sustainable production at or near the level intended (such as the demonstration of continuous throughput levels at or above a target percentage of the design capacity).
| iii. | Depreciation |
Depreciation is calculated over the depreciable amount, which is the cost of the asset less its residual value. Assets which are unrelated to production are depreciated according to the straight-line method based on estimated useful lives as follows:
| 2017 CONSOLIDATED FINANCIAL STATEMENTS AND NOTES | 93 |
Land | Not depreciated | |
Buildings | 15 - 25 years | |
Plant and equipment | 3 - 15 years | |
Furniture and fixtures | 3 - 10 years | |
Other
| 3 - 5 years
| |
Mining properties and certain mining and conversion assets for which the economic benefits from the asset are consumed in a pattern which is linked to the production level are depreciated according to theunit-of-production method. For conversion assets, the amount of depreciation is measured by the portion of the facilities’ total estimated lifetime production that is produced in that period. For mining assets and properties, the amount of depreciation or depletion is measured by the portion of the mines’ proven and probable mineral reserves recovered during the period.
Depreciation methods, useful lives and residual values are reviewed at each reporting period and are adjusted if appropriate.
| iv. | Borrowing costs |
Borrowing costs on funds directly attributable to finance the acquisition, production or construction of a qualifying asset are capitalized until such time as substantially all the activities necessary to prepare the qualifying asset for its intended use are complete. A qualifying asset is one that takes a substantial period of time to prepare for its intended use. Capitalization is discontinued when the asset enters the production stage or development ceases. Where the funds used to finance a project form part of general borrowings, interest is capitalized based on the weighted average interest rate applicable to the general borrowings outstanding during the period of construction.
| v. | Repairs and maintenance |
The cost of replacing a component of property, plant and equipment is capitalized if it is probable that future economic benefits embodied within the component will flow to the Company. The carrying amount of the replaced component is derecognized. Costs of routine maintenance and repair are charged to products and services sold.
| H. | Goodwill and intangible assets |
Goodwill arising from the acquisition of subsidiaries is initially recognized at cost, measured as the excess of the fair value of the consideration paid over the fair value of the identifiable net assets acquired. At the date of acquisition, goodwill is allocated to the cash generating unit (CGU), or group of CGUs that is expected to receive the economic benefits of the business combination. Goodwill is subsequently measured at cost, less accumulated impairment losses.
Intangible assets acquired individually or as part of a group of assets are initially recognized at cost and measured subsequently at cost less accumulated amortization and impairment losses. Subsequent expenditure is capitalized only when it increases the future economic benefits embodied in the specific asset to which it relates. The cost of a group of intangible assets acquired in a transaction, including those acquired in a business combination that meet the specified criteria for recognition apart from goodwill, is allocated to the individual assets acquired based on their relative fair values.
Intangible assets that have finite useful lives are amortized over their estimated remaining useful lives.Amortization methods and useful lives are reviewed at each reporting period and are adjusted if appropriate.
| I. | Leased assets |
Leases which result in the Company receiving substantially all the risks and rewards of ownership are classified as finance leases. Upon initial recognition, the leased asset is measured at an amount equal to the lower of its fair value and the present value of the minimum lease payments. Subsequent to initial recognition, the asset is accounted for in accordance with the accounting policy applicable to that asset. Minimum lease payments made under finance leases are apportioned between finance cost and the reduction of the outstanding liability. The finance cost is allocated to each period of the lease term to produce a constant periodic rate of interest on the remaining balance of the liability.
| 94 | CAMECO CORPORATION |
Lease agreements that do not meet the recognition criteria of a finance lease are classified and recognized as operating leases and are not recognized in the Company’s consolidated statements of financial position. Payments made under operating leases are charged to income on a straight-line basis over the lease term.
| J. | Finance income and finance costs |
Finance income comprises interest income on funds invested and gains on the disposal ofavailable-for-sale financial assets. Interest income and interest expense are recognized in earnings as they accrue, using the effective interest method. Finance costs comprise interest and fees on borrowings, unwinding of the discount on provisions and costs incurred on redemption of debentures.
Borrowing costs that are not directly attributable to the acquisition, construction or production of a qualifying asset are expensed in the period incurred.
| K. | Research and development costs |
Expenditures on research are charged against earnings when incurred. Development costs are recognized as assets when the Company can demonstrate technical feasibility and that the asset will generate probable future economic benefits.
| L. | Impairment |
| i. | Non-derivative financial assets |
Financial assets not classified as fair value through profit and loss are assessed at each reporting date to determine whether there is objective evidence of impairment. Objective evidence that financial assets (including equity securities) are impaired can include default or delinquency by a debtor, restructuring of an amount due to the Company on terms that the Company would not consider otherwise, indications that a debtor or issuer will enter bankruptcy, or the disappearance of an active market for a security. In addition, for an investment in an equity security, a significant or prolonged decline in its fair value below its cost is objective evidence of impairment.
Impairment losses onavailable-for-sale financial assets are recognized by transferring the cumulative loss that has been recognized in other comprehensive income, and presented in equity, to earnings. The cumulative loss that is removed from other comprehensive income and recognized in earnings is the difference between the acquisition cost, net of any principal payment and amortization, and the current fair value, less any impairment loss previously recognized in earnings.
If, in a subsequent period, the fair value of an impairedavailable-for-sale debt security increases and the increase can be related objectively to an event occurring after the impairment loss was recognized in earnings, then the impairment loss is reversed through earnings, otherwise, it is reversed through other comprehensive income. Impairment losses onavailable-for-sale equity securities that are recognized in earnings are never reversed through earnings.
| ii. | Non-financial assets |
The carrying amounts of Cameco’snon-financial assets are reviewed at each reporting date to determine whether there is any indication of impairment. If any such indication exists, then the asset’s recoverable amount is estimated. Goodwill is tested annually for impairment.
For impairment testing, assets are grouped together into CGUs which are the smallest group of assets that generate cash inflows from continuing use that are largely independent of the cash inflows of other assets or CGUs. Goodwill arising from a business combination is allocated to CGUs or groups of CGUs that are expected to benefit from the synergies of the combination.
| 2017 CONSOLIDATED FINANCIAL STATEMENTS AND NOTES | 95 |
The recoverable amount of an asset or CGU is the greater of its value in use and its fair value less costs to sell. Value in use is based on the estimated future cash flows, discounted to their present value using apre-tax discount rate that reflects current market assessments of the time value of money and the risks specific to the asset or CGU. Fair value is determined as the amount that would be obtained from the sale of the asset or CGU in anarm’s-length transaction between knowledgeable and willing parties. For exploration properties, fair value is based on the implied fair value of the resources in place using comparable market transaction metrics.
An impairment loss is recognized if the carrying amount of an asset or its CGU exceeds its recoverable amount. Impairment losses are recognized in earnings. Impairment losses recognized in respect of CGUs are allocated first to reduce the carrying amount of any goodwill allocated to the CGU, and then to reduce the carrying amounts of the other assets in the CGU on a pro rata basis.
Impairment losses recognized in prior periods are assessed at each reporting date whenever events or changes in circumstances indicate that the impairment may have reversed. If the impairment has reversed, the carrying amount of the asset is increased to its recoverable amount. An impairment loss is reversed only to the extent that the asset’s carrying amount does not exceed the carrying amount that would have been determined, net of depreciation or amortization, if no impairment loss had been recognized. A reversal of an impairment loss is recognized immediately in earnings. An impairment loss in respect of goodwill is not reversed.
| M. | Exploration and evaluation expenditures |
Exploration and evaluation expenditures are those expenditures incurred by the Company in connection with the exploration for and evaluation of mineral resources before the technical feasibility and commercial viability of extracting a mineral resource are demonstrable. These expenditures include researching and analyzing existing exploration data, conducting geological studies, exploratory drilling and sampling, and compiling prefeasibility and feasibility studies. Exploration and evaluation expenditures are charged against earnings as incurred, except when there is a high degree of confidence in the viability of the project and it is probable that these costs will be recovered through future development and exploitation.
The technical feasibility and commercial viability of extracting a resource is considered to be determinable based on several factors, including the existence of proven and probable reserves and the demonstration that future economic benefits are probable. When an area is determined to be technically feasible and commercially viable, the exploration and evaluation assets attributable to that area are first tested for impairment and then transferred to property, plant and equipment.
Exploration and evaluation costs that have been acquired in a business combination or asset acquisition are capitalized under the scope of IFRS 6,Exploration for and Evaluation of Mineral Resources, and are reported as part of property, plant and equipment.
| N. | Provisions |
A provision is recognized if, as a result of a past event, the Company has a present legal or constructive obligation that can be estimated reliably, and it is probable that an outflow of economic benefits will be required to settle the obligation. Provisions are determined by discounting the risk-adjusted expected future cash flows at apre-tax risk-free rate that reflects current market assessments of the time value of money. The unwinding of the discount is recognized as a finance cost.
| 96 | CAMECO CORPORATION |
| i. | Environmental restoration |
The mining, extraction and processing activities of the Company normally give rise to obligations for site closure and environmental restoration. Closure and restoration can include facility decommissioning and dismantling, removal or treatment of waste materials, as well as site and land restoration. The Company provides for the closure, reclamation and decommissioning of its operating sites in the financial period when the related environmental disturbance occurs, based on the estimated future costs using information available at the reporting date. Costs included in the provision comprise all closure and restoration activity expected to occur gradually over the life of the operation and at the time of closure. Routine operating costs that may impact the ultimate closure and restoration activities, such as waste material handling conducted as a normal part of a mining or production process, are not included in the provision.
The timing of the actual closure and restoration expenditure is dependent upon a number of factors such as the life and nature of the asset, the operating licence conditions and the environment in which the mine operates. Closure and restoration provisions are measured at the expected value of future cash flows, discounted to their present value using a currentpre-tax risk-free rate. Significant judgments and estimates are involved in deriving the expectations of future activities and the amount and timing of the associated cash flows.
At the time a provision is initially recognized, to the extent that it is probable that future economic benefits associated with the reclamation, decommissioning and restoration expenditure will flow to the Company, the corresponding cost is capitalized as an asset. The capitalized cost of closure and restoration activities is recognized in property, plant and equipment and depreciated on aunit-of-production basis. The value of the provision is gradually increased over time as the effect of discounting unwinds. The unwinding of the discount is an expense recognized in finance costs.
Closure and rehabilitation provisions are also adjusted for changes in estimates. The provision is reviewed at each reporting date for changes to obligations, legislation or discount rates that effect change in cost estimates or life of operations. The cost of the related asset is adjusted for changes in the provision resulting from changes in estimated cash flows or discount rates, and the adjusted cost of the asset is depreciated prospectively.
| ii. | Waste disposal |
The refining, conversion and manufacturing processes generate certain uranium-contaminated waste. The Company has established strict procedures to ensure this waste is disposed of safely. A provision for waste disposal costs in respect of these materials is recognized when they are generated. Costs associated with the disposal, the timing of cash flows and discount rates are estimated both at initial recognition and subsequent measurement.
| O. | Employee future benefits |
| i. | Pension obligations |
The Company accrues its obligations under employee benefit plans. The Company has both defined benefit and defined contribution plans. A defined contribution plan is a pension plan under which the Company pays fixed contributions into a separate entity. The Company has no legal or constructive obligations to pay further contributions if the fund does not hold sufficient assets to pay all employees the benefits relating to employee service in the current and prior periods. A defined benefit plan is a pension plan other than a defined contribution plan. Typically, defined benefit plans define an amount of pension benefit that an employee will receive on retirement, usually dependent on one or more factors such as age, years of service and compensation.
| 2017 CONSOLIDATED FINANCIAL STATEMENTS AND NOTES | 97 |
The liability recognized in the consolidated statements of financial position in respect of defined benefit pension plans is the present value of the defined benefit obligation at the reporting date less the fair value of plan assets. The defined benefit obligation is calculated annually, by qualified independent actuaries using the projected unit credit method prorated on service and management’s best estimate of expected plan investment performance, salary escalation, retirement ages of employees and expected health care costs. The present value of the defined benefit obligation is determined by discounting the estimated future cash outflows using interest rates of high-quality corporate bonds that are denominated in the currency in which the benefits will be paid, and that have terms to maturity approximating the terms of the related pension liability.
The Company recognizes all actuarial gains and losses arising from defined benefit plans in other comprehensive income, and reports them in retained earnings. When the benefits of a plan are improved, the portion of the increased benefit relating to past service by employees is recognized immediately in earnings.
For defined contribution plans, the contributions are recognized as employee benefit expense in earnings in the periods during which services are rendered by employees. Prepaid contributions are recognized as an asset to the extent that a cash refund or a reduction in future payments is available.
| ii. | Other post-retirement benefit plans |
The Company provides certain post-retirement health care benefits to its retirees. The entitlement to these benefits is usually conditional on the employee remaining in service up to retirement age and the completion of a minimum service period. The expected costs of these benefits are accrued over the period of employment using the same accounting methodology as used for defined benefit pension plans. Actuarial gains and losses are recognized in other comprehensive income in the period in which they arise. These obligations are valued annually by independent qualified actuaries.
| iii. | Short-term employee benefits |
Short-term employee benefit obligations are measured on an undiscounted basis and are expensed as the related service is provided. A liability is recognized for the amount expected to be paid under short-term cash bonus plans if the Company has a present legal or constructive obligation to pay this amount as a result of past service provided by the employee, and the obligation can be measured reliably.
| iv. | Termination benefits |
Termination benefits are payable when employment is terminated by the Company before the normal retirement date, or whenever an employee accepts an entity’s offer of benefits in exchange for termination of employment. Cameco recognizes termination benefits as an expense at the earlier of when the Company can no longer withdraw the offer of those benefits and when the Company recognizes costs for a restructuring. If benefits are payable more than 12 months after the reporting period, they are discounted to their present value.
| v. | Share-based compensation |
For equity-settled plans, the grant date fair value of share-based compensation awards granted to employees is recognized as an employee benefit expense, with a corresponding increase in equity, over the period that the employees unconditionally become entitled to the awards. The amount recognized as an expense is adjusted to reflect the number of awards for which the related service and vesting conditions are expected to be met, such that the amount ultimately recognized as an expense is based on the number of awards that meet the related service andnon-market performance conditions at the vesting date.
For cash-settled plans, the fair value of the amount payable to employees is recognized as an expense, with a corresponding increase in liabilities, over the period that the employees unconditionally become entitled to payment. The liability isre-measured at each reporting date and at settlement date. Any changes in the fair value of the liability are recognized as employee benefit expense in earnings.
| 98 | CAMECO CORPORATION |
Cameco’s contributions under the employee share ownership plan are expensed during the year of contribution. Shares purchased with Company contributions and with dividends paid on such shares become unrestricted on January 1 of the second plan year following the date on which such shares were purchased.
| P. | Revenue recognition |
Cameco supplies uranium concentrates and uranium conversion services to utility customers.
Cameco recognizes revenue on the sale of its nuclear products when the risks and rewards of ownership pass to the customer and collection is reasonably assured. Cameco’s sales are pursuant to an enforceable contract that indicates the type of sales arrangement, pricing and delivery terms, as well as details related to the transfer of title.
Cameco has three types of sales arrangements with its customers in its uranium and fuel services businesses. These arrangements include uranium supply, toll conversion services and conversion supply (converted uranium), which is a combination of uranium supply and toll conversion services.
Uranium supply
In a uranium supply arrangement, Cameco is contractually obligated to provide uranium concentrates to its customers. Cameco-owned uranium is physically delivered to conversion facilities (Converters) where the Converter will credit Cameco’s account for the volume of accepted uranium. Based on delivery terms in a sales contract with its customer, Cameco instructs the Converter to transfer title of a contractually specified quantity of uranium to the customer’s account at the Converter’s facility. At this point, the risks and rewards of ownership have been transferred and Cameco invoices the customer and recognizes revenue for the uranium supply.
Toll conversion services
In a toll conversion arrangement, Cameco is contractually obligated to convert customer-owned uranium to a chemical state suitable for enrichment. Based on delivery terms in a sales contract with its customer, Cameco either (i) physically delivers converted uranium to enrichment facilities (Enrichers) where it instructs the Enricher to transfer title of a contractually specified quantity of converted uranium to the customer’s account at the Enricher’s facility, or (ii) transfers title of a contractually specified quantity of converted uranium to either an Enricher’s account or the customer’s account. At this point, the risks and rewards of ownership have been transferred and Cameco invoices the customer and recognizes revenue for the toll conversion services.
Conversion supply
In a conversion supply arrangement, Cameco is contractually obligated to provide converted uranium of acceptable origins to its customers. Based on delivery terms in a sales contract with its customer, Cameco either (i) physically delivers converted uranium to the Enricher where it instructs the Enricher to transfer title of a contractually specified quantity of converted uranium to the customer’s account at the Enricher’s facility, or (ii) transfers title of a contractually specified quantity of converted uranium to either an Enricher’s account or a customer’s account at Cameco’s Port Hope conversion facility. At this point, the risks and rewards of ownership have been transferred and Cameco invoices the customer and recognizes revenue for both the uranium supplied and the conversion service provided.
| Q. | Financial instruments |
A financial instrument is any contract that gives rise to a financial asset of one entity and a financial liability or equity instrument of another.
| i. | Non-derivative financial assets and financial liabilities |
At initial recognition, Cameco classifies each of its financial assets and financial liabilities into one of the following categories:
| 2017 CONSOLIDATED FINANCIAL STATEMENTS AND NOTES | 99 |
Fair value through profit or loss
A financial asset or liability is classified as at fair value through profit or loss if it is classified asheld-for-trading or is designated as such on initial recognition. Cameco classifies a financial instrument asheld-for-trading if it was acquired principally for the purpose of selling or repurchasing in the near term, or if it is part of a portfolio with evidence of a recent pattern of short-term profit taking. Directly attributable transaction costs are recognized in earnings as incurred. These financial assets and financial liabilities are measured at fair value, with any gains or losses on revaluation being recognized in earnings.
Held-to-maturity
Held-to-maturity investments are financial assets that an entity has the intention and ability to hold until maturity, provide fixed or determinable payments and contain a fixed maturity date. Assets in this category are initially measured at fair value plus any directly attributable transaction costs and subsequently measured at amortized cost using the effective interest method.
Loans and receivables
Loans and receivables are financial assets that provide fixed or determinable payments and are not quoted in an active market. Assets in this category are initially measured at fair value plus any directly attributable transaction costs and subsequently measured at amortized cost using the effective interest method.
Available-for-sale assets
Available-for-sale financial assets arenon-derivative financial assets that are either designated in this category or not classified into any of the other categories. These assets are measured at fair value plus any directly attributable transaction costs with any gains or losses onre-measurement recognized in other comprehensive income. Accumulated changes in fair value are recorded as a separate component of equity until the asset is derecognized or impaired, then the cumulative gain or loss in other comprehensive income is transferred to earnings.
Other financial liabilities
This category consists of allnon-derivative financial liabilities that do not meet the definition ofheld-for-trading liabilities, and that have not been designated as liabilities at fair value through profit or loss. These liabilities are initially recognized at fair value less any directly attributable transaction costs and are subsequently measured at amortized cost using the effective interest method. Transaction costs arising on the issue of equity instruments are recognized directly in equity. Transaction costs that are directly related to the probable issuance of a security that is classified as a financial liability is deducted from the amount of the financial liability when it is initially recognized, or recognized in earnings when the issuance is no longer probable.
Cameco derecognizes a financial asset when the contractual rights to the cash flows from the asset expire, or it transfers the rights to receive the contractual cash flows in a transaction in which substantially all of the risks and rewards of ownership of the financial asset are transferred.
A financial liability is derecognized when its contractual obligations are discharged or cancelled, or expire.
| ii. | Derivative financial instruments |
The Company holds derivative financial instruments to reduce exposure to fluctuations in foreign currency exchange rates and interest rates. Except for those designated as hedging instruments, all derivative financial instruments are recorded at fair value in the consolidated statements of financial position, with any directly attributable transaction costs recognized in earnings as incurred. Subsequent to initial recognition, changes in fair value are recognized in earnings.
The purpose of hedging transactions is to modify the Company’s exposure to one or more risks by creating an offset between changes in the fair value of, or the cash flows attributable to, the hedged item and the hedging item. When hedge accounting is appropriate, the hedging relationship is designated as a fair value hedge, a cash flow hedge, or a foreign currency risk hedge related to a net investment in a foreign operation. The Company does not have any instruments that have been designated as hedge transactions at December 31, 2017 and 2016.
| 100 | CAMECO CORPORATION |
Separable embedded derivatives
Derivatives may be embedded in other financial instruments or executory contracts (the “host instrument”). Embedded derivatives are treated as separate derivatives when their economic characteristics and risks are not clearly and closely related to those of the host instrument, the terms of the embedded derivative are the same as those of a stand-alone derivative, and the combined contract is not designated at fair value. These embedded derivatives are measured at fair value with subsequent changes recognized in earnings through gains or losses on derivatives.
| R. | Income tax |
Income tax expense is comprised of current and deferred taxes. Current tax and deferred tax are recognized in earnings except to the extent that it relates to a business combination, or items recognized directly in equity or in other comprehensive income.
Current tax is the expected tax payable or receivable on the taxable income or loss for the year, using tax rates enacted or substantially enacted at the reporting date, and any adjustments to tax payable in respect of previous years. Current tax assets and liabilities are measured at the amount expected to be paid or recovered from the taxation authorities.
Deferred tax is recognized in respect of temporary differences between the carrying amounts of assets and liabilities for financial reporting purposes and the amounts used for taxation purposes. In addition, deferred tax is not recognized for taxable temporary differences arising on the initial recognition of goodwill. Deferred tax is measured at the tax rates that are expected to be applied to temporary differences when they reverse, based on the laws that have been enacted or substantively enacted by the reporting date. Deferred tax assets and liabilities are offset if there is a legally enforceable right to offset current tax liabilities and assets, and they relate to income taxes levied by the same tax authority on the same taxable entity, or on different tax entities, but they intend to settle current tax liabilities and assets on a net basis or their tax assets and liabilities will be realized simultaneously.
A deferred tax asset is recognized for unused tax losses, tax credits and deductible temporary differences, to the extent that it is probable that future taxable profits will be available against which they can be utilized. Deferred tax assets are reviewed at each reporting date and are reduced to the extent that it is no longer probable that the related tax benefit will be realized.
The Company’s exposure to uncertain tax positions is evaluated and a provision is made where it is probable that this exposure will materialize.
| S. | Share capital |
Common shares are classified as equity. Incremental costs directly attributable to the issue of common shares are recognized as a reduction of equity, net of any tax effects.
| T. | Earnings per share |
The Company presents basic and diluted earnings per share data for its common shares. Earnings per share is calculated by dividing the net earnings attributable to equity holders of the Company by the weighted average number of common shares outstanding.
Diluted earnings per share is determined by adjusting the net earnings attributable to equity holders of the Company and the weighted average number of common shares outstanding, for the effects of all dilutive potential common shares. The calculation of diluted earnings per share assumes that outstanding options which are dilutive to earnings per share are exercised and the proceeds are used to repurchase shares of the Company at the average market price of the shares for the period. The effect is to increase the number of shares used to calculate diluted earnings per share.
| 2017 CONSOLIDATED FINANCIAL STATEMENTS AND NOTES | 101 |
| U. | Segment reporting |
An operating segment is a component of the Company that engages in business activities from which it may earn revenues and incur expenses, including revenues and expenses that relate to transactions with any of the Company’s other segments. To be classified as a segment, discrete financial information must be available and operating results must be regularly reviewed by the Company’s Chief Executive Officer.
Segment capital expenditure is the total cost incurred during the period to acquire property, plant and equipment, and intangible assets other than goodwill.
| 3. | Accounting standards |
| A. | New standards and interpretations not yet adopted |
A number of new standards and amendments to existing standards are not yet effective for the year ended December 31, 2017, and have not been applied in preparing these consolidated financial statements. Cameco does not intend to early adopt any of the following standards or amendments to existing standards, unless otherwise noted.
| i. | Revenue |
In May 2014, the International Accounting Standards Board (IASB) issued IFRS 15, Revenue from Contracts with Customers (IFRS 15). IFRS 15 is effective for periods beginning on or after January 1, 2018 and is to be applied retrospectively. IFRS 15 clarifies the principles for recognizing revenue from contracts with customers. Our assessment primarily involved reviewing our sales contracts to determine if any performance obligations exist that will need to be separately identified that may affect the timing of when revenue will be recognized under IFRS 15. Based on our assessment, Cameco has not identified any material impacts on the timing and measurement of revenue from our existing revenue recognition practices from the adoption of the new standard, however we do expect to have additional disclosures.
| ii. | Financial instruments |
In July 2014, the IASB issued IFRS 9, Financial Instruments (IFRS 9). IFRS 9 replaces the existing guidance in IAS 39, Financial Instruments: Recognition and Measurement (IAS 39). IFRS 9 includes revised guidance on the classification and measurement of financial assets, a new expected credit loss model for calculating impairment on financial assets and new hedge accounting requirements. It also carries forward, from IAS 39, guidance on recognition and derecognition of financial instruments.
IFRS 9 is effective for annual periods beginning on or after January 1, 2018, with early adoption of the new standard permitted. Cameco does not apply hedge accounting and does not currently intend to apply hedge accounting upon adoption of IFRS 9. Based on our assessment, we do not expect adoption of the standard to have a material impact on the financial statements, however we do expect to have additional disclosures.
| iii. | Leases |
In January 2016, the IASB issued IFRS 16, Leases (IFRS 16). IFRS 16 is effective for periods beginning on or after January 1, 2019, with early adoption permitted. IFRS 16 eliminates the current dual model for lessees, which distinguishes betweenon-balance sheet finance leases andoff-balance sheet operating leases. Instead, there is a single,on-balance sheet accounting model that is similar to current finance lease accounting. The extent of the impact of adoption of IFRS 16 has not yet been determined.
| 102 | CAMECO CORPORATION |
| iv. | Income tax |
In June 2017, the IASB issued IFRIC 23,Uncertainty over Income Tax Treatments(IFRIC 23).IFRIC 23 is effective for periods beginning on or after January 1, 2019 with early adoption permitted. IFRIC 23 provides guidance on the accounting for current and deferred tax liabilities and assets in circumstances in which there is uncertainty over income tax treatments. The extent of the impact of the adoption of IFRIC 23 has not yet been determined.
| 4. | Determination of fair values |
A number of the Company’s accounting policies and disclosures require the measurement of fair value, for both financial andnon-financial assets and liabilities.
The fair value of an asset or liability is generally estimated as the amount that would be received on sale of an asset, or paid to transfer a liability in an orderly transaction between market participants at the reporting date. Fair values of assets and liabilities traded in an active market are determined by reference to last quoted prices, in the principal market for the asset or liability. In the absence of an active market for an asset or liability, fair values are determined based on market quotes for assets or liabilities with similar characteristics and risk profiles, or through other valuation techniques. Fair values determined using valuation techniques require the use of inputs, which are obtained from external, readily observable market data when available. In some circumstances, inputs that are not based on observable data must be used. In these cases, the estimated fair values may be adjusted in order to account for valuation uncertainty, or to reflect the assumptions that market participants would use in pricing the asset or liability.
All fair value measurements are categorized into one of three hierarchy levels, described below, for disclosure purposes. Each level is based on the transparency of the inputs used to measure the fair values of assets and liabilities:
Level 1 – Values based on unadjusted quoted prices in active markets that are accessible at the reporting date for identical assets or liabilities.
Level 2 – Values based on quoted prices in markets that are not active or model inputs that are observable either directly or indirectly for substantially the full term of the asset or liability.
Level 3 – Values based on prices or valuation techniques that require inputs that are both unobservable and significant to the overall fair value measurement.
When the inputs used to measure fair value fall within more than one level of the hierarchy, the level within which the fair value measurement is categorized is based on the lowest level input that is significant to the fair value measurement in its entirety.
Transfers between levels of the fair value hierarchy are recognized at the end of the reporting period during which the transfer occurred. There were no transfers between level 1, level 2, or level 3 during the period. Cameco does not have any recurring fair value measurements that are categorized as level 3 as of the reporting date.
Further information about the techniques and assumptions used to measure fair values is included in the following notes:
Note 8 - Property, plant and equipment
Note 9 - Goodwill and intangible assets
Note 22 - Share-based compensation plans
Note 24 - Financial instruments and risk management
| 5. | Use of estimates and judgments |
The preparation of the consolidated financial statements in conformity with IFRS requires management to make judgments, estimates and assumptions that affect the application of accounting policies and the reported amounts of assets, liabilities, revenues and expenses. Actual results may differ from these estimates.
| 2017 CONSOLIDATED FINANCIAL STATEMENTS AND NOTES | 103 |
Estimates and underlying assumptions are reviewed on an ongoing basis. Revisions to accounting estimates are recognized in the period in which the estimates are revised and in any future period affected.
Information about critical judgments in applying the accounting policies that have the most significant effect on the amounts recognized in the consolidated financial statements is discussed below. Further details of the nature of these judgments, estimates and assumptions may be found in the relevant notes to the consolidated financial statements.
| A. | Recoverability of long-lived and intangible assets |
Cameco assesses the carrying values of property, plant and equipment, and intangible assets when there is an indication of possible impairment. Goodwill and intangible assets not yet available for use or with indefinite useful lives are tested for impairment annually. If it is determined that carrying values of assets or goodwill cannot be recovered, the unrecoverable amounts are charged against current earnings. Recoverability is dependent upon assumptions and judgments regarding market conditions, costs of production, sustaining capital requirements and mineral reserves. Other assumptions used in the calculation of recoverable amounts are discount rates, future cash flows and profit margins. A material change in assumptions may significantly impact the potential impairment of these assets.
| B. | Cash generating units |
In performing impairment assessments of long-lived assets, assets that cannot be assessed individually are grouped together into the smallest group of assets that generates cash inflows that are largely independent of the cash inflows from other assets or groups of assets. Management is required to exercise judgment in identifying these CGUs.
| C. | Provisions for decommissioning and reclamation of assets |
Significant decommissioning and reclamation activities are often not undertaken until near the end of the useful lives of the productive assets. Regulatory requirements and alternatives with respect to these activities are subject to change over time. A significant change to either the estimated costs or mineral reserves may result in a material change in the amount charged to earnings.
| D. | Income taxes |
Cameco operates in a number of tax jurisdictions and is, therefore, required to estimate its income taxes in each of these tax jurisdictions in preparing its consolidated financial statements. In calculating income taxes, consideration is given to factors such as tax rates in the different jurisdictions,non-deductible expenses, changes in tax law and management’s expectations of future operating results. Cameco estimates deferred income taxes based on temporary differences between the income and losses reported in its consolidated financial statements and its taxable income and losses as determined under the applicable tax laws. The tax effect of these temporary differences is recorded as deferred tax assets or liabilities in the consolidated financial statements. The calculation of income taxes requires the use of judgment and estimates. The determination of the recoverability of deferred tax assets is dependent on assumptions and judgments regarding future market conditions, production rates and intercompany sales. If these judgments and estimates prove to be inaccurate, future earnings may be materially impacted.
| E. | Commencement of production stage |
Until a mining property is declared as being in the production stage, all costs related to its development are capitalized. The determination of the date on which a mine enters the production stage is a matter of judgment that impacts when capitalization of development costs ceases and depreciation of the mining property commences and is charged to earnings. Refer to note 2 (g)(ii) for further information on the criteria used to make this assessment.
| 104 | CAMECO CORPORATION |
| F. | Mineral reserves |
Depreciation on property, plant and equipment is primarily calculated using theunit-of-production method. This method allocates the cost of an asset to each period based on current period production as a portion of total lifetime production or a portion of estimated mineral reserves. Estimates oflife-of-mine and amounts of mineral reserves are updated annually and are subject to judgment and significant change over time. If actual mineral reserves prove to be significantly different than the estimates, there could be a material impact on the amounts of depreciation charged to earnings.
| G. | Purchase price allocations |
The purchase price related to a business combination or asset acquisition is allocated to the underlying acquired assets and liabilities based on their estimated fair values at the time of acquisition. The determination of fair value requires Cameco to make assumptions, estimates and judgments regarding future events. The allocation process is inherently subjective and impacts the amounts assigned to individually identifiable assets and liabilities. As a result, the purchase price allocation impacts Cameco’s reported assets and liabilities and future net earnings due to the impact on future depreciation and amortization expense and impairment tests.
| H. | Determination of joint control |
Cameco conducts certain operations through joint ownership interests. Judgment is required in assessing whether Cameco has joint control over the investee, which involves determining the relevant activities of the arrangement and whether decisions around relevant activities require unanimous consent. Judgment is also required to determine whether a joint arrangement should be classified as a joint venture or joint operation. Classifying the arrangement requires us to assess our rights and obligations arising from the arrangement. Specifically, management considers the structure of the joint arrangement and whether it is structured through a separate vehicle and when the arrangement is structured through a separate vehicle, we also consider the rights and obligations arising from the legal form of the separate vehicle, the terms of the contractual arrangements and other facts and circumstances, when relevant. This judgment influences whether we equity account or proportionately consolidate our interest in the arrangement.
| 6. | Accounts receivable |
| 2017
| 2016
| |||||||
Trade receivables | $ | 392,759 | $ | 236,373 | ||||
HST/VAT receivables | 3,611 | 3,968 | ||||||
Other receivables
|
| 454
|
|
| 2,141
|
| ||
Total
| $
| 396,824
|
| $
| 242,482
|
| ||
The Company’s exposure to credit and currency risks as well as impairment loss related to trade and other receivables, excluding harmonized sales tax (HST)/value added tax (VAT) receivables is disclosed in note 24.
| 2017 CONSOLIDATED FINANCIAL STATEMENTS AND NOTES | 105 |
| 7. | Inventories |
| 2017
| 2016
| |||||||
Uranium | ||||||||
Concentrate | $ | 820,426 | $ | 989,202 | ||||
Broken ore | 47,083 | 45,581 | ||||||
| 867,509 | 1,034,783 | |||||||
NUKEM | 13,801 | 141,040 | ||||||
Fuel services | 68,456 | 112,116 | ||||||
Total
| $
| 949,766
|
| $
| 1,287,939
|
| ||
Cameco expensed $1,654,000,000 of inventory as cost of sales during 2017 (2016 - $1,752,000,000). Included in cost of sales is an $8,662,000 net write-down to reflect net realizable value (2016 - $18,054,000 net write-down).
In the past, NUKEM has entered into financing arrangements where future receivables arising from certain sales contracts were sold to financial institutions in exchange for cash. These arrangements required NUKEM to satisfy its delivery obligations under the sales contracts, which were recognized as deferred sales (note 13). In addition, NUKEM was required to pledge the underlying inventory as security against these performance obligations. There was no inventory pledged at December 31, 2017. As of December 31, 2016, NUKEM had $4,884,000 ($3,637,000 (US)) of inventory pledged as security under financing arrangements.
| 8. | Property, plant and equipment |
At December 31, 2017
Land
| Plant
| Furniture
| Under
| Exploration
| Total
| |||||||||||||||||||
Cost | ||||||||||||||||||||||||
Beginning of year | $ | 4,979,489 | $ | 2,640,543 | $ | 95,168 | $ | 340,340 | $ | 1,120,641 | $ | 9,176,181 | ||||||||||||
Additions | 27,343 | 13,649 | 3,521 | 97,729 | 1,091 | 143,333 | ||||||||||||||||||
Transfers | 104,134 | 106,669 | (2,455 | ) | (208,359 | ) | 11 | - | ||||||||||||||||
Change in reclamation provision [note 14] | 17,541 | - | - | - | - | 17,541 | ||||||||||||||||||
Disposals | (4,610 | ) | (4,803 | ) | (4,578 | ) | (74,482 | ) | - | (88,473 | ) | |||||||||||||
Pre-commercial production revenue(a) | (22,818 | ) | (6,487 | ) | - | - | - | (29,305 | ) | |||||||||||||||
Effect of movements in exchange rates | (55,967 | ) | (19,936 | ) | (839 | ) | (497 | ) | (1,463 | ) | (78,702 | ) | ||||||||||||
End of year
|
| 5,045,112
|
|
| 2,729,635
|
|
| 90,817
|
|
| 154,731
|
|
| 1,120,280
|
|
| 9,140,575
|
| ||||||
Accumulated depreciation and impairment |
| |||||||||||||||||||||||
Beginning of year | 2,508,212 | 1,460,953 | 80,592 | 80,674 | 390,164 | 4,520,595 | ||||||||||||||||||
Depreciation charge | 137,896 | 175,811 | 6,490 | - | - | 320,197 | ||||||||||||||||||
Transfers | 48,209 | (35,243 | ) | (2,451 | ) | (10,515 | ) | - | - | |||||||||||||||
Disposals | (2,393 | ) | (4,130 | ) | (3,269 | ) | (70,159 | ) | - | (79,951 | ) | |||||||||||||
Impairment charges(b)(c) | 67,535 | 25,359 | - | 55,841 | 91,046 | 239,781 | ||||||||||||||||||
Effect of movements in exchange rates | (42,210 | ) | (11,290 | ) | (610 | ) | (9 | ) | 2,180 | (51,939 | ) | |||||||||||||
End of year
|
| 2,717,249
|
|
| 1,611,460
|
|
| 80,752
|
|
| 55,832
|
|
| 483,390
|
|
| 4,948,683
|
| ||||||
Net book value at December 31, 2017
| $
| 2,327,863
|
| $
| 1,118,175
|
| $
| 10,065
|
| $
| 98,899
|
| $
| 636,890
|
| $
| 4,191,892
|
| ||||||
| 106 | CAMECO CORPORATION |
At December 31, 2016
Land
| Plant
| Furniture fixtures
| Under
| Exploration
| Total
| |||||||||||||||||||
Cost | ||||||||||||||||||||||||
Beginning of year | $ | 4,862,160 | $ | 2,528,488 | $ | 121,299 | $ | 512,301 | $ | 1,147,100 | $ | 9,171,348 | ||||||||||||
Additions | 25,821 | 29,231 | 9,355 | 150,343 | 2,158 | 216,908 | ||||||||||||||||||
Transfers | 168,784 | 126,871 | 3,410 | (305,944 | ) | 6,879 | - | |||||||||||||||||
Change in reclamation provision | (23,124 | ) | - | - | - | - | (23,124 | ) | ||||||||||||||||
Disposals | (27,311 | ) | (34,611 | ) | (38,233 | ) | (15,490 | ) | - | (115,645 | ) | |||||||||||||
Effect of movements in exchange rates | (26,841 | ) | (9,436 | ) | (663 | ) | (870 | ) | (35,496 | ) | (73,306 | ) | ||||||||||||
End of year
|
| 4,979,489
|
|
| 2,640,543
|
|
| 95,168
|
|
| 340,340
|
|
| 1,120,641
|
|
| 9,176,181
|
| ||||||
Accumulated depreciation and impairment |
| |||||||||||||||||||||||
Beginning of year | 2,226,202 | 1,353,308 | 110,444 | 88,681 | 164,553 | 3,943,188 | ||||||||||||||||||
Depreciation charge | 196,564 | 129,892 | 6,957 | - | 198 | 333,611 | ||||||||||||||||||
Transfers | 27,101 | (26,770 | ) | (331 | ) | - | - | - | ||||||||||||||||
Disposals | (21,736 | ) | (19,794 | ) | (37,981 | ) | (10,603 | ) | - | (90,114 | ) | |||||||||||||
Impairment charge(d)(e) | 97,152 | 28,677 | 2,011 | 2,596 | 231,553 | 361,989 | ||||||||||||||||||
Effect of movements in exchange rates | (17,071 | ) | (4,360 | ) | (508 | ) | - | (6,140 | ) | (28,079 | ) | |||||||||||||
End of year
|
| 2,508,212
|
|
| 1,460,953
|
|
| 80,592
|
|
| 80,674
|
|
| 390,164
|
|
| 4,520,595
|
| ||||||
Net book value at December 31, 2016
| $
| 2,471,277
|
| $
| 1,179,590
|
| $
| 14,576
|
| $
| 259,666
|
| $
| 730,477
|
| $
| 4,655,586
|
| ||||||
Cameco has contractual capital commitments of approximately $23,000,000 at December 31, 2017. Certain of the contractual commitments may contain cancellation clauses, however the Company discloses the commitments based on management’s intent to fulfill the contract. The majority of this amount is expected to be incurred in 2018.
(a) During 2017, revenues of $29,305,000 from the sales of inventories before the commencement of commercial production of JV Inkai Block 3 are recorded as a reduction of the respective mining assets.
(b) In the fourth quarter of 2017, all remaining proven and probable reserves of our US operations were reclassified to resources, indicating that the mineable remaining pounds of U3O8no longer have demonstrated economic viability, but have reasonable prospects for economic extraction. In accordance with the provisions of IAS 36,Impairment of Assets, Cameco considered this to be an indicator that the assets of the two cash generating units in the US could potentially be impaired and accordingly, we were required to estimate the recoverable amount of these assets.
An impairment charge of $184,448,000 ($144,450,000 (USD)) was recognized as part of the uranium segment. The amount of the charge was determined as the excess of the carrying value over the recoverable amount which was based on a fair value less costs to sell model and categorized as anon-recurring level 3 fair value measurement. The recoverable amount was determined to be $133,228,000 ($106,200,000 (USD)) based on the fair value of resources in place using comparable market metrics.
(c) Also in the fourth quarter of 2017, Cameco announced the planned temporary suspension of production at the McArthur River/Key Lake operation. Due to this announcement, the Key Lake calciner project, which is part of the uranium segment and was initially undertaken to allow for an increase in annual production, wasre-evaluated. As a result, the Company wrote off $55,333,000 of assets under construction on this project.
| 2017 CONSOLIDATED FINANCIAL STATEMENTS AND NOTES | 107 |
(d) In the fourth quarter of 2016, Cameco recognized a $237,621,000 impairment charge relating to Kintyre, its uranium exploration project in Australia. Due to the weakening of the uranium market and the budget decision not to commit further expenditures to the project, the Company concluded it was appropriate to recognize an impairment charge. The charge was for the full carrying value of the CGU.
(e) In the second quarter of 2016, production was suspended at our Rabbit Lake operation in northern Saskatchewan. In accordance with the provisions of IAS 36,Impairment of Assets, Cameco considered this to be an indicator that the assets of the cash generating unit could potentially be impaired and accordingly, we were required to estimate the recoverable amount of these assets.
An impairment charge of $124,368,000 was recognized as part of the uranium segment. The charge was for the full carrying value of this cash generating unit. The recoverable amount of the mine and mill was based on a fair value less costs to sell model, which incorporated the future cash flows, including care and maintenance costs, expected to be derived from the operation. It was categorized as anon-recurring level 3 fair value measurement.
The discount rate used in the fair value less costs to sell calculation was 8% and was determined based on a market participant’s incremental borrowing cost, adjusted for the marginal return that the participant would expect to use on an investment in the mine and mill. Other key assumptions included uranium price forecasts and operating and capital cost forecasts. Uranium prices applied in the calculation were based on approved internal price forecasts, which reflect management’s expectation of prices that a market participant would use. Operating and capital cost forecasts were determined based on management’s internal cost estimates.
| 9. | Goodwill and intangible assets |
| A. | Reconciliation of carrying amount |
At December 31, 2017
Goodwill
| Contracts
| Intellectual
| Patents
| Total
| ||||||||||||||||
Cost | ||||||||||||||||||||
Beginning of year | $ | 118,664 | $ | 117,533 | $ | 118,819 | $ | 11,737 | $ | 366,753 | ||||||||||
Effect of movements in exchange rates | (7,265 | ) | (7,721 | ) | - | (771 | ) | (15,757 | ) | |||||||||||
End of year
|
| 111,399
|
|
| 109,812
|
|
| 118,819
|
|
| 10,966
|
|
| 350,996
|
| |||||
Accumulated amortization | ||||||||||||||||||||
Beginning of year | - | 110,284 | 49,589 | 3,570 | 163,443 | |||||||||||||||
Amortization charge | - | 2,002 | 4,091 | 630 | 6,723 | |||||||||||||||
Impairment charge | 111,399 | - | - | 7,150 | 118,549 | |||||||||||||||
Effect of movements in exchange rates | - | (7,347 | ) | - | (384 | ) | (7,731 | ) | ||||||||||||
End of year
|
| 111,399
|
|
| 104,939
|
|
| 53,680
|
|
| 10,966
|
|
| 280,984
|
| |||||
Net book value at December 31, 2017
| $
| -
|
| $
| 4,873
|
| $
| 65,139
|
| $
| -
|
| $
| 70,012
|
| |||||
| 108 | CAMECO CORPORATION |
At December 31, 2016
Goodwill
| Contracts
| Intellectual
| Patents
| Total
| ||||||||||||||||
Cost | ||||||||||||||||||||
Beginning of year | $ | 122,314 | $ | 121,148 | $ | 118,819 | $ | 12,098 | $ | 374,379 | ||||||||||
Effect of movements in exchange rates | (3,650 | ) | (3,615 | ) | - | (361 | ) | (7,626 | ) | |||||||||||
End of year
|
| 118,664
|
|
| 117,533
|
|
| 118,819
|
|
| 11,737
|
|
| 366,753
|
| |||||
Accumulated amortization | ||||||||||||||||||||
Beginning of year | - | 108,809 | 45,430 | 3,010 | 157,249 | |||||||||||||||
Amortization charge | - | 4,613 | 4,159 | 642 | 9,414 | |||||||||||||||
Effect of movements in exchange rates | - | (3,138 | ) | - | (82 | ) | (3,220 | ) | ||||||||||||
End of year
|
| -
|
|
| 110,284
|
|
| 49,589
|
|
| 3,570
|
|
| 163,443
|
| |||||
Net book value at December 31, 2016
| $
| 118,664
|
| $
| 7,249
|
| $
| 69,230
|
| $
| 8,167
|
| $
| 203,310
|
| |||||
| B. | Amortization |
The intangible asset values relate to intellectual property acquired with Cameco Fuel Manufacturing Inc. (CFM) and purchase and sales contracts acquired with NUKEM. The CFM intellectual property is being amortized on aunit-of-production basis over its remaining life. Amortization is allocated to the cost of inventory and is recognized in cost of products and services sold as inventory is sold. The NUKEM purchase and sales contracts will be amortized to earnings over the remaining terms of the underlying contracts, which extend to 2022. Amortization of the purchase contracts is allocated to the cost of inventory and is included in cost of products and services sold as inventory is sold. Sales contracts are amortized to revenue. Approximately $998,000 ofpre-tax earnings (in USD) relating to the amortization of the fair value allocated to the NUKEM contracts will be amortized in 2018 with the remaining balance being recognized fairly evenly each year through 2022.
Patents acquired with UFP Investments LLC (UFP) were being amortized to cost of products and services sold on a straight-line basis over their remaining life which expires in July 2029. In the fourth quarter of 2017, Cameco recorded an impairment charge of $7,150,000 on these assets due to continuing weakness in the uranium market and limited budget allocated to this project.
| C. | Impairment test |
For the purpose of impairment testing, goodwill is attributable to NUKEM, which is considered to be a CGU.
In the third quarter of 2017, Cameco restructured its global marketing organization in response to the changing business environment. The restructuring significantly impacts the marketing activities historically performed by NUKEM. In accordance with the provisions of IAS 36,Impairment of Assets, Cameco considered this to be an indicator that the assets of the CGU could potentially be impaired and accordingly, we were required to estimate the recoverable amount of these assets.
| 2017 CONSOLIDATED FINANCIAL STATEMENTS AND NOTES | 109 |
The recoverable amount of NUKEM was estimated based on a fair value less costs to sell calculation and was concluded to be equal to the carrying value of its inventory and existing contracts. A change in the previous assumption, that there would be cash flows generated beyond a five-year period, resulted in the elimination of the terminal value. Accordingly, an impairment charge of $111,399,000 ($88,377,000 (US)) was recorded, representing the full carrying value of NUKEM goodwill.
| 10. | Long-term receivables, investments and other |
2017
| 2016
| |||||||
Investments in equity securities [note 24] | $ | 21,417 | $ | 14,807 | ||||
Derivatives [note 24] | 40,804 | 10,612 | ||||||
Advances receivable from JV Inkai LLP [note 29] | 58,820 | 90,095 | ||||||
Investment tax credits | 92,846 | 93,920 | ||||||
Amounts receivable related to tax dispute [note 19] | 303,222 | 264,042 | ||||||
Other | 39,053 | 49,506 | ||||||
| 556,162 | 522,982 | |||||||
Less current portion | (36,089 | ) | (10,498 | ) | ||||
Net
| $
| 520,073
|
| $
| 512,484
|
| ||
| 11. | Accounts payable and accrued liabilities |
2017
| 2016
| |||||||
Trade payables | $ | 177,040 | $ | 213,481 | ||||
Non-trade payables | 75,784 | 85,632 | ||||||
Payables due to related parties | 5,581 | 13,787 | ||||||
Total
| $
| 258,405
|
| $
| 312,900
|
| ||
The Company’s exposure to currency and liquidity risk related to trade and other payables is disclosed in note 24.
| 12. | Long-term debt |
2017
| 2016
| |||||||
Unsecured debentures | ||||||||
Series D - 5.67% debentures due September 2, 2019 [note 24] | $ | 499,020 | $ | 498,472 | ||||
Series E - 3.75% debentures due November 14, 2022 | 398,604 | 398,346 | ||||||
Series F - 5.09% debentures due November 14, 2042 | 99,271 | 99,256 | ||||||
Series G - 4.19% debentures due June 24, 2024 | 497,576 | 497,253 | ||||||
Total | $
| 1,494,471
|
| $
| 1,493,327
|
| ||
Cameco has a $1,250,000,000 unsecured revolving credit facility that is available until November 1, 2021. Upon mutual agreement, the facility can be extended for an additional year on the anniversary date. In addition to direct borrowings under the facility, up to $100,000,000 can be used for the issuance of letters of credit and, to the extent necessary, it may be used to provide liquidity support for the Company’s commercial paper program. The agreement also provides the ability to increase the revolving credit facility above $1,250,000,000 by increments no less than $50,000,000, to a total of $1,750,000,000. The facility ranks equally with all of Cameco’s other senior debt. As of December 31, 2017 and 2016, there were no amounts outstanding under this facility.
| 110 | CAMECO CORPORATION |
Cameco has $1,667,932,000 (2016 - $1,658,727,000) in letter of credit facilities. Outstanding and committed letters of credit at December 31, 2017 amounted to $1,474,155,000 (2016 - $1,470,435,000), the majority of which relate to future decommissioning and reclamation liabilities (note 14).
Cameco is bound by a covenant in its revolving credit facility. The covenant requires a funded debt to tangible net worth ratio equal to or less than 1:1.Non-compliance with this covenant could result in accelerated payment and termination of the revolving credit facility. At December 31, 2017, Cameco was in compliance with the covenant and does not expect its operating and investing activities in 2018 to be constrained by it.
The table below represents currently scheduled maturities of long-term debt:
2018
| 2019
| 2020
| 2021
| 2022
| Thereafter
| Total
| ||||||||||||||||||||
|
| $ -
|
|
| 499,020
|
|
| -
|
|
| -
|
|
| 398,604
|
|
| 596,847
|
| $
| 1,494,471
|
| ||||||
| 13. | Other liabilities |
2017
| 2016
| |||||||
Deferred sales | $ | 29,148 | $ | 29,423 | ||||
Derivatives [note 24] | 23,414 | 58,885 | ||||||
Accrued pension and post-retirement benefit liability [note 23] | 74,804 | 69,699 | ||||||
Other | 53,107 | 25,725 | ||||||
| 180,473 | 183,732 | |||||||
Less current portion | (54,370 | ) | (60,744 | ) | ||||
Net
| $
| 126,103
|
| $
| 122,988
|
| ||
There were no performance obligations relating to financing arrangements entered into by NUKEM included in deferred sales at the end of 2017 (2016 - $6,143,000 ($4,575,000 (US))) (note 7).
| 14. | Provisions |
Reclamation
| Waste disposal
| Total
| ||||||||||
Beginning of year | $ | 899,261 | $ | 9,521 | $ | 908,782 | ||||||
Changes in estimates and discount rates | ||||||||||||
Capitalized in property, plant and equipment [note 8] | 17,541 | - | 17,541 | |||||||||
Recognized in earnings | 43 | (546 | ) | (503 | ) | |||||||
Provisions used during the period | (13,343 | ) | (989 | ) | (14,332 | ) | ||||||
Unwinding of discount [note 17] | 21,866 | 154 | 22,020 | |||||||||
Effect of movements in exchange rates | (19,968 | ) | - | (19,968 | ) | |||||||
End of period
| $
| 905,400
|
| $
| 8,140
|
| $
| 913,540
|
| |||
Current | $ | 36,617 | $ | 1,890 | $ | 38,507 | ||||||
Non-current | 868,783 | 6,250 | 875,033 | |||||||||
| $
| 905,400
|
| $
| 8,140
|
| $
| 913,540
|
| ||||
| A. | Reclamation provision |
Cameco’s estimates of future decommissioning obligations are based on reclamation standards that satisfy regulatory requirements. Elements of uncertainty in estimating these amounts include potential changes in regulatory requirements, decommissioning and reclamation alternatives and amounts to be recovered from other parties.
| 2017 CONSOLIDATED FINANCIAL STATEMENTS AND NOTES | 111 |
Cameco estimates total future decommissioning and reclamation costs for its existing operating assets to be $1,051,746,000 (2016 - $1,037,302,000). The expected timing of these outflows is based onlife-of-mine plans with the majority of expenditures expected to occur after 2022. These estimates are reviewed by Cameco technical personnel as required by regulatory agencies or more frequently as circumstances warrant. In connection with future decommissioning and reclamation costs, Cameco has provided financial assurances of $1,011,613,000 (2016 - $988,207,000) in the form of letters of credit to satisfy current regulatory requirements.
The reclamation provision relates to the following segments:
2017
| 2016
| |||||||
Uranium | $ | 669,835 | $ | 645,219 | ||||
Fuel services | 235,565 | 254,042 | ||||||
Total
| $
| 905,400
|
| $
| 899,261
|
| ||
| B. | Waste disposal |
The fuel services segment consists of the Blind River refinery, Port Hope conversion facility and Cameco Fuel Manufacturing Inc.. The refining, conversion and manufacturing processes generate certain uranium contaminated waste. These include contaminated combustible material (paper, rags, gloves, etc.) and contaminatednon-combustible material (metal parts, soil from excavations, building and roofing materials, spent uranium concentrate drums, etc.). These materials can in some instances be recycled or reprocessed. A provision for waste disposal costs in respect of these materials is recognized when they are generated.
Cameco estimates total future costs related to existing waste disposal to be $8,239,000 (2016 - $14,930,000). The majority of these expenditures are expected to occur within the next four years.
| 15. | Share capital |
Authorized share capital:
| · | Unlimited number of first preferred shares |
| · | Unlimited number of second preferred shares |
| · | Unlimited number of voting common shares, no stated par value, and |
| · | One Class B share |
| A. | Common Shares |
Number issued (number of shares)
| 2017
| 2016
| ||||||
Beginning of year | 395,792,522 | 395,792,522 | ||||||
Issued: | ||||||||
Stock option plan [note 22] | 210 | - | ||||||
Total
|
| 395,792,732
|
|
| 395,792,522
|
| ||
All issued shares are fully paid.
| B. | Class B share |
One Class B share issued during 1988 and assigned $1 of share capital entitles the shareholder to vote separately as a class in respect of any proposal to locate the head office of Cameco to a place not in the province of Saskatchewan.
| C. | Dividends |
Dividends on Cameco Corporation common shares are declared in Canadian dollars. For the year ended December 31, 2017, the dividend declared per share was $0.40 (December 31, 2016 - $0.40).
| 112 | CAMECO CORPORATION |
| 16. | Employee benefit expense |
The following employee benefit expenses are included in cost of products and services sold, administration, exploration, research and development and property, plant and equipment:
2017
| 2016
| |||||||
Wages and salaries | $ | 331,521 | $ | 379,620 | ||||
Statutory and company benefits | 60,334 | 66,402 | ||||||
Expenses related to defined benefit plans [note 23] | 5,208 | 5,128 | ||||||
Expenses related to defined contribution plans [note 23] | 15,929 | 17,716 | ||||||
Equity-settled share-based compensation [note 22] | 18,433 | 19,305 | ||||||
Cash-settled share-based compensation [note 22] | 134 | (822 | ) | |||||
Total | $
| 431,559
|
| $
| 487,349
|
| ||
| 17. | Finance costs |
2017
| 2016
| |||||||
Interest on long-term debt | $ | 73,211 | $ | 73,434 | ||||
Unwinding of discount on provisions [note 14] | 22,020 | 20,733 | ||||||
Other charges | 15,377 | 16,860 | ||||||
Interest on short-term debt | - | 879 | ||||||
Total
| $
| 110,608
|
| $
| 111,906
|
| ||
No borrowing costs were determined to be eligible for capitalization during the year.
| 18. | Other income (expense) |
2017
| 2016
| |||||||
Foreign exchange losses | $ | (23,168 | ) | $ | (5,935 | ) | ||
Contract settlements | - | 59,027 | ||||||
Gain on change in investment accounting | - | 7,032 | ||||||
Write-off of long-term receivables | (5,926 | ) | - | |||||
Other | (1,316 | ) | 547 | |||||
Total
| $
| (30,410
| )
| $
| 60,671
|
| ||
In 2016, Cameco agreed to terminate two long-term supply contracts with two of its utility customers that were effective for the years 2016 through 2020 and 2016 through 2021. The resulting gain on contract settlements was $59,027,000.
Also in 2016, Cameco’s share in one of its associates decreased such that equity accounting was no longer appropriate. As a result, the difference between its carrying value and fair value was recognized in other income. As anavailable-for-sale investment, future changes in fair value are being recognized in other comprehensive income.
| 2017 CONSOLIDATED FINANCIAL STATEMENTS AND NOTES | 113 |
| 19. | Income taxes |
| A. | Significant components of deferred tax assets and liabilities |
Recognized in earnings
|
As at December 31
| |||||||||||||||
2017
| 2016
| 2017
| 2016
| |||||||||||||
Assets | ||||||||||||||||
Property, plant and equipment | $ | (4,325) | $ | 118,853 | $ | 115,193 | $ | 118,853 | ||||||||
Provision for reclamation | (16,760) | (11,001) | 227,785 | 244,012 | ||||||||||||
Inventories | 1,027 | - | 1,027 | - | ||||||||||||
Foreign exploration and development | 16 | (43) | 5,295 | 5,279 | ||||||||||||
Income tax losses (gains) | 57,203 | (22,093) | 459,885 | 402,550 | ||||||||||||
Defined benefit plan actuarial losses | - | - | 7,845 | 5,691 | ||||||||||||
Long-term investments and other | (27,166) | (25,589) | 31,674 | 56,093 | ||||||||||||
Deferred tax assets
|
| 9,995
|
|
| 60,127
|
|
| 848,704
|
|
| 832,478
|
| ||||
Liabilities | ||||||||||||||||
Property, plant and equipment | - | (68,385) | - | - | ||||||||||||
Inventories | (12,430) | (10,144) | - | 12,430 | ||||||||||||
Deferred tax liabilities
|
| (12,430)
|
|
| (78,529)
|
|
| -
|
|
| 12,430
|
| ||||
Net deferred tax asset
| $
| 22,425
|
| $
| 138,656
|
| $
| 848,704
|
| $
| 820,048
|
| ||||
Deferred tax allocated as
|
2017
|
2016
| ||||||||||||||
Deferred tax assets | $ | 861,171 | $ | 835,985 | ||||||||||||
Deferred tax liabilities | (12,467) | (15,937) | ||||||||||||||
Net deferred tax asset
|
$
|
848,704
|
| $
| 820,048
|
| ||||||||||
Cameco has recorded a net deferred tax asset of $861,171,000 (December 31, 2016 - $835,985,000). The realization of this deferred tax asset is dependent upon the generation of future taxable income in certain jurisdictions during the periods in which the Company’s deferred tax assets are available. The Company considers whether it is probable that all or a portion of the deferred tax assets will not be realized. In making this assessment, management considers all available evidence, including recent financial operations, projected future taxable income and tax planning strategies. Based on projections of future taxable income over the periods in which the deferred tax assets are available, realization of these deferred tax assets is probable and consequently the deferred tax assets have been recorded.
| 114 | CAMECO CORPORATION |
| B. | Movement in net deferred tax assets and liabilities |
| �� | 2017
| 2016
| ||||||
Net deferred tax asset at beginning of year | $ | 820,048 | $ | 678,495 | ||||
Recovery for the year in net earnings | 22,425 | 138,656 | ||||||
Recovery for the year in other comprehensive income | 1,490 | 435 | ||||||
Effect of movements in exchange rates | 4,741 | 2,462 | ||||||
End of year
|
$
|
848,704
|
| $
| 820,048
|
| ||
| C. | Significant components of unrecognized deferred tax assets |
| 2017
| 2016
| |||||||
Income tax losses | $ | 259,770 | $ | 284,338 | ||||
Property, plant and equipment | 2,076 | 3,789 | ||||||
Provision for reclamation | 71,463 | 40,749 | ||||||
Long-term investments and other | 68,544 | 107,096 | ||||||
Total
|
$
|
401,853
|
| $
| 435,972
|
| ||
During December 2017, United States (US) tax reform legislation was enacted. This new legislation will not result in a significant impact on our financial statements as we derecognized the amounts related to our US deferred tax asset in 2015. At that time, it was determined that it was no longer probable that there would be sufficient taxable profit in the future against which the US operating losses and other tax deductions could be used. The change in legislation does however, significantly reduce the value of our unrecognized US deferred tax assets due to the US tax rate decrease. In addition, we have alternative minimum tax credits of $4,073,000 US that will be refunded between 2018 and 2021.
| D. | Tax rate reconciliation |
The provision for income taxes differs from the amount computed by applying the combined expected federal and provincial income tax rate to earnings before income taxes. The reasons for these differences are as follows:
| 2017
| 2016
| |||||||
Loss before income taxes andnon-controlling interest | $ | (207,237) | $ | (154,234) | ||||
Combined federal and provincial tax rate | 26.7% | 26.9% | ||||||
Computed income tax recovery | (55,332) | (41,489) | ||||||
Increase (decrease) in taxes resulting from: | ||||||||
Difference between Canadian rates and rates applicable to subsidiaries in other countries | (51,526) | (175,092) | ||||||
Change in unrecognized deferred tax assets | 70,353 | 106,766 | ||||||
Other taxes | - | (2,278) | ||||||
Share-based compensation plans | 1,349 | 1,221 | ||||||
Change in tax provision related to transfer pricing | 3,000 | 8,000 | ||||||
Non-deductible(non-taxable) capital amounts | 3,034 | - | ||||||
Change in legislation | (12,199) | - | ||||||
Non-deductible goodwill impairment | 35,520 | - | ||||||
Other permanent differences | 3,282 | 8,517 | ||||||
Income tax recovery
|
$
|
(2,519)
|
|
$
|
(94,355)
|
| ||
| 2017 CONSOLIDATED FINANCIAL STATEMENTS AND NOTES | 115 |
| E. | Earnings and income taxes by jurisdiction |
| 2017
| 2016
| |||||||
Earnings (loss) before income taxes | ||||||||
Canada | $ | (53,521) | $ | (463,946) | ||||
Foreign | (153,716) | 309,712 | ||||||
| $
| (207,237)
|
| $
| (154,234)
|
| |||
Current income taxes | ||||||||
Canada | $ | 5,221 | $ | 3,454 | ||||
Foreign | 14,685 | 40,847 | ||||||
| $ | 19,906 | $ | 44,301 | |||||
Deferred income tax recovery | ||||||||
Canada | $ | (18,272) | $ | (120,519) | ||||
Foreign | (4,153) | (18,137) | ||||||
$ |
(22,425) |
| $ | (138,656) | ||||
Income tax recovery
| $
| (2,519)
|
| $
| (94,355)
|
| ||
| F. | Reassessments |
Canada
In 2008, as part of the ongoing annual audits of Cameco’s Canadian tax returns, Canada Revenue Agency (CRA) disputed the transfer pricing structure and methodology used by Cameco and its wholly owned Swiss subsidiary, Cameco Europe Ltd., in respect of sale and purchase agreements for uranium products. From December 2008 to date, CRA issued notices of reassessment for the taxation years 2003 through 2011, which in aggregate have increased Cameco’s income for Canadian tax purposes by approximately $4,100,000,000. CRA has also issued notices of reassessment for transfer pricing penalties for the years 2007 through 2011 in the amount of $371,000,000. Cameco believes it is likely that CRA will reassess Cameco’s tax returns for subsequent years on a similar basis and that these will require Cameco to make future remittances or provide security on receipt of the reassessments.
Using the methodology we believe that CRA will continue to apply and including the $4,100,000,000 already reassessed, we expect to receive notices of reassessment for a total of approximately $8,400,000,000 for the years 2003 through 2017, which would increase Cameco’s income for Canadian tax purposes and result in a related tax expense of approximately $2,500,000,000. In addition to penalties already imposed, CRA may continue to apply penalties to taxation years subsequent to 2011. As a result, we estimate that cash taxes and transfer pricing penalties would be between $1,950,000,000 and $2,150,000,000. In addition, we estimate there would be interest and instalment penalties applied that would be material to Cameco. While in dispute, we would be responsible for remitting or otherwise securing 50% of the cash taxes and transfer pricing penalties (between $970,000,000 and $1,070,000,000), plus related interest and instalment penalties assessed, which would be material to Cameco.
Under Canadian federal and provincial tax rules, the amount required to be remitted each year will depend on the amount of income reassessed in that year and the availability of elective deductions. Recently, the CRA disallowed the use of any loss carry-backs to be applied to any transfer pricing adjustment, starting with the 2008 tax year. In light of our view of the likely outcome of the case, we expect to recover the amounts remitted to CRA, including cash taxes, interest and penalties totalling $303,222,000 already paid as at December 31, 2017 (December 31, 2016 - $264,042,000) (note 10). In addition to the cash remitted, we have provided $421,000,000 in letters of credit to secure 50% of the cash taxes and related interest.
| 116 | CAMECO CORPORATION |
The trial for the 2003, 2005 and 2006 reassessments concluded on September 13, 2017. We expect to have a Tax Court decision within six to 18 months of that date. Once the Tax Court has delivered a decision for the 2003, 2005 and 2006 tax years we will consider how the decision relates to other years in issue (being 2004 and years subsequent to 2006). While the decision would not be legally binding for any year other than the trial years, we expect the ultimate decision for the trial years to be an important factor in resolving the dispute for the other years in issue.
Having regard to advice from its external advisors, Cameco’s opinion is that CRA’s position is incorrect and Cameco is contesting CRA’s position and expects to recover any amounts remitted or secured as a result of the reassessments. However, to reflect the uncertainties of CRA’s appeals process and litigation, Cameco has recorded a cumulative tax provision related to this matter for the years 2003 through the current period in the amount of $61,000,000. While the resolution of this matter may result in liabilities that are higher or lower than the reserve, management believes that the ultimate resolution will not be material to Cameco’s financial position, results of operations or liquidity in the year(s) of resolution. Resolution of this matter as stipulated by CRA would be material to Cameco’s financial position, results of operations or liquidity in the year(s) of resolution and other unfavourable outcomes for the years 2003 to date could be material to Cameco’s financial position, results of operations and cash flows in the year(s) of resolution.
Further to Cameco’s decision to contest CRA’s reassessments, Cameco is pursuing its appeal rights under Canadian federal and provincial tax rules.
| G. | Income tax losses |
At December 31, 2017, income tax losses carried forward of $2,609,070,000 (2016 - $2,432,772,000) are available to reduce taxable income. These losses expire as follows:
| Date of expiry
| Canada
| US
| Other
| Total
| ||||||||||||
2030 | $ | 47 | $ | - | $ | - | $ | 47 | ||||||||
2031 | - | 20,147 | - | 20,147 | ||||||||||||
2032 | 171,687 | 21,698 | - | 193,385 | ||||||||||||
2033 | 284,592 | 36,989 | - | 321,581 | ||||||||||||
2034 | 302,121 | 20,404 | - | 322,525 | ||||||||||||
2035 | 334,769 | 14,198 | - | 348,967 | ||||||||||||
2036 | 168,218 | 43,150 | - | 211,368 | ||||||||||||
2037 | 18 | 53,724 | - | 53,742 | ||||||||||||
2038 | - | - | - | - | ||||||||||||
2039 | - | - | - | - | ||||||||||||
2040 | - | - | - | - | ||||||||||||
No expiry | - | - | 1,137,308 | 1,137,308 | ||||||||||||
| $
| 1,261,452
|
| $
| 210,310
|
| $
| 1,137,308
|
| $
| 2,609,070
|
| |||||
Included in the table above is $958,417,000 (2016 - $912,916,000) of temporary differences related to loss carry forwards where no future benefit has been recognized.
| 2017 CONSOLIDATED FINANCIAL STATEMENTS AND NOTES | 117 |
| 20. | Per share amounts |
Per share amounts have been calculated based on the weighted average number of common shares outstanding during the period. The weighted average number of paid shares outstanding in 2017 was 395,792,686 (2016 - 395,792,522).
| 2017
| 2016
| |||||||
Basic loss per share computation | ||||||||
Net loss attributable to equity holders | $ | (204,942) | $ | (61,611) | ||||
Weighted average common shares outstanding | 395,793 | 395,793 | ||||||
Basic loss per common share
| $
| (0.52)
|
| $
| (0.16)
|
| ||
Diluted loss per share computation | ||||||||
Net loss attributable to equity holders | $ | (204,942) | $ | (61,611) | ||||
Weighted average common shares outstanding | 395,793 | 395,793 | ||||||
Dilutive effect of stock options | - | - | ||||||
Weighted average common shares outstanding, assuming dilution
|
| 395,793
|
|
| 395,793
|
| ||
Diluted loss per common share
| $
| (0.52)
|
| $
| (0.16)
|
| ||
| 21. | Supplemental cash flow information |
Other operating items included in the statements of cash flows are as follows:
| 2017
| 2016
| |||||||
Changes innon-cash working capital: | ||||||||
Accounts receivable | $ | (174,613) | $ | 1,529 | ||||
Inventories | 299,980 | (73,833) | ||||||
Supplies and prepaid expenses | 15,436 | 10,867 | ||||||
Accounts payable and accrued liabilities | (64,689) | (17,989) | ||||||
Reclamation payments | (14,334) | (13,507) | ||||||
Amortization of purchase price allocation | (2,996) | 27,848 | ||||||
Other | 28,273 | (4,049) | ||||||
Other operating items
|
$
|
87,057
|
|
$
|
(69,134)
|
| ||
| 118 | CAMECO CORPORATION |
The changes in liabilities arising from financing activities were as follows:
Long-term
| Interest
| Dividends
| Share
| Total
| ||||||||||||||||
Balance at January 1, 2017 | $ | 1,493,327 | $ | 12,401 | $ | 39,579 | $ | 1,862,646 | $ | 3,407,953 | ||||||||||
Changes from financing cash flows: | ||||||||||||||||||||
Dividends paid | - | - | (158,297 | ) | - | (158,297 | ) | |||||||||||||
Interest paid | - | (69,498 | ) | - | - | (69,498 | ) | |||||||||||||
Shares issued, stock option plan | - | - | - | 4 | 4 | |||||||||||||||
Total cash changes
|
| -
|
|
| (69,498
| )
|
| (158,297
| )
|
| 4
|
|
| (227,791
| )
| |||||
Non-cash changes: | ||||||||||||||||||||
Amorization of issue costs | 1,144 | - | - | - | 1,144 | |||||||||||||||
Dividends declared | - | - | 158,297 | - | 158,297 | |||||||||||||||
Interest expense | - | 72,067 | - | - | 72,067 | |||||||||||||||
Shares issued, stock option plan | - | - | - | 2 | 2 | |||||||||||||||
Totalnon-cash changes
|
| 1,144
|
|
| 72,067
|
|
| 158,297
|
|
| 2
|
|
| 231,510
|
| |||||
Balance at December 31, 2017
| $
| 1,494,471
|
| $
| 14,970
|
| $
| 39,579
|
| $
| 1,862,652
|
| $
| 3,411,672
|
| |||||
| 22. | Share-based compensation plans |
The Company has the following equity-settled plans:
| A. | Stock option plan |
The Company has established a stock option plan under which options to purchase common shares may be granted to employees of Cameco. Options granted under the stock option plan have an exercise price of not less than the closing price quoted on the Toronto Stock Exchange (TSX) for the common shares of Cameco on the trading day prior to the date on which the option is granted. The options carry vesting periods of one to three years, and expire eight years from the date granted.
The aggregate number of common shares that may be issued pursuant to the Cameco stock option plan shall not exceed 43,017,198 of which 27,870,289 shares have been issued.
Stock option transactions for the respective years were as follows:
(Number of options)
| 2017
| 2016
| ||||||
Beginning of year | 8,020,311 | 8,503,238 | ||||||
Options granted | 1,373,040 | 1,273,340 | ||||||
Options forfeited | (564,423 | ) | (1,156,737 | ) | ||||
Options expired | (504,052 | ) | (599,530 | ) | ||||
Options exercised [note 15] | (210 | ) | - | |||||
End of year
|
| 8,324,666
|
|
| 8,020,311
|
| ||
Exercisable
|
| 5,809,077
|
|
| 5,929,550
|
| ||
| 2017 CONSOLIDATED FINANCIAL STATEMENTS AND NOTES | 119 |
Weighted average exercise prices were as follows:
2017
| 2016
| |||||||
Beginning of year | $23.61 | $26.04 | ||||||
Options granted | 14.70 | 16.38 | ||||||
Options forfeited | 26.49 | 25.70 | ||||||
Options expired | 19.50 | 38.81 | ||||||
Options exercised | 19.37 | - | ||||||
End of year
|
| $22.19
|
|
| $23.61
|
| ||
Exercisable
|
| $24.95
|
|
| $25.46
|
| ||
Total options outstanding and exercisable at December 31, 2017 were as follows:
Options outstanding
| Options exercisable
| |||||||||||||||||||
| Option price per share | Number | Weighted average
| Weighted
| Number | Weighted average price
| |||||||||||||||
$14.70 - 20.22 | 3,527,303 | 5.7 | $16.46 | 1,011,714 | $18.08 | |||||||||||||||
$20.23 - 39.53 | 4,797,363 | 2.2 | $26.41 | 4,797,363 | $26.41 | |||||||||||||||
|
| 8,324,666
|
|
| 5,809,077
|
| |||||||||||||||
The foregoing options have expiry dates ranging from February 28, 2018 to February 28, 2025.
| B. | Executive performance share unit (PSU) |
The Company has established a PSU plan whereby it provides each plan participant an annual grant of PSUs in an amount determined by the board. Each PSU represents one phantom common share that entitles the participant to a payment of one Cameco common share purchased on the open market, or cash with an equivalent market value, at the board’s discretion, at the end of each three-year period if certain performance and vesting criteria have been met. The final value of the PSUs will be based on the value of Cameco common shares at the end of the three-year period and the number of PSUs that ultimately vest. Vesting of PSUs at the end of the three-year period will be based on total shareholder return over the three years, Cameco’s ability to meet its annual operating targets and whether the participating executive remains employed by Cameco at the end of the three-year vesting period. As of December 31, 2017, the total number of PSUs held by the participants, after adjusting for forfeitures on retirement, was 1,070,997 (2016 - 892,895).
| C. | Restricted share unit (RSU) |
The Company has established an RSU plan whereby it provides each plan participant an annual grant of RSUs in an amount determined by the board. Each RSU represents one phantom common share that entitles the participant to a payment of one Cameco common share purchased on the open market, or cash with an equivalent market value, at the board’s discretion. The RSUs carry vesting periods of one to three years, and the final value of the units will be based on the value of Cameco common shares at the end of the vesting periods. As of December 31, 2017, the total number of RSUs held by the participants was 463,151 (2016 - 557,957).
| 120 | CAMECO CORPORATION |
| D. | Employee share ownership plan |
Cameco also has an employee share ownership plan, whereby both employee and Company contributions are used to purchase shares on the open market for employees. The Company’s contributions are expensed during the year of contribution. Under the plan, employees have the opportunity to participate in the program to a maximum of 6% of eligible earnings each year with Cameco matching the first 3% of employee-paid shares by 50%. Cameco contributes $1,000 of shares annually to each employee that is enrolled in the plan. Shares purchased with Company contributions and with dividends paid on such shares become unrestricted 12 months from the date on which such shares were purchased. At December 31, 2017, there were 2,979 participants in the plan (2016 - 3,356). The total number of shares purchased in 2017 with Company contributions was 370,381 (2016 - 404,550). In 2017, the Company’s contributions totalled $4,473,000 (2016 - $5,204,000).
Cameco records compensation expense under its equity-settled plans with an offsetting credit to contributed surplus, to reflect the estimated fair value of units granted to employees. During the year, the Company recognized the following expenses under these plans:
2017
| 2016
| |||||||
Stock option plan | $ | 4,941 | $ | 4,588 | ||||
Performance share unit plan | 6,186 | 5,572 | ||||||
Restricted share unit plan | 2,833 | 3,941 | ||||||
Employee share ownership plan | 4,473 | 5,204 | ||||||
End of year
| $
| 18,433
|
| $
| 19,305
|
| ||
Fair value measurement of equity-settled plans
The fair value of the units granted through the PSU plan was determined based on Monte Carlo simulation and the fair value of options granted under the stock option plan was measured based on the Black-Scholes option-pricing model. The fair value of RSUs granted was determined based on their intrinsic value on the date of grant. Expected volatility was estimated by considering historic average share price volatility.
The inputs used in the measurement of the fair values at grant date of the equity-settled share-based payment plans were as follows:
Stock option plan
| PSU
| RSU
| ||||||||||
Number of options granted | 1,373,040 | 470,120 | 279,892 | |||||||||
Average strike price | $14.70 | - | $14.71 | |||||||||
Expected dividend | $0.40 | - | - | |||||||||
Expected volatility | 34% | 36% | - | |||||||||
Risk-free interest rate | 1.1% | 0.9% | - | |||||||||
Expected life of option | 4.7 years | 3 years | - | |||||||||
Expected forfeitures | 7% | 9% | 13% | |||||||||
Weighted average grant date fair values
|
| $3.34
|
|
| $14.72
|
|
| $14.71
|
| |||
In addition to these inputs, other features of the PSU grant were incorporated into the measurement of fair value. The market condition based on total shareholder return was incorporated by utilizing a Monte Carlo simulation. Thenon-market criteria relating to realized selling prices and operating targets have been incorporated into the valuation at grant date by reviewing prior history and corporate budgets.
| 2017 CONSOLIDATED FINANCIAL STATEMENTS AND NOTES | 121 |
The Company has the following cash-settled plans:
| A. | Deferred share unit (DSU) |
Cameco offers a DSU plan tonon-employee directors. A DSU is a notional unit that reflects the market value of a single common share of Cameco. 60% of each director’s annual retainer is paid in DSUs. In addition, on an annual basis, directors can elect to receive 25%, 50%, 75% or 100% of the remaining 40% of their annual retainer and any additional fees in the form of DSUs. If a director meets their ownership requirements, the director may elect to take 25%, 50%, 75% or 100% of their annual retainer and any fees in cash, with the balance, if any, to be paid in DSUs. Each DSU fully vests upon award. The DSUs will be redeemed for cash upon a director leaving the board. The redemption amount will be based upon the weighted average of the closing prices of the common shares of Cameco on the TSX for the last 20 trading days prior to the redemption date multiplied by the number of DSUs held by the director. As of December 31, 2017, the total number of DSUs held by participating directors was 452,981 (2016 - 514,352).
| B. | Phantom stock option |
Cameco makes annual grants of bonuses to eligiblenon-North American employees in the form of phantom stock options. Employees receive the equivalent value of shares in cash when exercised. Options granted under the phantom stock option plan have an award value equal to the closing price quoted on the TSX for the common shares of Cameco on the trading day prior to the date on which the option is granted. The options vest over three years and expire eight years from the date granted. As of December 31, 2017, the number of options held by participating employees was 391,714 (2016 - 347,858) with exercise prices ranging from $14.70 to $39.53 per share (2016 - $16.38 to $39.53) and a weighted average exercise price of $22.13 (2016 - $24.13).
Cameco has recognized the following expenses (recoveries) under its cash-settled plans:
2017
| 2016
| |||||||
Deferred share unit plan | $ | (42 | ) | $ | (739 | ) | ||
Phantom stock option plan | 176 | (83 | ) | |||||
| $
| 134
|
| $
| (822
| )
| |||
At December 31, 2017, a liability of $5,771,000 (2016 - $7,558,000) was included in the consolidated statements of financial position to recognize accrued but unpaid expenses for cash-settled plans.
Fair value measurement of cash-settled plans
The fair value of the phantom stock option plan was measured based on the Black-Scholes option-pricing model. Expected volatility is estimated by considering historic average share price volatility. The inputs used in the measurement of the fair values of the phantom stock option plan at the grant and reporting dates were as follows:
Grant date
| Reporting date
| |||||
Number of units | 127,595 | 391,714 | ||||
Average strike price | $14.70 | $22.13 | ||||
Expected dividend | $0.40 | $0.08 | ||||
Expected volatility | 33% | 38% | ||||
Risk-free interest rate | 1.1% | 1.7% | ||||
Expected life of option | 4.5 years | 3.3 years | ||||
Expected forfeitures | 7% | 7% | ||||
Weighted average measurement date fair values
|
| $3.28
|
| $1.35
| ||
| 122 | CAMECO CORPORATION |
| 23. | Pension and other post-retirement benefits |
Cameco maintains both defined benefit and defined contribution plans providing pension benefits to substantially all of its employees. All regular and temporary employees participate in a registered defined contribution plan. This plan is registered under the Pension Benefits Standard Act, 1985. In addition, all Canadian-based executives participate in anon-registered supplemental executive pension plan which is a defined benefit plan.
Under the supplemental executive pension plan (SEPP), Cameco provides a lump sum benefit equal to the present value of a lifetime pension benefit based on the executive’s length of service and final average earnings. The plan provides for unreduced benefits to be paid at the normal retirement age of 65, however unreduced benefits could be paid if the executive was at least 60 years of age and had 20 years of service at retirement. This program provides for a benefit determined by a formula based on earnings and service, reduced by the benefits payable under the registered base plan. Security is provided for the SEPP benefits through a letter of credit held by the plan’s trustee. The face amount of the letter of credit is determined each year based on thewind-up liabilities of the supplemental plan, less any plan assets currently held with the trustee. A valuation is required annually to determine the letter of credit amount. Benefits will continue to be paid from plan assets until the fund is exhausted, at which time Cameco will begin paying benefits from corporate assets.
Cameco also maintainsnon-pension post-retirement plans (“other benefit plans”) which are defined benefit plans that cover such benefits as group life insurance and supplemental health and dental coverage to eligible employees and their dependents. The costs related to these plans are charged to earnings in the period during which the employment services are rendered. These plans are funded by Cameco as benefit claims are made.
The board of directors of Cameco has final responsibility and accountability for the Cameco retirement programs. The board is ultimately responsible for managing the programs to comply with applicable legislation, providing oversight over the general functions and setting certain policies.
Cameco expects to pay $1,713,000 in contributions and letter of credit fees to its defined benefit plans in 2018.
The post-retirement plans expose Cameco to actuarial risks, such as longevity risk, market risk, interest rate risk, liquidity risk and foreign currency risk. The other benefit plans expose Cameco to risks of higher supplemental health and dental utilization than expected. However, the other benefit plans have limits on Cameco’s annual benefits payable.
The effective date of the most recent valuation for funding purposes on the registered defined benefit pension plans is January 1, 2015. The next planned effective date for valuations is January 1, 2018.
| 2017 CONSOLIDATED FINANCIAL STATEMENTS AND NOTES | 123 |
Cameco has more than one defined benefit plan and has generally provided aggregated disclosures in respect of these plans, on the basis that these plans are not exposed to materially different risks. Information relating to Cameco’s defined benefit plans is shown in the following table:
| Pension benefit plans
| Other benefit plans | |||||||||||||||||||||||
| 2017
| 2016
| 2017
| 2016
| |||||||||||||||||||||
Fair value of plan assets, beginning of year | $ | 8,652 | $ | 10,632 | $ | - | $ | - | ||||||||||||||||
Interest income on plan assets | 320 | 403 | - | - | ||||||||||||||||||||
Return on assets excluding interest income | (2) | (127) | - | - | ||||||||||||||||||||
Benefits paid | (907) | (2,254) | - | - | ||||||||||||||||||||
Administrative costs paid | (2) | (2) | - | - | ||||||||||||||||||||
Fair value of plan assets, end of year
| $
| 8,061
|
| $
| 8,652
|
| $
| -
|
| $
| -
|
| ||||||||||||
Defined benefit obligation, beginning of year | $ | 54,930 | $ | 52,996 | $ | 23,421 | $ | 21,771 | ||||||||||||||||
Current service cost | 1,544 | 1,634 | 1,227 | 1,153 | ||||||||||||||||||||
Interest cost | 1,810 | 1,842 | 945 | 900 | ||||||||||||||||||||
Actuarial loss arising from: | ||||||||||||||||||||||||
- financial assumptions | 3,840 | 677 | 2,076 | 373 | ||||||||||||||||||||
- experience adjustment | 2,403 | 1,605 | 50 | 161 | ||||||||||||||||||||
Benefits paid | (9,095) | (2,970) | (826) | (937) | ||||||||||||||||||||
Foreign exchange | 540 | (854) | - | - | ||||||||||||||||||||
Defined benefit obligation, end of year
| $
| 55,972
|
| $
| 54,930
|
| $
| 26,893
|
| $
| 23,421
|
| ||||||||||||
Defined benefit liability [note 13]
| $
| (47,911)
|
| $
| (46,278)
|
| $
| (26,893)
|
| $
| (23,421)
|
| ||||||||||||
The percentages of the total fair value of assets in the pension plans for each asset category at December 31 were as follows:
|
| |||||||||||||||||||||||
| Pension benefit plans
| ||||||||||||||||||||||||
| 2017
| 2016
| |||||||||||||||||||||||
Asset category(a) | ||||||||||||||||||||||||
Canadian equity securities | 8% | 8% | ||||||||||||||||||||||
Global equity securities | 16% | 15% | ||||||||||||||||||||||
Canadian fixed income | 27% | 26% | ||||||||||||||||||||||
Other(b) | 49% | 51% | ||||||||||||||||||||||
Total
|
| 100%
|
|
| 100%
|
| ||||||||||||||||||
(a) The defined benefit plan assets contain no material amounts of related party assets at December 31, 2017 and 2016 respectively.
(b) Relates to the value of the refundable tax account held by the Canada Revenue Agency. The refundable total is approximately equal to half of the sum of the realized investment income plus employer contributions less half of the benefits paid by the plan.
| 124 | CAMECO CORPORATION |
The following represents the components of net pension and other benefit expense included primarily as part of administration:
| Pension benefit plans | Other benefit plans | |||||||||||||||
| 2017
| 2016
| 2017
| 2016
| |||||||||||||
Current service cost | $ | 1,544 | $ | 1,634 | $ | 1,227 | $ | 1,153 | ||||||||
Net interest cost | 1,490 | 1,439 | 945 | 900 | ||||||||||||
Administration cost | 2 | 2 | - | - | ||||||||||||
Defined benefit expense [note 16] | 3,036 | 3,075 | 2,172 | 2,053 | ||||||||||||
Defined contribution pension expense [note 16] | 15,929 | 17,716 | - | - | ||||||||||||
Net pension and other benefit expense
| $
| 18,965
|
| $
| 20,791
|
| $
| 2,172
|
| $
| 2,053
|
| ||||
The total amount of actuarial losses recognized in other comprehensive income is:
|
| |||||||||||||||
| Pension benefit plans | Other benefit plans | |||||||||||||||
| 2017
| 2016
| 2017
| 2016
| |||||||||||||
Actuarial loss | $ | 6,243 | $ | 2,282 | $ | 2,126 | $ | 534 | ||||||||
Return on plan assets excluding interest income | 2 | 127 | - | - | ||||||||||||
$
|
6,245
|
| $
| 2,409
|
| $
| 2,126
|
| $
| 534
|
| |||||
The assumptions used to determine the Company’s defined benefit obligation and net pension and other benefit expense were as follows at December 31 (expressed as weighted averages):
|
| |||||||||||||||
| Pension benefit plans | Other benefit plans | |||||||||||||||
| 2017
| 2016
| 2017
| 2016
| |||||||||||||
Discount rate - obligation | 3.4% | 3.9% | 3.4% | 3.9% | ||||||||||||
Discount rate - expense | 3.9% | 3.9% | 3.9% | 4.0% | ||||||||||||
Rate of compensation increase | 3.0% | 3.0% | - | - | ||||||||||||
Initial health care cost trend rate | - | - | 7.0% | 7.0% | ||||||||||||
Cost trend rate declines to | - | - | 5.0% | 5.0% | ||||||||||||
Year the rate reaches its final level | - | - | 2021 | 2021 | ||||||||||||
Dental care cost trend rate
|
| -
|
|
| -
|
|
| 5.0%
|
|
| 5.0%
|
| ||||
At December 31, 2017, the weighted average duration of the defined benefit obligation for the pension plans was 20.3 years (2016- 19.6 years) and for the other benefit plans was 15.7 years (2016 - 15.2 years).
A 1% change at the reporting date to one of the relevant actuarial assumptions, holding other assumptions constant, would have affected the defined benefit obligation by the following:
|
| |||||||||||||||
| Pension benefit plans | Other benefit plans | |||||||||||||||
| Increase
| Decrease
| Increase
| Decrease
| |||||||||||||
Discount rate | $ | (7,103 | ) | $ | 9,296 | $ | (3,693) | $ | 4,689 | |||||||
Rate of compensation increase
|
| 2,841
|
|
| (2,598
| )
|
| n/a
|
|
| n/a
|
| ||||
A 1% change in any of the other assumptions would not have a significant impact on the defined benefit obligation.
| 2017 CONSOLIDATED FINANCIAL STATEMENTS AND NOTES | 125 |
The methods and assumptions used in preparing the sensitivity analyses are the same as the methods and assumptions used in determining the financial position of Cameco’s plans as at December 31, 2017. The sensitivity analyses are determined by varying the sensitivity assumption and leaving all other assumptions unchanged. Therefore, the sensitivity analyses do not recognize any interdependence in the assumptions. The methods and assumptions used in determining the above sensitivity are consistent with the methods and assumptions used in the previous year.
In addition, an increase of one year in the expected lifetime of plan participants in the pension benefit plans would increase the defined benefit obligation by $1,329,000.
To measure the longevity risk for these plans, the mortality rates were reduced such that the average life expectancy for all members increased by one year. The reduced mortality rates were subsequently used tore-measure the defined benefit obligation of the entire plan.
| 24. | Financial instruments and related risk management |
Cameco is exposed in varying degrees to a variety of risks from its use of financial instruments. Management and the board of directors, both separately and together, discuss the principal risks of our businesses. The board sets policies for the implementation of systems to manage, monitor and mitigate identifiable risks. Cameco’s risk management objective in relation to these instruments is to protect and minimize volatility in cash flow. The types of risks Cameco is exposed to, the source of risk exposure and how each is managed is outlined below.
Market risk
Market risk is the risk that changes in market prices, such as commodity prices, foreign currency exchange rates and interest rates, will affect the Company’s earnings or the fair value of its financial instruments. Cameco engages in various business activities which expose the Company to market risk. As part of its overall risk management strategy, Cameco uses derivatives to manage some of its exposures to market risk that result from these activities.
Derivative instruments may include financial and physical forward contracts. Such contracts may be used to establish a fixed price for a commodity, an interest-bearing obligation or a cash flow denominated in a foreign currency. Market risks are monitored regularly against defined risk limits and tolerances.
Cameco’s actual exposure to these market risks is constantly changing as the Company’s portfolios of foreign currency, interest rate and commodity contracts change.
The types of market risk exposure and the way in which such exposure is managed are as follows:
| A. | Commodity price risk |
As a significant producer and supplier of uranium and nuclear fuel processing services, Cameco bears significant exposure to changes in prices for these products. A substantial change in prices will affect the Company’s net earnings and operating cash flows. Prices for Cameco’s products are volatile and are influenced by numerous factors beyond the Company’s control, such as supply and demand fundamentals and geopolitical events.
Cameco’s sales contracting strategy focuses on reducing the volatility in future earnings and cash flow, while providing both protection against decreases in market price and retention of exposure to future market price increases. To mitigate the risks associated with the fluctuations in the market price for uranium products, Cameco seeks to maintain a portfolio of uranium product sales contracts with a variety of delivery dates and pricing mechanisms that provide a degree of protection from pricing volatility.
Cameco is exposed to commodity price risk through its use of a uranium contract derivative. As of the reporting date, a 30% decrease in the price of uranium based on the Numerco forward uranium price curve, would result in a loss on this derivative of $7,516,000 ($5,770,000 (US)). A 30% increase would have an equal but opposite impact.
| 126 | CAMECO CORPORATION |
| B. | Foreign exchange risk |
The relationship between the Canadian and US dollar affects financial results of the uranium business as well as the fuel services business. Sales of uranium product, conversion and fuel manufacturing services are routinely denominated in US dollars while production costs are largely denominated in Canadian dollars.
Cameco attempts to provide some protection against exchange rate fluctuations by planned hedging activity designed to smooth volatility. To mitigate risks associated with foreign currency, Cameco enters into forward sales and option contracts to establish a price for future delivery of the foreign currency. These foreign currency contracts are not designated as hedges and are recorded at fair value with changes in fair value recognized in earnings. Cameco also has a natural hedge against US currency fluctuations because a portion of its annual cash outlays, including purchases of uranium and conversion services, is denominated in US dollars.
Cameco holds a number of financial instruments denominated in foreign currencies that expose the Company to foreign exchange risk. Cameco measures its exposure to foreign exchange risk on financial instruments as the change in carrying values that would occur as a result of reasonably possible changes in foreign exchange rates, holding all other variables constant. As of the reporting date, the Company has determined itspre-tax exposure to foreign currency exchange risk on financial instruments to be as follows based on a 5% weakening of the Canadian dollar:
| Carrying value | ||||||||||||
| Currency
| (Cdn)
| Gain (loss)
| ||||||||||
Cash and cash equivalents | EUR | $ | 23,495 | $ | 1,175 | |||||||
Cash and cash equivalents | USD | 149,655 | 7,483 | |||||||||
Accounts receivable | USD | 333,240 | 16,662 | |||||||||
Accounts receivable | KZT | 42,032 | 2,212 | |||||||||
Long-term receivables, investments and other | USD | 58,820 | 2,941 | |||||||||
Accounts payable and accrued liabilities | USD | (88,281 | ) | (4,414 | ) | |||||||
Net foreign currency derivatives
|
| USD
|
|
| 34,360
|
|
| (59,965
| )
| |||
A 5% strengthening of the Canadian dollar against the currencies above at December 31, 2017 would have had an equal but opposite effect on the amounts shown above, assuming all other variables remained constant.
| C. | Interest rate risk |
The Company has a strategy of minimizing its exposure to interest rate risk by maintaining target levels of fixed and variable rate borrowings. The proportions of outstanding debt carrying fixed and variable interest rates are reviewed by senior management to ensure that these levels are within approved policy limits. At December 31, 2017, the proportion of Cameco’s outstanding debt that carries fixed interest rates is 80% (2016 - 80%).
Cameco is exposed to interest rate risk through its interest rate swap contracts whereby fixed rate payments on a notional amount of $300,000,000 of the Series D senior unsecured debentures were swapped for variable rate payments. The swaps terminate on September 2, 2019. Under the terms of the swaps, Cameco makes interest payments based on the three-month Canada Dealer Offered Rate plus an average margin of 3.7% and receives fixed interest payments of 5.67%. At December 31, 2017, the fair value of Cameco’s interest rate swap net liability was $150,000 (2016 - asset of $6,547,000).
Cameco is also exposed to interest rate risk on its loan facility with Inkai due to the variable nature of the interest rate contained in the terms therein (note 29).
| 2017 CONSOLIDATED FINANCIAL STATEMENTS AND NOTES | 127 |
Cameco measures its exposure to interest rate risk as the change in cash flows that would occur as a result of reasonably possible changes in interest rates, holding all other variables constant. As of the reporting date, the Company has determined the impact on earnings of a 1% increase in interest rate on variable rate financial instruments to be as follows:
| Gain (loss)
| ||||
Interest rate contracts | $ | (3,009) | ||
Advances receivable from Inkai
|
| 611
|
| |
Counterparty credit risk
Counterparty credit risk is associated with the ability of counterparties to satisfy their contractual obligations to Cameco, including both payment and performance. Cameco’s sales of uranium product, conversion and fuel manufacturing services expose the Company to the risk ofnon-payment.
Cameco manages the risk ofnon-payment by monitoring the credit worthiness of its customers and seekingpre-payment or other forms of payment security from customers with an unacceptable level of credit risk. To mitigate risks associated with certain financial assets, Cameco will hold positions with a variety of large creditworthy institutions.
The maximum exposure to credit risk, as represented by the carrying amount of the financial assets, at December 31 was:
| 2017
| 2016
| |||||||
Cash and cash equivalents | $ | 591,620 | $ | 320,278 | ||||
Accounts receivable [note 6] | 393,213 | 238,514 | ||||||
Advances receivable from Inkai [note 29] | 58,820 | 90,095 | ||||||
Derivative assets [note 10] | 40,804 | 10,612 | ||||||
Other
|
| -
|
|
| 4,966
|
| ||
At December 31, 2017, there were no significant concentrations of credit risk and no amounts were held as collateral. Historically, Cameco has experienced minimal customer defaults and, as a result, considers the credit quality of its accounts receivable to be high. All accounts receivable at the reporting date are neither past due nor impaired.
Cameco has established programs for sales without recourse of trade accounts receivable to financial institutions. Through these programs, the Company surrenders the control, risks and benefits associated with the accounts receivable sold. The amount of receivables sold is recorded as a sale of financial assets and the balances are removed from the consolidated statement of financial position at the time of sale. The total amount of receivables sold under these programs and derecognized in accordance with IAS 39 during 2017 was $120,470,000 ($92,805,000 (USD)) (2016 - $214,428,000 ($159,551,000 (USD))).
Liquidity risk
Financial liquidity represents Cameco’s ability to fund future operating activities and investments. Cameco ensures that there is sufficient capital in order to meet short-term business requirements, after taking into account cash flows from operations and the Company’s holdings of cash and cash equivalents. The Company believes that these sources will be sufficient to cover the likely short-term and long-term cash requirements.
| 128 | CAMECO CORPORATION |
The table below outlines the Company’s available debt facilities at December 31, 2017:
| Total amount
| Outstanding and committed
| Amount available
| ||||||||||
Unsecured revolving credit facility | $ | 1,250,000 | $ | - | $ | 1,250,000 | ||||||
Letter of credit facilities
|
| 1,667,932
|
|
| 1,474,155
|
|
| 193,777
|
| |||
The tables below present a maturity analysis of Cameco’s financial liabilities, including principal and interest, based on the expected cash flows from the reporting date to the contractual maturity date:
| Carrying amount
| Contractual cash flows
| Due in less than 1 year
| Due in 1-3 years
| Due in 3-5 years
| Due after 5 years
| |||||||||||||||||||
Accounts payable and accrued liabilities | $ | 258,405 | $ | 258,405 | $ | 258,405 | $ | - | $ | - | $ | - | ||||||||||||
Dividends payable | 39,579 | 39,579 | 39,579 | - | - | - | ||||||||||||||||||
Long-term debt | 1,494,471 | 1,500,000 | - | 500,000 | 400,000 | 600,000 | ||||||||||||||||||
Foreign currency contracts | 5,624 | 5,624 | 1,747 | 3,877 | - | - | ||||||||||||||||||
Other derivative liabilities | 17,790 | 17,790 | 9,502 | 8,288 | - | - | ||||||||||||||||||
Total contractual repayments
| $
| 1,815,869
|
| $
| 1,821,398
|
| $
| 309,233
|
| $
| 512,165
|
| $
| 400,000
|
| $
| 600,000
|
| ||||||
| Total
| Due in less than 1 year
| Due in 1-3 years
| Due in 3-5 years
| Due after 5 years
| ||||||||||||||||||||
Total interest payments on long-term debt
| $
| 405,600
|
| $
| 69,390
|
| $
| 110,430
|
| $
| 82,080
|
| $
| 143,700
|
| |||||||||
Measurement of fair values
| A. | Accounting classifications and fair values |
The following tables summarize the carrying amounts and accounting classifications of Cameco’s financial instruments at the reporting date:
| 2017 CONSOLIDATED FINANCIAL STATEMENTS AND NOTES | 129 |
At December 31, 2017
| �� | ||||||||||||||||||||
| Fair value through profit or loss
| Loans and receivables
| Available for sale
| Other financial liabilities
| Total
| ||||||||||||||||
Financial assets | ||||||||||||||||||||
Cash and cash equivalents | $ | - | $ | 591,620 | $ | - | $ | - | $ | 591,620 | ||||||||||
Accounts receivable [note 6] | - | 396,824 | - | - | 396,824 | |||||||||||||||
Derivative assets [note 10] | ||||||||||||||||||||
Foreign currency contracts | 39,984 | - | - | - | 39,984 | |||||||||||||||
Interest rate contracts | 820 | - | - | - | 820 | |||||||||||||||
Investments in equity securities [note 10] | - | - | 21,417 | - | 21,417 | |||||||||||||||
Advances receivable from Inkai [note 29] | - | 58,820 | - | - | 58,820 | |||||||||||||||
$
|
40,804
|
| $
| 1,047,264
|
| $
| 21,417
|
| $
| -
|
| $
| 1,109,485
|
| ||||||
Financial liabilities | ||||||||||||||||||||
Accounts payable and accrued liabilities [note 11] | $ | - | $ | - | $ | - | $ | 258,405 | $ | 258,405 | ||||||||||
Dividends payable | - | - | - | 39,579 | 39,579 | |||||||||||||||
Derivative liabilities [note 13] | ||||||||||||||||||||
Foreign currency contracts | 5,624 | - | - | - | 5,624 | |||||||||||||||
Uranium contracts | 16,820 | - | - | - | 16,820 | |||||||||||||||
Interest rate contracts | 970 | - | - | - | 970 | |||||||||||||||
Long-term debt [note 12] | - | - | - | 1,494,471 | 1,494,471 | |||||||||||||||
|
23,414
|
|
| -
|
|
| -
|
|
| 1,792,455
|
|
| 1,815,869
|
| ||||||
Net
|
$
|
17,390
|
| $
| 1,047,264
|
| $
| 21,417
|
| $
| (1,792,455
| )
| $
| (706,384
| )
| |||||
At December 31, 2016
| ||||||||||||||||||||
| Fair value through profit or loss
| Loans and receivables
| Available for sale
| Other financial liabilities
| Total
| ||||||||||||||||
Financial assets | ||||||||||||||||||||
Cash and cash equivalents | $ | - | $ | 320,278 | $ | - | $ | - | $ | 320,278 | ||||||||||
Accounts receivable [note 6] | - | 242,482 | - | - | 242,482 | |||||||||||||||
Derivative assets [note 10] | ||||||||||||||||||||
Foreign currency contracts | 4,065 | - | - | - | 4,065 | |||||||||||||||
Interest rate contracts | 6,547 | - | - | - | 6,547 | |||||||||||||||
Investments in equity securities [note 10] | - | - | 14,807 | - | 14,807 | |||||||||||||||
Advances receivable from Inkai [note 29] | - | 90,095 | - | - | 90,095 | |||||||||||||||
Other | - | 4,966 | - | - | 4,966 | |||||||||||||||
$
|
10,612
|
| $
| 657,821
|
| $
| 14,807
|
| $
| -
|
| $
| 683,240
|
| ||||||
Financial liabilities | ||||||||||||||||||||
Accounts payable and accrued liabilities [note 11] | $ | - | $ | - | $ | - | $ | 312,900 | $ | 312,900 | ||||||||||
Dividends payable | - | - | - | 39,579 | 39,579 | |||||||||||||||
Derivative liabilities [note 13] | ||||||||||||||||||||
Foreign currency contracts | 29,231 | - | - | - | 29,231 | |||||||||||||||
Uranium contracts | 29,654 | - | - | - | 29,654 | |||||||||||||||
Long-term debt [note 12] | - | - | - | 1,493,327 | 1,493,327 | |||||||||||||||
|
58,885
|
|
| -
|
|
| -
|
|
| 1,845,806
|
|
| 1,904,691
|
| ||||||
Net
| $
| (48,273
| )
| $
| 657,821
|
| $
| 14,807
|
| $
| (1,845,806
| )
| $
| (1,221,451
| )
| |||||
| 130 | CAMECO CORPORATION |
Cameco does not have any financial instruments classified asheld-for-trading, orheld-to-maturity as of the reporting date.
The following tables summarize the carrying amounts and fair values of Cameco’s financial instruments, including their levels in the fair value hierarchy:
As at December 31, 2017
Fair value | ||||||||||||||||
| Carrying value
|
Level 1
| Level 2
| Total
| |||||||||||||
Derivative assets [note 10] | ||||||||||||||||
Foreign currency contracts | $ | 39,984 | $ | - | $ | 39,984 | $ | 39,984 | ||||||||
Interest rate contracts | 820 | - | 820 | 820 | ||||||||||||
Investments in equity securities [note 10] | 21,417 | 21,417 | - | 21,417 | ||||||||||||
Derivative liabilities [note 13] | ||||||||||||||||
Foreign currency contracts | (5,624 | ) | - | (5,624 | ) | (5,624 | ) | |||||||||
Uranium contracts | (16,820 | ) | - | (16,820 | ) | (16,820 | ) | |||||||||
Interest rate contracts | (970 | ) | - | (970 | ) | (970 | ) | |||||||||
Long-term debt [note 12] | (1,494,471 | ) | - | (1,652,230 | ) | (1,652,230 | ) | |||||||||
Net
| $
| (1,455,664
| )
| $
| 21,417
|
| $
| (1,634,840
| )
| $
| (1,613,423
| )
| ||||
As at December 31, 2016
| ||||||||||||||||
Fair value | ||||||||||||||||
Carrying value
| Level 1
| Level 2
| Total
| |||||||||||||
Derivative assets [note 10] | ||||||||||||||||
Foreign currency contracts | $ | 4,065 | $ | - | $ | 4,065 | $ | 4,065 | ||||||||
Interest rate contracts | 6,547 | - | 6,547 | 6,547 | ||||||||||||
Investments in equity securities [note 10] | 14,807 | 14,807 | - | 14,807 | ||||||||||||
Derivative liabilities [note 13] | ||||||||||||||||
Foreign currency contracts | (29,231 | ) | - | (29,231 | ) | (29,231 | ) | |||||||||
Share purchase options | (29,654 | ) | - | (29,654 | ) | (29,654 | ) | |||||||||
Long-term debt [note 12] | (1,493,327 | ) | - | (1,721,805 | ) | (1,721,805 | ) | |||||||||
Net
| $
| (1,526,793
| )
| $
| 14,807
|
| $
| (1,770,078
| )
| $
| (1,755,271
| )
| ||||
The preceding tables exclude fair value information for financial instruments whose carrying amounts are a reasonable approximation of fair value. The carrying value of Cameco’s cash and cash equivalents, accounts receivable and accounts payable and accrued liabilities approximates its fair value as a result of the short-term nature of the instruments.
There were no transfers between level 1 and level 2 during the period. Cameco does not have any financial instruments that are classified as level 3 as of the reporting date.
| B. | Financial instruments measured at fair value |
Cameco measures its derivative financial instruments, material investments in equity securities and long-term debt at fair value. Investments in publicly held equity securities are classified as a recurring level 1 fair value measurement while derivative financial instruments and long-term debt are classified as a recurring level 2 fair value measurement.
The fair value of investments in equity securities is determined using quoted share prices observed in the principal market for the securities as of the reporting date. The fair value of Cameco’s long-term debt is determined using quoted market yields as of the reporting date, which ranged from 1.6% to 2.3% (2016 - 0.8% to 2.3%).
| 2017 CONSOLIDATED FINANCIAL STATEMENTS AND NOTES | 131 |
Foreign currency derivatives consist of foreign currency forward contracts, options and swaps. The fair value of foreign currency options is measured based on the Black Scholes option-pricing model. The fair value of foreign currency forward contracts and swaps is measured using a market approach, based on the difference between contracted foreign exchange rates and quoted forward exchange rates as of the reporting date.
Interest rate derivatives consist of interest rate swap contracts. The fair value of interest rate swaps is determined by discounting expected future cash flows from the contracts. The future cash flows are determined by measuring the difference between fixed interest payments to be received and floating interest payments to be made to the counterparty based on Canada Dealer Offer Rate forward interest rate curves.
Uranium contract derivatives consist of written options and price swaps. The fair value of uranium options is measured based on the Black Scholes option-pricing model. The fair value of uranium price swaps is determined by discounting expected future cash flows from the contracts. The future cash flows are determined by measuring the difference between fixed purchases or sales under contracted prices, and floating purchases or sales based on Numerco forward uranium price curves.
Where applicable, the fair value of the derivatives reflects the credit risk of the instrument and includes adjustments to take into account the credit risk of the Company and counterparty. These adjustments are based on credit ratings and yield curves observed in active markets at the reporting date.
Derivatives
The following table summarizes the fair value of derivatives and classification on the consolidated statements of financial position:
| 2017
| 2016
| |||||||
Non-hedge derivatives: | ||||||||
Foreign currency contracts | $ | 34,360 | $ | (25,166 | ) | |||
Interest rate contracts | (150 | ) | 6,547 | |||||
Contract derivatives | (16,820 | ) | (29,654 | ) | ||||
Net
| $
| 17,390
|
| $
| (48,273
| )
| ||
Classification: | ||||||||
Current portion of long-term receivables, investments and other [note 10] | $ | 25,948 | $ | 4,119 | ||||
Long-term receivables, investments and other [note 10] | 14,856 | 6,493 | ||||||
Current portion of other liabilities [note 13] | (11,249 | ) | (24,966 | ) | ||||
Other liabilities [note 13] | (12,165 | ) | (33,919 | ) | ||||
Net
| $
| 17,390
|
| $
| (48,273
| )
| ||
| 132 | CAMECO CORPORATION |
The following table summarizes the different components of the gains (losses) on derivatives included in net earnings:
| 2017
| 2016
| |||||||
Non-hedge derivatives: | ||||||||
Foreign currency contracts | $ | 58,983 | $ | 59,398 | ||||
Interest rate contracts | (4,014 | ) | (1,016 | ) | ||||
Uranium contracts | 1,281 | (23,975 | ) | |||||
Net
| $
| 56,250
|
| $
| 34,407
|
| ||
| 25. | Capital management |
Cameco’s management considers its capital structure to consist of bank overdrafts, long-term debt, short-term debt (net of cash and cash equivalents and short-term investments),non-controlling interest and shareholders’ equity.
Cameco’s capital structure reflects its strategy and the environment in which it operates. Delivering returns to long-term shareholders is a top priority. The Company’s objective is to maximize cash flow while maintaining its investment grade rating through close capital management of our balance sheet metrics. Capital resources are managed to allow it to support achievement of its goals while managing financial risks such as the continued weakness in the market, litigation risk and refinancing risk. The overall objectives for managing capital in 2017 reflect the environment that the Company is operating in, similar to the prior comparative period.
The capital structure at December 31 was as follows:
| 2017
| 2016
| |||||||
Long-term debt [note 12] | $ | 1,494,471 | $ | 1,493,327 | ||||
Cash and cash equivalents | (591,620 | ) | (320,278 | ) | ||||
Net debt
|
| 902,851
|
|
| 1,173,049
|
| ||
Non-controlling interest | 371 | 157 | ||||||
Shareholders’ equity | 4,859,288 | 5,258,371 | ||||||
Total equity
|
| 4,859,659
|
|
| 5,258,528
|
| ||
Total capital
| $
| 5,762,510
|
| $
| 6,431,577
|
| ||
Cameco is bound by certain covenants in its general credit facilities. These covenants place restrictions on total debt, including guarantees and set minimum levels for net worth. As of December 31, 2017, Cameco met these requirements.
| 26. | Segmented information |
Cameco has three reportable segments: uranium, fuel services and NUKEM. Cameco’s reportable segments are strategic business units with different products, processes and marketing strategies. The uranium segment involves the exploration for, mining, milling, purchase and sale of uranium concentrate. The fuel services segment involves the refining, conversion and fabrication of uranium concentrate and the purchase and sale of conversion services. The NUKEM segment acts as a market intermediary between uranium producers and nuclear-electric utilities.
In the third quarter of 2017, Cameco announced that the way its global marketing activities are organized would be changed. To betterco-ordinate marketing activities and reduce costs, all future Canadian and international marketing activities will be consolidated in Saskatoon. These changes will have a significant impact on the activities historically performed by NUKEM and may change the factors that are considered in assessing the Company’s reportable segments in the future.
| 2017 CONSOLIDATED FINANCIAL STATEMENTS AND NOTES | 133 |
Accounting policies used in each segment are consistent with the policies outlined in the summary of significant accounting policies. Segment revenues, expenses and results include transactions between segments incurred in the ordinary course of business. These transactions are priced on an arm’s length basis, are eliminated on consolidation and are reflected in the “other” column.
| A. | Business segments - 2017 |
For the year ended December 31, 2017
| Uranium
|
Fuel
| NUKEM
| Other
| Total
| ||||||||||||||||
Revenue | $ | 1,574,068 | $ | 312,888 | $ | 321,188 | $ | (51,292 | ) | $ | 2,156,852 | |||||||||
Expenses | ||||||||||||||||||||
Cost of products and services sold | 910,685 | 212,035 | 321,362 | (53,849 | ) | 1,390,233 | ||||||||||||||
Depreciation and amortization | 267,931 | 37,093 | 14,193 | 11,128 | 330,345 | |||||||||||||||
Cost of sales
|
| 1,178,616
|
|
| 249,128
|
|
| 335,555
|
|
| (42,721
| )
|
| 1,720,578
|
| |||||
Gross profit (loss) | 395,452 | 63,760 | (14,367 | ) | (8,571 | ) | 436,274 | |||||||||||||
Administration | - | - | 12,439 | 150,656 | 163,095 | |||||||||||||||
Impairment charges | 246,931 | - | 111,399 | - | 358,330 | |||||||||||||||
Exploration | 29,933 | - | - | - | 29,933 | |||||||||||||||
Research and development | - | - | - | 5,660 | 5,660 | |||||||||||||||
Other operating loss | 43 | - | - | - | 43 | |||||||||||||||
Loss on disposal of assets | 5,901 | 247 | 799 | - | 6,947 | |||||||||||||||
Finance costs | - | - | 1,479 | 109,129 | 110,608 | |||||||||||||||
Loss (gain) on derivatives | - | - | 1,945 | (58,195 | ) | (56,250 | ) | |||||||||||||
Finance income | - | - | (23 | ) | (5,242 | ) | (5,265 | ) | ||||||||||||
Other expense | 7,193 | - | 1,263 | 21,954 | 30,410 | |||||||||||||||
Earnings (loss) before income taxes | 105,451 | 63,513 | (143,668 | ) | (232,533 | ) | (207,237 | ) | ||||||||||||
Income tax recovery | (2,519 | ) | ||||||||||||||||||
Net loss
|
| (204,718
| )
| |||||||||||||||||
Capital expenditures for the year
| $
| 132,073
|
| $
| 11,237
|
| $
| 23
|
| $
| -
|
| $
| 143,333
|
| |||||
| 134 | CAMECO CORPORATION |
For the year ended December 31, 2016
| Uranium
|
Fuel
| NUKEM
| Other
| Total
| ||||||||||||||||
Revenue | $ | 1,717,896 | $ | 321,374 | $ | 391,402 | $ | 732 | $ | 2,431,404 | ||||||||||
Expenses | ||||||||||||||||||||
Cost of products and services sold | 993,012 | 223,991 | 380,695 | (1,463 | ) | 1,596,235 | ||||||||||||||
Depreciation and amortization | 281,159 | 33,951 | 38,273 | 18,306 | 371,689 | |||||||||||||||
Cost of sales
|
| 1,274,171
|
|
| 257,942
|
|
| 418,968
|
|
| 16,843
|
|
| 1,967,924
|
| |||||
Gross profit (loss) | 443,725 | 63,432 | (27,566 | ) | (16,111 | ) | 463,480 | |||||||||||||
Administration | - | - | 20,088 | 186,564 | 206,652 | |||||||||||||||
Impairment charges | 361,989 | - | - | - | 361,989 | |||||||||||||||
Exploration | 42,579 | - | - | - | 42,579 | |||||||||||||||
Research and development | - | - | - | 4,952 | 4,952 | |||||||||||||||
Other operating income | (34,075 | ) | - | - | - | (34,075 | ) | |||||||||||||
Loss on disposal of assets | 22,787 | 221 | 160 | - | 23,168 | |||||||||||||||
Finance costs | - | - | 4,056 | 107,850 | 111,906 | |||||||||||||||
Gain on derivatives | - | - | (6,530 | ) | (27,877 | ) | (34,407 | ) | ||||||||||||
Finance income | - | - | (396 | ) | (3,983 | ) | (4,379 | ) | ||||||||||||
Share of earnings from | ||||||||||||||||||||
Other expense (income) | (56,219 | ) | (10,372 | ) | 329 | 5,591 | (60,671 | ) | ||||||||||||
Earnings (loss) before income taxes | 106,664 | 73,583 | (45,273 | ) | (289,208 | ) | (154,234 | ) | ||||||||||||
Income tax recovery | (94,355 | ) | ||||||||||||||||||
Net loss
|
| (59,879
| )
| |||||||||||||||||
Capital expenditures for the year
| $
| 201,722
|
| $
| 13,983
|
| $
| 1,203
|
| $
| -
|
| $
| 216,908
|
| |||||
| B. | Geographic segments |
Revenue is attributed to the geographic location based on the location of the entity providing the services. The Company’s revenue from external customers is as follows:
| 2017
| 2016
| |||||||
United States | $ | 1,692,936 | $ | 1,902,679 | ||||
Canada | 316,611 | 347,536 | ||||||
Germany | 147,305 | 181,189 | ||||||
| $
| 2,156,852
|
| $
| 2,431,404
|
| |||
The Company’snon-current assets, excluding deferred tax assets and financial instruments, by geographic location are as follows:
| 2017
| 2016
| |||||||
Canada | $ | 3,417,254 | $ | 3,665,558 | ||||
Australia | 422,400 | 420,448 | ||||||
United States | 138,455 | 327,266 | ||||||
Kazakhstan | 283,562 | 318,006 | ||||||
Germany | 233 | 127,618 | ||||||
$
|
4,261,904
|
| $
| 4,858,896
|
| |||
| 2017 CONSOLIDATED FINANCIAL STATEMENTS AND NOTES | 135 |
| 27. | Group entities |
The following are the principal subsidiaries and associates of the Company:
Principal place | Ownership interest | |||||||||||
| of business
| 2017
| 2016
| ||||||||||
Subsidiaries: | ||||||||||||
Cameco Fuel Manufacturing Inc. | Canada | 100% | 100% | |||||||||
Cameco Marketing Inc. | Canada | 100% | - | |||||||||
Cameco Inc. | US | 100% | 100% | |||||||||
Power Resources, Inc. | US | 100% | 100% | |||||||||
Crow Butte Resources, Inc. | US | 100% | 100% | |||||||||
NUKEM, Inc. | US | 100% | - | |||||||||
NUKEM Investments GmbH | Germany | 100% | 100% | |||||||||
Cameco Australia Pty. Ltd. | Australia | 100% | 100% | |||||||||
Cameco Europe Ltd. | Switzerland | 100% | 100% | |||||||||
| 28. | Joint operations |
Cameco conducts a portion of its exploration, development, mining and milling activities through joint operations located around the world. Operations are governed by agreements that provide for joint control of the strategic operating, investing and financing activities among the partners. These agreements were considered in the determination of joint control. Cameco’s significant Canadian uranium joint operation interests are McArthur River, Key Lake and Cigar Lake. The Canadian uranium joint operations allocate uranium production to each joint operation participant and the joint operation participant derives revenue directly from the sale of such product. The participants in the Inkai joint operation purchase uranium from Inkai and, in turn, derive revenue directly from the sale of such product to third-party customers. Mining and milling expenses incurred by joint operations are included in the cost of inventory.
Cameco reflects its proportionate interest in these assets and liabilities as follows:
Principal place
| Ownership
| 2017
| 2016
| |||||||||||||
Total assets | ||||||||||||||||
McArthur River | Canada | 69.81 | % | $ | 1,121,509 | $ | 1,093,254 | |||||||||
Key Lake | Canada | 83.33 | % | 482,879 | 571,183 | |||||||||||
Cigar Lake | Canada | 50.03 | % | 1,531,150 | 1,591,489 | |||||||||||
Inkai | Kazakhstan | 60.00 | % | 230,280 | 290,122 | |||||||||||
| $
| 3,365,818
|
| $
| 3,546,048
|
| |||||||||||
Total liabilities | ||||||||||||||||
McArthur River | 69.81 | % | $ | 38,896 | $ | 43,189 | ||||||||||
Key Lake | 83.33 | % | 140,214 | 150,847 | ||||||||||||
Cigar Lake | 50.03 | % | 40,687 | 37,888 | ||||||||||||
Inkai | 60.00 | % | 119,998 | 181,145 | ||||||||||||
| $
| 339,795
|
| $
| 413,069
|
| |||||||||||
Through unsecured shareholder loans, Cameco has agreed to fund the development of the Inkai project. Cameco eliminates the loan balances recorded by Inkai and records advances receivable (notes 10 and 29) representing its 40% share.
| 136 | CAMECO CORPORATION |
| 29. | Related parties |
The shares of Cameco are widely held and no shareholder, resident in Canada, is allowed to own more than 25% of the Company’s outstanding common shares, either individually or together with associates. Anon-resident of Canada is not allowed to own more than 15%.
Transactions with key management personnel
Key management personnel are those persons that have the authority and responsibility for planning, directing and controlling the activities of the Company, directly or indirectly. Key management personnel of the Company include executive officers, vice-presidents, other senior managers and members of the board of directors.
In addition to their salaries, Cameco also providesnon-cash benefits to executive officers and vice-presidents and contributes to pension plans on their behalf (note 23). Senior management and directors also participate in the Company’s share-based compensation plans (note 22).
Executive officers are subject to terms of notice ranging from three to six months. Upon resignation at the Company’s request, they are entitled to termination benefits of up to the lesser of 18 to 24 months or the period remaining until age 65. The termination benefits include gross salary plus the target short-term incentive bonus for the year in which termination occurs.
Compensation for key management personnel was comprised of:
| 2017
| 2016
| |||||||
Short-term employee benefits | $ | 26,569 | $ | 17,673 | ||||
Share-based compensation | 11,525 | 10,464 | ||||||
Post-employment benefits | 5,914 | 5,910 | ||||||
Termination benefits | 916 | 608 | ||||||
$
|
44,924
|
| $
| 34,655
|
| |||
| (a) | Excludes deferred share units held by directors (see note 22). |
Other related party transactions
Through unsecured shareholder loans, Cameco has agreed to fund Inkai’s project development costs as well as further evaluation on block 3. The limits of the loan facilities are $175,000,000 (US) and advances under these facilities bear interest at a rate of LIBOR plus 2%. At December 31, 2017, $117,218,000 (US) of principal and interest was outstanding (2016 - $167,750,000 (US)).
Cameco’s share of outstanding principal and interest, representing the 40% owed to it, was $58,820,000 at December 31, 2017 (2016 - $90,095,000) (notes 10 and 28). For the year ended December 31, 2017, Cameco recorded interest income of $2,182,000 relating to this balance (2016 - $2,155,000).
| 30. | Subsequent event |
On December 11, 2017, Cameco announced that the restructuring of JV Inkai outlined in the implementation agreement dated May 27, 2016 with Joint Stock Company National Atomic Company Kazatomprom (Kazatomprom) and JV Inkai closed and would take effect on January 1, 2018. Under the implementation agreement, Cameco’s ownership interest in JV Inkai will be adjusted to 40% and Kazatomprom’s ownership interest in JV Inkai will be adjusted to 60%. As a result, Cameco will account for JV Inkai on an equity basis commencing on January 1, 2018.
In addition, Cameco will recognize a gain on the change in ownership interests of approximately $66,000,000. The resulting gain on restructuring will be reflected in our financial results for the first quarter of 2018.
| 2017 CONSOLIDATED FINANCIAL STATEMENTS AND NOTES | 137 |
Investor Information
Common Shares
Toronto (CCO) | New York (CCJ)
Transfer Agents and Registrars
The registrar and transfer agent for Cameco’s common shares is AST Trust Company. For information on common shareholdings, dividend cheques, lost share certificates and address changes, contact:
Canada | USA | |
AST Trust Company (Canada) | American Stock Transfer & | |
P.O. Box 700, Station B | Trust Company, LLC | |
Montreal, Quebec H3B 3K3 | 6201 15th Avenue | |
| Brooklyn, NY 11219 | ||
Telephone | ||
1-800-387-0825 or 1-416-682-3860 (outside of North America)
www.astfinancial.com/ca-en | ||
Inquiries Cameco Corporation 2121 - 11th Street West Saskatoon, Saskatchewan S7M 1J3
Phone: 306-956-6200 Fax: 306-956-6201 | For comprehensive financial information, visit:
cameco.com | |
| Annual Meeting | Dividends | |
| The annual meeting of shareholders of Cameco Corporation is scheduled to be held on May 16, 2018 at Cameco’s head office in Saskatoon, Saskatchewan. | In 2017, our board of directors reduced the planned dividend to $0.08 per common share to be paid annually. The decision to declare a dividend by our board will be based on our cash flow, financial position, strategy and other relevant factors including appropriate alignment with the cyclical nature of our earnings. | |