
Management’s discussion and analysis
February 7, 2020
| 6 | 2019 PERFORMANCE HIGHLIGHTS | |
| 10 | MARKET OVERVIEW AND DEVELOPMENTS | |
| 15 | OUR STRATEGY | |
| 25 | MEASURING OUR RESULTS | |
| 26 | FINANCIAL RESULTS | |
| 55 | OPERATIONS AND PROJECTS | |
| 78 | MINERAL RESERVES AND RESOURCES | |
| 83 | ADDITIONAL INFORMATION | |
This management’s discussion and analysis (MD&A) includes information that will help you understand management’s perspective of our audited consolidated financial statements (financial statements) and notes for the year ended December 31, 2019. The information is based on what we knew as of February 6, 2020.
We encourage you to read our audited consolidated financial statements and notes as you review this MD&A. You can find more information about Cameco, including our financial statements and our most recent annual information form, on our website at cameco.com, on SEDAR at sedar.com or on EDGAR at sec.gov. You should also read our annual information form before making an investment decision about our securities.
The financial information in this MD&A and in our financial statements and notes are prepared according to International Financial Reporting Standards (IFRS), unless otherwise indicated.
Unless we have specified otherwise, all dollar amounts are in Canadian dollars.
Throughout this document, the terms we, us, our, the Company and Cameco mean Cameco Corporation and its subsidiaries, unless otherwise indicated.
Caution about forward-looking information
Our MD&A includes statements and information about our expectations for the future. When we discuss our strategy, plans, future financial and operating performance, or other things that have not yet taken place, we are making statements considered to beforward-looking information orforward-looking statements under Canadian and United States (US) securities laws. We refer to them in this MD&A asforward-looking information.
Key things to understand about the forward-looking information in this MD&A:
| • | It typically includes words and phrases about the future, such as: anticipate, believe, estimate, expect, plan, will, intend, goal, target, forecast, project, strategy and outlook (see examples below). |
| • | It represents our current views, and can change significantly. |
| • | It is based on a number ofmaterial assumptions, including those we have listed on page 3, which may prove to be incorrect. |
| • | Actual results and events may be significantly different from what we currently expect, due to the risks associated with our business. We list a number of thesematerial risks on pages 2 and 3. We recommend you also review our most recent annual information form, which includes a discussion of othermaterial risks that could cause actual results to differ significantly from our current expectations. |
| • | Forward-looking information is designed to help you understand management’s current views of our near and longer term prospects, and it may not be appropriate for other purposes. We will not necessarily update this information unless we are required to by securities laws. |
Examples of forward-looking information in this MD&A
| • | on the financial front, we are well-positioned to execute on our strategy and self-manage risk |
| • | we will continue to take the necessary actions to maintain the strength of our balance sheet so we can self-manage risk, and that we expect will reward shareholders for their continued patience and support of our strategy to build long-term value |
| • | our expectations about 2020 and future global uranium supply, consumption, contracting volumes and demand, including the discussion under the headingMarket overview and developments |
| • | the discussion under the headingOur strategy |
| • | our expectations for uranium purchases |
| • | our expectations for uranium sales and deliveries |
| • | the discussion of our expectations relating to our Canada Revenue Agency (CRA) transfer pricing dispute, including that the Tax Court of Canada’s (Tax Court) ruling will be upheld on appeal, the timing of an appeal decision, the Tax Court ruling diminishes our tax risk relating to our CRA dispute, and our estimate of the amount and timing of expected cash taxes and transfer pricing penalties and the amount of the disbursements award |
| • | the discussion under the headingOutlook for 2020, including our 2020 financial outlook, expectations for 2020 gross profit and cash balances, and our price sensitivity analysis for our uranium segment |
| • | the outlook for our uranium and fuel services segments for 2020 |
| • | our expectations for future tax payments and rates, including effective tax rates |
| • | our expectation that our cash balances and operating cash flows will meet our anticipated 2020 capital requirements |
| • | our expectations for 2020, 2021 and 2022 capital expenditures |
| • | our expectation that in 2020 we will be able to comply with all the covenants in our unsecured revolving credit facility |
| • | production and life of mine operating cost estimates for the Cigar Lake and Inkai operations |
| • | future plans and expectations for uranium properties, advanced uranium projects, and fuel services operating sites |
| • | our expectations related to care and maintenance costs, including incurring between $150 million and $170 million in 2020 |
| • | our mineral reserve and resource estimates |
| • | our decommissioning estimates |
Material risks
| • | actual sales volumes or market prices for any of our products or services are lower than we expect for any reason, including changes in market prices, loss of market share to a competitor or trade restrictions |
| • | we are adversely affected by changes in currency exchange rates, interest rates, royalty rates, or tax rates |
| • | our production costs are higher than planned, or our cost reduction strategies are unsuccessful, or necessary supplies are not available, or not available on commercially reasonable terms |
| • | our strategies may change, be unsuccessful or have unanticipated consequences |
| • | our estimates and forecasts prove to be inaccurate, including production, purchases, deliveries, cash flow, revenue, costs, decommissioning, reclamation expenses, our tax expense, or receipt of future dividends from JV Inkai |
| • | we are unable to enforce our legal rights under our existing agreements, permits or licences |
| • | we are subject to litigation or arbitration that has an adverse outcome, including lack of success in our dispute with CRA |
| • | we are unsuccessful in our dispute with CRA and this results in significantly higher cash taxes, interest charges and penalties that could have a material adverse effect on us |
| • | we are unable to utilize letters of credit to the extent anticipated in our dispute with CRA |
| • | there are defects in, or challenges to, title to our properties |
| 2 | CAMECO CORPORATION |
| • | our mineral reserve and resource estimates are not reliable, or there are unexpected or challenging geological, hydrological or mining conditions |
| • | we are affected by environmental, safety and regulatory risks, including increased regulatory burdens or delays |
| • | necessary permits or approvals from government authorities cannot be obtained or maintained |
| • | we are affected by political risks |
| • | we are affected by terrorism, sabotage, blockades, civil unrest, social or political activism, accident or a deterioration in political support for, or demand for, nuclear energy |
| • | a major accident at a nuclear power plant |
| • | we are impacted by changes in the regulation or public perception of the safety of nuclear power plants, which adversely affect the construction of new plants, the relicensing of existing plants and the demand for uranium |
| • | government laws, regulations, policies or decisions that adversely affect us, including tax and trade laws |
| • | our uranium suppliers fail to fulfil delivery commitments or our uranium purchasers fail to fulfil purchase commitments |
| • | our Cigar Lake development, mining or production plans are delayed or do not succeed for any reason |
| • | any difficulties in milling of Cigar Lake ore at the McClean Lake mill |
| • | water quality and environmental concerns could result in a potential deferral of production and additional capital and operating expenses for the Cigar Lake operation |
| • | JV Inkai’s development, mining or production plans are delayed or do not succeed for any reason |
| • | our expectations relating to care and maintenance costs prove to be inaccurate |
| • | we are affected by natural phenomena, including inclement weather, fire, flood and earthquakes |
| • | our operations are disrupted due to problems with our own or our suppliers’ or customers’ facilities, the unavailability of reagents, equipment, operating parts and supplies critical to production, equipment failure, lack of tailings capacity, labour shortages, labour relations issues, strikes or lockouts, underground floods,cave-ins, ground movements, tailings dam failures, transportation disruptions or accidents, unanticipated consequences of our cost reduction strategies, or other development and operating risks |
Material assumptions
| • | our expectations regarding sales and purchase volumes and prices for uranium and fuel services, trade restrictions, and that counterparties to our sales and purchase agreements will honour their commitments |
| • | our expectations regarding the demand for and supply of uranium |
| • | our expectations regarding spot prices and realized prices for uranium, and other factors discussed under the headingPrice sensitivity analysis: uranium segment |
| • | that the construction of new nuclear power plants and the relicensing of existing nuclear power plants not being more adversely affected than expected by changes in regulation or in the public perception of the safety of nuclear power plants |
| • | our ability to continue to supply our products and services in the expected quantities and at the expected times |
| • | our expected production levels for uranium and conversion services |
| • | our cost expectations, including production costs, purchase costs, operating costs, capital costs, and the success of our cost reduction strategies |
| • | our expectations regarding tax rates and payments, royalty rates, currency exchange rates and interest rates |
| • | our expectations about the outcome of our dispute with CRA, including that the Tax Court ruling will be upheld on appeal |
| • | we are able to utilize letters of credit to the extent anticipated in our dispute with CRA |
| • | our decommissioning and reclamation estimates, including the assumptions upon which they are based, are reliable |
| • | our mineral reserve and resource estimates, and the assumptions upon which they are based, are reliable |
| • | our understanding of the geological, hydrological and other conditions at our uranium properties |
| • | our Cigar Lake development, mining and production plans succeed |
| • | the McClean Lake mill is able to process Cigar Lake ore as expected |
| • | JV Inkai’s development, mining and production plans succeed |
| • | the ability of JV Inkai to pay dividends |
| • | that care and maintenance costs will be as expected |
| • | our and our contractors’ ability to comply with current and future environmental, safety and other regulatory requirements, and to obtain and maintain required regulatory approvals |
| • | our operations are not significantly disrupted as a result of political instability, nationalization, terrorism, sabotage, blockades, civil unrest, breakdown, natural disasters, governmental or political actions, litigation or arbitration proceedings, the unavailability of reagents, equipment, operating parts and supplies critical to production, labour shortages, labour relations issues, strikes or lockouts, underground floods,cave-ins, ground movements, tailings dam failure, lack of tailings capacity, transportation disruptions or accidents, unanticipated consequences of our cost reduction strategies, or other development or operating risks |
| MANAGEMENT’S DISCUSSION AND ANALYSIS | 3 |
| 4 | CAMECO CORPORATION |
| MANAGEMENT’S DISCUSSION AND ANALYSIS | 5 |
2019 performance highlights
Throughout 2019 we continued to do what we said we would do, executing on all strategic fronts; operational, marketing and financial. On the operational front, Cigar Lake and our Fuel Services segment are performing very well. With the McArthur River/Key Lake operation still on care and maintenance, production in our uranium segment remained well below our committed sales. As a result, we were actively purchasing material on the spot market. On the financial front, we are well-positioned to execute on our strategy and self-manage risk. Our balance sheet is strong, we are starting 2020 with $1.1 billion in cash and $1 billion in long-term debt with maturities in 2022, 2024 and 2042. In addition, the Federal Court of Appeal hearing of our September 2018 unequivocal Tax Court of Canada (Tax Court) win has been scheduled to be held on March 4, 2020 and we anticipate we could receive a decision in 2020. We believe the Tax Court ruling diminishes the risk related to our tax case with Canada Revenue Agency (CRA) and believe the decision of the Tax Court will be upheld on appeal.
In 2019, the spot market underperformed our expectations, due to the delay ofend-user demand caused by uncertainty largely related to market acess and trade policy issues. However, we were pleased by our performance in the term market. The interest in long-term contracting and ouroff-market conversations with some of our best and largest customers continues. We have not seen the current level of prospective business in our pipeline since before 2011. Since the beginning of 2019, we added just over 36 million pounds of deliveries to our contract portfolio, more than replacing the volumes delivered in 2019, while maintaining leverage to higher future uranium prices. Our customers recognize that, from a security of supply perspective, diversification is important, and in some cases their risk management departments require it. They want access to long-lived,tier-one productive capacity from commercial suppliers who have a proven operating track record. Increasingly, many customers are also required to ensure their suppliers adhere to more stringent environmental, social, and governance performance standards. In addition, in light of the market access and trade policy issues affecting our market, they recognize the potential for trade policy distortions to regionalize supply, and ultimately, along with low prices, make the availability of future supply less certain and less predictable.
In September, the World Nuclear Association released its nuclear fuel report, which highlighted the fact that the demand cycle is on an upswing while the production cycle has swung down. The report outlined three scenarios for uranium demand and supply for the years 2019 through 2040. Demand was up in all three scenarios considered: the low case, the base case, and the high case. Under all three scenarios the report shows that the industry needs to at least double projected primary uranium production by 2040 to satisfy forecasted demand. To achieve this, the WNA report recognized that the market will require the appropriate signals to ensure current levels of production continue, the return of idled capacity, the completion of projects under development, the pursuit of brownfield expansion projects, and the development of currently planned and prospective greenfield projects. Finally, the report recognized that even when inventories are high, mobility can be low. For us, the report reinforced our belief that the uranium market needs to transition, similar to what has happened in the conversion market and is beginning to occur in the enrichment market.
However, until we see that transition occur, we will continue to take the necessary actions to maintain the strength of our balance sheet so we can self-manage risk, and that we expect will reward shareholders for their continued patience and support of our strategy to build long-term value.
| 6 | CAMECO CORPORATION |
Financial performance
| HIGHLIGHTS | ||||||||||||
DECEMBER 31 ($ MILLIONS EXCEPT WHERE INDICATED) | 2019 | 2018 | CHANGE | |||||||||
Revenue | 1,863 | 2,092 | (11 | )% | ||||||||
Gross profit | 242 | 296 | (18 | )% | ||||||||
Net earnings attributable to equity holders | 74 | 166 | (55 | )% | ||||||||
$ per common share (diluted) | 0.19 | 0.42 | (56 | )% | ||||||||
Adjusted net earnings(non-IFRS, see page 28) | 41 | 211 | (81 | )% | ||||||||
$ per common share (adjusted and diluted) | 0.10 | 0.53 | (81 | )% | ||||||||
Cash provided by operations (after working capital changes) | 527 | 668 | (21 | )% | ||||||||
Net earnings attributable to equity holders (net earnings) and adjusted net earnings were lower in 2019 compared to 2018,in-line with the outlook we provided. See 2019 consolidated financial results beginning on page 27 for more information. Key highlights:
| • | generated $527 million in cash from operations |
| • | retiredone-third, $500 million, of our outstanding debt |
| • | extended the maturity date of our revolving credit facility to November 2023, and reduced it by $250 million to $1 billion |
| • | Tax Court awarded $10.25 million in legal fees incurred, plus an amount for disbursements of up to $17.9 million in our dispute with CRA. Timing of any payments under the cost award is uncertain. |
| • | tribunal of international arbitrators ruled in favour of Cameco Inc. in its dispute with Tokyo Electric Power Company Holdings, Inc. (TEPCO), awarding damages of $40.3 million (US), which we received in the third quarter |
| • | received $92.6 million (US) from JV Inkai, representing repayment, in full, of its outstanding loan. In addition, received dividends of $10.6 million (US) in December 2019. |
Our segment updates
In our uranium segment, annual production wasin-line with expectations. Key highlights:
| • | continued the production suspension at McArthur River/Key Lake, removing 18 million pounds per year (100% basis) from the market |
| • | annual production of 9.0 millionpounds—in-line with the 2019 outlook provided |
| • | purchased 19.0 million pounds of uranium, including our spot purchases, committed purchase volumes, JV Inkai purchases and the purchase of NUKEM’s excess inventory |
| • | reached a new collective agreement with unionized employees at our McArthur River/Key Lake operation, which expires December 31, 2022 |
Production in 2019 from our fuel services segment was 27% higher than in 2018, as a result of an increase in UF6 production given the increase in demand in the market. We reached a new collective agreement with unionized employees at our Port Hope conversion facility, which expires July 1, 2022.
SeeOur operations and projectsbeginning on page 55 for more information.
| MANAGEMENT’S DISCUSSION AND ANALYSIS | 7 |
HIGHLIGHTS | 2019 | 2018 | CHANGE | |||||||||||||
Uranium | Production volume (million lbs) | 9.0 | 9.2 | (2 | )% | |||||||||||
| Sales volume (million lbs) | 31.5 | 35.1 | (10 | )% | ||||||||||||
| Average realized price | ($US/lb) | 33.77 | 37.01 | (9 | )% | |||||||||||
| ($Cdn/lb) | 44.85 | 47.96 | (6 | )% | ||||||||||||
| Revenue ($ millions) | 1,414 | 1,684 | (16 | )% | ||||||||||||
| Gross profit ($ millions) | 153 | 268 | (43 | )% | ||||||||||||
Fuel services | Production volume (million kgU) | 13.3 | 10.5 | 27 | % | |||||||||||
| Sales volume (million kgU) | 14.1 | 11.6 | 22 | % | ||||||||||||
| Average realized price | ($Cdn/kgU) | 26.21 | 26.78 | (2 | )% | |||||||||||
| Revenue ($ millions) | 370 | 313 | 18 | % | ||||||||||||
| Gross profit ($ millions) | 90 | 59 | 53 | % | ||||||||||||
Industry prices
| 2019 | 2018 | CHANGE | ||||||||||
Uranium($US/lb U3O8)1 | ||||||||||||
Average annual spot market price | 25.64 | 24.59 | 4 | % | ||||||||
Average annual long-term price | 31.75 | 30.38 | 5 | % | ||||||||
Fuel services ($US/kgU as UF6)1 | ||||||||||||
Average annual spot market price | ||||||||||||
North America | 18.27 | 9.98 | 83 | % | ||||||||
Europe | 18.12 | 10.32 | 76 | % | ||||||||
Average annual long-term price | ||||||||||||
North America | 16.73 | 14.33 | 17 | % | ||||||||
Europe | 16.63 | 14.44 | 15 | % | ||||||||
Note: the industry does not publish UO2prices.
| 1 | Average of prices reported by TradeTech and UxC, LLC (UxC) |
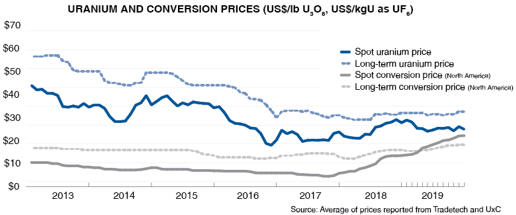
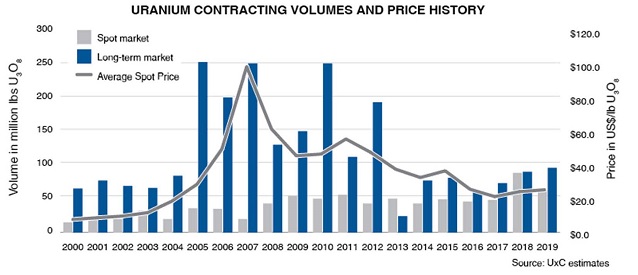
On the spot market, where purchases call for delivery within one year, the volume reported by UxC for 2019 was approximately 63.3 million pounds, compared to 88.7 million pounds in 2018. The majority of the activity in the spot market has been churn, the same material changing hands many times. There has been a lack ofend-user demand primarily caused by the delay of purchasing decisions. Uncertainty due to changing market dynamics, including ongoing market access and trade policy issues continued to keep some utilities on the sidelines. At the end of 2019, the average reported spot price was $24.93 (US) per pound, down $2.82 (US) per pound from the end of 2018. During the year, the uranium spot price ranged from a high of $28.90 (US) per pound to a low of $24.05 (US) per pound, averaging $25.64 (US) for the year.
Long-term contracts usually call for deliveries to begin more than two years after the contract is finalized, and use a number of pricing formulas, including fixed prices escalated over the term of the contract, and market referenced prices (spot and long-term indicators) quoted near the time of delivery. The volume of long-term contracting reported by UxC for 2019 was about 95.8 million pounds compared to about 91.5 million pounds in 2018. While higher than the same period last year, newly contracted volumes continued to be less than the quantities consumed. Uncertainty regarding the future of some reactor fleets and complacency due to low uranium prices continued to impact contracting volumes. The average reported long-term price at the end of the year was $32.50 (US) per pound, up $0.50 (US) from 2018.
With the uncertainty created by market access and trade policy issues facing the nuclear industry, we expect contracting in 2020 could remain largely discretionary.
Spot UF6 conversion prices increased to record levels in both the North American and European markets. For North American delivery, the average reported spot price at the end of 2019 was $22.13 (US) per kilogram uranium as UF6 (US/kgU as UF6), up $8.63 (US) from the end of 2018. Long-term UF6 conversion prices finished 2019 at $18.13 (US/kgU as UF6), up $2.13 (US) from the end of 2018.
| 8 | CAMECO CORPORATION |
SHARES AND STOCK OPTIONS OUTSTANDING
At February 5, 2020, we had:
| • | 395,797,732 common shares and one Class B share outstanding |
| • | 8,594,527 stock options outstanding, with exercise prices ranging from $11.32 to $26.81 |
DIVIDEND
In 2019, our board of directors declared a dividend of $0.08 per common share, which was paid December 13, 2019. The decision to declare an annual dividend by our board will be based on our cash flow, financial position, strategy and other relevant factors including appropriate alignment with the cyclical nature of our earnings.
| MANAGEMENT’S DISCUSSION AND ANALYSIS | 9 |
Market overview and developments
Growing confidence
Market access and trade policy issues were at the top of the list of factors affecting the market in 2019. These issues created uncertainty and consumed a significant amount of time and focus from our customers and contributed to the delay ofend-user demand in the spot market. Despite the significant demand created by the reduction in primary supply this year, at least half of the activity in the spot market has been churn, the same material changing hands many times. In contrast, interest in long-term contracting increased compared to 2018. While the volume of uranium executed under long-term contracts is still below annual consumption levels, it reached its highest level since 2012 and there continues to be significant interest. We believe that underlying this interest is the recognition that the demand cycle is on an upswing while the production cycle has swung down and the market needs to transition to one where price reflects an economic return on primary production. This gives us confidence that the uranium market will undergo the same transition we have seen in the conversion market and that is beginning to occur in the enrichment market.
Supply is not guaranteed
Economic realities and government-driven trade policies continue to have an impact on the security of supply in our industry. Not only does it not make sense to invest in future primary supply, even the lowest-cost producers are deciding to preserve long-term value by leaving uranium in the ground. Adding to security of supply concerns today is the role of commercial and state-owned entities in the uranium market, and the disconnect between where uranium is produced and where it is consumed. Nearly 80% of primary production is in the hands of state-owned enterprises, after taking into account the cuts to primary production that have occurred over the last several years. Furthermore, almost 90% of primary production comes from countries that consumelittle-to-no uranium, and 90% of uranium consumption occurs in countries that havelittle-to-no primary production. As a result, government-driven trade policies can be particularly disruptive for the uranium market. Some of the more significant supply developments are:
| • | In the US, which has the largest fleet of nuclear reactors in the world, the US Nuclear Fuel Working Group (NFWG) was established to further analyze the state of nuclear fuel production in the US. This action followed the determination by the President of the United States under Section 232 of the Trade Expansion Act that imports of foreign uranium do not constitute a national security threat, and that new restrictions on imports were not required. The NFWG has submitted its report to the President, however, the details of the report have not been made public and the President has not made any determinations. |
| • | The concern regarding expanded sanctions on Iran that could extend to countries providing nuclear fuel products and services to Iran (i.e. Russia, China, and some European nations), and therefore disrupt Russian nuclear fuel imports into the US. Compounding this concern is the continued uncertainty regarding Russian sanctions and whether existing quotas on imports of Russian uranium into the US, under the Russian Suspension Agreement, will be extended or amended prior to its expiry in 2020. |
| • | Trade tensions with China continue. On August 14, 2019, the US issued sanctions that involved China General Nuclear Power Group and three of its subsidiaries, effectively banning US companies from supplying these groups with specific nuclear-related commercial ordual-use goods. This has not impacted uranium sales. |
| • | Kazatomprom (KAP) announced that, given current market conditions, it intends to extend its current production limits (20% reduction from planned production volumes) across all its production assets through 2021. Combined with reductions from prior years, KAP indicated its cutbacks are equivalent to stopping all production in Kazakhstan for about one year. They have also indicated that a return to full production will not occur until there is a sustained market recovery. In addition, during the third quarter KAP offered a secondary placement of its shares, increasing its publicly-traded share capital from 15% to 18.8%. |
| • | Energy Resources of Australia Ltd. reconfirmed that it is required to discontinue mining and processing activities at the Ranger uranium mine in the Northern Territory of Australia by January 2021. |
| • | The board of directors of Orano’s Cominak mine announced that the mine will shut down in March 2021 due to depletion of reserves. |
| 10 | CAMECO CORPORATION |
Demand has recovered and is growing
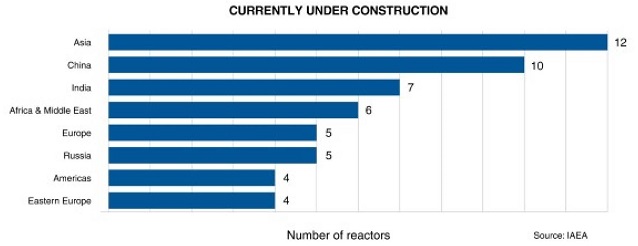
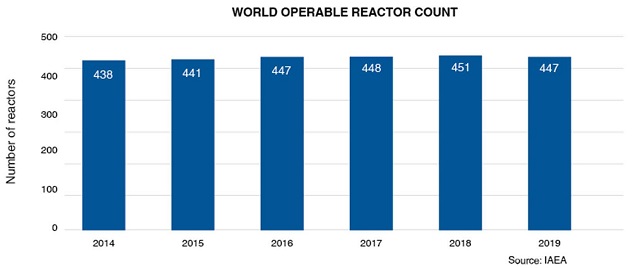
The demand gap left by forced and premature nuclear reactor shut-downs since March of 2011 has been filled. According to the International Atomic Energy Agency (IAEA) five new reactors began commercial operation in 2019, and 53 reactors are under construction. With a number of reactor construction projects recently approved, and many more planned, the demand for uranium is growing. This growth is largely occurring in Asia and the Middle East. Some of this growth is tempered by early reactor retirements, plans for reduced reliance on nuclear, orphase-out policies in other regions. However, there is growing recognition of the role nuclear power must play in providing safe, reliable, affordable carbon-free baseload electricity and achieving alow-carbon future. Some of the more significant demand developments are:
| • | The World Nuclear Association’s 2019 Nuclear Fuel Report shows demand is forecast to be higher in all scenarios examined over the period 2019 through 2040. In addition, the report shows that under all demand scenarios, the industry needs to at least double projected primary uranium production by 2040, which will require the appropriate market signals to ensure current levels of production continue, the return of idled production capacity, completion of projects under development, and development of currently planned and prospective projects. |
| • | In its latest uranium market outlook report, UxC increased its annual demand outlook by 8 million pounds per year and moved its assumed structural deficit from 2026 to 2022. |
| • | In May 2019, the International Energy Agency released its first nuclear report in 20 years, “Nuclear Power in a Clean Energy System”. The report highlights that a steep decline in nuclear power would threaten energy security and climate change goals and result in billions of tonnes of additional carbon emissions by 2040. |
| • | In October 2019, the IAEA held its first ever conference recognizing the critical role for nuclear power in combating climate change, “International Conference on Climate Change and the Role of Nuclear Power”. The IAEA advocates that it will be difficult to achieve the goal of reducing greenhouse gas emissions without a significant increase in nuclear power. |
| • | In November 2019, the European Parliament adopted a resolution recognizing the role of nuclear energy in achieving its 2050 climate plan calling for net zero emissions. |
| • | This year, China National Nuclear Company received the first new construction approval in China in about three years for units 1 and 2 at Zhangzhou, and construction began at unit 1 in October 2019. |
| • | NextEra Energy’s Turkey Point 3 and 4 in Florida received the first ever subsequent license renewal, allowing them to operate for 80 years. |
| • | Duke Energy announced it is seeking to renew the operating licences to 80 years for the 11 reactors it operates in North and South Carolina to support carbon reduction plans. Tennessee Valley Authority also announced plans to extend the licences for its six reactors in Tennessee and Alabama to 80 years. |
| • | Three Mile Island nuclear power plant was retired from service by Exelon after 45 years of operation in Pennsylvania. |
| • | In Ohio, a bill was passed providing funding to support the ongoing operation of the Perry and Davis-Besse nuclear power plants, similar to incentives enacted by other states including Illinois, New Jersey, New York, Connecticut, and pending legislation in Pennsylvania. |
| • | There were reports that Kyushu Electric Power Co. and other utilities in Japan expect to temporarily close their currently operating units over the coming years to complete the implementation of the antiterrorism measures required by the nuclear regulators. Some of these units are expected to shut down starting in 2020 before returning to service within a year. |
| • | Brazil announced the possible construction of six more nuclear reactors by 2050, in addition to completion of Angra unit 3, which is currently under construction. Brazil also plans to restart domestic uranium mining in 2019 for the first time in five years, and is open to private sector investment. |
| MANAGEMENT’S DISCUSSION AND ANALYSIS | 11 |
OPPORTUNITIES FOR THOSE WHO CAN WAIT
UxC reports that over the last five years only 396 million pounds have beenlocked-up in the long-term market, while over 831 million pounds have been consumed in reactors. We remain confident that utilities have a growing gap to fill.
Like other commodities, the uranium industry is cyclical. History demonstrates that in general, when prices are rising and high, uranium is perceived as scarce, and a lot of contracting activity takes place. The heavy contracting that takes place during price runs, drives investment in higher-cost sources of production. Once that production is in the market, it tends to stay in the market longer than is economically rational, creating the perception that uranium is abundant and always will be, and prices decline. When prices are declining and low, like we have seen over the past eight years, there is no perceived urgency to contract, and contracting activity and investment in new supply drops off. After years of low investment in supply, as has been the case since 2011, security of supply tends to overtake price concerns at some point, and utilitiesre-enter the long-term market to ensure they have the reliable supply of uranium they need to run their reactors.
| 12 | CAMECO CORPORATION |
We believe the current backlog of long-term contracting presents a substantial opportunity for commercially motivated suppliers like us that can weather thelow-price part of the cycle. As alow-cost producer, we manage our operations with these price cycles in mind.

In our industry, customers do not come to the market right before they need to load uranium into their reactors. To operate a reactor that could run for more than 60 years, natural uranium and the downstream services have to be purchased years in advance, allowing time for a number of processing steps before it arrives at the power plant as a finished fuel bundle. At present, we believe there is a significant amount of uranium that needs to be contracted to keep reactors running into the next decade.
UxC estimates that cumulative uncovered requirements are about 1.5 billion pounds to the end of 2035. The longer the recovery of the long-term market is delayed, the less certainty there will be about the availability of future supply to fill growing demand. In fact, recent data from the US Energy Information Administration shows that utility inventories are starting to decline and are approaching levels that could put security of supply at risk. Ultimately, we expect the current market uncertainty to give way to increasing concerns about the security of future supply.
As utilities’ uncovered requirements grow, annual supply declines, demand for uranium from producers and financial players increases, and with trade policy potentially restricting access to some markets, we believe the pounds available in the spot market will not be adequate to satisfy the growing backlog of long-term demand. As a result, we expect there will be increased competition to secure uranium under long-term contracts on terms that will ensure the availability of reliable primary supply to meet growing demand.
| MANAGEMENT’S DISCUSSION AND ANALYSIS | 13 |
Global population is on the rise, and with the world’s need for safe, clean, reliable baseload energy, nuclear remains an important part of the energy mix. We remain confident in the future of the nuclear industry. With demand coming on in the form of restarts and new reactors, and supply becoming less certain as a result of low prices, production curtailments, lack of investment, and market access and trade policy issues, we’re continuing to expect a market transition. While the timing of a market transition remains uncertain, we will continue to take the actions we believe are necessary to position the company for long-term success. Therefore, we will undertake contracting activity which aligns with the uncertain timing of a market recovery and is intended to ensure we have adequate protection and will benefit from higher prices under our contract portfolio, while maintaining exposure to the rewards that come from having uncommitted,low-cost supply to deliver into a strengthening market.
| 14 | CAMECO CORPORATION |
Our strategy
Our strategy is set within the context of a challenging market environment, which we expect to give way to strong long-term fundamentals driven by increasing populations, and the impact of growing electricity demand on the world’s climate. Nuclear energy must be a central part of the solution to the world’s shift to alow-carbon, climate resilient economy. It is an option that can provide the power needed, not only reliably, but also safely and affordably, and in a way that will help avoid some of the worst consequences of climate change.
Tier-one focus
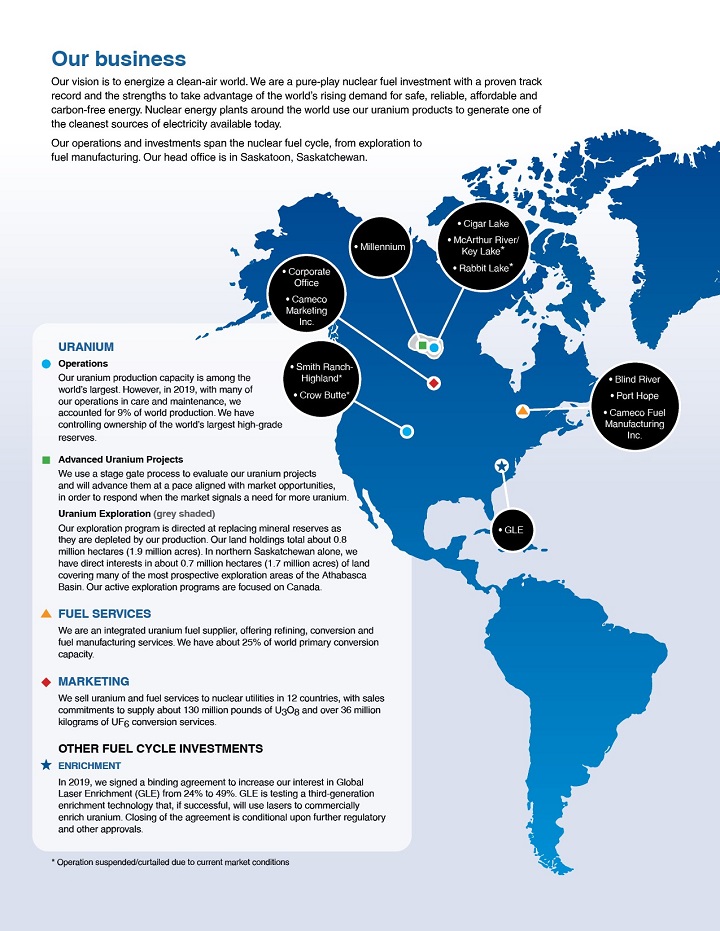
We are a pure-play nuclear fuel investment, focused on providing a clean source of energy, and taking advantage of the long-term growth we see coming in our industry. Our strategy is to focus on ourtier-one assets and profitably produce at a pace aligned with market signals in order to preserve the value of those assets and increase long-term shareholder value, and to do that with an emphasis on safety, people and the environment.
URANIUM
Uranium production is central to our strategy, as it is the biggest value driver of the nuclear fuel cycle and our business. In accordance with market conditions, and to mitigate risk, we will evaluate the optimal mix of our production, inventory and purchases in order to satisfy our contractual commitments and in order to return the best value possible. We will not produce from ourtier-one assets to sell into an oversupplied spot market. During a prolonged period of uncertainty, this could mean leaving our uranium in the ground. As conditions improve, we expect to meet rising demand with production from our best margin operations.
In light of today’s lingering uncertainty as to how long the weak market conditions will persist, we are focused on preserving the value of our lowest cost assets, on maintaining a strong balance sheet, on protecting and extending the value of our contract portfolio and on efficiently managing the company in a low price environment. We have undertaken a number of deliberate and disciplined actions. In 2019, these actions resulted in:
| • | generation of $527 million in cash from operations |
| • | retirement ofone-third, $500 million, of our outstanding debt |
| • | ayear-end balance of $1.1 billion in cash on our balance sheet |
Consistent with our actions, our McArthur River/Key Lake operation remains on care and maintenance for an indeterminate duration, removing 18 million pounds of uranium annually from the market. Some of our actions have a cost in the short term, and we must weigh these costs against the value we expect they will generate over the long term. Accordingly, we will adjust our actions based on market signals with the intent of being able to self-manage risk, and to ensure ourtier-one assets are available to us in a market that values them appropriately.
FUEL SERVICES
Our fuel services division is a source of profit and supports our uranium segment while allowing us to vertically integrate across the fuel cycle.
The UF6 conversion market has gone through a transition that has seen the industry average North American spot price increase by more than 280% and the industry average North American term price increase by almost 40% since the end of 2017. In this environment, with our Port Hope facility the only UF6 plant currently operating in North America, we are focused on securing new long-term contracts that reflect today’s prices and that will allow us to continue to consistently support the long-term needs of our customers.
In addition, we are pursuingnon-traditional markets for our UO2 and fuel fabrication business and have been actively securing new contracts for reactor components to support refurbishment of Canadian reactors.
Our focus will continue to be on maintaining and optimizing the profitability of this segment of our business.
OTHER FUEL CYCLE INVESTMENTS
We continue to explore other opportunities within the nuclear fuel cycle. In particular, we are interested in the second largest value driver of the fuel cycle, enrichment. Having operational control of uranium production, conversion, and enrichment facilities would offer operational synergies that could enhance profit margins.
| MANAGEMENT’S DISCUSSION AND ANALYSIS | 15 |
In 2019, we signed a binding agreement to increase our interest in Global Laser Enrichment (GLE) from 24% to 49%. GLE is testing a third-generation enrichment technology that, if successful, will use lasers to commercially enrich uranium. Closing of the agreement is conditional upon receipt of US regulatory approval and GLE’s contract with the US Department of Energy (DOE) regarding DOE’s inventory of depleted tails remaining in full force and effect.
Capital allocation – focus on value
Delivering returns to our long-term shareholders is a top priority. We continually evaluate our investment options to ensure we allocate our capital in a way that we believe will:
| • | create the greatest long-term value for our shareholders |
| • | allow us to navigate by our investment-grade rating and mitigate risk |
| • | allow us to execute on our dividend while ensuring it is appropriately aligned with the cyclical nature of our earnings |
To deliver value, free cash flow must be productively reinvested in the business or returned to shareholders, which requires good execution and disciplined allocation. Our decisions are based on the run rate of our business, notone-time events. Cash on our balance sheet that exceeds value-adding growth opportunities and/or is not needed to self-manage risk should be returned to shareholders.
We have a multidisciplinary capital allocation team that evaluates all possible uses of investable capital.
We start by determining how much cash we have to invest (investable capital), which is based on our expected cash flow from operations minus expenses we consider to be a higher priority, such as dividends and financing costs, and could include others. This investable capital can be reinvested in the company or returned to shareholders.
Our capital allocation decisions will continue to pivot on what the market is providing. With the continued market uncertainty we are facing, and our ongoing dispute with CRA, the objective of our capital allocation is to maximize cash flow, while navigating by our investment-grade rating through close management of our balance sheet metrics.
With the metrics that inform an investment-grade rating in mind, and in this period of low uranium prices, we have taken steps to improve margin and cash flow by:
| • | responsibly managing our sources of supply thereby preserving the value of ourtier-one assets |
| • | restructuring our activities to reduce our operating, capital, and general and administrative spending |
| • | reducing our annual dividend from $0.40 per share to $0.08 per share in 2018 |
| • | implementing an initiative intended to provide a greater focus on technology and its applications to improve efficiency and reduce costs across the organization, with a particular focus on innovation and accelerating the adoption of advanced digital and automation technologies |
As a result, we are well positioned to self-manage risk.
REINVESTMENT
If a decision is made to reinvest capital in sustaining, capacity replacement, or growth, all opportunities are ranked and only those that meet the required risk-adjusted return criteria are considered for investment. We also must identify, at the corporate level, the expected impact on cash flow, earnings, and the balance sheet. All project risks must be identified, including the risks of not investing. Allocation of capital only occurs once an investment has cleared these hurdles.
This may result in some opportunities being held back in favour of higher return investments, and should allow us to generate the best return on investment decisions when faced with multiple prospects, while also controlling our costs. If there are not enough good investment prospects internally or externally, this may result in residual investable capital, which we would then consider returning directly to shareholders.
| 16 | CAMECO CORPORATION |
We have not yet seen the market transition needed to restart our idled production capacity. Therefore, until we see that transition, our capital expenditures for 2020 through 2022 will be focused primarily on sustaining and capacity replacement capital, and demonstrating our continued commitment to a clean environment through ongoing investment in the Vision in Motion project in Port Hope. In addition, we will focus on improving operational effectiveness across our operations, including the use of digital and automation technologies with a particular goal of substantially reducing operating costs and increasing operational flexibility when it comes time to restart the McArthur River/Key Lake operation. Any opportunities will be rigorously assessed before an investment decision is made. If we get clarity on our CRA dispute prior to a market transition, which generates aone-time cash infusion, we will focus on the debt portion of our ratings metrics. This may mean an even greater emphasis on reducing the debt on our balance sheet. However, if the market does begin to transition and higher uranium prices are beginning to flow through our contract portfolio, and we are able to increase our portfolio of acceptable long-term contracts, the earnings portion of our rating metrics are expected to improve. In that scenario, reducing debt would not be the priority. Our priority would be to invest in restarting our idledtier-one assets, and if warranted, turn to value-adding growth opportunities.
RETURN
We believe in returning cash to shareholders, but are also focused on protecting the company and rewarding those shareholders who understand and support our strategy to build long-term value. If we have excess cash and determine the best use is to return it to shareholders, we can do that through a share repurchase or dividend—an annual dividend,one-time supplemental dividend or a progressive dividend. When deciding between these options, we consider a number of factors, including the nature of the excess cash (one time or cash generated by our business operations), growth prospects for the company, and growth prospects for the industry.
Share buyback: If we were generating excess cash while there were few or no growth prospects for the company or the industry, then a share buyback might make sense. However, our current view is that the long-term fundamentals for Cameco and the industry remain strong.
Dividend: The amount and type of dividend paid, annual, progressive orone-time supplemental is evaluated by our board of directors with careful consideration of our cash flow, financial position, strategy, and other relevant factors including appropriate alignment with the cyclical nature of our earnings.
Marketing framework – balanced contract portfolio
As with our corporate strategy and approach to capital allocation, the purpose of our marketing framework is to deliver value. Our approach is to secure a solid base of earnings and cash flow by maintaining a balanced contract portfolio that optimizes our realized price.
We evaluate our strategy in the context of our market environment and continue to adjust our actions in accordance with our marketing framework:
| • | First, we will not produce from ourtier-one assets to sell into an oversupplied spot market. We will not produce from these assets unless we can deliver ourtier-one pounds under long-term contracts that provide an acceptable rate of return on these assets for our owners. |
| • | Second, we do not intend to build up an inventory of excess uranium. Excess inventory serves to contribute to the sense that uranium is abundant and creates an overhang on the market, and it ties up working capital on our balance sheet. |
| • | Third, in addition to our committed sales, we will capture demand in the market where we think we can obtain value. We will take advantage of opportunities the market provides, where it makes sense from an economic, logistical and strategic point of view. Those opportunities may come in the form of spot,mid-term or long-term demand, and will be additive to our current committed sales. |
| • | Fourth, once we capture demand, we will decide how to best source material to satisfy that demand. Depending on the timing and volume of our production, purchase commitments, and our inventory volumes, this means we will be active buyers in the market in order to meet our demand obligations. |
| • | And finally, in general, if we choose to source material to meet demand by purchasing it, we expect the price of that material will be more than offset by the leverage to market prices in our sales portfolio over a rolling12-month period. |
In addition to this framework, our contracting decisions always factor in who the customer is, our desire for regional diversification, the product form, and logistical factors.
| MANAGEMENT’S DISCUSSION AND ANALYSIS | 17 |
Ultimately, our goal is to protect and extend the value of our contract portfolio on terms that recognize the value of our assets and provide adequate protection when prices go down and allow us to benefit when prices rise. We believe using this framework will allow us to create long-term value for our shareholders. Our focus will continue to be on maximizing cash flow, so we can execute on our strategy and self-manage risk.
LONG-TERM CONTRACTING
Uranium is not traded in meaningful quantities on a commodity exchange. Utilities have historically bought the majority of their uranium and fuel services products under long-term contracts with suppliers, and have met the rest of their needs on the spot market. We sell uranium and fuel services directly to nuclear utilities around the world as uranium concentrates, UO2 and UF6, conversion services, or fuel fabrication. We have a solid portfolio of long-term sales contracts that reflect the long-term, trusting relationships we have with our customers.
In general, we are always active in the market, buying and selling uranium when it is beneficial for us and in support of our long-term contract portfolio. We undertake activity in the spot and term markets prudently, looking at the prices and other business factors to decide whether it is appropriate to purchase or sell into the spot or term market. Not only is this activity a source of profit, it gives us insight into underlying market fundamentals.
We deliver large volumes of uranium every year, therefore our net earnings and operating cash flows are affected by changes in the uranium price. Market prices are influenced by the fundamentals of supply and demand, market access and trade policy issues, geopolitical events, disruptions in planned supply and demand, and other market factors.
The objectives of our contracting strategy are to:
| • | maximize realized price while reducing volatility of our future earnings and cash flow |
| • | focus on meeting the nuclear industry’s growing annual uncovered requirements with our future uncommitted supply while ensuring adequate regional diversity |
| • | establish and grow market share with strategic customers |
We target a ratio of 40% fixed-pricing and 60% market-related pricing in our portfolio of long-term contracts, including mechanisms to protect us when the market price is declining and allow us to benefit when market prices go up. This is a balanced and flexible approach that allows us to adapt to market conditions and put a floor on our average realized price, and deliver the best value to shareholders over the long term.
This approach has allowed us to realize prices higher than the market prices during periods of weak uranium demand, and we expect it will enable us to realize increases linked to higher market prices in the future.
Fixed-price contracts for uranium: are typically based on a term-price indicator at the time the contract is accepted and escalated over the term of the contract.
Market-related contracts for uranium: are different from fixed-price contracts in that they may be based on either the spot price or the long-term price, and that price is as quoted at the time of delivery rather than at the time the contract is accepted. These contracts sometimes provide for discounts, and often include floor prices and/or ceiling prices, which are usually escalated over the term of the contract.
Fuel services contracts: the majority of our fuel services contracts are at a fixed price per kgU, escalated over the term of the contract, and reflect the market at the time the contract is accepted.
OPTIMIZING THE CONTRACT PORTFOLIO
We work with our customers to optimize the value of our existing contract portfolio. In cases where a customer is seeking relief due to a challenging policy, operating, or economic environment, we evaluate their specific circumstances and assess their long-term sustainability. Where we deem the customer’s long-term demand to be at risk, we may consider options that allow us to benefit from converting that uncertain future value into certain present value. In contrast, where the customer is considered to have a more certain and predictable future, we may offer relief. For example, in a low price environment, we may blend in more market-related volumes in the near term, but only where the customer is willing to extend the terms and conditions of that contract out into the future, and only where it is beneficial to us.
| 18 | CAMECO CORPORATION |
CONTRACT PORTFOLIO STATUS
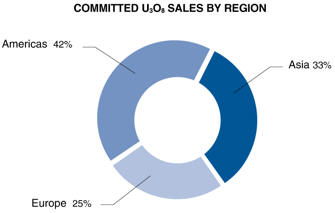
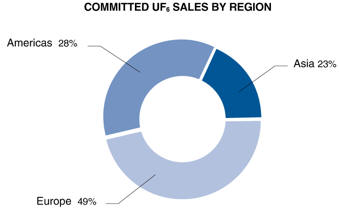
We have commitments to sell over 130 million pounds of U3O8 with 31 customers worldwide in our uranium segment, and over 36 million kilograms as UF6 conversion with 28 customers worldwide in our fuel services segment. The annual average sales commitments over the next five years in our uranium segment is around 19 million pounds, with commitment levels in 2020 and 2021 higher than in 2022 through 2024.
Customers – U3O8:
Five largest customers account for 60% of commitments
Customers – UF6 conversion:
Five largest customers account for 60% of commitments
MANAGING OUR CONTRACT COMMITMENTS
To meet our delivery commitments, we use our uranium supply, which includes uranium obtained from:
| • | our existing production |
| • | purchases under our JV Inkai agreement, from NUKEM, under long-term agreements and in the spot market |
| • | our existing inventory |
We allow sales volumes to varyyear-to-year depending on:
| • | the level of sales commitments in our long-term contract portfolio |
| • | our production volumes |
| • | purchases under existing and/or new arrangements |
| • | discretionary use of inventories |
| • | market opportunities |
| MANAGEMENT’S DISCUSSION AND ANALYSIS | 19 |
Managing our costs
PRODUCTION COSTS
In order to operate efficiently and cost-effectively, we manage operating costs and improve plant reliability by prudently investing in production infrastructure, new technology, and business process improvements. Like all mining companies, our uranium segment is affected by the cost of inputs such as labour and fuel.
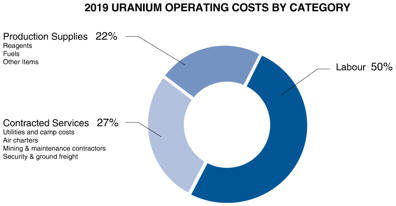
Given the current market dynamics, in 2020, our only operating property will be Cigar Lake. Our McArthur River/Key Lake, Rabbit Lake, and US operations are currently on care and maintenance. While we have these operations on standby, our annual cash production costs will reflect the operating cost of mining and milling our share of Cigar Lake mineral reserves, which is estimated to be between $15 and $16 per pound over the entirelife-of-mine.
Operating costs in our fuel services segment are mainly fixed. In 2019, labour accounted for about 44% of the total. The largest variable operating cost is for zirconium, followed by anhydrous hydrogen fluoride, and energy (natural gas and electricity).
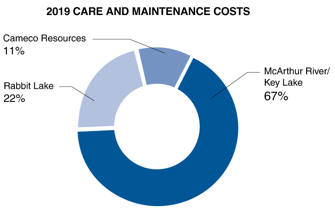
CARE AND MAINTENANCE COSTS
In 2020, we expect to incur between $150 million and $170 million in care and maintenance costs related to the suspension of production at our McArthur River/Key Lake mine and mill, Rabbit Lake mine and mill, and US operations. The largest proportion of these costs will be incurred at McArthur River/Key Lake.
Our expected care and maintenance costs have increased compared to 2019 due to planned expenditures that will allow us to fully assess our operating processes at McArthur River/Key Lake. Consistent with ourtier-one strategy, we expect that production at McArthur River/Key Lake will be the first of our operations to restart once we see the appropriate market signals. Therefore, we are focused on improving operational effectiveness, including the use of digital and automation technologies with a particular goal of substantially reducing operating costs and increasing operational flexibility when it comes time to restart these operations. As a result, care and maintenance costs are expected to be higher compared to Rabbit Lake and in the US. Our Rabbit Lake and US operations are higher-cost, and with plenty of idletier-one capacity andtier-one expansion capacity globally that can come back on line relatively quickly, the restart horizon is less certain.
While Rabbit Lake and our US operations are in standby, we will continue to evaluate our options in order to minimize costs.
| 20 | CAMECO CORPORATION |
PURCHASES AND INVENTORY COSTS
Our costs are also affected by the purchases of uranium and conversion services we make under long-term contracts and on the spot market.
To meet our delivery commitments, we make use of our mined production, inventories, purchases under long-term contracts, and purchases we make on the spot market. In 2020, the price for the majority of our purchases will be quoted at the time of delivery.
The cost of purchased material may be higher or lower than our other sources of supply, depending on market conditions. The cost of purchased material affects our cost of sales, which is determined by calculating the average of all of our sources of supply, including opening inventory, production, and purchases, and adding royalties, selling costs, and care and maintenance costs. If market prices exceed our cost of produced material including royalties, we expect the cost of sales to increase accordingly.
FINANCIAL IMPACT
As greater certainty returns to the uranium market, our view is that the market needs to transition to one where uranium prices reflect the cost of bringing on new primary production to meet growing demand.
We have taken a number of deliberate and disciplined actions to reduce supply and streamline operations. Some of these actions come with a cost in the near term, like care and maintenance costs, but we expect the benefit over the long term will far outweigh those costs.
We believe our actions will help shield the company from the nearer term risks we face and will reward shareholders for their continued patience and support of our strategy to build long-term value.
Committed to our values
Our values are at the core of everything we do and define who we are as a company.
SAFETY AND ENVIRONMENT
The safety of people and protection of the environment are the foundations of everything we do, locally and globally.
PEOPLE
We value the contribution of every employee and demonstrate respect for individual dignity, creativity and cultural diversity.
INTEGRITY
We lead by example, earn trust, honour our commitments and conduct our business ethically.
EXCELLENCE
Through leadership, collaboration and innovation, we strive to achieve our full potential and inspire others to reach theirs.
| MANAGEMENT’S DISCUSSION AND ANALYSIS | 21 |
Our approach to ESG matters
Our uranium is used around the world in the generation of safe, carbon-free, affordable, base-load nuclear energy. As we seek to bring the benefits of carbon-free nuclear energy to the world, we will do so in a manner that reflects our values. We are committed to identifying and addressing the environmental, social and governance (ESG) risks and opportunities that we believe may have a significant impact on our ability to add long-term value for our stakeholders.
SUSTAINABILITY: A KEY PART OF OUR STRATEGY, REFLECTING OUR VALUES
We view sustainability as an integrated approach to conducting business. We integrate sustainability principles and practices into all stages of our activities, from exploration to decommissioning, including factoring them into our objectives and approach to compensation, our overall corporate strategy, and ourday-to-day operations. We adopt established and recognized management system frameworks to guide our integrated approach, which is embedded within ethical business practices and our robust and transparent governance framework. We seek to be transparent with our stakeholders, keeping them updated on the risks and opportunities that we believe may have a significant impact on our ability to add long-term value.
We have a sustainability policy that describes our commitments in this regard. We encourage you to review our sustainability policy atcameco.com/about/governance/policies-programs.
Safety and the Environment
We employ an integrated Safety, Health, Environment and Quality (SHEQ) management system that applies to all phases and aspects of our business. The system is governed by one integrated SHEQ policy that recognizes that the safety and health of our workers and the public, protection of the environment, and quality of our processes are the highest priority during all stages of our activities. The policy is supported by multiple corporate SHEQ management programs. We maintain ISO 14001 certification at a corporate level. We encourage you to review our SHEQ policy atcameco.com/about/governance/policies-programs.
Climate change: Nuclear power is part of the solution
There is growing recognition that uranium is the cleanest energy fuel in the world and of the role nuclear power must play in ensuring safe, reliable and affordable carbon-free electricity generation from key global agencies, such as the United Nations Economic Commission for Europe, the United Nations Intergovernmental Panel on Climate Change, and the Union of Concerned Scientists. Indeed, for the first time in nearly two decades, the International Energy Agency released a report on nuclear energy in the hopes of bringing it back into the global energy debate. The report highlighted that a steep decline in nuclear power would threaten energy security and climate change goals and result in four billion tonnes of additional carbon emissions by 2040.
The nuclear industry recognizes the scale and immediacy of the challenge outlined in the Paris Agreement, and the important role that alllow-carbon and carbon-free energy sources have to play. Led by the World Nuclear Association, the nuclear industry has a program and vision for the future of electricity supply called “Harmony”. The Harmony program sets a target for nuclear power to provide 25% of electricity by 2050 to help avoid the worst consequences of climate change. As members of the World Nuclear Association, and through participation in other industry organizations we fully support and are advocates of this initiative.
We believe that the reduction of carbon and greenhouse gas (GHG) emissions is important and necessary in Canada and around the world, and that nuclear power must be a central part of the solution to the world’s shift to alow-carbon, climate resilient economy. As one of the world’s largest producers of the uranium fuel needed to fuel nuclear reactors, we believe there is a significant opportunity for us to be part of the solution to combating climate change and that we are well positioned to deliver significant long-term business value, while actively working to reduce our emission profile.
We are proud that our the high-grade uranium ores in Saskatchewan’s Athabasca Basin result in our Canadian uranium having among the lowest life cycle greenhouse gas emission intensity internationally, despite the constraints related to our geographic location. In fact, the production of Saskatchewan uranium requires at least one hundred times less greenhouse gas (GHG) emissions than production of the cleanest Canadian natural gas to produce the same amount of electricity and, all of the nuclear power produced is GHG emission free. We have tracked and reported GHG emissions for more than two decades, despite any regulatory requirement to do so. We continue to be focused on improving energy management and the visibility of energy consumption within our organization, with the overall goal of improving the energy intensity of our operations to create business value.
| 22 | CAMECO CORPORATION |
Stakeholder relations
Gaining the support of all our stakeholders is necessary to sustain our business.
We have a people policy that describes our commitment to developing and supporting a flexible, skilled, stable and diverse workforce. The policy is supported by multiple corporate human resource programs, standards and practices. We encourage you to review this policy atcameco.com/about/governance/policies-programs.
In addition, we strive to earn the support of the communities in which we operate, which is one of our key measures of success. We identify opportunities and initiatives that support and respect these communities and their cultures.
We recognize the substantial value in developing and maintaining long-term mutually beneficial relationships with Indigenous communities located within or near our operations and other activities.
Over more than 30 years of operation and partnership in northern Saskatchewan, we have developed a comprehensive strategy that applies to all our operations globally, and is aimed at ensuring the support of the communities with whom we work. The global strategy is flexible and is implemented locally to reflect the needs of the communities. The bulk of the strategy has evolved as a result of the commercial benefits we see from ensuring strong support among local communities wherever we operate and focuses on five key areas:
| • | Workforce development: designed to deliver programming that aims to build educational and skills capacity in local communities. |
| • | Business development: designed to promote involvement of locally-owned businesses in contracting opportunities at our operations, to provide additional jobs, revenue streams and capacity building at the local community level. |
| • | Community engagement: designed with the objective to ensure that we secure support for our operations from local communities and satisfy the obligations placed on us by regulators and laws. |
| • | Community investment: designed to help local communities with much-needed funding for community programming and infrastructure for initiatives focused on youth, education and literacy, health and wellness, and community development. |
| • | Environmental stewardship: designed to support our overall environmental programming and give communities a voice in both the formal environmental assessment regulatory process, as well as ongoing monitoring activities. |
We set standards for the measures that we will conform to in maintaining ongoing and meaningful engagement within the communities where we operate.
HOW WE ARE DOING
We produce a sustainability report for our stakeholders to tell them how we are performing against globally recognized key indicators that measure our environmental, social, governance and financial impacts in the areas that we believe may have a significant impact on our ability to add long-term value for our stakeholders. We use the Global Reporting Initiative’s Sustainability Framework (GRI), in addition to some corporate indicators that are unique to the company to measure and report our performance. This is our report card to our stakeholders. For our most recent performance results, we encourage you to review our sustainability report atcameco.com/about/sustainability.
Given the evolving nature of the ESG landscape, we have established a multi-disciplinary working group to review of our current approach in this area, including how we report. The working group is chaired by our Senior Vice-President and Chief Corporate Officer and will report to the relevant committees of the board.
GOVERNANCE: SOUND GOVERNANCE IS THE FOUNDATION FOR STRONG PERFORMANCE
We believe that sound governance is the foundation for strong corporate performance. Our board of directors is responsible for overseeing management, and our strategy and business affairs and the integration of ESG principles throughout the company. The board’s goal is to ensure we operate as a successful business, optimizing financial returns while effectively managing risk.
The board has formal governance guidelines that set out our approach to governance and the board’s governance role and practices. The guidelines ensure we comply with all of the governance rules and legislation in Canada and the United States that are applicable, conduct ourselves in the best interests of our stakeholders, and meet industry best practices. The guidelines are reviewed and updated regularly.
| MANAGEMENT’S DISCUSSION AND ANALYSIS | 23 |
Risk and Risk Management
We have a mature enterprise risk management (ERM) framework that consists of processes and controls to ensure risks are being appropriately managed and mitigated.
Decisions to accept, mitigate, or transfer identified risks guide management’s plans in our strategic planning and budgeting process. Employees throughout the company take ownership of the risks specific to their area, and are responsible for developing and implementing the controls to manage andre-assess risk, including ESG risks.
Our risk policy sets out a broad, systematic approach to identifying, assessing, reporting and managing the significant risks, including ESG risks, we face in our business and operations. The policy is reviewed annually to ensure that it continues to meet our needs.
SeeManaging the risks, starting on page 56, for a discussion of the risks, including ESG risks, that generally apply to all of our operations and advanced uranium projects, and that could have a material impact on business in the near term. We also recommend you review our most recent annual information form, which includes a discussion of other material risks that could have an impact on our business.
The board is responsible for overseeing management’s implementation of appropriate risk management processes and controls. Time is dedicated at board and committee meetings to risk identification, management, and reporting. In consultation with the board, management works on enhancing its enterprise risk oversight practices, processes and controls. While the board oversees the company’s strategic risks, including ESG/climate-related risks, it also allocates oversight of othertop-tier risks to specific board committees. Set out below is an overview of the responsibilities allocated to specific board committees.
Audit and finance– supports the board in fulfilling its oversight responsibilities regarding the integrity of our accounting and financial reporting, the adequacy and effectiveness of our internal controls and disclosure controls, legal, regulatory (excluding safety, health and the environment) and ethical compliance, the independence and performance of our external and internal auditors, oversight of specific material risks, and prevention and detection of fraudulent activities and financial oversight.
Human resources – supports the board in fulfilling its oversight responsibilities regarding human resource policies, employee and labour relations matters, executive compensation, executive succession and development, pension plan governance, and oversight of material risks assigned to the committee.
Nominating, corporate governance and risk – supports the board in fulfilling its oversight responsibilities by developing and recommending a set of corporate governance principles, identifying and recommending qualified individuals as members of the board and its committees, assessing the effectiveness of the board and committees, and overseeing the risk program.
Reserves oversight - supports the board in fulfilling its oversight responsibilities regarding estimating and disclosing mineral reserves and resources.
Safety, health and environment – supports the board in fulfilling its oversight responsibilities regarding safety, health, environmental and climate-related matters, and supportive communities.
In addition, the safety, health and environment committee and the nominating, corporate governance and risk committees assist the board in fulfilling its oversight responsibility with respect to ESG matters.
More information about our shareholder commitment, our governance principles, how our board operates, its responsibilities, and the profiles of each of our directors can be found in our most recent management proxy circular and on our website atcameco.com/about/board-of-directors.
TARGETS AND METRICS: THE LINK BETWEEN ESG FACTORS AND EXECUTIVE PAY
We recognize the importance of integrating certain ESG factors, such as safety performance, a clean environment and supportive communities, into our executive compensation strategy as we see success in these areas as critical to the long term success of the company. For more information on our compensable targets and our reported performance against those targets see theMeasuring our results section that follows and our most recent management proxy circular.
| 24 | CAMECO CORPORATION |
Measuring our results
Each year, we set corporate objectives that are aligned with our strategic plan. These objectives fall under our four measures of success, and performance against specific targets under these objectives forms the foundation for a portion of annual employee and executive compensation. See our most recent management proxy circular for more information on how executive compensation is determined.
2019 OBJECTIVES1 | TARGET | RESULTS | ||
| OUTSTANDING FINANCIAL PERFORMANCE | ||||
| Earnings measure | Achieve targeted adjusted net earnings. | • adjusted net earnings was above the maximum target | ||
| Cash flow measure | Achieve cash flow from operations (after working capital changes). | • cash flow from operations was above the maximum target | ||
| SAFE, HEALTHY AND REWARDING WORKPLACE | ||||
| Workplace safety measure | Strive for no injuries at all Cameco-operated sites. Maintain a long-term downward trend in combined employee and contractor injury frequency and severity, and radiation doses. | • best safety performance in the history of the company, however TRIR did not meet the 2019 improvement target
• completion of corrective actions and job task observations exceeded the target
• average radiation doses remained low and stable | ||
| CLEAN ENVIRONMENT | ||||
| Environmental performance measures | Achieve divisional environmental aspect improvement targets. | • performance was within the targeted range
• there were no significant environmental incidents in 2019 | ||
| SUPPORTIVE COMMUNITIES | ||||
| Stakeholder support measure | Implement Collaboration Agreements by supporting northern business development opportunities and build corporate reputation. | • of our two targets involving sourcing of services from preferred northern Saskatchewan suppliers, one did not meet the minimum target and the other was above the maximum target | ||
| 1 | Detailed results for our 2019 corporate objectives and the related targets will be provided in our 2020 management proxy circular prior to our Annual Meeting of Shareholders on April 30, 2020. |
2020 objectives
OUTSTANDING FINANCIAL PERFORMANCE
| • | Achieve targeted financial measures focused on controlling costs and generating cash. |
SAFE, HEALTHY AND REWARDING WORKPLACE
| • | Improve workplace safety performance at all sites. |
CLEAN ENVIRONMENT
| • | Improve environmental performance at all sites. |
SUPPORTIVE COMMUNITIES
| • | Build and sustain strong stakeholder support for our activities. |
| MANAGEMENT’S DISCUSSION AND ANALYSIS | 25 |
Financial results
This section of our MD&A discusses our performance, financial condition and outlook for the future.
| 27 | 2019 CONSOLIDATED FINANCIAL RESULTS | |
| 38 | OUTLOOK FOR 2020 | |
| 41 | LIQUIDITY AND CAPITAL RESOURCES | |
| 46 | 2019 FINANCIAL RESULTS BY SEGMENT | |
| 46 | URANIUM | |
| 48 | FUEL SERVICES | |
| 49 | FOURTH QUARTER FINANCIAL RESULTS | |
| 49 | CONSOLIDATED RESULTS | |
| 52 | URANIUM | |
| 54 | FUEL SERVICES | |
| 26 | CAMECO CORPORATION |
2019 consolidated financial results
This section of our MD&A discusses our performance, financial condition and outlook for the future.
As of January 1, 2018, due to restructuring and a change in our ownership interest, we began accounting for JV Inkai on an equity basis, with no restatement of prior periods.
| HIGHLIGHTS | CHANGE FROM | |||||||||||||||
DECEMBER 31 ($ MILLIONS EXCEPT WHERE INDICATED) | 2019 | 2018 | 2017 | 2018 TO 2019 | ||||||||||||
Revenue | 1,863 | 2,092 | 2,157 | (11 | )% | |||||||||||
Gross profit | 242 | 296 | 436 | (18 | )% | |||||||||||
Net earnings (loss) attributable to equity holders | 74 | 166 | (205 | ) | (55 | )% | ||||||||||
$ per common share (basic) | 0.19 | 0.42 | (0.52 | ) | (56 | )% | ||||||||||
$ per common share (diluted) | 0.19 | 0.42 | (0.52 | ) | (56 | )% | ||||||||||
Adjusted net earnings(non-IFRS, see page 28) | 41 | 211 | 59 | (81 | )% | |||||||||||
$ per common share (adjusted and diluted) | 0.10 | 0.53 | 0.15 | (81 | )% | |||||||||||
Cash provided by operations (after working capital changes) | 527 | 668 | 596 | (21 | )% | |||||||||||
Net earnings
Our net earnings normally trend with revenue, but, in 2017, were significantly influenced by impairment charges due to the weakness in the uranium market.
The following table shows what contributed to the change in net earnings in 2019 compared to 2018 and 2017.
($ MILLIONS) | 2019 | 2018 | 2017 | |||||||||||
Net earnings (losses) - previous year | 166 | (205 | ) | (62 | ) | |||||||||
Change in gross profit by segment | ||||||||||||||
(we calculate gross profit by deducting from revenue the cost of products and services sold, and depreciation and amortization (D&A), net of hedging benefits) |
| |||||||||||||
Uranium | Higher (lower) sales volume | (27 | ) | 18 | 29 | |||||||||
Higher (lower) realized prices ($US) | (133 | ) | 40 | (222 | ) | |||||||||
Foreign exchange impact on realized prices | 35 | 1 | (36 | ) | ||||||||||
Lower (higher) costs | 10 | (186 | ) | 180 | ||||||||||
|
|
|
|
|
| |||||||||
change – uranium | (115 | ) | (127 | ) | (49 | ) | ||||||||
|
|
|
|
|
| |||||||||
Fuel services | Higher (lower) sales volume | 13 | 1 | (5 | ) | |||||||||
Higher (lower) realized prices ($Cdn) | (11 | ) | (5 | ) | 21 | |||||||||
Lower (higher) costs | 29 | (1 | ) | (15 | ) | |||||||||
|
|
|
|
|
| |||||||||
change – fuel services | 31 | (5 | ) | 1 | ||||||||||
|
|
|
|
|
| |||||||||
Other changes | ||||||||||||||
Lower administration expenditures | 17 | 21 | 44 | |||||||||||
Lower impairment charges | — | 358 | 4 | |||||||||||
Lower exploration expenditures | 6 | 10 | 13 | |||||||||||
Change in reclamation provisions | 57 | (60 | ) | (34 | ) | |||||||||
Lower loss on disposal of assets | — | 5 | 16 | |||||||||||
Change in gains or losses on derivatives | 113 | (137 | ) | 22 | ||||||||||
Change in foreign exchange gains or losses | (45 | ) | 49 | (17 | ) | |||||||||
Change in earnings from equity-accounted investments | 13 | 32 | — | |||||||||||
Arbitration award in 2019 related to TEPCO contract | 52 | — | — | |||||||||||
Gain on sale of interest in Wheeler River Joint Venture in 2018 | (17 | ) | 17 | — | ||||||||||
Gain on restructuring of JV Inkai in 2018 | (49 | ) | 49 | — | ||||||||||
Gain on customer contract restructuring in 2018 | (6 | ) | 6 | — | ||||||||||
Sale of exploration properties in 2018 | (7 | ) | 7 | — | ||||||||||
Gain on customer contract settlements in 2016 | — | — | (59 | ) | ||||||||||
Reversal of tax provision in 2018 related to CRA dispute | (61 | ) | 61 | — | ||||||||||
Change in income tax recovery or expense | (126 | ) | 62 | (91 | ) | |||||||||
Other | 45 | 23 | 7 | |||||||||||
|
|
|
|
|
| |||||||||
Net earnings (losses) - current year | 74 | 166 | (205 | ) | ||||||||||
|
|
|
|
|
| |||||||||
| MANAGEMENT’S DISCUSSION AND ANALYSIS | 27 |
Impairment charges
In the third quarter of 2017, we made changes to the way our global marketing activities were organized. The changes significantly impacted the marketing activities historically performed by NUKEM. As a result, we recognized an impairment charge for the full carrying value of goodwill of $111 million.
During the fourth quarter of 2017, we announced our plan to temporarily suspend production at the McArthur River/Key Lake operation in 2018. As a result, were-evaluated the project to complete the new calciner at Key Lake, which was undertaken to allow for increased production. Given the production suspension, market conditions, and that we determined the existing calciner had sufficient capacity to reliably meet our ongoing production requirements, it was determined that no further investment would be made to complete the project. As a result, we recognized an impairment charge related to the new calciner of $55 million.
Also during the fourth quarter of 2017, we recorded a $184 million write down of our US assets. Due to the continued weakening of the uranium market and the reduction in mineral reserves, we concluded that it was appropriate to recognize an impairment charge for these assets.
Non-IFRS measures
ADJUSTED NET EARNINGS
Adjusted net earnings is a measure that does not have a standardized meaning or a consistent basis of calculation under IFRS(non-IFRS measure). We use this measure as a more meaningful way to compare our financial performance from period to period. We believe that, in addition to conventional measures prepared in accordance with IFRS, certain investors use this information to evaluate our performance. Adjusted net earnings is our net earnings attributable to equity holders, adjusted to better reflect the underlying financial performance for the reporting period. The adjusted earnings measure reflects the matching of the net benefits of our hedging program with the inflows of foreign currencies in the applicable reporting period, and is adjusted for impairment charges, reclamation provisions for our Rabbit Lake and US operations, which have been impaired, the gain on restructuring of JV Inkai, and income taxes on adjustments.
Adjusted net earnings isnon-standard supplemental information and should not be considered in isolation or as a substitute for financial information prepared according to accounting standards. Other companies may calculate this measure differently, so you may not be able to make a direct comparison to similar measures presented by other companies.
To facilitate a better understanding of these measures, the table below reconciles adjusted net earnings with our net earnings for the years ended 2019, 2018 and 2017.
($ MILLIONS) | 2019 | 2018 | 2017 | |||||||||
Net earnings (loss) attributable to equity holders | 74 | 166 | (205 | ) | ||||||||
Adjustments | ||||||||||||
Adjustments on derivatives | (49 | ) | 65 | (108 | ) | |||||||
Impairment charges | — | — | 358 | |||||||||
Reclamation provision adjustments | 3 | 60 | — | |||||||||
Gain on restructuring of JV Inkai | — | (49 | ) | — | ||||||||
Income taxes on adjustments | 13 | (31 | ) | 14 | ||||||||
|
|
|
|
|
| |||||||
Adjusted net earnings | 41 | 211 | 59 | |||||||||
|
|
|
|
|
| |||||||
Every quarter we are required to update the reclamation provisions for all operations based on new cash flow estimates, discount and inflation rates. This normally results in an adjustment to an asset retirement obligation asset in addition to the provision balance. When the assets of an operation have been written off due to an impairment, as is the case with our Rabbit Lake and US ISR operations, the adjustment is recorded directly to the statement of earnings as “other operating expense (income)”. See note 15 of our annual financial statements for more information. This amount has been excluded from our adjusted net earnings measure.
| 28 | CAMECO CORPORATION |
The following table shows what contributed to the change in adjusted net earnings(non-IFRS measure, see above) in 2019 compared to the same period in 2018 and 2017.
($ MILLIONS) | 2019 | 2018 | 2017 | |||||||||||
Adjusted net earnings - previous year | 211 | 59 | 143 | |||||||||||
Change in gross profit by segment | ||||||||||||||
(we calculate gross profit by deducting from revenue the cost of products and services sold, and depreciation and amortization (D&A), net of hedging benefits) |
| |||||||||||||
| Uranium | Higher (lower) sales volume | (27 | ) | 18 | 29 | |||||||||
Higher (lower) realized prices ($US) | (133 | ) | 40 | (222 | ) | |||||||||
Foreign exchange impact on realized prices | 35 | 1 | (36 | ) | ||||||||||
Lower (higher) costs | 10 | (186 | ) | 180 | ||||||||||
|
|
|
|
|
| |||||||||
change – uranium | (115 | ) | (127 | ) | (49 | ) | ||||||||
|
|
|
|
|
| |||||||||
| Fuel services | Higher (lower) sales volume | 13 | 1 | (5 | ) | |||||||||
Higher (lower) realized prices ($Cdn) | (11 | ) | (5 | ) | 21 | |||||||||
Lower (higher) costs | 29 | (1 | ) | (15 | ) | |||||||||
|
|
|
|
|
| |||||||||
change – fuel services | 31 | (5 | ) | 1 | ||||||||||
|
|
|
|
|
| |||||||||
Other changes | ||||||||||||||
Lower administration expenditures | 17 | 21 | 44 | |||||||||||
Lower (higher) exploration expenditures | 6 | 10 | 13 | |||||||||||
Lower loss on disposal of assets | — | 5 | 16 | |||||||||||
Change in gains or losses on derivatives | (1 | ) | 36 | 44 | ||||||||||
Change in foreign exchange gains or losses | (45 | ) | 49 | (17 | ) | |||||||||
Change in earnings from equity-accounted investments | 13 | 32 | — | |||||||||||
Arbitration award in 2019 related to TEPCO contract | 52 | — | — | |||||||||||
Gain on sale of interest in Wheeler River Joint Venture in 2018 | (17 | ) | 17 | — | ||||||||||
Gain on customer contract restructuring in 2018 | (6 | ) | 6 | — | ||||||||||
Sale of exploration properties in 2018 | (7 | ) | 7 | — | ||||||||||
Gain on customer contract settlements in 2016 | — | — | (59 | ) | ||||||||||
Reversal of tax provision in 2018 related to CRA dispute | (61 | ) | 61 | — | ||||||||||
Change in income tax recovery or expense | (82 | ) | 17 | (90 | ) | |||||||||
Other | 45 | 23 | 13 | |||||||||||
|
|
|
|
|
| |||||||||
Adjusted net earnings - current year | 41 | 211 | 59 | |||||||||||
|
|
|
|
|
| |||||||||
Average realized prices
| CHANGE FROM | ||||||||||||||||||
| 2019 | 2018 | 2017 | 2018 TO 2019 | |||||||||||||||
Uranium1 | $US/lb | 33.77 | 37.01 | 36.13 | (9 | )% | ||||||||||||
| $Cdn/lb | 44.85 | 47.96 | 46.80 | (6 | )% | |||||||||||||
Fuel services | $Cdn/kgU | 26.21 | 26.78 | 27.20 | (2 | )% | ||||||||||||
| 1 | Average realized foreign exchange rate ($US/$Cdn): 2019 – 1.33, 2018 – 1.30 and 2017 – 1.30. |
| MANAGEMENT’S DISCUSSION AND ANALYSIS | 29 |
Revenue
The following table shows what contributed to the change in revenue for 2019.
($ MILLIONS) | ||||
Revenue – 2018 | 2,092 | |||
|
| |||
Uranium | ||||
Lower sales volume | (172 | ) | ||
Lower realized prices ($Cdn) | (98 | ) | ||
|
| |||
Fuel services | ||||
Higher sales volume | 64 | |||
Lower realized prices ($Cdn) | (8 | ) | ||
|
| |||
Other | (15 | ) | ||
|
| |||
Revenue – 2019 | 1,863 | |||
|
| |||
See 2019 Financial results by segment on page 46 for more detailed discussion.
THREE-YEAR TREND
In 2018, revenue decreased by 3% compared to 2017 due to a decrease in sales volumes from NUKEM due to the restructuring of our marketing activities in 2017. This was partially offset by an increase in sales volumes and average realized price in our uranium segment.
In 2019, revenue decreased by 11% compared to 2018 due to a decrease in sales volume in the uranium segment and a decrease in the Canadian dollar average realized price despite an increase in the uranium spot price. This decrease in the uranium segment was partially offset by an increase in sales volumes in our fuel services segment.
REVENUE OUTLOOK FOR 2020
We expect consolidated revenue to be between $1,480 million and $1,630 million, lower than in 2019 due to a decrease in average realized prices in our uranium segment as a result of lower expected prices under our contract portfolio and a decrease in committed sales volumes. We will continue to be active buying and selling uranium in the spot market if it makes sense for us. If we make additional sales with deliveries in 2020, we would expect our revenue outlook to increase.
In our uranium and fuel services segments, our customers choose when in the year to receive deliveries. As a result, our quarterly delivery patterns and, therefore, our sales volumes and revenue can vary significantly. We expect the quarterly distribution of uranium deliveries in 2020 to be weighted to the last three quarters of the year as shown below. However, not all delivery notices have been received to date and the expected delivery pattern could change. Typically, we receive notices six months in advance of the requested delivery date.
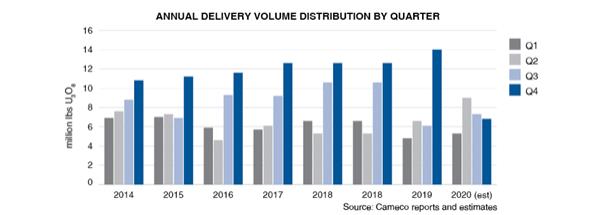
| 30 | CAMECO CORPORATION |
Corporate expenses
ADMINISTRATION
($ MILLIONS) | 2019 | 2018 | CHANGE | |||||||||
Direct administration | 113 | 112 | 1 | % | ||||||||
|
|
|
|
|
| |||||||
Severance costs | 1 | 14 | (93 | )% | ||||||||
|
|
|
|
|
| |||||||
Stock-based compensation | 11 | 16 | (31 | )% | ||||||||
|
|
|
|
|
| |||||||
Total administration | 125 | 142 | (12 | )% | ||||||||
|
|
|
|
|
| |||||||
Direct administration costs in 2019 were $1 million higher than 2018.
We recorded $11 million in stock-based compensation expenses in 2019 under our stock option, restricted share unit, deferred share unit, performance share unit and phantom stock option plans, $5 million lower than in 2018 due to the decrease in our share price compared to the same period in 2018. See note 24 to the financial statements.
Administration outlook for 2020
We expect direct administration costs to be between $110 million to $120 million, similar to 2019.
EXPLORATION
Our 2019 exploration activities were focused primarily on Canada. Our spending decreased from $20 million in 2018 to $14 million in 2019 due to a planned reduction in expenditures.
Exploration outlook for 2020
We expect exploration expenses to be about $13 million in 2020. The focus for 2020 will be on our core projects in Saskatchewan.
FINANCE COSTS
Finance costs were $99 million, a decrease from $112 million in 2018 due to a reduction in our outstanding debt as we retired our $500 million debenture that matured in September. See note 19 to the financial statements.
FINANCE INCOME
Finance income was $30 million compared to $22 million in 2018 due to higher cash balances throughout the year.
GAINS AND LOSSES ON DERIVATIVES
In 2019, we recorded $32 million in gains on our derivatives compared to $81 million in losses in 2018. The increase reflects the strength in the Canadian dollar compared to the US dollar at the end of 2019 compared to 2018. SeeForeign exchange on page 36 and note 26 to the financial statements.
INCOME TAXES
We recorded an income tax expense of $61 million in 2019 compared to a recovery of $126 million in 2018. The increase in expense was primarily due to a change in the distribution of earnings among jurisdictions as well as the reversal in 2018 of the provision related to our CRA dispute in the amount of $61 million (seeTax Court of Canada decision below for more details). See note 21 to the financial statements.
In 2019, we recorded earnings of $229 million in Canada compared to losses of $257 million in 2018, while in foreign jurisdictions, we recorded a loss of $94 million compared to earnings of $297 million in 2018. The tax rate in Canada is higher than the average of the rates in the foreign jurisdictions in which our subsidiaries operate.
On an adjusted earnings basis, we recognized a tax expense of $48 million in 2019 compared to a recovery of $95 million in 2018. The table below presents our adjusted earnings and adjusted income tax expenses attributable to Canadian and foreign jurisdictions.
| MANAGEMENT’S DISCUSSION AND ANALYSIS | 31 |
($ MILLIONS) | 2019 | 2018 | ||||||
Pre-tax adjusted earnings1 | ||||||||
Canada | 183 | (181 | ) | |||||
Foreign | (94 | ) | 297 | |||||
|
|
|
| |||||
Totalpre-tax adjusted earnings | 89 | 116 | ||||||
|
|
|
| |||||
Adjusted income taxes1 | ||||||||
Canada | 55 | (112 | ) | |||||
Foreign | (7 | ) | 17 | |||||
|
|
|
| |||||
Adjusted income tax expense (recovery) | 48 | (95 | ) | |||||
|
|
|
| |||||
| 1 | Pre-tax adjusted earnings and adjusted income taxes arenon-IFRS measures. Our IFRS-based measures have been adjusted by the amounts reflected in the table in adjusted net earnings(non-IFRS measures on page 28). |
TRANSFER PRICING DISPUTE
Tax Court of Canada decision
On September 26, 2018, the Tax Court of Canada (Tax Court) ruled unequivocally in our favour in our case with the Canada Revenue Agency (CRA) for the 2003, 2005 and 2006 tax years.
The Tax Court ruled that our marketing and trading structure involving foreign subsidiaries and the related transfer pricing methodology used for certain intercompany uranium purchase and sale agreements were in full compliance with Canadian laws for the three tax years in question. While the decision applies only to the three tax years under dispute, we believe there is nothing in the decision that would warrant a materially different outcome for subsequent tax years.
The Tax Court has referred the matter back to the Minister of National Revenue in order to issue new reassessments for the 2003, 2005 and 2006 tax years in accordance with the Tax Court’s decision. The total tax amount reassessed for those tax years was $11 million, and we remitted 50%. Therefore, we expect to receive refunds totaling about $5.5 million plus interest. The timing for the revised reassessments along with refunds plus interest may be delayed pending the outcome of the appeal. For further information regarding the appeal, see below.
On April 30, 2019, we announced the decision of the Tax Court in our application to recover costs in the amount of about $38 million ($20.5 million for legal fees and $17.9 million in disbursements), which were incurred over the course of this case. The Tax Court awarded $10.25 million in legal fees incurred, plus an amount for disbursements, which is yet to be determined. The amount of the award for disbursements will be determined by an officer of the Tax Court. We are optimistic we will recover all, or substantially all, of the $17.9 million in disbursements. Timing of any payments under the cost award is uncertain. The CRA has asked for the cost award to be overturned should it be successful in the appeals process.
Appeal process
On October 25, 2018, CRA filed a notice of appeal with the Federal Court of Appeal. In its notice of appeal, CRA is not appealing the Tax Court’s finding that sham was not present, but is appealing the Tax Court’s interpretation and application of the transfer pricing provisions in section 247 of the Income Tax Act. CRA filed its written submissions with the Federal Court of Appeal on May 31, 2019. In its written submission, CRA repeated its trial argument that the transactions should be recharacterized because arm’s length persons would not have entered into the various agreements that underpin the marketing and trading structure. CRA’s alternate argument is that the terms (focused on pricing) of these agreements would have been significantly different if these agreements had been made between arm’s length persons. CRA argues that either approach should result in the disputed reassessments being upheld in their totality.
The Federal Court of Appeal hearing is scheduled to be held on March 4, 2020, and we anticipate that we could receive a decision in 2020. We believe there is nothing in the Tax Court’s decision that would warrant a materially different outcome on appeal.
The decision of the Federal Court of Appeal can be appealed to the Supreme Court of Canada, but only if the Supreme Court of Canada agrees to hear the appeal. The request to appeal a decision of the Federal Court of Appeal to the Supreme Court of Canada must be made within 60 days of issuance of a Federal Court of Appeal decision.
| 32 | CAMECO CORPORATION |
In the event that either party appeals the Federal Court of Appeal decision, it would likely take about two years from the date the Federal Court of Appeal decision is issued to receive a decision from the Supreme Court of Canada should that court hear the appeal.
We expect to incur additional costs during the appeal process, and in connection with potential reassessments of subsequent years. There could also be costs incurred if a negotiated resolution with CRA is sought or achieved.
Potential exposure based on CRA appeal
Since 2008, CRA has disputed our marketing and trading structure and the related transfer pricing methodology we used for certain intercompany uranium sale and purchase agreements. To date, we have received notices of reassessment for our 2003 through 2013 tax years. While the Tax Court has ruled unequivocally in our favour for the 2003, 2005 and 2006 tax years, and we believe there is nothing in the decision that would warrant a materially different outcome on appeal, or for subsequent tax years we will continue to report on the potential exposure as we expect it will continue to tie up our financial capacity until the dispute is finally resolved for all years.
For the years 2003 to 2013, CRA has shifted Cameco Europe Limited’s income (as recalculated by CRA) back to Canada and applied statutory tax rates, interest and instalment penalties, and, from 2007 to 2011, transfer pricing penalties. We understand CRA is currently considering whether to impose a transfer pricing penalty for 2012 and 2013. Taxes of approximately $326 million for the 2003 to 2019 years have already been paid to date in a jurisdiction outside Canada. If CRA is successful on appeal, we will consider our options under bilateral international tax treaties to limit double taxation of this income. There is a risk that we will not be successful in eliminating all potential double taxation. The income adjustments claimed by CRA in its reassessments are represented by the amounts described below.
The Canadian income tax rules include provisions that generally require larger companies like us to remit or otherwise secure 50% of the cash tax plus related interest and penalties at the time of reassessment. We received the 2013 reassessment late in 2019. The CRA has advised that security remitted to date is sufficient to secure the tax debts they consider owing and as such, no further security is required at this time. To date, under these provisions, after applying elective deductions, we have paid or secured the amounts shown in the table below. Of these amounts, we expect to receive refunds totaling approximately $5.5 million plus interest for the years at issue in the Tax Court. The timing of the refund may be delayed pending the outcome of the appeal.
| INTEREST | TRANSFER | |||||||||||||||||||||||
| AND INSTALMENT | PRICING | CASH | SECURED BY | |||||||||||||||||||||
YEAR PAID ($ MILLIONS) | CASH TAXES | PENALTIES | PENALTIES | TOTAL | REMITTANCE | LC | ||||||||||||||||||
Prior to 2014 | 1 | 22 | 36 | 59 | 59 | — | ||||||||||||||||||
2014 | 106 | 47 | — | 153 | 153 | — | ||||||||||||||||||
2015 | 202 | 71 | 79 | 352 | 20 | 332 | ||||||||||||||||||
2016 | 51 | 38 | 31 | 120 | 32 | 88 | ||||||||||||||||||
2017 | — | 1 | 39 | 40 | 39 | 1 | ||||||||||||||||||
2018 | 17 | 40 | — | 57 | — | 57 | ||||||||||||||||||
2019 | — | 2 | — | 2 | — | 2 | ||||||||||||||||||
|
|
|
|
|
|
|
|
|
|
|
| |||||||||||||
Total | 377 | 221 | 185 | 783 | 303 | 480 | ||||||||||||||||||
|
|
|
|
|
|
|
|
|
|
|
| |||||||||||||
| MANAGEMENT’S DISCUSSION AND ANALYSIS | 33 |
While we expect the Tax Court’s decision to be upheld on appeal and believe the decision should apply in principle to subsequent years, until such time as all appeals are exhausted, and a resolution is reached for all tax years in question, we will not be in a position to determine the definitive outcome of this dispute. We expect any further actions regarding the tax years 2007 through 2013 will be suspended until the three years covered under the decision are finally resolved, with the exception of the transfer pricing penalties noted above. The tax years 2014 and beyond have not yet been reassessed, and it is uncertain what approach CRA will take on audit. Despite the fact that we believe there is no basis to do so, and it is not our view of the likely outcome, CRA may continue to reassess us using the methodology it used to reassess the 2003 through 2013 tax years. In that scenario, and including the $5.7 billion already reassessed, we would expect to receive notices of reassessment for a total of approximately $8.7 billion of additional income taxable in Canada for the years 2003 through 2019, which would result in a related tax expense of approximately $2.6 billion. As well, CRA may continue to apply transfer pricing penalties to taxation years subsequent to 2011. In that case, we estimate that cash taxes and transfer pricing penalties claimed by CRA for these years would be between $1.95 billion and $2.15 billion. In addition, CRA may seek to apply interest and instalment penalties that would be material to us. While in dispute, we may be required to remit or otherwise provide security for 50% of the cash taxes and transfer pricing penalties (between $970 million and $1.07 billion), plus related interest and instalment penalties assessed, which would be material to us. However, as noted previously, CRA has informed us that no further security is required for the tax debts it considers owing at this time. We have already paid or secured $562 million in cash taxes and transfer pricing penalties and $221 million in interest and instalment penalties.
Under the Canadian federal and provincial tax rules, any amount required to be paid or secured each year will depend on the amount of income reassessed in that year and the availability of elective deductions and tax loss carryovers. CRA has to date disallowed the use of any loss carry-backs for any transfer pricing adjustment, starting with the 2008 tax year. This does not impact the anticipated income tax expense for a particular year, but does impact the timing of any required security or payment. As noted above, for amounts reassessed after 2014, as an alternative to remitting cash, we used letters of credit to satisfy our obligations related to the reassessed income tax and related interest amounts. If required, we believe we will be able to continue to provide security in the form of letters of credit to satisfy these requirements. The amounts summarized in the table below reflect actual amounts paid or secured from 2003 through 2019 along with estimated post-2019 amounts if CRA were to continue to reassess based on the scenario outlined above, and include the expected timing adjustment for the inability to use any loss carry-backs starting with the 2008 tax year. The amounts have not been adjusted to reflect the refund of approximately $5.5 million plus interest we expect to receive based on the ruling of the Tax Court. The timing of such refund may be delayed pending the outcome of the appeal. We plan to update this table annually to include the estimated impact of reassessments expected for completed years subsequent to 2019.
$ MILLIONS | 2003-2019 | Post-2019 | TOTAL | |||||||||
50% of cash taxes and transfer pricing penalties paid, secured or potentially owing in the period |
| |||||||||||
Cash payments | 226 | 185 - 235 | 410 - 460 | |||||||||
Secured by letters of credit | 336 | 225 - 275 | 560 - 610 | |||||||||
|
|
|
|
|
| |||||||
Total paid or potentially owing1 | 562 | 410 - 510 | 970 - 1070 | |||||||||
|
|
|
|
|
| |||||||
| 1 | These amounts do not include interest and instalment penalties, which totaled approximately $221 million to December 31, 2019. |
In light of our view of the likely outcome of the appeal, and the dispute for subsequent years, based on the Tax Court’s decision as described above, we expect to recover the amounts remitted, including the $783 million already paid or otherwise secured to date.
| 34 | CAMECO CORPORATION |
Caution about forward-looking information relating to our CRA tax dispute
This discussion of our expectations relating to our tax dispute with CRA and future tax reassessments by CRA is forward-looking information that is based upon the assumptions and subject to the material risks discussed under the heading Caution about forward-looking information beginning on page 2 and also on the more specific assumptions and risks listed below. Actual outcomes may vary significantly.
Assumptions
| • | CRA will reassess us for the years 2014 through 2019 using a similar methodology as for the years 2003 through 2013, and the reassessments will be issued on the basis we expect |
| • | we will be able to apply elective deductions and utilize letters of credit to the extent anticipated |
| • | CRA will seek to impose transfer pricing penalties (in a manner consistent with penalties charged in the years 2007 through 2011) in addition to interest charges and instalment penalties |
| • | we will be substantially successful in our dispute with CRA, including any appeals of the Tax Court’s decision or any decisions regarding other tax years, and we will not incur any significant tax liability resulting from the outcome of the dispute or other costs, potentially including costs associated with a negotiated resolution with CRA |
| • | a favourable determination by the officer of the Tax Court of the amount of our disbursements award |
Material risks that could cause actual results to differ materially |
| • | CRA reassesses us for years 2014 through 2019 using a different methodology than for years 2003 through 2013, or we are unable to utilize elective deductions or letters of credit to the extent anticipated, resulting in the required cash payments or security provided to CRA pending the outcome of the dispute being higher than expected |
| • | the time lag for the reassessments for each year is different than we currently expect |
| • | we are unsuccessful in an appeal of the Tax Court’s decision or any tax decisions of the Tax Court for subsequent years, or appeals of those decisions, and the outcome of our dispute with CRA, potentially including costs associated with a negotiated resolution with CRA, results in significant costs, cash taxes, interest charges and penalties which could have a material adverse effect on our liquidity, financial position, results of operations and cash flows |
| • | cash tax payable increases due to unanticipated adjustments by CRA not related to transfer pricing |
| • | we are unable to effectively eliminate all double taxation |
| • | an unfavourable determination of the officer of the Tax Court of the amount of our disbursements award |
Tax outlook for 2020
On an adjusted net earnings basis, we expect a tax expense of between $20 million and $30 million in 2020.
Our consolidated tax rate is a blend of the statutory rates applicable to taxable income earned or tax losses incurred in Canada and in our foreign subsidiaries. We have a global customer base and we have established a marketing and trading structure involving foreign subsidiaries, which entered into various intercompany purchase and sale arrangements, as well as uranium purchase and sale agreements with third parties. Cameco and its subsidiaries made reasonable efforts to putarm’s-length transfer pricing arrangements in place, and these arrangements expose the parties to the risks and rewards accruing to them under these contracts. The intercompany contract prices are generally comparable to those established in comparable contracts betweenarm’s-length parties entered into at that time. In 2017, we changed our global marketing organization to consolidate our international activities in Canada in order to achieve efficiencies. The existing purchase and sale arrangements will continue to be in place until they expire. As the existing contracts expire, we anticipate that more income will be earned in Canada.
We continue to expect our consolidated tax rate will trend toward the Canadian statutory rate in the longer term. The actual effective tax rate will vary fromyear-to-year, primarily due to the actual distribution of earnings among jurisdictions and the market conditions at the time transactions occur under both our intercompany and third-party purchase and sale arrangements.
| MANAGEMENT’S DISCUSSION AND ANALYSIS | 35 |
FOREIGN EXCHANGE
The exchange rate between the Canadian dollar and US dollar affects the financial results of our uranium and fuel services segments.
We sell the majority of our uranium and fuel services products under long-term sales contracts, which are routinely denominated in US dollars. Our product purchases are denominated in US dollars while our production costs are largely denominated in Canadian dollars. To provide cash flow predictability we hedge a portion of our net US/Cdn exposure (e.g. total US dollar sales less US dollar expenditures and product purchases) to manage shorter term exchange rate volatility.
Our risk management policy is based on a60-month period and permits us to hedge 35% to 100% of our expected net exposure in the first 12 month period. Our normal practice is to layer in hedge contracts over a three- to four-year period with the hedge percentage being highest in the first 12 months and decreasing hedge percentages in subsequent years. The portion of our net exposure that remains unhedged is subject to prevailing market exchange rates for the period. Therefore, our results are affected by the movements in the exchange rate on our hedge portfolio (explained below), and on the unhedged portion of our net exposure. A weakening Canadian dollar would have a positive effect on the unhedged exposure, and a strengthening Canadian dollar would have a negative effect. SeeRevenue, adjusted net earnings, and cash flow sensitivity analysis on page 40 for more information on how a change in the exchange rate will impact our revenue, cash flow, adjusted net earnings (ANE), and gains and losses on derivatives, presented on an ANE basis.
Impact of hedging on IFRS earnings
We do not use hedge accounting under IFRS and, therefore, we are required to report gains and losses on all hedging activity, both for contracts that close in the period and those that remain outstanding at the end of the period. For the contracts that remain outstanding, we must treat them as though they were settled at the end of the reporting period(mark-to-market).
However, we do not believe the gains and losses that we are required to report under IFRS appropriately reflect the intent of our hedging activities, so we make adjustments in calculating our ANE to better reflect the impact of our hedging program in the applicable reporting period.
Impact of hedging on ANE
We designate contracts for use in particular periods, based on our expected net exposure in that period. Hedge contracts are layered in over time based on this expected net exposure. The result is that our current hedge portfolio is made up of a number of contracts which are currently designated to net exposures we expect in 2020 and future years and we will recognize the gains or losses in ANE in those periods.
For the purposes of ANE, gains and losses on derivatives are reported based on the difference between the effective hedge rate of the contracts designated for use in the particular period and the exchange rate at the time of settlement. This results in an adjustment to current period IFRS earnings to effectively remove reported gains or losses on derivatives that arise from contracts put in place for use in future periods. The effective hedge rate will lag the market in periods of rapid currency movement. SeeNon-IFRS measures on page 28.
The table below provides a summary of our hedge portfolio at December 31, 2019. You can use this information to estimate the expected gains or losses on derivatives for 2020 on an ANE basis. However, if we add contracts to the portfolio that are designated for use in 2020 or if there are changes in the US/Cdn exchange rates in the year, those expected gains or losses could change.
| 36 | CAMECO CORPORATION |
HEDGE PORTFOLIO SUMMARY
| DECEMBER 31, 2019 | AFTER | |||||||||||||
($ MILLIONS) | 2020 | 2020 | TOTAL | |||||||||||
US dollar forward contracts | ($ millions) | 190 | 140 | 330 | ||||||||||
Average contract rate1 | (US/Cdn dollar) | 1.27 | 1.30 | 1.28 | ||||||||||
US dollar option contracts | ($ millions) | 170 | 175 | 345 | ||||||||||
Average contract rate range1 | (US/Cdn dollar) | 1.29 to 1.33 | 1.29 to 1.33 | 1.29 to 1.33 | ||||||||||
Total US dollar hedge contracts | ($ millions) | 360 | 315 | 675 | ||||||||||
Effective hedge rate range2 | (US/Cdn dollar) | 1.28 to 1.30 | 1.29 to 1.32 | 1.29 to 1.31 | ||||||||||
Hedge ratio3 | 44 | % | 8 | % | 14 | % | ||||||||
| 1 | The average contract rate is the weighted average of the rates stipulated in the outstanding contracts. |
| 2 | The effective hedge rate is the exchange rate on the original hedge contract at the time it was established and designated for use. Therefore the effective hedge rate range shown reflects an average of contract exchange rates at the time of designation. |
| 3 | Hedge ratio is calculated by dividing the amount (in foreign currency) of outstanding derivative contracts by estimated future net exposures. |
At December 31, 2019:
| • | The value of the US dollar relative to the Canadian dollar was $1.00 (US) for $1.30 (Cdn), down from $1.00 (US) for $1.36 (Cdn) at December 31, 2018. The exchange rate averaged $1.00 (US) for $1.33 (Cdn) over the year. |
| • | Themark-to-market position on all foreign exchange contracts was a $4 million loss compared to a $53 million loss at December 31, 2018. |
We manage counterparty risk associated with hedging by dealing with highly rated counterparties and limiting our exposure. At December 31, 2019, all of our hedging counterparties had a Standard & Poor’s (S&P) credit rating of A or better.
For information on the impact of foreign exchange on our intercompany balances, see note 26 to the financial statements.
| MANAGEMENT’S DISCUSSION AND ANALYSIS | 37 |
Outlook for 2020
Our strategy is to focus on ourtier-one assets and profitably produce at a pace aligned with market signals, in order to preserve the value of those assets and increase long-term shareholder value, and to do that with a focus on safety, people and the environment.
Our outlook for 2020 reflects the expenditures necessary to help us achieve our strategy. We have made significant progress in reducing our administration, exploration and operating costs, as well as our capital expenditures. We have also made a number of strategic decisions that come with significant costs in the near term, costs we factored into our decisions. As a result, and based on what we know today, including committed delivery volumes, from a gross profit point of view, 2020 is expected to be a weaker year for us. The lower delivery commitments and changing pricing terms under our existing contract portfolio are expected to adversely impact our revenue and average realized price in 2020 relative to 2019. In addition, our outlook for the average unit cost of sales in 2020 continues to be impacted by the proportion of purchased material compared to produced material making up our uranium supply and care and maintenance costs, which are expected to be between $150 million and $170 million. Despite the impact on our expected results, we continue to believe these are the right decisions to create long-term shareholder value.
In contrast, from a cash perspective, we expect to continue to maintain a significant cash balance. We expect to continue to generate cash from operations however, the amount of cash generated will be dependent on the timing and magnitude of our purchasing activity and therefore, cash balances may fluctuate throughout the year.
We report our results and outlook based on a calendar-year view, at a point in time. However, under our marketing framework, we plan on a rolling12-month basis, which means our production, sales, inventory and purchases are all variables. Therefore, in accordance with market opportunities and as the year unfolds, we expect our actual production, sales, purchases and inventory may vary from what we are reporting in the 2020 Financial Outlook table.
In addition, there are a number of moving pieces both internally and externally, that could have a significant impact on the market and on our results, and it is important to keep them in mind. Some of the more significant items are:
| • | the decision by the President of the United States to implement any of the recommendations contained in the NFWG report, and the impact, if any, on the uranium market and uranium prices |
| • | whether the Russian Suspension Agreement gets amended or extended prior to its expiry at the end of 2020 |
| • | the impact if sanctions on Iran are expanded and extend to countries providing nuclear fuel products and services to Iran, and therefore disrupt Russian nuclear fuel imports into the US |
| • | a potential decision from the Federal Court of Appeal in our tax dispute with CRA |
See2019 Financial results by segment on page 46 for details.
2019 outlook compared to actual results
Our actual results were largelyin-line with the outlook provided in our third quarter MD&A. However, our total purchases for the year were 19 million pounds compared to our outlook of 21 million to 23 million pounds. Based on what we were seeing in the market, we decided to reduce our spot purchases in 2019 and to draw our inventory down. With the expected delivery pattern in 2020 heavily weighted to the last three quarters of the year and the timing of our 2020 purchase commitments, we are confident in our ability to meet our delivery commitments.
| 38 | CAMECO CORPORATION |
2020 FINANCIAL OUTLOOK
| CONSOLIDATED | URANIUM | FUEL SERVICES | ||||||||||
EXPECTED CONTRIBUTION TO GROSS PROFIT | 100 | % | 36 | % | 64 | % | ||||||
Production (owned and operated properties) | — | 9.0 million lbs | 13 to 14 million kgU | |||||||||
Purchases | — | 20 to 22 million lbs | — | |||||||||
Sales/delivery volume | — | 28 to 30 million lbs | 12 to 13 million kgU | |||||||||
Revenue | $ | 1,480-1,630 million | $ | 1,120-1,210 million | $ | 340-370 million | ||||||
Average realized price | — | $ | 40.90/lb | — | ||||||||
Average unit cost of sales (including D&A) | — | $ | 38.50-40.50/lb | $ | 19.70-20.70/kgU | |||||||
Direct administration costs | $ | 110-120 million | — | — | ||||||||
Exploration costs | — | $ | 13 million | — | ||||||||
Expected loss on derivatives - ANE basis | $ | 0-10 million | — | — | ||||||||
Tax expense - ANE basis | $ | 20-30 million | — | — | ||||||||
Capital expenditures | $ | 120 million | — | — | ||||||||
We do not provide an outlook for the items in the table that are marked with a dash.
The following assumptions were used to prepare the outlook in the table above:
| • | Purchases – are based on the volumes we currently have commitments to acquire under contract in 2020, including our JV Inkai purchases and the purchase of NUKEM’s excess inventory, and it includes the additional volumes we are required to purchase in order to meet the sales/delivery commitments we have under contract in 2020 and maintain our desired working inventory. |
| • | Our 2020 outlook for sales/delivery volume and revenue does not include sales between our uranium and fuel services segments. |
| • | Sales/delivery volume is based on the volumes we currently have commitments to deliver under contract in 2020. |
| • | Uranium revenue and average realized price are based on a uranium spot price of $24.35 (US) per pound (the UxC spot price as of January 27, 2020), a long-term price indicator of $32.00 (US) per pound (the UxC long-term indicator on January 27, 2020) and an exchange rate of $1.00 (US) for $1.30 (Cdn). |
| • | Uranium average unit cost of sales (including D&A) is based on the expected unit cost of sales for produced material, the planned purchases noted in the outlook at an anticipated average purchase price of $31.40 per pound, and includes care and maintenance costs of between $150 million and $170 million. If purchase volumes and/or uranium spot prices vary in 2020, then we expect the overall unit cost of sales may be affected. |
| • | Direct administration costs do not include stock-based compensation expenses. See page 31 for more information. |
| • | Our outlook for the tax expense is based on adjusted net earnings and the other assumptions listed in the table. The outlook does not include our share of taxes on JV Inkai profits as the income from JV Inkai is net of taxes. If other assumptions change then the expected expense may be affected. |
Our 2020 financial outlook is presented on the basis of equity accounting for our minority ownership interest in JV Inkai. Under equity accounting, our share of the profits earned by JV Inkai on the sale of its production will be included in “income from equity-accounted investees” on our consolidated statement of earnings. Our share of production will be purchased at a discount to the spot price and included at this value in inventory. In addition, JV Inkai capital is not included in our outlook for capital expenditures. Please seeInkai Planning for the future on page 70 andCapital spendingon page 42 for more details.
For more information on how changes in the exchange rate or uranium prices can impact our outlook seeRevenue, adjusted net earnings, and cash flow sensitivity analysis below, andForeign exchange on page 36.
| MANAGEMENT’S DISCUSSION AND ANALYSIS | 39 |
REVENUE, ADJUSTED NET EARNINGS, AND CASH FLOW SENSITIVITY ANALYSIS
| IMPACT ON: | ||||||||||||||
FOR 2020 ($ MILLIONS) | CHANGE | REVENUE | ANE | CASH FLOW | ||||||||||
Uranium spot and term price1 | $5(US)/lb increase | 78 | 12 | (10 | ) | |||||||||
| $5(US)/lb decrease | (74 | ) | (9 | ) | 14 | |||||||||
Value of Canadian dollar vs US dollar | One cent decrease in CAD | 10 | 3 | 2 | ||||||||||
| One cent increase in CAD | (10 | ) | (3 | ) | (2 | ) | ||||||||
| 1 | Assuming change in both UxC spot price ($24.35 (US) per pound on January 27, 2020) and the UxC long-term price indicator ($32.00 (US) per pound on January 27, 2020). |
In 2020, our cash flow is expected to move in the opposite direction from price. Cash inflows from revenue are expected to be relatively less sensitive to an increase in the spot price than cash outflows from purchases due the volume of planned deliveries at prices that have been fixed compared to the volume of spot purchases remaining based on our outlook.
PRICE SENSITIVITY ANALYSIS: URANIUM SEGMENT
The following table is not a forecast of prices we expect to receive. The prices we actually realize will be different from the prices shown in the table. It is designed to indicate how the portfolio of long-term contracts we had in place on December 31, 2019 would respond to different spot prices. In other words, we would realize these prices only if the contract portfolio remained the same as it was on December 31, 2019, and none of the assumptions we list below change.
We intend to update this table each quarter in our MD&A to reflect deliveries made and changes to our contract portfolio. As a result, we expect the table to change from quarter to quarter.
Expected realized uranium price sensitivity under various spot price assumptions
(rounded to the nearest $1.00)
| SPOT PRICES | ||||||||||||||||||||||||||||
($US/lb U3O8) | $20 | $40 | $60 | $80 | $100 | $120 | $140 | |||||||||||||||||||||
2021 | 27 | 40 | 53 | 60 | 65 | 69 | 73 | |||||||||||||||||||||
2022 | 27 | 40 | 54 | 62 | 66 | 69 | 71 | |||||||||||||||||||||
2023 | 28 | 40 | 54 | 62 | 66 | 69 | 72 | |||||||||||||||||||||
2024 | 30 | 41 | 53 | 60 | 62 | 63 | 63 | |||||||||||||||||||||
The table illustrates the mix of long-term contracts in our December 31, 2019 portfolio, and is consistent with our marketing strategy. It has been updated to reflect contracts entered into up to December 31, 2019.
Our portfolio includes a mix of fixed-price and market-related contracts, which we target at a 40:60 ratio. Those that are fixed at lower prices or have low ceiling prices will yield prices that are lower than current market prices.
Our portfolio is affected by more than just the spot price. We made the following assumptions (which are not forecasts) to create the table:
Sales
| • | sales volumes on average of 19 million pounds per year, with commitment levels in 2020 and 2021 higher than in 2022 through 2024 |
| • | excludes sales between our segments |
Deliveries
| • | deliveries include best estimates of requirements contracts and contracts with volume flex provisions |
Annual inflation
| • | is 2% in the US |
Prices
| • | the average long-term price indicator is the same as the average spot price for the entire year (a simplified approach for this purpose only). Since 1996, the long-term price indicator has averaged 21% higher than the spot price. This differential has varied significantly. Assuming the long-term price is at a premium to spot, the prices in the table will be higher. |
| 40 | CAMECO CORPORATION |
Liquidity and capital resources
Our financial objective is to ensure we have the cash and debt capacity to fund our operating activities, investments and other financial obligations.
At the end of 2019, we had cash and short-term investments of $1.1 billion, while our total debt amounted to $1 billion.
We have large, creditworthy customers that continue to need uranium even during weak economic conditions, and we expect the uranium contract portfolio we have built to continue to provide a solid revenue stream. From 2020 through 2024, we have commitments to deliver an average of 19 million pounds per year, with commitment levels in 2020 and 2021 higher than in 2022 through 2024.
In the currently weak uranium price environment, our focus is on preserving the value of ourtier-one assets and reducing our operating, capital and general and administrative spending. We have a number of alternatives to fund future capital requirements, including using our operating cash flow, drawing on our existing credit facilities, entering new credit facilities, and raising additional capital through debt or equity financings. We are always considering our financing options so we can take advantage of favourable market conditions when they arise. In addition, due to the deliberate cost reduction measures implemented over the past five years, the reduction in our dividend, and the drawdown of inventory in 2018 as a result of the suspension of production at our McArthur River/Key Lake operation, we have significant cash balances. We expect to continue to generate cash from operations however, the amount of cash generated will be dependent on the timing and magnitude of our purchasing activity and therefore, cash balances may fluctuate throughout the year. We expect our cash balances and operating cash flows to meet our capital requirements during 2020.
We received a favourable ruling in our case with CRA for the 2003, 2005 and 2006 tax years. We expect the ruling to be upheld on appeal, and we believe the ruling should apply in principle to subsequent tax years. However, until such time as all appeals are exhausted, and a resolution is reached for all tax years in question, in accordance with Canadian income tax rules we may be required to remit or otherwise secure 50% of any cash taxes plus related interest and penalties CRA may continue to reassess, even though we believe there is no basis for them to do so. See page 32 for more information. In the above scenario, the table on page 34 provides the amount and timing of the cash taxes and transfer pricing penalties paid or secured to date. In addition, it provides an estimate of the amounts we may potentially have to pay or secure upfront if CRA continues to reassess us using the same methodology it reassessed the 2003 to 2013 tax years. The timing of these amounts is uncertain.
FINANCIAL CONDITION
| 2019 | 2018 | |||||||
Cash position ($ millions) | 1,062 | 1,103 | ||||||
(cash and cash equivalents and short-term investments) | ||||||||
Cash provided by operations ($ millions) | 527 | 668 | ||||||
(net cash flow generated by our operating activities after changes in working capital) | ||||||||
Cash provided by operations/net debt1 | n/a | 170 | % | |||||
(net debt is total consolidated debt, less cash position) | ||||||||
Net debt/total capitalization1 | n/a | 7 | % | |||||
(total capitalization is net debt and equity) | ||||||||
| 1 | As at December 31, 2019, Cameco’s net debt is negative due to its strong cash position. |
CREDIT RATINGS
The credit ratings assigned to our securities by external ratings agencies are important to our ability to raise capital at competitive pricing to support our business operations. We navigate by our investment-grade credit rating.
Third-party ratings for our commercial paper and senior debt as of February 6, 2020:
SECURITY | DBRS | S&P | ||
Commercial paper | R-2 (middle)1 | A-32 | ||
Senior unsecured debentures | BBB1 | BBB-2 | ||
Rating trend / rating outlook | Negative | Stable2 |
| 1 | On May 24, 2019, DBRS lowered its long term corporate credit rating from BBB (high) to BBB and commercial paper toR-2 (middle). |
| 2 | On March 1, 2019 S&P lowered its long term corporate credit rating from BBB toBBB-, commercial paper toA-3 and changed Cameco’s rating outlook to stable from negative. |
| MANAGEMENT’S DISCUSSION AND ANALYSIS | 41 |
The rating agencies may revise or withdraw these ratings if they believe circumstances warrant. The rating trend/outlook represents the rating agency’s assessment of the likelihood and direction that the rating could change in the future.
A change in our credit ratings could affect our cost of funding and our access to capital through the capital markets.
Liquidity
($ MILLIONS) | 2019 | 2018 | ||||||
Cash and cash equivalents at beginning of year | 1,103 | 592 | ||||||
|
|
|
| |||||
Cash from operations | 527 | 668 | ||||||
|
|
|
| |||||
Investment activities | ||||||||
Additions to property, plant and equipment and acquisitions | (75 | ) | (55 | ) | ||||
Other investing activities | 121 | 34 | ||||||
|
|
|
| |||||
Financing activities | ||||||||
Change in debt | (500 | ) | — | |||||
Interest paid | (72 | ) | (73 | ) | ||||
Other financing activities | (3 | ) | — | |||||
|
|
|
| |||||
Dividends | (32 | ) | (71 | ) | ||||
|
|
|
| |||||
Exchange rate on changes on foreign currency cash balances | (7 | ) | 8 | |||||
|
|
|
| |||||
Cash and cash equivalents and short-term investments at end of year | 1,062 | 1,103 | ||||||
|
|
|
| |||||
CASH FROM OPERATIONS
Cash from operations was 21% lower than in 2018 due largely to the drawdown of inventory in 2018 in accordance with our strategy. Working capital provided $87 million less in 2019. Not including working capital requirements, our operating cash flows in the year were down $54 million. See note 23 to the financial statements.
INVESTING ACTIVITIES
Cash used in investing includes acquisitions and capital spending.
Capital spending
We classify capital spending as sustaining, capacity replacement or growth. As a mining company, sustaining capital is the money we spend to keep our facilities running in their present state, which would follow a gradually decreasing production curve, while capacity replacement capital is spent to maintain current production levels at those operations. Growth capital is money we invest to generate incremental production, and for business development.
CAMECO’S SHARE ($ MILLIONS) | 2019 PLAN | 2019 ACTUAL | 2020 PLAN | |||||||||
Sustaining capital | ||||||||||||
McArthur River/Key Lake | 5 | 2 | 10 | |||||||||
Cigar Lake | 15 | 9 | 15 | |||||||||
Fuel services | 30 | 28 | 45 | |||||||||
Other | — | 1 | — | |||||||||
|
|
|
|
|
| |||||||
Total sustaining capital | 50 | 40 | 70 | |||||||||
|
|
|
|
|
| |||||||
Capacity replacement capital | ||||||||||||
Cigar Lake | 45 | 35 | 50 | |||||||||
|
|
|
|
|
| |||||||
Total capacity replacement capital | 45 | 35 | 50 | |||||||||
|
|
|
|
|
| |||||||
Total uranium & fuel services | 95 | 75 | 120 | |||||||||
|
|
|
|
|
| |||||||
Total capital expenditures for 2019 were lower than our outlook of $95 million as a result of the rescheduling of some expenditures at Cigar Lake to 2020.
| 42 | CAMECO CORPORATION |
Outlook for investing activities
CAMECO’S SHARE ($ MILLIONS) | 2021 PLAN | 2022 PLAN | ||||||
Total uranium & fuel services | 75-125 | 50-100 | ||||||
Sustaining capital | 60-85 | 35-60 | ||||||
Capacity replacement capital | 15-40 | 15-40 | ||||||
Growth capital | — | — | ||||||
We expect total 2020 capital expenditures for uranium and fuel services to be about 58% higher than in 2019 due to ongoing investment in the Vision in Motion project at fuel services, increased mine development activity at Cigar Lake, and the rescheduling of some expenditures planned at Cigar Lake in 2019 to 2020.
Capital expenditures for JV Inkai are expected to be covered by JV Inkai cash flows in 2020, and are included in our overall equity investment.
Major sustaining and capacity replacement expenditures in 2020 include:
| • | Fuel services – continuation of work on our Vision in Motion project |
| • | Cigar Lake – underground development and necessary ground freezing infrastructure to meet production targets |
Our 2020, 2021 and 2022 capital spending estimates assume that market conditions remain such that McArthur River and Key Lake remain in a state of ongoing care and maintenance. Capital spending could increase if we identify and approve investment in projects we expect will reduce costs and improve operational effectiveness and efficiency.
This information regarding currently expected capital expenditures for future periods is forward-looking information, and is based upon the assumptions and subject to the material risks discussed on pages 2 and 3. Our actual capital expenditures for future periods may be significantly different.
FINANCING ACTIVITIES
Cash from financing includes borrowing and repaying debt, and other financial transactions including paying dividends and providing financial assurance.
Long-term contractual obligations
| 2021 AND | 2023 AND | 2025 AND | ||||||||||||||||||
DECEMBER 31 ($ MILLIONS) | 2020 | 2022 | 2024 | BEYOND | TOTAL | |||||||||||||||
Long-term debt | — | 400 | 500 | 100 | 1,000 | |||||||||||||||
Interest on long-term debt | 41 | 82 | 52 | 92 | 267 | |||||||||||||||
Provision for reclamation | 55 | 53 | 98 | 921 | 1,127 | |||||||||||||||
Provision for waste disposal | 1 | 3 | 3 | 1 | 8 | |||||||||||||||
Other liabilities | 5 | 10 | 4 | 75 | 94 | |||||||||||||||
Capital commitments | 38 | — | — | — | 38 | |||||||||||||||
|
|
|
|
|
|
|
|
|
| |||||||||||
Total | 140 | 548 | 657 | 1,189 | 2,534 | |||||||||||||||
|
|
|
|
|
|
|
|
|
| |||||||||||
We have contractual capital commitments of approximately $38 million at December 31, 2019. Certain of the contractual commitments may contain cancellation clauses; however, we disclose the commitments based on management’s intent to fulfil the contracts.
We have unsecured lines of credit of about $2.5 billion, which include the following:
| • | A $1.0 billion unsecured revolving credit facility that matures November 1, 2023. Each year on the anniversary date, and upon mutual agreement, the facility can be extended for an additional year. In addition to borrowing directly from this facility, we can use up to $100 million of it to issue letters of credit. We may increase the revolving credit facility above $1.0 billion, by increments of no less than $50 million, up to a total of $1.25 billion. The facility ranks equally with all of our other senior debt. At December 31, 2019, there were no amounts outstanding under this facility. |
| • | At December 31, 2019, we had approximately $1.5 billion outstanding in financial assurances provided by various financial institutions. We use these facilities mainly to provide financial assurance for future decommissioning and reclamation of our operating sites, for our obligations relating to the CRA dispute, and as overdraft protection. |
| MANAGEMENT’S DISCUSSION AND ANALYSIS | 43 |
In total we have $1.0 billion in senior unsecured debentures outstanding:
| • | $400 million bearing interest at 3.75% per year, maturing on November 14, 2022 |
| • | $500 million bearing interest at 4.19% per year, maturing on June 24, 2024 |
| • | $100 million bearing interest at 5.09% per year, maturing on November 14, 2042 |
Debt covenants
Our revolving credit facility includes the following financial covenants:
| • | our funded debt to tangible net worth ratio must be 1:1 or less |
| • | other customary covenants and events of default |
Funded debt is total consolidated debt lessnon-recourse debt, $100 million in letters of credit, cash and short-term investments.
Not complying with any of these covenants could result in accelerated payment and termination of our revolving credit facility. At December 31, 2019, we complied with all covenants, and we expect to continue to comply in 2020.
OFF-BALANCE SHEET ARRANGEMENTS
We had three kinds ofoff-balance sheet arrangements at the end of 2019:
| • | purchase commitments |
| • | financial assurances |
| • | other arrangements |
Purchase commitments
We make purchases under long-term contracts where it is beneficial for us to do so and in order to support our long-term contract portfolio. The following table is based on our purchase commitments in our uranium and fuel services segments, as well as commitments previously contracted by NUKEM, at December 31, 20192 but does not include purchases of our share of Inkai production. These commitments include a mix of fixed-price and market-related contracts. Actual payments will be different as a result of changes to our purchase commitments and, in the case of contracts with market-related pricing, the market prices in effect at the time of delivery. We will update this table as required in our MD&A to reflect material changes to our purchase commitments and changes in the prices used to estimate our commitments under market-related contracts.
| 2021 AND | 2023 AND | 2025 AND | ||||||||||||||||||
DECEMBER 31, 2019 ($ MILLIONS) | 2020 | 2022 | 2024 | BEYOND | TOTAL | |||||||||||||||
Purchase commitments1,2 | 216 | 180 | 126 | 251 | 773 | |||||||||||||||
| 1 | Denominated in US dollars and Japanese yen, converted from US dollars to Canadian dollars at the rate of 1.30 and from Japanese yen to Canadian dollars at the rate of $0.01. |
| 2 | These amounts have been adjusted for any additional purchase commitments that we have entered into since December 31, 2019, but does not include deliveries taken under contract since December 31, 2019. |
We have commitments of $773 million (Cdn) for the following:
| • | approximately 18 million pounds of U3O8 equivalent from 2020 to 2028 |
| • | approximately 0.3 million kgU as UF6 in conversion services in 2020 |
| • | about 0.1 million Separative Work Units (SWU) of enrichment services to meet existing forward sales commitments under agreements with anon-Western supplier |
The suppliers do not have the right to terminate agreements other than pursuant to customary events of default provisions.
Financial assurances
Standby letters of credit and surety bonds provide financial assurance for the decommissioning and reclamation of our mining and conversion facilities as well as for our obligations relating to the CRA dispute. We are required to provide financial assurances to various regulatory agencies until decommissioning and reclamation activities are complete. We are also providing letters of credit until the CRA dispute is resolved. Our financial assurances renew automatically on an annual basis, unless otherwise advised by the issuing institution. At December 31, 2019 our financial assurances totaled $1.5 billion, down from $1.6 billion at December 31, 2018. The decrease in 2019 was mainly due to small changes in reclamation requirements as well as the change in foreign exchange rates.
| 44 | CAMECO CORPORATION |
Other arrangements
We have arranged for standby product loan facilities with three different counterparties. The arrangements allow us to borrow up to 1.2 million kgU of UF6 conversion services over the period 2020 to 2022 with repayment in kind up to March 31, 2023. Under the loan facilities, standby fees of up to 1% are payable based on the market value of the facilities and interest is payable on the market value of any amounts drawn at rates ranging from 0.5% to 2.0%.
BALANCE SHEET
| DECEMBER 31, 2019 | CHANGE | |||||||||||||||
($ MILLIONS EXCEPT PER SHARE AMOUNTS) | 2019 | 2018 | 2017 | 2018 TO 2019 | ||||||||||||
Inventory | 321 | 468 | 950 | (31 | )% | |||||||||||
Total assets | 7,427 | 8,019 | 7,779 | (7 | )% | |||||||||||
Long-term financial liabilities | 2,099 | 2,102 | 2,448 | — | ||||||||||||
Dividends per common share | 0.08 | 0.08 | 0.40 | — | ||||||||||||
Total product inventories decreased by 31% to $321 million this year due to higher sales volumes than the quantities produced and purchased during the year. At December 31, 2019, our average cost for uranium was $33.41 per pound, up from $32.62 per pound at December 31, 2018. As of December 31, 2019, we held an inventory of 6.1 million pounds of U3O8 equivalent (excluding broken ore).
At the end of 2019, our total assets amounted to $7.4 billion, a decrease of $0.6 billion compared to 2018, due to a decrease in cash and investment balances resulting from the repayment of long term debt, offset by strong cash flow from operations. In addition, lower inventories, the repayment of our loan to JV Inkai and ongoing depreciation on our property plant and equipment impacted our total assets. In 2018, the total asset balance increased by $0.2 billion compared to 2017, primarily due to an increase in cash and investment balances.
The major components of long-term financial liabilities are long-term debt, the provision for reclamation, deferred sales and financial derivatives.
| MANAGEMENT’S DISCUSSION AND ANALYSIS | 45 |
2019 financial results by segment
Uranium
HIGHLIGHTS | 2019 | 2018 | CHANGE | |||||||||||||
Production volume (million lbs) | 9.0 | 9.2 | (2 | )% | ||||||||||||
Sales volume (million lbs) | 31.5 | 35.1 | (10 | )% | ||||||||||||
Average spot price | ($ | US/lb | ) | 25.64 | 24.59 | 4 | % | |||||||||
Average long-term price | ($ | US/lb | ) | 31.75 | 30.38 | 5 | % | |||||||||
Average realized price | ($ | US/lb | ) | 33.77 | 37.01 | (9 | )% | |||||||||
| ($ | Cdn/lb | ) | 44.85 | 47.96 | (6 | )% | ||||||||||
Average unit cost of sales (including D&A) | ($ | Cdn/lb | ) | 39.99 | 40.33 | (1 | )% | |||||||||
Revenue ($ millions) | 1,414 | 1,684 | (16 | )% | ||||||||||||
Gross profit ($ millions) | 153 | 268 | (43 | )% | ||||||||||||
Gross profit (%) | 11 | 16 | (31 | )% | ||||||||||||
Production volumes in 2019 decreased by 2% compared to 2018. SeeUranium – production overview on page 59 for more information.
Uranium revenues this year were down 16% compared to 2018 due to a decrease in sales volumes of 10% and a decrease of 6% in the Canadian dollar average realized price. Although the spot price for uranium averaged $25.64 (US) per pound in 2019, an increase of 4% compared to the 2018 average price of $24.59 (US) per pound, the average realized price decreased due to a lower proportion of sales from higher priced fixed-price contracts and lower prices on market-related contracts due to a change in the protection from floor prices compared to 2018 partially offset by the weakening of the Canadian dollar compared to the prior year.
Total cost of sales (including D&A) decreased by 11% ($1.26 billion compared to $1.42 billion in 2018) mainly due to a decrease in sales volume of 10%.
The net effect was a $115 million decrease in gross profit for the year.
The following table shows the costs of produced and purchased uranium incurred in the reporting periods(non-IFRS measures, see below). These costs do not include care and maintenance costs, selling costs such as royalties, transportation and commissions, nor do they reflect the impact of opening inventories on our reported cost of sales.
($CDN/LB) | 2019 | 2018 | CHANGE | |||||||||
Produced | ||||||||||||
Cash cost | 15.70 | 15.31 | 3 | % | ||||||||
Non-cash cost | 16.09 | 15.90 | 1 | % | ||||||||
|
|
|
|
|
| |||||||
Total production cost1 | 31.79 | 31.21 | 2 | % | ||||||||
|
|
|
|
|
| |||||||
Quantity produced (million lbs)1 | 9.0 | 9.2 | (2 | )% | ||||||||
|
|
|
|
|
| |||||||
Purchased | ||||||||||||
Cash cost1 | 35.26 | 36.01 | (2 | )% | ||||||||
|
|
|
|
|
| |||||||
Quantity purchased (million lbs)1 | 19.0 | 14.0 | 36 | % | ||||||||
|
|
|
|
|
| |||||||
Totals | ||||||||||||
Produced and purchased costs | 34.14 | 34.11 | 0 | % | ||||||||
|
|
|
|
|
| |||||||
Quantities produced and purchased (million lbs) | 28.0 | 23.2 | 21 | % | ||||||||
|
|
|
|
|
| |||||||
| 1 | Our share of Inkai production was 3.3 million pounds for 2019 (2018 - 2.9 million pounds). Due to equity accounting, our share of production is shown as a purchase at the time of delivery. JV Inkai purchases will fluctuate during the quarters and timing of purchases will not match production. In 2019 we purchased 3.5 million pounds at a purchase price per pound of $32.43 ($24.37 (US)). |
The average cash cost of production was 3% higher in the year than in 2018. While McArthur River and Key Lake are shut down, our annual cash cost of production is expected to reflect the estimatedlife-of-mine operating cost, between $15 and $16 per pound, of mining and milling our share of Cigar Lake mineral reserves, but it may fluctuate fromquarter-to-quarter.
The benefit of the estimatedlife-of-mine operating cost for Inkai’s production of between $8 and $9 per pound, is expected to be reflected in the line item on our statement of earnings called “share of earnings from equity-accounted investee”.
| 46 | CAMECO CORPORATION |
Although purchased pounds are transacted in US dollars, we account for the purchases in Canadian dollars. In the year, the average cash cost of purchased material was $35.26 (Cdn), or $26.49 (US) per pound, compared to $36.01 (Cdn), or $27.68 (US) per pound in the same period in 2018.
Cash cost per pound,non-cash cost per pound and total cost per pound for produced and purchased uranium presented in the above table arenon-IFRS measures. These measures do not have a standardized meaning or a consistent basis of calculation under IFRS. We use these measures in our assessment of the performance of our uranium business. We believe that, in addition to conventional measures prepared in accordance with IFRS, certain investors use this information to evaluate our performance and ability to generate cash flow.
These measures arenon-standard supplemental information and should not be considered in isolation or as a substitute for measures of performance prepared according to accounting standards. These measures are not necessarily indicative of operating profit or cash flow from operations as determined under IFRS. Other companies may calculate these measures differently, so you may not be able to make a direct comparison to similar measures presented by other companies.
To facilitate a better understanding of these measures, the following table presents a reconciliation of these measures to our unit cost of sales for the years ended 2019 and 2018 as reported in our financial statements.
CASH AND TOTAL COST PER POUND RECONCILIATION
($ MILLIONS) | 2019 | 2018 | ||||||
Cost of product sold | 1,041.9 | 1,138.9 | ||||||
Add / (subtract) | ||||||||
Royalties | (32.5 | ) | (39.1 | ) | ||||
Other selling costs | (10.5 | ) | (12.6 | ) | ||||
Care and maintenance and severance costs | (109.5 | ) | (168.3 | ) | ||||
Change in inventories | (78.2 | ) | (273.9 | ) | ||||
|
|
|
| |||||
Cash operating costs (a) | 811.2 | 645.0 | ||||||
Add / (subtract) | ||||||||
Depreciation and amortization | 218.8 | 277.2 | ||||||
Care and maintenance costs | (44.4 | ) | (44.2 | ) | ||||
Change in inventories | (29.6 | ) | (86.7 | ) | ||||
|
|
|
| |||||
Total operating costs (b) | 956.0 | 791.3 | ||||||
|
|
|
| |||||
Uranium produced & purchased (million lbs) (c) | 28.0 | 23.2 | ||||||
|
|
|
| |||||
Cash costs per pound (a ÷ c) | 28.97 | 27.80 | ||||||
Total costs per pound (b ÷ c) | 34.14 | 34.11 | ||||||
|
|
|
| |||||
| MANAGEMENT’S DISCUSSION AND ANALYSIS | 47 |
ROYALTIES
We pay royalties on the sale of all uranium extracted at our mines in the province of Saskatchewan. Two types of royalties are paid:
| • | Basic royalty: calculated as 5% of gross sales of uranium, less the Saskatchewan resource credit of 0.75%. |
| • | Profit royalty: a 10% royalty is charged on profit up to and including $23.76/kg U3O8 ($10.78/lb) and a 15% royalty is charged on profit in excess of $23.76/kg U3O8. Profit is determined as revenue less certain operating, exploration, reclamation and capital costs. Both exploration and capital costs are deductible at the discretion of the producer. |
As a resource corporation in Saskatchewan, we also pay a corporate resource surcharge of 3% of the value of resource sales.
URANIUM SEGMENT OUTLOOK
In July 2018 we announced the extension of the suspension of production at the McArthur River/Key Lake operation for an indeterminate duration and therefore, we expect to produce 9 million pounds in 2020. In addition, we expect to purchase between 20 million and 22 million pounds in 2020 to meet our sales commitments and achieve our desired inventory level. This includes our spot market purchases and other purchase commitments, including from JV Inkai and the purchase of NUKEM’s excess inventory. We anticipate an average purchase price of $31.40 per pound for our planned purchases, based on the uranium price and foreign exchange rate assumptions used in our outlook table on page 38.
Based on the contracts we have in place, and not including sales between our segments, we expect to deliver between 28 million and 30 million pounds of U3O8 in 2020. We expect the unit cost of sales to be between $38.50 per pound and $40.50 per pound, about the same as in 2019. The required spot market purchases and any additional discretionary purchases we may make in 2020 are subject to market prices throughout the year. If they are at a cost different than the assumptions noted, then we expect the overall unit cost of sales to be affected, as well as our revenue.
We expect revenue to be between $1,120 million to $1,210 million, lower than in 2019 as a result of a lower expected average realized price and lower sales volumes.
Fuel services
| (includes results for UF6, UO2, UO3 and fuel fabrication) | ||||||||||||||||
HIGHLIGHTS | 2019 | 2018 | CHANGE | |||||||||||||
Production volume (million kgU) | 13.3 | 10.5 | 27 | % | ||||||||||||
Sales volume (million kgU) | 14.1 | 11.6 | 22 | % | ||||||||||||
Average realized price | ($ | Cdn/kgU | ) | 26.21 | 26.78 | (2 | )% | |||||||||
Average unit cost of sales (including D&A) | ($ | Cdn/kgU | ) | 19.84 | 21.86 | (9 | )% | |||||||||
Revenue ($ millions) | 370 | 313 | 18 | % | ||||||||||||
Gross profit ($ millions) | 90 | 59 | 53 | % | ||||||||||||
Gross profit (%) | 24 | 19 | 26 | % | ||||||||||||
Total revenue increased by 18% from 2018 due to a 22% increase in sales volume that was partially offset by a 2% decrease in the realized price.
Total cost of products and services sold (including D&A) increased by 10% ($280 compared to $255 in 2018), due to the 22% increase in sales volume, partially offset by a 9% decrease in average unit cost of sales compared to 2018.
The net effect was a $31 million increase in gross profit.
FUEL SERVICES OUTLOOK
In 2020, we plan to produce 13 million to 14 million kgU, and we expect sales volumes, not including intersegment sales, to be 12 million to 13 million kgU. Overall revenue is expected to be between $340 million and $370 million, slightly lower than 2019 due to lower committed sales volumes. We expect the average unit cost of sales (including D&A) to be between $19.70/kgU and $20.70/kgU.
| 48 | CAMECO CORPORATION |
Fourth quarter financial results
Consolidated results
| THREE MONTHS ENDED | ||||||||||||
| HIGHLIGHTS | DECEMBER 31 | |||||||||||
($ MILLIONS EXCEPT WHERE INDICATED) | 2019 | 2018 | CHANGE | |||||||||
Revenue | 874 | 831 | 5 | % | ||||||||
Gross profit | 184 | 207 | (11 | )% | ||||||||
Net earnings attributable to equity holders | 128 | 160 | (20 | )% | ||||||||
$ per common share (basic) | 0.32 | 0.40 | (20 | )% | ||||||||
$ per common share (diluted) | 0.32 | 0.40 | (20 | )% | ||||||||
Adjusted net earnings(non-IFRS, see page 28) | 94 | 202 | (53 | )% | ||||||||
$ per common share (adjusted and diluted) | 0.24 | 0.51 | (53 | )% | ||||||||
Cash provided by operations (after working capital changes) | 274 | 57 | >100 | % | ||||||||
NET EARNINGS
The following table shows what contributed to the change in net earnings and adjusted net earnings(non-IFRS measure, see page 28) in the fourth quarter of 2019 compared to the same period in 2018.
($ MILLIONS) | IFRS | ADJUSTED | ||||||||
Net earnings - 2018 | 160 | 202 | ||||||||
Change in gross profit by segment | ||||||||||
| (we calculate gross profit by deducting from revenue the cost of products and services sold, and depreciation and amortization (D&A), net of hedging benefits) |
| |||||||||
Uranium | Higher sales volume | 20 | 20 | |||||||
Lower realized prices ($US) | (84 | ) | (84 | ) | ||||||
Foreign exchange impact on realized prices | 6 | 6 | ||||||||
Lower costs | 15 | 15 | ||||||||
|
|
|
| |||||||
change – uranium | (43 | ) | (43 | ) | ||||||
|
|
|
| |||||||
Fuel services | Higher sales volume | 5 | 5 | |||||||
Higher realized prices ($Cdn) | 5 | 5 | ||||||||
Lower costs | 11 | 11 | ||||||||
|
|
|
| |||||||
change – fuel services | 21 | 21 | ||||||||
|
|
|
| |||||||
Other changes | ||||||||||
Lower administration expenditures | 2 | 2 | ||||||||
Lower exploration expenditures | 1 | 1 | ||||||||
Change in reclamation provisions | 36 | — | ||||||||
Change in gains or losses on derivatives | 64 | (1 | ) | |||||||
Change in foreign exchange gains or losses | (25 | ) | (25 | ) | ||||||
Change in earnings from equity-accounted investments | 7 | 7 | ||||||||
Gain on sale of interest in Wheeler River Joint Venture in 2018 | (17 | ) | (17 | ) | ||||||
Change in income tax recovery or expense | (69 | ) | (44 | ) | ||||||
Other | (9 | ) | (9 | ) | ||||||
|
|
|
| |||||||
Net earnings - 2019 | 128 | 94 | ||||||||
|
|
|
| |||||||
| MANAGEMENT’S DISCUSSION AND ANALYSIS | 49 |
ADJUSTED NET EARNINGS
We use adjusted net earnings, anon-IFRS measure, as a more meaningful way to compare our financial performance from period to period. See page 28 for more information. The following table reconciles adjusted net earnings with our net earnings.
| THREE MONTHS ENDED | ||||||||
| DECEMBER 31 | ||||||||
($ MILLIONS) | 2019 | 2018 | ||||||
Net earnings attributable to equity holders | 128 | 160 | ||||||
|
|
|
| |||||
Adjustments | ||||||||
Adjustments on derivatives | (18 | ) | 47 | |||||
Reclamation provision adjustments | (26 | ) | 10 | |||||
Income taxes on adjustments | 10 | (15 | ) | |||||
|
|
|
| |||||
Adjusted net earnings | 94 | 202 | ||||||
|
|
|
| |||||
Every quarter we are required to update the reclamation provisions for all operations based on new cash flow estimates, discount and inflation rates. This normally results in an adjustment to an asset retirement obligation asset in addition to the provision balance. When the assets of an operation have been written off due to an impairment, as is the case with our Rabbit Lake and US ISR operations, the adjustment is recorded directly to the statement of earnings as “other operating expense (income)”. See note 15 of our annual financial statements for more information. This amount has been excluded from our adjusted net earnings measure.
ADMINISTRATION
| THREE MONTHS ENDED | ||||||||||||
| DECEMBER 31 | ||||||||||||
($ MILLIONS) | 2019 | 2018 | CHANGE | |||||||||
Direct administration | 32 | 33 | (3 | )% | ||||||||
Stock-based compensation | 2 | 3 | (33 | )% | ||||||||
|
|
|
|
|
| |||||||
Total administration | 34 | 36 | (6 | )% | ||||||||
|
|
|
|
|
| |||||||
Direct administration costs were $32 million in the quarter, $1 million lower than the same period last year. Stock-based compensation expenses were $1 million lower from the fourth quarter of 2018. See note 24 to the financial statements.
Quarterly trends
| HIGHLIGHTS | 2019 | 2018 | ||||||||||||||||||||||||||||||
($ MILLIONS EXCEPT PER SHARE AMOUNTS) | Q4 | Q3 | Q2 | Q1 | Q4 | Q3 | Q2 | Q1 | ||||||||||||||||||||||||
Revenue | 874 | 303 | 388 | 298 | 831 | 488 | 333 | 439 | ||||||||||||||||||||||||
Net earnings (loss) attributable to equity holders | 128 | (13 | ) | (23 | ) | (18 | ) | 160 | 28 | (76 | ) | 55 | ||||||||||||||||||||
$ per common share (basic) | 0.32 | (0.03 | ) | (0.06 | ) | (0.05 | ) | 0.40 | 0.07 | (0.19 | ) | 0.14 | ||||||||||||||||||||
$ per common share (diluted) | 0.32 | (0.03 | ) | (0.06 | ) | (0.05 | ) | 0.40 | 0.07 | (0.19 | ) | 0.14 | ||||||||||||||||||||
Adjusted net earnings (loss)(non-IFRS, see page 28) | 94 | (2 | ) | (18 | ) | (33 | ) | 202 | 15 | (28 | ) | 23 | ||||||||||||||||||||
$ per common share (adjusted and diluted) | 0.24 | (0.01 | ) | (0.04 | ) | (0.08 | ) | 0.51 | 0.04 | (0.07 | ) | 0.06 | ||||||||||||||||||||
Cash provided by (used in) operations (after working capital changes) | 274 | 232 | (59 | ) | 80 | 57 | 278 | 57 | 275 | |||||||||||||||||||||||
Key things to note:
| • | Our financial results are strongly influenced by the performance of our uranium segment, which accounted for 76% of consolidated revenues in the fourth quarter of 2019 and 81% of consolidated revenues in the fourth quarter of 2018. |
| • | The timing of customer requirements, which tends to vary from quarter to quarter, drives revenue in the uranium and fuel services segments. |
| • | Net earnings do not trend directly with revenue due to unusual items and transactions that occur from time to time. We use adjusted net earnings, anon-IFRS measure, as a more meaningful way to compare our results from period to period (see page 28 for more information). |
| 50 | CAMECO CORPORATION |
| • | Cash from operations tends to fluctuate as a result of the timing of deliveries and product purchases in our uranium and fuel services segments. |
| • | Quarterly results are not necessarily a good indication of annual results due to the variability in customer requirements noted above. |
The table that follows presents the differences between net earnings and adjusted net earnings for the previous seven quarters.
HIGHLIGHTS | 2019 | 2018 | ||||||||||||||||||||||||||||||
($ MILLIONS EXCEPT PER SHARE AMOUNTS) | Q4 | Q3 | Q2 | Q1 | Q4 | Q3 | Q2 | Q1 | ||||||||||||||||||||||||
Net earnings (loss) attributable to equity holders | 128 | (13 | ) | (23 | ) | (18 | ) | 160 | 28 | (76 | ) | 55 | ||||||||||||||||||||
|
|
|
|
|
|
|
|
|
|
|
|
|
|
|
| |||||||||||||||||
Adjustments | ||||||||||||||||||||||||||||||||
Adjustments on derivatives | (18 | ) | 9 | (17 | ) | (23 | ) | 47 | (24 | ) | 20 | 22 | ||||||||||||||||||||
Reclamation provision adjustments | (26 | ) | 3 | 24 | 2 | 10 | 5 | 44 | 1 | |||||||||||||||||||||||
Gain on restructuring of JV Inkai | — | — | — | — | — | — | — | (49 | ) | |||||||||||||||||||||||
Income taxes on adjustments | 10 | (1 | ) | (2 | ) | 6 | (15 | ) | 6 | (16 | ) | (6 | ) | |||||||||||||||||||
|
|
|
|
|
|
|
|
|
|
|
|
|
|
|
| |||||||||||||||||
Adjusted net earnings (losses)(non-IFRS, see page 28) | 94 | (2 | ) | (18 | ) | (33 | ) | 202 | 15 | (28 | ) | 23 | ||||||||||||||||||||
|
|
|
|
|
|
|
|
|
|
|
|
|
|
|
| |||||||||||||||||
| MANAGEMENT’S DISCUSSION AND ANALYSIS | 51 |
Fourth quarter financial results by segment
Uranium
| THREE MONTHS ENDED | ||||||||||||||
| DECEMBER 31 | ||||||||||||||
HIGHLIGHTS | 2019 | 2018 | CHANGE | |||||||||||
Production volume (million lbs) | 2.7 | 2.4 | 13 | % | ||||||||||
Sales volume (million lbs) | 14.0 | 12.6 | 11 | % | ||||||||||
Average spot price | ($US/lb) | 25.08 | 28.27 | (11 | )% | |||||||||
Average long-term price | ($US/lb) | 32.17 | 31.50 | 2 | % | |||||||||
Average realized price | ($US/lb) | 35.92 | 40.50 | (11 | )% | |||||||||
| ($Cdn/lb) | 47.50 | 53.11 | (11 | )% | ||||||||||
Average unit cost of sales (including D&A) | ($Cdn/lb) | 37.80 | 38.89 | (3 | )% | |||||||||
Revenue ($ millions) | 666 | 670 | (1 | )% | ||||||||||
Gross profit ($ millions) | 136 | 179 | (24 | )% | ||||||||||
Gross profit (%) | 20 | 27 | (26 | )% | ||||||||||
Production volumes this quarter were 13% higher compared to the fourth quarter of 2018. SeeUranium – production overview on page 59 for more information.
Uranium revenues were down 1% due to an 11% decrease in the Canadian dollar average realized price offset by an 11% increase in sales volume. The US dollar average realized price decreased by 11% compared to 2018. Average realized price decreased due to a lower proportion of sales from higher priced fixed-price contracts compared to the same period in 2018 and lower prices on both fixed and market-related contracts. The Canadian dollar was slightly weaker compared to the same period last year, $1.00 (US) for $1.32 (Cdn) compared to $1.00 (US) for $1.31 (Cdn) in the fourth quarter of 2018.
Total cost of sales (including D&A) increased by 9% ($519 million compared to $477 million in 2018). This was primarily the result of the 11% increase in sales volume as the average unit cost of sales decreased by 3%.
The net effect was a $43 million decrease in gross profit for the quarter.
The following table shows the costs of produced and purchased uranium incurred in the reporting periods (which arenon-IFRS measures, see the paragraphs below the table). These costs do not include care and maintenance costs, selling costs such as royalties, transportation and commissions, nor do they reflect the impact of opening inventories on our reported cost of sales.
| THREE MONTHS ENDED | ||||||||||||
| DECEMBER 31 | ||||||||||||
($CDN/LB) | 2019 | 2018 | CHANGE | |||||||||
Produced | ||||||||||||
Cash cost | 17.21 | 14.91 | 15 | % | ||||||||
Non-cash cost | 15.54 | 15.07 | 3 | % | ||||||||
Total production cost1 | 32.75 | 29.98 | 9 | % | ||||||||
Quantity produced (million lbs)1 | 2.7 | 2.4 | 13 | % | ||||||||
Purchased | ||||||||||||
Cash cost1 | 34.17 | 38.13 | (10 | )% | ||||||||
|
|
|
|
|
| |||||||
Quantity purchased (million lbs)1 | 4.3 | 7.3 | (41 | )% | ||||||||
|
|
|
|
|
| |||||||
Totals | ||||||||||||
Produced and purchased costs | 33.62 | 36.11 | (7 | )% | ||||||||
|
|
|
|
|
| |||||||
Quantities produced and purchased (million lbs) | 7.0 | 9.7 | (28 | )% | ||||||||
|
|
|
|
|
| |||||||
| 1 | Our share of Inkai production was 0.9 million pounds for Q4, 2019. Due to equity accounting, our share of production will be shown as a purchase at the time of delivery. JV Inkai purchases will fluctuate during the quarters and timing of purchases will not match production. During the quarter, we purchased 1.4 million pounds at a purchase price per pound of $32.18 ($24.40 (US)). |
| 52 | CAMECO CORPORATION |
The average cash cost of production was 15% higher for the quarter than in the comparable period in 2018. While McArthur River and Key Lake are shut down, our annual cash cost of production is expected to reflect the estimatedlife-of-mine operating cost, between $15 and $16 per pound, of mining and milling our share of Cigar Lake mineral reserves, but it may fluctuate fromquarter-to-quarter.
The benefit of the estimatedlife-of-mine operating cost for Inkai’s production of between $8 and $9 per pound, is expected to be reflected in the line item on our statement of earnings called “share of earnings from equity-accounted investee”.
Although purchased pounds are transacted in US dollars, we account for the purchases in Canadian dollars. In the fourth quarter, the average cash cost of purchased material was $34.17 (Cdn) per pound, or $25.87 (US) per pound in US dollar terms, compared to $38.13 (Cdn) per pound, or $29.08 (US) per pound in the fourth quarter of 2018.
Cash cost per pound,non-cash cost per pound and total cost per pound for produced and purchased uranium presented in the above table arenon-IFRS measures. These measures do not have a standardized meaning or a consistent basis of calculation under IFRS. We use these measures in our assessment of the performance of our uranium business. We believe that, in addition to conventional measures prepared in accordance with IFRS, certain investors use this information to evaluate our performance and ability to generate cash flow.
These measures arenon-standard supplemental information and should not be considered in isolation or as a substitute for measures of performance prepared according to accounting standards. These measures are not necessarily indicative of operating profit or cash flow from operations as determined under IFRS. Other companies may calculate these measures differently, so you may not be able to make a direct comparison to similar measures presented by other companies.
To facilitate a better understanding of these measures, the following table presents a reconciliation of these measures to our unit cost of sales for the fourth quarters of 2019 and 2018.
CASH AND TOTAL COST PER POUND RECONCILIATION
| THREE MONTHS ENDED | ||||||||
| DECEMBER 31 | ||||||||
($ MILLIONS) | 2019 | 2018 | ||||||
Cost of product sold | 442.8 | 409.2 | ||||||
Add / (subtract) | ||||||||
Royalties | (14.3 | ) | (2.6 | ) | ||||
Other selling costs | (4.4 | ) | (4.4 | ) | ||||
Care and maintenance and severance costs | (29.7 | ) | (38.6 | ) | ||||
Change in inventories | (201.0 | ) | (49.5 | ) | ||||
|
|
|
| |||||
Cash operating costs (a) | 193.4 | 314.1 | ||||||
Add / (subtract) | ||||||||
Depreciation and amortization | 87.4 | 81.1 | ||||||
Care and maintenance costs | (11.5 | ) | (13.4 | ) | ||||
Change in inventories | (33.9 | ) | (31.5 | ) | ||||
|
|
|
| |||||
Total operating costs (b) | 235.4 | 350.3 | ||||||
|
|
|
| |||||
Uranium produced & purchased (million lbs) (c) | 7.0 | 9.7 | ||||||
|
|
|
| |||||
Cash costs per pound (a ÷ c) | 27.63 | 32.38 | ||||||
Total costs per pound (b ÷ c) | 33.62 | 36.11 | ||||||
|
|
|
| |||||
| MANAGEMENT’S DISCUSSION AND ANALYSIS | 53 |
Fuel services
(includes results for UF6, UO2, UO3 and fuel fabrication)
| THREE MONTHS ENDED | ||||||||||||||||
| DECEMBER 31 | ||||||||||||||||
HIGHLIGHTS | 2019 | 2018 | CHANGE | |||||||||||||
Production volume (million kgU) | 4.0 | 3.5 | 14 | % | ||||||||||||
Sales volume (million kgU) | 6.2 | 5.1 | 22 | % | ||||||||||||
Average realized price | ($Cdn/kgU) | 24.61 | 23.56 | 4 | % | |||||||||||
Average unit cost of sales (including D&A) | ($Cdn/kgU) | 17.11 | 18.76 | (9 | )% | |||||||||||
Revenue ($ millions) | 152 | 120 | 27 | % | ||||||||||||
Gross profit ($ millions) | 47 | 24 | 96 | % | ||||||||||||
Gross profit (%) | 31 | 20 | 55 | % | ||||||||||||
Total revenue increased by 27% due to a 22% increase in sales volumes and a 4% increase in average realized price. The increase in average realized price was due to higher realized prices for all product lines.
Total cost of sales (including D&A) increased by 12% to $106 million compared to the fourth quarter of 2018 due to the 22% increase in sales volumes partially offset by a decrease of 9% in the average unit cost of sales, primarily as a result lower costs for UF6 due to higher production rates.
The net effect was a $23 million increase in gross profit.
| 54 | CAMECO CORPORATION |
Operations and projects
This section of our MD&A is an overview of the mining properties we operate or have an interest in, our curtailed operations and our projects, what we accomplished this year, our plans for the future and how we manage risk.
| 56 | MANAGING THE RISKS | |||
| 59 | URANIUM – PRODUCTION OVERVIEW | |||
| 59 | PRODUCTION OUTLOOK | |||
| 60 | URANIUM –TIER-ONE OPERATIONS | |||
| 60 | MCARTHUR RIVER MINE / KEY LAKE MILL | |||
| 64 | CIGAR LAKE | |||
| 68 | INKAI | |||
| 71 | URANIUM –TIER-TWO OPERATIONS | |||
| 71 | RABBIT LAKE | |||
| 72 | US ISR | |||
| 73 | URANIUM – ADVANCED PROJECTS | |||
| 73 | MILLENNIUM | |||
| 73 | YEELIRRIE | |||
| 73 | KINTYRE | |||
| 74 | URANIUM – EXPLORATION AND CORPORATE DEVELOPMENT | |||
| 75 | FUEL SERVICES | |||
| 75 | BLIND RIVER REFINERY | |||
| 76 | PORT HOPE CONVERSION SERVICES | |||
| 76 | CAMECO FUEL MANUFACTURING INC. (CFM) | |||
| MANAGEMENT’S DISCUSSION AND ANALYSIS | 55 |
Managing the risks
The nature of our operations means we face many potential risks and hazards that could have a significant impact on our business. Our risk policy and program involves a broad, systematic approach to identifying, assessing, reporting and managing the significant risks we face in our business and operations, including ESG risks. The policy establishes clear accountabilities for enterprise risk management. We use a common risk matrix throughout the company and consider any risk that has the potential to significantly affect our ability to achieve our corporate objectives or strategic plan as an enterprise risk. However, there is no assurance we will be successful in preventing the harm any of these risks and hazards could cause. We recommend you read our most recent management proxy circular for more information about our risk oversight.
Below we list the risks that generally apply to all of our operations and advanced projects. We also talk about how we manage specific risks in each operation or project update. These risks could have a material impact on our business in the near term.
We recommend you also review our annual information form, which includes a discussion of other material risks that could have an impact on our business.
Regulatory risks
A significant part of our economic value depends on our ability to:
| • | obtain and renew the licences and other approvals we need to operate, to increase production at our mines and to develop new mines. If we do not receive the regulatory approvals we need, or do not receive them at the right time, then we may have to delay, modify or cancel a project, which could increase our costs and delay or prevent us from generating revenue from the project. Regulatory review, including the review of environmental matters, is a long and complex process. |
| • | comply with the conditions in these licences and approvals. Our right to continue operating facilities, increase production at our mines and develop new mines depends on our compliance with these conditions. |
| • | comply with the extensive and complex laws and regulations that govern our activities. Environmental legislation imposes strict standards and controls on almost every aspect of our operations and projects, and is not only introducing new requirements, but also becoming more stringent. For example: |
| • | we must complete the environmental assessment process before we can begin developing a new mine or make any significant change to our operations |
| • | we may need regulatory approval to make changes to our operational processes, which can take a significant amount of time because it may require an extensive review of supporting technical information. The complexity of this process can be further compounded when regulatory approvals are required from multiple agencies. |
| • | the federal government has recently introduced a new Impact Assessment Act as well as a Canadian Navigable Waters Act along with significant revisions to the federal Fisheries Act. This new legislation will impact the scope and timeliness of approvals for projects and the revisions could impact existing operations. |
| • | Environment and Climate Change Canada has brought forward an amended national recovery plan for woodland caribou that has the potential to impact economic and social development in northern Saskatchewan. Research completed in northern Saskatchewan has resulted in a report indicating the range in which our northern Saskatchewan operations are located, hosts a secure and self-sustaining population of woodland caribou, perhaps one of the most secure boreal caribou populations in Canada. The population status was incorporated by Environment and Climate Change Canada into the amended national recovery plan; however, potential habitat protection measures could still have an impact on our Saskatchewan operations and advanced projects. |
We use significant management and financial resources to manage our regulatory risks.
Environmental risks
We have the safety, health and environmental risks associated with any mining and chemical processing company. Our uranium and fuel services segments also face unique risks associated with radiation.
| 56 | CAMECO CORPORATION |
Laws to protect the environment are becoming more stringent for members of the nuclear energy industry, including mining, milling and processing facilities, and have inter-jurisdictional aspects (both federal and provincial/state regimes are applicable). Once we have permanently stopped mining and processing activities at an operating site, we are required to decommission the site to the satisfaction of the regulators. We have developed preliminary decommissioning plans for our operating sites and use them to estimate our decommissioning costs. Regulators review and accept our preliminary decommissioning plans on a regular basis. As the site approaches or goes into decommissioning, regulators review the detailed decommissioning plans. This can result in further regulatory process, as well as additional requirements, costs and financial assurances.
Currently, Cameco has submitted updates to all Saskatchewan operations’ Preliminary Decommissioning Plan (PDP) and Preliminary Decommissioning Cost Estimate (PDCE) documents in accordance with the five year timeline specified in the regulations. Upon acceptance of the final PDP and PDCE documents by the Saskatchewan Ministry of Environment and Canadian Nuclear Safety Commission (CNSC) staff, a formal Commission proceeding will be required for final approval of the PDP and PDCE by the Commission. We have received the required approvals for the revised PDP and the letters of credit have been updated for McArthur River. For Cigar Lake and Key Lake, the revised PDP has been reviewed and accepted by staff and we are awaiting Commission proceedings to formally approve them. The revised PDP for Rabbit Lake is still under review by CNSC staff.
At the end of 2019, our estimate of total decommissioning and reclamation costs was $1.13 billion. This is the undiscounted value of the obligation and is based on our current operations. We had accounting provisions of $1.05 billion at the end of 2019 (the present value of the $1.13 billion). Regulatory approval is required prior to beginning decommissioning. Since we expect to incur most of these expenditures at the end of the useful lives of the operations they relate to, and none of our assets have approval for decommissioning, our expected costs for decommissioning and reclamation for the next five years are not material.
We provide financial assurances for decommissioning and reclamation such as letters of credit or surety bonds to regulatory authorities, as required. We had a total of about $994 million in financial assurances supporting our reclamation liabilities at the end of 2019. All of our North American operations have financial assurances in place in connection with our preliminary plans for decommissioning of the sites.
Some of the sites we own or operate have been under ongoing investigation and/or remediation and planning as a result of historic soil and groundwater conditions.
We use significant management and financial resources to manage our environmental risks.
We manage environmental risks through our safety, health, environment and quality (SHEQ) management system. Our chief executive officer is responsible for ensuring that our SHEQ management system is implemented. Our board’s safety, health and environment committee also oversees how we manage our environmental risks.
In 2019, we invested:
| • | $73 million in environmental protection, monitoring and assessment programs, approximately 4% more than in 2018 |
| • | $18 million in health and safety programs, or 10% less than 2018 |
The increase in environmental expenditures in 2019 was largely due to expenditures related to the Vision in Motion projects, but also some spending on projects involving tailings and waste rock in northern Saskatchewan. The decrease in health and safety related expenditures were due to overall cost reductions across Cameco operations.
Spending on environmental and health and safety programs is expected to level off in 2020 as a result of the continued impacts of the decisions to transition Rabbit Lake into care and maintenance and to curtail production at the US operations, as well as the continued shutdown of the McArthur River and Key Lake operations for an indeterminate duration.
| MANAGEMENT’S DISCUSSION AND ANALYSIS | 57 |
Operational risks
Other operational risks and hazards include:
| • | environmental damage |
| • | industrial and transportation accidents |
| • | labour shortages, disputes or strikes |
| • | cost increases for labour, contracted or purchased materials, supplies and services |
| • | shortages of required materials, supplies and equipment |
| • | transportation and delivery disruptions |
| • | interruptions in the supply of electricity, water, and other utilities |
| • | equipment failures |
| • | non-compliance with laws and licences |
| • | catastrophic accidents |
| • | fires |
| • | blockades or other acts of social or political activism |
| • | natural phenomena, such as inclement weather conditions, floods and earthquakes |
| • | unusual, unexpected or adverse mining or geological conditions |
| • | underground floods |
| • | ground movement orcave-ins |
| • | tailings pipeline or dam failures |
| • | technological failure of mining methods |
| • | unanticipated consequences of our cost reduction strategies |
We have insurance to cover some of these risks and hazards, but not all of them, and not to the full amount of losses or liabilities that could potentially arise.
| 58 | CAMECO CORPORATION |
Uranium – production overview
Production in our uranium segment in the fourth quarter was 2.7 million pounds, 13% higher compared to the same period in 2018, while production for the year was 9.0 million pounds, 2% lower than in 2018. SeeUranium –Tier-one operationsstarting on page 60 for more information.
Uranium production
| THREE MONTHS ENDED | YEAR ENDED | |||||||||||||||||||||||
| CAMECO SHARE | DECEMBER 31 | DECEMBER 31 | ||||||||||||||||||||||
(MILLION LBS) | 2019 | 2018 | 2019 | 2018 | 2019 PLAN | 2020 PLAN | ||||||||||||||||||
McArthur River/Key Lake | — | — | — | 0.1 | — | — | 1 | |||||||||||||||||
Cigar Lake | 2.7 | 2.4 | 9.0 | 9.0 | 9.0 | 9.0 | ||||||||||||||||||
US ISR | — | — | — | 0.1 | — | — | 1 | |||||||||||||||||
|
|
|
|
|
|
|
|
|
|
|
| |||||||||||||
Total | 2.7 | 2.4 | 9.0 | 9.2 | 9.0 | 9.0 | ||||||||||||||||||
|
|
|
|
|
|
|
|
|
|
|
| |||||||||||||
| 1 | The McArthur River/Key Lake and Rabbit Lake operations are in a safe and sustainable state of care and maintenance, and we are no longer developing new wellfields at Crow Butte and Smith Ranch-Highland. Please seeUranium –Tier-one operationsbeginning on page 60 andUranium –Tier-two operations beginning on page 71 for more information. |
We expect total production from Inkai to be 8.3 million pounds in 2020 on a 100% basis. Due to equity accounting, our share of production is shown as a purchase.
Production Outlook
We remain focused on taking advantage of the long-term growth we see coming in our industry, while maintaining the ability to respond to market conditions as they evolve. Our strategy is to focus on ourtier-one assets and profitably produce at a pace aligned with market signals in order to preserve the value of those assets and increase long-term shareholder value, and to do that with an emphasis on safety, people and the environment.
Given today’s weak market conditions and to mitigate risk, we plan to:
| • | ensure we continue to operate safely |
| • | evaluate the optimal mix of production, inventory and purchases in order to retain the flexibility to deliver long-term value |
| • | focus on technology and its applications to improve efficiency, reduce costs and improve operational effectiveness across our operations, including the use of digital and automation technologies |
| MANAGEMENT’S DISCUSSION AND ANALYSIS | 59 |
Uranium –Tier-one operations
McArthur River mine / Key Lake mill
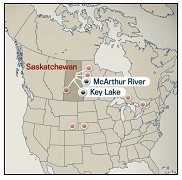 | 2019 Production (our share)
0.0M lbs
2020 Production Outlook (our share)
0.0M lbs
Estimated Reserves (our share)
273.6M lbs
Estimated Mine Life1
23 years |
| 1 | Estimated mine life based on the production schedule presented in the National Instrument43-101 Technical Report dated March 29, 2019. |
McArthur River is the world’s largest, high-grade uranium mine, and Key Lake is the world’s largest uranium mill.
Ore grades at the McArthur River mine are 100 times the world average, which means it can produce more than 18 million pounds per year by mining only 300 to 400 tonnes of ore per day. We are the operator of both the mine and mill.
In 2018, a decision was made to suspend production and place the mine and mill in care and maintenance, which will continue for an indeterminate duration.
McArthur River is considered a material uranium property for us. There is a technical report dated March 29, 2019 (effective December 31, 2018) that can be downloaded from SEDAR (sedar.com) or from EDGAR (sec.gov).
| Location | Saskatchewan, Canada | |||
| Ownership | McArthur River – 69.805% | |||
| Key Lake – 83.33% | ||||
| Mine type | Underground | |||
| Mining methods | Primary: blasthole stoping | |||
| Secondary: raiseboring | ||||
| End product | Uranium concentrate | |||
| Certification | ISO 14001 certified | |||
| Estimated reserves | 273.6 million pounds (proven and probable), average grade U3O8: 6.91% | |||
| Estimated resources | 6.7 million pounds (measured and indicated), average grade U3O8: 2.36% | |||
| 1.8 million pounds (inferred), average grade U3O8: 2.85% | ||||
| Licensed capacity | Mine and mill: 25.0 million pounds per year | |||
| Licence term | Through October, 2023 | |||
| Total packaged production: | 2000 to 2019 | 325.4 million pounds (McArthur River/Key Lake) (100% basis) | ||
| 1983 to 2002 | 209.8 million pounds (Key Lake) (100% basis) | |||
| 2019 production | 0 million pounds (0.0 million pounds on 100% basis) | |||
| 2020 production outlook | 0.0 million pounds (0.0 million pounds on 100% basis) | |||
| Estimated decommissioning cost1 | $42 million – McArthur River (100% basis) | |||
| $223 million – Key Lake (100% basis) | ||||
All values shown, including reserves and resources, represent our share only, unless indicated.
| 1 | The Key Lake estimate is currently under regulatory review. |
| 60 | CAMECO CORPORATION |
BACKGROUND
Mine description
The McArthur River reported mineral reserves are contained within seven zones: Zones 1, 2, 3, 4, 4 South, A and B. Prior to care and maintenance, there were two active mining zones and one where development was significantly advanced.
Zone 2 has been actively mined since production began in 1999. The ore zone was initially divided into three freeze panels. As the freeze wall was expanded, the inner connecting freeze walls were decommissioned in order to recover the inaccessible uranium around the active freeze pipes. Mining of zone 2 is almost complete. About 4.8 million pound of mineral reserves remain and we expect to recover them using a combination of raisebore and blasthole stope mining.
Zone 4 has been actively mined since 2010. The zone was divided into four freeze panels, and like in zone 2, as the freeze wall was expanded, the inner connecting freeze walls were decommissioned. Zone 4 has 117.5 million pounds of mineral reserves secured behind freeze walls and it will be the main source of production when mine production restarts. Raisebore mining and blasthole stoping will be used to recover the mineral reserves.
Zone 1 is the next planned mine area to be brought into production. Freezehole drilling was 90% complete and brine distribution construction was approximately 10% complete when work was suspended in 2018 as part of the production suspension. Work remaining before production can begin includes completion of the freezehole drilling, brine distribution construction, ground freezing and drill and extraction chamber development. Once complete, an additional 46.6 million pounds of mineral reserves will be secured behind freeze walls. Blasthole stope mining is currently planned as the main extraction method.
We have successfully extracted over 325 million pounds (100% basis) since we began mining in 1999.
Mining methods and techniques
The McArthur River deposit presents unique challenges that are not typical of traditional hard or soft rock mines. These challenges are the result of mining in or near high pressure ground water in challenging ground conditions with significant radiation concerns due to the high-grade uranium ore. Therefore, mine designs and mining methods are selected based on their ability to mitigate hydrological, radiological and geotechnical risks.
There are three approved mining methods at McArthur River: raisebore mining, blasthole stope mining and boxhole mining. However, only raisebore and blasthole stope mining remain in use. In addition, we use ground freezing to mine the McArthur River deposit.
Ground freezing
All the mineralized areas discovered to date at McArthur River are in, or partially in, water-bearing ground with significant pressure at mining depths. This high pressure water source is isolated from active development and production areas in order to reduce the inherent risk of an inflow. To date, McArthur River has relied on pressure grouting and ground freezing to successfully mitigate the risks of the high pressure ground water.
Chilled brine is circulated through freeze holes to form an impermeable freeze barrier around the area being mined. This prevents water from entering the mine, and helps stabilize weak rock formations.
Blasthole stoping
Our use of blasthole stoping began in 2011 and has expanded; the majority of ore extraction is now carried out using this method. It is planned in areas where blastholes can be accurately drilled and small stable stopes excavated without jeopardizing the freeze wall integrity. The use of this method has allowed the site to improve operating costs by increasing overall extraction efficiency by reducing underground development, concrete consumption, mineralized waste generation and improving extraction cycle time.
Raisebore mining
Raisebore mining is an innovativenon-entry approach that we adapted to meet the unique challenges at McArthur River, and it has been used since mining began in 1999. This method is favourable for mining the weaker rock mass areas of the deposit, and is suitable for massive high-grade zones where there is access both above and below the ore zone.
| MANAGEMENT’S DISCUSSION AND ANALYSIS | 61 |
Initial processing
McArthur River produces two product streams which are both shipped to the Key Lake mill to produce uranium ore concentrates. We carry out initial processing of two product streams at McArthur River: high-grade slurry andlow-grade mineralization. Both product streams are shipped to Key Lake mill to produce uranium ore concentrate.
High-grade slurry is pumped to surface and, after blending and further thickening it is transported to Key Lake in slurry trucks.
Thelow-grade mineralization is hoisted to surface and hauled to Key Lake, where it is mixed with water, ground, thickened and blended with the high-grade slurry to a nominal 5% U3O8 mill feed grade. It is then processed into uranium ore concentrates and packaged.
Tailings capacity
Based on the current licence conditions, tailings capacity at Key Lake is sufficient to mill all the known McArthur River mineral reserves and resources, should they be converted to reserves, with additional capacity to toll mill ore from other regional deposits.
Licensed annual production capacity
The McArthur River mine and Key Lake mill are both licensed to produce up to 25 million pounds (100% basis) per year. The current production capacity of the Key Lake mill is sufficient to process McArthur River mineral reserves at a production rate of 18 million pounds U3O8 per year.
2019 UPDATE
Production suspension
The facilities remained in a state of safe and sustainable care and maintenance throughout 2019.
Approximately 175 employees remain at the McArthur River and Key Lake sites. Care and maintenance activities include mine dewatering, water treatment, freeze wall maintenance, and environmental monitoring. In addition, preservation maintenance and monitoring of the critical facilities continues. Our objective is that the McArthur River and Key Lake operations are available to return to production in a timely manner once a decision is made to end the production suspension.
Exploration
As a result of the production suspension, there was no exploration activity in 2019.
Labour relations
We reached a new collective agreement with unionized employees at our McArthur River/Key Lake operations. The new agreement expires on December 31, 2022.
PLANNING FOR THE FUTURE
Production
Due to continued uranium price weakness, we have suspended production for an indeterminate duration. As a result of the suspension, and the time required to restart the mine and mill, we do not expect the operation to produce any uranium in 2020. Our share of the cash andnon-cash costs to maintain both operations during the suspension is expected to range between $8 million and $10 million per month. The increase in care and maintenance costs compared to 2019 is related to planned expenditures to fully assess our operating processes. SeeInnovation below.
Expansion potential
Once the market signals that new supply is needed and a decision is made to restart production, we will undertake the work necessary to optimize the capacity of both the McArthur River mine and Key Lake mill, up to a maximum of 25 million pounds per year (100% basis), the annual production licence limit. We expect that this paced approach will allow us to extract maximum value from the operation as the market transitions.
| 62 | CAMECO CORPORATION |
Innovation
While McArthur River/Key Lake is in a state of care and maintenance, we are taking the opportunity to fully assess our operating processes with the objective of enhancing the efficiency of these operations. Our goal is to streamline our processes and leverage digital and automation technologies to significantly reduce our future operating costs and increase operational flexibility when the time comes to restart. Any opportunities will be rigorously assessed before an investment decision is made.
MANAGING OUR RISKS
Production at McArthur River/Key Lake poses many challenges. These challenges include control of groundwater, weak rock formations, radiation protection, water inflow, mine area transitioning, regulatory approvals, surface and underground fires and other mining related challenges. Operational experience gained since the start of production has resulted in a significant reduction in risk.
Mine and mill restart
The operational changes we have made, including the suspension of production in 2018 for an indeterminate duration and the accompanying workforce reduction, carry with them the risks of a delay in restarting operations and subsequent production disruption.
There is increased uncertainty regarding the timing of a successful restart of the operations and the associated costs the longer the mine and mill are on care and maintenance.
Water inflow risk
Water inflows pose a significant risk to mine production. In 2003, a water inflow resulted in a three-month suspension of production. We also had a small water inflow in 2008 that did not impact production, but did cause significant development delays.
The consequences of another water inflow at McArthur River would depend on its magnitude, location and timing, but could include a significant interruption or reduction in production, a material increase in costs or a loss of mineral reserves.
We take significant steps and precautions to reduce the risk of inflows, but there is no guarantee that these will be successful. In the event that an inflow does occur, we believe we have sufficient pumping, water treatment and surface storage capacity to handle the estimated maximum sustained inflow.
We also manage the risks listed on pages 56 to 58.
| MANAGEMENT’S DISCUSSION AND ANALYSIS | 63 |
Uranium –Tier-one operations
Cigar Lake
 | 2019 Production (our share)
9.0M lbs 2020 Production Outlook (our share)
9.0M lbs Estimated Reserves (our share)
86.3M lbs Estimated Mine Life
2029 |
Cigar Lake is the world’s highest grade uranium mine, with grades that are 100 times the world average. We are a 50% owner and the mine operator. Cigar Lake uranium is milled at Orano’s (previously AREVA) McClean Lake mill.
Cigar Lake is considered a material uranium property for us. There is a technical report dated March 29, 2016 (effective December 31, 2015) that can be downloaded from SEDAR (sedar.com) or from EDGAR (sec.gov).
| Location | Saskatchewan, Canada | |
| Ownership | 50.025% | |
| Mine type | Underground | |
| Mining method | Jet boring system | |
| End product | Uranium concentrate | |
| Certification | ISO 14001 certified | |
| Estimated reserves | 86.3 million pounds (proven and probable), average grade U3O8: 14.69% | |
| Estimated resources | 50.8 million pounds (measured and indicated), average grade U3O8: 14.44% | |
| 11.9 million pounds (inferred), average grade U3O8: 5.92% | ||
| Licensed capacity | 18.0 million pounds per year (our share 9.0 million pounds per year) | |
| Licence term | Through June, 2021 | |
| Total packaged production: 2014 to 2019 | 82.9 million pounds (100% basis) | |
| 2019 production | 9.0 million pounds (18.0 million pounds on 100% basis) | |
| 2020 production outlook | 9.0 million pounds (18.0 million pounds on 100% basis) | |
| Estimated decommissioning cost1 | $62 million (100% basis) | |
All values shown, including reserves and resources, represent our share only, unless otherwise indicated.
| 1 | This updated estimate is currently under regulatory review. |
BACKGROUND
Development
We began developing the Cigar Lake underground mine in 2005, but development was delayed due to water inflows in 2006 and 2008. The underground workings were successfully remediated and secured in 2011 and, in October 2014 the McClean Lake mill produced the first uranium concentrate from ore mined at the Cigar Lake operation. Commercial production was declared in May 2015.
| 64 | CAMECO CORPORATION |
Mine description
Cigar Lake’s geological setting is similar to McArthur River’s: the permeable sandstone, which overlays the deposit and basement rocks, contains large volumes of water at significant pressure. However, unlike McArthur River, the Cigar Lake deposit has the shape of a flat- to cigar-shaped lens. As a result of these challenging geological conditions, we are unable to utilize traditional mining methods that require access above the ore, necessitating the development of anon-entry mining method specifically adapted for this deposit: the Jet Boring System (JBS).
Mine development is carried out uniquely in the basement rocks below the ore horizon. New mine development is required throughout the mine life to gain access to the ore above.
Mining method
Bulk ground freezing
The sandstone that overlays the deposit and basement rocks is water-bearing, and to prevent water from entering the mine, help stabilize weak rock formations, and meet our production schedule, we freeze the ground from surface. The ore zone and surrounding ground in the area to be mined must meet specific ground freezing requirements before we begin jet boring.
Jet boring system (JBS) mining
After many years of test mining, we selected jet boring, anon-entry mining method, which we have developed and adapted specifically for this deposit. This method involves:
| • | drilling a pilot hole into the frozen orebody, inserting a high pressure water jet and cutting a cavity out of the frozen ore |
| • | collecting the ore and water mixture (slurry) from the cavity and pumping it to storage (sump storage), allowing it to settle |
| • | using a clamshell, transporting the ore from sump storage to an underground grinding and processing circuit |
| • | once mining is complete, filling each cavity in the orebody with concrete |
| • | starting the process again with the next cavity |
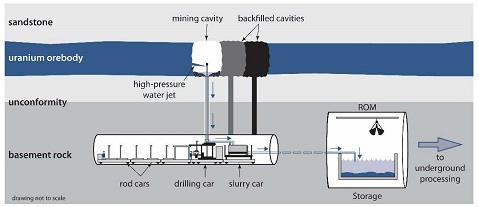
We have divided the orebody into production panels and at least three production panels need to be frozen at one time to achieve the full annual production rate of 18 million pounds. One JBS machine is located below each frozen panel. Three JBS machines are currently in operation. Two machines actively mine at any given time while the third is moving, setting up, or undergoing maintenance.
Initial processing
We carry out initial processing of the extracted ore at Cigar Lake:
| • | the underground circuit grinds the ore and mixes it with water to form a slurry |
| • | the slurry is pumped 500 metres to the surface and stored in one of two ore slurry holding tanks |
| • | it is blended and thickened, removing excess water |
| • | the final slurry, at an average grade of approximately 14% U3O8, is pumped into transport truck containers and shipped to McClean Lake mill on a 69 kilometreall-weather road |
Water from this process, including water from underground operations, is treated on the surface. Any excess treated water is released into the environment.
| MANAGEMENT’S DISCUSSION AND ANALYSIS | 65 |
Milling
All of Cigar Lake’s ore slurry is being processed at the McClean Lake mill, operated by Orano. Given the McClean Lake mill’s capacity, it is able to:
| • | operate at Cigar Lake’s targeted annual production level of 18.0 million pounds U3O8 |
| • | process and package all of Cigar Lake’s current mineral reserves |
Licensing annual production capacity
The Cigar Lake mine is licensed to produce up to 18 million pounds (100% basis) per year. Orano’s McClean Lake mill is licensed to produce 24 million pounds annually.
2019 UPDATE
Production
Total packaged production from Cigar Lake was 18.0 million pounds U3O8; our share was 9.0 million pounds, achieving our forecast.
During the year, we:
| • | completed and commissioned the freeze plant expansion project |
| • | implemented an extended summer shutdown, during which maintenance activities were completed as well as a capital upgrade to the mine exhaust fans |
| • | executed production activities from three production tunnels in the eastern part of the ore body |
| • | extended our surface brine distribution infrastructure and expanded our ground freezing program ensuring continued frozen ore inventory growth in alignment with our long-term production plans |
Underground development
In alignment with our production plans, underground mine development restarted in 2019. Development included focus on two new production panels in the eastern portion of the ore body along with initial access development towards the western portion. Development in these specific areas will continue in 2020 to ensure new production panels are available in alignment with long-term production plans.
Labour relations
Orano reached a new three-year collective agreement with unionized employees at the McClean Lake mill. The previous contract expired on May 31, 2019.
PLANNING FOR THE FUTURE
Production
In 2020, we expect to produce 18 million packaged pounds at Cigar Lake; our share is 9.0 million pounds.
Our 2020 production plan for the Cigar Lake mine includes an extended shutdown during the third quarter. The shut-down will consist of a four-week production outage, preceded by atwo-week maintenance period with minestart-up planned before the end of the third quarter.
| 66 | CAMECO CORPORATION |
In 2020, we expect to:
| • | continue surface freeze drilling and complete construction and commissioning of the freeze distribution infrastructure expansion in support of future production |
| • | continue underground mine development and complete three new production tunnels as well as expand ventilation and access drifts in alignment with the long-term mine plan |
| • | expand underground piping and infrastructure towards new production panels required to sustain production |
MANAGING OUR RISKS
Cigar Lake is a challenging deposit to develop and mine. These challenges include control of groundwater, weak rock formations, radiation protection, chemical ore characteristics, performance of the water treatment system, water inflow, regulatory approvals, surface and underground fires and other mining-related challenges. To reduce this risk, we are applying our operational experience and the lessons we have learned about water inflows at McArthur River and Cigar Lake.
Operational changes
The operational changes we have made, including the extended summer shutdown, the workforce reduction, changes to the shift rotation schedule, and changes to the commuter flight services at the site, which are intended to achieve cost savings and improve efficiency, carry with them increased risk of production disruption.
Transition to new mining areas
In order to successfully achieve the planned production schedule, we must continue to successfully transition into new mining areas, which includes mine development and investment in critical support infrastructure.
Ground freezing
To manage our risks and meet our production schedule, the areas being mined must meet specific ground freezing requirements before we begin jet boring. We have identified greater variation of the freeze rates of different geological formations encountered in the mine, based on information obtained through surface freeze drilling. As a mitigation measure, we have increased the site freeze capacity to facilitate the mining of ore cavities as planned.
Environmental performance
The Cigar Lake orebody contains elements of concern with respect to the water quality and the receiving environment. The distribution of elements such as arsenic, molybdenum, selenium and others isnon-uniform throughout the ore body, and this can present challenges in attaining and maintaining the required effluent concentrations.
There have been ongoing efforts to optimize the current water treatment process and water handling systems to ensure acceptable environmental performance, which is expected to avoid the need for additional capital upgrades and potential deferral of production.
Water inflow risk
A significant risk to development and production is from water inflows. The 2006 and 2008 water inflows were significant setbacks.
The consequences of another water inflow at Cigar Lake would depend on its magnitude, location and timing, but could include a significant delay or disruption in Cigar Lake production, a material increase in costs or a loss of mineral reserves.
We take the following steps to reduce the risk of inflows, but there is no guarantee that these will be successful:
| • | Bulk freezing: Two of the primary challenges in mining the deposit are control of groundwater and ground support. Bulk freezing reduces but does not completely eliminate the risk of water inflows. |
| • | Mine development: We plan for our mine development to take place away from known groundwater sources whenever possible. In addition, we assess all planned mine development for relative risk and apply extensive additional technical and operating controls for all higher risk development. |
| • | Pumping capacity and treatment limits: We have pumping capacity to meet our standard for this operation of at least one and a half times the estimated maximum inflow. |
We believe we have sufficient pumping, water treatment and surface storage capacity to handle the estimated maximum inflow.
We also manage the risks listed on pages 56 to 58.
| MANAGEMENT’S DISCUSSION AND ANALYSIS | 67 |
Uranium –Tier-one operations
Inkai
 | 2019 Production (100% basis)
8.3 M lbs 2020 Production Outlook (100% basis)
8.3 M lbs Estimated Reserves (our share)
100.7M lbs Estimated Mine Life
2045(based on licence term) |
Inkai is a very significant uranium deposit, located in Kazakhstan. The operator is JV Inkai limited liability partnership, which we jointly own (40%) with Kazatomprom (60%)1.
Inkai is considered a material uranium property for us. There is a technical report dated January 25, 2018 (effective January 1, 2018) that can be downloaded from SEDAR (sedar.com) or from EDGAR (sec.gov).
| Location | South Kazakhstan | |
| Ownership | 40%1 | |
| Mine type | In situ recovery (ISR) | |
| End product | Uranium concentrate | |
| Certifications | BSI OHSAS 18001 | |
| ISO 14001 certified | ||
| Estimated reserves | 100.7 million pounds (proven and probable), average grade U3O8: 0.03% | |
| Estimated resources | 12.8 million pounds (measured and indicated), average grade U3O8: 0.03% | |
| 30 million pounds (inferred), average grade U3O8: 0.03% | ||
| Licensed capacity (wellfields) | 10.4 million pounds per year (our share 4.2 million pounds per year)1 | |
| Licence term | Through July 2045 | |
| Total packaged production: 2009 to 2019 | 57.5 million pounds (100% basis) | |
| 2019 production | 8.3 million pounds (100% basis) | |
| 2020 production outlook | 8.3 million pounds (100% basis)1 | |
| Estimated decommissioning cost (100% basis) | $11 million (US) (100% basis) (this estimate is currently under review) | |
All values shown, including reserves and resources, represent our share only, unless indicated.
| 1 | Effective January 1, 2018, our ownership interest in the joint venture dropped to 40% and we now equity account for our investment. Due to the transition to equity accounting, our share of production is shown as a purchase. |
BACKGROUND
Mine description
The Inkai uranium deposit is a roll-front type orebody within permeable sandstones. The more porous and permeable units host several stacked and relatively continuous, sinuous “roll-fronts” oflow-grade uranium forming a regional system. Superimposed over this regional system are several uranium projects and active mines.
Inkai’s mineralization ranges in depths from about 260 metres to 530 metres. The deposit has a surface projection of about 40 kilometres in length, and the width ranges from 40 to 1600 metres. The deposit has hydrogeological and mineralization conditions favourable for use ofin-situ recovery (ISR) technology.
| 68 | CAMECO CORPORATION |
Mining and milling method
JV Inkai uses conventional, well-established, and very efficient ISR technology, developed after extensive test work and operational experience. The process involves five major steps:
| • | leach the uraniumin-situ by circulating an acid-based solution through the host formation |
| • | recover it from solution with ion exchange resin (takes place at both main and satellite processing plants) |
| • | precipitate the uranium with hydrogen peroxide |
| • | thicken, dewater, and dry it |
| • | package the uranium peroxide product in drums |
Production
Total 2019 production from Inkai was 8.3 million pounds (100% basis), an increase from 2018. While the production volume was in accordance with Kazatomprom’s planned 20% decrease to the licensed production profile under the terms of the subsoil use contract, the subsoil use contract called for higher production in 2019 compared to 2018. The subsoil use law in Kazakhstan allows producers to produce within 20% (above or below) of their licensed capacity in a year.
Project funding and cash distribution
We had an outstanding loan for Inkai’s work on block 3 prior to the restructuring. Under the restructuring agreement, the partners agreed that JV Inkai would distribute excess cash, after working capital requirements, as priority repayment of this loan. In 2019, principal and interest payments of $92.7 million (US) were received, which repaid the loan in full. As a result, excess cash, after working capital requirements, will be distributed to the partners as dividends. Our share of dividends follows our production purchase entitlements as described below.
JV Inkai Restructuring Agreement
In 2016, we signed an agreement with our partner Kazatomprom and JV Inkai to restructure and enhance JV Inkai. The restructuring closed in December 2017 and took effect January 1, 2018. This restructuring was subject to obtaining all required government approvals including an amendment to JV Inkai’s Resource Use Contract, which were obtained. The restructuring consisted of the following:
| • | JV Inkai has the right to produce 10.4 million pounds of U3O8 per year, an increase from the prior licensed annual production of 5.2 million pounds |
| • | JV Inkai has the right to produce until 2045 (previously, the licence terms, based on the boundaries prior to the restructuring, were to 2024 and 2030) |
| • | our ownership interest in JV Inkai is 40% and Kazatomprom’s share is 60%. However, during production rampup, we are entitled to purchase 57.5% of the first 5.2 million pounds of annual production, and, as annual production increases over 5.2 million pounds, we are entitled to purchase 22.5% of such incremental production, to the maximum annual share of 4.2 million pounds. Once the rampup to 10.4 million pounds annually is complete, we will be entitled to purchase 40% of such annual production, matching our ownership interest. |
| • | a governance framework that provides protection for us as a minority owner |
| • | the boundaries of the mining area match the agreed production profile for JV Inkai to 2045 |
| • | priority payment of the loan that our subsidiary made to JV Inkai to fund exploration and evaluation of the historically defined block 3 area |
With Kazatomprom, we completed and reviewed a feasibility study for the purpose of evaluating the design, construction and operation of a uranium refinery in Kazakhstan. In accordance with the agreement, a decision was made not to proceed with construction of the uranium refinery as contemplated in the feasibility study. We subsequently signed an agreement to licence our proprietary UF6 conversion technology to Kazatomprom, which will allow Kazatomprom to examine the feasibility of constructing and operating its own UF6 conversion facility in Kazakhstan.
Our 2020 financial outlook is presented on the basis of equity accounting for our minority ownership interest in JV Inkai. Under equity accounting, our share of the profits earned by JV Inkai on the sale of its production are included in “income from equity-accounted investees” on our consolidated statement of earnings. Our share of production is purchased at a discount to the spot price and included at this value in inventory. In addition, JV Inkai capital is not included in our outlook for capital expenditures. Please seePlanning for the future below for more details.
| MANAGEMENT’S DISCUSSION AND ANALYSIS | 69 |
PLANNING FOR THE FUTURE
Production
We expect total production from Inkai to be 8.3 million pounds (100% basis) in 2020. Due to Kazatomprom’s announced plans to maintain its aggregate production reduction of 20%, an adjustment to the restructuring agreement, as described above, has been made. As a result of this adjustment, we are entitled to purchase 59.4% of JV Inkai’s planned production in 2020 which equates to 4.9 million pounds. Our share of the profits earned by JV Inkai on the sale of its production will be included in “income from equity-accounted investees” on our consolidated statement of earnings.
MANAGING OUR RISKS
Political risk
Kazakhstan declared itself independent in 1991 after the dissolution of the Soviet Union. Our investment in JV Inkai is subject to the greater risks associated with doing business in developing countries, which have significant potential for social, economic, political, legal and fiscal instability. Kazakh laws and regulations are complex and still developing and their application can be difficult to predict. The other owner of JV Inkai is Kazatomprom, an entity majority owned by the government of Kazakhstan. We have entered into agreements with JV Inkai and Kazatomprom intended to mitigate political risk. This risk includes the imposition of governmental laws or policies that could restrict or hinder JV Inkai paying us dividends, or selling us our share of JV Inkai production, or that impose discriminatory taxes or currency controls on these transactions. The restructuring of JV Inkai, which took effect January 1, 2018, was undertaken with the objective to better align the interests of Cameco and Kazatomprom and includes a governance framework that provides for protection for us as a minority owner of JV Inkai. We believe the political risk related to our investment in JV Inkai is manageable.
For more details on this risk, please our most recent annual information form under the heading political risks.
JV Inkai manages risks listed on pages 56 to 58.
| 70 | CAMECO CORPORATION |
Uranium –Tier-two operations
Rabbit Lake
Located in Saskatchewan, Canada, our 100% owned Rabbit Lake operation opened in 1975, and has the second largest uranium mill in the world. Due to market conditions, we suspended production at Rabbit Lake during the second quarter of 2016.
| Location | Saskatchewan, Canada | |
| Ownership | 100% | |
| End product | Uranium concentrates | |
| ISO certification | ISO 14001 certified | |
| Mine type | Underground | |
| Estimated reserves | - | |
| Estimated resources | 38.6 million pounds (indicated), average grade U3O8: 0.95% | |
| 33.7 million pounds (inferred), average grade U3O8: 0.62% | ||
| Mining methods | Vertical blasthole stoping | |
| Licensed capacity | Mill: maximum 16.9 million pounds per year; currently 11 million | |
| Licence term | Through October, 2023 | |
| Total production: 1975 to 2019 | 202.2 million pounds | |
| 2019 production | 0 million pounds | |
| 2020 production outlook | 0 million pounds | |
| Estimated decommissioning cost1 | $213 million | |
| 1 | This updated estimate is currently under regulatory review. |
PRODUCTION SUSPENSION
The facilities remained in a state of safe and sustainable care and maintenance throughout 2019.
While in standby, we continue to evaluate our options in order to minimize care and maintenance costs. We expect care and maintenance costs to range between $30 million and $35 million annually.
MANAGING OUR RISKS
We also manage the risks listed on pages 56 to 58.
| MANAGEMENT’S DISCUSSION AND ANALYSIS | 71 |
US ISR Operations
Located in Nebraska and Wyoming in the US, the Crow Butte and Smith Ranch-Highland (including the North Butte satellite) operations began production in 1991 and 1975. Each operation has its own processing facility. Due to market conditions, we curtailed production and deferred all wellfield development at these operations during the second quarter of 2016.
| Ownership | 100% | |||
| End product | Uranium concentrates | |||
| ISO certification | ISO 14001 certified | |||
| Estimated reserves | Smith Ranch-Highland: | - | ||
| North Butte-Brown Ranch: | - | |||
| Crow Butte: | - | |||
| Estimated resources | Smith Ranch-Highland: | 24.9 million pounds (measured and indicated), average grade U3O8: 0.06% | ||
| 7.7 million pounds (inferred), average grade U3O8: 0.05% | ||||
| North Butte-Brown Ranch: | 9.5 million pounds (measured and indicated), average grade U3O8: 0.07% | |||
| 0.4 million pounds (inferred), average grade U3O8: 0.07% | ||||
| Crow Butte: | 13.9 million pounds (measured and indicated), average grade U3O8: 0.25% | |||
| 1.8 million pounds (inferred), average grade U3O8: 0.16% | ||||
| Mining methods | In situ recovery (ISR) | |||
| Licensed capacity | Smith Ranch-Highland:1 | Wellfields: 3 million pounds per year; processing plants: 5.5 million pounds per year | ||
| Crow Butte: | Processing plants and wellfields: 2 million pounds per year | |||
| Licence term | Smith Ranch-Highland: | Through September, 2028 | ||
| Crow Butte: | Through October, 2024 | |||
| Total production: 2002 to 2019 | 33.0 million pounds | |||
| 2019 production | 0 million pounds | |||
| 2020 production outlook | 0 million pounds | |||
| Estimated decommissioning cost2 | Smith Ranch-Highland: $219 million (US), including North Butte | |||
| Crow Butte: $52 million (US) | ||||
| 1 | Including Highland mill |
| 2 | This updated estimate is currently under regulatory review. |
PRODUCTION CURTAILMENT
As a result of our 2016 decision, production at the US operations ceased in 2018. We expect ongoing cash andnon-cash care and maintenance costs to range between $14 million (US) and $16 million (US) for 2020.
FUTURE PRODUCTION
We do not expect any production in 2020.
IMPAIRMENT
In 2017, due to the continued weakening of the uranium market and a reduction in mineral reserves, we recorded a $184 million write down of our US assets.
MANAGING OUR RISKS
We manage the risks listed on pages 56 to 58.
| 72 | CAMECO CORPORATION |
Uranium – advanced projects
Work on our advanced projects has been scaled back and will continue at a pace aligned with market signals.
| Millennium | ||
| Location | Saskatchewan, Canada | |
| Ownership | 69.9% | |
| End product | Uranium concentrates | |
| Potential mine type | Underground | |
| Estimated resources(our share) | 53.0 million pounds (indicated), average grade U3O8: 2.39% | |
| 20.2 million pounds (inferred), average grade U3O8: 3.19% | ||
BACKGROUND
The Millennium deposit was discovered in 2000, and was delineated through geophysical survey and surface drilling work between 2000 and 2013.
| Yeelirrie | ||
| Location | Western Australia | |
| Ownership | 100% | |
| End product | Uranium concentrates | |
| Potential mine type | Open pit | |
| Estimated resources | 128.1 million pounds (measured and indicated), average grade U3O8: 0.15% | |
BACKGROUND
The deposit was discovered in 1972 and is a near-surface calcrete-style deposit that is amenable to open pit mining techniques. It is one of Australia’s largest undeveloped uranium deposits.
| Kintyre | ||
| Location | Western Australia | |
| Ownership | 100% | |
| End product | Uranium concentrates | |
| Potential mine type | Open pit | |
| Estimated resources | 53.5 million pounds (indicated), average grade U3O8: 0.62% | |
| 6.0 million pounds (inferred), average grade U3O8: 0.53% | ||
BACKGROUND
The Kintyre deposit was discovered in 1985 and is amenable to open pit mining techniques.
2019 PROJECT UPDATES
We believe that we have some of the best undeveloped uranium projects in the world. However, in the current market environment our primary focus is on preserving the value of ourtier-one uranium assets. We continue to await a signal from the market that additional production is needed prior to making any new development decisions.
PLANNING FOR THE FUTURE
2020 Planned activity
No work is planned at Millennium, Yeelirrie or Kintyre. Further progress towards a development decision is not expected until market conditions improve.
MANAGING THE RISKS
For all of our advanced projects, we manage the risks listed on pages 56 to 58.
| MANAGEMENT’S DISCUSSION AND ANALYSIS | 73 |
Uranium – exploration and corporate development
Our exploration program is directed at replacing mineral reserves as they are depleted by our production, and is key to sustaining our business. However, during this period of weak uranium prices, and as we have ample idled production capacity, we have reduced our spending to focus only on exploration near our existing operations where we have established infrastructure and capacity to expand. Globally, we have land with exploration and development prospects that are among the best in the world, mainly in Canada, Australia and the US. Our land holdings total about 0.8 million hectares (1.9 million acres). In northern Saskatchewan alone, we have direct interests in about 0.7 million hectares (1.7 million acres) of land covering many of the most prospective exploration areas of the Athabasca Basin.
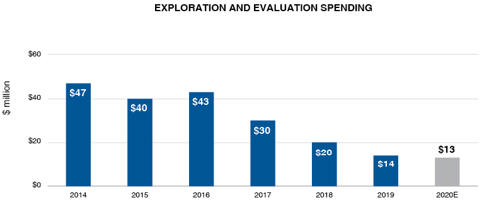
2019 UPDATE
Brownfield exploration
Brownfield exploration is uranium exploration near our existing operations, and includes expenses for advanced exploration on the evaluation of projects where uranium mineralization is being defined.
In 2019, we spent about $4 million on brownfields and advanced uranium projects in Saskatchewan and Australia. At the US operations we spent $1 million.
Regional exploration
We spent about $9 million on regional exploration programs (including support costs), primarily in Saskatchewan’s Athabasca Basin.
PLANNING FOR THE FUTURE
We will continue to focus on our core projects in Saskatchewan under our long-term exploration strategy. Long-term, we look for properties that meet our investment criteria. We may partner with other companies through strategic alliances, equity holdings and traditional joint venture arrangements. Our leadership position and industry expertise in both exploration and corporate social responsibility make us a partner of choice.
ACQUISITION PROGRAM
Currently, given the conditions in the uranium market, our extensive portfolio of reserves and resources and our belief that we have ample idle production capacity, our focus is on navigating by our investment-grade rating and preserving the value of ourtier-one assets. We expect that these assets will allow us to meet rising uranium demand with increased production from our best margin operations, and will help to mitigate risk in the event of prolonged uncertainty.
However, we continually evaluate acquisition opportunities within the nuclear fuel cycle that could add to our future supply options, support our sales activities, and complement and enhance our business in the nuclear industry. We will invest when an opportunity is available at the right time and the right price. We strive to pursue corporate development initiatives that will leave us and our shareholders in a fundamentally stronger position. As such, an acquisition opportunity is never assessed in isolation. Acquisitions must compete for investment capital with our own internal growth opportunities. They are subject to our capital allocation process described in the strategy section, starting on page 15.
| 74 | CAMECO CORPORATION |
Fuel services
Refining, conversion and fuel manufacturing
We have about 25% of world UF6 primary conversion capacity and are a supplier of natural UO2. Our focus is on cost-competitiveness and operational efficiency.
Our fuel services segment is strategically important because it helps support the growth of the uranium segment. Offering a range of products and services to customers helps us broaden our business relationships and expand our uranium market share.
Blind River Refinery
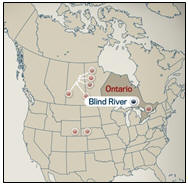 | Licensed Capacity
24.0M kgU as UO3
Licence renewal in
Feb, 2022 |
Blind River is the world’s largest commercial uranium refinery, refining uranium concentrates from mines around the world into UO3.
| Location | Ontario, Canada | |
| Ownership | 100% | |
| End product | UO3 | |
| ISO certification | ISO 14001 certified | |
| Licensed capacity | 18.0 million kgU as UO3 per year, approved to 24.0 million subject to the completion of certain equipment upgrades (advancement depends on market conditions) | |
| Licence term | Through February, 2022 | |
| Estimated decommissioning cost | $48 million | |
| MANAGEMENT’S DISCUSSION AND ANALYSIS | 75 |
Port Hope Conversion Services
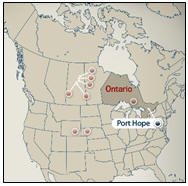 | Licensed Capacity
12.5M kgU as UF6
2.8M kgU as UO2
Licence renewal in
Feb, 2027 |
Port Hope is the only uranium conversion facility in Canada and a supplier of UO2 for Canadian-made CANDU reactors.
| Location | Ontario, Canada | |
| Ownership | 100% | |
| End product | UF6, UO2 | |
| ISO certification | ISO 14001 certified | |
| Licensed capacity | 12.5 million kgU as UF6 per year 2.8 million kgU as UO2 per year | |
| Licence term | Through February, 2027 | |
| Estimated decommissioning cost | $129 million | |
Cameco Fuel Manufacturing Inc. (CFM)
| Licensed Capacity
1.2M kgU as UO2 fuel pellets
Licence renewal in
Feb, 2022 |
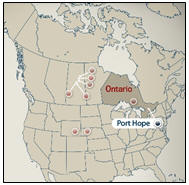
CFM produces fuel bundles and reactor components for CANDU reactors.
| Location | Ontario, Canada | |
| Ownership | 100% | |
| End product | CANDU fuel bundles and components | |
| ISO certification | ISO 9001 certified, ISO 14001 certified | |
| Licensed capacity | 1.2 million kgU as UO2 fuel pellets | |
| Licence term | Through February, 2022 | |
| Estimated decommissioning cost | $21 million | |
| 76 | CAMECO CORPORATION |
2019 UPDATE
Production
Fuel services produced 13.3 million kgU, 27% higher than 2018. This was a result of increased demand.
Port Hope conversion facility cleanup and modernization (Vision in Motion)
Vision in Motion is a unique opportunity that demonstrates our continued commitment to a clean environment. It has been made possible by the opening of a long-term waste management facility by the government of Canada’s Port Hope Area Initiative project. There is a limited opportunity during the life of this project to engage inclean-up and renewal activities that address legacy waste at the Port Hope Conversion facility inherited from historic operations. We made significant progress on the Vision in Motion project in 2019 and will continue with the implementation work in 2020.
PLANNING FOR THE FUTURE
Production
We plan to produce between 13 million and 14 million kgU in 2020.
In addition, in conjunction with our initiative intended to provide a greater focus on technology and its applications to improve efficiency and reduce costs across the organization, we will continue to look for opportunities to improve operational effectiveness, including the use of digital and automation technologies.
MANAGING OUR RISKS
Labour relations
A new collective agreement with unionized employees at our conversion facility in Port Hope was reached. The new agreement is for three years and expires on July 1, 2022.
We also manage the risks listed on pages 56 to 58.
| MANAGEMENT’S DISCUSSION AND ANALYSIS | 77 |
Mineral reserves and resources
Our mineral reserves and resources are the foundation of our company and fundamental to our success.
We have interests in a number of uranium properties. The tables in this section show the estimates of the proven and probable mineral reserves, and measured, indicated, and inferred mineral resources at those properties. However, only three of the properties listed in those tables are material uranium properties for us: McArthur River/Key Lake, Cigar Lake and Inkai. Mineral reserves and resources are all reported as of December 31, 2019.
We estimate and disclose mineral reserves and resources in five categories, using the definition standards adopted by the Canadian Institute of Mining, Metallurgy and Petroleum Council, and in accordance withNational Instrument43-101 – Standards of Disclosure for Mineral Projects (NI43-101), developed by the Canadian Securities Administrators. You can find out more about these categories at www.cim.org.
About mineral resources
Mineral resources do not have to demonstrate economic viability, but have reasonable prospects for eventual economic extraction. They fall into three categories: measured, indicated and inferred. Our reported mineral resources are exclusive of mineral reserves.
| • | Measured and indicated mineral resourcescan be estimated with sufficient confidence to allow the appropriate application of technical, economic, marketing, legal, environmental, social and governmental factors to support evaluation of the economic viability of the deposit. |
| • | measured resources: we can confirm both geological and grade continuity to support detailed mine planning |
| • | indicated resources: we can reasonably assume geological and grade continuity to support mine planning |
| • | Inferred mineral resourcesare estimated using limited geological evidence and sampling information. We do not have enough confidence to evaluate their economic viability in a meaningful way. You should not assume that all or any part of an inferred mineral resource will be upgraded to an indicated or measured mineral resource, but it is reasonably expected that the majority of inferred mineral resources could be upgraded to indicated mineral resources with continued exploration. |
Our share of uranium in the following mineral resource tables is based on our respective ownership interests. Mineral resources that are not mineral reserves have no demonstrated economic viability.
About mineral reserves
Mineral reserves are the economically mineable part of measured and/or indicated mineral resources demonstrated by at least a preliminary feasibility study. The reference point at which mineral reserves are defined is the point where the ore is delivered to the processing plant, except for ISR operations where the reference point is where the mineralization occurs under the existing or planned wellfield patterns. Mineral reserves fall into two categories:
| • | proven reserves: the economically mineable part of a measured resource for which at least a preliminary feasibility study demonstrates that, at the time of reporting, economic extraction could be reasonably justified with a high degree of confidence |
| • | probable reserves: the economically mineable part of a measured and/or indicated resource for which at least a preliminary feasibility study demonstrates that, at the time of reporting, economic extraction could be reasonably justified with a degree of confidence lower than that applying to proven reserves |
We use current geological models, an average uranium price of $44 (US) per pound U3O8, and current or projected operating costs and mine plans to report our mineral reserves, allowing for dilution and mining losses. We apply our standard data verification process for every estimate.
Our share of uranium in the mineral reserves table below is based on our respective ownership interests.
| 78 | CAMECO CORPORATION |
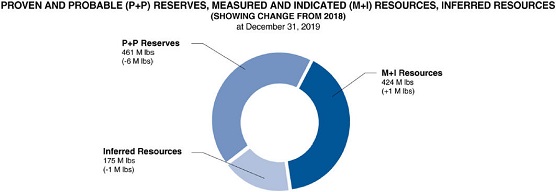
Changes this year
Our share of proven and probable mineral reserves decreased from 467 million pounds U3O8 at the end of 2018, to 461 million pounds at the end of 2019. The change was primarily the result of:
| • | production at Cigar Lake and Inkai, which removed 13 million pounds from our mineral inventory |
partially offset by:
| • | a mineral resource and reserve estimate update at Cigar Lake, which added approximately 7 million pounds of proven and probable reserves |
Our share of measured and indicated mineral resources slightly increased from 423 million pounds U3O8 at the end of 2018, to 424 million pounds at the end of 2019. Our share of inferred mineral resources is 175 million pounds U3O8, a slight decrease of 1 million pounds from the end of 2018. The variance in mineral resources was primarily the result of the Cigar Lake mineral resource estimate update and minor mineral resource estimation work at McArthur River.
| MANAGEMENT’S DISCUSSION AND ANALYSIS | 79 |
Qualified persons
The technical and scientific information discussed in this MD&A for our material properties (McArthur River/Key Lake, Cigar Lake and Inkai) was approved by the following individuals who are qualified persons for the purposes of NI43-101:
MCARTHUR RIVER/KEY LAKE
| • | Greg Murdock, general manager, McArthur River/Key Lake, Cameco |
| • | Alain D. Renaud, lead geologist, technical services, Cameco |
| • | Scott Bishop, director, technical services, Cameco |
CIGAR LAKE
| • | Lloyd Rowson, general manager, Rabbit Lake/Cigar Lake, Cameco |
| • | Scott Bishop, director, technical services, Cameco |
| • | Alain D. Renaud, lead geologist, technical services, Cameco |
INKAI
| • | Alain D. Renaud, lead geologist, technical services, Cameco |
| • | Scott Bishop, director, technical services, Cameco |
Important information about mineral reserve and resource estimates
Although we have carefully prepared and verified the mineral reserve and resource figures in this document, the figures are estimates, based in part on forward-looking information.
Estimates are based on knowledge, mining experience, analysis of drilling results, the quality of available data and management’s best judgment. They are, however, imprecise by nature, may change over time, and include many variables and assumptions, including:
| • | geological interpretation |
| • | extraction plans |
| • | commodity prices and currency exchange rates |
| • | recovery rates |
| • | operating and capital costs |
There is no assurance that the indicated levels of uranium will be produced, and we may have tore-estimate our mineral reserves based on actual production experience. Changes in the price of uranium, production costs or recovery rates could make it unprofitable for us to operate or develop a particular site or sites for a period of time. See page 2 for information about forward-looking information.
Please see our mineral reserves and resources section of our annual information form for the specific assumptions, parameters and methods used for McArthur River, Inkai and Cigar Lake mineral reserve and resource estimates.
Important information for US investors
We present information about mineralization, mineral reserves and resources as required by National Instrument43-101 – Standards of Disclosure for Mineral Projects of the Canadian Securities Administrators (NI43-101), in accordance with applicable Canadian securities laws. As a foreign private issuer filing reports with the US Securities and Exchange Commission (SEC) under the Multijurisdictional Disclosure System, we are not required to comply with the SEC’s disclosure requirements relating to mining properties. Investors in the United States should be aware that the disclosure requirements of NI43-101 are different from those under applicable SEC rules, and the information that we present concerning mineralization, mineral reserves and resources may not be comparable to information made public by companies that comply with the SEC’s reporting and disclosure requirements for mining companies.
| 80 | CAMECO CORPORATION |
Mineral reserves
As at December 31, 2019 (100% – only the shaded column shows our share)
PROVEN AND PROBABLE
(tonnes in thousands; pounds in millions)
| OUR | ||||||||||||||||||||||||||||||||||||||||||||||||
| SHARE | ||||||||||||||||||||||||||||||||||||||||||||||||
| PROVEN | PROBABLE | TOTAL MINERAL RESERVES | RESERVES | |||||||||||||||||||||||||||||||||||||||||||||
| MINING | GRADE | CONTENT | GRADE | CONTENT | GRADE | CONTENT | CONTENT | METALLURGICAL | ||||||||||||||||||||||||||||||||||||||||
PROPERTY | METHOD | TONNES | % U3O8 | (LBS U3O8) | TONNES | % U3O8 | (LBS U3O8) | TONNES | % U3O8 | (LBS U3O8) | (LBS U3O8) | RECOVERY (%) | ||||||||||||||||||||||||||||||||||||
Cigar Lake | UG | 261.9 | 15.50 | 89.5 | 270.8 | 13.90 | 83.0 | 532.7 | 14.69 | 172.5 | 86.3 | 98.5 | ||||||||||||||||||||||||||||||||||||
Key Lake | OP | 61.1 | 0.52 | 0.7 | — | — | — | 61.1 | 0.52 | 0.7 | 0.6 | 99 | ||||||||||||||||||||||||||||||||||||
McArthur River | UG | 2,034.0 | 7.14 | 320.2 | 538.5 | 6.04 | 71.7 | 2,572.5 | 6.91 | 391.9 | 273.6 | 99 | ||||||||||||||||||||||||||||||||||||
Inkai | ISR | 204,440.9 | 0.04 | 160.0 | 152,994.7 | 0.03 | 91.8 | 357,435.6 | 0.03 | 251.8 | 100.7 | 85 | ||||||||||||||||||||||||||||||||||||
|
|
|
|
|
|
|
|
|
|
|
|
|
|
|
|
|
|
|
|
|
| |||||||||||||||||||||||||||
Total | 206,797.9 | — | 570.4 | 153,804.0 | — | 246.5 | 360,601.9 | — | 816.9 | 461.2 | — | |||||||||||||||||||||||||||||||||||||
|
|
|
|
|
|
|
|
|
|
|
|
|
|
|
|
|
|
|
|
|
| |||||||||||||||||||||||||||
(UG – underground, OP – open pit, ISR – in situ recovery)
Note that the estimates in the above table:
| • | Use a constant dollar average uranium price of approximately $44 (US) per pound U3O8 |
| • | are based on exchange rates of $1.00 US=$1.25 Cdn and 405 Kazakhstan Tenge to $1.00 Cdn |
Our estimate of mineral reserves and mineral resources may be positively or negatively affected by the occurrence of one or more of the material risks discussed under the headingCaution about forward-looking information beginning on page 2, as well as certain property-specific risks. SeeUranium –Tier-one operations starting on page 60.
Metallurgical recovery
We report mineral reserves as the quantity of contained ore supporting our mining plans, and provide an estimate of the metallurgical recovery for each uranium property. The estimate of the amount of valuable product that can be physically recovered by the metallurgical extraction process is obtained by multiplying the quantity of contained metal (content) by the planned metallurgical recovery percentage. The content and our share of uranium in the table above are before accounting for estimated metallurgical recovery.
| 2019 CONSOLIDATED FINANCIAL STATEMENTS AND NOTES | 81 |
Mineral resources
As at December 31, 2019 (100% – only the shaded columns show our share)
MEASURED, INDICATED AND INFERRED
(tonnes in thousands; pounds in millions)
| OUR SHARE | OUR SHARE | |||||||||||||||||||||||||||||||||||||||||||||||
| MEASURED RESOURCES (M) | INDICATED RESOURCES (I) | INFERRED RESOURCES | ||||||||||||||||||||||||||||||||||||||||||||||
| TOTAL M+I | TOTAL M+I | INFERRED | ||||||||||||||||||||||||||||||||||||||||||||||
| GRADE | CONTENT | GRADE | CONTENT | CONTENT | CONTENT | GRADE | CONTENT | CONTENT | ||||||||||||||||||||||||||||||||||||||||
PROPERTY | TONNES | % U3O8 | (LBS U3O8) | TONNES | % U3O8 | (LBS U3O8) | (LBS U3O8) | (LBS U3O8) | TONNES | % U3O8 | (LBS U3O8) | (LBS U3O8) | ||||||||||||||||||||||||||||||||||||
Cigar Lake | 11.6 | 8.54 | 2.2 | 307.1 | 14.66 | 99.3 | 101.5 | 50.8 | 182.1 | 5.92 | 23.8 | 11.9 | ||||||||||||||||||||||||||||||||||||
Fox Lake | — | — | — | — | — | — | — | — | 386.7 | 7.99 | 68.1 | 53.3 | ||||||||||||||||||||||||||||||||||||
Kintyre | — | — | — | 3,897.7 | 0.62 | 53.5 | 53.5 | 53.5 | 517.1 | 0.53 | 6.0 | 6.0 | ||||||||||||||||||||||||||||||||||||
McArthur River | 97.8 | 2.57 | 5.5 | 85.0 | 2.12 | 4.0 | 9.5 | 6.7 | 41.0 | 2.85 | 2.6 | 1.8 | ||||||||||||||||||||||||||||||||||||
Millennium | — | — | — | 1,442.6 | 2.39 | 75.9 | 75.9 | 53.0 | 412.4 | 3.19 | 29.0 | 20.2 | ||||||||||||||||||||||||||||||||||||
Rabbit Lake | — | — | — | 1,836.5 | 0.95 | 38.6 | 38.6 | 38.6 | 2,460.9 | 0.62 | 33.7 | 33.7 | ||||||||||||||||||||||||||||||||||||
Tamarack | — | — | — | 183.8 | 4.42 | 17.9 | 17.9 | 10.3 | 45.6 | 1.02 | 1.0 | 0.6 | ||||||||||||||||||||||||||||||||||||
Yeelirrie | 27,172.9 | 0.16 | 95.9 | 12,178.3 | 0.12 | 32.2 | 128.1 | 128.1 | — | — | — | — | ||||||||||||||||||||||||||||||||||||
Crow Butte | 1,601.0 | 0.19 | 6.7 | 939.3 | 0.35 | 7.3 | 14.0 | 14.0 | 531.4 | 0.16 | 1.8 | 1.8 | ||||||||||||||||||||||||||||||||||||
Gas Hills - Peach | 687.2 | 0.11 | 1.7 | 3,626.1 | 0.15 | 11.6 | 13.3 | 13.3 | 3,307.5 | 0.08 | 6.0 | 6.0 | ||||||||||||||||||||||||||||||||||||
Inkai | 36,680.9 | 0.03 | 21.3 | 21,132.2 | 0.02 | 10.7 | 32.0 | 12.8 | 116,394.6 | 0.03 | 75.0 | 30.0 | ||||||||||||||||||||||||||||||||||||
North Butte - Brown Ranch | 621.3 | 0.08 | 1.1 | 5,530.3 | 0.07 | 8.4 | 9.5 | 9.5 | 294.5 | 0.07 | 0.4 | 0.4 | ||||||||||||||||||||||||||||||||||||
Ruby Ranch | — | — | — | 2,215.3 | 0.08 | 4.1 | 4.1 | 4.1 | 56.2 | 0.14 | 0.2 | 0.2 | ||||||||||||||||||||||||||||||||||||
Shirley Basin | 89.2 | 0.16 | 0.3 | 1,638.2 | 0.11 | 4.1 | 4.4 | 4.4 | 508.0 | 0.10 | 1.1 | 1.1 | ||||||||||||||||||||||||||||||||||||
Smith Ranch -Highland | 3,711.3 | 0.10 | 7.9 | 14,372.3 | 0.05 | 17.0 | 24.9 | 24.9 | 6,861.0 | 0.05 | 7.7 | 7.7 | ||||||||||||||||||||||||||||||||||||
|
|
|
|
|
|
|
|
|
|
|
|
|
|
|
|
|
|
|
|
|
|
|
| |||||||||||||||||||||||||
Total | 70,673.2 | — | 142.6 | 69,384.7 | — | 384.6 | 527.2 | 424.0 | 131,999.0 | — | 256.4 | 174.7 | ||||||||||||||||||||||||||||||||||||
|
|
|
|
|
|
|
|
|
|
|
|
|
|
|
|
|
|
|
|
|
|
|
| |||||||||||||||||||||||||
Note that mineral resources:
| • | do not include amounts that have been identified as mineral reserves |
| • | do not have demonstrated economic viability |
| 82 | CAMECO CORPORATION |
Additional information
Due to the nature of our business, we are required to make estimates that affect the amount of assets and liabilities, revenues and expenses, commitments and contingencies we report. We base our estimates on our experience, our best judgment, guidelines established by the Canadian Institute of Mining, Metallurgy and Petroleum and on assumptions we believe are reasonable.
We believe the following critical accounting estimates reflect the more significant judgments used in the preparation of our financial statements. These estimates affect all of our segments, unless otherwise noted.
Decommissioning and reclamation
In our uranium and fuel services segments, we are required to estimate the cost of decommissioning and reclamation for each operation, but we normally do not incur these costs until an asset is nearing the end of its useful life. Regulatory requirements and decommissioning methods could change during that time, making our actual costs different from our estimates. A significant change in these costs or in our mineral reserves could have a material impact on our net earnings and financial position. See note 15 to the financial statements.
Property, plant and equipment
We depreciate property, plant and equipment primarily using theunit-of-production method, where the carrying value is reduced as resources are depleted. A change in our mineral reserves would change our depreciation expenses, and such a change could have a material impact on amounts charged to earnings.
We assess the carrying values of property, plant and equipment and goodwill every year, or more often if necessary. If we determine that we cannot recover the carrying value of an asset or goodwill, we write off the unrecoverable amount against current earnings. We base our assessment of recoverability on assumptions and judgments we make about future prices, production costs, our requirements for sustaining capital and our ability to economically recover mineral reserves. A material change in any of these assumptions could have a significant impact on the potential impairment of these assets.
In performing impairment assessments of long-lived assets, assets that cannot be assessed individually are grouped together into the smallest group of assets that generates cash inflows that are largely independent of the cash inflows from other assets or groups of assets. Management is required to exercise judgment in identifying these cash generating units.
Taxes
When we are preparing our financial statements, we estimate taxes in each jurisdiction we operate in, taking into consideration different tax rates,non-deductible expenses, valuation of deferred tax assets, changes in tax laws and our expectations for future results.
We base our estimates of deferred income taxes on temporary differences between the assets and liabilities we report in our financial statements, and the assets and liabilities determined by the tax laws in the various countries we operate in. We record deferred income taxes in our financial statements based on our estimated future cash flows, which includes estimates ofnon-deductible expenses, future market conditions, production levels and intercompany sales. If these estimates are not accurate, there could be a material impact on our net earnings and financial position.
Controls and procedures
We have evaluated the effectiveness of our disclosure controls and procedures and internal control over financial reporting as of December 31, 2019, as required by the rules of the US Securities and Exchange Commission and the Canadian Securities Administrators.
| 2019 CONSOLIDATED FINANCIAL STATEMENTS AND NOTES | 83 |
Management, including our Chief Executive Officer (CEO) and our Chief Financial Officer (CFO), supervised and participated in the evaluation, and concluded that our disclosure controls and procedures are effective to provide a reasonable level of assurance that the information we are required to disclose in reports we file or submit under securities laws is recorded, processed, summarized and reported accurately, and within the time periods specified. It should be noted that, while the CEO and CFO believe that our disclosure controls and procedures provide a reasonable level of assurance that they are effective, they do not expect the disclosure controls and procedures or internal control over financial reporting to be capable of preventing all errors and fraud. A control system, no matter how well conceived or operated, can provide only reasonable, not absolute, assurance that the objectives of the control system are met.
Management, including our CEO and our CFO, is responsible for establishing and maintaining internal control over financial reporting and conducted an evaluation of the effectiveness of our internal control over financial reporting based on the Internal Control — Integrated Framework (2013) issued by the Committee of Sponsoring Organizations of the Treadway Commission (COSO). Based on this evaluation, management concluded that our internal control over financial reporting was effective as of December 31, 2019.
During the first quarter of 2019, we implemented a new marketing system resulting in a material change in internal controls over financial reporting. The new system provides for contract administration, including the processing and recording of delivery obligations as well as revenue forecasting and reporting. The implementation process included extensive involvement by key end users and management and incorporated user acceptance testing, change management procedures, data migration strategies and a parallel run period where users validated the new system. Post-implementation reviews and testing were conducted by management to ensure that internal controls surrounding the implementation process were properly designed to prevent material financial statement errors.
There have been no other changes in our internal control over financial reporting during the year that have materially affected, or are reasonably likely to materially affect, our internal control over financial reporting.
New standards adopted
On January 1, 2019, we adopted the following new standards as issued by the International Accounting Standards Board (IASB).
IFRS 16,Leases, eliminates the dual model for lessees, which distinguishes betweenon-balance sheet finance leases andoff-balance sheet operating leases. Instead, there is a single,on-balance sheet accounting model that is similar to current finance lease accounting. We adopted IFRS 16 using the modified retrospective approach which does not require comparative information to be restated.
IFRIC 23,Uncertainty over Income Tax Treatments provides guidance on the accounting for current and deferred tax liabilities and assets in circumstances in which there is uncertainty over income tax treatments. The adoption of the standard did not have a material impact on the financial statements.
| 84 | CAMECO CORPORATION |