Exhibit 99.3

Management’s discussion and analysis
February 8, 2024
| 10 | MARKET OVERVIEW AND DEVELOPMENTS | |
| 17 | 2023 PERFORMANCE HIGHLIGHTS | |
| 22 | OUR VISION, VALUES AND STRATEGY | |
| 32 | OUR ESG PRINCIPLES AND PRACTICES | |
| 36 | MEASURING OUR RESULTS | |
| 38 | FINANCIAL RESULTS | |
| 69 | OPERATIONS AND PROJECTS | |
| 100 | MINERAL RESERVES AND RESOURCES | |
| 105 | ADDITIONAL INFORMATION | |
This management’s discussion and analysis (MD&A) includes information that will help you understand management’s perspective of our audited consolidated financial statements (financial statements) and notes for the year ended December 31, 2023. The information is based on what we knew as of February 7, 2024.
We encourage you to read our audited consolidated financial statements and notes as you review this MD&A. You can find more information about Cameco, including our financial statements and our most recent annual information form, on our website at cameco.com, on SEDAR+ at www.sedarplus.com or on EDGAR at sec.gov. You should also read our annual information form before making an investment decision about our securities.
The financial information in this MD&A and in our financial statements and notes is prepared according to International Financial Reporting Standards (IFRS), unless otherwise indicated.
Unless we have specified otherwise, all dollar amounts are in Canadian dollars.
Throughout this document, the terms we, us, our, the Company and Cameco mean Cameco Corporation and its subsidiaries, unless otherwise indicated.
Caution about forward-looking information
Our MD&A includes statements and information about our expectations for the future. When we discuss our strategy, plans, future financial and operating performance, or other things that have not yet taken place, we are making statements considered to be forward-looking information or forward-looking statements under Canadian and United States (US) securities laws. We refer to them in this MD&A as forward-looking information.
Key things to understand about the forward-looking information in this MD&A:
| • | It typically includes words and phrases about the future, such as: anticipate, believe, estimate, expect, plan, will, intend, goal, target, forecast, project, vision, strategy and outlook (see examples below). |
| • | It represents our current views and can change significantly. |
| • | It is based on a number of material assumptions, including those we have listed on page 5, which may prove to be incorrect. |
| • | Actual results and events may be significantly different from what we currently expect, due to the risks associated with our business. We list a number of these material risks on page 4. We recommend you also review our most recent annual information form, which includes a discussion of other material risks that could cause actual results to differ significantly from our current expectations. |
| • | Forward-looking information is designed to help you understand management’s current views of our near- and longer-term prospects, and it may not be appropriate for other purposes. We will not necessarily update this information unless we are required to by securities laws. |
Examples of forward-looking information in this MD&A
| • | our view that we have the strengths to take advantage of the world’s rising demand for safe, clean, secure, reliable, affordable and carbon-free energy, and our vision to energize a clean-air world |
| • | that we will continue to focus on delivering our products responsibly and addressing the environmental, social and governance (ESG) risks and opportunities that we believe will make our business sustainable and will build long-term value |
| • | our expectations about when future reactors will come online |
| • | our expectations about 2024 and future global uranium supply, consumption, contracting, demand, geopolitical issues and the market including the discussion under the heading Market overview and developments |
| • | our expectations for the future of the nuclear industry and the potential for new enrichment technology, including that nuclear power must be a central part of the solution to the world’s shift to a low-carbon climate-resilient economy and that our investment in enrichment technology, if successful, will allow us to participate in the entire nuclear fuel value chain |
| • | our efforts to participate in the commercialization and deployment of small modular reactors (SMRs) and increase our contributions to global climate change solutions by exploring SMRs and other emerging opportunities within the fuel cycle |
| • | our expectations about future demand for SMRs |
| • | our views on our ability to self-manage risk |
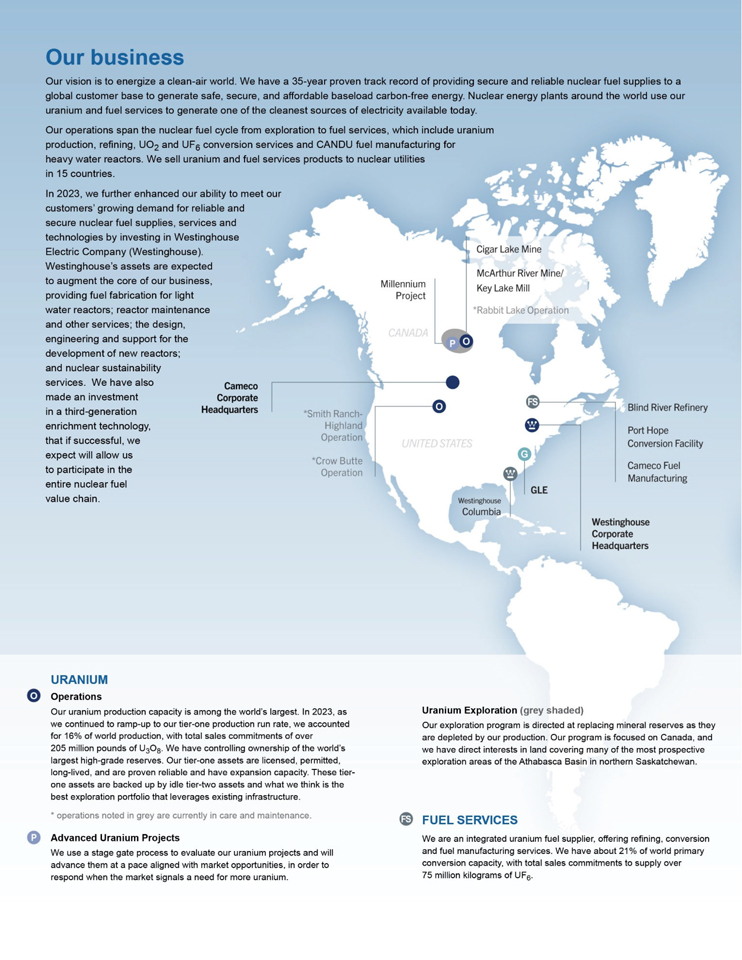
| • | the discussion under the heading Our business |
| • | the discussion under the heading Our strategy |
| • | our expectations regarding the effect of supply scarcity on our long-term contract portfolio |
| • | our expectations regarding the operation of, and production levels for, the Cigar Lake mine and McArthur River/Key Lake operation and the Port Hope UF6 conversion facility, as well as our exploration activities at these and other sites |
| • | our expectations regarding the future average unit cost of production at McArthur River/Key Lake and at Cigar Lake |
| • | our expectation regarding the timing of filing a new technical report for Cigar Lake |
| • | our expectations regarding our licences for McArthur River, Key Lake and Crow Butte |
| • | Kazatomprom’s planned production levels and timing for JV Inkai |
| • | the discussion under the heading Our ESG principles and practices including our belief there is a significant opportunity for us to be part of the solution to combat climate change and that we are well positioned to deliver significant long-term business value |
| • | our expectations for uranium purchases, sales and deliveries |
| • | our intentions regarding future dividend payments |
| • | the discussion of our expectations relating to our Canada Revenue Agency (CRA) transfer pricing dispute, including our confidence that the courts would reject any attempt by CRA to utilize the same or similar positions for other tax years currently in dispute, our plan to file a notice of objection for 2017 and our belief that CRA should return the full amount of cash and security that has been paid or otherwise secured by us |
| • | our expectations regarding the amount of security we will need to provide to CRA in connection with the tax debts CRA considers us owing for 2017 |
| • | the discussion of our future plans for Cigar Lake and McArthur River/Key Lake under the heading 2023 performance highlights |
| • | our views on our ability to align our production with market opportunities and our contract portfolio |
| • | our expectation regarding opportunities to improve operational effectiveness and to reduce our impact on the environment, including through the use of digital and automation technologies |
2 CAMECO CORPORATION
| • | the discussion under the heading Outlook for 2024, including expected business resiliency, expectations for 2024 average unit cost of sales, average purchase price per pound, deliveries and production, 2024 financial outlook, our revenue, expectations for 2024 cash balances, tax rates, adjusted net earnings and cash flow sensitivity, and our price sensitivity analysis for our uranium segment |
| • | the discussion under the heading Liquidity and capital resources, including expected liquidity to meet our 2024 obligations and our expectations regarding how the ratings agencies will consider our investment in Westinghouse in their analysis |
| • | our expectation that the uranium contract portfolio we have built will continue to provide a solid revenue stream, and our portfolio management strategy, including our inventory strategy and the extent of our spot market purchases |
| • | our expectation that our cash balances and operating cash flows will meet our anticipated 2024 capital requirements |
| • | our expectations for our and Westinghouse’s future capital expenditures and sources of funds |
| • | our expectation that in 2024 we will be able to comply with all the covenants in our credit agreements |
| • | our expectation that Westinghouse will continue to comply with the covenants in its credit agreements |
| • | life of mine operating cost estimates for the Cigar Lake, McArthur River/Key Lake and JV Inkai operations |
| • | our future plans and expectations for uranium properties, advanced uranium projects, and fuel services operating sites, including production levels and suspension of production at certain properties, pace of advancement and expansion capacity, carbon reduction targets and mine life, and that our core growth is expected to come from our existing tier-one mining and fuel services assets |
| • | our expectations related to care and maintenance costs |
| • | our mineral reserve and resource estimates |
| • | our decommissioning estimates |
| • | the discussion of our expectations relating to our acquisition of a 49% interest in Westinghouse Electric Company (Westinghouse), including the acquisition expanding our participation in the nuclear fuel value chain, and providing a platform for further growth, and various factors and drivers for Westinghouse’s business segment |
| • | our expectation that the acquisition will enhance our participation in the nuclear fuel cycle |
| • | our expectation that the Westinghouse acquisition will be accretive to us and augment the core of our business |
| • | our expectation of Westinghouse being well positioned to participate in the growing demand profile for nuclear energy |
| • | our plans to update our physical climate risk assessments, incorporate these findings into our internal risk management review and developing an adaptation action plan template and our expectations regarding the timing for implementation of these plans |
| • | our expectations regarding our research and development expenses for 2024 |
| • | our expectations regarding the timing of the Canadian Nuclear Safety Commission’s review of our preliminary decommissioning cost estimate for the Port Hope conversion facility |
| • | our expectations regarding which extraction methods we will use in the future |
| • | our expectation that Westinghouse’s durable and growing business will allow Westinghouse to self-fund its approved annual operating budget, maintain its existing capacity to service its annual financial obligations from de-risked cash flows, and pay annual distributions to its owners |
| • | our 2024 outlook for Westinghouse’s Adjusted EBITDA, capital expenditures and revenue |
| • | our expectation that strategic initiatives, including the development of the AP300™ small modular reactor and the eVinci™ microreactor, will provide new business opportunities for Westinghouse that will make a meaningful contribution to Westinghouse’s long-term financial performance |
| • | our expectation for Westinghouse projects generating multi-year revenue streams and EBITDA for Westinghouse |
| • | our expectation that the timing of cash distributions from Westinghouse will be aligned with the timing of Westinghouse’s cash flows |
| • | our expectation that Westinghouse’s new opportunities will allow Westinghouse to compete for and win new business |
| • | our expectation that Westinghouse’s reputation and position will benefit its core business as Eastern European countries seek to develop a reliable fuel supply chain |
| • | our expectations regarding the growth of Westinghouse’s Adjusted EBITDA over the next five years |
| • | our estimates in respect of the framework for the timing of revenue flows and profitability of contracts under a new build project |
| • | our expectation with respect to the development of its AP300 small modular reactor and eVinci microreactor |
| • | our expectation on Westinghouse being well-positioned for future growth |
| • | our expectation around the refinancing of our senior unsecured debentures, our expected cash flow and our plan to reduce total debt, with a focus on the floating rate term loan |
| • | our expectations regarding when Global Laser Enrichment’s technology will be deployed at a commercial scale |
MANAGEMENT’S DISCUSSION AND ANALYSIS 3
Material risks
| • | actual sales volumes or market prices for any of our products or services are lower than we expect, or cost of sales is higher than we expect, for any reason, including changes in market prices, loss of market share to a competitor, trade restrictions, geopolitical issues or the impact of a pandemic |
| • | we are adversely affected by changes in currency exchange rates, interest rates, royalty rates, tax rates, or inflation |
| • | our production costs are higher than planned, or necessary supplies are not available, or not available on commercially reasonable terms |
| • | our strategies may change, be unsuccessful or have unanticipated consequences, or we may not be able to achieve anticipated operational flexibility and efficiency |
| • | changing views of governments regarding the pursuit of carbon reduction strategies or our view may prove to be inaccurate on the role of nuclear power in pursuit of those strategies |
| • | our estimates and forecasts prove to be inaccurate, including production, purchases, deliveries, cash flow, revenue, costs, decommissioning, reclamation expenses, or receipt of future dividends from JV Inkai |
| • | that we may not realize the expected benefits from the Westinghouse acquisition |
| • | Westinghouse fails to generate sufficient cash flow to fund its approved annual operating budget or make quarterly distributions to the partners |
| • | we are unable to enforce our legal rights under our existing agreements, permits or licences |
| • | we are subject to litigation or arbitration that has an adverse outcome |
| • | that the courts may accept the same, similar or different positions and arguments advanced by CRA to reach decisions that are adverse to us for other tax years |
| • | the possibility of a materially different outcome in disputes with CRA for other tax years |
| • | that CRA does not agree that the court rulings for the years that have been resolved in Cameco’s favour should apply to subsequent tax years |
| • | that CRA will not return all or substantially all of the cash and security that has been paid or otherwise secured in a timely manner, or at all |
| • | there are defects in, or challenges to, title to our properties |
| • | our mineral reserve and resource estimates are not reliable, or there are unexpected or challenging geological, hydrological or mining conditions |
| • | we are affected by environmental, safety and regulatory risks, including workforce health and safety or increased regulatory burdens or delays resulting from a pandemic or other causes |
| • | we are adversely affected by subsurface contamination from current or legacy operations |
| • | necessary permits or approvals from government authorities cannot be obtained or maintained |
| • | we are affected by political risks, including any potential future unrest in Kazakhstan |
| • | operations are disrupted due to problems with our own or our suppliers’ or customers’ facilities, the unavailability of reagents, equipment, operating parts and supplies critical to production, equipment failure, lack of tailings capacity, labour shortages, labour relations issues, strikes or lockouts, underground floods, cave-ins, ground movements, tailings dam failures, transportation disruptions or accidents, aging infrastructure or other development and operating risks |
| • | we are affected by terrorism, sabotage, blockades, civil unrest, social or political activism, outbreak of illness (such as a pandemic), accident or a deterioration in political support for, or demand for, nuclear energy |
| • | a major accident at a nuclear power plant |
| • | we are impacted by changes in the regulation or public perception of the safety of nuclear power plants, which adversely affect the construction of new plants, the relicensing of existing plants and the demand for uranium |
| • | government laws, regulations, policies or decisions that adversely affect us, including tax and trade laws and sanctions on nuclear fuel imports |
| • | our uranium suppliers or purchasers fail to fulfil their commitments |
| • | our McArthur River development, mining or production plans are delayed or do not succeed for any reason |
| • | our Cigar Lake development, mining or production plans are delayed or do not succeed for any reason |
| • | our production plans for our Port Hope UF6 conversion facility do not succeed for any reason |
| • | the McClean Lake’s mill production plan is delayed or does not succeed for any reason |
| • | water quality and environmental concerns could result in a potential deferral of production and additional capital and operating expenses required for the Cigar Lake and McArthur River/Key Lake operations |
| • | JV Inkai’s development, mining or production plans are delayed or do not succeed for any reason, or JV Inkai is unable to transport and deliver its production |
| • | we may be unsuccessful in pursuing innovation or implementing advanced technologies, including the risk that the commercialization and deployment of SMRs or new enrichment technology may incur unanticipated delays or expenses, or ultimately prove to be unsuccessful |
| • | our expectations relating to care and maintenance costs prove to be inaccurate |
| • | the risk that we may not be able to refinance our debenture on terms that are as favourable as we expect, or that we may not realize our expected cash flow, or meet our expectations in reducing total debt |
| • | the risk that we may become unable to pay future dividends at the expected rate |
| • | we are affected by natural phenomena, including inclement weather, fire, flood and earthquakes |
| • | the risks that generally apply to all our operations and advanced uranium projects that are discussed under the heading Managing the risks beginning on page 70 |
4 CAMECO CORPORATION
| • | the risks relating to our tier-one uranium operations discussed under the heading McArthur River mine/Key Lake mill – Managing Our Risks beginning on page 75, under the heading Cigar Lake – Managing Our Risks beginning on page 79, and under the heading Inkai – Managing Our Risks beginning on page 83 |
| • | unexpected changes in uranium supply, demand, long-term contracting, and prices |
| • | changes in consumer demand for nuclear power and uranium as a result of changing societal views and objectives regarding nuclear power, electrification and decarbonization |
| • | the risk that our views regarding nuclear power, its growth profile, and benefits may prove to be incorrect |
| • | the risk that we and Westinghouse may not be able to meet sales commitments for any reason |
| • | the risk that Westinghouse may not achieve the expected growth in its business |
| • | the risk to Westinghouse’s business associated with potential production disruptions, including those related to global supply chain disruptions, global economic uncertainty, political volatility, labour relations issues, and operating risks |
| • | the risk that Westinghouse may not be able to implement its business objectives in a manner consistent with its or our environmental, social, governance and other values |
| • | the risk that Westinghouse’s strategies may change, be unsuccessful, or have unanticipated consequences |
| • | the risk that Westinghouse may be unsuccessful in respect of its new business |
| • | the risk that Westinghouse may be delayed in announcing its future financial results |
| • | the risk that Westinghouse may fail to comply with nuclear license and quality assurance requirements at its facilities |
| • | the risk that Westinghouse may lose protections against liability for nuclear damage, including discontinuation of global nuclear liability regimes and indemnities |
| • | the risk that increased trade barriers may adversely impact Westinghouse’s business |
| • | the risk that Westinghouse may default under its credit facilities, impacting adversely Westinghouse’s ability to fund its ongoing operations and to make distributions |
| • | the risk that liabilities at Westinghouse may exceed our estimates and the discovery of unknown or undisclosed liabilities |
| • | the risk that occupational health and safety issues may arise at Westinghouse’s operations |
| • | the risk that there may be disputes between us and Brookfield regarding our strategic partnership |
| • | the risk that we may default under the governance agreement with Brookfield, including us losing some or all of our interest in Westinghouse |
Material assumptions
| • | our expectations regarding sales and purchase volumes and prices for uranium and fuel services, cost of sales, trade restrictions, inflation and that counterparties to our sales and purchase agreements will honour their commitments |
| • | our expectations for the nuclear industry, including its growth profile, market conditions, geopolitical issues and the demand for and supply of uranium |
| • | the continuing pursuit of carbon reduction strategies by governments and the role of nuclear in the pursuit of those strategies |
| • | the assumptions discussed under the heading 2024 Financial Outlook |
| • | our expectations regarding spot prices and realized prices for uranium, and other factors discussed under the heading Price sensitivity analysis: uranium segment |
| • | Westinghouse’s ability to generate cash flow and fund its approved annual operating budget and make quarterly distributions to the partners |
| • | our ability to compete for additional business opportunities so as to generate additional revenue for us as a result of the Westinghouse acquisition |
| • | market conditions and other factors upon which we based the Westinghouse acquisition and our related forecasts will be as expected |
| • | the success of our plans and strategies relating to the Westinghouse acquisition |
| • | that the construction of new nuclear power plants and the relicensing of existing nuclear power plants will not be more adversely affected than expected by changes in regulation or in the public perception of the safety of nuclear power plants |
| • | our ability to continue to supply our products and services in the expected quantities and at the expected times |
| • | our expected production levels for Cigar Lake, McArthur River/Key Lake, JV Inkai and our fuel services operating sites |
| • | our cost expectations, including production costs, operating costs, and capital costs |
| • | our expectations regarding tax payments, tax rates, royalty rates, currency exchange rates and interest rates |
| • | our entitlement to and ability to receive expected refunds and payments from CRA |
| • | in our dispute with CRA, that courts will reach consistent decisions for other tax years that are based upon similar positions and arguments |
| • | that CRA will not successfully advance different positions and arguments that may lead to different outcomes for other tax years |
| • | our expectation that we will recover all or substantially all of the amounts paid or secured in respect of the CRA dispute to date |
| • | our decommissioning and reclamation estimates, including the assumptions upon which they are based, are reliable |
MANAGEMENT’S DISCUSSION AND ANALYSIS 5
| • | our mineral reserve and resource estimates, and the assumptions upon which they are based, are reliable |
| • | our understanding of the geological, hydrological and other conditions at our uranium properties |
| • | our Cigar Lake and McArthur River development, mining and production plans succeed |
| • | our Key Lake mill production plan succeeds |
| • | the McClean Lake mill is able to process Cigar Lake ore as expected |
| • | our production plans for our Port Hope UF6 conversion facility succeed |
| • | JV Inkai’s development, mining and production plans succeed, and that JV Inkai will be able to transport and deliver its production |
| • | the ability of JV Inkai to pay dividends |
| • | that care and maintenance costs will be as expected |
| • | our and our contractors’ ability to comply with current and future environmental, safety and other regulatory requirements, and to obtain and maintain required regulatory approvals |
| • | that we will be successful in our efforts to renew our operating license for Crow Butte |
| • | that we will be able to refinance our senior unsecured debentures, and assumptions regarding our expected cash flow and our ability to reduce total debt |
| • | our operations are not significantly disrupted as a result of political instability, nationalization, terrorism, sabotage, blockades, civil unrest, breakdown, natural disasters, outbreak of illness (such as a pandemic), governmental or political actions, litigation or arbitration proceedings, the unavailability of reagents, equipment, operating parts and supplies critical to production, labour shortages, labour relations issues, strikes or lockouts, underground floods, cave-ins, ground movements, tailings dam failure, lack of tailings capacity, transportation disruptions or accidents, aging infrastructure or other development or operating risks |
| • | that no major accident at a nuclear power plant will occur |
| • | nuclear power and uranium demand, supply, consumption, long-term contracting, growth in the demand for and global public acceptance of nuclear energy, and prices |
| • | Westinghouse’s production, purchases, sales, deliveries, and costs |
| • | the assumptions and discussion set out under the heading Westinghouse Electric Company – Future Prospects |
| • | the market conditions and other factors upon which we have based Westinghouse’s future plans and forecasts |
| • | Westinghouse’s ability to mitigate adverse consequences of delays in production and construction |
| • | the success of Westinghouse’s plans and strategies |
| • | the absence of new and adverse government regulations, policies or decisions |
| • | that there will not be any significant adverse consequences to Westinghouse’s business resulting from business disruptions, including those relating to supply disruptions, economic or political uncertainty and volatility, labour relation issues, and operating risks |
| • | Westinghouse’s ability to announce future financial results when expected |
| • | Westinghouse will comply with the covenants in its credit agreements |
| • | Westinghouse will comply with nuclear license and quality assurance requirements at its facilities |
| • | Westinghouse maintaining protections against liability for nuclear damage, including continuation of global nuclear liability regimes and indemnities |
| • | that known and unknown liabilities at Westinghouse will not materially exceed our estimates |
| • | the absence of disputes between us and Brookfield regarding our strategic partnership, and that we do not default under the governance agreement with Brookfield |
6 CAMECO CORPORATION
[This page is intentionally left blank.]
8 CAMECO CORPORATION
MANAGEMENT’S DISCUSSION AND ANALYSIS 9
Market overview and developments
A market in transition
In 2023, geopolitical uncertainty and heightened concerns about energy security and climate change continued to improve the demand and supply fundamentals for the nuclear power industry and the fuel cycle that is required to support it. Increasingly, countries and companies around the globe are recognizing the critical role nuclear power must play in providing clean and secure baseload power. This growing support has led to a rise in demand as reactors are being saved from earlier retirement, 10- and 20-year life extensions are being sought and approved for existing reactor fleets in several countries, and numerous commitments and plans are being made for the construction of new nuclear generating capacity. In addition, there is increasing interest in small modular reactors (SMR), including smaller versions of existing technology and advanced technology designs, which are expected to add to demand in the decades to come, with several projects already underway.
While demand continues to increase, future supply is not keeping pace. Heightened supply risk caused by growing geopolitical uncertainty, shrinking secondary supplies and a lack of investment in new capacity over the past decade has motivated utilities to evaluate their near-, mid- and long-term nuclear fuel supply chains. The uncertainty about where nuclear fuel supplies will come from to satisfy growing demand has led to increased long-term contracting activity and in 2023, about 160 million pounds of uranium was placed under long-term contracts by utilities. While it is the highest annual volume contracted since 2012, it remains below replacement rate and includes our contract with Ukraine, which alone accounted for about 30 million of those pounds. Prices across the nuclear fuel cycle continued to rise in 2023, with spot enrichment prices up 38%, conversion prices continuing to achieve record highs, uranium spot prices more than doubling from around $48 (US) per pound at the end of 2022 to $100 (US) per pound at the end of January 2024, after peaking at $106 (US) per pound earlier in the month, and the long-term price for uranium increasing about 38% over the same period. We expect there will be continued competition to secure uranium, conversion services and enrichment services under long-term contracts with proven producers and suppliers who have a diversified portfolio of assets in geopolitically attractive jurisdictions, with strong environmental, social and governance (ESG) performance, and on terms that help ensure a reliable supply is available to satisfy demand.
DURABLE DEMAND GROWTH
The benefits of nuclear energy have come clearly into focus, supporting a level of durability that, we believe, has not been previously seen. The durability is being driven not only by accountability for achieving the net-zero carbon targets set by countries and companies around the world, but also by a geopolitical realignment in energy markets that is causing countries to reexamine how they plan to address their energy needs. Net-zero carbon targets are turning global attention to a triple challenge. First, about one-third of the global population must be lifted out of energy poverty by improving access to clean and reliable baseload electricity. Second, approximately 80% of the current global electricity grids that run on carbon-emitting sources of thermal power must be replaced with a clean, reliable alternative. And finally, global power grids must grow by electrifying industries, such as private and commercial transportation, and home and industrial heating, which today are largely powered with carbon-emitting sources of thermal energy. Additionally, geopolitical uncertainty has deepened concerns about energy security, highlighting the role of energy policy in balancing three main objectives: providing a clean emissions profile; providing a reliable and secure baseload profile; and providing an affordable, levelized cost profile. There is increasing recognition that nuclear power meets these objectives and has a key role to play in achieving decarbonization and energy security goals. The growth in demand is not just long-term and in the form of new builds, but medium-term in the form of reactor life extensions, and near-term with early reactor retirement plans being deferred or cancelled and new markets continuing to emerge. And, we are seeing even more long-term momentum building with the development of SMRs, where the use case extends beyond just power generation and numerous companies and countries are pursuing projects.
10 CAMECO CORPORATION
Demand and energy policy highlights
| • | In September, the World Nuclear Association released its biennial Global Nuclear Fuel Report which provides scenarios for demand and supply availability across the fuel supply chain through 2040. This included a robust demand outlook showing global nuclear generating capacity increasing to 686 GWe by 2040 in the Reference Scenario, an average annual growth rate of 3.6%, compared to 2.6% in the 2021 report. This improvement was driven by improved government support, life extensions, new builds and importantly, that starting in the 2030s, the deployment of SMRs is forecasted to contribute to capacity growth. Additional key themes include assumed reductions to secondary supply and decreased availability of mobile inventories, along with the need for a growing volume of future uranium supply requiring higher incentive pricing to balance the market after 2030. |
| • | At the 28th annual Conference of Parties (COP28), the 2023 United Nations Climate Change Conference held in the United Arab Emirates, 22 countries (now 28) launched a declaration to triple nuclear energy capacity by 2050. For the first time at the conference, nuclear energy was recognized alongside other low-emissions technologies for the key role it must play in reaching global net-zero greenhouse gas emissions by 2050. In addition, the inaugural global stocktake was introduced at COP28, a process where countries and stakeholders can provide an update every five years to track the world’s progress toward the Paris Agreement targets. In 2023, the initiative concluded that more action is required, as emissions continue to rise and put 2030 targets at risk, reinforcing that in order to achieve net zero by 2050, the world needs “absolute economy-wide emission reduction targets”, which were estimated at a cost of “trillions of dollars”. |
| • | China Nuclear Energy Association published the “China Nuclear Energy Development Report 2023” in April, which highlighted China’s continuing growth. According to the report, the country is expected to lead the world in installed nuclear capacity with 110 GWe expected by 2030, rising to 150 GWe expected by 2035, and plans to build over 90% of their major nuclear power reactors domestically. Additionally, a proposal drafted by 15 Chinese national policy advisors was submitted to the government advocating for the development of new nuclear power plants at inland sites, which are now being considered following the end of a post-Fukushima moratorium on proposed inland nuclear power plants. |
| • | In Japan, Takahama unit 2 restarted in September, becoming the country’s 12th reactor to restart since Fukushima. Onagawa unit 2 and Shimane unit 2 are expected to restart in 2024. In November, the Nuclear Regulation Authority approved 20-year life extensions (beyond 40 years) for Sendai units 1 and 2; additionally, Takahama units 3 and 4 are expected to receive similar life extensions, pending generator work in 2026 and 2027. In addition, Japan enacted a bill in May allowing nuclear reactors to operate beyond the 60-year limit. |
| • | In South Korea, Korea Hydro and Nuclear Power (KHNP) announced in September that they successfully completed fuel loading at Shin Hanul unit 2, a new 1,400 MWe APR-1400 pressurized water reactor (PWR) unit. This followed an announcement from the Ministry of Industry and Energy that Shin Hanul units 3 and 4 would be completed by the end of 2024. Additionally, to help achieve the plans set out in their 10th Basic Plan for Electricity Supply and Demand 2030, which targets more than 30% of its power supply to come from nuclear, the Ministry confirmed a review of the need for new nuclear power plants was underway. |
| • | In India, the first domestically designed 700 MWe pressurized heavy water reactor, Kakrapar unit 3, reached full operating capacity in August. Three more units of the same design are expected to come online in the next few years. The country is targeting an expansion of nuclear generating capacity to 22.5 GWe by 2031. |
| • | In February, the European Nuclear Alliance was launched. Led by France, the initiative commits 11 European countries to cooperate across the nuclear fuel supply chain, and to promote new nuclear generation projects and technologies, including the advancement of SMRs. Throughout 2023, the alliance expanded and now includes a commitment from 16 European countries that will prepare a roadmap to develop an integrated European nuclear industry and target 150 GWe of nuclear power by 2050. |
| • | In France, plans were advanced to relaunch the country’s reactor construction program: the government committed to life extensions with a proposed “industrial build” program that initially includes six new European Pressurized Reactors (EPR), as well as eight additional EPRs in the future. Électricité de France filed an application to build the first pair of 1,650 MWe EPRs with construction scheduled to begin in 2028. |
| • | In January 2024, the United Kingdom (UK) announced that they are seeking to quadruple their nuclear power output by 2050. Under the “Civil Nuclear Roadmap”, the UK will invest into developing new advanced nuclear fuel, new regulations, and a new nuclear reactor. |
MANAGEMENT’S DISCUSSION AND ANALYSIS 11
| • | In June, Sweden’s parliament adopted a new energy target, changing its focus to “100% fossil-free” electricity as opposed to the previously stated focus of “100% renewable”. In August, the government announced a target to further expand the role of nuclear power and in November, announced its intention to build up to 2,500 MWe of new nuclear power capacity by 2035, and up to 10 new reactors by 2045, backed by an offer of loan guarantees. |
| • | In Belgium, the government and nuclear operator ENGIE reached an agreement following prolonged negotiations to extend the lifespans of the Doel unit 4 and Tihange unit 3 reactors by 10 years, with each now expected to operate until 2035. |
| • | In Bulgaria, the government issued its 30-year energy strategy to 2053, which envisions the construction of four new nuclear reactor units. In December, parliament approved a government proposal to inject up to 1.5 billion levs ($838 million (US)) into the state-owned Kozloduy Nuclear Power Plant to fund the planned construction of the first of two proposed reactors using Westinghouse’s AP1000® technology. |
| • | In Poland, the government adopted a resolution committing to finance the country’s first nuclear power plant. The funds will go to Polish utility Polskie Elektrownie Jadrowe, which signed a contract with Westinghouse for multiple AP1000 reactors in February of 2023. |
| • | In the US, Vogtle unit 3 entered commercial service on July 31, after becoming the first Westinghouse AP1000 reactor in the US to successfully connect to the electrical grid. Vogtle unit 4 is expected to begin operating in the second quarter of 2024. |
| • | Throughout 2023, many US states expressed local support for nuclear: Ohio, Virginia, Kentucky, and Tennessee all began creating state-level advisory authorities to promote, research and develop nuclear power technologies, and Michigan formed a new Nuclear Caucus to support the reopening of the Palisades nuclear power plant, and also approved extending operations at the Monticello nuclear power plant through 2040. |
| • | In Canada, provincial support for nuclear increased in 2023. New Brunswick Power signed a three-year contract with Ontario Power Generation (OPG) to enhance the operational performance of the Point Lepreau nuclear power plant. In Ontario, the Minister of Energy announced support to advance the long-term planning required to explore nuclear expansion options for Bruce Power, outlining the need for nearly 18 GWe in new nuclear capacity to help the province reach its electrification and net-zero goals. Additionally, in Saskatchewan, Crown Investments Corporation provided around $479,000 to help local firms build small, advanced, and micro reactors supply chain capacity, while the Alberta government announced plans to invest around $7 million to study SMRs. |
| • | In January 2024, OPG announced plans to proceed with the refurbishment of the Pickering Nuclear Generating Station’s “B” units (units 5, 6, 7 and 8). Once the project is completed in the mid-2030s, Pickering would produce a total of 2 GWe of electricity, to help meet increasing electricity demand and fuel the province’s economic growth. |
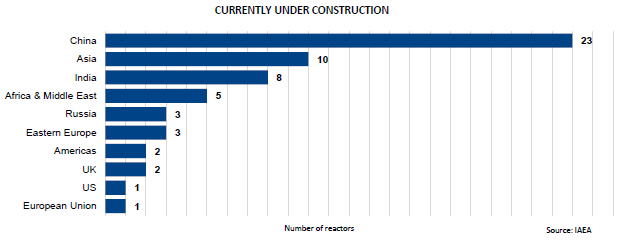
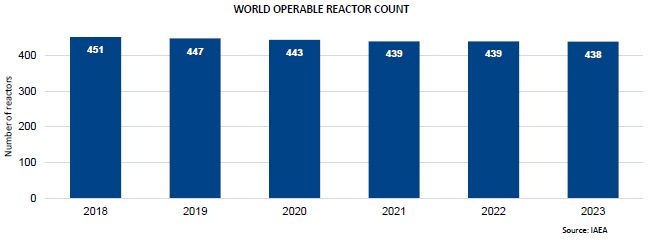
According to the International Atomic Energy Agency (IAEA), globally there are currently 438 operable reactors and 58 reactors under construction. Several nations are appreciating the clean energy and energy security benefits of nuclear power and have reaffirmed their commitment with plans underway to support existing reactor units and review policies to encourage more nuclear generation. Several other non-nuclear countries have emerged as candidates for new nuclear capacity. In the EU, specific nuclear energy projects have been identified for inclusion under its sustainable financing taxonomy and are therefore eligible for access to low-cost financing. In Canada, the government revised the Canada Green Bond Framework to include nuclear energy projects. In some countries where phase-out policies have been in place, policy reversals and decisions have been made to temporarily keep reactors running, with public opinion polls showing increasing support. With a number of reactor construction projects recently approved and many more planned, demand for uranium continues to improve. There is growing recognition of the role nuclear must play in providing safe, affordable, carbon-free baseload electricity to achieve a low-carbon economy, while being a reliable energy source that helps countries move away from Russian energy supply.
12 CAMECO CORPORATION
SUPPLY UNCERTAINTY
Geopolitical uncertainty remained the most notable factor impacting security of supply in 2023. Driven by the Russian invasion of Ukraine, and more recently, the coup d’état in Niger, many governments and utilities are re-examining supply chains and procurement strategies that rely on nuclear fuel supplies from these jurisdictions. In addition, sanctions on Russia and Niger, government restrictions, and restrictions on and cancellations of some cargo insurance coverages continue to create transportation and supply chain risks for nuclear fuel supplies coming out of Central Asia. There are also transportation risks to material being shipped from Australia to Europe as a result of the conflict in the Middle East. Despite the recent increase in market prices, the deepening geopolitical uncertainty and years of underinvestment in new uranium and fuel cycle service capacities has shifted risk from producers to utilities.
Supply and trade policy highlights
| • | Sprott Physical Uranium Trust (SPUT) purchased about 4 million pounds U3O8 in 2023, bringing total purchases since inception to over 45 million pounds U3O8 and increasing the total net asset value to around $7 billion (US). Volatility in equity markets has impacted SPUT’s valuation (discount or premium to its net asset value) and therefore its ability to raise funds to purchase uranium. |
| • | In June, Kazatomprom (KAP) announced plans to start production at a new uranium deposit, Inkai 3 (100% owned by KAP). KAP expects approval of a Subsoil Use Agreement (SSUA) to produce 10.4 million pounds U3O8 annually for 25 years from Inkai 3’s uranium resources of about 216 million pounds U3O8. |
MANAGEMENT’S DISCUSSION AND ANALYSIS 13
| • | In September, KAP had restated its plan to increase production in 2024 to 90% of SSUAs and announced a ramp up to 100% of SSUAs in 2025, though the company also warned that geopolitical uncertainty, global supply chain issues, and inflationary pressure could create challenges. On January 12, 2024, KAP announced that it had faced challenges in completing the development required to achieve the planned 2024 production increase, and that it expected to lower its 2024 uranium production guidance due to limited availability of sulfuric acid and delays in the construction and development of new assets, including Budenovskoye 6 and 7. On February 1, 2024, KAP rescinded its 2024 target due to the shortage of sulfuric acid and construction delays in 2023, and they now plan to remain about 20% below SSUAs, expecting to produce between 55 million and 59 million pounds U3O8 in 2024 (previously 65 million to 66 million pounds U3O8). KAP also warned that if the acid, supply chain and construction issues persist throughout 2024, the company’s 2025 plan to increase production to 100% of SSUAs (79 million to 82 million pounds U3O8) may also be affected. |
| • | In April, five of the G7 countries (Canada, France, Japan, UK, and US), entered into a civil nuclear fuel security agreement that attempts to reduce Russia’s influence in the global nuclear fuel supply chain. |
| • | In December, Urenco announced its decision to expand enrichment capacity at their facility in Almelo, Netherlands, increasing capacity by 15% or approximately 750,000 separative work units (SWU), by 2027. This followed a prior announcement of plans to expand enrichment capacity at its Urenco USA site, increasing capacity there by 15% or approximately 700,000 SWU, by 2025. |
| • | In October, Orano announced a planned enrichment capacity extension project at Georges Besse 2. The project, forecasted to cost €1.7 billion, seeks to increase capacity by over 30% or approximately 2.5 million SWU, beginning in 2028. |
| • | In July, ConverDyn announced the restart of Honeywell’s Metropolis uranium conversion facility. The restart plan had been delayed by a safety equipment failure in June, resulting in a special inspection by the US Nuclear Regulatory Commission. The facility restarted production in July 2023. |
| • | In July, a coup d’état in Niger resulted in a group of military officers removing President Mohamed Bazoum and seizing power. All exports of uranium and gold to France were suspended and in September, Orano stated that it had halted uranium processing operations at the company’s majority-owned SOMAIR (Arlit) project in Niger due to logistical complications caused by international sanctions. This resulted in 2023 production dropping to 3.9 million pounds U3O8, compared to around 5.2 million pounds U3O8 in 2022. |
| • | In December, the US House of Representatives passed the Prohibiting Russian Uranium Impacts Act. The act proposes to prohibit the import of Russian low-enriched uranium (LEU) into the US, but includes waivers that allow the import of LEU from Russia if the US Energy Secretary determines no alternative source can be procured, or if the shipments are of national interest. The waivers would gradually reduce and eliminate Russian uranium imports by 2028. The bill is awaiting further action after it was blocked by the US Senate on grounds unrelated to the bill itself. Separately, the US Senate Energy and Natural Resources Committee passed the Nuclear Fuel Security Act of 2023, which directs the Department of Energy to create a “Nuclear Fuel Security Program” and strengthen the US nuclear fuel supply chain, including new LEU and high-assay low-enriched uranium (HALEU) capacity, though no new funding has yet been appropriated. Finally, a Supplemental Funding Bill is progressing through Congress and includes roughly $111 billion (US) for national security measures, including a provision for $2.72 billion (US) to be allocated to a new “American Energy Independence Fund”, which would acquire non-Russian LEU and HALEU, subject to the ban on Russian imports becoming law. |
Long-term contracting creates full-cycle value for proven productive assets
Like other commodities, the demand for uranium is cyclical. However, unlike other commodities, uranium is not traded in meaningful quantities on a commodity exchange. The uranium market is principally based on bilaterally negotiated long-term contracts covering the annual run-rate requirements of nuclear power plants, with a small spot market to serve discretionary demand. History demonstrates that in general, when prices are rising and high, uranium is perceived as scarce, and more contracting activity takes place with proven and reliable suppliers. The higher demand discovered during this contracting cycle drives investment in higher-cost sources of production, which due to lengthy development timelines, tend to miss the contracting cycle and ramp up after demand has already been won by proven producers. When prices are declining and low, there is no perceived urgency to contract, and contracting activity and investment in new supply dramatically decreases. After years of low prices, and a lack of investment in supply, and as the uncommitted material available in the spot market begins to thin, security-of-supply tends to overtake price concerns. Utilities typically re-enter the long-term contracting market to ensure they have a reliable future supply of uranium to run their reactors.
14 CAMECO CORPORATION
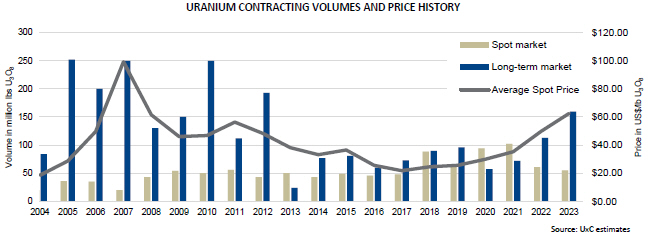
UxC reports that over the last five years approximately 510 million pounds U3O8 equivalent have been locked-up in the long-term market, while approximately 780 million pounds U3O8 equivalent have been consumed in reactors. We remain confident that utilities have a growing gap to fill.
We believe the current backlog of long-term contracting presents a substantial opportunity for proven and reliable suppliers with tier-one productive capacity and a record of honoring supply commitments. As a low-cost producer, we manage our operations to increase value throughout these price cycles.

In our industry, customers do not come to the market right before they need to load nuclear fuel into their reactors. To operate a reactor that could run for more than 60 years, natural uranium and the downstream services have to be purchased years in advance, allowing time for a number of processing steps before a finished fuel bundle arrives at the power plant. At present, we believe there is a significant amount of uranium that needs to be contracted to keep reactors running into the next decade.
UxC estimates that cumulative uncovered requirements are about 2.2 billion pounds to the end of 2040. With the lack of investment over the past decade, there is growing uncertainty about where uranium will come from to satisfy growing demand, and utilities are becoming increasingly concerned about the availability of material to meet their long-term needs. In addition, secondary supplies have diminished, and the material available in the spot market has thinned as producers and financial funds continue to purchase material. Furthermore, geopolitical uncertainty is causing some utilities to seek nuclear fuel suppliers whose values are aligned with their own or whose origin of supply better protects them from potential interruptions, including from transportation challenges or the possible imposition of formal sanctions.
MANAGEMENT’S DISCUSSION AND ANALYSIS 15
We will continue to take the actions we believe are necessary to position the company for long-term success. Therefore, we will continue to align our production decisions with our customers’ needs under our contract portfolio. We will undertake contracting activity which is intended to ensure we have adequate protection while maintaining exposure to the benefits that come from having uncommitted, low-cost supply to place into a strengthening market.
16 CAMECO CORPORATION
2023 performance highlights
It was another positive year for the nuclear energy industry. Demand for nuclear power, including support for existing reactors, continues to grow, catalyzed by the increasing recognition by policy makers and major industries that nuclear energy must play an important role in achieving the objectives of providing clean, secure, reliable and affordable energy. We recently announced our commitment to the Net Zero Nuclear initiative, which is calling for collaboration among government, industry leaders and civil society to triple global nuclear capacity to achieve carbon neutrality by 2050. We believe nuclear energy is back in durable growth mode, and we too are back in durable growth mode. This growth will be sought in the same manner as we approach all aspects of our business; strategic, deliberate, disciplined and responsible and with a focus on generating full-cycle value.
In our uranium segment, our portfolio of long-term contracts totals approximately 205 million pounds representing only about 20% of our current reserve and resource base, providing us with plenty of exposure to improving demand from our customers as they look to secure their long-term needs. We continue to have a large and growing pipeline of uranium business under discussion. Our focus continues to be on obtaining market-related pricing mechanisms, while also providing adequate downside protection. We continue to be strategically patient in our discussions to maximize value in our contract portfolio and to maintain exposure to higher prices with unencumbered future productive capacity. In addition, with strong demand in the UF6 conversion market, we were successful in adding new long-term contracts that bring our total contracted volumes to over 75 million kgU of UF6 that will underpin that operation for years to come.
At McArthur River/Key Lake, we produced 13.5 million pounds (100% basis) of packaged uranium concentrate (14.8 million pounds at the mine, 13.5 million pounds of which were packaged at the mill), slightly below our most recent estimate of 14 million pounds (100% basis). At Cigar Lake, we produced 15.1 million pounds (100% basis) of packaged uranium, which is in line with our most recent estimate of up to 16.3 million pounds (100% basis). Any pounds we did not produce in 2023 remain available to us and, with increasing supply pressures, have potentially become more valuable when delivered in the future.
Through our investment in Inkai, we were impacted by the 20% supply reduction enacted by Kazatomprom (KAP) across all uranium mines in Kazakhstan and the continued supply chain challenges it has faced. As well, delivery of our share of 2023 production from JV Inkai was delayed due to the challenges of transporting uranium via an alternate route that does not rely on Russian rail lines or ports. The first shipment, containing approximately two thirds of our share of Inkai’s 2023 production, arrived in the fourth quarter. The second shipment with the remainder of our share of 2023 production has arrived at a Canadian port.
Cameco has 35 years of experience in this market, and we have designed our strategy of full-cycle value capture to be resilient. Given the nature of our contracts, we have good visibility into when and where we need to deliver material, and we have put in place a number of tools that allow us to self-manage risk.
We have built a strong reputation as a proven and reliable supplier with a diversified production portfolio, that provides us with the flexibility to work with our customers to ensure they maintain access to our reliable supplies to satisfy their ongoing fuel requirements. In addition to our production, we can source material from market purchases today, and while these purchases would be more expensive than our production, our strategy positions us to benefit from added demand for nuclear fuel supplies and services. We have exposure to higher prices under the market-related contracts in our long-term portfolio and a pipeline of contracting discussions underway, which we expect will also benefit from the increased focus on securing access to scarce supplies and generate long-term value for Cameco. Also, we do not have to buy every pound in the spot market. We can source from inventory, to be replaced by production or purchases later. Further, we have the ability to pull forward long-term purchase arrangements that we put in place in a much lower-price environment, and with licensed storage facilities, we have secured the ability to borrow product under the terms of some of our storage agreements.
Global production shortfalls and transportation challenges in 2023 further highlighted the growing security of supply risk at a time when we believe the demand outlook is stronger and more durable than ever, with 28 countries around the world committing to triple nuclear power capacity by 2050. In this environment, uncertainty about where nuclear fuel supplies will come from to satisfy growing demand continues to drive long-term contracting as risk shifts from producers to utilities.
We delivered 32 million pounds of uranium and 12 million kgU in our fuel services segment to our customers in alignment with our contract portfolio and profitable opportunities in the market. We generated $688 million in cash from operations, with
MANAGEMENT’S DISCUSSION AND ANALYSIS 17
higher sales volumes and higher average realized prices in both our uranium and fuel services segments than in 2022. To meet our sales commitments and maintain a working inventory we purchased 11.3 million pounds of uranium at an average cost of $59.42 (US) per pound. While the unit cost of our purchases is significantly higher than the average production costs at McArthur River/Key Lake and Cigar Lake in 2023, we benefit from higher prices under the market-related portion of our long-term contract portfolio and higher prices benefit the pounds we have under negotiation. See 2023 financial results by segment – Uranium starting on page 61 for more information.
Thanks to our disciplined strategy, our balance sheet is strong, and we expect it will enable us to continue executing our strategy as well as to self-manage risk, including from global macro-economic uncertainty and volatility. As of December 31, 2023, we had $567 million in cash and cash equivalents with $1.8 billion in total debt. In addition, we have a $1.0 billion undrawn credit facility.
On November 7, 2023, we announced the closing of the acquisition of Westinghouse Electric Company (Westinghouse) in a strategic partnership with Brookfield Asset Management alongside its publicly listed affiliate Brookfield Renewable Partners (Brookfield) and institutional partners. Cameco now owns a 49% interest and Brookfield owns the remaining 51% in Westinghouse. We believe bringing together our expertise in the nuclear industry with Brookfield’s expertise in clean energy positions nuclear power at the heart of the clean energy transition and creates a powerful platform for strategic growth across the nuclear sector. See Westinghouse Electric Company beginning on page 94 for more information.
In the current environment, we believe the risk to uranium supply is greater than the risk to uranium demand and expect it will create a renewed focus on ensuring availability of long-term supply to fuel nuclear reactors. With the improvements in the market and to help meet our sales commitments, we plan to produce 18 million pounds (100% basis) at each of McArthur River/Key Lake and Cigar Lake in 2024. Based on KAP’s announcement on February 1, 2024, production in Kazakhstan is expected to remain 20% below the level stipulated in subsoil use agreements, similar to in 2023, primarily due to the sulfuric acid shortage in the country. We are still in discussions with JV Inkai and KAP to determine how this may impact production at Inkai in 2024 and thereafter and therefore our corresponding purchase obligation. We also plan to begin the work necessary to extend the mine life at Cigar Lake to 2036, subject to approval of Orano’s board, which we expect will be granted in the first quarter of 2024. In addition, at McArthur River/Key Lake, we plan to undertake an evaluation of the work and investment necessary to expand production up to its annual licensed capacity of 25 million pounds (100% basis), which we expect will allow us to take advantage of this opportunity when the time is right. See Uranium – Tier-one operations starting on page 73 for more information.
If we took advantage of all of the tier-one expansion opportunities available to us, our annual share of tier-one supply could be about 32 million pounds. However, we will continue to align our production with our contract portfolio and market opportunities, demonstrating that we continue to responsibly manage our supply in accordance with our customers’ needs.
In addition to our uranium production, at our Port Hope UF6 conversion facility we plan to produce 12,000 tonnes in 2024 to satisfy our book of long-term business and demand for conversion services, at a time when conversion prices are at historic highs.
We will continue to look for opportunities to improve operational effectiveness, to improve our safety performance and reduce our impact on the environment, including through the use of digital and automation technologies to allow us to operate our assets with more flexibility and efficiency. This is key to our ability to continue to align our production decisions with our contract portfolio commitments and opportunities. With a solid base of contracts to underpin our productive capacity, and a growing contracting pipeline we plan to return to our tier-one cost structure, which we expect will generate strong financial performance.
As we execute on our strategy, we will continue to focus on protecting the health and safety of our employees, delivering our products safely and responsibly and addressing the ESG risks and opportunities that we believe will make our business sustainable and will build long-term value.
18 CAMECO CORPORATION
Financial performance
HIGHLIGHTS DECEMBER 31 ($ MILLIONS EXCEPT WHERE INDICATED) | 2023 | 2022 | CHANGE | |||||||||
Revenue | 2,588 | 1,868 | 39 | % | ||||||||
Gross profit | 562 | 233 | >100 | % | ||||||||
Net earnings attributable to equity holders | 361 | 89 | >100 | % | ||||||||
$ per common share (diluted) | 0.83 | 0.22 | >100 | % | ||||||||
Adjusted net earnings (non-IFRS, see page 41) | 339 | 135 | >100 | % | ||||||||
$ per common share (adjusted and diluted) | 0.78 | 0.33 | >100 | % | ||||||||
Adjusted EBITDA (non-IFRS, see page 41) | 831 | 431 | 93 | % | ||||||||
Cash provided by operations | 688 | 305 | >100 | % | ||||||||
Net earnings attributable to equity holders (net earnings) and adjusted net earnings in 2023 significantly outperformed 2022. See 2023 consolidated financial results beginning on page 39 for more information. Of note:
| • | generated $688 million in cash from operations |
| • | received refund of $297 million from CRA, consisting of cash in the amount of $86 million and letters of credit in the amount of $211 million. Also, received $12 million from CRA for disbursements related to the September 2018 Tax Court decision and cost award. See Transfer pricing dispute on page 46 for more information. |
| • | received a cash dividend of $79 million (US), net of withholdings, from JV Inkai |
| • | completed acquisition of 49% interest in Westinghouse for a $2.1 billion (US) purchase price. To finance the acquisition, we used $1.5 billion (US) of cash and drew the full amount of both $300 million (US) tranches of the term loan put in place concurrently with the execution of the acquisition agreement. See Westinghouse Electric Company starting on page 94 for more information. |
| • | incurred $51 million in care and maintenance costs compared to $218 million in care and maintenance and operational readiness costs in 2022 |
Our segment updates and other fuel cycle investment updates
In our uranium segment, we continued to execute our strategy, further ramping up our tier-one assets which had a positive impact on our operations. Of note in 2023, we:
| • | delivered 32 million pounds in alignment with the commitments under our contract portfolio and profitable market opportunities |
| • | produced 15.1 million pounds (100% basis) at Cigar Lake. Production was impacted by delays associated with the first production from a new mining zone and some unplanned maintenance work. |
| • | produced 13.5 million pounds (100% basis) at McArthur River/Key Lake. Production was impacted by challenges related to length of time the facility was in care and maintenance, the operational changes that were implemented throughout the mill, aging infrastructure, availability of personnel with the necessary skills and experience, and the impact of supply chain challenges on the availability of materials and reagents. |
| • | purchased 11.3 million pounds of uranium, including our spot purchases and committed purchase volumes (including JV Inkai purchases) |
| • | signed major supply agreement to meet Ukraine’s full nuclear fuel needs through 2035 |
| • | received 20-year licence renewals from the Canadian Nuclear Safety Commission (CNSC) for McArthur River, Key Lake and a 15-year licence renewal for Rabbit Lake |
| • | maintained Rabbit Lake and US ISR operations on care and maintenance |
In 2023, in our fuel services segment, we:
| • | delivered 12.0 million kgU under contract |
| • | produced 13.3 million kgU |
| • | received a 20-year licence renewal from the CNSC for Cameco Fuel Manufacturing (CFM). The licence renewal also grants CFM’s request for a slight production increase to 1,650 tonnes as UO2 fuel pellets. |
| • | commissioned a Closed Loop Cooling Water system at the Port Hope conversion facility, which is expected to provide environmental and operational improvements |
MANAGEMENT’S DISCUSSION AND ANALYSIS 19
See Operations and projects beginning on page 69 for more information.
HIGHLIGHTS | 2023 | 2022 | CHANGE | |||||||||||||
Uranium | Production volume (million lbs) | 17.6 | 10.4 | 69 | % | |||||||||||
Sales volume (million lbs) | 32.0 | 25.6 | 25 | % | ||||||||||||
Average realized price1 | ($US/lb) | 49.76 | 44.73 | 11 | % | |||||||||||
($Cdn/lb) | 67.31 | 57.85 | 16 | % | ||||||||||||
Revenue ($ millions) | 2,152 | 1,480 | 45 | % | ||||||||||||
Gross profit ($ millions) | 444 | 121 | >100 | % | ||||||||||||
Net earnings attributable to equity holders | 606 | 200 | >100 | % | ||||||||||||
Adjusted EBITDA (non-IFRS, see page 41) | 835 | 380 | >100 | % | ||||||||||||
| Fuel services | Production volume (million kgU) | 13.3 | 13.0 | 2 | % | |||||||||||
Sales volume (million kgU) | 12.0 | 11.1 | 8 | % | ||||||||||||
Average realized price 2 | ($Cdn/kgU) | 35.61 | 32.92 | 8 | % | |||||||||||
Revenue ($ millions) | 426 | 365 | 17 | % | ||||||||||||
Gross profit ($ millions) | 124 | 117 | 6 | % | ||||||||||||
Net earnings attributable to equity holders | 129 | 120 | 8 | % | ||||||||||||
Adjusted EBITDA (non-IFRS, see page 41) | 164 | 153 | 7 | % | ||||||||||||
Westinghouse | Revenue | 521 | — | — | ||||||||||||
(our share) | Net loss attributable to equity holders | (24 | ) | — | — | |||||||||||
Adjusted EBITDA (non-IFRS, see page 41) | 101 | — | — | |||||||||||||
| 1 | Uranium average realized price is calculated as the revenue from sales of uranium concentrate, transportation and storage fees divided by the volume of uranium concentrates sold. |
| 2 | Fuel services average realized price is calculated as revenue from the sale of conversion and fabrication services, including fuel bundles and reactor components, transportation and storage fees divided by the volumes sold. |
Industry prices
| 2023 | 2022 | CHANGE | ||||||||||
Uranium ($US/lb U3O8)1 | ||||||||||||
Average annual spot market price | 62.51 | 49.81 | 25 | % | ||||||||
Average annual long-term price | 58.20 | 49.75 | 17 | % | ||||||||
Fuel services ($US/kgU as UF6)1 | ||||||||||||
Average annual spot market price | ||||||||||||
North America | 41.23 | 31.96 | 29 | % | ||||||||
Europe | 41.23 | 31.96 | 29 | % | ||||||||
Average annual long-term price | ||||||||||||
North America | 30.55 | 24.75 | 23 | % | ||||||||
Europe | 30.55 | 24.94 | 22 | % | ||||||||
Note: the industry does not publish UO2 prices.
| 1 | Average of prices reported by TradeTech and UxC, LLC (UxC) |
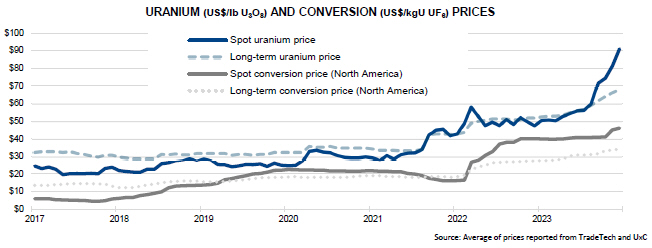
On the spot market, where purchases call for delivery within one year, the volume reported by UxC for 2023 decreased to 55 million pounds U3O8 equivalent, compared to 62 million pounds U3O8 equivalent in 2022. In 2023, total spot purchases by producers, junior uranium companies, financial funds and intermediaries was approximately 42 million pounds U3O8 equivalent, compared to approximately 53 million pounds U3O8 equivalent in 2022; in 2023, these purchases represented over 75% of spot market purchases compared to over 85% in 2022. At the end of 2023, the average reported spot price was $91.00 (US) per pound, up $43.33 (US) per pound from the end of 2022. During the year, the uranium spot price ranged from a month-end low of $50.48 (US) per pound to a month-end high of $91.00 (US) per pound, averaging $62.51 (US) for the year.
Long-term contracts generally call for deliveries to begin more than two years after the contract is finalized, and use a number of pricing formulas, including base-escalated prices set at time of contracting and escalated over the term of the contract, and market referenced prices (spot and long-term indicators) determined near the time of delivery, which also often include floor
20 CAMECO CORPORATION
prices and ceiling prices that are also escalated to time of delivery. The volume of long-term contracting reported by UxC for 2023 was about 160 million pounds U3O8 equivalent, up from about 125 million pounds U3O8 equivalent in 2022, including two contracts that combined totaled over 60 million pounds. Higher volumes can largely be attributed to utilities turning their attention to securing their long-term fuel needs to support the durable growth in demand for nuclear power and in light of the growing uncertainty of supply driven by heightened geopolitical tensions, and ongoing production challenges. The average reported long-term price at the end of the year was $68.00 (US) per pound, up $16.00 (US) from the end of 2022. During the year, the uranium long-term price steadily increased from a month-end low of $52.50 (US) per pound in January to a high of $68.00 (US) per pound in December, averaging $58.20 (US) for the year.
Since the Russian invasion of Ukraine in February 2022, conversion prices in both the North American and European markets have continued to increase. At the end of 2023, the average reported spot price for North American delivery reached a record high of $46.00 (US) per kilogram uranium as UF6 (US/kgU as UF6), up $6.00 (US) from the end of 2022. Long-term UF6 conversion prices for North American delivery finished 2023 at $34.25 (US/kgU as UF6), up $7.00 (US) from the end of 2022.
MANAGEMENT’S DISCUSSION AND ANALYSIS 21
Our vision, values and strategy
Our vision
Our vision – “Energizing a clean-air world” – recognizes that we have an important role to play in enabling the vast reductions in global GHG emissions required to achieve a resilient net-zero carbon economy. We support climate action that is consistent with the ambition of the Paris Agreement and the Canadian government’s corresponding commitment to limit global temperature rise to less than 2°C. We believe that this means the world needs to reach net-zero emissions by 2050 or sooner. The uranium we produce is used around the world in the generation of safe, carbon-free, affordable, base-load nuclear power.
We believe we have the right strategy to achieve our vision and we will do so in a manner that reflects our values. For 35 years, we have been delivering our products responsibly. Building on that strong foundation, we remain committed to our efforts to reduce our own, already low, greenhouse gas footprint in our ambition to reach net-zero emissions, while identifying and addressing the ESG risks and opportunities that we believe may have a significant impact on our ability to add long-term value for our stakeholders.
Committed to our values
Our values are discussed below. They define who we are as a company, are at the core of everything we do and help to embed ESG principles and practices as we execute on our strategy in pursuit of our vision. They are:
| • | safety and environment |
| • | people |
| • | integrity |
| • | excellence |
SAFETY AND ENVIRONMENT
The safety of people and protection of the environment are the foundations of our work. All of us share in the responsibility of continually improving the safety of our workplace and the quality of our environment.
We are committed to keeping people safe and conducting our business with respect and care for both the local and global environment.
PEOPLE
We value the contribution of every employee, and we treat people fairly by demonstrating our respect for individual dignity, creativity and cultural diversity. By being open and honest, we achieve the strong relationships we seek.
We are committed to developing and supporting a flexible, skilled, stable and diverse workforce, in an environment that:
| • | attracts and retains talented people and inspires them to be fully productive and engaged |
| • | encourages relationships that build the trust, credibility and support we need to grow our business |
INTEGRITY
Through personal and professional integrity, we lead by example, earn trust, honour our commitments and conduct our business ethically.
We are committed to acting with integrity in every area of our business, wherever we operate.
EXCELLENCE
We pursue excellence in all that we do. Through leadership, collaboration and innovation, we strive to achieve our full potential and inspire others to reach theirs.
22 CAMECO CORPORATION
Our strategy
We are a pure-play investment in the growing demand for nuclear energy, focused on taking advantage of the near-, medium-, and long-term growth occurring in our industry. We provide nuclear fuel and nuclear power products, services, and technologies across the fuel cycle, augmented by our investment in Westinghouse, that support the generation of clean, reliable, secure, and affordable energy. Our strategy is set within the context of what we believe is a transitioning market environment. Increasing populations, a growing focus on electrification and decarbonization, and concerns about energy security and affordability are driving a global focus on tripling nuclear power capacity by 2050, which is expected to durably strengthen the long-term fundamentals for our industry. Nuclear energy must be a central part of the solution to the world’s shift to a low-carbon, climate resilient economy. It is an option that can provide the power needed, not only reliably, but also safely and affordably, and in a way that will help avoid some of the worst consequences of climate change.
Our strategy is to capture full-cycle value by:
| • | remaining disciplined in our contracting activity, building a balanced portfolio in accordance with our contracting framework |
| • | profitably producing from our tier-one assets and aligning our production decisions in all segments of the fuel cycle with contracted demand and customer needs |
| • | being financially disciplined to allow us to: |
| • | execute our strategy |
| • | invest in new opportunities that are expected to add long-term value |
| • | to self-manage risk |
| • | exploring other emerging opportunities within the nuclear power value chain, which align with our commitment to manage our business responsibly and sustainably, contribute to decarbonization, and help to provide secure and affordable energy |
We expect our strategy will allow us to increase long-term value, and we will execute it with an emphasis on safety, people and the environment.
URANIUM
Uranium production is central to our strategy, as it is the biggest value driver of the nuclear fuel cycle and our business. We have tier-one assets that are licensed, permitted, long-lived, and are proven reliable with capacity to expand. These tier-one assets are backed up by idle tier-two assets and what we think is the best exploration portfolio of mineral reserves and resources that in some cases can leverage our existing infrastructure. Currently, we believe that we have ample productive capacity with the ability to expand as the demand for nuclear energy and nuclear fuel grows.
We are focused on protecting and extending the value of our contract portfolio, on aligning our production decisions with our contract portfolio and market opportunities thereby optimizing the value of our lowest cost assets. We also prioritize maintaining a strong balance sheet, and on efficiently managing the company. We have undertaken a number of deliberate and disciplined actions, including a focus on operational effectiveness to allow us to operate our assets more efficiently and with more flexibility.
FUEL SERVICES
Our fuel services segment supports our strategy to capture full-cycle value by providing our customers with access to refining and conversion services for both heavy-water and light-water reactors, and CANDU fuel and reactor component manufacturing for heavy-water reactors.
As in our uranium segment, we are focused on securing new long-term contracts and on aligning our production decisions with our contract portfolio that will allow us to continue to profitably produce and consistently support the long-term needs of our customers.
In addition, we are pursuing non-traditional markets for our UO2 and fuel fabrication business and have been actively securing new contracts for reactor components to support refurbishment of Canadian reactors.
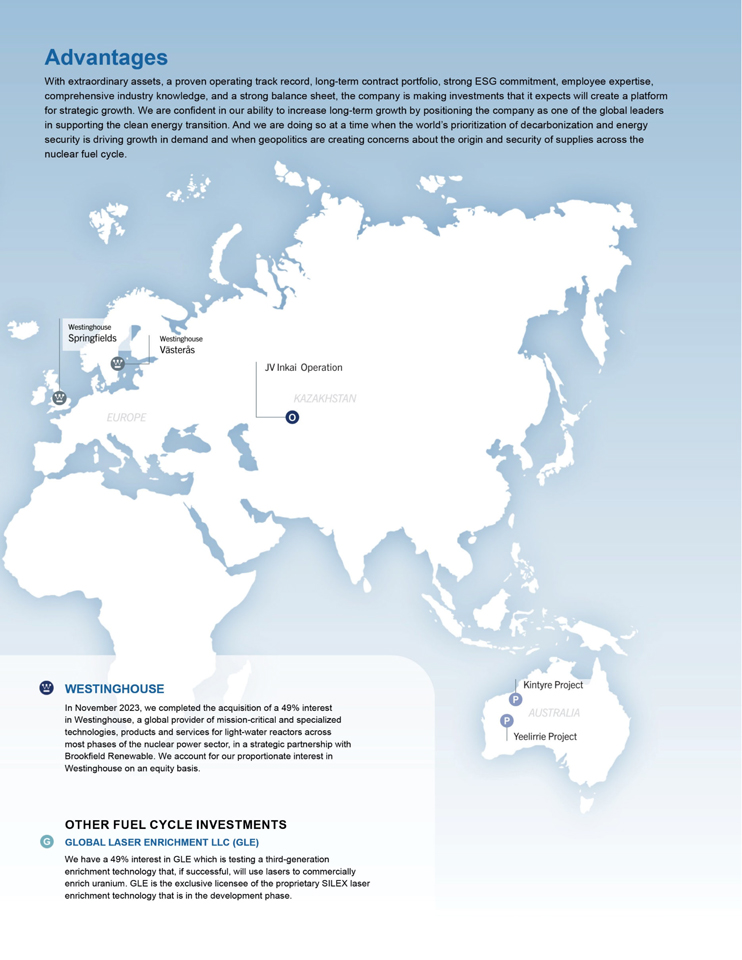
WESTINGHOUSE
In 2023, we completed the acquisition of Westinghouse, a global provider of mission-critical and specialized technologies, products and services for light-water reactors across most phases of the nuclear power sector, in a strategic partnership with Brookfield. We own a 49% interest in Westinghouse.
MANAGEMENT’S DISCUSSION AND ANALYSIS 23
We are enhancing our ability to compete for more business by investing in additional nuclear fuel cycle assets that we expect will augment the core of our business and offer more solutions to our customers across the nuclear fuel cycle. Like Cameco, Westinghouse has nuclear assets that are strategic, proven, licensed and permitted, and that are in geopolitically attractive jurisdictions. We expect these assets, like ours, will participate in the growing demand profile for nuclear energy.
Westinghouse has a stable and predictable core business generating durable cash flows. Like Cameco, Westinghouse has a long-term contract portfolio, which we believe positions it well to compete for growing demand for new nuclear reactors and reactor services, as well as the fuel supplies and services needed to keep the global reactor fleet operating safely and reliably. This strong base of business also helps protect Westinghouse from macro-economic headwinds as utility customers run their critical nuclear power plants. Its durable and growing business is expected to allow Westinghouse to self-fund its approved annual operating budget, to service its annual financial obligations from de-risked cash flows, and to pay annual distributions to its owners. See Westinghouse starting on page 94 for more information.
OTHER NUCLEAR FUEL CYCLE INVESTMENTS
We continually evaluate investment opportunities within the nuclear fuel value chain, which align well with our commitment to manage our business responsibly and sustainably, increase our contributions to decarbonization and help provide energy security. Expanding our participation in the fuel cycle is expected to complement our tier-one uranium and fuel services assets, creating new revenue opportunities, and it enhances our ability to meet the increasing needs of existing and new customers for secure, reliable nuclear fuel supplies, services and technologies.
In particular, we are interested in the second largest value driver of the fuel cycle, enrichment, and have a 49% interest in Global Laser Enrichment LLC (GLE). GLE is the exclusive licensee of the proprietary SILEX laser enrichment technology, a third-generation uranium enrichment technology. We are the commercial lead for the GLE project with an option to attain a majority interest of up to 75% ownership. See Global Laser Enrichment starting on page 99 for more information.
Additionally, we have signed a number of non-binding arrangements to explore several areas of cooperation to advance the commercialization and deployment of small modular reactors in Canada and around the world.
We will make an investment decision when an opportunity is available at the right time and the right price. We strive to pursue corporate development initiatives that will leave us and our stakeholders in a fundamentally stronger position. As such, an investment opportunity is never assessed in isolation. Investments must compete for investment capital with our own internal growth opportunities. They are subject to our capital allocation process described under Capital Allocation – Focus on Value, starting on page 30.
BUILDING A BALANCED PORTFOLIO
The purpose of our contracting framework is to deliver value. Our approach is to secure a solid base of earnings and cash flow by maintaining a balanced contract portfolio that optimizes our realized price.
Contracting decisions in all segments of our business need to consider the nuclear fuel market structure, the nature of our competitors, and the current market environment. The vast majority of run-rate fuel requirements are procured under long-term contracts. The spot market is thinly-traded where utilities buy small, discretionary volumes. This market structure is reflective of the baseload nature of nuclear power and the relatively small proportion of the overall operating costs the fuel represents compared to other sources of baseload electricity. Additionally, about half of the fuel supply typically comes from diversified mining companies that produce uranium as a by-product, or by state-owned entities with production volume strategies or ambitions to serve state nuclear power ambitions with low-cost fuel supplies. We evaluate our strategy in the context of our market environment and continue to adjust our actions in accordance with our contracting framework:
| • | First, we build a long-term contract portfolio by layering in volumes over time. In addition to our committed sales, we will compete for customer demand in the market where we think we can obtain value and, in general, as part of longer-term contracts. We will take advantage of opportunities the market provides, where it makes sense from an economic, logistical, diversification and strategic point of view. Those opportunities may come in the form of spot, mid-term or long-term demand, and will be additive to our current committed sales. |
| • | As we build our portfolio of long-term contracts, we decide how to best source material to satisfy that demand, planning our production in accordance with our contract portfolio and other available sources of supply. We will not produce from our tier-one assets to sell into an oversupplied spot market. |
24 CAMECO CORPORATION
| • | We do not intend to build an inventory of excess uranium. Excess inventory serves to contribute to the sense that uranium is abundant and creates an overhang on the market, and it ties up working capital on our balance sheet. |
| • | Depending on the timing and volume of our production, purchase commitments, and our inventory volumes, we may be active buyers in the market in order to meet our annual delivery commitments. Historically, prior to the supply curtailments that we began in 2016, we have generally planned our annual delivery commitments to slightly exceed the annual supply we expect to come from our annual production and our long-term purchase commitments and have therefore relied on the spot market to meet a small portion of our delivery commitments. In general, if we choose to purchase material to meet demand, we expect the cost of that material will be more than offset by the volume of commitments in our sales portfolio that are exposed to market prices at the time of delivery over the long-term. |
In addition to this framework, our contracting decisions always factor in who the customer is, our desire for regional diversification, the product form, and logistical factors.
Ultimately, our goal is to protect and extend the value of our contract portfolio on terms that recognize the value of our assets, including future development projects, and pricing mechanisms that provide adequate protection when prices go down and exposure to rising prices. We believe using this framework will allow us to create long-term value. Our focus will continue to be on ensuring we have the financial capacity to execute on our strategy and self-manage risk.
LONG-TERM CONTRACTING
Uranium is not traded in meaningful quantities on a commodity exchange. Utilities have historically bought the majority of their uranium and fuel services products under long-term contracts that are bilaterally negotiated with suppliers. The spot market is discretionary and typically used for one-time volumes, not to satisfy annual demand. We sell uranium and fuel products and services directly to nuclear utilities around the world as uranium concentrates, UO2 and UF6, conversion services, or fuel fabrication and reactor components for CANDU heavy water reactors. We have a solid portfolio of long-term sales contracts that reflect our reputation as a proven, reliable supplier of geographically stable supply, and the long-term relationships we have built with our customers.
In general, we are active in the market, buying and selling uranium when it is beneficial for us and in support of our long-term contract portfolio. We undertake activity in the spot and term markets prudently, looking at the prices and other business factors to decide whether it is appropriate to purchase or sell into the spot or term market. Not only is this activity a source of profit, but it also gives us insight into underlying market fundamentals.
We deliver the majority of our uranium under long-term contracts each year, some of which are tied to market-related pricing mechanisms quoted at time of delivery. Therefore, our net earnings and operating cash flows are generally affected by changes in the uranium price. Market prices are influenced by the fundamentals of supply and demand, market access and trade policy issues, geopolitical events, disruptions in planned supply and demand, and other market factors.
The objectives of our contracting strategy are to:
| • | optimize realized price by balancing exposure to future market prices while providing some certainty for our future earnings and cash flow |
| • | focus on meeting the nuclear industry’s growing annual uncovered requirements with our tier-one production |
| • | establish and grow market share with strategic and regionally diverse customers |
We have a portfolio of long-term contracts, each bilaterally negotiated with customers, that have a mix of base-escalated pricing and market-related pricing mechanisms, including provisions that provide exposure to rising market prices and also protect us when the market price is declining. This is a balanced and flexible approach that allows us to adapt to market conditions, put a floor on our average realized price and deliver the best value over the long term.
This approach has allowed our realized price to outperform the market during periods of weak uranium demand, and we expect it will enable us to realize increases linked to higher market prices in the future.
Base-escalated contracts for uranium: use a pricing mechanism based on a term-price indicator at the time the contract is accepted and escalated to time of each delivery over the term of the contract.
MANAGEMENT’S DISCUSSION AND ANALYSIS 25
Market-related contracts for uranium: are different from base-escalated contracts in that the pricing mechanism may be based on either the spot price or the long-term price, and that price is generally set a month or more prior to delivery rather than at the time the contract is accepted. These contracts may provide for discounts, and typically include floor prices and/or ceiling prices, which are established at time of contract acceptance and usually escalate over the term of the contract.
Fuel services contracts: the majority of our fuel services contracts use a base-escalated mechanism per kgU and reflect the market at the time the contract is accepted.
OPTIMIZING OUR CONTRACT PORTFOLIO
We work with our customers to optimize the value of our contract portfolio. With respect to new contracting activity, there is often a lag from when contracting discussions begin and when contracts are executed. With our large pipeline of business under negotiation in our uranium segment, and a value driven strategy, we continue to be strategically patient in considering the commercial terms we are willing to accept. We layer in contracts over time, with higher commitments in the near term and declining over time in accordance with utilities growing uncovered requirements. Demand may come in the form of off-market negotiations or through on-market requests for proposals. We remain confident that we can add acceptable new sales commitments to our portfolio of long-term contracts to underpin the ongoing operation of our productive capacity and capture long-term value.
Given our view that additional long-term supply will need to be incented to meet the growing demand for safe, clean, reliable, carbon-free nuclear energy, our preference today is to sign long-term contracts with market-related pricing mechanisms. However, we believe our customers expect prices to rise and prefer to lock-in today’s prices, with a fixed-price mechanism. Our goal is to balance all these factors, along with our desire for customer and regional diversification, with product form, and logistical factors to ensure we have adequate protection and will have exposure to rising market prices under our contract portfolio, while maintaining the benefits that come from having low-cost supply to deliver into a strengthening market.
With respect to our existing contracts, at times we may also look for opportunities to optimize the value of our portfolio. In cases where there is a changing policy, operating, or economic environment, we may consider adjusting our contracts in a manner that allow us to maintain our customer relationships and is mutually beneficial.
CONTRACT PORTFOLIO STATUS
We have executed contracts to sell approximately 205 million pounds of U3O8 with 37 customers worldwide in our uranium segment, and over 75 million kilograms as UF6 conversion with 33 customers worldwide in our fuel services segment.
Customers – U3O8:
Five largest customers account for 62% of commitments
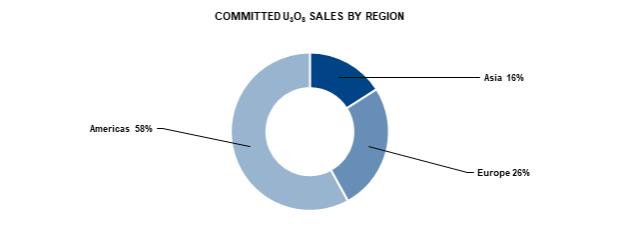
26 CAMECO CORPORATION
Customers – UF6 conversion:
Five largest customers account for 64% of commitments
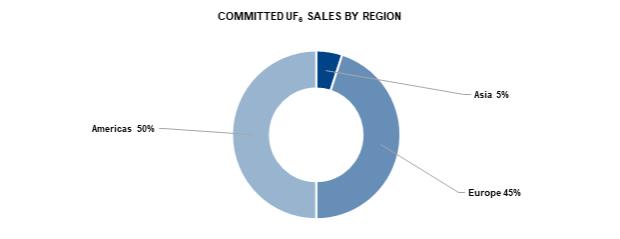
MANAGING OUR CONTRACT COMMITMENTS
We allow sales volumes to vary year-to-year depending on:
| • | the level of sales commitments in our long-term contract portfolio |
| • | market opportunities |
| • | our sources of supply |
To meet our delivery commitments and to mitigate risk, we have access to a number of sources of supply, which includes uranium obtained from:
| • | our productive capacity |
| • | purchases under our JV Inkai agreement, under long-term agreements and in the spot market |
| • | our inventory in excess of our working requirements |
| • | product loans |
OUR SUPPLY DISCIPLINE
As spot is not the fundamental market, true value is built under a long-term contract portfolio and is measured over the full commodity cycle. Therefore, we align our uranium production decisions with our contract commitments and market opportunities to avoid carrying excess inventory or having to sell into an oversupplied spot market. In accordance with market conditions, and to mitigate risk, we evaluate the optimal mix of our production, inventory and purchases in order to satisfy our contractual commitments and in order to realize the best return over the entire commodity cycle. During a prolonged period of uncertainty, this could mean leaving our uranium in the ground. For the years 2016 through 2022, we left more than 130 million pounds of uranium in the ground (100% basis) by curtailing our production. We purchased more than 60 million pounds including spot and long-term purchases and in 2018 we drew down our inventory by almost 20 million pounds. That totals over 210 million pounds (100% basis) of uranium that were not available to the market.
However, today we believe the uranium market is in transition, driven by the growing demand for nuclear energy and the increasing recognition that it is essential to the clean-energy transition and to energy security. As the market continues to transition, we expect to continue placing our uranium under long-term contracts and meet rising demand with production from our best margin operations.
MANAGEMENT’S DISCUSSION AND ANALYSIS 27
With the improvements in the market, the new long-term contracts we have put in place, and a pipeline of contracting discussions, we plan to produce 18 million pounds (100% basis) at McArthur River/Key Lake and Cigar Lake in 2024. Based on KAP’s announcement on February 1, 2024, production in Kazakhstan is expected to remain 20% below the level stipulated in subsoil use agreements, similar to in 2023, primarily due to the sulfuric acid shortage in the country. We are still in discussions with JV Inkai and KAP to determine how this may impact production at Inkai in 2024 and thereafter and therefore our corresponding purchase obligation. We also plan to begin the work necessary to extend the mine life at Cigar Lake subject to approval of Orano’s board. In addition, we plan to undertake the evaluation of the work and investment necessary to expand production at McArthur River/Key Lake up to its annual licensed capacity of 25 million pounds, which we expect will allow us to take advantage of this opportunity when the time is right.
Our production decisions will continue to be aligned with market opportunities and our ability to secure the appropriate long-term contract homes for our unencumbered, in-ground inventory, demonstrating that we continue to responsibly manage our assets in accordance with our customers’ needs.
In addition to our uranium production plans, we plan to produce 12,000 tonnes at our Port Hope UF6 conversion facility in 2024 to satisfy our book of long-term business for conversion services and customer demand, at a time when conversion prices are at historic highs.
Our production plans for McArthur River/Key Lake and Cigar Lake are expected to generate strong financial performance by allowing us to source more of our committed sales from the lower-cost produced pounds. In addition, with conversion demand elevated, we have been successful in securing long-term sales commitments that will support increased UF6 production at Port Hope, which is expected to further improve its contribution to our financial results. However, this is not an end to our supply discipline. We expect to continue to adjust our production in accordance with our contract portfolio. This will remain our production plan until we see further improvements in the uranium market and contracting progress, once again demonstrating that we are a responsible fuel supplier.
MANAGING OUR COSTS
Production costs
In order to operate efficiently and cost-effectively, we manage operating costs and improve plant reliability by prudently investing in production infrastructure, new technology, and business process improvements. Like all mining companies, our uranium segment is affected by the cost of inputs such as labour and fuel.
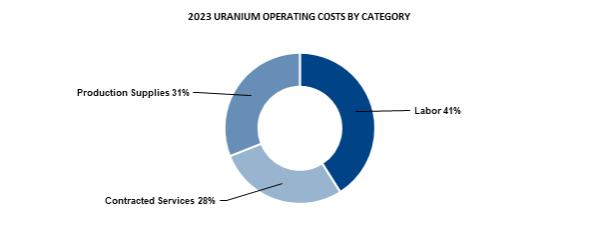
| * | Production supplies include reagents, fuel and other items. Contracted services include utilities and camp costs, air charters, mining and maintenance contractors and security and ground freight. |
28 CAMECO CORPORATION
Over the last number of years, the annual cash cost of production reflected the operating cost of mining and milling our share of Cigar Lake as this was our only operating site. With the restart of the McArthur River/Key Lake operations the annual cost of production will reflect a combined cost of all our operating uranium assets. See 2023 financial results by segment – Uranium starting on page 61 for more information. In 2024, our cash production costs may continue to be affected by inflation, the availability of personnel with the necessary skills and experience, supply chain challenges impacting the availability of materials and reagents, and our continued efforts to ramp up to planned production at McArthur River/Key Lake.
Operating costs in our fuel services segment are mainly fixed. In 2023, labour accounted for about 56% of the total. The largest variable operating cost is for anhydrous hydrogen fluoride, followed by zirconium, and energy (natural gas and electricity).
We continue to look to adopt innovative and advanced digital and automation technologies to improve efficiency and operational flexibility and to further reduce cost.
Care and maintenance costs
In 2024, we expect to incur between $50 million and $60 million in care and maintenance costs related to the suspension of production at our Rabbit Lake mine and mill, and our US operations. Production at these operations are higher-cost and a restart is less certain. We continue to evaluate our options in order to minimize these costs.
Purchases and inventory costs
Our costs are also affected by the purchases of uranium and conversion services we make under long-term contracts and on the spot market.
To meet our delivery commitments, we make use of our mined production, inventories, purchases of our share of material from Inkai, purchases under long-term contracts, purchases we make on the spot market and product loans. In 2024, we expect the price for the majority of our purchases will be quoted at the time of delivery.
The cost of purchased material may be higher or lower than our other sources of supply, depending on market conditions. The cost of purchased material affects our cost of sales, which is determined by calculating the average of all of our sources of supply, including opening inventory, production, and purchases, and adding royalties, selling costs, and care and maintenance costs. Our cost of sales could be impacted if we do not achieve our annual production plan, or if we are unable to source uranium as planned, and we are required to purchase uranium at prices that differ from our cost of inventory.
Financial impact
The growing demand for nuclear power due to its safety, clean energy, reliability, security and affordability attributes has contributed to increased demand for nuclear fuel products and services. As a result, we have seen significant price increases across the nuclear fuel value chain, which reflect the need for capacity increases to satisfy the projected growth.
The deliberate and disciplined actions we took to curtail production and streamline operations over the past decade came with near-term costs like care and maintenance costs, operational readiness costs, and purchase costs higher than our production costs. However, we considered these costs as investments in our future.
Today, thanks to our investments, and with our continued ability to secure new long-term sales commitments, we believe we are well-positioned for growth. Our core growth is expected to come from our existing tier-one mining and fuel services assets. We do not have to build new capacity to pursue new opportunities. We have sufficient productive capacity to expand, a position we have not enjoyed in previous price cycles.
And, with the acquisition of a 49% interest in Westinghouse, we expect to be able to expand our growth profile by extending our reach in the nuclear fuel cycle at a time when there are tremendous tailwinds for the nuclear power industry. We are extending our reach with an investment in assets, that like ours, are strategic, proven, licensed and permitted, that are located in geopolitically favourable jurisdictions, and that we expect will be able to grow from their existing footprint. These assets are also expected to provide new opportunities for our existing suite of uranium and fuel services assets.
We believe our actions and investments have helped position the company to self-manage risk and as we make the transition back to a tier-one run rate, we expect to generate strong financial performance, allowing us to execute on our strategy while rewarding our stakeholders for their continued patience and support of our strategy to build long-term value.
MANAGEMENT’S DISCUSSION AND ANALYSIS 29
CAPITAL ALLOCATION – FOCUS ON VALUE
Delivering long-term value is a top priority. While we navigate by our investment-grade rating, we continually evaluate our investment options to ensure we allocate our capital in a way that we believe will:
| • | sustain our assets and grow our core business in a manner that we expect will create sustainable long-term value |
| • | maintain a strong balance sheet that will allow us to execute on our strategy, take advantage of strategic opportunities and self-manage risk |
| • | allow us to sustainably execute on our dividend while considering the cyclical nature of our earnings and cash flow |
To deliver value, free cash flow must be productively reinvested in the business. We start by determining how much cash we have to invest (investable capital). Investable capital takes into account, our expected cash flow from operations, including the expected cash distributions from JV Inkai and our Westinghouse investment, minus the cash required to satisfy our financing costs, for working capital purposes, and the other uses of cash we consider to be higher priority, such as dividends. This investable capital can be reinvested in the core business of the company, including to manage the physical and transition risks and opportunities associated with changing climate conditions, or to take advantage of new opportunities in line with our long-term strategy. If after consideration of investment opportunities there is excess investable capital available, it can be considered for debt reduction, or shareholder returns.
Reinvestment
We have a multidisciplinary capital allocation committee that evaluates all sustaining, capacity replacement, or growth investment opportunities.
These opportunities are ranked using return criteria that includes both financial and non-financial metrics, with a current priority focus on five main value drivers:
| • | cost reduction |
| • | emission reduction |
| • | operational flexibility |
| • | improving safety performance |
| • | enabling digital technology |
Only those that meet the required risk-adjusted return criteria are considered for investment. We also must identify, at the corporate level, the expected impact on cash flow, earnings, and the balance sheet. All project risks must be identified, including the risks of not investing. Allocation of capital only occurs once an investment has cleared these hurdles.
This may result in some opportunities being held back in favour of higher return investments and should allow us to generate the best return on investment decisions when faced with multiple prospects, while also controlling our costs and meeting ESG objectives, including achieving the 30% reduction in our GHG emissions by 2030 compared to 2015 levels.
Return
We believe in returning cash to shareholders under appropriate circumstances but are also focused on protecting the company and rewarding those shareholders who understand and support our strategy to build long-term value. If we have excess cash and determine the best use is to return it to shareholders, we can do that through a share repurchase or dividend—an annual dividend, one-time supplemental dividend or a progressive dividend. The decision to return capital and the type of return is evaluated regularly by our board of directors with careful consideration of our cash flow, financial position, strategy, and other relevant factors including appropriate alignment with the cyclical nature of our earnings. For example, in 2022, the board increased the dividend by 50% to reflect the expected improvement in our financial performance as we began the transition to our tier-one run rate.
In Action
The current objective of our capital allocation will be to ensure we have the financial capacity to execute on our 2024 production plan and to return to our tier-one cost structure. In addition, we expect to allocate the capital necessary to allow us to begin work on extending the mine life at Cigar Lake and to undertake evaluation of the work and investment required to expand production at McArthur River/Key Lake up to its licensed capacity of 25 million pounds per year (100% basis).
30 CAMECO CORPORATION
We will maintain our focus on improving operational effectiveness across the company through for example, the use of digital and automation technologies. The particular goals of this work being to reduce operating costs, increase operational flexibility, improve our safety performance and reduce our impact on the environment, including the reduction of our GHG emissions.
Over the coming months, we will look for an opportunity to refinance the $500 million senior unsecured debenture maturing on June 24, 2024, prior to maturity or as it comes due. Ultimately our decision will be made with consideration for our cash generation, the interest rate environment and other capital allocation considerations. In addition, we have initiated a partial repayment of $200 million (US) on the $600 million (US) floating-rate term loan that was used to finance the acquisition of Westinghouse. The prepayment will be applied to the $300 million (US) tranche which matures in November 2026. See Liquidity and capital resources – Financing Activities starting on page 54 for more information about the term loan.
We will continue to navigate by our investment-grade rating through close management of our balance sheet metrics, maintaining sufficient liquidity, including a minimum cash balance for working capital requirements and that would allow us to pursue other value-adding opportunities. If the market transition continues as expected, our priorities might include consideration of:
| • | the opportunities available to add value with our licensed and permitted tier-two assets and brownfield infrastructure |
| • | further value-adding opportunities in the nuclear fuel value chain |
| • | the return of excess cash to shareholders |
Any opportunities will be rigorously assessed by our capital allocation committee before an investment decision is made.
Shares and stock options outstanding
At February 6, 2024, we had:
| • | 434,175,752 common shares and one Class B share outstanding |
| • | 1,396,289 stock options outstanding, with exercise prices ranging from $11.32 to $16.38 |
Dividend
In 2023, our board of directors declared a dividend of $0.12 per common share, which was paid December 15, 2023. See the section titled Return on page 30 for more information regarding the factors the board considers in deciding to declare an annual dividend.
MANAGEMENT’S DISCUSSION AND ANALYSIS 31
Our ESG principles and practices
A key part of our strategy, reflecting our values
We are committed to delivering our products responsibly. We integrate ESG principles and practices into every aspect of our business, from our corporate objectives and approach to compensation, to our overall corporate strategy, risk management, and day-to-day operations, and they align with our values. We seek to be transparent with our stakeholders, keeping them updated on the risks and opportunities that we believe may have a significant impact on our ability to achieve our strategic plan and add long-term value. We recognize the importance of integrating certain ESG factors, such as safety performance, a clean environment and supportive communities, into our executive compensation strategy as we see success in these areas as critical to the long-term success of the company.
Our board of directors holds the highest level of oversight for our business strategy and strategic risks, including ESG matters and climate-related risks. Oversight of ESG and climate-related reporting and disclosure has been delegated by the board to the Safety, Health and Environment (SHE) committee of the board. We also have a multi-disciplinary ESG steering committee, chaired by our senior vice-president and chief corporate officer that includes representatives from across the organization whose role is to review our ESG governance and reporting, and our current approach to sustainability, against evolving trends. Additional information about our governance of ESG matters is included in our most recent ESG report.
In an effort to continually evolve the robustness of our sustainability commitments and communications, starting in 2020, we aligned our ESG performance indicators with the ones recommended by the Sustainability Accounting Standards Board (SASB). In addition, we began addressing the recommendations of the Task Force on Climate-Related Financial Disclosures (TCFD) in our ESG report. In 2022, we continued to progress our work, conducting a gap analysis to identify how we could better align to TCFD recommendations. Key findings from this work were actioned throughout 2022 and 2023, including the undertaking of physical and transition-related climate scenario analyses to inform our overarching climate strategy. In 2023, the IFRS published its first two sustainability standards, S1 sustainability disclosure standard and S2 climate-related disclosure via the International Sustainability Standards Board. While it is unclear when and to what extent the Canadian Securities Administrators may adopt these standards at this point, we have begun the work to better understand the requirements under these standards and how our current reporting aligns with these standards.
In July 2023, we published our 2022 ESG report. The report sets out our strategy and the policies and programs we use to govern and manage ESG issues that are important to our stakeholders. In addition to SASB and TCFD, the report provides key ESG performance indicator data based on the Global Reporting Initiative’s Sustainability Framework as well as some unique corporate indicators, to measure and report our performance on environmental, social and economic impacts in the areas we believe have a significant impact on our sustainability in the long-term and are important to our stakeholders. This is our ESG report card to our stakeholders. You can find our report at cameco.com/about/sustainability.
ENVIRONMENT
We recognize the critical nature of the fight against climate change, and want our employees, customers, investors, and community partners near our operations to know we are committed to being an active and constructive partner in addressing this challenge. The reduction of carbon and greenhouse gas (GHG) emissions is important and necessary in Canada and around the world. Policy makers and major industries recognize that nuclear power must be a central part of the solution to the world’s shift to a low-carbon, climate-resilient economy. Several nations have reaffirmed their commitments to nuclear power and are developing plans to support existing reactors and are reviewing their policies to encourage more nuclear capacity. There are now 28 countries that have signed on to the declaration that was launched at COP28 to triple nuclear energy capacity by 2050.
As one of the world’s largest producers of the uranium needed to fuel nuclear reactors, we believe this represents a significant opportunity for us to be part of the solution to combat climate change given 100% of our product is used to produce clean, carbon-free base-load electricity. We enable vast emissions reductions globally through nuclear power and are committed to transforming our already low operational GHG emissions footprint to achieve our ambition of having net-zero emissions while delivering significant long-term business value. In the 35 years we have been in business, we have sold over 954 million pounds of product for nuclear power generation. By reducing the need for fossil-fuel based electricity, this has avoided up to 16 billion tonnes of CO2e emissions, equivalent to removing all gas-powered vehicles in the world from operation for 3.5 years.
32 CAMECO CORPORATION
Recently, we put further support behind our commitment to climate action and our vision of energizing a clean-air world by joining Net Zero Nuclear as a corporate partner. Net Zero Nuclear is an initiative between government, industry leaders and civil society to triple global nuclear capacity to achieve carbon neutrality by 2050. We join the initiative as a Gold Partner, deepening industry support for this initiative, which was launched by the World Nuclear Association and the Emirates Nuclear Energy Corporation, with the support of the Atoms4NetZero initiative launched by the International Atomic Energy Agency at the 2023 World Nuclear Symposium in London.
In 2022, we undertook a planning process to outline our overarching Low Carbon Transition Plan. Within this plan, we set a target to reduce our Scope 1 and 2 GHG emissions by 30% by 2030, from 2015 levels. We also identified the practical and achievable actions that we expect to take to decarbonize our operations and manage climate-related risks. In doing so, we are demonstrating our alignment with the ambitions of the Paris Agreement to, “limit global temperature rise to well below 2 degrees Celsius (°C), above pre-industrial levels, and to pursue efforts to limit global temperature rise even further to 1.5°C”. Our Low Carbon Transition Plan provides a foundation for managing our climate-related physical and transition risks, and it supports us in better aligning with the Government of Canada’s Net Zero Accountability Act and 2030 Emission Reduction Plan.
We recognize that climate change, including shifts in temperature, precipitation and more frequent severe weather events could affect our operations in a range of possible ways. As part of our Low Carbon Transition Plan, we have completed climate change scenario analyses to understand how projected long-term changing climate conditions could impact our employees, assets, and operations in northern Saskatchewan and Ontario, Canada. We leveraged internal subject matter expertise with help from a third-party expert to complete the assessments.
The physical risk assessment studies were undertaken to deliver initial forward-looking physical climate risk assessments and identify possible risk management and adaptation options across our mining, milling and fuel services operations. In 2024, we will focus on updating the findings from these physical climate risk assessments into our internal risk management review and developing an adaptation action plan template. The template will support the development of site-specific adaptation plans for each of our Canadian operations. We are targeting the completion of physical climate risk assessments for all our majority owned and operated facilities by the end of 2026.
We will continue to explore climate change projections for the areas where we operate and those critical to moving supplies and products through our value chain. We will use this information to identify where our existing climate-related acute and chronic risk management practices are expected to remain sufficient in the years to come and where adaptation and other enhancements may be required.
When it comes to climate change, we have tracked and reported our GHG emissions for more than two decades. A summary of our activities to understand and mitigate the risks associated with climate change scenarios is reported to the board of directors on a regular basis in accordance with our Enterprise Risk Management program, including the mitigating controls and management actions taken to reduce these risks.
To support achieving our 2030 GHG emissions reduction target, we implemented a 2023 compensable target to create tailored decarbonization pathways for each operationally controlled site. The 2023 work included an evaluation of over 160 decarbonization project ideas solicited from across the organization. Project ideas were evaluated based on cost, emissions reduction potential, implementation timeline, and other co-benefits as outlined by the climate action factors recently integrated within our Capital Allocation Committee process. The site-specific decarbonization pathways also included the development of practical project implementation timelines considering life of asset plans for each operation and technological readiness of the relevant technologies. Decarbonization efforts are already underway across our five decarbonization themes: efficiency, electrification, waste to value, fuel switching and carbon economy.
MANAGEMENT’S DISCUSSION AND ANALYSIS 33
Over the past few years, we have put significant effort towards efficiency, our first decarbonization theme. We have been focused on improving the visibility of energy consumption within our organization and implementing improvements to reduce energy consumption. We have already enjoyed some significant success in our efforts to reduce our energy use and GHG emissions to date. For example, at our Port Hope conversion facility, we have achieved a 28% reduction to peak power demand and more than $2.1 million in annual energy savings with projects such as HVAC and compressed air system upgrades and lighting efficiency retrofits. In 2023, the Port Hope Closed Loop Cooling Water system was commissioned, eliminating the need to draw water from the nearby harbour. With the new closed loop system, the operation is no longer dependent on the temperature or quality of the lake water. This project has positive benefits for both the overall reliability and our environmental footprint, decreasing the energy required to change the temperature of the water and eliminating the risk of environmental releases to the lake.
At our northern Saskatchewan mining and milling operations, recent efforts have focused on the implementation of an Energy Management Information System (EMIS) in alignment with our larger digital transformation efforts. The EMIS improves our ability to visualize, monitor, and manage our energy use and emissions profile in real time. Ultimately, EMIS gives those operations the ability to identify where our highest impact emissions reduction opportunities exist and assurance that the actions we have taken are maintained over time. Two projects were advanced in 2023 at our northern Saskatchewan operations: LED lighting updates to Key Lake and Ventilation-on-Demand at McArthur River. At Key Lake, we have made upgrades in lighting, updating to LED, translating to annual reductions of approximately 725,000 kWh electricity savings or 375 tonnes of CO2e. Additionally, this project improves operator comfort and safety when working in these areas. At McArthur River, the Ventilation-on-Demand project is currently underway. It includes mine ventilation upgrades to surface heater fans and underground ventilation dampers to enable a reduction in both electricity and propane consumption.
SOCIAL
Our relationships with our workforce, Indigenous Peoples, and local communities are fundamental to our success. The safety and protection of our workforce and the public is our top priority in our assessment of risk and planning for safe operations and product transport. To deliver on our vision, we invest in programs to attract and retain a diverse and skilled workforce that better reflects the communities in which we operate and to increase the participation of underrepresented groups in trades and technical positions. We want to build a workforce that is dedicated to continuous improvement and shares our values.
We have a five-pillar approach to develop and maintain long-term relationships and provide opportunities to those living in areas near our operations. The five-pillars include workforce development, business development, community investment, environmental stewardship, and community engagement. To strengthen relationships and shape them into mutually beneficial partnerships, we have collaboration agreements in northern Saskatchewan and Ontario that follow this approach. These agreements allow us to collaboratively determine focus areas based on a community’s unique needs, optimizing benefits to the community, providing certainty around community investment and local business opportunities.
GOVERNANCE
We believe that sound governance is the foundation for strong corporate performance. Our diverse and independent board of directors’ primary role is to provide strategic direction and risk oversight in order to help the company achieve its vision of “energizing a clean-air world”. The board guides the company to operate as a sustainable business, to optimize financial returns while effectively managing risk, and to conduct business in a way that is transparent, independent, and ethical.
The board has formal governance guidelines that set out our approach to governance and the board’s governance role and practices. The guidelines ensure we comply with all of the applicable governance rules and legislation in Canada and the US, conduct ourselves in the best interests of our stakeholders, and meet industry best practices. The guidelines are reviewed and updated regularly.
Our corporate governance framework includes an established and recognized management system that describes the policies, processes and procedures we use to help us fulfill all the tasks required to achieve our objectives and strategy. It sets out our vision, values, and measures of success. It speaks to our strategic planning process, leadership alignment and accountability, compliance and assessment, people and culture, process identification and work management, risk management, communications and stakeholder support, knowledge and information management, change management, problem identification and resolution, and continual improvement.
34 CAMECO CORPORATION
Risk and Risk Management
Our board of directors oversees management’s implementation of appropriate risk management processes and controls. We have a Risk Policy that is supported by our formal Risk Management Program.
Our Risk Management Program involves a broad, systematic approach to identifying, assessing, monitoring, reporting and managing the significant risks we face in our business and operations, including consideration of ESG and climate-related risks and cyber risks that could impact our four measures of success. The program is based on the ISO 31000 Risk Management guidelines. ISO 31000 provides guidance on risk management activities with internationally recognized practices and provides sound principles for effective management and governance of risks. Our program applies to all risks facing the company, including climate-related risks. The program establishes clear accountabilities for employees throughout the company to take ownership of risks specific to their area and to effectively manage those risks. The program is reviewed annually to ensure that it continues to meet our needs.
We use a common risk matrix throughout the company. Any risk that has the potential to significantly affect our ability to achieve our corporate objectives or strategic plan is considered an enterprise risk and is brought to the attention of senior management and the board. We continually update our risk profile by performing regular monitoring of risks across the organization. Regular monitoring helps us to properly manage risks and identify any new risks. Detailed risk reporting is provided on a quarterly basis to senior management and the board and its committees on the status of the mitigating and/or monitoring plans for each of the enterprise risks. Management also reviews monthly updates on the company’s progress in managing these risks.
In addition to considering the other information in this MD&A, you should carefully consider the material risks discussed starting on page 4, under the heading Managing the risks, starting on page 70, and the specific risks discussed under each operation, advanced project, and other fuel cycle investment update in this document. These risks, however, are not a complete list of the potential risks our operations, advanced projects, or other investments face. There may be others we are not aware of or risks we feel are not material today that could become material in the future.
We recommend you also review our annual information form, which includes a discussion of other material risks that could have an impact on our business.
MANAGEMENT’S DISCUSSION AND ANALYSIS 35
Measuring our results
Targets and Metrics: The link between ESG factors and executive pay
Each year, we set corporate objectives that are aligned with our strategic plan. These objectives fall under our four measures of success: outstanding financial performance, safe, healthy and rewarding workplace, clean environment and supportive communities. Performance against specific targets under these objectives forms the foundation for a portion of annual employee and executive compensation. See our most recent management proxy circular for more information on how executive compensation is determined.
While we saw a significant improvement in our financial performance (earnings and cash flow) as our tier-one production increases and our average realized price reflects the improving market, our results still do not reflect our expected long-term run rate performance. As our long-term contract portfolio continues to grow and our tier-one production continues to ramp up, we believe that the strategic actions we have taken have helped to pave the way to stronger financial performance over time. Additionally, we will not compromise our commitment to safety, people and our environment.
2023 OBJECTIVES1 | TARGET | RESULTS | ||
| OUTSTANDING FINANCIAL PERFORMANCE | ||||
| Earnings measure | Achieve targeted adjusted net earnings. | • adjusted net earnings was above the target | ||
| Cash flow measure | Achieve targeted cash flow from operations (before working capital changes). | • cash flow from operations was below the target | ||
| SAFE, HEALTHY AND REWARDING WORKPLACE | ||||
| Workplace safety measure | Strive for no injuries at all Cameco-operated sites. Maintain a long-term downward trend in combined employee and contractor total recordable injury rate while achieving targets on specified leading indicators. | • we did not achieve our target for TRIR
• performance of the leading indicators was above the target range | ||
| CLEAN ENVIRONMENT | ||||
| Environmental performance measures | Achieve corporate environmental targets.
Develop tailored decarbonization pathways for operationally controlled sites. | • performance on corporate environmental targets was within the target range
• Completed decarbonization pathways for all operationally controlled sites | ||
| SUPPORTIVE COMMUNITIES | ||||
| Stakeholder support measure | Enhance the skill set of Residents of Saskatchewan’s North (RSN) for changing industrial environments | • RSN skill enhancement was above the target | ||
| 1 | Detailed results for our 2023 corporate objectives and the related targets will be provided in our 2024 management proxy circular prior to our Annual Meeting of Shareholders on May 9, 2024. |
36 CAMECO CORPORATION
2024 objectives
OUTSTANDING FINANCIAL PERFORMANCE
| • | Achieve targeted financial measures. |
SAFE, HEALTHY AND REWARDING WORKPLACE
| • | Improve workplace safety performance at all sites. |
CLEAN ENVIRONMENT
| • | Improve environmental performance at all sites and continue to execute on our Low Carbon Transition Plan. |
SUPPORTIVE COMMUNITIES
| • | Build and sustain strong stakeholder support for our activities. |
MANAGEMENT’S DISCUSSION AND ANALYSIS 37
Financial results
This section of our MD&A discusses our performance, financial condition and outlook for the future.
39 | 2023 CONSOLIDATED FINANCIAL RESULTS | |
51 | OUTLOOK FOR 2024 | |
54 | LIQUIDITY AND CAPITAL RESOURCES | |
61 | 2023 FINANCIAL RESULTS BY SEGMENT | |
61 | URANIUM | |
62 | FUEL SERVICES | |
63 | WESTINGHOUSE | |
64 | FOURTH QUARTER FINANCIAL RESULTS | |
64 | CONSOLIDATED RESULTS | |
67 | URANIUM | |
68 | FUEL SERVICES |
38 CAMECO CORPORATION
2023 consolidated financial results
During the fourth quarter, we announced the closing of the acquisition of a 49% interest in Westinghouse. Effective November 7, 2023, we began equity accounting for this investment. Our share of Westinghouse’s earnings has been reflected in our financial results from that date.
In the second quarter of 2022, we along with Orano acquired Idemitsu Canada Resources Ltd.’s 7.875% participating interest in the Cigar Lake Joint Venture. Our ownership stake in Cigar Lake now stands at 54.547%, 4.522 percentage points higher than it was prior to the transaction. Effective May 19, 2022, we have reflected our share of production and financial results based on this new ownership stake.
| HIGHLIGHTS | CHANGE FROM | |||||||||||||||
DECEMBER 31 ($ MILLIONS EXCEPT WHERE INDICATED) | 2023 | 2022 | 2021 | 2022 TO 2023 | ||||||||||||
Revenue | 2,588 | 1,868 | 1,475 | 39 | % | |||||||||||
Gross profit | 562 | 233 | 2 | >100 | % | |||||||||||
Net earnings (loss) attributable to equity holders | 361 | 89 | (103 | ) | >100 | % | ||||||||||
$ per common share (basic) | 0.83 | 0.22 | (0.26 | ) | >100 | % | ||||||||||
$ per common share (diluted) | 0.83 | 0.22 | (0.26 | ) | >100 | % | ||||||||||
Adjusted net earnings (loss) (non-IFRS, see page 41) | 339 | 135 | (98 | ) | >100 | % | ||||||||||
$ per common share (adjusted and diluted) | 0.78 | 0.33 | (0.25 | ) | >100 | % | ||||||||||
Adjusted EBITDA (non-IFRS, see page 41) | 831 | 431 | 194 | 93 | % | |||||||||||
Cash provided by operations | 688 | 305 | 458 | >100 | % | |||||||||||
Net earnings
The following table shows what contributed to the change in net earnings in 2023 compared to 2022 and 2021.
($ MILLIONS) | 2023 | 2022 | 2021 | |||||||||||
Net earnings (losses) - previous year | 89 | (103 | ) | (53 | ) | |||||||||
|
|
|
|
|
| |||||||||
Change in gross profit by segment | ||||||||||||||
(we calculate gross profit by deducting from revenue the cost of products and services sold, and depreciation and amortization (D&A), net of hedging benefits) |
| |||||||||||||
Uranium | Impact from sales volume changes | 30 | (6 | ) | (4 | ) | ||||||||
Higher realized prices ($US) | 208 | 328 | 5 | |||||||||||
Foreign exchange impact on realized prices | 95 | 44 | (72 | ) | ||||||||||
Higher costs | (9 | ) | (137 | ) | (55 | ) | ||||||||
|
|
|
|
|
| |||||||||
change – uranium | 324 | 229 | (126 | ) | ||||||||||
|
|
|
|
|
| |||||||||
Fuel services | Impact from sales volume changes | 9 | (21 | ) | 1 | |||||||||
Higher realized prices ($Cdn) | 32 | 33 | 23 | |||||||||||
Higher costs | (34 | ) | (13 | ) | (2 | ) | ||||||||
|
|
|
|
|
| |||||||||
change – fuel services | 7 | (1 | ) | 22 | ||||||||||
|
|
|
|
|
| |||||||||
Other changes | ||||||||||||||
Lower (higher) administration expenditures | (74 | ) | (44 | ) | 17 | |||||||||
Lower (higher) exploration expenditures | (7 | ) | (3 | ) | 3 | |||||||||
Change in reclamation provisions | 31 | (31 | ) | 32 | ||||||||||
Change in gains or losses on derivatives | 111 | (86 | ) | (24 | ) | |||||||||
Change in foreign exchange gains or losses | (58 | ) | 74 | (14 | ) | |||||||||
Change in earnings from equity-accounted investments | 60 | 26 | 32 | |||||||||||
Redemption of Series E debentures in 2020 | — | — | 24 | |||||||||||
Canadian Emergency Wage Subsidy | — | (21 | ) | (16 | ) | |||||||||
Bargain purchase gain on CLJV ownership interest increase | (23 | ) | 23 | — | ||||||||||
Higher (lower) finance income | 75 | 30 | (4 | ) | ||||||||||
Higher finance costs | (30 | ) | (9 | ) | (5 | ) | ||||||||
Change in income tax recovery or expense | (130 | ) | 3 | 15 | ||||||||||
Other | (14 | ) | 2 | (6 | ) | |||||||||
|
|
|
|
|
| |||||||||
Net earnings (losses) - current year | 361 | 89 | (103 | ) | ||||||||||
|
|
|
|
|
| |||||||||
MANAGEMENT’S DISCUSSION AND ANALYSIS 39
Average realized prices
| CHANGE FROM | ||||||||||||||||||||
| 2023 | 2022 | 2021 | 2022 TO 2023 | |||||||||||||||||
Uranium1 | $ | US/lb | 49.76 | 44.73 | 34.53 | 11 | % | |||||||||||||
| $ | Cdn/lb | 67.31 | 57.85 | 43.34 | 16 | % | ||||||||||||||
|
|
|
|
|
|
|
| |||||||||||||
Fuel services | $ | Cdn/kgU | 35.61 | 32.92 | 29.72 | 8 | % | |||||||||||||
|
|
|
|
|
|
|
| |||||||||||||
| 1 | Average realized foreign exchange rate ($US/$Cdn): 2023 – 1.35, 2022 – 1.29 and 2021 – 1.26. |
Revenue
The following table shows what contributed to the change in revenue for 2023.
($ MILLIONS) | ||||
Revenue – 2022 | 1,868 | |||
|
| |||
Uranium | ||||
Higher sales volume | 370 | |||
Higher realized prices ($Cdn) | 303 | |||
|
| |||
Fuel services | ||||
Higher sales volume | 28 | |||
Higher realized prices ($Cdn) | 32 | |||
|
| |||
Other | (13 | ) | ||
|
| |||
Revenue – 2023 | 2,588 | |||
|
| |||
See 2023 Financial results by segment on page 61 for more detailed discussion.
THREE-YEAR TREND
In 2022, revenue increased by 27% compared to 2021 due to an increase in the average realized price and sales volume in the uranium segment. In our fuel services segment, revenue decreased by 10% as a result of a decrease in sales volume partially offset by an increase in average realized price.
In 2023, revenue increased by 39% compared to 2022 due to a 45% increase in the uranium segment and a 17% increase in our fuel services segment. Both segments saw increases in the average realized price and sales volume. See notes 18 and 29 in our annual financial statements for more information.
SALES DELIVERY OUTLOOK FOR 2024
For 2024 we have committed sales volumes in our uranium segment of between 32 and 34 million pounds. In general, we are active in the market, buying and selling uranium when it is beneficial for us and in support of our long-term contract portfolio.
40 CAMECO CORPORATION
In our uranium and fuel services segments, our customers choose when in the year to receive deliveries. As a result, our quarterly delivery patterns and, therefore, our sales volumes and revenue can vary significantly. We expect the quarterly distribution of uranium deliveries in 2024 to be more heavily weighted to the first and fourth quarters as shown below. However, not all delivery notices have been received to date and the expected delivery pattern could change. Typically, we receive notices six months in advance of the requested delivery date.
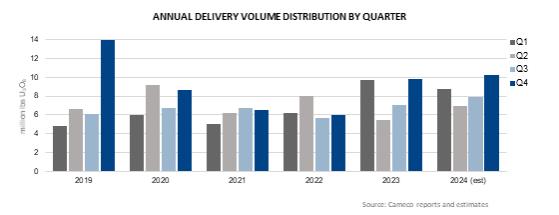
Non-IFRS measures
The non-IFRS measures referenced in this document are supplemental measures, which are used as indicators of our financial performance. Management believes that these non-IFRS measures provide useful supplemental information to investors, securities analysts, lenders and other interested parties in assessing our operational performance and our ability to generate cash flows to meet our cash requirements. These measures are not recognized measures under IFRS, do not have standardized meanings, and are therefore unlikely to be comparable to similarly-titled measures presented by other companies. Accordingly, these measures should not be considered in isolation or as a substitute for the financial information reported under IFRS. The following are the non-IFRS measures used in this document.
ADJUSTED NET EARNINGS
Adjusted net earnings (ANE) is our net earnings attributable to equity holders, adjusted for non-operating or non-cash items such as gains and losses on derivatives, adjustments to reclamation provisions flowing through other operating expenses, and bargain purchase gains, that we believe do not reflect the underlying financial performance for the reporting period. Other items may also be adjusted from time to time. We adjust this measure for certain of the items that our equity-accounted investees make in arriving at other non-IFRS measures. Adjusted net earnings is one of the targets that we measure to form the basis for a portion of annual employee and executive compensation (see Measuring our results starting on page 36).
In calculating ANE we adjust for derivatives. We do not use hedge accounting under IFRS and, therefore, we are required to report gains and losses on all hedging activity, both for contracts that close in the period and those that remain outstanding at the end of the period. For the contracts that remain outstanding, we must treat them as though they were settled at the end of the reporting period (mark-to-market). However, we do not believe the gains and losses that we are required to report under IFRS appropriately reflect the intent of our hedging activities, so we make adjustments in calculating our ANE to better reflect the impact of our hedging program in the applicable reporting period. See Foreign exchange starting on page 49 for more information.
We also adjust for changes to our reclamation provisions that flow directly through earnings. Every quarter we are required to update the reclamation provisions for all operations based on new cash flow estimates, discount and inflation rates. This normally results in an adjustment to our asset retirement obligation asset in addition to the provision balance. When the assets of an operation have been written off due to an impairment, as is the case with our Rabbit Lake and US ISR operations, the adjustment is recorded directly to the statement of earnings as “other operating expense (income)”. See note 16 of our annual financial statements for more information. This amount has been excluded from our ANE measure.
MANAGEMENT’S DISCUSSION AND ANALYSIS 41
The bargain purchase gain that was recognized when we acquired our pro-rata share of Idemitsu Canada Resources Ltd.’s 7.875% participating interest in the Cigar Lake Joint Venture has also been removed in calculating ANE since it is non-cash, non-operating and outside of the normal course of our business. The gain was recorded in the statement of earnings as part of “other income (expense)”.
As a result of the change in ownership of Westinghouse when they were acquired by Cameco and Brookfield, their inventories at the acquisition date were revalued based on the market price at that date. As these quantities are sold, their cost of products and services sold reflect these market values, regardless of Westinghouse’s historic costs. Since this adjustment is non-cash, outside of the normal course of business and only occurred due to the change in ownership, it has been excluded from our ANE measure.
To facilitate a better understanding of these measures, the table below reconciles adjusted net earnings with our net earnings for the years ended 2023, 2022 and 2021.
($ MILLIONS) | 2023 | 2022 | 2021 | |||||||||
Net earnings (loss) attributable to equity holders | 361 | 89 | (103 | ) | ||||||||
|
|
|
|
|
| |||||||
Adjustments | ||||||||||||
Adjustments on derivatives | (59 | ) | 76 | 13 | ||||||||
Adjustments to earnings from equity-investees | 20 | — | — | |||||||||
Adjustments on other operating expense (income) | (2 | ) | 26 | (8 | ) | |||||||
Adjustment to other income | — | (23 | ) | — | ||||||||
Income taxes on adjustments | 19 | (33 | ) | — | ||||||||
|
|
|
|
|
| |||||||
Adjusted net earnings (loss) | 339 | 135 | (98 | ) | ||||||||
|
|
|
|
|
| |||||||
The following table shows what contributed to the change in adjusted net earnings (non-IFRS measure, see above) in 2023 compared to the same period in 2022 and 2021.
42 CAMECO CORPORATION
($ MILLIONS) | 2023 | 2022 | 2021 | |||||||||||
Adjusted net earnings (losses) - previous year | 135 | (98 | ) | (66 | ) | |||||||||
|
|
|
|
|
| |||||||||
Change in gross profit by segment | ||||||||||||||
(we calculate gross profit by deducting from revenue the cost of products and services sold, and depreciation and amortization (D&A), net of hedging benefits) |
| |||||||||||||
Uranium | Impact from sales volume changes | 30 | (6 | ) | (4 | ) | ||||||||
Higher realized prices ($US) | 208 | 328 | 5 | |||||||||||
Foreign exchange impact on realized prices | 95 | 44 | (72 | ) | ||||||||||
Higher costs | (9 | ) | (137 | ) | (55 | ) | ||||||||
|
|
|
|
|
| |||||||||
change – uranium | 324 | 229 | (126 | ) | ||||||||||
|
|
|
|
|
| |||||||||
Fuel services | Impact from sales volume changes | 9 | (21 | ) | 1 | |||||||||
Higher realized prices ($Cdn) | 32 | 33 | 23 | |||||||||||
Higher costs | (34 | ) | (13 | ) | (2 | ) | ||||||||
|
|
|
|
|
| |||||||||
change – fuel services | 7 | (1 | ) | 22 | ||||||||||
|
|
|
|
|
| |||||||||
Other changes | ||||||||||||||
Lower (higher) administration expenditures | (74 | ) | (44 | ) | 17 | |||||||||
Lower (higher) exploration expenditures | (7 | ) | (3 | ) | 3 | |||||||||
Change in reclamation provisions | 3 | 3 | — | |||||||||||
Change in gains or losses on derivatives | (24 | ) | (23 | ) | 34 | |||||||||
Change in foreign exchange gains or losses | (58 | ) | 74 | (14 | ) | |||||||||
Change in earnings from equity-accounted investments | 80 | 26 | 32 | |||||||||||
Redemption of Series E debentures in 2020 | — | — | 24 | |||||||||||
Canadian Emergency Wage Subsidy | — | (21 | ) | (16 | ) | |||||||||
Higher (lower) finance income | 75 | 30 | (4 | ) | ||||||||||
Higher finance costs | (30 | ) | (9 | ) | (5 | ) | ||||||||
Change in income tax recovery or expense | (78 | ) | (30 | ) | 7 | |||||||||
Other | (14 | ) | 2 | (6 | ) | |||||||||
|
|
|
|
|
| |||||||||
Adjusted net earnings (losses) - current year | 339 | 135 | (98 | ) | ||||||||||
|
|
|
|
|
| |||||||||
EBITDA
EBITDA is defined as net earnings attributable to equity holders, adjusted for the costs related to the impact of the company’s capital and tax structure including depreciation and amortization, finance income, finance costs (including accretion) and income taxes.
ADJUSTED EBITDA
Adjusted EBITDA is defined as EBITDA, as further-adjusted for the impact of certain costs or benefits incurred in the period which are either not indicative of the underlying business performance or that impact the ability to assess the operating performance of the business. These adjustments include the amounts noted in the adjusted net earnings definition.
In calculating adjusted EBITDA, we also adjust for items included in the results of our equity-accounted investees. These items are reported as part of marketing, administrative and general expenses within the investee financial information and are not representative of the underlying operations. These include gain/loss on undesignated hedges, transaction costs related to acquisitions and gain/loss on disposition of a business.
We also adjust for the unwinding of the effect of purchase accounting on the sale of inventories which is included in our share of earnings from equity-accounted investee and recorded in the cost of products and services sold in the investee information (see note 12 to the financial statements).
The company may realize similar gains or incur similar expenditures in the future.
ADJUSTED FREE CASH FLOW
Adjusted free cash flow is defined as adjusted EBITDA less capital expenditures for the period.
ADJUSTED EBITDA MARGIN
Adjusted EBITDA margin is defined as adjusted EBITDA divided by revenue for the appropriate period.
MANAGEMENT’S DISCUSSION AND ANALYSIS 43
EBITDA, adjusted EBITDA, adjusted free cash flow, and adjusted EBITDA margin are measures which allow us and other users to assess results of operations from a management perspective without regard for our capital structure. To facilitate a better understanding of these measures, the table below reconciles earnings before income taxes with EBITDA and adjusted EBITDA for the years ended 2023 and 2022.
For the year ended December 31, 2023:
| FUEL | ||||||||||||||||||||
($ MILLIONS) | URANIUM1 | SERVICES | WESTINGHOUSE | OTHER | TOTAL | |||||||||||||||
Net earnings (loss) attributable to equity holders | 606 | 129 | (24 | ) | (350 | ) | 361 | |||||||||||||
Depreciation and amortization | 175 | 35 | — | 10 | 220 | |||||||||||||||
Finance income | — | — | — | (112 | ) | (112 | ) | |||||||||||||
Finance costs | — | — | — | 116 | 116 | |||||||||||||||
Income taxes | (7 | ) | 126 | 119 | ||||||||||||||||
Net adjustments on equity investees2 | 56 | — | 89 | — | 145 | |||||||||||||||
|
|
|
|
|
|
|
|
|
| |||||||||||
EBITDA | 837 | 164 | 58 | (210 | ) | 849 | ||||||||||||||
Loss on derivatives | — | — | — | (59 | ) | (59 | ) | |||||||||||||
Other operating expense (income) | (2 | ) | — | — | — | (2 | ) | |||||||||||||
Other income | — | — | — | — | — | |||||||||||||||
Adjustments on equity investees3 | — | — | 43 | — | 43 | |||||||||||||||
|
|
|
|
|
|
|
|
|
| |||||||||||
Adjusted EBITDA | 835 | 164 | 101 | (269 | ) | 831 | ||||||||||||||
|
|
|
|
|
|
|
|
|
| |||||||||||
| 1 | JV Inkai EBITDA of $235 million is included in the uranium segment. See JV Inkai Non-IFRS measures on page 83. |
| 2 | Includes depreciation and amortization, finance income and finance costs of equity-accounted investees (see note 12 to the financial statements). |
| 3 | For detail of adjustments, see Our 2023 Earnings from Westinghouse on page 63. |
For the year ended December 31, 2022:
| FUEL | ||||||||||||||||
($ MILLIONS) | URANIUM1 | SERVICES | OTHER | TOTAL | ||||||||||||
Net earnings (loss) attributable to equity holders | 200 | 120 | (231 | ) | 89 | |||||||||||
Depreciation and amortization | 136 | 33 | 8 | 177 | ||||||||||||
Finance income | — | — | (37 | ) | (37 | ) | ||||||||||
Finance costs | — | — | 86 | 86 | ||||||||||||
Income taxes | — | — | (4 | ) | (4 | ) | ||||||||||
Net adjustments on equity investees2 | 41 | — | — | 41 | ||||||||||||
|
|
|
|
|
|
|
| |||||||||
EBITDA | 377 | 153 | (178 | ) | 352 | |||||||||||
Loss on derivatives | — | — | 76 | 76 | ||||||||||||
Other operating expense (income) | 26 | — | — | 26 | ||||||||||||
Other income | (23 | ) | — | — | (23 | ) | ||||||||||
|
|
|
|
|
|
|
| |||||||||
Adjusted EBITDA | 380 | 153 | (102 | ) | 431 | |||||||||||
|
|
|
|
|
|
|
| |||||||||
| 1 | JV Inkai EBITDA of $135 million is included in the uranium segment. See JV Inkai Non-IFRS measures on page 83. |
| 2 | Includes depreciation and amortization, finance income and finance costs of equity-accounted investees (see note 12 to the financial statements). |
CASH COST PER POUND, NON-CASH COST PER POUND AND TOTAL COST PER POUND FOR PRODUCED AND PURCHASED URANIUM
Cash cost per pound, non-cash cost per pound and total cost per pound for produced and purchased uranium are non-IFRS measures. We use these measures in our assessment of the performance of our uranium business. These measures are not necessarily indicative of operating profit or cash flow from operations as determined under IFRS.
44 CAMECO CORPORATION
To facilitate a better understanding of these measures, the table below reconciles these measures to cost of product sold and depreciation and amortization for the fourth quarter and years ended 2023 and 2022.
| THREE MONTHS | YEAR ENDED | |||||||||||||||
| ENDED DECEMBER 31 | DECEMBER 31 | |||||||||||||||
($ MILLIONS) | 2023 | 2022 | 2023 | 2022 | ||||||||||||
Cost of product sold | 573.3 | 355.1 | 1,532.3 | 1,223.6 | ||||||||||||
Add / (subtract) | ||||||||||||||||
Royalties | (10.6 | ) | (2.1 | ) | (71.7 | ) | (23.4 | ) | ||||||||
Other selling costs | (3.8 | ) | (2.0 | ) | (10.9 | ) | (5.9 | ) | ||||||||
Care and maintenance and operational readiness costs | (11.6 | ) | (35.5 | ) | (46.7 | ) | (178.5 | ) | ||||||||
Change in inventories | 139.1 | 87.4 | (63.0 | ) | 124.2 | |||||||||||
|
|
|
|
|
|
|
| |||||||||
Cash operating costs (a) | 686.4 | 402.9 | 1,340.0 | 1,140.0 | ||||||||||||
Add / (subtract) | ||||||||||||||||
Depreciation and amortization | 31.6 | 18.2 | 175.5 | 135.8 | ||||||||||||
Care and maintenance and operational readiness costs | (0.5 | ) | (7.5 | ) | (3.9 | ) | (39.9 | ) | ||||||||
Change in inventories | 31.3 | 40.2 | 32.6 | 67.6 | ||||||||||||
|
|
|
|
|
|
|
| |||||||||
Total operating costs (b) | 748.8 | 453.8 | 1,544.2 | 1,303.5 | ||||||||||||
|
|
|
|
|
|
|
| |||||||||
Uranium produced & purchased (million lbs) (c) | 12.0 | 9.5 | 28.9 | 28.7 | ||||||||||||
|
|
|
|
|
|
|
| |||||||||
Cash costs per pound (a ÷ c) | 57.20 | 42.41 | 46.37 | 39.72 | ||||||||||||
Total costs per pound (b ÷ c) | 62.40 | 47.77 | 53.43 | 45.42 | ||||||||||||
|
|
|
|
|
|
|
| |||||||||
Corporate expenses
ADMINISTRATION
($ MILLIONS) | 2023 | 2022 | CHANGE | |||||||||
Direct administration1 | 186 | 143 | 30 | % | ||||||||
Stock-based compensation1 | 60 | 25 | 140 | % | ||||||||
Reversal (recovery) of fees related to CRA dispute | — | 4 | (100 | )% | ||||||||
|
|
|
|
|
| |||||||
Total administration | 246 | 172 | 43 | % | ||||||||
|
|
|
|
|
| |||||||
| 1 | Direct administration and stock-based compensation are supplementary financial measures. They are components of administration expense as shown on the statement of earnings and calculated according to IFRS. |
Direct administration costs in 2023 were $43 million higher than in 2022 largely due to the impacts of inflation, higher costs as a result of digital initiatives, and the restart at McArthur River/Key Lake.
We recorded $60 million in stock-based compensation expenses in 2023, $35 million higher compared to 2022 due to the increase in our share price from the comparative period. See note 25 to the financial statements.
Administration outlook for 2024
We expect direct administration costs to be between $190 million to $200 million.
EXPLORATION AND RESEARCH & DEVELOPMENT
Our 2023 exploration activities were focused primarily on Canada. Our spending increased from $11 million in 2022 to $18 million in 2023 and reflects higher planned expenditures.
We also had research and development expenditures in 2023 of $21 million compared to $12 million in 2022. These expenses are related to our investment in Global Laser Enrichment LLC (GLE). See Global Laser Enrichment on page 99.
Exploration and research & development outlook for 2024
We expect exploration expenses to be about $20 million in 2024. The focus for 2024 will be on our core projects in Saskatchewan. We expect research and development expenses to be about $37 million in 2024, primarily related to our investment in GLE. See Global Laser Enrichment on page 99.
MANAGEMENT’S DISCUSSION AND ANALYSIS 45
FINANCE COSTS
Finance costs were $116 million, an increase from $86 million in 2022 due to interest and standby fees on the facilities put in place to finance the acquisition of Westinghouse as well as higher costs related to the unwinding of the discount on our reclamation provisions. See note 20 to the financial statements.
FINANCE INCOME
Finance income was $112 million compared to $37 million in 2022 mainly due to higher interest rates and a higher short-term investments balance throughout 2023 due to the proceeds from the October 2022 share issuance that were used to partially finance the Westinghouse acquisition.
GAINS AND LOSSES ON DERIVATIVES
In 2023, we recorded $38 million in gains on our derivatives compared to $73 million in losses in 2022. The gains reflect a stronger Canadian dollar compared to the US dollar in 2023 compared to 2022. See Foreign exchange on page 49 and note 27 to the financial statements.
INCOME TAXES
We recorded an income tax expense of $126 million in 2023 compared to a recovery of $4 million in 2022 primarily as a result of higher earnings in Canada. Equity-accounted investees are included in both Canadian and foreign earnings net of tax paid in the jurisdictions in which they operate. Foreign earnings include losses in some jurisdictions for which no future tax benefit has been recognized.
In 2023, we recorded earnings of $562 million in Canada compared to earnings of $100 million in 2022, while in foreign jurisdictions, we recorded a loss of $75 million compared to a loss of $15 million in 2022.
($ MILLIONS) | 2023 | 2022 | ||||||
Net earnings (loss) before income taxes | ||||||||
Canada | 562 | 100 | ||||||
Foreign | (75 | ) | (15 | ) | ||||
|
|
|
| |||||
Total net earnings before income taxes | 487 | 85 | ||||||
|
|
|
| |||||
Income tax expense (recovery) | ||||||||
Canada | 131 | (8 | ) | |||||
Foreign | (5 | ) | 4 | |||||
|
|
|
| |||||
Total income tax expense (recovery) | 126 | (4 | ) | |||||
|
|
|
| |||||
Effective tax rate | 26 | % | (5 | )% | ||||
|
|
|
| |||||
TRANSFER PRICING DISPUTE
Background
Since 2008, Canada Revenue Agency (CRA) has disputed our marketing and trading structure and the related transfer pricing methodology we used for certain intercompany uranium sale and purchase agreements.
For the years 2003 to 2014, CRA shifted Cameco Europe Limited’s income (as recalculated by CRA) back to Canada and applied statutory tax rates, interest and instalment penalties, and, from 2007 to 2011, transfer pricing penalties. In addition, for 2014 to 2017, CRA has advanced an alternate reassessing position, see Reassessments, remittances and next steps below for more information.
In September 2018, the Tax Court of Canada (Tax Court) ruled that our marketing and trading structure involving foreign subsidiaries, as well as the related transfer pricing methodology used for certain intercompany uranium sales and purchasing agreements, were in full compliance with Canadian law for the tax years in question (2003, 2005 and 2006). On June 26, 2020, the Federal Court of Appeal (Court of Appeal) upheld the Tax Court’s decision.
46 CAMECO CORPORATION
On February 18, 2021, the Supreme Court of Canada (Supreme Court) dismissed CRA’s application for leave to appeal the June 26, 2020 decision of the Court of Appeal. The dismissal means that the dispute for the 2003, 2005 and 2006 tax years is fully and finally resolved in our favour. Although not technically binding, there is nothing in the reasoning of the lower court decisions that should result in a different outcome for the 2007 through 2014 tax years, which were reassessed on the same basis.
Refund and cost award
The Minister of National Revenue issued new reassessments for the 2003 through 2006 tax years in accordance with the decision and in July 2021, refunded the tax paid for those years. In October 2023, pursuant to a cost award from the courts, we received a payment of approximately $12 million for disbursements which is in addition to the $10 million we received from CRA in April 2021 as reimbursement for legal fees.
Reassessments, remittances and next steps
The Canadian income tax rules include provisions that generally require larger companies like us to remit or otherwise secure 50% of the cash tax plus related interest and penalties at the time of reassessment. Following the Supreme Court’s dismissal of CRA’s application for leave to appeal, we wrote to CRA requesting reversal of CRA’s transfer pricing adjustments for 2007 through 2013 and the return of the $780 million in cash and letters of credit we paid or provided for those years. Given the strength of the court decisions received, our request was made on the basis that the Tax Court would reject any attempt by CRA to defend its reassessments for the 2007 through 2013 tax years applying the same or similar positions already denied for previous years.
In March 2023, CRA issued revised reassessments for the 2007 through 2013 tax years, which resulted in a refund of $297 million of the $780 million in cash and letters of credit held by CRA at the time. The refund consisted of cash in the amount of $86 million and letters of credit in the amount of $211 million, which were returned in the second quarter. CRA continues to hold $483 million ($209 million in cash and $274 million in letters of credit) that we have remitted or secured to date.
The series of court decisions that were completely and unequivocally in our favour for the 2003, 2005 and 2006 tax years, determined that the income earned by our foreign subsidiary from the sale of non-Canadian produced uranium was not taxable in Canada. In accordance with these decisions, CRA issued reassessments reducing the proposed transfer pricing adjustment from $5.1 billion to $3.3 billion, resulting in a reduction of $1.8 billion in income taxable in Canada compared to the previous reassessments issued to us by CRA for the 2007 through 2013 tax years.
The remaining transfer pricing adjustment of $3.3 billion for the 2007 to 2013 tax years relates to the sale of Canadian-produced uranium by our foreign subsidiary. We maintain that the clear and decisive court decisions described above apply, and that CRA should fully reverse the remaining transfer pricing adjustments for these years and return all cash and security being held.
In October 2021, due to a lack of significant progress on our points of contention, we filed a notice of appeal with the Tax Court for the years 2007 through 2013. We have asked the Tax Court to order the complete reversal of CRA’s transfer pricing adjustment for those years and the return of all cash and letters of credit being held, with costs.
In 2020, CRA advanced an alternate reassessing position for the 2014 tax year in the event the basis for its original reassessment, noted above, is unsuccessful. Subsequent to this, we received a reassessment for the 2015 and 2016 tax years and in late 2023, we received a reassessment for the 2017 tax year, all reflecting this alternative reassessing position. CRA did not require additional security for the tax debts they considered owing for 2014 through 2016 but do require additional letters of credit related to the tax debts they considered owing for 2017 as discussed above, which we expect will be about $70 million.
The new basis of reassessment is inconsistent with the methodology CRA has pursued for prior years and we are disputing it separately. Our view is that this alternate methodology will not result in a materially different outcome from our 2014 to 2017 filing positions. On October 12, 2022, we filed an appeal with the Tax Court for the years 2014 and 2015, and in March 2023, filed a notice of objection for 2016. We plan to file a notice of objection for 2017.
MANAGEMENT’S DISCUSSION AND ANALYSIS 47
We will not be in a position to determine the definitive outcome of the dispute for any tax year other than 2003 through 2006 until such time as all reassessments have been issued advancing CRA’s arguments and final resolution is reached for that tax year. CRA may also advance alternative reassessment methodologies for years other than 2003 through 2006, such as the alternative reassessing position advanced for 2014 through 2017.
Caution about forward-looking information relating to our CRA tax dispute
This discussion of our expectations relating to our tax dispute with CRA and future tax reassessments by CRA is forward-looking information that is based upon the assumptions and subject to the material risks discussed under the heading Caution about forward-looking information beginning on page 2 and also on the more specific assumptions and risks listed below. Actual outcomes may vary significantly.
Assumptions
| • | the courts will reach consistent decisions for subsequent tax years that are based on similar positions and arguments |
| • | CRA will not successfully advance different positions and arguments that may lead to a different outcome for other tax years |
Material risks that could cause actual results to differ materially
| • | the possibility the courts may accept the same, similar or different positions and arguments advanced by CRA to reach decisions that are adverse to us for other tax years |
| • | the possibility that we will not be successful in eliminating all double taxation |
| • | the possibility that CRA does not agree that the court decisions for the years that have been resolved in Cameco’s favour should apply to subsequent tax years |
| • | the possibility CRA will not return all or substantially all of the cash and security that has been paid or otherwise secured by Cameco in a timely manner, or at all |
| • | the possibility of a materially different outcome in disputes for other tax years |
Tax outlook for 2024
Our consolidated tax rate is a blend of the statutory rates applicable to taxable income earned or tax losses incurred in Canada and in our foreign subsidiaries. Since 2017, our global marketing organization has been mainly consolidated in Canada in order to achieve efficiencies, resulting in more income earned in Canada. In addition, equity-accounted investees are included in Canadian and foreign earnings net of tax paid in the jurisdiction in which they operate. We continue to expect our consolidated tax rate will trend toward the Canadian statutory rate in the longer term.
The actual effective tax rate will vary from year-to-year, primarily due to the actual distribution of earnings among jurisdictions and differences between accounting earnings and income for tax purposes. In addition, the Organization for Economic Co-operation and Development has proposed the introduction of rules that would impose a global minimum tax rate of 15% beginning in 2024. Switzerland, Luxembourg, and Germany have all enacted or substantively enacted these rules.
48 CAMECO CORPORATION
FOREIGN EXCHANGE
The exchange rate between the Canadian dollar and US dollar affects the financial results of our uranium and fuel services segments.
We sell the majority of our uranium and fuel services products under long-term sales contracts, which are routinely denominated in US dollars. While our product purchases are denominated in US dollars, our production costs are largely denominated in Canadian dollars. To provide cash flow predictability, we hedge a portion of our net US/Cdn exposure (e.g. total US dollar sales less US dollar expenditures and product purchases) to manage shorter term exchange rate volatility. Our results are therefore affected by the movements in the exchange rate on our hedge portfolio, and on the unhedged portion of our net exposure.
Our risk management policy is based on a 60-month period and permits us to hedge 35% to 100% of our expected net exposure in the first 12-month period. Our normal practice is to layer in hedge contracts over a three- to four-year period with the hedge percentage being highest in the first 12 months and decreasing hedge percentages in subsequent years. The portion of our net exposure that remains unhedged is subject to prevailing market exchange rates for the period. Therefore, our results are affected by the movements in the exchange rate on our hedge portfolio (explained below), and on the unhedged portion of our net exposure. A weakening Canadian dollar would have a positive effect on the unhedged exposure, and a strengthening Canadian dollar would have a negative effect.
Impact of hedging on IFRS earnings
We do not use hedge accounting under IFRS and, therefore, we are required to report gains and losses on all hedging activity, both for contracts that close in the period and those that remain outstanding at the end of the period. For the contracts that remain outstanding, we must treat them as though they were settled at the end of the reporting period (mark-to-market).
However, we do not believe the gains and losses that we are required to report under IFRS appropriately reflect the intent of our hedging activities, so we make adjustments in calculating our ANE to better reflect the impact of our hedging program in the applicable reporting period.
Impact of hedging on ANE
We designate contracts for use in particular periods, based on our expected net exposure in that period. Hedge contracts are layered in over time based on this expected net exposure. The result is that our current hedge portfolio is made up of a number of contracts which are currently designated to net exposures we expect in 2024 and future years and we will recognize the gains or losses in ANE in those periods.
For the purposes of ANE, gains and losses on derivatives are reported based on the difference between the effective hedge rate of the contracts designated for use in the particular period and the exchange rate at the time of settlement. This results in an adjustment to current period IFRS earnings to effectively remove reported gains or losses on derivatives that arise from contracts put in place for use in future periods. The effective hedge rate will lag the market in periods of rapid currency movement. See Non-IFRS measures on page 41.
The table below provides a summary of our hedge portfolio at December 31, 2023. You can use this information to estimate the expected gains or losses on derivatives for 2024 on an ANE basis. Additionally, if we add contracts to the portfolio that are designated for use in 2024 or if there are changes in the US/Cdn exchange rates in the year, those expected gains or losses could change.
MANAGEMENT’S DISCUSSION AND ANALYSIS 49
Hedge portfolio summary
| DECEMBER 31, 2023 | AFTER | |||||||||||||||
($ MILLIONS) | 2024 | 2024 | TOTAL | |||||||||||||
US dollar forward contracts | ($ millions | ) | 690 | 870 | 1,560 | |||||||||||
Average contract rate 1 | (US/Cdn dollar | ) | 1.32 | 1.34 | 1.33 | |||||||||||
|
|
|
|
|
| |||||||||||
US dollar option contracts | ($ millions | ) | 10 | — | 10 | |||||||||||
Average contract rate range1 | (US/Cdn dollar | ) | 1.20 to 1.24 | — | 1.20 to 1.24 | |||||||||||
|
|
|
|
|
| |||||||||||
Total US dollar hedge contracts | ($ millions | ) | 700 | 870 | 1,570 | |||||||||||
Average hedge rate | (US/Cdn dollar | ) | 1.32 | 1.34 | 1.33 | |||||||||||
Hedge ratio2 | 52 | % | 19 | % | 22 | % | ||||||||||
| 1 | The average contract rate is the weighted average of the rates stipulated in the outstanding contracts. |
| 2 | Hedge ratio is calculated by dividing the amount (in foreign currency) of outstanding derivative contracts by estimated future net exposures. |
At December 31, 2023:
| • | The value of the US dollar relative to the Canadian dollar was $1.00 (US) for $1.32 (Cdn), down from $1.00 (US) for $1.36 (Cdn) at December 31, 2022. The exchange rate averaged $1.00 (US) for $1.35 (Cdn) over the year. |
| • | The mark-to-market position on all foreign exchange contracts was a $12 million gain compared to a $48 million loss at December 31, 2022. The mark-to-market position is a component of gain on derivatives as shown on the statement of earnings and calculated in accordance with IFRS. |
We manage counterparty risk associated with hedging by dealing with highly rated counterparties and limiting our exposure. At December 31, 2023, all of our hedging counterparties had a Standard & Poor’s (S&P) credit rating of A or better.
For information on the impact of foreign exchange on our intercompany balances, see note 27 to the financial statements.
50 CAMECO CORPORATION
Outlook for 2024
Our outlook for 2024 reflects the continued transition of our cost structure back to a tier-one run rate, as we plan our production to satisfy the growing long-term commitments under our contract portfolio. With our plan to produce 18 million pounds (100% basis) at each of Cigar Lake and McArthur River/Key Lake, and to produce 12,000 tonnes UF6 at our Port Hope conversion facility, we expect strong financial performance, including cash flow generation.
Our financial performance and the amount of cash generated will be dependent on sourcing the material required to meet our deliveries as planned, including achieving our production plans. Therefore, our cash balances may fluctuate throughout the year.
As in prior years, we will incur care and maintenance costs for the ongoing curtailment of our tier-two assets, which are expected to be between $50 million and $60 million.
2023 outlook compared to actual
Our actual results were largely in-line with the outlook provided in our third quarter MD&A. In 2022 we announced the restart of McArthur River/Key Lake. Throughout 2023, the operations continued to ramp up production. We set a production target of 20.3 million pounds (our share) at the beginning of 2023. In September, we revised this to up to 18.7 million pounds (our share), and we achieved 17.6 million pounds (our share), consisting of 9.4 million pounds (our share) of production at McArthur River/Key Lake and 8.2 million pounds of production (our share) at Cigar Lake, both slightly below our forecast. See Uranium – Tier-one production on page 73 for more information.
At the end of the third quarter, average realized price was expected to be $65.50 per pound. This was based on a uranium spot price of $70.00 (US) per pound (the UxC spot price as of September 25, 2023) and a long-term price indicator of $61.00 (US) per pound (the UxC long-term indicator on September 25, 2023). The spot price averaged $82.21 (US) per pound during the fourth quarter, and as a result, the actual average realized price was $67.31 per pound, resulting in revenue slightly above the forecasted range for the uranium segment.
See 2023 Financial results by segment on page 61 for details.
2024 Financial outlook
| CONSOLIDATED | URANIUM | FUEL SERVICES | WESTINGHOUSE | |||||||||||||
Production (owned and operated properties) | — | 22.4 million lbs | 13.5 to 14.5 million kgU | — | ||||||||||||
Market purchases | — | up to 2 million lbs | — | — | ||||||||||||
Committed purchases (including Inkai purchase volumes) | — | 9 million lbs | — | — | ||||||||||||
Sales/delivery volume | — | 32 to 34 million lbs | 12 to 13 million kgU | — | ||||||||||||
Revenue | $ | 2,850 to 3,000 million | $ | 2,410 to 2,530 million | $ | 430-460 million | — | |||||||||
Average realized price | — | $ | 74.70/lb | — | — | |||||||||||
Average unit cost of sales (including D&A) | — | $ | 57.00-60.00/lb | 1 | $ | 24.50-25.50/kgU | 2 | — | ||||||||
Direct administration costs | $ | 190-200 million | — | — | — | |||||||||||
Exploration costs | — | $ | 20 million | — | — | |||||||||||
Capital expenditures | $ | 215-250 million | — | — | — | |||||||||||
Adjusted EBITDA (non-IFRS measure see page 41) | — | — | — | $ | 445-510 million | |||||||||||
| 1 | Uranium average unit cost of sales is calculated as the cash and non-cash costs of the product sold, royalties, care and maintenance and selling costs, divided by the volume of uranium concentrates sold. |
| 2 | Fuel services average unit cost of sales is calculated as the cash and non-cash costs of the product sold, transportation and weighing and sampling costs, as well as care and maintenance costs, divided by the volume of products sold. |
MANAGEMENT’S DISCUSSION AND ANALYSIS 51
We do not provide an outlook for the items in the table that are marked with a dash.
The following assumptions were used to prepare the outlook in the table above:
| • | Production – we achieve 22.4 million pounds of production (our share) in our uranium segment. If we do not achieve 22.4 million pounds, the consolidated revenue outlook and outlook for the uranium segment could vary. |
| • | Market purchases – reflect the market purchases we plan to make in 2024. Market purchases may vary if planned production varies. In addition, if we decide to increase our working inventory from current levels our market purchases could be higher. Our market purchases could also be lower if, instead of making market purchases, we choose to source the required volumes by temporarily reducing inventory levels, by pulling forward long-term purchase commitments, or by drawing on loan arrangements we have in place. |
| • | Committed purchases – are based on the 4.7 million pounds we currently have commitments to acquire under contract in 2024 and our JV Inkai purchases, which we have assumed will be equivalent to our 2023 purchase volume of 4.2 million pounds. If Inkai production and/or deliveries vary, committed purchases may vary and we may have to rely on our other sources of supply described above. We equity account for our minority ownership interest in JV Inkai. We record our share of its production as a purchase. However, this does not reflect our share of the economic benefit. Our share of the economic benefit is based on the difference between our purchase price and JV Inkai’s lower production cost and is reflected in the line item on our statement of earnings called, “share of earnings from equity-accounted investees”. As a result, increases in the spot price increase our cost of purchases from JV Inkai and also our “share of earnings from equity-accounted investees”. The benefit is realized, through receipt of a cash dividend, when declared and paid by JV Inkai. |
| • | Our 2024 outlook for sales/delivery volume does not include sales between our uranium and fuel services segments. |
| • | Sales/delivery volume is based on the volumes we currently have commitments to deliver under contract in 2024. |
| • | Uranium revenue and average realized price are based on a uranium spot price of $91.00 (US) per pound (the UxC spot price on December 25, 2023), a long-term price indicator of $68.00 (US) per pound (the UxC long-term indicator on December 25, 2023) and an exchange rate of $1.00 (US) for $1.30 (Cdn) |
| • | Uranium average unit cost of sales (including D&A) is based on the expected unit cost of sales for produced material, the planned market purchases and committed purchases noted in the outlook at an anticipated average purchase price of about $100 (Cdn) per pound and includes care and maintenance costs of between $50 million and $60 million. We expect overall unit cost of sales could vary if there are changes in production and market or committed purchase volumes or the mix of supply sources used to meet our contract deliveries, uranium spot prices, and/or care and maintenance costs in 2023. |
| • | The Adjusted EBITDA outlook for Westinghouse is based on the assumptions listed in the section titled, Westinghouse – Future Prospects starting on page 94. |
| • | Westinghouse and JV Inkai are accounted for using the equity method for our share. Under equity accounting Westinghouse and JV Inkai capital expenditures are not presented within our consolidated financial statements and are therefore not included in our outlook for capital expenditures. |
The following table shows how changes in the exchange rate or uranium prices can impact our outlook.
| IMPACT ON: | ||||||||||||||
FOR 2024 ($ MILLIONS) | CHANGE | REVENUE | ANE | CASH FLOW | ||||||||||
Uranium spot and long-term price1 | $5(US)/lb increase | 9 | (21 | ) | (49 | ) | ||||||||
| $5(US)/lb decrease | (22 | ) | 12 | 37 | ||||||||||
Value of Canadian dollar vs US dollar | One cent decrease in CAD | 22 | 7 | 5 | ||||||||||
| One cent increase in CAD | (22 | ) | (7 | ) | (5 | ) | ||||||||
| 1 | Assuming change both UxC spot price $91.00 (US) per pound on December 25, 2023 and the UxC long-term price indicator $68.00 (US) per pound on December 25, 2023. |
We have sensitivity to the uranium price through both our sales and purchase commitments. However, at the current price levels many of the market-related sales contracts we are delivering into in 2024 are subject to ceiling prices and therefore are generally less sensitive than our purchase commitments.
This sensitivity assumes that 2 million pounds of purchases are sourced from the market. To the extent that our market purchases vary, our sensitivity of ANE and cash flow to changes in the spot and long-term prices may be impacted. In the case of decreased market purchasing, our sensitivity would be reduced. In the case of increased market purchasing, our sensitivity would be greater.
52 CAMECO CORPORATION
Price sensitivity analysis: uranium segment
As discussed under the Long-term contracting section on page 25, our average realized price is based on pricing terms established in our portfolio of long-term contracts, which includes a mix of base-escalated and market-related contracts that are layered in over time. Each confidential contract is bilaterally negotiated with the customer and delivery generally does not begin until two years or more after signing.
| • | Base-escalated contracts will reflect market conditions and pricing at the time each contract was finalized, with escalation factors applied based on when the material is delivered. |
| • | Market-related contracts reference a pricing mechanism that may be based on either the spot price or the long-term price, and that price is generally set a month or more prior to delivery, subject to specific terms unique to each contract, such as floors and ceilings set relative to market pricing at time of negotiation and typically escalated to time of delivery. |
As a result of these contracting dynamics, changes to our average realized price will generally lag changes in market prices in both rising and falling price conditions. The magnitude and direction of the deviation can vary based on the degree of market price volatility between the time the contract price is set, and the time the product is delivered.
To help understand how the pricing under our current portfolio of commitments is expected to react at various spot prices at December 31, 2023, we have constructed the table that follows.
The table is based on the volumes and pricing terms under the long-term commitments in our contract portfolio that have been finalized as at December 31, 2023. The table does not include volumes and pricing terms in contracts under negotiation or those that have been accepted but are still subject to contract finalization. Based on the terms and volumes under contracts that have been finalized, the table is designed to indicate how our average realized price would react under various spot price assumptions at a point in time. In other words, the prices shown in the table would only be realized if the contract portfolio remained exactly as it was on December 31, 2023, using the following assumptions:
| • | The uranium price remains fixed at a given spot level for each annual period shown |
| • | Deliveries based on commitments under finalized contracts include best estimates of the expected deliveries and flexibility under contract terms |
| • | To reflect escalation mechanisms contained in existing contracts, the long-term US inflation rate target of 2% is used, for modeling purposes only |
It is important to note, that the table is not a forecast of prices we expect to receive. The prices we actually realize will be different from the prices shown in the table. We intend to update this table each quarter in our MD&A to reflect deliveries made and changes to our contract portfolio. As a result, we expect the table to change from quarter to quarter.
Expected realized uranium price sensitivity under various spot price assumptions at December 31, 2023
| (rounded to the nearest $1.00) | ||||||||||||||||||||||||||||
| SPOT PRICES | ||||||||||||||||||||||||||||
($US/lb U3O8) | $20 | $40 | $60 | $80 | $100 | $120 | $140 | |||||||||||||||||||||
2024 | 38 | 43 | 52 | 56 | 58 | 59 | 59 | |||||||||||||||||||||
2025 | 38 | 43 | 54 | 61 | 64 | 65 | 66 | |||||||||||||||||||||
2026 | 41 | 43 | 56 | 66 | 69 | 70 | 71 | |||||||||||||||||||||
2027 | 41 | 44 | 57 | 68 | 71 | 73 | 74 | |||||||||||||||||||||
2028 | 44 | 46 | 57 | 69 | 72 | 74 | 76 | |||||||||||||||||||||
As of December 31, 2023, we had commitments requiring delivery of an average of about 27 million pounds per year from 2024 through 2028, with commitment levels in 2024 and 2025 higher than the average and in 2026 through 2028 lower than the average, reflecting our disciplined approach to contracting. As the market improves, we expect to continue to layer in volumes capturing greater upside using market-related pricing mechanisms.
MANAGEMENT’S DISCUSSION AND ANALYSIS 53
Liquidity and capital resources
Our financial objective is to ensure we have the cash and debt capacity to fund our operating activities, investments and other financial obligations in order to execute our strategy and to allow us to self-manage risk. We have a number of alternatives to fund future capital requirements, including using our operating cash flow, drawing on our existing credit facilities, entering new credit facilities, and raising additional capital through debt or equity financings. We regularly consider our financing options so we can take advantage of favourable market conditions when they arise. In addition, with improving prices under our long-term contract portfolio and the plan to return to our tier one cost structure, we expect to continue to see strong earnings and cash flow generation in 2024.
To finance our 49% share of the purchase price of Westinghouse, on November 7, 2023, we used $1.5 billion (US) of cash and drew the full amount of both $300 million (US) tranches of the term loan. See Westinghouse on page 94 for more information. At the end of 2023, we had cash and cash equivalents of $567 million, while our total debt amounted to $1.8 billion. Our cash balances and investments are held in government securities or with banks that are party to our lending facilities. We have a risk management policy that we follow to manage our exposure to banking counterparties, which limits the amount and tenor of cash or investments based on counterparty credit rating. Our investment decisions prioritize security and liquidity and consider concentration amongst our banking partners. The majority of our cash balances are with Schedule I Canadian banks.
We have large, creditworthy customers that continue to need our nuclear fuel products and services even during weak economic conditions, and we expect the contract portfolio we have built to continue to provide a solid revenue stream. In our uranium segment, from 2024 through 2028, we have commitments to deliver an average of 27 million pounds per year, with commitment levels in 2024 and 2025 higher than the average and in 2026 through 2028 lower than the average.
We expect the increased production from our tier one assets will continue to generate strong cash flows. It will allow us to source more of our committed sales from lower-cost produced pounds. However, cash flow from operations for 2024 will be dependent on our ability to source the material required to meet our deliveries as planned, including achieving our production plans.
We expect our cash balances and operating cash flows to meet our capital requirements during 2024, based on the assumption that we will refinance our $500 million debenture on or prior to its June 2024 maturity. With our expected strong cash flow generation, and in conjunction with our capital allocation priorities, we plan to reduce total debt, with a focus on the floating rate term loan. See below for more information on Investing Activities, Financing Activities and Off-Balance Sheet Arrangements and our Capital Allocation section on page 30 for more information.
With the Supreme Court’s dismissal of CRA’s application for leave, the dispute of the 2003 through 2006 tax years are fully and finally resolved in our favour. Furthermore, we are confident the courts would reject any attempt by CRA to utilize the same position and arguments for tax years 2007 through 2014, or its alternate reassessing position for tax years 2014 through 2017 and believe CRA should return all cash and letters of credit (to date, $483 million for 2007 through 2014) being held. However, timing of any further payments is uncertain, and there can be no assurance that the courts will take this position. Additionally, we expect to provide approximately $70 million in letters of credit to secure the tax debts CRA considers owing for 2017. See page 46 for more information.
54 CAMECO CORPORATION
Financial condition
| 2023 | 2022 | |||||||
Cash position ($ millions) | ||||||||
(cash and cash equivalents and short-term investments) | 567 | 2,282 | ||||||
|
|
|
| |||||
Cash provided by operations ($ millions) | ||||||||
(net cash flow generated by our operating activities after changes in working capital) | 688 | 305 | ||||||
|
|
|
| |||||
Cash provided by operations/net debt1 | ||||||||
(net debt is total consolidated debt, less cash position) | 57 | % | -24 | % | ||||
|
|
|
| |||||
Net debt/total capitalization1 | ||||||||
(total capitalization is net debt and equity) | 17 | % | -28 | % | ||||
|
|
|
| |||||
Credit ratings
The credit ratings assigned by external ratings agencies are important as they impact our ability to raise capital at competitive pricing to support our business operations and execute our strategy.
Third-party ratings for our commercial paper and senior debt as of February 7, 2024:
SECURITY | DBRS | S&P | ||||||
Commercial paper | R-2 (middle) | A-3 | ||||||
Senior unsecured debentures | BBB | BBB- | ||||||
Rating trend / rating outlook | Stable | 1 | Stable | 2 | ||||
| 1 | On October 12, 2023, DBRS confirmed the rating and outlook. |
| 2 | On February 16, 2022, S&P revised Cameco’s rating outlook to stable and affirmed the rating. |
Although we are required to equity account for our investment in Westinghouse, we expect the ratings agencies will proportionately consolidate it in their rating analysis. There was no change to our credit ratings upon close of the acquisition.
The rating agencies may revise or withdraw these ratings if they believe circumstances warrant. The rating trend/outlook represents the rating agency’s assessment of the likelihood and direction that the rating could change in the future.
A change in our credit ratings could affect our cost of funding and our access to capital through the capital markets.
Liquidity
($ MILLIONS) | 2023 | 2022 | ||||||
Cash and cash equivalents and short-term investments at beginning of year | 2,282 | 1,332 | ||||||
|
|
|
| |||||
Cash from operations | 688 | 305 | ||||||
|
|
|
| |||||
Investment activities | ||||||||
Additions to property, plant and equipment and acquisitions | (3,183 | ) | (245 | ) | ||||
Other investing activities | — | 8 | ||||||
|
|
|
| |||||
Financing activities | ||||||||
Change in debt | 817 | — | ||||||
Interest paid | (41 | ) | (39 | ) | ||||
Issue of shares | 28 | 963 | ||||||
Dividends | (52 | ) | (52 | ) | ||||
Other financing activities | (3 | ) | (3 | ) | ||||
|
|
|
| |||||
Exchange rate on changes on foreign currency cash balances | 31 | 13 | ||||||
|
|
|
| |||||
Cash and cash equivalents and short-term investments at end of year | 567 | 2,282 | ||||||
|
|
|
| |||||
CASH FROM OPERATIONS
Cash from operations in 2023 was higher than in 2022 due to higher earnings, the $86 million cash refund from CRA, higher interest received due to higher cash and investment balances, and lower working capital requirements. Purchases in 2023 were 11.3 million pounds compared to 18.3 million pounds in 2022. Not including working capital requirements, our operating cash flows in the year were up $330 million. See note 24 to the financial statements.
MANAGEMENT’S DISCUSSION AND ANALYSIS 55
INVESTING ACTIVITIES
Cash used in investing includes acquisitions and capital spending.
Capital spending
We classify capital spending as sustaining, capacity replacement or growth. As a mining company, sustaining capital is the money we spend to keep our facilities running in their present state, which would follow a gradually decreasing production curve, while capacity replacement capital is spent to maintain current production levels at those operations. Growth capital is money we invest to generate incremental production, and for business development. We have a capital allocation process to approve our capital spend. See Capital Allocation beginning on page 30 for more information.
CAMECO’S SHARE ($ MILLIONS) | 2023 ACTUAL | 2024 PLAN | ||||||
Sustaining capital | ||||||||
Uranium | 49 | 80-85 | ||||||
Fuel services | 39 | 60-65 | ||||||
Other | 6 | 5-10 | ||||||
|
|
|
| |||||
Total sustaining capital | 94 | 145-160 | ||||||
|
|
|
| |||||
Capacity replacement capital | ||||||||
Uranium | 56 | 50-60 | ||||||
Fuel services | — | — | ||||||
|
|
|
| |||||
Total capacity replacement capital | 56 | 50-60 | ||||||
|
|
|
| |||||
Growth capital | ||||||||
Uranium | 1 | 15-20 | ||||||
Fuel services | 3 | 5-10 | ||||||
|
|
|
| |||||
Total growth capital | 4 | 20-30 | ||||||
|
|
|
| |||||
Total sustaining, capital and growth | 154 | 215-250 | ||||||
|
|
|
| |||||
Outlook for investing activities
CAMECO’S SHARE ($ MILLIONS) | 2024 PLAN | 2025 PLAN | 2026 PLAN | |||||||||
Total uranium & fuel services | 215-250 | 200-250 | 200-250 | |||||||||
|
|
|
|
|
| |||||||
Sustaining capital | 145-160 | 120-140 | 110-130 | |||||||||
Capacity replacement capital | 50-60 | 30-50 | 30-50 | |||||||||
Growth capital | 20-30 | 50-60 | 60-70 | |||||||||
Our 2024, 2025 and 2026 capital spending estimates assume that we produce 18 million pounds (100% basis) per year at McArthur River/Key Lake and at Cigar Lake and produce 12,000 tonnes per year at our UF6 conversion facility. If our production plans change, then our capital spending estimates may change.
Our estimate for capital spending in 2024 has been increased to between $215 million and $250 million (previously between $150 million and $200 million) due to the capital required to meet production targets sustainably and reliably, commencement of work on the Cigar Lake extension and the rescheduling of some expenditures planned in 2023 to 2024.
Our estimate for capital spending in 2025 has been increased to between $200 million and $250 million (previously between $100 million and $150 million) due to the rescheduling of expenditures and work on the Cigar Lake extension.
Capital expenditures for JV Inkai are expected to be covered by JV Inkai cash flows in 2024 and Westinghouse capital expenditures are expected to be covered by Westinghouse cash flows, both are included in our overall equity investment.
Major capital expenditures in 2024 include:
| • | Investments required to refresh aging infrastructure to help ensure reliable and sustainable production at all our operations as planned |
| • | Fuel services – continued work on our Vision in Motion project |
| • | Cigar Lake – begin work on the Cigar Lake extension. See Cigar Lake starting on page 77. |
56 CAMECO CORPORATION
This information regarding currently expected capital expenditures for future periods is forward-looking information and is based upon the assumptions and subject to the material risks discussed on pages 4 to 6. Our actual capital expenditures for future periods may be significantly different.
FINANCING ACTIVITIES
Cash from financing includes borrowing and repaying debt, and other financial transactions including paying dividends and providing financial assurance.
Contractual obligations
| 2025 AND | 2027 AND | 2029 AND | ||||||||||||||||||
DECEMBER 31 ($ MILLIONS) | 2024 | 2026 | 2028 | BEYOND | TOTAL | |||||||||||||||
Debt | 500 | 795 | 400 | 100 | 1,795 | |||||||||||||||
Interest on debt | 85 | 121 | 22 | 71 | 299 | |||||||||||||||
Provision for reclamation | 36 | 131 | 105 | 1,084 | 1,356 | |||||||||||||||
Provision for waste disposal | 3 | 5 | 2 | — | 10 | |||||||||||||||
Other liabilities | 18 | 12 | 5 | 77 | 112 | |||||||||||||||
Capital commitments | 61 | — | — | — | 61 | |||||||||||||||
Unconditional product purchase obligations | 341 | 170 | 18 | — | 529 | |||||||||||||||
|
|
|
|
|
|
|
|
|
| |||||||||||
Total | 1,044 | 1,234 | 552 | 1,332 | 4,162 | |||||||||||||||
|
|
|
|
|
|
|
|
|
| |||||||||||
| 1 | Debt and interest on debt is calculated assuming that all debt is held to maturity and as such does not incorporate the expected reduction in 2024 of the term loan outstanding, or any other reductions, and the associated impact on interest payments. |
We have contractual capital commitments of approximately $61 million at December 31, 2023. Certain of the contractual commitments may contain cancellation clauses; however, we disclose the commitments based on management’s intent to fulfil the contracts.
We have sufficient borrowing capacity with available unsecured lines of credit totalling about $2.7 billion, which include the following:
| • | A $1.0 billion unsecured revolving credit facility that matures October 1, 2027. Each calendar year, upon mutual agreement, the facility can be extended for an additional year. We may increase the revolving credit facility above $1.0 billion, by increments of no less than $50 million, up to a total of $1.25 billion. The facility ranks equally with all of our other senior debt. At December 31, 2023, there were no amounts outstanding under this facility. |
| • | Financial assurance facilities with various financial institutions and insurers of approximately $1.7 billion. At December 31, 2023, we had approximately $1.4 billion outstanding on these facilities. We use these facilities mainly to provide financial assurance for future decommissioning and reclamation of our operating sites, for our obligations relating to the CRA dispute, and as overdraft protection. |
In total we have $1.0 billion in senior unsecured debentures outstanding:
| • | $500 million bearing interest at 4.19% per year, maturing on June 24, 2024 (classified as current) |
| • | $400 million bearing interest at 2.95% per year, maturing on October 21, 2027 |
| • | $100 million bearing interest at 5.09% per year, maturing on November 14, 2042 |
Additionally, we have approximately $800 million in term loan debt. We have drawn the full amount of the single advance
$600 million (US) term loan that was put in place concurrently with the execution of the Westinghouse acquisition agreement, of which $300 million (US) matures in November 2025 and $300 million (US) matures in November 2026. We have initiated a partial repayment of $200 million (US) on the $300 million (US) tranche which matures in November 2026. The term loan facility requires interest rate elections on each tranche, priced at the applicable rate of:
| • | Term Secured Overnight Financing Rate (SOFR) plus a credit spread adjustment of 0.10% and a margin that currently ranges from 1.7% to 1.95%, or |
| • | US base rate, plus a margin that currently ranges from 0.7% to 0.95% |
The margins are dependent on the company’s credit rating and as such could change over the term if the credit rating changes.
MANAGEMENT’S DISCUSSION AND ANALYSIS 57
The $280 million (US) bridge commitment that we also secured concurrently with the acquisition agreement was not required to complete the transaction and was terminated.
Debt covenants
Our credit agreements include the following financial covenants:
| • | our funded debt to tangible net worth ratio must be 1:1 or less |
| • | other customary covenants and events of default |
Funded debt is total consolidated debt less non-recourse debt, $100 million in letters of credit, cash and cash equivalents and short-term investments.
Not complying with any of these covenants could result in accelerated payment and termination of our credit agreements. At December 31, 2023, we complied with all covenants, and we expect to continue to comply in 2024.
OFF-BALANCE SHEET ARRANGEMENTS
We had three kinds of off-balance sheet arrangements at the end of 2023:
| • | purchase commitments |
| • | financial assurances |
| • | other arrangements |
Purchase commitments
We make purchases under long-term contracts where it is beneficial for us to do so and to support our long-term contract portfolio. The following table is based on our purchase commitments in our uranium and fuel services segments at December 31, 20232, but does not include purchases of our share of Inkai production. These commitments include a mix of fixed-price and market-related contracts. Actual payments will be different as a result of changes to our purchase commitments and, in the case of contracts with market-related pricing, the market prices in effect at the time of delivery. We will update this table as required in our MD&A to reflect material changes to our purchase commitments and changes in the prices used to estimate our commitments under market-related contracts.
| 2025 AND | 2027 AND | 2029 AND | ||||||||||||||||||
DECEMBER 31, 2023 ($ MILLIONS) | 2024 | 2026 | 2028 | BEYOND | TOTAL | |||||||||||||||
Purchase commitments1,2 | 341 | 170 | 18 | — | 529 | |||||||||||||||
|
|
|
|
|
|
|
|
|
| |||||||||||
| 1 | Denominated in US dollars and Japanese yen, converted from US dollars to Canadian dollars at the rate of 1.30 and from Japanese yen to Canadian dollars at the rate of $0.01. |
| 2 | These amounts have been adjusted for any additional purchase commitments that we have entered into since December 31, 2023, but does not include deliveries taken under contract since December 31, 2023. |
We have commitments of $529 million (Cdn) for the following:
| • | approximately 8.4 million pounds of U3O8 equivalent from 2024 to 2028 |
| • | approximately 0.3 million kgU as UF6 in conversion services in 2024 |
| • | about 0.4 million Separative Work Units (SWU) of enrichment services to meet existing forward sales commitments under agreements with a non-Western supplier |
The suppliers do not have the right to terminate agreements other than pursuant to customary events of default provisions.
Financial assurances
We use standby letters of credit and surety bonds mainly to provide financial assurance for the decommissioning and reclamation of our mining and conversion facilities.
Once we have permanently stopped mining and processing activities at an operating site, we are required to decommission the site to the satisfaction of the regulators. We have developed preliminary decommissioning plans for our operating sites and use them to estimate our decommissioning costs. Regulators review and accept our preliminary decommissioning plans on a regular basis. As the site approaches or goes into decommissioning, regulators review the detailed decommissioning plans. This can result in further regulatory process, as well as additional requirements, costs and financial assurances.
58 CAMECO CORPORATION
We have submitted updates to all Saskatchewan operations’ Preliminary Decommissioning Plan (PDP) and Preliminary Decommissioning Cost Estimate (PDCE) documents in accordance with the five-year timeline specified in the regulations. Upon acceptance of the PDP and PDCE documents by the Saskatchewan Ministry of Environment and Canadian Nuclear Safety Commission (CNSC) staff, a formal Commission proceeding will be required for final approval of the PDP and PDCE by the Commission. All Saskatchewan mining operations have received the necessary approvals for the current PDP and PDCE and all required financial assurances are in place.
The PDP and PDCE for the Blind River refinery were revised in 2020. The CNSC approved the PDCE in February 2022 and the financial assurance was updated in March 2022. The Cameco Fuel Manufacturing PDP and PDCE were revised in 2021, and the revised PDCE was approved by the Commission in February 2022 and the financial assurance was updated in March 2022. The PDP and PDCE for the Port Hope conversion facility were revised in 2022 and submitted to CNSC staff in September 2022 and are currently under review by CNSC staff. A decision on the PDCE is expected by the Commission in April 2024, after which the financial assurance will be updated.
For Smith Ranch-Highland, the 2023 surety was approved and the credit instruments are being reviewed by the State of Wyoming. For Crow Butte, the 2023 annual update was submitted to the federal Nuclear Regulatory Commission and Nebraska Department of Environmental Quality in September 2023.
At the end of 2023, our estimate of total decommissioning and reclamation costs was $1.36 billion. This is the undiscounted value of the obligation and is based on our current operations. We had accounting provisions of $1.05 billion at the end of 2023 (the present value of the $1.36 billion). Regulatory approval is required prior to beginning decommissioning. The expected timing for these costs in based on each mine or fuel service facility’s expected operating life. Our required costs for decommissioning and reclamation in each of the next five years are not expected to be material. However, we may choose to undertake progressive reclamation activities, for example, as we do at our US assets and through our Vision in Motion project at our Port Hope fuel services facilities.
We had a total of about $1.06 billion in financial assurances supporting our reclamation liabilities at the end of 2023. All of our North American operations have financial assurances in place in connection with our preliminary plans for decommissioning of the sites.
We are also providing letters of credit until the CRA dispute is resolved.
Our financial assurances renew automatically on an annual basis, unless otherwise advised by the issuing institution. At December 31, 2023 our financial assurances totaled $1.4 billion, down from $1.6 billion at December 31, 2022, largely due to the return of letters of credit in the amount of $211 million from CRA. See Transfer pricing dispute on page 46.
Other arrangements
We have arranged for standby product loan facilities with various counterparties. The arrangements allow us to borrow up to 2.0 million kgU of UF6 conversion services and 3.5 million pounds of U3O8 over the period 2020 to 2026 with repayment in kind up to December 31, 2026. Under the loan facilities, standby fees of up to 1% are payable based on the market value of the facilities and interest is payable on the market value of any amounts drawn at rates ranging from 0.5% to 2.0%. At December 31, 2023, we have 1.8 million kgU of UF6 conversion services and 2.8 million pounds of U3O8 drawn on the loans.
BALANCE SHEET
| DECEMBER 31, | CHANGE | |||||||||||||||
($ MILLIONS EXCEPT PER SHARE AMOUNTS) | 2023 | 2022 | 2021 | 2022 TO 2023 | ||||||||||||
Inventory | �� | 692 | 665 | 410 | 4 | % | ||||||||||
Total assets | 9,934 | 8,633 | 7,518 | 15 | % | |||||||||||
Total non-current liabilities | 2,651 | 2,236 | 2,318 | 19 | % | |||||||||||
Dividends per common share | 0.12 | 0.12 | 0.08 | — | ||||||||||||
Total product inventories increased by 4% to $692 million this year due to the higher cost of purchased material. At December 31, 2023, our average cost for uranium was $49.62 per pound, up from $43.45 per pound at December 31, 2022. As of December 31, 2023, we held an inventory of 10.3 million pounds of U3O8 equivalent (excluding broken ore).
MANAGEMENT’S DISCUSSION AND ANALYSIS 59
At the end of 2023, our total assets amounted to $9.9 billion, an increase of 15% compared to 2022, due mainly to the addition of Westinghouse as an equity-accounted investee, partially offset by the decrease in cash and cash equivalents and short-term investments used to fund the acquisition. In 2022, the total asset balance increased by $1.1 billion compared to 2021, due mainly to an increase in investment balances resulting from the October 2022 issuance of common shares in preparation for the closing of the Westinghouse transaction as well as higher inventories.
60 CAMECO CORPORATION
2023 financial results by segment
Uranium
HIGHLIGHTS | 2023 | 2022 | CHANGE | |||||||||||||
Production volume (million lbs) | 17.6 | 10.4 | 69 | % | ||||||||||||
|
|
|
|
|
| |||||||||||
Sales volume (million lbs) | 32.0 | 25.6 | 25 | % | ||||||||||||
|
|
|
|
|
| |||||||||||
Average spot price | ($US/lb | ) | 62.51 | 49.81 | 25 | % | ||||||||||
Average long-term price | ($US/lb | ) | 58.20 | 49.75 | 17 | % | ||||||||||
Average realized price | ($US/lb | ) | 49.76 | 44.73 | 11 | % | ||||||||||
| ($Cdn/lb | ) | 67.31 | 57.85 | 16 | % | |||||||||||
|
|
|
|
|
| |||||||||||
Average unit cost of sales (including D&A) | ($Cdn/lb | ) | 53.41 | 53.13 | 1 | % | ||||||||||
|
|
|
|
|
| |||||||||||
Revenue ($ millions) | 2,152 | 1,480 | 45 | % | ||||||||||||
|
|
|
|
|
| |||||||||||
Gross profit ($ millions) | 444 | 121 | >100 | % | ||||||||||||
|
|
|
|
|
| |||||||||||
Gross profit (%) | 21 | 8 | >100 | % | ||||||||||||
|
|
|
|
|
| |||||||||||
Net earnings attributable to equity holders | 606 | 200 | >100 | % | ||||||||||||
|
|
|
|
|
| |||||||||||
Adjusted EBITDA (non-IFRS, see page 41)1 | 835 | 380 | >100 | % | ||||||||||||
|
|
|
|
|
| |||||||||||
| 1 | Includes JV Inkai EBITDA of $235 million in 2023 and $135 million in 2022. See JV Inkai Non-IFRS measures on page 83. |
Production volumes in 2023 increased by 69% compared to 2022. See Uranium – production overview on page 72 for more information.
Uranium revenues this year were up 45% compared to 2022 due to an increase in sales volumes of 25% and an increase of 16% in the Canadian dollar average realized price due to the impact of the increase in average US dollar spot price on market-related contracts as well as the weakening of the Canadian dollar. For more information on the impact of spot price changes on average realized price, see Price sensitivity analysis: uranium segment on page 53.
Total cost of sales (including D&A) increased by 26% ($1.71 billion compared to $1.36 billion in 2022) due primarily to an increase in sales volume of 25% as well as a 1% increase in unit cost of sales. Unit cost of sales is slightly higher than in the same period in 2022 due to the higher cost of purchased material in 2023 compared to the same period in 2022 mostly offset by higher operational readiness costs at McArthur River/Key Lake operations in 2022.
The net effect was a $323 million increase in gross profit for the year.
The following table shows the costs of produced and purchased uranium incurred in the reporting periods (see Non-IFRS measures starting on page 41). These costs do not include care and maintenance costs, operational readiness costs, selling costs such as royalties, transportation and commissions, nor do they reflect the impact of opening inventories on our reported cost of sales.
($CDN/LB) | 2023 | 2022 | CHANGE | |||||||||
Produced | ||||||||||||
Cash cost | 24.12 | 19.24 | 25 | % | ||||||||
Non-cash cost | 11.60 | 15.72 | (26 | )% | ||||||||
|
|
|
|
|
| |||||||
Total production cost 1 | 35.72 | 34.96 | 2 | % | ||||||||
|
|
|
|
|
| |||||||
Quantity produced (million lbs)1 | 17.6 | 10.4 | 69 | % | ||||||||
|
|
|
|
|
| |||||||
Purchased | ||||||||||||
Cash cost1 | 81.02 | 51.36 | 58 | % | ||||||||
|
|
|
|
|
| |||||||
Quantity purchased (million lbs)1 | 11.3 | 18.3 | (38 | )% | ||||||||
|
|
|
|
|
| |||||||
Totals | ||||||||||||
Produced and purchased costs | 53.43 | 45.42 | 18 | % | ||||||||
|
|
|
|
|
| |||||||
Quantities produced and purchased (million lbs) | 28.9 | 28.7 | 1 | % | ||||||||
|
|
|
|
|
| |||||||
| 1 | Due to equity accounting for JV Inkai, our share of production is shown as a purchase at the time of delivery. JV Inkai purchases will fluctuate during the quarters and timing of purchases will not match production. In 2023 we purchased 4.2 million pounds at a purchase price per pound of $92.72 ($67.69 (US)) (2022 – 3.3 million pounds at a purchase price per pound of $62.78 ($47.33 (US))). |
MANAGEMENT’S DISCUSSION AND ANALYSIS 61
The average cash cost of production was 25% higher compared to 2022, due to lower production at Cigar Lake in 2023 as well as well as inflationary pressures and the ongoing ramp up of production at McArthur/Key Lake.
In 2024, we expect the average unit cost of production at McArthur River/Key Lake to continue to be higher than the average unit life of mine operating costs reflected in our most recent annual information form as we complete the ramp up of production and continue work to realize the benefits from the operational improvements that have been made. The average unit production cost at Cigar Lake is expected to trend down with higher planned production. The estimated average unit life of mine operating costs reflected in our most recent annual information form are $16 per pound at McArthur River/Key Lake and $18 per pound at Cigar Lake.
We equity account for our share of JV Inkai. As a result, we record our share of its production as a purchase, which under Kazakhstan’s pricing regulations, requires we purchase the material at a price equal to the uranium spot price, less a 5% discount. However, this does not reflect the economic benefit to Cameco. Our share of the economic benefit is based on the difference between our purchase price and JV Inkai’s lower production cost and is reflected in the line item on our statement of earnings called, “share of earnings from equity-accounted investees.” This benefit is realized through receipt of a cash dividend, when declared and paid by JV Inkai. Excess cash, net of working capital requirements is distributed to the partners as dividends. If there is a significant disruption to JV Inkai’s operations for any reason, it may not achieve its production plans, there may be a delay in production, and it may experience increased costs to produce uranium.
Our purchases in 2023, totaled about $916 million, representing an average annual cost of $81.02 per pound, about $45.00 per pound higher than our total unit production cost for the year. Although purchased pounds are transacted in US dollars, we account for the purchases in Canadian dollars. The average cost of purchased material in Canadian dollar terms increased by 58% this year compared to 2022. The average cash cost of purchased material was $81.02 (Cdn), or $59.42 (US) per pound, compared to $51.36 (Cdn), or $39.45 (US) per pound in the same period in 2022.
ROYALTIES
We pay royalties on the sale of all uranium extracted at our mines in the province of Saskatchewan. Two types of royalties are paid:
| • | Basic royalty: calculated as 5% of gross sales of uranium, less the Saskatchewan resource credit of 0.75%. |
| • | Profit royalty: a 10% royalty is charged on profit up to and including $28.182/kg U3O8 ($12.78/lb) and a 15% royalty is charged on profit in excess of $28.182/kg U3O8. Profit is determined as revenue less certain operating, exploration, reclamation and capital costs. Both exploration and capital costs are deductible at the discretion of the producer. |
As a resource corporation in Saskatchewan, we also pay a corporate resource surcharge of 3% of the value of resource sales.
Fuel services
(includes results for UF6, UO2,UO3 and fuel fabrication) HIGHLIGHTS | 2023 | 2022 | CHANGE | |||||||||||||
Production volume (million kgU) | 13.3 | 13.0 | 2 | % | ||||||||||||
Sales volume (million kgU) | 12.0 | 11.1 | 8 | % | ||||||||||||
Average realized price | ($ | Cdn/kgU | ) | 35.61 | 32.92 | 8 | % | |||||||||
Average unit cost of sales (including D&A) | ($ | Cdn/kgU | ) | 25.23 | 22.39 | 13 | % | |||||||||
Revenue ($ millions) | 426 | 365 | 17 | % | ||||||||||||
Gross profit ($ millions) | 124 | 117 | 6 | % | ||||||||||||
Gross profit (%) | 29 | 32 | (9 | )% | ||||||||||||
Net earnings attributable to equity holders | 129 | 120 | 8 | % | ||||||||||||
Adjusted EBITDA (non-IFRS, see page 41) | 164 | 153 | 7 | % | ||||||||||||
Total revenue increased by 17% from 2022 due to an 8% increase in sales volume and an 8% increase in the realized price. The increase in realized price was mainly the result of increased prices due to market conditions.
Total cost of products and services sold (including D&A) increased 21% ($301 million compared to $248 million in 2022), due to the 8% increase in sales volume as well as a 13% increase in average unit cost of sales compared to 2022 due to higher input costs.
62 CAMECO CORPORATION
The net effect was a $7 million increase in gross profit.
Westinghouse
OUR 2023 EARNINGS FROM WESTINGHOUSE
On November 7, 2023, we announced the closing of the acquisition of Westinghouse in a strategic partnership with Brookfield. Cameco now owns a 49% interest and Brookfield owns the remaining 51%. Under the equity method of accounting, beginning on November 7, 2023, we have included our share of Westinghouse’s earnings in our financial results.
($ MILLIONS) | 100% | 49% | ||||||
Net loss1 | (49 | ) | (24 | ) | ||||
Depreciation and amortization | 124 | 61 | ||||||
Finance income | (4 | ) | (2 | ) | ||||
Finance costs | 61 | 30 | ||||||
Income tax expense (recovery) | (14 | ) | (7 | ) | ||||
|
|
|
| |||||
EBITDA2 | 118 | 58 | ||||||
Adjustments on cost of products and services sold3 | 55 | 27 | ||||||
Adjustments on marketing, administrative and general | 34 | 16 | ||||||
|
|
|
| |||||
Adjusted EBITDA2 | 207 | 101 | ||||||
Capital expenditures | 87 | 42 | ||||||
|
|
|
| |||||
Adjusted free cash flow2 | 120 | 59 | ||||||
|
|
|
| |||||
Revenue | 1,063 | 521 | ||||||
|
|
|
| |||||
Adjusted EBITDA margin2 | 19 | % | 19 | % | ||||
|
|
|
| |||||
| 1 | This table includes results for the period beginning on the date of acquisition until the end of 2023. Comparative figures are not available. See Westinghouse Non-IFRS measures starting on page 95 for full year results for both 2023 and 2022 prepared in accordance with US GAAP. |
| 2 | Non-IFRS measures, see page 41 |
| 3 | Net earnings for 2023 were impacted by purchase price accounting. Inventories acquired were assigned values based on the market price at the date of the acquisition. As these quantities are sold, cost of products and services sold reflects these market values, regardless of Westinghouse’s historic costs. |
MANAGEMENT’S DISCUSSION AND ANALYSIS 63
Fourth quarter financial results
Consolidated results
| THREE MONTHS ENDED | ||||||||||||
| HIGHLIGHTS | DECEMBER 31 | |||||||||||
($ MILLIONS EXCEPT WHERE INDICATED) | 2023 | 2022 | CHANGE | |||||||||
Revenue | 844 | 524 | 61 | % | ||||||||
Gross profit | 133 | 65 | >100 | % | ||||||||
Net earnings (loss) attributable to equity holders | 80 | (15 | ) | >100 | % | |||||||
$ per common share (basic) | 0.18 | (0.04 | ) | >100 | % | |||||||
$ per common share (diluted) | 0.18 | (0.04 | ) | >100 | % | |||||||
Adjusted net earnings (non-IFRS, see page 41) | 90 | 36 | >100 | % | ||||||||
$ per common share (adjusted and diluted) | 0.21 | 0.09 | >100 | % | ||||||||
Cash provided by operations | 201 | 77 | >100 | % | ||||||||
NET EARNINGS
The following table shows what contributed to the change in net earnings and adjusted net earnings (non-IFRS measure, see page 41) in the fourth quarter of 2023 compared to the same period in 2022.
($ MILLIONS) | IFRS | Adjusted | ||||||||
Net earnings (losses) - 2022 | (15 | ) | 36 | |||||||
|
|
|
| |||||||
Change in gross profit by segment | ||||||||||
(we calculate gross profit by deducting from revenue the cost of products and services sold, and depreciation and amortization (D&A), net of hedging benefits) |
| |||||||||
Uranium | Impact from sales volume changes | 10 | 10 | |||||||
Higher realized prices ($US) | 122 | 122 | ||||||||
Foreign exchange impact on realized prices | 13 | 13 | ||||||||
Higher costs | (73 | ) | (73 | ) | ||||||
|
|
|
| |||||||
change – uranium | 72 | 72 | ||||||||
|
|
|
| |||||||
Fuel services | Impact from sales volume changes | 4 | 4 | |||||||
Higher realized prices ($Cdn) | 8 | 8 | ||||||||
Higher costs | (14 | ) | (14 | ) | ||||||
|
|
|
| |||||||
change – fuel services | (2 | ) | (2 | ) | ||||||
|
|
|
| |||||||
Other changes | ||||||||||
Higher administration expenditures | (30 | ) | (30 | ) | ||||||
Higher exploration expenditures | (1 | ) | (1 | ) | ||||||
Change in reclamation provisions | 41 | (7 | ) | |||||||
Change in gains or losses on derivatives | 36 | (4 | ) | |||||||
Change in foreign exchange gains or losses | 2 | 2 | ||||||||
Change in earnings from equity-accounted investments | 39 | 59 | ||||||||
Lower finance income | (3 | ) | (3 | ) | ||||||
Higher finance costs | (24 | ) | (24 | ) | ||||||
Change in income tax recovery or expense | (32 | ) | (5 | ) | ||||||
Other | (3 | ) | (3 | ) | ||||||
|
|
|
| |||||||
Net earnings - 2023 | 80 | 90 | ||||||||
|
|
|
| |||||||
ADJUSTED NET EARNINGS
We use adjusted net earnings, a non-IFRS measure, as a more meaningful way to compare our financial performance from period to period. See page 41 for more information. The following table reconciles adjusted net earnings with our net earnings.
64 CAMECO CORPORATION
| THREE MONTHS ENDED | ||||||||
| DECEMBER 31 | ||||||||
($ MILLIONS) | 2023 | 2022 | ||||||
Net earnings (loss) attributable to equity holders | 80 | (15 | ) | |||||
|
|
|
| |||||
Adjustments | ||||||||
Adjustments on derivatives | (59 | ) | (19 | ) | ||||
Adjustments to earnings from equity-investees | 20 | — | ||||||
Adjustments on other operating expense (income) | 40 | 88 | ||||||
Income taxes on adjustments | 9 | (18 | ) | |||||
|
|
|
| |||||
Adjusted net earnings | 90 | 36 | ||||||
|
|
|
| |||||
ADMINISTRATION
| THREE MONTHS ENDED | ||||||||||||
| DECEMBER 31 | ||||||||||||
($ MILLIONS) | 2023 | 2022 | CHANGE | |||||||||
Direct administration | 48 | 37 | 30 | % | ||||||||
Stock-based compensation | 11 | (8 | ) | 238 | % | |||||||
Total administration | 59 | 29 | 103 | % | ||||||||
Direct administration costs were $48 million in the quarter, $11 million higher than the same period last year. We recorded $11 million in stock-based compensation expenses in the fourth quarter of 2023, $19 million higher compared to 2022 due to the increase in our share price compared to the same period last year.
Quarterly trends
| HIGHLIGHTS | 2023 | 2022 | ||||||||||||||||||||||||||||||
($ MILLIONS EXCEPT PER SHARE AMOUNTS) | Q4 | Q3 | Q2 | Q1 | Q4 | Q3 | Q2 | Q1 | ||||||||||||||||||||||||
Revenue | 844 | 575 | 482 | 687 | 524 | 389 | 558 | 398 | ||||||||||||||||||||||||
Net earnings (loss) attributable to equity holders | 80 | 148 | 14 | 119 | (15 | ) | (20 | ) | 84 | 40 | ||||||||||||||||||||||
$ per common share (basic) | 0.18 | 0.34 | 0.03 | 0.27 | (0.04 | ) | (0.05 | ) | 0.21 | 0.10 | ||||||||||||||||||||||
$ per common share (diluted) | 0.18 | 0.34 | 0.03 | 0.27 | (0.04 | ) | (0.05 | ) | 0.21 | 0.10 | ||||||||||||||||||||||
Adjusted net earnings (loss) (non-IFRS, see page 41) | 90 | 137 | (3 | ) | 115 | 36 | 10 | 72 | 17 | |||||||||||||||||||||||
$ per common share (adjusted and diluted) | 0.21 | 0.32 | (0.01 | ) | 0.27 | 0.09 | 0.03 | 0.18 | 0.04 | |||||||||||||||||||||||
Cash provided by (used in) operations (after working capital changes) | 201 | 185 | 87 | 215 | 77 | (47 | ) | 102 | 172 | |||||||||||||||||||||||
Key things to note:
| • | The timing of customer requirements, which tends to vary from quarter to quarter, drives revenue in the uranium and fuel services segments, meaning quarterly results are not necessarily a good indication of annual results due to the variability in customer requirements. |
| • | Net earnings do not trend directly with revenue due to unusual items and transactions that occur from time to time. We use adjusted net earnings, a non-IFRS measure, as a more meaningful way to compare our results from period to period (see page 41 for more information). |
| • | Cash from operations tends to fluctuate as a result of the timing of deliveries and product purchases in our uranium and fuel services segments. |
MANAGEMENT’S DISCUSSION AND ANALYSIS 65
The table that follows presents the differences between net earnings and adjusted net earnings for the previous seven quarters.
| HIGHLIGHTS | 2023 | 2022 | ||||||||||||||||||||||||||||||
($ MILLIONS EXCEPT PER SHARE AMOUNTS) | Q4 | Q3 | Q2 | Q1 | Q4 | Q3 | Q2 | Q1 | ||||||||||||||||||||||||
Net earnings (loss) attributable to equity holders | 80 | 148 | 14 | 119 | (15 | ) | (20 | ) | 84 | 40 | ||||||||||||||||||||||
Adjustments | ||||||||||||||||||||||||||||||||
Adjustments on derivatives | (59 | ) | 41 | (35 | ) | (6 | ) | (19 | ) | 75 | 31 | (11 | ) | |||||||||||||||||||
Adjustments to earnings from equity-investees | 20 | — | — | — | — | — | — | — | ||||||||||||||||||||||||
Adjustments on other operating expense (income) | 40 | (48 | ) | 8 | (2 | ) | 88 | (24 | ) | (19 | ) | (19 | ) | |||||||||||||||||||
Adjustment to other income | — | — | — | — | — | — | (23 | ) | — | |||||||||||||||||||||||
Income taxes on adjustments | 9 | (4 | ) | 10 | 4 | (18 | ) | (21 | ) | (1 | ) | 7 | ||||||||||||||||||||
|
|
|
|
|
|
|
|
|
|
|
|
|
|
|
| |||||||||||||||||
Adjusted net earnings (losses) (non-IFRS, see page 41) | 90 | 137 | (3 | ) | 115 | 36 | 10 | 72 | 17 | |||||||||||||||||||||||
|
|
|
|
|
|
|
|
|
|
|
|
|
|
|
| |||||||||||||||||
66 CAMECO CORPORATION
Fourth quarter financial results by segment
Uranium
| THREE MONTHS ENDED | ||||||||||||||||
| DECEMBER 31 | ||||||||||||||||
HIGHLIGHTS | 2023 | 2022 | CHANGE | |||||||||||||
Production volume (million lbs) | 5.7 | 3.7 | 54 | % | ||||||||||||
|
|
|
|
|
| |||||||||||
Sales volume (million lbs) | 9.8 | 6.9 | 42 | % | ||||||||||||
|
|
|
|
|
| |||||||||||
Average spot price | ($US/lb | ) | 82.21 | 49.94 | 65 | % | ||||||||||
Average long-term price | ($US/lb | ) | 66.00 | 51.67 | 28 | % | ||||||||||
Average realized price | ($US/lb | ) | 52.35 | 43.05 | 22 | % | ||||||||||
| ($Cdn/lb | ) | 71.65 | 57.87 | 24 | % | |||||||||||
|
|
|
|
|
| |||||||||||
Average unit cost of sales (including D&A) | ($Cdn/lb | ) | 61.90 | 54.37 | 14 | % | ||||||||||
|
|
|
|
|
| |||||||||||
Revenue ($ millions) | 700 | 397 | 76 | % | ||||||||||||
|
|
|
|
|
| |||||||||||
Gross profit ($ millions) | 96 | 24 | >100 | % | ||||||||||||
|
|
|
|
|
| |||||||||||
Gross profit (%) | 14 | 6 | >100 | % | ||||||||||||
|
|
|
|
|
| |||||||||||
Production volumes this quarter increased by 54% compared to the fourth quarter of 2022. See Uranium – production overview on page 72 for more information.
Uranium revenues were up 76% due to a 42% increase in sales volume due to the timing of sales, which were in line with the delivery pattern disclosed in our 2022 annual MD&A, and a 24% increase in the Canadian dollar average realized price. While the average US dollar spot price for uranium increased by 65% compared to the same period in 2022, the Canadian dollar average realized price increased by 24% due to the timing of market changes on our contract portfolio. For more information on the impact of spot price changes on average realized price, see Price sensitivity analysis: uranium segment on page 53.
Total cost of sales (including D&A) increased by 62% ($605 million compared to $373 million in 2022). This was primarily the result of the 42% increase in sales volume as well as an increase of 14% in the average unit cost of sales which was due to the higher cost of purchased material.
The net effect was a $72 million increase in gross profit for the quarter.
The following table shows the costs of produced and purchased uranium incurred in the reporting periods (see Non-IFRS measures starting on page 41). These costs do not include care and maintenance costs, operational readiness costs, selling costs such as royalties, transportation and commissions, nor do they reflect the impact of opening inventories on our reported cost of sales.
| THREE MONTHS ENDED | ||||||||||||
| DECEMBER 31 | ||||||||||||
($/LB) | 2023 | 2022 | CHANGE | |||||||||
Produced | ||||||||||||
Cash cost | 21.07 | 19.50 | 8 | % | ||||||||
Non-cash cost | 10.95 | 13.76 | (20 | )% | ||||||||
|
|
|
|
|
| |||||||
Total production cost 1 | 32.02 | 33.26 | (4 | )% | ||||||||
|
|
|
|
|
| |||||||
Quantity produced (million lbs)1 | 5.7 | 3.7 | 54 | % | ||||||||
|
|
|
|
|
| |||||||
Purchased | ||||||||||||
Cash cost1 | 89.89 | 57.02 | 58 | % | ||||||||
|
|
|
|
|
| |||||||
Quantity purchased (million lbs)1 | 6.3 | 5.8 | 9 | % | ||||||||
|
|
|
|
|
| |||||||
Totals | ||||||||||||
Produced and purchased costs | 62.40 | 47.77 | 31 | % | ||||||||
|
|
|
|
|
| |||||||
Quantities produced and purchased (million lbs) | 12.0 | 9.5 | 26 | % | ||||||||
|
|
|
|
|
| |||||||
| 1 | Due to equity accounting for JV Inkai, our share of production will be shown as a purchase at the time of delivery. JV Inkai purchases will fluctuate during the quarters and timing of purchases will not match production. During the quarter we purchased 2.8 million pounds at a purchase price per pound of $105.74 ($77.13 (US)) (Q4 2022 – 2.6 million pounds at a purchase price per pound of $61.27 ($45.60 (US))). |
MANAGEMENT’S DISCUSSION AND ANALYSIS 67
The average cash cost of production for the fourth quarter was 8% higher compared to the same period in the prior year. Cash cost was higher due to the effect of supply chain challenges and inflationary pressures.
Although purchased pounds are transacted in US dollars, we account for the purchases in Canadian dollars. In the fourth quarter, the average cash cost of purchased material was $89.89 (Cdn) per pound, or $65.67 (US) per pound in US dollar terms, compared to $57.02 (Cdn) per pound, or $42.18 (US) per pound in the fourth quarter of 2022.
Fuel services
(includes results for UF6, UO2,UO3 and fuel fabrication)
| THREE MONTHS ENDED | ||||||||||||||||
| DECEMBER 31 | ||||||||||||||||
HIGHLIGHTS | 2023 | 2022 | CHANGE | |||||||||||||
Production volume (million kgU) | 3.7 | 3.7 | — | |||||||||||||
Sales volume (million kgU) | 4.2 | 3.8 | 11 | % | ||||||||||||
Average realized price | ($ | Cdn/kgU | ) | 32.19 | 30.11 | 7 | % | |||||||||
Average unit cost of sales (including D&A) | ($ | Cdn/kgU | ) | 22.69 | 19.33 | 17 | % | |||||||||
Revenue ($ millions) | 134 | 115 | 17 | % | ||||||||||||
Gross profit ($ millions) | 40 | 41 | (2 | )% | ||||||||||||
Gross profit (%) | 30 | 36 | (17 | )% | ||||||||||||
Total revenue increased by 17% due to an 11% increase in sales volumes and a 7% increase in average realized price. The increase in average realized price was mainly the result of increased prices for UF6 due to market conditions.
Total cost of sales (including D&A) increased by 28% to $95 million compared to the fourth quarter of 2022 due to the 11% increase in sales volumes and an increase of 17% in the average unit cost of sales. Unit cost of sales increased mainly as a result of higher input costs.
The net effect was a $1 million decrease in gross profit.
68 CAMECO CORPORATION
Operations, projects and investments
This section of our MD&A is an overview of the mining, milling and processing facilities we operate or have an interest in, our curtailed operations, our advanced uranium projects and our exploration activities, what we accomplished this year, our plans for the future and how we manage risk. It also includes an overview of our investments in Westinghouse and GLE.
70 | MANAGING THE RISKS | |
72 | URANIUM – PRODUCTION OVERVIEW | |
72 | PRODUCTION OUTLOOK | |
73 | URANIUM – TIER-ONE OPERATIONS | |
73 | MCARTHUR RIVER MINE / KEY LAKE MILL | |
77 | CIGAR LAKE | |
81 | INKAI | |
85 | URANIUM – TIER-TWO OPERATIONS | |
85 | RABBIT LAKE | |
86 | US ISR | |
87 | URANIUM – ADVANCED PROJECTS | |
87 | MILLENNIUM | |
87 | YEELIRRIE | |
87 | KINTYRE | |
89 | URANIUM – EXPLORATION | |
91 | FUEL SERVICES | |
91 | BLIND RIVER REFINERY | |
92 | PORT HOPE CONVERSION SERVICES | |
92 | CAMECO FUEL MANUFACTURING INC. (CFM) | |
94 | WESTINGHOUSE ELECTRIC COMPANY | |
99 | OTHER NUCLEAR FUEL CYCLE INVESTMENTS | |
99 | GLOBAL LASER ENRICHMENT (GLE) | |
MANAGEMENT’S DISCUSSION AND ANALYSIS 69
Managing the risks
The nature of our business means we face many kinds of potential risks and hazards – some that relate to the nuclear energy industry in general, safety, health and environmental risks associated with any mining and chemical processing company and others that apply to specific properties, operations, planned operations, Westinghouse or other fuel cycle investments. Our uranium and fuel services and Westinghouse segments also face unique risks associated with radiation. These risks could have a significant impact on our business, earnings, cash flows, financial condition, results of operations or prospects, which may result in a significant decrease in the market price of our common shares.
Risks and hazards generally applicable to the mining, milling and processing facilities we operate, and advanced projects include:
| • | catastrophic accidents resulting in large-scale releases of hazardous chemicals, or a tailings facility failure |
| • | industrial safety accidents |
| • | transportation incidents, which may involve radioactive or other hazardous materials |
| • | labour shortages, disputes or strikes |
| • | availability of personnel with the necessary skills and experience |
| • | cost increases for labour, contracted or purchased materials, supplies and services |
| • | shortages of, or interruptions in the supply of, required materials, supplies and equipment |
| • | transportation and delivery disruptions |
| • | interruptions in the supply of electricity, water, and other utilities or infrastructure |
| • | inability of our innovation initiatives to achieve the expected cost saving and operational flexibility objectives |
| • | equipment failures |
| • | cyberattacks |
| • | joint venture disputes or litigation |
| • | non-compliance with legal requirements, including exceedances of applicable air or water limits |
| • | subsurface contamination from current or legacy operations |
| • | inability to obtain and renew the licences and other approvals needed to restart, operate, and to increase production at our mines, mills, processing facilities, to develop new mines, or for Westinghouse to operate its fuel fabrication or other facilities or undertake its other commercial activities |
| • | increased workforce health and safety risks or increased regulatory burdens resulting from a pandemic or other causes |
| • | fires |
| • | blockades or other acts of social or political activism |
| • | uncertain impact of changing regulations or policy leading to higher annual operating costs, including GHG pricing and regulations (e.g., carbon pricing, the Canadian Clean Fuel Standard) |
| • | natural phenomena, such as forest fires, floods and earthquakes as well as shifts in temperature, precipitation, and the impact of more frequent severe weather conditions on our operations as a result of climate change |
| • | outbreak of communicable illness (such as a pandemic) |
| • | unusual, unexpected or adverse mining or geological conditions |
| • | underground water inflows at our mining operations |
| • | ground movement or cave-ins at our mining operations |
Risks and hazards generally applicable to Westinghouse and our ownership interest in Westinghouse include:
| • | failure to realize any or all of the anticipated benefits from the acquisition |
| • | Westinghouse’s failure to generate sufficient cash flow to fund its approved annual operating budget or make quarterly distributions to us and Brookfield |
| • | Westinghouse’s failure to comply with nuclear licence and quality assurance requirements at its facilities |
| • | Westinghouse’s loss of protections against liability for nuclear damage, including discontinuation of global nuclear liability regimes and indemnities |
| • | adverse public perception of nuclear energy |
70 CAMECO CORPORATION
| • | adverse public reaction to an unforeseen nuclear incident resulting in a lessening of demand for nuclear generators |
| • | threat of increased trade barriers adversely impacting Westinghouse’s business |
| • | our inability to control Westinghouse |
| • | liabilities at Westinghouse exceeding our estimates and the discovery of unknown or undisclosed liabilities |
| • | default by Westinghouse under its credit facilities impacting adversely Westinghouse’s ability to fund its ongoing operations |
| • | occupational health and safety issues arising at Westinghouse’s operations |
| • | disputes between us and Brookfield regarding our strategic partnership |
| • | Cameco defaulting under the governance agreement with Brookfield, including us losing some or all of our interest in Westinghouse |
We have a Risk Policy that is supported by our formal Risk Management Program.
Our Risk Management Program involves a broad, systematic approach to identifying, assessing, monitoring, reporting and managing the significant risks we face in our business and operations, including consideration of ESG and climate-related risks that could impact our four measures of success. For more information about our risk management program see the Risk and Risk Management section in this MD&A, as well as our most recent ESG Report at cameco.com.
We have insurance to cover some of these risks and hazards, but not all of them, and not to the full amount of losses or liabilities that could potentially arise.
In addition to considering the other information in this MD&A and the risks noted above, you should carefully consider the material risks discussed starting on page 4, and the specific risks discussed under the update for each operation, advanced project, Westinghouse, and GLE in this section. These risks, however, are not a complete list of the potential risks our operations, advanced projects, or other investments face. There may be others we are not aware of or risks we feel are not material today that could become material in the future.
We recommend you also review our most recent annual information form, which includes a discussion of other material risks that could have an impact on our business.
MANAGEMENT’S DISCUSSION AND ANALYSIS 71
Uranium – production overview
Our share of production in our uranium segment in the fourth quarter was 5.7 million pounds, 54% higher compared to the same period in 2022, while production for the year was 17.6 million pounds, 69% higher than in 2022. In 2022, there was no production from McArthur River and Key Lake until the fourth quarter. Total production in 2023 was 1.1 million pounds below the revised production plan we announced in September.
The Rabbit Lake operation remained in a safe and sustainable state of care and maintenance, and we are no longer developing new wellfields at Crow Butte and Smith Ranch-Highland. See Uranium – Tier-one operations starting on page 73 and Uranium – Tier-two operations beginning on page 85 for more information.
Uranium production
| CAMECO SHARE | THREE MONTHS ENDED DECEMBER 31 | YEAR ENDED DECEMBER 31 | ||||||||||||||||||||||
(MILLION LBS) | 2023 | 2022 | 2023 | 2022 | 2023 PLAN1 | 2024 PLAN | ||||||||||||||||||
Cigar Lake | 2.6 | 2.9 | 8.2 | 9.6 | 8.9 | 9.8 | ||||||||||||||||||
McArthur River/Key Lake | 3.1 | 0.8 | 9.4 | 0.8 | up to 9.8 | 12.6 | ||||||||||||||||||
|
|
|
|
|
|
|
|
|
|
|
| |||||||||||||
Total | 5.7 | 3.7 | 17.6 | 10.4 | up to 18.7 | 22.4 | ||||||||||||||||||
|
|
|
|
|
|
|
|
|
|
|
| |||||||||||||
| 1 | During the third quarter, we updated our Cigar Lake production forecast to up to 16.3 million pounds (100% basis) in 2023 (previously 18 million pounds). |
| 2 | During the third quarter, we updated our McArthur River/Key Lake production forecast to 14 million pounds (100% basis) in 2023 (previously 15 million pounds). |
PRODUCTION OUTLOOK
We remain focused on taking advantage of the long-term growth we see coming in our industry, while maintaining the ability to respond to market conditions as they evolve. Our strategy includes a focus, in our uranium segment, on protecting and extending the value of our contract portfolio, on aligning our production decisions with our contract portfolio and market opportunities in order to increase long-term value, and to do that with an emphasis on safety, people and the environment.
In 2024, we are planning production of 22.4 million pounds (our share).
Due to equity accounting, our share of production from Inkai is shown as a purchase. Based on KAP’s announcement on February 1, 2024, production in Kazakhstan is expected to remain 20% below the level stipulated in subsoil use agreements, similar to in 2023, primarily due to the sulfuric acid shortage in the country. We are still in discussions with JV Inkai and KAP to determine how this may impact production at Inkai in 2024 and thereafter and therefore our corresponding purchase obligation. We expect to purchase the remaining share of our 2023 production entitlement, which has arrived at a Canadian port.
72 CAMECO CORPORATION
Uranium – Tier-one operations
McArthur River mine / Key Lake mill
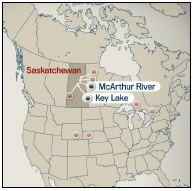 | 2023 Production (our share) | |
| 9.4M lbs | ||
| 2024 Production Outlook (our share) | ||
| 12.6M lbs | ||
| Estimated Reserves (our share) | ||
| 265.6M lbs | ||
| Estimated Mine Life | ||
| 2044 |
McArthur River is the world’s largest, high-grade uranium mine, and Key Lake is the world’s largest uranium mill. We are the operator of both the mine and mill.
McArthur River is considered a material uranium property for us. There is a technical report dated March 29, 2019 (effective December 31, 2018) that can be downloaded from SEDAR+ (www.sedarplus.com) or from EDGAR (sec.gov).
| Location | Saskatchewan, Canada | |||
| Ownership | McArthur River – 69.805% | |||
| Key Lake – 83.33% | ||||
| Mine type | Underground | |||
| Mining methods | Blasthole stoping and raiseboring | |||
| End product | Uranium concentrate | |||
| Certification | ISO 14001 certified | |||
| Estimated reserves | 265.6 million pounds (proven and probable), average grade U3O8: 6.72% | |||
| Estimated resources | 4.9 million pounds (measured and indicated), average grade U3O8: 2.28% | |||
| 1.7 million pounds (inferred), average grade U3O8: 2.90% | ||||
| Licensed capacity | Mine and mill: 25.0 million pounds per year | |||
| Licence term | Through October 2043 | |||
| Total packaged production: | 2000 to 2023 | 340.0 million pounds (McArthur River/Key Lake) (100% basis) | ||
| 1983 to 2002 | 209.8 million pounds (Key Lake) (100% basis) | |||
| 2023 production | 9.4 million pounds (13.5 million pounds on 100% basis) | |||
| 2024 production outlook | 12.6 million pounds (18.0 million pounds on 100% basis) | |||
| Estimated decommissioning cost | $50.6 million – McArthur River (100% basis) | |||
| $276.7 million – Key Lake (100% basis) | ||||
All values shown, including reserves and resources, represent our share only, unless indicated.
MANAGEMENT’S DISCUSSION AND ANALYSIS 73
BACKGROUND
Mine description
The mineral reserves at McArthur River are contained within seven zones: zones 1, 2, 3, 4, 4 South, A and B. There are currently two active mining zones (zone 2 and 4), one with development significantly advanced (zone 1), and one in the early stages of development (zone 4 South).
Zone 2 has been actively mined since production began in 1999. The ore zone was initially divided into three freeze panels. As the freeze wall was expanded, the inner connecting freeze walls were decommissioned to recover the inaccessible uranium around the active freeze pipes. Mining of zone 2 is almost complete. About 3.5 million pounds of mineral reserves remain, and we expect to recover them using a combination of raisebore and blasthole stope mining.
Zone 4 has been actively mined since 2010. The zone was divided into four freeze panels, and like in zone 2, as the freeze wall was expanded, the inner connecting freeze walls were decommissioned. Zone 4 has 103.9 million pounds of mineral reserves secured behind freeze walls, and it will be the main source of production for the next several years. Raisebore and blasthole stope mining will be used to recover the mineral reserves.
Zone 1 is the next planned mine area to be brought into production. Freeze hole drilling was completed in 2023 and brine distribution construction work has resumed. A small section of the planned freeze wall is currently actively freezing. Once brine distribution construction is complete and an active freeze wall has been established, drill and extraction chamber development will need to be completed prior to the start of production. Once complete, an additional 48.0 million pounds of mineral reserves will be secured behind freeze walls. Blasthole stope mining is currently planned as the main extraction method in zone 1.
Zone 4 South is in the early development stages. Access development for the freeze drifts has resumed on the lower levels and freeze drilling began at the end of 2023 on the upper freeze drifts which were established prior to the 2018 shutdown.
We have successfully extracted over 340 million pounds (100% basis) since we began mining in 1999.
Mining methods and techniques
All the mineralized areas discovered to date at McArthur River are in, or partially in, water-bearing ground with significant pressure at mining depths.
There are three approved mining methods at McArthur River: raisebore mining, blasthole stope mining and boxhole mining. However, only raisebore and blasthole stope mining remain in use. Before we begin mining an area, we freeze the ground around it by circulating chilled brine through freeze holes to form an impermeable frozen barrier.
Blasthole stope mining
Blasthole stope mining began in 2011 and is the main extraction method planned for future production. It is planned in areas where blastholes can be accurately drilled and small stable stopes excavated without jeopardizing the freeze wall integrity. The use of this method has allowed the site to improve operating costs by increasing overall extraction efficiency by reducing underground development, concrete consumption, mineralized waste generation and improving extraction cycle time.
Raisebore mining
Raisebore mining is an innovative non-entry approach that we adapted to meet the unique challenges at McArthur River, and it has been used since mining began in 1999. This method is favourable for mining the weaker rock mass areas of the deposit and is suitable for massive high-grade zones where there is access both above and below the ore zone.
Initial processing
McArthur River produces two product streams, high grade slurry and low-grade mineralized rock. Both product streams are shipped to Key Lake mill to produce uranium ore concentrate.
The high-grade material is ground and thickened into a slurry underground and then pumped to surface. The material is then thickened and blended for grade control and shipped to Key Lake in slurry totes using haul trucks.
The low-grade mineralized material is hoisted to surface and shipped as a dry product to Key Lake using covered haul trucks. Once at Key Lake, the material is ground, thickened and blended with the high-grade slurry to a nominal 5% U3O8 mill feed grade. It is then processed into uranium ore concentrate and packaged in drums for further processing offsite.
74 CAMECO CORPORATION
Tailings capacity
Based on the current licence conditions, tailings capacity at Key Lake is sufficient to mill all the known McArthur River mineral reserves and resources, should they be converted to reserves, with additional capacity to toll mill ore from other regional deposits.
Licensed annual production capacity
The McArthur River mine and Key Lake mill are both licensed to produce up to 25 million pounds (100% basis) per year. To achieve annual production at the licensed capacity, additional investment will be required.
2023 UPDATE
Production
The McArthur River and Key Lake operation was in a state of safe care and maintenance from 2018 through 2021 due to weak market conditions. The operation began transitioning back to production through the first three quarters of 2022, with no packaged pounds until the fourth quarter of 2022. Production ramp-up activities continued in 2023.
Total packaged production from McArthur River and Key Lake in 2023 was 13.5 million pounds (9.4 million pounds our share), slightly less than the announced September 3, 2023, forecast of 14 million pounds (9.8 million pounds our share).
The McArthur River mine continued to operate well and achieved its planned mine production for the year. Any ore from McArthur River that was not immediately processed at Key Lake is stored in inventory for future milling. All required mine activities have now resumed at McArthur and the site is now considered to be back in normal mine operations.
At the Key Lake mill, the extended period of time the mill was on care and maintenance, the operational changes made, aging infrastructure, the availability of personnel with the necessary skills and experience, and the impact of supply chain challenges on the availability of materials and reagents combined to impact production in 2023.
Licensing
In October 2023, the Canadian Nuclear Safety Commission (CNSC) granted 20-year renewals to the licences for both McArthur River and Key Lake. The renewed licences are expected to allow McArthur River and Key Lake to operate until October 2043.
Exploration
Underground exploration at McArthur River resumed in June 2023 with the resumption of infill drilling of zone B. Infill drilling of zone B will continue in 2024.
PLANNING FOR THE FUTURE
Production
We plan to produce 18 million pounds (100% basis) in 2024. Over the last three months, the mill has been running at a rate that, when annualized, would allow this operation to achieve its 2024 planned production. In 2024, we plan to undertake an evaluation of the work and investment necessary to expand production up to its annual licensed capacity, which we expect will allow us to take advantage of this opportunity when the time is right. We will continue to plan our production to align with our contract portfolio and market opportunities, demonstrating that we continue to be a responsible supplier of uranium fuel.
MANAGING OUR RISKS
The McArthur River deposit presents unique challenges that are not typical of traditional hard or soft rock mines. These challenges are the result of mining in or near high pressure ground water in challenging ground conditions with significant radiation concerns due to the high-grade uranium. We take significant steps and precautions to reduce the risks. Mine designs and mining methods are selected based on their ability to mitigate hydrological, radiological and geotechnical risks. Operational experience gained since the start of production has resulted in a significant reduction in risk. However, there is no guarantee that our efforts to mitigate risk will be successful.
MANAGEMENT’S DISCUSSION AND ANALYSIS 75
In addition to the risks listed on pages 70 to 71, in 2024 we are focused on the management of the following risks:
Mine and mill ramp up
With the extended period of time the assets were on care and maintenance, the operational changes made, aging infrastructure, and commissioning issues that we have worked through at the mill, which caused delays to the production schedule in 2022 and 2023, there is continued uncertainty regarding the timing of a successful ramp up to planned 2024 production and the associated costs. In addition, inflation, the availability of personnel with the necessary skills and experience, and the potential impact of supply chain challenges on the availability of materials and reagents carry with them the risks of not achieving our production plans, production delays and increased costs.
Labour relations
The collective agreement with the United Steelworkers local 8914 expired in December 2022, and we are in negotiations to reach a new agreement. As in the past, work continues under the terms of the expired collective agreement while negotiations proceed. There is a risk to the production plan if we are unable to reach an agreement and there is a labour disruption.
Water inflow risk
All the mineralized areas discovered to date at McArthur River are in, or partially in, water-bearing ground with significant pressure at mining depths. This high-pressure water source is isolated from active development and production areas to reduce the inherent risk of an inflow. McArthur River relies on pressure grouting and ground freezing, and sufficient pumping, water treatment and above ground storage capacity to mitigate the risks of the high-pressure ground water.
McArthur River has not experienced a significant disruption to its mining or development activities resulting from a water inflow since 2008. The consequences of another water inflow at McArthur River would depend on its magnitude, location and timing, but could include a significant interruption or reduction in production, a material increase in costs or a loss of mineral reserves.
76 CAMECO CORPORATION
Uranium – Tier-one operations
Cigar Lake
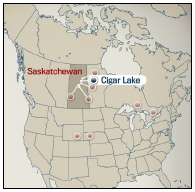 | 2023 Production (our share)
| |
| 8.2M lbs | ||
| 2024 Production Outlook (our share) | ||
| 9.8M lbs | ||
| Estimated Reserves (our share) | ||
| 113.8M lbs | ||
| Estimated Mine Life | ||
| 2036 |
Cigar Lake is the world’s highest grade uranium mine. We are a 54.5% owner and the mine operator. Cigar Lake uranium is milled at Orano’s McClean Lake mill.
Cigar Lake is considered a material uranium property for us. There is a technical report dated March 29, 2016 (effective December 31, 2015) that can be downloaded from SEDAR+ (www.sedarplus.com) or from EDGAR (sec.gov).
| Location | Saskatchewan, Canada | |
| Ownership | 54.547% | |
| Mine type | Underground | |
| Mining method | Jet boring system | |
| End product | Uranium concentrate | |
| Certification | ISO 14001 certified | |
| Estimated reserves | 113.8 million pounds (proven and probable), average grade U3O8: 17.03% | |
| Estimated resources | 14.7 million pounds (measured and indicated), average grade U3O8: 5.32% | |
10.9 million pounds (inferred), average grade U3O8: 5.55% | ||
| Licensed capacity | 18.0 million pounds per year (our share 9.8 million pounds per year) | |
| Licence term | Through June, 2031 | |
| Total packaged production: 2014 to 2023 | 138.4 million pounds (100% basis) | |
| 2023 production | 8.2 million pounds (15.1 million pounds on 100% basis) | |
| 2024 production outlook | 9.8 million pounds (18.0 million pounds on 100% basis) | |
| Estimated decommissioning cost | $62 million (100% basis) | |
All values shown, including reserves and resources, represent our share only, unless otherwise indicated.
BACKGROUND
Mine description
Cigar Lake’s geological setting is similar to McArthur River’s. However, unlike McArthur River, the Cigar Lake deposit is horizontally oriented.
Mine development is carried out in the basement rocks below the ore horizon. New mine development is required throughout the mine life to gain access to the ore above.
Mining method
At Cigar Lake, the permeable sandstone which overlays the deposit and basement rocks, contains large volumes of water at significant pressure. Before we begin mining, we freeze the ore zone and surrounding ground. We use a jet boring system to mine the ore.
MANAGEMENT’S DISCUSSION AND ANALYSIS 77
Jet boring system (JBS) mining
As a result of the unique geological conditions at Cigar Lake, we are unable to utilize traditional mining methods that require access above the ore, which necessitated the development of a non-entry mining method specifically adapted for this deposit. After many years of test mining, we selected jet boring, and it has been used since mining began in 2014. This method involves:
| • | drilling a pilot hole into the frozen orebody, inserting a high pressure water jet and cutting a cavity out of the frozen ore |
| • | collecting the ore and water mixture (slurry) from the cavity and pumping it to a storage sump, allowing it to settle |
| • | using a clamshell, transporting the ore from the storage sump to an underground grinding and processing circuit |
| • | once mining is complete, filling each cavity in the orebody with concrete |
| • | starting the process again with the next cavity. |
We have divided the orebody into production panels and at least three production panels need to be frozen at one time to achieve the annual production rate. One JBS machine is located below each frozen panel. Three JBS machines are currently in operation. Two machines actively mine at any given time while the third is moving, setting up, or undergoing maintenance.
We have successfully extracted approximately 138.4 million pounds (100% basis) since we began mining in 2014.
Initial processing
We carry out initial processing of the extracted ore at Cigar Lake before shipping it to McClean Lake. To accomplish this, we:
| • | grind the ore and mix it with water to form a slurry in our underground circuit |
| • | pump the slurry 500 metres to the surface and store it in one of two ore slurry holding tanks, where it is blended and thickened to remove excess water |
| • | the final slurry, at an average grade of approximately 17% U3O8, is pumped into transport truck containers and shipped to McClean Lake mill on a 69-kilometre all-weather road |
Water from this process, including water from underground operations, is treated on the surface. Any excess treated water is released into the environment.
Milling
All of Cigar Lake’s ore slurry is being processed at the McClean Lake mill, operated by Orano. Given the McClean Lake mill’s capacity, it is able to:
| • | process up to 18 million pounds U3O8 per year |
| • | process and package all of Cigar Lake’s current mineral reserves |
Licensing annual production capacity
The Cigar Lake mine is licensed to produce up to 18 million pounds (100% basis) per year. Orano’s McClean Lake mill is licensed to produce 24 million pounds annually.
2023 UPDATE
Production
Total packaged production from Cigar Lake in 2023 was 15.1 million pounds U3O8 (8.2 million pounds our share) compared to 18.0 million pounds U3O8 (9.8 million pounds our share) in 2022.
Productivity was impacted as we completed development and commissioning activities in the first quarter and achieved first production from a new mining area. We had expected to recover from these delays in the second half of the year. However, in the third quarter, we determined maintenance work was required on one of the underground circuits, which had not been planned. The additional time required to complete this work did not allow for the delayed production volumes to be recovered prior to year-end.
During the year, we:
| • | executed planned 21-day annual maintenance activities in September |
| • | executed production activities from four production tunnels in the eastern part of the orebody and one, for the first time, from the western part of the orebody |
78 CAMECO CORPORATION
| • | in alignment with our long-term production planning, brought two new panels online |
| • | continued underground header construction activities and expanded our ground freezing program to ensure continued frozen ore inventory |
| • | completed our freeze hole drilling program in the second quarter |
Underground development
Underground mine development continued in 2023. We completed our second production crosscut in the western portion of the orebody in preparation for ore mining starting in the second quarter of 2024.
PLANNING FOR THE FUTURE
Production
In 2024, we expect to produce 18 million pounds (100% basis) at Cigar Lake; our share is approximately 9.8 million pounds.
In 2024, we plan to:
| • | continue production activities focused on bringing one new production panel online |
| • | complete construction and commissioning of freeze distribution infrastructure expansion in support of future production |
| • | continue underground mine development on two new production tunnels as well as expand ventilation and access drifts in alignment with the long-term mine plan |
| • | commission the surface backfill batch plant to support ongoing operations |
| • | execute an underground geotechnical drilling program |
CIGAR LAKE EXTENSION
Completion of a prefeasibility study of the indicated resources contained in the Cigar Lake extension orebody (referred to as Phase 2 in the technical report filed in 2016), demonstrated the economic feasibility of extracting those resources, allowing us to convert 73.4 million pounds (100% basis) (40 million pounds our share), to probable reserves and extending the estimated mine life to 2036. Based on our analyses, we expect our share of the up-front capital cost to complete the mine development and other capacity replacement projects necessary to access these reserves to be between $250 million and $300 million. We expect the average life of mine unit cash operating costs for Cigar Lake production to increase to between $19 per pound and $20 per pound (previously $18.13 per pound) and our share of annual production to be between 9.5 million pounds and 10.0 million pounds.
A new NI 43-101 technical report for Cigar Lake is in the process of being finalized and is expected to be filed under Cameco’s profile on SEDAR+ within 45 days of this release. More detailed descriptions of the scientific and technical information on which the mineral reserves and mine plan are based will be included in the relevant sections of the technical report. Once filed, the new technical report will supersede and replace the current technical report titled “Cigar Lake Operation, Northern Saskatchewan, Canada” dated March 29, 2016, with an effective date of December 31, 2015. A copy is available on SEDAR+ (www.sedarplus.com), on EDGAR (www.sec.gov/edgar.shtml), and on Cameco’s website (www.cameco.com/media/media-library).
MANAGING OUR RISKS
The Cigar Lake deposit presents unique challenges that are not typical of traditional hard or soft rock mines. These challenges are the result of mining in or near high-pressure ground water in challenging ground conditions with significant radiation concerns due to the high-grade uranium and elements of concern in the orebody with respect to water quality. We take significant steps and precautions to reduce the risks. Mine designs and the mining method are selected based on their ability to mitigate hydrological, radiological, and geotechnical risks. Operational experience gained since the start of production has resulted in a significant reduction in risk. However, there is no guarantee that our efforts to mitigate risk will be successful.
In addition to the risks listed on pages 70 to 71, in 2023 we are focused on the management of the following risks:
Inflation, labour shortages, and supply chain challenges
Inflation, the availability of personnel with the necessary skills and experience, and the impact of supply chain challenges on the availability of materials and reagents carry with them the risk of not achieving our production plans, production delays and increased costs in 2024 and future years.
MANAGEMENT’S DISCUSSION AND ANALYSIS 79
Transition to new mining areas
In order to successfully achieve the planned production schedule, we must continue to successfully transition into new mining areas, which includes mine development and investment in critical support infrastructure, and deployment of the jet boring method in new areas. If development or infrastructure construction work is delayed for any reason, including availability of storage capacity for waste rock, or if the performance of our jet boring method is materially different than previously mined areas, our ability to meet our future production plans may be impacted.
Water inflow risk
The sandstone that overlays the Cigar Lake deposit and basement rocks is water-bearing with significant pressure at mining depths. This high-pressure water source is isolated from active development and production areas in order to reduce the inherent risk of an inflow. Cigar Lake relies on ground freezing and sufficient pumping, water treatment and above ground storage capacity to mitigate the risks of the high-pressure ground water.
Cigar Lake has not experienced a significant disruption resulting from a water inflow since 2008. The consequences of another water inflow at Cigar Lake would depend on its magnitude, location and timing, but could include a significant interruption or reduction in production, a material increase in costs or a loss of mineral reserves.
80 CAMECO CORPORATION
Uranium – Tier-one operations
Inkai
 | 2023 Production (100% basis) | |
| 8.3M lbs | ||
| 2024 Production Outlook (100% basis) | ||
| See Planning for the future – Production on page 83 | ||
| Estimated Reserves (our share) | ||
| 104.7M lbs | ||
| Estimated Mine Life | ||
| 2045 (based on licence term) |
Inkai is a very significant uranium deposit, located in Kazakhstan. The operator is JV Inkai limited liability partnership, which we jointly own (40%)1 with Kazatomprom (KAP) (60%).
Inkai is considered a material uranium property for us. There is a technical report dated January 25, 2018 (effective January 1, 2018) that can be downloaded from SEDAR+ (www.sedarplus.com) or from EDGAR (sec.gov).
| Location | South Kazakhstan | |
| Ownership | 40%1 | |
| Mine type | In situ recovery (ISR) | |
| End product | Uranium concentrate | |
| Certifications | BSI OHSAS 18001 | |
| ISO 14001 certified | ||
| Estimated reserves | 104.7 million pounds (proven and probable), average grade U3O8: 0.04% | |
| Estimated resources | 35.6 million pounds (measured and indicated), average grade U3O8: 0.03% | |
| 9.6 million pounds (inferred), average grade U3O8: 0.03% | ||
| Licensed capacity (wellfields) | 10.4 million pounds per year (our share 4.2 million pounds per year)1 | |
| Licence term | Through July 2045 | |
| Total packaged production: 2009 to 2023 | 89.3 million pounds (100% basis) | |
| 2023 production | 8.3 million pounds (100% basis)1 | |
| 2024 production outlook | See Planning for the future – Production on page 831 | |
| Estimated decommissioning cost (100% basis) | $20 million (US) (100% basis) (this estimate is currently under review) | |
All values shown, including reserves and resources, represent our share only, unless indicated.
| 1 | Our ownership interest in the joint venture is 40% and we equity account for our investment. As such, our share of production is shown as a purchase. |
MANAGEMENT’S DISCUSSION AND ANALYSIS 81
BACKGROUND
Mine description
The Inkai uranium deposit is a roll-front type orebody within permeable sandstones. The more porous and permeable units host several stacked and relatively continuous, sinuous “roll-fronts” of low-grade uranium forming a regional system. Superimposed over this regional system are several uranium projects and active mines.
Inkai’s mineralization ranges in depths from about 260 metres to 530 metres. The deposit has a surface projection of about 40 kilometres in length, and the width ranges from 40 to 1600 metres. The deposit has hydrogeological and mineralization conditions favourable for use of in situ recovery (ISR) technology.
Mining and milling method
JV Inkai uses conventional, well-established, and very efficient ISR technology, developed after extensive test work and operational experience. The process involves five major steps:
| • | leach the uranium in situ by circulating an acid-based solution through the host formation |
| • | recover it from solution with ion exchange resin (takes place at both main and satellite processing plants) |
| • | precipitate the uranium with hydrogen peroxide |
| • | thicken, dewater, and dry it |
| • | package the uranium peroxide product in drums |
Production
Through our investment in Inkai, production continued to be impacted by the 20% supply reduction enacted by KAP across all uranium mines in Kazakhstan and the continued supply chain challenges it has faced. KAP has the ability to flex production 20% above or below planned production levels (8.3 million to 12.5 million pounds per year). Total 2023 production from Inkai was 8.3 million pounds (100% basis), the same as in 2022. In 2023, Inkai experienced a number of operational issues related to interruptions in reagent delivery and wellfield drilling.
The first shipment, containing approximately two thirds of our share of Inkai’s 2023 production, arrived in the fourth quarter. The second shipment with the remainder of our share of 2023 production has arrived at a Canadian port. We continue to work closely with JV Inkai and our joint venture partner, KAP, to receive our share of production via the Trans-Caspian International Transport Route, which does not rely on Russian rail lines or ports.
Production purchase entitlements
Under the terms of a restructuring agreement signed with our partner KAP in 2016, our ownership interest in JV Inkai is 40% and KAP’s share is 60%. However, during production ramp-up to the licensed limit of 10.4 million pounds, we are entitled to purchase 57.5% of the first 5.2 million pounds of annual production, and as annual production increases over 5.2 million pounds, we are entitled to purchase 22.5% of such incremental production, to the maximum annual share of 4.2 million pounds. Once the ramp-up to 10.4 million pounds annually is complete, we will be entitled to purchase 40% of such annual production, matching our ownership interest.
Based on an adjustment to the production purchase entitlement under the 2016 JV Inkai restructuring agreement, for 2023 we were entitled to purchase 4.2 million pounds, or 50% of JV Inkai’s planned 2023 production of 8.3 million pounds. Timing of our JV Inkai purchases will fluctuate during the quarters and may not match production, and, in particular, in 2023, timing was impacted by shipping delays. Total purchases in 2023 were 4.2 million pounds, of which 2.8 million pounds were related to our 2023 entitlement.
Cash distribution
Excess cash, net of working capital requirements, will be distributed to the partners as dividends. In 2023, we received a cash dividend from JV Inkai of $79 million (US), net of withholdings. Our share of dividends follows our production purchase entitlements as described above.
82 CAMECO CORPORATION
JV INKAI NON-IFRS MEASURE
EBITDA is a supplemental measure which is used by us and other users to assess results of operations for JV Inkai from a management perspective without regard to its capital structure. We believe that this measure is useful to management, lenders, investors, security analysts and other interested parties in assessing the underlying performance of JV Inkai’s ongoing operations and its ability to generate cash flows to fund its cash requirements. See Non-IFRS Measures starting on page 41.
| CAMECO SHARE | ||||||||||||
($ MILLIONS) | 2023 | 2022 | CHANGE | |||||||||
Share of earnings from equity-investee | 179 | 94 | 90 | % | ||||||||
Depreciation and amortization | 14 | 10 | 40 | % | ||||||||
Finance costs | — | 1 | (100 | )% | ||||||||
Income tax expense (recovery) | 42 | 30 | 40 | % | ||||||||
|
|
|
|
|
| |||||||
EBITDA | 235 | 135 | 74 | % | ||||||||
|
|
|
|
|
| |||||||
PLANNING FOR THE FUTURE
Production
Based on KAP’s announcement on February 1, 2024, production in Kazakhstan is expected to remain 20% below the level stipulated in subsoil use agreements, similar to in 2023, primarily due to the sulfuric acid shortage in the country. We are still in discussions with JV Inkai and KAP to determine how this may impact production at Inkai in 2024 and thereafter and therefore our corresponding purchase obligation.
Our share of production is purchased at a discount to the spot price and included at this value in inventory. In addition, JV Inkai capital is not included in our outlook for capital expenditures.
MANAGING OUR RISKS
In addition to the risks listed on pages 70 to 71, JV Inkai also manages the following risks:
Production forecast
Presently, JV Inkai is experiencing procurement and supply chain issues, most notably, related to the availability of sulfuric acid. It is also experiencing challenges related to construction delays and inflationary pressures on its production costs. Production plans for 2024 and subsequent years are uncertain and being reassessed. A significant disruption to JV Inkai’s previous production plans for 2024 and subsequent years could result in penalties and further escalation of production costs. In addition, JV Inkai’s costs could be impacted by potential changes to the tax code in Kazakhstan and by possible increased financial contributions to social and other state causes, although these risks cannot be quantified or estimated at this time.
Depending on production levels at Inkai and the outcome of our discussions related thereto with JV Inkai and KAP, our share of production and earnings from this equity-accounted investee and the amount and timing of our dividends from the joint venture may be impacted.
Transportation
The geopolitical situation continues to cause transportation risks in the region. We could continue to experience delays in our expected Inkai deliveries from 2023 and for 2024. To mitigate this risk, we have inventory, long-term purchase agreements and loan arrangements in place we can draw on. Depending on when we receive shipments of our share of Inkai’s production, our share of earnings from this equity-accounted investee and the timing of the receipt of our share of dividends from the joint venture may be impacted.
MANAGEMENT’S DISCUSSION AND ANALYSIS 83
Political
Kazakhstan declared itself independent in 1991 after the dissolution of the Soviet Union. Our investment in JV Inkai is subject to the greater risks associated with doing business in developing countries, which have significant potential for social, economic, political, legal and fiscal instability. Kazakhstan laws and regulations are complex and still developing and their application can be difficult to predict. The other owner of JV Inkai is Kazatomprom, an entity majority owned by the government of Kazakhstan. We have entered into agreements with JV Inkai and Kazatomprom intended to mitigate political risk. This risk includes the imposition of governmental laws or policies that could restrict or hinder JV Inkai paying us dividends, or selling us our share of JV Inkai production, or that impose discriminatory taxes or currency controls on these transactions. The restructuring of JV Inkai, which took effect January 1, 2018, was undertaken with the objective to better align the interests of Cameco and Kazatomprom and includes a governance framework that provides for protection for us as a minority owner of JV Inkai.
For more details on this risk, please see our most recent annual information form under the heading political risks.
JV Inkai manages risks listed on pages 70 to 71.
84 CAMECO CORPORATION
Uranium – Tier-two operations
Rabbit Lake
Located in Saskatchewan, Canada, our 100% owned Rabbit Lake operation opened in 1975, and has the second largest uranium mill in the world. Due to market conditions, we suspended production at Rabbit Lake during the second quarter of 2016.
| Location | Saskatchewan, Canada | |
| Ownership | 100% | |
| End product | Uranium concentrates | |
| ISO certification | ISO 14001 certified | |
| Mine type | Underground | |
| Estimated reserves | — | |
| Estimated resources | 38.6 million pounds (indicated), average grade U3O8: 0.95% | |
| 33.7 million pounds (inferred), average grade U3O8: 0.62% | ||
| Mining methods | Vertical blasthole stoping | |
| Licensed capacity | Mill: maximum 16.9 million pounds per year; currently 11 million | |
| Licence term | Through October 2038 | |
| Total production: 1975 to 2023 | 202.2 million pounds | |
| 2023 production | 0 million pounds | |
| 2024 production outlook | 0 million pounds | |
| Estimated decommissioning cost | $213 million | |
OPERATING STATUS
The site remained in a safe state of care and maintenance throughout 2023.
While in standby, we continue to evaluate our options in order to minimize care and maintenance costs. We expect care and maintenance costs to range between $28 million and $32 million annually.
Licensing
In October 2023, the CNSC granted a 15-year renewal of the operating licence for Rabbit Lake, extending the licence term to October 2038.
FUTURE PRODUCTION
We do not expect any production from Rabbit Lake in 2024.
MANAGING OUR RISKS
We manage the risks listed on pages 70 to 71.
MANAGEMENT’S DISCUSSION AND ANALYSIS 85
US ISR Operations
Located in Nebraska and Wyoming in the US, the Crow Butte and Smith Ranch-Highland (including the North Butte satellite) operations began production in 1991 and 1975, respectively. Each operation has its own processing facility. Due to market conditions, we curtailed production and deferred all wellfield development at these operations during the second quarter of 2016.
| Ownership | 100% | |||
| End product | Uranium concentrates | |||
| ISO certification | ISO 14001 certified | |||
| Estimated reserves | Smith Ranch-Highland: | — | ||
| North Butte-Brown Ranch: | — | |||
| Crow Butte: | — | |||
| Estimated resources | Smith Ranch-Highland: | 24.9 million pounds (measured and indicated), average grade U3O8: 0.06% | ||
| 7.7 million pounds (inferred), average grade U3O8: 0.05% | ||||
| North Butte-Brown Ranch: | 9.4 million pounds (measured and indicated), average grade U3O8: 0.07% | |||
| 0.4 million pounds (inferred), average grade U3O8: 0.06% | ||||
| Crow Butte: | 13.9 million pounds (measured and indicated), average grade U3O8: 0.25% | |||
| 1.8 million pounds (inferred), average grade U3O8: 0.16% | ||||
| Mining methods | In situ recovery (ISR) | |||
| Licensed capacity | Smith Ranch-Highland:1 | Wellfields: 3 million pounds per year; processing plants: 5.5 million pounds per year | ||
| Crow Butte: | Processing plants and wellfields: 2 million pounds per year | |||
| Licence term | Smith Ranch-Highland: | Through September, 2028 | ||
| Crow Butte: | Through October, 2024 | |||
| Total production: 2002 to 2023 | 33.0 million pounds | |||
| 2023 production | 0 million pounds | |||
| 2024 production outlook | 0 million pounds | |||
| Estimated decommissioning cost | Smith Ranch-Highland: $239 million (US), including North Butte | |||
| Crow Butte: $62 million (US) | ||||
| 1 | Including Highland mill |
PRODUCTION CURTAILMENT
As a result of our 2016 decision, commercial production at the US operations ceased in 2018. We expect ongoing cash and non-cash care and maintenance costs to range between $12.5 million (US) and $14.5 million (US) for 2024.
FUTURE PRODUCTION
We do not expect any production in 2024.
MANAGING OUR RISKS
The current operating licence for Crow Butte expires in October 2024. Efforts are underway for re-licensing with the Nuclear Regulatory Commission.
We also manage the risks listed on pages 70 to 71.
86 CAMECO CORPORATION
Uranium – advanced projects
Our advanced projects are part of our project pipeline and these resources are supportive of growth beyond our existing suite of tier-one and tier-two assets. We plan to advance them at a pace aligned with market opportunities.
Millennium
| Location | Saskatchewan, Canada | |
| Ownership | 69.9% | |
| End product | Uranium concentrates | |
| Potential mine type | Underground | |
Estimated resources (our share) | 53.0 million pounds (indicated), average grade U3O8: 2.39%
20.2 million pounds (inferred), average grade U3O8: 3.19% | |
BACKGROUND
The Millennium deposit was discovered in 2000 and was delineated through geophysical surveys and surface drilling work between 2000 and 2013.
Yeelirrie
| Location | Western Australia | |
| Ownership | 100% | |
| End product | Uranium concentrates | |
| Potential mine type | Open pit | |
| Estimated resources | 128.1 million pounds (measured and indicated), average grade U3O8: 0.15% | |
BACKGROUND
The deposit was discovered in 1972 and is a near-surface calcrete-style deposit that is amenable to open pit mining techniques. It is one of Australia’s largest undeveloped uranium deposits.
Kintyre
| Location | Western Australia | |
| Ownership | 100% | |
| End product | Uranium concentrates | |
| Potential mine type | Open pit | |
Estimated resources | 53.5 million pounds (indicated), average grade U3O8: 0.62%
6.0 million pounds (inferred), average grade U3O8: 0.53% | |
BACKGROUND
The Kintyre deposit was discovered in 1985 and is amenable to open pit mining techniques.
2023 PROJECT UPDATES
We believe that we have some of the best undeveloped uranium projects in the world. However, our primary focus is on producing from our tier-one uranium assets at a pace aligned with our contract portfolio and market opportunities.
PLANNING FOR THE FUTURE
2024 Planned activity
No work is planned at Millennium, Yeelirrie or Kintyre in 2024.
MANAGEMENT’S DISCUSSION AND ANALYSIS 87
MANAGING THE RISKS
Project approval
The approval received for Kintyre from the prior state government required substantial commencement of the project by March 2020, being within five years of the grant of the approval, and this was not achieved. The current government declined to grant us an extension to achieve it. In the future, we can apply for an extension of time to achieve substantial commencement of the project. If granted by a future government we could commence the Kintyre project, provided we have all other required regulatory approvals.
The approval for the Yeelirrie project, received from the prior state government, required substantial commencement of the project by January 2022, and this was not achieved. The current government declined to grant us an extension to achieve it. In the future, we can again apply for an extension of time to achieve substantial commencement of the project. If granted by a future government we could commence the Yeelirrie project, provided we have all other required regulatory approvals. Approval for the Yeelirrie project at the federal level was granted in 2019 and extends until 2043.
For all of our advanced projects, we manage the risks listed on pages 70 to 71.
88 CAMECO CORPORATION
Uranium – exploration
Our exploration program is focused on replacing mineral reserves as they are depleted by our production, which is key to sustaining our business, meeting our commitments, and ensuring long-term growth. Our global exploration activity is adjusted annually in line with market signals and at a pace aligned with Cameco’s mining plans and sourcing needs. In recent years, we have increased exploration spending in response to the significant, positive momentum in the nuclear fuel market that has provided a clear signal that more uranium production will be required in the next decade, setting the stage for a renewed exploration cycle.
Our position as one of the world’s largest uranium producers and our continued growth across the nuclear fuel cycle has been driven by decades of experience and our history of exploration, discovery and mining success. Our land position totals 740,000 hectares (1.8 million acres) that cover exploration and development prospects in Canada, Australia, Kazakhstan and the US that are among the best in the world. In northern Saskatchewan alone, we have direct interests in 650,000 hectares (1.6 million acres) that cover many of the most prospective areas of the prolific Athabasca Basin.
In northern Saskatchewan, our well-established infrastructure includes fully licensed and fully permitted uranium mills and mines in the eastern Athabasca basin, along with a supporting network of roads, airstrips and electricity supply. That infrastructure provides us with an advantage that not only underpins the potential development of our advanced exploration projects, but also supports our ongoing work to both delineate existing prospects and deposits, and to identify future undiscovered uranium potential of the region. Additionally, our decades of work to establish a positive corporate reputation by prioritizing our relationships with northern Saskatchewan Indigenous communities, confirms our long-term commitment to continually engage and provide ongoing benefits to the people that call the region home.
The uranium endowment of the Athabasca Basin, where we are involved in 39 projects (including partner-operated joint ventures), is well known and combined with the basin’s unique geological history, it creates a remarkable mining jurisdiction hosting the highest uranium grades and some of the largest uranium deposits in the world. On our projects, we have identified numerous uranium occurrences, prospects, and undeveloped deposits of variable grades and sizes that have progressed through multiple stages of evaluation. Depending on the potential deposit size, ore and ground quality, evolving mining technologies and the uranium market environment, some of these prospects are expected to become viable, economic deposits in a uranium market and price environment that supports new primary production and provides an adequate risk-adjusted return.
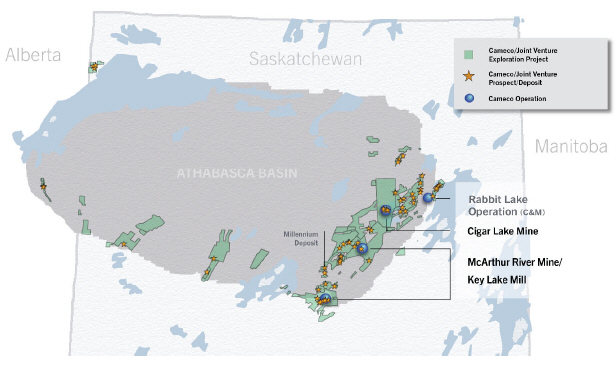
MANAGEMENT’S DISCUSSION AND ANALYSIS 89
The combination of our large land position and proven expertise in discovering and developing world class uranium mines provides the foundation for future mill-supported exploration projects, ranging from early to advanced stages of greenfield exploration and for brownfield opportunities to extend the lives of our existing operations.
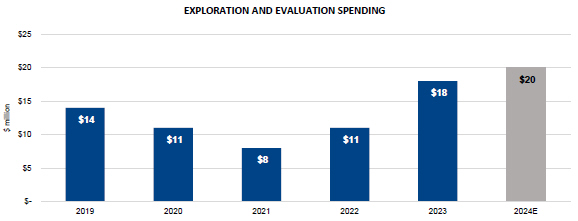
2023 UPDATE
Brownfield and advanced exploration
Brownfield and advanced exploration activities include exploration near our existing operations and expenses for maintaining advanced projects and delineation drilling where uranium mineralization is being defined. In 2023, we spent about $4.5 million in Saskatchewan, $1 million in Australia and $1 million in the US on brownfields and advanced exploration projects. The spending in Saskatchewan was primarily focused on advancing the extension of the mine life at Cigar Lake and advanced exploration on the Dawn Lake project.
The Dawn Lake project is located approximately 45 km northwest of the Rabbit Lake operation, on the La Rocque Lake corridor which hosts several historic discoveries and deposits. In 2023, exploration drilling at Dawn Lake expanded the footprint of known uranium mineralization with mineralized intercepts in excess of 60% U3O8 over several metres. Although the deposit remains at a very early stage of exploration, the high-grade results and geological conditions observed to date are comparable to those of other mines and known deposits in the Athabasca Basin, generating interest and a focused effort to better understand its potential.
Regional exploration
Regional exploration is defined as projects that are considered greenfield. In 2023, we spent about $11 million on regional exploration programs that are comprised of target generation geophysical surveys and diamond drilling primarily in northern Saskatchewan.
PLANNING FOR THE FUTURE
We plan to continue to focus on our core projects in Saskatchewan under our long-term exploration framework. Our leadership position and industry expertise in both exploration and corporate social responsibility makes us a partner of choice and for properties and projects that meet our investment criteria, we may partner with other companies through strategic alliances, equity holdings and traditional joint venture arrangements to optimize our exploration activity and spending.
Brownfields and Advanced Exploration
In 2024, we plan to spend about $7 million on brownfields and advanced Exploration, primarily to expand the footprint of the mineralization identified on in the La Rocque Lake corridor of the Dawn Lake project.
Regional Exploration
We plan to spend about $13 million on diamond drilling and target generation geophysical surveys on our core regional projects in Saskatchewan, in 2024.
90 CAMECO CORPORATION
Fuel services
Refining, conversion and fuel manufacturing
We have about 21% of world UF6 primary conversion capacity and are a supplier of natural UO2. Our focus is on cost-competitiveness and operational efficiency, as well as increasing our production of UF6 in line with our contract portfolio and market opportunities.
Our fuel services segment is strategically important because it helps support the growth of the uranium segment. Offering a range of products and services to customers helps us broaden our business relationships and meet customer needs.
Blind River Refinery
 | Licensed Capacity
24.0M kgU as UO3
Licence renewal in
February 2032 |
Blind River is the world’s largest commercial uranium refinery, refining uranium concentrates from mines around the world into UO3.
| Location | Ontario, Canada | |
| Ownership | 100% | |
| End product | UO3 | |
| ISO certification | ISO 14001 certified | |
| Licensed capacity | 18.0 million kgU as UO3 per year, approved to 24.0 million subject to the completion of certain equipment upgrades (advancement depends on market conditions) | |
| Licence term | Through February 2032 | |
| Estimated decommissioning cost | $58 million | |
MANAGEMENT’S DISCUSSION AND ANALYSIS 91
Port Hope Conversion Services
 | Licensed Capacity
12.5M kgU as UF6
2.8M kgU as UO2
Licence renewal in
February 2027 |
Port Hope is the only uranium conversion facility in Canada and a supplier of UO2 for Canadian-made CANDU heavy-water reactors.
| Location | Ontario, Canada | |
| Ownership | 100% | |
| End product | UF6, UO2 | |
| ISO certification | ISO 14001 certified | |
| Licensed capacity | 12.5 million kgU as UF6 per year | |
| 2.8 million kgU as UO2 per year | ||
| Licence term | Through February 2027 | |
| Estimated decommissioning cost | $129 million | |
Cameco Fuel Manufacturing Inc. (CFM)
 | Licensed Capacity
1.65M kgU as UO2fuel pellets
Licence renewal in
February 2043 |
CFM produces fuel bundles and reactor components for CANDU heavy-water reactors.
| Location | Ontario, Canada | |
| Ownership | 100% | |
| End product | CANDU fuel bundles and components | |
| ISO certification | ISO 9001 certified, ISO 14001 certified | |
| Licensed capacity | 1.65 million kgU as UO2 fuel pellets | |
| Licence term | Through February 2043 | |
| Estimated decommissioning cost | $10.8 million | |
92 CAMECO CORPORATION
2023 UPDATE
Production
Fuel services produced 13.3 million kgU in 2023, 2% higher than 2022.
Port Hope conversion facility cleanup and modernization (Vision in Motion)
Vision in Motion is a unique opportunity that demonstrates our continued commitment to a clean environment. It has been made possible by the opening of a long-term waste management facility by the Government of Canada’s Port Hope Area Initiative project. There is a limited opportunity during the life of this project to engage in clean-up and renewal activities that address legacy waste at the Port Hope Conversion facility inherited from historic operations. Good progress was made over the past year with the removal of old buildings and structures on site, and the project will continue to be active in the year ahead.
PLANNING FOR THE FUTURE
Production
We plan to produce between 13.5 million and 14.5 million kgU in 2024. This includes increasing annual production at our Port Hope UF6 conversion facility to 12,000 tonnes to satisfy our book of long-term business and demand for conversion services.
Licensing
In January 2023, the CNSC granted a 20-year renewal to the licence for CFM. The licence renewal also grants CFM’s request for a slight production increase to 1,650 tonnes as UO2 fuel pellets.
MANAGING OUR RISKS
We take significant steps and precautions to reduce risk. However, there is no guarantee that our efforts to mitigate risk will be successful.
In addition to the risks listed on pages 70 to 71, in 2024 we are focused on the management of the following risk:
Production plans
Inflation, the availability of personnel with the necessary skills and experience, aging infrastructure, and the potential impact of supply chain challenges on the availability of materials and reagents carry the risk of not achieving our production plans, production delays, and increased costs in 2024 and future years.
Labour relations
The collective agreement with unionized employees at our fuel manufacturing operations in Port Hope and Cobourg expires in June 2024. During past negotiations, work has continued under the terms of the expired collective agreement while negotiations to reach a new agreement proceeded. There is a risk to the production plan if we are unable to reach an agreement and there is a labour dispute.
MANAGEMENT’S DISCUSSION AND ANALYSIS 93
Westinghouse Electric Company
Westinghouse is a nuclear reactor technology original equipment manufacturer (OEM) and a leading provider of highly technical aftermarket products and services to commercial nuclear power utilities and government agencies globally. Westinghouse’s history in the energy industry stretches back over a century, during which time the company became a pioneer in nuclear energy.
| • | It is the OEM or a technology provider to about 50% of the global nuclear reactor fleet, delivering capacity of about 190,000 carbon-free MWe. |
| • | It has three fuel fabrication facilities, one in the US, one in Sweden and one in the United Kingdom. |
| • | In addition, it has about 90 facilities, engineering centers, and workshops, with a presence in more than 20 countries. |
The company has strong recurring and predictable revenue and cash flow profiles due to the critical and non-discretionary nature of its products and services to the operation of nuclear power plants around the world.
Like Cameco, Westinghouse enables carbon-free baseload and dispatchable energy that is needed to support the energy transition and we believe is therefore well-positioned for long-term growth.
| Corporate headquarters | Cranberry Township, Pennsylvania (United States) | |
| Ownership | 49% - equity-accounted | |
| Business activities | Operations and maintenance of installed base (core business): Designs and manufactures nuclear fuel supplies and services for light water reactors. Provides outage and maintenance services, engineering support, instrumentation and controls equipment, plant modifications, and components and parts to nuclear reactors. | |
| New build: Designs, develops and procures equipment for new nuclear plants. | ||
| Certifications | ISO 14001 | |
| ISO 45001 | ||
BACKGROUND
On November 7, 2023, we announced the closing of the acquisition of Westinghouse in partnership with Brookfield. Brookfield beneficially owns a 51% interest in Westinghouse, and we beneficially own 49%. Bringing together Cameco’s expertise in the nuclear industry with Brookfield’s expertise in clean energy positions nuclear power at the heart of the energy transition and creates a powerful platform for strategic growth across the nuclear sector.
The total enterprise value at time of close was $7.9 billion (US) and was adjusted for working capital balances at that time, resulting in a final enterprise value of $8.2 billion (US). At time of close, Westinghouse had $3.8 billion (US) in outstanding debt commitments, for which it maintains responsibility, and which reduced the equity cost of the acquisition.
To finance Cameco’s 49% share of the purchase price, equaling $2.1 billion (US), we used $1.5 billion (US) of cash and drew the full amount of both $300 million (US) tranches of the term loan put in place concurrently with the execution of the acquisition agreement, and which mature two years and three years from the date of close. The $280 million (US) bridge commitment that we also secured concurrently with the acquisition agreement was not required to complete the transaction and was terminated.
The acquisition of Westinghouse was completed in the form of a limited partnership with Brookfield. The board of directors governing the limited partnership consists of six directors, three appointed by Cameco and three appointed by Brookfield. Decision-making by the board corresponds to percentage ownership interests in the limited partnership (51% Brookfield and 49% Cameco). However, decisions with respect to certain reserved matters under the partnership agreement, such as the approval of the annual budget, require the presence and support of both Cameco and Brookfield appointees to the board as long as certain ownership thresholds are met.
We believe Westinghouse is well-positioned for long-term growth driven by the expected increase in global demand for nuclear power. As of November 7, 2023, we receive the economic benefit of our ownership in Westinghouse. We account for our proportionate interest in Westinghouse on an equity basis.
94 CAMECO CORPORATION
We expect this strategic acquisition will be transformative and accretive to Cameco. We are enhancing our ability to compete for more business by investing in additional nuclear fuel cycle assets that we expect will augment the core of our business and offer more solutions to our customers across the nuclear fuel cycle. Like Cameco, Westinghouse has nuclear assets that are strategic, proven, licensed and permitted, and that are in geopolitically attractive jurisdictions. We expect these assets, like ours, will participate in the growing demand profile for nuclear energy.
Cash distributions
Annually, we and Brookfield (the partners) approve a budget and business plan which outline Westinghouse’s financial projections and capital allocation priorities. The determination of whether to make cash distributions to the partners will be reviewed quarterly based on the approved budgeted expenditures and capital allocation priorities, including growth investment opportunities, as well as available cash balances. However, the timing of cash distributions is expected to be aligned with the timing of Westinghouse’s cash flows, which are typically higher in the fourth quarter.
Westinghouse debt
As at December 31, 2023, Westinghouse had the following outstanding debt:
| • | $3.5 billion (US) term loan with a maturity of August 2025 |
| • | credit facilities of $400 million (US), which had drawings of $115 million (US) and mature in June 2026 |
| • | drawn financial assurances including letters of credit of $474 million (US) and surety bonds of $262 million (US) |
Effective January 25, 2024, Westinghouse refinanced its existing debt and entered into various credit agreements which now provide total borrowing capacity of $4.6 billion (US), comprised of:
| • | $3.5 billion (US) term loan which now matures on January 25, 2031, and has quarterly repayments of $8.75 million (US), with any remaining amounts due at maturity. The term loan is priced at the applicable term SOFR rate plus a margin that is currently 2.75%. |
| • | credit facilities totaling $500 million (US), which mature in January 2029 |
| • | financial assurances including letters of credit in the amount of about $570 million (US) and surety bonds of $262 million (US) |
The credit agreements are non-recourse to Cameco, but come with certain covenants, which if breached, could result in all amounts outstanding thereunder to be immediately due and payable by Westinghouse. We expect Westinghouse to continue to comply with these covenants in 2024.
WESTINGHOUSE NON-IFRS MEASURES
EBITDA, adjusted EBITDA and adjusted free cash flow and adjusted EBITDA margin are supplemental measures which are used by us and other users, including our lenders and investors, to assess the results of operations for Westinghouse from a management perspective without regard to its capital structure. We believe that these measures are useful to management, lenders and investors in assessing the underlying performance of Westinghouse’s ongoing operations and its ability to generate cash flows to fund its cash requirements. See Non-IFRS measures starting on page 41.
The financial information in the table below is provided to allow comparison to, and is in line with the outlook provided in our November 7, 2023, news release. It is derived from the consolidated financial statements of Westinghouse, which are reported in US dollars and prepared in accordance with US GAAP, and does not reflect Cameco’s ownership share.
MANAGEMENT’S DISCUSSION AND ANALYSIS 95
($US MILLIONS – US GAAP) | 2023 | 2022 | ||||||
Net earnings (loss) | (155 | ) | 440 | |||||
Depreciation and amortization | 348 | 371 | ||||||
Finance income | (11 | ) | (2 | ) | ||||
Finance costs | 296 | 202 | ||||||
Income tax expense (recovery) | 4 | (392 | ) | |||||
|
|
|
| |||||
EBITDA | 482 | 619 | ||||||
Other expenses (income) | 22 | (5 | ) | |||||
(Gain) loss on disposal of fixed assets | 6 | (4 | ) | |||||
Purchase accounting unwind | 40 | — | ||||||
Restructuring and acquisition-related costs | 159 | 92 | ||||||
Gain on disposition of businesses | (14 | ) | — | |||||
|
|
|
| |||||
Adjusted EBITDA | 695 | 702 | ||||||
|
|
|
| |||||
Capital expenditures | 200 | 165 | ||||||
|
|
|
| |||||
Adjusted free cash flow | 495 | 537 | ||||||
|
|
|
| |||||
Revenue | 4,281 | 3,784 | ||||||
|
|
|
| |||||
Adjusted EBITDA margin | 16 | % | 19 | % | ||||
|
|
|
| |||||
FUTURE PROSPECTS
Amid the ongoing demand growth and global energy security concerns, we expect there will be new opportunities for Westinghouse to compete for and win new business. Westinghouse’s reputation as a global leader in the nuclear industry and its position as the only fully European supplier for certified VVER fuel assemblies are expected to benefit its core business as Eastern European countries seek to develop a reliable fuel supply chain independent of Russia.
In addition to growth in its core business, the focus on the importance of nuclear power in providing carbon-free, secure and affordable baseload power as an essential part of the electricity grid in many countries is creating new opportunities for Westinghouse’s proven AP1000 reactor design, as well as the smaller reactor designs it has in development. Its technology and experience provide a competitive advantage as the engineering and procurement aspects of new build programs are initiated.
The following financial outlook is reported in Canadian dollars and prepared in accordance with IFRS and reflects Cameco’s 49% ownership share.
In 2024, we expect our share of Adjusted EBITDA from our equity investment in Westinghouse to be between $445 million and $510 million. Over the next five years, we expect its Adjusted EBITDA will grow at a compound annual growth rate of 6% to 10%. Adjusted EBITDA is a non-IFRS measure (see Non-IFRS Measures starting on page 41).
CAMECO SHARE (49%) ($Cdn MILLIONS - IFRS) | 2024 OUTLOOK | |||
Net earnings (loss) | (170-230 | ) | ||
Depreciation and amortization | 335-385 | |||
Finance income | (2-3 | ) | ||
Finance costs | 140-170 | |||
Income tax expense (recovery) | 10-30 | |||
|
| |||
EBITDA | 320-380 | |||
Adjustments on cost of products and services sold | 55-60 | |||
Adjustments on marketing, administrative and general | 50-65 | |||
|
| |||
Adjusted EBITDA | 445-510 | |||
|
| |||
The outlook for Adjusted EBITDA for 2024 and its growth over the next five years are based on the following assumptions:
| • | An exchange rate of $1.00 (US) for $1.30 (Cdn) |
96 CAMECO CORPORATION
| • | A compound annual growth rate in revenue from its core business of 4% to 6%, which is slightly higher than the anticipated average growth rate of the nuclear industry based on the World Nuclear Association’s Reference Case. In addition to orders for PWR reactor fuel and services, this includes orders for VVER and BWR fuel and services. The outlook assumes that work is fulfilled on the timelines and scope expected based on current orders received, and additional work is undertaken based on past trends. The expected margins on this work are aligned with the historic margins of 16% to 19%, with variability expected to come from product mix compared to in previous years. |
| • | Growth from new AP1000 reactor projects is based on agreements that have been signed and announcements where the AP1000 technology has been selected, including Poland, Bulgaria and Ukraine. It is assumed that work on announced agreements and announced selections to be done by Westinghouse would proceed on the timelines and revenue pattern noted under the New Build Framework. The growth only assumes Westinghouse undertakes the Engineering and Procurement work required prior to a new reactor project breaking ground, which is a small component of the overall potential. A delay in project timelines or cancellation of announced projects would result in a growth rate near the bottom of the range. |
| • | Estimates and assumptions, including development timelines for both announced and potential reactor builds are subject to government and regulatory approval, as well as risks related to the current macro-economic environment, and may differ significantly from those assumed. |
| • | It is also expected that investments in new technologies, including eVinci™ microreactor and AP300™ small modular reactor, will be made in accordance with the current business plan and are expected to contribute to Adjusted EBITDA largely outside the 5-year time frame. |
New Build
New Build framework
Westinghouse undertakes its role in the design, development, engineering and procurement of equipment for new reactors. It does not provide construction services or assume any construction risk. This segment has the potential to add significant long-term value during the construction phase, and then to the core of the business through reactor services and fuel supply contracts once the reactor begins commercial operation.
Following an announcement of a successful bid, there are a number of contracts that must be signed before work commences and revenue is realized. The chart below is an illustrative framework and the assumptions used for the expected timing of revenue flows and profitability as these large, one-time decisions by utilities to construct new nuclear power plants using Westinghouse’s proven AP1000 reactor design are made.
Assumptions and estimates:
| • | Cost to construct new AP1000 reactor in the US based on an MIT (Massachusetts Institute of Technology) study: $6 billion to $8 billion (US), although it can vary significantly depending on in-country labour and construction productivity rates. There is a measured and noticeable scale effect where multiple reactors have been built – for example, in China, where four AP1000 reactors are in operation and six more are under construction, and the US, where two were built and one is in operation. |
| • | Engineering and procurement work: 25% to 40% of total plant cost, depending on the scope of the project – excluding China, where Westinghouse scope is typically less than 10% of the total project cost. |
| • | EBITDA margin for new build activity is expected to be aligned with the overall core business, although it can vary between 10% to 20%. |
MANAGEMENT’S DISCUSSION AND ANALYSIS 97
Illustrative framework of Westinghouse revenue flow for reactor new build project
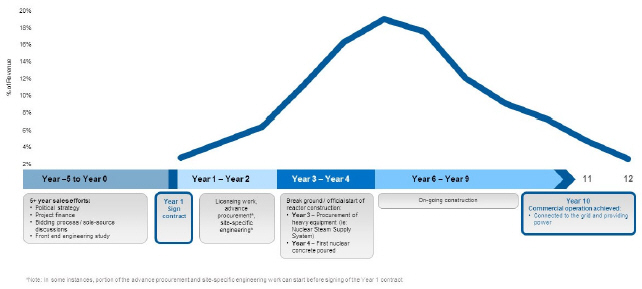
Other growth opportunities
In addition to its AP1000 reactor design, Westinghouse has submitted its pre-application Regulatory Engagement Plan with the US Nuclear Regulatory Commission for the development of its AP300 small modular reactor, which is based on the proven and licensed AP1000 reactor design. Its eVinci microreactor design was recently awarded US Department of Energy funding for a test reactor FEED (front-end engineering design) at Idaho National Lab. The AP300 small modular reactor and the eVinci microreactor are expected to offer the same carbon-free baseload benefits as larger nuclear reactor technologies, but are tailored for specific applications, including industrial, remote mining, off-grid communities, defense facilities and critical infrastructure. As with the AP1000 reactor, they are expected to have applications beyond electricity generation, including district and process heat, desalination and hydrogen production. We are optimistic about the future competitiveness of these technologies and their potential to make a meaningful contribution to Westinghouse’s long-term financial performance. However, they are presently still in the development phase.
Caution about forward-looking information relating to Westinghouse
This discussion of our expectations relating to the future prospects of Westinghouse is subject to the assumptions and risks that are discussed under the heading Caution about forward-looking information beginning on page 2 and may be subject to the risks listed under the heading Managing the risks, starting on page 70, which include:
Assumptions
| • | the market conditions and other factors upon which we have based Westinghouse’s future plans and forecasts |
| • | Westinghouse’s ability to mitigate adverse consequences of delays in production and construction, and the success of its plans and strategies |
| • | the absence of new and adverse government regulations, policies or decisions, and that Westinghouse will comply with nuclear licence and quality assurance requirements at its facilities |
| • | that there will not be any significant adverse consequences to Westinghouse’s business resulting from business disruptions, including those relating to supply disruptions, economic or political uncertainty and volatility, labour relation issues, and operating risks |
Material risks that could cause actual results to differ materially
| • | the risk that Westinghouse may not be able to meet sales commitments for any reason |
| • | the risk that Westinghouse may not achieve the expected growth or success in its business |
| • | the risk to Westinghouse’s business associated with potential production disruptions, including those related to global supply chain disruptions, global economic uncertainty, political volatility, labour relations issues, and operating risks |
| • | the risk that Westinghouse’s strategies may change, be unsuccessful, or have unanticipated consequences |
| • | the risk that Westinghouse may fail to comply with nuclear licence and quality assurance requirements at its facilities |
We also recommend that you review our most recent AIF, which discusses other material risks that could have an impact on Westinghouse’s performance. Actual outcomes may vary significantly.
98 CAMECO CORPORATION
Other Nuclear Fuel Cycle Investments
Global Laser Enrichment
Global Laser Enrichment LLC (GLE) is the exclusive worldwide licensee of the proprietary Separation of Isotopes by Laser EXcitation (SILEX) laser uranium enrichment technology, a third-generation enrichment technology. Cameco is the commercial lead for the GLE project with a 49% interest and we hold an option to attain a majority interest of 75%. Silex Systems Ltd. (Silex Systems) owns the other 51% interest in GLE and is the licensor of the SILEX laser enrichment technology and the technology lead for GLE.
Subject to completion of the technology demonstration program and its progression through to commercialization, GLE has the potential to offer a variety of advantages to the global nuclear energy sector, including:
| • | re-enriching depleted uranium tails leftover as a by-product of first-generation gaseous diffusion enrichment operation, repurposing legacy waste into a commercial source of uranium and conversion products to fuel nuclear reactors and aiding in the responsible clean-up of legacy tails inventories, as per GLE’s agreement with the US Department of Energy (DOE); |
| • | producing commercial low-enriched uranium (LEU) to fuel the world’s existing and future fleet of large-scale light-water reactors (and depending on market developments, SMR’s that also require LEU-based fuel) with greater efficiency and flexibility than current enrichment technologies; and |
| • | producing high-assay low-enriched uranium (HALEU), if a market for that fuel stock develops to serve a number of small modular reactor (SMR) and advanced reactor designs that might be commercially deployed and require HALEU-based fuel. |
Our view is that re-enriching US government inventories of depleted uranium tails into a commercial source of uranium and conversion is GLE’s lowest-risk path to the market. This opportunity is underpinned by an agreement GLE has with the DOE to upgrade depleted uranium tails leftover from DOE’s historic enrichment operations, which may help address the growing supply gap for Western nuclear fuel supplies and services.
With the support of both Cameco and Silex Systems, GLE has accelerated its technology demonstration project activities to target an earlier delivery of the successful demonstration of Technology Readiness Level 6 (TRL-6). TRL-6 achievement will confirm large-scale system performance under relevant conditions (pilot-scale demonstration), which represents a major step up in a technology’s demonstrated readiness. Of note, GLE received the second full-scale laser system module from Silex Systems last year, which was installed in GLE’s pilot demonstration facility in the US. GLE’s efforts to bring forward planned activities and expenditures under the technology demonstration program are intended to demonstrate TRL-6 this year. Earlier TRL-6 demonstration may provide optionality for GLE to pursue government and industry support and funding related to potential commercial deployment opportunities (LEU and, potentially, HALEU) that could precede tails re-enrichment if the right conditions exist.
Unless another commercial deployment opportunity materializes, GLE will continue its work to complete the technology demonstration project with the potential to deploy its enrichment technology at a commercial scale in Western Kentucky under its agreement with the DOE no later than 2030. GLE’s path to commercialization depends on several factors, including but not limited to the successful progression and completion of GLE’s technology demonstration and maturation program, a clear commercial use case, sound market fundamentals, clarity regarding future Russian fuel imports, the ability to secure substantial government support and funding (specifically, accelerated commercial pathways related to LEU and, potentially, HALEU are reliant on government funding) and long-term industry support.
MANAGING OUR RISKS
GLE is subject to the risks relating to the nuclear industry discussed under the heading Caution about forward-looking information beginning on page 2.
MANAGEMENT’S DISCUSSION AND ANALYSIS 99
Mineral reserves and resources
Our mineral reserves and resources are the foundation of our company and fundamental to our success.
We have interests in a number of uranium properties. The tables in this section show the estimates of the proven and probable mineral reserves, and measured, indicated, and inferred mineral resources at those properties. However, only three of the properties listed in those tables are material uranium properties for us: McArthur River/Key Lake, Cigar Lake and Inkai. Mineral reserves and resources are all reported as of December 31, 2023.
We estimate and disclose mineral reserves and resources in five categories, using the definition standards adopted by the Canadian Institute of Mining, Metallurgy and Petroleum Council, and in accordance with National Instrument 43-101 – Standards of Disclosure for Mineral Projects (NI 43-101), developed by the Canadian Securities Administrators. You can find out more about these categories at www.cim.org.
About mineral resources
Mineral resources do not have to demonstrate economic viability but have reasonable prospects for eventual economic extraction. They fall into three categories: measured, indicated and inferred. Our reported mineral resources are exclusive of mineral reserves.
| • | measured and indicated mineral resources can be estimated with sufficient confidence to allow the appropriate application of technical, economic, marketing, legal, environmental, social and governmental factors to support evaluation of the economic viability of the deposit |
| • | measured resources: we can confirm both geological and grade continuity to support detailed mine planning |
| • | indicated resources: we can reasonably assume geological and grade continuity to support mine planning |
| • | inferred mineral resources are estimated using limited geological evidence and sampling information. We do not have enough confidence to evaluate their economic viability in a meaningful way. You should not assume that all or any part of an inferred mineral resource will be upgraded to an indicated or measured mineral resource, but it is reasonably expected that the majority of inferred mineral resources could be upgraded to indicated mineral resources with continued exploration. |
Our share of uranium in the following mineral resource tables is based on our respective ownership interests. Reported mineral resources have not demonstrated economic viability.
About mineral reserves
Mineral reserves are the economically mineable part of measured and/or indicated mineral resources demonstrated by at least a preliminary feasibility study. The reference point at which mineral reserves are defined is the point where the ore is delivered to the processing plant, except for ISR operations where the reference point is where the mineralization occurs under the existing or planned wellfield patterns. Mineral reserves fall into two categories:
| • | proven reserves: the economically mineable part of a measured resource for which at least a preliminary feasibility study demonstrates that, at the time of reporting, economic extraction could be reasonably justified with a high degree of confidence |
| • | probable reserves: the economically mineable part of a measured and/or indicated resource for which at least a preliminary feasibility study demonstrates that, at the time of reporting, economic extraction could be reasonably justified with a degree of confidence lower than that applying to proven reserves |
For properties where we are the operator, we use current geological models, an average uranium price of $54 (US) per pound U3O8, and current or projected operating costs and mine plans to report our mineral reserves, allowing for dilution and mining losses. We apply our standard data verification process for every estimate. For properties in which we have an interest but are not the operator, we will take reasonable steps to ensure that the reserve and resource estimates that we report are reliable.
100 CAMECO CORPORATION
Our share of uranium in the mineral reserves table below is based on our respective ownership interests.
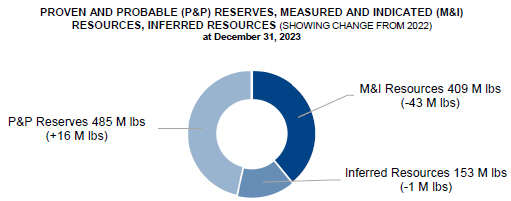
Changes this year
Our share of proven and probable mineral reserves increased from 469 million pounds U3O8 at the end of 2022, to 485 million pounds at the end of 2023. The change was primarily the result of:
| • | mineral resource estimate update at Cigar Lake Extension and subsequent conversion of indicated mineral resources adding 40 million pounds to probable reserves. |
partially offset by:
| • | production at Cigar Lake, Inkai and McArthur River, which removed 22 million pounds of proven and probable reserves from our mineral inventory |
The remaining changes are attributable to other adjustments based on the mineral resource and reserve estimate updates at Cigar Lake, McArthur River and Inkai.
Our share of measured and indicated mineral resources decreased from 451 million pounds U3O8 at the end of 2022, to 409 million pounds at the end of 2023. Our share of inferred mineral resources decreased from 154 million pounds U3O8 to 153 million pounds.
MANAGEMENT’S DISCUSSION AND ANALYSIS 101
Qualified persons
The technical and scientific information discussed in this MD&A for our material properties (McArthur River/Key Lake, Cigar Lake and Inkai) was approved by the following individuals who are qualified persons for the purposes of NI 43-101:
MCARTHUR RIVER/KEY LAKE
| • | Greg Murdock, general manager, McArthur River, Cameco |
| • | Daley McIntyre, general manager, Key Lake, Cameco |
| • | Alain D. Renaud, principal resource geologist, technical services, Cameco |
| • | Biman Bharadwaj, principal metallurgist, technical services, Cameco |
CIGAR LAKE
| • | Lloyd Rowson, general manager, Cigar Lake, Cameco |
| • | Scott Bishop, director, technical services, Cameco |
| • | Alain D. Renaud, principal resource geologist, technical services, Cameco |
| • | Biman Bharadwaj, principal metallurgist, technical services, Cameco |
INKAI
| • | Alain D. Renaud, principal resource geologist, technical services, Cameco |
| • | Scott Bishop, director, technical services, Cameco |
| • | Biman Bharadwaj, principal metallurgist, technical services, Cameco |
| • | Sergey Ivanov, deputy director general, technical services, Cameco Kazakhstan LLP |
Important information about mineral reserve and resource estimates
Although we have carefully prepared and verified the mineral reserve and resource figures in this document, the figures are estimates, based in part on forward-looking information.
Estimates are based on knowledge, mining experience, analysis of drilling results, the quality of available data and management’s best judgment. They are, however, imprecise by nature, may change over time, and include many variables and assumptions, including:
| • | geological interpretation |
| • | extraction plans |
| • | commodity prices and currency exchange rates |
| • | recovery rates |
| • | operating and capital costs |
There is no assurance that the indicated levels of uranium will be produced, and we may have to re-estimate our mineral reserves based on actual production experience. Changes in the price of uranium, production costs or recovery rates could make it unprofitable for us to operate or develop a particular site or sites for a period of time. See page 2 for information about forward-looking information.
Please see our mineral reserves and resources section of our most recent annual information form for the specific assumptions, parameters and methods used for McArthur River, Inkai and Cigar Lake mineral reserve and resource estimates.
Important information for US investors
We present information about mineralization, mineral reserves and resources as required by National Instrument 43-101 – Standards of Disclosure for Mineral Projects of the Canadian Securities Administrators (NI 43-101), in accordance with applicable Canadian securities laws. As a foreign private issuer filing reports with the US Securities and Exchange Commission (SEC) under the Multijurisdictional Disclosure System, we are not required to comply with the SEC’s disclosure requirements relating to mining properties. Investors in the United States should be aware that the disclosure requirements of NI 43-101 are different from those under applicable SEC rules, and the information that we present concerning mineralization, mineral reserves and resources may not be comparable to information made public by companies that comply with the SEC’s reporting and disclosure requirements for mining companies.
102 CAMECO CORPORATION
Mineral reserves
As of December 31, 2023 (100% – only the shaded column shows our share)
PROVEN AND PROBABLE
(tonnes in thousands; pounds in millions)
| OUR | ||||||||||||||||||||||||||||||||||||||||||||||
| SHARE | ||||||||||||||||||||||||||||||||||||||||||||||
| PROVEN | PROBABLE | TOTAL MINERAL RESERVES | RESERVES | |||||||||||||||||||||||||||||||||||||||||||
| MINING | GRADE | CONTENT | GRADE | CONTENT | GRADE | CONTENT | CONTENT | METALLURGICAL | ||||||||||||||||||||||||||||||||||||||
PROPERTY | METHOD | TONNES | % U3O8 | (LBS U3O8) | TONNES | % U3O8 | (LBS U3O8) | TONNES | % U3O8 | (LBS U3O8) | (LBS U3O8) | RECOVERY (%) | ||||||||||||||||||||||||||||||||||
Cigar Lake | UG | 338.1 | 18.11 | 135.0 | 217.5 | 15.36 | 73.7 | 555.6 | 17.03 | 208.6 | 113.8 | 98.7 | ||||||||||||||||||||||||||||||||||
Key Lake | OP | 61.1 | 0.52 | 0.7 | — | — | — | 61.1 | 0.52 | 0.7 | 0.6 | 95.0 | ||||||||||||||||||||||||||||||||||
McArthur River | UG | 2,047.3 | 7.02 | 316.8 | 520.7 | 5.55 | 63.8 | 2,568.0 | 6.72 | 380.5 | 265.6 | 99.0 | ||||||||||||||||||||||||||||||||||
Inkai | ISR | 239,588.4 | 0.04 | 208.8 | 66,046.9 | 0.04 | 52.9 | 305,635.3 | 0.04 | 261.7 | 104.7 | 85.0 | ||||||||||||||||||||||||||||||||||
|
|
|
|
|
|
|
|
|
|
|
|
|
|
|
|
|
|
|
|
|
| |||||||||||||||||||||||||
Total | 242,035.0 | — | 661.2 | 66,785.0 | — | 190.3 | 308,820.1 | — | 851.5 | 484.7 | — | |||||||||||||||||||||||||||||||||||
|
|
|
|
|
|
|
|
|
|
|
|
|
|
|
|
|
|
|
|
|
| |||||||||||||||||||||||||
(UG – underground, OP – open pit, ISR – in situ recovery)
Note that the estimates in the above table:
| • | use a constant dollar average uranium price of approximately $54 (US) per pound U3O8 |
| • | are based on exchange rates of $1.00 US=$1.26 Cdn and $1.00 US=450 Kazakhstan Tenge |
Our estimate of mineral reserves and mineral resources may be positively or negatively affected by the occurrence of one or more of the material risks discussed under the heading Caution about forward-looking information beginning on page 2, as well as certain property-specific risks. See Uranium – Tier-one operations starting on page 73.
Metallurgical recovery
We report mineral reserves as the quantity of contained ore supporting our mining plans and provide an estimate of the metallurgical recovery for each uranium property. The estimate of the amount of valuable product that can be physically recovered by the metallurgical extraction process is obtained by multiplying the quantity of contained metal (content) by the planned metallurgical recovery percentage. The content and our share of uranium in the table above are before accounting for estimated metallurgical recovery.
MANAGEMENT’S DISCUSSION AND ANALYSIS 103
Mineral resources
As of December 31, 2023 (100% – only the shaded columns show our share)
MEASURED, INDICATED AND INFERRED
(tonnes in thousands; pounds in millions)
| OUR SHARE | OUR SHARE | |||||||||||||||||||||||||||||||||||||||||||||||
| MEASURED RESOURCES (M) | INDICATED RESOURCES (I) | INFERRED RESOURCES | ||||||||||||||||||||||||||||||||||||||||||||||
| TOTAL M+I | TOTAL M+I | INFERRED | ||||||||||||||||||||||||||||||||||||||||||||||
| GRADE | CONTENT | GRADE | CONTENT | CONTENT | CONTENT | GRADE | CONTENT | CONTENT | ||||||||||||||||||||||||||||||||||||||||
PROPERTY | TONNES | % U3O8 | (LBS U3O8) | TONNES | % U3O8 | (LBS U3O8) | (LBS U3O8) | (LBS U3O8) | TONNES | % U3O8 | (LBS U3O8) | (LBS U3O8) | ||||||||||||||||||||||||||||||||||||
Cigar Lake | 86.3 | 5.32 | 10.1 | 143.6 | 5.33 | 16.9 | 27.0 | 14.7 | 163.4 | 5.55 | 20.0 | 10.9 | ||||||||||||||||||||||||||||||||||||
Fox Lake | — | — | — | — | — | — | — | — | 386.7 | 7.99 | 68.1 | 53.3 | ||||||||||||||||||||||||||||||||||||
Kintyre | — | — | — | 3,897.7 | 0.62 | 53.5 | 53.5 | 53.5 | 517.1 | 0.53 | 6.0 | 6.0 | ||||||||||||||||||||||||||||||||||||
McArthur River | 78.7 | 2.27 | 3.9 | 60.6 | 2.30 | 3.1 | 7.0 | 4.9 | 37.2 | 2.90 | 2.4 | 1.7 | ||||||||||||||||||||||||||||||||||||
Millennium | — | — | — | 1,442.6 | 2.39 | 75.9 | 75.9 | 53.0 | 412.4 | 3.19 | 29.0 | 20.2 | ||||||||||||||||||||||||||||||||||||
Rabbit Lake | — | — | — | 1,836.5 | 0.95 | 38.6 | 38.6 | 38.6 | 2,460.9 | 0.62 | 33.7 | 33.7 | ||||||||||||||||||||||||||||||||||||
Tamarack | — | — | — | 183.8 | 4.42 | 17.9 | 17.9 | 10.3 | 45.6 | 1.02 | 1.0 | 0.6 | ||||||||||||||||||||||||||||||||||||
Yeelirrie | 27,172.9 | 0.16 | 95.9 | 12,178.3 | 0.12 | 32.2 | 128.1 | 128.1 | — | — | — | — | ||||||||||||||||||||||||||||||||||||
Crow Butte | 1,558.1 | 0.19 | 6.6 | 939.3 | 0.35 | 7.3 | 13.9 | 13.9 | 531.4 | 0.16 | 1.8 | 1.8 | ||||||||||||||||||||||||||||||||||||
Gas Hills - Peach | 687.2 | 0.11 | 1.7 | 3,626.1 | 0.15 | 11.6 | 13.3 | 13.3 | 3,307.5 | 0.08 | 6.0 | 6.0 | ||||||||||||||||||||||||||||||||||||
Inkai | 87,192.7 | 0.03 | 56.1 | 65,236.0 | 0.02 | 32.9 | 89.1 | 35.6 | 36,165.2 | 0.03 | 23.9 | 9.6 | ||||||||||||||||||||||||||||||||||||
North Butte - Brown Ranch | 604.2 | 0.08 | 1.1 | 5,530.3 | 0.07 | 8.4 | 9.4 | 9.4 | 294.5 | 0.06 | 0.4 | 0.4 | ||||||||||||||||||||||||||||||||||||
Ruby Ranch | — | — | — | 2,215.3 | 0.08 | 4.1 | 4.1 | 4.1 | 56.2 | 0.13 | 0.2 | 0.2 | ||||||||||||||||||||||||||||||||||||
Shirley Basin | 89.2 | 0.15 | 0.3 | 1,638.2 | 0.11 | 4.1 | 4.4 | 4.4 | 508.0 | 0.10 | 1.1 | 1.1 | ||||||||||||||||||||||||||||||||||||
Smith Ranch - Highland | 3,703.5 | 0.10 | 7.9 | 14,372.3 | 0.05 | 17.0 | 24.9 | 24.9 | 6,861.0 | 0.05 | 7.7 | 7.7 | ||||||||||||||||||||||||||||||||||||
|
|
|
|
|
|
|
|
|
|
|
|
|
|
|
|
|
|
|
|
|
|
|
| |||||||||||||||||||||||||
Total | 121,172.8 | — | 183.7 | 113,300.7 | — | 323.4 | 507.1 | 408.8 | 51,747.1 | — | 201.3 | 153.2 | ||||||||||||||||||||||||||||||||||||
|
|
|
|
|
|
|
|
|
|
|
|
|
|
|
|
|
|
|
|
|
|
|
| |||||||||||||||||||||||||
Note that mineral resources:
| • | do not include amounts that have been identified as mineral reserves |
| • | do not have demonstrated economic viability |
| • | totals may not add due to rounding |
104 CAMECO CORPORATION
Additional information
Due to the nature of our business, we are required to make estimates that affect the amount of assets and liabilities, revenues and expenses, commitments and contingencies we report. We base our estimates on our experience, our best judgment, guidelines established by the Canadian Institute of Mining, Metallurgy and Petroleum and on assumptions we believe are reasonable.
We believe the following critical accounting estimates reflect the more significant judgments used in the preparation of our financial statements. These estimates affect all of our segments, unless otherwise noted.
Decommissioning and reclamation
In our uranium and fuel services segments, we are required to estimate the cost of decommissioning and reclamation for each operation, but we normally do not incur these costs until an asset is nearing the end of its useful life. Regulatory requirements and decommissioning methods could change during that time, making our actual costs different from our estimates. A significant change in these costs or in our mineral reserves could have a material impact on our net earnings and financial position. See note 16 to the financial statements.
Carrying value of assets
We depreciate property, plant and equipment primarily using the unit-of-production method, where the carrying value is reduced as resources are depleted. A change in our mineral reserves would change our depreciation expenses, and such a change could have a material impact on amounts charged to earnings.
We assess the carrying values of property, plant and equipment, intangibles and investments in associates and joint ventures every year, or more often if necessary. If we determine that we cannot recover the carrying value of an asset, we write off the unrecoverable amount against current earnings. We base our assessment of recoverability on assumptions and judgments we make about future prices, production costs, our requirements for sustaining capital, our ability to economically recover mineral reserves and the impact of geopolitical events. A material change in any of these assumptions could have a significant impact on the potential impairment of these assets.
In performing impairment assessments of long-lived assets, assets that cannot be assessed individually are grouped together into the smallest group of assets that generates cash inflows that are largely independent of the cash inflows from other assets or groups of assets. Management is required to exercise judgment in identifying these cash generating units.
Taxes
When we are preparing our financial statements, we estimate taxes in each jurisdiction we operate in, taking into consideration different tax rates, non-deductible expenses, valuation of deferred tax assets, changes in tax laws and our expectations for future results.
We base our estimates of deferred income taxes on temporary differences between the assets and liabilities we report in our financial statements, and the assets and liabilities determined by the tax laws in the various countries we operate in. We record deferred income taxes in our financial statements based on our estimated future cash flows, which includes estimates of non-deductible expenses, future market conditions, production levels and intercompany sales. If these estimates are not accurate, there could be a material impact on our net earnings and financial position.
Controls and procedures
We have evaluated the effectiveness of our disclosure controls and procedures and internal control over financial reporting as of December 31, 2023, as required by the rules of the US Securities and Exchange Commission and the Canadian Securities Administrators.
MANAGEMENT’S DISCUSSION AND ANALYSIS 105
Management, including our Chief Executive Officer (CEO) and our Chief Financial Officer (CFO), supervised and participated in the evaluation, and concluded that our disclosure controls and procedures are effective to provide a reasonable level of assurance that the information we are required to disclose in reports we file or submit under securities laws is recorded, processed, summarized and reported accurately, and within the time periods specified. It should be noted that, while the CEO and CFO believe that our disclosure controls and procedures provide a reasonable level of assurance that they are effective, they do not expect the disclosure controls and procedures or internal control over financial reporting to be capable of preventing all errors and fraud. A control system, no matter how well conceived or operated, can provide only reasonable, not absolute, assurance that the objectives of the control system are met.
Management, including our CEO and our CFO, is responsible for establishing and maintaining internal control over financial reporting and conducted an evaluation of the effectiveness of our internal control over financial reporting based on the Internal Control — Integrated Framework (2013) issued by the Committee of Sponsoring Organizations of the Treadway Commission (COSO). Based on this evaluation, management concluded that our internal control over financial reporting was effective as of December 31, 2023.
There have been no changes in our internal control over financial reporting during the year that have materially affected, or are reasonably likely to materially affect, our internal control over financial reporting.
New standards adopted
A number of amendments to existing standards became effective January 1, 2023, but they did not have an effect on our financial statements.
A number of amendments to existing standards are not yet effective for the year ended December 31, 2023, and have not been applied in preparing these consolidated financial statements. We do not intend to early adopt any of the amendments and do not expect them to have a material impact on our financial statements.
106 CAMECO CORPORATION