Exhibit 99.1

Inkai Operation
Turkestan Region, Republic of Kazakhstan
National Instrument 43-101
Technical Report
Effective Date: September 30, 2024
Date of Technical Report: November 12, 2024
PREPARED FOR CAMECO CORPORATION BY:
C. SCOTT BISHOP, P.ENG.
SERGEY IVANOV, P.GEO.
ALAIN D. RENAUD, P.GEO.
Table of Contents
1 Summary | 1 | |||
1.1 Operation overview | 1 | |||
1.2 Property tenure | 1 | |||
1.3 Location and existing infrastructure | 2 | |||
1.4 Geology and mineralization | 2 | |||
1.5 Exploration and delineation | 3 | |||
1.6 MPP, Sat1 and Sat2 area development | 4 | |||
1.7 Mineral resources and mineral reserves | 4 | |||
1.8 Mining | 6 | |||
1.9 Processing | 7 | |||
1.10 Environmental assessment and licensing | 7 | |||
1.11 Production plan and mine life | 10 | |||
1.12 Economic analysis and cost estimates | 10 | |||
1.13 Regulatory and production risks | 11 | |||
1.14 Implementation agreement | 12 | |||
1.15 Conclusions and recommendations | 13 | |||
2 Introduction | 14 | |||
2.1 Introduction and purpose | 14 | |||
2.2 Report basis | 14 | |||
3 Reliance on other experts | 15 | |||
4 Property description and location | 16 | |||
4.1 Location | 16 | |||
4.2 Exploration and mining licences | 17 | |||
4.3 Surface tenure | 17 | |||
4.4 Resource use contract | 17 | |||
4.5 Subsoil code | 18 | |||
4.6 Strategic object | 23 | |||
4.7 Royalties | 23 | |||
4.8 Known environmental liabilities | 23 | |||
4.9 Permitting | 23 | |||
4.10 Factors affecting the right to work on the property | 23 | |||
5 Accessibility, climate, local resources, infrastructure and physiography | 25 | |||
5.1 Access | 25 | |||
5.2 Climate | 25 | |||
5.3 Physiography | 25 | |||
i
5.4 Local resources | 26 | |||
5.5 Infrastructure | 26 | |||
6 History | 27 | |||
6.1 Ownership | 27 | |||
6.2 Exploration and development history | 27 | |||
6.3 Historical mineral resource and mineral reserve | 29 | |||
6.4 Historical production | 29 | |||
7 Geological setting and mineralization | 31 | |||
7.1 Regional geology | 31 | |||
7.2 Local and property geology | 33 | |||
7.3 Mineralization | 36 | |||
8 Deposit types | 43 | |||
8.1 Roll-front deposits of the Chu-Sarysu Basin | 43 | |||
9 Exploration | 45 | |||
10 Drilling | 46 | |||
10.1 Uranium exploration and delineation drilling | 46 | |||
10.2 Methodology and guidelines | 46 | |||
10.3 Core recovery | 47 | |||
10.4 Geophysical logging | 47 | |||
10.5 Factors that could materially affect the accuracy of the results | 48 | |||
11 Sample preparation, analyses and security | 50 | |||
11.1 Sampling density | 50 | |||
11.2 Procedure for sampling and sample preparation | 50 | |||
11.3 Assaying | 50 | |||
11.4 Radioactivity, radium and equivalent uranium grades | 51 | |||
11.5 Density sampling | 51 | |||
11.6 Quality assurance/quality control | 51 | |||
11.7 Adequacy of sample preparation, assaying, QA/QC and security | 52 | |||
12 Data verification | 53 | |||
13 Mineral processing and metallurgical testing | 55 | |||
13.1 MPP, Sat1 and Sat2 processing plants | 55 | |||
13.2 Production expansion test work | 55 | |||
13.3 Deleterious elements at Inkai | 56 | |||
14 Mineral resource estimates | 57 | |||
14.1 Definitions | 57 | |||
14.2 Key assumptions, parameters and methods | 57 | |||
14.3 Resource classification | 59 | |||
ii
14.4 Mineral resource estimate and classification | 62 | |||
14.5 Factors that could materially affect the mineral resource estimate | 63 | |||
15 Mineral reserve estimates | 64 | |||
15.1 Definitions | 64 | |||
15.2 Key assumptions, parameters and methods | 64 | |||
15.3 Mineral reserve estimate and classification | 65 | |||
15.4 Factors that could materially affect the mineral reserve estimate | 66 | |||
16 Mining methods | 67 | |||
16.1 Hydrogeology | 67 | |||
16.2 Mining | 71 | |||
16.3 Wellfield production | 74 | |||
16.4 Production schedule | 77 | |||
17 Recovery methods | 80 | |||
17.1 Processing facilities | 80 | |||
17.2 Reagents and energy requirements | 81 | |||
17.3 Overall uranium recovery | 82 | |||
17.4 Expansion project | 83 | |||
18 Project infrastructure | 84 | |||
18.1 Inkai facilities | 84 | |||
18.2 UOC shipping routes | 84 | |||
19 Market studies and contracts | 86 | |||
19.1 Markets | 86 | |||
19.2 Uranium sales contracts | 86 | |||
19.3 Material contracts | 87 | |||
19.4 Uranium price assumptions used for economic analysis | 87 | |||
20 Environmental studies, permitting and social or community impact | 88 | |||
20.1 Environmental considerations | 88 | |||
20.2 Social and community requirements | 92 | |||
21 Capital and operating costs | 94 | |||
21.1 Capital cost estimates | 94 | |||
21.2 Operating cost estimates | 94 | |||
22 Economic analysis | 96 | |||
22.1 Economic analysis | 96 | |||
22.2 Sensitivities | 96 | |||
22.3 Payback | 98 | |||
22.4 Mine life | 98 | |||
22.5 Taxes and royalties | 98 | |||
iii
23 Adjacent properties | 100 | |||
24 Other relevant data and information | 101 | |||
24.1 Implementation agreement | 101 | |||
24.2 Currency control regulations | 102 | |||
24.3 Regulatory risks | 102 | |||
24.4 Production and product delivery risks | 106 | |||
24.5 Caution about forward-looking information | 107 | |||
25 Interpretation and conclusions | 110 | |||
26 Recommendations | 111 | |||
27 References | 112 | |||
28 Date and signature page | 114 | |||
iv
Tables
TABLE 1-1: INKAI MINERALIZED HORIZONS | 3 | |||
TABLE 1-2: EXPLORATION AND DELINEATION DRILLING AT INKAI | 4 | |||
TABLE 1-3: SUMMARY OF MINERAL RESOURCES – AS OF SEPTEMBER 30, 2024 | 5 | |||
TABLE 1-4: SUMMARY OF MINERAL RESERVES – AS OF SEPTEMBER 30, 2024 | 6 | |||
TABLE 3-1: RELIANCE ON OTHER EXPERTS | 15 | |||
TABLE 6-1: HISTORICAL DRILLING | 27 | |||
TABLE 6-2: INKAI URANIUM PRODUCTION | 29 | |||
TABLE 7-1: HORIZONS AND SUB-HORIZONS DIVISION | 36 | |||
TABLE 7-2: EXTENT AND DIMENSIONS BY MINERALIZED HORIZON | 39 | |||
TABLE 10-1: EXPLORATION AND DELINEATION DRILLING AT INKAI | 46 | |||
TABLE 14-1: CUT-OFFS AND ADDITIONAL ESTIMATION PARAMETERS | 59 | |||
TABLE 14-2: INKAI MINERAL RESOURCES – AS OF SEPTEMBER 30, 2024 | 62 | |||
TABLE 15-1: INKAI MINERAL RESERVES – AS OF SEPTEMBER 30, 2024 | 66 | |||
TABLE 16-1: HYDRAULIC CONDUCTIVITY | 69 | |||
TABLE 16-2: LIST OF MINING EQUIPMENT | 74 | |||
TABLE 16-3: RESERVES-BASED JV INKAI PRODUCTION SCHEDULE – 100% BASIS | 79 | |||
TABLE 17-1: INKAI REAGENT CONSUMPTION | 82 | |||
TABLE 19-1: EXPECTED AVERAGE URANIUM PRICES BY YEAR | 87 | |||
TABLE 21-1: CAPITAL COST FORECAST BY YEAR – 100% BASIS | 95 | |||
TABLE 21-2: OPERATING COST FORECAST BY YEAR – 100% BASIS | 95 | |||
TABLE 22-1: ECONOMIC ANALYSIS BY YEAR – 100% BASIS | 97 |
v
Figures
FIGURE 1-1: ANNUAL PRODUCTION PLAN – 100% BASIS | 10 | |||
FIGURE 4-1: LOCATION MAP | 16 | |||
FIGURE 5-1: GENERAL LOCATION MAP | 26 | |||
FIGURE 7-1: GEOLOGICAL MAP OF CHU-SARYSU BASIN AND ITS SURROUNDINGS | 32 | |||
FIGURE 7-2: SCHEMATIC CROSS-SECTION OF THE CHU-SARYSU BASIN – LOOKING WEST | 32 | |||
FIGURE 7-3: SCHEMATIC STRATIGRAPHIC COLUMN FOR THE CHU-SARYSU BASIN | 35 | |||
FIGURE 7-4: INKAI URANIUM ROLL FRONTS | 37 | |||
FIGURE 7-5: ROLL-FRONT MORPHOLOGY OF MINERALIZATION | 41 | |||
FIGURE 7-6: TYPICAL CHARACTERISTICS OF A ROLL-FRONT DEPOSIT | 42 | |||
FIGURE 10-1: DRILL HOLE COLLAR LOCATION MAP | 49 | |||
FIGURE 13-1: PROCESSING PLANTS TOTAL AVERAGE RECOVERY (2015-JUNE 30, 2024) | 55 | |||
FIGURE 14-1: TOTAL INKAI MINERAL RESOURCES BY CIM CATEGORIES | 61 | |||
FIGURE 16-1: IN SITU RECOVERY SCHEMATIC | 72 | |||
FIGURE 16-2: CONFIGURATION OF TYPICAL WELLFIELD PATTERNS USED AT INKAI | 73 | |||
FIGURE 16-3: HISTORICAL YEARLY UBS VOLUMES | 75 | |||
FIGURE 16-4: HISTORICAL YEARLY UBS HEAD GRADES | 75 | |||
FIGURE 16-5: HISTORICAL YEARLY PRODUCTION BY MINING AREA | 76 | |||
FIGURE 16-6. MONTHLY HEAD GRADE VARIABILITY | 76 | |||
FIGURE 16-7: MPP, SAT1 AND SAT2 HISTORICAL RECOVERY CURVES | 77 | |||
FIGURE 16-8: RESERVES-BASED JV INKAI PRODUCTION SCHEDULE – 100% BASIS | 79 | |||
FIGURE 17-1: CURRENT INKAI FLOWSHEET | 82 | |||
FIGURE 17-2: PROPOSED FLOWSHEET BASED ON ANNUAL PRODUCTION OF 10.4 M LBS U3O8 | 83 | |||
FIGURE 18-1: INFRASTRUCTURE GENERAL ARRANGEMENT | 85 | |||
FIGURE 22-1: SENSITIVITY ANALYSIS – 100% BASIS | 96 | |||
FIGURE 23-1: ADJACENT PROPERTIES TO INKAI MA | 100 |
vi
Units of Measure and Abbreviations
| °C | Degree Celsius | |
| $ | Canadian dollar (unless otherwise indicated) | |
| > | Greater than | |
| < | Less than | |
| % | Percent | |
| a | Annum (year) | |
| cm | Centimetre | |
| d | Day | |
| g | Gram | |
| GT | Grade times Thickness | |
| h | Hour | |
| IX | Ion exchange | |
| K | Thousand | |
| km | Kilometre | |
| km2 | Square kilometre | |
| L | Litre | |
| L/sec | Litre per second | |
| Lbs | Pounds | |
| M | Million | |
| MWh | Megawatt per hour | |
| m | Metre | |
| m/a | Metre per annum | |
| m/d | Metre per day | |
| m2 | Square metre | |
| m2/d | Square metre per day | |
| m3 | Cubic metre | |
| m%U3O8 | Metre times percent uranium oxide | |
| mg | Milligram | |
| mm | Millimetre | |
| sec | Second | |
| t | Metric tonne | |
| TDS | Total dissolved solids | |
| U | Uranium (1 tonne U = 2,599.8 Lbs U3O8) | |
| %U | Percent uranium (%U x 1.179 = % U3O8) | |
| U3O8 | Triuranium octoxide | |
| %U3O8 | Percent uranium oxide (%U3O8 x 0.848 = %U) | |
| UBS | Uranium-bearing solution | |
| UF6 | Uranium hexafluoride | |
| UOC | Uranium ore concentrate | |
vii
Definitions and Interpretation
In this technical report the following capitalized words, terms and expressions, and any derivations thereof as the context may require, will have the following meanings:
2009 Tax Code means the Code of the Republic of Kazakhstan dated December 10, 2006 No.99-IV “On Taxes and Other Obligatory Payments to the State Budget”
Amendment No. 6 means Amendment No. 6 to the Resource Use Contract, dated November 30, 2017
Block 1 means the 16.58 km2 area of land in the Suzak District of the Republic of Kazakhstan, which is designated as Block 1 in Licence Series AY 1370D
Block 2 means the 230 km2 area of land in the Suzak District of the Republic of Kazakhstan, which is designated as Block 2 in Licence Series AY 1371D
Block 3 means the 240 km2 area of land in the Suzak District of the Republic of Kazakhstan, which is designated as Block 3 in Licence Series AY 1371D
BTP means biological treatment plant
Cameco means Cameco Corporation
CIM means Canadian Institute of Mining, Metallurgy and Petroleum
CIM Definition Standards means CIM Definition Standards for Mineral Resources and Mineral Reserves
Competent Authority means the appropriate state agency designated under the Subsoil Law as the competent authority; currently, the Ministry of Energy of the Republic of Kazakhstan is the Competent Authority for uranium resources
C1 means C1 category of mineral resources as defined by the GKZ classification system
C2 means C2 category of mineral resources as defined by the GKZ classification system
Geology Committee means the Geology Committee of the Republic of Kazakhstan
GKZ means State Reserve Commission of USSR which developed the GKZ classification system for mineral resources
Implementation Agreement means the agreement between Cameco, Kazatomprom and JV Inkai dated May 27, 2016, to restructure and enhance JV Inkai, as supplemented or amended from time to time
Inkai means collectively the mine operated by JV Inkai and the MA Area or, as the context requires, the uranium deposit
IRR means internal rate of return
ISL means in situ leaching, a mining process now referred to as ISR
ISR means in situ recovery, a mining process described in Section 1.10
JV Inkai means Joint Venture Inkai Limited Liability Partnership, a limited liability partnership registered under the laws of the Republic of Kazakhstan. JV Inkai is currently owned by Cameco (40%) and Kazatomprom (60%)
KATEP means National Joint Stock Company Atomic Power Engineering and Industry “KATEP”
Kazatomprom or KAP means Joint Stock Company “National Atomic Company “Kazatomprom”
KAZRC Code means the code developed in June 2016 by the Kazakhstan Association for Public Reporting of Exploration Results, Mineral Resource and Mineral Reserves (KAZRC) following the Committee for Mineral Reserves International Reporting Standards (CRIRSCO) template
Licences means Licence Series AY 1370D, which allowed for the mining of uranium on Block 1, and
viii
Licence Series AY 1371, which allowed for the exploration and further mining of uranium on Blocks 2 and 3
LOM Plan means the life of mine plan for Inkai
MA Area means the 139 km2 area in which JV Inkai currently has the right to mine, as covered by the Mining Allotment, which includes the historical Block 1 and portions of Blocks 2 and 3; now referred to as MPP Area, Sat1 Area and Sat2 Area, respectively
Mining Allotment means the document issued by the Geology Committee to JV Inkai in July 2017, which is a part of the Resource Use Contract, as provided for in Amendment No. 6, and which graphically and descriptively defines the area in which JV Inkai has the right to mine
MPP means JV Inkai’s main processing plant that is located in the MPP Area
MPP Area means the portion of Block 1 that is included in the MA Area
NI 43-101 means National Instrument 43-101 – Standards of Disclosure for Mineral Projects
NPV means net present value
Project for Uranium Deposit Development (abbreviated PUDD) means the stipulated by Subsoil Code project documentation that contains the mining plan including mining methods, technical indicators as well as production volumes, timeframes and other parameters for uranium deposit development
Qualified person as defined in NI 43-101
Ramp-up means the increase in production at Inkai from its current rate of production to 10.4 million pounds U3O8 as detailed in the Implementation Agreement and the various supplemental agreements thereto
Redox means the oxidation-reduction reaction
Resource Use Contract (abbreviated RUC) means the resource use contract between the Republic of Kazakhstan and JV Inkai that was signed in July 2000 and that provides for JV Inkai’s mining rights, as amended by Amendment Nos. 1-6. The Resource Use Contract includes the Mining Allotment
Sat1 means JV Inkai’s Satellite Plant 1 processing facility that is located in the Sat1 Area
Sat1 Area means the portion of Block 2 that is included in the MA Area
Sat2 means JV Inkai’s Satellite Plant 2 processing facility that is located in the Sat2 Area
Sat2 Area means the portion of Block 3 that is included in the MA Area
SRC means the State Reserve Commission of Kazakhstan
Subsoil Code means the Subsoil Code No. 125-VI, signed by the President of the Republic of Kazakhstan on December 27, 2017, effective as of January 08, 2018, as amended, and as further described in Section 4.5
Subsoil Law means the Law of the Republic of Kazakhstan “On Subsoil and Subsoil Use”, dated June 24, 2010, as amended
Tax Code means the Code of the Republic of Kazakhstan dated December 2017 No.120-VI “On Taxes and Other Obligatory Payments to the State Budget”
TEO stands (from the Russian abbreviation) for “Technical and Economic Substantiation”. The TEO of Permanent Conditions is prepared according to the results of completed exploration work. Its purpose is to establish the scale and commercial value of a deposit, to define the economic value of its development, and to aid decision-making on financial investments in mining development of the deposit. All financial estimates on the accepted option for commercial development of the deposit are carried out within the framework of realistically assumed values of all the modifying factors.
Volkovgeology means Volkovgeology Joint Stock Company
Water Code means Water Code of the Republic of Kazakhstan dated July 9, 2003 No. 481-II, as amended
ix
| 1 | Summary |
Preamble
This technical report replaces the previous Inkai Operation technical report, filed in January of 2018 (2018 Technical Report). This report is based on new technical and scientific information, and reflects experience gained since 2018.
Following the Implementation Agreement and Amendment 6 to the Resource Use Contract (RUC), a portion of the areas historically referred to as Blocks 1, 2 and 3 were relinquished by Inkai and subsequently acquired by Kazatomprom (KAP). Areas within the revised mining allotment (MA) area aligning with the historical blocks are now respectively referred to as the MPP, Sat1 and Sat2 Areas.
Key highlights of this report based on JV Inkai’s share (100%) of Inkai mineral reserves include:
| • | Increase in average price used in the economic analysis to $87.50 (US) per pound U3O8 from $54.40 (US) |
| • | increase in estimated after tax net present value (NPV) at a 12% discount rate of $4.3 billion (Cdn), from $2.2 billion (Cdn) |
| • | decrease in estimated after-tax internal rate of return (IRR) of 26.9%, using the total capital invested, along with the operating and capital cost estimates, from 27.1% |
| • | increase in estimated average cash operating costs per pound to $12.66, from $9.55 |
| • | total estimated Inkai capital to bring the remaining mineral reserves into production is approximately $1.5 billion, an increase of 106% when compared to the 2018 Technical Report’s 2024 to mid-2045 time frame. The change is mostly related to wellfield development activities with increased drilling tariffs and higher costs for sulphuric acid and other materials. |
| • | expected total packaged production of 212.3 million pounds U3O8, based on mineral reserves from 2024 through the projected mine life extending to mid-2045 |
| • | process expansion of the Inkai circuit to support the Ramp-up to 10.4 million pounds U3O8 per year is in progress. The expansion project includes an upgrade to the yellowcake filtration and packaging units, the addition of a pre-dryer, calciner and automatic packaging. It is planned to be completed in 2026. |
Inkai is a material property for Cameco under Canadian securities laws.
This technical report has been prepared for Cameco by internal qualified persons in support of the disclosure of scientific and technical information relating to Inkai.
| 1.1 | Operation overview |
Inkai is an ISR producing mine in the Central Asian Republic of Kazakhstan, made up of a single parcel of land. The parcel of land set out in the Mining Allotment, the MA Area, covers 139 km2 and includes the original Block 1 and portions of the original Blocks 2 and 3. Inkai is owned and operated by JV Inkai, an entity which is owned by Cameco (40%) and Kazatomprom (60%).
Inkai’s total packaged production from 2009 to September 30, 2024, not including the Sat2 Area test mining, is 95.7 million pounds of U3O8 (Cameco’s share - 52.1 million).
| 1.2 | Property tenure |
The RUC grants JV Inkai the rights to explore for and to extract uranium from the subsoil contained in the MA Area. JV Inkai owns uranium extracted from this subsoil and has the right to use the surface of the MA Area. JV Inkai has obligations under the RUC which it must comply with in order to maintain these rights.
2024 INKAI OPERATION TECHNICAL REPORT 1
In addition to complying with its obligations under the RUC, JV Inkai, like all subsoil users, is required to abide by the work program appended to its RUC, which relates to its mining operations.
Under Kazakhstan law, subsoil and mineral resources belong to the state. Currently, the state provides access to the subsoil and mineral resources under a resource use contract. Minerals extracted from the subsoil by a subsoil user under a RUC are the property of the subsoil user unless the Subsoil Code or a RUC provides otherwise.
A RUC gives JV Inkai a right to use the surface of the property while exploring, mining and reclaiming the land. However, this right must be set forth in a land lease agreement with the applicable local administrative authorities.
On a regular basis, JV Inkai obtains from local authorities the necessary land lease agreements for new buildings and infrastructure. JV Inkai does not hold land leases for the entire MA Area. JV Inkai obtains land leases gradually only for surface area required for exploration, mining or construction of new infrastructure.
| 1.3 | Location and existing infrastructure |
Inkai is located in the Suzak District of the Turkestan region, Kazakhstan, near the town of Taikonur. The territory of the district is about 41,000 km2 and its population is over 60,000. It is approximately 350 km northwest of the city of Shymkent and approximately 155 km east of the city of Kyzylorda. Inkai is accessible by paved road from Shymkent (440 km), from Turkistan (310 km) and from Kyzylorda (290 km). JV Inkai’s corporate office is located in Shymkent.
There are three processing facilities at Inkai: the MPP, Sat1 and Sat2. The existing MPP, Sat1 and Sat2 circuit capacities were estimated using Inkai monthly process summaries. The MPP has demonstrated an IX capacity of 2.7 million pounds U3O8 per year and a product drying and packaging capacity of 8.3 million pounds U3O8 per year. Sat1 has a demonstrated IX capacity of 6.3 million pounds U3O8 per year as eluate. The current demonstrated IX capacity of Sat2 is 4.5 million pounds U3O8 as eluate.
The following infrastructure currently exists on the MA Area: administrative, engineering and construction offices, a laboratory, shops, garages, holding ponds and reagent storage tanks, enclosures for low-level radioactive waste and domestic waste, an emergency response building, food services facilities, roads and power lines, wellfield pipelines and header houses. At Taikonur, JV Inkai has an employee residence camp with catering and leisure facilities.
| 1.4 | Geology and mineralization |
The geology of south-central Kazakhstan is composed of a large relatively flat basin of Cretaceous to Quaternary age continental clastic sedimentary rocks. The Chu-Sarysu Basin extends for more than 1,000 km from the foothills of the Tien Shan Mountains located on south and southeast sides of the basin, and merges into the flats of the Aral Sea depression to the northwest. The basin is up to 250 km wide, bordered by the Karatau Mountains on the southwest and the Kazakh Uplands on the northeast. The basin is composed of gently-dipping to nearly flat-lying fluvial-derived unconsolidated sediments composed of inter-bedded sand, silt and local clay horizons.
The Cretaceous and Paleogene sediments contain several stacked and relatively continuous, sinuous roll-fronts or redox fronts hosted in the more porous and permeable sand and silt units. Several uranium deposits and active ISR uranium mines are located at these regional oxidation roll-fronts, developed along a regional system of superimposed mineralization fronts. The overall stratigraphic horizon of interest in the basin is approximately 200 to 250 m in vertical section.
The Inkai deposit is a roll-front deposit hosted within the Middle and Lower Inkuduk and the Upper and Lower Mynkuduk horizons which are comprised of fine, medium and coarse-grain sands, gravels and clays. The redox boundary can be readily recognized in core by a distinct colour
2024 INKAI OPERATION TECHNICAL REPORT 2
change from grey and greenish-grey on the reduced side to light-grey with yellowish stains on the oxidized side, stemming from the oxidation of pyrite to limonite and consumption of organic carbon.
Hydrogeological parameters of the deposit play a key role in ISR mining which have been demonstrated at Inkai through various studies, pilot leaching tests, and mining results since start of commercial production in 2009.
The extent and dimensions of Inkai’s mineralized horizons are shown in Table 1-1.
Table 1-1: Inkai Mineralized Horizons
Horizon | Strike Length (km) | Width (m) | Average Width (m) | Depth (m) | Average Depth (m) | |||||||||||||||
Middle Inkuduk | 35 | 40-1,600 | 350 | 262-380 | 314 | |||||||||||||||
Lower Inkuduk | 40 | 40-600 | 250 | 317-447 | 382 | |||||||||||||||
Upper and Lower Mynkuduk | 40 | 40-350 | 200 | 350-528 | 390 | |||||||||||||||
The main uranium minerals are sooty pitchblende (85%) and coffinite (15%). The pitchblende occurs as micron-sized globules and spherical aggregates, while the coffinite forms microscopic crystals. Both uranium minerals occur in pores on interstitial materials such as clay minerals, as films around and in cracks within sand grains, and as pseudomorphic replacements of rare organic matter commonly associated with pyrite.
| 1.5 | Exploration and delineation |
Historical exploration work at Inkai, including drilling, began in the 1970s and progressed until 1996. Since 2006, additional exploration and delineation drilling has been conducted by JV Inkai.
JV Inkai’s uranium exploration and delineation drilling programs in the MPP, Sat1 and Sat2 Areas were conducted by drilling vertical holes from surface. Delineation of the areas and their geological and geophysical features were carried out by drilling on a grid at a prescribed density of 3.2 to 1.6-kilometre line spacing and 200 to 50-metre hole spacing with coring. Additional information was obtained by further drilling at grids of 800 to 400 x 200 to 50 metres with coring and 200 to 100 x 50 to 25 metre grids, usually without core being recovered.
Vertical holes are drilled with a triangular drill bit for use in unconsolidated formations down to the target horizon, at which point the rest of the hole is cored. At the Inkai deposit, approximately 50% of all exploration holes are cored through the entire mineralized interval. Sampling, radiometric probing, hole deviation, geophysical and hole diameter surveys are done by site crews and experienced contractors. This information is used to inform the geological modelling, the estimation of uranium distribution and content and to characterize the hydrogeological and metallurgical characteristics.
As the mineralized horizons are generally horizontal and the drill holes are nearly vertical, the intercepts approximate the true thickness of the mineralization.
The total number of holes drilled at Inkai is presented in Table 1-2. The locations of the drillholes are shown in Figure 10-1.
2024 INKAI OPERATION TECHNICAL REPORT 3
Table 1-2: Exploration and Delineation Drilling at Inkai
| Type | Number of holes | |||
Historical exploration – delineation (non-JV Inkai) 1976-1996 | 3,017 | |||
Block 3 delineation 2006-2016 | 1,003 | |||
Block 2 delineation 2016-2019 | 1,207 | |||
Pre-production drilling 2013-September 30, 2024 | 922 | |||
|
| |||
Total | 6,149 | |||
|
| |||
| 1.6 | MPP, Sat1 and Sat2 area development |
A pilot leach test, using the ISR mining method, was started in the northeast area of the MPP Area in December 1988 and completed in 1990. This was followed by a 2005 decision to construct the MPP to process uranium-bearing solution (UBS). Construction was completed in 2009 and processing of UBS was initiated. In February 2010, regulatory approval was received allowing full processing of uranium concentrate at the plant.
A pilot leach test in the Sat1 Area was conducted between 2002 and 2006. This was followed by the decision to construct and start commissioning the Sat1 processing plant to process UBS in 2009. In 2011, JV Inkai received regulatory approval for processing at Sat1. Infill drilling program in Sat1 Area begins in 2018 and is completed in 2019.
In the Sat2 Area, drilling at test wellfields and construction of the Sat2 processing plant was initiated in 2012. In 2015, construction of the Sat2 facility was completed, regulatory approval obtained and the pilot leach test was initiated. The pilot leach test was completed in 2017. Commercial production started in 2018. Sat2 expansion also commenced in 2018, including the increase in pump station capacity, two additional IX sorption columns, and required piping. Sat2 expansion was completed in in 2021.
| 1.7 | Mineral resources and mineral reserves |
The estimated mineral resources and reserves at Inkai are located in the MA Area. The preparation of the resource models and estimates followed SRC guidelines. The models and estimates for the MPP Area were completed by Volkovgeology, while Two Key LLP (2K) completed the models and estimates for the Sat1 and Sat2 Areas. Volkovgeology is a subsidiary of Kazatomprom and is involved in prospecting, exploration and development of uranium deposits in Kazakhstan. Two Key LLP is an engineering consultancy firm based in Almaty, Kazakhstan, providing services in mineral resource estimation, mine planning and engineering. The estimates were done using the GT area average estimation method where the estimated variable is the uranium grade multiplied by the thickness of the interval, and using averages for the blocks.
In 2003, Cameco performed a validation of the Kazakhstan estimate for the MPP Area which was also validated by an independent consulting firm in 2005.
Following additional infill delineation drilling, an estimate for the Sat2 Area was completed in 2017, followed by an estimate update in the Sat1 Area in 2020.
The current mineral resources and reserves estimates are based on 3,800 surface drillholes.
2024 INKAI OPERATION TECHNICAL REPORT 4
Summaries of the estimated mineral resources and mineral reserves for Inkai, with an effective date of September 30, 2024, are shown in Table 1-3 and Table 1-4. Cameco’s share of uranium in the mineral resources and mineral reserves is based on its ownership interest in JV Inkai (40%).
Table 1-3: Summary of Mineral Resources – as of September 30, 2024
Category | Total tonnes (x 1,000) | Grade % U3O8 | Total M Lbs U3O8 | Cameco’s share M Lbs U3O8 | ||||||||||||
Measured | 75,923.1 | 0.03 | 58.2 | 23.3 | ||||||||||||
Indicated | 63,488.4 | 0.02 | 34.5 | 13.8 | ||||||||||||
|
|
|
|
|
|
|
| |||||||||
Total Measured & Indicated | 139,411.5 | 0.03 | 92.7 | 37.1 | ||||||||||||
Inferred | 33,742.2 | 0.03 | 22.3 | 8.9 | ||||||||||||
Notes: | (1) | Cameco reports mineral reserves and mineral resources separately. Reported mineral resources do not include amounts identified as mineral reserves. Totals may not add up due to rounding. |
| (2) | Mineral resources that are not mineral reserves do not have demonstrated economic viability and/or are outside the term of the current RUC ending in mid-2045. |
| (3) | Cameco’s share is 40% of total mineral resources. |
| (4) | Inferred mineral resources are estimated using limited geological evidence and sampling information. We do not have enough confidence to evaluate their economic viability in a meaningful way. You should not assume that all or any part of an inferred mineral resource will be upgraded to an indicated or measured mineral resource, but it is reasonably expected that the majority of inferred mineral resources could be upgraded to indicated mineral resources with continued exploration. |
| (5) | Reasonable expectation for eventual economic extraction of the mineral resources is based on a uranium price of $62 (US) per pound U3O8, anticipated exchange rates, mining and process recoveries, production costs, royalties and mineralized area tonnage, grade, and spatial continuity considerations. |
| (6) | Mineral resources have been estimated at minimum grade-thickness cut-offs per hole of 0.047 m%U3O8 for the MPP Area and 0.071 m%U3O8 for the Sat1 and Sat2 Areas, with the GT area average method using 2-dimensional block models. |
| (7) | The geological model used for Inkai involves geological interpretations on section and plan derived from surface drillhole information. |
| (8) | Mineral resources have been estimated with no allowance for mining recovery but include some allowances for dilutive material expected under leaching conditions. |
| (9) | Mineral resources were estimated based on the use of the ISR extraction method. |
| (10) | Other than the risk associated with failing to extend the term of the RUC beyond mid-2045, there are no known environmental, permitting, legal, title, taxation, socio-economic, political, marketing or other relevant factors that could materially affect the above estimate of mineral resources. |
2024 INKAI OPERATION TECHNICAL REPORT 5
Table 1-4: Summary of Mineral Reserves – as of September 30, 2024
Category | Total tonnes (x 1,000) | Grade % U3O8 | Total M Lbs U3O8 | Cameco’s share M Lbs U3O8 | ||||||||||||
Proven | 277,232.9 | 0.03 | 203.6 | 81.4 | ||||||||||||
Probable | 90,850.8 | 0.03 | 50.0 | 20.0 | ||||||||||||
|
|
|
|
|
|
|
| |||||||||
Total Reserves | 368,083.7 | 0.03 | 253.6 | 101.5 | ||||||||||||
|
|
|
|
|
|
|
| |||||||||
Notes: | (1) | Cameco reports mineral reserves and mineral resources separately. Totals may not add up due to rounding. |
| (2) | Total pounds U3O8 are those contained in mineral reserves and are not adjusted for the estimated metallurgical recovery of 85%. |
| (3) | Cameco’s share is 40% of total mineral reserves. |
| (4) | Mineral reserves have been estimated at a grade-thickness cut-off of 0.13 m%U3O8using the GT area average method on a block basis. |
| (5) | Mineral reserves have been estimated based on the use of the ISR extraction method. |
| (6) | Mineral reserves have been estimated with an average allowance of 40% dilution at 0% U3O8,representing the rock volume contacted by the lixiviant. |
| (7) | Mineral reserves were estimated based on existing or planned wellfield patterns required to achieve production varying between 7.7 to 10.4 million pounds U3O8 per year within the term of the RUC. |
| (8) | An average uranium price of $54 (US) per pound U3O8 with exchange rates of $1.00 US=$1.26 Cdn and $1.00 US=450 Kazakhstan Tenge was used to estimate the mineral reserves. |
| (9) | Other than the risks described in Section 15.4, there are no known mining, metallurgical, infrastructure, permitting or other relevant factors that could materially affect the above estimate of mineral reserves. |
| 1.8 | Mining |
Mining at Inkai is based upon a conventional and well-established ISR process. ISR mining of uranium is defined by the International Atomic Energy Agency as “the extraction of ore from a host sandstone by chemical solutions (lixiviants) and the recovery of uranium at the surface. ISL (ISR) extraction is conducted by injecting a suitable leach solution into the ore zone below the water table; oxidizing, complexing and mobilizing the uranium; recovering the pregnant (loaded) solutions through production wells (extraction wells or recovery wells); and finally, pumping the uranium bearing solution to the surface for further processing”.
ISR mining at Inkai uses sulphuric acid based lixiviant. The mining process comprises the following components to produce UBS, which goes to the settling ponds and then to the respective IX plant before being directed to the MPP for production of uranium as yellowcake:
| • | Determination of the GT cut-off for the initial design and the operating period. The design cut-off sets the minimum amount of uranium per pattern required to justify wellfield installation before funds are committed, and the operating head grade in UBS cut-off for individual producer wells dictates the lower limit once a well has entered production. |
| • | Preparation of a production sequence which will deliver the UBS to meet production requirements considering the rate of wellfield uranium recovery, UBS uranium head grades, and wellfield flow rates. |
| • | Wellfield development using an optimal pattern design to distribute barren lixiviant to the |
2024 INKAI OPERATION TECHNICAL REPORT 6
wellfield injectors, and to collect UBS back to the MPP, Sat1, or Sat2, as the case may be. |
The above factors are used to estimate the number of operating wellfields, wellfield patterns and header houses over the production life. They also determine the unit cost of each of the mining components required to realize the production schedule, including drilling, wellfield installation and wellfield operation.
Significant experience since the start of commercial production in 2009 supports the current production plan. Currently, all wellfields utilize hexagonal or line-drive patterns and the UBS is captured on IX resins at their respective processing facilities.
The annual production target of 10.4 million pounds U3O8 requires a combined flow of approximately 5,680 m3/h and an average head grade of approximately 100 parts per million of uranium delivered to the IX columns. Flow capacity within production wells generally vary between 8.0 and 10.5 m3/h on average requiring approximately 550 patterns in operation to achieve the needed flow to the IX circuits.
In recent years, production from higher cost wellfields in the MPP Area have been reduced, largely due to sulphuric acid supply challenges. Production from each of the three areas is planned to increase as these challenges are resolved and Inkai can bring on additional wellfields.
The production plan, based on mineral reserves, forecasts an estimated 212.3 million pounds of packaged production until mid-2045 and is based on Cameco’s assumptions for production from JV Inkai.
| 1.9 | Processing |
As a result of extensive test work and operational experience, a very efficient process of uranium recovery has been established. The process consists of the following major steps:
| • | uranium in situ leaching with a sulphuric acid-based lixiviant |
| • | uranium adsorption from UBS with IX resin |
| • | elution of uranium from resin with ammonium nitrate |
| • | precipitation of uranium as yellowcake with hydrogen peroxide and anhydrous ammonia |
| • | yellowcake thickening, dewatering, and drying |
| • | packaging of dry yellowcake product in containers |
All plants load and elute uranium from resin while the resulting eluate is converted to yellowcake at the MPP. Inkai is designed to produce a dry uranium product that meets the quality specifications of uranium refining and conversion facilities.
Construction work for a process expansion of the Inkai circuit to at least 10.4 million pounds U3O8 per year is in progress. The expansion project includes an upgrade to the yellowcake filtration and packaging units and the addition of a pre-dryer and calciner.
| 1.10 | Environmental assessment and licensing |
Legislation
The Ecological Code, adopted in 2021, is the principal legislation dealing with the protection of the environment. Although it does not specifically refer to uranium, there are general provisions regulating production waste which apply to uranium. More specific provisions are provided in other applicable Kazakhstan regulations and state standards.
The Ecological Code firmly established the “polluter pays” principle pursuant to which the person whose actions or activities cause environmental damage must remediate the components of the environment that were damaged in full and at its own expense. Administrative or criminal liability for
2024 INKAI OPERATION TECHNICAL REPORT 7
environmental damage does not release such person from civil liability for such remediation of the environment.
Environmental studies
The baseline conditions and potential environmental impacts of the commercial mining facility were assessed based on Republic of Kazakhstan and western U.S. standards. The baseline fieldwork was performed in 2001 – 2002. The EIA reports describe the biological, hydrogeological, hydrologic and other physical environmental baseline prior to exploration and the commencement of production operations and assess the potential impacts to environmental media and the human environment from the proposed operations. The environmental studies completed to date have not identified any potential impacts to human health or the environment that could not be mitigated through permit conditions or reclamation bond commitments.
A groundwater flow and plume modelling study was conducted to review hydrogeological data and simulate contaminant transport. The model results showed no risk to local and regional groundwater users from ISR mining of the MPP Area.
A study was conducted to assess natural attenuation of ISR solutions within the MPP Area, based on the pilot-scale uranium in situ leaching conducted between 1988 and 1990. The study concluded that the majority of contamination caused by ISR test mining in the MPP Area will be attenuated by 2044.
Environmental management
The environmental management system at JV Inkai is designed to ensure compliance with regulatory requirements, preventing pollution in accordance with ISR operation best practice, and continual improvement of performance. The environmental management system and the occupational health and safety management systems have been certified to ISO 14001 and OHSAS 18001 (now ISO 45001). In 2018, the JV Inkai quality management system was certified to ISO 9001. This integrated management system (ISO:14001/45001/9001) is re-certified every three years.
As an industrial company, JV Inkai is required to undertake programs to reduce, control or eliminate various types of pollution and to protect natural resources. The RUC specifically requires the implementation of environmental controls based on an industrial environmental control program developed by JV Inkai and approved by the environmental protection authorities. JV Inkai must also actively monitor specific air emission levels, ambient air quality, nearby surface water quality, groundwater quality, levels of soil contaminants and the creation of solid waste. JV Inkai must submit annual reports on pollution levels to Kazakhstan’s environmental, tax and statistics authorities which conduct tests to validate JV Inkai’s results.
JV Inkai may be subject to administrative penalties for waste exceedances and intends to mitigate against any potential waste exceedances through the construction of additional biological treatment plants (BTP) at MPP, Sat1 and Sat2. The BTP at MPP is anticipated to be completed by the end of 2024.
Permitting and insurance
In addition to the requirements of the RUC, Inkai, as a nuclear facility, is also required to hold certain permits and licences to operate the mine. With regard to environmental protection requirements, JV Inkai has applied for and received:
| • | a permit for environmental emissions and discharges for the operation valid until December 31, 2026 |
| • | water use permits with various expiry dates |
JV Inkai currently holds the following additional material licences relating to its mining activities, and has applied for prolongation of licences expiring in 2024:
2024 INKAI OPERATION TECHNICAL REPORT 8
| • | “Licence for radioactive substances handling” valid until December 31, 2024, which will be replaced by “Licence for nuclear materials handling” |
| • | “Licence for operation of mining and chemical productions” with an indefinite term |
| • | “Licence for transportation of radioactive substances within the territory of the Republic of Kazakhstan” valid until December 30, 2024 |
| • | “Licence for radioactive waste handling” valid until December 30, 2024 |
| • | “Licence for ionizing radiation equipment handling” with an indefinite term |
In accordance with applicable legislation regulating the use of radioactive substances, JV Inkai is required to submit annual reports to relevant state authorities. Renewal of environmental permits requires the submission of an annual report on pollution levels to Kazakhstan’s environmental authorities, compliance with the permits’ provisions and the remittance of any environmental payment obligations.
Legal entities carrying out environmentally hazardous activities are required to obtain insurance to cover activities which may cause harm to third parties, in addition to the civil liability insurance which must be held by owners of facilities. JV Inkai currently maintains both the required environmental insurance and the civil liability insurance.
Decommissioning and restoration
JV Inkai’s decommissioning obligations are largely defined by the Resource Use Contract and the Subsoil Code dated 27 December 2017 (Subsoil Code). JV Inkai is required to maintain a fund, which is capped at $500,000 (US), as security for meeting its decommissioning obligations; it is fully funded.
JV Inkai developed a preliminary decommissioning estimate reflecting current total decommissioning costs under a “decommission now” scenario and updates the plan every year. The preliminary decommissioning estimate prepared as of the end 2023 was $33.6 million (US).
Under the Subsoil Code, the decommissioning cost estimate for the RUC timeframe must be included in the Project for Uranium Deposit Development (PUDD). Inkai retained the services of a local engineering firm licensed to prepare the PUDD. The PUDD preparation, including the decommissioning cost estimate, is currently in progress. Once completed, the PUDD undergoes regulatory review and approval. The annual decommissioning fund contributions under the Subsoil Code are determined by pro-rating the total decommissioning cost in the PUDD against the annual production volume within the RUC timeframe and must be reflected in a corresponding amendment to RUC. Any required amendments to the RUC are then required to be prepared and signed by the Competent Authority and JV Inkai to become a part of the RUC. The decommissioning estimate contained in the PUDD is subject to review and update every three years. Updates account for changes in the volume of work based on the deposit’s development as well as any decommissioning activities carried out in the previous three-year time period. The decommissioning costs in the PUDD are subject to review and approval by the government.
Under the RUC, JV Inkai must submit a project for decommissioning the property to the government six months before mining activities are complete.
The Subsoil Code now requires subsoil users to provide a new type of security for their decommissioning obligations which is pledge of a bank deposit. The transitional provisions of the Subsoil Code preserve the decommissioning fund mechanism applicable to the Resource Use Contract and accordingly, JV Inkai continues to rely upon its existing decommissioning fund mechanism.
Social and community requirements
2024 INKAI OPERATION TECHNICAL REPORT 9
Under the RUC, JV Inkai is required to finance the training and development of Kazakhstan personnel. The RUC imposes local content requirements on JV Inkai with respect to employees, goods, works and services. See Section 4.5.7 and Section 20.2 for more information.
| 1.11 | Production plan and mine life |
The production plan is based on Cameco’s assumptions for production from JV Inkai. At the time of writing of this Technical Report, discussions are ongoing between Cameco and Kazatomprom regarding plans for recovering production shortfalls to the Ramp-up schedule in the Implementation Agreement (See Section 24.1 for additional information). Apart from 2024, Cameco expects that any changes made to this production schedule will conform to the +/- 20% variance limit to the production plan in the RUC.
The LOM Plan is partially based on inferred mineral resources. Annual production levels will be dependent on results of further delineation drilling and market conditions. There is no certainty that the LOM Plan production will be realized. With continued delineation drilling and wellfield development, Cameco expects that the majority of the inferred mineral resources within the LOM Plan production will be upgraded to indicated and/or measured mineral resources.
The reserves-based production profile and economic analysis supporting the reported mineral reserves do not include the inferred resources. The production plan is based on mineral reserves and forecasts an estimated 212.3 million pounds U3O8 of packaged production from 2024 through the projected mine life extending to mid-2045.
Figure 1-1 presents the reserves-based production plan and the LOM Plan over the mine life (2024 to mid-2045).
Figure 1-1: Annual Production Plan - 100% basis

Note: 2024 production comprises 5.5 million pounds of actual production from January 1 through September 30, 2024, plus a forecast of 2.2 million pounds for the remainder of 2024. The 2025 production forecast is contingent upon receipt of sufficient volumes of sulphuric acid.
| 1.12 | Economic analysis and cost estimates |
The economic analysis for JV Inkai is partially based upon Cameco’s assumption regarding the production plan, which contemplates mining and processing Inkai’s mineral reserves to mid-2045. The financial projections do not contain any estimates involving the potential mining and processing of inferred mineral resources. Only mineral reserves have demonstrated economic viability.
2024 INKAI OPERATION TECHNICAL REPORT 10
The economic analysis, undertaken from the perspective of JV Inkai, is based on JV Inkai’s share (100%) of Inkai mineral reserves, and results in an after tax NPV (at a discount rate of 12%), for the net cash flows from January 1, 2024 to mid-2045, of $4.3 billion. Using the total capital invested, along with the operating and capital cost estimates for the remainder of mineral reserves, the after-tax IRR is estimated to be 26.9%.
Payback for JV Inkai, including all actual costs was achieved in 2015, on an undiscounted, after-tax basis. All future capital expenditures are forecast to be covered by operating cash flow.
Capital costs for Inkai are estimated to be $1.476 billion over the remaining life of the current mineral reserves. The remaining capital costs, as of January 1, 2024, includes $1.196 billion for wellfield development, $95 million for construction and expansion, and $186 million for sustaining capital. The cost estimates are on a 100% basis with a currency exchange rate assumption of 365 Kazakhstan Tenge to $1.00 Cdn. All cost projections are stated in constant 2024 Canadian dollars and assume the throughput from the production schedule for the current mineral reserves outlined on Figure 1-1.
For the period from 2024 to mid-2045, capital cost estimates have increased by 106% compared to the 2018 Technical Report. The majority of the increase relates to wellfield development activities with increased drilling tariffs and higher costs for sulphuric acid and other materials.
Capital for construction and expansion is heavily weighted to 2024 to 2027 due to the capital required for the Ramp-up and expansion projects, as well as upgrades planned for existing facilities.
Operating expenditures for ISR mining, surface processing, site administration and corporate overhead are estimated to be $12.66 per pound of U3O8 over the remaining life of the mineral reserves. The 2018 Technical Report showed estimated operating costs to be $9.55 per pound U3O8. Major contributors to the increased operating costs are adjustments to remuneration programs, higher cost for production materials and electricity, increased transportation costs, and other inflationary factors.
| 1.13 | Regulatory and production risks |
Regulatory risks
Although the Republic of Kazakhstan has well-developed legislation, many provisions are subject to discretion in their application, interpretation and enforcement. Consequently, JV Inkai’s operations may be affected by government regulations restricting production, price controls, export controls, currency controls, taxes and royalties, expropriation of property, environmental, mining and safety legislation, and annual fees to maintain mineral properties in good standing. There is no assurance that the laws in Kazakhstan protecting foreign investments will not be amended or abolished, or that these existing laws will be enforced or interpreted to provide adequate protection against any or all of the risks described above. There is also no assurance that the RUC can be enforced or will provide adequate protection against any or all of the risks described above.
Cameco believes that the regulatory risks related to its JV Inkai investment in Kazakhstan are manageable. See Section 24.3 for more information about regulatory and geopolitical risks.
Risks that may materially impact the mineral reserves are discussed in Section 15.4.
Production risks
In addition to the noted regulatory risks, there are a number of challenges that may, or in some cases are, impacting JV Inkai’s ability to achieve production targets and to deliver finished product to Cameco.
Inkai continues to experience challenges related to procurement of sulphuric acid used in the in situ leaching process. While KAP actively pursues alternative sources of sulphuric acid, its continued
2024 INKAI OPERATION TECHNICAL REPORT 11
shortage in Kazakhstan could have a material adverse effect on JV Inkai’s earnings, cash flows, financial condition, or results of operations.
Inkai is currently experiencing issues related to availability of adequate construction services. This is leading to delays with completion of the expansion projects. In the case these issues are not resolved within a reasonable timeframe, Inkai runs the risk of not meeting the production targets set out in the Ramp-up schedule or production cost increases due to reliance on toll milling. While Inkai currently has access to a sufficient supply of drilling services, meeting the Ramp-up production targets will require an increased amount of drilling. Procuring drilling services in sufficient amounts at the appropriate time may prove to be challenging.
The geopolitical situation continues to cause transportation risks in the region. The timing of delivery of the remaining share of Cameco’s 2024 production from JV Inkai is uncertain. Depending on when Cameco receives shipments of its share of Inkai’s production, its share of earnings from this equity-accounted investee and the timing of the receipt of its share of dividends from the joint venture may be impacted.
See Section 24.4 for more information.
| 1.14 | Implementation agreement |
The restructuring of JV Inkai, as contemplated by the Implementation Agreement, closed on December 11, 2017, with an effective date of January 1, 2018, and consisted of the following, subject to various supplemental agreements:
| • | an adjustment to the Inkai Participants’ Ownership Interests and the restructuring of JV Inkai resulting in Kazatomprom obtaining a majority Ownership Interest and exercising sufficient control over JV Inkai. |
| • | an increase in the annual production limit from the MA Area from 5.2 million pounds U3O8 per year to 10.4 million pounds U3O8 per year. |
| • | an extension of the term of the RUC for the MA Area to the year 2045. |
| • | a revision to the boundaries of the MA Area. |
| • | priority payment of the loan made by a Cameco subsidiary to JV Inkai to fund exploration and evaluation of Block 3 (in 2019, the loan was repaid). |
| • | Cameco and Kazatomprom have also completed and reviewed a feasibility study for the purpose of evaluating the design, construction and operation of a uranium conversion facility in Kazakhstan. In accordance with the agreement, a decision was made not to proceed with construction of the uranium conversion facility as contemplated in the feasibility study. Cameco and KAP subsequently signed an agreement to licence proprietary UF6 conversion technology to KAP, to allow KAP to examine the feasibility of constructing and operating its own UF6 conversion facility in Kazakhstan. |
JV Inkai has experienced a number of delays in achieving the production levels outlined in the Implementation Agreement. Cameco and Kazatomprom mutually agreed to revise the production Ramp-up schedule via supplemental agreements to the Implementation Agreement while staying within the 20% deviation from the production levels specified in the RUC, as allowed under the Subsoil Code. The supplemental agreements also contemplate:
| • | production level increases to recover the shortfall to the original Ramp-up schedule |
| • | production sharing framework for the production shortfall |
| • | dividend distribution sharing formula |
| • | continued support for the calciner project |
| • | toll processing of a portion of JV Inkai production in 2021 |
2024 INKAI OPERATION TECHNICAL REPORT 12
Discussions are ongoing between Cameco and Kazatomprom regarding additional supplemental agreements to address ongoing delays to the Ramp-up schedule tied, in part, to challenges with supply of sulphuric acid.
| 1.15 | Conclusions and recommendations |
Based on the rigorous procedures and experience demonstrated by Volkovgeology, JV Inkai and Cameco personnel, Cameco’s review of the reliability, quality and density of data available, the thorough geological interpretative work, and the different validation tests performed over the years, the qualified persons responsible for the mineral resource and mineral reserve estimates consider that the current estimates of mineral resources and reserves are relevant and reliable.
From 2009 until September 30, 2024, JV Inkai produced, not including the Sat2 Area test mining, 95.7 million pounds U3O8 (Cameco’s share - 52.1 million pounds). The reserves-based production plan represents an operating mine life from 2024 until mid-2045, during which Inkai is forecast to produce an estimated 212.3 million pounds U3O8 (Cameco’s share - 85.6 million pounds).
The authors of this technical report concur with JV Inkai’s plan for construction and expansion of the required project facilities and infrastructure, as outlined in this technical report.
In order to achieve the production plan and its economic benefits, and to mitigate risk, the authors of this technical report make the following recommendations:
| • | The confidence in grade continuity and hydrogeological conditions can be increased in areas presently classified as probable mineral reserves and indicated or inferred mineral resources, a portion of the latter being included in the LOM Plan. Additional pre-production delineation and in-fill drilling is recommended to upgrade these resources to the measured and/or indicated classification categories, allowing conversion of the resources to proven or probable reserves. This drilling is currently included in the LOM Plan and budget. |
| • | That JV Inkai pursue additional options for procurement of required volumes of sulphuric acid to ensure production reliability. |
| • | Over the life of the operation and at higher production rates, the accumulation of specific ionic species in the holding ponds could reduce surface equipment performance. It is recommended that the concentration of ionic species continue to be monitored. |
| • | That JV Inkai continue to investigate opportunities for continual improvement related to optimization of operating costs through targeted metallurgical studies, maintenance reliability, and operational technology and enhanced control systems. |
2024 INKAI OPERATION TECHNICAL REPORT 13
| 2 | Introduction |
| 2.1 | Introduction and purpose |
Inkai is a material property for Cameco under Canadian securities laws.
This technical report has been prepared for Cameco by, or under supervision of, internal qualified persons in support of the disclosure of scientific and technical information relating to Inkai, contained in Cameco’s short form base shelf prospectus dated November 12, 2024 and filed concurrently with the filing of this technical report.
The report has an effective date of September 30, 2024, and has been prepared in accordance with NI 43-101 by the following individuals:
| • | C. Scott Bishop, P. Eng., Director, Technical Services, Cameco Corporation |
| • | Sergey Ivanov, P. Geo., Deputy General Director, Technical Services, Cameco Kazakhstan LLP |
| • | Alain D. Renaud, P. Geo., Principal Resource Geologist, Technical Services, Cameco Corporation |
These individuals are the qualified persons responsible for the content of this technical report. Two of these qualified persons have visited the Inkai site.
Mr. Bishop has been involved with Inkai since 2019. He has not visited the site. Mr. Bishop has been involved in various technical reviews of Inkai including reviews of the mineral resource and mineral reserve estimates, wellfield and plant performance assessments and cost reviews. He has also been involved in audits, property evaluations and technical studies of other uranium ISR properties.
Mr. Ivanov has been involved with JV Inkai since 2009, including working as Chief Geologist at JV Inkai from 2011 to 2015. He is currently based in Astana, Kazakhstan and routinely visits the Inkai site and JV Inkai’s office in Shymkent. His most recent visit to the mine site was conducted from September 23-27, 2024. His visits included observing drilling, sampling and downhole geophysical logging activities, reviewing the mine and production plans and performance, ecological monitoring, mineral resource and mineral reserve estimation and production-mineral reserve reconciliation. He has been involved with audits, evaluations and technical studies of other uranium ISR properties.
Mr. Renaud has been involved with JV Inkai since 2018 and has visited the site on two occasions. Mr. Renaud’s last personal inspection of the Inkai site, including the main processing plant, occurred from October 7-10, 2022, and included a review of drilling, core handling, radiometric probing, logging, laboratory and sampling facilities, sampling and data verification procedures in place. Mr. Renaud was involved in reviewing the Sat1 and Sat2 Area mineral resource and mineral reserve estimates and is also involved in the year-end compilation and review of JV Inkai’s mineral reserves and resources. He has been involved with audits, property evaluations and technical studies of other uranium ISR properties.
| 2.2 | Report basis |
This technical report has been prepared with available internal Cameco and JV Inkai data and information, as well as data and information prepared for Inkai. The principal technical documents and files relating to Inkai that were used in preparation of this technical report are listed in Section 27.
All monetary references in this technical report are expressed in Canadian dollars, unless otherwise indicated. Illustrations (Figures) in this report are from Cameco, and are dated September 30, 2024, unless otherwise stated.
2024 INKAI OPERATION TECHNICAL REPORT 14
| 3 | Reliance on other experts |
The authors have relied, and believe they have a reasonable basis to rely, upon the following individuals who have contributed the legal and taxation information stated in this technical report, as noted in Table 3-1 below.
Table 3-1: Reliance on Other Experts
Name | Title | Section # (description) | ||
| Aislu Sergaziyeva | Deputy General Director, Legal & Compliance, Cameco Kazakhstan | 1.2 (description of Property tenure)
1.10 (description of Environmental assessment and licensing)
1.13 (description of Regulatory risks)
1.14 (description of Implementation agreement)
4.2 (description of Exploration and mining licences)
4.3 (description of Surface tenure)
4.4 (description of Resource use contract)
4.5 (description of Subsoil code)
4.6 (description of Strategic object)
4.10 (description of Factors affecting the right to work on the property)
6.1 (description of Ownership)
19.2 (description of Uranium sales contracts)
19.3 (description of Material contracts)
20 (description of Environmental studies, permitting and social or community impact)
24.1 (description of Implementation agreement)
24.3 (description of Regulatory risks) | ||
| Jill Johnson, MPAcc, CPA, CA | Senior Director, Tax and Treasury, Cameco | 22.5 (description of Taxes and royalties) | ||
2024 INKAI OPERATION TECHNICAL REPORT 15
| 4 | Property description and location |
| 4.1 | Location |
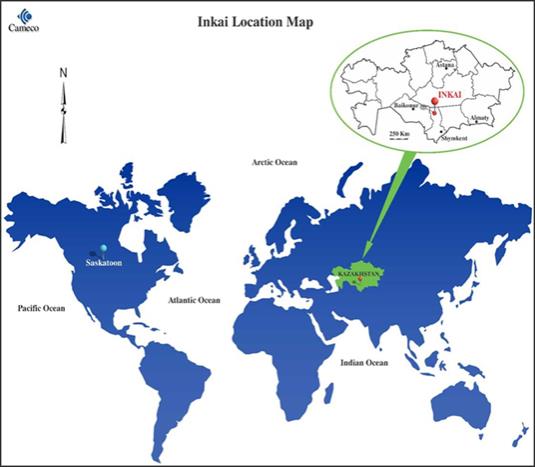
The Inkai operation is located in the Suzak District of the Turkestan region, Republic of Kazakhstan. The geographic coordinates are at approximately 45º 20’ north latitude and 67º 30’ east longitude (Figure 4-1).
The RUC, giving JV Inkai its rights to the Inkai deposit, was signed by the Republic of Kazakhstan and JV Inkai in July 2000. Amendment No. 6 was signed on November 30, 2017 and provided for the contiguous MA Area covering 139 km2 that includes the original Block 1 (MPP Area) and portions of Blocks 2 and 3 (Sat1 Area and Sat2 Area respectively). The MA Area is located near the town of Taikonur.
Figure 4-1: Location Map
2024 INKAI OPERATION TECHNICAL REPORT 16
| 4.2 | Exploration and mining licences |
The original RUC was issued in conjunction with two licences: Licence AY 1370D and Licence AY 1371D. Licence Series AY 1370D allowed for the mining of uranium in a 16.58 km2 area, designated as Block 1 in the Suzak District of the Republic of Kazakhstan. Licence Series AY 1371D allowed for the exploration and further mining of uranium in a 470 km2 area, designated as Block 2 (about 230 km2) and Block 3 (about 240 km2) in the Suzak District of the Republic of Kazakhstan. These areas were replaced by the MA Area upon the signing of Amendment No. 6.
Amendment No. 6 grants JV Inkai mining rights over the MA Area until mid-2045.
| 4.3 | Surface tenure |
Under Kazakhstan law, the subsoil and mineral resources belong to the Republic of Kazakhstan. Currently, the Republic of Kazakhstan provides access to subsoil and mineral resources under a resource use contract or a licence depending on the type of mineral in question. Minerals extracted from the subsoil by a subsoil user under a resource use contract or a licence are the property of the subsoil user unless the Subsoil Code or a resource use contract provide otherwise.
Under JV Inkai’s RUC, JV Inkai has the rights to explore for and to extract uranium from the subsoil contained in the MA Area and JV Inkai owns the uranium extracted from this subsoil.
A resource use contract gives a subsoil user a land use right while exploring, mining and reclaiming the land. However, this right must be set forth in a land lease agreement with the applicable local administrative authorities.
On a regular basis, JV Inkai obtains from local authorities the necessary land lease agreements for new buildings and infrastructure. JV Inkai does not hold land leases for the entire MA Area; it obtains them gradually only for the surface area required for exploration, mining or construction of new infrastructure.
| 4.4 | Resource use contract |
The RUC was signed by the Republic of Kazakhstan and JV Inkai and then registered in July, 2000 and provides for JV Inkai’s mining rights to the MA Area, as well as containing obligations with which JV Inkai must comply in order to maintain such rights. There have been six amendments to the RUC as follows:
| • | In 2007, Amendment No. 1 was signed, extending the exploration period of Blocks 2 and 3 for two years. |
| • | In 2009, Amendment No. 2 was signed, approving the mining licence at Block 2, adopting the 2009 Tax Code, which eliminated the tax stabilization provision of the RUC, implementing local content and employment requirements, and extending the exploration period at Block 3. |
| • | In 2011, Amendment No 3 was signed, increasing production and giving JV Inkai government approval to carry out a five-year assessment program on Block 3 that included delineation drilling, uranium resource estimation, construction and operation of a processing plant at Block 3, and completion of a feasibility study. |
| • | In 2013, Amendment No. 4 was signed to increase annual production from Blocks 1 and 2 to 5.2 million pounds U3O8. |
| • | In November 2016, Amendment No. 5 was signed, extending the exploration period at Block 3 to July 13, 2018 (superseded by Amendment 6 which changed the block boundaries and relinquished portions of Block 2 and 3). |
| • | In November 2017, Amendment No. 6 was signed which defined the boundaries of the MA Area to match the agreed production profile for Inkai, increased the annual production from the MA Area to 10.4 million pounds U3O8and extended the extraction term until July 13, 2045. |
2024 INKAI OPERATION TECHNICAL REPORT 17
Discussions are ongoing with respect to a further amendment to the RUC which may address recent production shortfalls, incorporate updated wellfield design and sequencing and incorporate new decommissioning estimates. Inkai retained a local engineering firm to develop an updated PUDD, which, after going through a regulatory review and approval process, will form the basis for a work program. This updated work program is anticipated to support a further amendment to the RUC. See Section 20.1.5 for additional information.
In addition to complying with its obligations under the RUC, JV Inkai, like all subsoil users, is required to abide by the work program appended to its RUC, which relates to its mining operations.
| 4.5 | Subsoil code |
The principal legislation governing subsoil exploration and mining activity in Kazakhstan is the Subsoil Code dated December 27, 2017, which superseded the Subsoil Law dated June 24, 2010 (Subsoil Law). In general, the rights held by JV Inkai are governed by the previous Subsoil Law that was in effect at the time of the RUC registration in July 2000. As follows from the stability provisions of the RUC, the Subsoil Code should apply insofar as it does not deteriorate JV Inkai’s position from the previous Subsoil Law that was in effect at the time the Licences were issued in April 1999.
The Subsoil Code defines the framework and the procedures connected with the granting of subsoil rights and the regulation of the activities of subsoil users. The subsoil, including mineral resources, are Kazakhstan state property, while minerals brought to the surface belong to the subsoil user, unless otherwise provided by contract or the Subsoil Code.
In order to develop mineral resources, the Competent Authority grants exploration and production rights to third parties. Subsoil rights are granted for a specific period but may be extended prior to the expiration of the applicable contract or licence.
Pursuant to the Subsoil Code, a subsoil user is accorded, among other things, the exclusive right to conduct mining operations, to erect production facilities, to freely dispose of its share of production and to conduct negotiations for extension of the contract, subject to restrictions and requirements set out in the Subsoil Code.
Until amendments to the previous Subsoil Law in August 1999, both a licence and a contract were required for exploration and production.
In August 1999, the Kazakhstan government abolished the licence regime for subsoil use rights granted after September 1999. Thus, from September 1999 onward, subsoil use rights have been granted on the basis of a resource use contract alone. However, all licences previously issued remain valid. An entity which obtained its subsoil use right prior to August 1999 holds such rights on the basis of a subsoil use licence and a resource use contract. An entity which obtained a subsoil use right after August 1999 holds its rights on the basis of a resource use contract alone.
The subsoil use rights held by JV Inkai came into effect upon the initial issuance of the Licences (April 1999), the execution of its RUC (July 2000), and the registration of the RUC by applicable state entities.
| 4.5.1 | Stabilization clause |
Under the previous Subsoil Law, changes in legislation that worsened the position of the subsoil user did not apply to resource use contracts signed or licences granted before the changes were adopted. Additionally, the RUC contains its own stability provision that reflects this approach.
While the Subsoil Code still contains the above guarantees, there are a number of listed exceptions such as national defence or security, ecological safety, public health, taxation, and customs.
Some of the provisions of the current Subsoil Code are stated to be applicable retroactively. Given that some subsoil use contracts (including the RUC) contain the legislation stability guarantee and
2024 INKAI OPERATION TECHNICAL REPORT 18
the latter is also provided for by both the stabilized Subsoil Law and the Subsoil Code, any retrospective provisions of the Subsoil Code should not generally override such stability guarantee unless an exception applies.
Overall, the Republic of Kazakhstan has gradually weakened the stabilization guarantee, particularly in relation to new projects, and the national security exception is applied broadly to encompass security over strategic national resources.
| 4.5.2 | Transfer of subsoil use rights and pre-emptive rights |
Amendments to the previous Subsoil Law (December 2004 and October 2005) provide the Republic of Kazakhstan with a pre-emptive right to acquire subsurface use rights and equity interests in entities holding subsoil use rights and in any entity which may directly or indirectly determine or exert influence on decisions made by a subsoil user, if the main activity of such entity is related to subsoil use in Kazakhstan, when such entity wishes to transfer such rights or interests. This pre-emptive right was also provided by the Subsoil Law and has been maintained in the Subsoil Code, and it permits the Republic of Kazakhstan to purchase any subsoil use rights or equity interests being offered for transfer on terms no less favourable than those offered by other purchasers. At a certain point, the pre-emptive right has been limited to the deposits of strategic importance; however, Inkai is considered a deposit of strategic importance and therefore still subject to the pre-emptive right of the state.
The Subsoil Law provided that assignments and transfers of subsoil use rights may be made only with the prior consent of the Competent Authority. The Competent Authority has the right to terminate a subsoil contract if a transaction takes place without such consent.
The Subsoil Code continues to provide for the state’s pre-emptive right to deposits of strategic importance and the requirement to obtain the Competent Authority’s consent to transfer of subsurface use rights and equity interests in entities holding subsoil use rights or entities who may directly or indirectly control the subsoil user.
That said, the Subsoil Code liberates to some extent the regime of regulatory approvals. For example, it provides for a longer list of cases where the pre-emptive right and the consent requirements do not apply (e.g. abolished the requirement to obtain consent in case of a charter capital increase without change in shareholding and a transaction with government, state body, national management holding or national company).
| 4.5.3 | Dispute resolution |
The dispute resolution procedure in the Subsoil Code does not specifically disallow international arbitration. Instead, it states that if a dispute relates to exercise, amendment or termination of subsoil use rights, the parties can resolve the dispute according to the laws of Kazakhstan and international treaties ratified by the Republic of Kazakhstan. Pursuant to amendments to the Subsoil Code that came into effect on January 10, 2023, disputes under contracts related to complex hydrocarbon projects are expressly allowed to be referred to international arbitration under UNCITRAL rules. However, no express arbitration rights have been provided for uranium contracts.
The RUC allows for international arbitration.
The Subsoil Code provides for resolution of disputes by court order (meaning state courts) on a number of specific issues such as termination of resource use contracts and some of these provisions were given retrospective effect. Generally, Cameco believes those retrospective provisions should not override the stability guarantee and should not apply to the RUC.
| 4.5.4 | Contract termination |
Under the Subsoil Code, the Competent Authority can unilaterally terminate a contract before it expires on the following grounds:
2024 INKAI OPERATION TECHNICAL REPORT 19
| a) | failure to provide or provision of false information in the reports required to be submitted to the Competent Authority; |
| b) | less than 30% of the financial obligations under a contract are fulfilled during the reporting year; |
| c) | conducting uranium production operations without establishing the decommissioning security in accordance with the established schedule; |
| d) | breach of the terms of the resource use contract; |
| e) | entry into force of a court judgment prohibiting subsoil use operations; |
| f) | conducting uranium production operations without the approved project documents; |
| g) | violation of the requirements applicable to transfer of subsoil rights or an object connected with the subsoil use rights (direct and indirect ownership interests in a subsoil user) such as consent of the Competent Authority for the transfer if such consent was required; |
| h) | activities of a subsoil user exploring or developing a strategic deposit entails such changes in the economic interests of the state that it poses a threat to national security and the subsoil user does not satisfy the Competent Authority’s request to amend the resource use contract in this regard. |
The Competent Authority may terminate the RUC on grounds (a)-(d) only where it notifies the subsoil user of the alleged violations and the subsoil user fails to remedy one of the violations indicated in sub-sections (a)-(c) within three months from the date of the receipt of the notice from the Competent Authority or when the subsoil user fails to remedy more than two contractual violations under the RUC within the term specified in the notice from the Competent Authority. The Competent Authority may terminate the resource use contract immediately on grounds (e)-(g). In case of ground (h), the Competent Authority may terminate the resource use contract only upon the Government’s decision.
March 2021 amendments to the Subsoil Code gave retrospective effect to the provisions on termination of resource use contracts.
Cameco believes that the Subsoil Code’s retrospective provisions on termination should not override the stability guarantee and therefore terms of the RUC should continue to apply unless the state seeks to apply the national security, ecological safety or health care exception to the guarantee of legal stability. The termination provisions of the RUC are more favourable than those contained in the Subsoil Code, as the RUC may only be terminated by the Competent Authority with notice to JV Inkai in respect of any contractual breaches, with a period to cure any such breaches, other than with respect to breaches relating to a threat to human life or to the environment.
See Section 4.5.8 for more information on termination of contract regarding fields of strategic importance.
| 4.5.5 | Work programs and project documentation |
In addition to following its obligations under the RUC, JV Inkai, like all subsoil users, is required to abide by the work program, which is a mandatory part of the RUC, and which relates to its operations over the life of the mine.
Work programs must be developed in accordance with project documents. The Subsoil Code establishes three types of project documents in the sphere of uranium production, depending on the type and stage of the work:
| • | pilot production project: none for JV Inkai |
| • | mining project: JV Inkai’s PUDD |
| • | decommissioning project |
2024 INKAI OPERATION TECHNICAL REPORT 20
The project documents are developed and undergo a review and approval process. All work must be in compliance with the project documents, and conducting any work without an approved project document, or in non-compliance with it, is not permitted. Since January 2015, subsoil users conducting production of hard materials, including uranium, are allowed to produce within 20% (above or below) of their approved project targets in a year without triggering a requirement to redo the approved project documents. Any changes to the project documents that affect investment project targets included in the work program require amendments to the work program. Thus, changes of types, methods, technologies, volumes and terms of uranium mining operations are only allowed after amendment of the relevant project documents. Any amendments to aspects of the work program that are an integral part of the resource use contract require an application to the Competent Authority for approval, signing and registering amendments to the resource use contract.
The Subsoil Code repealed the previous requirement for annual work plans. Instead, expected exploration and production for each year are now set out in one work program.
| 4.5.6 | Procurement requirements |
Under the Subsoil Code, all subsoil users (with some exceptions) must procure goods, works and services for uranium mining operations under prescribed statutory procedures.
The Subsoil Code requires procurements from open tender, single source, open competition to control costs (digital procurement) to be conducted using the register of goods, works and services (the register of potential suppliers) or other digital procurement systems located on Kazakhstan’s Internet sites. Uranium mining companies may also conduct procurement of certain limited goods, works and services by applying other methods or on commodity exchanges.
Subsoil users are also required to develop annual and mid-term (for five financial years) procurement programs based on the work program and respective budget.
Prior to 2018, JV Inkai followed the statutory procedures prescribed by the Subsoil Code. After 2018, as an entity with more than 50% of its voting shares directly or indirectly belonging to Samruk Kazyna National Wealth Fund, JV Inkai has been following Samruk Kazyna procurement procedures that generally are more prescriptive than the procedures in the Subsoil Code.
| 4.5.7 | Local content requirements |
Since 2002, Kazakhstan has implemented a policy aimed at replacing imports, and fostering greater involvement, support and stimulation of local producers and local employees. Under this policy, subsoil users are obliged to purchase local works and services and hire local personnel in such percentages as may be specified in their resource use contracts.
In 2012, Kazakhstan amended the Subsoil Law to retroactively mandate all subsoil users to use unified terminology and to report on local content pursuant to a newly introduced unified methodology. However, since accession to the World Trade Organization, Kazakhstan amended its local content requirements, abolishing the local content requirements for goods. If this requirement remained in resource use contracts entered into prior to January 1, 2015, it was automatically abolished on January 1, 2021, unless amended earlier. Nonetheless, the Subsoil Code imposes local content requirements for works, services and employees.
The RUC imposes local content requirements on JV Inkai with respect to employees, goods, works and services. As a result, at least 40% of the costs of goods and equipment must be for equipment and materials purchased of local origin, 90% of the contract work (i.e. works and services) must be of local origin, and 100%, 70% and 60% of employees depending on qualifications (workers, engineers and management, respectively) must be of local origin.
2024 INKAI OPERATION TECHNICAL REPORT 21
Effective January 1, 2021, under Kazakhstan law this local content requirement ceased to apply to goods procured by JV Inkai.
| 4.5.8 | Strategic deposits |
On August 13, 2009, a governmental resolution “On Determination of the List of Subsoil (Deposit) Areas having Strategic Importance” No. 1213 came into force whereby 231 blocks, including all three of JV Inkai’s blocks, were prescribed as strategic deposits. The Kazakhstan government re-approved this list in 2011 by its decree No. 1137, and in 2018 by its decree No. 389, which still included JV Inkai’s blocks.
Under the Subsoil Code, if a subsoil user’s actions in the performance of subsoil use operations with respect to strategic deposits result in a change to the economic interests of the Republic of Kazakhstan which create a threat to national security, the Competent Authority is entitled to require an amendment to the resource use contract for the purpose of restoring the economic interests of the Republic of Kazakhstan. The Subsoil Code prescribes strict deadlines for the parties to negotiate and execute any such required amendments and failure to comply with such deadlines entitles the Competent Authority to terminate the resource use contract unilaterally.
The Subsoil Code also allows the Competent Authority, upon a decision of the Government of the Republic of Kazakhstan, to unilaterally terminate a resource use contract if it determines that the subsoil use operations conducted thereunder will result in a change in the economic interests of Kazakhstan, which create a threat to national security. In such circumstances, the Competent Authority must provide not less than two months prior notice of such termination. The Competent Authority has the right to unilaterally terminate a resource use contract without having to apply to a court or arbitration panel for termination.
The basis for exercise by the Competent Authority of any of these powers is a “change in the economic interests of the Republic of Kazakhstan which creates a threat to national security”, which might be interpreted broadly.
Moreover, this right of unilateral termination applies retroactively to old resource use contracts.
| 4.5.9 | Decommissioning |
The decommissioning regulations have been changed by the Subsoil Code. The general provisions related to decommissioning have been modified and special provisions on decommissioning of uranium fields have been introduced.
The transitional provisions of the Subsoil Code preserve the decommissioning fund mechanism applicable to the RUC and accordingly, JV Inkai continues to rely upon its existing decommissioning fund. See Section 20.1.5 for additional information.
| 4.5.10 | Uranium special regulations |
In addition to the general provisions described above, the Subsoil Code differentiates uranium from the rest of solid minerals and provides an additional, distinct set of rules to govern uranium mining specifically. The Subsoil Code provides that a uranium deposit is granted for mining to a uranium national company (a joint stock company created by the Government of Kazakhstan’s decree and controlling stock of which belongs to the state or national management fund and conducting activities in uranium sphere) on the basis of direct negotiations. Currently, the uranium national company is Kazatomprom. The Subsoil Code does not envisage that such direct negotiations can be initiated by persons other than national companies. It follows then that new subsoil use rights for uranium mining can only be granted to a national company.
The Subsoil Code further stipulates that a subsoil use right for uranium mining (or a share in such subsoil use right) granted to a uranium national company on the basis of direct negotiations may only be further transferred to a legal entity in which more than 50% of the shares (participating
2024 INKAI OPERATION TECHNICAL REPORT 22
interests) belong directly or indirectly to a uranium national company. Such a transferee, in turn, may only transfer the subsoil use right (or share in the subsoil use right) to a legal entity in which more than 50% of the shares (participating interests) belong directly or indirectly to a uranium national company.
The uranium special rules also regulate issues of termination of the uranium subsoil use right, provision of a uranium deposit and its extension/reduction, conditions, and periods of mining and project and design documents. The Subsoil Code does not generally establish a retroactive effect for these special uranium rules, subject to a few exceptions (for example, uranium contract termination provisions now apply retroactively).
| 4.6 | Strategic object |
Kazakhstan law (Civil Code and the Law on State Property) defines the term “strategic object” and provides that imposition of encumbrances and their alienation is subject to the approval of the Kazakhstan government. In addition, the Law on State Property provides that the Republic of Kazakhstan shall have the priority right to purchase the strategic object being disposed of.
The Civil Code provides a general description of objects which might be recognized as strategic objects while Decree No. 651 of the Republic of Kazakhstan dated June 30, 2008 approves a specific list of objects qualified as strategic (the “List of Strategic Objects”). While Kazatomprom’s interest in JV Inkai was on the List of Strategic Objects since 2008, Cameco’s interest in JV Inkai was included on the List of Strategic Objects only since 2012.
Accordingly, any encumbrances and disposal of an interest in JV Inkai requires a decree of the Republic of Kazakhstan and waiver of the priority right by the Republic of Kazakhstan.
| 4.7 | Royalties |
A discussion of royalties payable by JV Inkai can be found in Section 22.5.
| 4.8 | Known environmental liabilities |
For a discussion of known environmental liabilities, see Section 20.1.3.
| 4.9 | Permitting |
For a discussion on permitting, see Section 20.1.4.
| 4.10 | Factors affecting the right to work on the property |
Known factors and risks that may affect access, title and right to work on the property are described below.
Under the RUC, JV Inkai has the rights to explore for and to extract uranium from the subsoil and it owns the uranium extracted from the subsoil. Its ability to conduct these activities, however, depends upon compliance with its obligations under the RUC and laws of Kazakhstan, as well as ongoing support, agreement and co-operation from the government of Kazakhstan.
Under Kazakhstan law, the state has the right to nationalize private property by enacting a law on nationalization. As of the date of this technical report, Kazakhstan has not exercised such right but the risk of nationalization of Cameco’s interest in JV Inkai exists.
The Subsoil Code lists the violations which entitle the Competent Authority to unilateral termination of a resource use contract (for more details please refer to Section 4.5.4). If JV Inkai or its participants commit any of these violations, there is a risk of JV Inkai losing its subsoil use rights due to unilateral termination by the Competent Authority.
The Subsoil Code provides the state with the right to demand amendments to a resource use contract if activities of a subsoil user, exploring or developing a strategic deposit, result in changes
2024 INKAI OPERATION TECHNICAL REPORT 23
in the economic interests of the Republic of Kazakhstan that pose a threat to national security. This, in turn, might entail a risk of diminishment of JV Inkai’s rights. The right to demand amendments might be applied broadly by the Republic of Kazakhstan leading to a risk of:
(i) curtailment of JV Inkai’s rights or (ii) termination of the RUC. This right is provided by the Subsoil Code and it applied retroactively to old resource use contracts.
JV Inkai is required to hold, and it does hold, a number of licences and permits (including but not limited to ecological permits) and therefore must comply with their requirements. Failure to obtain and to comply with the requirements of licences and permits could result in the activities JV Inkai performs under a licence or permit being limited. For example, without an ecological permit, JV Inkai will be unable to conduct subsoil operations.
Generally, other breaches of law and/or contractual obligations (such as failure to pay taxes or causing damages to a third party) may also lead to limitation of the right to use JV Inkai’s property.
2024 INKAI OPERATION TECHNICAL REPORT 24
| 5 | Accessibility, climate, local resources, infrastructure and physiography |
| 5.1 | Access |
Inkai is located near the town of Taikonur, approximately 350 kilometres northwest of the city of Shymkent and approximately 155 kilometres east of the city of Kyzylorda in the south-central region of Kazakhstan. Taikonur can be reached from Astana or Almaty by flying to one of the regional cities of Shymkent or Kyzylorda, then driving on paved roads (Figure 5-1). The road to Taikonur is currently the primary access road for transportation of people, supplies and uranium product for JV Inkai.
Major airline service is available to Astana and Almaty from Europe, Russia, China and other countries in the region. From Astana or Almaty, commercial airline services are available to Shymkent, Turkistan and Kyzylorda. The direct distance from Astana to Shymkent is 980 kilometres, to Turkistan it is 890 kilometres and to Kyzylorda it is 830 kilometres. The distance by paved roads from Taikonur to Shymkent is 440 kilometres, to Turkistan it is 310 kilometres, and to Kyzylorda it is 290 kilometres.
Rail transportation is available from Almaty to Shymkent then northwest to Shieli, Kyzylorda and beyond. A rail line also runs from the town of Dzhambul to Kazatomprom’s Centralia facility to the south of Taikonur.
| 5.2 | Climate |
Inkai lies in the Betpak-Dala Desert. The ground consists of extensive sand deposits with vegetation limited to grasses and occasional low bushes. Major hydrographic systems in the area include the Shu, Sarysu and Boktykaryn rivers. These rivers typically exhibit surface water flow in May and June and revert to isolated reaches with salty water during the rest of the year.
The climate in south central Kazakhstan is semi-arid, with temperatures ranging from -35°C in the winter to +40°C in the summer. January is the coldest month, with an average temperature of -9°C. July is the warmest month, when temperatures climb to an average of +28°C. The climate of the region is continental, characterized by harsh winters and hot summers, low humidity and low precipitation. The daily fluctuation in air temperature during the summer can be up to 14°C. Site operations are carried out throughout the year, despite the cold winter and hot summer conditions.
The average precipitation varies from 130 to 140 mm/a, with snow accounting for 22 to 40% of this amount. The average air humidity is typically in the range of 56 to 59%.
The region is also characterized by strong winds. The prevailing direction of the wind is northeast, averaging 3.8 to 4.6 m/sec. Dust storms are common.
| 5.3 | Physiography |
The surface elevation at Inkai ranges from 140 to 300 metres above mean sea level. The Inkai deposit is sub-divided into two morphologically diverse regions:
| • | the sandy-brackish intercontinental deltas of the Shu and Sarysu rivers |
| • | the Betpak-Dala Plateau |
The sandy-brackish intercontinental deltas of the Shu and Sarysu rivers are located in the hollow between the elevation of the Betpak-Dala plateau and the Karatau Mountain range. This plain has numerous brackish and lacustrine basins, dry riverbeds, former riverbeds, and aeolian relief of various configurations. The Betpak-Dala is a slightly sloping and slanted north to south plain with deflationary basins and rare arched ridges.
2024 INKAI OPERATION TECHNICAL REPORT 25
| 5.4 | Local resources |
Currently, Taikonur has a population of approximately 700 people who are mainly employed in uranium development and exploration. Whenever possible, JV Inkai hires personnel from Taikonur and surrounding villages. The town has a school, medical clinic and small store. Most of the food is purchased in Shymkent or Shieli.
| 5.5 | Infrastructure |
Inkai is a developed producing property with site facilities and infrastructure. It has sufficient surface rights to meet future operational needs given the current mineral reserves. The electrical supply for Inkai is from the national power grid. Inkai is connected to the grid via a 35-kilovolt power line, which is a branch of the circuit that supplies the Stepnoye mine east of Inkai. In case of power outage, there are standby generators. Telephone communications utilize a satellite internet system and fibre optics.
Inkai has access to sufficient water from groundwater wells for all planned industrial activities. Potable water for use at the camp and at the site facilities is supplied from shallow wells on site drawing from the Uvanas Aquifer while industrial use water is drawn from the Zhalpak Aquifer (see Section 7.1.1 for more information). The water systems include well houses, pump stations, storage for reserve demands and fire protection and distribution to points of use and fire protection mains. Sewage disposal is in a standard septic tank and leach field system.
Further details about infrastructure can be found in Section 18.
Figure 5-1: General Location Map
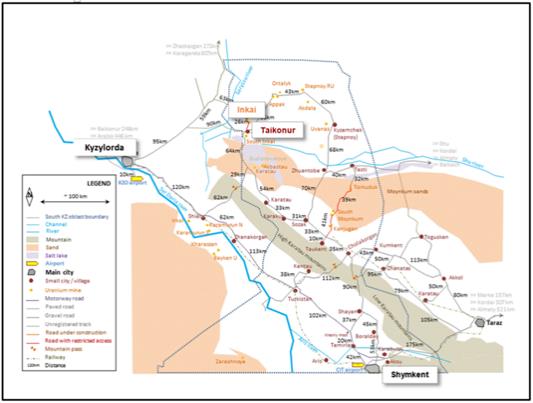
(Source: Cameco, 2016)
2024 INKAI OPERATION TECHNICAL REPORT 26
| 6 | History |
| 6.1 | Ownership |
There have been several changes in the ownership interests in JV Inkai. The current owners and their respective ownership interests are as follows:
| • | Cameco (40%) |
| • | Kazatomprom (60%) |
In 1996, JV Inkai was first registered by the Kazakhstan Ministry of Justice. The original owners were Cameco, Uranerzbergbau-GmbH, and KATEP, who each held an ownership interest of 33 1/3%.
In 1997, Kazatomprom was established.
In 1998, KATEP’s ownership interest in JV Inkai was transferred to Kazatomprom. Cameco acquired the ownership interest in JV Inkai held by Uranerzbergbau-GmbH, increasing Cameco’s ownership interest in JV Inkai to 66 2/3%. Cameco agreed to transfer 6 2/3% of its ownership interest in JV Inkai to Kazatomprom, leaving Cameco with a 60% ownership interest.
In 2016, Cameco signed the Implementation Agreement with Kazatomprom and JV Inkai to restructure and enhance JV Inkai. With the restructuring, Cameco retained 40% ownership of JV Inkai while Kazatomprom increased their ownership to 60%. This agreement became effective January 1, 2018. Further details on the Implementation Agreement and the various supplemental agreements thereto can be found in Section 24.1.
Currently, the Joint Stock Company Sovereign Wealth Fund “Samruk-Kazyna” holds a 63% share and the Ministry of Finance holds 12% of Kazatomprom, with the Republic of Kazakhstan owning 100% of both entities. The remaining 25% of Kazatomprom shares are floated on the London Stock Exchange and Astana International Exchange.
| 6.2 | Exploration and development history |
The Inkai deposit was discovered during drilling campaigns conducted from 1976 to 1978 by the Volkovskaya Expedition. By that time, prospecting and exploration programs had also resulted in the identification of the Uvanas, Zhalpak, Kanzhugan and Mynkuduk deposits. Together with the Inkai deposit, they formed a large new uranium mineralization prospect in the Shu-Sarysu Basin.
Exploration drilling progressed until 1996, at which time, the main exploration grid for Blocks 1 and 2 was mostly developed along fence lines 400 to 800 metres apart, with drillholes centered 50 metres apart. In several areas, the distance between fence lines was reduced to 200 by 50 metre spacing. Block 3 was characterized by significantly lower drilling density, ranging from 800 by 50 metres to 1,600 – 3,200 metres by 100 – 800 metres. All historical exploration and delineation drilling within the MA Area, as listed in Table 6-1, was carried out prior to JV Inkai obtaining its licences for Inkai. A map of the location of the historical and current drill holes within the MA Area is presented in Figure 10-1.
Table 6-1: Historical Drilling
Area | Number of holes | |||
Block 1 | 1,464 | |||
Block 2 | 1,429 | |||
Block 3 | 124 | |||
2024 INKAI OPERATION TECHNICAL REPORT 27
Regional and local hydrogeology studies were completed on the Inkai deposit dating back to 1979. Numerous borehole tests characterize the four aquifers within the Inkai deposit: the Uvanas, Zhalpak, Inkuduk and Mynkuduk.
Other exploration and development highlights include:
1980s
| • | ISR pilot leach tests initiated in northeast area of Block 1 in 1988. |
1990s
| • | 1993: First Kazakhstan estimates of uranium resources for Block 1. |
| • | 1996: First Kazakhstan estimates of uranium resources for Block 2. |
| • | 1999: JV Inkai receives a mining licence for Block 1 and an exploration with subsequent mining licence for Blocks 2 and 3 from the government of Kazakhstan. |
2000s
| • | 2000: JV Inkai and the government of Kazakhstan sign a subsoil use contract (called the resource use contract), which covers the licences issued in 1999. |
| • | 2002: Pilot leach test in the north area of Block 2 begins. |
| • | 2005: Construction of ISR commercial processing facility at Block 1 begins. |
| • | 2006: Complete pilot leach test at Block 2. Exploration-delineation drilling initiated at Block 3. |
| • | 2008: Commission front half of the MPP in the fourth quarter, and begin processing solution from Block 1. |
| • | 2009: Commission the MPP and start commissioning the Sat1 processing plant. |
2010s
| • | 2010: Receive regulatory approval for commissioning of the MPP. File a notice of potential commercial discovery at Block 3. Receive approval in principle for the extension of Block 3 exploration for a five-year appraisal period that expires July 2015, and an increase in annual production from Blocks 1 and 2 to 3.9 million pounds (100% basis). |
| • | 2011: Receive regulatory approval for commissioning and processing of uranium concentrate at Sat1. Sign a memorandum of agreement with KAP to increase annual production from Blocks 1 and 2 from 3.9 million pounds to 5.2 million pounds (100% basis). |
| • | 2012: Sign a memorandum of agreement with KAP setting out the framework to increase annual production from Blocks 1 and 2 to 10.4 million pounds (100% basis), to extend the term of JV Inkai’s RUC through 2045 and to cooperate on the development of uranium conversion capacity, with the primary focus on uranium refining rather than uranium conversion. Start construction of Sat2 at Block 3. Started drilling at test wellfields on Block 3. |
| • | 2015: Complete construction of the Sat2 facility at Block 3. Regulatory approval allowing processing of uranium eluate is received and the pilot leach test initiated. The Subsoil Law in Kazakhstan is amended to allow producers to produce within 20% (above or below) of their licensed production rate in a year. |
| • | 2016: Receive extension to the exploration period for Block 3 to July 2018 |
| • | 2017: SRC approval of resource estimate update for Block 3. Implementation Agreement was closed. Inkai’s RUC was amended extending its term to July 13, 2045, allowing annual production of 10.4 million pounds. |
| • | 2018: Infill drilling program in Sat1 Area begins and is completed in 2019. Sat2 commercial production starts along with expansion project, including the increase in pump station capacity, two additional IX sorption columns, and required piping. |
2024 INKAI OPERATION TECHNICAL REPORT 28
2020s
| • | 2021: Two Key LLP update mineral reserve/resource estimate based on the 2018/2019 infill drilling program. SRC approves new estimates. Sat2 expansion is completed. |
| 6.3 | Historical mineral resource and mineral reserve |
There are no historical mineral resources and mineral reserve estimates within the meaning of NI 43-101 to report.
| 6.4 | Historical production |
A pilot leach test, using the ISR mining method, was performed in the northeast area of Block 1 starting in December 1988. The test lasted for 495 days and recovered approximately 0.1 million pounds of U3O8. The pilot leach test in Block 2 started in 2002 and was completed in 2006, recovering approximately 2.0 million pounds of U3O8. The test wellfields continued to produce with commercial production starting in 2009.
A pilot leach test was performed in Block 3 between 2015 and 2017 recovering approximately 1.1 million pounds of U3O8(not reflected in table below).
Inkai packaged production and Cameco’s share to September 30, 2024 is shown in Table 6-2.
Table 6-2: Inkai Uranium Production
Period | Production (M Lbs U3O8) | Cameco’s share (M Lbs U3O8)1 | ||||||
1988 – 1990 | 0.1 | — | ||||||
2002 – 2006 | 2.0 | 1.2 | ||||||
2007 | 0.3 | 0.2 | ||||||
2008 | 0.5 | 0.3 | ||||||
2009 | 1.9 | 1.1 | ||||||
2010 | 4.3 | 2.6 | ||||||
2011 | 4.2 | 2.5 | ||||||
2012 | 4.4 | 2.6 | ||||||
2013 | 5.3 | 3.1 | ||||||
2014 | 5.0 | 2.9 | ||||||
2015 | 5.8 | 3.4 | ||||||
2016 | 5.9 | 3.4 | ||||||
2017 | 5.5 | 3.2 | ||||||
2018 | 6.9 | 3.4 | ||||||
2019 | 8.3 | 3.7 | ||||||
2020 | 7.0 | 4.2 | ||||||
2021 | 9.0 | 5.3 | ||||||
2022 | 8.3 | 4.2 | ||||||
2023 | 8.4 | 4.2 | ||||||
2024 YTD2 | 5.5 | 2.5 | ||||||
2009-20243 | 95.7 | 52.1 | ||||||
| 1 | Pursuant to the Implementation Agreement enacted in 2017, Cameco is entitled to purchase 57.5% of the first 5.2 million pounds of annual production, and as annual production increases over 5.2 million pounds, we are entitled to purchase 22.5% of such incremental production, to the maximum annual share of 4.2 million pounds. Once the Ramp-up to 10.4 million pounds annually is complete, Cameco is entitled to purchase 40% of such |
2024 INKAI OPERATION TECHNICAL REPORT 29
| annual production, matching its ownership interest. For the years 2020 through 2023 the partners agreed to an adjustment to the annual entitlement. The figures reported as Cameco’s share represent the volume of annual production that Cameco was entitled to purchase. Actual annual purchase amounts may have varied due to the timing of shipments and deliveries. |
| 2 | as of September 30, 2024. |
| 3 | numbers may not add due to rounding. |
2024 INKAI OPERATION TECHNICAL REPORT 30
| 7 | Geological setting and mineralization |
| 7.1 | Regional geology |
The geology of south-central Kazakhstan is composed of a large relatively flat basin of Cretaceous to Quaternary age continental clastic sedimentary rocks. The Chu-Sarysu Basin extends for more than 1,000 km from the foothills of the Tien Shan Mountains located on the south and southeast sides of the basin, and merges into the flats of the Aral Sea depression to the northwest.
The basin is up to 250 kilometres wide, bordered by the Karatau Mountains on the southwest and the Kazakh Uplands on the northeast. The basin is composed of gently-dipping to nearly flat-lying fluvial-derived unconsolidated sediments comprising inter-bedded sand, silt and local clay horizons. These sediments contain several stacked and relatively continuous, sinuous roll-fronts or redox fronts hosted in the more porous and permeable sand and silt units (Figures 7-1 and 7-2).
Economic uranium mineralization within the Chu-Sarysu Basin was studied extensively from 1971 to 1991. Several uranium deposits were identified across the Chu-Sarysu and its neighbour, the Syr-Darya basin, separated by the Karatau Range uplift. These deposits have been grouped into the Chu-Syr Darya mineralized region. The Zhalpak, Mynkuduk, Aqdala, Inkai, South Inkai and Budenovskoe deposits are hosted by Upper Cretaceous sequences and form the Zhalpak-Budenovskoe mineralized belt situated in the northwestern part of the Chu-Sarysu Basin. The Kanzhugan, Muyunkum, Tortkuduk and Uvanas deposits are hosted by Upper Cretaceous and Paleocene-Eocene sequences, forming the Uvanas-Kanzhugan mineralized belt situated in the central part of the Chu-Sarysu Basin.
The Cretaceous and Paleogene sediments hosting the uranium deposits are associated with large fluvial systems.
2024 INKAI OPERATION TECHNICAL REPORT 31
Figure 7-1: Geological Map of Chu-Sarysu Basin and Its Surroundings
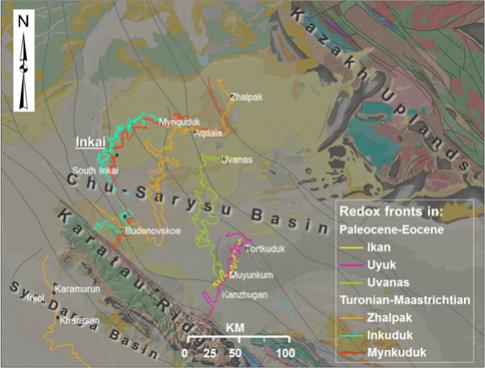
(Source: Cameco, 2024)
Figure 7-2: Schematic Cross-section of the Chu-Sarysu Basin – Looking West
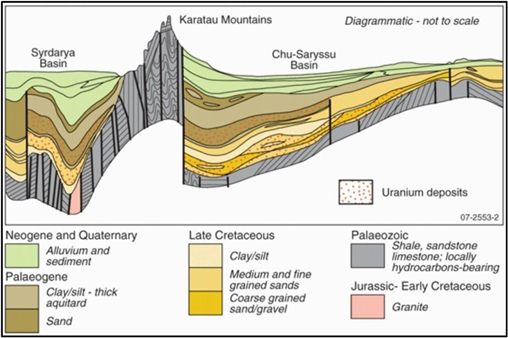
(Source: Kislyakov and Shetochkin, 2000; modified by Cameco in 2016)
2024 INKAI OPERATION TECHNICAL REPORT 32
| 7.1.1 | Hydrostratigraphy of the Chu-Sarysu Basin |
Hydrostratigraphy plays key roles in both the formation of the uranium sandstone deposits and the ISR mining method.
The Inkai deposit is located in the north-western part of the Suzak artesian basin that comprises two hydrogeological stages: an upper platform stage and a lower basement stage.
The upper platform stage is related to Quaternary-Neogene and Paleogene-Cretaceous deposits. The hydrogeological section of the platform stage reveals two hydrogeological sub-stages. The upper hydrogeological sub-stage is the Betpak-Dala aquifer (fine-grain sands) and other aquifers of sporadic occurrence. In general, these aquifers contain non-potable brackish and saline water. These upper aquifers are hydraulically isolated from the lower hydrogeological sub-stage aquifers by the regional Intymak clay aquitard of the Lower and Upper Eocene which is about 100 to 150 metres thick.
The lower basement stage contains groundwater in fractured rocks of Paleozoic age. It contains four aquifers within Paleocene and Upper Cretaceous strata, listed from top to bottom as follows:
| • | Uvanas aquifer: contains potable groundwater and is also widely used as a water supply for livestock. Six domestic water supply boreholes tap into the Uvanas aquifer and supply the nearby town of Taikonur. Some regional free-flowing artesian boreholes are also used for livestock watering needs. |
| • | Zhalpak aquifer: contains slightly brackish water which is suitable for industrial uses and livestock watering. |
| • | Inkuduk aquifer: contains non-potable brackish and slightly brackish water. |
| • | Mynkuduk aquifer: contains non-potable brackish and slightly brackish water |
Groundwater movement in the Chu-Sarysu Basin is towards the north-westerly discharge areas. The annual natural groundwater movement averages one to four metres, depending on the various permeabilities of the different sand horizons.
The lower aquifers have a common recharge area (the Karatau ridge and the Tien-Shan Mountains) and discharge into topographic depressions of the region-saline lands of Ashikol, Askazansor, and Lake Arys. Regional groundwater flows north-north-west. Permian claystones and siltstones underlay the Mynkuduk aquifer and appear to be a regional aquitard. Elsewhere in the region, the groundwater is tapped by numerous boreholes for livestock watering. Groundwater from the lower aquifers is not used at Inkai or in the surrounding area. The hydrogeology of the Inkai deposit is further described in Section 16.
| 7.2 | Local and property geology |
The stratigraphic sequence at Inkai ranges from Cretaceous to Quaternary sediments. A schematic stratigraphic cross- section of Inkai is presented in Figure 7-3.
Neogene-Quaternary sediments of continental origin form the uppermost cover. They do not host significant uranium occurrences. These are underlain by 100 to 150 metres of Paleogene clay-dominated marine sediments. Elsewhere in the basin, these display a lower facies transition zone of brackish sediments that hosts the uranium deposits of Tortkuduk and of the Taukent area (Kanzhugan and Moynkum).
The underlying Upper Cretaceous strata are divided into three horizons, listed from youngest to oldest: the Zhalpak horizon; the Inkuduk horizon; and the Mynkuduk horizon.
Zhalpak horizon
The Zhalpak horizon is Campanian-Maastrichtian in age, and is generally comprised of a medium grained sand, with occasional clay layers.
2024 INKAI OPERATION TECHNICAL REPORT 33
Inkuduk horizon
The Inkuduk horizon is Coniacian-Santonian in age, and is typified by medium to coarse-grained sands, with occasional gravels.
In the Inkuduk horizon, there are three sub-horizons representing indistinct transgressive alluvial cycles composed of several incomplete elementary rhythms. Lower and middle sub-horizons are composed mainly of coarse clastic sediments of channel facies while the upper sub-horizon is made of floodplain channel formations. The thickness of the Inkuduk horizon is up to 120 metres, and the depth to the bottom varies from 300 to 420 metres at the Inkai deposit, being a function of both basin architecture and the topography.
Mynkuduk horizon
The Mynkuduk horizon is Turonian in age, unconformably overlying the Permian argillites and dominated by fine to medium-grained sands. These sands are generally well sorted, reflecting a probable overbank environment.
Sediments of the Mynkuduk horizon represent an alluvial cycle of the first order where several (up to ten) elementary rhythms with a thickness up to several metres can be identified. Each of them begins with coarse, poorly sorted gravel, inequigranular sands with gravel and pebble and ends with small, clastic rocks, sometimes interbeds (up to 20 centimetres) of dense sands with carbonaceous cement. In some areas within the basal part of the horizon, mottled sandy clays and siltstones of floodplain facies are developed.
The dominating colour of the rocks is greyish-green to light-grey for the channel sand-gravel sediments. The total thickness of the sediments of the Mynkuduk horizon in the area is 60 to 80 metres.
Regular alternation of channel sediments with floodplain sediments is characteristic of lateral direction, where initial mottled and green sand-clay formations in floodplains and watersheds are replaced by channel midstream, grey bar sands.
The depth to the Paleozoic unconformity increases to the west and south. At the east end of the Mynkuduk deposit, the unconformity is at a depth of approximately 250 metres. It deepens to 350 to 400 metres where the Mynkuduk and the Inkai deposits meet, to 500 to 600 metres at the south end of Inkai, and to more than 700 metres at the Budenovskoe deposit.
2024 INKAI OPERATION TECHNICAL REPORT 34
Figure 7-3: Schematic Stratigraphic Column for the Chu-Sarysu Basin
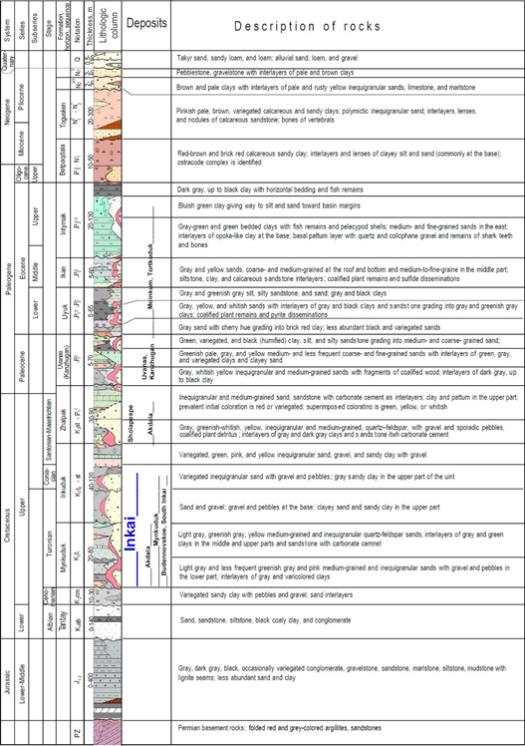
(Source: Kislyakov and Shetochkin, 2000; modified by Cameco in 2016)
2024 INKAI OPERATION TECHNICAL REPORT 35
| 7.3 | Mineralization |
| 7.3.1 | Host rocks |
Uranium mineralization in the Sat1 and Sat2 Area mostly occurs in the middle and upper parts of the Inkuduk aquifer. In the MPP Area, uranium mineralization is generally associated with the Mynkuduk aquifer.
As presented in Figure 7-4, the roll front mineralization is hosted by four horizons: the Middle Inkuduk; the Lower Inkuduk; the Upper Mynkuduk, and the Lower Mynkuduk horizons. Horizons are divided into sub-horizons as shown in Table 7-1.
Table 7-1: Horizons and Sub-horizons Division
Horizon | Horizon index | Sub-Horizon | Sub- | |||
| Middle Inkuduk | in2 | Uppermost part of Middle Inkuduk | in24 | |||
| Upper part of Middle Inkuduk | in23 | |||||
| Middle part of Middle Inkuduk | in22 | |||||
| Lower part of Middle Inkuduk | in21 | |||||
| Lower Inkuduk | in1 | Upper part of Lower Inkuduk | in12 | |||
| Lower part of Lower Inkuduk | in11 | |||||
| Upper Mynkuduk | mk2 | Upper part of Upper Mynkuduk | mk23 | |||
| Middle part of Upper Mynkuduk | mk22 | |||||
| Lower part of Upper Mynkuduk | mk21 | |||||
| Lower Mynkuduk | mk1 | Upper part of Lower Mynkuduk | mk13 | |||
| Middle part of Lower Mynkuduk | mk12 | |||||
| Lower part of Lower Mynkuduk | mk11 | |||||
2024 INKAI OPERATION TECHNICAL REPORT 36
Figure 7-4: Inkai Uranium Roll Fronts
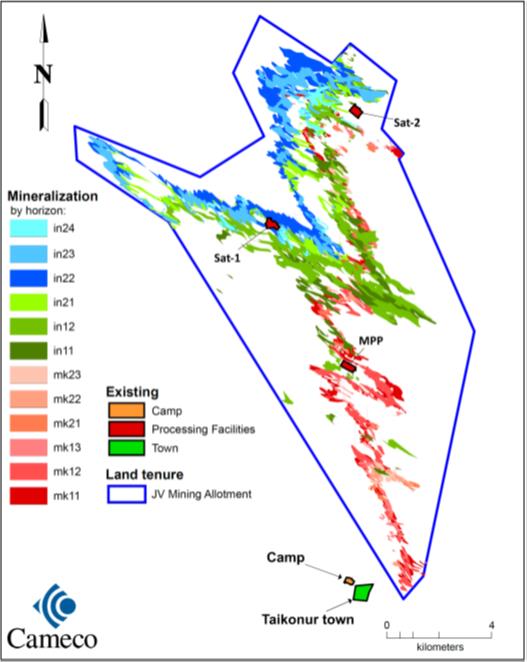
2024 INKAI OPERATION TECHNICAL REPORT 37
Regional structures in the Chu-Sarysu Basin have had some control in the development of the sedimentary facies and to the movement of uranium bearing groundwater forming the roll fronts. While the hydrostratigraphy of the Cretaceous formations are interpreted to be the primary control to mineralization, structure contour maps of the basement Palaeozoic rocks indicate that linear depressions in the surface may also play a role in overlying roll front development.
| 7.3.2 | Oxidation and mineralization |
Different lithologic and geochemical types have been studied to determine the total organic carbon and iron contents.
The zone of uranium mineralization is located along the geochemical barrier marked by the contact zone of partially oxidized rock and the reduced, primary grey-coloured rock. Iron oxides are nearly absent in this zone and organic carbon content is lower. Some associated pyrite, and sometimes carbonates can be present. Four geochemical host rock types have been identified at the deposit:
| • | diagenetically reduced grey sands and clays containing coalified plant detritus |
| • | green-grey sands and clays, reduced both diagenetically and epigenetically by gley soil (anaerobic organic) processes |
| • | non-reduced initially mottled sediments |
| • | yellow-coloured lithologies that underwent stratal epigenetic oxidation |
The initial colours are typical of channel or flood-plain facies. Diagenetically reduced grey sands and gravel of channel facies are more favourable for uranium deposition compared to greenish-grey or grey-green sands.
Occurrence and development of facies of Upper Cretaceous continental mottled alluvial formation is controlled by syn-sedimentary structures consistent with the tectonic pattern of the basin. Structural-facies control of mineralization is clearly observed in mineralization of the lower Mynkuduk horizon but is less distinct in the upper horizons.
From observations of core, the redox boundary can be readily recognized by a distinct colour change from grey and greenish-grey on the reduced side to light-grey with yellowish stains on the oxidized side, stemming from the oxidation of pyrite to limonite and consumption of organic carbon.
The propagation of the oxidation fronts is affected by hydrostratigraphy (controlling fluid paths and velocities), and rock composition (controlling redox reactions). The implied groundwater movement direction was from the southeast to northwest, leading to the formation of oxidation tongues also oriented to the northwest. It gives rise to characteristic geometries of the redox fronts and associated mineralization described in more detail in the following section.
| 7.3.3 | Geometry |
The Inkai deposit has developed along a regional system of superimposed redox fronts in the porous and permeable sand units of the Chu-Sarysu Basin. The overall strike length of the redox fronts and related mineralization envelopes at Inkai is approximately 40 kilometres. The stratigraphic horizons of interest in the basin, located between 250 and 550 metres below surface, have a combined total thickness which ranges from approximately 200 to 250 metres. Four mineralized horizons are present within the Inkai deposit MA Area:
| • | The Middle Inkuduk in the northern, central and western portion |
| • | The Lower Inkuduk in the northern, eastern and southern portion |
| • | The Upper and Lower Mynkuduk stretching from north to south in the eastern portion |
Extent and dimensions in plan view by mineralized horizon are shown in Table 7-2.
2024 INKAI OPERATION TECHNICAL REPORT 38
Table 7-2: Extent and Dimensions by Mineralized Horizon
Horizon | Strike Length (km) | Width (m) | Average Width (m) | Depth (m) | Average Depth (m) | |||||||||||||||
Middle Inkuduk | 35 | 40-1,600 | 350 | 262-380 | 314 | |||||||||||||||
Lower Inkuduk | 40 | 40-600 | 250 | 317-447 | 382 | |||||||||||||||
Upper and Lower Mynkuduk | 40 | 40-350 | 200 | 350-528 | 390 | |||||||||||||||
Morphology in plan view
In plan view, the mineralized fronts have an irregular sinuous shape, comprising of southwestern and northeastern limbs joining to form prominent northeast-oriented frontal crests and southeast-oriented posterior troughs of various scales. The wavelength of the larger-scale sinusoid varies from 1 to 5 kilometres, with the corresponding peak- to-peak amplitude varying from 2 to 10 kilometres. Often, the irregular shape of a larger scale sinusoid is further complicated by smaller scale irregular sinusoids with more variably oriented limbs, crests and troughs, with wavelengths ranging from 100 to 500 metres and amplitudes from 200 to 1,000 metres. In plan view, the width of the limbs is typically narrower than that of the frontal crests and rear troughs which usually contain most of the metal accumulations. Notable differences in the mineralization can be observed between different horizons and sub-horizons as shown in Figure 7-4.
In general, the mineralization in the Mynkuduk and Lower Inkuduk horizon is less than 40 to 100 metres wide in the limbs and can reach up to 600 metres in the crests and troughs. The mineralization in the Middle Inkuduk horizon tends to be more developed, especially in the central to northern part of the deposit where it ranges from 50 to 400 metres width in the limbs and up to 1,400 metres width in the crests and troughs.
In the Middle Inkuduk horizon, the mineralization is found in coarse sands of the main channel or streambed facies. Here, the mineralized fronts are farthest advanced to the northwest aligning with the direction of groundwater flow. In the Lower Inkuduk and Mynkuduk horizons, mineralization usually lags somewhat behind, along a complex system of superimposed suturing oxidation tongues. Stacked mineralization is also observed where it occurs in different horizons over the same area; for example, in the Sat1 and Sat2 Areas, where up to five mineralization levels can be observed.
Morphology in cross-section view
Observed roll-front morphologies shown in Figure 7-5 are classified in five major groups:
| • | simple rolls, mineralization along the nose or edge of a single oxidation tongue, including the classic C-shaped rolls (A, E and H) |
| • | cascade type, where two or more superimposed oxidation tongues form overlapping rolls (stacked mineralization) (B and D) |
| • | adjacent type, where two or more tongues develop in the same level enclosing mineralization in between (C) |
| • | combined cascade-adjacent type (G) |
| • | tabular (F) |
7.3.4 Mineralogy
Uranium
2024 INKAI OPERATION TECHNICAL REPORT 39
The main uranium minerals are sooty pitchblende (85%) and coffinite (15%). Sooty pitchblende occurs as micron-sized globules and spherical aggregates, while coffinite forms microscopic crystals. Both minerals occur in pores on interstitial materials such as clay minerals, as films around and in cracks within sand grains, and as pseudomorphic replacements of rare organic matter which is also commonly associated with pyrite. The pyrite is interpreted to have formed after the growth of pitchblende as it often coats or rims the uraniferous films and aggregates.
Other elements
Overall, elements of potential concern (EOPC) such as molybdenum (Mo), selenium (Se) and vanadium (V) occur in background levels consistent with average values for the Earth’s crustal rocks. However, elevated local vanadium and molybdenum values are sometimes observed where organic material has accumulated. The general distribution of EOPC in the roll-fronts is represented in Figure 7-6.
Authigenic minerals includes pyrite, siderite, calcite, native selenium, chlorite, sphalerite, pyrolusite and apatite.
Additional quantitative methods of analysis in mineralized and waste sands were used to study the content of rhenium, scandium, yttrium, and other rare earths.
2024 INKAI OPERATION TECHNICAL REPORT 40
Figure 7-5: Roll-Front Morphology of Mineralization
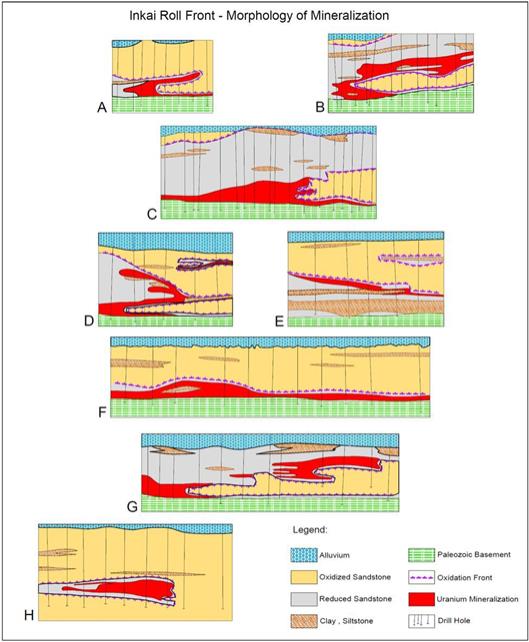
(Source: Kislyakov and Shetochkin, 2000; modified by Cameco in 2016)
2024 INKAI OPERATION TECHNICAL REPORT 41
Figure 7-6: Typical Characteristics of a Roll-Front Deposit
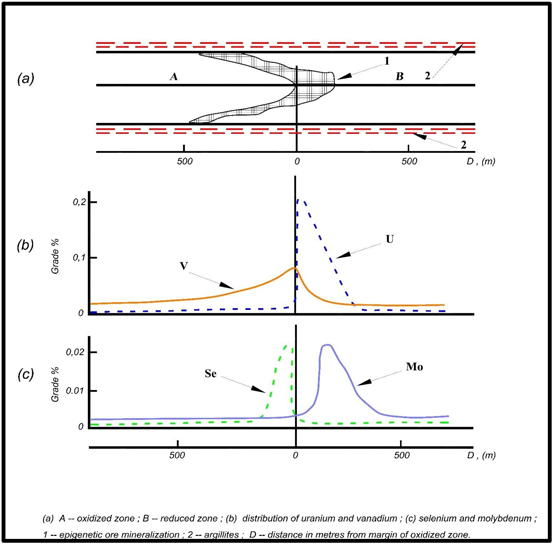
(Source: Cameco, 2017)
2024 INKAI OPERATION TECHNICAL REPORT 42
| 8 | Deposit types |
| 8.1 | Roll-front deposits of the Chu-Sarysu Basin |
The Inkai uranium deposit is a roll-front stratiform system. Roll-front deposits are a type of stratiform deposit that forms within permeable sandstones in localised reduced environments. Microcrystalline uraninite and coffinite are deposited during diagenesis by oxygenated and uraniferous groundwater, in a crescent-shaped lens that cuts across bedding and forms at the interface between oxidized and reduced lithologies. Sandstone host rocks are medium to coarse grained and were highly permeable at the time of mineralization.
They form in continental-basin margins, fluvial channels, braided stream deposits and stable coastal plains. Contemporaneous felsic volcanism or eroding felsic plutons are the typical sources of uranium. In tabular mineralization, source rocks for uranium-bearing fluids are commonly in overlying or underlying mud-flat facies sediments.
Soviet geologists established the spatial relation for this type of uranium mineralization between the boundaries of the yellow oxidized sand sediments of aquifers and unoxidized grey sand sediments in Uzbekistan in 1956. These were named “bed oxidation zones” deposits by Soviet geologists, and characterised by:
| • | hydrodynamic conditions of infiltration artesian basins |
| • | arid climate conditions during the time of mineralization |
The mineralizing system responsible for the formation of the uranium deposits in the Chu-Sarysu Basin is related to the rise of the Tien-Shan Mountains which started in the Oligocene and is still active today. (Kislyakov and Shetochkin, 2000).
The geological model for stratabound roll-front deposits incorporates the following oxidation states:
| • | Oxidized: Siderite, pyrite, biotite, chlorite and glauconite are absent in the completely oxidized zone. The mineralization contains iron hydroxides. The granular fraction includes some kaolinized feldspars. The predominant colour of the rock is yellow, ochre-yellow and orange. The completely oxidized sub-zone can extend for tens and hundreds of kilometres into the basin, measured from the outcrop at the basin margin. |
| • | Partially oxidized: In the sub-zone of incomplete oxidation, iron hydroxides occur locally, resulting in the rock having a mottled appearance. Minor quantities of plant detritus, siderite, and glauconite may be present. The predominant colours are yellowish-green and whitish-yellow. Between the zone of complete and partial oxidation, one sometimes observes a sub-zone of re-deposited red hematite ochres. The sub-zone of incomplete oxidation can extend from a few kilometres to some tens and hundreds of kilometres. |
| • | Reduced: The zone of barren grey rock has a characteristic mineral composition of rock common for the stratigraphic horizon under consideration. The colour is grey or light grey. Unoxidized pyrite and small quantities of bitumen or carbon detritus are common and contribute to the grey colour. |
The zone of uranium mineralization is located along the geochemical barrier marked by the contact zone of the partially oxidized rock and the primary reduced rock. The uranium-bearing zone generally extends for tens of metres but can extend, albeit rarely, for a few hundred metres (in cross-section across the roll front), to several kilometres along the roll-front.
The geochemical properties of the host rocks are determined by their primary composition and particle size distribution, as well as by their permeability and other hydrological characteristics. The reduced chemical state of the host rocks develops during diagenesis following deposition, or possibly as the result of later geological events, such as the introduction of hydrocarbons.
2024 INKAI OPERATION TECHNICAL REPORT 43
The reduction processes are accompanied by the development of grey, dark-grey and greenish-grey coloured host rocks. Epigenetic alteration taking place during reduction, include bituminization, carbonatization, sulphidation, argillization and decomposition of iron minerals result in bleaching of the sediments.
2024 INKAI OPERATION TECHNICAL REPORT 44
| 9 | Exploration |
The MA Area is in production. All completed exploration and delineation work in the MPP, Sat1 and Sat2 Areas is described in Section 6.2 and Section 10. No further exploration activities are planned.
2024 INKAI OPERATION TECHNICAL REPORT 45
| 10 | Drilling |
| 10.1 | Uranium exploration and delineation drilling |
JV Inkai’s uranium exploration and delineation drilling programs in the MPP, Sat1 and Sat2 Areas were conducted by drilling vertical holes from surface. Delineation of the areas and their geological and geophysical features were carried out by drilling on a grid at a prescribed density of 3.2 to 1.6-kilometre line spacing and 200 to 50-metre hole spacing with coring. Additional information was obtained by further drilling at grids of 800 to 400 x 200 to 50 metres with coring and 200 to 100 x 50 to 25 metre grids, usually without core being recovered.
Vertical holes are drilled with a triangular drill bit for use in unconsolidated formations down to the target horizon, at which point the rest of the hole is cored. At the Inkai deposit, approximately 50% of all exploration holes are cored through the entire mineralized interval. Sampling, radiometric probing, hole deviation, geophysical and hole diameter surveys are done by site crews and experienced contractors.
As the mineralized horizons are generally horizontal and the drill holes are nearly vertical, the intercepts approximate the true thickness of the mineralization.
The total number of holes drilled at Inkai is presented in Table 10-1. The locations of the drillholes are shown in Figure 10-1.
Table 10-1: Exploration and Delineation Drilling at Inkai
Type | Number of holes | |||
Historical exploration – delineation (non-JV Inkai) 1976-1996 | 3,017 | |||
Block 3 delineation 2006-2016 | 1,003 | |||
Block 2 delineation 2016-2019 | 1,207 | |||
Pre-production drilling 2013-September 30, 2024 | 922 | |||
|
| |||
Total | 6,149 | |||
|
| |||
| 10.2 | Methodology and guidelines |
The methodology of exploration-delineation programs and all related procedures for geological, geophysical, and analytical work follows the SRC guidelines for exploration and delineation of uranium deposits.
Exploration-delineation drilling programs
Historical drilling information was relied upon to estimate Inkai’s original mineral resources and reserves for the MA Area.
Additional exploration and delineation work was completed in the Sat2 Area by JV Inkai from 2006 to 2016.
A delineation and infill drilling program was completed in the Sat1 Area, by JV Inkai from 2016 to 2018. The program was designed to refine the geological model to be used for resource estimation and classification of the area.
2024 INKAI OPERATION TECHNICAL REPORT 46
From 2013 to 2024, additional pre-production drilling was conducted within the MA Area to better establish the mineralization distribution and to support further development and wellfield design.
JV Inkai’s Geology department oversaw the exploration drilling program, including the drilling program and management of contractors. JV Inkai retained a contractor, Volkovgeology, to direct and coordinate day-to-day drilling activities, and to ensure the quality of drilling, core recovery, surveying, geological logging, sampling, assaying and daily data processing. All downhole geophysical logging was performed by JV Inkai logging crews while drilling was performed by a number of contractors, supervised by Volkovgeology.
In compliance with the requirements of the SRC, drilling conducted on grids of 400 x 50 metres or greater are cored. A minimum core recovery of 70% is required in at least 70% of the drillholes for further studies. The infill drillholes in 200 x 50 metre drilling patterns consisted of predominately coreless drillholes.
| 10.3 | Core recovery |
Core recovery is generally considered to be acceptable, given the unconsolidated state of the mineralized material. Resource estimates are based on gamma log results. Core sample assays are used for correlation purposes if core recovery was at least 70%. Average core recoveries at Inkai are:
| • | MPP Area > 70% |
| • | Sat1 Area > 62% |
| • | Sat2 Area > 85% |
| 10.4 | Geophysical logging |
Downhole geophysical logging is used to inform the geological modelling, the estimation of uranium distribution and content and to characterize the hydrogeological and metallurgical characteristics. JV Inkai owns six geophysical downhole logging trucks, fully equipped for conducting the following types of data collection:
| • | radiometric probing |
| • | caliper hole deviation |
| • | resistivity and spontaneous potential |
| • | thermometry |
| • | inductive resistivity |
Radiometric, resistivity and spontaneous potential logging is conducted in un-cased drillholes over their entire length.
AtomGeo, the specialized software developed by Volkovgeology, is universally used throughout uranium mines and exploration projects in Kazakhstan. It centralizes entry, storage, processing and retrieval of drillhole-related geological information. The raw geophysical data are entered into the AtomGeo database by JV Inkai staff after validating the data.
A copy of the database is given to the Volkovgeology data processing centre in Almaty for more rigorous data processing. Correction coefficients for gamma probe readings are determined considering relevant factors, including correction for disequilibrium. Resulting equivalent U3O8 grades are then checked against the chemical assay results. A specifically formatted drillhole file is then prepared and later used in building cross-sections and plans for use in resource estimation. Volkovgeology performs this work under a separate contract with JV Inkai.
| 10.4.1 | Radiometric probing |
2024 INKAI OPERATION TECHNICAL REPORT 47
Every drillhole at Inkai is logged for total count gamma radiation which is adjusted for disequilibrium based on core assays to determine the equivalent uranium content for resource estimation. The probes use sodium-iodine crystals which are 30 x 70 millimetres in size and are shielded by lead filters 0.9 to 1.1 millimetres in thickness. The preparation of devices and equipment for operation, methods and techniques of logging are kept in strict compliance with the requirements from the instruction manuals on operation and gamma-logging. The readings are measured in micro-roentgen per hour and are taken at 10-centimetre intervals down the length of the drillhole.
The data from the gamma logging is processed and interpreted using the AtomGeo software, which uses an algorithm of differential interpretation (deconvolution), as recommended by the SRC logging instruction manual. During processing, adjustments are made for absorption of gamma radiation by mud and for moisture within the mineralization. The first adjustment is made based on the nominal diameter for the drilled mineralized intervals following verification against caliper logging measurements. A 15% adjustment for humidity is applied on the basis of numerous measurements. In addition, adjustments for radioactive equilibrium and radon release are made manually on the diagrams of differential interpretation.
| 10.4.2 | Caliper logging |
Caliper logging is performed in approximately 10% of the drillholes. Calipers are calibrated before and after each logging run by using reference rings of various diameters. When comparing the results of the calliper logging to the corresponding nominal diameters of the drillhole intervals, the difference is generally less than 2% and the standard deviations did not exceed the allowable values indicated by the instruction manual. On this basis, it was concluded that for the calculation of the gamma-ray absorption coefficient, the nominal diameter of drillholes could be used.
| 10.4.3 | Hole deviation |
Directional surveys are carried out on every drillhole at Inkai to measure the hole deviation. Survey measurements are collected every 20 metre down the length of the drillhole with a check measurement at every fifth point conducted two to three metres above the original survey point. Additional checks are conducted in cases where significant deviations occur between individual interval points. The drift indicator is calibrated at least once per month.
| 10.4.4 | Resistivity and self-polarization |
These methods are used on all holes to identify the lithologies and stratigraphic features, and to assess the permeability of the rocks in place.
| 10.5 | Factors that could materially affect the accuracy of the results |
The qualified persons responsible for this section considers that the methods and procedures used in the exploration and drilling programs were satisfactory and there are no known drilling, sampling or core recovery factors that could materially affect the accuracy and reliability of the results. For a further discussion of sampling and core recovery factors, see Section 11.
2024 INKAI OPERATION TECHNICAL REPORT 48
Figure 10-1: Drill Hole Collar Location Map
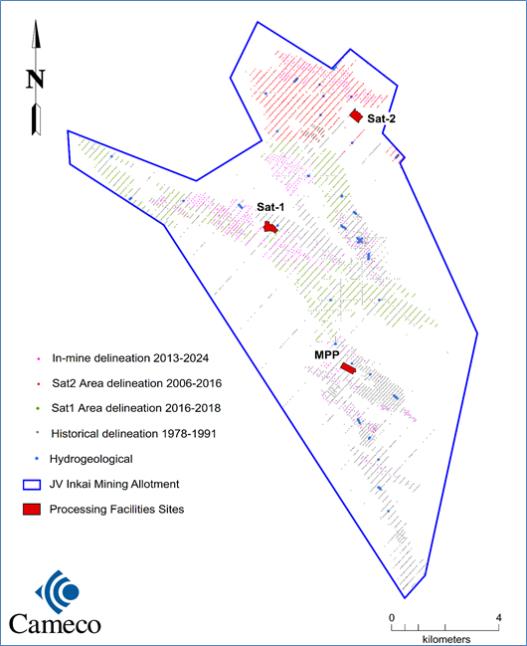
2024 INKAI OPERATION TECHNICAL REPORT 49
| 11 | Sample preparation, analyses and security |
The sampling, sample preparation, analyses and sample security used during the exploration and delineation programs followed the procedures and manuals which adhere to the requirements set out in the SRC guidelines.
| 11.1 | Sampling density |
Sampling of the mineralization is based on drilling grids that progressively tighten with increasing levels of geological knowledge and confidence. The line and drillhole spacing decreases as follows:
| • | 3.2 – 1.6 kilometres x 200 – 50 metres, all drillholes are cored through the target horizon |
| • | 800 – 400 metres x 200 – 50 metres, all drillholes are cored through the target horizon |
| • | 200 – 100 metres x 50 – 25 metres, most drillholes are coreless |
| 11.2 | Procedure for sampling and sample preparation |
Drill core is logged in log journals following the developed manuals and representative core samples are selected for the following analyses and tests:
| • | determination of the content of uranium, radium and associated elements |
| • | determination of bulk density, moisture content, porosity and acid-base balance of monolith rocks |
| • | determination of mineralization and host rock physical composition, grain size and carbonate content |
| • | column leach tests for uranium leachability |
Detailed sampling procedures guide the sampling interval within the mineralization. Where core recoveries are greater than 70% and radioactivity is greater than 40 micro-roentgens per hour, core samples are taken at irregular intervals of 0.2 to 1.2 metres. Sample intervals also are differentiated by barren or low-permeability material. The average core sample length is 0.4 metre. The sampling is conducted from half the core divided along its axis. Core diameter is 60, 70 or 100 millimetres depending on depth. The required sample weight is determined based on the length of the samples and the diameters of the core sampled.
Sample preparation and assaying are done by Volkovgeology following SRC guidelines. When core samples are being analyzed for geochemistry, they are primarily analyzed for grain size and assayed for uranium, radium, thorium, potassium and carbonate content. On selected fence lines, a more extensive study of geochemistry is undertaken.
The core samples for uranium and radium determination are taken from representative intervals. Samples are ground down to pass 1.0 mm mesh size and are subsequently subdivided until the final representative weight of samples and duplicates is reached (0.2 kilogram) at the final division stage.
Additional duplicate samples are collected by a different sampler from the second half of the core split for quality control purposes.
| 11.3 | Assaying |
The laboratory tests for uranium and radium were performed by the Central Analytical Laboratory (CAL) of JSC Volkovgeology, located in Almaty. The laboratory was certified and licensed by the National Centre for Accreditation of the Republic of Kazakhstan to comply with the STRK ISO/IEC 17025-2007 standard, Certificate number KZ.I.02.1029. Volkovgeology is a subsidiary of Kazatomprom, which is part owner of JV Inkai. The uranium content was determined using X-ray fluorescence spectrum analysis while the radium content was determined through gamma-X-ray
2024 INKAI OPERATION TECHNICAL REPORT 50
spectrum analysis. Assays from core sampling are only used for gamma probing correlation and radioactive disequilibrium determination purposes.
| 11.4 | Radioactivity, radium and equivalent uranium grades |
Each drillhole has been entirely gamma probed with the data being recorded in digital form by the logging equipment and stored in the individual drillhole files. In the anomalous zones and their vicinity, the profile of radioactivity measurements in micro-roentgen per hour, taken every 10 centimetres, were digitized. All data is stored in the AtomGeo database.
As a correlation has been established between radioactivity and radium content, it is possible to convert this radioactivity into radium grade. The process used is performed by means of AtomGeo. This program takes into account the characteristics of the drillhole (diameter, fluid density and casing), the characteristics of the surrounding ground (density) and the characteristics of each individual probe.
The conversion of radium grade into uranium grade is dependent on the radium-uranium equilibrium. A disequilibrium factor related to the interpreted location of the mineralized intervals in the roll-front is applied.
| 11.5 | Density sampling |
Density determinations are typically made on 100 to 150 samples per mineralized horizon which are analyzed using the dry bulk density method. Based on results, a constant density of 1.70 t/m3 is used for mineralized material.
| 11.6 | Quality assurance/quality control |
All drilling, logging, core drilling, and subsequent core splitting and assaying were completed under the direction of various geological expeditions of the USSR Ministry of Geology and later under the supervision of Volkovgeology.
Sampling reproducibility for the uranium and radium assays was determined by two methods: (1) having the remaining half of the core sampled by another sampler, and (2) by compositing samples consisting of the original sample rejects and samples of the remaining half of the core. The standard deviation for (1) did not exceed 12.9% for grades less than 0.012% U3O8 and 7.8% for grades greater than 0.012% U3O8 and the standard deviation for (2) did not exceed 13.4% for grades less than 0.012% U3O8 and 7.8% for grades greater than 0.012% U3O8.
In order to ensure the assay accuracy and reliability for the purposes of correlation with gamma probing and disequilibrium determination for resource estimation, the following quality controls were carried out:
| • | Source materials for logging calibration are used to test the probing equipment on a quarterly basis. The variation in gamma logging results cannot exceed +/- 5% grade-thickness, and the variation in recording electrical logging parameters does not exceed +/- 7%. Results falling outside acceptable tolerances are reviewed. |
| • | Further comparisons have been made between gamma logging data and neutron logging data to confirm the absence of systematic errors. Prompt fission neutron logging, a direct measurement method for determining uranium content, was performed for a number of drillholes as a check against gamma radioactivity-determined uranium grades, which provides an indirect measure of uranium content. |
| • | Resulting equivalent U3O8 grades are checked against the chemical assay results. |
| • | Internal laboratory control of the uranium and the radium grade determination is performed by comparing the results of the sample against its blind duplicate. The mean square error between sample and duplicate is calculated by measuring the deviation to ensure it stays |
2024 INKAI OPERATION TECHNICAL REPORT 51
within the prescribed limits. The number of control samples was approximately 9% of all samples for uranium and approximately 6% of all samples for radium. |
| • | Internal inter-method control of assays for uranium and radium were performed in the form of checks between the results of the X-ray fluorescence analysis for uranium against the results of wet chemical analyses conducted by CAL. The results of radium determination were checked against the results of radiochemical analyses also conducted by CAL. The number of control samples was approximately 12% of all samples for uranium and radium. |
| • | External (inter-laboratory) controls for the uranium and radium assays were carried out at the VIMS laboratory in Moscow, Russia, Nevskoe PGO laboratory in Saint-Petersburg, Russia and Kyzyltepageologiya Laboratory in Navoi, Uzbekistan. The number of control samples was approximately 3% of all samples for uranium and radium. |
Based on numerous QA/QC controls applied by Volkovgeology, including gamma probing correlations as well as internal checks and external inter-laboratory checks, the repeatability of the results for uranium and radium confirmed the accuracy of uranium and radium values with no significant systematic deviations identified.
Sampling and analysis procedures have been examined by Cameco and an independent consultant and found to be detailed and thorough. The qualified persons for this section have reviewed the data and are of the opinion that it is of adequate quality to be used for mineral resource and mineral reserve estimation purposes. Supporting this opinion is the fact that expected model results are within 2% of the 85% planned overall recovery.
| 11.7 | Adequacy of sample preparation, assaying, QA/QC and security |
With respect to historical Kazakhstan exploration on the MA Area, Cameco has been unable to locate the documentation on sample security. However, based on the rigorous QA/QC used in other areas of sampling, the regulations imposed by the Kazakhstan government and comparisons against current data, Cameco believes that the security measures taken to store and ship samples were of the highest quality.
The qualified persons for this section have witnessed core handling, logging and sampling at Inkai, and consider that the methodologies are satisfactory and the results representative and reliable. The qualified persons for this section are satisfied with all aspects of probing, sample preparation, assaying, QA/QC and security for samples resulting from drilling by JV Inkai and believe that the security measures taken to handle, store and ship samples are acceptable.
2024 INKAI OPERATION TECHNICAL REPORT 52
| 12 | Data verification |
The historical exploration and drillhole data, which forms part of the database used for the current mineral resource and mineral reserve estimates, included information relevant to the MPP Area of the Inkai deposit, as well as some of the data relevant to the Sat1 Area on which the historical Kazakhstan mineral resource and reserve estimate was based. This information was summarized in the “Report of the Expedition No. 7 on the First Stage of the Detailed Exploration-Delineation of the Inkai Uranium Deposit for the Period 1979–1991”, issued by Volkovgeology in 1991.
In 2002, Cameco geoscientists obtained access to the detailed dataset which included:
| • | radioactivity measurements for all anomalous zones (with their conversion into radium concentration for 159 drillholes) |
| • | geophysical graphs (radioactivity, resistivity, self-potential) |
| • | assay results (radium and uranium) from individual drillhole logs |
| • | hydraulic conductivity values in the anomalous zones |
| • | plan and section views, and tables from the report |
The following information was verified by Cameco geoscientists:
| • | lists of mineralized intervals used in the 1991 estimate |
| • | area average derivation and estimation blocks calculation tables |
| • | radioactivity measurements (and calculated radium concentrations) for the 159 drillholes |
| • | drillhole collar co-ordinates and deviations |
| • | lithology, oxidation level and hydraulic conductivity values |
| • | geological interpretations on vertical sections and plan views against drillhole data |
In addition, sampling and analysis procedures used for the MPP Area resource estimate were examined by both Cameco geoscientists and an independent consultant and found to be detailed and thorough. The relationship between radioactive readings and calculated radium grades obtained from the use of the method was studied in detail at that time, showing a good relationship between radioactivity and radium grade in most locations.
The qualified persons have reviewed the summary reports including the methodologies employed at the time and are satisfied with the quality of data used for the MPP Area estimate. Review of historical Sat1 Area drilling information, ISR test results and commercial production since 2009 in comparison to the model supports this opinion.
Following additional infill delineation, an estimate for the Sat2 Area was completed in 2017 by Two Key LLP (2K), a company contracted by JVI and summarized in “Report on the results of exploration of Block 3 of the Inkai uranium deposit with a feasibility study and the estimation of uranium resources as of 01.01.2017.”. This was followed by an estimate update in the Sat1 Area in 2020, again completed by 2K, and summarized in “Report on the results of exploration of Block 1 (north-western and central parts of the Block 1) of Inkai deposits for the period 2018-2019 with reserves calculated as of 01.01.2020”.
The following information, in digital format for both the Sat1 and Sat2 Area datasets, were reviewed and verified by the qualified persons:
| • | area average derivation and estimation blocks calculation tables |
| • | radioactivity measurements and derived uranium grades for mineralized intervals |
| • | drillhole collar coordinates and deviations |
2024 INKAI OPERATION TECHNICAL REPORT 53
| • | geological interpretations on vertical sections and plan views against drillhole data |
Minor data inconsistencies were identified during these reviews but are considered to have minimal impact on the mineral resource and/or mineral reserve estimate.
To validate the Sat1 Area and Sat2 Area GT area average estimates, 3D resource estimates were generated by both 2K and Cameco geoscientists for validation purposes which compared well on a tonnage and pounds basis.
All of the drillhole information in use at Inkai is provided to Cameco upon request. The current database has been validated a number of times by geoscientists with JV Inkai, JSC Volkovgeology, the SRC, 2K, and Cameco geoscientists. Correlation on grade-thickness from radioactivity and from radium grade (and its subsequent conversion to uranium grade based on radium-uranium equilibrium) has been reviewed by Cameco geoscientists and found to be accurate and reliable. Cameco geoscientists, including the qualified persons for this section, have witnessed or reviewed drilling, core handling, radiometric probing, logging, sampling processes and facilities used at the Inkai mine and consider the methodologies to be satisfactory and the results representative and reliable.
In consideration of the above, the qualified persons for this section are satisfied with the quality of data and consider it valid for use in the estimation of mineral resources and mineral reserves for the MA Area. Comparison of Cameco estimates against JV Inkai mineral resource and reserve models, subsequent wellfield drilling results on the MA Area, the results of the leach tests and mine production against the model estimates support this opinion.
2024 INKAI OPERATION TECHNICAL REPORT 54
| 13 | Mineral processing and metallurgical testing |
The ISR mining method at Inkai uses a sulphuric acid-based lixiviant. The resulting UBS is processed at the MPP, Sat1 and Sat2 to obtain eluate which is further processed at the MPP to currently produce uranium peroxide yellowcake.
Exploration at Inkai started in the late 1970’s involving sampling, assaying and mineralogical studies at Blocks 1, 2 and 3. Standardized column leach tests on composite samples were performed to measure average uranium UBS grades and levels of acid consumption. Uranium recoveries approaching 85% or greater were achieved with all samples.
A pilot test, using the ISR mining method, was performed in the northeast area of Block 1 starting in December 1988. The pilot leach test in Block 2 started in 2002 and was completed in 2006 while the pilot leach test in Block 3 was initiated in 2015 and completed in 2017.
Commercial production at MPP and Sat1 and Sat2 started in 2009, 2010 and 2018 respectively.
Since the MPP, Sat1 and Sat2 processing plants have been in commercial production for a significant period, validating the test work results, the qualified person for this section has determined that the metallurgical test results for these three operating process circuits are no longer significant or relevant in regard to forming the basis of future recovery assumptions and estimates.
| 13.1 | MPP, Sat1 and Sat2 processing plants |
The overall surface process recovery for MPP, Sat1 and Sat2 operations is approximately 98%. It is expected to remain at this level for the remainder of the current LOM Plan. Inkai process plant recoveries, based on the commercial production results over the years (see Figure 13-1) is included in the expected overall 85% metallurgical recovery used to support the mineral reserves (discussed further in Section 16).
Figure 13-1: Processing Plants Total Average Recovery (2015-June 30, 2024)
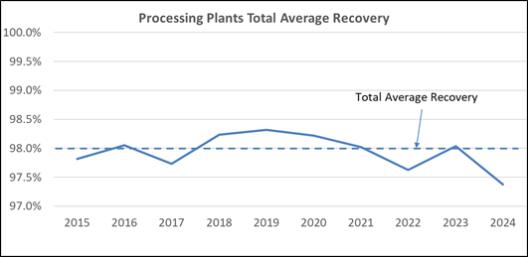
| 13.2 | Production expansion test work |
Engineering work for a process expansion of the Inkai circuit to 10.4 million pounds U3O8 per year has been completed and construction is in progress. The expansion project includes an upgrade to the yellowcake filtration and packaging units and the addition of a pre-dryer and calciner.
2024 INKAI OPERATION TECHNICAL REPORT 55
Calcination of Inkai produced uranium peroxide (i.e. UO4•nH2O) test work was completed at the Nuclear Physics Institute in Almaty, Kazakhstan in 2017 to support the design specifications for the production expansion project. The expansion project includes the addition of a pre-dryer and calciner which will convert the currently produced uranium peroxide (UO4•nH2O), a product of approximate 65 %U unit mass content, to calcine (triuranium octoxide - U3O8), a product of approximate 85 %U unit mass content. This change will significantly reduce unit transportation costs per unit mass U produced and to some extent reduce impurity content within the packaged product (i.e. primarily sulphur and nitrogen).
Differential thermal analysis (DTA), differential thermogravimetry (DTG) and time temperature transition (TTT) tests were performed on the uranium peroxide product over the required temperature range. The results of the study informed the design parameters for the required process equipment to convert the uranium peroxide to calcine product.
| 13.3 | Deleterious elements at Inkai |
As discussed in Section 7.3.4, all potential contaminants in the deposit such as molybdenum, selenium, and vanadium occur at background levels consistent with the average values for the Earth’s crustal rocks. The effect of calcium, magnesium and aluminum precipitates on permeability was also studied. It was determined that any reduction in permeability caused by the associated salts could be addressed by increasing the lixiviant acid strength.
Due to the closed-loop nature of the process, accumulation of nitrate, chloride, ferrous, ferric ions and other impurities could potentially impede surface process recovery and are monitored on a regular basis.
2024 INKAI OPERATION TECHNICAL REPORT 56
| 14 | Mineral resource estimates |
The estimated mineral resources at Inkai are located in the MA Area. The resource models were prepared by Volkovgeology and Two Key LLP following the SRC guidelines under the GKZ System. The resource estimates were approved by the SRC in 1993 for the MPP Area, in 2021 for the Sat1 Area, and in 2017 for the Sat2 Area. The current mineral resources and reserves estimates are based on 3,800 surface drillholes.
Inkai’s mineral resource estimates have been validated by Cameco. Cameco has also established an alignment of the GKZ system to the CIM Definition Standards classifications.
| 14.1 | Definitions |
The classification of mineral resources and their subcategories conform to the CIM Definitions Standards adopted by the CIM Council (as amended) which are incorporated by reference in NI 43-101. Cameco reports mineral reserves and mineral resources separately. The amount of reported mineral resources does not include those amounts identified as mineral reserves. Mineral resources, which are not mineral reserves, do not have demonstrated economic viability.
| 14.2 | Key assumptions, parameters and methods |
As illustrated in Figure 14-1, the known mineralization at Inkai occurs over three areas, referred to as the MPP, Sat1 and Sat2 Areas. Mineral resources for the three areas have been estimated following the SRC guidelines methodology.
| 14.2.1 | SRC guidelines |
All procedures for geological, geophysical and analytical work for Inkai, as well as resource estimation and classification, follow the guidelines for exploration and delineation of uranium deposits (GKZ, 1986). The guideline was first developed by the State Reserve Commission of the USSR. It was followed by the guideline issued in 2008 by the SRC, specifically developed for the roll-front uranium deposits in Kazakhstan (SRC, 2008).
The guidelines outline the main requirements and standards for exploration, delineation and related work, including:
| • | deposit classification into geological types and complexity categories |
| • | stages of exploration and delineation work |
| • | recommendations for drilling pattern geometry and densities, depending on the stage, complexity and the deposit classifications |
| • | drilling patterns required for the polygonal method of reserve estimation |
| • | geological core logging |
| • | geophysical downhole logging |
| • | content and standards of analytical work |
| • | reserve estimation procedures and data requirements |
The requirements for geophysical logging, data processing, analytical and topographic work must follow additional guidelines specifying the standards for equipment performance, QA/QC protocols and other similar items.
The SRC guidelines represent a significantly more detailed and prescriptive set of requirements in comparison to NI 43-101, the CIM Definition Standards and the CIM Estimation of Mineral Resources & Mineral Reserves Best Practice Guidelines.
2024 INKAI OPERATION TECHNICAL REPORT 57
The GKZ system, still used in Kazakhstan, is gradually being replaced by the KAZRC Code developed in 2016, which contains a checklist outlining the recommended additional criteria for estimation and reporting of uranium for in situ leaching. The checklist is consistent with the requirements of the SRC guidelines, although represents a much higher-level summary.
| 14.2.2 | Technical studies |
The regulations in Kazakhstan require that definitive mineral resource estimation reports submitted to the SRC be based on an approved set of parameters. These parameters must be substantiated in a study known as a TEO, which must be submitted and approved by the SRC. The study is required to include a mining plan, technical and economic parameters, cost estimates for capital expenditures and operating expenditures, and commodity price forecasts relevant to the deposit’s development.
The TEO corresponds to a Feasibility Study as defined in the International Reporting Template (FGU GKZ and CRIRSCO, 2010). It provides a set of parameters allowing distinguishing parts of mineralization that can be profitably extracted (the so-called “Balance” part) from parts which cannot be profitably extracted (the so-called “Off-Balance” part) at the time of estimation in accordance with technical-economic calculations carried out in the study. Cameco only uses the “Balance” part of mineralization for defining Inkai’s mineral resources and the basis for mineral reserves.
The required TEO studies were completed and approved by SRC based on the results of exploration-delineation drilling programs and accompanying studies of hydrogeological and technical characteristics, as well as laboratory column leach and field ISR tests.
The mineral resource estimation reports describe, in greater detail, the geological, hydrogeological and geotechnical characteristics of the deposit based on the results from delineation drilling, geochemical and physical analyses, geophysical studies, and the laboratory and field ISR tests. They also detail the delineation and the grade x thickness (GT) area average resource estimation method.
| 14.2.3 | Key assumptions and parameters |
The key assumptions and parameters used to estimate the mineral resources are as follows:
| • | mineral resources have been estimated based on the use of the ISR extraction method |
| • | reported mineral resources do not include allowances for metallurgical recovery but include some allowances for dilutive material expected under leaching conditions |
| • | grades of U3O8 were obtained from equivalent %U3O8 grades based on gamma radiometric probing of drillholes, checked against assay results and prompt-fission neutron logging results to account for disequilibrium |
| • | average density of 1.7 tonnes per cubic metre was used, based on historical and current sample measurements |
| • | a resource block must be confined to one aquifer taking into consideration the distribution of local aquitards |
| • | reasonable expectation for eventual economic extraction of the mineral resources is based on a uranium price of $62 (US) per pound U3O8, anticipated exchange rates, mining and process recoveries, production costs, royalties and mineralized area tonnage, grade, and spatial continuity considerations. |
Additional key parameters based on SRC guidelines, including cut-offs, are listed in Table 14-1.
2024 INKAI OPERATION TECHNICAL REPORT 58
Table 14-1: Cut-offs and Additional Estimation Parameters
Parameter | Value | |
| Minimum grade to define the mineralized intervals | 0.012% U3O8 | |
| Minimum GT cut-off per hole per productive horizon to define the limits of estimation block | ||
• MPP Area | 0.071 m% U3O8 | |
• Sat1 and Sat2 Areas | 0.047 m% U3O8 | |
| Minimum GT cut-off for an estimated block | 0.130 m% U3O8 | |
| Maximum thickness of barren intervals to be included | ||
• per hole | 1 m | |
• per C1 category block | 6 m | |
• per C2 category block | No limit | |
| Minimum percent of above cut-off holes per estimated block | 75% | |
| Minimum size of a standalone estimated block | 40,000 m2 | |
| Maximum size of estimated block | 300,000 m2 | |
| Content of silt-clay of size < 0.05 mm in mineralized intervals | < 30% | |
| Carbonate content per estimation block, CO2 equivalent | < 2% | |
| Minimum hydraulic conductivity | 1.0 m per day |
| 14.2.4 | Key methods |
The key methods used to estimate the mineral resources are as follows:
| • | geological interpretation of the orebody was done in section and plan views derived from surface drillhole information |
| • | mineral resources were estimated with the GT area average method, where the estimated variable is the uranium grade multiplied by the thickness of the interval, and using averages for the blocks |
| • | the metal content per block is estimated considering average grade, thicknesses and density and multiplying by an ore/waste factor |
The geological modelling and mining applications used were AtomGeo, MapInfo and Micromine.
| 14.3 | Resource classification |
In Kazakhstan, mineral resources and reserves are classified according to the 1981 “System of Classification of Reserves and Resources of Mineral Deposits” (GKZ). The SRC uses the GKZ system.
The categories are denoted in the order of decreasing geological confidence as A, B, C1, C2, and P1. The KAZRC Code provides a useful frame of reference in converting the resource categories of the GKZ system to other national systems, including the CIM system.
The GKZ system B, C1 and C2 categories were aligned with the CIM Definition Standards by Cameco. As a starting point, B is aligned to measured while the C1 category can be aligned to the measured or indicated resource category and the C2 category to the indicated or inferred resource categories. Additional criteria, on the basis of sampling density, interpretation of geological continuity and grade continuity and content of barren material between mineralized intervals, was applied by Cameco.
The classification criteria applied for alignment with the CIM Definition Standards for the mineral resources categories are as follows:
2024 INKAI OPERATION TECHNICAL REPORT 59
Measured mineral resources: Drilling density equivalent to or denser than a 200 x 50 metre grid spacing (or 1 drillhole per hectare) for mineralization zones characterized by a uniform and easily correlatable morphology, from one fence line to another. The barren volume included into the resource block does not exceed 40%. Mineralization must be continuous between fences. If a resource block is defined by three fence lines, more than one mineralized drillhole must occur on each delimiting fence. The hydrogeological properties of the hosting horizon is studied by aquifer pump tests. Sampling for grain size and carbonate content of the mineralization is available from core drilling on at least 400 x 50 metre grid density. The amenability of mineralization to ISR mining is demonstrated by laboratory and field ISR leach tests or mining operation results. Mineralization is characterized by sufficient confidence in geological interpretation to support detailed wellfield planning and development with no or very little changes expected from additional drilling.
Indicated mineral resources: Drilling density is sparser than 200 x 50 metres, but denser than 400 to 600 x 50 to 100 metres for mineralization zones characterized by relatively uniform and correlatable morphology. In some areas, resource blocks may be drilled on 200 by 50 metre spacing but not meet the additional criteria for measured resources due to continuity, uniformity and confidence in geological interpretation. The hydrogeological properties of the hosting horizon is studied by aquifer pump tests. Sampling for grain size and carbonate content of the mineralization is available from core drilling on at least a 600 x 100 metre grid density. The amenability of mineralization to ISR mining is demonstrated by laboratory and field ISR leach tests or mining operation results. Mineralization is characterized by sufficient confidence in geological interpretation to support wellfield planning and development albeit with some changes expected from additional drilling.
Inferred mineral resources: Drilling grid defining mineralization is sparser than 400 to 600 x 50 to 100 metres, but denser than 800 x 100 metres. Resource blocks defined in areas drilled with denser than 400 to 600 x 50 to 100 metres but not meeting the additional criteria for higher categories for continuity, uniformity and confidence in geological interpretation. The hydrogeological properties of the hosting horizon is studied by aquifer pump tests. Sampling for grain size and carbonate content of the mineralization is available from core drilling on at least an 800 x 200 metre grid density. The amenability of mineralization to ISR mining must be demonstrated by at least laboratory leach tests. Mineralization is characterized by insufficient confidence in geological interpretation to support wellfield planning and development due to significant changes expected from additional drilling.
Figure 14-1 shows a plan view of the total mineral resources, inclusive of mineral reserves, under the CIM Definition Standards within the MA Area.
2024 INKAI OPERATION TECHNICAL REPORT 60
Figure 14-1: Total Inkai Mineral Resources by CIM Categories
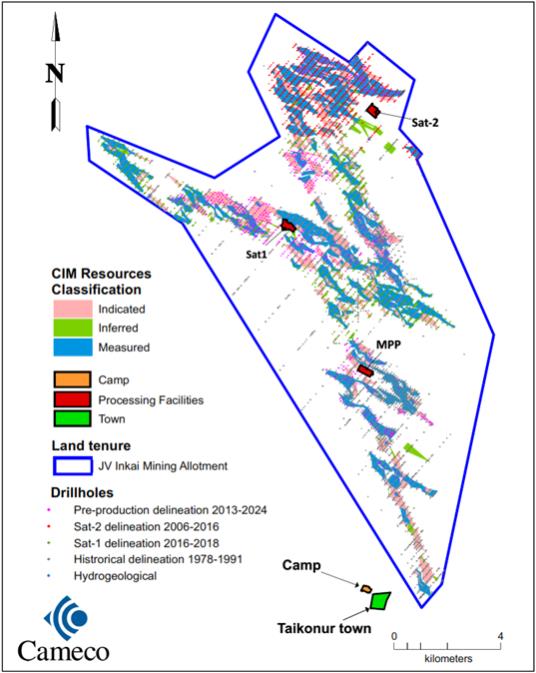
2024 INKAI OPERATION TECHNICAL REPORT 61
| 14.4 | Mineral resource estimate and classification |
A summary of the Inkai mineral resource estimates, with an effective date of September 30, 2024, is shown in Table 14-2. C. Scott Bishop, P. Eng., Sergey Ivanov, P. Geo., and Al Renaud, P. Geo., each with Cameco, are the qualified persons within the meaning of NI 43-101 for the purpose of the mineral resource estimates.
Table 14-2: Inkai Mineral Resources – as of September 30, 2024
Category | Area | Total tonnes (x 1,000) | Grade % U3O8 | Total M lbs U3O8 | Cameco’s share M lbs U3O8 | |||||||||||||
Measured | MPP | 6,007.7 | 0.04 | 5.9 | 2.4 | |||||||||||||
| Sat1 | 40,387.5 | 0.04 | 31.9 | 12.8 | ||||||||||||||
| Sat2 | 29,527.9 | 0.03 | 20.3 | 8.1 | ||||||||||||||
Total Measured | 75,923.1 | 0.03 | 58.2 | 23.3 | ||||||||||||||
Indicated | MPP | 14,327.5 | 0.03 | 8.5 | 3.4 | |||||||||||||
| Sat1 | 32,960.4 | 0.03 | 19.7 | 7.9 | ||||||||||||||
| Sat2 | 16,200.5 | 0.02 | 6.3 | 2.5 | ||||||||||||||
Total Indicated | 63,488.4 | 0.02 | 34.5 | 13.8 | ||||||||||||||
|
|
|
|
|
|
|
| |||||||||||
Total Measured & Indicated | 139,411.5 | 0.03 | 92.7 | 37.1 | ||||||||||||||
|
|
|
|
|
|
|
| |||||||||||
Inferred | MPP | 7,709.8 | 0.02 | 4.2 | 1.7 | |||||||||||||
| Sat1 | 12,442.5 | 0.02 | 6.6 | 2.6 | ||||||||||||||
| Sat2 | 13,589.9 | 0.04 | 11.5 | 4.6 | ||||||||||||||
|
|
|
|
|
|
|
| |||||||||||
Total Inferred | 33,742.2 | 0.03 | 22.3 | 8.9 | ||||||||||||||
|
|
|
|
|
|
|
| |||||||||||
Notes:
| (1) | Cameco reports mineral reserves and mineral resources separately. Reported mineral resources do not include amounts identified as mineral reserves. Totals may not add up due to rounding. |
| (2) | Mineral resources that are not mineral reserves do not have demonstrated economic viability and/or are outside the term of the current RUC ending in mid-2045. |
| (3) | Cameco’s share is 40% of total mineral resources. |
| (4) | Inferred mineral resources are estimated using limited geological evidence and sampling information. We do not have enough confidence to evaluate their economic viability in a meaningful way. You should not assume that all or any part of an inferred mineral resource will be upgraded to an indicated or measured mineral resource, but it is reasonably expected that the majority of inferred mineral resources could be upgraded to indicated mineral resources with continued exploration. |
| (5) | Reasonable prospects for eventual economic extraction of the mineral resources is based on a uranium price of $62 (US) per pound U3O8, anticipated exchange rates, mining and process recoveries, production costs, royalties and mineralized area tonnage, grade, and spatial continuity considerations. |
| (6) | Mineral resources have been estimated at minimum grade-thickness cut-offs per hole of 0.047 m%U3O8 for the MPP Area and 0.071 m%U3O8 for Sat1 and Sat2 Areas, with the GT area average method using 2-dimensional block models. |
| (7) | The geological model used for Inkai involves geological interpretations on section and plan derived from surface drillhole information. |
| (8) | Mineral resources have been estimated with no allowance for mining recovery but include some |
2024 INKAI OPERATION TECHNICAL REPORT 62
| allowances for dilutive material expected under leaching conditions. |
| (9) | Mineral resources were estimated based on the use of the ISR extraction method. |
| (10) | Other than the risk associated with failing to extend the term of the RUC beyond mid-2045, there are no known environmental, permitting, legal, title, taxation, socio-economic, political, marketing or other relevant factors that could materially affect the above estimate of mineral resources. |
| 14.5 | Factors that could materially affect the mineral resource estimate |
As is the case for most mining projects, the extent to which the estimate of mineral resources may be affected by environmental, permitting, legal, title, taxation, socio-economic, political, marketing or other relevant factors could vary from material gains to material losses. The qualified persons responsible for this section are not aware of any relevant factors that could materially affect Inkai’s mineral resource estimate except for that listed below.
Duration of Resource Use Contract term
Production variances of +/-20% are allowed under the RUC work program, but under the current LOM plan and PUDD, the majority of mineral resources would be mined after the term of the RUC ends in mid-2045. While the current regulatory framework provides rights for Inkai to apply for an extension to the RUC term, failure to obtain the extension would result in the loss of remaining mineral resources.
2024 INKAI OPERATION TECHNICAL REPORT 63
| 15 | Mineral reserve estimates |
The Inkai mineral reserve estimates have been reviewed and verified by Cameco. Verification of the MPP Area estimate was performed by an independent consulting firm in 2005. Also, for the Sat1 and Sat2 Area GT area average estimates, three dimensional estimates were generated by both 2K and Cameco for validation purposes, which compared well on both a tonnage and pounds basis.
Inkai’s mineral reserves include allowances for the barren material that will be contacted by the leaching solutions, an approach similar to dilution in hard rock mining. The wellfield uranium recovery is part of the reported metallurgical recovery and is described in Section 16. Stated mineral reserves are derived from estimated quantities of mineable mineral resources by the ISR method during the term of the RUC. Only the measured and indicated mineral resources were considered for conversion to mineral reserves.
| 15.1 | Definitions |
CIM Definitions
The classification of mineral reserves and the subcategories of each conform to the definitions adopted by the Canadian Institute of Mining, Metallurgy and Petroleum (CIM) Council (as amended), which are incorporated by reference in NI 43-101.
Dilution
In ISR, the lixiviant cannot be precisely confined to the limits of mineralized volume of rock. It is rather controlled by the hydrostratigraphy of the productive horizons, the placement of screens and the balance between injector and producer wells. Dilution results in additional volume of rock mass that has to be acidified and leached relative to the mineralized rock volume. Dilution is accounted for by using permeable thickness and corresponding screen lengths at the mine planning step to provide the diluted volume of rock that is subject to acidification and leaching.
Recovery
In the ISR process, some quantity of mineralization cannot be extracted from the ground due to a number of geological, mining and metallurgical factors. These include, for example, the formation of stagnant zones, reduced permeability due to plugging of pore spaces, re-precipitation of some uranium in the leach zones, screen location in relation to mineralization and hydrogeological settings or unfavorable host rock composition, and residual uranium remaining in the lixiviant returned to wellfields after extraction at the processing facilities. In practice, it is difficult or impossible to accurately establish the share of each of the above contributors to the total loss pertinent to the in situ leaching process. The total losses can nevertheless be established based on the results of laboratory leach tests, field ISR tests and production reconciliation which all provide the basis for expected wellfield recovery. The recovery expected from the in situ leaching process is included as part of the overall metallurgical recovery.
Inkai has been in commercial production since 2009 and during this time achieved recoveries are 86.1, 87.4 and 87.5% for the MPP, Sat1 and Sat2 Areas, respectively. These results validate the 85% metallurgical recovery used to support the mineral reserves. See Section 16.3 for additional information.
| 15.2 | Key assumptions, parameters and methods |
Mineral reserves are based on estimated quantities of mineral resources economically recoverable by the ISR mining method producing UBS that is recovered at the MPP, Sat1 and/or Sat2 processing plants. In order to convert mineral resources to mineral reserves, a viable mine plan and
2024 INKAI OPERATION TECHNICAL REPORT 64
realistic allowances for recovery and dilution are applied. The current mining plan has been designed to extract the mineral reserves from Inkai through mid-2045.
| 15.2.1 | Key assumptions and parameters |
The key assumptions and parameters used to estimate the mineral reserves are as follows:
| • | mineral reserves represent the in situ ore available for production within the term of the RUC. |
| • | reserves-based annual production varies between 7.7 million pounds and 10.4 million pounds. Average estimated operating costs of $12.66 per pound U3O8 are based on the reserves-based production plan. |
| • | dilutive material is included in reported mineral reserves. Dilution, comprising approximately 40% of the total diluted tonnage, is based on permeability and planned screen lengths and represents the rock volume contacted by the lixiviant. The diluted tonnage is used to generate the wellfield uranium recovery curves and production forecasts. |
| • | reported mineral reserves are not adjusted for the estimated metallurgical recovery of 85%. For wellfields started close to the end of the RUC term, the target recoveries of 85% are not expected to be achieved. |
| • | an average uranium price of $54 (US) per pound U3O8, with exchange rates of $1.00 US=$1.26 Cdn and $1.00 US=450 Kazakhstan Tenge was used to estimate the mineral reserves. |
| • | a cut-off for the mineral reserves of 0.13 m%U3O8 is applied on the estimated GT value for each block of the mineral resources model. The cut-off is determined with consideration to: |
| • | uranium price |
| • | wellfield development and operating costs defined by depth, acid consumption, wellfield pattern layouts, and metallurgical recovery |
| • | UBS processing costs |
| • | the reference point at which Inkai’s mineral reserves are defined is the point where the mineralization occurs under the existing or planned wellfield pattern. |
| 15.2.2 | Key methods |
The key methods used to estimate the mineral reserves are as follows:
| • | only indicated and measured mineral resources are considered for conversion to mineral reserves |
| • | cut-off criteria applied to identify areas for mining, including consideration of the rate of wellfield uranium recovery, lixiviant uranium head grades, wellfield flow rates and production requirements to define the production sequence |
| • | preparation of a feasible mining plan with required infrastructure, reclamation costs as well as other relevant factors |
| • | submittal of appropriate documentation for regulatory approval |
The geological and mining applications used were AtomGeo, MapInfo and Micromine.
| 15.3 | Mineral reserve estimate and classification |
The mineral reserves classification follows CIM definitions, where economically mineable measured and indicated mineral resources can be converted to proven and probable mineral reserves, but inferred mineral resources cannot be reported as mineral reserves. Overall metallurgical recovery of 85% has been applied in the economic model.
The Inkai mineral reserves estimates, with an effective date of September 30, 2024, are shown in Table 15-1. C. Scott Bishop, P. Eng., Sergey Ivanov, P. Geo., and Al Renaud, P. Geo., each with
2024 INKAI OPERATION TECHNICAL REPORT 65
Cameco, are the qualified persons within the meaning of NI 43-101 for the purpose of the mineral reserve estimates.
Table 15-1: Inkai Mineral Reserves – as of September 30, 2024
Category | Area | Total tonnes (x 1,000) | Grade % U3O8 | Total M Lbs U3O8 | Cameco’s share M Lbs U3O8 | |||||||||||||
Proven | MPP | 50,340.9 | 0.04 | 46.1 | 18.4 | |||||||||||||
| Sat1 | 149,812.3 | 0.03 | 105.7 | 42.3 | ||||||||||||||
| Sat2 | 77,079.7 | 0.03 | 51.8 | 20.7 | ||||||||||||||
|
|
|
|
|
|
|
| |||||||||||
Total Proven | 277,232.9 | 0.03 | 203.6 | 81.4 | ||||||||||||||
|
|
|
|
|
|
|
| |||||||||||
Probable | MPP | 25,484.7 | 0.03 | 18.3 | 7.3 | |||||||||||||
| Sat1 | 48,763.1 | 0.02 | 23.4 | 9.4 | ||||||||||||||
| Sat2 | 16,603.0 | 0.02 | 8.4 | 3.3 | ||||||||||||||
|
|
|
|
|
|
|
| |||||||||||
Total Probable | 90,850.8 | 0.03 | 50.0 | 20.0 | ||||||||||||||
|
|
|
|
|
|
|
| |||||||||||
Total Reserves | 368,083.7 | 0.03 | 253.6 | 101.5 | ||||||||||||||
|
|
|
|
|
|
|
| |||||||||||
Notes:
| (1) | Cameco reports mineral reserves and mineral resources separately. Totals may not add up due to rounding. |
| (2) | Total pounds U3O8 are those contained in mineral reserves and are not adjusted for the estimated metallurgical recovery of 85%. |
| (3) | Cameco’s share is 40% of total mineral reserves. |
| (4) | Mineral reserves have been estimated at a grade-thickness cut-off of 0.13 m%U3O8 using the GT area average method on a block basis. |
| (5) | Mineral reserves have been estimated based on the use of the ISR extraction method. |
| (6) | Mineral reserves have been estimated with an average allowance of 40% dilution at 0% U3O8, representing the rock volume contacted by the lixiviant. |
| (7) | Mineral reserves were estimated based on existing or planned wellfield patterns required to achieve production varying between 7.7 to 10.4 million pounds U3O8 per year within the term of the RUC. |
| (8) | An average uranium price of $54 (US) per pound U3O8 with exchange rates of $1.00 US=$1.26 Cdn and $1.00 US=450 Kazakhstan Tenge was used to estimate the mineral reserves. |
| (9) | Other than the risks described in Section 15.4, there are no known mining, metallurgical, infrastructure, permitting or other relevant factors that could materially affect the above estimate of mineral reserves. |
| 15.4 | Factors that could materially affect the mineral reserve estimate |
The qualified persons responsible for this section are not aware of any relevant factors that could materially affect the mineral reserve estimate, except for that listed below.
Duration of Resource Use Contract term
Mineral reserves represent anticipated production of in situ uranium over the term of the RUC, ending in mid-2045. A portion of the JV Inkai mineral resources could be converted into mineral reserves if the RUC term were to be extended beyond 2045. The magnitude of impact to the mineral reserves would be directly related to the duration of the RUC term extension. While Inkai has the right to apply for an extension to the RUC, there is no guarantee that it will be granted.
2024 INKAI OPERATION TECHNICAL REPORT 66
| 16 | Mining methods |
| 16.1 | Hydrogeology |
16.1.1 Local hydrogeology
The unconsolidated Upper Cretaceous sediments provide an excellent groundwater-storing reservoir, some 250 to 300 metres thick. This reservoir is regionally confined by the underlying Paleozoic rocks and the overlying thick Paleogene marine clays (Intymak, Uyuk and Ikan aquitards). To varying degrees, there is local confinement created by the sedimentation cycles, with each cycle including fine sands to silts and occasional clay seams at the top.
The Upper Cretaceous groundwater regime exhibits a layered sequence of aquifers due to gravity separation controlled by their respective salinity levels, or TDS. At Inkai, from youngest to oldest, top to bottom these are:
| • | Uvanas & Betpak-Dala fresh water (0.6 – 0.8 g/L TDS) aquifer |
| • | Zhalpak brackish water (1.1 – 1.5 g/L TDS) aquifer |
| • | Inkuduk salt water (2.3 – 3.6 g/L TDS) aquifer |
| • | Mynkuduk salt water (2.7 – 4.5 g/L TDS) aquifer |
The confined Upper Cretaceous aquifers produce artesian conditions where the topography is situated below the piezometric surface. The general water table is at a depth of eight to ten metres below surface at Inkai.
The Inkai deposit includes the lower hydrogeological sub-stage (Paleocene and Upper Cretaceous). The hydrogeological conditions for the Quaternary-Upper Eocene sediments are not described here because aquifers of the upper sub-stage are not hydraulically connected to the Inkai deposit (Volkovgeology, 2007, 2015).
The typical feature of the Upper Cretaceous aquifers (Zhalpak, Inkuduk and Mynkuduk) is a quasi-uniform lateral structure with locally high heterogeneity. Thus, at the pumping test scale, lateral hydraulic properties vary little, even though borehole logs reveal sediments of very different grain sizes. All of these aquifers present a vertical anisotropy due to low permeability lenses and thin layers between the aquifers and sub-horizons.
Intymak aquitard (Middle to Upper Eocene)
The Intymak aquitard is composed of intercalated greenish-grey, bluish-grey and rarely massive marine clays, varying in thickness from 70 to 120 metres. Intymak clays outcrop immediately to the north-west of the Sat2 Area in the Batykaryn river terrace. The Intymak clays comprise a regional aquitard in the Chu-Sarysu Basin.
Uyuk-Ikan aquitard (Lower Eocene)
The Uyuk-Ikan aquitard is represented by massive grey and greenish-grey marine clays. The thickness varies from 22 metres in the northern part to 70 metres in the southern part of the MA Area.
Uvanas and Byurtusken aquifers (Lower Paleocene)
The thickness of the Uvanas and Byurtusken aquifers varies from 15 metres in the northern portion of the MA Area and up to 80 metres in the south and southeast, beyond the deposit boundary. At Inkai, the aquifers occur at depths of 170 to 280 metres and have a thickness from 20 to 30 metres. Water-bearing sediments are characterized by fine to medium grained sands.
Based on 15 single borehole pumping tests at the MPP and Sat1 Areas and five multi-well pump tests in the Sat2 Area, the calculated transmissivity of the Uvanas and Byurtusken aquifer varies
2024 INKAI OPERATION TECHNICAL REPORT 67
from 47 to 168 m2/d, with horizontal hydraulic conductivity between 2.4 and 8.6 m/d. Borehole yields were 1.6 to 11.0 L/sec.
Zhalpak aquifer (Campanian-Maastrichtian)
The depth to the bottom of the Zhalpak aquifer varies from 195 metres in the northern part to 270 metres in the central part, and to 355 metres in the southern part of the MA Area. The aquifer thickness is 40 to 60 metres. Water-bearing sediments are fine and medium-grained sands with gravels. In the top of the Zhalpak Formation, there is a one to ten metre layer of clays and fine sands that separates the Zhalpak aquifer from the overlying Uvanas aquifer. This layer is assumed to be the Upper Zhalpak aquitard. There are clays and argillaceous sands underlying the Zhalpak aquifer that serve as local aquitards. These low permeability sediments are somewhat discontinuous; therefore, some hydraulic connection between the Zhalpak and underlying aquifers is possible.
The hydraulic properties of the Zhalpak aquifer were characterized by 10 pumping tests within the Sat1 Area, and seven pumping tests within the Sat2 Area. The estimated transmissivity varies from 226 to 575 m2/d, with an average value of 413 m2/d. Elsewhere in the mine, transmissivities of the Zhalpak aquifer were estimated within a similar range for the Sat1 Area. Horizontal hydraulic conductivities in the Sat1 Area were estimated at the range 5.5 to 11.4 m/d, with an average value of 8.9 m/d.
Inkuduk aquifer (Upper Turonian-Santonian)
The top of the Inkuduk aquifer is located at an approximate depth of 250 to 380 metres, with an average thickness between 110 and 130 metres. The aquifer contains fine to coarse-grained sands, gravels and pebbles. Three sub-layers within the aquifer are present and in descending order, can be characterized as: sands with clay lenses, fine and medium-grained sands, and sands with gravels and pebbles.
These sub-layers are not always present, and there are no clear boundaries between them. Northeast of the Sat1 Area and the MPP, the clay content slightly increases in all sub-layers. Clay lenses typically separate the Inkuduk aquifer from the upper and lower horizons. This aquifer hosts a portion of the mining zone. In the Sat1 and Sat2 Areas, uranium mineralization occurs within the middle and lower parts of the Inkuduk aquifer down to depths of 270 to 370 metres, depending on local conditions.
The Inkuduk aquifer is characterized by 27 borehole tests conducted by Volkovgeology prior to 1991, and 38 borehole tests comprising eight cluster aquifer pump tests, as well as 28 single well tests conducted in the Sat2 Area from 2010 to 2013 by Volkovgeology, under contract with JV Inkai. Horizontal hydraulic conductivities obtained from different parts of test interpretation graphs were between 6.3 and 22.8 m/d, with 80% of values in the range 10 to 18 m/day.
Borehole yields for the Inkuduk aquifer in the Sat1 Area vary between 3.2 and 18.3 L/sec, and specific borehole yields vary between 0.8 and 2.4 L/sec. Generally, hydrogeological tests revealed that horizontal hydraulic conductivities of the Inkuduk aquifer were consistent through the whole cross-section. Hydraulic conductivity of the lower sub-horizon was estimated in the range of 9.2 to 16.1 m/d; for the middle sub-horizon, 11.8 to 15.8 m/d; and approximately 13 m/d for the upper sub-horizon. Transmissivities for different sub-horizons were estimated, on average, as 472 m2/d, 613 m2/d, and 336 m2/d for the lower, the middle, and the upper horizons, respectively.
Mynkuduk aquifer (Lower Turonian)
The top of the Mynkuduk aquifer is encountered at depths of 360 to 370 metres, with a thickness of 30 to 40 metres in the northeast, increasing to 70 to 90 metres in the south-west. The average thickness of the aquifer in the Sat1 Area is 48 metres.
2024 INKAI OPERATION TECHNICAL REPORT 68
The aquifer lies on the Paleozoic argillaceous sediments which act as a regional aquitard. The water-bearing sediments are comprised of sands of various grain sizes with clays, gravels and pebbles. Generally, coarse sand and gravel fractions are associated with the upper part of the aquifer, while more clayish fractions are associated with the lower part of the aquifer. Towards the north-east of the Sat1 Area, the clay content slightly increases in all sub-layers, particularly in the upper sub-horizon of the Mynkuduk aquifer.
The Mynkuduk aquifer in the MPP Area is characterized by 95 boreholes, 20 hydrogeological single borehole tests, 36 multi-borehole tests and five injection tests. Borehole yields vary from 1.5 to 16.7 L/sec, with borehole specific yields between 0.2 to 2.6 L/sec.
Horizontal hydraulic conductivities at the deposit area vary from 7.1 to 13 m/d, with the average value of 10.9 m/d. Site transmissivities vary between 394 and 694 m2/d, with the average value of 564 m2/d. The Sat1 Area was characterized by 20 borehole tests prior to 1991.
Resulting horizontal hydraulic conductivities are generally higher in the Sat1 Area compared to the MPP Area, with values varying between 7.4 and 17.3 m/d, and an average value of 13 m/d. Transmissivities obtained from pumping tests in the Sat1 Area were in the range 460 to 755 m2/d.
Vertical hydraulic conductivities were not well-defined during exploration activities. They were calculated through calibration of the regional groundwater flow model by Geolink.
Prevailing values of both horizontal and vertical hydraulic conductivities used by Geolink for the regional groundwater flow model are shown in Table 16-1.
Table 16-1: Hydraulic Conductivity
Model | Hydraulic conductivity (m/d) | |||||
Aquifer/Aquitard | Horizontal | Vertical | Anisotropy ratio | |||
Uvanas | 4.0 | 0.62 | 6 : 1 | |||
Upper Zhalpak aquitard | 1 x 10⁻⁵ | 2.5 x 10⁻⁵ | 1 : 2.5 | |||
Zhalpak | 14.6 | 0.023 | 635 : 1 | |||
Upper Inkuduk | 3.0 | 0.5 | 6 : 1 | |||
Middle Inkuduk | 10.5 | 0.5 | 20 : 1 | |||
Lower Inkuduk | 14.4 | 0.5 | 30 : 1 | |||
Upper Mynkuduk | 10.7 | 1.0 | 10 : 1 | |||
Lower Mynkuduk | 10.3 | 1.0 | 10 : 1 | |||
Calibrated values of horizontal hydraulic conductivity are generally higher than vertical hydraulic conductivity values by about one order of magnitude, with the exception of the Zhalpak aquifer. This aquifer has discontinuous lenses of low-permeable clays and argillaceous sands with a calculated anisotropy ratio of 635:1.
16.1.2 Hydraulic connectivity
The Uvanas aquifer, confined by 100 to 150 metres of clays, is generally considered hydraulically isolated from the overlying Betpak-Dala aquifer. The Geolink model indicates that minor hydraulic connection is present at the northern flank of the Sat1 Area, likely due to open exploration wells in the area.
The aquifers of the lower hydrogeological sub-stage are hydraulically connected. These connections are most prevalent between three lower aquifers (the Zhalpak, the Inkuduk and the Mynkuduk). Based on borehole logs and geophysical results, these are comprised of clay lenses and by sediments with higher clay contents that do not form continuous low-permeability layers. Hydraulic connection between these aquifers were confirmed by pumping tests conducted by Volkovgeology and KAPE.
2024 INKAI OPERATION TECHNICAL REPORT 69
The hydraulic connection of the Uvanas aquifer with the underlying aquifers is hindered by the presence of a thin (one to ten metre) layer of low-permeable deposits in the upper part of the Zhalpak aquifer. Previous site study results initially concluded that these two aquifers are considered hydraulically isolated. However, subsequent site studies indicate that some hydraulic connections may occur locally.
Piezometric levels of the Uvanas aquifer are very close to that of the Zhalpak aquifer (less than 10 to 20 centimetres difference) with both aquifers showing continued synchronous decreases. This suggests a hydraulic connection between the aquifers in the lower hydrogeological sub-stage. However, the degree of interconnection between the Uvanas-Zhalpak aquifers is significantly less than between the Zhalpak-Inkuduk and the Inkuduk-Mynkuduk aquifers.
16.1.3 Piezometric measurements
The majority of water level measurements taken in the MPP Area were taken in the Mynkuduk aquifer, while measurements in the Sat1 and Sat2 Areas were taken in the Inkuduk and Zhalpak aquifers. Overall, piezometric data indicate that the Uvanas, Zhalpak, Inkuduk and Mynkuduk aquifers are confined, with piezometric levels varying from approximately 20 metres above ground surface in the southeast to about 20 metres below ground surface in the north and north-west. The horizontal hydraulic gradients at Inkai are relatively small (e.g., 2 to 3 x 10⁻⁴). Estimated lateral groundwater velocity is approximately 0.5 to 3.0 m/a.
Concurrent piezometric measurements from four aquifers measured in three wells indicate similar piezometric levels with differences of 0.7 metre. This observation suggests that the natural piezometric surfaces for these aquifers are similar.
Monitoring of piezometry variations by Volkovgeology revealed that, between 1981 and 1991, the site piezometry was gradually declining in all four aquifers. This drop was observed throughout the MA Area. A drop of piezometric levels between 0.3 and 1.2 m/a was observed in most exploration boreholes, averaging a decrease of 0.5 to 0.7 m/a. This drop in the piezometric surface was likely related to aquifer exploitation beyond the mine site, in the southern, south-eastern and south-western parts of the Chu-Sarysu artesian basin. Other reasons could be the presence of free-flowing artesian boreholes used for livestock watering.
Between 2001 and 2004, piezometric levels of the Upper Cretaceous complex continued to decline, but at a slower rate of 0.1 to 0.3 m/a. This trend is expected to continue as free-flowing boreholes within and adjacent to the MA Area are remediated.
16.1.4 Groundwater chemistry
Typical vertical hydrochemical zoning is observed in the water-bearing complex of the lower hydrogeological sub-stage showing a top-down increase in TDS from 0.6 to 4.7 g/L. These aquifers also exhibit lateral hydrochemical zoning with the salinity of water increasing as groundwater flows from its source towards the north-west.
Apart from upper zones of the Zhalpak aquifer which can be used for livestock watering, the groundwaters are not potable due to high TDS.
Groundwater in the Zhalpak aquifer is fresh to slightly brackish (TDS = 0.9 to 1.8 g/L) with uranium concentrations of 1.0 x 10⁻⁷ to 2.1 x 10⁻⁶ g/L and radium concentrations ranging from 1 x 10-12 to 6 x 10-12 g/L. These concentrations are consistent with typical background concentrations of these elements in sedimentary rocks.
The Lower Inkuduk and Mynkuduk aquifers are brackish. TDS of the Inkuduk aquifer vary between 1.2 and 3.6 g/L, increasing with depth. The groundwaters of the upper sub-horizon, with TDS less than 1.6 g/L, are suitable for industrial needs. TDS of the Mynkuduk aquifer is high, varying
2024 INKAI OPERATION TECHNICAL REPORT 70
between 2.7 to 4.7 g/L, increasing from north to south with deepening of the layer. The groundwaters from both aquifers are of a SO4-Cl-Na type.
| 16.2 | Mining |
ISR mining of uranium is defined by the International Atomic Energy Agency as “the extraction of ore from a host sandstone by chemical solutions (lixiviants) and the recovery of uranium at the surface. ISL [ISR] extraction is conducted by injecting a suitable leach solution into the ore zone below the water table; oxidizing, complexing and mobilizing the uranium; recovering the pregnant (loaded) solutions through production wells (extraction wells or recovery wells); and finally, pumping the uranium bearing solution to the surface for further processing.”
Two basic types of ISR leaching systems are used in the world today, acid leach and alkaline leach. In an acid leach system, diluted sulphuric acid is normally used as the complexing agent and to generate an oxidant from iron in the deposit. In an alkaline system, bicarbonate, either as a direct addition or as liberated from the reaction of carbon dioxide and carbonates in the formation, is used as the complexing agent. Oxygen is added in some cases when there is low carbonate in the formation.
Acid leach has the following technical advantages over alkaline leach:
| • | a high degree of uranium recovery from the ore (70 – 90%) |
| • | favourable leach kinetics |
| • | a comparatively short leaching period of two to five years |
| • | limited seepage beyond the wellfield due to the formation of low permeable chemical precipitates that block or hinder flow |
| • | addition of oxidants is not necessary (if ferric iron is present) |
| • | possibility of self-restoration (or self-attenuation) of the remaining leach solution due to self-cleaning of the contaminated solutions through the adjacent barren rocks |
16.2.1 ISR at Inkai
ISR mining at Inkai uses a sulphuric acid based lixiviant. The mining process comprises the following components to produce UBS, which goes to settling ponds and then to the respective IX plant before being directed to the MPP for production of uranium as yellowcake (see Figure 16-1):
| • | Determination of the GT cut-off for the initial design and the operating period. The design cut-off sets the minimum amount of uranium per pattern required to justify wellfield installation before funds are committed, and the operating head grade in UBS cut-off for individual producer wells that dictates the lower limit once a well has entered production. |
| • | Preparation of a production sequence which will deliver the UBS to meet production requirements considering the rate of wellfield uranium recovery, UBS uranium head grades, and wellfield flow rates. |
| • | Wellfield development using an optimal pattern design to distribute barren lixiviant to the wellfield injectors, and to collect UBS back to the MPP, Sat1, or Sat2, as the case may be. |
The above factors are used to estimate the number of operating wellfields, wellfield patterns and header houses over the production life. They also determine the unit cost of each of the mining components required to realize the production schedule, including drilling, wellfield installation and wellfield operation.
2024 INKAI OPERATION TECHNICAL REPORT 71
Figure 16-1: In situ Recovery Schematic
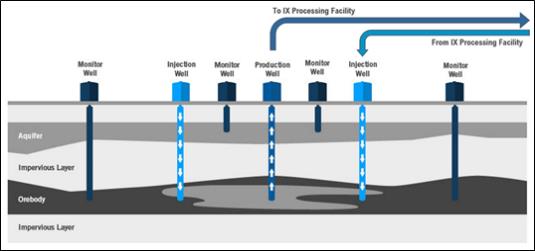
(Source: Cameco, 2024)
16.2.2 Wellfield design and development
For ISR mining, the basic unit of production is a ‘pattern’ with an extraction well and associated injector wells. Economic patterns must cover the cost of well installation, connection of the wells to a piping system to carry the lixiviant to and from the IX plant, the cost of the chemicals needed to leach the uranium, the operating cost of the pumps and maintenance on the pumps, the down-stream plant costs (elution, precipitation, filtering and drying), post-processing costs, and administrative overhead. While individual well performance can vary significantly, long-range scheduling assumes a general average flow using past production results which is deemed sufficient for predicting the behaviour of a large numbers of patterns.
Many factors can affect the design of the pattern, including:
| • | permeability of the host sands |
| • | depth of the host sands |
| • | cost of drilling |
| • | thickness of the mineralized units |
| • | surface topography |
| • | target wellfield uranium recovery |
Where there are no historical operations to use as a baseline, extensive hydrological modelling may be required for wellfield design and production planning. This is not the case with Inkai, as there has been significant experience following the start of commercial production in 2009 to support the current production plan.
Inkai uses both 7-spot (also known as hexagonal) and line drive patterns as shown on Figure 16-2. In a 7-spot pattern, six injectors are located on the vertices of a hexagon with one extractor in its centre. The distances between the wells in a hexagonal pattern varies from 35 to 45 metres, with average distance of 40 metres. In line drive patterns, rows of injectors alternate with rows of extractors. The distance between rows varies from 50 to 65 metres. The distance between wells in injector rows vary from 20 to 25 metres and in extractor rows from 25 to 30 metres. The total injector to extractor ratio is approximately 2.6. The screen length varies from 3 to 15 metres, with 6 metres being the most typical target length. The horizontal and vertical patterns geometries depend
2024 INKAI OPERATION TECHNICAL REPORT 72
on the mineralization morphology, its width and thickness, hydraulic conductivity and the hydrostratigraphic architecture in the area.
Figure 16-2: Configuration of Typical Wellfield Patterns Used at Inkai
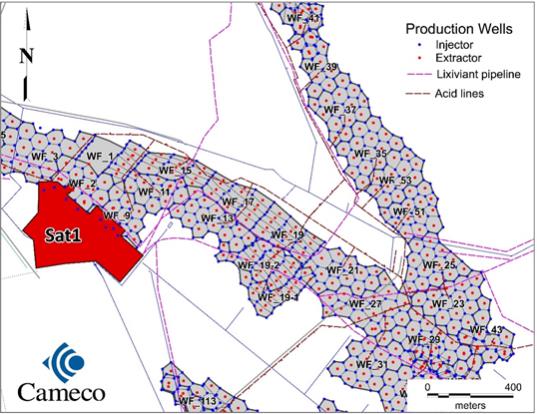
16.2.3 Mining Equipment
In ISR mining, ore is accessed through the wells. A total of 1,000 to 1,300 wells are required to be drilled, developed and equipped annually at Inkai. All of this work is contracted.
The surface infrastructure comprising of roads, overhead powerlines, acid lines, lixiviant and UBS pipelines, header houses and acidification units are required to be developed to deliver lixiviant, acid and electric power to wellfields and UBS to the processing facilities. A total of 20 to 25 wellfields are required to be developed annually.
Most wellfield construction is carried out by Inkai using its own equipment. Submersible pumps installed in each extractor well are used to lift UBS from the productive horizons and to maintain the required flowrate to transport it to the processing facilities. A total of 350 to 550 extractors are required to work at any given time to achieve the target flowrate. All submersible pumps are owned by Inkai.
To achieve the mine development and production targets, a fleet of corresponding equipment is required as shown in Table 16-2 below.
2024 INKAI OPERATION TECHNICAL REPORT 73
Table 16-2: List of Mining Equipment
Activity | Equipment type | Number of units required | ||||
Own | Contracted | |||||
Well drilling, developing and equipping | drilling rig | 22-25 | ||||
| compressor | 6 | |||||
| water truck | 9 | |||||
| excavator | 2 | |||||
| bulldozer | 2 | |||||
| downhole logging truck | 6 | |||||
Wellfield construction | trench digger | 2 | ||||
| excavator | 2 | |||||
| excavator / loader | 2 | |||||
| mobile cranes | 2 | |||||
| telescopic handler | 2 | |||||
| crane manipulator | 1 | |||||
| frontal loader | 2 | |||||
| tractor | 1 | |||||
| off-road truck | 4 | |||||
| Mining | submersible pumps | 350-500 | ||||
| Well servicing | drilling rig | 1 | ||||
| 16.3 | Wellfield production |
Production objectives
The annual production target of 10.4 million pounds U3O8 requires a combined flow of approximately 5,680 m3/h and an average head grade of approximately 100 parts per million of uranium delivered to the IX columns. Flow capacity within individual production wells generally vary between 8.0 m3/h and 10.5 m3/h on average resulting in approximately 550 patterns required to be in operation to achieve the required flow to the IX circuits. Wellfields are typically in production for two to five years.
Figures 16-3 through 16-5 show the historical annualized average flow volumes, head grades and total uranium to the processing facilities. Regular variability is experienced on a monthly basis by the operation as wellfields are started and depleted as illustrated in Figure 16-6. This variability is expected to continue throughout the mine life.
2024 INKAI OPERATION TECHNICAL REPORT 74
Figure 16-3: Historical Yearly UBS Volumes
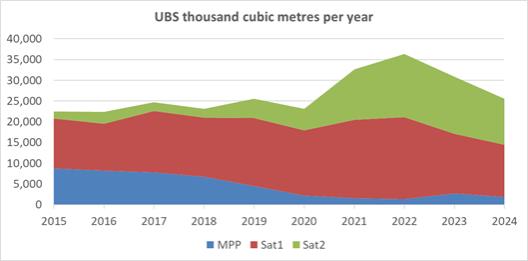
Figure 16-4: Historical Yearly UBS Head Grades
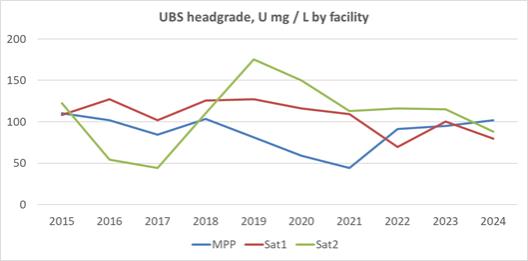
2024 INKAI OPERATION TECHNICAL REPORT 75
Figure 16-5: Historical Yearly Production by Mining Area
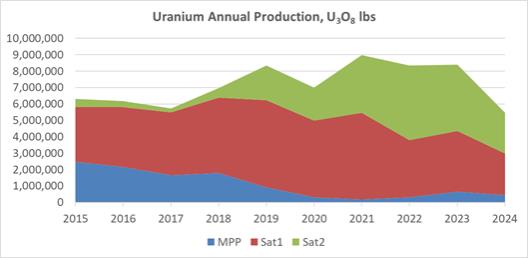
Figure 16-6. Monthly Head Grade Variability
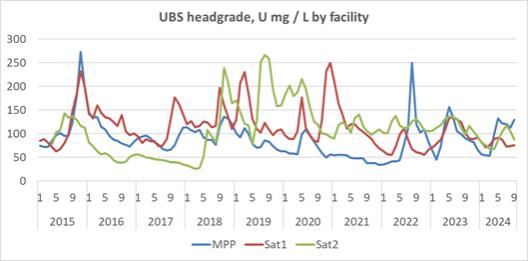
In recent years, production from the higher cost wellfields in the MPP Area has been deliberately reduced, largely due to sulphuric acid supply challenges. Production from each of the three areas is planned to increase as supply chain challenges are resolved and Inkai can bring on additional wellfields.
Recovery curves for actual production results from MPP, Sat1 and Sat2 are shown for their respective wellfields in Figure 16-7. The recovery curve graphs show the relationship between the liquid to solid ratio (L/S) and the recovery expressed in percent. L/S is defined as the ratio between the volume of the leaching solution to the rock mass in the leaching zone of the wellfields. The graphs indicate that the target average uranium recovery of 85% is achievable and agrees with the RUC and approved project documents.
2024 INKAI OPERATION TECHNICAL REPORT 76
Figure 16-7: MPP, Sat1 and Sat2 Historical Recovery Curves
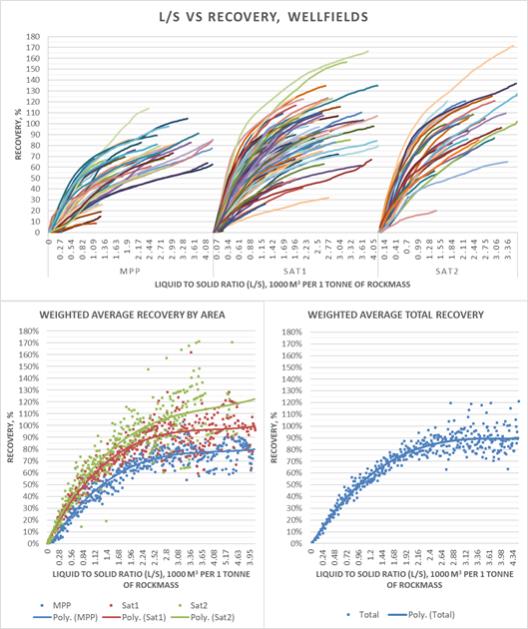
Additional wellfields and infrastructure including roads, pipelines, powerlines and acid lines are being developed, in various stages, to provide additional production as required to meet production targets in 2024 and beyond. See Section 18 for more details.
| 16.4 | Production schedule |
This production plan is based on Cameco’s assumptions for production from JV Inkai. At the time of writing of this Technical Report, discussions are ongoing between Cameco and Kazatomprom regarding plans for recovering production shortfalls to the Ramp-up schedule in the Implementation Agreement (see Section 24.1 for additional information). Apart from 2024, which is discussed
2024 INKAI OPERATION TECHNICAL REPORT 77
below, Cameco expects that any changes made to this production schedule will conform to the +/- 20% variance limit to the production plan in the RUC.
JV Inkai is forecasting that the 2024 production volume will decrease by more than 20% of the original RUC approved production amount of 10.4 million pounds, as maximum 2024 production is now expected to be approximately 7.7 million pounds.
The LOM Plan is partially based on inferred mineral resources. Annual production levels will be dependent on results of further delineation drilling and market conditions. There is no certainty that the LOM Plan production will be realized. With continued delineation drilling and wellfield development, Cameco expects the majority of the inferred mineral resources withing the LOM Plan will be upgraded to indicated and/or measured mineral resources.
The reserves-based production profile supporting the reported mineral reserves do not include the inferred resources. The production plan is based on mineral reserves and forecasts an estimated 212.3 million pounds U3O8 of packaged production from 2024 through to the end of the RUC term in mid-2045. For wellfields started close to the end of the RUC term, the target recoveries of 85% are not expected to be achieved given the average lifespan of a typical wellfield. The reserves-based production schedule summary for Inkai between 2024 and mid-2045 is shown in Table 16-3 and Figure 16-8.
2024 INKAI OPERATION TECHNICAL REPORT 78
Table 16-3: Reserves-based JV Inkai Production Schedule – 100% basis
Year | 2024 | 2025 | 2026 | 2027 | 2028 | 2029 | 2030 | 2031 | 2032 | 2033 | 2034 | 2035 | ||||||||||||||||||||||||||||||||||||||
JV Inkai | (M lbs U3O8) | 7.7 | 9.4 | 10.4 | 10.4 | 10.4 | 10.4 | 10.4 | 10.4 | 10.4 | 10.4 | 10.4 | 10.4 | |||||||||||||||||||||||||||||||||||||
Year | 2036 | 2037 | 2038 | 2039 | 2040 | 2041 | 2042 | 2043 | 2044 | 2045 | Total | |||||||||||||||||||||||||||||||||||||||
JV Inkai | (M lbs U3O8) | 10.1 | 8.9 | 9.0 | 9.4 | 9.6 | 9.9 | 9.9 | 9.5 | 10.0 | 4.8 | 212.3 | ||||||||||||||||||||||||||||||||||||||
Note: 2024 production comprises 5.5 million pounds of actual production from January 1 through September 30, 2024, plus a forecast of 2.2 million pounds for the remainder of 2024.
Figure 16-8: Reserves-based JV Inkai Production Schedule – 100% basis
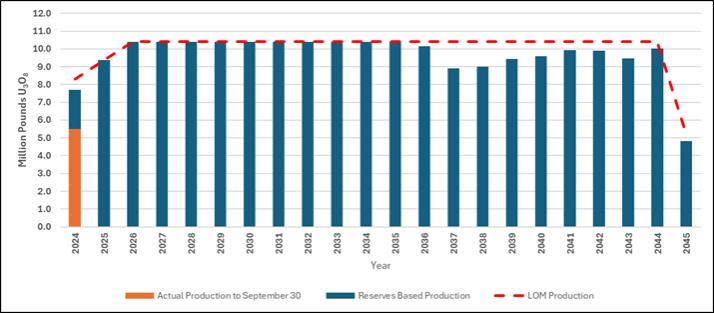
2024 INKAI OPERATION TECHNICAL REPORT 79
| 17 | Recovery methods |
| 17.1 | Processing facilities |
There are three surface processing facilities at Inkai: MPP, Sat1 and Sat2. The processing equipment in the MPP circuit currently includes IX units (adsorption and elution columns), along with yellowcake precipitation, thickening, drying and packaging process units. The processing equipment at both Sat1 and Sat2 consists of adsorption and elution equipment. This is illustrated in the block flowsheet in Figure 17-1. The MPP currently produces a uranium peroxide (UO4·nH2O) dried product from the UBS. Periodically, when there is a shortage in drying capacity, eluate from the process circuit is shipped to a toll mill for processing to U3O8. Planning continues related to upgrading the drying circuit to produce U3O8 by processing the uranium peroxide in an electrically heated rotary calciner.
Loaded IX resin is produced from UBS and is eluted at the MPP, Sat1 and Sat2 processing plants. All eluate from Sat1 and Sat2 is be transported to the MPP for the production of uranium peroxide.
The following demonstrated capacity estimates are based on periods when higher head grades have been attained during production in the specific block. The existing MPP, Sat1 and Sat2 circuit capacities were estimated using Inkai monthly process summaries. The MPP has demonstrated an IX capacity of 2.7 million pounds U3O8 per year and a product drying and packaging capacity of 8.3 million pounds U3O8 per year. Sat1 has a demonstrated IX capacity of 6.3 million pounds U3O8 per year as eluate. The current demonstrated IX capacity of Sat2 is 4.5 million pounds U3O8 per year as eluate.
Plans are progressing to install filtering, drying and calcining circuits at the MPP to support planned production levels of at least 10.4 million packaged pounds per year.
Ion exchange resin adsorption (loading)
Wellfield acid solution, containing the leached uranium (UBS), is pumped from the selected wellfield(s) via pipelines to a settling pond and then to the IX circuits for adsorption of the contained uranium. The uranyl sulphate anions are selectively adsorbed onto solid synthetic IX resin beads with fixed ionic sites. The resin bed is retained in IX vessels where resin is contacted with UBS.
Once the resin in an IX column is fully loaded with uranium, the column is isolated from the continuous IX circuit and the resin is retained for elution or transferred with push water to an elution vessel. In the case of the MPP, the UBS can be directed to one of the adsorption column trains. Each train is capable of performing resin adsorption and then operated in the desired mode of elution. In the case of Sat1, the UBS reports to either an adsorption column train or a semi-batch adsorption column. In the case of Sat2, UBS solution reports to a semi-batch adsorption column.
Resin elution (stripping)
In the elution process, uranium that has been adsorbed onto the IX resin during the adsorption cycle (loaded resin) is desorbed from the resin using ammonium nitrate. The eluate produced from this step is stored in tanks.
At the MPP and Sat1, loaded resin can either be retained in the vessel for elution or hydraulically conveyed to a vessel specifically designed for elution within the circuit. Loaded resin can also be transferred between the two plants for elution based on available capacity. At Sat2, loaded resin is hydraulically transferred from the adsorption vessel to an elution vessel.
Denitrification
After the uranium has been stripped from the resin in the elution process, the adsorption sites on the resin are initially left in a nitrate form. The adsorption sites on the resin must be denitrified and converted to a sulphate form for re-use in the IX circuit. This is accomplished by contacting the
2024 INKAI OPERATION TECHNICAL REPORT 80
resin with a solution of sulphuric acid and process water in a denitrification vessel. Each plant has a denitrification vessel to complete this step.
Precipitation
Eluate from Sat1 and Sat2 is transported to and stored with the MPP eluate before being directed to the precipitation circuit. Hydrogen peroxide is added to the precipitation tanks to induce precipitation. The pH of this stream is adjusted within the tank through the addition of anhydrous ammonia.
The tanks are operated in a cascade configuration to allow the required retention time for the precipitation reaction to proceed to completion. The final yellowcake slurry is discharged from the last tank in the series and pumped into a thickener.
Yellowcake product thickening
The slurry from the precipitation circuit is pumped into a thickener where the contained yellowcake slurry is thickened to approximately 35% solids and pumped to filter presses for further dewatering and cake washing.
Filter press operation
The yellowcake slurry from the yellowcake thickener underflow reports to the filter presses. The slurry is first washed and then dewatered in the filter presses to approximately 65% solids.
Drying
The dewatered yellowcake from the filter press is then pumped into rotary vacuum dryers where the yellowcake product is produced.
The vacuum dryers are totally enclosed during the drying cycle to assure zero emissions. The off-gases and steam generated during the drying cycle are filtered and condensed to collect entrained particulates and moisture within the process system.
Packaging
Once the dryer contents have cooled, a measured amount of dried yellowcake is transferred through a rotary valve into drums before being shipped.
| 17.2 | Reagents and energy requirements |
Process inputs for the Inkai circuits include water, sulphuric acid, ammonium nitrate, hydrogen peroxide, ammonia, and electrical power. No challenges are projected in having adequate electrical power, water and other process reagent inputs to support the production expansion.
Current and projected reagent consumption figures are presented in Table 17-1.
Current electrical energy consumption for the production facility is approximately 55,000 MWh and will increase to approximately 70,000 MWh with the increased production target. The energy consumption is highly dependent on the pumping requirement (i.e. UBS flowrates and mg/L U) required to meet the production target.
2024 INKAI OPERATION TECHNICAL REPORT 81
Table 17-1: Inkai Reagent Consumption
Reagent | Current Est’d Annual Consumption (tonnes) | Expansion Est’d Annual Consumption (tonnes) | ||||||
Sulphuric Acid | 165,000 | 200,000 | ||||||
Ammonium Nitrate | 8,300 | 9,300,200 | ||||||
Anhydrous Ammonia | 720 | 900 | ||||||
Ion Exchange Resin1 | 60 | 70 | ||||||
Hydrogen Peroxide | 550 | 700 | ||||||
Technical Water1 | 600,000 | 700,000 | ||||||
| 1 | units of consumption for ion exchange resin and technical water are m3 |
Figure 17-1: Current Inkai Flowsheet
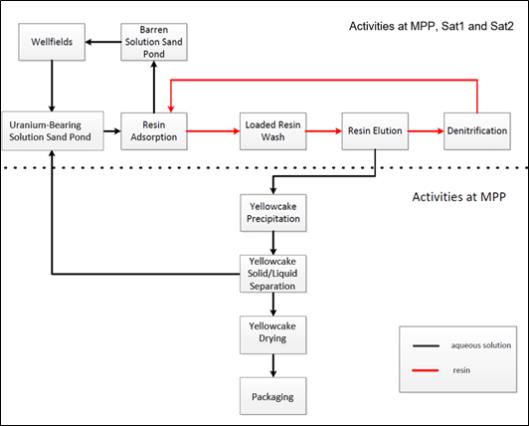
(Source: Cameco, 2017)
| 17.3 | Overall uranium recovery |
The uranium extraction efficiency (recoverability) of ISR operation is determined by uranium loss in underground leaching and in surface production facilities. Plant recovery of the uranium from the UBS has averaged approximately 98% since 2015 (see Figure 13-1). Based on the blend of feeds
2024 INKAI OPERATION TECHNICAL REPORT 82
from the various wellfields over the LOM, an overall uranium recovery, or metallurgical recovery, of 85% is expected for the remainder of the LOM plan.
| 17.4 | Expansion project |
Engineering work for a process expansion of the Inkai circuit to support a nominal production of at least 10.4 million pounds U3O8 per year has been completed and construction is in progress. The expansion project includes an upgrade to the yellowcake filtration and packaging units, and the addition of a pre-dryer and calciner. The proposed expansion flowsheet is presented in Figure 17-2.
Following completion of the expansion project, total expected production capacity is expected to be approximately 13 million pounds per year from leaching and IX, and approximately 12 million pounds per year from calcining and packaging.
Following completion of the expansion project, the use of toll milling services to reach annual packaged production targets is not expected to be required.
Figure 17-2: Proposed Flowsheet Based on Annual Production of 10.4 M Lbs U3O8
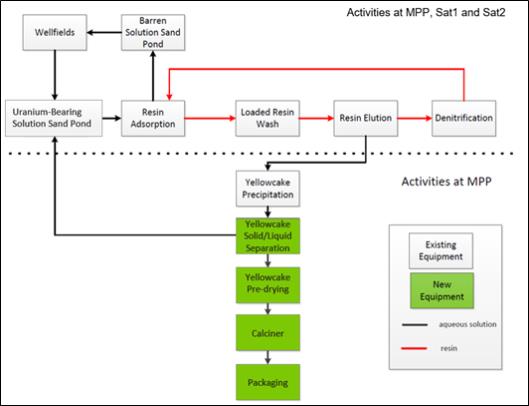
(Source: Cameco, 2017)
2024 INKAI OPERATION TECHNICAL REPORT 83
| 18 | Project infrastructure |
| 18.1 | Inkai facilities |
Inkai is a developed producing property with surface rights, site facilities and infrastructure. Expansion plans are in progress to accommodate future expansion in mining operations and production. A site plan of the existing infrastructure general arrangement is shown in Figure 18-1.
JV Inkai facilities in Taikonur
| • | residence camp for employees, with catering and leisure facilities |
| • | perimeter security fence |
As part of the Ramp-up, the following upgrades are in progress:
| • | expansion of the camp in a phased approach with construction of two residential blocks for 165 people each and addition of a dining room for 150 people |
| • | construction of a 24 km asphalt paved road connecting the camp to the three processing facilities |
Facilities in the MA Area
| • | the MPP, Sat1 and Sat2 |
| • | security gates |
| • | administrative, engineering and construction offices, laboratory, shops and garages |
| • | holding ponds and reagent storage tanks |
| • | waste disposal enclosures for low-level radioactive waste and domestic waste |
| • | emergency response building (staffed at all times by fire services personnel) |
| • | food services facilities |
| • | roads and power lines |
| • | wellfield pipelines and header houses |
As part of the Ramp-up, the following upgrades are in progress:
| • | expansion of the processing facilities to add processing capacity |
| • | addition of calcining capability at the MPP |
| • | expansion of the office buildings and the laboratory |
| 18.2 | UOC shipping routes |
As a result of geopolitical issues, the Trans-Caspian route is currently being utilized to deliver Cameco’s share of Inkai production to market.
Those shipments of UOC are delivered to the Zhanatas rail station in Kazakhstan and then moved to the port of Aktau on the Caspian Sea. By ship, it then moves to the port of Alyat near Baku, Azerbaijan, proceeding to the Black Sea port of Poti, Georgia. From there it travels through the Bosphorus Strait into the Mediterranean Sea and across the Atlantic Ocean to the port of Montreal before delivery to Cameco’s Blind River Refinery.
Prior to 2022, Cameco’s share of JV Inkai production was delivered via the “northern” route that involved rail transportation from Zhanatas station through Russia to the Baltic Sea port of St. Petersburg, where it was loaded on an ocean vessel and transported across the Atlantic Ocean to the port of Montreal before delivery to Cameco’s Blind River refinery.
2024 INKAI OPERATION TECHNICAL REPORT 84
Figure 18-1: Infrastructure General Arrangement
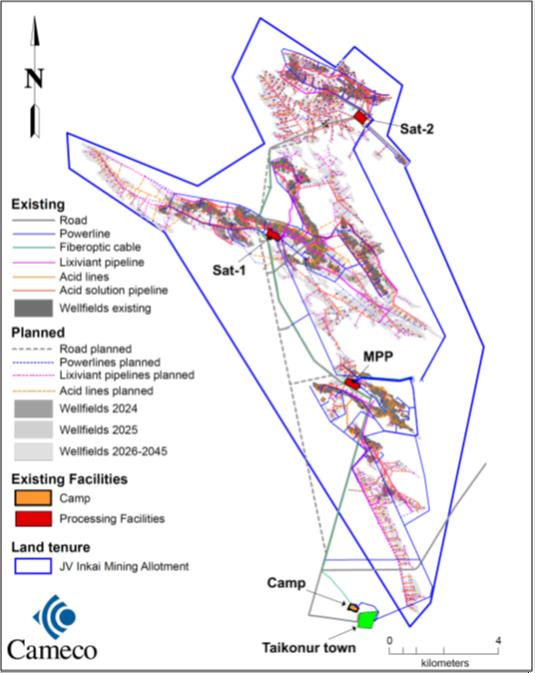
(Source: JV Inkai, 2024)
2024 INKAI OPERATION TECHNICAL REPORT 85
| 19 | Market studies and contracts |
| 19.1 | Markets |
Nuclear plants around the world use uranium to generate electricity. The following is an overview of the uranium market.
Uranium demand
The demand for U3O8 is directly linked to the level of electricity generated by nuclear power plants and to a lesser degree, interest from financial funds. In 2023, the world annual uranium requirement was about 160 million pounds according to UxC, while cumulative uncovered requirements were about 2.2 billion pounds to the end of 2040. Additionally, total uranium placed under long-term contracts by utilities was also about 160 million pounds in 2023.
Uranium supply
There are two sources of uranium supply: primary production is production from mines that are currently in commercial operation; and secondary supply includes other sources such as excess inventories, uranium made available from defence stockpiles and the decommissioning of nuclear weapons, re-enriched depleted uranium tails, and used reactor fuel that has been reprocessed.
Mine production
While the uranium production industry is international in scope, there are only a small number of companies operating in relatively few countries. In 2023, world mine production was estimated at 143 million pounds U3O8:
| • | about 80% of estimated world production was sourced from four countries: Kazakhstan (38%), Canada (20%), Namibia (13%) and Australia (9%). |
| • | almost 80% of estimated world mine production was attributable to five producers. Cameco accounted for approximately 16% (22 million pounds) of estimated world production. |
Uranium markets
Uranium is not traded in meaningful quantities on a commodity exchange. Utilities buy the majority of their uranium products under long-term contracts with suppliers and meet the rest of their needs on the spot market.
Uranium spot and long-term prices
The industry average spot price (TradeTech and UxC) on September 30, 2024, was $82.00 (US) per pound of U3O8, down 10% from $91.00 (US) per pound of U3O8 on December 31, 2023.
The industry average long-term price (TradeTech and UxC) on September 30, 2024, was $81.50 (US) per pound of U3O8, up 20% from $68.00 (US) per pound of U3O8 on December 31, 2023.
| 19.2 | Uranium sales contracts |
100% of JV Inkai’s annual production is sold to Cameco and Kazatomprom. Annual uranium sales contracts between JV Inkai and a Cameco subsidiary to purchase Cameco’s share of JV Inkai’s production are concluded each year, as well as similar contracts between JV Inkai and Kazatomprom to purchase Kazatomprom’s share of JV Inkai’s production. JV Inkai currently has no other forward-sales commitments for its uranium production.
In accordance with the Kazakhstan government’s resolution on uranium concentrate pricing regulations (effective February 3, 2011), product is currently purchased from JV Inkai at a price equal to the uranium spot price, less a 5% discount (maximum allowable). The spot price represents an average of various third-party consultant views on the most competitive near-term offers available for natural uranium concentrates (U3O8).
2024 INKAI OPERATION TECHNICAL REPORT 86
| 19.3 | Material contracts |
The RUC is the only contract material to Cameco required for the development and mining of Inkai. Please see Section 4.4 for a description of this contract.
| 19.4 | Uranium price assumptions used for economic analysis |
Table 19-1 outlines the projected JV Inkai average realized prices, taking into account Kazakhstan’s transfer pricing law and the independent annual spot prices projections. The independent annual spot price projections are derived from the average of various independent third-party forecasts of supply and demand fundamentals. To the extent the independent forecasts did not extend their price projections to cover the entire expected mine life, the projections have been extrapolated forward to the end of the anticipated mine life. The price projections are stated in constant 2024 dollars (US) and have been incorporated into the projections for the purpose of the economic analysis.
The qualified persons for Sections 14 and 15 have reviewed the studies of the independent price projections and confirm that the results of these studies support the assumptions used for the portions of the technical report such qualified persons are responsible for.
Table 19-1: Expected Average Uranium Prices by Year
Price assumptions | 2024 | 2025 | 2026 | 2027 | 2028 | 2029 | ||||||||||||||||||
Independent Spot Price Projection $US/lb | 95.00 | 99.00 | 97.00 | 93.00 | 89.00 | 87.00 | ||||||||||||||||||
Transfer Price Discount $US/lb | 4.75 | 4.95 | 4.85 | 4.65 | 4.45 | 4.35 | ||||||||||||||||||
JV inkai average price $US/lb | 90.25 | 94.05 | 92.15 | 88.35 | 84.55 | 82.65 | ||||||||||||||||||
JV inkai average price $Cdn/lb | 120.03 | 125.09 | 119.80 | 110.44 | 105.69 | 103.31 | ||||||||||||||||||
Exchange rate $1.00 US = $Cdn | 1.33 | 1.33 | 1.30 | 1.25 | 1.25 | 1.25 | ||||||||||||||||||
| 2030 | 2031 | 2032 | 2033 | 2034 | 2035 | 2036 | 2037 | 2038 | 2039 | 2040-2045 | ||||||||||||||||||||||||||||||||
| 84.00 | 84.00 | 83.00 | 85.00 | 84.00 | 83.00 | 84.00 | 85.00 | 85.00 | 86.00 | 87.00 | ||||||||||||||||||||||||||||||||
| 4.20 | 4.20 | 4.15 | 4.25 | 4.20 | 4.15 | 4.20 | 4.25 | 4.25 | 4.30 | 4.35 | ||||||||||||||||||||||||||||||||
| 79.80 | 79.80 | 78.85 | 80.75 | 79.80 | 78.85 | 79.80 | 80.75 | 80.75 | 81.70 | 82.65 | ||||||||||||||||||||||||||||||||
| 99.75 | 99.75 | 98.56 | 100.94 | 99.75 | 98.56 | 99.75 | 100.94 | 100.94 | 102.13 | 103.31 | ||||||||||||||||||||||||||||||||
| 1.25 | 1.25 | 1.25 | 1.25 | 1.25 | 1.25 | 1.25 | 1.25 | 1.25 | 1.25 | 1.25 | ||||||||||||||||||||||||||||||||
2024 INKAI OPERATION TECHNICAL REPORT 87
| 20 | Environmental studies, permitting and social or community impact |
| 20.1 | Environmental considerations |
20.1.1 Legislation
In Kazakhstan, government agencies are responsible for the administration of, among other things, uranium production, transportation and storage. The primary regulatory authorities that issue permits, licences, and approvals are the Ministry of Energy (Nuclear and Energy Supervision and Control Committee) and the Ministry of Ecology, Geology and Natural Resources (Committee of Environmental Regulation and Control). At a regional level, both ministries provide enforcement through local representative authorities. In particular, the Ministry of Ecology’s local representative authorities administer approvals of environmental protection programs, costs for environmental protection and enhancement, and approval for waste management programs. The Ministry of Ecology’s departments and territorial units supervise and control development and implementation of environmental protection and subsoil use programs, and are responsible for granting approval for the construction of facilities.
The Ecological Code, adopted in 2021, is the principal legislation dealing with the protection of the environment. Although it does not specifically refer to uranium, there are general provisions regulating production waste which apply to uranium. More specific provisions are provided in other applicable Kazakhstan regulations and state standards.
The Ecological Code firmly established the “polluter pays” principle pursuant to which the person whose actions or activities cause environmental damage must remediate the components of the environment that were damaged in full and at its own expense. Administrative or criminal liability for environmental damage does not release such person from civil liability for such remediation of the environment. Under the existing legislative regime, a subsoil user, such as JV Inkai, is obliged to comply with environmental requirements during all stages of a subsoil use operation. Kazakhstan environmental legislation requires that contemplated activities that may have an impact on the environment undergo the environmental assessment prior to making of any legal, organisational or economic decisions with respect to an operation that could impact the environment and public health. One of the types of such environmental assessment is an EIA.
The Ecological Code requires that the subsoil user obtain environmental permits to conduct its operations. Facilities, based on their environmental impact, are divided into four categories. Assignment of a facility to a category in terms of the level of environmental impact would determine which type of the environmental permit is required. There are two types of environmental permits: comprehensive and impact permits. Both include environmental conditions for conducting one’s activity such as emission limit values and waste management programs. The difference between the two is that a comprehensive environmental permit must include the condition of adoption of the “best available techniques”. The best available techniques are technologies, ways, and methods that are used during an activity and are effective, advanced, and practically applicable. Operators of category 1 facilities who operate under this permit and invest in best available techniques are exempt from payments for emissions into the environment. In August 2021, JV Inkai was assigned category 1.
The environmental management system at JV Inkai is designed to ensure compliance with regulatory requirements, preventing pollution in accordance with ISR operation best practice, and continual improvement of performance. The environmental management system and the occupational health and safety management systems have been certified to ISO 14001 and OHSAS 18001 (now ISO 45001). In 2018, the JV Inkai quality management system was certified to
2024 INKAI OPERATION TECHNICAL REPORT 88
ISO 9001. This integrated management system (ISO:14001/45001/9001) is re-certified every three years.
The principal legislation governing subsoil exploration and mining activity in Kazakhstan is the Subsoil Code. In general, the Subsoil Code identifies the subsoil and mineral resources in the underground state as property of the Republic of Kazakhstan, and resources brought to the surface as property of the subsoil user, unless otherwise provided by contract or this law. See Section 4.5 for more information.
As the subsoil use sector has evolved, there is presently a trend towards greater regulation, heightened enforcement and increased liability for non-compliance with respect to environmental issues.
20.1.2 Environmental impact assessment
Under the Ecological Code, an environmental impact assessment (EIA) is a mandatory requirement for business projects which may have direct or indirect impact on the environment and human health. The Ecological Code requires that an EIA must be conducted at various stages of a project. Specifically, an EIA must be carried out:
| • | prior to implementing any type of industrial or construction project listed in Section 1 of Annex 1 to the Ecological Code; |
| • | prior to implementing any type of industrial or construction project listed in Section 2 of Annex 1 to the Ecological Code if the preliminary environmental screening of the contemplated project established the necessity in an EIA; |
| • | prior to implementing any material changes to the above projects (such as changes to production capacity, technologies, production process, etc.). |
Every EIA must be reviewed and approved by the Competent Authority for environmental protection which results in an opinion confirming the conclusions on the possible significant impacts of the planned activity on the environment, the admissibility of the planned activity and the conditions under which the activity is recognised as admissible. Conclusions and conditions of the opinion based on EIAs must be taken into consideration by other governmental authorities in the course of granting permits or in other administrative procedures.
Kazakhstan environmental legislation requires that contemplated activities that may have an impact on the environment undergo the environmental assessment prior to making of any legal, organizational or economic decisions regarding an operation that may potentially impact public health or the environment. One of the types of such environmental assessment is an environmental impact statement.
The baseline conditions and potential environmental impacts of the commercial mining facility at Inkai were assessed based on Republic of Kazakhstan and western U.S. standards. The baseline fieldwork was performed in 2001 - 2002. The anticipated environment is common to any uranium acid ISR operation and is described in detail in the EIA and environmental assessment reports published since 2002. The EIA reports describe the biological, hydrogeological, hydrologic and other physical environmental baseline prior to exploration and the commencement of production operations and assess the potential impacts to environmental media and the human environment from the proposed operations. The environmental studies completed to date have not identified any potential impacts to human health or the environment that could not be mitigated through permit conditions or reclamation bond commitments.
A groundwater flow and plume modelling study was conducted to review hydrogeological data and simulate contaminant transport. The modelling study predicted groundwater flow and transport within the test area of the MPP Area. The model was calibrated with recent and historical
2024 INKAI OPERATION TECHNICAL REPORT 89
piezometric measurements. The model results showed no risk to local and regional groundwater users from ISR mining of the MPP Area.
A study was conducted to assess natural attenuation of ISR solutions within the MPP Area, based on the pilot-scale uranium in situ leaching conducted between 1988 and 1990. To assess and monitor the natural attenuation, four deep boreholes were drilled to depths up to 519 m into Permian rocks to intersect the mineralized zones within the Mynkuduk aquifer. The observed contamination plume was localized within an area of 110 x 80 m and with a thickness of 32 m. Laboratory investigations showed attenuation of contaminants (e.g., approximately neutral pH) in the upper part of ISR profile and partial attenuation in the lower part of the profile. Analogous with other uranium ISR sites in the region, the study concluded that the majority of contamination caused by ISR test mining in the MPP Area will be attenuated by 2044.
20.1.3 Known environmental liabilities
JV Inkai’s mining activities must comply with the environmental requirements of Kazakhstan laws and regulations. In addition, in the RUC, JV Inkai has committed to conduct its operations in accordance with good international mining practices.
Government authorities and the courts enforce compliance with the required permits, and violations may result in civil, administrative and/or criminal liability, the curtailment or cessation of operations, orders to pay compensation, orders to remedy the effects of violations and orders to take preventative steps against possible future violations. In certain situations, the issuing authority may modify, renew, suspend or revoke the permits.
Administrative liability for excess emissions and waste disposal has become much more stringent with the fine applicable to the volume of the excess emissions/waste now being calculated at the rate of 10,000% to the standard emission payment (a hundredfold coefficient).
JV Inkai may be subject to administrative penalties for waste exceedances and intends to mitigate against any potential waste exceedances through the construction of additional BTPs at MPP, Sat1 and Sat2. The BTP at MPP is anticipated to be completed by the end of 2024.
As an industrial company, JV Inkai is also required to undertake programs to reduce, control or eliminate various types of pollution and to protect natural resources. The RUC specifically requires the implementation of environmental controls based on an industrial environmental control program developed by JV Inkai and approved by the environmental protection authorities. JV Inkai must also actively monitor specific air emission levels, ambient air quality, nearby surface water quality, groundwater quality, levels of soil contaminants and the creation of solid waste. JV Inkai must submit annual reports on pollution levels to Kazakhstan’s environmental, tax and statistics authorities who conduct tests to validate JV Inkai’s results.
If JV Inkai’s emissions were to exceed the specified levels, this would trigger additional payment obligations. Moreover, in the course of, or as a result of, an environmental investigation, regulatory authorities in Kazakhstan have the power to issue an order reducing or halting production at a facility that has violated environmental standards.
The Ecological Code and the RUC set out requirements with respect to environmental insurance. Legal entities carrying out environmentally hazardous activities are required to obtain insurance to cover activities which may cause harm to third parties, in addition to the civil liability insurance which must be held by owners of facilities. JV Inkai currently maintains both the required environmental insurance and the civil liability insurance. JV Inkai carries environmental insurance, as required by the RUC and environmental law.
The Parliament of Kazakhstan ratified the country’s accession to the United Nations Framework Convention on Climate Changes (Kyoto Protocol) in 2009. The Kyoto Protocol’s objective is to limit or capture emissions of greenhouse gases such as carbon dioxide and methane. Within the
2024 INKAI OPERATION TECHNICAL REPORT 90
framework of the Kyoto Protocol, Kazakhstan has enacted a number of legislative instruments aiming to reduce emissions of greenhouse gases. In particular, the emission regulations and trading provisions were introduced into the Ecological Code and took effect January 1, 2018.
Currently, all operators of installations (units) cannot use any unit which produces emissions higher than 20,000 tons of equivalent carbon dioxide per year in the regulated spheres of activities such as oil and gas, electric power, mining, metallurgy, and the chemical industry. If the unit’s emission is between 10,000 to 20,000 tons equivalent carbon dioxide per year, then its operator is subject to the regime of administration. JV Inkai has not exceeded these limits.
20.1.4 Permitting
Having the rights to explore for and to extract uranium under the RUC, JV Inkai, as a nuclear facility, is also required to hold certain permits and licences to operate the mine. With regard to environmental protection requirements, JV Inkai has applied for and received:
| • | a permit for environmental emissions and discharges for the operation, valid until December 31, 2026 |
| • | water use permits with various expiry dates |
JV Inkai currently holds the following additional material licences relating to its mining activities and has applied for prolongation of licences expiring in 2024:
| • | “Licence for radioactive substances handling” valid until December 31, 2024, which will be replaced by “Licence for nuclear materials handling” |
| • | “Licence for operation of mining and chemical productions” with an indefinite term |
| • | “Licence for transportation of radioactive substances within the territory of the Republic of Kazakhstan” valid until December 30, 2024 |
| • | “Licence for radioactive waste handling” valid until December 30, 2024 |
| • | “Licence for ionizing radiation equipment handling” with an indefinite term |
In accordance with applicable legislation regulating the use of radioactive substances, JV Inkai is required to submit annual reports to relevant state authorities. Renewal of environmental permits requires the submission of an annual report on pollution levels to Kazakhstan’s environmental authorities, compliance with the permits’ provisions and the remittance of any environmental payment obligations.
Pursuant to the Water Code, JV Inkai is qualified as a primary water user, and is entitled to extract water directly from water sources for its own use. JV Inkai has obtained special water use permits, which have various expiry dates. Water usage under the permits is limited to the purposes defined in the permits.
As is typical with any mineral extraction site, construction, operation, and reclamation are subject to an ongoing process during which permits, licences, and approvals are requested, monitored and reported on, expire, and are amended or renewed. Provision for these ongoing processes has been included in the cost estimates in this technical report.
20.1.5 Decommissioning and restoration
JV Inkai’s decommissioning obligations are largely defined by the Resource Use Contract and the Subsoil Code dated 27 December 2017 (Subsoil Code). JV Inkai is required to maintain a fund, which is capped at $500,000 (US), as security for meeting its decommissioning obligations; it is fully funded.
JV Inkai developed a preliminary decommissioning estimate reflecting current total decommissioning costs under a “decommission now” scenario and updates the plan every year. The preliminary decommissioning estimate prepared as of the end 2023 was $33.6 million (US).
2024 INKAI OPERATION TECHNICAL REPORT 91
Under the Subsoil Code, the decommissioning cost estimate for the RUC timeframe must be included in the Project for Uranium Deposit Development (PUDD). Inkai retained the services of a local engineering firm licensed to prepare the PUDD. The PUDD preparation, including the decommissioning cost estimate, is currently in progress. Once completed, the PUDD undergoes regulatory review and approval. Any required amendments to the RUC are then required to be prepared and signed by the Competent Authority and JV Inkai to become a part of the RUC. The decommissioning estimate contained in the PUDD is subject to review and update every three years. Updates account for changes in the volume of work based on the deposit’s development as well as any decommissioning activities carried out in the previous three-year time period. The decommissioning costs in the PUDD are subject to review and approval by the government.
Under the RUC, JV Inkai must submit a project for decommissioning the property to the government six months before mining activities are complete.
The Subsoil Code now requires subsoil users to provide a new type of security for their decommissioning obligations which is pledge of a bank deposit. The transitional provisions of the Subsoil Code preserve the decommissioning fund mechanism applicable to the RUC and accordingly, JV Inkai continues to rely upon its existing decommissioning fund mechanism
Surface reclamation following the completion of mining will include the removal of all buildings, re-contouring of all disturbed areas of the mine site, and removal of any contaminated material based on a detail post-mining gamma radiation survey. Material exceeding baseline conditions will be removed and replaced with clean material. Contaminated material will be removed to an approved waste facility for permanent disposal.
No active restoration of post-mining groundwater is done in Kazakhstan. Natural attenuation of the residual acid in the mined-out horizon as a passive form of groundwater restoration is determined to be sufficient.
The decommissioning regulations have been changed by the Subsoil Code. The general provisions related to decommissioning have been modified and special provisions on decommissioning of uranium fields have been introduced. Such changes to the law related to the order of decommissioning and conservation of a uranium field do not fall within the scope of the stability guarantee as such changes clearly pertain to the sector of environmental safety and JV Inkai is required to comply with it.
The Subsoil Code introduced three types of decommissioning security: pledge of a bank deposit, guarantee and insurance policy. For uranium specifically the required type of security is pledge of a bank deposit.
The transitional provisions of the Subsoil Code preserve the decommissioning fund mechanism applicable to the RUC and accordingly, JV Inkai continues to rely upon its existing decommissioning fund.
| 20.2 | Social and community requirements |
JV Inkai operates in the Suzak district of the Turkestan region. The territory of the district is about 41,000 km2 and its population is over 60,000. The town of Taikonur, with a population of approximately 700, is in this district and the Inkai deposit is located nearby. A major part of Kazakhstan’s uranium deposits are in the district which also hosts deposits of gold, silver, coal and other minerals. Meat and dairy products production is a leading agriculture industry in the district.
In accordance with JV Inkai’s corporate responsibility strategy and to comply with its obligations under the RUC, JV Inkai finances projects and provides goods and services to support the district’s social infrastructure.
2024 INKAI OPERATION TECHNICAL REPORT 92
Under the RUC, JV Inkai is required to finance the training and development of Kazakhstan personnel. The RUC imposes local content requirements on JV Inkai with respect to employees, goods, works and services. See Section 4.5.7 for more information.
2024 INKAI OPERATION TECHNICAL REPORT 93
| 21 | Capital and operating costs |
The cost estimates in this section are on a 100% basis with a currency exchange rate assumption of 365 Kazakhstan Tenge to $1.00 Cdn. All cost projections are stated in constant 2024 Canadian dollars and assume the throughput from the production schedule outlined in Table 16-3. The cost projections do not contain any estimates involving the potential mining and processing of inferred mineral resources.
| 21.1 | Capital cost estimates |
Capital costs for Inkai are estimated to be $1.476 billion over the remaining life of the current mineral reserves. The remaining capital costs, as of January 1, 2024, includes $1.196 billion for wellfield development, $95 million for construction and expansion, and $186 million for sustaining capital.
For the period from 2024 to mid-2045, capital cost estimates have increased by 106% compared to the 2018 Technical Report. The majority of the increase relates to wellfield development activities with increased drilling tariffs and higher costs for sulphuric acid and other materials.
It is assumed that wellfield development costs will trend with the production schedule.
Capital for construction and expansion is heavily weighted to 2024 to 2027 due to the capital required for the Ramp-up and the expansion projects, as well as upgrades planned for existing facilities.
Table 21-1 shows the annual capital cost estimate for Inkai from 2024 to mid-2045.
| 21.2 | Operating cost estimates |
Estimated operating expenditures, excluding taxes and royalties, for ISR mining, surface processing, site administration and corporate overhead for Inkai from 2024 to mid-2045 are presented in Table 21-2.
Mining costs consist of annual expenditures incurred at Inkai to extract the uranium from the ore zone and pump the UBS to the surface for further processing.
Surface processing costs are expenditures incurred to turn the UBS from the wellfields into a saleable product. This includes IX (adsorption and elution), precipitation, thickening, drying, calcining and packaging circuits.
Site administration costs consist of general maintenance, health, safety and environment, camp and catering costs, along with charges for additional functions performed at the mine site office, such as geology and supply chain management.
Corporate overhead costs consist of the marketing and transportation of the finished product, along with additional charges due to the administration functions at the Shymkent office, such as the finance and legal departments.
Operating costs for Inkai are estimated to be $12.66 per pound of U3O8 over the remaining life of the current mineral reserves. The operating cost projections have incorporated the production sequence and pattern design of the wellfields along with past production experience to determine the estimated annual expenditures. The 2018 Technical Report showed estimated operating costs to be $9.55 per pound U3O8. Major contributors to the increased operating costs are adjustments to remuneration programs, higher cost for production materials and electricity, increased transportation costs, and other inflationary factors.
2024 INKAI OPERATION TECHNICAL REPORT 94
Table 21-1: Capital Cost Forecast by Year – 100% basis
Capital Costs ($Cdn M) | 2024 | 2025 | 2026 | 2027 | 2028 | 2029 | 2030 | 2031 | 2032 | |||||||||||||||||||||||||||
Total wellfield development | $ | 52.2 | $ | 61.1 | $ | 60.3 | $ | 60.3 | $ | 61.0 | $ | 62.7 | $ | 54.3 | $ | 59.8 | $ | 56.3 | ||||||||||||||||||
Construction and expansion capital | 9.0 | 7.6 | 29.3 | 5.1 | 3.2 | 2.8 | 2.7 | 2.5 | 2.0 | |||||||||||||||||||||||||||
Sustaining capital | 8.7 | 9.2 | 8.2 | 8.4 | 8.0 | 8.6 | 9.3 | 8.6 | 8.6 | |||||||||||||||||||||||||||
|
|
|
|
|
|
|
|
|
|
|
|
|
|
|
|
|
| |||||||||||||||||||
Total Capital Costs | $ | 70.0 | $ | 77.9 | $ | 97.8 | $ | 73.8 | $ | 72.1 | $ | 74.1 | $ | 66.3 | $ | 71.0 | $ | 66.9 | ||||||||||||||||||
|
|
|
|
|
|
|
|
|
|
|
|
|
|
|
|
|
| |||||||||||||||||||
| 2033 | 2034 | 2035 | 2036 | 2037 | 2038 | 2039 | 2040 | 2041 | 2042 | 2043 | 2044 | 2045 | Total | |||||||||||||||||||||||||||||||||||||||||
| $ | 59.9 | $ | 49.5 | $ | 57.0 | $ | 58.1 | $ | 58.6 | $ | 54.8 | $ | 51.5 | $ | 49.6 | $ | 51.6 | $ | 50.7 | $ | 55.0 | $ | 48.2 | $ | 23.0 | $ | 1,195.5 | |||||||||||||||||||||||||||
| 2.7 | 2.1 | 2.8 | 2.1 | 2.2 | 2.8 | 2.2 | 2.9 | 2.3 | 2.3 | 2.4 | 2.4 | 1.2 | 94.6 | |||||||||||||||||||||||||||||||||||||||||
| 8.6 | 8.6 | 8.6 | 8.6 | 8.6 | 8.6 | 8.6 | 8.6 | 8.6 | 8.6 | 8.6 | 8.6 | 4.3 | 185.8 | |||||||||||||||||||||||||||||||||||||||||
|
|
|
|
|
|
|
|
|
|
|
|
|
|
|
|
|
|
|
|
|
|
|
|
|
|
|
| |||||||||||||||||||||||||||
| $ | 71.3 | $ | 60.2 | $ | 68.4 | $ | 68.9 | $ | 69.4 | $ | 66.3 | $ | 62.4 | $ | 61.2 | $ | 62.5 | $ | 61.6 | $ | 66.0 | $ | 59.2 | $ | 28.5 | $ | 1,475.9 | |||||||||||||||||||||||||||
|
|
|
|
|
|
|
|
|
|
|
|
|
|
|
|
|
|
|
|
|
|
|
|
|
|
|
| |||||||||||||||||||||||||||
Note: numbers may not add due to rounding.
Table 21-2: Operating Cost Forecast by Year – 100% basis
Operating Costs ($Cdn M) | 2024 | 2025 | 2026 | 2027 | 2028 | 2029 | 2030 | 2031 | 2032 | |||||||||||||||||||||||||||
Site administration | $ | 25.2 | $ | 32.2 | $ | 34.5 | $ | 32.1 | $ | 32.2 | $ | 32.3 | $ | 33.2 | $ | 33.1 | $ | 33.0 | ||||||||||||||||||
Mining costs | 35.2 | 46.9 | 46.3 | 46.2 | 46.1 | 46.3 | 46.4 | 45.3 | 46.9 | |||||||||||||||||||||||||||
Processing costs | 14.0 | 17.5 | 19.8 | 19.0 | 19.0 | 19.0 | 18.6 | 18.5 | 18.4 | |||||||||||||||||||||||||||
Corporate overhead | 32.6 | 28.6 | 30.5 | 30.4 | 30.3 | 30.4 | 29.3 | 29.3 | 29.3 | |||||||||||||||||||||||||||
|
|
|
|
|
|
|
|
|
|
|
|
|
|
|
|
|
| |||||||||||||||||||
Total Operating Costs | $ | 107.0 | $ | 125.1 | $ | 131.0 | $ | 127.6 | $ | 127.6 | $ | 128.1 | $ | 127.6 | $ | 126.2 | $ | 127.7 | ||||||||||||||||||
|
|
|
|
|
|
|
|
|
|
|
|
|
|
|
|
|
| |||||||||||||||||||
Total Operating Costs ($Cdn/lb) | $ | 13.90 | $ | 13.37 | $ | 12.60 | $ | 12.27 | $ | 12.27 | $ | 12.31 | $ | 12.27 | $ | 12.14 | $ | 12.28 | ||||||||||||||||||
|
|
|
|
|
|
|
|
|
|
|
|
|
|
|
|
|
| |||||||||||||||||||
| 2033 | 2034 | 2035 | 2036 | 2037 | 2038 | 2039 | 2040 | 2041 | 2042 | 2043 | 2044 | 2045 | Total | |||||||||||||||||||||||||||||||||||||||||
| $ | 33.0 | $ | 32.9 | $ | 32.8 | $ | 32.4 | $ | 30.7 | $ | 30.8 | $ | 31.1 | $ | 31.2 | $ | 31.5 | $ | 31.3 | $ | 30.9 | $ | 31.3 | $ | 15.2 | $ | 682.8 | |||||||||||||||||||||||||||
| 46.1 | 47.4 | 46.3 | 49.0 | 44.5 | 45.4 | 44.7 | 46.1 | 45.0 | 46.8 | 46.1 | 49.0 | 23.4 | 985.3 | |||||||||||||||||||||||||||||||||||||||||
| 18.6 | 18.6 | 18.6 | 18.4 | 17.6 | 17.7 | 17.9 | 18.0 | 18.3 | 18.2 | 17.9 | 18.3 | 9.1 | 391.0 | |||||||||||||||||||||||||||||||||||||||||
| 29.3 | 29.3 | 29.3 | 29.0 | 27.6 | 27.7 | 28.2 | 28.4 | 28.8 | 28.7 | 28.3 | 28.9 | 14.3 | 628.7 | |||||||||||||||||||||||||||||||||||||||||
|
|
|
|
|
|
|
|
|
|
|
|
|
|
|
|
|
|
|
|
|
|
|
|
|
|
|
| |||||||||||||||||||||||||||
| $ | 126.9 | $ | 128.2 | $ | 127.0 | $ | 128.9 | $ | 120.4 | $ | 121.6 | $ | 122.0 | $ | 123.7 | $ | 123.6 | $ | 125.0 | $ | 123.2 | $ | 127.5 | $ | 61.9 | $ | 2,687.9 | |||||||||||||||||||||||||||
|
|
|
|
|
|
|
|
|
|
|
|
|
|
|
|
|
|
|
|
|
|
|
|
|
|
|
| |||||||||||||||||||||||||||
| $ | 12.20 | $ | 12.33 | $ | 12.21 | $ | 12.71 | $ | 13.53 | $ | 13.50 | $ | 12.91 | $ | 12.90 | $ | 12.44 | $ | 12.64 | $ | 13.01 | $ | 12.71 | $ | 12.83 | $ | 12.66 | |||||||||||||||||||||||||||
|
|
|
|
|
|
|
|
|
|
|
|
|
|
|
|
|
|
|
|
|
|
|
|
|
|
|
| |||||||||||||||||||||||||||
Note: numbers may not add due to rounding.
2024 INKAI OPERATION TECHNICAL REPORT 95
| 22 | Economic analysis |
| 22.1 | Economic analysis |
The economic analysis shown in Table 22-1 for JV Inkai is based upon Cameco’s assumption regarding the production plan (see Table 16-3 and Figure 16-8), which contemplates mining and processing Inkai’s mineral reserves to mid-2045. The financial projections do not contain any estimates involving the potential mining and processing of inferred mineral resources. Mineral resources that are not mineral reserves have no demonstrated economic viability.
The economic analysis is undertaken from the perspective of JV Inkai and is based on JV Inkai’s share (100%) of Inkai mineral reserves. The economic analysis assumes that 85% of these reserves are recoverable as saleable yellowcake. The net cash flow incorporates the projected sales revenue from the estimated saleable yellowcake, less the related operating and capital cost, mineral extraction tax, and corporate income tax.
The economic analysis results in an after tax NPV (at a discount rate of 12%), for the net cash flows from January 1, 2024 to mid-2045, of $4.3 billion for JV Inkai mineral reserves. Using the total capital invested, along with the operating and capital cost estimates for the remainder of the mineral reserves, the after-tax IRR is estimated to be 26.9%.
| 22.2 | Sensitivities |
The graph in Figure 22-1 illustrates the operation’s sensitivity to changes in annual production output, capital cost, operating cost, and uranium price. The graph illustrates the variability around the base case after-tax net present value of $4.3 billion (see Section 22.1), using sensitivities of plus and minus 20% on annual production output, plus 50% and minus 30% on capital and operating costs, and plus 30% and minus 50% on the independent spot price projections incorporated in the base case as shown in Table 19-1.
Figure 22-1: Sensitivity Analysis – 100% basis
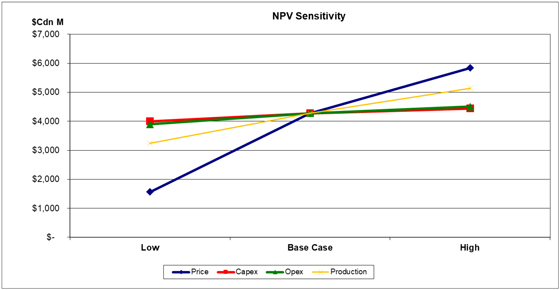
2024 INKAI OPERATION TECHNICAL REPORT 96
Table 22-1: Economic Analysis by Year – 100% basis
Economic Analysis ($Cdn M) | 2024 | 2025 | 2026 | 2027 | 2028 | 2029 | 2030 | 2031 | 2032 | |||||||||||||||||||||||||||
Production volume (000’s lbs U3O8) | 7,696 | 9,360 | 10,400 | 10,399 | 10,399 | 10,399 | 10,399 | 10,399 | 10,399 | |||||||||||||||||||||||||||
Sales Revenue | $ | 923.8 | $ | 1,170.8 | $ | 1,245.9 | $ | 1,148.5 | $ | 1,099.1 | $ | 1,074.4 | $ | 1,037.3 | $ | 1,037.3 | $ | 1,025.0 | ||||||||||||||||||
Operating Costs | 107.0 | 125.1 | 131.0 | 127.6 | 127.6 | 128.1 | 127.6 | 126.2 | 127.7 | |||||||||||||||||||||||||||
Capital Costs | 70.0 | 77.9 | 97.8 | 73.8 | 72.1 | 74.1 | 66.3 | 71.0 | 66.9 | |||||||||||||||||||||||||||
Mineral Extraction Tax | 58.3 | 110.9 | 216.4 | 199.5 | 185.1 | 180.9 | 174.7 | 174.7 | 172.6 | |||||||||||||||||||||||||||
Corporate Income Tax | 140.5 | 175.1 | 167.3 | 152.6 | 145.8 | 142.0 | 128.8 | 131.8 | 130.4 | |||||||||||||||||||||||||||
|
|
|
|
|
|
|
|
|
|
|
|
|
|
|
|
|
| |||||||||||||||||||
Net cash flow | $ | 547.9 | $ | 681.7 | $ | 633.2 | $ | 594.9 | $ | 568.4 | $ | 549.2 | $ | 540.0 | $ | 533.6 | $ | 527.3 | ||||||||||||||||||
|
|
|
|
|
|
|
|
|
|
|
|
|
|
|
|
|
| |||||||||||||||||||
| 2033 | 2034 | 2035 | 2036 | 2037 | 2038 | 2039 | 2040 | 2041 | 2042 | 2043 | 2044 | 2045 | Total | |||||||||||||||||||||||||||||||||||||||||
| 10,399 | 10,399 | 10,399 | 10,141 | 8,904 | 9,012 | 9,446 | 9,591 | 9,934 | 9,888 | 9,468 | 10,033 | 4,827 | 212,292 | |||||||||||||||||||||||||||||||||||||||||
| $ | 1,049.7 | $ | 1,037.3 | $ | 1,025.0 | $ | 1,011.6 | $ | 898.8 | $ | 909.7 | $ | 964.7 | $ | 990.9 | $ | 1,026.3 | $ | 1,021.5 | $ | 978.1 | $ | 1,036.5 | $ | 498.7 | $ | 22,210.6 | |||||||||||||||||||||||||||
| 126.9 | 128.2 | 127.0 | 128.9 | 120.4 | 121.6 | 122.0 | 123.7 | 123.6 | 125.0 | 123.2 | 127.5 | 61.9 | 2,687.9 | |||||||||||||||||||||||||||||||||||||||||
| 71.3 | 60.2 | 68.4 | 68.9 | 69.4 | 66.3 | 62.4 | 61.2 | 62.5 | 61.6 | 66.0 | 59.2 | 28.5 | 1,475.9 | |||||||||||||||||||||||||||||||||||||||||
| 176.8 | 174.7 | 172.6 | 170.4 | 151.4 | 153.2 | 162.5 | 166.9 | 172.8 | 172.0 | 164.7 | 174.6 | 84.0 | 3,569.8 | |||||||||||||||||||||||||||||||||||||||||
| 134.9 | 133.2 | 130.7 | 128.2 | 113.3 | 114.6 | 123.1 | 127.5 | 132.0 | 131.8 | 125.8 | 132.6 | 62.8 | 2,905.2 | |||||||||||||||||||||||||||||||||||||||||
|
|
|
|
|
|
|
|
|
|
|
|
|
|
|
|
|
|
|
|
|
|
|
|
|
|
|
| |||||||||||||||||||||||||||
| $ | 539.8 | $ | 541.0 | $ | 526.2 | $ | 515.2 | $ | 444.3 | $ | 453.9 | $ | 494.8 | $ | 511.5 | $ | 535.3 | $ | 531.1 | $ | 498.4 | $ | 542.6 | $ | 261.5 | $ | 11,571.8 | |||||||||||||||||||||||||||
|
|
|
|
|
|
|
|
|
|
|
|
|
|
|
|
|
|
|
|
|
|
|
|
|
|
|
| |||||||||||||||||||||||||||
The 2025 production forecast is contingent upon receipt of sufficient volumes of sulphuric acid in accordance with a specific schedule.
Note: numbers may not add due to rounding.
2024 INKAI OPERATION TECHNICAL REPORT 97
The analysis shows relatively low sensitivity to changes in its operating or capital cost projections and moderate sensitivity to changes in the annual production output. The relative sensitivity to the independent spot price is significantly higher due to the price estimates being used, which are a reflection of the current U3O8 market environment.
The sensitivity analysis further demonstrates that JV Inkai can withstand financially negative events, such as increasing costs or decreased prices, and continue to deliver strong cash flows.
| 22.3 | Payback |
Payback for JV Inkai, including all actual costs was achieved in 2015, on an undiscounted, after-tax basis. All future capital expenditures are forecasted to be covered by operating cash flow.
| 22.4 | Mine life |
The reserves-based production plan, as described in Section 16 of this technical report, is based on Inkai mineral reserves from which packaged production of an estimated 212.3 million pounds U3O8 is forecast. The projected mine life extends from 2024 until mid-2045.
The reserves-based production plan details production increasing to 10.4 million pounds U3O8 per year. Annual production levels will be dependent on results of further delineation drilling and market conditions. There is no certainty that the planned production will be realized. The reserves-based production profile and economic analysis supporting the reported mineral reserves do not include the inferred resources and their associated extraction costs and revenues.
The economic analysis does not include any evaluation of the mineral resources or possible extension of the mine life.
| 22.5 | Taxes and royalties |
The Tax Code, effective January 1, 2018, provides that subsoil users pay all taxes and payments provided for in the tax legislation effective as of the date of occurrence of the tax obligations. Although under the updated Tax Code the main principles of subsoil users’ taxation remain the same, there are several important changes relevant to special taxes and payments of subsoil users as briefly described below:
| • | The commercial discovery bonus has been abolished |
| • | Payment for the use of the land by subsoil users has been expressly provided for in the updated Tax Code. |
| • | Further amendments to the 2018 Tax Code have been introduced and substantially enacted in subsequent periods. The most relevant amendments are as follows: |
| • | Effective January 1, 2023, the domestic dividend withholding tax (WHT) exemption mechanism was abolished. Instead, the Tax Code provides for the reduced 10% WHT rate on dividends payable by a subsoil user to a foreign shareholder. To apply the reduced tax rate, a subsoil user must comply with a number of conditions, including that a certain portion of minerals extracted in the 12 months prior to the accrual of dividends must be subsequently processed (after primary processing) at the production facilities of the subsoil user or its affiliated entities in Kazakhstan. In addition, the foreign shareholder must have owned its shares in the dividend-paying entity for more than three years and the foreign shareholder must not be resident in a jurisdiction with preferential taxation. Article 10 of the Convention Between the Government of Canada and the Government of the Republic of Kazakhstan for the Avoidance of Double Taxation and the Prevention of Fiscal Evasion with Respect to Taxes on Income and on Capital, provides for a further reduced WHT rate of 5%. Cameco fully expects the treaty to apply and therefore only be subject to the reduced WHT rate of 5%. |
| • | Effective January 1, 2023, JV Inkai is required to pay the mineral extraction tax (MET) of 6% |
2024 INKAI OPERATION TECHNICAL REPORT 98
on production of uranium. The MET is calculated as 6% of the monetary value of the extracted uranium. The monetary value is determined as the weighted average price of uranium from public price reporting sources for the corresponding period. |
| • | Effective January 1, 2025, the applicable MET rate will increase to 9%. |
| • | Effective January 1, 2026, a new MET rate will be introduced that will depend on the actual volume of annual mineral extraction under each subsoil use agreement and the monetary value of the uranium as follows: |
Annual Production | Rate (percentage) | |||||
1. | up to 500 tonnes U inclusive | 4 | % | |||
2. | up to 1,000 tonnes U inclusive | 6 | % | |||
3. | up to 2,000 tonnes U inclusive | 9 | % | |||
4. | up to 3,000 tonnes U inclusive | 12 | % | |||
5. | up to 4,000 tonnes U inclusive | 15 | % | |||
6. | over 4,000 tonnes U | 18 | % | |||
Increased by the following amounts, if applicable:
Weighted average price of natural uranium | Rate (percentage) | |||||
1. | over $70 (US) per pound | 0.5 | % | |||
2. | over $80 (US) per pound | 1.0 | % | |||
3. | over $90 (US) per pound | 1.5 | % | |||
4. | over $100 (US) per pound | 2.0 | % | |||
5. | over $110 (US) per pound | 2.5 | % | |||
Obligatory contributions to the pension fund by the employers, effective from January 1, 2024, is 1.5%, which will be gradually increased to 5% in 2028. From January 1, 2025, the social tax rate will be increased to 11%, and the rate of social security contributions will be increased to 5%. Obligatory medical insurance contributions of 5% are jointly paid by the employer and the employee.
JV Inkai’s costs could be impacted by potential changes to the 2018 Tax Code and by possible increased financial contributions to social and other state causes, although these risks cannot be quantified or estimated at this time.
The rate of corporate income tax on aggregate income is 20%.
There are no other royalties payable by JV Inkai.
2024 INKAI OPERATION TECHNICAL REPORT 99
| 23 | Adjacent properties |
Inkai Block 4 is an operating ISR uranium mine that began operating in 2009. Inkai Block 4’s land position is contiguous with, and south of, Inkai. It is 100% owned by the Southern Mining and Chemical Company (SMCC) joint venture and operated by SMCC, in turn owned by Uranium One Inc. (70% interest) and Kazatomprom (30% interest). The mineralization hosted in the Mynkuduk horizons extends from Inkai’s MA Area onto the Inkai Block 4 property.
Inkai Block 2 is adjacent to Inkai from the southeast and is 100% owned by Kazatomprom. The mineralization in the Middle and Lower Inkuduk and the Mynkuduk horizons extends from Inkai’s MA Area onto the Inkai Block 2 property.
Inkai Block 3 is adjacent to Inkai from the north and is 100% owned by Kazatomprom. The mineralization in the Middle and Lower Inkuduk and the Mynkuduk horizons extends from Inkai’s MA Area onto the Inkai Block 3 property.
This publicly disclosed information (SRK, 2023 and SRK, 2024) has not been verified by the qualified persons responsible for this section. This information is not necessarily indicative of the mineralization in the MA Area that is the subject of this technical report.
Figure 23-1: Adjacent Properties to Inkai MA
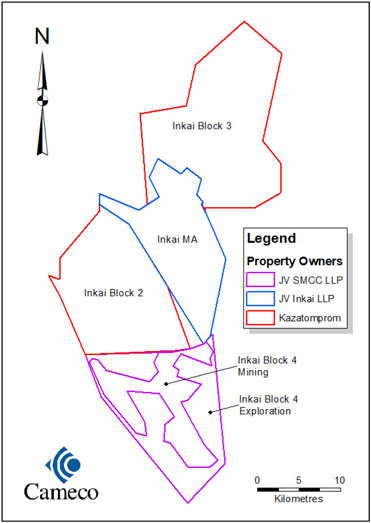
2024 INKAI OPERATION TECHNICAL REPORT 100
| 24 | Other relevant data and information |
| 24.1 | Implementation agreement |
In May, 2016, Cameco and Kazatomprom signed an agreement (Implementation Agreement) to restructure JV Inkai. The restructuring closed on December 11, 2017, with an effective date of January 1, 2018, and consisted of the following:
| • | JV Inkai to have the right to produce 10.4 million pounds U3O8 per year (Cameco’s share - 4.2 million pounds), an increase from the prior licensed production of 5.2 million pounds (Cameco’s share - 3.0 million pounds). |
| • | JV Inkai to have the right to produce from the MA Area until mid-2045 (previously, the licence terms were to 2024 for Block 1 and to 2030 for Blocks 2 and 3). |
| • | Cameco’s ownership interest in JV Inkai decreased to 40% (from 60%) and Kazatomprom’s ownership interest in JV Inkai increased to 60% (from 40%). However, during the Ramp-up, Cameco’s share of annual production remains at 57.5% on the first 5.2 million pounds U3O8. As annual production increases above 5.2 million pounds, Cameco will be entitled to 22.5% of any incremental production, to the maximum annual share of 4.2 million pounds U3O8. Once the Ramp-up is complete, Cameco’s share of all production will be 40%, matching its ownership interest. |
| • | a governance framework that provides protection for Cameco as a minority owner of JV Inkai. |
| • | the boundaries of the MA Area match the agreed production profile for Inkai to 2045. |
| • | priority payment of the loan made by a Cameco subsidiary to JV Inkai to fund exploration and evaluation of Block 3 (the loan was repaid in 2019). |
Cameco and Kazatomprom also completed and reviewed a feasibility study for the purpose of evaluating the design, construction and operation of a uranium refinery in Kazakhstan. In accordance with the agreement, a decision was made not to proceed with construction of the uranium refinery as contemplated in the feasibility study. Cameco and KAP subsequently signed an agreement to licence proprietary UF6 conversion technology to KAP, to allow KAP to examine the feasibility of constructing and operating its own UF6 conversion facility in Kazakhstan.
Supplemental agreements to the Implementation Agreement
JV Inkai has experienced a number of delays in achieving the production levels outlined in the Implementation Agreement. Cameco and Kazatomprom mutually agreed to revise the production Ramp-up schedule via supplemental agreements to the Implementation Agreement while staying within the 20% deviation from the production levels specified in the RUC, as allowed under the Subsoil Code. There have been three supplements since the Implementation Agreement was first signed. The supplemental agreements also included specifics covering:
| • | production level increases to recover the shortfall to the original Ramp-up schedule |
| • | production sharing framework for the production shortfall |
| • | dividend distribution sharing formula |
| • | continued support for the calciner project |
| • | toll processing of a portion of JV Inkai production in 2021 |
Discussions are ongoing between Cameco and Kazatomprom regarding additional supplemental agreements to address ongoing delays to the Ramp-up schedule tied, in part, to challenges with supply of sulphuric acid.
2024 INKAI OPERATION TECHNICAL REPORT 101
| 24.2 | Currency control regulations |
Purchase/sale of foreign currency
Pursuant to the current Law of the Republic of Kazakhstan on Currency Regulation and Currency Control (the Currency Control Law), Kazakh legal entities (other than Kazakh banks) undertake purchasing and/or selling of foreign currency (a) through their bank accounts opened with Kazakh banks and (b) in accordance with the rules on carrying out currency operations in Kazakhstan.
Kazakh resident legal entities (except Kazakh banks) can buy non-cash foreign currency for the national currency for the purposes not related to the fulfillment of obligations in foreign currency on the same business day in an amount not exceeding the equivalent of $50,000 (US). The purposes not related to fulfilment of obligations in foreign currency include transfer of foreign currency to own accounts in foreign banks, gratuitous transfers of money in foreign currency, as well as crediting and transfer of foreign currency to own accounts in local banks.
A Kazakh resident (except Kazakh banks), when applying for the purchase of non-cash foreign currency for national currency in an amount exceeding the equivalent of $50,000 (US), shall indicate the purpose of the purchase and provide a copy of the currency contract, as well as an invoice or other payment document.
Measures for protection of payment balance
Pursuant to the Currency Control Law, the Kazakhstan Government is entitled to introduce “measures for protection of payment balance”, i.e. a special currency regime. These measures can be established when there is a serious threat to the stability of (i) the payment balance, (ii) the internal currency market and (iii) the economic security of the Republic of Kazakhstan – provided that these events cannot be resolved by other economic policy measures.
The measures for protection of payment balance must comply with international treaties ratified by the Republic of Kazakhstan, if and when such treaties entered into within the framework of participation in international associations (organisations) (e.g., Eurasian Economic Community). Such measures must be temporary and should be canceled when the circumstances (events) that led to their introduction are eliminated.
In theory, measures for protection of payment balance may potentially prevent Kazakhstan companies, like JV Inkai, from inter alia paying dividends to their participants abroad or repatriating any or all of its profits in foreign currency. JVI can hold USD on its accounts as needed, and buy foreign currency to pay dividends in case of shortage.
The RUC grants JV Inkai a measure of protection from currency control regulations, granting it the right to freely transfer funds, in state and other currencies, inside and outside Kazakhstan.
| 24.3 | Regulatory risks |
| 24.3.1 | Kazakhstan laws and regulations |
Complex legal regime
Most civil relations in the Republic of Kazakhstan are governed principally by the Civil Code of the Republic of Kazakhstan. The Civil Code broadly recognizes, among other things, the rights of foreign companies and citizens to enter into transactions and to own property in Kazakhstan. These rights are established in the Constitution of the Republic of Kazakhstan and may be limited only by those restrictions set forth in the legislation of Kazakhstan.
In addition to the Civil Code, there are a number of statutes which are material to JV Inkai’s operations. They include, principally, the Subsoil Code, the Law on Limited Liability Partnerships, the Tax Code, the Ecological Code, the Entrepreneurial Code, Law on State Property, the Law on Transfer Pricing, and the Law on Currency Regulation.
2024 INKAI OPERATION TECHNICAL REPORT 102
Although the Republic of Kazakhstan has well-developed legislation, many provisions are subject to discretion in their application, interpretation and enforcement. Consequently, JV Inkai’s efforts to comply with applicable law may not always result in recognized compliance, with resulting consequences disproportionate to the violation. The uncertainties in Kazakhstan laws, as well as in their interpretation and application, represent a risk for JV Inkai’s current operations and plans to increase production.
In addition, the regulation of business in Kazakhstan continues to be influenced by strong governmental control and regulation. This, coupled with state institutions and a judicial system in which many foreign investors still lack confidence, present a challenging environment in which to do business. To maintain and increase Inkai production, ongoing support, agreement and co-operation from Kazatomprom and the Kazakhstan government is required.
Subsoil use legislation
The worldwide trend of resource nationalism has also been embraced by and changes have been negotiated by the government into existing resource use contracts with new laws granting preferences to the state, state enterprises and domestic concerns being adopted.
Amendments to the Subsoil Law in 2007 allowed the government to reopen resource use contracts in certain circumstances, and in 2009, the Kazakhstan government passed a resolution that classified 231 blocks, including Inkai’s blocks, as strategic deposits. The Kazakhstan government re-approved this list in 2011 and in 2018 and Inkai’s blocks remain on it. These actions may increase the government’s ability to expropriate JV Inkai’s properties in certain situations. In 2009, at the request of the Kazakhstan government, JV Inkai amended the RUC to adopt a new tax code, even though the government had agreed to tax stabilization provisions in the original contract.
The previous Subsoil Law which went into effect in 2010 weakened the stabilization guarantee of the prior law and the current Subsoil Code contains a significant number of provisions which apply retrospectively. These developments reflect increased political risk in Kazakhstan.
Nationalization
The risk of nationalization of Cameco’s interest in JV Inkai exists since, under Kazakhstan law, the state has the right to nationalize private property.
Government policy can change to discourage foreign investment and nationalize mineral production, or the government can implement new limitations, restrictions, or requirements.
One of the recent examples of the legislation that poses a risk of property confiscation is the Law on Return of Illegally Diverted Assets to the State adopted after re-election of President Tokayev. This Law is aimed at confiscation of assets deemed to have been illegally acquired by persons holding a responsible public position or a managerial position in state or quasi-state companies (target persons) or by individuals/legal entities affiliated with the target persons. As the Law establishes extremely broad categories of affiliated persons such as, for example, individuals and legal entities related to target persons by common commercial interests, foreign investors are potentially at risk of being declared as affiliated to target persons and their assets deemed illegally diverted and confiscated.
There is no assurance that Cameco’s investment in Kazakhstan will not be nationalized, taken over or confiscated by any authority or body, whether the action is legitimate or not. While there are provisions for compensation and reimbursement of losses to investors under these circumstances, there is no assurance that these provisions would restore the value of the original investment or fully compensate Cameco for the investment loss. This could have a material and adverse effect on JV Inkai’s mineral reserves, Cameco’s earnings, cash flows, financial condition, results of operations or prospects.
Government regulations
2024 INKAI OPERATION TECHNICAL REPORT 103
JV Inkai’s operations may be affected by government regulations restricting production, price controls, export controls, currency controls, taxes and royalties, expropriation of property, environmental, mining and safety legislation, and annual fees to maintain mineral properties in good standing. There is no assurance that the laws in Kazakhstan protecting foreign investments will not be amended or abolished, or that these existing laws will be enforced or interpreted to provide adequate protection against any or all of the risks described above. There is also no assurance that the RUC can be enforced or will provide adequate protection against any or all of the risks described above.
Cameco believes that the regulatory risks related to its JV Inkai investment in Kazakhstan are manageable.
| 24.3.2 | Compliance with legal requirements |
Under the RUC, JV Inkai has the rights to explore for and to extract uranium from the subsoil in the MA Area and it owns the uranium extracted from this subsoil. Its ability to conduct these activities, however, depends upon compliance with its obligations under the RUC and laws of the Republic of Kazakhstan, as well as ongoing support, agreement, and co-operation from the government of Kazakhstan.
The Subsoil Code lists the violations which entitle the Competent Authority to unilateral termination of a resource use contract. For more details please refer to Section 4.5.4. If JV Inkai or its participants commit any of these violations, there is a risk of JV Inkai losing its subsoil use rights due to unilateral termination by the Competent Authority.
The Subsoil Code provides the state with the right to demand amendments to the RUC if activities of a subsoil user, exploring or developing a strategic deposit, entail such changes in the economic interests of the state that pose a threat to national security. This in turn might entail a risk of diminishment of JV Inkai’s rights. The right to demand amendments might be applied broadly by the state leading to a risk of (i) curtailment of JV Inkai’s rights or (ii) termination of the RUC. For more details, please refer to Section 4.5.4.
In the RUC, JV Inkai committed to conducting its operations according to good international mining practices. It complies with the environmental requirements of Kazakhstan legislation and regulations, and, as an industrial company, it must reduce, control or eliminate various kinds of pollution and protect natural resources. Regulatory authorities have the power to issue an order reducing or halting production at a facility that violates environmental standards.
JV Inkai holds the required licences and permits (including but not limited to ecological permits) with stipulated requirements. Failure to comply with the requirements of licences and permits could result in limitations to the activities of JV Inkai. For example, without an ecological permit, JV Inkai will be unable to conduct subsoil operations.
Generally, other breaches of law and/or contractual obligations may also lead to limitation of the right to use JV Inkai’s property.
Compliance with sanctions
It has been reported in the media that Kazakhstan’s official stance is dedication to complying with the sanctions imposed against Russia. The government holds consultations with its Western partners to prevent imposition of secondary sanctions, has introduced restrictions on export of certain types of goods intended for military purposes and has an online tracking system for all goods passing through Kazakhstan’s borders.
That said, since the EU lawmakers adopted a series of sanction packages, it is now possible for sanctions to be imposed on companies and individuals in third countries found to be helping Russia circumvent sanctions. There is a risk of persons, banks and companies based in Kazakhstan being
2024 INKAI OPERATION TECHNICAL REPORT 104
subjected to secondary sanctions, especially considering Kazakhstan’s frequent exports to Russia and that its oil and gas industry, which provides its primary source of revenue, remains highly dependent on Russia as an exporting route.
| 24.3.3 | Geopolitical risk |
Conflict in Ukraine
On February 24, 2022, Russia commenced a military invasion of Ukraine. In response, many jurisdictions have imposed strict economic sanctions against Russia, including Canada, the United States, the European Union, the United Kingdom, and others. Currently, the global nuclear industry relies on Russia for approximately 13% of its supply of uranium concentrates, 22% of conversion supply and 38% of enrichment capacity. With continued conflict, there is ongoing uncertainty about the ability to continue to rely on nuclear fuel supplies coming out of Russia or that ship through Russian ports. The geopolitical situation continues to cause transportation risks in Central Asia, which impacted shipments of finished product from JV Inkai in 2022 and 2023. JV Inkai may continue to experience delays in Cameco’s expected deliveries in 2024 and 2025.
JV Inkai’s business has been and may continue to be impacted by the ongoing conflict between Russia and Ukraine and the related economic sanctions.
Governments continue to develop and implement economic sanctions in response to the conflict. For instance, the Prohibiting Russian Uranium Imports Act was passed by the United States House of Representatives in December 2023 which, if enacted, would ban imports of enriched Russian uranium to the United States. This ban would be subject to certain waivers until 2028 allowing the import of low-enriched uranium from Russia if the United States energy secretary determines there is no alternative source available or if the shipments are in the national interest. Sanctions such as these may lead to significant volatility in global uranium prices. In addition, with the United States presidential election occurring in late 2024, there remains significant uncertainty regarding future economic sanctions in the United States and how they may be altered by a potentially new administration.
The ongoing conflict and economic sanctions may also give rise to additional indirect impacts, including increased fuel prices, supply chain challenges, logistics and transport disruptions and heightened cybersecurity disruptions and threats. Increased fuel prices and ongoing volatility of such prices may have adverse impacts on Cameco’s costs of doing business.
While Cameco and JV Inkai have not yet been materially affected by the current conflict and economic sanctions, there remains significant uncertainty surrounding the outcome of the ongoing conflict, future economic sanctions, and shipments of Cameco’s share of finished JV Inkai product.
Risk of corruption in Kazakhstan
Based on Kazakhstan’s ranking as 93 out of 180 on the 2023 Transparency International Corruption Index, corruption remains an issue in the country. Having assessed Cameco’s and JV Inkai’s exposure to corruption in Kazakhstan, it was concluded that the risk of JV Inkai and Cameco violating applicable laws prohibiting corrupt activities (including Corruption of Foreign Public Officials Act (Canada) and the United States Foreign Corrupt Practices Act of 1977) are mitigated by JV Inkai’s controls relating to such risks, including JV Inkai’s Code of Conduct and Ethics, Business Conduct Policy, Anti-Bribery and Anti-Fraud Policy and Anti-corruption Compliance Manual and Cameco’s controls relating to such risks, including Cameco’s Code of Conduct and Ethics and Global Anti-corruption Program.
There can be no assurance, however, that corruption will not indirectly affect or otherwise impair JV Inkai’s or Cameco’s ability to operate in Kazakhstan and effectively pursue its business plan in that country. The failure of the government of Kazakhstan to continue to fight corruption or the perceived risk of corruption in Kazakhstan could have a material adverse effect on the local
2024 INKAI OPERATION TECHNICAL REPORT 105
economy. Any allegations of corruption in Kazakhstan or evidence of money laundering could adversely affect the country’s ability to attract foreign investment and may have an adverse effect on its economy which in turn could have a material adverse effect on JV Inkai’s and Cameco’s business, results of operations, financial condition and prospects. Additionally, JV Inkai and Cameco are subject to competition with companies from countries that are not subject to or do not follow Canadian, United States or similar laws and regulation with respect to anti-corruption or bribery.
| 24.4 | Production and product delivery risks |
JV Inkai is a mature mining operation, with over 15 years of commercial production history. However, certain geopolitical and supply chain challenges have the potential to impact future activities at the operation that would influence the production Ramp-up, production sustainability and the value of Cameco’s investment. Additional information about these challenges, and how they may impact Cameco’s interest in JV Inkai, are outlined below.
Risks that may materially impact the mineral reserves are discussed in Section 15.4.
Production variance to Resource Use Contract
Based on Kazatomprom’s announcement on February 1, 2024, 2024 production in Kazakhstan was expected to remain approximately 20% below the level stipulated in subsoil use agreements, primarily due to the sulphuric acid shortage in the country and delays in development of new deposits.
JV Inkai’s target for production in 2024 was 8.3 million pounds of U3O8 (100% basis). However, this target was tentative and contingent upon receipt of sufficient quantities of sulphuric acid on a specified schedule. JV Inkai is forecasting that the 2024 production volume will decrease by more than 20% of the original RUC approved production amount of 10.4 million pounds, as maximum 2024 production is now expected to be approximately 7.7 million pounds.
The Subsoil Code permits subsoil users to deviate by up to 20% from the approved production volumes without changing their project documents. As noted, JV Inkai is expected to produce uranium below this allowance in 2024. However, JV Inkai is still expected to meet its financial obligations under the RUC for 2024. There is a risk that the Competent Authority may require JV Inkai to update its project documents and work program and/or catch up production. Cameco does not expect that this underproduction in 2024 will result in the RUC being suspended or terminated. However, there can be no certainty that significant uranium production deficits will not cause the validity of JV Inkai’s RUC to be challenged.
Acid supply
Presently, JV Inkai is experiencing procurement and supply chain issues, most notably, related to the availability of sulphuric acid. The production issues noted above are due, in part, to difficulties procuring sufficient levels of sulphuric acid on a specified schedule and delays in development of new deposits. KAP cited increased demand for sulphuric acid by the agricultural sector for fertilizer production, as well as supply chain disruptions and geopolitical uncertainty, as factors contributing to the procurement issue. Inkai production targets are contingent upon receipt of sufficient quantities of sulphuric acid. If the availability of sulphuric acid continues to be limited through the year, JV Inkai’s production plans for 2025 could be negatively impacted. While KAP actively pursues alternative sources of sulphuric acid, its continued shortage in Kazakhstan could have a material and adverse effect on JV Inkai’s earnings, cash flows, financial condition, or results of operations.
Services procurement in Kazakhstan
In the past, Inkai experienced shortages in supply of drilling services. Since mine development and ore access is dependent on the drilling and equipping of extractor and injector wells, interruptions in
2024 INKAI OPERATION TECHNICAL REPORT 106
drilling may have a detrimental impact on production. While Inkai currently has access to a sufficient supply of drilling services, meeting the Ramp-up production targets will require an increased amount of drilling. Procuring drilling services in sufficient amounts at the appropriate time may prove to be challenging.
Completion of the expansion projects described in Section 17.4 requires procurement of adequate construction services following the requirements described in Section 4.5.6. Currently, Inkai continues to experience issues leading to delays with completion of the expansion projects due to challenges with procuring services of qualified construction contractors. If these issues are not resolved within a reasonable timeframe, Inkai runs the risk of not meeting the production targets set out in the Ramp-up schedule or production cost increases due to reliance on toll milling.
UOC transport and delivery to Cameco
Due to the geographical location of Inkai and Cameco’s customers, JV Inkai and Cameco are highly dependent on third parties for the provision of transportation services, including road, air, and port services. JV Inkai and Cameco negotiate prices for the provision of these services in circumstances where they may not have viable alternatives to using specific providers. They require regulatory approvals to transport and export products, of which Cameco has experienced delays in receiving some of the approvals and permits. Contractual disputes, demurrage charges and port capacity issues, regulatory issues, availability of transports and vessels, inclement weather or other factors can have a material adverse effect on the ability to transport materials and products according to schedules and contractual commitments. These risks could have a material and adverse effect on JV Inkai and Cameco.
The geopolitical situation continues to cause transportation risks in the region. The timing of delivery of the remaining share of Cameco’s 2024 production from JV Inkai is uncertain. Depending on when Cameco receives shipments of its share of Inkai’s production, its share of earnings from this equity-accounted investee and the timing of the receipt of its share of dividends from the joint venture may be impacted.
| 24.5 | Caution about forward-looking information |
This technical report includes statements and information about expectations for the future that are not historical facts. When JV Inkai’s plans and the future performance of Inkai, or other things that have not yet taken place, are discussed, these statements are considered to be forward-looking information or forward-looking statements under Canadian and US securities laws. They are referred to in this technical report as forward-looking information.
Key things to understand about the forward-looking information in this technical report:
| • | It typically includes words and phrases about the future, such as believe, estimate, anticipate, expect, plan, intend, goal, target, forecast, project, scheduled, potential, strategy and proposed or variations (including negative variations) of such words and phrases or may be identified by statements to the effect that certain actions, events or results, may, could, should, would, will be or shall be taken, occur or be achieved. |
| • | It is based on a number of material assumptions, including those listed below, which may prove to be incorrect. |
| • | Actual results and events may be significantly different from what is currently expected because of the risks associated with JV Inkai, its business, the Inkai deposit and mining in the Republic of Kazakhstan. A number of these material risks are listed below. It is recommended that the reader also review other parts of this document, including Section 24.3, which outlines a number of regulatory risks, Cameco’s Annual Information Form for the year ended December 31, 2023 under the headings “Caution about forward-looking information” and “Risks that can affect our business”, Cameco’s annual Management’s Discussion and |
2024 INKAI OPERATION TECHNICAL REPORT 107
Analysis for the year ended 2023 under the headings “Caution about forward-looking information” and “Uranium Operating Properties – Inkai – Managing our risks”. |
| • | Forward-looking information is designed to help the reader understand current views of the qualified persons and management of Cameco. It may not be appropriate for other purposes. Cameco and the qualified persons will not necessarily update this forward- looking information unless required to by securities laws. |
Examples of forward-looking information in this technical report
| • | plans and expectations for Inkai |
| • | results of the economic analysis, including but not limited to forecasts of uranium price, NPV, IRR, cash flows and sensitivity analysis |
| • | estimates of capital, operating, sustaining and decommissioning costs |
| • | mineral resource and mineral reserve estimates |
| • | forecasts relating to mining, development and other activities including but not limited to mine life, mine and processing plant production |
| • | JV Inkai’s expectation that all necessary regulatory permits and approvals will be obtained to meet its future annual production targets |
| • | future royalty and tax payments and rates |
| • | timing for completion of expansion activities supporting the Ramp-up |
Material assumptions
| • | there is no material delay or disruption in JV Inkai’s plans due to natural phenomena, delay in acquiring critical equipment, equipment failure or other causes |
| • | delivery of material is made in the year of production |
| • | there are no labour disputes or shortages |
| • | all necessary contractors, equipment, operating parts and supplies are obtained when they are needed |
| • | regulatory permits and approvals are obtained when they are needed |
| • | the Ramp-up, including the expansion and upgrade of various facilities, proceeds as anticipated |
| • | the MPP, Sat1 and Sat2 processing plants are available, function reliably and as designed |
| • | the mineral resource and mineral reserve estimates and the assumptions they are based on are reliable (see Sections 14.2.3 and 15.2) |
| • | JV Inkai’s development, mining and production plans for Inkai succeed |
| • | equipment required for mining operates reliably |
Material risks
| • | an unexpected geological, hydrological, or mining condition delays or disrupts production |
| • | the Ramp-up is delayed |
| • | the necessary regulatory permits or approvals cannot be obtained or maintained |
| • | natural phenomena, labour disputes, equipment failure, delay in obtaining the required contractors, equipment, operating parts and supplies or other reasons cause a material delay or disruption in production |
| • | the MPP, Sat1, and Sat2 processing plants are not available or do not function as designed |
| • | mineral resource and mineral reserve estimates are not reliable |
| • | JV Inkai’s development, mining or production plans for Inkai are delayed, change or do not |
2024 INKAI OPERATION TECHNICAL REPORT 108
succeed for any reason |
| • | the risks described in Section 24.3 and 24.4 |
2024 INKAI OPERATION TECHNICAL REPORT 109
| 25 | Interpretation and conclusions |
Inkai is an ISR mine successfully operating in the Central Asian Republic of Kazakhstan, with a Mining Allotment covering an area of 139 km2.
Based on the rigorous procedures and experience demonstrated by Volkovgeology, JV Inkai and Cameco personnel, Cameco’s review of the reliability, quality and density of data available, the thorough geological interpretative work, and the different validation tests performed over the years, the qualified persons responsible for the mineral resource and mineral reserve estimates consider that the current estimates of mineral resources and reserves are relevant and reliable.
The economic analysis for JV Inkai is based on Cameco’s assumption regarding the production plan, which contemplates mining and processing Inkai’s mineral reserves to mid-2045, The financial projections do not contain any estimates involving the potential mining and processing of inferred mineral resources
The economic analysis for JV Inkai is undertaken from the perspective of JV Inkai, and is based on its share (100%) of Inkai mineral reserves. It assumes that 85% of these reserves are recoverable as saleable yellowcake.
The economic analysis results in an after tax NPV (at a discount rate of 12%), for the net cash flows from January 1, 2024 to mid-2045, of $4.3 billion (Cdn). Using the total capital invested, along with the operating and capital cost estimates for the remainder of the mineral reserves, the after-tax IRR is estimated to be 26.9%.
Capital costs for Inkai are estimated to be $1.476 billion over the remaining life of the current mineral reserves. The remaining capital costs, as of January 1, 2024, includes $1.196 billion for wellfield development, $95 million for construction and expansion, and $186 million for sustaining capital. Capital for construction and expansion is heavily weighted to 2024 to 2027 due to the capital required for the Ramp-up, as well as upgrades planned for existing facilities.
Operating expenditures, excluding taxes and royalties, for ISR mining, surface processing, site administration and corporate overhead are estimated to be $12.66 per pound of U3O8 over the remaining life of the current mineral reserves.
Cameco believes that the identified regulatory, production and product delivery risks associated with Inkai, presented in Sections 24.3 and 24.4 respectively, are manageable.
From 2009 until end of September, 2024, JV Inkai produced, not including Sat2 Area test mining, 95.7million pounds U3O8 (Cameco’s share - 52.1 million pounds). The reserves-based production plan represents an operating mine life from 2024 until mid-2045, during which Inkai is forecast to produce an estimated 212.3 million pounds U3O8 (Cameco’s share - 85.6 million pounds).
2024 INKAI OPERATION TECHNICAL REPORT 110
| 26 | Recommendations |
Inkai is a developed producing property with sufficient surface rights to meet future mining operation needs for the current mineral reserves.
The authors of this technical report concur with JV Inkai’s plan for construction and expansion of the required project facilities and infrastructure, as outlined in this technical report.
To realize the economic benefits from this operation and to mitigate risk, the authors of this technical report make the following recommendations:
| • | The confidence in grade continuity and hydrogeological conditions can be increased in areas presently classified as probable mineral reserves and indicated or inferred mineral resources, a portion of the latter being included in the LOM Plan. Additional pre-production delineation and in-fill drilling is recommended to upgrade these resources to the measured and/or indicated classification categories, allowing conversion of the resources to proven or probable reserves. This drilling is currently included in the LOM Plan and budget. |
| • | That JV Inkai pursue additional options for procurement of required volumes of sulphuric acid to ensure production reliability. |
| • | Over the life of the operation and at higher production rates, the accumulation of specific ionic species in the holding ponds could reduce surface equipment performance. It is recommended that the concentration of ionic species continue to be monitored. |
| • | That JV Inkai continue to investigate opportunities for continual improvement related to optimization of operating costs through targeted metallurgical studies, maintenance reliability, and operational technology and enhanced control systems. |
2024 INKAI OPERATION TECHNICAL REPORT 111
| 27 | References |
Canadian Institute of Mining, Metallurgy and Petroleum (CIM), (2014), CIM, Definition Standards for Mineral Resources & Mineral Reserves. Retrieved from https://mrmr.cim.org/en/standards/canadian-mineral-resource-and-mineral-reserve-definitions//CIM-Definition-Standards_2014.pdf
CIM, (2019), Estimation of Mineral Resources & Mineral Reserves – Best Practice Guidelines. Retrieved from https://mrmr.cim.org/en/practice-guidelines/estimation-of-mineral-resources-mineral-reserves/cim-mrmr-bp-guidelines_2019_May2022.pdf
Clark, D., Mainville, A.G., Soliz, S.B., Sumner, R.J., 2018: Inkai Operation, South Kazakhstan Oblast, Republic of Kazakhstan, National Instrument 43-101 Technical Report prepared for Cameco Corporation, effective date January 1, 2018
Council of Ministers of the USSR, Resolution N 1128 on the Approval of the Classification for the Mineral Reserves and Prognosticated Resources of the Solid Minerals, 1981
FGU GKZ and CRISCO, Guidelines on Alignment of Russian minerals reporting standards and the CRIRSCO Template, 2010
Geolink Consulting, Groundwater Flow and Plume Migration Modeling Study at the Inkai Deposit, Block No. 1, 2003
GKZ (State Reserve Commission of the USSR), Guidelines on the Application of the Mineral Reserve Classification for the Deposits of Radioactive Minerals, 1986
Institute of Nuclear Physics, Republic of Kazakhstan, Technical Report on Laboratory Tests of Samples of the Chemical Concentrates of Natural Uranium, 2017
International Atomic Energy Agency, In Situ Leach Uranium Mining: An Overview of Operations, 2016
International Atomic Energy Agency, Manual of acid in situ leach uranium mining technology, 2001
JV Inkai, The Elephant And Its Habitat: Regional Geology, MZ-CZ Tectonic Evolution Of Central Asia And The Origin Of Giant Uranium Deposits In The Chu-Sarysu Basin. IAEA Technical Meeting on Origin of sandstone uranium deposits: A global perspective, Vienna, 2012
KAPE, Environmental Baseline Study of the Inkai Deposit, 2002
KAPE, Environmental Baseline Study on Block 2 of the Inkai Deposit, 2006. Kazatomprom, Development of Uranium Mining by ISL in Kazakhstan, IAEA Vienna, 2014
KAZRC, Kazakhstan Code for the Public Reporting of Exploration Results, Mineral Resources and Mineral Reserves, 2016
KAZRC, The Guidelines On Alignment Of Minerals Reporting Standards Of The Republic Of Kazakhstan And The CRIRSCO Template, 2016
Kislyakov, Y.M. and Shetochkin, V.N., Hydrogenic Ore Formation, 2000. English translation from Russian by CERCAMS, 2009
Power Resources Inc., Inkai ISL Uranium Project Feasibility Study Volume 1, November 2003, revised September 2004 and December 2004
SRC (State Reserve Commission of Kazakhstan), Guidelines on the Application of the Mineral Reserve Classification for the Sandstone Uranium Deposits (Amendment to the Guidelines on the Application of the Mineral Reserve Classification for the Deposits of Radioactive Minerals), 2008
2024 INKAI OPERATION TECHNICAL REPORT 112
SRK Consulting, Inkai In-Situ Leach Uranium Project, 2005
SRK Consulting, Resource Verification – Inkai in-situ Leach, 2007
SRK Consulting, Competent Persons’ Report on The Mineral Assets of Joint Stock Company National Atomic Company Kazatomprom, Republic of Kazakhstan, 2023
SRK Consulting, Uranium One, Mineral Resource and Ore Reserve Statements for the Mineral Assets of Joint Stock Company National Atomic Company Kazatomprom, 2024
Two Key, Report on the results of exploration of Block 1 (north-western and central parts of the Block 1) of Inkai deposits for the period 2018-2019 with reserves calculated as of 01.01.2020, 2021
Two Key, Report on the Results of Exploration and Delineation at the Block 3 of Inkai Uranium Deposit with Technical-Economic Substantiation of Permanent Conditions, 2017
Volkovgeology, Assessment of Natural Attenuation on Test Block 1 after In-Situ Leaching at the Inkai Deposit, 2005
Volkovgeology, Report of the Expedition No 7 on the First Stage of the Detailed Exploration and Delineation of the Inkai Uranium Deposit for the Period 1979-1991, with Mineral Resource Estimation as of 01.07.1991. Volumes I, II and III, 1991
Volkovgeology, Report on the Results of Exploration and Delineation Block 2 of the Inkai Uranium Deposit over a Period of 1991-2006, 2007
Volkovgeology, Technical and Economic Substantiation of Permanent Conditions for Block 2 of the Inkai Uranium Deposit, 2007
Volkovgeology, Laboratory Studies on the Technical Parameters of the Ore - Deposit Inkai, 2011
Volkovgeology, Report of Exploration of Block 3 Inkai Uranium Deposit As of 01.01.2015, Volume 1, Book 4, 2015
2024 INKAI OPERATION TECHNICAL REPORT 113
| 28 | Date and signature page |
This NI 43-101 Technical Report titled “Inkai Operation, Turkestan Region, Republic of Kazakhstan”, dated November 12, 2024 with an effective date of September 30, 2024 has been prepared under the supervision of the undersigned. The format and content of the report conform to Form 43-101F1 of NI 43-101 of the Canadian Securities Administrators.
“signed and sealed”
C. Scott Bishop, P. Eng.
Cameco Corporation | November 12, 2024 | |||
“signed and sealed”
Sergey Ivanov, P. Geo.
Cameco Kazakhstan LLC | November 12, 2024 | |||
“signed and sealed”
Alain D. Renaud, P. Geo.
Cameco Corporation | November 12, 2024 | |||
2024 INKAI OPERATION TECHNICAL REPORT 114