SECURITIES AND EXCHANGE COMMISSION
Washington, D.C. 20549
Report of Foreign Issuer
Pursuant to Rule 13a-16 or 15d-16 of
the Securities Exchange Act of 1934
For the month of October 2002.
Scania AB
SE-151 87 Södertälje
Sweden
Indicate by check mark whether the registrant files or will file annually under cover of Form 20-F or Form 40-F.
Form 20-Fx Form 40-F¨
Indicate by check mark whether the registrant by furnishing the information contained in this Form is also thereby furnishing the information to the Commission pursuant to Rule 12g3-2(b) under the Securities Exchange Act of 1934.
Yes¨ Nox
If “Yes” is marked, indicate below the file number assigned to the registrant in connection with Rule 12g3-2(b): 82- .
31 October 2002 SCANIA INTERIM REPORT—JANUARY—SEPTEMBER 2002 |  | |
“In Europe, demand has developed somewhat better than expected, while uncertainty has increased with regard to the outlook for 2003. In Latin America, demand is weak and the effects of a new administration after the presidential election in Brazil are impossible to foresee. Scania’s service-related business has developed well, and together with action programmes in the form of a stricter price policy and more efficient production, the trend of earnings is expected to remain good for the rest of the year,” says Leif Östling, President and CEO.
First three quarters in brief | First nine months | Change in % | ||||||
Units | USD m.* | 2002 | 2001 | |||||
| Trucks and buses | ||||||||
| —Order bookings | 35,166 | 35,884 | -2 | |||||
| —Deliveries | 30,261 | 35,165 | -14 | |||||
Sales and earnings SEK m. unless otherwise stated | ||||||||
Sales, Scania products1 | 3,550 | 32,953 | 33,579 | -2 | ||||
| Operating income, Scania products | 261 | 2,425 | 1,924 | 26 | ||||
| Operating income, Scania Group | 322 | 2,987 | 2,004 | 49 | ||||
| Income after financial items | 265 | 2,462 | 1,524 | 62 | ||||
| Net income | 197 | 1,831 | 1,037 | 77 | ||||
| Operating margin, Scania products, percent | 7.4 | 5.7 | ||||||
Return on equity, percent2 | 11.7 | 14.8 | ||||||
Return on capital employed, excluding Customer Finance operations, percent2 | 12.5 | 14.4 | ||||||
| Earnings per share, SEK | USD 0.99 | 9.16 | 5.19 | |||||
| Earnings per share excluding capital gain, SEK | USD 0.69 | 6.40 | 5.19 | |||||
| Cash flow excluding Customer Finance operations and divestments/acquisitions of companies | 230 | 2,137 | 2,376 | |||||
| Cash flow excluding Customer Finance operations and including divestments/acquisitions of companies | 356 | 3,302 | 1,479 | |||||
| Number of employees, 30 September | 28,212 | 28,812 | ||||||
Number of shares: 200 million
1 | Trucks, buses, engines and service-related products. |
2 | Calculations are based on rolling 12-month income. |
| * | Translated solely for the convenience of the reader at a closing exchange rate of SEK 9.2825 = USD 1.00. |
Unless otherwise stated, all comparisons in brackets refer to the same period of last year.
This report is also available at www.scania.com
1
SCANIA INTERIM REPORT—JANUARY—SEPTEMBER 2002
SCANIA, FIRST THREE QUARTERS OF 2002—COMMENTS BY THE PRESIDENT AND CEO
“The operating income of the Scania Group was largely unchanged compared to the corresponding period of 2001, when the effects of new accounting principles and the capital gain from the divestment of Svenska Volkswagen AB and Din Bil AB have been excluded. The operating margin for Scania products amounted to 7.4 percent during the first nine months of 2002 and 7.0 percent during the third quarter,” notes Leif Östling, President and CEO of Scania.
“Operating income was mainly affected by the fact that about 5,000 fewer trucks and buses were delivered. Sales of service-related products—parts and workshop services—rose by 6 percent. Customer Financing continued to show good performance.
“In Europe, demand is divided. Order bookings increased in Great Britain, Italy and Spain while they declined in Germany. During the first nine months, order bookings in Europe were somewhat higher than during the corresponding period of 2001.
“The number of trucks delivered in western Europe was 11 percent lower than during the first nine months of 2001, and Scania’s market share was 13.5 percent. Demand for heavy trucks in western Europe now seems to have stabilised at a rolling annual rate of around 190,000 units.
“In central and eastern Europe, the positive trend continued. Future EU membership for a number of countries should contribute to continued favourable economic growth, and an increasing demand for transport equipment. Scania’s performance in the region was favourable, especially in Russia.
“Many newer used Scania trucks from western Europe are sold in central and eastern Europe. Scania’s share of this used truck market is higher than the 15 percent share we have in the region for new trucks. The flow of newer used trucks has kept up the sales volume of new trucks in western Europe.
“In the Middle East, demand remained good despite the unrest in the region. In the Far East, the positive volume trend continued, especially in South Korea.
“In European operations, order bookings for trucks rose by 8 percent, and to shorten delivery times, we increased the pace in our production workshops, while deliveries of components and vehicles from Latin America greatly increased.
“In Latin America, demand remained weak. The Argentine market was nearly non-existent. In Brazil, activity was low while waiting for the political strategy to become clear after the presidential election. During the third quarter, the currency weakened further by more than 25 percent, and the real now stands at about 4 per US dollar. Scania’s programme for increasing prices in Brazil to world market level remains in place, even though this has meant a significant decline in market share. Deliveries of components and complete vehicles to markets outside Latin America increased and had a positive effect on earnings in Latin America.
“In bus and coach operations, markets performed well in Europe, while order bookings in Latin America declined by around 30 percent. The restructuring of Scania’s European bus production is progressing largely as planned.
“Scania is currently displaying its trucks for the first time at the Tokyo Motor Show, the leading commercial vehicle exhibition in Asia. Together with our local sales partner Hino, we are displaying products intended for launching in the Japanese market. The task of defining other potential areas of co-operation between Hino and Scania continued.
“In Europe, demand has developed somewhat better than expected, while uncertainty has increased with regard to the outlook for 2003. In Latin America, demand is weak and the effects of a new administration after the presidential election in Brazil are impossible to foresee. Scania’s service-related business has developed well, and together with action programmes in the form of a stricter price policy and more efficient production, the trend of earnings is expected to remain good for the rest of the year,” Mr Östling concludes.
2
SCANIA INTERIM REPORT—JANUARY—SEPTEMBER 2002
SCANIA INTERIM REPORT—JANUARY—SEPTEMBER 2002 | | |
THE MARKET
In western Europe, demand increased during the third quarter. Measured as registrations, the total market for heavy trucks during the first nine months of the year was 157,853 (183,204) units. Scania’s market share amounted to 13.5 (13.6) percent. Order bookings in western Europe increased by 2 percent to 22,619 (22,112) units during the first nine months of 2002.
In central and eastern Europe, order bookings rose by 33 percent during the first nine months of 2002.
In Latin America, order bookings declined by 49 percent compared to the same period last year. In Argentina the decline was due to the political and economic crisis in the country, which essentially caused the market to disappear. In Brazil, decreased order bookings were mainly due to the mounting economic uncertainty, which had an adverse impact on the total market, plus the sharp price hikes that Scania has carried out. Scania’s market share in Brazil declined to 17.4 (28.9) percent during the first nine months of the year.
Order bookings for buses and coaches declined to 3,050 (3,488) units.
Scania’s deliveries of industrial and marine engines fell during the first nine months of the year to 2,198 (3,674) units.
Number of Scania heavy truck registrations, Scania’s 10 largest markets, January-September
2002 | 2001 | Change in % | ||||
| Great Britain | 3,726 | 4,063 | -8 | |||
| France | 3,036 | 3,575 | -15 | |||
| Germany | 2,622 | 3,098 | -15 | |||
| Spain | 2,362 | 2,423 | -2 | |||
| Italy | 2,240 | 2,414 | -7 | |||
| Brazil | 2,169 | 3,960 | -45 | |||
| The Netherlands | 1,570 | 1,836 | -14 | |||
| South Korea | 1,397 | 864 | 62 | |||
| Sweden | 1,278 | 1,472 | -13 | |||
| Belgium | 850 | 1,300 | -35 | |||
| Western Europe | 21,240 | 24,931 | -15 |
Scania’s market shares, heavy trucks,
Scania’s 10 largest markets,
January-September, percent
2002 | 2001 | |||
| Great Britain | 16.6 | 15.8 | ||
| France | 9.7 | 9.9 | ||
| Germany | 7.9 | 7.7 | ||
| Spain | 12.8 | 12.0 | ||
| Italy | 12.9 | 13.6 | ||
| Brazil | 17.4 | 28.9 | ||
| The Netherlands | 17.0 | 17.1 | ||
| South Korea | 13.7 | 14.9 | ||
| Sweden | 49.1 | 48.4 | ||
| Belgium | 15.4 | 18.2 | ||
| Western Europe | 13.5 | 13.6 |
3
SCANIA INTERIM REPORT—JANUARY—SEPTEMBER 2002
SALES
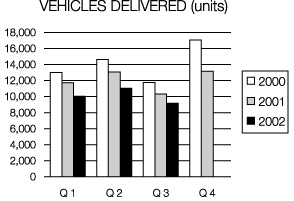
During the first nine months of 2002, the Scania Group’sdeliveries of trucks totalled 27,765 units (31,892), which was a decline of 13 percent. Bus and coach deliveries totalled 2,496 units (3,273), a decline of 24 percent.
��
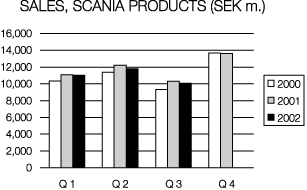
Sales of Scania products declined by 2 percent and amounted to SEK 32,953 m. (33,579). Compared to the preceding year, sales were positively influenced by currency rate effects of about SEK 550 m. including currency hedging.
Sales ofservice-related products rose by 6 percent to SEK 7,925 m. (7,495). The Scania Group’s sales amounted to SEK 33,837 m., compared to SEK 37,900 m. for the same period last year, when sales within car operations were included.
EARNINGS
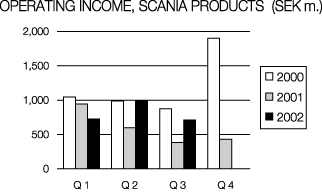
The Scania Group’s total operating income during the first nine months amounted to SEK 2,987 m. (2,004). Capitalisation of research and development expenses positively affected operating income by SEK 425 m. during the first nine months of 2002. Operating income included capital gains of SEK 550 m. from the divestment of Scania’s shareholding in Swedish car operations. The operating margin for Scania products was 7.4 (5.7) percent. During the third quarter, operating income for Scania products amounted to SEK 709 m. (384), which resulted in an operating margin of 7.0 (3.7) percent.
Operating income for European operations3 amounted to SEK 3,667 m. (3,647), excluding research and development expenses as well as corporate costs. Compared to the same period of last year, earnings were favourably influenced by net currency effects of nearly SEK 800 m. as well as by high sales of service-related products. This was offset by lower production volume for both trucks and buses due to lower sales, together with increased internal deliveries from Latin American operations. In addition there were changeover-related expenses, among other things for European bus and coach operations. Third quarter operating income amounted to SEK 1,021 m. (920), which was equivalent to an operating margin of 10.8 (10.0) percent.
Operating income in Latin American operationsamounted to SEK -62 m. (-201). Volume decreased both in Brazil and Argentina. The price hikes carried out in Brazil, cost savings in both Brazil and Argentina, an improved currency situation in Argentina as well as increased component and vehicle deliveries to European operations countered the effect of lower sales volume. During the third quarter, operating income amounted to SEK 41 m. (-118).
3 | European operations are the portion of Scania’s operations that, in principle, supply all markets except Latin American ones with the company’s products and services. |
4
SCANIA INTERIM REPORT—JANUARY—SEPTEMBER 2002
Corporate research and development expenses amounted to SEK 1,077 m. (1,407). Furthermore, SEK 425 m. (0) was capitalised.
Earnings inCustomer Finance operations rose to SEK 248 m. (223). The Customer Finance portfolio amounted to SEK 25,031 m. (24,944).
Car operations4,5: The divestment of Scania’s shareholding in Swedish car operations during the second quarter resulted in a combined purchase price of more than SEK 1.3 billion, and a capital gain of SEK 550 m.
Net financial items totalled SEK -525 m. (-480). This lower figure was mainly due to somewhat higher interest rates, but also the fact that net financial items were influenced by positive currency rate effects in Latin America last year.
The Scania Group’stax expenses were equivalent to 25.8 (32.0) percent of income after financial items. This lower tax rate was affected by the taxation of the capital gain from the divestment of Swedish car operations.
CASH FLOW
Scania’s cash flow, excluding Customer Finance operations and acquisitions/divestments, amounted to SEK 2,137 m. (2,376), of which SEK 1,149 m. (1,291) during the third quarter. Scania’s cash flow including acquisitions/divestments was SEK 3,302 m. (1,479) during the first nine months of 2002.
Tied-up working capital decreased by SEK 985 m. Higher tied-up inventories were offset by lower receivables and increased operating liabilities.
Net investments excluding acquisitions/divestments of businesses amounted to SEK -2,008 m. (-1,362) during the first nine months, of which capitalisation of corporate research and development expenses amounted to SEK -425 m. (0).
Acquisitions/divestments:The divestment of Swedish car operations resulted in a positive cash flow of SEK 1,332 m. In addition, Scania’s net indebtedness improved by SEK 220 m., since the buyer took over previous internal financing. Last year, cash flow was negatively affected by SEK 886 m. due to the acquisition of the Dutch sales and service company Beers.
MISCELLANEOUS
Number of employees
The total number of employees at the close of the first nine months of 2002 was 28,212, compared to 28,541 at year-end 2001. The net effect of acquisitions/divestments of companies resulted in a decrease of about 900 persons. Excluding acquisitions and divestments, the number of employees in European industrial operations rose by about 650 and in the commercial organisation by almost 200. In Latin American operations, the number of employees declined by more than 300.
4 | Car operations included half the importer operations of the Svenska Volkswagen AB in Sweden; the wholly owned Swedish car dealership network Din Bil Sverige AB; and car dealership networks in Finland and Switzerland. |
5 | The divestment of Swedish car operations occurred effective from the beginning of 2002 and was completed during the second quarter when the EU’s competition authority approved the transactions. As a result of this, the sales and earnings of the divested Swedish car operations, which were booked in the report for the first quarter of 2002, were reversed in the second quarter. Only the accumulated capital gain thus remains. |
5
SCANIA INTERIM REPORT—JANUARY—SEPTEMBER 2002
Changes in accounting principles
Beginning with thefirst quarter of 2002, Scania is applying recommendation RR 15 of the Swedish Financial Accounting Standards Council, related to intangible assets. This means that a certain portion of Scania’s corporate research and development expenditures is recognised as assets (capitalised) and amortised over its estimated useful life.
Scania is applying the same accounting principles as in 2001, except for the above mentioned change. This report follows recommendation RR 20 of the Swedish Financial Accounting Standards Council concerning interim reporting.
Södertälje, 31 October 2002
LEIF ÖSTLING
President and CEO
This interim report has not been subjected to special review by the company’s auditors.
Financial information from Scania
Scania’s Year-End Report 2002 will be published on 31 January 2003.
This report contains forward-looking statements that reflect management’s current views with respect to certain future events and potential financial performance. Such forward-looking statements involve risks and uncertainties that could significantly alter potential results. These statements are based on certain assumptions, including assumptions related to general economic and financial conditions in the company’s markets and the level of demand for the company’s products.
This report does not imply that the company has undertaken to revise these forward-looking statements, beyond what is required under the company’s registration contract with Stockholmsbörsen (formerly the OM Stockholm Stock Exchange) if and when circumstances arise that will lead to changes compared to the date when these statements were provided.
| For further information, please contact: | ||
| Magnus Hahn, Business Communications | tel. +46-8 5538 3510, mobile tel. +46-70 551 7903 | |
| Joanna Daugaard, Investor Relations | tel. +46-8 5538 3716, mobile tel. +46-70 518 3716 | |
| Torbjörn Boije, Corporate Control | tel. +46-8 5538 2228, mobile tel. +46-70 591 5016 |
6
SCANIA INTERIM REPORT—JANUARY—SEPTEMBER 2002
Earnings by area of operations
Amounts in SEK m. unless otherwise stated | Nine months | Change in % | 2001 | Oct 01- Sep 02 | ||||||||
USD m.* | 2002 | 2001 | ||||||||||
Number of trucks and buses delivered | ||||||||||||
| European operations | 27,100 | 29,322 | -8 | 40,626 | 38,404 | |||||||
| Latin American operations | 3,855 | 6,000 | -36 | 8,151 | 6,006 | |||||||
| Internal delivered | -694 | -157 | -446 | -983 | ||||||||
| Total Scania vehicles delivered | 30,261 | 35,165 | -14 | 48,331 | 43,427 | |||||||
Sales | ||||||||||||
| European operations | 3,316 | 30,783 | 30,192 | 2 | 42,496 | 43,087 | ||||||
| Latin American operations | 348 | 3,231 | 4,217 | -23 | 5,806 | 4,820 | ||||||
| Less intra-Group sales | -114 | -1,061 | -830 | 28 | -1,089 | -1,320 | ||||||
| Total Scania products | 3,550 | 32,953 | 33,579 | -2 | 47,213 | 46,587 | ||||||
Car operations6 | 95 | 884 | 4,321 | 5,852 | 2,415 | |||||||
| Scania Group total | 3,645 | 33,837 | 37,900 | -11 | 53,065 | 49,002 | ||||||
Operating income | ||||||||||||
| European operations | 395 | 3,667 | 3,647 | 1 | 5,066 | 5,086 | ||||||
| Latin American operations | -7 | -62 | -201 | -581 | -442 | |||||||
| Customer Finance operations | 27 | 248 | 223 | 11 | 278 | 303 | ||||||
| Research and development expenses | -116 | -1,077 | -1,407 | -23 | -1,955 | -1,625 | ||||||
| Corporate costs | -38 | -351 | -338 | 4 | -452 | -465 | ||||||
| Total Scania products | 261 | 2,425 | 1,924 | 26 | 2,356 | 2,857 | ||||||
Car operations7 | 61 | 562 | 80 | 111 | 593 | |||||||
| Scania Group total | 322 | 2,987 | 2,004 | 49 | 2,467 | 3,450 | ||||||
Operating margin in percent | ||||||||||||
| European operations | 11.9 | 12.1 | 11.9 | 11.8 | ||||||||
| Latin American operations | -1.9 | -4.8 | -10.0 | -9.2 | ||||||||
| Total Scania products | 7.4 | 5.7 | 5.0 | 6.1 | ||||||||
| Car operations | — | 1.9 | 1.9 | 24.6 | ||||||||
| Scania Group total | 7.38 | 5.3 | 4.6 | 7.0 | ||||||||
6 | The wholly owned portion of the Swedish dealership network for Svenska Volkswagen products, Din Bil Sverige AB, as well as car dealership networks in Finland and Switzerland were included in the 2001 sales figure. Sales of Svenska Volkswagen products totalled SEK 3,456 m. during the first nine months of 2001. |
7 | Aside from wholly owned businesses, operating income in 2001 included the half-owned importing business Svenska Volkswagen AB. “Operating income” 2002 includes capital gain of SEK 550 m. |
8 | Excluding capital gains in car operations. Operating margin for the Scania Group including capital gains in car operations: 8.8%. |
| * | Translated solely for the convenience of the reader at a closing exchange rate of SEK 9.2825 = USD 1.00. |
7
SCANIA INTERIM REPORT—JANUARY—SEPTEMBER 2002
Sales by product category
Amounts in SEK m. unless otherwise stated | Nine months | Change in % | 2001 | Oct 01-Sep 02 | ||||||||
USD m.* | 2002 | 2001 | ||||||||||
| Trucks | 2,068 | 19,199 | 20,881 | -8 | 29,139 | 27,457 | ||||||
| Buses | 292 | 2,708 | 3,249 | -17 | 4,701 | 4,160 | ||||||
| Engines | 34 | 316 | 462 | -32 | 608 | 462 | ||||||
| Service-related products | 854 | 7,925 | 7,495 | 6 | 10,279 | 10,709 | ||||||
| Used vehicles etc. | 383 | 3,558 | 2,891 | 23 | 4,370 | 5,037 | ||||||
Revenue deferral9 | -81 | -753 | -1,399 | -1,884 | -1,238 | |||||||
| Total Scania products | 3,550 | 32,953 | 33,579 | -2 | 47,213 | 46,587 | ||||||
| Car operations | 95 | 884 | 4,321 | 5,852 | 2,415 | |||||||
| Total | 3,645 | 33,837 | 37,900 | -11 | 53,065 | 49,002 | ||||||
9 | Refers to the difference between sales recognised as revenues and sales value based on deliveries. |
* | Translated solely for the convenience of the reader at a closing exchange rate of SEK 9.2825 = USD 1.00. |
8
SCANIA INTERIM REPORT—JANUARY—SEPTEMBER 2002
Income statement (Divested operations, see note)
Amounts in SEK m. unless otherwise stated | Nine months | Change in % | Q3 | Oct 01-Sep 02 | ||||||||||||
USD m.* | 2002 | 2001 | 2002 | 2001 | 2001 | |||||||||||
| Sales | 3,645 | 33,837 | 37,900 | -11 | 10,381 | 11,707 | 53,065 | 49,002 | ||||||||
| Cost of goods sold | -2,822 | -26,201 | -30,201 | -13 | -8,014 | -9,506 | -42,601 | -38,601 | ||||||||
| Gross income | 823 | 7,636 | 7,699 | -1 | 2,367 | 2,201 | 10,464 | 10,401 | ||||||||
Research and development expenses11 | -116 | -1,077 | -1,407 | -23 | -339 | -401 | -1,955 | -1,625 | ||||||||
Selling expenses12 | -405 | -3,765 | -3,939 | -4 | -1,223 | -1,299 | -5,594 | -5,420 | ||||||||
Administrative expenses13 | -68 | -628 | -614 | 2 | -181 | -183 | -785 | -799 | ||||||||
| Income from Customer Finance operations | 27 | 248 | 223 | 11 | 82 | 81 | 278 | 303 | ||||||||
| Share of income of associated companies | 2 | 23 | 42 | -45 | 4 | 3 | 59 | 40 | ||||||||
| Capital gain from divestments in car operations | 59 | 550 | — | — | — | — | — | 550 | ||||||||
Operating income10 | 322 | 2,987 | 2,004 | 49 | 710 | 402 | 2,467 | 3,450 | ||||||||
| Financial revenues and expenses | -57 | -525 | -480 | 9 | -178 | -104 | -926 | -971 | ||||||||
| Income after financial items | 265 | 2,462 | 1,524 | 62 | 532 | 298 | 1,541 | 2,479 | ||||||||
| Taxes | -68 | -634 | -487 | 30 | -162 | -101 | -496 | -643 | ||||||||
| Minority interests | 0 | 3 | 0 | — | 2 | 2 | 3 | 6 | ||||||||
| Net income | 197 | 1,831 | 1,037 | 77 | 372 | 199 | 1,048 | 1,842 | ||||||||
| Number of shares: 200 million | ||||||||||||||||
Operating margin, percent14 | 7.3 | 5.3 | 4.6 | |||||||||||||
Return on equity, percent15 | 11.7 | 14.8 | 6.5 | |||||||||||||
Return on capital employed, excluding Customer Finance operations, percent15 | 12.5 | 14.4 | 8.4 | |||||||||||||
Return on capital employed, percent15 | 7.7 | 9.3 | 5.6 | |||||||||||||
| Earnings per share, SEK | 9.16 | 5.19 | 1.86 | 0.99 | 5.24 | |||||||||||
10Includes depreciation of | -1,597 | -1,595 | -503 | -530 | -2,157 | -2,159 | ||||||||||
11 | Total research and developmentexpenditure amounted to SEK 1,502 m., of which SEK 425 m. was capitalized. See page 6, “Changes in accounting principles”. |
12 | Selling expenses: Defined as sales-related expenses, including goodwill amortisation, in commercial companies and costs of central commercial-related resources. |
13 | Administrative expenses: Defined as Group-wide costs for management and for the staff units in European and Latin American operations. |
14 | Operating margin for January – September 2002, is reported excluding the capital gain in Car operations. |
15 | Calculations are based on an average of five measurement points (quarters). |
| * | Translated solely for the convenience of the reader at a closing exchange rate of SEK 9.2825 = USD 1.00. |
9
SCANIA INTERIM REPORT—JANUARY—SEPTEMBER 2002
Earnings by quarter
Amounts in SEK m. unless otherwise stated | 2002 | 2001 | ||||||||||||||||
USD m.* | Q3 | Q2 | Q1 | Full year | Q4 | Q3 | Q2 | Q1 | ||||||||||
Sales | ||||||||||||||||||
| European operations | 1,022 | 9,485 | 11,171 | 10,127 | 42,496 | 12,304 | 9,182 | 10,909 | 10,101 | |||||||||
| Latin American operations | 130 | 1,208 | 909 | 1,114 | 5,806 | 1,589 | 1,387 | 1,570 | 1,260 | |||||||||
| Less intra-Group sales | -65 | -600 | -267 | -194 | -1,089 | -259 | -275 | -276 | -279 | |||||||||
| Total Scania products | 1,087 | 10,093 | 11,813 | 11,047 | 47,213 | 13,634 | 10,294 | 12,203 | 11,082 | |||||||||
| Car operations | 31 | 288 | -844 | 1,440 | 5,852 | 1,531 | 1,413 | 1,585 | 1,323 | |||||||||
| Scania Group total | 1,118 | 10,381 | 10,969 | 12,487 | 53,065 | 15,165 | 11,707 | 13,788 | 12,405 | |||||||||
Operating income | ||||||||||||||||||
| European operations | 110 | 1,021 | 1,427 | 1,219 | 5,066 | 1,419 | 920 | 1,218 | 1,509 | |||||||||
| Latin American operations | 4 | 41 | -45 | -58 | -581 | -380 | -118 | -47 | -36 | |||||||||
| Customer Finance operations | 9 | 82 | 85 | 81 | 278 | 55 | 81 | 72 | 70 | |||||||||
| Research and development expenses | -37 | -339 | -346 | -392 | -1,955 | -548 | -401 | -521 | -485 | |||||||||
Corporate costs16 | -10 | -96 | -129 | -126 | -452 | -114 | -98 | -125 | -115 | |||||||||
| Total Scania products | 76 | 709 | 992 | 724 | 2,356 | 432 | 384 | 597 | 943 | |||||||||
| Car operations | 0 | 1 | 515 | 46 | 111 | 31 | 18 | 53 | 9 | |||||||||
| Scania Group total | 76 | 710 | 1,507 | 770 | 2,467 | 463 | 402 | 650 | 952 | |||||||||
| Financial items | -19 | -178 | -141 | -206 | -926 | -446 | -104 | -243 | -133 | |||||||||
| Income after financial items | 57 | 532 | 1,366 | 564 | 1,541 | 17 | 298 | 407 | 819 | |||||||||
| Net income | 40.08 | 372 | 1,076 | 383 | 1,048 | 11 | 199 | 265 | 573 | |||||||||
| Earnings per share, SEK | 0.20 | 1.86 | 5.38 | 1.92 | 5.24 | 0.05 | 0.99 | 1.33 | 2.87 | |||||||||
Operating margin, percent | ||||||||||||||||||
| European operations | 10.8 | 12.8 | 12.0 | 11.9 | 11.5 | 10.0 | 11.2 | 14.9 | ||||||||||
| Latin American operations | 3.4 | -5.0 | -5.2 | -10.0 | -23.9 | -8.5 | -3.0 | -2.9 | ||||||||||
| Scania products | 7.0 | 8.4 | 6.6 | 5.0 | 3.2 | 3.7 | 4.9 | 8.5 | ||||||||||
| Car operations | 0.3 | — | 3.2 | 1.9 | 2.0 | 1.3 | 3.3 | 0.7 | ||||||||||
| Scania Group total | 6.8 | — | 6.2 | 4.6 | 3.1 | 3.4 | 4.7 | 7.7 | ||||||||||
16 | Since certain corporate costs have been reclassified, figures for comparative periods have been adjusted. |
| * | Translated solely for the convenience of the reader at a closing exchange rate of SEK 9.2825 = USD 1.00. |
10
SCANIA INTERIM REPORT—JANUARY—SEPTEMBER 2002
Units by quarter (by geographic area)
2002 | 2001 | |||||||||||||||
Q3 | Q2 | Q1 | Full year | Q4 | Q3 | Q2 | Q1 | |||||||||
Order bookings, trucks | ||||||||||||||||
| Western Europe | 6,732 | 7,633 | 8,254 | 30,158 | 8,046 | 6,105 | 8,125 | 7,882 | ||||||||
| Central and eastern Europe | 888 | 1,077 | 836 | 2,825 | 713 | 731 | 770 | 611 | ||||||||
| Latin America | 1,019 | 721 | 698 | 6,222 | 1,420 | 1,400 | 1,657 | 1,745 | ||||||||
| Asia | 1,040 | 947 | 1,090 | 3,324 | 975 | 478 | 960 | 911 | ||||||||
| Other markets | 323 | 376 | 482 | 1,388 | 367 | 225 | 391 | 405 | ||||||||
| Total | 10,002 | 10,754 | 11,360 | 43,917 | 11,521 | 8,939 | 11,903 | 11,554 | ||||||||
Trucks delivered | ||||||||||||||||
| Western Europe | 5,725 | 7,314 | 6,980 | 30,416 | 7,872 | 6,353 | 8,205 | 7,986 | ||||||||
| Central and eastern Europe | 685 | 704 | 477 | 2,579 | 964 | 526 | 652 | 437 | ||||||||
| Latin America | 951 | 759 | 786 | 6,181 | 1,507 | 1,354 | 1,811 | 1,509 | ||||||||
| Asia | 759 | 1,082 | 638 | 2,994 | 972 | 607 | 771 | 644 | ||||||||
| Other markets | 315 | 339 | 251 | 1,489 | 452 | 326 | 394 | 317 | ||||||||
| Total | 8,435 | 10,198 | 9,132 | 43,659 | 11,767 | 9,166 | 11,833 | 10,893 | ||||||||
Order bookings, buses | ||||||||||||||||
| Europe | 378 | 354 | 675 | 1,613 | 501 | 320 | 394 | 398 | ||||||||
| Latin America | 399 | 216 | 359 | 1,522 | 143 | 356 | 645 | 378 | ||||||||
| Other markets | 143 | 185 | 341 | 1,667 | 670 | 372 | 386 | 239 | ||||||||
| Total | 920 | 755 | 1,375 | 4,802 | 1,314 | 1,048 | 1,425 | 1,015 | ||||||||
Buses delivered | ||||||||||||||||
| Europe | 319 | 456 | 402 | 1,828 | 563 | 356 | 535 | 374 | ||||||||
| Latin America | 225 | 151 | 294 | 1,595 | 378 | 508 | 424 | 285 | ||||||||
| Other markets | �� | 186 | 251 | 212 | 1,249 | 458 | 314 | 302 | 175 | |||||||
| Total | 730 | 858 | 908 | 4,672 | 1,399 | 1,178 | 1,261 | 834 | ||||||||
Deliveries of industrial and marine engines totalled 2,198 (3,674) units during the first nine months of 2002
11
SCANIA INTERIM REPORT—JANUARY—SEPTEMBER 2002
Balance sheet
With Customer Finance operations reported according to the equity accounting method
Amounts in SEK m. unless otherwise stated | 2002 | 2001 | ||||||||||||||
USD m.* | 30 Sep | 30 Jun | 31 Mar | 31 Dec | 30 Sep | 30 Jun | 31 Mar | |||||||||
ASSETS | ||||||||||||||||
| Intangible fixed assets | 196 | 1,817 | 1,697 | 1,549 | 1,364 | 1,267 | 1,083 | 1,199 | ||||||||
Tangible fixed assets17 | 2,574 | 23,896 | 23,730 | 24,689 | 25,695 | 26,265 | 25,803 | 25,043 | ||||||||
| Shares and participations | 341 | 3,162 | 2,977 | 3,415 | 3,287 | 3,030 | 2,795 | 2,716 | ||||||||
| Inventories | 845 | 7,844 | 7,641 | 8,352 | 7,880 | 8,660 | 8,844 | 9,225 | ||||||||
| Other receivables | 946 | 8,787 | 9,604 | 10,729 | 11,016 | 11,865 | 12,298 | 11,612 | ||||||||
| Interest-bearing receivables | 163 | 1,513 | 1,671 | 1,712 | 1,773 | 1,671 | 1,736 | 1,721 | ||||||||
| Liquid investments | 378 | 3,505 | 3,118 | 3,743 | 3,931 | 2,828 | 3,222 | 2,882 | ||||||||
| Total assets | 5,443 | 50,524 | 50,438 | 54,189 | 54,946 | 55,586 | 55,781 | 54,398 | ||||||||
SHAREHOLDERS’ EQUITY AND LIABILITIES | ||||||||||||||||
| Shareholders’ equity | 1,732 | 16,078 | 15,644 | 15,776 | 15,995 | 16,116 | 15,792 | 16,450 | ||||||||
| Provisions for pensions | 204 | 1,896 | 1,911 | 2,174 | 2,087 | 2,010 | 1,937 | 1,921 | ||||||||
| Other provisions | 370 | 3,435 | 3,322 | 3,488 | 3,670 | 3,329 | 3,364 | 3,182 | ||||||||
Other liabilities17 | 2,252 | 20,897 | 20,888 | 21,354 | 21,473 | 23,128 | 22,152 | 21,725 | ||||||||
| Borrowings | 885 | 8,218 | 8,673 | 11,397 | 11,721 | 11,003 | 12,536 | 11,120 | ||||||||
| Total shareholders’ equity and liabilities | 5,443 | 50,524 | 50,438 | 54,189 | 54,946 | 55,586 | 55,781 | 54,398 | ||||||||
| Net indebtedness, excluding provisions for pensions | 508 | 4,713 | 5,555 | 7,654 | 7,790 | 8,175 | 9,314 | 8,238 | ||||||||
| Debt/equity ratio | 0.29 | 0.36 | 0.49 | 0.49 | 0.51 | 0.59 | 0.50 | |||||||||
| Equity per share, SEK | 8.66 | 80.39 | 78.22 | 78.88 | 79.98 | 80.58 | 78.96 | 82.25 | ||||||||
17 | Tangible fixed assets include the value of deliveries with guaranteed residual values or with repurchase obligations that have not yet been recognised as revenues, and for which corresponding payments received have been reported among “Other liabilities”. The following amounts have been recognised: |
Amounts in SEK m. unless otherwise stated | 2002 | 2001 | ||||||||||||
30 Sep | 30 Jun | 31 Mar | 31 Dec | 30 Sep | 30 Jun | 31 Mar | ||||||||
9,075 | 9,129 | 9,326 | 9,821 | 10,255 | 9,926 | 9,628 | ||||||||
* | Translated solely for the convenience of the reader at a closing exchange rate of SEK 9.2825 = USD 1.00. |
12
SCANIA INTERIM REPORT—JANUARY—SEPTEMBER 2002
Balance sheet
Customer Finance operations
Amounts in SEK m. unless otherwise stated | 2002 | 2001 | ||||||||||||||
USD m.* | 30 Sep | 30 Jun | 31 Mar | 31 Dec | 30 Sep | 30 Jun | 31 Mar | |||||||||
ASSETS | ||||||||||||||||
| Lease assets | 962 | 8,926 | 9,114 | 8,948 | 9,894 | 10,146 | 9,865 | 9,644 | ||||||||
| Financial receivables | 1,735 | 16,105 | 15,693 | 15,499 | 15,197 | 14,798 | 13,894 | 13,117 | ||||||||
| Other assets | 66 | 617 | 746 | 675 | 987 | 670 | 739 | 516 | ||||||||
| Liquid investments | 15 | 141 | 140 | 163 | 176 | 272 | 128 | 426 | ||||||||
| Total assets | 2,778 | 25,789 | 25,692 | 25,285 | 26,254 | 25,886 | 24,626 | 23,703 | ||||||||
SHAREHOLDERS’ EQUITY AND LIABILITIES | ||||||||||||||||
| Shareholders’ equity | 327 | 3,032 | 2,837 | 2,635 | 2,492 | 2,260 | 2,064 | 1,967 | ||||||||
| Borrowings | 2,238 | 20,780 | 20,815 | 20,643 | 21,691 | 21,596 | 20,487 | 20,078 | ||||||||
| Other liabilities and provisions | 213 | 1,977 | 2,040 | 2,007 | 2,071 | 2,030 | 2,075 | 1,658 | ||||||||
| Total shareholders’ equity and liabilities | 2,778 | 25,789 | 25,692 | 25,285 | 26,254 | 25,886 | 24,626 | 23,703 | ||||||||
Balance sheet
Including Customer Finance operations
Amounts in SEK m. unless otherwise stated | 2002 | 2001 | ||||||||||||||
USD m.* | 30 Sep | 30 Jun | 31 Mar | 31 Dec | 30 Sep | 30 Jun | 31 Mar | |||||||||
ASSETS | ||||||||||||||||
| Intangible fixed assets | 196 | 1,822 | 1,700 | 1,549 | 1,364 | 1,267 | 1,083 | 1,199 | ||||||||
| Tangible fixed assets | 2,577 | 23,924 | 23,758 | 24,716 | 25,714 | 26,290 | 25,828 | 25,058 | ||||||||
| Shares and participations | 14 | 131 | 140 | 780 | 795 | 770 | 732 | 750 | ||||||||
| Inventories | 852 | 7,909 | 7,709 | 8,431 | 7,946 | 8,719 | 8,902 | 9,319 | ||||||||
| Other receivables | 974 | 9,034 | 9,886 | 11,031 | 11,544 | 12,008 | 12,272 | 11,685 | ||||||||
| Interest-bearing receivables | 1,898 | 17,622 | 17,368 | 16,812 | 16,969 | 16,470 | 15,630 | 14,816 | ||||||||
| Liquid investments | 393 | 3,646 | 3,257 | 3,906 | 4,107 | 3,100 | 3,350 | 3,307 | ||||||||
| Total assets | 6,904 | 64,088 | 63,818 | 67,225 | 68,439 | 68,624 | 67,797 | 66,134 | ||||||||
SHAREHOLDERS’ EQUITY AND LIABILITIES | ||||||||||||||||
| Shareholders’ equity | 1,732 | 16,078 | 15,644 | 15,776 | 15,995 | 16,116 | 15,792 | 16,450 | ||||||||
| Provisions for pensions | 205 | 1,902 | 1,916 | 2,179 | 2,092 | 2,014 | 1,941 | 1,922 | ||||||||
| Other provisions | 474 | 4,404 | 4,192 | 4,366 | 4,575 | 4,137 | 4,124 | 3,892 | ||||||||
| Other liabilities | 1,366 | 12,678 | 12,578 | 12,863 | 12,365 | 13,758 | 12,917 | 12,672 | ||||||||
| Borrowings | 3,127 | 29,026 | 29,488 | 32,041 | 33,412 | 32,599 | 33,023 | 31,198 | ||||||||
| Total shareholders’ equity and liabilities | 6,904 | 64,088 | 63,818 | 67,225 | 68,439 | 68,624 | 67,797 | 66,134 | ||||||||
| Net indebtedness excluding provisions for pensions | 2,734 | 25,380 | 26,231 | 28,135 | 29,305 | 29,499 | 29,673 | 27,891 | ||||||||
| Equity/assets ratio, % | 25.1 | 24.5 | 23.5 | 23.4 | 23.5 | 23.3 | 24.9 | |||||||||
| * | Translated solely for the convenience of the reader at a closing exchange rate of SEK 9.2825 = USD 1.00. |
13
SCANIA INTERIM REPORT—JANUARY—SEPTEMBER 2002
Statement of changes in shareholders’ equity
Amounts in SEK m. unless otherwise stated | USD m.* | 2002 | 2001 | |||
| Shareholders’ equity, 1 January | 1,723 | 15,995 | 15,698 | |||
| Translation differences | -113 | -1,048 | 781 | |||
| Net income for the period | 197 | 1,831 | 1,037 | |||
| Dividends to shareholders | -75 | -700 | -1,400 | |||
| Shareholders’ equity, 30 September | 1,732 | 16,078 | 16,116 |
| * | Translated solely for the convenience of the reader at a closing exchange rate of SEK 9.2825 = USD 1.00. |
14
SCANIA INTERIM REPORT—JANUARY—SEPTEMBER 2002
Statement of cash flow
Amounts in SEK m. unless otherwise stated | Nine months | 2002 | 2001 | |||||||||||||
USD m.* | 2002 | 2001 | USD m.* | Q3 | Q2 | Q1 | Q3 | |||||||||
| Cash from operating activities | 340 | 3,160 | 2,479 | 108 | 1,007 | 1,193 | 960 | 628 | ||||||||
| Change in working capital etc. | 107 | 985 | 1,259 | 100 | 923 | 403 | -341 | 1,127 | ||||||||
Cash flow from operating activities | 447 | 4,145 | 3,738 | 208 | 1,930 | 1,596 | 619 | 1,755 | ||||||||
| Net investments excluding acquisitions/divestments of companies | -217 | -2,008 | -1,362 | -84 | -781 | -738 | -489 | -464 | ||||||||
Cash flow before acquisitions/divestments of companies | 230 | 2,137 | 2,376 | 124 | 1,149 | 858 | 130 | 1,291 | ||||||||
| Net investment through acquisitions/divestments of companies | 126 | 1,165 | -897 | -3 | -28 | 1,322 | -129 | -11 | ||||||||
Cash flow excluding Customer finance operations | 356 | 3,302 | 1,479 | 121 | 1,121 | 2,180 | 1 | 1,280 | ||||||||
| Expansion in Customer Finance operations | -39 | -365 | -1,661 | 6 | 62 | -574 | 147 | -416 | ||||||||
Change in net indebtedness including Customer Finance operations | 317 | 2,937 | -182 | 127 | 1,183 | 1,606 | 148 | 864 | ||||||||
| Change in indebtedness through financing activities | -266 | -2,463 | 900 | -82 | -767 | -1,415 | -281 | -1,098 | ||||||||
| Dividend to shareholders | -75 | -700 | -1,400 | 0 | 0 | -700 | 0 | 0 | ||||||||
Net change in liquid assets and short-term investments | -24 | -226 | -682 | 45 | 416 | -509 | -133 | -234 | ||||||||
| Effect of exchange rate fluctuations on liquid assets and short-term investments | -25 | -235 | 201 | -3 | -27 | -140 | -68 | -16 | ||||||||
| Liquid assets and short-term investments at beginning of period | 442 | 4,107 | 3,581 | 351 | 3,257 | 3,906 | 4,107 | 3,350 | ||||||||
Liquid assets and short-term investments at end of period | 393 | 3,646 | 3,100 | 393 | 3,646 | 3,257 | 3,906 | 3,100 | ||||||||
| * | Translated solely for the convenience of the reader at a closing exchange rate of SEK 9.2825 = USD 1.00. |
15
SCANIA INTERIM REPORT—JANUARY—SEPTEMBER 2002
Number of employees
2002 | 2001 | |||||||||||||
30 Sep | 30 Jun | 31 Mar | 31 Dec | 30 Sep | 30 Jun | 31 Mar | ||||||||
| Research and development, production as well as corporate units | 14,275 | 13,977 | 13,805 | 13,403 | 13,706 | 13,698 | 13,963 | |||||||
| Commercial companies | 9,768 | 9,580 | 10,753 | 10,688 | 10,600 | 10,478 | 10,428 | |||||||
| European operations | 24,043 | 23,557 | 24,558 | 24,091 | 24,306 | 24,176 | 24,391 | |||||||
| Latin American operations | 3,877 | 3,937 | 4,014 | 4,199 | 4,269 | 4,246 | 4,160 | |||||||
| Customer Finance operations | 292 | 281 | 247 | 251 | 237 | 230 | 219 | |||||||
Total number of employees | 28,212 | 27,775 | 28,819 | 28,541 | 28,812 | 28,652 | 28,770 | |||||||
16
SCANIA INTERIM REPORT—JANUARY—SEPTEMBER 2002
Note, divested operations
Income statement
Amounts in SEK m. Unless otherwise stated | Divested operations (Cars) | Remaining operations | ||||||||||||||||||
Nine months | Q3 | Full year | Nine months | Q3 | Full year | |||||||||||||||
2002 | 2001 | 2002 | 2001 | 2001 | 2002 | 2001 | 2002 | 2001 | 2001 | |||||||||||
| Sales | — | 3,456 | — | 1,141 | 4,755 | 33,837 | 34,444 | 10,381 | 10,566 | 48,310 | ||||||||||
| Cost of goods sold | — | -3,135 | — | -1,046 | -4,326 | -26,201 | -27,066 | -8,014 | -8,460 | -38,275 | ||||||||||
| Gross income | — | 321 | — | 95 | 429 | 7,636 | 7,378 | 2,367 | 2,106 | 10,035 | ||||||||||
| Research and development expenses | — | 0 | — | 0 | 0 | -1,077 | -1,407 | -339 | -401 | -1,955 | ||||||||||
| Selling expenses | — | -276 | — | -88 | -355 | -3,765 | -3,663 | -1,223 | -1,211 | -5,239 | ||||||||||
| Administrative expenses | — | 0 | — | 0 | 0 | -628 | -614 | -181 | -183 | -785 | ||||||||||
| Income from Customer Finance operations | — | 0 | — | 0 | 0 | 248 | 223 | 82 | 81 | 278 | ||||||||||
| Share of income of associated companies | — | 29 | — | 9 | 30 | 23 | 13 | 4 | -6 | 29 | ||||||||||
| Capital gain in car operations | 550 | — | — | — | — | 0 | — | — | — | — | ||||||||||
| Operating income | 550 | 74 | — | 16 | 104 | 2,437 | 1,930 | 710 | 386 | 2,363 | ||||||||||
| Financial revenues and expenses | — | -14 | — | -5 | -17 | -525 | -466 | -178 | -99 | -909 | ||||||||||
| Income after financial items | 550 | 60 | — | 11 | 87 | 1,912 | 1,464 | 532 | 287 | 1,454 | ||||||||||
| Taxes | — | -17 | — | -3 | -22 | -634 | -470 | -162 | -98 | -474 | ||||||||||
| Minority interest | — | 0 | — | 0 | 0 | 3 | 0 | 2 | 2 | 3 | ||||||||||
| Net income | 550 | 43 | — | 8 | 65 | 1,281 | 994 | 372 | 191 | 983 | ||||||||||
| Operating margin, percent | 2.1 | 1.4 | 2.2 | 7.2 | 5.6 | 6.8 | 3.7 | 4.9 | ||||||||||||
The divestment of Swedish car operations, including the half-owned Svenska Volkswagen AB and the wholly owned dealership group Din Bil Sverige AB, that was agreed upon during the first quarter was completed during June in conjunction with approval by competition authorities and payment from the buyer. On January 1, the reported value of the assets in the divested operations in the Scania accounts was SEK 1,575 m. and liabilities and provisions amounted to SEK 818 m. During 2001 the cash flow from the discontinued operations was SEK -20 m., net investments were SEK -75 m. and the change in indebtedness due to financing activities was SEK 85 m. The capital gain from the divestment was SEK 550 m.
17
SIGNATURES
Pursuant to the requirements of the Securities Exchange Act of 1934, the registrant has duly caused this report to be signed on its behalf by the undersigned, thereunto duly authorized.
| Date: October 31, 2002 | By: | /s/ PETER HÄRNWALL | ||||||
Name: Peter Härnwall Title: Senior Vice President Corporate Control | ||||||||