Q3 FY 2013 Earnings
Prepared Comments and Slides
August 13, 2013
Rob Eggers
Vice President, Investor Relations
Phone: 408-333-8797
reggers@brocade.com
John Noh
Senior Director, Public Relations
Phone: 408-333-5108
jnoh@brocade.com
NASDAQ: BRCD
Brocade Q3 FY 2013 Earnings 8/13/2013
Prepared comments provided by Rob Eggers, Investor Relations
Thank you for your interest in Brocade's Q3 Fiscal 2013 earnings presentation, which includes prepared remarks, safe harbor, slides, and a press release detailing fiscal third quarter 2013 results. The press release, along with these prepared comments and slides, has been furnished to the SEC on Form 8-K and has been made available on the Brocade Investor Relations website at www.brcd.com. The press release will be issued subsequently via Marketwired.
© 2013 Brocade Communications Systems, Inc. Page 2 of 24
Brocade Q3 FY 2013 Earnings 8/13/2013
© 2013 Brocade Communications Systems, Inc. Page 3 of 24
Brocade Q3 FY 2013 Earnings 8/13/2013
Today’s prepared comments include remarks by Lloyd Carney, Brocade CEO, regarding the company’s quarterly results, its strategy, and a review of operations, as well as industry trends and market/technology drivers related to its business; and by Dan Fairfax, Brocade CFO, who will provide a financial review.
A management discussion and live question and answer conference call will be webcast at
2:30 p.m. PT on August 13 at www.brcd.com and will be archived on the Brocade Investor Relations website.
© 2013 Brocade Communications Systems, Inc. Page 4 of 24
Brocade Q3 FY 2013 Earnings 8/13/2013
Prepared comments provided by Lloyd Carney, CEO
© 2013 Brocade Communications Systems, Inc. Page 5 of 24
Brocade Q3 FY 2013 Earnings 8/13/2013
This was a solid quarter for Brocade. Revenue came in above our guidance range and we exceeded our expectations for non-GAAP operating margin, non-GAAP EPS, and cash flow. Revenue in the third quarter was $537 million, down 3% from Q3 12 and down slightly sequentially.
The storage market is recovering more quickly than we had expected, following a challenging second quarter. This improving storage environment, coupled with continued strong adoption of Gen 5 Fibre Channel, resulted in SAN product revenue in the quarter that surpassed our expectations. The storage market continues to be softer than it was a year ago, but we are receiving positive indications from our partners that end-user demand is improving.
Although IP Networking product revenue was up slightly sequentially, it was short of our expectations for the quarter. Our Federal sales were disappointing, as certain deals did not close as a result of the challenging federal environment. On the positive side, Brocade VDX switch revenue grew nicely in the quarter and we continue to be on track to reach our goal of an annualized run-rate of $100 million revenue in Q4 13. We continue to believe that Ethernet fabrics represent an exciting opportunity for Brocade and a significant differentiator of our product portfolio for data center networking. We have also seen a significant increase in customer wins, network function virtualization evaluations, and trial activities with our software networking solutions.
From an expense management perspective, we are making great progress towards our goal of reducing annual spending by $100 million by February 2014. Our company-wide effort has resulted in annualized savings of more than $60 million since Q1 13. The lower spending and improved operating margin performance contributed to Q3 GAAP EPS of $0.26, up $0.17 Yr./Yr., and non-GAAP EPS of $0.19 in the quarter, up $0.05 Yr./Yr., which exceeded expectations.
In addition, we have recognized a $76.8 million gain during the quarter related to a settlement with A10 Networks of a long-standing lawsuit. This one-time gain has been excluded from our non-GAAP results in the quarter.
Finally, we repurchased more than $100 million in common stock, or approximately 18 million shares, during the third quarter. This was the largest repurchase of stock for Brocade within a single quarter since Q4 11 and demonstrates both strong cash flow and a commitment to returning cash to our shareholders.
© 2013 Brocade Communications Systems, Inc. Page 6 of 24
Brocade Q3 FY 2013 Earnings 8/13/2013
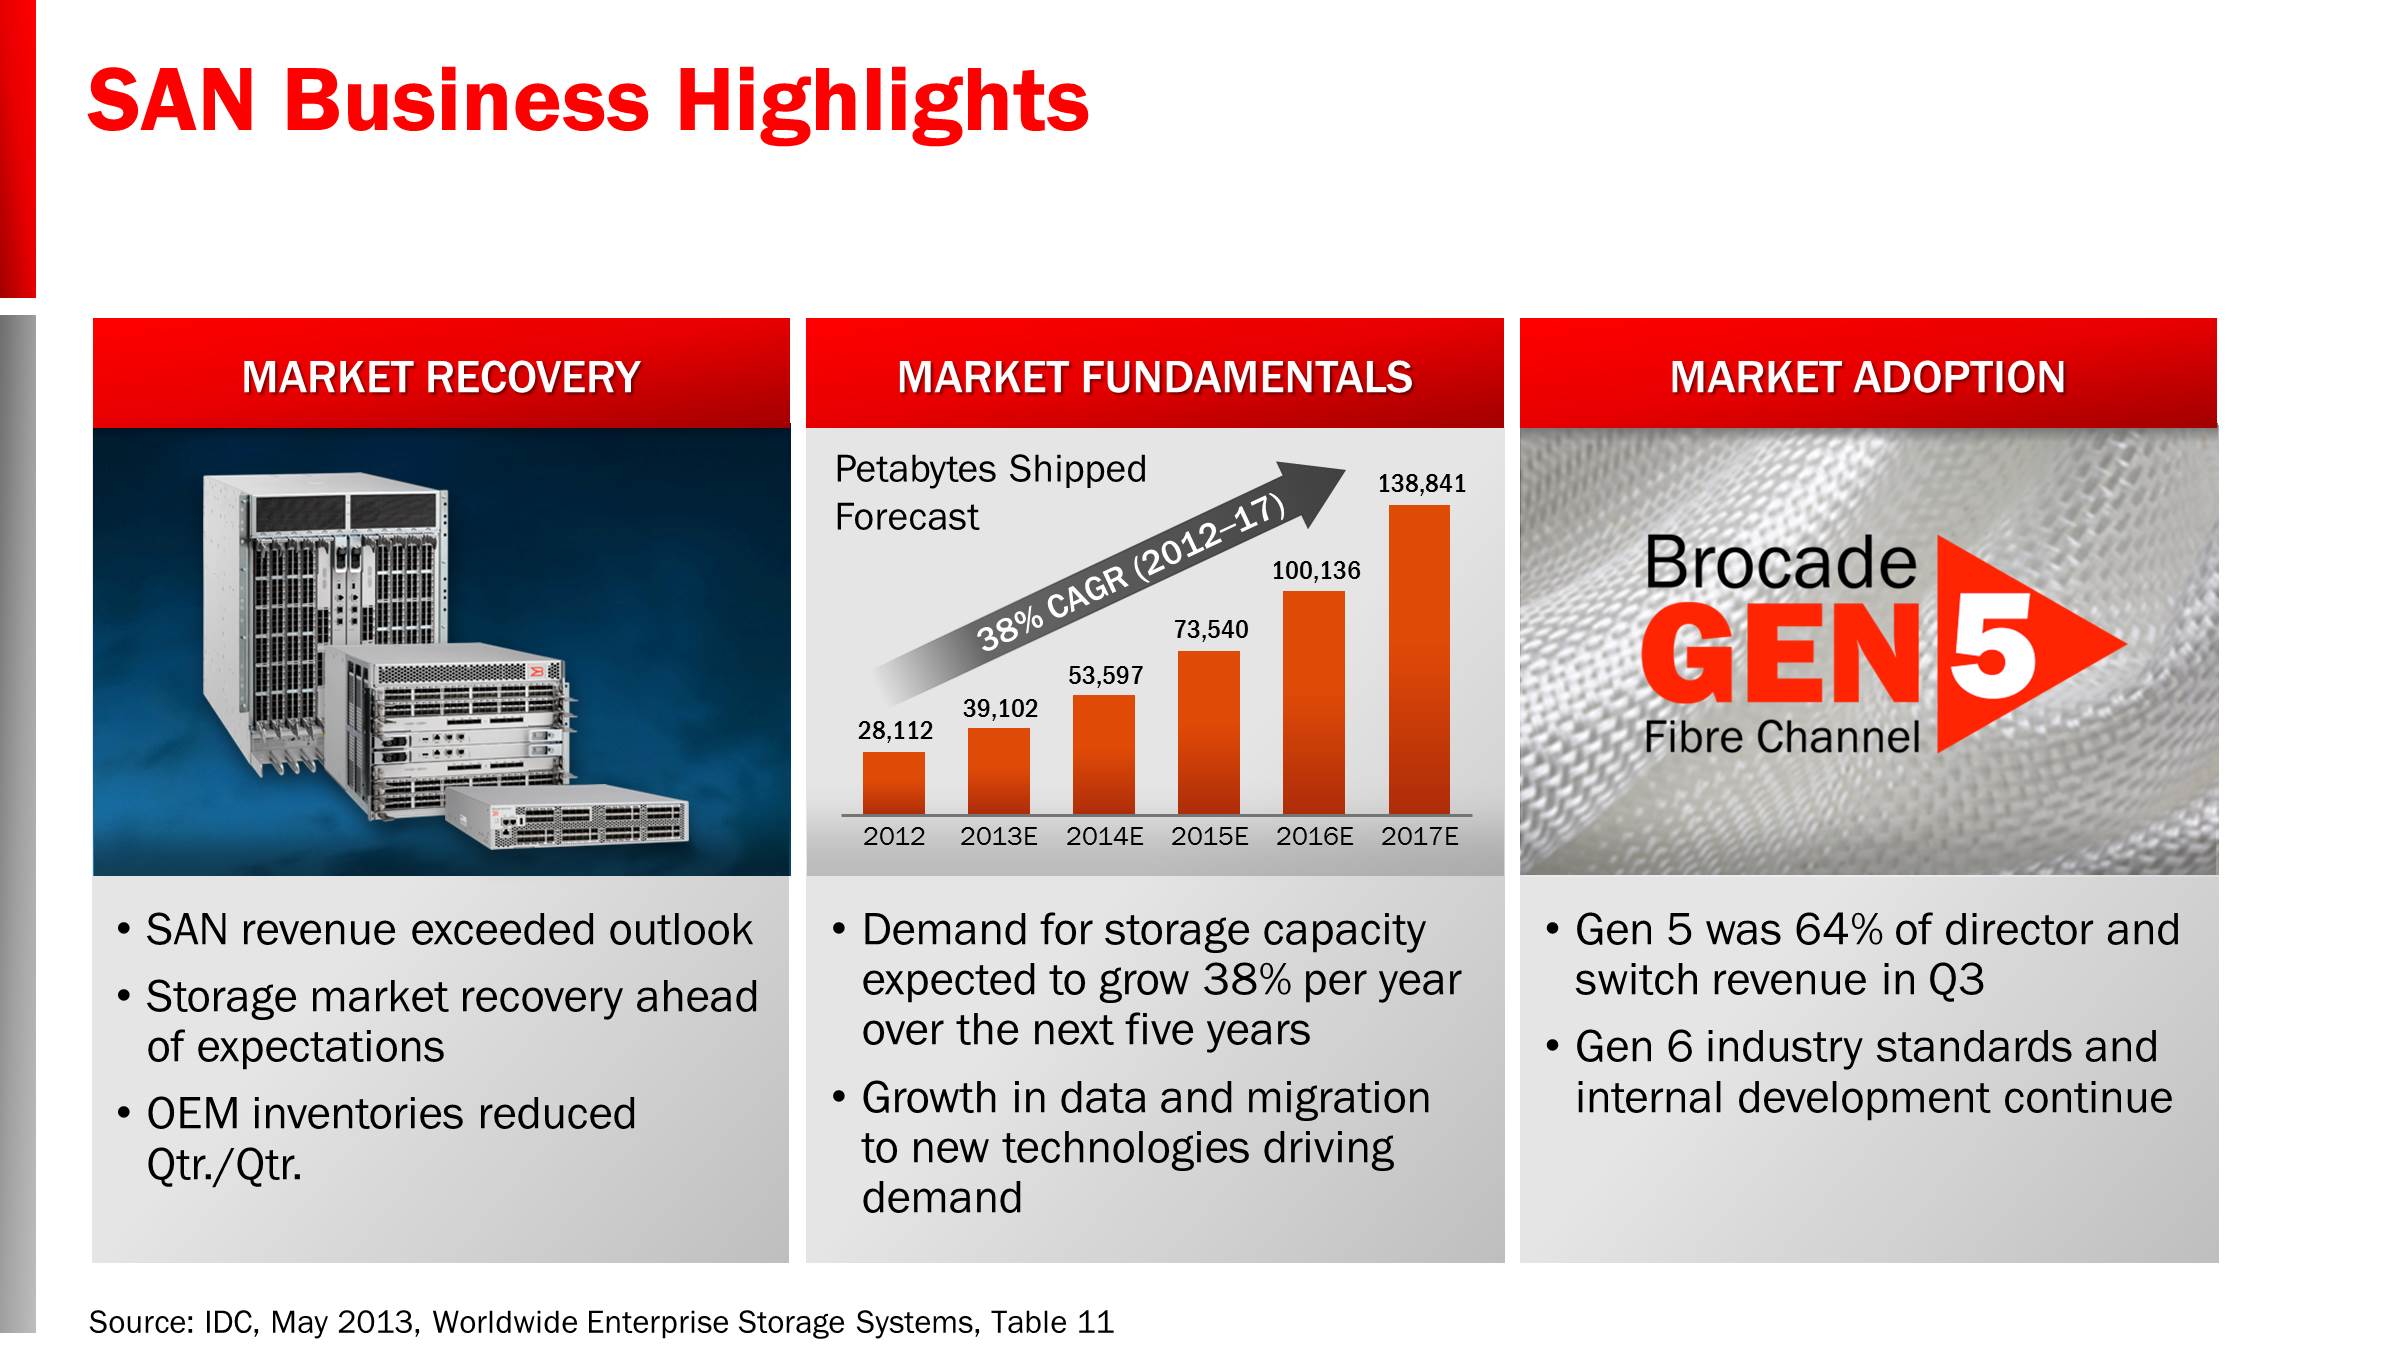
Turning to business highlights in storage area networking, SAN product revenue was $314 million in Q3, down 2% Yr./Yr. and down 2% Qtr./Qtr. We are seeing a rebound occurring in the broader storage market and believe that the recovery will strengthen for the remainder of this calendar year. In addition to our better-than-expected SAN revenue, OEM inventory was lower exiting the quarter, which is an indicator of improving end-user demand.
We continue to view the long-term SAN market fundamentals as intact, in spite of a continuing soft storage market in the near term. Storage capacity expansion is a major pain point for IT organizations as they manage the ever-increasing growth of data. In fact, IDC estimates that demand for storage capacity is expected to grow at a CAGR of 38% over the next 5 years. In response to this and other market conditions, we are seeing rapid industry adoption of our Gen 5 (16 Gbps) Fibre Channel, which now represents 64% of total SAN director and switch revenue. Fibre Channel technology offers significant advantages in terms of performance and reliability, particularly with the continuing migration to high-density server virtualization and cloud computing. Our innovative Fibre Channel solutions solidify our substantial lead over competitive offerings in this market. Our development is underway for Gen 6 (32 Gbps+) and customer interest for this technology is high.
© 2013 Brocade Communications Systems, Inc. Page 7 of 24
Brocade Q3 FY 2013 Earnings 8/13/2013
IP Networking product revenue was $134 million, down 8% Yr./Yr. and up 1% Qtr./Qtr. A key factor in the lower year-over-year revenue was lower-than-expected Federal sales, which were down approximately $14M Yr./Yr. While we believe that many of the federal deals in our sales funnel have funding, federal agencies have been slower in spending their budgets this year. We anticipate that we will see higher sales in the fourth fiscal quarter, which coincides with the U.S. government fiscal year end. Further, we are expanding our public sector reach by continuing to diversify our sales into a broader set of federal programs in defense, intelligence and civilian agencies. We were pleased to announce that the Brocade MLX and MLXe 100 Gigabit Ethernet networking solutions were approved for the U.S. Department of Defense Unified Communications Product List this past quarter. These are the first 100 Gigabit Ethernet solutions to receive this certification, opening up new opportunities for Brocade in the federal market.
Moving to the data center IP business, Brocade VDX switch revenue showed continued strong growth in Q3, increasing by over 80% year-over-year. With an annualized run-rate of over $80 million revenue in Q3, we are on pace to reach our goal of $100 million run-rate in Q4 13. To date we have shipped more than 400,000 Brocade VDX switch ports to our customers, helping to establish Brocade as a leader in this exciting new market.
Ethernet fabrics provide an ideal network architecture to fully leverage the benefits that software can offer in highly-virtualized and cloud-enabled environments. Brocade continues to be a leader in software-defined networking (SDN) with significant investment in our technology and product portfolio. As proof of the benefits of our advanced software capabilities, during the third quarter the Brocade vRouter was launched in the Rackspace Open Cloud, enabling Rackspace customers to deploy easy-to-configure advanced virtual networking and virtual firewall capabilities. The Brocade vRouter is also available in the Amazon Web Services (AWS) GovCloud. These new AWS cloud services are designed to help U.S. government agencies and contractors move more sensitive workloads to the cloud.
© 2013 Brocade Communications Systems, Inc. Page 8 of 24
Brocade Q3 FY 2013 Earnings 8/13/2013
As we have stated, our strategy is to first focus on data center networking. Within this space, we are prioritizing markets in which we can be most successful and where we can hold a leading market share position of meaningful size. Specifically, we will continue to invest in maintaining our considerable installed base in SAN, and growing our footprint in data center IP and emerging technologies, such as software networking. We will also make targeted investments in campus networking where price-performance and ease of use are the value drivers for this market. We believe that this strategy will best leverage our core competencies, product strengths, and competitive positioning. According to IDC, Brocade holds the number two position in worldwide market share in data center networking. Our investments in technologies, such as Ethernet fabrics, 40/100 GbE, SAN innovations, and SDN, will provide additional opportunities for market share gains.
Beyond market share, Brocade is also tied for the number two position in Infonetics' recent Enterprise Networking and Communication vendor scorecard. This ranking takes into consideration a diverse set of factors, such as market share, innovation, financial stability, product reliability, and service and support. Our positioning speaks to the overall strength of our business on many of the key fronts that will ensure our growth and success in the years to come.
On the operational front, we are focusing on improving our profitability and maximizing our return on investment. We will continue our on-going efforts to reduce our annualized spending by $100 million. To date, we have cut expenses across our organization in non-strategic areas and have put additional processes in place to ensure we are spending at the right level to support the company's strategic initiatives. For example, we have eliminated some broader marketing programs and events, aligned the product roadmap to our focused strategy, reduced capital expenditures, and have placed increased scrutiny on headcount replacements. As such, we achieved nearly $15 million savings in operating expenses in Q3 and have reduced by more than $2 million in spending above the line that has benefited both our product and services gross margins. Using Q1 13 as a baseline, this has resulted in annualized savings of more than $60 million and contributed to year-over-year growth in EPS in Q3.
We remain committed to a regular share-repurchase program with the goal of reducing the number of shares outstanding. During the quarter we repurchased more than $100 million of common stock bringing our total to $187 million of stock through Q3 of this fiscal year. This demonstrates both strong cash flow and a commitment to returning cash to our shareholders. At the end of Q3 13 we had $361 million remaining of the Board-authorized share-repurchase program.
© 2013 Brocade Communications Systems, Inc. Page 9 of 24
Brocade Q3 FY 2013 Earnings 8/13/2013
In closing, Q3 was a solid quarter in which we exceeded our guidance for revenue, profitability, and cash flow. The storage market is showing encouraging signs of recovery and our progress in Ethernet fabrics is on track with our goal. We are making great strides on our spending-reduction initiatives and I am encouraged by both the amount of savings as well as how quickly we have been able to realize these benefits in our financial results.
At our Analyst and Technology Day event on September 25, we will provide additional details about our progress and take you through an updated financial model, as well as our market opportunity assessment. I encourage you to attend in person or participate virtually, and look forward to speaking with you soon.
© 2013 Brocade Communications Systems, Inc. Page 10 of 24
Brocade Q3 FY 2013 Earnings 8/13/2013
Prepared comments provided by Dan Fairfax, CFO
© 2013 Brocade Communications Systems, Inc. Page 11 of 24
Brocade Q3 FY 2013 Earnings 8/13/2013
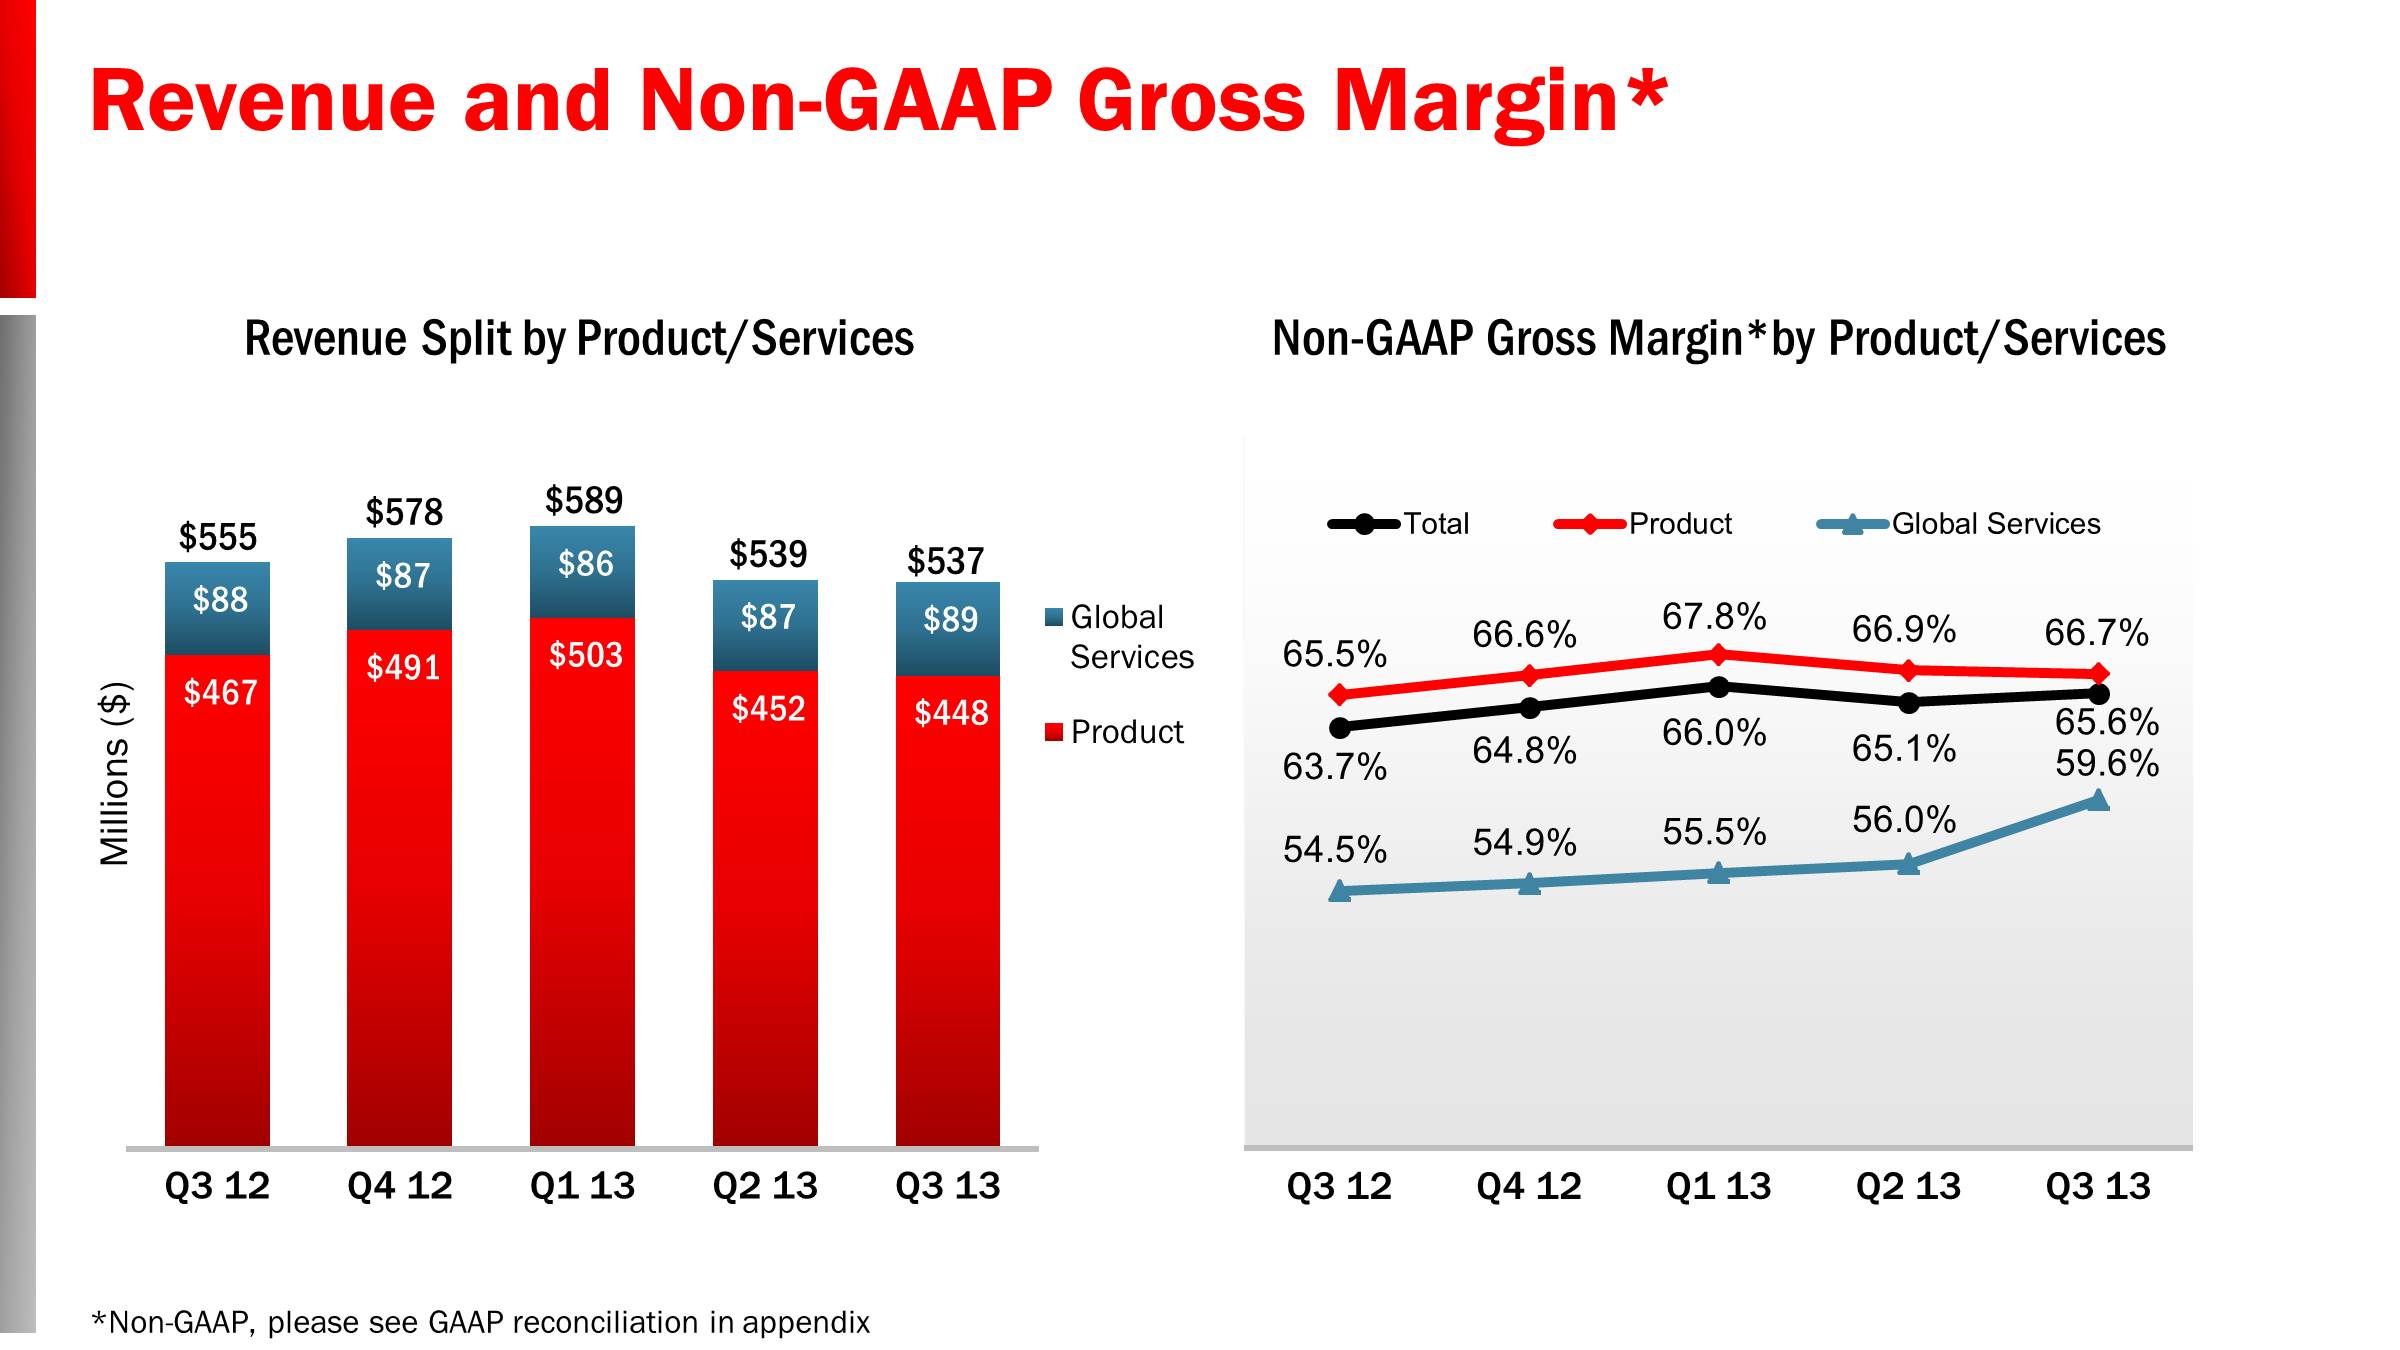
In Q3 13 Brocade reported revenue of $537 million, a decrease of 3% Yr./Yr. and slightly down sequentially. As we look at our business by reporting segment, Q3 SAN product revenue was $314 million, a decrease of 2% Yr./Yr. primarily due to order-rate softness in the storage array market that impacted some of our OEM partners in first half calendar 2013. SAN product revenue was down 2% sequentially, which is typical in our seasonally softer third quarter. SAN product revenue represented 59% of total revenue, unchanged quarter-over-quarter and slightly higher than 58% reported in Q3 12.
Revenue from our IP Networking products was $134 million, down 8% Yr./Yr. and up 1% sequentially. The year-over-year decline was due to lower Federal revenue. At the beginning of the quarter, we had anticipated more federal deals to close and ship, as is typical in our fiscal third quarter. But within the current challenging federal environment and sequester, orders for some funded projects were delayed and did not close during the quarter. Non-Federal revenue was 3% higher both year-over-year and quarter-over-quarter. IP Networking product revenue represented 25% of total revenue in Q3, flat from Q2 13 and down slightly from 26% in Q3 12.
Q3 Global Services revenue was $89 million, up slightly year-over-year and sequentially. Our Global Services revenue represented 16% of total Q3 revenue, relatively unchanged quarter-over-quarter and year-over-year.
Non-GAAP gross margin was 65.6% in Q3, up 190 basis points from Q3 12 and up 50 basis points from Q2 13. The year-over-year improvement in gross margin was due primarily to a more favorable mix within our Ethernet product sales, a higher percentage of SAN products in our overall revenue, and lower spending. Non-GAAP operating margin was 21.6% in Q3, up 210 basis points from Q3 12 and up 260 basis points Qtr./Qtr., due to improved gross margins and lower spending.
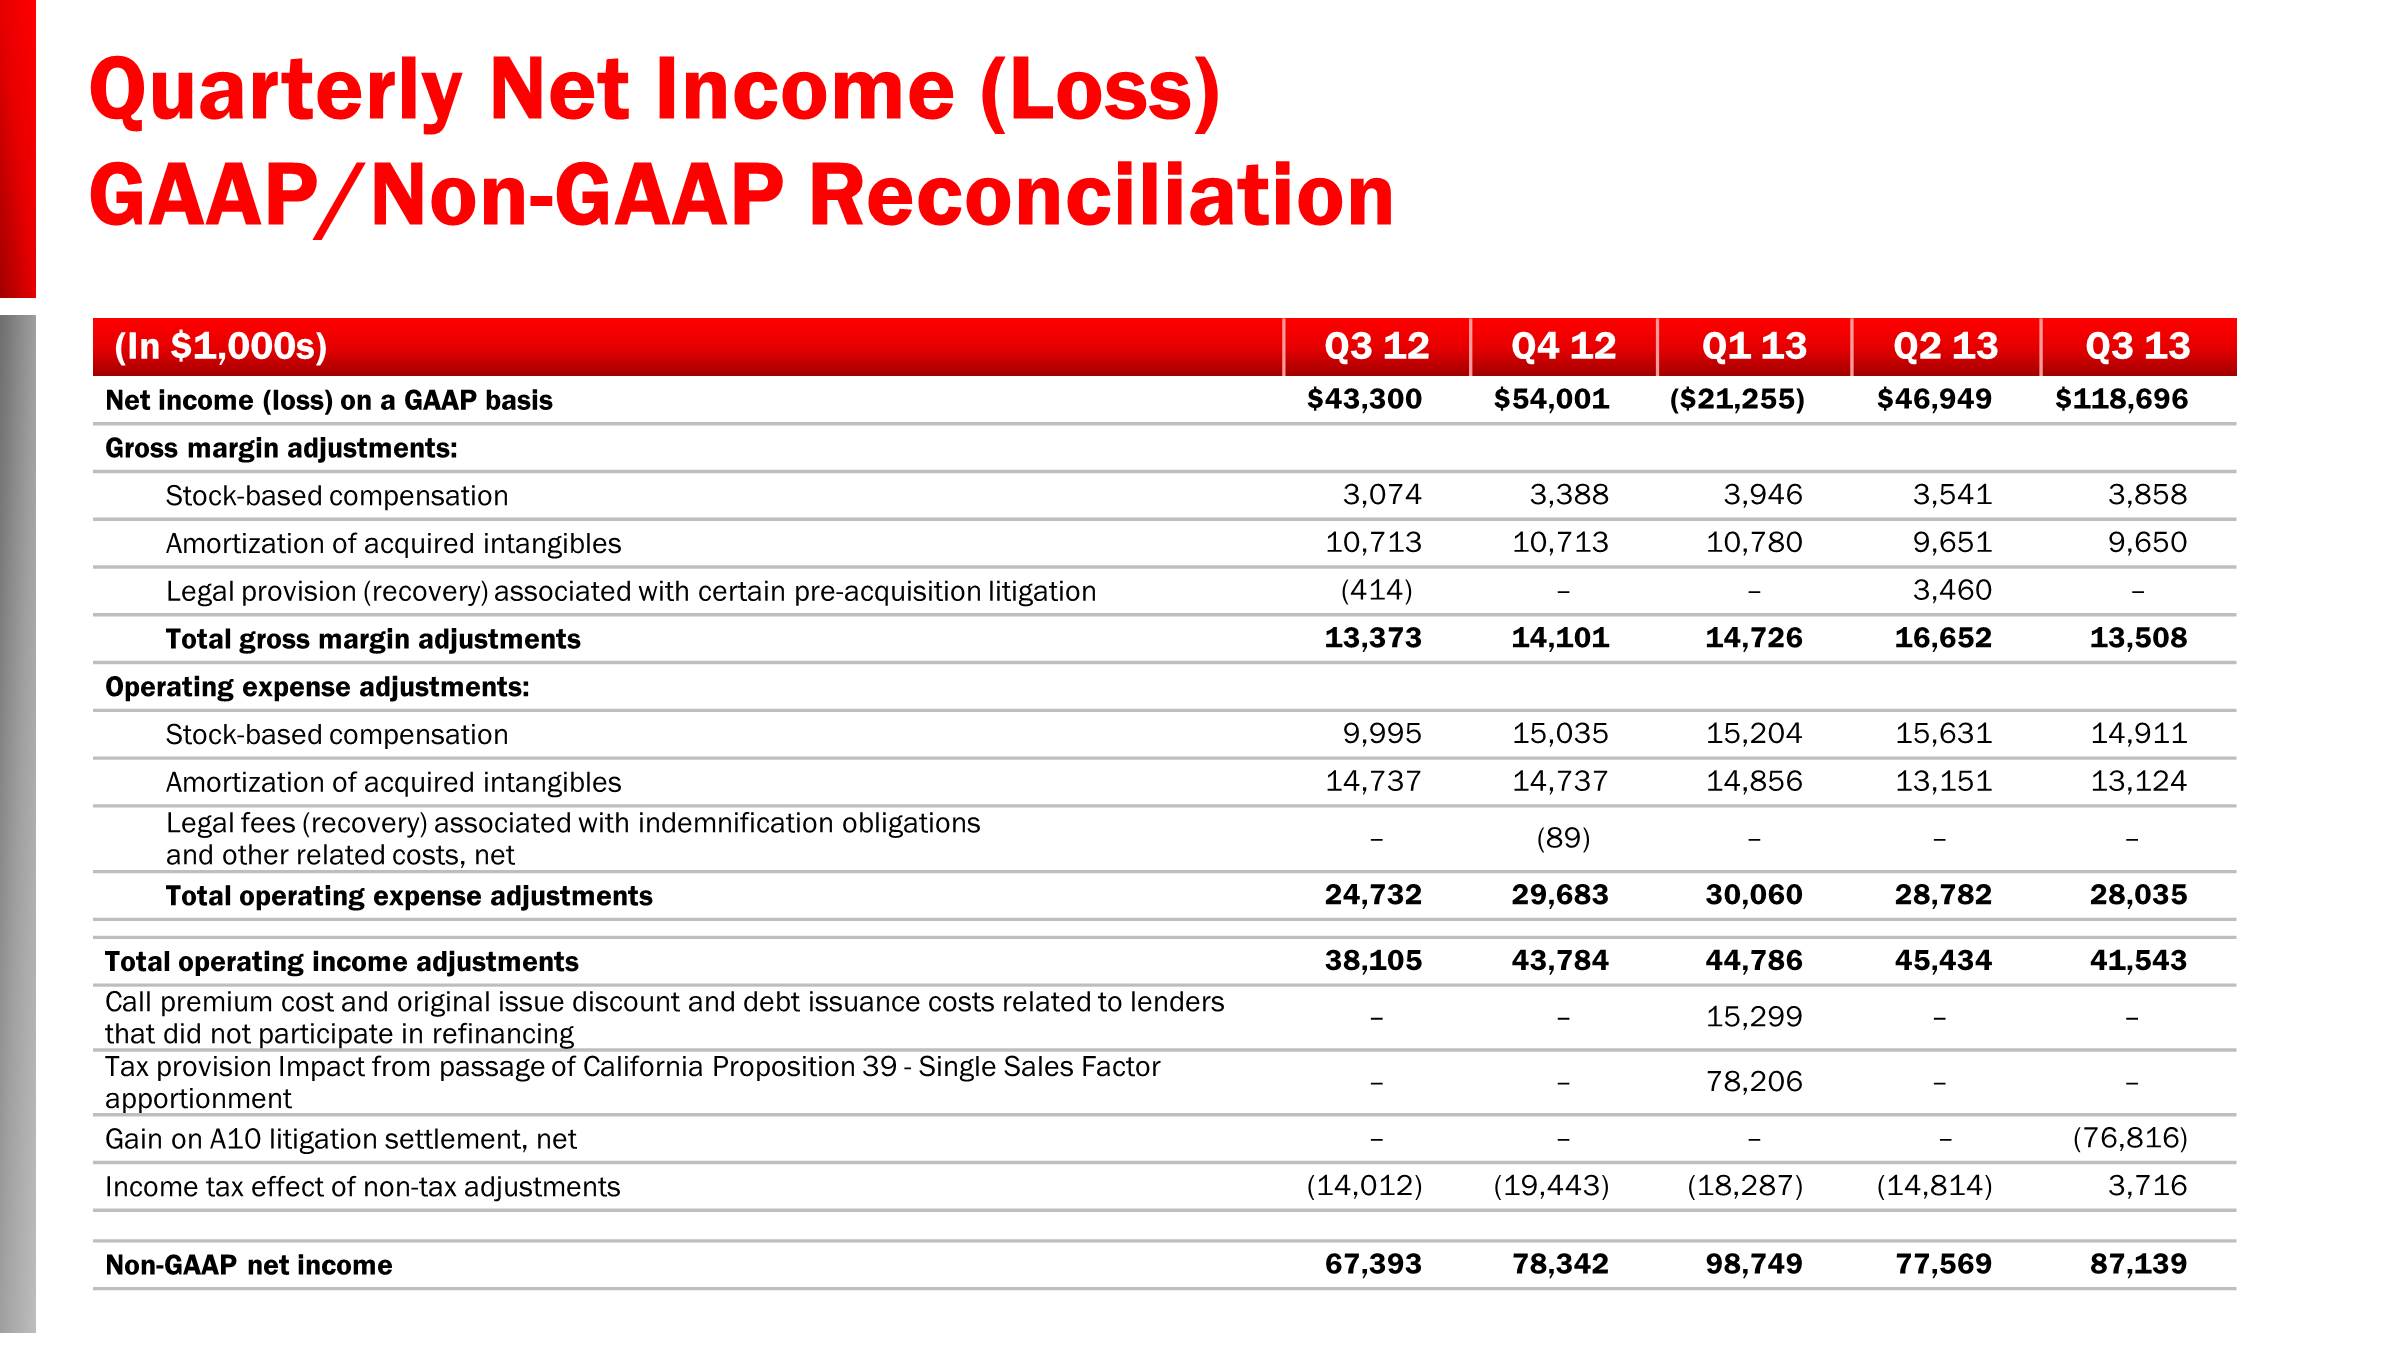
GAAP diluted EPS was $0.26 and non-GAAP diluted EPS was $0.19 in the quarter, up from $0.09 and $0.14 in Q3 12 respectively. During the quarter, we agreed to a litigation settlement with A10 Networks that resulted in a one-time gain of $76.8 million. We have excluded that gain from our non-GAAP results. We also saw a benefit in our Q3 tax rate from the favorable results from closing various tax audits and assessments, which increased our EPS by approximately $0.02 in the quarter. The resulting effective GAAP tax rate was 16.3% and the effective non-GAAP tax rate was 18.2% in Q3.
We generated $102 million in operating cash flow during Q3, down 10% Yr./Yr. and down 15% Qtr./Qtr. Weighted average diluted shares outstanding in Q3 was 461 million and the company repurchased 18 million shares for $101 million at an average price of $5.64 during the quarter.
© 2013 Brocade Communications Systems, Inc. Page 12 of 24
Brocade Q3 FY 2013 Earnings 8/13/2013
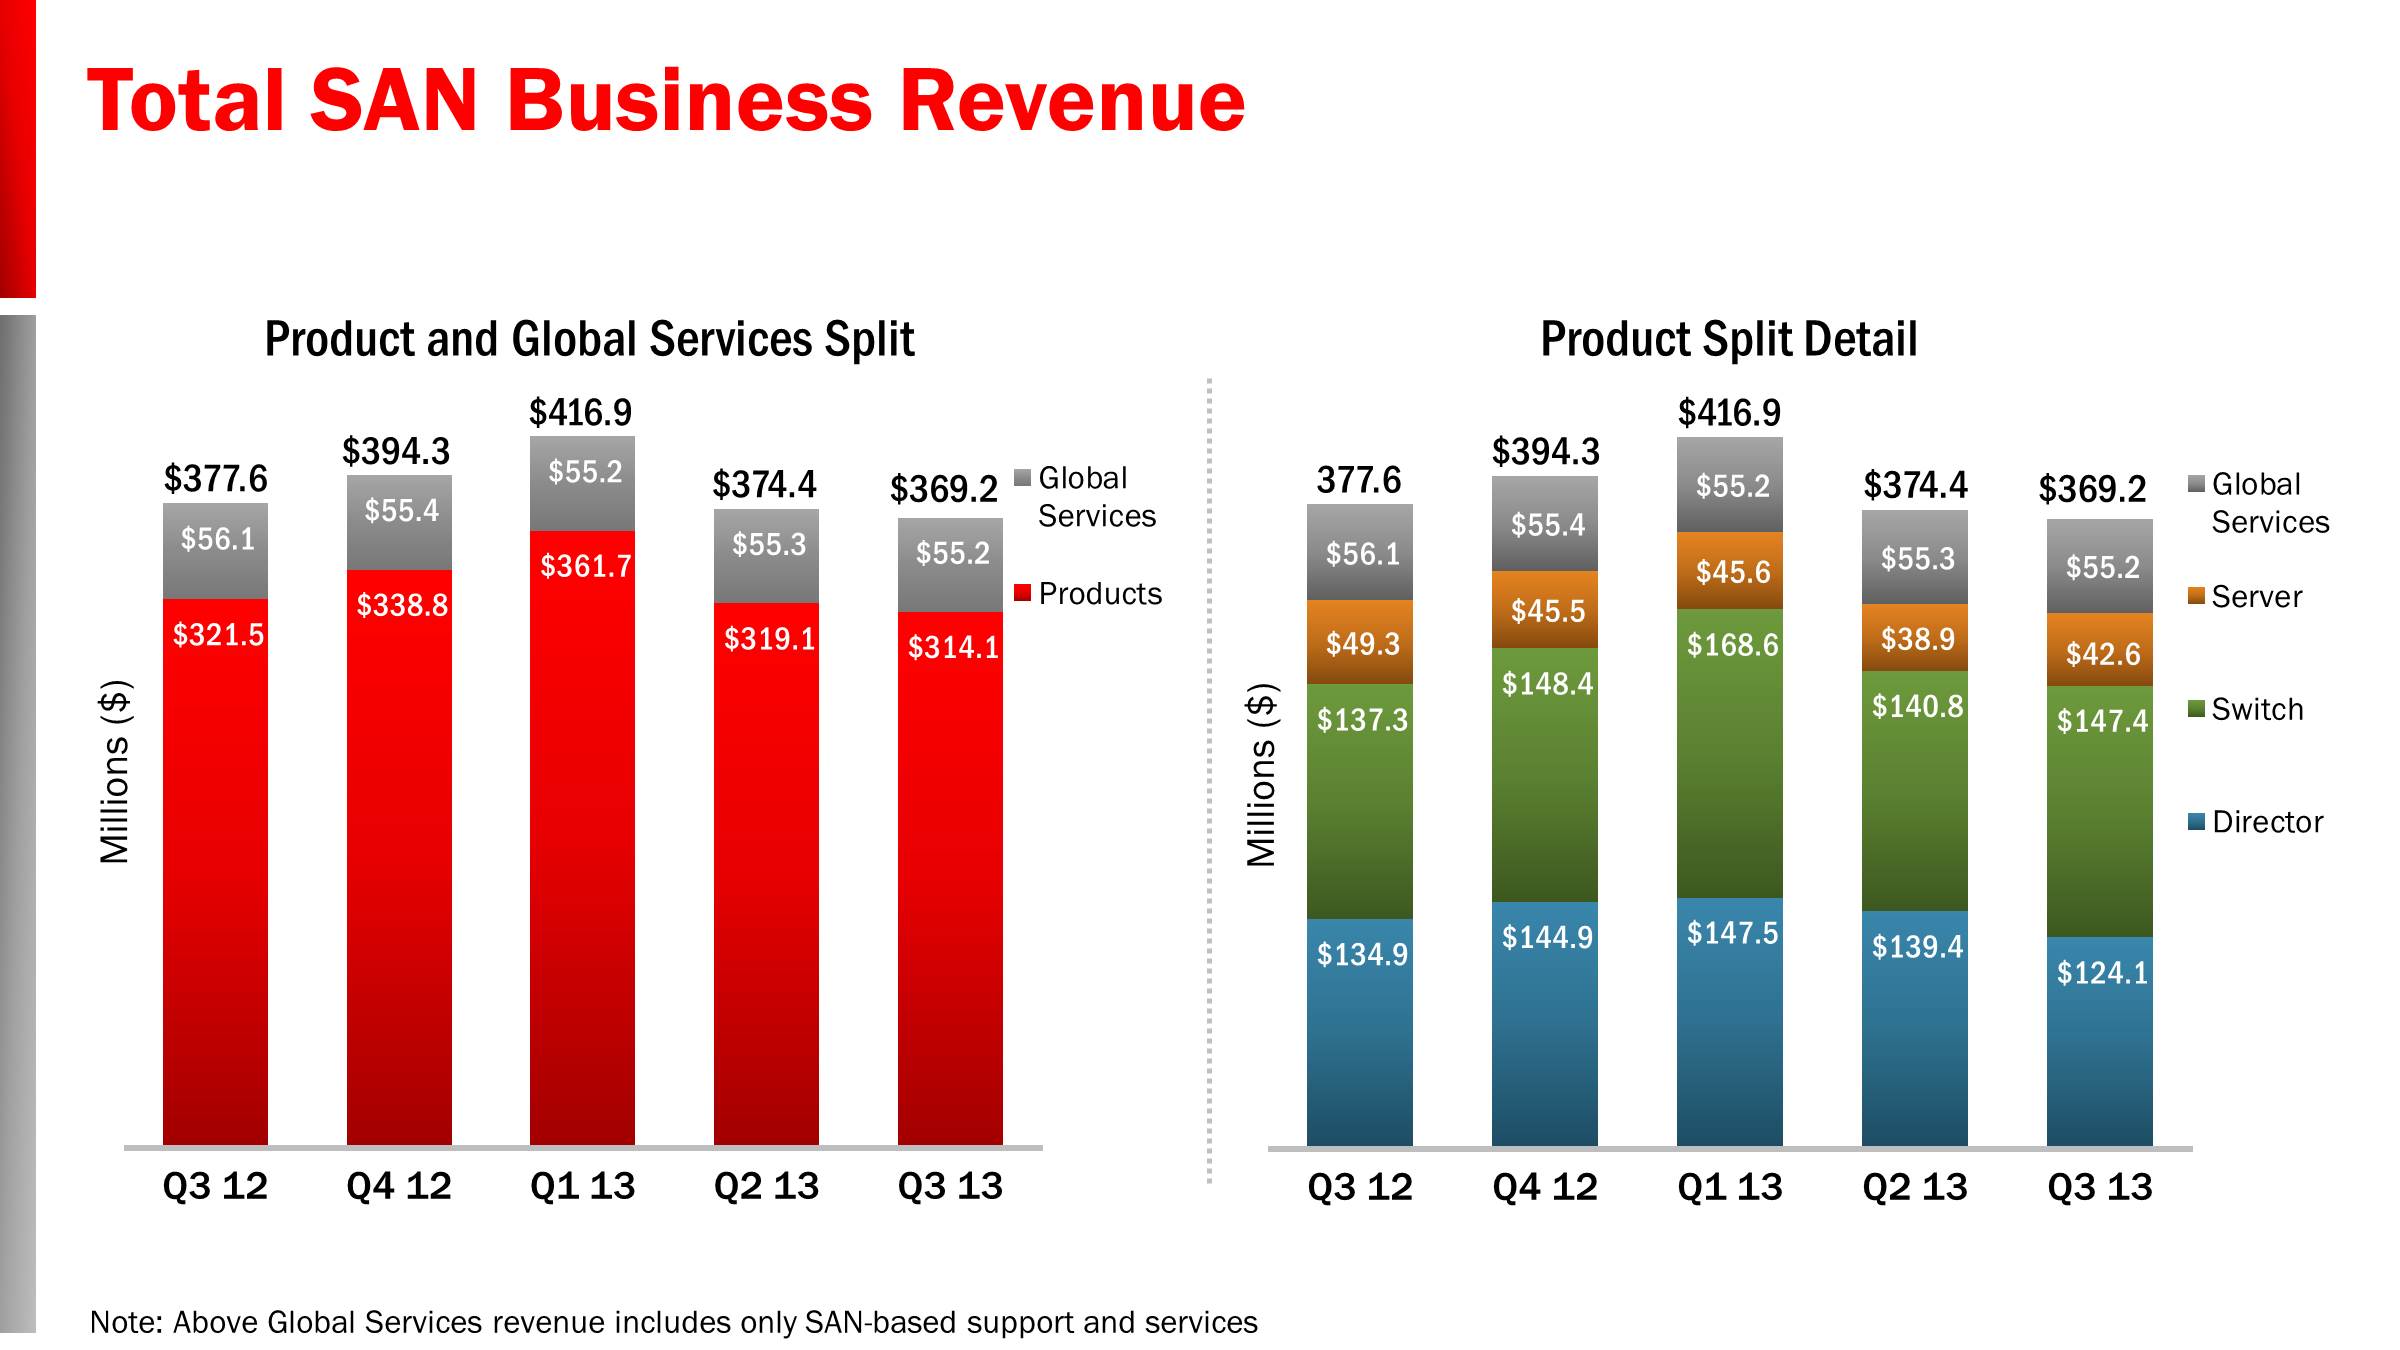
Turning to our total SAN business, including hardware and SAN-based support and services, Q3 revenue was $369.2 million, down 2% from Q3 12 and 1% sequentially.
During the quarter, our OEM partners saw some improvement in their storage business, driven by strengthening end-user demand that occurred earlier than we had anticipated. The sequential decline in SAN revenue for Q3 is in line with typical seasonality for the quarter. We saw the expansion of our Gen 5 (16 Gbps) Fibre Channel product revenue as more of our customers continued to upgrade their networking infrastructure. In Q3, our Gen 5 products represented 64% of director and switch revenue compared with 52% in Q2 13 and 29% in Q3 12. The sequential increase in Gen 5 revenue contribution was due in part to the ramp of the new Brocade 6520 96-port switch.
SAN product revenue was $314.1 million in the quarter, down 2% Yr./Yr. and 2% sequentially. In looking at the SAN product families, director revenue was down 8% Yr./Yr. and 11% sequentially, while switch revenue was up 7% Yr./Yr. and 5% Qtr./Qtr. Our Server product group, including embedded switches and server adapter products, posted revenue of $42.6 million, down 14% Yr./Yr. and up 9% Qtr./Qtr. The Server product group is correlated to bladed server chassis sold through our OEM partners.
SAN-based support and services revenue was $55.2 million in the quarter, down slightly Yr./Yr. and relatively flat quarter-over-quarter.
© 2013 Brocade Communications Systems, Inc. Page 13 of 24
Brocade Q3 FY 2013 Earnings 8/13/2013
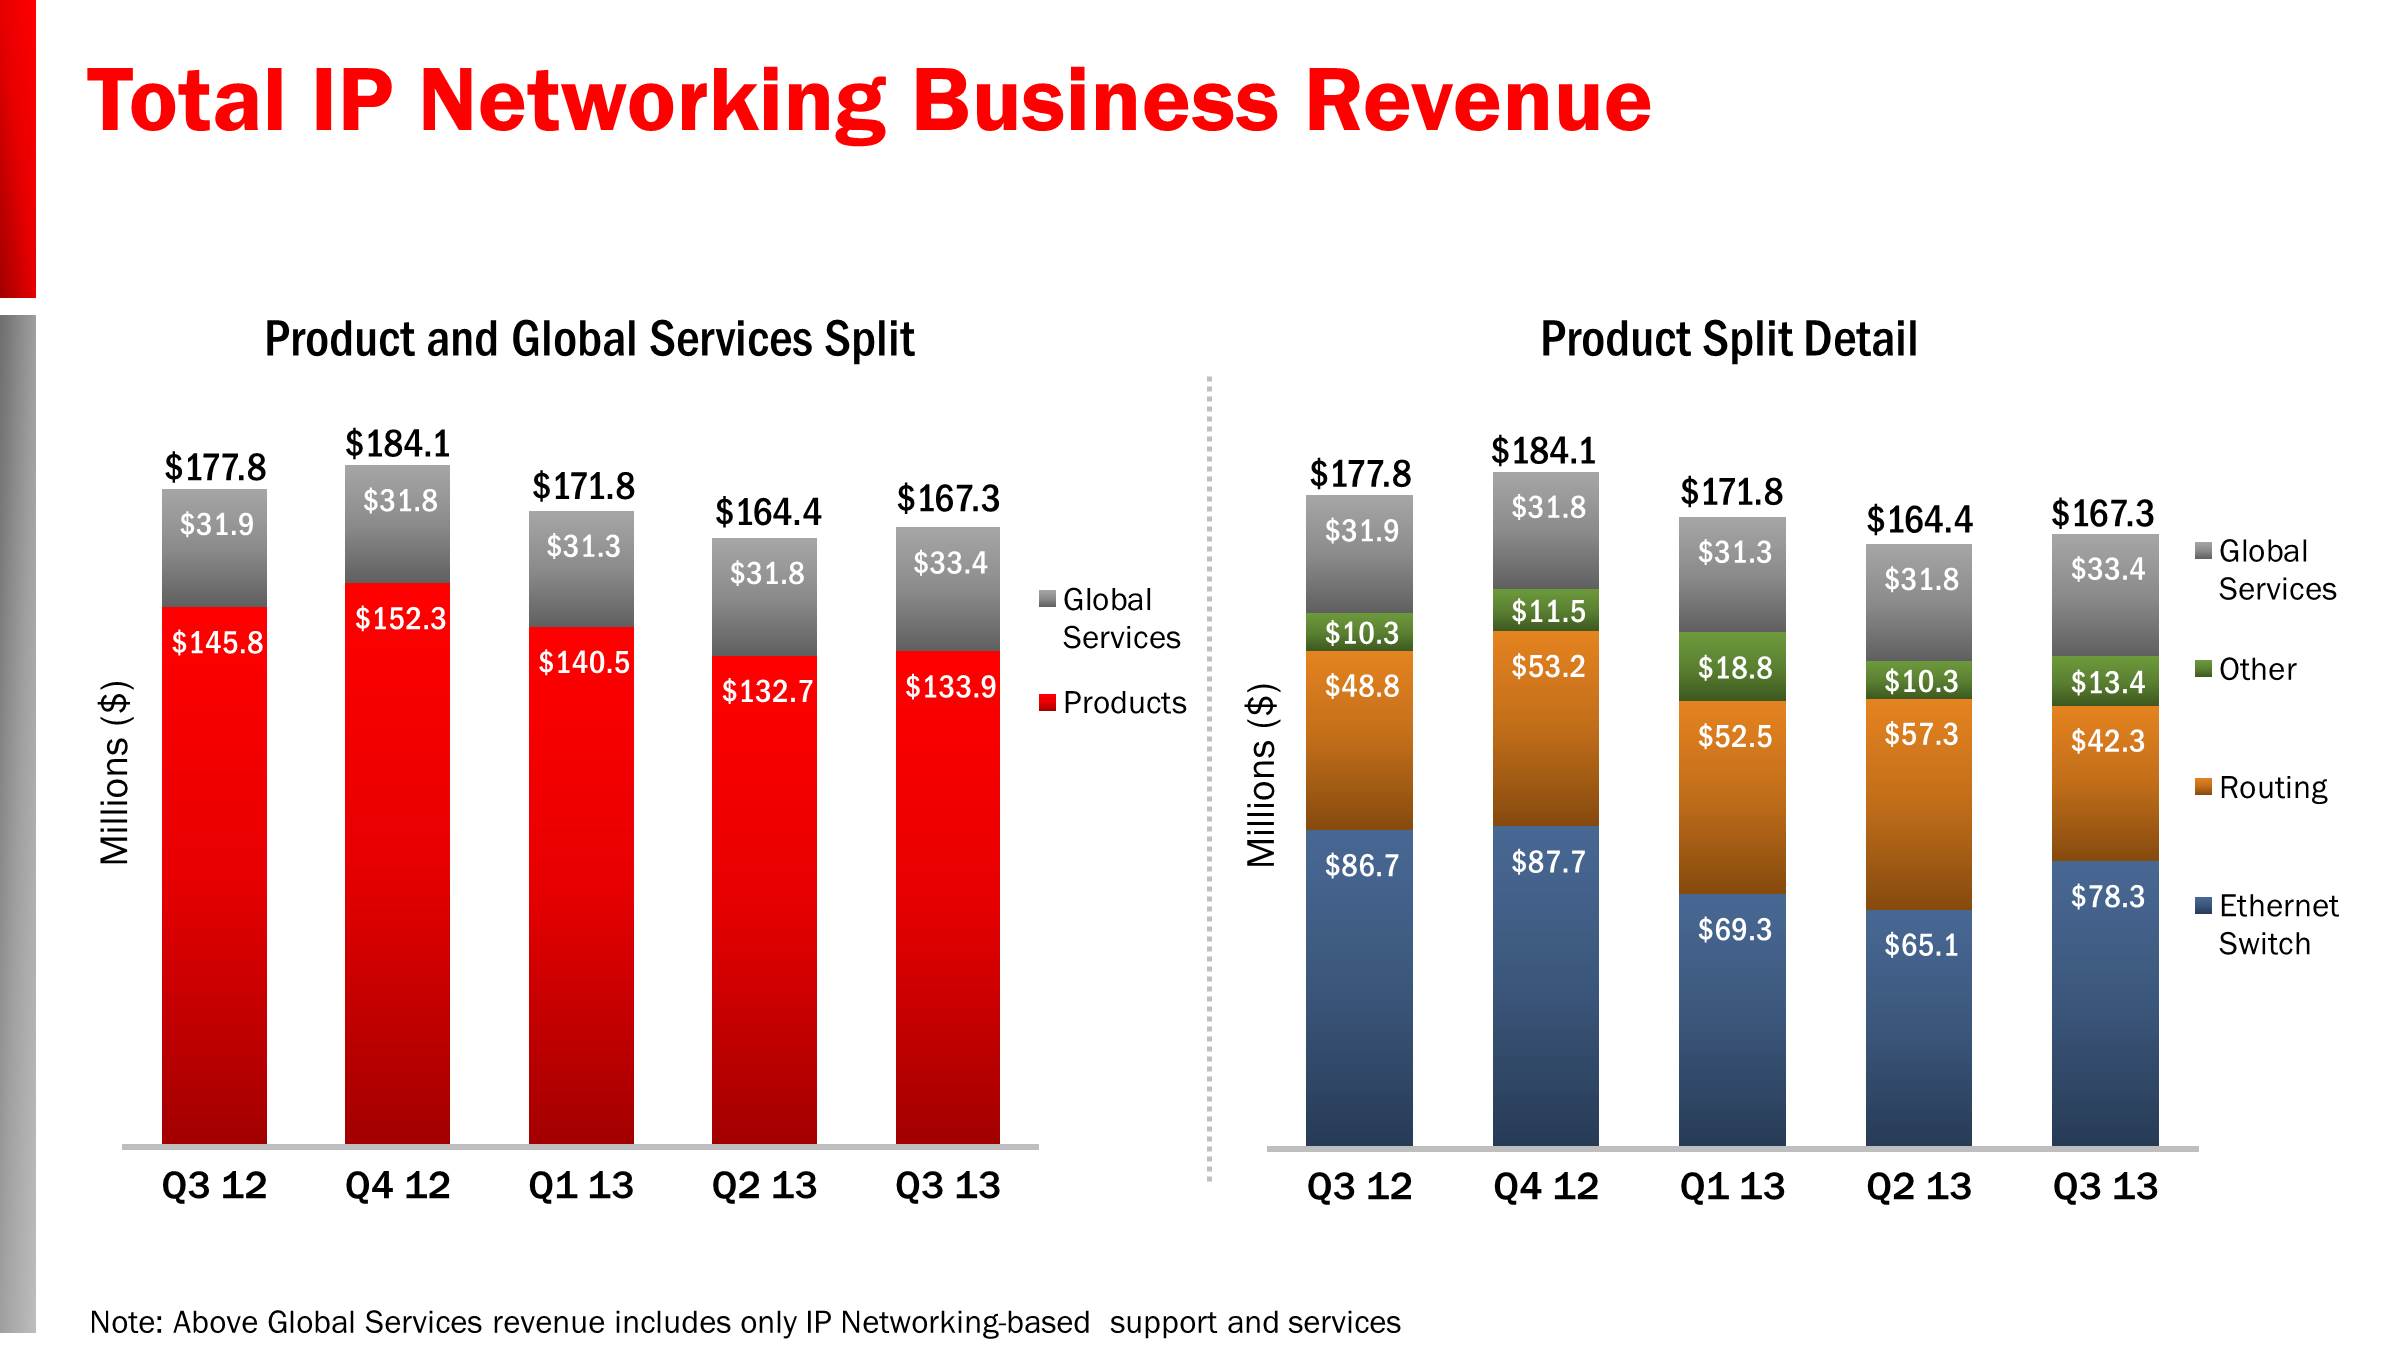
Moving on to our total IP Networking business, including hardware and support, Q3 revenue was $167.3 million, down 6% Yr./Yr. and up 2% sequentially.
Q3 IP Networking product revenue was $133.9 million, down 8% Yr./Yr. and up 1% Qtr./Qtr. As we look at the product splits for IP Networking in the quarter, we saw good quarter-over-quarter performance for our Ethernet switch products. Ethernet switch products, which include products for the data center and campus LAN environments, generated $78.3 million in revenue, up 20% Qtr./Qtr. This was primarily due to higher Brocade VDX switch revenue as well as increased sales of Brocade ICX switches into non-Federal accounts in the Americas. Ethernet switch revenue was down 10% Yr./Yr., as a result of lower Federal revenue. Estimated Federal revenue was $19.9 million in the quarter, down 42% Yr./Yr. and down 5% Qtr./Qtr.
Routing revenue of $42.3 million was down 13% Yr./Yr. and 26% sequentially. The decrease in routing revenue was driven by lower orders from service providers as well as enterprise customers. Other IP Networking revenue of $13.4 million was up 29% Yr./Yr. and 30% Qtr./Qtr. on increased Brocade ADX application delivery switches and converged network adapter sales. IP Networking-based support and services revenue was $33.4 million in the quarter, up 5% Yr./Yr. and 5% sequentially.
As we mentioned last quarter, our IP Networking strategy is to be more focused on opportunities in the data center and public sector, including federal. In the future, we will provide some color of this view of the business using our sales funnel to give insight into how we are performing in these key customers and verticals. Historically, our data center customers, including all verticals, have represented approximately 40-50% of our IP Networking business in our sales funnel. The rest of the customer split would include service provider transport customers as well as enterprise campus accounts. As we look at the business from a vertical perspective, the public sector, which includes federal, other government entities including state and local, as well as education, has represented approximately 25-35% of our business. Other verticals, such as services, communications, banking, health care, and others would represent the rest of the business from this perspective. We will spend some time at our upcoming Analyst Day talking about the opportunities for these customers and verticals, our recent performance, and plans for the next two to three years.
From a geographic viewpoint for IP Networking, the U.S. (excluding federal), APAC and Japan regions each grew at least 7% Yr./Yr., while the EMEA region was down 6%. On a sequential basis, the U.S. region was up 20% and the EMEA, APAC, and Japan regions were each lower.
© 2013 Brocade Communications Systems, Inc. Page 14 of 24
Brocade Q3 FY 2013 Earnings 8/13/2013
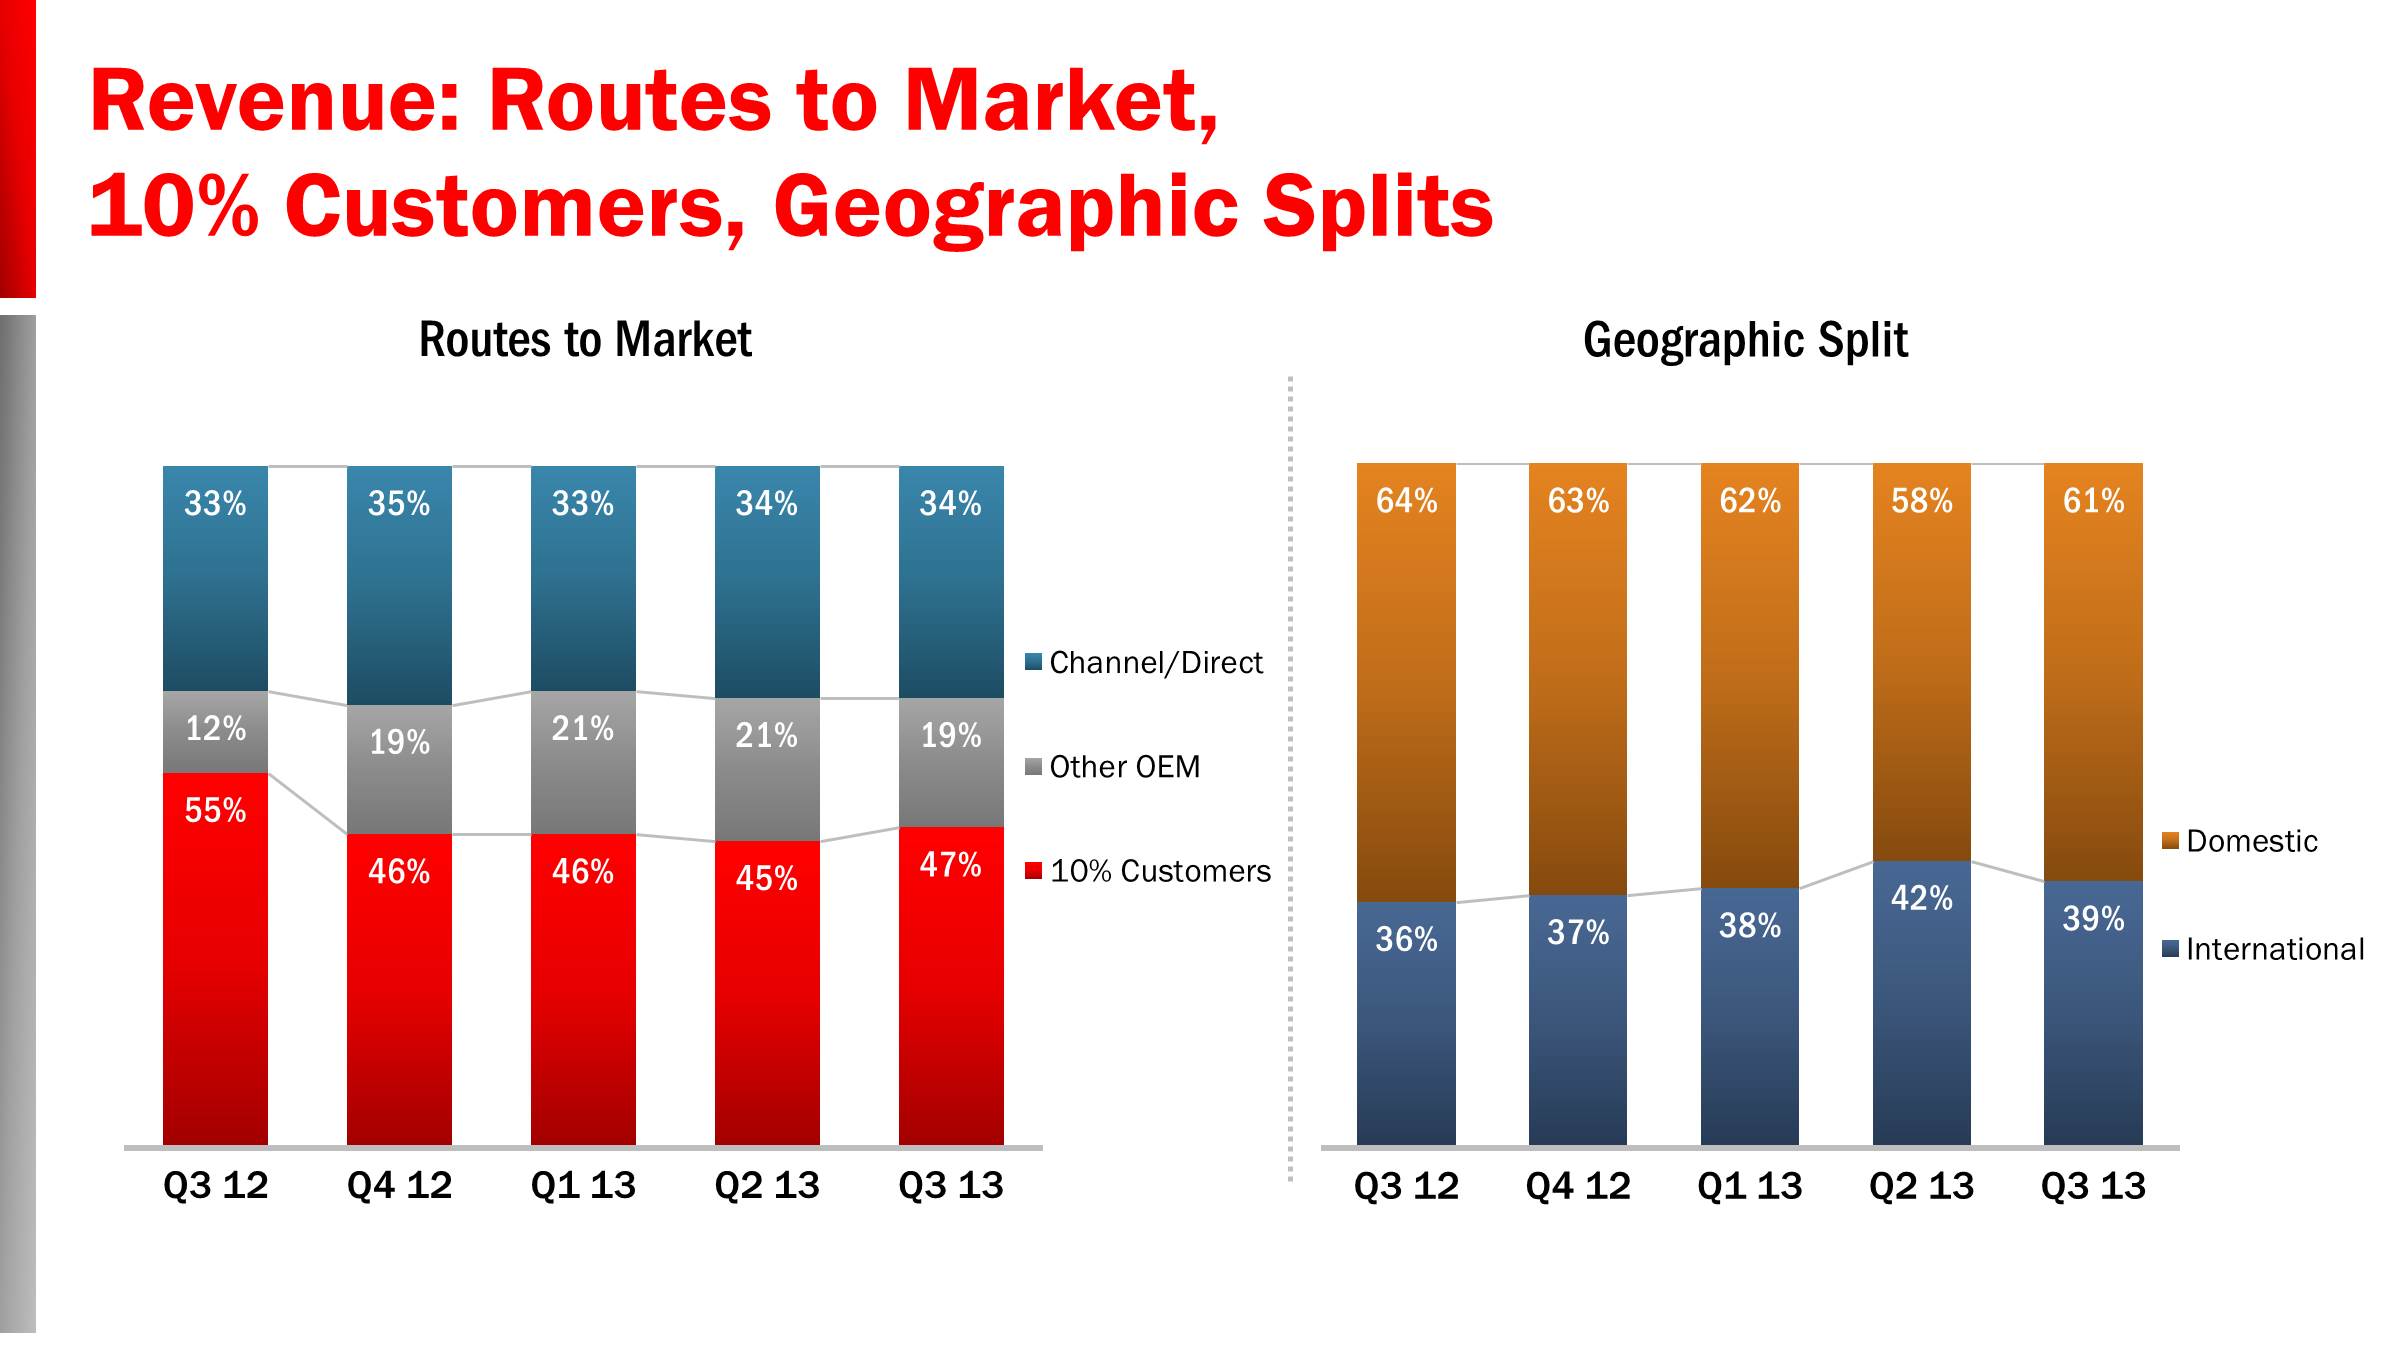
In Q3, three of our customers (EMC, HP , and IBM) each contributed at least 10% of the total company revenue. Our 10% customers collectively contributed 47% of revenue in Q3, up slightly from 45% in Q2 13 and down from 55% in Q3 12 when HDS was also a 10% customer. All other OEMs represented 19% of revenue in Q3, down from 21% from Q2 13 and up from 12% in Q3 12 when HDS was a 10% customer. Channel and direct routes to market contributed 34% of revenue in Q3, flat from Q2 13 and up from 33% in Q3 12.
The mix of business based on ship-to location was 61% domestic and 39% international in the quarter, a lower domestic split compared with 64% in Q3 12, reflecting lower IP Networking revenue sold into the U.S. federal market during Q3 13. Overall revenues in the Americas (including Canada/South America) as well as Japan were lower year-over-year, while EMEA and APAC were both higher. Since some of our OEMs take delivery of our products domestically and then ship internationally to their end-users, the percentage of international revenue based on end-user location would be higher.
© 2013 Brocade Communications Systems, Inc. Page 15 of 24
Brocade Q3 FY 2013 Earnings 8/13/2013
Q3 non-GAAP company gross margin of 65.6% exceeded our guidance range for the quarter due in part to higher revenues, a more favorable product mix to SAN, and lower spending.
Q3 non-GAAP product gross margin was 66.7%, near the high-end our two-year target model range of 65% to 67% and higher than the 65.5% reported in Q3 12, due to higher IP Networking margins and a favorable overall revenue mix. Product gross margins were essentially flat quarter-over-quarter. Q3 non-GAAP SAN product gross margin was in the mid-70's, slightly higher compared with Q2 2013 and slightly lower compared with Q3 12 on lower revenues. Q3 non-GAAP IP Networking product gross margin was over 50%, down slightly quarter-over-quarter and up more than 400 basis points compared with Q3 12 due to a favorable product mix and lower COGS overhead spending.
Non-GAAP Global Services gross margin was a record 59.6% in Q3, up 360 basis points quarter-over-quarter and up 510 basis points year-over-year based on lower spending and higher revenue.
© 2013 Brocade Communications Systems, Inc. Page 16 of 24
Brocade Q3 FY 2013 Earnings 8/13/2013
Q3 non-GAAP gross margin was 65.6%, above our two-year target model range of 63% to 64%, driven by a favorable product mix and lower spending.
On a non-GAAP basis, total operating expenses were $235.8 million, or 43.9% of revenues in Q3, slightly above our two-year target model range of 42.0% to 43.5%. Total operating expenses were lower on an absolute dollar basis compared with Q2 13 as we are beginning to realize some of the savings identified as part of our spending reduction plan. As we measure our performance to our goal of removing $100 million annualized spending, we have now realized annualized spending reductions of more than $60 million using Q1 13 as a baseline. We are pleased with our performance to date and will provide more detail about our plans at the September Analyst Day. Ending headcount was 4,565 in Q3, down 83 compared with the prior quarter.
Non-GAAP operating margin was 21.6% in Q3, an increase of 210 basis points compared with Q3 2012 and 260 basis points higher compared with Q2 13. The Q3 non-GAAP operating margin was near the high-end of the two-year target model range of 19.5% to 22.0%, as a result of improved margins and spending actions.
© 2013 Brocade Communications Systems, Inc. Page 17 of 24
Brocade Q3 FY 2013 Earnings 8/13/2013
Operating cash flow was $102 million in Q3, down 10% Yr./Yr. and down 15% sequentially in a typically softer quarter for cash flow due to payments of employee earned incentives and interest on our debt. We saw improved shipment linearity in the quarter, which resulted in DSOs of 37 days, better than our long-term DSO model of 40 to 45 days, and slightly better than 38 days in Q3 12. Total capital expenditures in the quarter were $10 million, below our historical capital spending range due to the timing of some projects that moved outside of the quarter as well as increased focus on capital outlays.
Our cash, equivalents, and short-term investments were $790 million, up $26 million from Q2 2013 and up $209 million from Q3 12. This is our highest cash position in nearly 5 years.
As I mentioned earlier, we repurchased 17.9 million shares of common stock during Q3 and had $361 million remaining in the Board authorized share repurchase program exiting the quarter. Subsequent to the end of Q3 2013, the company has repurchased an additional $7.8 million shares for $52.6 million.
Finally, we recognized a one-time gain of $76.8 million during the quarter, which has been excluded from our non-GAAP results, related to the settlement with A10 Networks of a long-standing lawsuit. We received an initial $5.0 million payment from A10 Networks in Q3 and a $70.0 million note that is due to Brocade prior to the end of January 2014. The remaining $1.8 million gain is related to the value of certain licensing rights granted to Brocade as part of the settlement.
© 2013 Brocade Communications Systems, Inc. Page 18 of 24
Brocade Q3 FY 2013 Earnings 8/13/2013
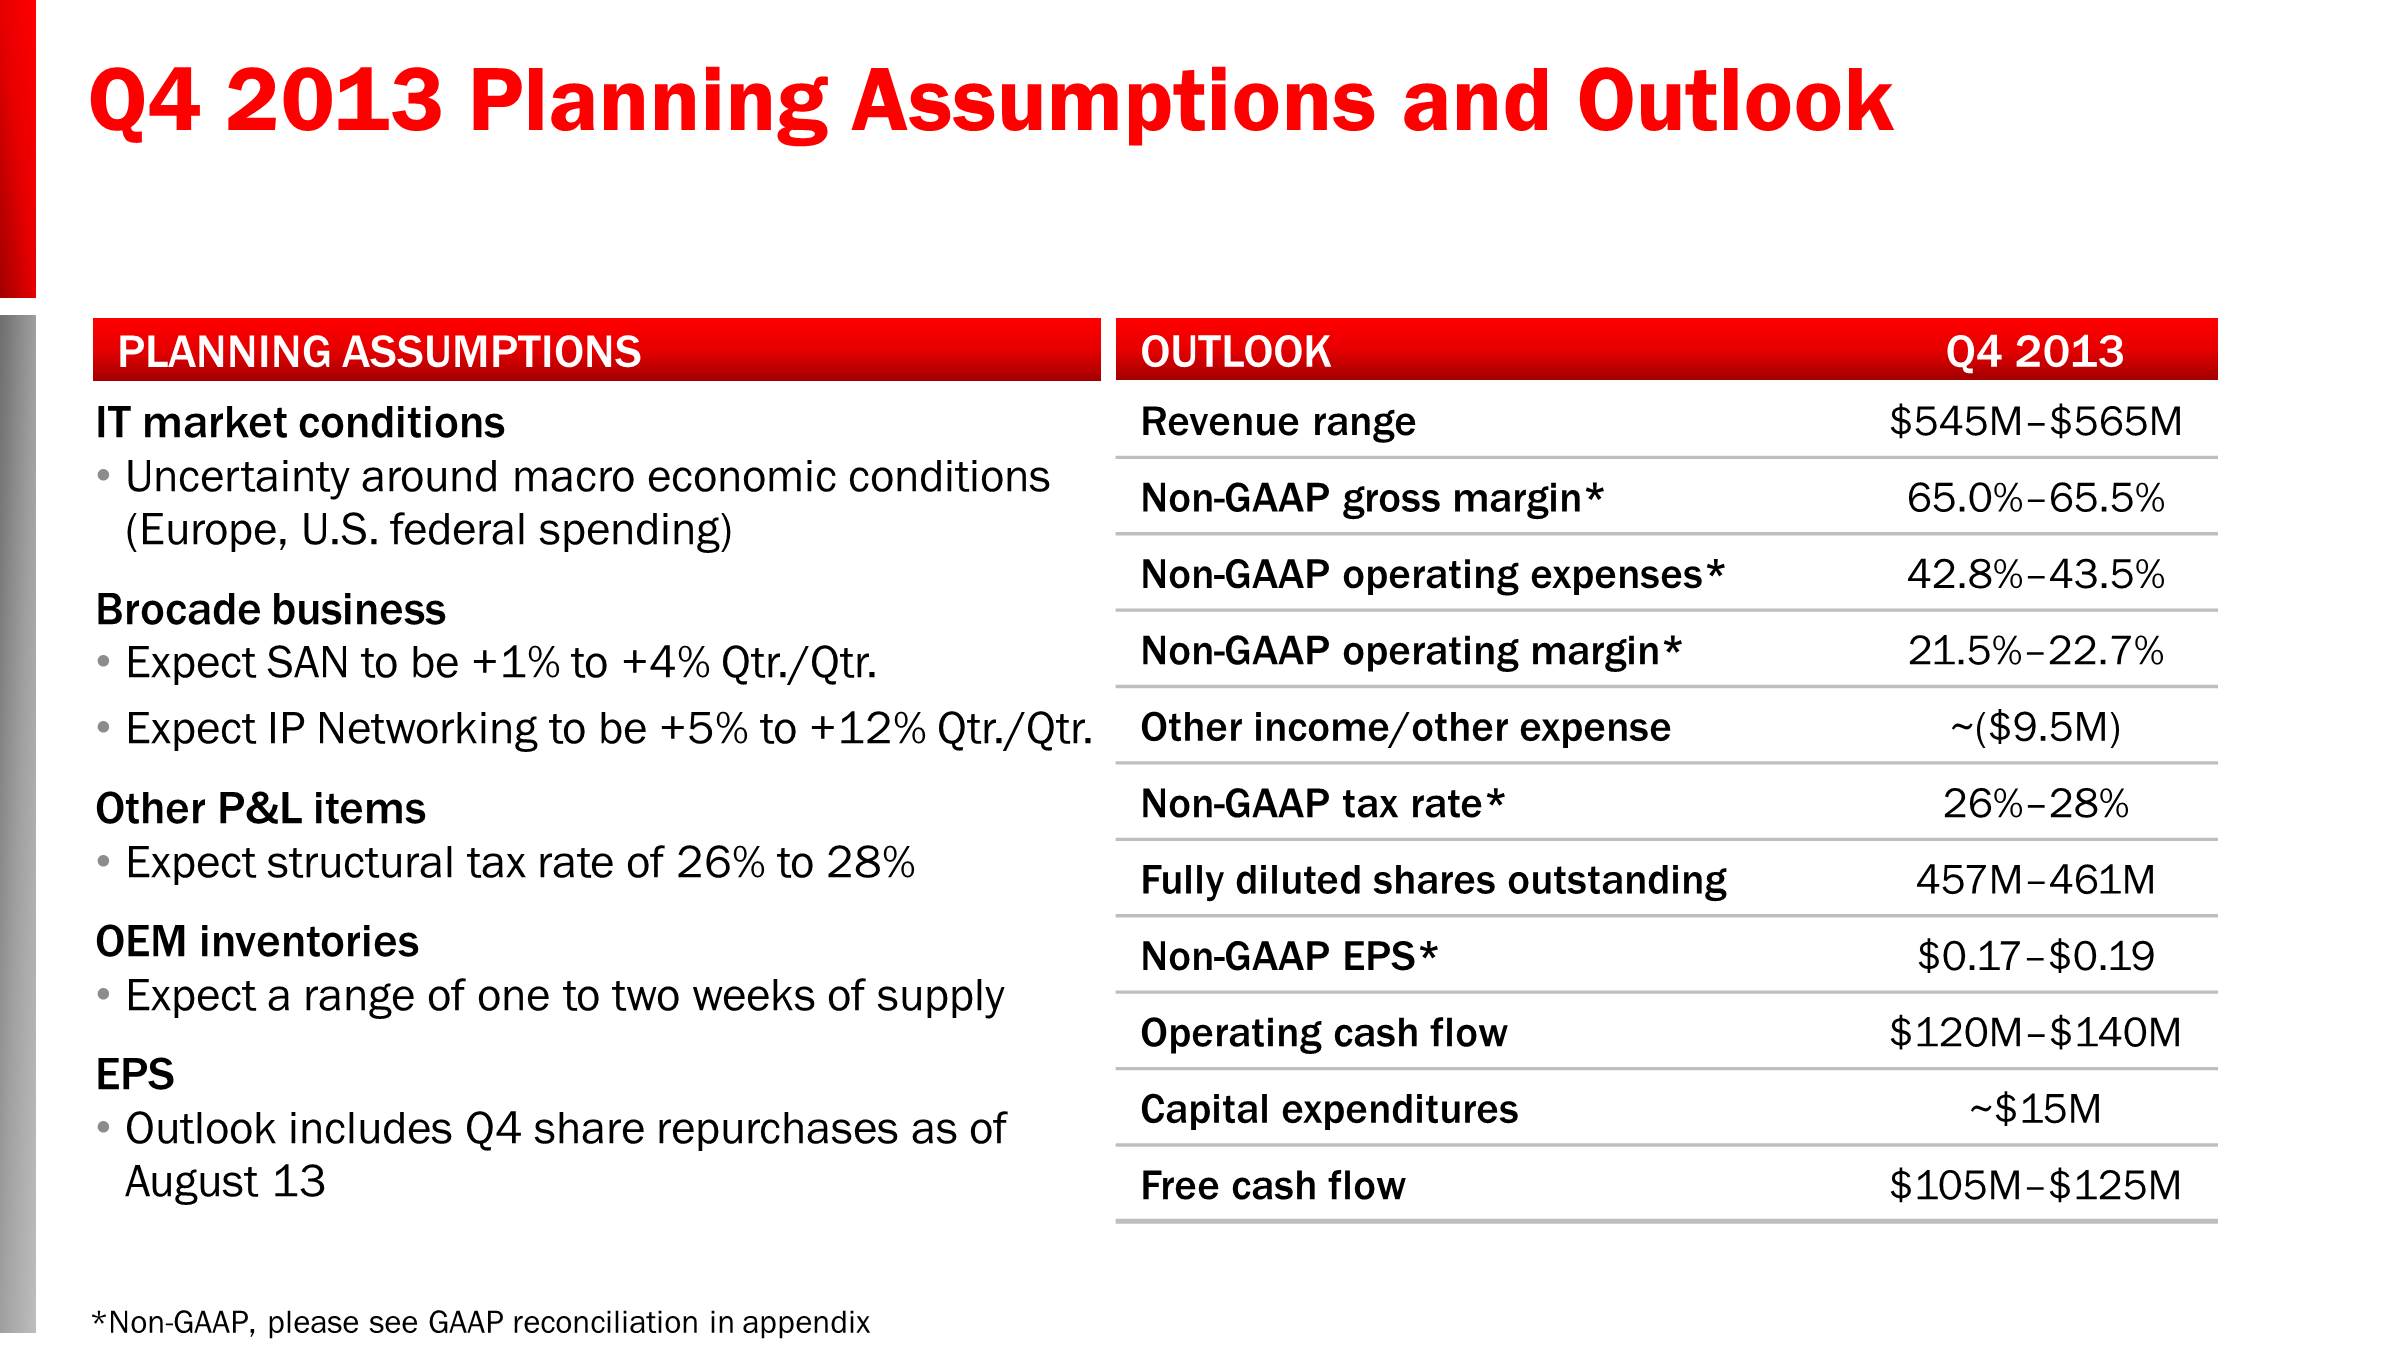
Looking forward to Q4 13, we considered a number of factors, including the following, in setting our outlook:
| |
| • | The current macro environment and economy continue to show uncertainty in the near-term, specifically in the storage market, the U.S. federal government, and in Europe. |
| |
| • | For Q4, we expect SAN revenue to be up 1% to 4% quarter-over-quarter as the current demand for storage is improving but remains softer than last year. |
| |
| • | We expect our Q4 IP Networking revenue to be up 5% to 12% quarter-over-quarter driven by improved U.S. federal order flow as well as continued growth of IP Networking revenue from new products, including Ethernet fabrics. |
| |
| • | We expect non-GAAP operating expenses to be flat to slightly higher quarter-over-quarter, reflecting higher seasonal spending in our Q4, partially offset by some additional savings from our spending initiatives. |
| |
| • | At the end of Q3, OEM inventory was just over 1.5 weeks of supply based on SAN business revenue, lower than OEM inventory levels exiting Q2 13 and Q3 12. While we expect OEM inventory levels to be between one to two weeks exiting Q4, inventory levels may fluctuate due to both seasonality and large end-user order patterns at the OEMs. |
| |
| • | From a tax rate perspective, we assume a structural non-GAAP tax rate of 26% to 28% for Q4. Discrete events can impact our tax rate from time to time. |
| |
| • | Our guidance reflects the share repurchases already completed in Q4. |
| |
| • | Cash from operations will be up sequentially due to the timing of interest payments on our notes and employee bonuses that are paid in Q3 and Q1. |
| |
| • | Based on the company's performance in Q3 and the outlook for Q4, we expect full-year FY13 gross margin to be more than 65%, above the two-year target model range of 63% to 64%, and FY13 operating margin to be at the high end of the two-year target model range of 19.5% to 22.0%. |
© 2013 Brocade Communications Systems, Inc. Page 19 of 24
Brocade Q3 FY 2013 Earnings 8/13/2013
Prepared comments provided by Rob Eggers, Investor Relations
That concludes Brocade’s prepared comments. At 2:30 p.m. Pacific Time on August 13, Brocade will host a webcast conference call at www.brcd.com.
Thank you for your interest in Brocade.
© 2013 Brocade Communications Systems, Inc. Page 20 of 24
Brocade Q3 FY 2013 Earnings 8/13/2013
© 2013 Brocade Communications Systems, Inc. Page 21 of 24
Brocade Q3 FY 2013 Earnings 8/13/2013
Additional Financial Information:
|
| | | | | | |
| | Q3 12 |
| Q2 13 |
| Q3 13 |
|
| GAAP gross margin | 61.3 | % | 62.0 | % | 63.0 | % |
| Non-GAAP gross margin | 63.7 | % | 65.1 | % | 65.6 | % |
| | | | |
| GAAP product gross margin | 62.8 | % | 63.6 | % | 64.2 | % |
| Non-GAAP product gross margin | 65.5 | % | 66.9 | % | 66.7 | % |
| | | | |
| GAAP services gross margin | 53.2 | % | 54.0 | % | 57.2 | % |
| Non-GAAP services gross margin | 54.5 | % | 56.0 | % | 59.6 | % |
| | | | |
| GAAP operating margin | 12.6 | % | 10.6 | % | 13.9 | % |
| Non-GAAP operating margin | 19.5 | % | 19.0 | % | 21.6 | % |
© 2013 Brocade Communications Systems, Inc. Page 22 of 24
Brocade Q3 FY 2013 Earnings 8/13/2013
© 2013 Brocade Communications Systems, Inc. Page 23 of 24
Brocade Q3 FY 2013 Earnings 8/13/2013
© 2013 Brocade Communications Systems, Inc. Page 24 of 24