Q2 FY 2014 Earnings
Prepared Comments and Slides
May 22, 2014
Ben Jones
Senior Director, Investor Relations
Phone: 408-333-6601
bjones@brocade.com
John Noh
Senior Director, Public Relations
Phone: 408-333-5108
jnoh@brocade.com
NASDAQ: BRCD
Brocade Q2 FY 2014 Earnings 5/22/2014
Prepared comments provided by Ben Jones, Investor Relations
Thank you for your interest in Brocade's Q2 Fiscal 2014 earnings presentation, which includes prepared remarks, safe harbor, slides, and a press release detailing fiscal second quarter 2014 results. The press release, along with these prepared comments and slides, has been furnished to the SEC on Form 8-K and has been made available on the Brocade Investor Relations website at www.brcd.com. The press release will be issued subsequently via Marketwired.
© 2014 Brocade Communications Systems, Inc. Page 2 of 27
Brocade Q2 FY 2014 Earnings 5/22/2014
© 2014 Brocade Communications Systems, Inc. Page 3 of 27
Brocade Q2 FY 2014 Earnings 5/22/2014
Today’s prepared comments include remarks by Lloyd Carney, Brocade CEO, regarding the company’s quarterly results, its strategy, and a review of operations, as well as industry trends and market/technology drivers related to its business; and by Dan Fairfax, Brocade CFO, who will provide a financial review.
A management discussion and live question and answer conference call will be webcast at
2:30 p.m. PT on May 22 at www.brcd.com and will be archived on the Brocade Investor Relations website.
© 2014 Brocade Communications Systems, Inc. Page 4 of 27
Brocade Q2 FY 2014 Earnings 5/22/2014
Prepared comments provided by Lloyd Carney, CEO
© 2014 Brocade Communications Systems, Inc. Page 5 of 27
Brocade Q2 FY 2014 Earnings 5/22/2014
This was another solid quarter for Brocade. Our SAN business grew year-over-year and we continued to execute against our strategic goals of focused innovation, increased efficiency, and profitability.
SAN product revenue grew 1% Yr./Yr. and business trends continue to improve. We saw healthy demand for our SAN products, coupled with strong shipment linearity throughout the quarter.
IP Networking product revenue was lower year-over-year, but within the range of the outlook for the quarter. We continue to focus on building on our #2 position in terms of revenue share within data center networking and disrupting the traditional hardware-oriented network with innovative software offerings and modern fabrics.
As an example of our increasing software focus, we have made a decision to shift a greater portion of our ADX product development resources to our virtual solution. Our decision to do this is an indicator of our growing expertise and commitment to software networking, increasing interest among our customers, and significantly higher growth rates for the software version of the Application Delivery Controller market. This decision resulted in a non-cash goodwill impairment charge during the quarter, which is covered in more detail in Dan's commentary that follows.
We repurchased $50M of common stock during Q2, reflecting our commitment of returning a minimum of 60% of adjusted free cash flow to our shareholders. Year to date, we have met this commitment solely through our share repurchase program. Today, we are pleased to announce that our Board has authorized a cash dividend, beginning in Q3 14. The addition of a quarterly dividend will give us another avenue to return cash to our shareholders in a consistent way that many of you have told us you wanted.
© 2014 Brocade Communications Systems, Inc. Page 6 of 27
Brocade Q2 FY 2014 Earnings 5/22/2014
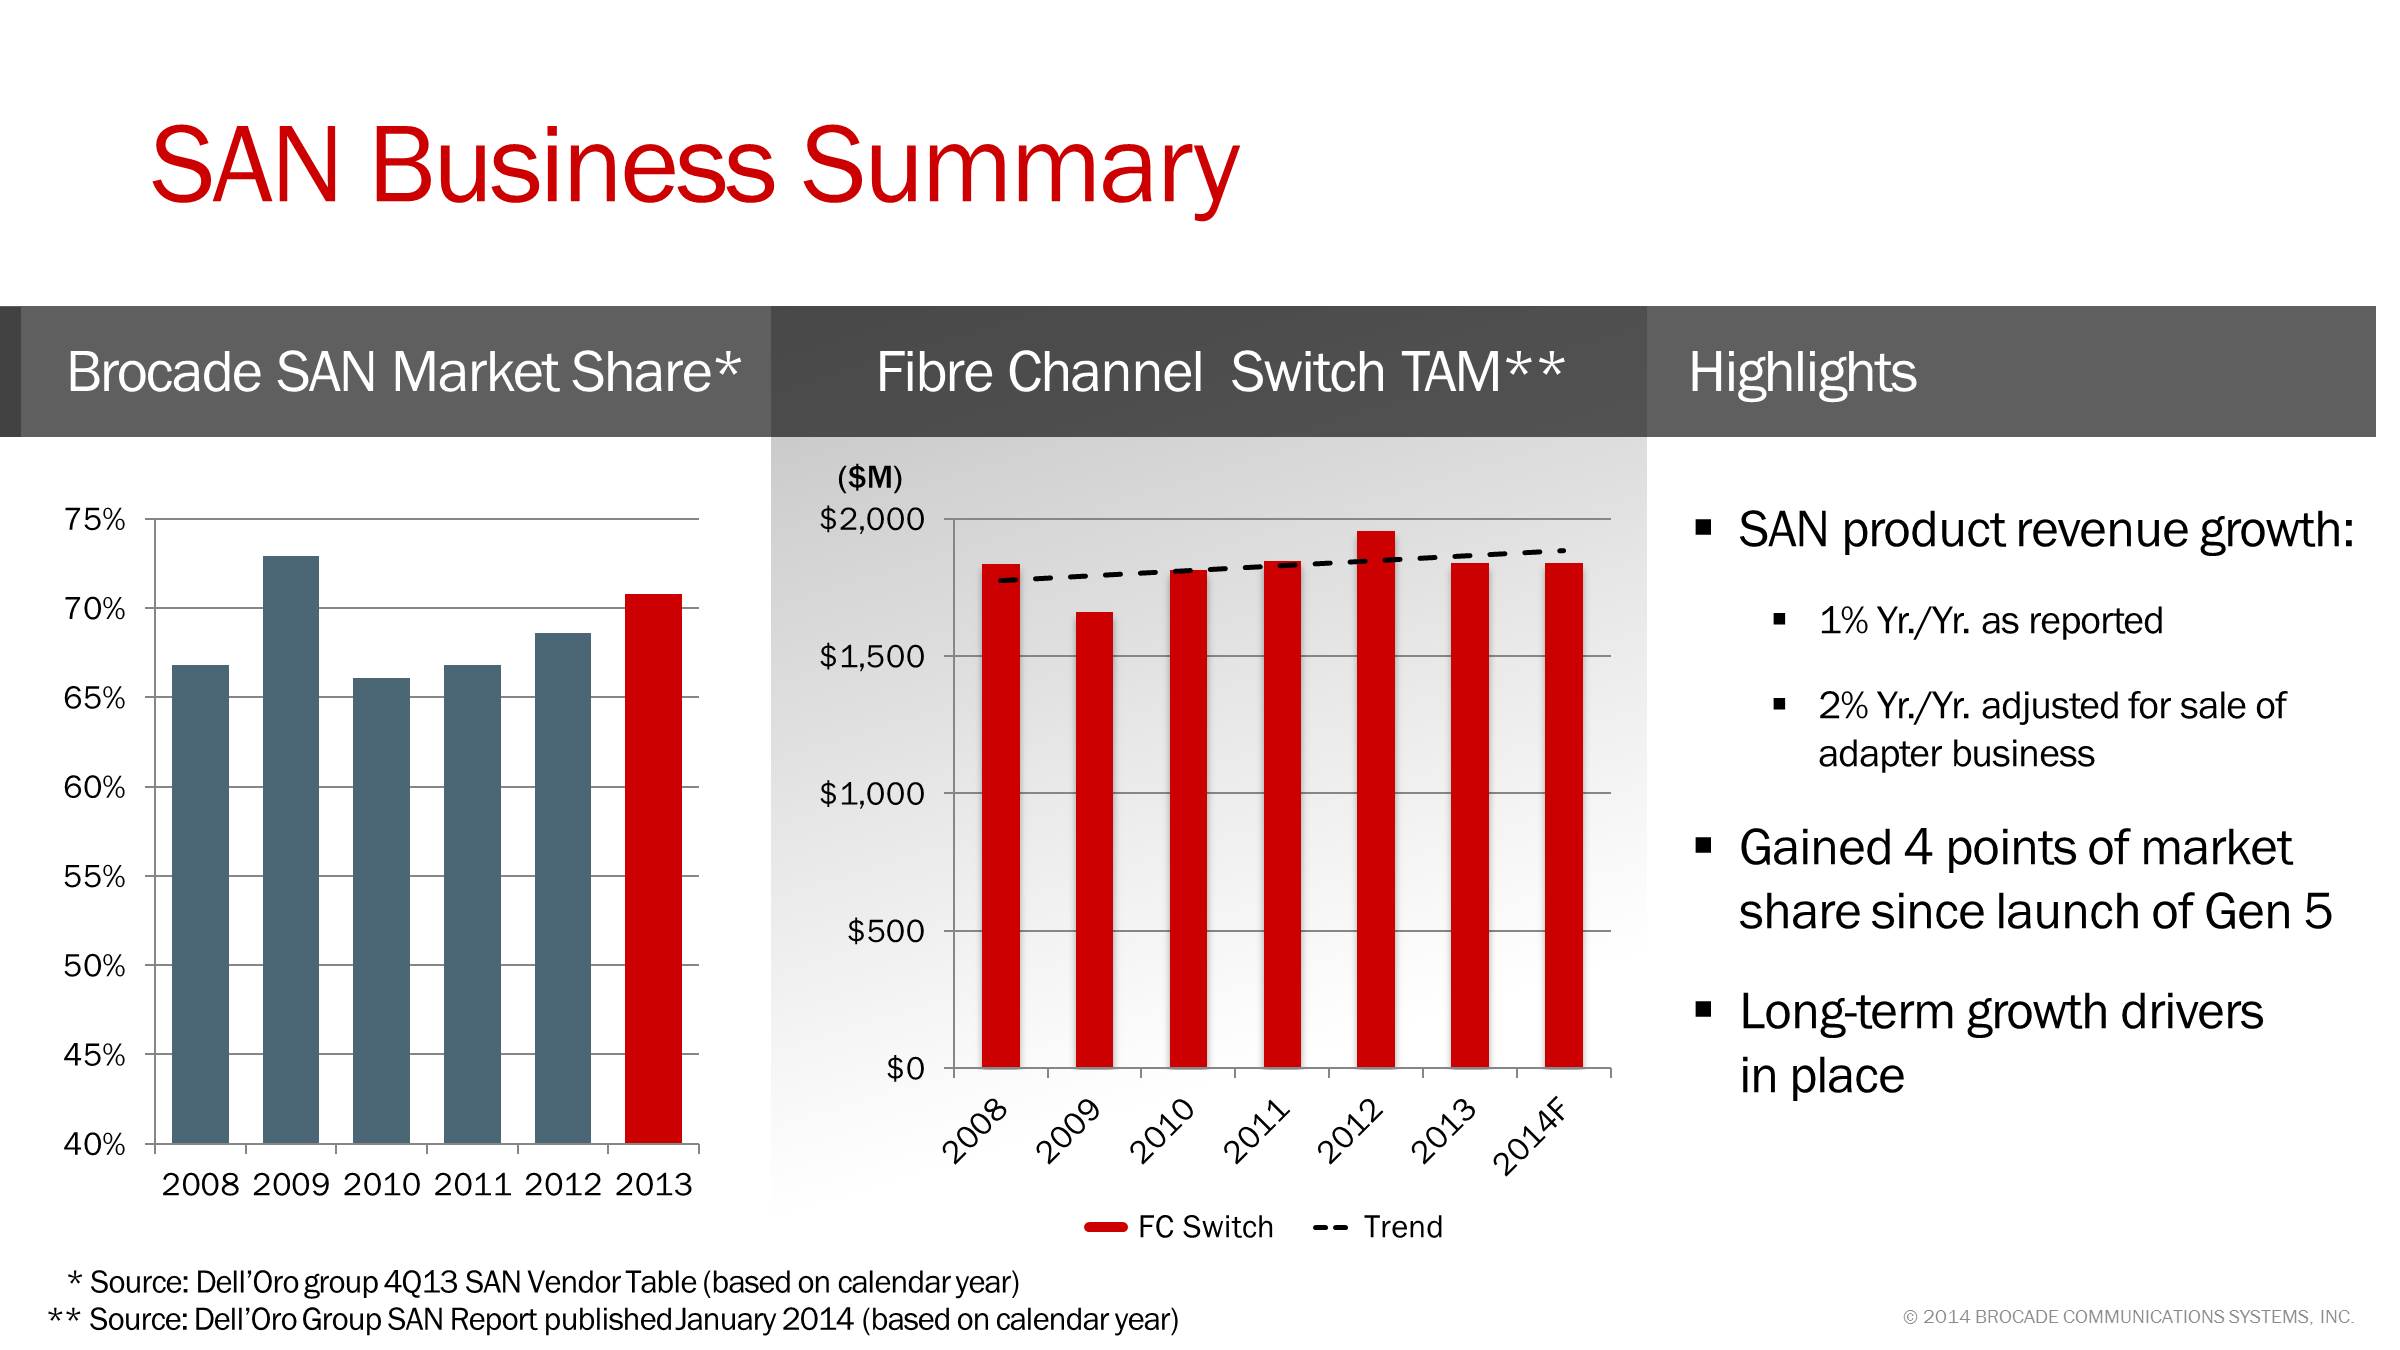
SAN revenues exceeded our expectations for Q2 and reflect the strength of our industry leadership and the compelling advantages of Brocade Gen 5 Fibre Channel and FabricVision technology.
SAN product revenue for Q2 14 increased 1% Yr./Yr. When adjusted for the sale of the network adapter business, SAN product revenue increased 2% Yr./Yr.
Storage capacity expansion is a major pain point for IT organizations as they manage the ever-increasing growth of data. IDC estimates demand for Fibre Channel storage capacity is expected to grow at a 34% CAGR through 2017. The growth of data is highly correlated to the growth in both physical and virtualized servers, all of which must be connected to the network.
The Fibre Channel adapter market has been negatively impacted by the increase in virtualized servers while the Fibre Channel switching market will continue to grow. This growth is partly driven by traditional Fibre Channel-connected storage capacity. Industry research shows that storage administrators prefer Fibre Channel connectivity over other technologies to support virtualized data centers because of significant performance, automation and reliability advantages.
Emerging storage technologies are creating market expansion opportunities for Fibre Channel switching. For these applications, Fibre Channel offers the high-bandwidth capability, fast data accessibility, and superior reliability that are critical requirements. Brocade research indicates that more than 90% of standalone enterprise flash array systems connect via Fibre Channel. The ecosystem of flash array vendors that now support Fibre Channel connectivity includes major storage array suppliers such as EMC, HDS, HP, IBM, and NetApp, as well as new entrants such as PureStorage and Violin, with others planning to launch products this calendar year.
The latest Dell’Oro report showed Brocade’s calendar year market share grew from 69% in 2012 to 71% in 2013. Since the launch of our Gen 5 products in 2011, we have increased our market share by 4%. We are on track with the Gen 6 technology and expect initial shipments in the first-half of calendar 2016.
© 2014 Brocade Communications Systems, Inc. Page 7 of 27
Brocade Q2 FY 2014 Earnings 5/22/2014
IP Networking revenue met our expectations for the quarter despite continued challenges within the U.S. Federal business. Data center networking revenue accounted for an estimated 57% of our total IP Networking revenues and represented growth of approximately 4% Yr./Yr. Brocade VDX product revenue grew 22% year-over-year and continues to be our fastest growing data center hardware product line.
We expanded our Ethernet fabric offerings with the availability of multitenant solutions, the VCS Virtual Fabric, and support for 100 Gigabit Ethernet connectivity.
Multitenancy is a critical capability for cloud service providers and enterprises that offer Infrastructure as a Service (IaaS). It ensures that each tenant's traffic remains private while sharing a common infrastructure. In addition, new line cards for the Brocade VDX 8770 Switch enable a wider range of network topologies and broaden our capability to provide the high performance and density required for cloud optimized data center deployments.
In Q2 14 we made a strategic shift within the Brocade ADX product family to reduce our investment in the hardware-based platform while increasing investment in the software-based products. The virtual ADX will become part of our NFV portfolio. In making this shift, our aim is to align with the growing market trend to unlock the dependency between proprietary hardware and performance, allowing our customers to utilize the server platforms of their choice while obtaining the throughput and services they require, all within a virtualized environment. According to Dell'Oro Group, the Application Delivery Controller market revenue is expected to grow approximately 30% for software-based products through 2017, while growth rates are in the low single digits for hardware-based products.
During the quarter we launched a formalized trial program for the Brocade Virtual ADX and the Brocade Vyatta 5400 vRouter. As a result of this program, we saw a significant increase in the number of downloads compared with Q1, further seeding the market with our technology.
The Brocade Vyatta 5600 vRouter, became generally available in Q2 and is the first 10 Gigabit virtual router for carrier-class networks.
Finally, Brocade Network Subscription secured wins at a major financial services company and a global systems integrator during the quarter.
© 2014 Brocade Communications Systems, Inc. Page 8 of 27
Brocade Q2 FY 2014 Earnings 5/22/2014
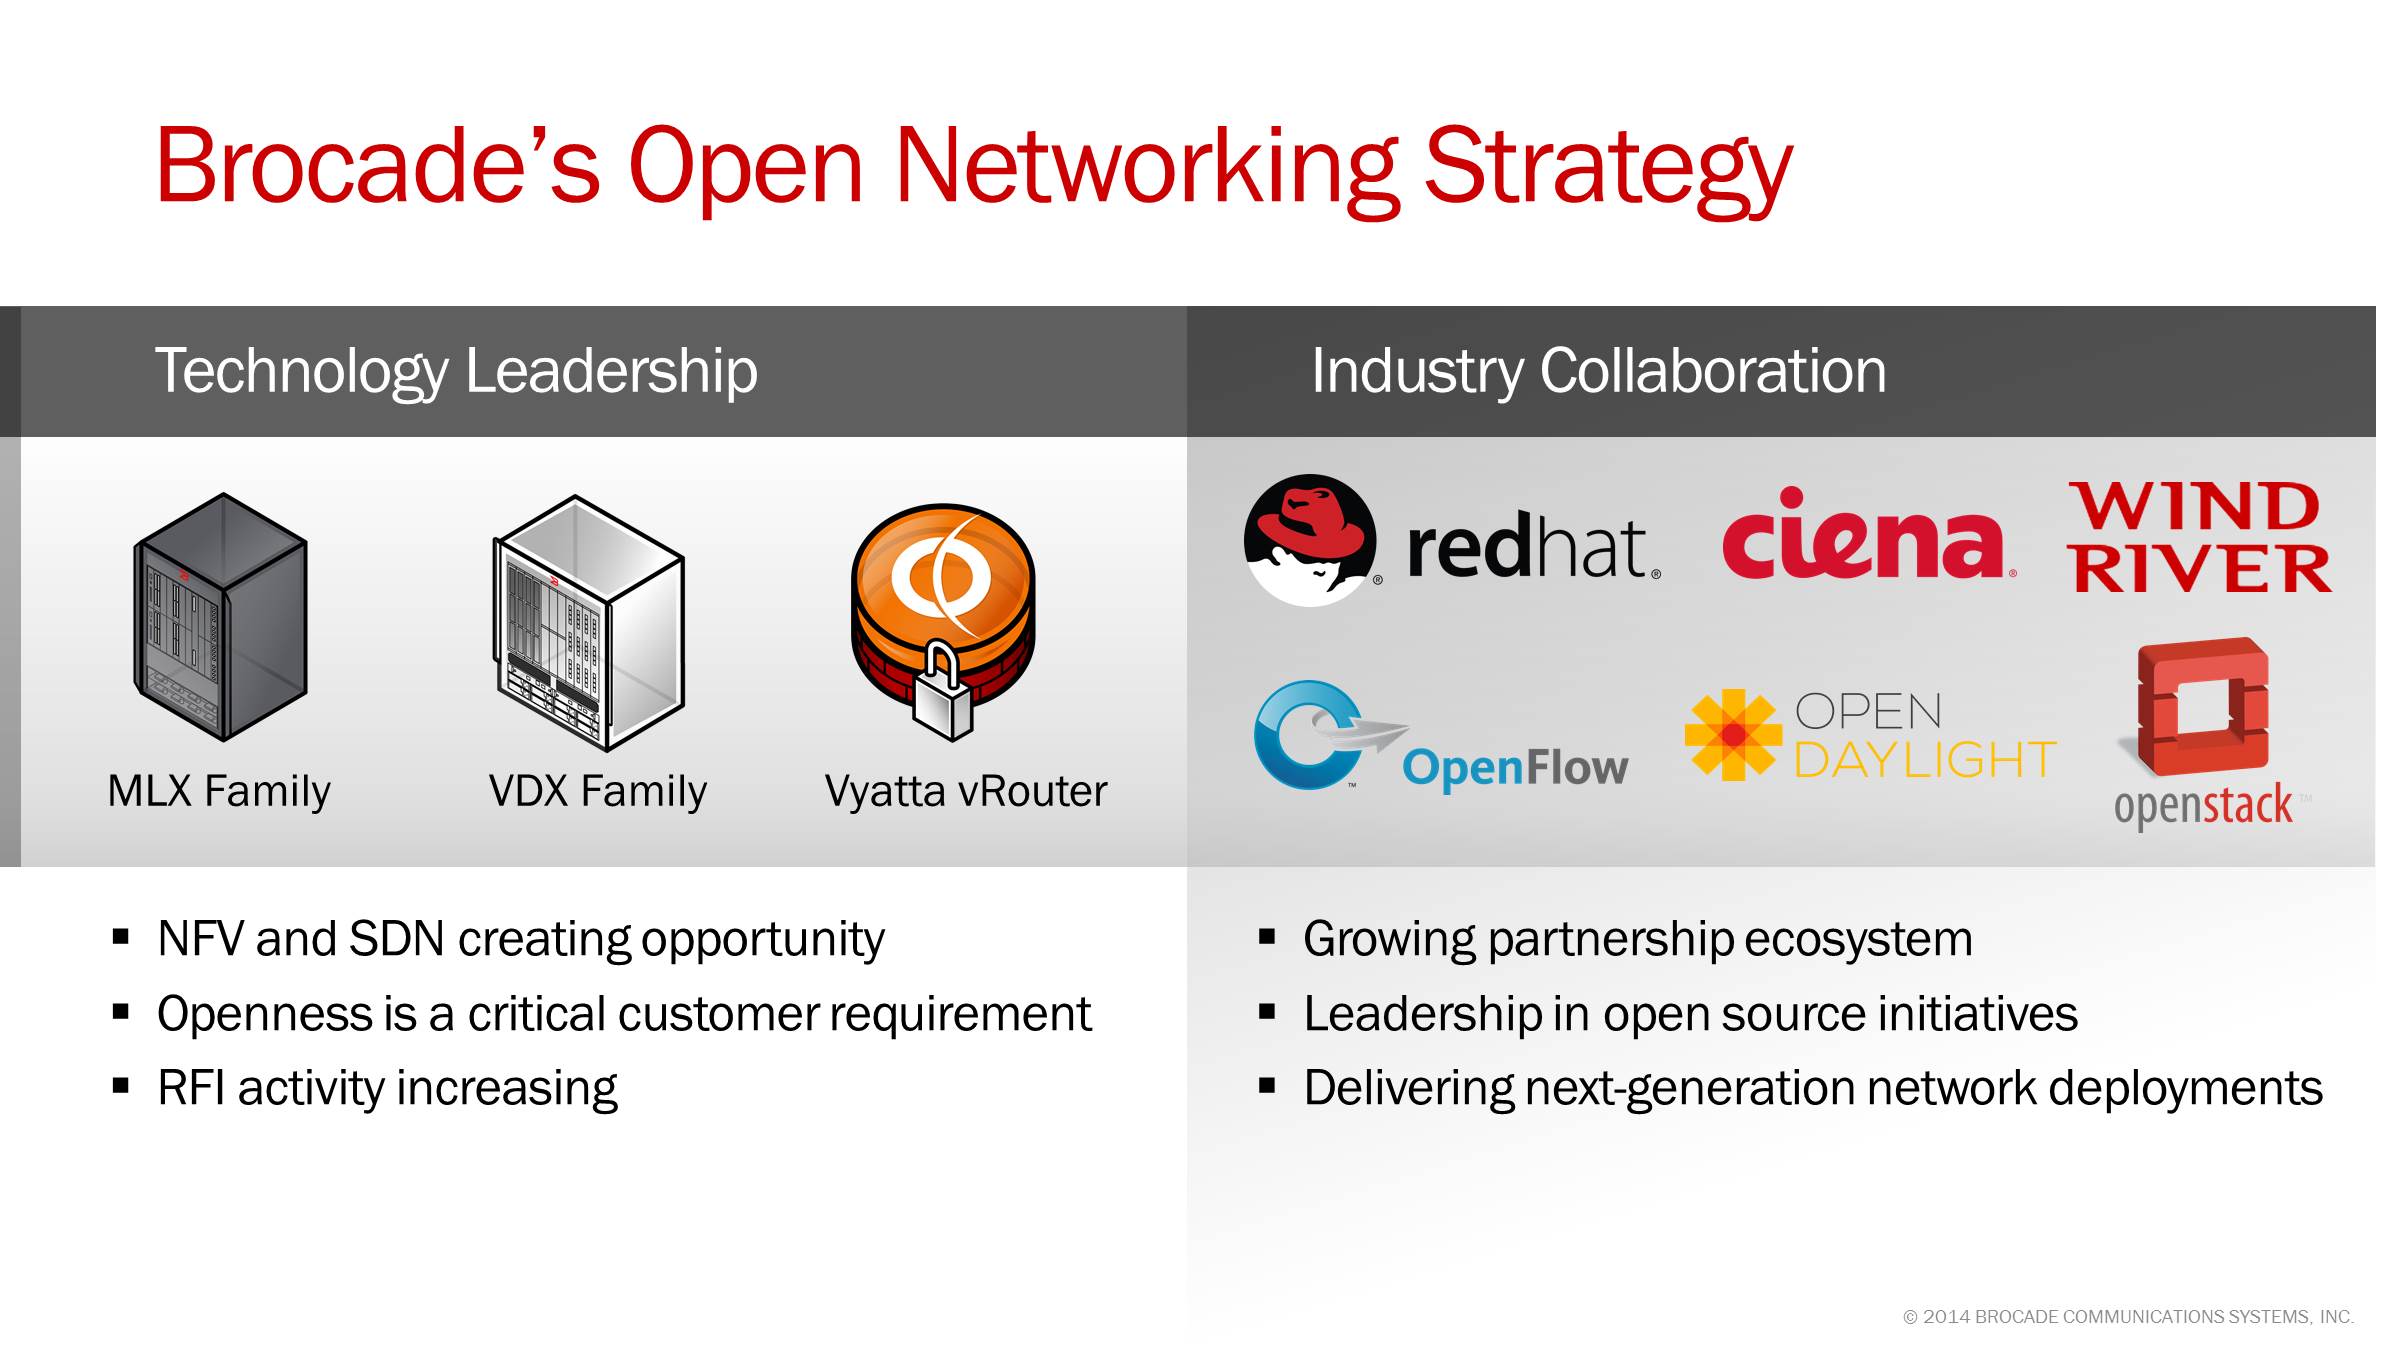
We remain excited about disruptive technologies like NFV and SDN which create opportunities in the networking industry. These new architectures break the closed, proprietary model that has long favored incumbency.
Vertical architectures are giving way to open solutions that allow customers to select best-of-breed technologies that enable new services and networks optimized for their own specific requirements. I can say without hesitation that “openness” is an integral part of nearly every discussion I have with customers and I firmly believe it is creating meaningful business opportunities for Brocade. Disruption in the data center is real and it is happening today.
For example, we are included in many RFIs from thought leaders in the service provider and enterprise space that we haven’t worked with previously, including a number of Tier-1 service providers around the world. We are excited to be one of a select number of companies in Telefonica’s NFV proof-of-concept project, in which we support the carrier-grade OpenStack virtualized infrastructure manager (VIM) and NFV infrastructure. And in April, Brocade was named the SDN Idol Winner at the Open Networking Summit where we demonstrated a real-time analytics solution for security mitigation.
Brocade remains committed to openness at the code, component, product, solution, and network levels. This is in stark contrast to our competitors and will differentiate us in the eyes of customers that seek to break free of vendor lock-in.
This commitment is demonstrated by our support of system architectures that include multi-vendor, best-of-breed components. We are actively involved in the foundational SDN and NFV-related initiatives and open source organizations, such as OpenDaylight, OpenStack, the Open Networking Foundation (ONF), the Internet Engineering Task Force (IETF), and the European Telecommunications Standards Institute (ETSI), providing technical and thought leadership to this rapidly evolving industry movement.
Last month we announced OpenFlow 1.3 support is planned to be available later this year across our entire IP routing and switching portfolio. Brocade technology allows service providers and enterprises to transition to SDN by enabling inter-working between SDN and non-SDN networks.
Brocade continues to expand its partner ecosystem. For example, earlier this month we announced a new solution with Ciena that provides dynamic resource provisioning for cloud networking. We are collaborating with Red Hat and Wind River on the development of carrier-class functionality for software-defined networking.
In total, emerging technologies such as fabrics, SDN, and NFV are playing an increasingly important role in customer discussions and buying decisions. Our commitment to open architectures and our differentiated capabilities are increasing customer engagements and creating new business opportunities. While this market is early in its formation, it is a key component of our growth strategy.
© 2014 Brocade Communications Systems, Inc. Page 9 of 27
Brocade Q2 FY 2014 Earnings 5/22/2014
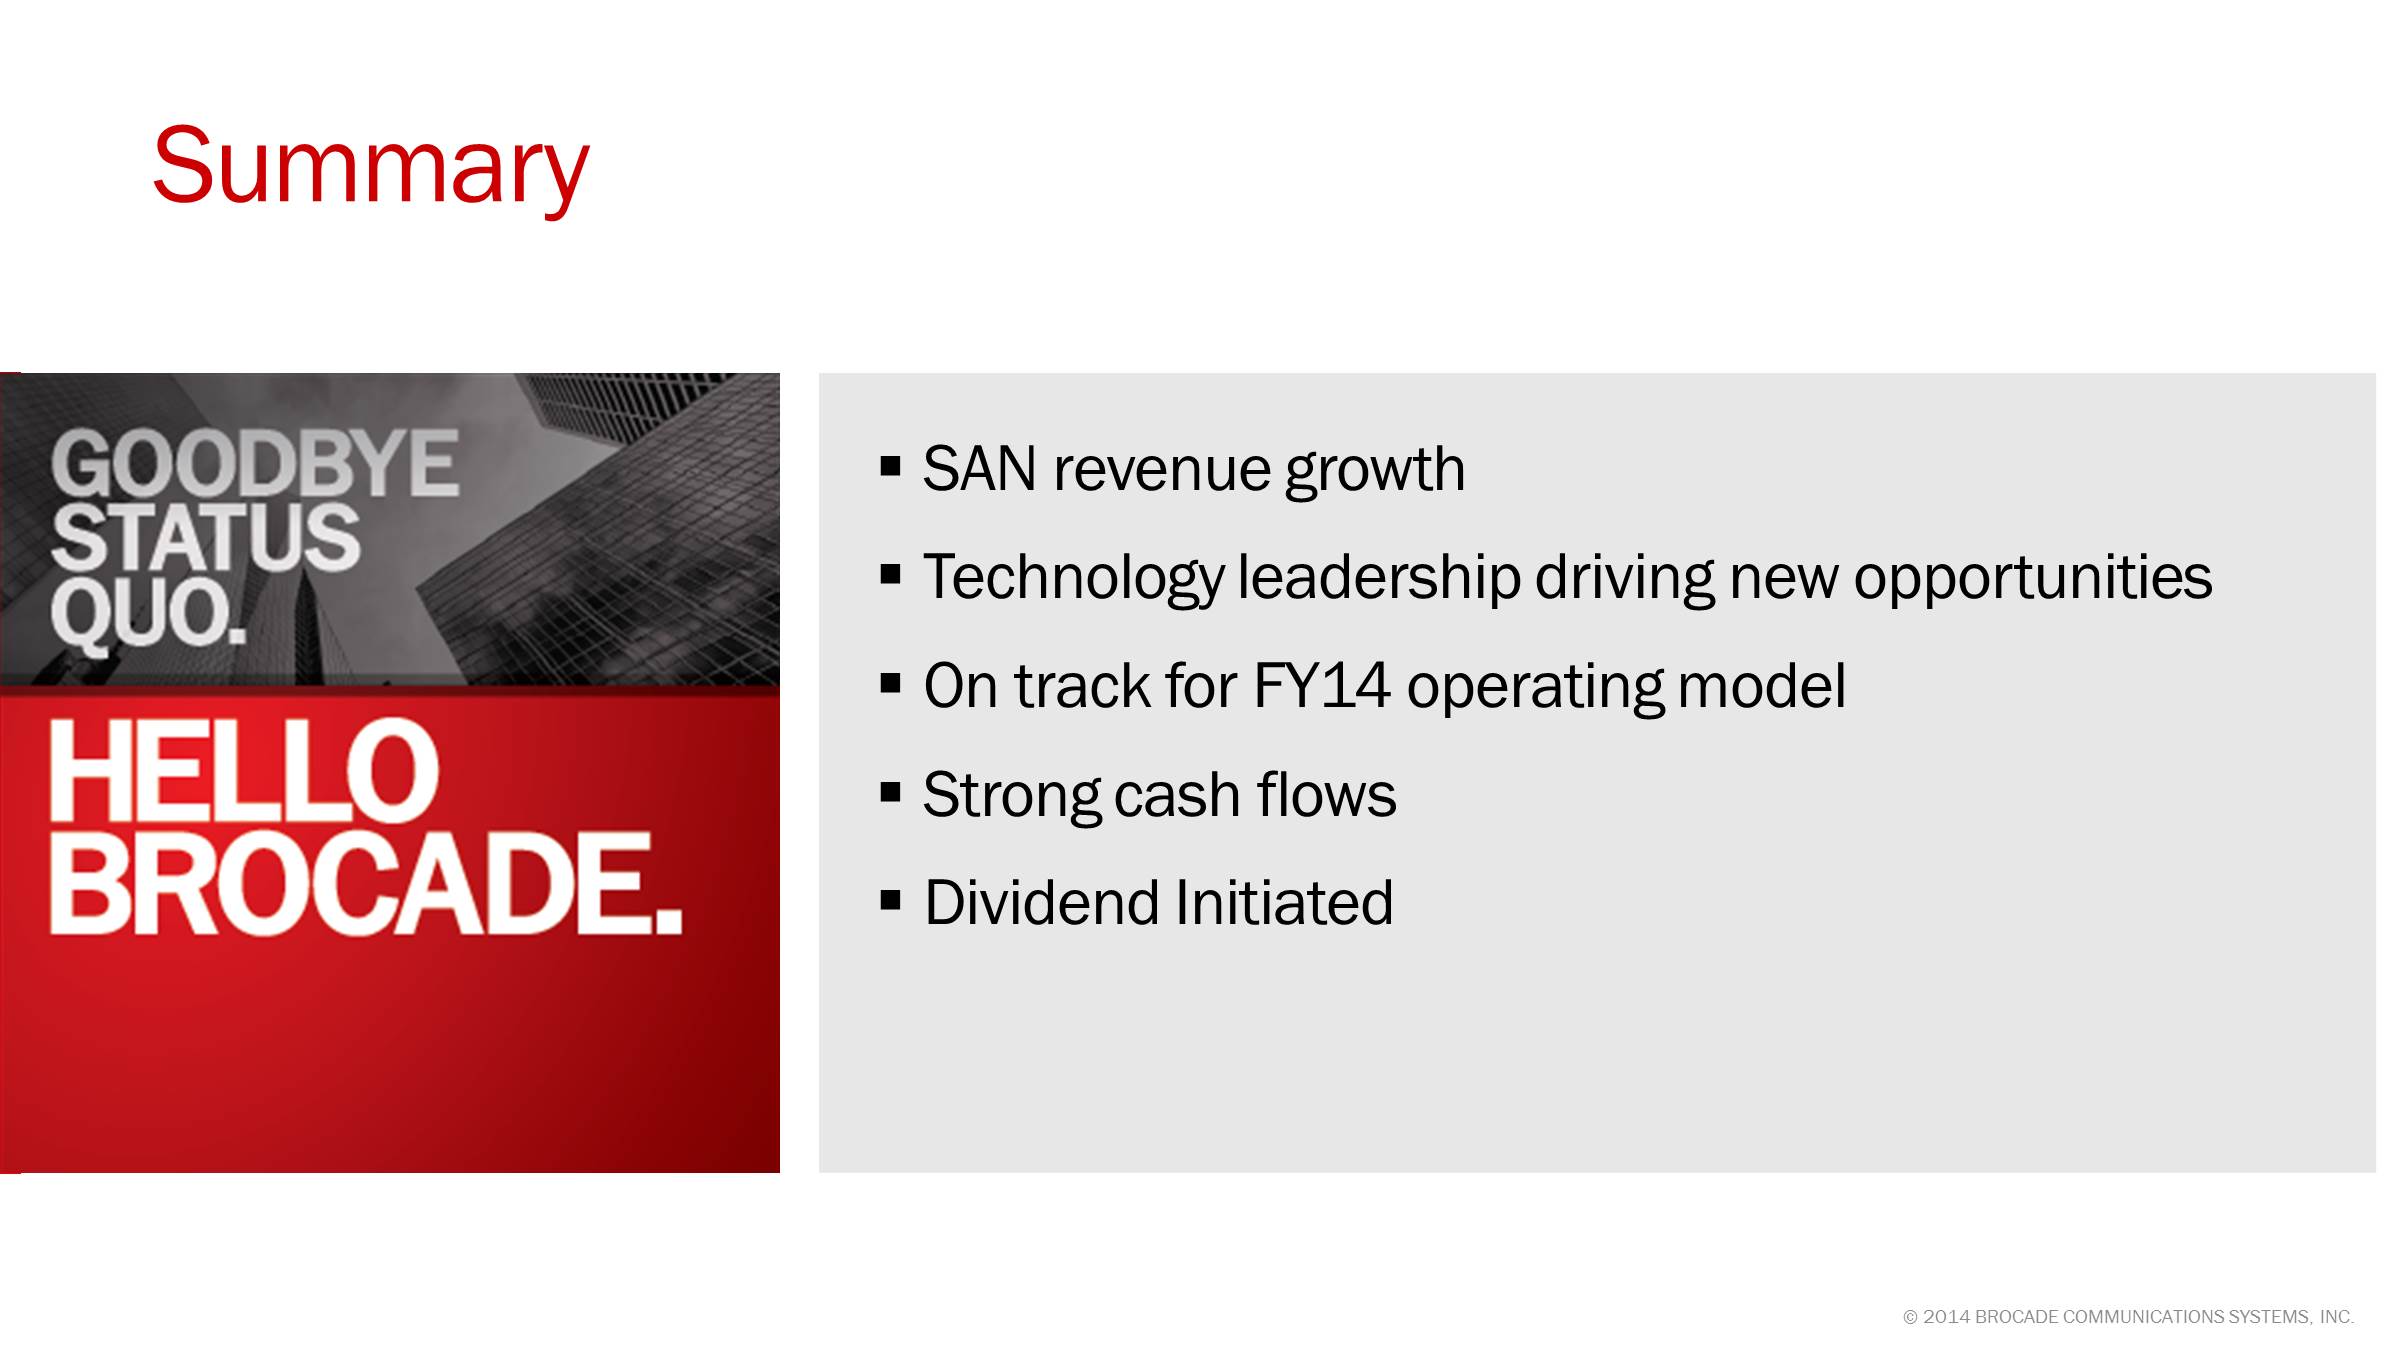
In summary, this was another solid quarter for Brocade in which we executed against our strategic goals, met our financial objectives, and saw our SAN business grow year-over-year.
At the half-way mark of our fiscal 2014, Brocade is on track to meet the operating model we communicated at our September 2013 Analyst Day. In addition, we have already achieved more than 50% of the operating cash flow estimate for fiscal 2014. The continued strength of our operational performance and cash flow has enabled us to enhance our capital allocation program with the initiation of a cash dividend to be paid in Q3 14.
Our technology leadership and focus on the data center is continuing to drive new opportunities in our business. We will build on our #2 position in data center networking and focus on the world’s largest enterprise, telco and cloud service provider customers. We are confident that we have the right team, the right products, and the right strategy to take advantage of market trends that can drive our growth throughout this year and beyond.
© 2014 Brocade Communications Systems, Inc. Page 10 of 27
Brocade Q2 FY 2014 Earnings 5/22/2014
Prepared comments provided by Dan Fairfax, CFO
© 2014 Brocade Communications Systems, Inc. Page 11 of 27
Brocade Q2 FY 2014 Earnings 5/22/2014
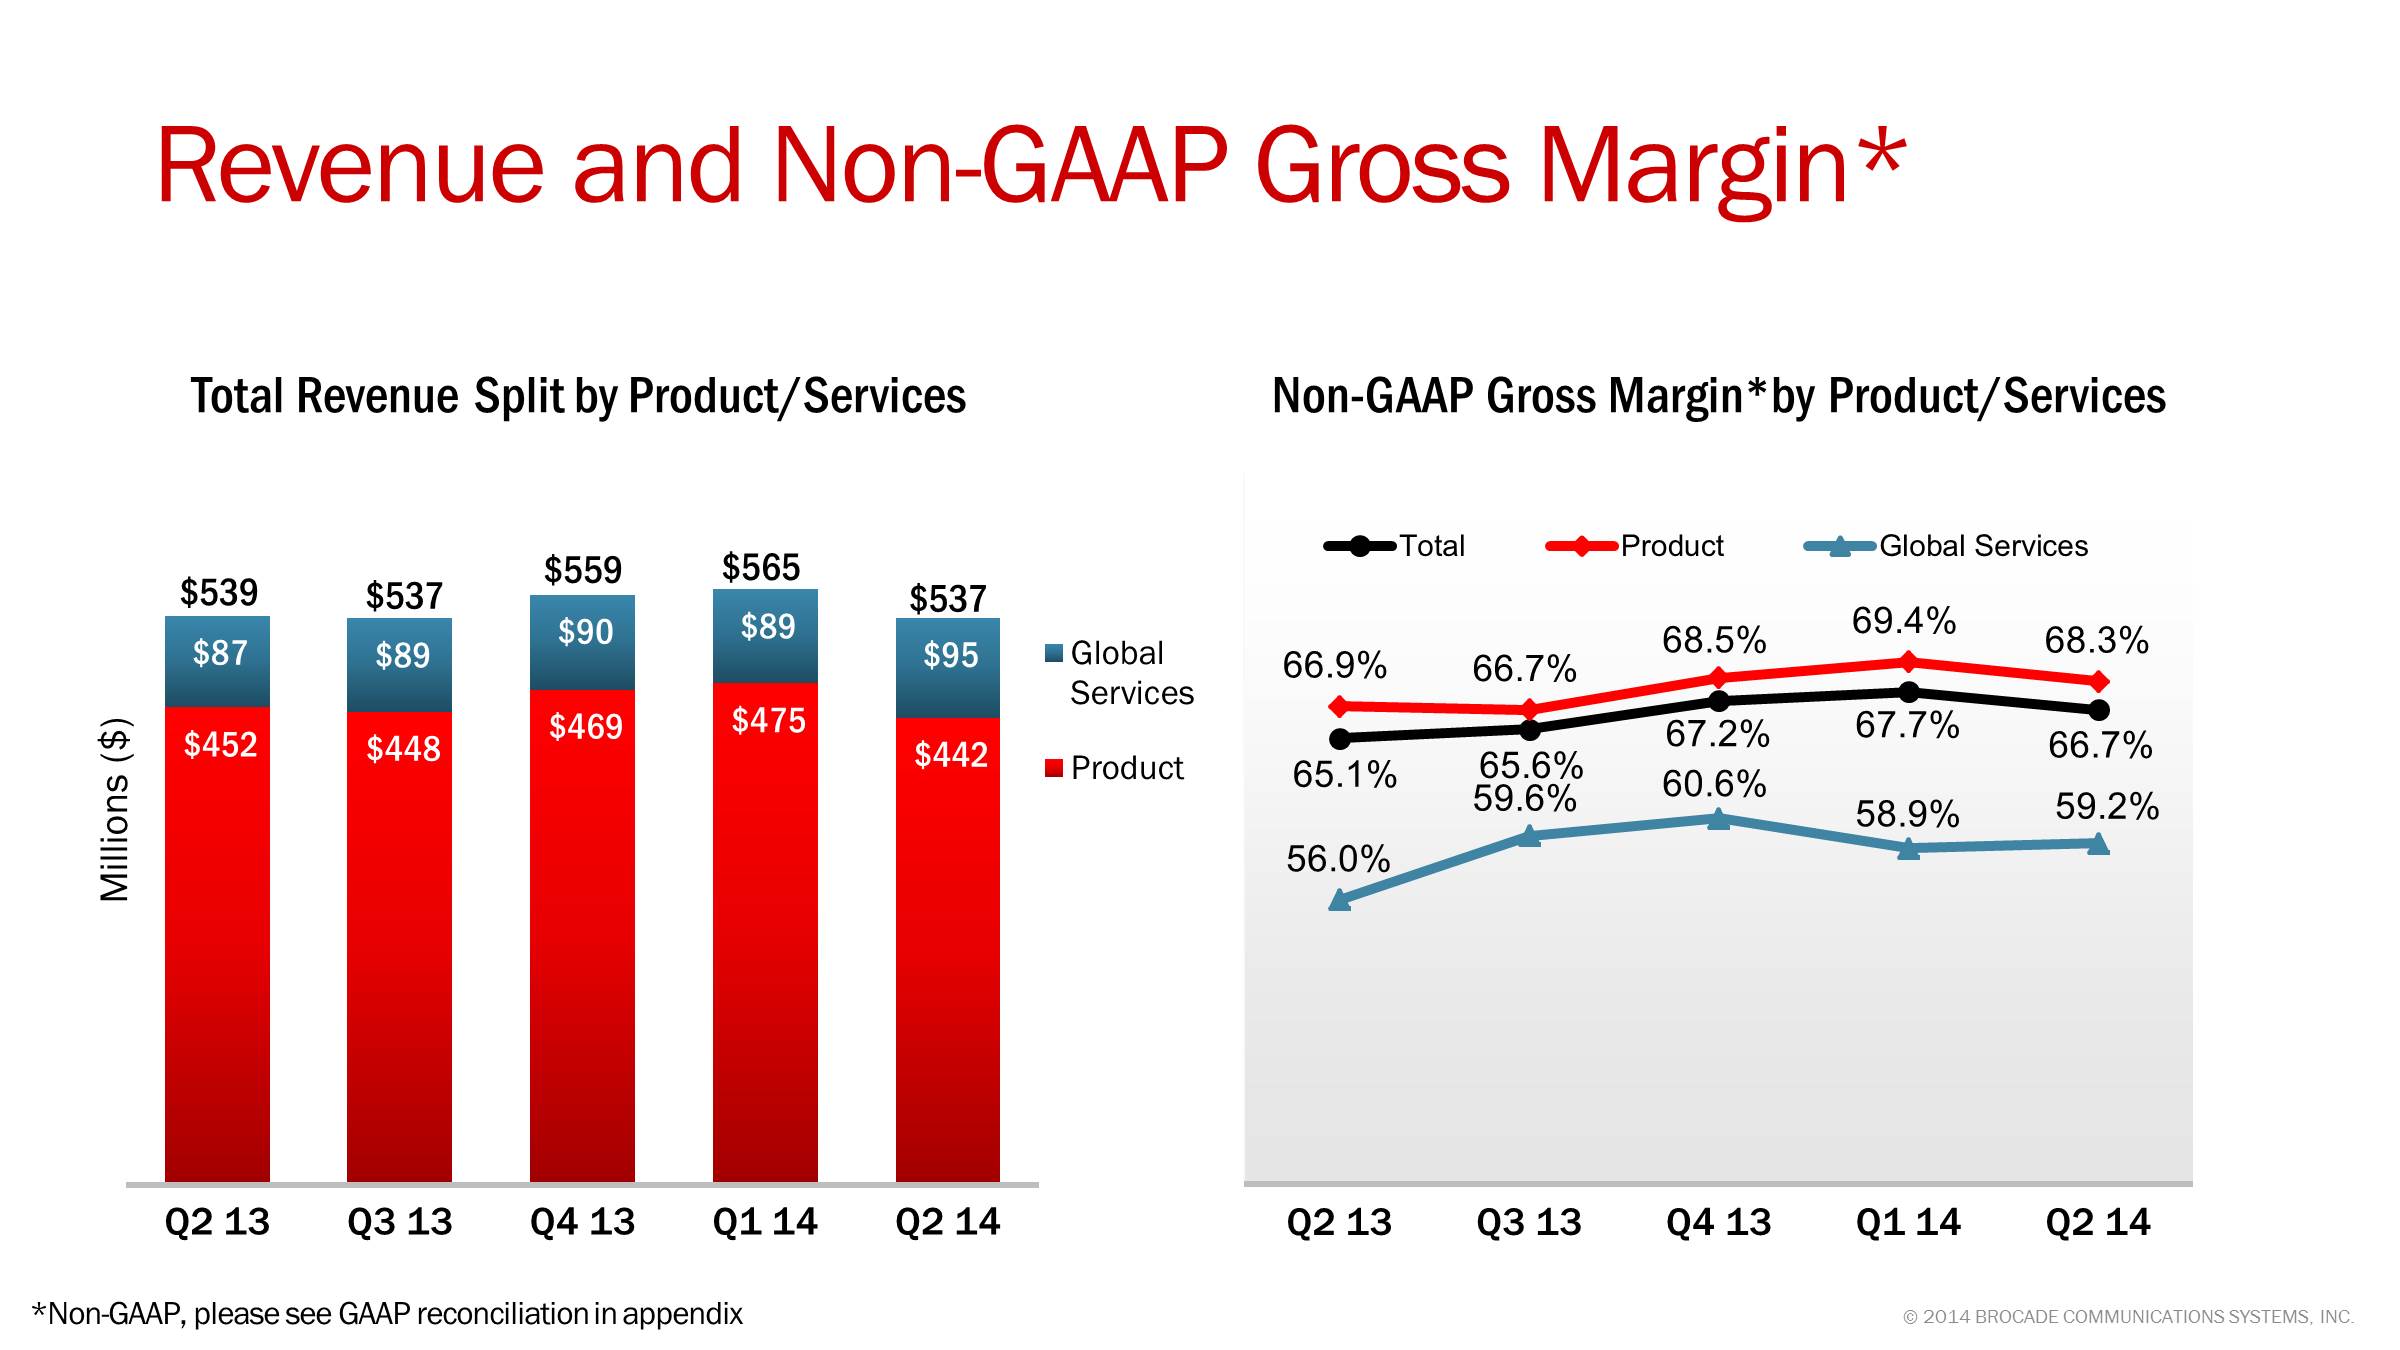
In Q2 14, revenue was $537M, flat Yr./Yr. and down 5% sequentially. SAN product revenue was $321M in the quarter, an increase of 1% Yr./Yr. and down 10% sequentially in a seasonally soft quarter for some of our OEM partners. SAN product revenue represented 60% of total revenue, compared with 63% in Q1 14 and 59% in Q2 13.
Revenue from our IP Networking products in Q2 14 was $121M, down 9% Yr./Yr. and up 1% sequentially. The year-over-year decline was due to lower sales to the U.S. Federal government, the divestiture of the network adapter business, and the change in our wireless and Brocade ADX business strategies. The sequential increase was principally due to higher sales of Ethernet switching products. IP Networking product revenue represented 22% of total revenue in Q2, compared with 21% in Q1 14 and 25% in Q2 13.
Q2 14 Global Services revenue was $95M, up 9% Yr./Yr. and up 6% sequentially. The year-over-year and sequential increase was primarily due to Q2 14 being a 14-week quarter, which resulted in an extra week of amortized support revenue. Global Services revenue represented 18% of total Q2 revenue, compared with 16% in both Q1 14 and Q2 14.
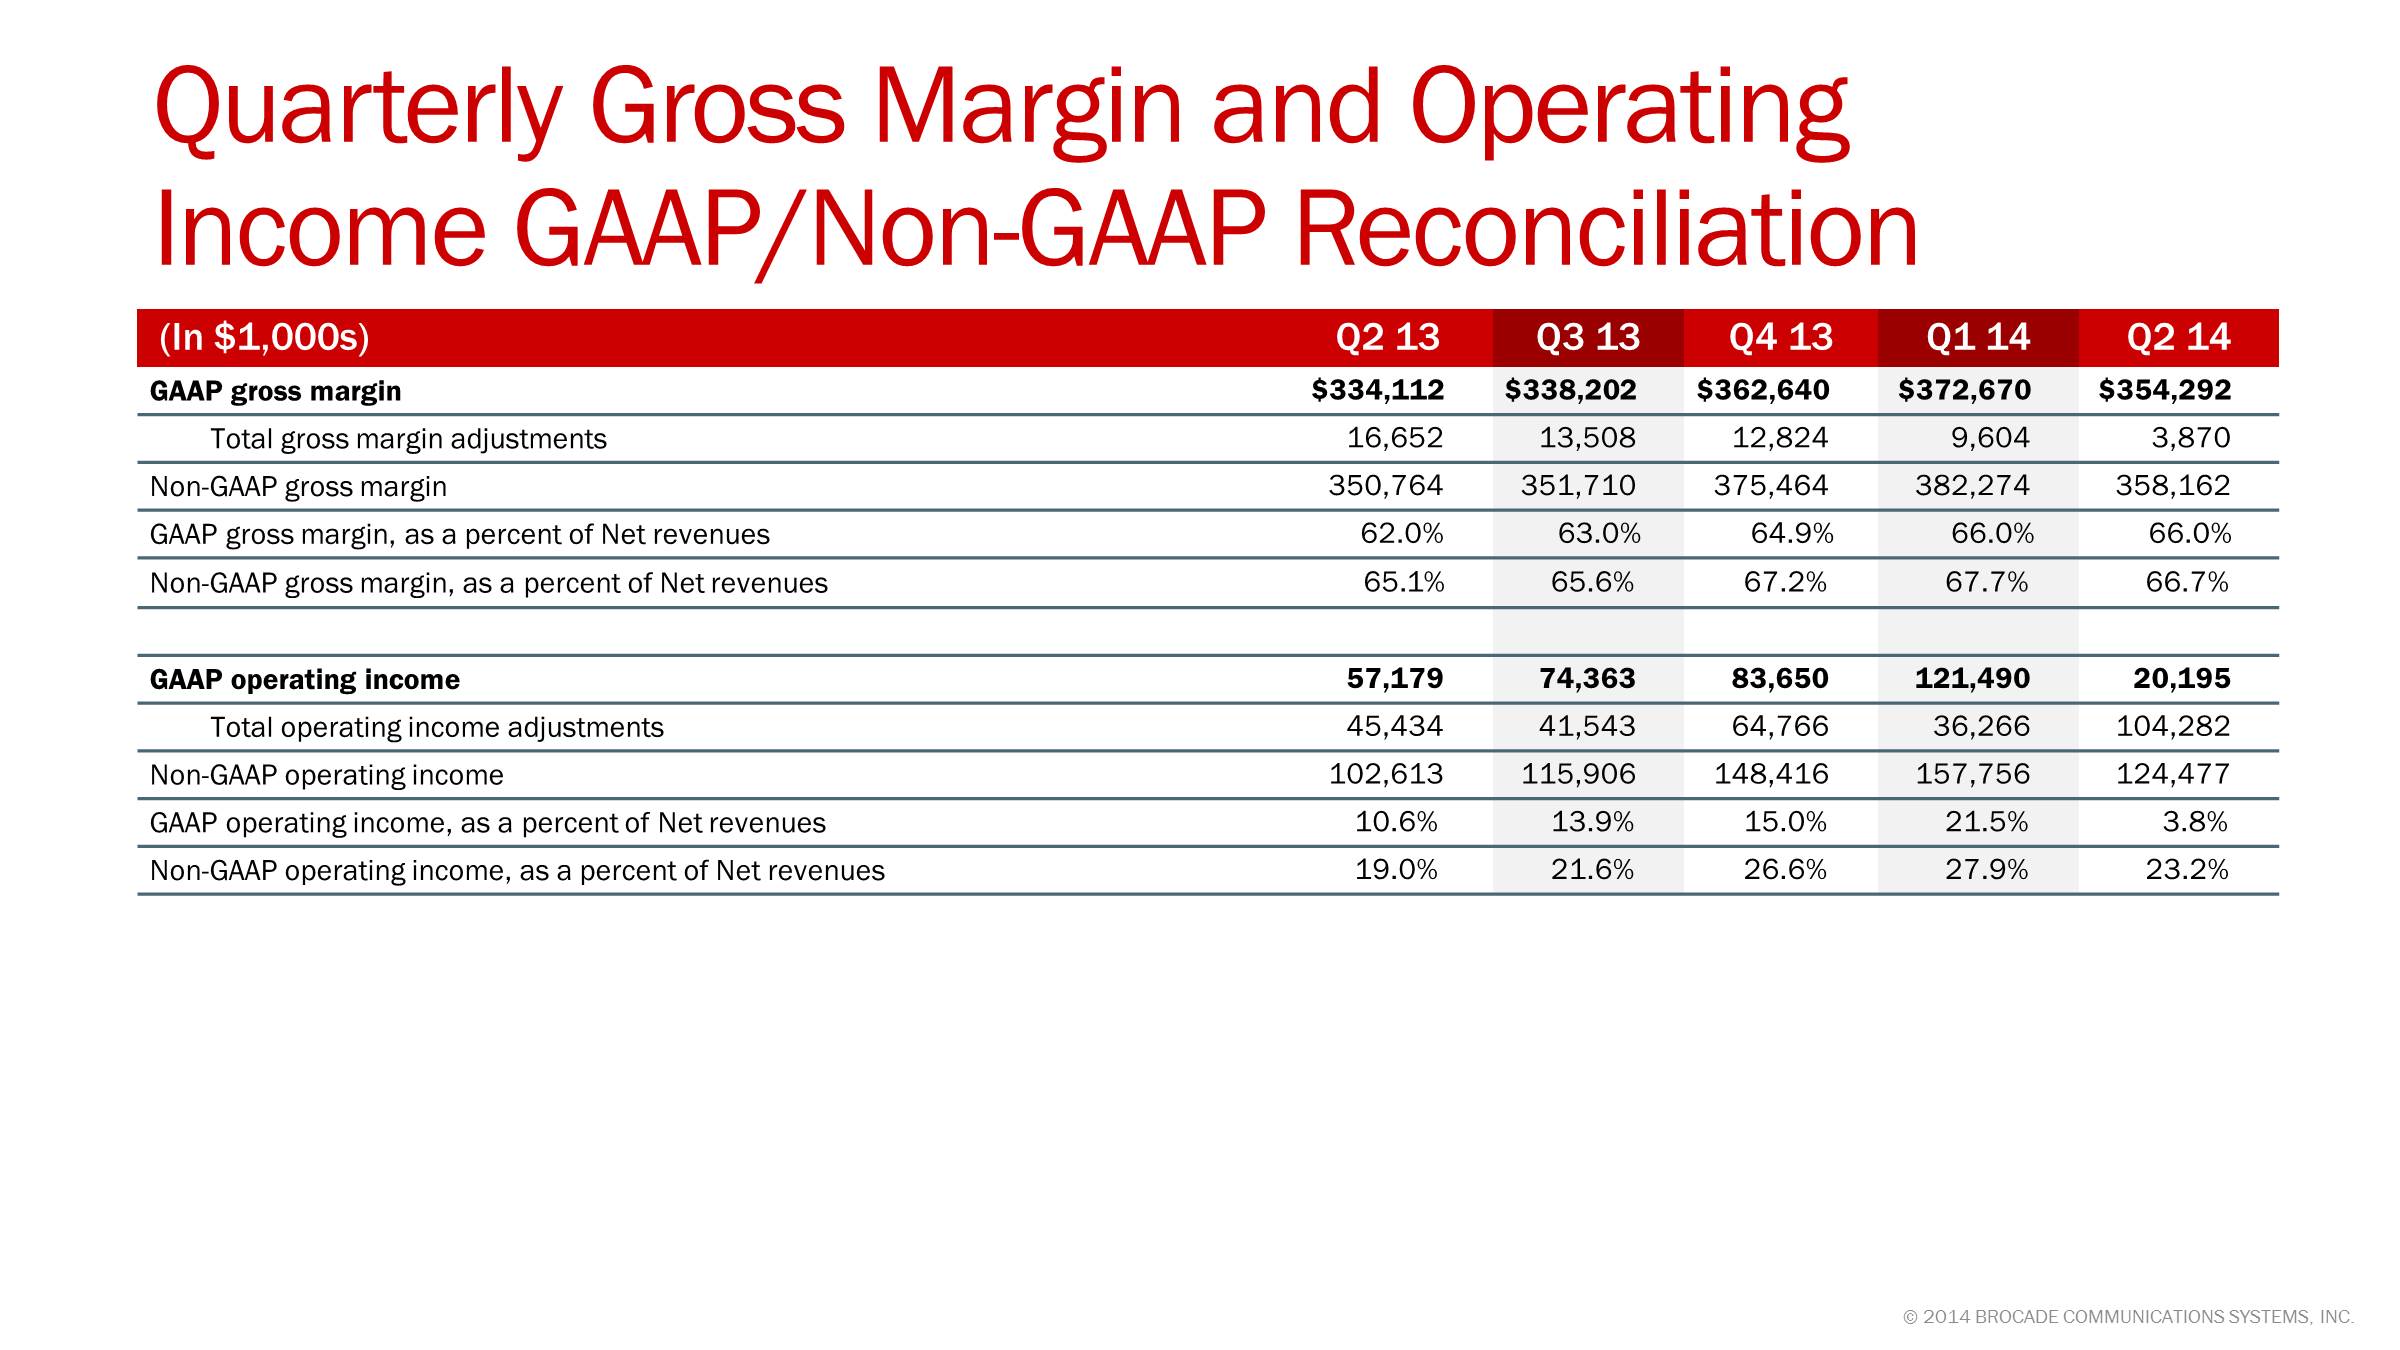
Non-GAAP gross margin was 66.7% in Q2 14, up 160 basis points from Q2 13 and down 100 basis points from Q1 14. The year-over-year improvement in gross margin was due to lower manufacturing and overhead costs, a favorable revenue mix shift to more SAN products, and a favorable product and customer mix within the IP Networking business. The sequential decline was primarily due to seasonally lower volume, a less favorable revenue mix shift to less SAN products, and higher overhead costs due to the additional week of spending from the 14-week quarter. Non-GAAP operating margin was 23.2% in Q2, up 420 basis points from Q2 13 due to lower operating expenses and down 470 basis points from Q1 14 due to lower revenue and increased operating expense from the extra week in Q2 14.
As Lloyd mentioned, we have initiated a quarterly cash dividend of $0.035 per share of common stock to stockholders of record as of the close of market on June 10, 2014. Annualized, the dividend represents approximately 13% of our adjusted free cash flow target for FY14.
© 2014 Brocade Communications Systems, Inc. Page 12 of 27
Brocade Q2 FY 2014 Earnings 5/22/2014
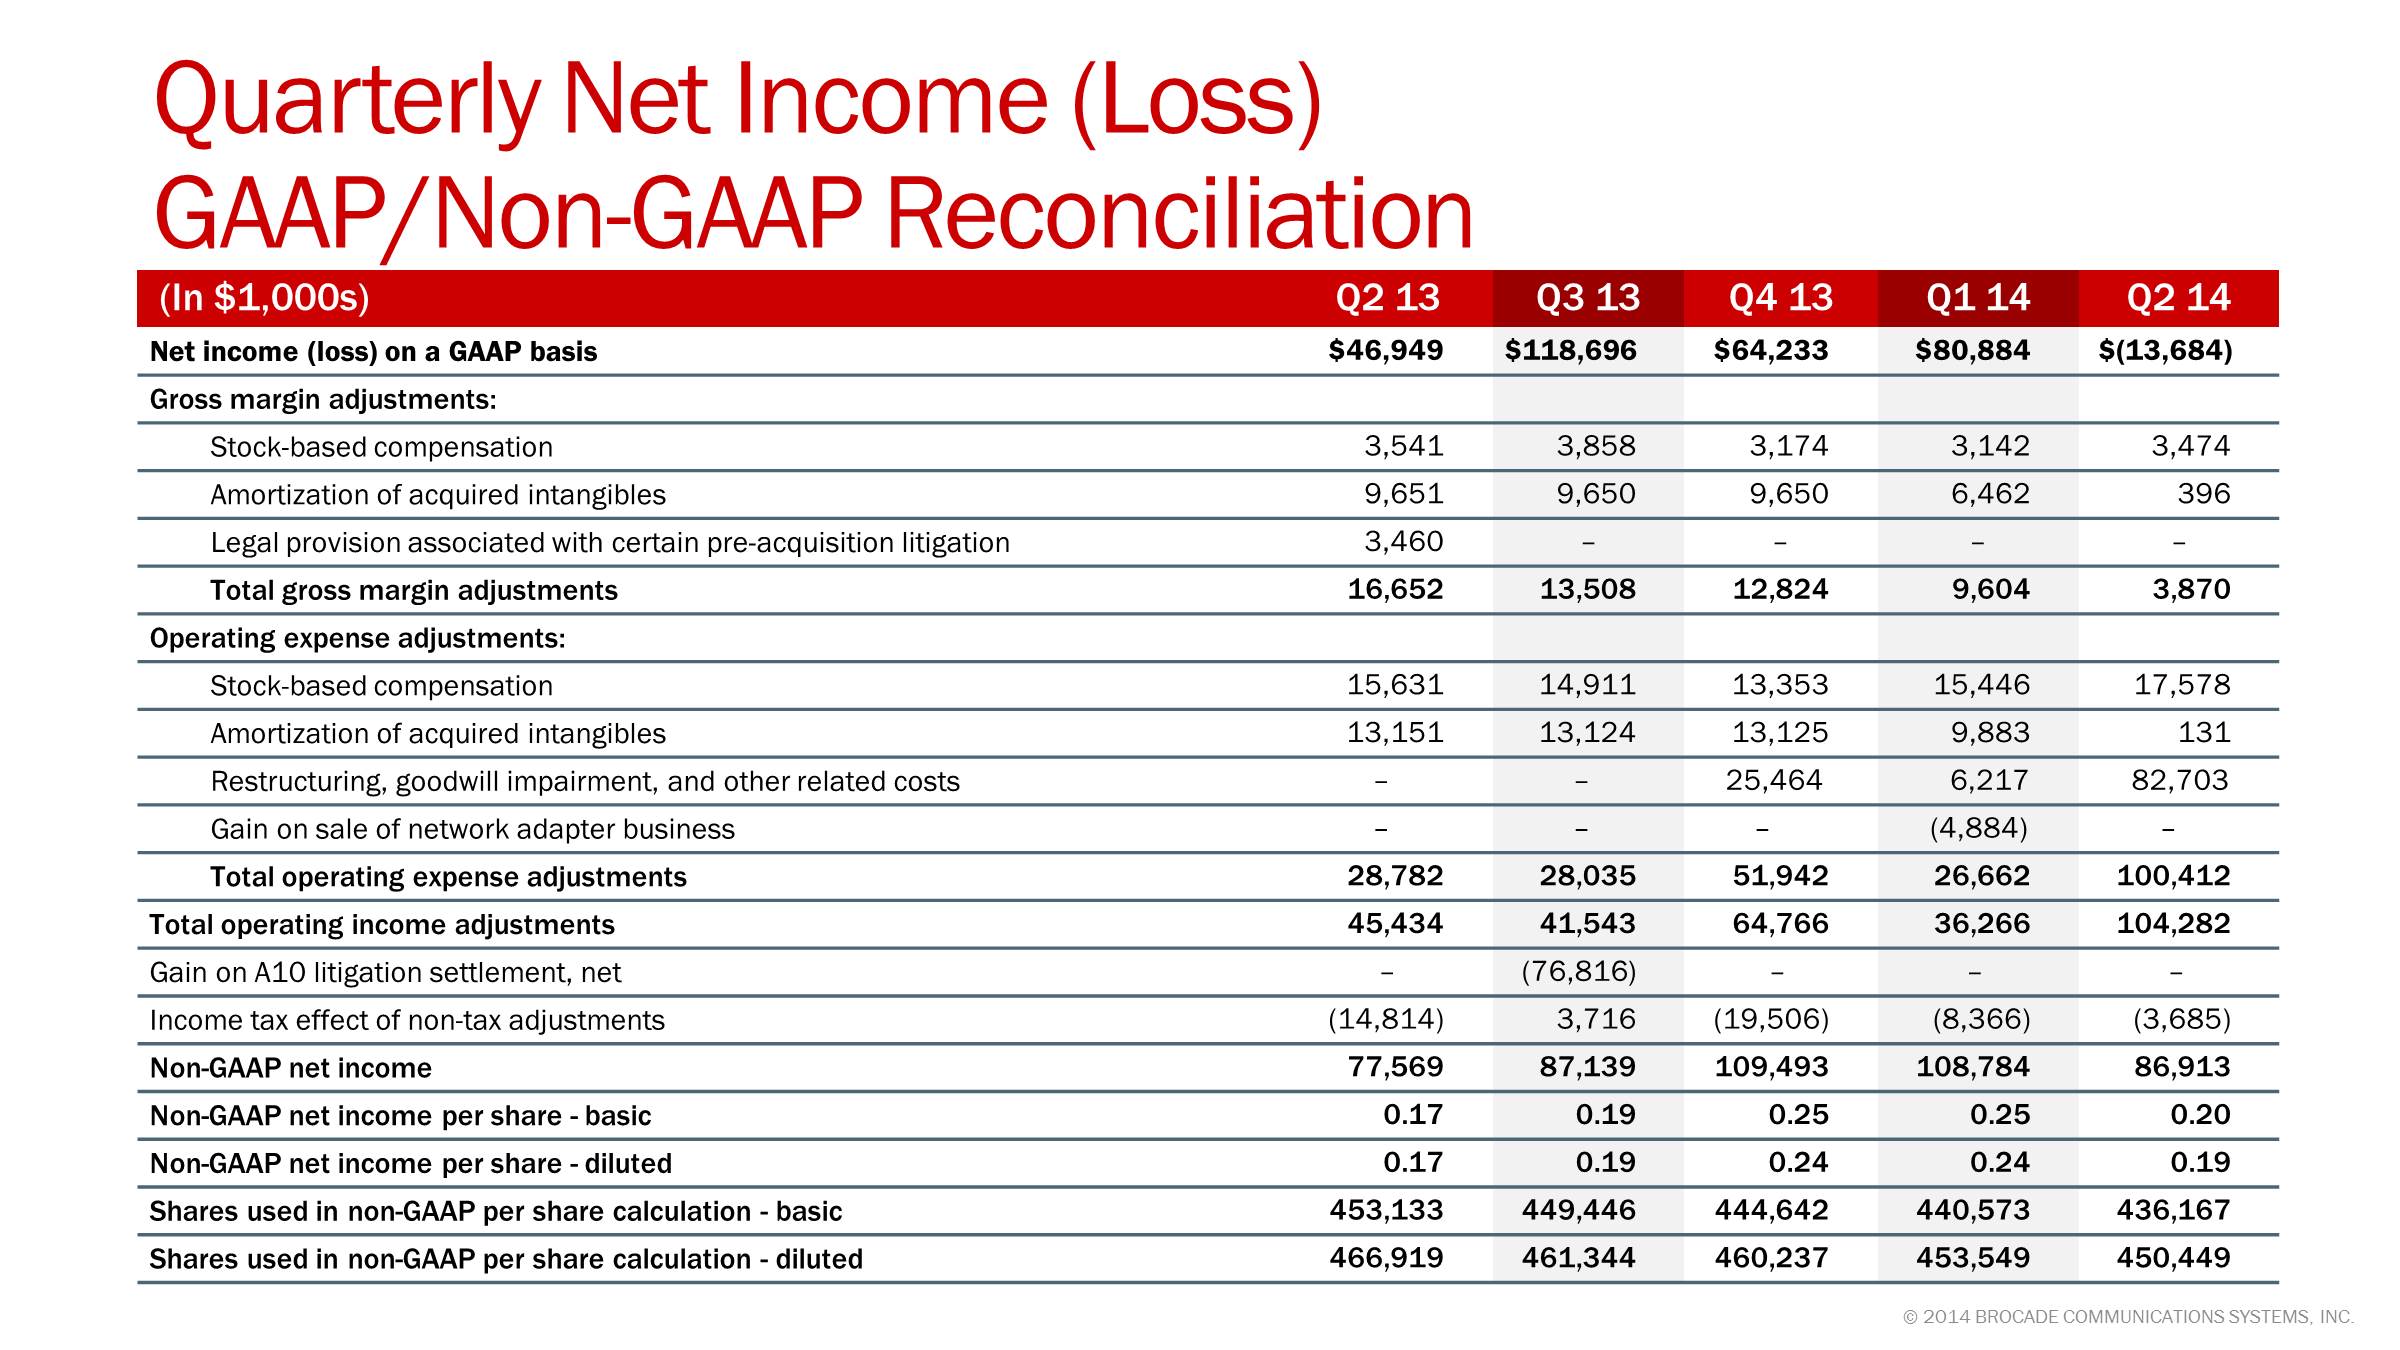
Q2 14 GAAP loss per share was $(0.03), down from EPS of $0.10 in Q2 13 and $0.18 in Q1 14. Non-GAAP diluted EPS was $0.19 in the quarter, up from $0.17 in Q2 13 and down from $0.24 in Q1 14. The GAAP loss was due to an $83 million non-cash goodwill impairment charge associated with the Brocade ADX product family. During Q2 14, we made a strategic shift to reduce investment in the hardware-based ADX and to increase investment in the software-based ADX products for the Layer 4-7 market. As a result of this shift, we expect hardware-based ADX and related support revenue to be negatively impacted by $20 million to $40 million on an annualized basis.
In Q2 14 the effective GAAP tax rate was 225.1% and the effective non-GAAP tax rate was 24.6%. The $83 million goodwill impairment charge is non-deductible for tax purposes resulting in the Company's effective GAAP tax rate being significantly higher in Q2 14 than in Q1 14. In addition, the effective GAAP and non-GAAP tax rates for Q2 14 were higher than Q2 13 due to the R&D tax credit that expired on December 31, 2013 and has not been extended by Congress.
In Q2 14 we generated $168M in operating cash flow, up 41% Yr./Yr. and 54% Qtr./Qtr. The year-to-year increase in operating cash flow was primarily due to lower days sales outstanding (DSOs) as well as increased operating profits. The increase in operating cash flow from Q1 14 was due to the timing of payment for employee incentives, which are made semi-annually. Non-GAAP average diluted shares outstanding for Q2 14 was 450 million shares, down 4% Yr./Yr. and down 1% Qtr./Qtr.
© 2014 Brocade Communications Systems, Inc. Page 13 of 27
Brocade Q2 FY 2014 Earnings 5/22/2014
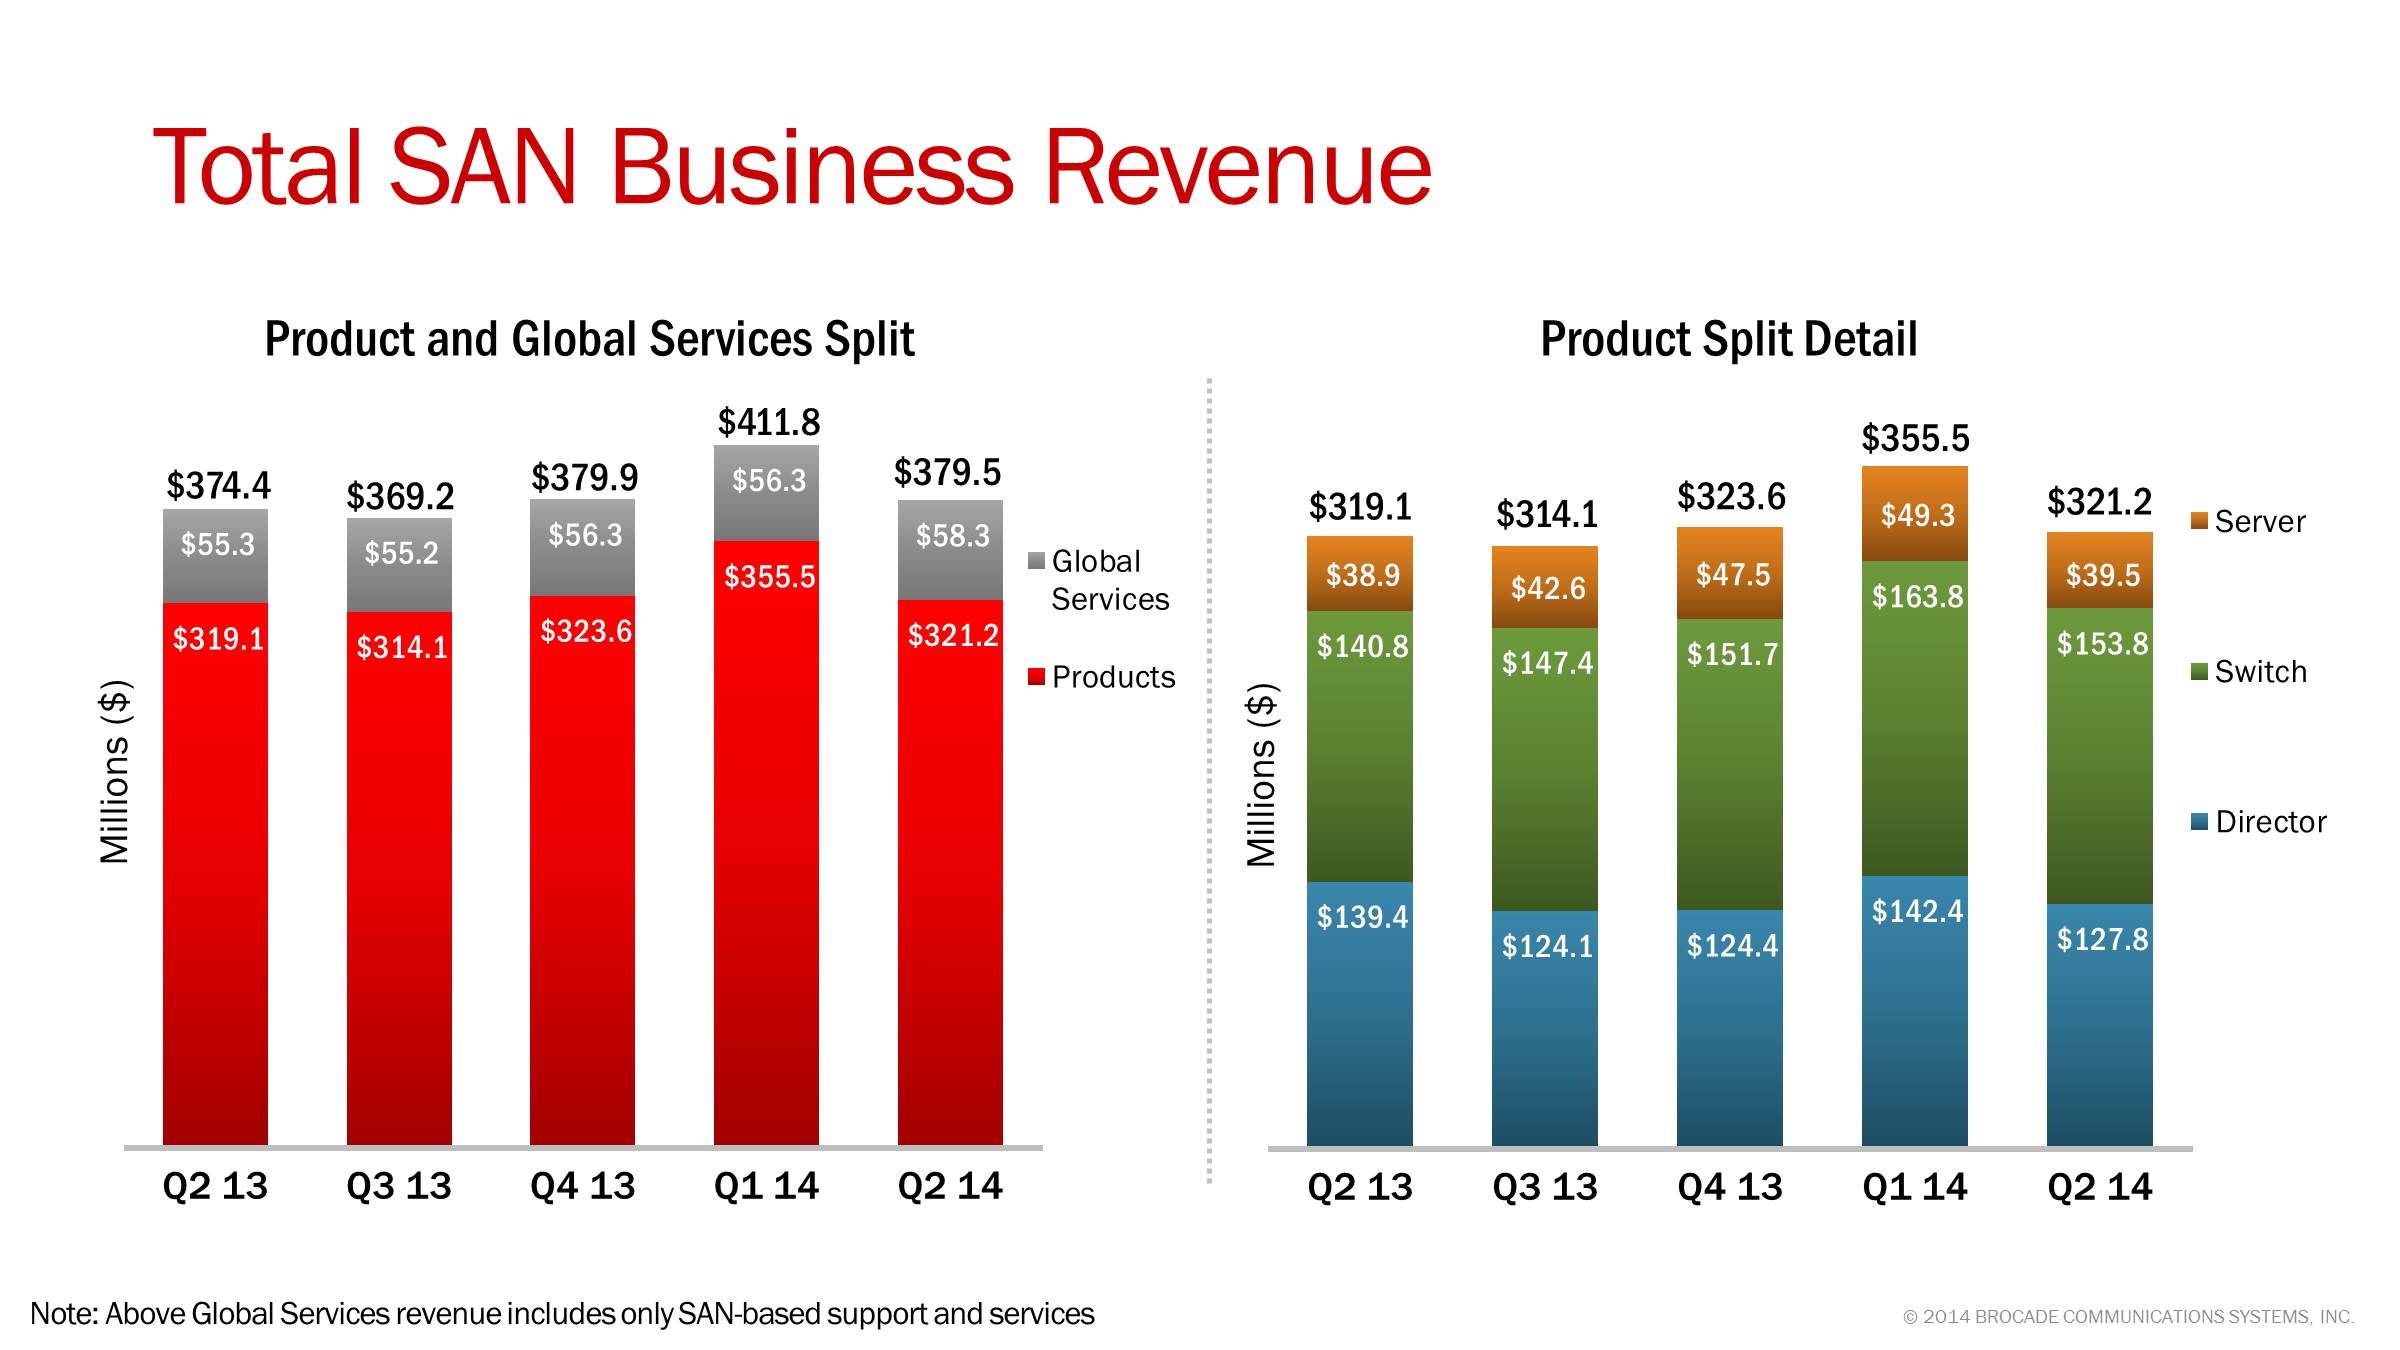
For our total SAN business, including hardware products and SAN-based support and services, Q2 14 revenue was $379M, up 1% from Q2 13 and down 8% sequentially.
Our SAN product revenue in the quarter saw strong performance in our switch and embedded product families. SAN product revenue was $321M in the quarter, up 1% Yr./Yr. and down 10% sequentially. When adjusted for the sale of the network adapter business that occurred in Q1 14, SAN product revenue was up 2% Yr./Yr. and down 9% sequentially. The sequential decline in SAN product revenue was due to a seasonally soft quarter for some of our OEM partners as well as certain partner specific sales disruption. The healthy demand for our SAN products, coupled with strong shipment linearity, resulted in Brocade ending the quarter with 1.2 weeks of OEM inventory; a decrease both year-over-year and sequentially.
In looking at the SAN product families, director revenue was down 8% Yr./Yr. and down 10% sequentially. SAN switch revenue was up 9% Yr./Yr. and down 6% Qtr./Qtr. Our Server product group, including embedded switches and server adapter products, was up 2% Yr./Yr. and down 20% Qtr./Qtr. When adjusted for the sale of the network adapter business, Server product group product revenue was up 13% Yr./Yr. and down 14% sequentially.
SAN-based support and services revenue was $58M in the quarter, up 5% Yr./Yr. and up 4% sequentially due to the benefit of an additional week of amortized support revenue from the 14-week quarter in Q2 14.
© 2014 Brocade Communications Systems, Inc. Page 14 of 27
Brocade Q2 FY 2014 Earnings 5/22/2014
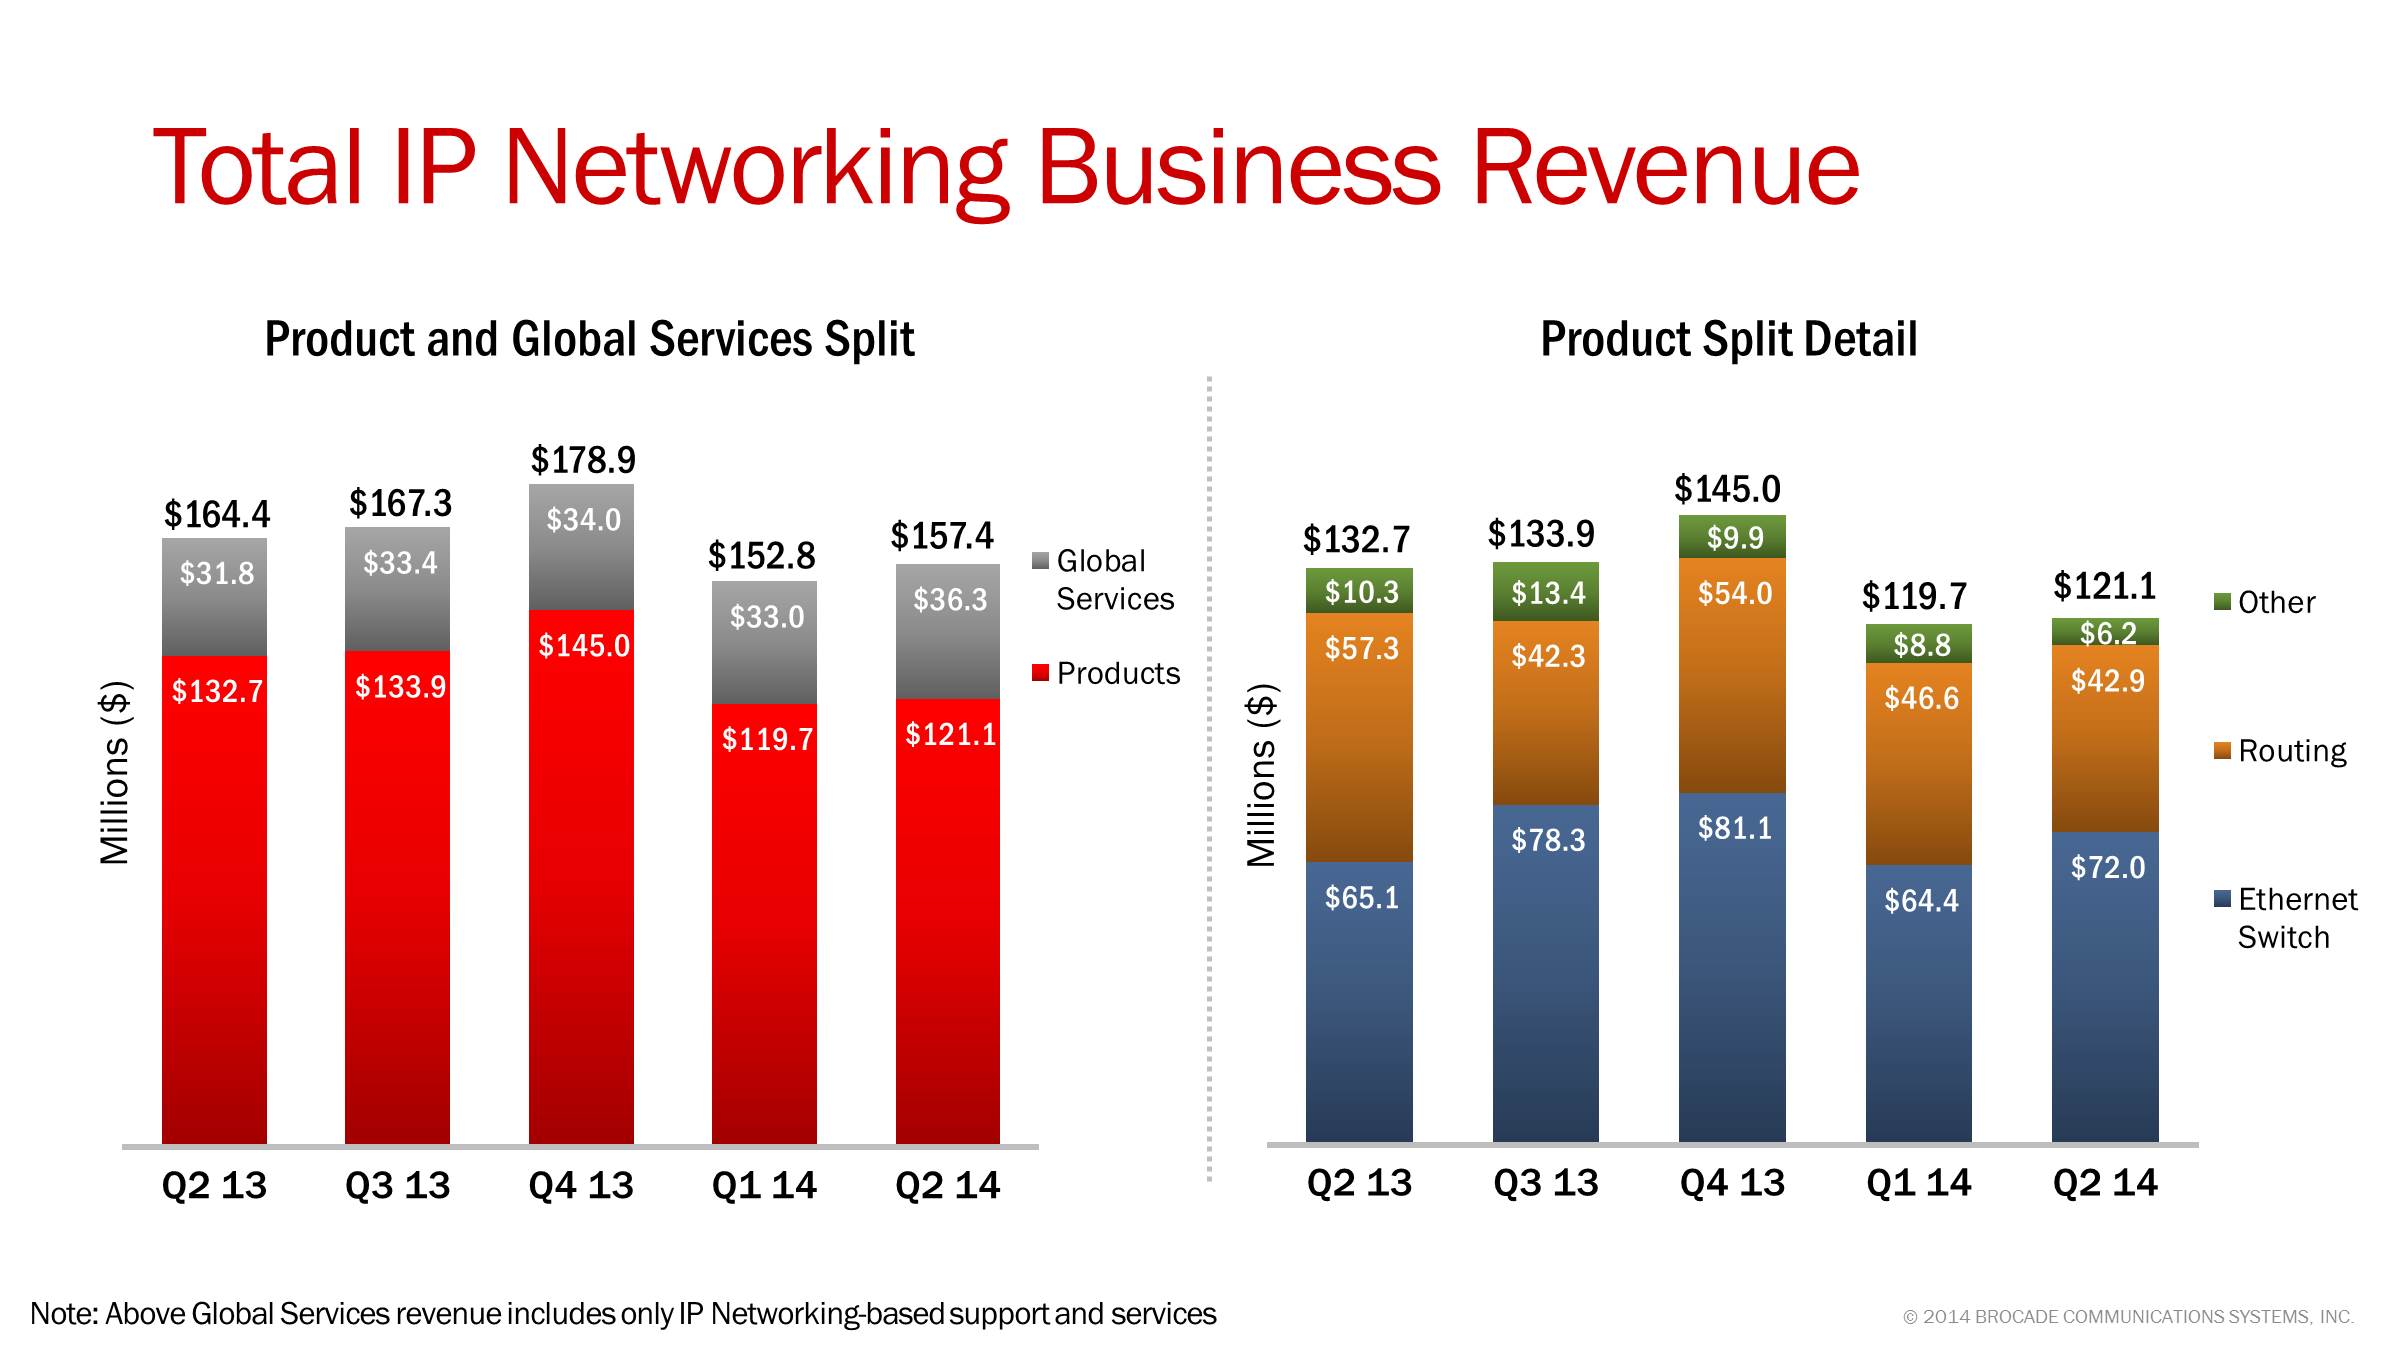
For our total IP Networking business, including hardware and IP-based support and services, Q2 14 revenue was $157M, down 4% Yr./Yr. and up 3% sequentially. The year-over-year decline was due to lower revenue from our U.S. Federal government customers, the impact of the divestiture of the network adapter business, and the shift in strategies in the Brocade ADX product line and wireless business. These reductions were partially offset by increased IP Networking based support revenue driven by an additional week of amortized support revenue from the 14-week quarter in Q2 14. The sequential increase in IP Networking business revenue was principally due to higher IP Networking based support revenue. Our Federal revenue was approximately $13M in the quarter, down 36% Yr./Yr. and essentially flat Qtr./Qtr.
Q2 14 IP Networking product revenue was $121M, down 9% Yr./Yr. and up 1% sequentially. The Q2 14 IP Networking product revenue was lower by $4M Yr./Yr. due to the impacts from the divestiture of the network adapter business and the changes in the wireless and Brocade ADX business strategies. The sequential increase was due to higher sales of Ethernet switching products.
As we look at the product splits for IP Networking in the quarter, our Ethernet switch revenue, which includes products for the data center and campus LAN environments, generated revenue of $72M, up 11% Yr./Yr. and 12% Qtr./Qtr. Our switch revenue includes Brocade VDX products, which were up 22% Yr./Yr. and down 4% Qtr./Qtr. Our routing products generated $43M in revenue, down 25% Yr./Yr. and 8% Qtr./Qtr.
Other IP Networking revenue of $6M was down 40% Yr./Yr. and 30% Qtr./Qtr. The year-over-year decrease was due to the divestiture of the network adapter business as well as lower Brocade ADX sales. The sequential decrease was due to the divestiture of the network adapter business. IP Networking-based support and services revenue was $36M in the quarter, up 14% Yr./Yr. and 10% sequentially.
Turning to the split of our IP Networking business based on customer use cases, we are pleased with the continued progress within our areas of strategic focus. Although it is difficult to identify all end users and their specific network deployments due to our two-tier distribution channel, we are providing estimates of the split of our IP Networking business. Our data center customers represented approximately 57% of IP Networking revenue in Q2 14, compared with 59% in Q1 14 and 50% in Q2 13. The estimated percentage of revenue coming from data center IP Networking customers may fluctuate quarter-to-quarter due to the timing of large data center transactions. Other use cases, such as enterprise campus and carrier networks (MAN/WAN) represent the balance of the business.
From a geographic viewpoint, the Americas region (excluding Federal) was up approximately 4% Yr./Yr., the EMEA region was down 3% Yr./Yr., the APAC region was down 3% Yr./Yr., and the Japan region was down 15%. On a sequential basis, the Americas (excluding Federal) region was up 6%, EMEA was down 6%, APAC was down 1%, and Japan was up 30%.
© 2014 Brocade Communications Systems, Inc. Page 15 of 27
Brocade Q2 FY 2014 Earnings 5/22/2014
In Q2 14, four of our customers (EMC, HDS, HP , and IBM) each contributed at least 10% of the total
company revenue. Our 10% customers collectively contributed 56% of revenue in Q2 14, down
1% from Q1 14 and up 11% from Q2 13. All other OEMs represented 12% of revenue in Q2 14, down 1% from Q1 14 and down 10% from Q2 13 when HDS was not a 10% customer. Channel and direct routes to market contributed 32% of revenue in Q2 14, up 2% from Q1 14 and down 2% from Q2 13.
The mix of business based on ship-to location was 59% domestic and 41% international in the
quarter, a higher domestic share compared with 57% in Q1 14 and 58% in Q2 13. Since some of our OEMs take delivery of our products domestically and then ship internationally to their end-users, the percentage of international revenue based on end-user location would be higher.
© 2014 Brocade Communications Systems, Inc. Page 16 of 27
Brocade Q2 FY 2014 Earnings 5/22/2014
Q2 14 non-GAAP company gross margin of 66.7% exceeded our original guidance range for the
quarter primarily due to a more favorable SAN share of the product mix than we estimated at the start of the quarter.
Q2 14 non-GAAP product gross margin was 68.3%, slightly above our FY14 target model range of 66.0% to 68.0%. This represents a decrease of approximately 110 basis points from Q1 14 and an increase of approximately 140 basis points from Q2 13. The quarter-over-quarter decline was primarily due to seasonally lower volume, a less favorable revenue mix shift to more IP Networking products, and higher overhead costs due to the additional week of spending from the 14-week quarter. The year-over-year increase was due to a favorable revenue mix shift to more SAN products, a favorable product and customer mix within the IP Networking business, and lower manufacturing and overhead costs.
Q2 14 non-GAAP SAN product gross margin percentage was in the mid-70's essentially flat quarter-over-quarter and year-over-year. Q2 14 non-GAAP IP Networking product gross margin percentage was in the mid-50‘s, slightly down quarter-over-quarter but up slightly year-over-year.
Non-GAAP Global Services gross margin was 59.2% in Q2 14, up 30 basis points quarter-over-quarter primarily due to higher revenue and offset slightly by increased spending. Non-GAAP Global Services gross margin was up approximately 320 basis points year-over-year based on higher revenue.
© 2014 Brocade Communications Systems, Inc. Page 17 of 27
Brocade Q2 FY 2014 Earnings 5/22/2014
Non-GAAP gross margin was 66.7% in Q2 14, which was higher than our FY14 target model of 65.0% to 66.0%. The increase in SAN share of the total product revenue mix was the principal reason we outperformed the non-GAAP gross margin target.
On a non-GAAP basis, total operating expenses were $234M, or 43.5% of revenues in Q2 14,
which is slightly higher than our FY14 target model range of 40.0% to 42.0%. The impact of the additional week of spending from the 14-week quarter was the primary reason we were above our FY14 target model range in Q2 14.
Ending headcount was 4,061 in Q2 14, down 16 from 4,077 in Q1 14, and down 587 from 4,648 in Q2 13.
Non-GAAP operating margin was 23.2% in Q2 14, an increase of 420 basis points compared with Q2 13 and 470 basis points lower compared with Q1 14. The increase from Q2 13 was primarily due to decreased overall spending as well as a favorable shift to more SAN share of the total revenue mix. The decrease from Q1 14 was due to lower gross margin from an unfavorable revenue mix shift to more IP Networking and Global Services revenue as well as the impact of the additional week of spending from the 14-week quarter.
© 2014 Brocade Communications Systems, Inc. Page 18 of 27
Brocade Q2 FY 2014 Earnings 5/22/2014
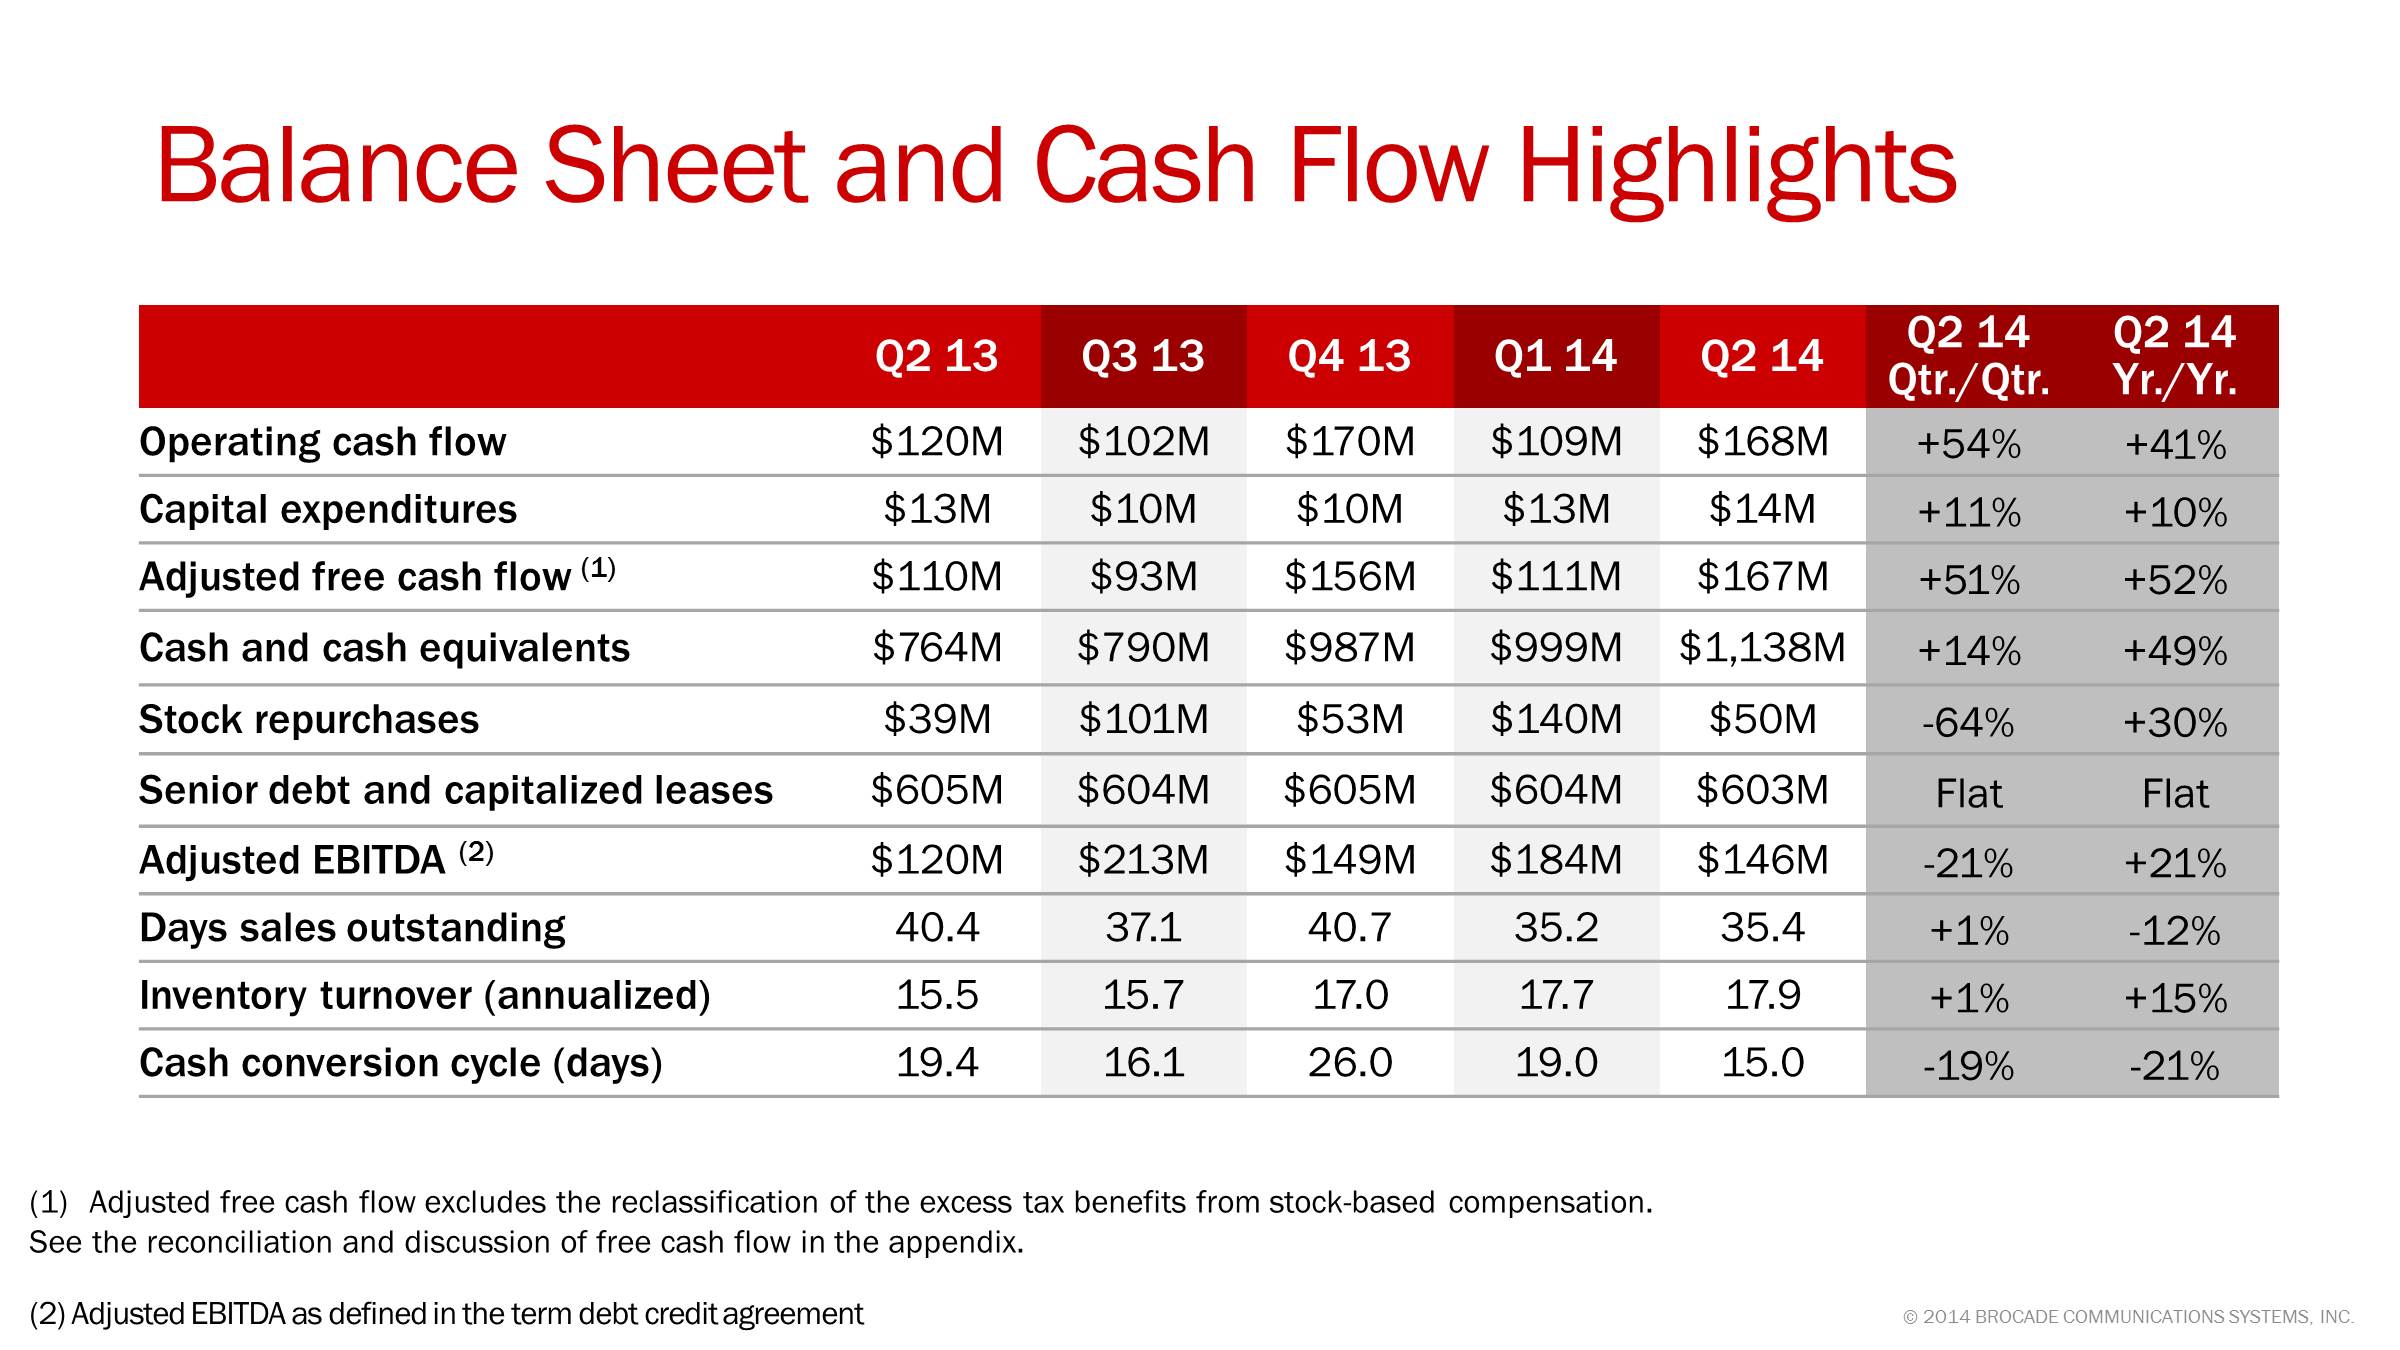
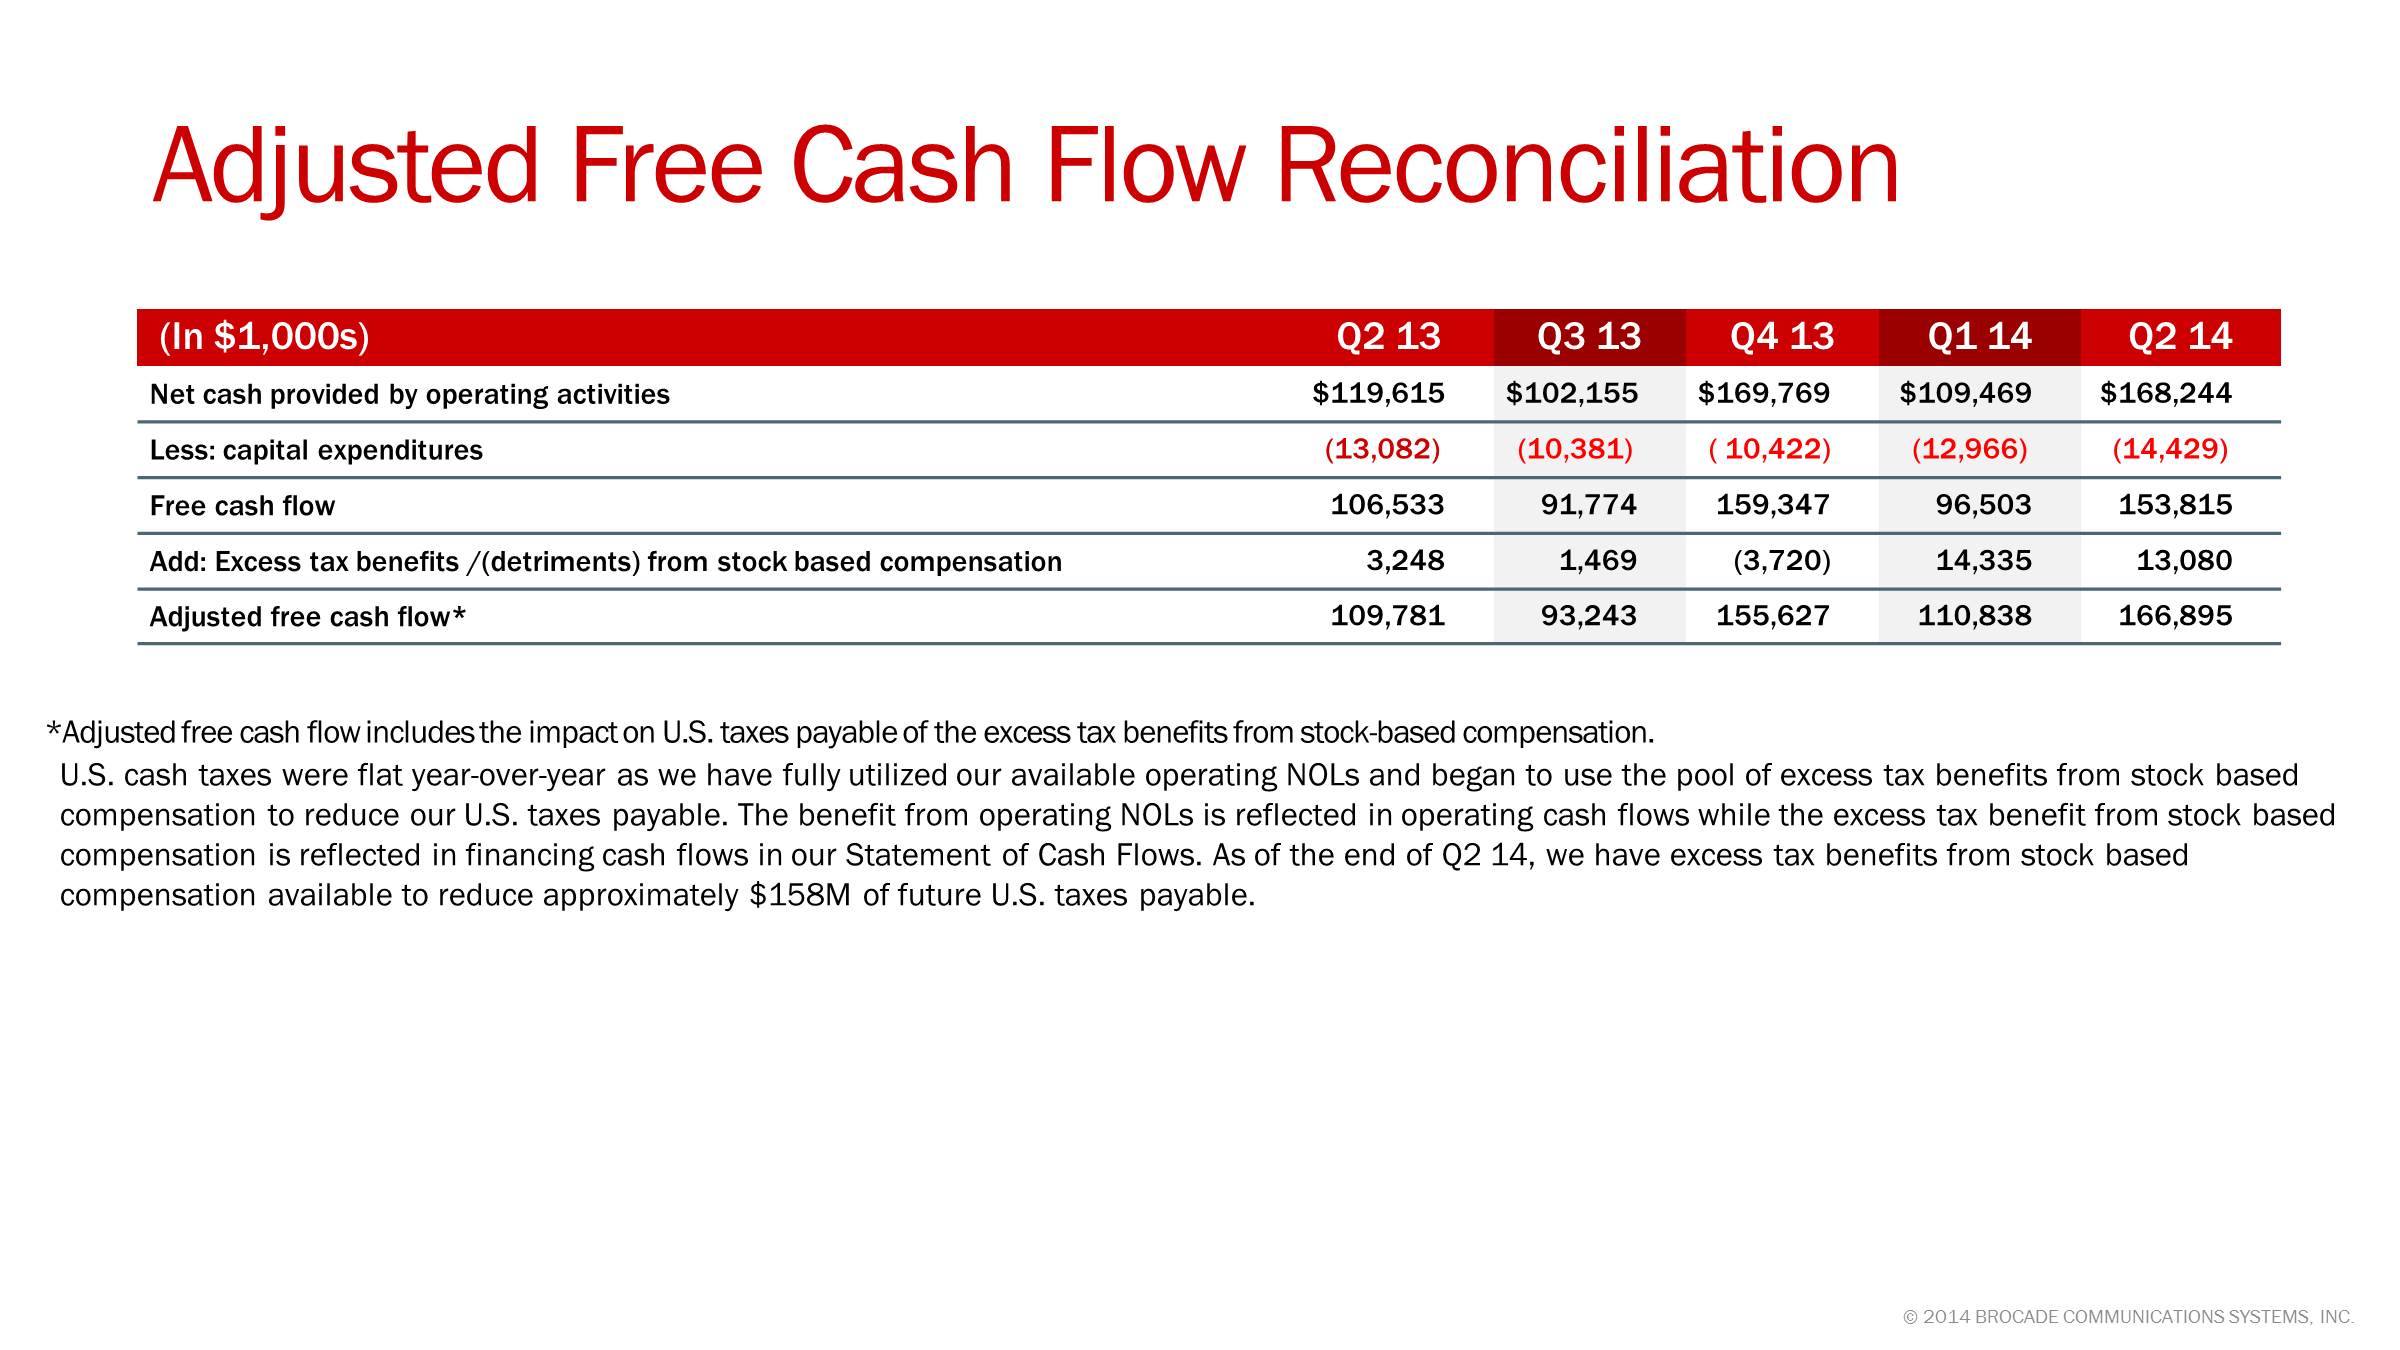
Operating cash flow was $168M in Q2 14, up 41% Yr./Yr. and 54% sequentially. The increase in cash flow from the prior year was primarily due to lower DSOs as well as increased non-GAAP net income. We typically see a sequential increase in cash from operations in our fiscal second quarter as Q1 includes the payment of employee incentives earned in the prior year as well as the semi-annual payment of the interest on our outstanding notes. We saw strong shipment linearity in Q2 14, which resulted in DSOs of 35.4 days, a slight increase from 35.2 days in Q1 14 and an improvement from 40.4 days in Q2 13.
The excess tax benefit from stock-based compensation resulted in a decrease of operating cash flow and an offsetting increase in cash flows from financing activities for Q2 14 of $13M as compared with a decrease of $14M in Q1 14 and a decrease of $3M in Q2 13. We describe the free cash flow impact of the excess tax benefit from stock-based compensation in the appendix.
Total capital expenditures in the quarter were $14M. Cash and cash equivalents were $1,138M in Q2 14, up $139M from Q1 14 and up $373M from Q2 13. The U.S. cash balance was $440M at the end of Q2 14.
We repurchased $50M of common stock at an average purchase price of $9.53 during Q2 14. Year to date, we have repurchased $190M of common stock as of the end of Q2 14. This represents a return of approximately 69% to our shareholders of adjusted free cash flow over the first six months of FY14. Subsequent to the end of our Q2 14, we have repurchased an additional $51M of common stock as of May 21, 2014.
© 2014 Brocade Communications Systems, Inc. Page 19 of 27
Brocade Q2 FY 2014 Earnings 5/22/2014
Looking forward to Q3 14, we considered a number of factors, including the following, in setting our outlook:
| |
| • | As we modeled our business in Q3 14, we took into account the impact of the divestiture of the network adapter business and the shift in strategies in the Brocade ADX product line and wireless business. The estimated total revenue impact of these actions is $15M compared with the historical quarterly run rate. |
| |
| • | For Q3 14, we expect SAN revenue to be down 2% to 5% Qtr./Qtr. due to the seasonal buying patterns of our OEMs. In addition, we considered potential disruption from ongoing business transitions within certain of our OEM partners. When adjusted for the sale of the network adapter business, we expect our SAN product revenue to be down 2% to up 1% Yr./Yr. |
| |
| • | We expect our Q3 14 IP Networking revenue to be up 9% to 16% Qtr./Qtr., principally driven by a seasonally stronger quarter for our U.S. Federal customers and growth in our enterprise customers. When adjusted for the sale of the network adapter business, we expect our IP Networking product revenue to be up 2% to 8% Yr./Yr. |
| |
| • | We expect our Global Services revenue to be down 6% to 7% Qtr./Qtr. due to the impact of one less week of revenue as compared with the 14-week quarter that occurred in Q2 14. |
| |
| • | We expect non-GAAP operating expenses to be down 2% to 3% Qtr./Qtr. which is reflective of the impact of one less week of expense as compared with the 14-week quarter that occurred in Q2 14 and the impact of summer holidays. |
| |
| • | At the end of Q2 14, OEM inventory was approximately 1.2 weeks of supply based on SAN business revenue. While we expect inventory to be between one to two weeks in Q3 14, OEM inventory levels may fluctuate due to both seasonality and large end-user order patterns at the OEMs. |
| |
| • | We have assumed a structural non-GAAP tax rate of 25% to 27% for Q3 14. |
| |
| • | We expect Q3 14 operating cash flow to be lower sequentially due higher working capital, and the timing of variable compensation and bond interest payments. We estimate that DSOs will be within our target range of 40 to 45 days. |
| |
| • | We expect Q3 14 non-GAAP gross margin to be 65.5% to 66.5%, within or slightly better than our two-year target model range, and non-GAAP operating margin to be at 22.5% to 24.5%, within or slightly lower than our two-year target model range. |
| |
| • | We continue to plan our business in accordance with the operating and cash flow model we presented at our September 25, 2013 Analyst Day. |
© 2014 Brocade Communications Systems, Inc. Page 20 of 27
Brocade Q2 FY 2014 Earnings 5/22/2014
Prepared comments provided by Ben Jones, Investor Relations
That concludes Brocade’s prepared comments. At 2:30 p.m. Pacific Time on May 22, Brocade will host a webcast conference call at www.brcd.com.
Thank you for your interest in Brocade.
© 2014 Brocade Communications Systems, Inc. Page 21 of 27
Brocade Q2 FY 2014 Earnings 5/22/2014
© 2014 Brocade Communications Systems, Inc. Page 22 of 27
Brocade Q2 FY 2014 Earnings 5/22/2014
Additional Financial Information:
|
| | | | | | |
| | Q2 13 |
| Q1 14 |
| Q2 14 |
|
| GAAP gross margin | 62.0 | % | 66.0 | % | 66.0 | % |
| Non-GAAP gross margin | 65.1 | % | 67.7 | % | 66.7 | % |
| | | | |
| GAAP product gross margin | 63.6 | % | 67.7 | % | 67.8 | % |
| Non-GAAP product gross margin | 66.9 | % | 69.4 | % | 68.3 | % |
| | | | |
| GAAP services gross margin | 54.0 | % | 57.2 | % | 57.4 | % |
| Non-GAAP services gross margin | 56.0 | % | 58.9 | % | 59.2 | % |
| | | | |
| GAAP operating margin | 10.6 | % | 21.5 | % | 3.8 | % |
| Non-GAAP operating margin | 19.0 | % | 27.9 | % | 23.2 | % |
© 2014 Brocade Communications Systems, Inc. Page 23 of 27
Brocade Q2 FY 2014 Earnings 5/22/2014
© 2014 Brocade Communications Systems, Inc. Page 24 of 27
Brocade Q2 FY 2014 Earnings 5/22/2014
© 2014 Brocade Communications Systems, Inc. Page 25 of 27
Brocade Q2 FY 2014 Earnings 5/22/2014
© 2014 Brocade Communications Systems, Inc. Page 26 of 27
Brocade Q2 FY 2014 Earnings 5/22/2014
© 2014 Brocade Communications Systems, Inc. Page 27 of 27