Q4 FY 2010 EARNINGS November 22, 2010 Exhibit 99.2 Page 1 of 51 © 2010 Brocade Communications Systems, Inc. |
Prepared comments provided by Rob Eggers, Investor Relations Thank you for your interest in Brocade’s Q4 Fiscal 2010 earnings presentation, which includes prepared remarks, slides, and a press release detailing fiscal fourth quarter 2010 financial results. The press release was issued shortly after 1:00 p.m. Pacific time on November 22, 2010, via Business Wire and First Call. The press release, along with these prepared comments and slides, has been made available on Brocade’s Investor Relations website at www.brcd.com and has been furnished to the SEC on Form 8-K. |
Cautionary Statements and Disclosures This presentation includes forward-looking statements regarding Brocade’s financial results, plans and business outlook as well as worldwide and Federal government spending, which are only predictions and involve risks and uncertainties such that actual results may vary significantly. These and other risks are set forth in more detail in our Form 10-Q for the fiscal quarter ended July 31, 2010 and our Form 10-K for the fiscal year ended October 31, 2009. These forward-looking statements reflect beliefs, assumptions, outlook, estimates and predictions as of today, and Brocade expressly assumes no obligation to update any such forward-looking statements. In addition, this presentation includes various third party estimates regarding the total available market and other measures, which do not necessarily reflect the view of Brocade. Further, Brocade does not guarantee the accuracy or reliability of any such information or forecast. Certain financial information is presented on a non-GAAP basis. The most directly comparable GAAP information and a reconciliation between the non-GAAP and GAAP figures are provided in the accompanying press release, which has been furnished to the SEC on Form 8-K and posted on Brocade’s website, and is included in the appendix to this presentation. Please see risk factors on Forms 10-K and 10-Q filed with the SEC Page 2 of 51 © 2010 Brocade Communications Systems, Inc. |
Agenda Prepared comments followed by live Q&A call Richard Deranleau CFO Mike Klayko CEO Page 3 of 51 © 2010 Brocade Communications Systems, Inc. |
Today’s prepared comments include remarks by Mike Klayko, Brocade’s CEO, regarding the company’s quarterly results, its strategy and a review of operations, as well as industry trends and market/technology drivers related to its business; and by Richard Deranleau, Brocade’s CFO, who will provide a financial review. A live question-and-answer conference call will be webcast beginning at 2:30 p.m. Pacific time on November 22 at www.brcd.com and will be archived on Brocade’s Investor Relations website for approximately 12 months. Participants are invited to submit questions via email at ir@brocade.com up to 60 minutes prior to the conference call and to ask live questions during the call. |
Fiscal 2010: Q4 Earnings Mike Klayko, CEO * * * * * * * * * Page 4 of 51 © 2010 Brocade Communications Systems, Inc. |
Prepared comments provided by Mike Klayko, CEO |
Q4 Executive Summary Q4 Results • $550.4M record revenues, up 9% Qtr./Qtr. • $0.14 non-GAAP EPS* (diluted) Business Highlights • Record Ethernet business revenue (including support) of $171M up 14% Qtr./Qtr. • SAN product revenue grew 8% Qtr./Qtr. driven by Director/Server • Americas and APAC were up 11% and 9% Qtr./Qtr. respectively Page 5 of 51 © 2010 Brocade Communications Systems, Inc. |
Brocade reported Q4 revenues of $550.4M, an all-time record in our 15-year history, up more than 9% quarter-over- quarter (Qtr./Qtr.) and more than 5% year-over-year (Yr./Yr.). We also reported non-GAAP EPS (diluted) of $0.14 and GAAP EPS (diluted) of $0.05 for the quarter. The highlight of the quarter was record revenue performance in our Ethernet business, which includes products and services. It was an all-time company high with 14% growth Qtr./Qtr. and 13% growth Yr./Yr. I’ll cover the Ethernet business in greater detail in the next section but we believe this quarter’s results is a positive sign for this focus and investment area of our business. We also saw revenue growth in our SAN products in Q4 with 8% growth Qtr./Qtr. and 4% growth Yr./Yr. in what is a seasonally strong quarter for that business. This growth was led by our performance in the SAN director business, which is another indication that Fibre Channel is as healthy as ever. We believe this segment of our business will continue to perform well, driven by the requirements of key IT initiatives such as server virtualization, data center consolidation and the migration to higher-performance technologies. These initiatives also positively impacted our server connectivity business, particularly the HBA business, which was up more than 150% in Q4 Yr./Yr. and up more than 200% in FY 10 versus FY 09. Looking at Q4 in terms of revenue performance by geography and vertical markets, we saw several areas of strength including Americas with 11% growth Qtr./Qtr. and 9% growth Yr./Yr. The Americas business was bolstered by strength in both the Enterprise and Service Provider business segments as well as growth in the Federal business, which was up 7% Qtr./Qtr. Additionally, Asia Pacific continued its momentum with 9% sequential growth and 22% growth Yr./Yr. Both EMEA and Japan were both up slightly sequentially but were down Yr./Yr. In general, I am very pleased with our Q4 performance, which provided a strong finish to our fiscal year. The Q4 results exemplify the value of maintaining a well-balanced, highly diversified business model across geographies, technology segments and go-to-market routes as strength in multiple areas of the business enabled us to achieve record performance. |
Ethernet Initiatives Update • Added 1600 net new accounts since Foundry acquisition • Added ~300 new accounts in Q4 • Highest revenue contribution since Foundry acquisition • Grew our key vertical segments • Captured Service Provider design wins • Realized strong Channel/Direct ROI with increased deals Strong performance drives growth Cumulative New Ethernet Accounts Page 6 of 51 © 2010 Brocade Communications Systems, Inc. |
Continuing on a theme we started earlier in FY 10, I will now provide an update on the key initiatives that we have implemented to help drive both immediate and long-term growth in our Ethernet business. First, the growth of our number of net new Ethernet accounts continues to track nicely. In Q4 we added almost 300 net new accounts, giving us a total of nearly 1600 new Ethernet customers as we end FY 10. The 1100 new accounts added in FY 10 exceeded our internal target of adding 1000 net new Ethernet accounts for the year. We believe there are other positive signs that our Ethernet business initiatives are starting to generate significant returns on our investment. For example, Q4 was another record quarter in terms of revenue contribution from net new accounts, building on the momentum from the previous quarter. We also saw great results for our Ethernet products among our key vertical segments with Healthcare and Federal showing strong sequential growth. We also had several Service Provider customer designs wins, which we believe should help augment that part of our business in the future. Finally, we believe it’s significant that we are securing an increasing number of these deals through both our direct, high- touch sales efforts and through our channel partners. It is another sign that our focus and investment in these routes-to- market are paying off now and we are optimistic that it will generate even more lucrative returns in the future. |
Q4 Partnership Highlights Creating excitement around Ethernet fabrics Page 7 of 51 © 2010 Brocade Communications Systems, Inc. |
We also ended FY 10 on a high note in terms of partnership momentum with a very busy Q4. I begin with a focus on our strategic partnerships with leading virtualization hypervisor partners. Virtualization is no longer a buzzword in IT; it is now a customer imperative. For Brocade, we believe virtualization also presents a huge market opportunity for our existing and emerging networking solutions. It is also the reason we have included the enhancement of our partnerships with these virtualization companies as one of our company’s key initiatives for FY 11. The vision and technologies of these companies and Brocade are aligned to address this rapidly expanding part of the market. I’ll cover this further in an upcoming section. |
Q4 Partnership Momentum Converged Networking Converged Networking Server Connectivity Server Connectivity Channel Partner Programs Channel Partner Programs 350 Elite 350 Elite and Premier and Premier Partners Partners New New New New Page 8 of 51 © 2010 Brocade Communications Systems, Inc. |
Next, some OEM highlights in Q4, which include an uptick in activity around our server connectivity business for both converged network and host bus adapters. This reinforces the importance of server virtualization in today’s data center network solutions available through our OEM partners. Specifically, in Q4 we announced: • IBM and Brocade are partnering to build the first fully converged embedded 10 GbE switch module and CNA designed specifically for IBM BladeCenter server environments. This is an important design win for Brocade that provides IBM BladeCenter customers with multiprotocol support that consolidates their IP and Fibre Channel I/O needs into a single switch; • Dell is offering the Brocade 815/825 Fibre Channel HBAs and Brocade 1020 CNAs as factory-installed options in Dell’s existing portfolio of Brocade storage networking solutions. This enables Dell customers to deploy an end-to- end storage networking architecture featuring Brocade products through an easy-to-select purchase option. One side note about Dell, we saw good traction in the Ethernet business through Dell in Q4, representing more than 50% growth sequentially. In terms of Q4 channel momentum, Brocade was able to recruit an additional 24 Elite and Premier partners to our Alliance Partner Network (APN) giving us a total of almost 350 globally. To drive channel partner loyalty and to help them become more profitable, Brocade announced enhanced APN programs that place greater emphasis on driving expertise and skill sets within the channel. Brocade also unveiled a channel-focused Professional Services Program (PSP) as well as a Support Delivery Program (SDP), which are designed to attract storage and Ethernet channel resellers with more selective and profitable professional services, support, and warranty offerings. |
FY 2010 Innovation Highlights * * * * * * * * * Page 9 of 51 © 2010 Brocade Communications Systems, Inc. |
We recognize that innovation is a significant factor to a company’s differentiation to the market and a foundation for future growth. |
• • Unmatched simplicity Unmatched simplicity • • Non-stop networking Non-stop networking • • Investment protection Investment protection • • Application optimization Application optimization Brocade One Brocade One © 2010 Brocade Communications Systems, Inc. Page10 of 51 |
Earlier this year we introduced the Brocade One™ vision that clearly outlined how we would align our innovation strategies around four core value propositions, namely: unmatched simplicity, non-stop networking, investment protection and application optimization. In Q4, Brocade had an exceptional quarter in terms of innovation by taking key leadership positions with respect to product innovations across multiple technology segments. |
Brocade VCS ™ Technology and Ethernet Fabrics Simplify, automate, and scale virtualized and cloud data centers Core Servers with 10 Gbps Connections Servers with 10 Gbps Connections Classic Hierarchical Ethernet Architecture Ethernet Fabric Architecture Scalability Page 11 of 51 © 2010 Brocade Communications Systems, Inc. |
One of the most exciting and disruptive technologies that we introduced in FY 10 is virtual cluster switching (VCS) technology that we unveiled at our Technology Day in June. We believe that Brocade VCS™ Technology is a game- changer that forms the basis of “Ethernet fabrics” through cloud-optimized networking that will advance the adoption of fully virtualized, cloud-enabled data centers. If you are building a private or public cloud, then we believe our Ethernet fabric products based on flat, simplified, and highly intelligent networks will be at the foundation of your architecture. |
Brocade VDX ™ 6720 Switches First switch in the industry to deliver Ethernet fabrics 11/22/2010 © 2010 Brocade Communications Systems, Inc. Company Proprietary Information Sixth-Generation ASIC All Brocade VDX switches are built on a proven operating system and ASIC technology Sixth-Generation ASIC All Brocade VDX switches are built on a proven operating system and ASIC technology Brocade VCS Technology All Brocade VDX switches are capable of running Brocade VCS Technology to build Ethernet fabrics Brocade VCS Technology All Brocade VDX switches are capable of running Brocade VCS Technology to build Ethernet fabrics Brocade VDX 6720-24 Switch Brocade VDX 6720-60 Switch Page 12 of 51 © 2010 Brocade Communications Systems, Inc. |
Last week we introduced the Brocade VDX™ 6720 Data Center Switch, the first switching platform based on Brocade VCS Technology. Our approach to building these technologies is consistent with our core values in that it is based on an open architecture that is hypervisor agnostic, supporting all the major virtualization software available today including VMware, Microsoft, Citrix and Oracle. I will cover Brocade VCS Technology, Brocade VDX switches, and Ethernet fabrics in greater detail in the FY 11 innovation focus section. |
Brocade MLXe Core Routers Quenching the thirst for bandwidth in Service Provider and Data Center networks Brocade MLXe chassis with 100 GbE Brocade was the only vendor who could build a bridge towards 100 GbE while leveraging the existing infrastructure—this was a key factor in our decision-making process… The Brocade MLXe provides the platform and Brocade has given us a blueprint for the future. ” “ —Henk Steenman, CTO at AMS-IX Page 13 of 51 © 2010 Brocade Communications Systems, Inc. |
Another highlight in Q4 and FY 10 was our introduction of the Brocade MLXe Core Router and the two-port 100 Gigabit Ethernet module. Through these products, Brocade introduced the world’s most powerful 100 Gigabit Ethernet router that is designed to tackle the massive growth in both network traffic and digital data that our customers are dealing with today. The Brocade MLXe has already garnered public recognition as a highly innovative platform with LightReading.com naming it as a “Leading Lights” finalist. But more importantly, we received enthusiastic endorsements from existing and prospective customers, resulting in a number of wins. A case in point is AMS-IX, one of the world’s largest Internet Exchange Points (IXPs). AMS-IX manages almost a terabit of Internet traffic every second in support of approximately 365 of its member companies, which include leading Internet service providers, telecommunications providers, content providers, content delivery networks, hosting and application providers as well as mobile networks. AMS-IX’s network traffic growth rates have doubled every 18 months and that pace is expected to accelerate going forward. To address this, AMS-IX has deployed seven Brocade MLXe routers to complement its existing network infrastructure of Brocade MLX-8, MLX-16, and MLX-32 routers. AMS-IX has deployed the new 8×10 Gigabit Ethernet modules, which Brocade introduced in Q3, with plans to migrate to the 100 Gigabit Ethernet modules to achieve even greater scale and performance. We are pleased that AMS-IX publicly recognized Brocade as “the only vendor who could build a bridge towards higher densities of 100 GbE ports while leveraging the existing infrastructure.” The AMS-IX example demonstrates why the world’s top five IXPs run on Brocade networks. |
Brocade 16 Gbps Fibre Channel Portfolio Expected to be industry’s first end-to-end 16 Gbps product portfolio • Unmatched Simplicity: Integrated compression, encryption, and routing • Investment Protection: Upgrade existing SAN infrastructure • Non-Stop Networking: Field-proven “five nines” availability 8-slot and 4-slot Backbones 48-port 1U 16 Gbps Fabric Switch Mezzanine 16 Gbps HBAs Page 14 of 51 © 2010 Brocade Communications Systems, Inc. |
Another innovation highlight in Q4 was our public commitment for 16-gigabit Fibre Channel technology that was recently ratified by the ANSI T11 Technical Committee. Our commitment is not only important to our install base but is critical to the Fibre Channel industry overall, as we are the undisputed leader in terms of market share, innovation, and thought leadership. I want to reiterate what I’ve heard our customers say: Fibre Channel continues to be a key technology no and will continue to be a critical interconnect technology for the future. Fibre Channel is the de facto networking technology that connects servers and applications to storage systems and protects the most important digital data in the world today. Additionally, one customer survey after another indicates that Fibre Channel is the most popular storage networking technology in the all-important server virtualization environment. As a leading innovator, Brocade plans to be first-to-market with a full portfolio of 16-gigabit Fibre Channel products in the nex calendar year. By doing so, we believe that Brocade will continue its industry leadership through every Fibre Channel technology cycle, including the evolution from 1, 2, 4, 8, and now 16-gigabit technologies. We expect to begin shipping our complete 16-gigabit Fibre Channel solutions in calendar year 2011, while supporting an investment protection and migration path to allow Brocade customers to purchase current technology. |
Brocade World-Class Data Center Real-world innovation and technology Page 15 of 51 © 2010 Brocade Communications Systems, Inc. |
Finally, I believe innovation is not only defined through product and technology introductions but also through how technologies are applied in the real world. In this regard, Brocade demonstrated its innovation know-how this quarter by showcasing our world-class data center to hundreds of visitors that included customers, partners, press, industry/financial analysts as well as dozens of other invited guests and dignitaries such as US Commerce Secretary Gary Locke. In October, we also hosted the third annual Data Center Efficiency Summit, an industry-wide event that attracted more than 500 leading experts in data center facilities management and IT operations who share Brocade’s passion about improving data center efficiencies and performance. We are justifiably proud of our state-of-the-art and energy-efficient data center that is emblematic of our data center heritage and expertise. Our data center is a centerpiece of our LEED-certified facility and is the result of a consolidation project involving three legacy data centers that: • decreases the physical footprint requirement by 30 percent • reduces data center energy consumption by 37 percent • eliminates 4,450 tons of CO² emissions per year • enables Brocade to decommission approximately 133 kilowatts (kW) worth of equipment, translating to $200,000 in yearly savings and helping Brocade qualify for $2 million+ rebate from Pacific Gas & Electric, the largest in the history of its data center rebate program. Our data center is also a showcase for our and our partners’ end-to-end networking solutions. Our customers who have toured the facility have reacted very positively, as reducing energy and operational costs are key IT initiatives for them and the impetus for many data center modernization projects that are taking place now. In fact, many of you were able to tour our data center during our recent Analyst Day and have seen our innovation in action. |
FY 2010 Summary: Key Initiatives Ethernet Account/ Revenue Growth • Slow start in Q1 10 • Exceeded new account goal • Strong finish to the year Maintaining SAN Leadership • Technology leadership—16 Gbps commitment • Share gains in 2H 10 • Virtualization driving growth Enhancing Our Partnership Ecosystem • OEM partner stability • Channel partner growth ��� Open architectures for customer choice Innovation • 8 “Product of the Year” awards • Brocade One vision and strategy • First true Ethernet fabrics Employer of Choice • Fortune 100 “Best Companies to Work For” • “Best Place to Work for in the SF Bay Area” • ~600 net new hires in FY 10 Page 16 of 51 © 2010 Brocade Communications Systems, Inc. |
Before we look ahead to our priorities for Q1 and the rest of FY 11, I wanted to take a look back on our overall performance in FY 10 according to a number of key initiatives. Specifically, I will look at growing Ethernet accounts/revenue, maintaining SAN leadership, enhancing our partnership ecosystem, continuing innovation, and positioning Brocade as an employer of choice. Growing Ethernet Accounts/Revenue: While we admittedly had a slow start in Q1, we closed the year strong and we believe our outlook is bright in this area of the business. We believe we have a stronger foundation for growth in FY 11. Maintaining SAN Leadership: Our focus on the SAN business remains strong as is our commitment to work with our customers through the next technology transition: the migration to 16-gigabit Fibre Channel technology. I am pleased that we ended FY 10 as the industry thought leader and clear market share leader in this area of business. Enhancing Our Partnership Ecosystem: Partnerships are inherent to Brocade’s DNA. Enhancing our existing partnerships and forming new ones was a core focus area for us in FY 10, especially with key partners aligned in our advancement of cloud-optimized networks. Continuing Innovation: Innovation is key competitive differentiator for Brocade. FY 10 was a successful year for us with some significant product and technology introductions that were recognized and rewarded through 13 product awards including eight “Product of the Year” awards. We also introduced the Brocade One unifying vision and strategy that will set the framework and priorities for future innovations. Positioning Brocade as Employer of Choice: Brocade is a destination of choice for talented individuals from all over the world. In FY 10 our recruiting efforts were bolstered by the important milestone of Brocade being named as one of the Fortune 100 “Best Companies to Work For” as well as Brocade being named the “Best Place to Work in the San Francisco Bay Area” by the publishers of the San Francisco Business Times/Silicon Valley Business Journal. Specifically, we added nearly 600 new employees in FY 10 including 124 to our University Development Program, which has now expanded to our United Kingdom and India operations. |
Virtualization Virtualization Cloud Cloud Computing Computing Ethernet Ethernet Fabrics Fabrics FY 2011 Innovation Focus Page 17 of 51 © 2010 Brocade Communications Systems, Inc. |
The innovation theme is a useful way for me to frame the discussion of our FY 11 outlook. I do this because I believe that the networking industry, particularly in Ethernet, has just begun a new innovation cycle that will carry us through the next decade. This innovation boom follows a long period in the Ethernet market characterized by relatively limited and incremental advancements, mostly around density and performance. That dynamic has been altered completely. The drivers that necessitate this accelerated pace of innovation are virtualization and cloud computing, two very familiar concepts in the IT world today. The networking industry has responded to these IT imperatives by inventing a new technology category—Ethernet fabrics, which are purpose-built for highly virtualized and cloud-optimized data centers. I am confident that Brocade will be among the leaders, if not the leader, in this category by being first to offer the most innovative architectures, technologies, and solutions. Let me now cover the virtualization, cloud computing and Ethernet fabric opportunities in greater depth. |
FY 2011 Innovation Focus * Source: IDC Virtualization Virtualization • • A top IT imperative today A top IT imperative today • • 70% of IT workloads will 70% of IT workloads will run on VMs run on VMs by 2013* by 2013* • • Tremendous business Tremendous business opportunity opportunity Page 18 of 51 © 2010 Brocade Communications Systems, Inc. |
Server virtualization has been around for years but it has never captured the IT industry’s mindshare as it has recently. The reality is that server virtualization more than lives up to its hype. Practically every customer I’ve spoken with lately places virtualization among the very top initiatives for that organization. More importantly, these customers tell me that although virtualization has significantly saved server resources, it has actually created significant complexity at the networking level that needs to be addressed through new technologies and architectures. The complexity will only increase with time. I’ve seen recent market research from IDC that indicates that just about half of all IT workloads will run on virtual machines by the end of this year, with that number climbing to beyond 70% by the end of 2013. Brocade IT is actually outpacing the industry as we are already at 70% virtual workloads in our new data center. To accommodate for this, we have architected and deployed a flat, high-performance and highly scalable data center network that leverages products from our own portfolio. Our ability to do the same for our customers as they scale their virtual environments will present tremendous business opportunities for Brocade in FY 11 and beyond. |
FY 2011 Innovation Focus Cloud Cloud Computing Computing • • Networking fundamental Networking fundamental to building high-functioning to building high-functioning clouds clouds • • Support today’s and Support today’s and tomorrow’s applications tomorrow’s applications • • Brocade One Brocade One ™ ™ vision vision for cloud-optimized networks for cloud-optimized networks Page 19 of 51 © 2010 Brocade Communications Systems, Inc. |
Building virtual data centers is just the first step in a far more ambitious journey that places a premium on highly flexible and agile architectures, all to enable “as a service”, “on-demand” IT models. For lack of a better name, the IT industry call this concept “cloud computing”. Call it what you will, I believe that a proper network infrastructure is fundamental to building high-functioning clouds—public, private, hybrid, etc. This is what our Brocade One vision and strategy is about. Brocade recognizes that the journey to cloud IT models is inevitable but will take time, especially for enterprises. The four Brocade One value propositions map perfectly to this reality: • Unmatched simplicity: Reducing complexity and associated costs are key IT initiatives and principal motivators for moving to cloud architectures. • Non-stop networking: The networks that support cloud architectures have to be high-performance and highly reliable in order to meet the stringent service level agreements of today’s enterprises. • Investment protection: The return on investment for moving to cloud architectures will take too long if the only option is to “rip and replace” everything customers have already deployed. • Application optimization: Cloud architectures need to support current and emerging applications to be useful. In FY 11, you can expect to hear and see a lot of announcements and messaging from us about our “cloud optimized” technologies and products . |
FY 2011 Innovation Focus Ethernet Ethernet Fabrics Fabrics • • Game-changer for Game-changer for virtualization virtualization • • Start of a 10-year innovation Start of a 10-year innovation cycle cycle • • First-to-market with Brocade First-to-market with Brocade VDX VDX ™ ™ 6720 and Brocade 6720 and Brocade VCS VCS ™ ™ Technology Technology Page 20 of 51 © 2010 Brocade Communications Systems, Inc. |
Both virtualization and cloud computing have created tremendous complexity in the networking environment. You might even characterize the complexity as chaotic. However, there is a well-known saying, “out of chaos comes opportunity”. That is how I view our investment in building new technologies, solutions, and products toward the establishment of Ethernet fabrics. For us this has been more than a three-year process that has involved significant R&D resources. I believe that the market opportunity in Ethernet fabrics justifies this resource investment. If we execute properly, this market will sustain the growth of our company for many, many years. My confidence is largely based on the quality of our offering. That is, I flat out believe that the Brocade VDX 6720 powered by virtual cluster switching technology is best-in-class in the Ethernet fabric category. The reason for this is simple. Ethernet fabric is highly dependent on Brocade’s core technology expertise—the building of large, always-on, any- to-any, ultra-reliable and very high-performance networks inside data centers. Building these fabrics has made Brocade a great company for the last 15 years, trusted by thousands of companies around the world to network and protect their mission-critical applications and data. The same technological and business dynamics apply to the Ethernet fabric opportunity. It is little wonder then why we have received such enthusiastic responses from customers we have spoken with about the Brocade VDX 6720 and VCS technology. In fact, we have generated strong interest and have already taken orders from some of the largest financial, energy, service provider, and high performance computing companies. |
Brocade Business Fundamentals • Differentiate through innovation • Grow Ethernet business • Maintain SAN leadership • Generate more awareness • Continue to be top employer of choice • Grow top line profitably FY 2011 playbook for growth * * * * * * * * * * * * * * * * * * * * * * * * Page 21 of 51 © 2010 Brocade Communications Systems, Inc. |
In addition to tackling these emerging opportunities, Brocade will continue to improve on the fundamentals of our overall business according to the FY 11 Playbook we discussed at Analyst Day. These include: • Differentiating through innovation, a theme I have highlighted throughout these comments; • Growing our Ethernet business by increasing our foothold in new customer accounts. With the new products we have introduced in FY 10, we believe we have the opportunity to grow our share; • Maintaining SAN leadership through continued innovation and catering to our very large install base. We believe our commitment to 16-gigabit Fibre Channel technology should give our customers the confidence to know that Brocade’s focus and interest in this very important business is as strong as ever; • Generating more awareness through marketing, public relations and social media for Brocade as a complete networking solutions provider in all major customer segments and across all major networking technologies; • Continuing to be an employer of choice through aggressive recruiting efforts of top talent all around the world; • Growing top-line revenue profitably by accelerating the productivity and ramp of new sales resources as well as deploying new sales enablement programs. In general, I do recognize that there are challenges ahead of us both within and outside of our control. For the challenge areas within our control, I am extremely confident about our ability to execute and succeed. I for one am looking forward to what lies ahead. |
Q4 FY 2010 Financials Richard Deranleau, CFO ****** * * * * * * * * * * * * * * * * * *** * * * * * * * * * * ****** * * * * * * * * * * * * * * * * * *** * * * * * * * * * * ****** * * * * * * * * * * * * * * * * * *** * * * * * * * * * * ****** * * * * * * * * * * * * * * * * * *** * * * * * * * * * * Page 22 of 51 © 2010 Brocade Communications Systems, Inc. |
Prepared comments provided by Richard Deranleau, CFO |
Financial Highlights * Note: Non-GAAP, please see GAAP reconciliation in appendix Q4 10 execution drives improved performance Q4 10 FY 10 Revenues Overall revenue $550M +9% Qtr./Qtr. $2,094M +7% Yr./Yr. SAN revenue +8% Qtr./Qtr. +4% Yr./Yr. Ethernet revenue +17% Qtr./Qtr. +15% Yr./Yr. Profitability Non-GAAP EPS* (diluted) $0.14 +$.01 Qtr./Qtr. $0.59 +$.06 Yr./Yr. GAAP EPS (diluted) $0.05 unchanged Qtr./Qtr. $0.25 vs. loss of $0.20 in FY 09 Generating Cash/Reducing Debt Operating cash flow $106M $299M Non-mandatory debt payments $25M $125M Term loan down to $351M at end of Q4 10 Page 23 of 51 © 2010 Brocade Communications Systems, Inc. |
Brocade executed well in Q4, growing revenues 9.3% Qtr./Qtr. and 5.5% Yr./Yr. to an all-time record $550M. Ethernet revenues were also an all-time record in Q4, led by growth in the Americas and APAC regions. The growth in revenues resulted in improving gross margins and operating margins for the quarter on a sequential basis. Non-GAAP earnings per share on a diluted basis was $0.14 for Q4. We also generated $106M in operating cash flow that we used to pay down our term loan and to build our cash balance. For FY 10, we grew revenues 7.2% achieving record annual revenues of $2.094B, resulting in non-GAAP EPS of $0.59 and generating nearly $300M in cash from operations. I am also pleased with recent awards given to our team by the Association for Financial Professionals including the 2010 Pinnacle Grand Prize which recognizes excellence in treasury and finance. I’ll expand on all these points in my remarks today. |
Key Financial Metrics Q4 09 Q1 10 Q2 10 Q3 10 Q4 10 FY 09 FY 10 Revenue $522M $539M $501M $504M $550M $1,953M $2,094M Sequential growth 5.8% 3.4% (7.1)% .5% 9.3% Year-over-year growth 30.9% (2) 25.0% (2) (1.1)% 2.1% 5.5% 33.1% 7.2% Non-GAAP gross margin* (1) 65.6% 64.9% 62.7% 60.4% 62.3% 64.1% 62.6% Non-GAAP operating margin* 22.7% 26.0% 20.5% 17.3% 20.4% 21.8% 21.1% Non-GAAP EPS*—diluted $0.15 $0.19 $0.13 $0.13 $0.14 $0.53 $0.59 GAAP EPS—diluted** $0.07 $0.11 $0.05 $0.05 $0.05 ($0.20) $0.25 (1) Adjusted to reflect the reclassification of system engineer costs from cost of revenues to sales and marketing expenses (2) Acquisition of Foundry in December 2008 * Note: Non-GAAP, please see GAAP reconciliation in appendix ** Note: Adjusted due to adoption of update to ASC 470-20 relating to convertible debt instruments Record revenue in Q4 and FY 10 drive EPS growth Page 24 of 51 © 2010 Brocade Communications Systems, Inc. |
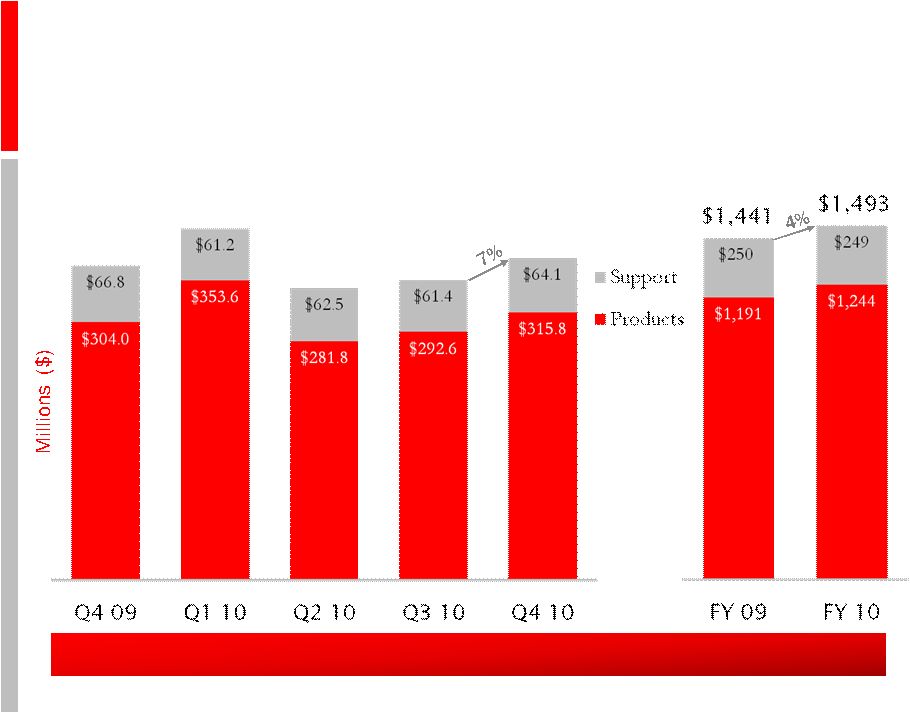
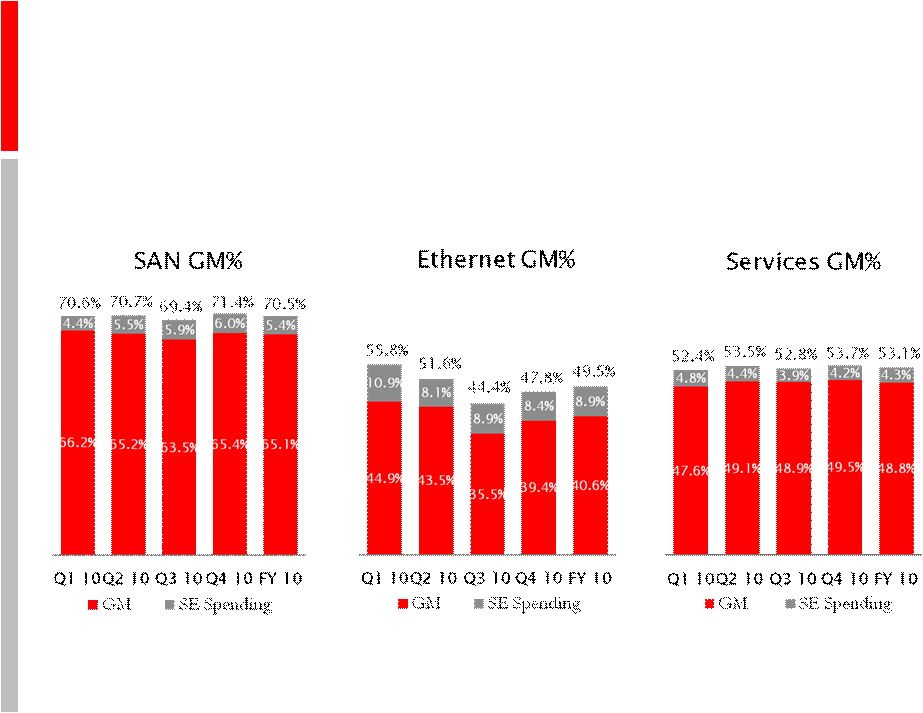
Turning first to revenues, Q4 revenues were $550.4M in a quarter where we experienced strong demand across all of our business segments. Revenues came in at the high end of the guidance we provided on our Q3 earnings call. SAN product revenues were up 7.9% sequentially driven by higher director and server sales, which were up 13.7% and 17.8% respectively. Ethernet product revenues were up 16.8% sequentially driven by growth in the Americas and APAC regions. As Mike mentioned, we continue to be pleased with the performance and growth in our new accounts, specifically in the Americas and APAC regions. Global Services revenues were up 3.6% sequentially driven by higher support and maintenance revenues. OEM inventory levels exiting the quarter were up slightly as OEMs prepared for the end of the calendar year. Based on forward looking demand, we estimate that our partners’ weeks-on-hand inventory is currently at just under 2.5 weeks exiting Q4. Non-GAAP gross margins of 62.3% were up 190 basis points sequentially. The increase in gross margins was principally driven by the increase in revenues and lower period costs in the quarter. Our reported gross margins in Q4 10 and for FY 10 now reflect the change in reporting of System Engineering (SE) spending as discussed at our Analyst Day on September 15. During Q4 10, we reviewed our cost classification, primarily related to our SE costs that were previously classified within cost of revenues. The SE’s primary role has over time migrated from assisting with customer support to primarily performing pre-sales activity to generate future business. As a result of this review, we have reclassified the SE costs within our Consolidated Statements of Operations starting in FY 10. These costs are now presented within sales and marketing expenses, as opposed to cost of revenues. This reclassification did not impact revenue, income from operations, net income, or earnings per share for FY 10. This should also help in peer comparison analysis of non-GAAP gross margin. We will provide a detailed gross margin bridge for Q4 10 and FY 10 by segment later in the presentation. Non-GAAP operating margins were 20.4%. The sequential improvement in operating margin was driven by higher gross margins and operating leverage as we achieved the high end of our revenue guidance for the quarter. Non-GAAP operating expenses grew slower than revenue in Q4 and were down slightly as a percentage of revenue to 41.9%. The increase in operating expense dollars in the quarter was primarily driven by our investments in Ethernet sales and marketing. We hired approximately 130 incremental employees during the quarter. The Q4 10 effective non-GAAP tax rate was 23.2% and effective GAAP tax rate was 20.4%. The FY 10 effective non-GAAP tax rate was 18.9% and effective GAAP tax benefit was negative 7.9%. Both full-year tax rates reflect the benefit that we received in Q3 as we completed various tax audits with the US Federal Government and the State of California, which resulted in a more favorable outcome than expected in our tax reserve position. Looking to the Balance Sheet, Brocade repaid $30.2M of our senior secured debt, of which $25.0M was in excess of the mandatory amount due, bringing our acquisition term debt down to approximately $350M. Total diluted shares were within our expected range for Q4 at 485.7M shares. We did not repurchase any stock during the quarter. |
Revenue: SAN, Ethernet, and Global Services Diversified business model will help enable long-term growth Page 25 of 51 © 2010 Brocade Communications Systems, Inc. |
Turning to revenues by business unit, we saw growth across all segments in Q4. Our SAN product revenue was $315.8M in the quarter, an improvement of 3.9% Yr./Yr. and up 7.9% sequentially. SAN represented 57% of revenues in Q4 versus 58% in Q3. Our Ethernet product revenue was $142.6M in the quarter, an improvement of 11.0% Yr./Yr. and up 16.8% sequentially. Ethernet product revenue represented 26% of total revenue versus 24% in Q3. Our Global Services revenue was $92.0M in the quarter, and represented 17% of revenues, down slightly versus 18% in Q3. Global Services revenue was up 3.0% Yr./Yr. and was up 3.6% sequentially. |
Total Ethernet Business Revenue Record revenue in Q4 10 Ethernet business $151.0 $124.6 $156.7 $149.5 $170.5 Page 26 of 51 © 2010 Brocade Communications Systems, Inc. |
Looking at our Ethernet business, including hardware and Ethernet based support and services, Q4 revenue of $170.5M grew 12.9% Yr./Yr. and was up 14.1% from Q3. Again, this was an all-time record quarter for our Ethernet business. The Ethernet business growth was driven by strong sequential performances in our Americas and APAC regions, with Japan remaining flat and EMEA down slightly. Both Americas and APAC regions saw Ethernet product revenue growth greater than 20% sequentially. We saw good growth in our new accounts with both initial sales in the quarter as well as new customers from previous quarters returning and buying again. Revenue from our net new Ethernet accounts, including repeat customers, exceeded $30M in the quarter. From an Ethernet product standpoint, we saw strong demand for our Brocade MLX/MLXe products with 22% sequential growth and for our FastIron CX products with 27% growth compared to Q3. We are pleased with the ramp of the Brocade MLXe and 8 x 10 GbE blades and our manufacturing capacity was sufficient to meet the demand for these new products in the quarter. Ethernet ASP sequential declines were in the low single-digits, better than the Q4 guidance. |
Total Ethernet Business Revenue By customer segment $151.0 $124.6 $156.7 $149.5 $170.5 Q4 10 and FY 10 saw good growth across all Ethernet segments Page 27 of 51 © 2010 Brocade Communications Systems, Inc. |
We were also very pleased with our Service Provider performance and Enterprise growth in Q4 and in FY 10. Customers that we have identified as service providers grew to now represent 25% of total Ethernet business and grew 32% sequentially and 32% in FY 10 compared to FY 09. Enterprise customers, excluding Federal, also saw double-digit sequential growth in Q4 as well as 17% growth in FY 10 versus FY 09. Federal Ethernet business was up 7% sequentially in a typically strong quarter. |
Total SAN Business Revenue Fibre Channel market remains healthy $370.8 $414.8 $344.3 $354.0 $379.9 Page 28 of 51 © 2010 Brocade Communications Systems, Inc. |
Looking at our SAN business, including hardware and SAN based support and services, Q4 revenue of $379.9M grew 2.5% Yr./Yr. and was up 7.3% from Q3. Our SAN product revenue was $315.8M in the quarter, an improvement of 3.9% Yr./Yr. and up 7.9% sequentially. Demand for our leading SAN products was strong in what is typically a seasonally strong quarter. Increases in revenue across our director and server product families drove the overall SAN increase Qtr./Qtr. Based on our internal analysis, we believe we gained share in Q4. Our Server product group, consisting of embedded switches, HBAs, CNAs, and mezzanine cards, posted revenue of $46.6M which was up 24% Yr./Yr. and up 18% from our Q3. Embedded switches were up 18% sequentially while our of CNAs, HBAs and mezzanine cards were up 154% Yr./Yr. CNAs represented more than 10% of our adapter products revenue. SAN ASP sequential declines were in the low single-digits, consistent with the prior quarter. |
Revenue: 10% Customers, Other OEM, Channel/Direct Increases in Channel/Direct reflect investments and focus Page 29 of 51 © 2010 Brocade Communications Systems, Inc. |
In Q4, consistent with the prior quarter, Brocade had three customers that had revenue greater than 10%. EMC, IBM and HP all contributed more than 10% of revenues individually. Collectively, our top 3 OEMs contributed 44% of revenues in Q4, no change versus Q3, and down from 46% in Q4 09. Other OEMs represented 17% of revenues in Q4 versus 20% in Q3. Channel and Direct were 39% of revenues in Q4, an increase from 36% in Q3 as we continue to build out our channel and direct sales teams. |
Company Non-GAAP Gross Margins* Brocade gross margins excluding SE spending (1) Adjusted to reflect the reclassification of system engineer costs from cost of revenues to sales and marketing expenses * Note: Non-GAAP, please see GAAP reconciliation in appendix Q4 10 shows initial steps in long-term gross margin expansion plan (1) Page 30 of 51 © 2010 Brocade Communications Systems, Inc. |
As we mentioned at our Analyst Day in September, we planned to make a change in reporting our SE costs in November. The adjustment to COGS in FY 10 is consistent with the sizing we provided at our Analyst Day. Non-GAAP gross margins in Q4 were 62.3%, which were up approximately 190 basis points Qtr./Qtr. and reflected improvements in gross margins across all of our business segments. FY 10 non-GAAP gross margins were 62.6%, consistent with our previous guidance, and were down 150 basis points compared to FY 09. The reduction in company gross margins in FY 10 is reflective of a mix of revenue towards lower margin Ethernet products of 40 basis points and increased discounting and period cost of 110 basis points. The SE adjustment does not impact revenue, operating margin or EPS for the current or any of the previously reported periods. |
Revenue and gross margins up sequentially across all segments Segment Revenues and Gross Margin Snapshot Q4 vs. Q3 revenue mix and non-GAAP gross margin* (1) Adjusted to reflect the reclassification of system engineer costs from cost of revenues to sales and marketing expenses * Note: Non-GAAP, please see GAAP reconciliation in appendix Q3 10 Q4 10 SE Spending Revenues by Segment ($M) Non-GAAP Gross Margin* by Segment 65.4% 39.4% 49.5% 8.9% 3.9% 5.9% 63.5% 35.5% 48.9% 4.2% (1) Page 31 of 51 © 2010 Brocade Communications Systems, Inc. |
Q4 SAN gross margins, were 71.4% up from 69.4% in Q3. The higher SAN gross margins were driven by a higher volumes and a higher mix of Director products in the quarter. The impact of higher SAN gross margins on overall company gross margins was approximately +115 basis points in Q4. This was partially offset by higher mix of Ethernet products at an overall company level which decreased margins by approximately 25 basis points. Q4 Ethernet non-GAAP gross margins were 47.8%, up from 44.4% in Q3. The higher Ethernet gross margins were primarily driven by higher volumes and lower inventory reserve charges in the quarter. The impact of higher Ethernet gross margins on overall company gross margins was approximately +90 basis points in Q4. Global Services non-GAAP gross margins were 53.7% in Q4, an improvement versus 52.8% in Q3. |
Ethernet Non-GAAP Gross Margin* Detail Qtr./Qtr. bridge * Note: Non-GAAP, please see GAAP reconciliation in appendix ** New product costs impact includes all product cost savings and mix impact Q3 10 Q4 10 Pricing Volumes Inventory Mgmt New Product Costs** +2.2% +1.3% +1.6% -1.7% Making progress towards Ethernet gross margin expansion plan Page 32 of 51 © 2010 Brocade Communications Systems, Inc. |
Ethernet product gross margins, on a non-GAAP basis, were 47.8% in Q4. Ethernet gross margins were higher sequentially driven primarily by lower inventory reserves taken in Q4 (2.2 pts) and higher volumes which improved the fixed cost absorption (1.6 pts). Impact to gross margins due to pricing was offset by cost takedowns in the quarter. We are pleased with improvement in the Ethernet non-GAAP gross margins in Q4 and feel that we have made some positive strides on our gross margin initiatives outlined during our Analyst Day. We would expect the volume benefit to be slightly lower in Q1 11 as the Federal business is seasonally down from Q4 to Q1, which offsets expected growth in our other Ethernet segments. |
Operating Expenses and Margins Non-GAAP Operating Margins* Non-GAAP Operating Expenses* (1) as a Percentage of Revenues 2 Yr target operating expense range: 43–44% Leveraged model delivered operating margins above Target Model in Q4 10 2 Yr target operating margin range: 17–20% (1) Adjusted to reflect the reclassification of system engineer costs from cost of revenues to sales and marketing expenses * Note: Non-GAAP, please see GAAP reconciliation in appendix © 2010 Brocade Communications Systems, Inc. Page 33 of 51 |
While increasing our investment in sales headcount, we continued to focus on controlling spending in non-sales functional areas. On a non-GAAP basis, total operating expenses were 41.9% of revenues in Q4 versus 43.1% in Q3. Operating expenses were better than our 2-year target model of 43% to 44% of revenues. The dollar increase in operating expense sequentially reflects the investment in our sales organization made in Q3 as well as Q4. We added approximately 130 headcount in Q4, of which the majority was in sales. Non-GAAP operating margins increased on a sequential basis to 20.4% in Q4 from Q3 operating margins of 17.3%, primarily due to our higher gross margins and operating leverage from the higher revenue. |
Balance Sheet and Cash Flow Highlights as of October 30, 2010 Cash flows enable de-leveraging and reinvestment * Note: Adjusted EBITDA is as defined in the term debt credit agreement ** Note: Giving effect to the McDATA convertible debt of $173M repaid on February 16, 2010 Q4 09 Q1 10 Q2 10 Q3 10 Q4 10 Cash from operations $155.3M $69.1M $67.7M $55.3M $106.4M Campus capital expenditures $28M $31M $42M $24M $22M Operating capital expenditures $17M $17M $20M $23M $24M Free cash flow $110M $22M $6M $9M $61M Cash, equivalents, and short term investments $339M $328M** $290M $296M $336M Debt payments $57.9M $506.5M $202.2M $30.6M $30.2M Senior secured debt $0.95B $1.04B $1.01B $0.99B $0.96B Adjusted EBITDA* $130.0M $154.7M $116.4M $101.5M $127.7M Stock repurchase $0 $0 $20M $5M $0 Senior secured leverage ratio 1.87x 1.99x 1.95x 1.97x 1.92x Covenant 2.3x 2.5x 2.5x 2.5x 2.5x Fixed charge coverage ratio 2.1x 2.0x 1.8x 1.7x 1.7x Covenant 1.25x 1.25x 1.25x 1.25x 1.25x Page 34 of 51 © 2010 Brocade Communications Systems, Inc. |
Cash from operations was $106M in Q4, which is typically a strong seasonal quarter for cash generation. Total capital expenditures in the quarter were $46M, composed of $22M for the campus, which was completed and occupied during Q3, and $24M for operations. Free cash flow was $61M in the quarter. With the exception of some small payments remaining in FY 11, the campus project is complete. As a result, we expect an incremental cash generation of approximately $125 million in FY 11 compared to FY 10 via capital expenditures and rent expense savings. For FY 10, we generated $299M in cash from operations. Some of the primary uses of the cash flow this year were payin off the $173M McData convertible bonds in February, paying down $148M of the term debt associated with the Foundry acquisition, and repurchasing $25M of stock. Adjusted EBITDA in the quarter was $127.7M, which was up from the Q3 level of $101.5M. The Sr. Secured Leverage Ratio of 1.92 x and the Fixed Charge Coverage Ratio of 1.68 x are both well within the covenant requirements of our term credit agreement. Brocade did not repurchase stock during the quarter. |
Net Debt: Defined as Total Debt Less Total Cash Net-debt decreased by $158M year-over-year Page 35 of 51 © 2010 Brocade Communications Systems, Inc. |
Cash and equivalents grew to $336M, up from $296M in Q3. In Q4, we reduced our debt principal by $30.2M including $25.0M in excess of the mandatory payment. Since acquiring Foundry last year, Brocade has steadily reduced Net Debt, defined as total debt less total cash, equivalents and short-term investments. Net Debt has declined from $1,073M at the end of Q1 09 to $624M at the end of Q4 10, a $449M reduction. Our term debt loan balance is now down to nearly $350M. |
Selected Metrics * Note: Return on Equity = Non-GAAP net income/total stockholders equity Please see Non-GAAP reconciliation in appendix Page 36 of 51 © 2010 Brocade Communications Systems, Inc. |
Return on Equity was 3.2%, flat with Q3. Days Sales Outstanding (DSO) was 54 days, unchanged from Q3. Inventories turned 14 times, which was an improvement from Q3 turns of 12. |
Q1 2011 Planning Assumptions IT market conditions • Macro economic challenges; GDP outlook has come down • Continued recovery in US but cautious regarding international IT spending (EMEA, Japan, and possibly China) • Federal spending and budget timing uncertainty • Expect to grow with market in SAN • Expect to grow at least with market in Ethernet ASP trends • Low single-digit declines in SAN pricing • Low to mid single-digit declines in Ethernet pricing Taxes • Rates return to blended worldwide statutory rate for FY 11 • Rate does not assume R&D tax credit, which could result in ~3% benefit if passed OEM inventories • Expect to come down slightly exiting Q1, consistent with seasonal trends Page 37 of 51 © 2010 Brocade Communications Systems, Inc. |
Now, as we look forward to Q1 11, here are some things to consider in developing your financial models: • We continue to look at GDP and IT spending forecasts for next quarter and next year. Our current GDP growth assumptions have not changed since Analyst Day. The World Bank assumes that the global GDP growth will be 3.3% in 2011, but called out risk specifically in international economies. • We continue to monitor the health of international markets, specifically Europe, Japan, and China. • We are cognizant of the change in leadership in the US Congress and the potential impacts on the timing and size of the appropriation bills for this year. We believe that this uncertainty will create gridlock and have a negative affect on our Federal business for our Q1 11, consistent with the negative impact we experienced in Q1 10 when the Federal budget was delayed. • We anticipate that the new Brocade VDX and VCS products will have a minimal impact to revenue/gross margin in Q1 as they were launched on November 15. • We expect quarterly ASP declines in our SAN business to remain in the low single-digits. ASP declines in our Ethernet business are expected to be in the low to mid single-digits. • From a tax rate perspective, we do not forecast discrete events due to the inherent uncertainty of their timing. Our current tax rate outlook does not include the Federal R&D tax credit that is pending Congressional approval. • Regarding OEM inventory, we would expect OEM inventory levels to decline slightly in absolute dollar terms exiting Q1 11, given that we would be heading into our seasonally weak Q2. |
Q1 2011 Financial Outlook: Revenue As of November 22, 2010 Continued growth in non-Federal business; Federal budget uncertainty Q4 10 Q1 11 Qtr./Qtr. Growth Revenue $550M $535M–$550M -3% to Flat Revenue (excluding Federal Ethernet) $511M $520M–$530M 2% to 4% Federal Ethernet $39M $15M–$20M -62% to -50% Page 38 of 51 © 2010 Brocade Communications Systems, Inc. |
After the recent US elections and the current uncertainty in Congress with the FY 11 Federal appropriations bill, we are assuming that our Federal Ethernet business will decline sequentially in Q1 11 at a similar rate that we saw in Q1 10 (down 62%) when the FY 10 appropriation bill signing was delayed. This would result in a sequential decline of approximately $20M to $25M in revenue for our Federal business, and offset expected sequential growth in our non- Federal Ethernet business. Regarding OEM SAN inventories, we would normally expect to see OEMs reduce their inventories as they approach the Q2/Q3 seasonally slow period of the year. As you may recall, due to overall industry concerns about supply chain constraints in the January 2010 time frame, we saw our OEM postpone their seasonal adjustment of SAN inventory until our fiscal Q2 10. This year as there are no supply chain capacity concerns, we would expect our OEMs to seasonally adjust their SAN inventories at the end our fiscal Q1, which will reduce our sequential growth rates below our historical seasonality of 6% to 8%. Based on these assumptions we anticipate our total company revenue in Q1 11 to be in the range of $535M to $550M, roughly flat to down 3% Qtr./Qtr. Excluding the impact of the Federal business, our revenue outlook in Q1 11 would be up 2% to 4% Qtr./Qtr. and would be similar to the historical seasonality of up 6% to 8% from a sell through perspective. |
Q1 2011 Financial Outlook: Other As of November 22, 2010 * Note: Non-GAAP estimates assume exclusion of the same category of items excluded from Q4 10 non-GAAP results Q1 11 Non-GAAP gross margin* 61.5%–62.0% Non-GAAP operating expenses* 46%–47% Non-GAAP operating margin* 15%–16% Other income/other expense ($20M–$21M) Non-GAAP tax rate* 27%–28% Fully diluted shares outstanding 490M–493M Non-GAAP EPS* $0.09–$0.10 Operating cash flow $60M–$70M Capital expenditures $32M–$34M Free cash flow $28M–$36M Investing to drive top line growth Page 39 of 51 © 2010 Brocade Communications Systems, Inc. |
Given these planning assumptions, in Q1 11 we expect: • Non-GAAP gross margins to be 61.5% to 62.0% • Non-GAAP operating expenses to be 46% to 47% • Non-GAAP operating margins to be 15% to 16% • Other income/expense net to be ($20M) to ($21M) • Non-GAAP tax rate to be 27% to 28% • Diluted shares outstanding to be in a range of 490M to 493M shares • Non-GAAP EPS to be in a range from 9 cents to 10 cents • Operating cash flow of $60M to $70M • Capital expenditures of $32M to $34M • Free cash flow of $28M to $36M |
Financial Summary Richard Deranleau, CFO * * * * * * * * * Page 40 of 51 © 2010 Brocade Communications Systems, Inc. |
To summarize from a financial perspective, we are pleased with a very strong Q4 performance and improving profitability as we exit FY 10. The expansion in Ethernet revenues is the result of our refocused Ethernet go-to-market strategy. We continue to strengthen our balance sheet by reducing our debt at a faster rate than outlined by our credit agreement. Our goals for FY 11 are: • Drive top line company revenue profitably • Gain market share in Ethernet • Improve Ethernet gross margins • Maintain SAN leadership • Operate within financial model We are looking forward to answering your questions in the Q&A session of our conference call. |
Jason Nolet VP Data Center and Enterprise Networking Live Q&A Call November 22, 2010, 2:30PM Pacific Time Richard Deranleau CFO John McHugh CMO Ian Whiting SVP WW Sales Mike Klayko CEO Page 41 of 51 © 2010 Brocade Communications Systems, Inc. |
Prepared comments provided by Rob Eggers, Investor Relations That concludes Brocade’s prepared comments. At 2:30 p.m. Pacific Time on November 22 Brocade will host a webcast conference call at www.brcd.com primarily devoted to answering questions submitted via email to ir@brocade.com and taken live from participants via telephone. Thank you for your interest in Brocade. |
Appendix and Reconciliations * * * * * * * * * Page 42 of 51 © 2010 Brocade Communications Systems, Inc. |
Non-GAAP Gross Margin* Bridge Breakout by Business Unit by Quarter Adjustment for SEs in 2010 (1) (1) Adjusted to reflect the reclassification of system engineer costs from cost of revenues to sales and marketing expenses * Note: Non-GAAP, please see GAAP reconciliation in appendix Page 43 of 51 © 2010 Brocade Communications Systems, Inc. |
Quarterly Net Income GAAP/Non-GAAP Reconciliation * Adjusted as a result of adoption of update to ASC 470-20 relating to accounting for convertible debt instruments (In Thousands) Q4 09 Q1 10 Q2 10 Q3 10 Q4 10 Net income on a GAAP basis* 32,101 51,095 22,380 21,961 23,416 Adjustments: Legal fees associated with indemnification obligations and other related expenses, net (14,612) 301 277 (74) (666) Stock-based compensation expense 35,715 21,523 30,146 24,682 25,275 Amortization of intangible assets 34,950 34,902 30,657 30,657 30,657 Acquisition and integration costs 333 204 – – – Loss on sale of property – 8,783 (47) – – Restructuring costs and facilities lease loss – – – – 1,059 Legal fees associated with certain pre-acquisition litigation 546 299 17 13 243 Provision for certain pre-acquisition litigation 14,335 – – 1,604 – Interest due to adoption of new standard* 2,085 2,142 348 – – Income tax effect of adjustments (32,091) (25,239) (21,044) (15,217) (13,975) Non-GAAP net income 73,362 94,010 62,734 63,626 66,009 Page 44 of 51 © 2010 Brocade Communications Systems, Inc. |
Capital Expenditures * Note: Excludes furniture and equipment leases of approximately $13M Forecast Campus completed, remaining capital spend in FY 11 expected to be nominal Page 45 of 51 © 2010 Brocade Communications Systems, Inc. |
Adjusted EBITDA and Sr. Secured Leverage Ratio As defined in the term credit agreement Consolidated Senior Secured Leverage Ratio Q1 FY 10 Q2 FY 10 Q3 FY 10 Q4 FY 10 $ Thousand Actual Actual Actual Actual Consolidated Net Income $51,095 $22,380 $21,961 $23,416 plus (i) Consolidated Interest Charges $22,073 $19,522 $22,061 $22,202 (ii) Provision for Federal, state, local and foreign income taxes payable $1,277 $0 $0 $5,988 (iii) Depreciation and amortization expense $51,012 $46,600 $50,493 $51,532 (iv) Fees, costs and expenses incurred on or prior to the Acquisition Closing Date in connection with the Acquisition and the financing thereof – – $0 $0 (v) Any cash restructuring charges and integration costs in connection with the Acquisition, in an aggregate amount not to exceed $75,000,000 $204 $0 $0 $0 (vi) Non-cash restructuring charges incurred in connection with the Transaction, all as approved by Arrangers $1,502 $1,084 $1,006 $930 (vii) Other non-recurring expenses reducing such Consolidated Net Income which do not represent a cash item in such period or any future period (in each case of or by the Borrower and its Subsidiaries for such Measurement Period) $8,783 ($47) $0 $574 (viii) Any non-cash charges for stock compensation expense in compliance with FAS 123R and amortization of the fair value of unvested options under the Acquired Business’ employee stock option plan assumed by the Borrower $21,523 $30,146 $24,682 $25,275 (ix) Legal fees and expenses relating to the Borrower’s indemnification obligations for the benefit of its former officers and directors in connection with its historical stock option litigation $250 724 376 $22 minus (i) Federal, state, local and foreign income tax credits $0 ($840) ($15,096) $0 (ii) All non-cash items increasing Consolidated Net Income (in each case of or by the Borrower and its Subsidiaries for such Measurement Period) ($3,036) ($3,127) ($4,026) ($2,212) Consolidated EBITDA $154,683 $116,442 $101,457 $127,727 4 Quarter Trailing Consolidated EBITDA $523,861 $520,429 $502,567 $500,309 Consolidated Senior Secured Debt $1,041,483 $1,015,957 $989,803 $959,491 Consolidated Senior Secured Leverage Ratio 1.99 1.95 1.97 1.92 Page 46 of 51 © 2010 Brocade Communications Systems, Inc. |
Q4 FY 2010 Cash and Debt Covenant Adjusted EBITDA* Performance (In Millions) Strong Capital Structure (In Millions) Within Debt Covenant Cash Balance** (In Millions) * Note: Adjusted EBITDA is as defined in the term debt credit agreement ** Cash, equivalents and short term investments Page 47 of 51 © 2010 Brocade Communications Systems, Inc. |
2010 Share Repurchases • Company has remaining Board authorization of $389M • Brocade can repurchase an additional $75M under the terms of the Term Debt Agreement if the Senior Secured Leverage Ratio is under 2.0 Amount Shares Total repurchases in 2010 $25M 4.4M Page 48 of 51 © 2010 Brocade Communications Systems, Inc. |
Domestic and International Reported Revenue Reported revenue on a ship-to basis Page 49 of 51 © 2010 Brocade Communications Systems, Inc. |
Segment Revenue Detail Product segment as a percent of revenue Q4 10 Q3 10 Q4 09 SAN Business Directors 37% 35% 42% Switches 48% 51% 46% Server 15% 14% 12% Ethernet Business Chassis 63% 65% 70% Stackables 37% 35% 30% Page 50 of 51 © 2010 Brocade Communications Systems, Inc. |
Thank You www.brcd.com Page 51 of 51 © 2010 Brocade Communications Systems, Inc. |