![]() Brocade Q2 FY 2011 Earnings Q2 FY 2011 EARNINGS May 19, 2011 5/19/2011 © 2011 Brocade Communications Systems, Inc. Page 1 Exhibit 99.2 |
![]() Prepared comments provided by Rob Eggers, Investor Relations Thank you for your interest in Brocade’s Q2 Fiscal 2011 earnings presentation, which includes prepared remarks, slides, and a press release detailing fiscal second quarter 2011 financial results. The press release was issued shortly after 1:00 p.m. Pacific time on May 19, 2011, via Marketwire. The press release, along with these prepared comments and slides, has been made available on Brocade’s Investor Relations website at www.brcd.com and has been furnished to the SEC on Form 8-K. |
![]() Brocade Q2 FY 2011 Earnings Cautionary Statements and Disclosures This presentation includes forward-looking statements regarding Brocade’s financial results, plans and business outlook as well as worldwide SAN, Ethernet and Federal government IT spending, which are only predictions and involve risks and uncertainties such that actual results may vary significantly. These and other risks are set forth in more detail in our Form 10-Q for the fiscal quarter ended January 29, 2011 and our Form 10-K for the fiscal year ended October 30, 2010. These forward-looking statements reflect beliefs, assumptions, outlook, estimates and predictions as of today, and Brocade expressly assumes no obligation to update any such forward-looking statements. In addition, this presentation includes various third-party estimates regarding the total available market and other measures, which do not necessarily reflect the views of Brocade. Further, Brocade does not guarantee the accuracy or reliability of any such information or forecast. Certain financial information is presented on a non-GAAP basis. The most directly comparable GAAP information and a reconciliation between the non-GAAP and GAAP figures are provided in the accompanying press release, which has been furnished to the SEC on Form 8-K and posted on Brocade’s website, and is included in the appendix to this presentation. Please see risk factors on Forms 10-K and 10-Q filed with the SEC 5/19/2011 © 2011 Brocade Communications Systems, Inc. Page 2 |
![]() Brocade Q2 FY 2011 Earnings Agenda Prepared comments followed by live Q&A call Richard Deranleau CFO Mike Klayko CEO 5/19/2011 © 2011 Brocade Communications Systems, Inc. Page 3 |
![]() Today’s prepared comments include remarks by Mike Klayko, Brocade CEO, regarding the company’s quarterly results, its strategy, and a review of operations, as well as industry trends and market/technology drivers related to its business; and by Richard Deranleau, Brocade CFO, who will provide a financial review. A live question-and-answer conference call will be webcast beginning at 2:30 p.m. Pacific time on May 19 at www.brcd.com and will be archived on the Brocade Investor Relations web site for approximately 12 months. Participants are invited to submit questions via e-mail at ir@brocade.com up to 60 minutes prior to the conference call and to ask live questions during the call. |
![]() Brocade Q2 FY 2011 Earnings Fiscal 2011: Q2 Earnings Mike Klayko, CEO 5/19/2011 © 2011 Brocade Communications Systems, Inc. Page 4 |
Prepared comments provided by Mike Klayko, CEO |
![]() Brocade Q2 FY 2011 Earnings Q2 Executive Summary Q2 Results • $550M revenues, up ~10% Yr./Yr. • 18.2% non-GAAP operating margin* • $0.13 non-GAAP EPS* (diluted) Business Highlights • SAN product revenue grew 17% Yr./Yr. driven by Director/Server • Enterprise/Service Provider Ethernet businesses revenue grew 24% Yr./Yr. led by EMEA, Americas, and APAC • Non-GAAP gross margins* expanded to 63.5% • Operating cash flows of $114M, up 68% Yr./Yr. * Non-GAAP, please see GAAP reconciliation in appendix 5/19/2011 © 2011 Brocade Communications Systems, Inc. Page 5 |
Brocade reported Q2 revenues of approximately $550M and non-GAAP diluted earnings per share (EPS) of $.13, which exceeded our prior guidance of $.10 for the quarter. Our revenues in the quarter represented almost a 10% increase year-over-year (Yr./Yr.) and a slight increase sequentially from our strong Q1. Highlights in the quarter included growth in our Enterprise and Service Provider Ethernet businesses, which grew 24% Yr./Yr. collectively. Other positive signs in the quarter included an increase in overall non-GAAP gross margins driven by improved non-GAAP gross margins for both the Ethernet and SAN products, which were at 51% and 72% respectively. Richard will provide more details on gross margins in the CFO section of the prepared comments. Our Server products business demonstrated continued momentum by growing nearly 21% Yr./Yr. Adoption of virtualization and migration to cloud computing are contributing factors to the growth in our adapter and embedded switch business. On the topics of virtualization and cloud, I would like to reiterate how excited I am about Brocade’s unique strategy and differentiated offerings to address what we believe is a new innovation cycle in networking that will last through this decade. We believe that Brocade has established a clear leadership position by out-innovating the rest of the industry to deliver purpose-built, cloud- optimized network solutions into the hands of customers beginning last year. Virtualization and clouds are not merely buzz words; they are the tangible means to help customers migrate to IT architectures that enable new levels of business agility and financial efficiency. I’ll cover these topics in greater detail in the next section. |
![]() Brocade Q2 FY 2011 Earnings Brocade FY 2011 Playbook 1. Differentiate through Innovation 2. Grow the Ethernet Business and Top Line Profitably 3. Maintain SAN Leadership 4. Generate More Awareness 5. Be an Employer of Choice 5/19/2011 © 2011 Brocade Communications Systems, Inc. Page 6 |
Now I will provide an update on the progress we’ve made on our FY 11 Playbook, which outlines our objectives to: •Differentiate through Innovation •Grow the Ethernet Business and Top Line Profitably •Maintain SAN Leadership •Generate More Awareness •Be an Employer of Choice |
![]() ![]() ![]() ![]() Brocade Q2 FY 2011 Earnings 1. Differentiate through Innovation BROCADE TECHNOLOGY DAY SUMMIT 2011 BROCADE TECHNOLOGY DAY SUMMIT 2011 5/19/2011 © 2011 Brocade Communications Systems, Inc. Page 7 |
Perhaps there was no better way to showcase our innovation progress and demonstrate our leadership than through our Technology Day Summit, which we hosted here at our San Jose campus earlier this month. The theme for the event was how Brocade is enabling IT transformation through cloud- optimized networks for all cloud segments—private, public, and hybrid. Fundamentally, we believe that the simplicity, uptime, and capabilities of any network will ultimately define application performance and user experience in the cloud. We also believe that our 15-year heritage in storage networking, our leadership in creating and defining the Ethernet fabric category, as well as our laser focus on all things networking, uniquely position Brocade as the company best capable of helping customers migrate smoothly to a world where information and applications reside and can be accessed anywhere—in other words, the cloud. |
![]() Brocade Q2 FY 2011 Earnings Brocade Private Cloud Innovations 5/19/2011 © 2011 Brocade Communications Systems, Inc. Page 8 |
As part of the Technology Day Summit, we made several significant announcements for the three cloud areas. I’ll briefly recap those starting with private cloud innovation, which was highlighted by Brocade again leading the Fibre Channel industry to the next technology transition by introducing the industry’s first and complete 16 Gbps Fibre Channel portfolio. This includes new SAN backbones/switches, enhancements to the unified management platform to address virtualization and cloud computing needs, and the next generation of server connectivity enabled through a new product category we’ve defined as Fabric Adapters. In addition, we also outlined a rich roadmap for our Ethernet fabric offerings that are designed to enhance these solutions in terms of scale, distance, performance, and versatility. |
![]() Brocade Q2 FY 2011 Earnings Brocade Public Cloud Innovations 5/19/2011 © 2011 Brocade Communications Systems, Inc. Page 9 |
In terms of public cloud innovation, we demonstrated how Brocade is leading the Service Provider business model transformation through public cloud-optimized offerings by delivering new hardware and software solutions. Specifically, we announced the general availability of the world’s most powerful and dense 10 and 100 Gigabit Ethernet blades for Brocade MLX and Brocade MLXe Series routers at industry-leading price points to enable massive scalability for highly virtualized public clouds. We also introduced significant software advancements across our router line designed to enable seamless IPv4–to–IPv6 interoperability and new MPLS capabilities, which are all critical in helping Service Providers fundamentally change their businesses and make them more profitable through public clouds. |
![]() Brocade Q2 FY 2011 Earnings Brocade Hybrid Cloud Innovations �� Ethernet fabrics • Fibre Channel fabrics • Multiprotocol Fabric Adapters • High-performance app delivery • Virtual Compute Blocks • Universal Distance Extension • Cloud ID • Open management frameworks • Unified education, support, and services AVAILABLE TODAY ROADMAP CloudPlex ™ Architecture Roadmap Dave Stevens, CTO, at the Brocade Technology Day Summit 5/19/2011 © 2011 Brocade Communications Systems, Inc. Page 10 |
Finally, in the area of hybrid cloud innovation, we outlined a vision for the “Virtual Enterprise” enabled through the Brocade CloudPlex™ architecture. This open, extensible architectural framework will help customers build the next generation of distributed and virtualized data centers in a simple, evolutionary way. We believe that the CloudPlex architecture is unique in that it is both the foundation for integrated compute blocks and also designed to embrace a customer’s existing multivendor infrastructure to unify all of the assets into a single compute and storage domain. As we discussed, Brocade is already delivering on several of the components of the CloudPlex architecture with others being completed on our development roadmap. |
![]() Brocade Q2 FY 2011 Earnings 2. Grow the Ethernet Business • 24% Yr./Yr. revenue growth in Enterprise/Service Provider Ethernet businesses • 51% Ethernet product non-GAAP gross margins* • Demonstrating progress toward key business initiatives Increasing profitability through key initiatives * Non-GAAP, please see GAAP reconciliation in appendix 5/19/2011 © 2011 Brocade Communications Systems, Inc. Page 11 |
Drilling down in our Ethernet business further, I am pleased to announce that we grew revenue in our products and services Yr./Yr. and sequentially, led by the growth in our Enterprise and Service Provider businesses. Our Federal Ethernet business did not recover in Q2 as expected due to key deals being deferred largely because of budgetary delays. However, as we experienced last fiscal year, we expect the Federal business to rebound in future quarters as these transactions close. The revenue growth compounded with the improvements in gross margins validate that we’re making progress on the key business initiatives we outlined in 2010. |
![]() Brocade Q2 FY 2011 Earnings De Persgroep Deploying Europe’s first Ethernet fabric switching solution 72 Brocade VDX 6720 Ethernet fabric switches deployed across a fabric-based architecture created a single logical chassis with a single distributed control plane across multiple racks of servers. •Improved performance and reliability •Reduced capital and operating costs •Simplified virtual machine migration “As we look to accelerate our virtualization strategy, Brocade’s approach provides virtual machines a greater sphere of mobility and gives us a blueprint for future growth. ” Wim Vanhoof, ICT Infrastructure Manager, De Persgroep Brocade VDX 6720–24 Switch Brocade VDX 6720–60 Switch 5/19/2011 © 2011 Brocade Communications Systems, Inc. Page 12 |
Customer demand drove excellent momentum across our entire Ethernet solutions portfolio. For example, we recently announced an Ethernet fabric win at De Persgroep, one of Europe’s largest media companies that delivers news to 9.4 million daily readers and online visitors. De Persgroep deployed the Brocade VDX 6720 switches to manage and simplify its IT environment that includes more than 1,000 servers, 3,500 users, and 325 terabytes of data to manage significant data traffic growth—which has already grown 650% in just the last four years. De Persgroep presented at our Technology Day Summit and discussed its Ethernet fabric deployment and the reasons for selecting Brocade. These included the fact that Brocade Ethernet fabrics delivered improved performance and reliability while reducing management and operating cost—and we were able to deliver this today. |
![]() Brocade Q2 FY 2011 Earnings Hurricane Electric Hurricane Electric remains ahead of the IPv6 curve with Brocade World’s largest IPv6 Internet backbone future- readies its business to support massive bandwidth demands and device growth by implementing Brocade IPv6 routers and switches. “With an infrastructure of our magnitude, we absolutely required a simple, yet powerful and scalable routing infrastructure to support massive routing table space, IPv6, 10 GbE and a base to support for 100 GbE in the future. We rely on Brocade to provide us the right balance of performance, future IPv6 routing table scalability and total cost of ownership to ensure a solid network investment. ” Martin Levy, Director of IPv6 Strategy, Hurricane Electric Brocade MLXe with 100 GbE 5/19/2011 © 2011 Brocade Communications Systems, Inc. Page 13 |
Another example is our win at Hurricane Electric, which now operates the largest IPv6 Internet backbone in the world using Brocade networking technology. As of January 2011, Hurricane Electric became the first Internet backbone worldwide to connect to 1200 IPv6 networks. IPv6 is an important issue for network administrators as experts warn that IPv4 addressing capacity has reached its limit, which will eventually require a transition to the newer technology. However, as we discussed at our Technology Day Summit, we have outlined a smooth transition strategy that will ensure years of IPv4–to–Pv6 interoperability enabled through software enhancements to Brocade IP routers and application delivery switches. |
![]() ![]() ![]() ![]() ![]() ![]() ![]() ![]() ![]() ![]() ![]() Brocade Q2 FY 2011 Earnings Partner Traction and Momentum Avnet CEO Roy Vallee discusses Avnet’s unique long-term partnership with Brocade. Avnet CEO Roy Vallee discusses Avnet’s unique long-term partnership with Brocade. Robin Johnson, CIO of Dell, discusses the implementation of Dell PowerConnect Brocade IP technology that has yielded a 40% OpEx reduction. Robin Johnson, CIO of Dell, discusses the implementation of Dell PowerConnect Brocade IP technology that has yielded a 40% OpEx reduction. 5/19/2011 © 2011 Brocade Communications Systems, Inc. Page 14 |
Partnerships are also critical to the overall success of our Ethernet business and in this area we had several significant updates in Q2. Most recently, Dell announced the general availability of several Brocade Ethernet switches—referred to as the Dell PowerConnect B-Series—as part of a larger networking, server, and storage portfolio update aimed at data center deployments in enterprise and small-to-medium customers. And in fact, Dell not only partners with us to sell these solutions, they are also a Brocade customer, deploying Brocade solutions in their own IT environments. In Q2, Brocade also announced a new OEM relationship with LG-Ericsson that will enable both companies to jointly pursue business opportunities in the high-growth Korean information and communications technology market. Specifically, LG-Ericsson has launched a number of Brocade networking solutions under its “iPECS” brand and made them available in Korea starting in April. Turning now to our channel partners, our recent strategic focus has been to provide them the necessary tools and training to enable them to take full advantage of virtualization and cloud computing opportunities. Brocade has launched a number of education initiatives and certifications designed to increase channel partner expertise in data center network and Ethernet fabric solutions. We are also working with key distributors in this area on joint programs such as the “Avnet Accelerator,” a collaborative effort between Brocade and Avnet to enable resellers to design and implement advanced data center solutions for customers who face mounting challenges associated with virtualization and application proliferation. |
![]() Brocade Q2 FY 2011 Earnings 3. Maintain SAN Leadership First to market with 16 Gbps Fibre Channel 5/19/2011 © 2011 Brocade Communications Systems, Inc. Page 15 |
Moving onto the SAN business, Q2 was a strong quarter with revenue for products and support/services growing nearly 14% Yr./Yr. We were particularly pleased with the broad-based demand across our OEM and channel partners, which was driven by strength in sales of SAN backbones/directors as well as Server products. We are also excited about the impact that our new, cloud-optimized 16 Gbps Fibre Channel portfolio will have in the marketplace as it is ideal for highly virtualized and cloud environments. |
![]() ![]() ![]() Brocade Q2 FY 2011 Earnings “Over the years, Brocade networking solutions have become an integral component in improving the scalability, efficiency and agility of our customers’ Hitachi storage environments for mission-critical data and applications. We are excited about Brocade’s next generation Fibre Channel solutions, which promise to help our customers to more easily on-board our industry-leading storage solutions and achieve improved performance, centralized management and faster connectivity between data centers. ” Sean Moser, Vice President, Storage Software Product Management, Hitachi Data Systems OEM Highlights 5/19/2011 © 2011 Brocade Communications Systems, Inc. Page 16 |
In terms of OEM updates, a clear Q2 highlight was the fact that Hitachi Data Systems (HDS), has now joined EMC, HP, and IBM as a “10% Customer,” meaning that each company accounted for at least 10% of Brocade’s total revenue in the quarter. These partners will be critical in helping us transition the SAN industry to the next-generation technology—16 Gbps Fibre Channel. Recent industry research validates that Fibre Channel continues to be the foundation for virtualized storage and private cloud/VDI implementations, with Forrester Research documenting that 76% of customers surveyed said they are using Fibre Channel as the preferred storage networking technology for virtualization, far exceeding other technologies. Forrester’s data is consistent with similar market research over the last three years from other firms including Gartner, TheInfoPro, and the Enterprise Strategy Group. With availability of our 16 Gbps Fibre Channel portfolio expected to begin later this calendar year, Brocade again expects to enjoy a significant time-to-market advantage, which we experienced through previous transitions, namely from 2 to 4 and 4 to 8 Gbps Fibre Channel technologies. |
![]() Brocade Q2 FY 2011 Earnings 4. Generate More Awareness Brocade launches new global campaign 5/19/2011 © 2011 Brocade Communications Systems, Inc. Page 17 |
In addition to investments in new products, technologies, and more direct engagements with customers, Brocade continues to invest in raising our company’s global brand awareness. At the Technology Day Summit, we introduced a new corporate campaign called “The Data Center Is Here” with “Here” representing any place computing or information storage exists, inside or outside the data center. “The Data Center Is Here” also carries another message in that Brocade is the only company delivering Ethernet fabrics to the market today—it’s here. And we believe that we are gaining credibility with large customers because of our heritage and first-to- market advantage in fabrics and the data center solutions. |
![]() Brocade Q2 FY 2011 Earnings APAC Leadership Summit 2011 Executive Roadshow Momentum and strategic investment in this critical market 5/19/2011 © 2011 Brocade Communications Systems, Inc. Page 18 |
We are also generating more awareness by meeting with customers, partners, and other key influencers in key regions. In Q2, Brocade held our APAC Executive Roadshow where our senior executive team fanned out across eight countries to meet with nearly one thousand customers and media/analysts. One of our core messages was to reiterate how important Asia Pacific is to Brocade’s overall business. Reflective of that is the doubling of our headcount in the region over the last several quarters. During this roadshow, we also launched a broad-reaching technology/ product evaluation program designed to enable eligible customers to quickly deploy Ethernet fabrics as the foundation for highly virtualized data centers. |
![]() Brocade Q2 FY 2011 Earnings The eighth annual Best Places to Work awards recognized Brocade as a top employer in the Bay Area 5. Be an Employer of Choice 5/19/2011 © 2011 Brocade Communications Systems, Inc. Page 19 |
Finally, we are also increasing our company profile by continuing to be recognized as a top destination for talented employees. In Q2 we were recognized by the San Francisco Business Times/Silicon Valley Business Journal as one of the “Best Companies to Work for in the Bay Area.” This is the third consecutive year we received this honor, and it follows the recognition earlier this year by Fortune Magazine as Brocade being one of the “100 Best Companies to Work For” in the United States. |
![]() Brocade Q2 FY 2011 Earnings Q2 2011 Summary • 24% growth Yr./Yr. for Enterprise/Service Provider Ethernet businesses revenue • 17% growth Yr./Yr. for Storage product revenue • Continue to be an award-winning employer of choice • Clear leadership and first-to-market advantage in a new cycle of networking innovation 5/19/2011 © 2011 Brocade Communications Systems, Inc. Page 20 |
Brocade executed well in Q2 delivering solid results in our overall Ethernet business and stronger- than-expected performance in our SAN business. The improvements in Ethernet and SAN product non- GAAP gross margins were clearly a highlight of the quarter, which helped us achieve overall gross margins and operating margins above our guidance. We believe that the networking industry is in the beginning stages of a new innovation cycle driven by the IT imperatives of virtualization and cloud computing. Brocade has established a clear leadership position and first-to-market advantage by delivering award-winning Ethernet fabric solutions to customers well ahead of the competition. We are also leading the storage networking industry through the transition to 16 Gbps Fibre Channel to ensure that customers have options in determining the networking technologies that best suit their data center and IT requirements. In summary, there are new opportunities emerging in the networking industry that we have not seen in the previous decade and we believe Brocade has the right strategy, technologies, and offerings to capitalize on this new and exciting era of innovation. |
![]() Brocade Q2 FY 2011 Earnings Q2 FY 2011 Financials Richard Deranleau, CFO 5/19/2011 © 2011 Brocade Communications Systems, Inc. Page 21 |
Prepared comments provided by Richard Deranleau, CFO |
![]() Brocade Q2 FY 2011 Earnings Financial Highlights * Non-GAAP, please see GAAP reconciliation in appendix Growing top line profitably and reducing term debt Q2 11 Revenues Overall revenue/growth $550M / +9.8% Yr./Yr. Storage product revenue growth +17% Yr./Yr. Enterprise/Service Provider Ethernet business revenue growth +24% Yr./Yr. Profitability Non-GAAP EPS* (diluted) $0.13 GAAP EPS (diluted) $0.06 Generating cash/reducing debt Operating cash flow $114M Total debt payments $59M Term loan balance $252M 5/19/2011 © 2011 Brocade Communications Systems, Inc. Page 22 |
In Q2, Brocade generated revenues of $549.9M, which were up 9.8% Yr./Yr. and up slightly Qtr./Qtr. from a strong Q1, in line with the guidance we shared with you on our last earnings call. Storage product revenues were up over 17% Yr./Yr. driven by double-digit growth in backbones/directors, switches, embedded switches, and server adapters. Storage revenues were slightly lower sequentially, but performing better than historical seasonality, with lower backbone/director revenue partially offset by higher switch revenue. Ethernet business revenues were up 1.4% Yr./Yr. and up 3.7% Qtr./Qtr. with Enterprise and Service Provider Ethernet segments showing good progress again in the quarter. Non-GAAP earnings per share on a diluted basis were $0.13 for Q2, driven by stronger gross margins and slower growth in operating expenses. Q2 results included approximately one-half cent benefit from a lower- than-expected tax rate resulting primarily from the settlement of an IRS audit for FY07 and FY08. Excluding this benefit, our non-GAAP EPS for Q2 would have been $0.12, which is higher than the guidance we provided of $0.10 for the quarter. We generated strong operating cash flow of $113.7M in Q2, better than our outlook, which we used to pay down our term loan and build our cash balance. In Q2 we repaid $58.9M of our senior secured debt of which $50.0M was in excess of the mandatory amount due, bringing our acquisition term debt down to $252M. Total Q2 diluted shares were 501.5M shares and within our expected range when we provided our outlook for the quarter. |
![]() Brocade Q2 FY 2011 Earnings Key Financial Metrics * Non-GAAP, please see GAAP reconciliation in appendix Q2 10 Q3 10 Q4 10 Q1 11 Q2 11 Revenue $501M $504M $550M $546M $550M Sequential growth (7.1)% .5% 9.3% (0.8)% .7% Year-over-year growth (1.1)% 2.1% 5.5% 1.2% 9.8% Non-GAAP gross margin* 62.7% 60.4% 62.3% 62.0% 63.5% Non-GAAP operating margin* 20.5% 17.3% 20.4% 17.1% 18.2% Non-GAAP EPS*—diluted $0.13 $0.13 $0.14 $0.12 $0.13 GAAP EPS—diluted $0.05 $0.05 $0.05 $0.06 $0.06 Continuing to manage the business to our 2-year target model 5/19/2011 © 2011 Brocade Communications Systems, Inc. Page 23 |
Turning first to the top line, Q2 revenues were $549.9M in a quarter where we saw our Storage business outperform expected seasonal patterns. We added a fourth 10% customer this quarter in HDS, achieving a record revenue quarter with this partner. Storage product revenues were up 17% Yr./Yr. driven by higher backbone/director and Server product sales, which were up 22% and 21%, respectively, compared to Q2 10. Switches were also up 12% compared to the same period last year. Ethernet business revenues were up 3.7% sequentially and up 1.4% Yr./Yr. We saw strong Yr./Yr. revenue growth in our Enterprise and Service Provider Ethernet businesses of 24% offset by continued weakness in Federal Ethernet revenue. At the beginning of the quarter, we assumed Federal spending would be improving in our Q2. However, the ultimate budget delays and the deferral of key deals negatively impacted our Federal business in the quarter. On a geographic basis, we saw better-than-expected performances in EMEA, continued strength in APAC, and improvement in non-Federal Americas. Global Services revenues were up 2.4% sequentially driven by higher professional services and Ethernet support revenue. Non-GAAP Gross Margins of 63.5% were better than our guidance range of 61.5% to 62.0% for the quarter driven by stronger-than-expected Storage performance and improving Ethernet gross margins. Non-GAAP gross margins in the quarter were above our 2-year target model range of 61% to 63%. Q2 non-GAAP operating expenses as a percentage of revenue were 45.3%, slightly higher quarter-over- quarter but lower than the guidance of 45.5% to 46.0% for the quarter. Non-GAAP operating margins were 18.2%, above the guidance of 15.5% to 16.0% for the quarter, and comfortably within our 2-year target model range of 17% to 20%. The sequential improvement in operating margins was driven by the higher gross margins. The Q2 11 effective non-GAAP tax rate was 20.7% and effective GAAP tax benefit was (2.3%). The Non- GAAP tax rate in Q2 reflects a one-time benefit from the settlement of IRS audits that resulted in a benefit of approximately 3 points to the rate and contributed approximately one-half cent to non-GAAP EPS. |
![]() Brocade Q2 FY 2011 Earnings Revenue: SAN, Ethernet, and Global Services Stable mix across business segments 5/19/2011 © 2011 Brocade Communications Systems, Inc. Page 24 |
Turning to revenues by business unit, our Storage product revenue was $330.4M in the quarter, a slight decrease sequentially, better than seasonal trends, and an increase of 17% from Q2 10. Storage product revenue represented 60% of total revenues in Q2, versus 61% in Q1. Our Ethernet product revenue was $128.7M in the quarter, an increase of 2.0% from the previous quarter and essentially flat from Q2 10. Ethernet product revenue represented 23% of total revenue, unchanged from Q1. Our Global Services revenue was $90.9M in the quarter and represented 17% of revenues, up from 16% in Q1. Global Services revenue was up 2.4% sequentially driven primarily by higher professional services and Ethernet support revenue and was essentially flat versus Q2 10. |
![]() Brocade Q2 FY 2011 Earnings Total Ethernet Business Revenue $156.7 $149.5 $170.5 $153.2 $158.9 Total +1.4% Support +5.6% Products +0.4% Q2 Yr./Yr. Compares 5/19/2011 © 2011 Brocade Communications Systems, Inc. Page 25 |
Looking at our Ethernet business, including hardware and Ethernet-based support and services, Q2 revenues were $158.9M up 1.4% Yr./Yr. and up 3.7% from Q1 11. From a product segment view, stackables continued to grow as a percentage of Ethernet revenues and represented 43% of revenues in Q2, a slight improvement compared to 42% in Q1. We are also pleased with our Brocade ADX Layer 4–7 product revenue in Q2, which grew nearly 30% Yr./Yr. |
![]() Brocade Q2 FY 2011 Earnings Total Ethernet Business Revenue By customer segment Note: Service Provider segment consists of end users that are identified as a service provider through SIC codes or other analysis on a quarterly basis Strong Yr./Yr. growth across Enterprise and Service Provider $156.7 $149.5 $170.5 $153.2 $158.9 Total +1% Federal -58% Enterprise Service Provider Q2 Yr./Yr. Compares $124.6 Federal FY 10 budget approved Dec. ‘09 Federal FY 11 budget approved Apr. ‘11 24% 5/19/2011 © 2011 Brocade Communications Systems, Inc. Page 26 |
As we drill down into the Ethernet business details, we are pleased with the Yr./Yr. growth in our Service Provider and Enterprise segments in Q2. Revenue from Enterprise and Service Provider businesses collectively were up 24% Yr./Yr. and up nearly 6% sequentially, showing strength across our product portfolio and customer base. Revenue from enterprise customers, excluding Federal, was up 4.7% sequentially, grew 32.5% Yr./Yr., and represented 61% of our total Ethernet business in Q2. Revenue from our Service Provider business grew 8.4% Yr./Yr., and represented 27% of our total Ethernet business in Q2. We saw good growth in our new accounts with both initial sales in the quarter as well as repeat business. Our Federal Ethernet business was $18.5M, down 9.3% from Q1 and down 58% Yr./Yr. from a strong Q2 10, reflecting continued softness in Federal spending and the deferral of several key deals due to the timing of the Federal budget approval. As you may recall, in Q2 10 we experienced a significant improvement in Federal revenue Qtr./Qtr. after the Federal budget was signed in December 2009. This makes the current Yr./Yr. comparable more challenging as the current Federal fiscal year’s budget was not approved until April. |
![]() Brocade Q2 FY 2011 Earnings Total SAN Business Revenue Strong Yr./Yr. growth in SAN business $344.3 $354.0 $379.9 $392.8 $391.0 Total +14% Support -3% Products +17% Q2 Yr./Yr. Compares 5/19/2011 © 2011 Brocade Communications Systems, Inc. Page 27 |
Looking at our SAN business, including hardware and SAN-based support and services, Q2 revenue of $391.0M was down slightly from Q1 and up 13.6% from Q2 10. Demand for Brocade’s leading SAN products was strong, resulting in SAN product revenue of $330.4M in the quarter. The increase year-over-year was driven by revenue growth across all of our product families, led by backbone/director and Server products. Our Server product group, including embedded switches and Server adapter products (HBAs and Mezzanine Cards), posted revenues of $48.4M, up 20.9% Yr./Yr. and down slightly from our record in Q1. Embedded switches revenues were up 15.5% Yr./Yr. while our Server adapter product (HBAs and Mezzanine Cards) revenues were up over 110% Yr./Yr. As we look at our multiprotocol and converged networking products including the Brocade 8000, FCoE blades for our flagship Brocade DCX storage chassis, Brocade VDX switches and CNAs, total converged product revenue growth was more than 100% Yr./Yr. We feel that our product portfolio, including the recently announced Brocade 1860 Fabric Adapters, continues to demonstrate our leadership in multiprotocol and cloud-optimized networks. |
![]() Brocade Q2 FY 2011 Earnings Revenue: 10% Customers, Other OEM, Channel/Direct HDS joins 10% Customers in Q2 2011 5/19/2011 © 2011 Brocade Communications Systems, Inc. Page 28 |
In Q2, Brocade had four customers that each contributed revenue greater than 10%: EMC, HDS, HP, and IBM. Collectively, our four greater-than-10% customers contributed 53% of revenues in Q2, up from 47% in Q1, when we had three 10% customers, and up from 44% in the quarter a year ago, when again we had three 10% customers. Other OEMs represented 11% of revenues in Q2 versus 19% in Q1, when the figure included HDS. Channel and Direct were 36% of revenues in Q2, an increase from 34% in Q1, reflecting a mix shift from the OEMs to the channel/direct business sequentially. |
![]() Brocade Q2 FY 2011 Earnings Segment Revenues and Gross Margin Snapshot Q1 11 vs. Q2 11 revenue mix and non-GAAP gross margin* * Non-GAAP, please see GAAP reconciliation in appendix Q1 11 Q2 11 Revenues by Segment ($M) Non-GAAP Gross Margin* by Segment Gross margin expansion across all segments 5/19/2011 © 2011 Brocade Communications Systems, Inc. Page 29 |
Non-GAAP gross margins of 63.5% were above our guidance range of 61.5% to 62.0% for the quarter, driven primarily by the strong Storage performance and improving Ethernet margins. Company non-GAAP gross margins were up 150 basis points from Q1. Q2 Storage non-GAAP gross margins were 72.3%, up from 71.4% in Q1, reflecting a favorable customer mix, including a shift to direct and channel revenue. The impact of higher Storage gross margins on the overall non-GAAP gross margins was approximately +50 basis points in the quarter. Q2 Ethernet non-GAAP gross margins were 51.0%, up from 46.7% in Q1 and are at the highest level since Q2 10. The higher Ethernet gross margins reflect good progress on the initiatives to improve gross margins we laid out at our September 2010 Analyst Day. The impact of higher Ethernet gross margins on overall non- GAAP gross margins was approximately +100 basis points in Q2. Global Services non-GAAP gross margins were 49.0% in Q2, up versus 48.7% in Q1, primarily due to higher professional services and support revenue. |
![]() Brocade Q2 FY 2011 Earnings Ethernet Non-GAAP Gross Margin* Progress Comparison to Q3 10 and 2-year target model * Non-GAAP, please see GAAP reconciliation in appendix ** Pricing/other includes all pricing and mix impact Q3 10 Q2 11 Executing on Ethernet gross margin initiatives Pricing/ Other ** Volumes Inventory Mgmt. +3% +1–4% +2.3% +2.7% +2–4% +0.7% +1–2% +0.9% 2-Yr. Target Model Gross margin initiatives est. Actual Product Costs 54–59% 5/19/2011 Page 30 © 2011 Brocade Communications Systems, Inc. |
In looking at our Ethernet gross margins, we are pleased with the progress we have made since we laid out our plans at our 2010 Analyst Day last September. We had identified several areas of focus to improve our Ethernet gross margins from our Q3 10 levels to reach our 2-year target model of 54% to 59%. In the 3 quarters since we set that goal, we have made very good progress, including improving the management of inventory [+2.3 pts], generating higher volumes to improve fixed cost absorption [+0.7 pts], lowering product costs including new product offerings [+2.7 pts], and managing the business to a more stable pricing environment/mix/other [+0.9 pts]. We continue to be focused on these Ethernet gross margin initiatives outlined above and plan to drive improvements going forward to be within our target of 54% to 59% by Q4 this year. |
![]() Brocade Q2 FY 2011 Earnings Operating Performance vs. 2-Year Target Model * Non-GAAP, please see GAAP reconciliation in appendix Overachievement on gross margin improved operating margin Non-GAAP Operating Margins* Non-GAAP Operating Expenses* as a Percentage of Revenues 2-year target model: 43–44% 2-year target model: 17–20% Non-GAAP Gross Margin* 2-year target model: 61–63% 5/19/2011 © 2011 Brocade Communications Systems, Inc. Page 31 |
Since we introduced our 2-year target model at the September 2010 Analyst Day, we have been able to manage the business to the target model ranges for both non-GAAP gross margin and non-GAAP operating margin for each quarter in a challenging business environment. On a non-GAAP basis, total operating expenses were 45.3% of revenues in Q2 versus 44.9% in Q1. The dollar increase in operating expenses sequentially reflects the investment in our sales organization and marketing spend made during the first half of FY11. With the investment in sales largely completed, we would expect to manage our spending to within our 2-year target model going forward. Non-GAAP operating margins were 18.2% in Q2, an improvement over Q1 driven by the overachievement of gross margins compared to our model and guidance. Our 2-year target model for operating margins is 17% to 20%, and we are pleased that we have been able to operate within that model, delivering 17.6% operating margin in the first half. |
![]() Brocade Q2 FY 2011 Earnings Balance Sheet and Cash Flow Highlights as of April 30, 2011 Strong cash flows drive healthy balance sheet * Adjusted EBITDA is as defined in the term debt credit agreement Q2 10 Q3 10 Q4 10 Q1 11 Q2 11 Cash from operations $67.7M $55.3M $106.4M $118.2M $113.7M Capital expenditures $62M $47M $46M $23M $27M Free cash flow $6M $9M $61M $95M $87M Debt payments $202.2M $30.6M $30.2M $39.7M $58.9M Cash, equivalents, and short term investments $290M $296M $336M $416M $466M Senior secured debt $1.01B $0.99B $0.96B $0.92B $0.86B Adjusted EBITDA* $116.4M $101.5M $127.7M $114.5M $122.5M Stock repurchase $20M $5M $0 $0 $0 Senior secured leverage ratio 1.95x 1.97x 1.92x 2.00x 1.84x Covenant 2.5x 2.5x 2.5x 2.5x 2.5x Fixed charge coverage ratio 1.8x 1.7x 1.7x 1.8x 2.3x Covenant 1.25x 1.25x 1.25x 1.5x 1.5x 5/19/2011 © 2011 Brocade Communications Systems, Inc. Page 32 |
Cash from operations was $113.7M in Q2, down slightly quarter-over-quarter and better than our previous guidance. Total capital expenditures in the quarter were $27M, lower than our outlook. Free cash flow was nearly $87M in the quarter, down slightly Qtr./Qtr. Cash and equivalents grew to $466M, up $50M from $416M in Q1. In Q2, we reduced our term debt principal by $58.9M, including $50.0M in excess of the mandatory payment. As we stated during our Analyst Day last year, we continue to focus on increasing operating cash flow and our priorities for cash will be focused on paying down our term debt first, continuing to build our cash reserves, and repurchasing stock on an opportunistic basis and subject to debt covenants. Adjusted EBITDA in the quarter was $122.5M, which was an improvement from the Q1 level of $114.5M. The Senior Secured Leverage Ratio of 1.84x and the Fixed Charge Coverage Ratio of 2.28x are both within the covenant requirements of our term credit agreement. |
![]() Brocade Q2 FY 2011 Earnings Net Debt: Defined as Total Debt Less Total Cash Decreased by $679M from Q1 09 to Q2 11 More than 63% reduction in 2+ years 5/19/2011 © 2011 Brocade Communications Systems, Inc. Page 33 |
Net Debt has declined from $1,073M at the end of Q1 09 to $394M at the end of Q2 11. This represents a $679M or 63% reduction over the last two plus years, demonstrating Brocade’s ability to generate cash and reduce our long-term debt. Our term debt loan balance is now down to $252M. |
![]() Brocade Q2 FY 2011 Earnings Q3 2011 Planning Assumptions IT market conditions • Caution around macro economic conditions (Japan, China, Europe) • Federal budget closure will improve Federal IT spending • SAN TAM expected to grow 4–6% in FY 11 • Expect to grow faster than market in Ethernet Margins/pricing • Overall non-GAAP gross margins within 2-year target, but lower Qtr./Qtr. due to mix • Small pricing declines in SAN and Ethernet Taxes • Outlook tax rate does not include discrete items OEM inventories • Expect to come down Qtr./Qtr. with 16 Gbps launch 5/19/2011 © 2011 Brocade Communications Systems, Inc. Page 34 |
Now, as we look to Q3 11, here are some assumptions to consider in developing your financial models: We continue to monitor the stability and health of international markets, specifically Japan, China, and Europe. We are cautious about the current global and country-specific dynamics, such as the effects from the Japanese earthquake and tsunami, inflationary risks in China, and the continuing sovereign debt risk in Europe, all of which may impact our business and that of our partners. As a result of this uncertain macro environment and using a balanced viewpoint, we are issuing revenue guidance with a wider range than previous quarters. We expect our Federal Ethernet business to return to more normal levels starting in Q3 as we close several deals that were deferred primarily due to the timing of the Federal budget approval. We believe that the SAN total available market will grow 4% to 6% annually in FY11, consistent with what we outlined at Analyst Day. Our Storage product revenues were up 4.1% during the first half of FY11 compared to the first half of FY10. For Q3 11, we anticipate that Brocade SAN revenue will be up 3% to 5% Yr./Yr. Exiting Q2, OEM inventory was approximately 2.5 weeks. As the OEMs launch their 16 Gbps offerings, we plan to work with them to reduce 8 Gbps inventories over the second half of 2011, to help ensure a smooth transition to 16 Gbps. We expect to grow faster than the Ethernet market in Q3. We anticipate that our new Brocade VDX and VCS technology solutions will continue to ramp and will have a larger contribution to revenue/gross margin in FY12 as we continue to see this market evolve and see a longer selling cycle with Ethernet fabrics. We expect company non-GAAP gross margins to be within our 2-year target model in Q3 as the product revenue mix moves to more Ethernet products and Storage non-GAAP gross margins return to Q4 10/Q1 11 levels, reflecting a more historical customer/product mix. We expect quarterly ASP declines in our SAN and Ethernet businesses to be in the low-single digits in Q3. From a tax rate perspective, we do not forecast discrete events due to the inherent uncertainty of their timing, but expect no change to our structural rate for planning purposes. |
![]() Brocade Q2 FY 2011 Earnings Q3 2011 Financial Outlook As of May 19, 2011 * Non-GAAP estimates assume exclusion of the same category of items excluded from Q1 11 non-GAAP results Q3 11 Revenue range (up 7%–11% Yr./Yr.) $540M–560M Non-GAAP gross margin* 62.0%–62.5% Non-GAAP operating expenses* 45.0%–45.5% Non-GAAP operating margin* 16.5%–17.5% Other income/other expense ($21M) Non-GAAP tax rate* ~25% Fully diluted shares outstanding 512M–517M Non-GAAP EPS* $0.10–$0.11 Operating cash flow $60M–$75M Capital expenditures $30M–$33M Free cash flow $30M–$42M 5/19/2011 © 2011 Brocade Communications Systems, Inc. Page 35 |
Given these planning assumptions, in Q3 11 we expect: • Overall revenue to be $540M to $560M, down 2% to up 2% Qtr./Qtr. and up 7% to 11% Yr./Yr. • Non-GAAP gross margins to be 62.0% to 62.5% • Non-GAAP operating expenses to be 45.0% to 45.5% • Non-GAAP operating margins to be 16.5% to 17.5% • Other income/expense net to be approximately ($21M) • Non-GAAP tax rate to be approximately 25% • Diluted shares outstanding to be in a range of 512M to 517M shares • Non-GAAP EPS to be 10 cents to 11 cents • Operating cash flow of $60M to $75M • Capital expenditures of $30M to $33M • Free cash flow of $30M to $42M, in a seasonally weak cash flow quarter |
![]() Brocade Q2 FY 2011 Earnings Financial Summary Richard Deranleau, CFO 5/19/2011 © 2011 Brocade Communications Systems, Inc. Page 36 |
We are looking forward to answering your questions in the Q&A session of our conference call. |
![]() ![]() ![]() Brocade Q2 FY 2011 Earnings Jason Nolet VP Data Center and Enterprise Networking Live Q&A Call May 19, 2011, 2:30PM Pacific Time Richard Deranleau CFO John McHugh CMO Ian Whiting SVP WW Sales Mike Klayko CEO Dave Stevens CTO 5/19/2011 © 2011 Brocade Communications Systems, Inc. Page 37 |
![]() Prepared comments provided by Rob Eggers, Investor Relations That concludes Brocade’s prepared comments. At 2:30 p.m. Pacific Time on May 19 Brocade will host a webcast conference call at www.brcd.com primarily devoted to answering questions submitted via e-mail to ir@brocade.com and taken live from participants via telephone. Thank you for your interest in Brocade. |
![]() Brocade Q2 FY 2011 Earnings Appendix and Reconciliations 5/19/2011 © 2011 Brocade Communications Systems, Inc. Page 38 |
![]() Brocade Q2 FY 2011 Earnings Quarterly Net Income GAAP/Non-GAAP Reconciliation (In Thousands) Q2 10 Q3 10 Q4 10 Q1 11 Q2 11 Net income on a GAAP basis 22,380 21,961 23,416 27,179 27,613 Adjustments: Legal fees associated with indemnification obligations and other related expenses, net 277 (74) (666) 124 – Stock-based compensation expense 30,146 24,682 25,275 19,906 22,530 Amortization of intangible assets 30,657 30,657 30,657 30,656 29,489 Loss on sale of property (47) – – – – Restructuring costs and facilities lease loss – – 1,059 – – Legal fees associated with certain pre-acquisition litigation 17 13 243 77 216 Provision for certain pre-acquisition litigation – 1,604 – – – Interest due to adoption of new standard 348 – – – – Income tax effect of adjustments (21,044) (15,217) (13,975) (17,208) (17,037) Non-GAAP net income 62,734 63,626 66,009 60,734 62,811 5/19/2011 © 2011 Brocade Communications Systems, Inc. Page 39 |
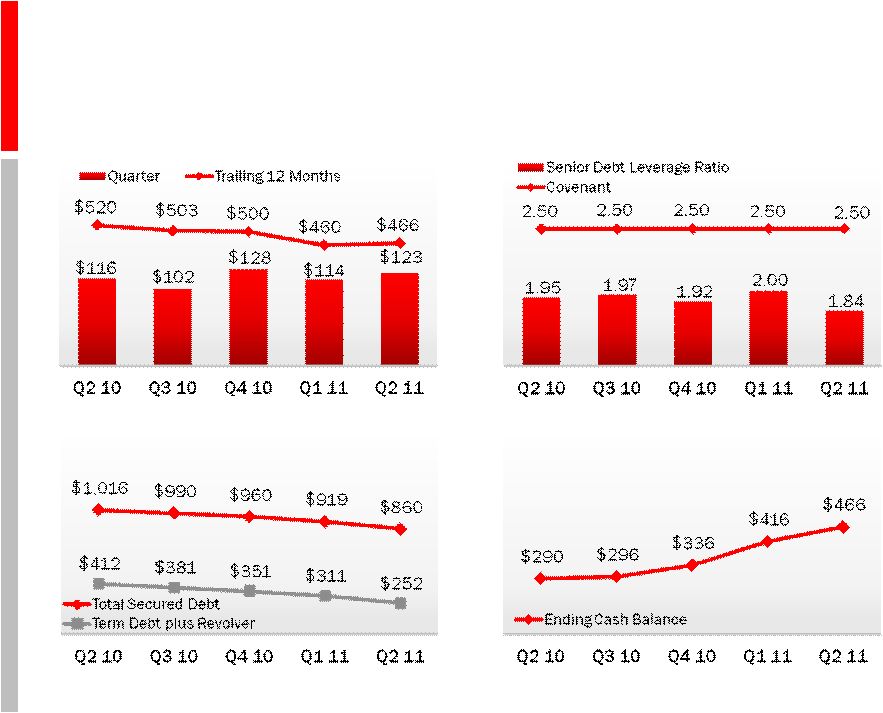
![]() Brocade Q2 FY 2011 Earnings Adjusted EBITDA and Sr. Secured Leverage Ratio As defined in the term credit agreement Consolidated Senior Secured Leverage Ratio Q2 FY 10 Q3 FY 10 Q4 FY 10 Q1 FY 11 Q2 FY 11 $ Thousand Actual Actual Actual Actual Actual Consolidated Net Income $22,380 $21,961 $23,416 $27,179 $27,613 plus (i) Consolidated Interest Charges $19,522 $22,061 $22,202 $21,546 $20,745 (ii) Provision for Federal, state, local and foreign income taxes payable $0 $0 $5,988 $0 $0 (iii) Depreciation and amortization expense $46,600 $50,493 $51,532 $52,522 $51,712 (iv) Fees, costs and expenses incurred on or prior to the Acquisition Closing Date in connection with the Acquisition and the financing thereof $0 $0 $0 $0 $0 (v) Any cash restructuring charges and integration costs in connection with the Acquisition, in an aggregate amount not to exceed $75,000,000 $0 $0 $0 $0 $0 (vi) Non-cash restructuring charges incurred in connection with the Transaction, all as approved by Arrangers $1,084 $1,006 $930 $848 $779 (vii) Other non-recurring expenses reducing such Consolidated Net Income which do not represent a cash item in such period or any future period (in each case of or by the Borrower and its Subsidiaries for such Measurement Period) ($47) $0 $574 $175 $1,735 (viii) Any non-cash charges for stock compensation expense in compliance with FAS 123R and amortization of the fair value of unvested options under the Acquired Business’ employee stock option plan assumed by the Borrower $30,146 $24,682 $25,275 $19,906 $22,530 (ix) Legal fees and expenses relating to the Borrower’s indemnification obligations for the benefit of its former officers and directors in connection with its historical stock option litigation 724 376 $22 $15 $0 minus (i) Federal, state, local and foreign income tax credits ($840) ($15,096) $0 $5,717 $611 (ii) All non-cash items increasing Consolidated Net Income (in each case of or by the Borrower and its Subsidiaries for such Measurement Period) ($3,127) ($4,026) ($2,212) $1,995 $1,992 Consolidated EBITDA $116,442 $101,457 $127,727 $114,479 $122,511 4 Quarter Trailing Consolidated EBITDA $520,429 $502,567 $500,309 $460,105 $466,174 Consolidated Senior Secured Debt $1,015,957 $989,803 $959,491 $919,312 $859,983 Consolidated Senior Secured Leverage Ratio (x) 1.95 1.97 1.92 2.00 1.84 5/19/2011 © 2011 Brocade Communications Systems, Inc. Page 40 |
![]() Brocade Q2 FY 2011 Earnings Q2 2011 Cash and Debt Covenant Adjusted EBITDA* Performance (In Millions) Reducing Debt Position (In Millions) Within Debt Covenant Increasing Cash Balance** (In Millions) * Adjusted EBITDA is as defined in the term debt credit agreement ** Cash, equivalents and short term investments 5/19/2011 © 2011 Brocade Communications Systems, Inc. Page 41 |
![]() Brocade Q2 FY 2011 Earnings Domestic and International Reported Revenue Reported revenue on a ship-to basis 5/19/2011 © 2011 Brocade Communications Systems, Inc. Page 42 |
![]() Brocade Q2 FY 2011 Earnings Segment Revenue Detail Product segment as a percent of revenue * Reallocation of SAN common hardware altered historic SAN percentages Q2 10 Q3 10 Q4 10 Q1 11 Q2 11 SAN Business * Directors 40% 37% 39% 44% 42% Switches 46% 49% 46% 41% 43% Server 14% 14% 15% 15% 15% Ethernet Business Chassis 64% 65% 63% 58% 57% Stackables 36% 35% 37% 42% 43% 5/19/2011 © 2011 Brocade Communications Systems, Inc. Page 43 |
![]() Brocade Q2 FY 2011 Earnings Thank You www.brcd.com 5/19/2011 © 2011 Brocade Communications Systems, Inc. Page 44 |