UNITED STATES SECURITIES AND EXCHANGE COMMISSION
Washington, D.C. 20549
FORM 10-K
(Mark One)
| x | ANNUAL REPORT PURSUANT TO SECTION 13 OR 15(d) OF THE SECURITIES EXCHANGE ACT OF 1934 |
For the fiscal year ended October 29, 2011
OR
| ¨ | TRANSITION REPORT PURSUANT TO SECTION 13 OR 15(d) OF THE SECURITIES EXCHANGE ACT OF 1934 |
For the transition period from to
Commission file number: 000-25601
Brocade Communications Systems, Inc.
(Exact name of registrant as specified in its charter)
| | |
| Delaware | | 77-0409517 |
(State or other jurisdiction of
incorporation or organization) | | (I.R.S. Employer
Identification No.) |
130 Holger Way
San Jose, CA 95134
(408) 333-8000
(Address, including zip code, of registrant’s principal executive offices and telephone number, including area code)
Securities registered pursuant to Section 12(b) of the Act:
| | |
Title of each class | | Name of each exchange on which registered |
Common stock, $0.001 par value | | The NASDAQ Stock Market LLC |
Securities registered pursuant to Section 12(g) of the Act:
None
Indicate by check mark if the registrant is a well-known seasoned issuer, as defined in Rule 405 of the Securities Act. Yes x No ¨
Indicate by check mark if the registrant is not required to file reports pursuant to Section 13 or Section 15(d) of the Act. Yes ¨ No x
Indicate by check mark whether the registrant (1) has filed all reports required to be filed by Section 13 or 15(d) of the Securities Exchange Act of 1934 during the preceding 12 months (or for such shorter period that the registrant was required to file such reports), and (2) has been subject to such filing requirements for the past 90 days. Yes x No ¨
Indicate by check mark whether the registrant has submitted electronically and posted on its corporate Web site, if any, every Interactive Data File required to be submitted and posted pursuant to Rule 405 of Regulation S-T (§232.405 of this chapter) during the preceding 12 months (or for such shorter period that the registrant was required to submit and post such files). Yes x No ¨
Indicate by check mark if disclosure of delinquent filers pursuant to Item 405 of Regulation S-K (§229.405 of this chapter) is not contained herein, and will not be contained, to the best of registrant’s knowledge, in definitive proxy or information statements incorporated by reference in Part III of this Form 10-K or any amendment to this Form 10-K. x
Indicate by check mark whether the registrant is a large accelerated filer, an accelerated filer, a non-accelerated filer, or a smaller reporting company. See the definitions of “large accelerated filer,” “accelerated filer” and “smaller reporting company” in Rule 12b-2 of the Exchange Act.
| | | | | | |
| Large accelerated filer x | | Accelerated filer ¨ | | Non-accelerated filer ¨ | | Smaller reporting company ¨ |
| | (Do not check if a smaller reporting company) |
Indicate by check mark whether the registrant is a shell company (as defined in Rule 12b-2 of the Exchange Act). Yes ¨ No x
The aggregate market value of the voting and non-voting common equity held by non-affiliates of the registrant, based upon the closing price of a share of the registrant’s common stock on April 29, 2011 as reported by the NASDAQ Global Select Market on that date, was approximately $2,970,054,519. This calculation does not reflect a determination that certain persons are affiliates of the registrant for any other purpose.
The number of shares outstanding of the registrant’s common stock as of December 9, 2011 was 455,071,968 shares.
DOCUMENTS INCORPORATED BY REFERENCE
Portions of the registrant’s Proxy Statement for its 2012 Annual Meeting of Stockholders (the “Proxy Statement”), to be filed with the Securities and Exchange Commission, are incorporated by reference into Part III of this Annual Report on Form 10-K where indicated.
BROCADE COMMUNICATIONS SYSTEMS, INC.
FORM 10-K
For the Fiscal Year Ended October 29, 2011
INDEX
Forward-Looking Statements
This Annual Report on Form 10-K contains forward-looking statements regarding future events and future results. All statements other than statements of historical fact are statements that could be deemed forward-looking statements, including, but not limited to, statements regarding future revenue, margins, expenses, tax provisions, earnings, cash flows, benefit obligations, debt repayments, share repurchases or other financial items; any statements of the plans, strategies and objectives of management for future operations; any statements concerning expected development, performance or market share relating to products or services; any statements regarding future economic conditions or performance; any statements regarding pending litigation, including claims or disputes; any statements of expectation or belief; and any statements of assumptions underlying any of the foregoing. Words such as “expects,” “anticipates,” “assumes,” “targets,” “goals,” “projects,” “intends,” “plans,” “believes,” “seeks,” “estimates,” “continues,” “may,” variations of such words and similar expressions are intended to identify such forward-looking statements. These statements are based on current expectations, estimates, forecasts and projections about the industries in which Brocade operates, and the beliefs and assumptions of management. Readers are cautioned that these forward-looking statements are only predictions and are subject to risks, uncertainties and assumptions that are difficult to predict, including those identified below, under “Part I—Item 1A. Risk Factors” and elsewhere herein. Therefore, actual results may differ materially and adversely from those expressed in any forward-looking statements. Further, Brocade undertakes no obligation to revise or update any forward-looking statements for any reason.
3
PART I
General
Brocade Communications Systems, Inc. (“Brocade” or the “Company”) is a leading supplier of networking equipment, including Internet Protocol (“IP”) based Ethernet networking solutions and storage area networking solutions for businesses and organizations of many types and sizes, including global enterprises, and service providers such as telecommunication firms, cable operators and mobile carriers. Brocade offers a comprehensive line of high-performance networking hardware and software products and services that enable businesses and organizations to make their networks and data centers more efficient, reliable and adaptable. Brocade’s products, services and solutions simplify information technology (“IT”) infrastructure, increase resource utilization, ensure availability of mission critical applications, and support key IT services including Internet connectivity, enterprise mobility, virtualization, and cloud computing.
Brocade products and services are marketed, sold and supported worldwide to end-user customers through distribution partners, including original equipment manufacturers (“OEMs”), distributors, systems integrators, value-added resellers (“VARs”) and directly to end-users by the Brocade sales force.
For revenue and other information regarding Brocade’s operating segments, see Note 16 “Segment Information,” of the Notes to Consolidated Financial Statements in Part II, Item 8 of this Form 10-K , which is incorporated herein by reference.
Products and Services
Data Storage Products
Brocade’s storage networking products and services are designed to help customers reduce the cost and complexity of managing business information within a shared data storage environment, while enabling high levels of availability of mission critical business applications. In addition, Brocade’s products and services assist customers in the development and delivery of storage and server consolidation, disaster recovery and data security, and in meeting compliance issues regarding data management. Customers use Brocade’s products to build storage area networks (“SAN”s), which we refer to as “Storage fabrics.” Brocade’s products are generally used in conjunction with servers and storage subsystems, SAN interconnection components such as host bus adapters (“HBAs”), and server and storage management software applications and tools. By utilizing shared storage, or networked storage solution, enterprises of all types and sizes can more easily share and consolidate server and storage resources, centralize and simplify data management, scale and provision storage resources more effectively, and improve application efficiency, performance and availability. As a result, these enterprises are able to better utilize IT assets, improve productivity of IT personnel, reduce capital and operational expenditures, and more reliably and securely store, manage and administer business information.
Brocade’s family of Fibre Channel (“FC”) SAN backbones, directors, fabric and embedded switches provide interconnections, bandwidth and high-speed routing of data between servers and storage devices. Product models range from entry-level 8-port fabric switches to 896-port directors with multiple options, addressing the needs of small departments and global enterprises alike. These high-performance solutions are available to support requirements both for open systems and mainframe operations. Switches and directors support key applications such as data backup, remote mirroring and high-availability clustering, as well as high-volume transaction processing applications such as enterprise resource planning and data warehousing. Brocade’s storage networking products have been designed to meet the storage networking needs of end-users in environments ranging from small and medium-sized businesses to large enterprises with storage network fabrics that scale to thousands of ports, spread across multiple locations around the world. Brocade’s storage networking products also include HBAs, which connect host computers to a FC network.
4
Brocade offers a variety of fabric extension, switching and routing solutions that are designed to connect two or more data centers over long distances to enhance business continuity and disaster recovery. Brocade’s fabric extension solutions support SAN extension (Fibre Channel), mainframe extension (Fibre Connectivity), as well as other multiprotocol switching and routing technologies including optical, asynchronous transfer mode, and IP networks. Through its Brocade Network Advisor software, Brocade offers end-to-end management across multiple fabrics with high levels of scalability and performance designed to maximize data availability even over extended distances.
To enable industry-leading encryption-based security, Brocade offers high-speed, highly reliable hardware in both modular and fixed-switch form factors that provides fabric-based encryption and compression services. Brocade works with industry-leading security solution vendors to offer customers a wide choice of enterprise-class key management systems options. These solutions provide high-performance disk encryption processing power to meet the needs of the most demanding enterprise environments with flexible, on-demand performance.
Brocade recently made available the next generation of FC industry standard products, which offer 16 gigabits per second (“Gbps”) performance. Brocade’s commitment to 16 Gbps FC builds upon its market leadership in FC storage networking solutions, which includes the flagship Brocade DCX(R) Backbone family along with SAN directors, switches and HBAs. Brocade has also led the industry through every FC technology cycle, including the evolution from 1, 2, 4, 8 and now 16 Gbps technologies.
Brocade also offers various data center networking products, including fixed port switches, fabric switches such as the Brocade VDX, and blades for its SAN backbones, that support other emerging protocols such as Fibre Channel over Ethernet (“FCoE”) and Data Center Bridging (“DCB”). Brocade is one of the pioneers of these technologies and has been instrumental in driving the protocol toward standardization.
Ethernet Products—Ethernet Switching & Internet Protocol Routing
Brocade’s enterprise-class Layer 2 and Layer 3 switches and routers are designed to connect users in an enterprise network, enabling network connectivity such as access to the Internet, network-based communications such as voice over IP (“VOIP”), and higher levels of collaboration through unified messaging applications and greater degrees of productivity through mobility. Brocade offers a variety of platforms to allow customers to design a network to meet their needs, including the Brocade BigIron, FastIron, EdgeIron and TurboIron product families. Brocade’s Layer 2 and Layer 3 switches provide cost-effective delivery of the intelligence, speed and manageability required to support the increasing use of bandwidth-intensive and Internet-based applications.
Brocade has begun offering new Layer 2 products as “Ethernet fabric” solutions that provide new levels of network automation, scalability, performance and operational simplicity that are essential in helping IT move to highly virtualized and cloud environments. Brocade delivers Ethernet fabric capabilities through its family of Brocade VDX Data Center Switches, which began shipping in early 2011. The Brocade VDX family of switches with Brocade Virtual Cluster Switching or VCS Fabric technology delivers enterprise agility through automated, zero-touch Virtual Machine (“VM”) discovery, configuration, and mobility. Brocade now offers three versions of the VDX switches, specifically the VDX 6710, 6720 and 6730 models that offer differing levels of performance, port density and functionality that customers may choose based on their needs.
Brocade’s NetIron MLX and CES/CER families of carrier-class switches and routers are designed to handle network traffic within and across service provider networks, including telecommunications providers, cable multiservice operators and mobile carriers. Brocade offers a full portfolio of Ethernet-optimized platforms designed for service provider environments including the data center, metro access, aggregation and high-capacity IP/Multiprotocol Label Switching core. Brocade also offers an industry-leading portfolio of Carrier Ethernet products from the metro edge into the network core. Brocade’s Metro and Internet routers are designed to deliver the capabilities, performance and scalability needed to provide efficient and reliable routing services to Internet data centers around the world.
5
Brocade is also focused on helping its global service provider customers fundamentally change their business and make them more profitable by enabling their networks to deliver new services and capabilities based on cloud computing. Cloud computing is transforming how service providers are able to deliver IT services to their customers. The Company believes it has taken a leadership position in delivering a variety of cloud-optimized networking solutions such as Ethernet fabrics, high-density 10 and 100 Gigabit Ethernet as well as a seamless migration strategy and solution from IPv4 to IPv6.
Ethernet Products—Application Delivery Products (“ADP”)
Brocade’s Layer 4 – 7 platforms, including the Brocade ServerIron and ServerIron ADX family of products, are designed for application traffic management and server load balancing, allowing customers to improve the performance of specific applications or improve the performance of a server farm. These high-performance data center traffic management systems with network intelligence capabilities allow enterprises and service providers to build reliable network infrastructures that efficiently manage the flow of traffic over extended distances, known as metro area networks and wide area networks.
In early 2011, Brocade introduced new software for its ServerIron ADX products that enables these platforms to act as a seamless gateway between existing IPv4 networks and new ones built on IPv6. According to networking experts and industry research firms, IPv4 has reached its scalability limits due to the exponential proliferation of networked devices such as smartphones, mobile tablets, laptops and smart sensors. This growth has resulted in the emergence of new IPv6-only devices requiring IT organizations to create new strategies to service these clients while limiting the disruption of large scale technology upgrades. With this new gateway functionality, the Company is able to provide its customers with a pragmatic path to adopt IPv6 technology and support both IPv4 and IPv6 environments simultaneously, offering them a seamless and non-disruptive migration strategy.
Global Services
Brocade offers a wide range of consulting and support services that assist customers in designing, implementing, deploying and managing advanced networking solutions, as well as post-contract customer support (“PCS”) and extended warranties. These services address a number of customer priorities that must be managed during the life cycle of a storage network or data center infrastructure and are meaningful to customers because we bring valuable experience and expertise to a customer challenge. Brocade’s services may be delivered directly to end-user customers or via partners as a component of a broader service and support offering.
On September 27, 2011, Brocade sold Strategic Business Systems, Inc. (“SBS”), a wholly-owned subsidiary that provided IT professional services for medium-size and large enterprises in both the commercial and federal government sectors. The sale of the SBS business now enables the Company’s Global Services organization to focus on the execution of strategic and core offerings such as support and service for the Company’s products as well as professional consulting.
Industry Initiatives and Standards Development
Brocade believes that, as the need for networking solutions continues to grow, enterprises will look to further simplify the tasks of storing, managing and administering their data, while also looking to maximize their IT investments and reduce both capital and operational expenditures. Brocade also believes enterprises will continue to expand the size and scope of their networks and the number and types of applications that these networks support.
Brocade believes that the future evolution of networking and data center management markets will be led by the providers of products and services that simplify the management of heterogeneous server and storage environments and maximize end-users’ IT investments on an ongoing basis. Brocade also believes that
6
networking and data center infrastructure solutions will evolve to provide increased capabilities that enable new types of data management applications that simplify the management of data, increase operational efficiencies and reduce operating expense. As a result, many of Brocade’s initiatives and investments are aimed at expanding the capabilities enabled by networks, increasing end-to-end interoperability, protecting end-user investments in existing and new IT resources, and making it easier for Brocade and its partners to deliver solutions that provide efficiencies in managing large, complex and growing enterprise data center environments.
Brocade works with industry-leading organizations to facilitate the development of standards, technologies, products and services that focus on the simplification of data center infrastructure management and the implementation and management of data networking environments. Brocade has a partner-centric approach to building solutions and works with nearly every leading provider of server, storage and storage network management applications and technologies.
Brocade has a long history of being a major contributor to the evolution of industry standards ranging from Fibre Channel communication technology to storage network interoperability to storage and storage network management. Brocade contributes to related industry standards committees and has authored or co-authored the majority of the Fibre Channel protocol standards in existence today. As Brocade continues to expand its leadership presence in new technologies, Brocade’s participation in associated standards groups continues to grow. In fiscal year 2011, Brocade was a member of the Ethernet Alliance, Metro Ethernet Forum, Open Networking Foundation, IETF, IEEE, FCIA Board, SNIA Technical Council, DMTF Technical Council and Fibre Channel-related industry associations and standards bodies. Brocade also currently chairs the INCITS T11 Committee, the lead governing body for all Fibre Channel-related standards, which includes FCoE. In October 2011, the Ethernet Alliance named a Brocade senior technologist as its new president through February 2012.
Education and Technical Certification Services
Brocade’s education and training organization delivers technical education and training to its partners and their customers on Brocade technology that encompasses design, implementation and management solutions. This education and training curriculum is delivered worldwide using diverse methodologies, which include instructor-led classes and an online web-based training portfolio as well as a “live” virtual classroom capability. Brocade Education Services trained approximately 27,000 IT professionals in fiscal year 2011. The Brocade University offers certification on Brocade solutions for IT professionals who have completed certain tests administered by an independent testing organization. The certification program is designed to measure the knowledge and proficiency of IT professionals in Brocade data center and data management solutions and technologies, and to help ensure that Brocade’s customers receive superior customer service and support. Approximately 28,000 certification tests have been delivered and 12,500 IT professionals have received Brocade credentials since inception of the program. Brocade’s education and training services are made available through its own education facilities and through its worldwide training provider network.
Distribution Channels
Brocade’s products and services are marketed, sold and supported worldwide to end-user customers through distribution partners, including OEMs, distributors, systems integrators, VARs, and directly to end-users by the Brocade sales force.
| | • | | Brocade’s OEM partners are leading server, storage and systems providers who offer Brocade’s products under their own private label or as Brocade-branded solutions. Sales of these products through OEM partners comprise the majority of Brocade’s business. |
| | • | | Other distribution partners include a global network of authorized distributors, systems integrators and VARs. Brocade authorizes these partners to market, sell and support its products and services. Some of these partners also sell training and other value-added services. |
7
Brocade has OEM or distribution agreements with most of the major companies that sell enterprise servers and storage systems. In addition, Brocade employs a worldwide sales force to assist its distribution partners in marketing Brocade solutions, assessing customer requirements and designing, implementing and maintaining Brocade-based solutions.
Customers
For the fiscal years ended October 29, 2011, October 30, 2010 and October 31, 2009, EMC Corporation (“EMC”), Hewlett-Packard Company (“HP”) and International Business Machines Corporation (“IBM”), Brocade’s largest OEM customers, each represented greater than 10% of Brocade’s total net revenues for combined totals of 43% (EMC with 15%, HP with 13% and IBM with 15%), 47% (EMC with 16%, HP with 14% and IBM with 17%) and 48% (EMC with 18%, HP with 13% and IBM with 17%) of its total net revenues, respectively. The level of sales to any OEM customer may vary from quarter to quarter. Brocade expects that it will continue to expand its routes-to-market including through distributors, direct to end-users, global systems integrators and VARs in addition to its OEM channel.
In the Ethernet market, Brocade cultivates business through its distributors in a number of key customer markets such as the service provider, U.S. government and enterprise segments. Customers in these market segments represented a significant part of Brocade’s Ethernet business. Brocade’s strategy to expand its sales of Ethernet products includes leveraging current investments in direct sales, two-tier distribution and channel partnerships, and international markets as well as selling into existing customer accounts in which it has a significant SAN presence, including Global 1000 companies and other targeted end users.
Geographic Information
For the year ended October 29, 2011, domestic and international revenues were approximately 61% and 39% of total net revenues, respectively. For the year ended October 30, 2010, domestic and international revenues were approximately 64% and 36% of total net revenues, respectively. For the year ended October 31, 2009, domestic and international revenues were approximately 65% and 35% of total net revenues, respectively. International revenues primarily consist of sales to customers in Western Europe, the greater Asia Pacific region and Japan. For the year ended October 29, 2011, international revenues increased as a percentage of total net revenues compared to the prior year primarily due to growth in Japan and the Asia Pacific region. For the year ended October 30, 2010, international revenues increased as a percentage of total net revenues compared to the prior year primarily due to growth in the Asia Pacific region.
Revenues are attributed to geographic areas based on where Brocade’s products are shipped. However, certain OEM customers take possession of Brocade’s products domestically and then distribute these products to their international customers. Because Brocade accounts for all of those OEM revenues as domestic revenues, Brocade cannot be certain of the extent to which its domestic and international revenue mix is impacted by the practices of its OEM customers. Nevertheless, data provided by OEM customers indicate that international customers may account for a higher percentage of end-user demand than that indicated by Brocade’s mix of domestic and international revenues.
The majority of Brocade’s assets as of October 29, 2011 were attributable to its United States operations. For additional geographic information on Brocade’s revenues and long lived assets, see Note 16 “Segment Information,” of the Notes to Consolidated Financial Statements in Part II, Item 8 of this From 10-K, which is incorporated herein by reference. Also, for a discussion of the risks attendant to Brocade’s international operations, see Part I, Item 1A. Risk Factors of this Form 10-K, which is incorporated herein by reference.
Acquisitions and Investments
Brocade’s acquisition and investment strategy is focused on facilitating the evolution and expansion of shared storage, data management and Ethernet networking.
8
On December 18, 2008, Brocade completed its acquisition of Foundry Networks, Inc. (“Foundry”), a performance and total solutions leader for Ethernet network switching and routing. This acquisition positioned Brocade as a leading supplier of end-to-end networking solutions that help enterprises and service providers connect and manage their information.
From time to time, Brocade has made equity investments in companies that develop technology or provide services that are complementary to or broaden the markets for its products or services and further its business objectives.
Research and Development
The industry in which Brocade competes is subject to rapid technological developments, evolving industry standards, changes in customer requirements, new product introductions and consolidation. As a result, Brocade’s success depends, in part, on its ability to continue to enhance its existing solutions and to develop and introduce new solutions that improve performance and reduce the total cost of ownership in the storage environment. Brocade has invested significantly in product research and development. Brocade continues to enhance and extend its products and increase the speed, performance and port-density of its switching platform. Brocade also continues to expand the value-added services of its intelligent platform to further simplify storage management and to enable more functionality for end-user customers, OEM partners and application partners.
Brocade products are designed to support current industry standards and may continue to support emerging standards that are consistent with its product strategy. Brocade products have been designed around a common platform architecture which facilitates the product design, development and testing cycle, and reduces the time to market for new products and features. Brocade intends to continue to leverage this common architecture to develop and introduce additional hardware and software products and enhancements in the future.
Brocade’s product development process includes the certification of certain of its products by its OEM partners. During this process, Brocade supports its OEM partners in the testing of its new products to ensure they meet quality, functionality and inoperability requirements. The process is completed once the OEM partner has certified the product and announced general availability of that product to their customers.
For the years ended October 29, 2011, October 30, 2010 and October 31, 2009, Brocade’s research and development expenses totaled $354.4 million, $354.3 million and $354.8 million, respectively. All expenditures for research and development costs have been expensed as incurred. In fiscal year 2012, Brocade expects to maintain or increase its level of investment, in absolute dollars, in research and development.
Competition
The market for networking solutions is intensely competitive. In particular, Cisco Systems, Inc. (“Cisco”) maintains a large position in the Ethernet and SAN markets and a number of its products compete directly with Brocade’s products. Brocade also competes with other companies, such as Alcatel-Lucent, Arista Networks, Avaya Inc., Enterasys Networks, Inc., Extreme Networks, Inc., F5 Networks, Inc., Dell/Force10 Networks, Inc., HP, Huawei Technologies Co. Ltd., IBM and Juniper Networks, Inc. (“Juniper”). Some of Brocade’s current and potential competitors have greater market leverage, longer operating histories, greater financial, technical, sales, marketing and other resources, more name recognition and larger installed customer bases.
In addition, Brocade faces significant competition from providers of storage networking products for interconnecting servers and storage. These principal competitors include Cisco and QLogic Corporation (“QLogic”). Brocade also faces competitors in other markets in which we participate, such as Cisco, F5 Networks, Inc. and A10 Networks, Inc. in the application delivery market and QLogic and Emulex Corporation in the HBA/CNA markets. In addition, EMC, one of Brocade’s top OEM customers in terms of Fibre Channel sales and a go-to-market and technology partner since 1997, has formed a separate venture with Cisco and VMware called the “Virtual Computing Environment” (VCE) that enables the new company to sell packaged “cloud computing” and data center virtualization solutions.
9
New competitors are likely to emerge from the existing Ethernet networking companies in the market as the FCoE standard becomes finalized and additional products come to market. These competitors are likely to use emerging technologies and various routes-to-market to compete with Brocade. In addition, Brocade’s OEM partners, who also have relationships with some of Brocade’s current competitors, could become new competitors by developing, acquiring or introducing products that compete with Brocade’s product offerings, by choosing to sell its competitors’ products instead of Brocade’s products, or by offering preferred pricing or promotions on competitors’ products. Competitive pressure will also likely intensify as technology trends may impact long-standing alliances, partnerships and go-to-market routes.
In addition, as the networking solutions market evolves, additional technologies may become available for interconnecting servers and storage. To the extent that products based upon these technologies provide the ability to connect network servers and storage and support high-performance storage applications, they are likely to compete with Brocade’s current and future products. Competitive technologies include, but are not limited to, emerging Ethernet products, InfiniBand and Internet Small Computer System Interface (“iSCSI”) protocols, as well as other storage solutions such as Network Attached Storage and Direct Attached Storage. In addition, networking companies, manufacturers of networking equipment, and other companies may develop competitive products and technologies. Brocade’s OEM partners or other partners could also develop and introduce products that compete with Brocade’s product offerings. Brocade believes the competitive factors in this market include product performance and features, product reliability, price, size, extent of installed base, ability to meet delivery schedules, customer service, technical support and distribution channels.
Manufacturing
Brocade has manufacturing arrangements with Hon Hai Precision Industry Co., Ltd. (“Foxconn”), Sanmina-SCI Corporation (“Sanmina”), Asteel Flash Group (“Flash”), Accton Wireless Broadband Corporation (“Accton”), Motorola, Inc. (“Motorola”) and Quanta Computer Incorporated (“Quanta”) (collectively the contract manufacturers or “CMs”) under which Brocade provides product forecasts and places purchase orders in advance of the scheduled delivery of products to Brocade’s customers. The required lead time for placing orders with the CMs depends on the specific product. The CMs invoice Brocade based on prices and payment terms mutually agreed upon and set forth in purchase orders Brocade issues to them. Although the purchase orders Brocade places with its CMs are cancelable, the terms of the agreements require Brocade to purchase all inventory materials not returnable, usable by, or sold to other customers of the CMs. In addition, Flextronics International Ltd. (“Flextronics”) is Brocade’s service repair operations provider.
Brocade uses the CMs for final turnkey product assembly; however, Brocade also maintains key component selection and qualification expertise internally. Brocade designs and develops the key components of its products, including application-specific integrated circuits (“ASICs”), operating system and other software, as well as certain details in the fabrication and enclosure of its products. In addition, Brocade determines the components that are incorporated into its products and selects appropriate suppliers of those components.
Although Brocade uses standard parts and components for its products where possible, Brocade’s CMs currently purchase, on Brocade’s behalf, several key components used in the manufacture of its products from single or limited supplier sources. Brocade’s principal single source components include ASICs, built by third-parties based on Brocade’s designs, and Brocade’s principal limited source components include memory, certain oscillators, microprocessors, certain connectors, certain logic chips, certain power supplies, enclosures, programmable logic devices, certain printed circuit boards, certain optical components, packet processors and switching fabrics. In addition, Brocade licenses certain software from third parties that is incorporated into its fabric operating system and other software. See Part I, Item 1A. Risk Factors of this Form 10-K, which is incorporated herein by reference.
10
Environmental Matters
Brocade is subject to various environmental and other regulations governing product safety, materials usage, packaging and other environmental impacts in the various countries where its products are sold. For example, many of Brocade’s products are subject to laws and regulations that restrict the use of lead, mercury, hexavalent chromium, cadmium and other substances, and require producers of electrical and electronic equipment to assume responsibility for collecting, treating, recycling and disposing of its products when they have reached the end of their useful life. In Europe, substance restrictions apply to products Brocade sells, and certain of Brocade’s OEM partners require compliance with these or more stringent requirements. Recycling, labeling, financing and related requirements also apply to products Brocade sells in Europe. China has also enacted legislation with similar requirements for Brocade’s products or its OEM partners for Brocade products sold in China. Brocade may be required to redesign its products to ensure that they comply with any new requirements as well as related requirements imposed by its OEM customers. Brocade also continues to work with its suppliers to ensure they provide Brocade with compliant materials, parts and components. Various other countries and states in the United States have issued, or are in the process of issuing, other environmental regulations that may impose additional restrictions or obligations and require further changes to Brocade’s products.
Patents, Intellectual Property and Licensing
Brocade relies on a combination of patent, copyright, trademark and trade secret laws, and contractual restrictions on disclosure to protect its intellectual property rights in these proprietary technologies. Despite these precautions, the measures Brocade undertakes may not prevent misappropriation or infringement of its proprietary technology. These measures also may not preclude competitors from independently developing products with functionality or features similar to our products.
Brocade maintains a program to identify and obtain patent protection for its selected inventions. As of December 9, 2011, Brocade has 376 patents in the United States and 13 patents in various foreign countries (based on certain U.S. patents or patent applications) that are currently in force and has approximately 325 patent applications pending in the United States and approximately 17 patent applications pending in various foreign countries (based on certain U.S. patents or patent applications). The normal expiration dates of Brocade’s issued patents in the United States range from 2011 to approximately 2029. Although Brocade has patent applications pending, there can be no assurance that patents will be issued from pending applications or that claims allowed on any future patents will be sufficiently broad to protect its technology.
Many of Brocade’s products are designed to include software or other intellectual property licensed from third parties. While it may be necessary in the future to seek or renew licenses relating to various aspects of its products, Brocade believes that such licenses generally could be obtained on commercially reasonable terms. However, failure to obtain such licenses on commercially reasonable terms could materially harm Brocade’s business. See Part I, Item 1A. Risk Factors of this Form 10-K, which is incorporated herein by reference.
From time to time, third parties have asserted patent, copyright and trade secret rights to technologies and standards that are important to Brocade. Third parties assert patent infringement claims against Brocade from time to time in the form of letters, lawsuits and other forms of communication. In addition, from time to time, Brocade receives notification from customers claiming that they are entitled to indemnification or other obligations from Brocade related to infringement claims made against them by third parties.
Seasonality
Historically, our first and fourth fiscal quarters are seasonally stronger quarters from a Data Storage revenue perspective than our second and third fiscal quarters. Historically, our fourth fiscal quarter for Ethernet revenue is our strongest while our first fiscal quarter is our weakest driven by the seasonality of our federal Ethernet business.
11
Backlog
Brocade’s business is characterized by short lead-time orders and fast delivery schedules. Sales of its products are generally made pursuant to contracts and purchase orders that are cancelable without significant penalties. These commitments are subject to price negotiations and to changes in quantities of products and delivery schedules in order to reflect changes in customers’ requirements and manufacturing availability. In addition, actual shipments depend on the manufacturing capacity of suppliers and the availability of products from such suppliers. As a result of the foregoing factors, Brocade does not believe that backlog at any given time is a meaningful indicator of its ability to achieve any particular level of overall revenue or financial performance.
Employees
As of October 29, 2011, Brocade had 4,546 employees. Brocade has not experienced any work stoppages and considers its relations with its employees to be good. Brocade’s employees are currently located in the United States headquarters in San Jose, California, as well as facilities in Broomfield, Colorado, Herndon, Virginia, Plymouth, Minnesota, Brocade’s European headquarters in Geneva, Switzerland, Brocade’s Asia Pacific headquarters in Singapore, and other offices throughout North America, Europe, Asia Pacific, Japan and Central and South America.
Other
Brocade was incorporated in California on August 24, 1995 and reincorporated in Delaware on May 14, 1999. Brocade’s mailing address and executive offices are located at 130 Holger Way, San Jose, California 95134. Brocade’s telephone number is (408) 333-8000.
Brocade’s corporate Web site is www.brocade.com. Brocade’s Annual Report on Form 10-K, Quarterly Reports on Form 10-Q, Current Reports on Form 8-K and amendments to those reports filed or furnished pursuant to Section 13(a) or 15(d) of the Securities Exchange Act of 1934, as amended, are available free of charge on Brocade’s Web site when such reports are available on the U.S. Securities and Exchange Commission (“SEC”) Web site. The public may read and copy any materials filed by Brocade with the SEC at the SEC’s Public Reference Room at 100 F Street, NE, Washington, D.C. 20549. The public may obtain information on the operation of the Public Reference Room by calling the SEC at 1-800-SEC-0330. The SEC maintains a Web site at www.sec.gov that contains reports, proxy and information statements, and other information regarding issuers that file electronically with the SEC. The content of any Web site referred to in this Form 10-K is not incorporated by reference into this filing. Further, Brocade’s references to the Uniform Resource Locators (“URLs”) for these Web sites are intended to be inactive textual references only.
Brocade, the B-wing symbol, DCX, Fabric OS, and SAN Health are registered trademarks, and Brocade Assurance, Brocade NET Health, Brocade One, CloudPlex, MLX, VCS, VDX, and When the Mission Is Critical, the Network Is Brocade are trademarks of Brocade Communications Systems, Inc., in the United States and/or in other countries. Other brands, products, or service names mentioned are or may be trademarks or service marks of their respective owners.
12
Uncertainty about or a slowdown in the domestic and global economies may increasingly adversely affect Brocade’s operating results and financial condition.
There is ongoing uncertainty about the domestic and global economies and there may be a prolonged period of significant slowdown. Such uncertainty or slowdown may result in lower growth in the networking industry and reduced demand for information technology, including high-performance data networking solutions. Information technology spending has historically declined as federal spending decreases and general economic and market conditions have worsened. If the domestic and/or global economy undergoes a prolonged period of uncertainty or a significant downturn, such as the debt crisis occurring in the Eurozone economy, or if Brocade’s customers believe such a period of uncertainty or a downturn will continue for a sustained period, they will likely reduce their information technology spending and future budgets. Brocade is particularly susceptible to reductions in information technology spending because the purchase of Brocade’s products is often discretionary and may involve a significant commitment of capital and other resources. Future delays or reductions in information technology spending, domestically and/or internationally, could harm Brocade’s business, results of operations and financial condition in a number of ways, including longer sales cycles, increased inventory provisions, increased production costs, lowered prices for products and reduced sales volumes. Similarly, as Brocade’s suppliers face challenges in obtaining credit or otherwise in operating their businesses, they may become unable to continue to offer the materials Brocade uses to manufacture its products. These events have caused, and may cause further, reductions in Brocade’s revenue, profitability and cash flows, increased price competition, increased operating costs and longer fulfillment cycles and exacerbate many other risks noted in this Form 10-K, which adversely affect Brocade’s business, results of operations and financial condition.
Given the current uncertainty about the extent and duration of the global financial recovery, it is increasingly difficult for Brocade, Brocade’s customers and Brocade’s suppliers to accurately forecast future product demand trends, which could cause Brocade to produce excess products that would increase Brocade’s inventory carrying costs and result in obsolete inventory. Alternatively, this forecasting difficulty could cause a shortage of products or materials used in Brocade’s products that would result in an inability to satisfy demand for Brocade’s products and a loss of market share.
A period of uncertainty or economic downturn may also significantly affect financing markets, the availability of capital and the terms and conditions of financing arrangements, including the overall cost of financing. Circumstances may arise in which Brocade needs, or desires, to raise additional capital. Such capital may not be available on commercially reasonable terms, or at all, which in turn could adversely affect Brocade’s financial condition.
Intense competition in the market for networking solutions could prevent Brocade from increasing or maintaining revenue, profitability and cash flows with respect to its networking solutions.
The networking market is increasingly competitive. While Cisco maintains a dominant position in the Ethernet networking market, other companies have strengthened their networking portfolios through acquisitions, including Dell’s acquisition of Force10 Networks, HP’s acquisition of 3Com, and IBM’s acquisition of Blade Network Technologies. These acquisitions will significantly limit Brocade’s ability to sell Ethernet products through these companies and may also indirectly impact the Fibre Channel business. HP, IBM and Dell are important OEM partners for Brocade in the Fibre Channel switching market, yet also are competitive with Brocade in other respects. Other competitors in the Ethernet networking market include Arista Networks, Alcatel- Lucent, Avaya Inc., A10 Networks, Inc., Enterasys Networks, Inc., Extreme Networks, Inc., F5 Networks, Inc., Huawei Technologies Co. Ltd., and Juniper Networks, Inc.
Brocade also competes with Cisco and QLogic Corporation in the Fibre Channel switching market and with QLogic and Emulex Corporation in the server connectivity or HBA market. In addition, EMC, one of Brocade’s
13
top OEM customers in terms of Fibre Channel sales and a go-to-market and technology partner since 1997, has formed a separate venture with Cisco and VMware called the VCE that enables the new company to sell packaged “cloud computing” and data center virtualization solutions.
The above-referenced acquisitions and business partnerships demonstrate the increasingly complex nature of relationships within the networking industry, especially as the IT industry migrates to cloud computing models. This trend has led the networking industry to introduce new solutions and technology architectures to support cloud computing. Brocade calls this category “Ethernet fabrics” and has introduced a new solution portfolio through the Brocade VDX 6720 Data Center Switch and the Brocade VCS software. Brocade’s competitors also recently introduced and have begun shipping new products focused on cloud computing and delivering alternative flat network solutions such as Juniper Networks with its QFabric architecture and Cisco with its Fabricpath. Other competition in cloud solutions include Arista Networks, Avaya Inc., Alcatel-Lucent and Dell/Force10 Networks who have all recently introduced roadmaps and solutions targeted at cloud computing users.
Some of Brocade’s competitors have greater market leverage, longer operating histories, greater financial, technical, sales, marketing and other resources, more name recognition and larger installed customer bases. Brocade’s competitors could also adopt more aggressive pricing policies than Brocade. Brocade believes that competition based on price may become more aggressive than it has traditionally experienced. As a result of these factors, Brocade’s competitors could devote more resources to develop, promote and sell their own products rather than Brocade’s, and, therefore, those competitors could respond more quickly to changes in customer or market requirements. Brocade’s failure to successfully compete in the market would harm Brocade’s business and financial results.
The prices of Brocade’s products have declined in the past and Brocade expects the prices of Brocade’s products to continue to decline, which could reduce Brocade’s revenues, gross margins and profitability.
The average selling price for Brocade’s products has typically declined in the past and will likely continue to decline in the future as a result of changes in competitive pricing pressure, broader macroeconomic factors, product mix, enhanced marketing programs, increased sales discounts, new product introductions by Brocade or Brocade’s competitors, the entrance of new competitors and other factors. Price declines may also increase as competitors ramp up product releases that compete with Brocade’s products. Furthermore, particularly as economic conditions deteriorate and drive a more cautious capital spending environment in the technology sector, Brocade and its competitors could pursue more aggressive pricing strategies in an effort to maintain or seek to increase sales levels. If Brocade is unable to offset the negative impact from the above factors on the average selling price of Brocade’s products by increasing the volume of products shipped or reducing product manufacturing costs, Brocade’s total revenues and gross margins will be negatively impacted.
In addition, to maintain Brocade’s gross margins, Brocade must maintain or increase the number of existing products shipped and develop and introduce new products and product enhancements with improved costs, and continue to reduce the overall manufacturing costs of Brocade’s products. While Brocade has successfully reduced the cost of manufacturing Brocade’s products in the past, Brocade may not be able to continue to reduce cost of production at historical rates. Moreover, most of Brocade’s expenses are fixed in the short-term or incurred in advance of receipt of corresponding revenue. As a result, Brocade may not be able to decrease its spending quickly enough or in sufficient amounts to offset any unexpected shortfall in revenues. If this occurs, Brocade could incur losses and Brocade’s operating results and gross margins could be below expectations. Additionally, Brocade’s gross margins may be negatively affected by fluctuations in manufacturing volumes, component costs, foreign currency exchange rates, the mix of product configurations sold and the mix of distribution channels through which its products are sold. In addition, if product or related warranty costs associated with Brocade’s products are greater than previously experienced, Brocade’s gross margins may also be adversely affected. Brocade has also announced its plans to increase gross margins for its Ethernet products by a combination of initiatives, including new product introductions with improved gross margins, normalized
14
pricing, inventory management and increased product volumes. If Brocade is not able to successfully execute on one or more of these on-going initiatives, gross margin improvements may not be realized.
The loss of any of Brocade’s major OEM customers, the failure to successfully grow a direct and channel model or any other significant failure to execute on Brocade’s overall sales strategy could significantly reduce Brocade’s revenues and negatively affect Brocade’s financial results.
Brocade’s SAN business depends on recurring purchases from a limited number of large OEM partners for a substantial portion of its revenues. As a result, these large OEM partners have a significant influence on Brocade’s quarterly and annual financial results. For fiscal years 2011, 2010 and 2009, the same three customers each represented 10% or more of Brocade’s total net revenues. Brocade’s agreements with its OEM partners are typically cancelable, non-exclusive, have no minimum purchase requirements and have no specific timing requirements for purchases. Brocade’s OEM partners could also elect to eliminate, reduce, or rebalance the amount they purchase from Brocade and/or increase the amount purchased from Brocade’s competitors or introduce their own technology. Changes to inventory levels at one or multiple partners can negatively impact Brocade’s revenue and earnings results and may mask underlying end-user demand. Also, one or more of Brocade’s OEM partners could elect to consolidate or enter into a strategic partnership with one of Brocade’s competitors, which could reduce or eliminate Brocade’s future revenue opportunities with that OEM partner. Brocade anticipates that a significant portion of its revenues and operating results from its SAN business will continue to depend on sales to a relatively small number of OEM partners. The loss of any one significant OEM partner, or a decrease in the level of sales to any one significant OEM partner, or unsuccessful quarterly negotiation on key terms, conditions or timing of purchase orders placed during a quarter, would likely cause serious harm to Brocade’s business and financial results.
Brocade’s OEM partners evaluate and qualify Brocade’s SAN products for a limited time period before they begin to market and sell them. Assisting Brocade’s OEM partners through the evaluation process requires significant sales, marketing and engineering management efforts on Brocade’s part, particularly if Brocade’s SAN products are being qualified with multiple distribution partners at the same time. In addition, once Brocade’s SAN products have been qualified, its customer agreements have no minimum purchase commitments. Brocade may not be able to effectively maintain or expand its distribution channels, manage distribution relationships successfully, or market its products through distribution partners.
Brocade offers its Ethernet products through a multipath distribution strategy, including through resellers, distributors and direct, and through OEMs that have historically offered Brocade SAN products. However, these new and expanded channels may not generate much, if any, Ethernet revenue opportunities for Brocade. This is further compounded by the fact that several major OEMs, including Dell, IBM and HP, have acquired companies who offer Ethernet products competitive to Brocade’s offerings. A loss of or significant reduction in revenue through one of Brocade’s paths to market would impact Brocade’s financial results.
Additionally, Brocade has focused substantial resources to emphasize the Ethernet networking market and grow revenues through a channels strategy. This focus towards the Ethernet networking market may negatively impact Brocade’s other businesses such as its Data Storage networking products because management’s attention and limited resources such as employees may be reallocated away from Brocade’s Data Storage products and towards Ethernet products. Brocade must continually anticipate and respond to the needs of its distribution partners and their customers, and ensure that its products integrate with their solutions. Brocade’s failure to successfully manage and grow its distribution relationships or the failure of its distribution partners to sell Brocade’s products could reduce Brocade’s revenues significantly. In addition, Brocade’s ability to respond to the needs of its distribution partners in the future may depend on third parties producing complementary products and applications for Brocade’s products. There can be no assurance that Brocade will be successful in expanding its go to market objectives. If Brocade fails to respond successfully to the needs of these distribution partners, its business and financial results could be harmed.
15
The loss or delay of continued orders from any of Brocade’s more significant customers, such as the U.S. government or individual agencies within the U.S. government such as the Department of Defense or Intelligence where Brocade’s revenue is highly concentrated, or companies within the financial services, education and health sectors, could also cause its revenue and profitability to suffer. For example, if Brocade is unable to offer qualified products to such government customers due to regulations and requirements with respect to country of origin designation, or if Brocade experiences governmental procurement delays due to the timing of approval of the federal budget, budget reductions that target specific agencies where Brocade’s revenue is concentrated, including reductions resulting from the recently failed efforts by the Congressional Super Committee, or other reasons, Brocade’s revenue and operating results could be negatively impacted. In addition, a change in the mix of Brocade’s customers, or a change in the mix of direct and indirect sales, could adversely affect its revenue and gross margins. Also, such governmental delays or budget reductions could negatively impact IT spending across the broader economy and therefore negatively impact Brocade’s revenue and operating results.
Brocade’s future revenue growth depends on its ability to introduce new products and services on a timely basis and achieve market acceptance of these new products and services.
Developing new offerings requires significant upfront investments that may not result in revenue for an extended period of time, if at all. Brocade must achieve widespread market acceptance of Brocade’s new product and service offerings on a timely basis in order to realize the benefits of Brocade’s investments. The market for networking solutions, however, is characterized by rapidly changing technology, accelerating product introduction cycles, changes in customer requirements and evolving industry standards. Brocade’s future success depends largely upon its ability to address the rapidly changing needs of its customers by developing and supplying high-quality, cost-effective products, product enhancements and services on a timely basis and by keeping pace with technological developments and emerging industry standards. This risk will likely become more pronounced as the networking markets become more competitive and as demand for new and improved technologies increases.
Examples of such technological developments include adoption of network attached storage and iSCSI in storage networks, which may displace existing solutions in actual customer implementations and may erode the total addressable market for Fibre Channel products. Brocade recently introduced its newest portfolio of Fibre Channel switching products that support the new 16 Gbps technology. The transition to this new Fibre Channel technology may be negatively impacted if customers accelerate their adoption of alternative storage networking technologies.
Brocade is also an early developer of, and the vendor who was first-to-market for, Ethernet fabrics based on the Brocade VDX 6720 and Brocade VCS software, which were built to provide the features necessary to support virtualization and private clouds. The success of Ethernet fabrics will depend on customers recognizing the need to upgrade their data center LANs to fabric-based architectures. Although Brocade plans to continue to invest in this area with new and enhanced Ethernet fabric solutions, Brocade’s future success would be negatively impacted if this technological transition does not occur at the anticipated rate or at all.
Other factors that may affect Brocade’s successful introduction of new product and service offerings include Brocade’s ability to:
| | • | | Properly determine the market for and define new products and services, which can be particularly challenging for initial product offerings in new markets; |
| | • | | Differentiate Brocade’s new products and services from its competitors’ technology and product offerings; |
| | • | | Address the complexities of interoperability of Brocade’s products with its installed base, OEM partners’ server and storage products and its competitors’ products; |
| | • | | Meet or exceed customer requirements for product features, cost-effectiveness, and scalability; and |
| | • | | Maintain high levels of product quality and reliability. |
16
Various factors impacting market acceptance are outside of Brocade’s control, including the following:
| | • | | The availability and price of competing products and alternative technologies; |
| | • | | The cost of certain product subcomponents, which could cause Brocade to modify prices to maintain adequate gross margins; |
| | • | | Product qualification requirements by Brocade’s OEM partners, which can cause delays in the market acceptance; |
| | • | | The timing of the adoption of new industry standards relative to Brocade’s development of new technologies and products; |
| | • | | The ability of its OEM partners to successfully distribute, support and provide training for its products; and |
| | • | | Customer acceptance of Brocade’s products, including its Ethernet solutions and in particular its Ethernet fabric solutions. |
If Brocade is not able to successfully develop and market new and enhanced products and services on a timely basis, its business and results of operations will likely be harmed.
As Brocade introduces new or enhanced products, Brocade must also successfully manage the transition from older products to minimize disruption in customers’ ordering patterns, avoid excessive levels of older product inventories and provide sufficient supplies of new products to meet customer demands. When Brocade introduces new or enhanced products, Brocade faces numerous risks relating to product transitions, including the inability to accurately forecast demand, manage excess and obsolete inventories, address new or higher product cost structures, and manage different sales and support requirements due to the type or complexity of the new products. In addition, any customer uncertainty regarding the timeline for rolling out new products or Brocade’s plans for future support of existing products may negatively impact customer purchase decisions.
If Brocade loses key talent or is unable to hire additional qualified talent, Brocade’s business may be harmed.
Brocade’s success depends, to a significant degree, upon the continued contributions of key management, engineering, sales and other talent, many of whom would be difficult to replace. Brocade believes its future success depends, in large part, upon Brocade’s ability to effectively attract highly skilled sales talent in addition to managerial, engineering and other talent, and on the ability of management to operate effectively, both individually and as a group, in geographically diverse locations. There is limited qualified talent in each applicable market and competition for such talent has become much more aggressive. Other companies in Brocade’s industry and geographic regions are recruiting from the same limited talent pool which creates further compression on the availability of qualified talent. In particular, Brocade operates in various locations with highly competitive labor markets including Bangalore, India and San Jose, California, as well as certain emerging labor markets, such as the Eastern European and Latin American markets. Brocade may experience difficulty in hiring qualified talent with skills in areas such as sales, ASICs, software, system and test, product management, marketing, service, customer support and key management.
In addition, future declines in Brocade’s stock price would reduce the value of equity awards granted to its employees. If such a decline in Brocade’s stock price were to occur, Brocade’s ability to incentivize, retain or attract qualified talent could be negatively impacted. Additionally, such declines in stock price may result in additional “underwater” stock options held by certain employees. Brocade’s ability to retain qualified talent may also be affected by future and recent acquisitions, which may cause uncertainty and loss of key talent. The loss of the services of any of Brocade’s key employees, the inability to attract or retain qualified talent in the future, or delays in hiring required talent, particularly sales and engineering talent, could delay the development and introduction of Brocade’s products or services, and negatively affect Brocade’s ability to sell its products or services.
17
In addition, companies in the computer storage, networking and server industries whose employees accept positions with competitors may claim that their competitors have engaged in unfair hiring practices or that there will be inappropriate disclosure of confidential or proprietary information. Brocade may be subject to such claims in the future as Brocade seeks to hire additional qualified talent. Such claims could result in litigation. As a result, Brocade could incur substantial costs in defending against these claims, regardless of their merits, and be subject to additional restrictions if any such litigation is resolved against Brocade.
The failure to accurately forecast demand for Brocade’s products or the failure to successfully manage the production of Brocade’s products could negatively affect Brocade’s product cost or Brocade’s ability to manufacture and sell Brocade’s products.
Brocade provides product forecasts to its contract manufacturers and places purchase orders with them in advance of the scheduled delivery of products to Brocade’s customers. In preparing sales and demand forecasts, Brocade relies largely on input from its sales force, partners, resellers and end-user customers. Therefore, if Brocade or its partners are unable to accurately forecast demand, or if Brocade fails to effectively communicate with its distribution partners about end-user demand or other time-sensitive information, the sales and demand forecasts may not reflect the most accurate, up-to-date information. If these forecasts are inaccurate, Brocade may be unable to obtain adequate manufacturing capacity from its contract manufacturers to meet customers’ delivery requirements or Brocade may accumulate excess inventories. Furthermore, Brocade may not be able to identify forecast discrepancies until late in its fiscal quarter. Consequently, Brocade may not be able to make timely adjustments to its business model. If Brocade is unable to obtain adequate manufacturing capacity from its contract manufacturers, or if Brocade is unable to make necessary adjustments to Brocade’s business model, revenue may be delayed or even lost to Brocade’s competitors and Brocade’s business and financial results may be harmed. If excess inventories accumulate, Brocade’s gross margins may be negatively impacted by write-downs for excess and/or obsolete inventory. In addition, Brocade may experience higher fixed costs as it expands its contract manufacturer capabilities, which could negatively affect Brocade’s ability to react quickly if demand suddenly decreases.
Brocade’s ability to accurately forecast demand also may become increasingly more difficult as Brocade introduces new or enhanced products, begins phasing out certain products, or acquires other companies or businesses. Forecasting demand for products that are nearing end of life or are being replaced by new versions, and decreasing production on these older products, while at the same time ramping up production on the new products, may be difficult. Brocade may be unable to obtain adequate supply of new product components and/or manufacturing capacity from its contract manufacturers to meet customers’ delivery requirements and such a situation may negatively impact revenues. Brocade may also accumulate excess inventories that may negatively impact gross margins due to write-downs for excess and/or obsolete inventory.
In addition, although the purchase orders placed with Brocade’s contract manufacturers are cancelable in certain circumstances, if Brocade cancels any of its CM purchase orders, Brocade could be required to purchase certain unused material of the CM if that material is not returnable, usable by, or sold to other customers. This purchase commitment exposure is particularly high in periods of new product introductions and product transitions. If Brocade is required to purchase unused material from Brocade’s contract manufacturers, Brocade could incur unanticipated expenses, including write-downs for excess and/or obsolete inventory, and Brocade’s business and financial results could be negatively affected. In the past, Brocade has experienced delays in shipments of its Ethernet products from its contract manufacturers and OEMs, which in turn delayed product shipments to its customers. Brocade may in the future experience similar delays or other problems, such as insufficient quantity of product, acquisition by a competitor or loss of business from one or more of its OEMs, any of which could harm Brocade’s business and operating results.
18
Brocade has a substantial amount of acquired intangible assets, goodwill and deferred tax assets on its balance sheet, and Brocade could be required to record impairment charges for these assets; Any impairment of the carrying value of those assets could adversely affect Brocade’s business and financial results.
Brocade has a substantial amount of acquired intangible assets, goodwill and deferred tax assets on its balance sheet. The goodwill and acquired intangibles relate to Brocade’s prior strategic acquisitions. In response to changes in industry and market conditions, Brocade may elect to realign its resources strategically and consider restructuring, selling, disposing of, or otherwise exiting businesses. Any decision to limit investment in, sell, dispose of or otherwise exit businesses may result in the recording of special charges, such as inventory and technology-related write-offs, goodwill impairment charges, intangible asset write-offs, workforce reduction costs, charges relating to consolidation of excess facilities, or claims from third parties who were resellers or users of discontinued products.
As a result of Brocade’s acquisition of Foundry in December 2008, Brocade reorganized into four operating segments, of which two are individually reportable segments: Data Storage Products and Global Services; and the two other operating segments, Ethernet Switching & IP Routing and ADP, combine to form a third reportable segment: Ethernet Products. Brocade’s determination of fair value of long-lived assets relies on management’s assumptions of future revenues, operating costs, and other relevant factors. If management’s estimates of future operating results change or if there are changes to other assumptions, such as the discount rate applied to future cash flows, the estimate of the fair value of Brocade’s reporting units could change significantly, which could result in goodwill impairment charges. Brocade’s estimates with respect to the useful life or ultimate recoverability of Brocade’s carrying basis of assets, including purchased intangible assets, could change as a result of such assessments and decisions. Brocade is required to perform goodwill impairment tests on an annual basis and between annual tests in certain circumstances, and future goodwill impairment tests may result in a charge to earnings. Brocade conducted its annual goodwill impairment test during the second fiscal quarter of 2011, and determined that no impairment needed to be recorded (see Note 4, “Goodwill and Intangible Assets,” of the Notes to Consolidated Financial Statements in Part II, Item 8 of this Form 10-K, and sensitivity analysis performed in Item 7. Management’s Discussion and Analysis of Financial Condition and Results of Operations in Part II, Item 7 of this Form 10-K). If future goodwill impairment tests result in a charge to earnings, Brocade’s financial results would be adversely affected.
Brocade has determined that more-likely-than-not it will realize its deferred tax assets based on positive evidence of its historical operations and projections of future income. Accordingly, the Company only applies a valuation allowance on the deferred tax assets relating to capital loss and investment loss carryforwards. In the event future income by jurisdiction is less than what is currently projected, Brocade may be required to apply a valuation allowance to these deferred tax assets in jurisdictions where realization of such assets are no longer more-likely-than-not (see Note 15, “Income Taxes,” of the Notes to Consolidated Financial Statements in Part II, Item 8 of this Form 10-K).
Brocade’s estimates relating to the liabilities for excess facilities are also affected by changes in real estate market conditions. In addition, Brocade has made investments in certain private companies which could become impaired if the operating results of those companies change adversely.
Brocade’s revenues and operating results and financial position may fluctuate in future periods due to a number of factors, which make predicting results of operations difficult and could adversely affect the trading price of Brocade’s stock.
Information technology spending is subject to cyclical and uneven fluctuations. It can be difficult to predict the degree to which the seasonality and uneven sales patterns of Brocade’s OEM partners or other customers will affect Brocade’s business in the future, particularly as Brocade releases new products. While Brocade’s first and fourth fiscal quarters have typically been seasonally stronger quarters than its second and third fiscal quarters, particularly for storage networking products, future buying patterns may differ from historical seasonality. In
19
addition, the Federal budget for government IT spending can be subject to delay, reductions and uncertainty from time to time due to political and legislative volatility, which can cause Brocade’s financial results to fluctuate unevenly and unpredictably.
Uneven sales patterns are not only difficult to predict, but also can result in irregular shipment patterns that can cause shortages or underutilized capacity, increase costs due to higher inventory levels, and otherwise adversely impact inventory planning. For example, Brocade’s Ethernet networking business has experienced significantly higher levels of sales towards the end of a period. Orders received towards the end of the period may not ship within the period due to Brocade’s manufacturing lead times. This exposes Brocade to additional inventory risk because Brocade must order products in anticipation of expected future orders and additional sales risk if Brocade is unable to fulfill unanticipated demand.
Brocade’s quarterly and annual revenues and operating results and financial position may vary significantly in the future due to the factors noted above as well as other factors, including but not limited to, the following:
| | • | | Receipt of a high number of customer orders towards the end of a fiscal quarter will increase reported receivables outstanding as a fraction of reported sales and result in higher days sales outstanding; |
| | • | | Disruptions, or a continued decline, in general economic conditions, particularly in the information technology industry and U.S. federal government budget cycles, especially those governmental departments such as the Department of Defense and Intelligence that are likely to be negatively impacted by budget reductions and where Brocade’s revenue is highly concentrated; |
| | • | | Announcements of pending or completed acquisitions or other strategic transactions by Brocade, its competitors or its partners; |
| | • | | Announcements, introductions and transitions of new products by Brocade, its competitors or its partners; |
| | • | | The timing of customer orders, product qualifications and product introductions of Brocade’s partners; |
| | • | | Long and complex sales cycles; |
| | • | | Internal supply and inventory management objectives of Brocade’s OEM partners and other customers; |
| | • | | Brocade’s ability to timely produce products that comply with new environmental restrictions or related requirements of its customers; |
| | • | | Brocade’s ability to obtain sufficient supplies of sole- or limited-sourced components, including ASICs, microprocessors, certain connectors, certain logic chips and programmable logic devices; |
| | • | | Availability of supply or increases in prices of components used in the manufacture of Brocade’s products; |
| | • | | Variations in the mix of Brocade’s products sold and the mix of distribution channels and geographies through which they are sold; |
| | • | | Pending or threatened litigation, including any settlements or judgments related to such litigation; |
| | • | | Stock-based compensation expense that is affected by Brocade’s stock price; |
| | • | | Examinations by government tax authorities that may have unfavorable outcomes and subject Brocade to additional tax liabilities; |
| | • | | New legislation and regulatory developments, including increases to tax rates or changes to treatment of an income or expense item; and |
| | • | | Other risk factors detailed in this section. |
Accordingly, Brocade’s quarterly and annual revenues and operating results may vary significantly in future. The results of any prior periods should not be relied upon as an indication of future performance. Brocade
20
cannot assure you that in some future quarter Brocade’s revenues or operating results will not be below Brocade’s projections or the expectations of stock market analysts or investors, which could cause Brocade’s stock price to decline.
Brocade has extensive international operations, which subjects it to additional business risks.
A significant portion of Brocade’s sales occur in international jurisdictions. In addition, Brocade’s contract manufacturers have significant operations in China. Brocade plans to continue to expand its international operations and sales activities. Brocade’s international sales of its Ethernet networking products have primarily depended on a variety of its resellers, including Avnet Technology Solutions and Computacenter AG & Co. OHG in Europe and Net One Systems in Japan. The failure by international resellers to sell Brocade’s products could limit its ability to sustain and grow revenue. Maintenance or expansion of international sales or international operations involves inherent risks that Brocade may not be able to control, including:
| | • | | Exposure to economic instability or fluctuations in international markets that could cause reductions in customer and public sector IT spending; |
| | • | | Exposure to inflationary risks in China and the continuing sovereign debt risk in Europe; |
| | • | | Reduced or limited protection of intellectual property rights, particularly in jurisdictions that have less developed intellectual property regimes such as China and India; |
| | • | | Managing research and development teams in geographically diverse locations, including teams divided between the United States and India; |
| | • | | Significant wage inflation in certain growing economies such as India; |
| | • | | Increased exposure to foreign currency exchange rate fluctuations, including the appreciation of foreign currencies such as the Chinese yuan or European Union’s euro; |
| | • | | Communicating effectively across multiple geographies, cultures and languages; |
| | • | | Recruiting sales and technical support personnel with the skills to design, manufacture, sell and support Brocade’s products in international markets; |
| | • | | Complying with governmental regulation of encryption technology and regulation of imports and exports, including obtaining required import or export approval for its products; |
| | • | | Increased complexity and costs of managing international operations; |
| | • | | Commercial laws and business practices that favor local competition; |
| | • | | Multiple, potentially conflicting, and changing governmental laws, regulations and practices, including differing export, import, tax, labor, anti-bribery and employment laws; |
| | • | | Longer sales cycles and manufacturing lead times; |
| | • | | Increased complexity and cost of providing customer support and maintenance for international customers; |
| | • | | Difficulties in collecting accounts receivable; and |
| | • | | Increased complexity of logistics and distribution arrangements. |
Failure to manage expansion effectively could seriously harm Brocade’s business, financial condition and prospects. In addition, international political instability may halt or hinder Brocade’s ability to do business and may increase Brocade’s costs. Various events, including the occurrence or threat of terrorist attacks, increased national security measures in the United States and other countries, and military action and armed conflicts, may suddenly increase international tensions. Such events may have an adverse effect on the world economy and could adversely affect Brocade’s business operations or the operations of Brocade’s OEM partners, end-user customers and channels, contract manufacturers and suppliers.
21
To date, no material amount of Brocade’s international revenues and cost of revenues have been denominated in foreign currencies. As a result, an increase in the value of the U.S. dollar relative to foreign currencies could make Brocade’s products more expensive and, thus, not competitively priced in foreign markets. Additionally, a decrease in the value of the U.S. dollar relative to foreign currencies could increase Brocade’s product and operating costs in foreign locations (e.g., appreciation of the European Union’s euro and Chinese yuan). In the future, a larger portion of Brocade’s international revenues may be denominated in foreign currencies, which will subject Brocade to additional risks associated with fluctuations in those foreign currencies. In addition, Brocade may be unable to successfully hedge against any such fluctuations.
Brocade is subject to, and may in the future be subject to other, intellectual property infringement claims and litigation that are costly to defend and/or settle, and that could result in significant damage and cost awards against Brocade and limit Brocade’s ability to use certain technologies in the future.
Brocade competes in markets that are frequently subject to claims and related litigation regarding patent and other intellectual property rights. From time to time, third parties have asserted patent, copyright, trade secret, and/or other intellectual property related claims against Brocade and/or employees of Brocade. These claims may be, and have been in the past, made against Brocade’s products and services, subcomponents of its products, methods performed by its products, or a combination of products, including third party products, methods used in its operations or uses of its products by its customers, or may concern Brocade’s hiring of a former employee of the third party claimant. Brocade and companies acquired by Brocade, such as Foundry, have in the past incurred, are currently incurring, and will in the future incur, substantial expenses to defend against such third-party claims. For instance, Brocade currently is defending patent-related lawsuits, including lawsuits filed by A10 Networks, Inc., Enterasys Networks, Inc. and Chrimar Systems, Inc. Brocade’s suppliers and customers also may be subject to third party intellectual property claims, which could negatively impact their ability to supply Brocade or their willingness to purchase from Brocade, respectively. In addition, Brocade may be subject to claims and indemnification obligations with respect to third-party intellectual property rights pursuant to Brocade agreements with suppliers, OEM and channel partners, or customers. The third party asserters of such intellectual property claims may be unreasonable in their demands, or may simply refuse to settle, which could lead to expensive settlement payments, prolonged periods of litigation expenses, additional burden on employees or other resources, distraction from Brocade’s business initiatives and operations, component supply stoppages and lost sales. In the event of an adverse determination, Brocade could incur substantial monetary liability and be prohibited from utilizing certain intellectual property or technology, hiring certain people, selling, shipping, importing or servicing certain products or incorporating necessary components into Brocade’s products. Suppliers of components or OEM systems to Brocade may be unwilling to, or not be able to, defend or indemnify Brocade against third-party assertions directed at, or based in part on, the components or systems they supply to Brocade, and may be unwilling to take licenses that would assure Brocade’s supply of such components or OEM systems. Suppliers subject to third party intellectual property claims also may choose to, or be forced by litigation to, discontinue or alter components or services supplied to Brocade, with little or no advance notice to Brocade. Customers may perceive such third-party intellectual property claims as risks, and may, as a result, be less willing to do business with Brocade. Such claims or litigation could also negatively impact Brocade’s recruiting efforts or ability to retain its employees. Any of the above scenarios could have a material adverse effect on Brocade’s financial position, results of operations, cash flows, and future business prospects.
Brocade’s intellectual property rights may be infringed or misappropriated by others, and Brocade may not be able to protect or enforce its intellectual property rights.
Brocade’s intellectual property rights may be infringed or misappropriated by others. In some cases, such infringement or misappropriation may be undetectable, or enforcement of Brocade’s rights may be impractical. From time to time, Brocade sends notice to third parties to assert its intellectual property rights and to request that those third parties take steps to address Brocade’s concerns. In addition, Brocade has filed, and may in the future file, lawsuits against third parties in an effort to enforce its intellectual property rights. For instance, in the
22
fourth quarter of fiscal year 2010, Brocade filed a patent infringement, copyright infringement, trade secret misappropriation and unfair competition lawsuit against A10 Networks, Inc. and certain individuals. Intellectual property litigation is expensive and unpredictable. There can be no assurance that Brocade will prevail in such assertions or enforcement efforts, either on the merits, or with respect to particular relief sought, such as damages or an injunction. Further, the opposing party may attempt to prove that the asserted intellectual property rights are invalid or unenforceable, and, if successful, may seek recompense for its attorney fees and costs. Further, the opposing party may counterclaim against Brocade, for example, for infringement of its own patents or other intellectual property rights, or may assert other tort or contract claims, which could lead to further expense and potential exposure for Brocade.
Brocade relies on a combination of patent, copyright, trademark and trade secret laws, and measures such as physical and operational security and contractual restrictions, to protect its intellectual property rights in its proprietary technologies, but none of these methods of protection may be entirely appropriate to address the particular risk or reliable, due to, for instance, employee hiring and turnover, geographic dispersion of employees, technology disclosures with suppliers, customers, and partners, unpredictable events, misappropriation or negligence, operations in various countries that do not have well-established or reliable enforcement institutions or customs, and other aspects of doing business on the scale of Brocade’s operations. The measures Brocade has taken to protect its intellectual property rights in its proprietary technologies may prove inadequate, which could result in a loss of intellectual property rights. Brocade attempts to identify its technological developments for assessment of whether to file patent applications, but there can be no assurance that all patentable technological developments will be captured in patent applications. Further, although Brocade has patent applications pending, there can be no assurance that patents will be issued from pending applications, or that claims allowed on any future patents will be sufficiently broad to protect its technology. Further, physical and operational security can be adversely affected, and associated policies and training rendered ineffective, by employee attitudes, carelessness or disregard for policies, malfeasors or changes in technology, such as the now-near-ubiquitous availability of portable memory devices. In addition, due to less developed intellectual property regimes in certain jurisdictions, Brocade may not be able to protect fully its intellectual property as Brocade expands its operations globally.
Brocade relies on licenses from third parties and the loss or inability to obtain any such license could harm its business.
Many of Brocade’s products are designed to include software or other intellectual property licensed from third parties. While it may be necessary in the future to seek or renew licenses relating to various aspects of its products, Brocade believes that, based upon past experience and standard industry practice, such licenses generally can be obtained on commercially reasonable terms. Nonetheless, there can be no assurance that the necessary licenses will be available on acceptable terms, if at all. Brocade’s inability to obtain certain licenses or other rights on favorable terms could have an adverse effect on Brocade’s business, operating results and financial condition, including its ability to continue to distribute or support effected products. In addition, if Brocade has failed or in the future fails to carefully manage the use of “open source” software in Brocade’s products, or if companies acquired by Brocade such as Foundry or McDATA failed in such regard, Brocade may be required to license key portions of Brocade’s products on a royalty-free basis or expose key parts of source code, or to commence costly product redesigns, which could result in a loss of intellectual property rights, product performance degradation or delay in shipping products to customers.
Brocade is dependent on sole source and limited source suppliers for certain key components, the loss of which may significantly impact results of operations.
Although Brocade uses standard parts and components for its products where possible, Brocade’s contract manufacturers currently purchase, on Brocade’s behalf, several key components used in the manufacture of its products from single or limited supplier sources. Brocade’s single source components include, but are not limited to, its application-specific integrated circuits (“ASICs”) and Brocade’s principal limited source components
23
include memory, certain oscillators, microprocessors, certain connectors, certain logic chips, power supplies, programmable logic devices, printed circuit boards, certain optical components, packet processors and switching fabrics. Brocade generally acquires these components through purchase orders and has no long-term commitments regarding supply or pricing with such suppliers. If Brocade is unable to obtain these and other components when required, or if Brocade experiences component defects, Brocade may not be able to deliver Brocade’s products to Brocade’s customers in a timely manner and may be required to repair or retro-fit products previously delivered to customers at significant expense to Brocade. In addition, a challenging economic or industry environment could cause some of these sole source or limited source suppliers to delay or halt production or to go out of business or be acquired by third parties, which could result in a disruption in Brocade’s supply chain. Brocade’s supply chain could also be disrupted in a variety of other circumstances that may impact its suppliers and partners, including adverse results from intellectual property litigation or natural disasters. As a result, Brocade’s business and financial results could be harmed.
In addition, the loss of any of Brocade’s major third-party contract manufacturers, or portions of their capacity, could significantly impact Brocade’s ability to produce its products for an indefinite period of time. Qualifying a new contract manufacturer and commencing volume production is typically a lengthy and expensive process. If Brocade is required to change any of its contract manufacturers or if any of its contract manufacturers experience delays, disruptions, capacity constraints, component parts shortages or quality control problems in its manufacturing operations, shipment of Brocade’s products to Brocade’s customers could be delayed and result in loss of revenues and Brocade’s competitive position and relationship with customers could be harmed.
Undetected software or hardware errors could increase Brocade’s costs, reduce Brocade’s revenues and delay market acceptance of Brocade’s products.
Networking products frequently contain undetected software or hardware errors, or bugs, when first introduced or as new versions are released. Brocade’s products are becoming increasingly complex and particularly, as Brocade continues to expand its product portfolio to include software-centric products, including software licensed from third parties, errors may be found from time to time in Brocade’s products. In addition, through its acquisitions, Brocade has assumed, and may in the future assume, products previously developed by an acquired company that have not been through the same level of product development, testing and quality control processes used by Brocade, and may have known or undetected errors. Some types of errors also may not be detected until the product is installed in a heavy production or user environment. In addition, Brocade’s products are often combined with other products, including software, from other vendors, and these products often need to interface with existing networks, each of which have different specifications and utilize multiple protocol standards and products from other vendors. As a result, when problems occur, it may be difficult to identify the source of the problem. These problems may cause Brocade to incur significant warranty and repair costs, may divert the attention of engineering personnel from product development efforts, and may cause significant customer relations problems such as reputational problems with customers. Moreover, the occurrence of hardware and software errors, whether caused by another vendor’s storage, data management or Ethernet products or Brocade’s, could delay market acceptance of Brocade’s new products.
Brocade may not realize the anticipated benefits of past or future acquisitions, divestitures and strategic investments, and integration of acquired companies or technologies or divestiture of businesses may negatively impact Brocade’s overall business.
Brocade has in the past acquired, or made strategic investments in, other companies, products or technologies, and Brocade expects to make additional acquisitions and strategic investments in the future. One example was Brocade’s acquisition of Foundry in December 2008. Brocade may not realize the anticipated benefits of any of its acquisitions or strategic investments, which involve numerous risks, including:
| | • | | Difficulties in successfully integrating the acquired businesses; |
24
| | • | | Inability to effectively coordinate sales and marketing efforts to communicate the capabilities of the combined company; |
| | • | | Customer uncertainty that may cause delays or cancellations of customer purchases, as well as revenue attrition in excess of anticipated levels if existing customers alter or reduce their historical buying patterns; |
| | • | | Unanticipated costs, litigation and other contingent liabilities; |
| | • | | Diversion of management’s attention from Brocade’s daily operations and business; |
| | • | | Adverse effects on existing business relationships with suppliers and customers; |
| | • | | Risks associated with entering into markets in which Brocade has limited or no prior experience, including potentially less visibility into demand; |
| | • | | Inability to attract and retain key employees; |
| | • | | Inability to retain key customers, distributors, vendors and other business partners of the acquired business; |
| | • | | Inability to successfully develop new products and services on a timely basis that address the market opportunities of the combined company; |
| | • | | Inability to compete effectively against companies already serving the broader market opportunities expected to be available to the combined company; |
| | • | | Inability to qualify the combined company’s products with OEM partners on a timely basis, or at all; |
| | • | | Inability to successfully integrate and harmonize financial reporting and information technology systems; |
| | • | | Failure to successfully manage additional remote locations, including the additional infrastructure and resources necessary to support and integrate such locations; |
| | • | | Assumption or incurrence of debt and contingent liabilities and related obligations to service such liabilities and Brocade’s ability to satisfy financial and other negative operating covenants; |
| | • | | Additional costs such as increased costs of manufacturing and service costs, costs associated with excess or obsolete inventory, costs of employee redeployment, relocation and retention, including salary increases or bonuses, accelerated amortization of deferred equity compensation and severance payments, reorganization or closure of facilities, taxes, advisor and professional fees, and termination of contracts that provide redundant or conflicting services; |
| | • | | Incurrence of significant exit charges if products acquired in business combinations are unsuccessful; |
| | • | | Incurrence of significant charges if Brocade divests, disposes of or otherwise exits all or part of a business; |
| | • | | Incurrence of acquisition and integration related costs, accounting charges, or amortization costs for acquired intangible assets, that could negatively impact Brocade’s operating results and financial condition; and |
| | • | | Potential write-down of goodwill, acquired intangible assets and/or deferred tax assets, which are subject to impairment testing on an annual basis, and could significantly impact Brocade’s operating results. |
Brocade may divest certain businesses from time to time. Such divestitures will likely involve risks, such as difficulty splitting up businesses, distracting employees, potential loss of revenue and negatively impacting margins, and potentially disrupting customer relationships.
25
If Brocade is not able to successfully integrate or divest businesses, products, technologies or personnel that Brocade acquires or divests, or to realize expected benefits of Brocade’s acquisitions, divestitures or strategic investments, Brocade’s business and financial results would be adversely affected.
Brocade’s business is subject to increasingly complex corporate governance, public disclosure, accounting and tax requirements, and environmental regulations that could adversely affect Brocade’s business and financial results.
Brocade is subject to changing rules and regulations of federal and state government as well as the stock exchange on which Brocade’s common stock is listed. These entities, including the Public Company Accounting Oversight Board, the FASB, the SEC, the IRS and NASDAQ, have issued a significant number of new and increasingly complex requirements and regulations over the course of the last several years and continue to develop additional regulations and requirements in response to laws enacted by Congress. In addition, the Department of Treasury, the SEC and various Congressional representatives have recently proposed additional rules and regulations that may go into effect in the near future. On July 21, 2010, the Dodd-Frank Wall Street Reform and Protection Act was enacted. The Act included significant corporate governance and executive compensation-related provisions and also required the SEC to adopt additional rules and regulations in areas such as “say on pay” and proxy access. Brocade is also subject to various rules and regulations of certain foreign jurisdictions, including applicable tax regulations. Brocade’s efforts to comply with these requirements have resulted in, and are likely to continue to result in, an increase in expenses and a diversion of management’s time from other business activities. Similarly, any change in the tax law in the jurisdictions in which Brocade does business, including an increase in tax rates or an adverse change in the treatment of an item of income or expense, could result in a material increase in Brocade’s tax expense. For example, in the 2011 and 2012 budget proposals, the President of the United States and the U.S. Treasury Department have proposed changing certain of the U.S. tax rules for U.S. corporations doing business outside the United States. With increasing discussions around overall U.S. tax reform, and other legislation that have not yet been proposed or enacted, these or other changes in the federal or state tax laws could increase Brocade’s U.S. income tax liability in the future.
Brocade is subject to periodic audits or other reviews by such governmental agencies. For example, in December 2011, Brocade received and accepted an offer from the Appeals division of the IRS to settle its fiscal years 2004 through 2006 audit. Brocade is still under examination by the IRS for its domestic federal income tax return for the fiscal years 2007 and 2008. In addition, Foundry’s California income tax returns for calendar years 2006 and 2007 are currently being examined by the California Franchise Tax Board. All these examination cycles remain open as of October 29, 2011. Brocade resolved its California income tax audit for the years ended October 25, 2003 and October 30, 2004. To the extent carryforwards from these years are used in the future, the California Franchise Tax Board has the right to audit the carryforward amounts. The SEC also periodically reviews Brocade’s public company filings. Any such examination or review frequently requires management’s time and diversion of internal resources and, in the event of an unfavorable outcome, may result in additional liabilities or adjustments to Brocade’s historical financial results.
The IRS is contesting Brocade’s transfer pricing for the cost sharing and buy-in arrangements with its foreign subsidiaries. Brocade appealed the Revenue Agent’s Report to the Appeals Office of the IRS for the fiscal years under examination through 2008. The IRS may make similar claims against Brocade’s transfer pricing arrangements in future examinations. Audits by the IRS are subject to inherent uncertainties and an unfavorable outcome could occur, such as fines or penalties. The occurrence of an unfavorable outcome in any specific period could have a material adverse effect on Brocade’s results of operations for that period or future periods. The expense of defending and resolving such an audit may be significant. The amount of time to resolve an audit is unpredictable and defending Brocade may divert management’s attention from Brocade’s day-to-day business operations, which could adversely affect Brocade’s business.
Brocade is subject to various environmental and other regulations governing product safety, materials usage, packaging and other environmental impacts in the various countries where Brocade’s products are sold. For example, many of Brocade’s products are subject to laws and regulations that restrict the use of lead, mercury,
26
hexavalent chromium, cadmium and other substances, and require producers of electrical and electronic equipment to assume responsibility for collecting, treating, recycling and disposing of Brocade’s products when they have reached the end of their useful life. For example, in Europe, substance restrictions apply to products sold, and certain of Brocade’s partners require compliance with these or more stringent requirements. In addition, recycling, labeling, financing and related requirements apply to products Brocade sells in Europe. China has also enacted similar legislation with similar requirements for Brocade’s products or its partners. Despite Brocade’s efforts to ensure that its products comply with new and emerging requirements, Brocade cannot provide absolute assurance that its products will, in all cases, comply with such requirements. If Brocade’s products do not comply with the substance restrictions under local environmental laws, Brocade could become subject to fines, civil or criminal sanctions and contract damage claims. In addition, Brocade could be prohibited from shipping non-compliant products into one or more jurisdictions and required to recall and replace any non-compliant products already shipped, which would disrupt its ability to ship products and result in reduced revenue, increased obsolete or excess inventories, and harm to Brocade’s business and customer relationships. Brocade’s suppliers may also fail to provide it with compliant materials, parts and components despite Brocade’s requirement to do so, which could impact Brocade’s ability to timely produce compliant products and, accordingly, could disrupt its business.
Business interruptions could adversely affect Brocade’s business.
Brocade’s operations and the operations of its suppliers, contract manufacturers and customers are vulnerable to interruptions by fire, earthquake, tsunami, nuclear reactor leak, hurricane, power loss, telecommunications failure and other events beyond Brocade’s control. For example, a substantial portion of Brocade’s facilities, including its corporate headquarters, is located near major earthquake faults. Brocade does not have multiple site capacity for all of its services in the event of any such occurrence. In the event of a major earthquake, such as the recent events in Japan, Brocade could experience business interruption, destruction of facilities and loss of life. Brocade carries a limited amount of earthquake insurance, which may not be sufficient to cover earthquake-related losses, and has not set aside funds or reserves to cover other potential earthquake-related losses. Additionally, major public health issues such as an outbreak of a pandemic or epidemic may interrupt business operations in those geographic regions affected by that particular health issue. In addition, one of Brocade’s contract manufacturers has a major facility located in an area that is subject to hurricanes. In the event that a material business interruption occurs that affects Brocade, its suppliers, contract manufacturers or customers, shipments could be delayed and Brocade’s business and financial results could be harmed. Despite Brocade’s implementation of network security measures, its servers may be vulnerable to computer viruses, break-ins, and similar disruptions from unauthorized tampering with its computer systems. Brocade may not carry sufficient insurance to compensate for losses that may occur as a result of any of these events.
Brocade is exposed to various risks related to legal proceedings or claims that could adversely affect its operating results.
Brocade is a party to lawsuits in the normal course of its business. Litigation in general can be expensive, lengthy and disruptive to normal business operations. Moreover, the results of complex legal proceedings are difficult to predict. Responding to lawsuits brought against Brocade, or legal actions initiated by Brocade, can often be expensive and time-consuming. Unfavorable outcomes from these claims and/or lawsuits could adversely affect Brocade’s business, results of operations, or financial condition, and Brocade could incur substantial monetary liability and/or be required to change its business practices.
Brocade has incurred substantial indebtedness that decreases Brocade’s business flexibility and access to capital, and increases its borrowing costs, which may adversely affect Brocade’s operations and financial results.
As of October 29, 2011, Brocade owed $600 million of senior secured notes and approximately $190 million under the Senior Secured Credit Facility (see Note 9, “Borrowings,” of the Notes to Consolidated
27
Financial Statements in Part II, Item 8 of this From 10-K). The financial and other covenants agreed to by Brocade in connection with such indebtedness and the increased indebtedness and higher debt-to-equity ratio of Brocade in comparison to that of Brocade on a historical basis will have the effect, among other things, of reducing Brocade’s flexibility to respond to changing business and economic conditions and increasing borrowing costs, and may adversely affect Brocade’s operations and financial results. This indebtedness may also adversely affect Brocade’s ability to access sources of capital or incur certain liens, including without limitation, funding acquisitions or repurchasing Brocade stock. In addition, Brocade’s failure to comply with these covenants could result in a default under the applicable debt financing agreements, which could permit the holders to accelerate such debt or demand payment in exchange for a waiver of such default. If any of Brocade’s debt is accelerated, Brocade may not have sufficient funds available to repay such debt. The current debt under the Senior Secured Credit Facility has a floating interest rate and an increase in interest rates may negatively impact Brocade’s financial results. The mandatory debt repayment schedule on the Senior Secured Credit Facility may negatively impact Brocade’s cash position and reduce Brocade’s financial flexibility. In addition, any negative changes by rating agencies to Brocade’s credit rating may negatively impact the value and liquidity of Brocade’s debt and equity securities and Brocade’s ability to access sources of capital.
Provisions in Brocade’s charter documents, customer agreements and Delaware law could prevent or delay a change in control of Brocade, which could hinder stockholders’ ability to receive a premium for Brocade’s stock.
Provisions of Brocade’s certificate of incorporation and bylaws may discourage, delay or prevent a merger or mergers that a stockholder may consider favorable. These provisions include:
| | • | | Authorizing the issuance of preferred stock without stockholder approval; |
| | • | | Prohibiting cumulative voting in the election of directors; |
| | • | | Limiting the persons who may call special meetings of stockholders; and |
| | • | | Prohibiting stockholder actions by written consent. |
Certain provisions of Delaware law also may discourage, delay or prevent someone from acquiring or merging with Brocade, and Brocade’s agreements with certain of Brocade’s customers require that Brocade give prior notice of a change of control and grant certain manufacturing rights following a change of control. Brocade’s various change-of-control provisions could prevent or delay a change in control of Brocade, which could hinder stockholders’ ability to receive a premium for Brocade’s stock.
| Item 1B. | Unresolved Staff Comments |
None.
Brocade’s principal administrative, sales, marketing, education, customer support, and research and development facilities include approximately 562,000 square feet owned by Brocade in San Jose, California. Additional administrative and research and development facilities are located in an aggregate of approximately 322,000 square feet in Broomfield, Colorado, Plymouth, Minnesota and Bangalore, India. Approximately 154,000 square feet of such space is leased and 168,000 square feet is owned. Brocade believes that its existing properties, including both owned and leased, are in good condition and are suitable for the conduct of its business. Brocade also productively utilizes the majority of the space in its facilities.
Brocade’s leased properties have expirations through December 2020. In addition to the noted facilities, Brocade leases administrative, sales and marketing office space in various locations to serve its customers throughout the world. On May 23, 2008, the Company purchased property located in San Jose, California, which
28
consisted of three unimproved building parcels that were entitled for approximately 562,000 square feet of space in three buildings. In connection with the purchase, Brocade also engaged a third party as development manager to manage the development and construction of improvements on the property. The construction of our San Jose, California campus, including three office buildings, was completed in fiscal year 2010, and serves as the Company’s headquarters.
Brocade has four operating segments. Due to the interrelation of these segments, these segments use substantially all of the properties at least in part, and Brocade retains the flexibility to use each of the properties in whole or in part for each of the segments.
Brocade’s properties are subject to a perfected first interest in and mortgages on its tangible and intangible assets as further described in Note 9 (see “Borrowing” of Note 9) of the Notes to Consolidated Financial Statements in Part II, Item 8 of this Form 10-K.
The information set forth in Note 10 (see “Legal Proceedings” of Note 10) of the Notes to Consolidated Financial Statements in Part II, Item 8 of this Form 10-K is incorporated herein by reference.
| Item 4. | (Removed and Reserved) |
29
PART II
| Item 5. | Market for Registrant’s Common Equity, Related Stockholder Matters and Issuer Purchases of Equity Securities |
Brocade’s common stock is listed on the NASDAQ Global Select Market under the symbol “BRCD.” Information regarding the high and low closing sales prices per share of Brocade’s common stock as reported on the NASDAQ Global Select Market for each full quarterly period for the last two fiscal years is set forth in “Quarterly Summary” in Part II, Item 8 of this Form 10-K.
According to records of Brocade’s transfer agent, Brocade had 900 stockholders of record as of December 9, 2011 and it believes there are a substantially greater number of beneficial holders. Brocade has never declared or paid any cash dividends on its common stock. Brocade currently expects to retain any future earnings for use in the operation and expansion of its business, reduce the term loan, and repurchase the Company’s stock and does not anticipate paying any cash dividends in the foreseeable future. Information with respect to restrictions on paying dividends is set forth in Note 9 (see “Borrowing” of Note 9) of the Notes to Consolidated Financial Statements in Part II, Item 8 of this Form 10-K.
There were no unregistered sales of equity securities during the fiscal year ended October 29, 2011. Brocade has never declared or paid dividends on its common stock and has no present plans to do so.
Issuer Purchases of Equity Securities
The following table summarizes share repurchase activity for the three months ended October 29, 2011 (in thousands, except per share amounts):
| | | | | | | | | | | | | | | | |
Period | | Total Number
of Shares
Purchased | | | Average
Price Paid
per Share | | | Total Number of
Shares Purchased
as Part of Publicly
Announced
Program (1) | | | Approximate Dollar
Value of Shares that
May Yet Be
Purchased Under
the Program (1) | |
July 31, 2011 – August 27, 2011 | | | — | | | $ | — | | | | — | | | $ | 379,096 | |
August 28, 2011 – September 24, 2011 | | | 22,562 | | | $ | 4.11 | | | | 22,562 | | | $ | 286,439 | |
September 25, 2011 – October 29, 2011 | | | 23,965 | | | $ | 4.51 | | | | 23,965 | | | $ | 178,442 | |
| | | | | | | | | | | | | | | | |
Total | | | 46,527 | | | $ | 4.31 | | | | 46,527 | | | $ | 178,442 | |
| | | | | | | | | | | | | | | | |
| (1) | On November 29, 2007, the Company’s Board of Directors authorized a total of $800.0 million for the repurchase of the Company’s common stock. Purchases have been made, from time to time, in prior periods in the open market or by privately negotiated transactions and were funded from available working capital. The number of shares purchased and the timing of purchases were based on the level of the Company’s cash balances, general business and market conditions, and other factors, including alternative investment opportunities. |
30
Stock Performance Graph
The graph below shows a comparison for the period commencing on October 28, 2006 and ending on October 29, 2011 of the annual percentage change in the cumulative total stockholder return for Brocade common stock, assuming the investment of $100.00 on October 28, 2006, with the cumulative total stockholder returns for the NASDAQ Composite Index and the NASDAQ Telecommunications Index, assuming the investment of $100.00 respectively on October 31, 2006. The stockholder returns over the indicated periods below are weighted based on market capitalization at the beginning of each measurement point and are not indicative of, or intended to forecast, future performance of Brocade’s common stock. Data for the NASDAQ Composite Index and the NASDAQ Telecommunications Index assume reinvestment of dividends.
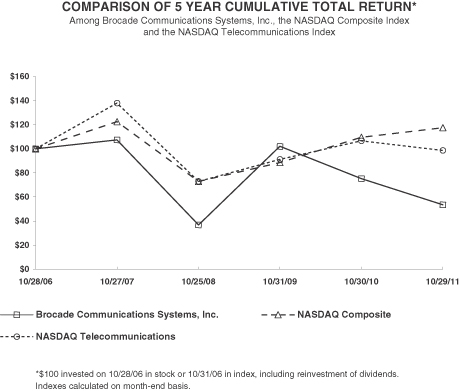
| | | | | | | | | | | | | | | | | | | | | | | | |
| | | 10/28/06 | | | 10/27/07 | | | 10/25/08 | | | 10/31/09 | | | 10/30/10 | | | 10/29/11 | |
Brocade Communications Systems, Inc. | | | 100.00 | | | | 107.35 | | | | 36.65 | | | | 102.02 | | | | 75.33 | | | | 53.50 | |
NASDAQ Composite | | | 100.00 | | | | 122.49 | | | | 72.83 | | | | 88.57 | | | | 109.52 | | | | 117.48 | |
NASDAQ Telecommunications | | | 100.00 | | | | 137.98 | | | | 72.94 | | | | 91.04 | | | | 106.51 | | | | 98.53 | |
31
| Item 6. | Selected Financial Data |
The following selected financial data should be read in conjunction with the Consolidated Financial Statements and related notes, “Management’s Discussion and Analysis of Financial Condition and Results of Operations,” and other financial information appearing elsewhere in this Annual Report on Form 10-K. The information set forth below is not necessarily indicative of Brocade’s future financial condition or results of operations.
| | | | | | | | | | | | | | | | | | | | |
| | | Fiscal Year Ended | |
| | | October 29,
2011 (1) | | | October 30,
2010 (1) | | | October 31,
2009 (2) | | | October 25,
2008 (3) | | | October 27,
2007 (4) | |
| | | (In thousands, except per share amounts) | |
Consolidated Statements of Operations Data: | | | | | | | | | | | | | | | | | | | | |
Net revenues | | $ | 2,147,442 | | | $ | 2,091,153 | | | $ | 1,950,376 | | | $ | 1,463,246 | | | $ | 1,230,927 | |
Cost of revenues | | | 863,908 | | | | 860,033 | | | | 919,426 | | | | 606,565 | | | | 575,451 | |
| | | | | | | | | | | | | | | | | | | | |
Gross margin | | | 1,283,534 | | | | 1,231,120 | | | | 1,030,950 | | | | 856,681 | | | | 655,476 | |
| | | | | | | | | | | | | | | | | | | | |
Operating expenses: | | | | | | | | | | | | | | | | | | | | |
Research and development | | | 354,401 | | | | 354,260 | | | | 354,809 | | | | 255,571 | | | | 213,311 | |
Sales and marketing | | | 608,513 | | | | 534,458 | | | | 385,155 | | | | 274,311 | | | | 211,168 | |
General and administrative | | | 69,506 | | | | 67,848 | | | | 84,962 | | | | 58,172 | | | | 46,980 | |
Legal fees associated with indemnification obligations, SEC investigation and other related costs, net | | | 125 | | | | (163 | ) | | | 23,941 | | | | 48,673 | | | | 46,257 | |
Provision for class action lawsuit | | | — | | | | — | | | | — | | | | 160,000 | | | | — | |
Amortization of intangible assets | | | 60,713 | | | | 65,623 | | | | 68,718 | | | | 31,484 | | | | 24,719 | |
Acquisition and integration costs | | | — | | | | 204 | | | | 5,127 | | | | 682 | | | | 19,354 | |
Restructuring costs and facilities lease loss | | | — | | | | 1,059 | | | | 2,329 | | | | 2,731 | | | | — | |
In-process research and development | | | — | | | | — | | | | 26,900 | | | | — | | | | — | |
Goodwill and acquisition-related intangible assets impairment | | | — | | | | — | | | | 53,306 | | | | — | | | | — | |
Loss on sale of subsidiary | | | 12,756 | | | | — | | | | — | | | | — | | | | — | |
| | | | | | | | | | | | | | | | | | | | |
Total operating expenses | | | 1,106,014 | | | | 1,023,289 | | | | 1,005,247 | | | | 831,624 | | | | 561,789 | |
| | | | | | | | | | | | | | | | | | | | |
Income from operations | | | 177,520 | | | | 207,831 | | | | 25,703 | | | | 25,057 | | | | 93,687 | |
Interest income | | | 597 | | | | 763 | | | | 4,896 | | | | 24,568 | | | | 36,989 | |
Other expenses, net | | | (975 | ) | | | (7,215 | ) | | | (7,278 | ) | | | 2,299 | | | | 1,512 | |
Interest expense | | | (97,838 | ) | | | (85,858 | ) | | | (99,294 | ) | | | (17,249 | ) | | | (11,295 | ) |
Gain (loss) on sale of investments and property, net | | | 124 | | | | (8,551 | ) | | | (602 | ) | | | (6,874 | ) | | | 13,205 | |
Loss on impairment of portfolio investments | | | — | | | | — | | | | — | | | | (8,751 | ) | | | — | |
| | | | | | | | | | | | | | | | | | | | |
Income (loss) before income tax provision (benefit) | | | 79,428 | | | | 106,970 | | | | (76,575 | ) | | | 19,050 | | | | 134,098 | |
Income tax provision (benefit) | | | 28,818 | | | | (9,553 | ) | | | 6,614 | | | | (147,317 | ) | | | 67,806 | |
| | | | | | | | | | | | | | | | | | | | |
Net income (loss) | | $ | 50,610 | | | $ | 116,523 | | | $ | (83,189 | ) | | $ | 166,367 | | | $ | 66,292 | |
| | | | | | | | | | | | | | | | | | | | |
Net income (loss) per share—basic | | $ | 0.11 | | | $ | 0.26 | | | $ | (0.21 | ) | | $ | 0.44 | | | $ | 0.18 | |
| | | | | | | | | | | | | | | | | | | | |
Net income (loss) per share—diluted | | $ | 0.10 | | | $ | 0.24 | | | $ | (0.21 | ) | | $ | 0.43 | | | $ | 0.18 | |
| | | | | | | | | | | | | | | | | | | | |
Shares used in per share calculation—basic | | | 474,259 | | | | 446,996 | | | | 398,948 | | | | 375,303 | | | | 362,070 | |
| | | | | | | | | | | | | | | | | | | | |
Shares used in per share calculation—diluted | | | 497,030 | | | | 482,741 | | | | 398,948 | | | | 385,641 | | | | 375,250 | |
| | | | | | | | | | | | | | | | | | | | |
Consolidated Balance Sheet Data: | | | | | | | | | | | | | | | | | | | | |
Cash, cash equivalents, investments, and marketable equity securities | | $ | 414,976 | | | $ | 335,982 | | | $ | 338,871 | | | $ | 820,125 | | | $ | 793,330 | |
Working capital | | | 278,214 | | | | 294,182 | | | | 20,431 | | | | 232,887 | | | | 496,801 | |
Total assets | | | 3,474,308 | | | | 3,646,012 | | | | 3,665,625 | | | | 3,301,287 | | | | 1,924,164 | |
Non-current liabilities associated with facilities lease losses | | | 2,496 | | | | 3,984 | | | | 10,150 | | | | 15,007 | | | | 25,742 | |
Term loan, current and long-term portion | | | 186,858 | | | | 325,897 | | | | 898,936 | | | | 1,055,005 | | | | — | |
Senior secured notes | | | 595,803 | | | | 595,373 | | | | — | | | | — | | | | — | |
Convertible subordinated debt | | | — | | | | — | | | | 169,332 | | | | 159,157 | | | | 149,814 | |
Total stockholders’ equity | | | 2,014,138 | | | | 2,035,405 | | | | 1,769,437 | | | | 1,293,522 | | | | 1,278,643 | |
32
| (1) | Fiscal years ended October 29, 2011 and October 30, 2010 reflect the classification of system engineer costs within sales and marketing expenses as opposed to cost of revenues in prior fiscal years. Fiscal years ended October 31, 2009, October 25, 2008 and October 27, 2007 have not been updated for the new cost classification implemented in 2010 and include system engineer costs within cost of revenues (See Note 1, “Basis of Presentation,” of the Notes to Consolidated Financial Statements). |
| (2) | The fiscal year ended October 31, 2009 includes the impact of the acquisition of Foundry, which was completed in the first fiscal quarter and the one-time $26.9 million in-process research and development charge in connection with this acquisition. The fiscal year ended October 31, 2009 also includes the impact of the impairment of the Files reporting unit. |
| (3) | The fiscal year ended October 25, 2008 includes the impact of the release of the valuation allowance of deferred tax assets which resulted in a tax benefit of $174.4 million during the year ended October 25, 2008. The fiscal year ended October 25, 2008 also includes the provision for a class action lawsuit of $160.0 million relating to a preliminary settlement reached between Brocade and the lead plaintiffs for the federal securities class action on May 30, 2008. |
| (4) | The fiscal year ended October 27, 2007 includes the impact of the acquisition of McDATA, which was completed in the second fiscal quarter of 2007. |
33
| Item 7. | Management’s Discussion and Analysis of Financial Condition and Results of Operations |
The following discussion and analysis should be read in conjunction with the consolidated financial statements and related notes appearing elsewhere in this Annual Report on Form 10-K.
Overview
We are a leading supplier of end-to-end networking solutions and services for businesses and organizations of many types and sizes, including global enterprises, and service providers such as telecommunication firms, cable operators and mobile carriers. Our business model is driven by our two key markets, namely our Data Storage business, where we offer SAN backbones, directors, fabrics, switches, HBAs, and server virtualization solutions, and our Ethernet business, where we offer modular and stackable solutions, Ethernet fabrics, converged network products, as well as application delivery, security and wireless solutions.
Growth opportunities in the Data Storage market are expected to be driven by key customer IT initiatives such as server virtualization, enterprise mobility, data center consolidation, migration to higher performance technologies and private “cloud” initiatives. Our Ethernet business strategies are intended to increase new Ethernet accounts, and expand our market share. Moreover, we plan to continue to support our Data Storage and Ethernet growth plans by enhancing our existing partnerships and forming new ones, through continuous innovation, new product introductions, and through investing in sales and marketing.
We continue to face challenges, such as the uncertainty in the worldwide macroeconomic climate and its impact on IT spending patterns globally, as well as the federal government spending in the United States. We also continue to monitor the stability and health of international markets, including China and Europe. We are cautious about the current global and country specific dynamics, including inflationary risks in China and the continuing sovereign debt risk in Europe, which may impact our business and that of our partners. While the diversification of our business model helps mitigate the effect of some of these challenges and we expect IT spending levels to generally rise in the long-term, however, it is generally difficult to offset short-term reductions of IT spending.
We expect the number of Data Storage and Ethernet products we ship to fluctuate depending on the demand for our existing and recently introduced products, as well as the timing of product transitions by our OEM partners. The average selling prices per port for our Data Storage and Ethernet products have typically declined in the past and will likely continue to decline in the future.
Our plans for our operating cash flows are to build our cash balance in the face of continued macro-economic uncertainty, reduce our existing term loan and opportunistically repurchase our stock. In June 2011, we amended our credit agreement for our Senior Secured Credit Facility to refinance all of the outstanding term loan. The refinancing effectively reduced interest rates, and is expected to provide us greater flexibility, including extending the maturity date on the term loan to October 31, 2014, reducing the required principal payments on a quarterly basis, and providing more flexibility in the use of our cash from operations, including for our share repurchase program. In the fourth fiscal quarter of 2011, we repatriated $200.0 million from our offshore operations, with which we repurchased approximately 46.5 million shares of our stock.
Results of Operations
We report our fiscal year on a 52/53-week period ending on the last Saturday in October. As is customary for companies that use the 52/53-week convention, every fifth year contains a 53-week year. Both fiscal years 2011 and 2010 were 52-week fiscal years. Our fiscal year 2009 was a 53-week fiscal year, with our second quarter of fiscal year 2009 consisting of fourteen weeks, which was one week longer than a typical quarter. Our next 53-week fiscal year will be fiscal year 2014 and our next 14-week quarter will be in the second quarter of fiscal year 2014.
34
During fiscal year 2010, we reviewed our cost classification, primarily related to our system engineer (“SE”) costs that were previously classified within cost of revenues. The SE’s primary role has migrated over time from assisting with customer support to primarily performing pre-sales activity to generate future business, which was enabled by the growth of our support organization, such that, starting in 2010, the majority of the SE’s time was spent on pre-sales activity. As a result of this change, we have reclassified the SE costs within our Consolidated Statements of Operations starting in fiscal year 2010. These costs are now presented within sales and marketing expenses, instead of cost of revenues. Prior period amounts have not been updated for the new cost classification implemented in fiscal year 2010. See impact of this adjustment within “Gross margin” and “Sales and marketing expenses” below for comparative purposes.
Our results of operations for the years ended October 29, 2011, October 30, 2010 and October 31, 2009 are reported in this discussion and analysis as a percentage of total net revenues, except for gross margin with respect to each segment, which is indicated as a percentage of the respective segment net revenues.
Revenues.Our revenues are derived primarily from sales of our Data Storage products, sales of our Ethernet products, and our service and support offerings related to those products.
Our total net revenues are summarized as follows (in thousands, except percentages):
| | | | | | | | | | | | | | | | | | | | | | | | |
| | | Fiscal Year Ended | | | | | | | |
| | | October 29,
2011 | | | % of Net
Revenues | | | October 30,
2010 | | | % of Net
Revenues | | | Increase/
(Decrease) | | | %
Change | |
Data Storage Products | | $ | 1,237,994 | | | | 57.6 | % | | $ | 1,240,626 | | | | 59.3 | % | | $ | (2,632 | ) | | | (0.2 | )% |
Ethernet Products | | | 551,820 | | | | 25.7 | % | | | 488,188 | | | | 23.4 | % | | | 63,632 | | | | 13.0 | % |
Global Services | | | 357,628 | | | | 16.7 | % | | | 362,339 | | | | 17.3 | % | | | (4,711 | ) | | | (1.3 | )% |
| | | | | | | | | | | | | | | | | | | | | | | | |
Total net revenues | | $ | 2,147,442 | | | | 100.0 | % | | $ | 2,091,153 | | | | 100.0 | % | | $ | 56,289 | | | | 2.7 | % |
| | | | | | | | | | | | | | | | | | | | | | | | |
| | | Fiscal Year Ended | | | | | | | |
| | | October 30,
2010 | | | % of Net
Revenues | | | October 31,
2009 | | | % of Net
Revenues | | | Increase/
(Decrease) | | | %
Change | |
Data Storage Products | | $ | 1,240,626 | | | | 59.3 | % | | $ | 1,188,527 | | | | 60.9 | % | | $ | 52,099 | | | | 4.4 | % |
Ethernet Products | | | 488,188 | | | | 23.4 | % | | | 424,434 | | | | 21.8 | % | | | 63,754 | | | | 15.0 | % |
Global Services | | | 362,339 | | | | 17.3 | % | | | 337,415 | | | | 17.3 | % | | | 24,924 | | | | 7.4 | % |
| | | | | | | | | | | | | | | | | | | | | | | | |
Total net revenues | | $ | 2,091,153 | | | | 100.0 | % | | $ | 1,950,376 | | | | 100.0 | % | | $ | 140,777 | | | | 7.2 | % |
The increase in total net revenues for the year ended October 29, 2011 compared with the year ended October 30, 2010 reflects higher sales of Ethernet Products, partially offset by lower revenues from Data Storage Products and our Global Services offerings.
| | • | | The marginal decrease in Data Storage Products revenues for the fiscal year 2011 reflects a 2.0% decrease in average selling price per port which includes the impact of lower pricing and a reduction in inventory held at our OEM partners . This was slightly offset by a favorable mix shift from 4 Gb and 8Gb director and switch products to 8 Gb and 16Gb director and switch products, which carry a higher price per port and by an increase of 1.9% in the number of ports shipped. |
| | • | | The increase in Ethernet Products revenues for the fiscal year 2011 reflects higher revenues from our enterprise and service provider customers, which we believe was influenced by the implementation of initiatives to drive both immediate and long-term growth in our Ethernet business. The higher enterprise and service provider revenue was partially offset by lower pricing and lower revenues from United States federal customers; and |
| | • | | The decrease in Global Services revenues for the fiscal year 2011 was primarily a result of lower Data Storage support and lower service revenues during the year as a result of the sale of SBS in September 2011, partially offset by an increase in Ethernet support revenues. |
35
The increase in total net revenues for the year ended October 30, 2010 compared with the year ended October 31, 2009 reflects growth in sales across all segments.
| | • | | The increase in Data Storage product revenues for the fiscal year 2010 reflects a 14.3% increase in the number of ports shipped, partially offset by a decrease in average selling price per port of 8.7% which includes the impact of lower pricing that was partially offset by a favorable mix shift from 4 Gb director and switch products to 8 Gb director and switch products, which carry a higher price per port. |
| | • | | Ethernet Products revenues for the fiscal year 2010 increased as a result of the inclusion of Foundry, which was acquired during the first fiscal quarter of 2009, and reflects the implementation of initiatives to drive both immediate and long-term growth in our Ethernet business, which offset the decrease in average selling price during fiscal year 2010; and |
| | • | | The increase in Global Services revenues was primarily a result of the inclusion of Foundry, which was acquired during the first fiscal quarter of 2009, and reflects higher support revenues attached to higher product revenues during fiscal year 2010. |
Our total net revenues by geographical area are summarized as follows (in thousands, except percentages):
| | | | | | | | | | | | | | | | | | | | | | | | |
| | | Fiscal Year Ended | | | | | | | |
| | | October 29,
2011 | | | % of Net
Revenues | | | October 30,
2010 | | | % of Net
Revenues | | | Increase/
(Decrease) | | | %
Change | |
United States | | $ | 1,313,302 | | | | 61.2 | % | | $ | 1,338,262 | | | | 64.0 | % | | $ | (24,960 | ) | | | (1.9 | )% |
Europe, the Middle East and Africa (1) | | | 502,999 | | | | 23.4 | % | | | 482,707 | | | | 23.1 | % | | | 20,292 | | | | 4.2 | % |
Asia Pacific | | | 212,636 | | | | 9.9 | % | | | 173,243 | | | | 8.3 | % | | | 39,393 | | | | 22.7 | % |
Japan | | | 75,542 | | | | 3.5 | % | | | 58,914 | | | | 2.8 | % | | | 16,628 | | | | 28.2 | % |
Canada, Central and South America | | | 42,963 | | | | 2.0 | % | | | 38,027 | | | | 1.8 | % | | | 4,936 | | | | 13.0 | % |
| | | | | | | | | | | | | | | | | | | | | | | | |
Total net revenues | | $ | 2,147,442 | | | | 100.0 | % | | $ | 2,091,153 | | | | 100.0 | % | | $ | 56,289 | | | | 2.7 | % |
| | | |
| | | Fiscal Year Ended | | | | | | | |
| | | October 30,
2010 | | | % of Net
Revenues | | | October 31,
2009 | | | % of Net
Revenues | | | Increase/
(Decrease) | | | %
Change | |
United States | | $ | 1,338,262 | | | | 64.0 | % | | $ | 1,266,844 | | | | 65.0 | % | | $ | 71,418 | | | | 5.6 | % |
Europe, the Middle East and Africa (1) | | | 482,707 | | | | 23.1 | % | | | 450,159 | | | | 23.1 | % | | | 32,548 | | | | 7.2 | % |
Asia Pacific | | | 173,243 | | | | 8.3 | % | | | 141,511 | | | | 7.2 | % | | | 31,732 | | | | 22.4 | % |
Japan | | | 58,914 | | | | 2.8 | % | | | 59,771 | | | | 3.1 | % | | | (857 | ) | | | (1.4 | )% |
Canada, Central and South America | | | 38,027 | | | | 1.8 | % | | | 32,091 | | | | 1.6 | % | | | 5,936 | | | | 18.5 | % |
| | | | | | | | | | | | | | | | | | | | | | | | |
Total net revenues | | $ | 2,091,153 | | | | 100.0 | % | | $ | 1,950,376 | | | | 100.0 | % | | $ | 140,777 | | | | 7.2 | % |
| (1) | Includes net revenues of $257.5 million, $254.4 million and $177.0 million for the years ended October 29, 2011, October 30, 2010 and October 31, 2009, respectively, relating to the Netherlands. |
International revenues increased as a percentage of total net revenues for the year ended October 29, 2011 compared with fiscal year 2010 primarily as a result of increased revenues in Japan and the Asia Pacific region. International revenues increased as a percentage of total net revenues for the year ended October 30, 2010 compared with fiscal year 2009 primarily as a result of increased revenues in the Asia Pacific region. Revenues are attributed to geographic areas based on where our products are shipped. However, certain OEM partners take possession of our products domestically and then distribute these products to their international customers. Because we account for all of those OEM revenues as domestic revenues, we cannot be certain of the extent to which our domestic and international revenue mix is impacted by the practices of our OEM partners, but we believe that international revenues comprise a larger percentage of our total net revenues than the attributed revenues may indicate.
36
A significant portion of our revenue is concentrated among a relatively small number of OEM customers. For the years ended October 29, 2011, October 30, 2010 and October 31, 2009, the same three customers each represented 10% or more of our total net revenues for a combined total of 43% (EMC with 15%, HP with 13% and IBM with 15%), 47% (EMC with 16%, HP with 14% and IBM with 17%) and 48% (EMC with 18%, HP with 13% and IBM with 17%), respectively, of our total net revenues. We expect that a significant portion of our future revenues will continue to come from sales of products to a relatively small number of OEM partners and to the U.S. government or individual agencies within the U.S. government through our distributors. Therefore, the loss of, or a decrease in the level of sales to, or a change in the ordering pattern of any one of these customers could seriously harm our financial condition and results of operations.
A majority of our accounts receivable balance is derived from sales to our OEM partners. As of October 29, 2011, two customers accounted for 16% and 14%, respectively, of total accounts receivable. As of October 30, 2010, three customers accounted for 17%, 14% and 10%, respectively, of total accounts receivable. We perform ongoing credit evaluations of our customers and generally do not require collateral or security interests on accounts receivable balances. We have established reserves for credit losses, sales allowances, and other allowances. While we have not experienced material credit losses in any of the periods presented, there can be no assurance that we will not experience material credit losses in the future.
Gross margin.Gross margin as stated below is indicated as a percentage of the respective segment net revenues, except for total gross margin, which is stated as a percentage of total net revenues. Gross margins are summarized as follows (in thousands, except percentages):
| | | | | | | | | | | | | | | | | | | | | | | | |
| | | Fiscal Year Ended | | | | | | | |
| | | October 29,
2011 | | | % of Net
Revenues | | | October 30,
2010 | | | % of Net
Revenues | | | Increase/
(Decrease) | | | % Points
Change | |
Data Storage Products | | $ | 881,981 | | | | 71.2 | % | | $ | 846,120 | | | | 68.2 | % | | $ | 35,861 | | | | 3.0 | % |
Ethernet Products | | | 230,637 | | | | 41.8 | % | | | 199,208 | | | | 40.8 | % | | | 31,429 | | | | 1.0 | % |
Global Services | | | 170,916 | | | | 47.8 | % | | | 185,792 | | | | 51.3 | % | | | (14,876 | ) | | | (3.5 | )% |
| | | | | | | | | | | | | | | | | | | | | | | | |
Total gross margin | | $ | 1,283,534 | | | | 59.8 | % | | $ | 1,231,120 | | | | 58.9 | % | | $ | 52,414 | | | | 0.9 | % |
| | | |
| | | Fiscal Year Ended | | | | | | | |
| | | October 30,
2010 | | | % of Net
Revenues | | | October 31,
2009 | | | % of Net
Revenues | | | Increase/
(Decrease) | | | % Points
Change | |
Data Storage Products | | $ | 846,120 | | | | 68.2 | % | | $ | 721,031 | | | | 60.7 | % | | $ | 125,089 | | | | 7.5 | % |
Ethernet Products | | | 199,208 | | | | 40.8 | % | | | 152,576 | | | | 35.9 | % | | | 46,632 | | | | 4.9 | % |
Global Services | | | 185,792 | | | | 51.3 | % | | | 157,343 | | | | 46.6 | % | | | 28,449 | | | | 4.7 | % |
| | | | | | | | | | | | | | | | | | | | | | | | |
Total gross margin | | $ | 1,231,120 | | | | 58.9 | % | | $ | 1,030,950 | | | | 52.9 | % | | $ | 200,170 | | | | 6.0 | % |
Starting fiscal year 2010, gross margin excludes SE costs which have been reclassified as operating expense. For comparative purposes, had the reclassification been affected for fiscal year 2009, the adjusted gross margins would have been as follows (in thousands, except percentages):
| | | | | | | | | | | | | | | | | | | | | | | | |
| | | Fiscal Year Ended | | | | | | | |
| | | October 30,
2010 | | | % of Net
Revenues | | | October 31,
2009 | | | % of Net
Revenues | | | Increase/
(Decrease) | | | % Points
Change | |
Data Storage Products | | $ | 846,120 | | | | 68.2 | % | | $ | 780,501 | | | | 65.7 | % | | $ | 65,619 | | | | 2.5 | % |
Ethernet Products | | | 199,208 | | | | 40.8 | % | | | 195,526 | | | | 46.1 | % | | | 3,682 | | | | (5.3 | )% |
Global Services | | | 185,792 | | | | 51.3 | % | | | 175,469 | | | | 52.0 | % | | | 10,323 | | | | (0.7 | )% |
| | | | | | | | | | | | | | | | | | | | | | | | |
Total gross margin | | $ | 1,231,120 | | | | 58.9 | % | | $ | 1,151,496 | | | | 59.0 | % | | $ | 79,624 | | | | (0.1 | )% |
37
For the year ended October 29, 2011 compared with the fiscal year 2010, total gross margin increased in absolute dollars and percentage primarily due to higher revenues, as well as higher margins on Data Storage Products and Ethernet Products. This was partially offset by a decrease in Global Services gross margins, and increased mix of Ethernet Products revenues, which carry a lower overall gross margin.
Gross margin percentage by reportable segment increased or decreased for the year ended October 29, 2011 compared with the fiscal year 2010 primarily due to the following factors (the percentages below reflect the impact on gross margin):
| | • | | Data Storage Products gross margins as a percentage of net revenues increased primarily due to a benefit of 1.2% from the release of a provision for certain litigation originally recorded in cost of sales, and a 1.3% decrease in direct product costs relative to net revenues, which more than offset the decline in average selling price. Additionally, amortization of intangible assets related to the McDATA acquisition decreased by 0.2% and other manufacturing costs relative to net revenues decreased by 0.3%; |
| | • | | Ethernet Products gross margins as a percentage of net revenues increased due to a 1.0% decrease in amortization of intangible assets related to the Foundry acquisition, due to improved overhead absorption from higher revenues and a 0.3% decrease in direct product costs, partially offset by a 0.3% increase in other manufacturing costs. |
| | • | | Global Services gross margins as a percentage of net revenues decreased due to a 2.9% increase in service and support costs, primarily due to increased headcount, which offset the impact of a one-time settlement of a litigation matter during the first fiscal quarter of 2010. Additionally, stock-based compensation relative to net revenues increased 0.6% due to increased headcount. |
For the year ended October 30, 2010 compared with fiscal year 2009, total gross margin increased in absolute dollars primarily due to higher revenues and exclusion of SE costs in fiscal year 2010. Total gross margin percentage also increased primarily due to the exclusion of SE costs from gross margin. Assuming the SE reclassification was made for fiscal year 2009 on an as adjusted basis for comparative purposes, the total gross margin percentage decrease in fiscal year 2010 was primarily due to lower Ethernet Products gross margins, as well as lower margins on Global Services, which offset the improved margins in the Data Storage Products segment.
Gross margin percentage by reportable segment increased or decreased for the year ended October 30, 2010 compared with fiscal year 2009 primarily due to the following factors which reflect the reclassification of SE costs in fiscal year 2009 for comparative purposes (the percentages below reflect the impact on gross margin):
| | • | | Data Storage Products gross margins as a percentage of net revenues increased due to a 1.8% decrease in other manufacturing costs and a 1.0% decrease in amortization of intangible assets related to the McDATA acquisition. This was partially offset by an increase in direct product costs of 0.3% relative to net revenues, primarily due to a decline in average selling price; |
| | • | | Ethernet Products gross margins as a percentage of net revenues decreased due to a 2.4% increase in direct product costs relative to net revenues due to lower average selling prices and shifting product mix, partially offset by cost savings, and the impact of purchase price accounting adjustment for the fiscal year 2009 related to deferred revenues. Additionally, other manufacturing costs increased 2.9% primarily driven by inventory write-downs due to product transitions, and higher manufacturing costs tied to new products; and |
| | • | | Global Services gross margins as a percentage of net revenues decreased due to a 1.3% increase in service and support costs, primarily driven by inventory write-downs in fiscal year 2010 and cash payment pursuant to a one-time settlement of a litigation matter during the first fiscal quarter of 2010. This was partially offset by a 0.6% decrease in stock-based compensation relative to net revenues. |
38
Stock-based compensation expense. Stock-based compensation expense is summarized as follows (in thousands, except percentages):
| | | | | | | | | | | | | | | | | | | | | | | | |
| | | October 29,
2011 | | | % of Net
Revenues | | | October 30,
2010 | | | % of Net
Revenues | | | Increase/
(Decrease) | | | %
Change | |
Fiscal year ended | | $ | 83,076 | | | | 3.9 | % | | $ | 101,625 | | | | 4.9 | % | | $ | (18,549 | ) | | | (18.3 | )% |
| | | | | | |
| | | October 30,
2010 | | | % of Net
Revenues | | | October 31,
2009 | | | % of Net
Revenues | | | Increase/
(Decrease) | | | %
Change | |
Fiscal year ended | | $ | 101,625 | | | | 4.9 | % | | $ | 137,219 | | | | 7.0 | % | | $ | (35,594 | ) | | | (25.9 | )% |
The decrease in stock-based compensation expense for the year ended October 29, 2011 compared with the fiscal year ended 2010 was primarily due to the decrease in Foundry-related deferred compensation and lower expenses related to our 2009 Employee Stock Purchase Plan (“ESPP”) for which higher compensation expense was recognized under the graded vesting methodology in fiscal year 2010. This was partially offset by higher expenses from an increase in new equity grants in 2011.
The decrease in stock-based compensation expense for the year ended October 30, 2010 compared with the fiscal year ended 2009 was primarily due to the decrease in Foundry-related deferred compensation and the completion of the Company’s long-term, performance-based equity incentive plan on October 31, 2009. The decrease was partially offset by the adoption in fiscal year 2009 of our 2009 ESPP for which compensation expense is recognized using the graded vesting method over the twenty-four month offering period in comparison to the six-month offering period under our 1999 ESPP, which was effective for the first seven fiscal months of 2009.
Research and development expenses.Research and development (“R&D”) expenses consist primarily of salaries and related expenses for personnel engaged in engineering and R&D activities, fees paid to consultants and outside service providers, nonrecurring engineering charges, prototyping expenses related to the design, development, testing and enhancement of our products, depreciation related to engineering and test equipment, and related IT and facilities expenses.
R&D expenses are summarized as follows (in thousands, except percentages):
| | | | | | | | | | | | | | | | | | | | | | | | |
| | | October 29,
2011 | | | % of Net
Revenues | | | October 30,
2010 | | | % of Net
Revenues | | | Increase/
(Decrease) | | | %
Change | |
Fiscal year ended | | $ | 354,401 | | | | 16.5 | % | | $ | 354,260 | | | | 16.9 | % | | $ | 141 | | | | 0.0 | % |
| | | | | | |
| | | October 30,
2010 | | | % of Net
Revenues | | | October 31,
2009 | | | % of Net
Revenues | | | Increase/
(Decrease) | | | %
Change | |
Fiscal year ended | | $ | 354,260 | | | | 16.9 | % | | $ | 354,809 | | | | 18.2 | % | | $ | (549 | ) | | | (0.2 | )% |
R&D expenses increased for the year ended October 29, 2011 compared with the year ended October 30, 2010 due to the following:
| | | | |
| | | $ Change
2010 to 2011
Year-to-Date
(“YTD”) | |
Salaries and wages | | $ | 14,288 | |
Outside services | | | 3,647 | |
Depreciation and amortization | | | 2,586 | |
Various individually insignificant items | | | 625 | |
The increase in R&D expenses was partially offset by decreases in the following: | | | | |
Stock-based compensation | | | (8,835 | ) |
Nonrecurring engineering expenses | | | (8,548 | ) |
Sustaining engineering expenses allocated to cost of revenues | | | (3,622 | ) |
| | | | |
Total change | | $ | 141 | |
| | | | |
39
Salaries and wages increased primarily due to increased headcount and higher bonuses, partially offset by five days of unpaid time resulting from the implementation of a company-wide unpaid time off program during the fourth fiscal quarter of 2011. Outside services increased primarily due to projects related to our new Ethernet product offerings. Depreciation and amortization increased primarily due to the continued build-up of our development and testing labs. Nonrecurring engineering expenses decreased primarily due to lower prototype costs and a decrease in chip design expenses. Sustaining engineering expenses allocated to cost of revenues increased primarily as a result of new Ethernet products launched, partially offsetting the increase in R&D expenses.
R&D expenses decreased for the year ended October 30, 2010 compared with the year ended October 31, 2009 due to the following:
| | | | |
| | | $ Change
2009 to 2010
Year-to-Date
(“YTD”) | |
Salaries and wages | | $ | (16,150 | ) |
Stock-based compensation | | | (12,570 | ) |
The decrease in R&D expenses was partially offset by increases in the following: | | | | |
Depreciation and amortization | | | 12,126 | |
Expenses related to IT, facilities and other shared functions | | | 8,933 | |
Outside services | | | 5,185 | |
Nonrecurring engineering expenses | | | 1,518 | |
Various individually insignificant items | | | 409 | |
| | | | |
Total change | | $ | (549 | ) |
| | | | |
Salaries and wages decreased primarily due to lower bonuses, partially offset by headcount growth. Depreciation and amortization increased primarily due to the build-up of our labs and increased equipment purchases. Expenses related to IT, facilities and other shared functions increased primarily due to headcount growth and moving costs associated with preparing our new Company campus for occupancy. Outside services increased primarily due to projects and certification costs related to our product offerings. Nonrecurring engineering expenses increased primarily due to continued development of new and enhanced products.
Sales and marketing expenses.Sales and marketing expenses consist primarily of salaries, commissions and related expenses for personnel engaged in sales, marketing and customer service functions, costs associated with promotional and marketing programs, travel expenses, and related IT and facilities expenses.
Sales and marketing expenses are summarized as follows (in thousands, except percentages):
| | | | | | | | | | | | | | | | | | | | | | | | |
| | | October 29,
2011 | | | % of Net
Revenues | | | October 30,
2010 | | | % of Net
Revenues | | | Increase/
(Decrease) | | | %
Change | |
Fiscal year ended | | $ | 608,513 | | | | 28.3 | % | | $ | 534,458 | | | | 25.6 | % | | $ | 74,055 | | | | 13.9 | % |
| | | | | | |
| | | October 30,
2010 | | | % of Net
Revenues | | | October 31,
2009 | | | % of Net
Revenues | | | Increase/
(Decrease) | | | %
Change | |
Fiscal year ended | | $ | 534,458 | | | | 25.6 | % | | $ | 385,155 | | | | 19.7 | % | | $ | 149,303 | | | | 38.8 | % |
Starting fiscal year 2010, the Company began classifying its SE costs as sales and marketing expenses. For comparative purposes, had the reclassification of SE costs from cost of revenues to sales and marketing expenses been effected for fiscal year 2009, the as adjusted sales and marketing expenses would have been as follows (in thousands, except percentages):
| | | | | | | | | | | | | | | | | | | | | | | | |
| | | October 30,
2010 | | | % of Net
Revenues | | | October 31,
2009 | | | % of Net
Revenues | | | Increase/
(Decrease) | | | %
Change | |
Fiscal year ended | | $ | 534,458 | | | | 25.6 | % | | $ | 505,701 | | | | 25.9 | % | | $ | 28,757 | | | | 5.7 | % |
40
Sales and marketing expenses increased for the year ended October 29, 2011 compared with the year ended October 30, 2010 due to the following:
| | | | |
| | | $ Change
2010 to 2011
YTD | |
Salaries and wages | | $ | 64,508 | |
Other marketing expenses | | | 10,442 | |
Expenses related to IT, facilities and other shared functions | | | 3,799 | |
Travel expenses | | | 1,931 | |
Depreciation and amortization | | | 1,683 | |
Various individually insignificant items | | | 856 | |
The increase in sales and marketing expenses was partially offset by the decrease in the following: | | | | |
Stock-based compensation | | | (9,164 | ) |
| | | | |
Total change | | $ | 74,055 | |
| | | | |
Salaries and wages, expenses related to IT, facilities and other shared functions, travel expenses, and depreciation and amortization increased primarily due to headcount growth. Additionally, salaries and wages increased due to higher bonuses and commissions, partially offset by five days of unpaid time resulting from the implementation of a company-wide unpaid time off program during the fourth fiscal quarter of 2011. Other marketing expenses increased primarily due to our new marketing awareness campaign, and consulting expenses related to our business model and growth strategy.
Sales and marketing expenses increased for the year ended October 30, 2010 compared with the year ended October 31, 2009 due to the following, which reflects the as adjusted reclassification of SE costs in fiscal year 2009 for comparative purposes:
| | | | |
| | | $ Change
2009 to 2010
YTD | |
System engineering costs | | $ | 13,760 | |
Expenses related to IT, facilities and other shared functions | | | 10,930 | |
Salaries and wages | | | 8,409 | |
Outside services | | | 5,493 | |
Travel expenses | | | 2,584 | |
The increase in sales and marketing expenses was partially offset by decreases in the following: | | | | |
Stock-based compensation | | | (11,689 | ) |
Various individually insignificant items | | | (730 | ) |
| | | | |
Total change | | $ | 28,757 | |
| | | | |
System engineering costs increased primarily due to head count growth. Expenses related to IT, facilities and other shared functions increased primarily due to headcount growth and moving costs associated with our new Company campus. Salaries and wages increased primarily due to headcount growth and higher commissions. Outside services increased primarily due to channel-related marketing and promotions and corporate brand marketing. Travel expenses increased due to headcount growth and initiatives to drive incremental revenue.
General and administrative expenses.General and administrative (“G&A”) expenses consist primarily of salaries and related expenses for corporate executives, finance, human resources, legal and investor relations, as well as recruiting expenses, professional fees, other corporate expenses, and related IT and facilities expenses.
41
G&A expenses are summarized as follows (in thousands, except percentages):
| | | | | | | | | | | | | | | | | | | | | | | | |
| | | October 29,
2011 | | | % of Net
Revenues | | | October 30,
2010 | | | % of Net
Revenues | | | Increase/
(Decrease) | | | %
Change | |
Fiscal year ended | | $ | 69,506 | | | | 3.2 | % | | $ | 67,848 | | | | 3.2 | % | | $ | 1,658 | | | | 2.4 | % |
| | | | | | |
| | | October 30,
2010 | | | % of Net
Revenues | | | October 31,
2009 | | | % of Net
Revenues | | | Increase/
(Decrease) | | | %
Change | |
Fiscal year ended | | $ | 67,848 | | | | 3.2 | % | | $ | 84,962 | | | | 4.4 | % | | $ | (17,114 | ) | | | (20.1 | )% |
G&A expenses increased for the year ended October 29, 2011 compared with the year ended October 30, 2010 due to the following:
| | | | |
| | | $ Change
2010 to 2011
YTD | |
Depreciation and amortization | | $ | 8,849 | |
Salaries and wages | | | 7,206 | |
Outside services | | | 1,026 | |
The increase in general and administrative expenses was partially offset by decreases in the following: | | | | |
Other facility expenses | | | (11,217 | ) |
Stock-based compensation | | | (2,605 | ) |
Various individually insignificant items | | | (1,601 | ) |
| | | | |
Total change | | $ | 1,658 | |
| | | | |
Depreciation and amortization increased primarily due to additional furniture and equipment and depreciation related to our new campus that was completed in the third fiscal quarter of 2010. Salaries and wages increased due to headcount growth and higher bonuses, partially offset by five days of unpaid time resulting from the implementation of a company-wide unpaid time off program during the fourth fiscal quarter of 2011. Outside services increased primarily due to higher legal expenses related to ongoing disputes. Other facility expenses decreased primarily due to decrease in rent and related expenses after moving into our new campus in the third fiscal quarter of 2010.
G&A expenses decreased for the year ended October 30, 2010 compared with the year ended October 31, 2009 due to the following:
| | | | |
| | | $ Change
2009 to 2010
YTD | |
Expenses related to IT, facilities and other shared functions | | $ | (23,202 | ) |
Stock-based compensation | | | (7,333 | ) |
Salaries and wages | | | (6,421 | ) |
The decrease in general and administrative expenses was partially offset by increases in the following: | | | | |
Outside services | | | 13,784 | |
Depreciation and amortization | | | 5,873 | |
Various individually insignificant items | | | 185 | |
| | | | |
Total change | | $ | (17,114 | ) |
| | | | |
The expenses related to IT, facilities and other shared functions decreased primarily due to an increase in the amount of total expense allocated to other departments due to headcount growth in those departments. Salaries
42
and wages decreased primarily due to lower bonuses which was partially offset by higher headcount. Outside services increased primarily due to costs associated with preparing our new campus for occupancy, as well as an increase in outside services related to information systems projects. Depreciation and amortization increased primarily due to additional furniture and equipment and depreciation related to our new Company campus.
Legal fees associated with indemnification obligations and other related costs, net.These expenses consist of legal fees for various matters, including applicable indemnification obligations, defense of the Company in legal proceedings, and actions to pursue claims by the Special Litigation Committee of the Board of Directors (the “SLC”), which had plenary authority to, among other things, evaluate and resolve claims asserted against Brocade in federal and state derivative actions related to stock option backdating and related matters. Pursuant to our charter documents and indemnification agreements, we had certain indemnification obligations to our directors, officers and employees, as well as certain former directors, officers and employees. As a result of such obligations and claims filed by the SLC against former officers, directors and employees of Brocade, we incurred expenses related to amounts paid in satisfaction of the Company’s indemnification obligations to certain of these former directors, officers and employees who have been and/or are subject to ongoing SEC, civil actions and/or criminal proceedings in connection with Brocade’s historical stock option granting practices. The SLC reached settlement with each of the defendants and we believe our obligations relating to stock option backdating and related matters have substantially ended. Effective May 31, 2010, our Board of Director dissolved the Special Litigation Committee.
Legal fees associated with indemnification obligations and other related costs, net, are summarized as follows (in thousands, except percentages):
| | | | | | | | | | | | | | | | | | | | | | | | |
| | | October 29,
2011 | | | % of Net
Revenues | | | October 30,
2010 | | | % of Net
Revenues | | | Increase/
(Decrease) | | | %
Change | |
Fiscal year ended | | $ | 125 | | | | — | % | | $ | (163 | ) | | | — | % | | $ | 288 | | | | 176.7 | % |
| | | | | | |
| | | October 30,
2010 | | | % of Net
Revenues | | | October 31,
2009 | | | % of Net
Revenues | | | Increase/
(Decrease) | | | %
Change | |
Fiscal year ended | | $ | (163 | ) | | | — | % | | $ | 23,941 | | | | 1.2 | % | | $ | (24,104 | ) | | | (100.7 | )% |
Legal fees associated with indemnification obligations and other related costs, net, were immaterial for the years ended October 29, 2011 and October 30, 2010.
Legal fees decreased for the year ended October 30, 2010 compared with fiscal year 2009 primarily due to resolution of multiple legal proceedings related to the SLC litigation.
Amortization of intangible assets. Amortization of intangible assets is summarized as follows (in thousands, except percentages):
| | | | | | | | | | | | | | | | | | | | | | | | |
| | | October 29,
2011 | | | % of Net
Revenues | | | October 30,
2010 | | | % of Net
Revenues | | | Increase/
(Decrease) | | | %
Change | |
Fiscal year ended | | $ | 60,713 | | | | 2.8 | % | | $ | 65,623 | | | | 3.1 | % | | $ | (4,910 | ) | | | (7.5 | )% |
| | | | | | |
| | | October 30,
2010 | | | % of Net
Revenues | | | October 31,
2009 | | | % of Net
Revenues | | | Increase/
(Decrease) | | | %
Change | |
Fiscal year ended | | $ | 65,623 | | | | 3.1 | % | | $ | 68,718 | | | | 3.5 | % | | $ | (3,095 | ) | | | (4.5 | )% |
During the years ended October 29, 2011 and October 30, 2010, we recorded amortization of intangible assets related to the acquisitions of McDATA, Silverback, SBS and Foundry. The decrease in amortization of intangible assets for the year ended October 29, 2011 compared with fiscal year 2010 was primarily due to the full amortization of a portion of the McDATA-related intangible assets and the sale of SBS in the fourth quarter of fiscal year 2011.
43
During the year ended October 31, 2009, we recorded amortization of intangible assets related to the acquisitions of McDATA, Silverback, SBS and Foundry. The decrease in amortization of intangible assets for the year ended October 30, 2010 compared with fiscal year 2009 was primarily due to the full amortization of a portion of the McDATA-related intangible assets.
Intangible assets are recorded based on estimates of fair value at the time of the acquisition and identifiable intangible assets are amortized on a straight-line basis over their estimated useful lives (see Note 4, “Goodwill and Intangible Assets,” of the Notes to Consolidated Financial Statements in Part II, Item 8 of this Form 10-K).
Acquisition and integration costs.We did not incur any acquisition and integration costs during the year ended October 29, 2011. For fiscal years 2010 and 2009, acquisition and integration costs are summarized as follows (in thousands, except percentages):
| | | | | | | | | | | | | | | | | | | | | | | | |
| | | October 30,
2010 | | | % of Net
Revenues | | | October 31,
2009 | | | % of Net
Revenues | | | Increase/
(Decrease) | | | %
Change | |
Fiscal year ended | | $ | 204 | | | | — | % | | $ | 5,127 | | | | 0.3 | % | | $ | (4,923 | ) | | | (96.0 | )% |
For years ended October 30, 2010 and October 31, 2009, we recorded acquisition and integration costs primarily for consulting services and other professional fees in connection with our acquisition and integration of Foundry which we acquired on December 18, 2008.
Restructuring costs and facilities lease loss. We did not incur any restructuring costs and facilities lease loss during the year ended October 29, 2011. Restructuring costs and facilities lease loss for fiscal years 2010 and 2009 are summarized as follows (in thousands, except percentages):
| | | | | | | | | | | | | | | | | | | | | | | | |
| | | October 30,
2010 | | | % of Net
Revenues | | | October 31,
2009 | | | % of Net
Revenues | | | Increase/
(Decrease) | | | %
Change | |
Fiscal year ended | | $ | 1,059 | | | | 0.1 | % | | $ | 2,329 | | | | 0.1 | % | | $ | (1,270 | ) | | | (54.5 | )% |
Restructuring costs and facilities lease loss for the year ended October 30, 2010 was due to $0.5 million of restructuring costs, primarily severance payments related to certain realignment within our Global Services segment and $0.5 million related to estimated facility lease losses, net of expected sublease income recorded during the year ended October 30, 2010.
Restructuring costs and facilities lease loss for the year ended October 31, 2009 was primarily due to $2.7 million in restructuring costs related to severance payments in connection with the decision to no longer offer our suite of Files products, partially offset by a benefit of $0.3 million related to estimated facilities lease losses, net of expected sublease income, recorded during the year ended October 31, 2009. This benefit represented a change in estimate. We revised certain estimates and assumptions, including those related to estimated sublease rates, estimated time to sublease the facilities, expected future operating costs, and expected future use of the facilities.
In-process research and development. We did not record any in-process research and development (“IPR&D”) charge for the years ended October 29, 2011 and October 30, 2010. IPR&D for the year ended October 31, 2009 is summarized as follows (in thousands, except percentages):
| | | | | | | | | | | | | | | | | | | | | | | | |
| | | October 30,
2010 | | | % of Net
Revenues | | | October 31,
2009 | | | % of Net
Revenues | | | Increase/
(Decrease) | | | %
Change | |
Fiscal year ended | | $ | — | | | | — | % | | $ | 26,900 | | | | 1.4 | % | | $ | (26,900 | ) | | | (100.0 | )% |
In the first quarter of fiscal year 2009, we completed our acquisition of Foundry. In connection with this acquisition, we recorded a $26.9 million IPR&D charge because the acquired technologies had not reached technological feasibility and had no alternative uses. Technological feasibility is defined as being equivalent to
44
completion of a beta-phase working prototype in which there is no remaining risk relating to the development. At the time of the acquisition in December 2008, Foundry was developing new products in multiple product areas that qualify as IPR&D. These efforts included FastIron SuperX Family, FastIron CX, NetIron CER, TurboIron and various other projects. Development efforts for these projects have been completed.
Goodwill and acquisition-related intangible assets impairment. We did not record any goodwill and acquisition-related intangible assets impairment for the years ended October 29, 2011 and October 30, 2010. Goodwill and acquisition-related intangible assets impairment for the year ended October 31, 2009 is summarized as follows (in thousands, except percentages):
| | | | | | | | | | | | | | | | | | | | | | | | |
| | | October 30,
2010 | | | % of Net
Revenues | | | October 31,
2009 | | | % of Net
Revenues | | | Increase/
(Decrease) | | | %
Change | |
Fiscal year ended | | $ | — | | | | — | % | | $ | 53,306 | | | | 2.7 | % | | $ | (53,306 | ) | | | (100.0 | )% |
During the second quarter of fiscal year 2009, we made a decision to no longer offer our suite of Files products. After the acquisition of Foundry, Files was combined with the ADP operating segment. The integration of Files into the ADP operating segment was at a preliminary stage when the decision was made to cease development of the Files business. Accordingly, we assessed the potential impairment of the goodwill and long-lived assets relating to the Files business on a standalone basis.
As a result of the goodwill impairment analysis, we determined that all of the goodwill and acquisition-related intangible assets associated with the Files business were impaired. During the year ended October 31, 2009, we recorded a $53.3 million impairment charge, which is comprised of a non-cash goodwill impairment charge of $45.8 million and a non-cash acquisition-related intangible assets impairment charge of $7.5 million.
Consistent with prior years, we performed our annual goodwill impairment test using measurement data as of the first day of the second fiscal quarter of 2011. The estimated fair value of the Ethernet Switching & IP Routing reporting unit exceeded its carrying value by approximately $176.0 million and the ADP reporting unit exceeded its carrying value by approximately $34.0 million. The respective fair values of our remaining reporting units exceeded carrying value by significant amounts. Based on the goodwill impairment test results, our reporting units passed step one of the impairment test and no further testing was required. The sensitivity of these test results is discussed under the “Critical Accounting Estimates” section below.
Loss on sale of subsidiary.Loss on sale of subsidiary for the year ended October 29, 2011 is summarized as follows (in thousands, except percentages):
| | | | | | | | | | | | | | | | | | | | | | | | |
| | | October 29,
2011 | | | % of Net
Revenues | | | October 30,
2010 | | | % of Net
Revenues | | | Increase/
(Decrease) | | | %
Change | |
Fiscal year ended | | $ | 12,756 | | | | 0.6 | % | | $ | — | | | | — | % | | $ | 12,756 | | | | 100.0 | % |
During the year ended October 29, 2011, we recorded a loss of $12.8 million on the sale of SBS, consisting primarily of loss on disposal of goodwill of $1.7 million and write-down of intangible assets of $11.1 million (see Note 17, “Loss on Sale of Subsidiary,” of the Notes to Consolidated Financial Statements). We did not record any loss on sale of subsidiary for the years ended October 30, 2010 and October 31, 2009.
Interest income and other expenses, net.Interest income and other expenses, net, are summarized as follows (in thousands, except percentages):
| | | | | | | | | | | | | | | | | | | | | | | | |
| | | October 29,
2011 | | | % of Net
Revenues | | | October 30,
2010 | | | % of Net
Revenues | | | Increase/
(Decrease) | | | %
Change | |
Fiscal year ended | | $ | (378 | ) | | | — | % | | $ | (6,452 | ) | | | (0.3 | )% | | $ | 6,074 | | | | 94.1 | % |
| | | | | | |
| | | October 30,
2010 | | | % of Net
Revenues | | | October 31,
2009 | | | % of Net
Revenues | | | Increase/
(Decrease) | | | %
Change | |
Fiscal year ended | | $ | (6,452 | ) | | | (0.3 | )% | | $ | (2,382 | ) | | | (0.1 | )% | | $ | (4,070 | ) | | | (170.9 | )% |
45
For the year ended October 29, 2011 compared with fiscal year 2010, the increase in interest income and other expenses, net, was primarily due to higher foreign exchange losses recognized during the year ended October 30, 2010. Additionally, beginning in the first fiscal quarter of 2011, gains or losses relating to the effective portion of foreign currency cash flow derivatives are recorded in cost of revenues and operating expenses to match the underlying exposure to the related hedge results (see Note 11, “Derivative Instruments and Hedging Activities” of the Notes to Consolidated Financial Statements). In the prior periods, net losses recorded in other expenses were not material, and have not been reclassified.
For the year ended October 30, 2010 compared with fiscal year 2009, the decrease in interest income and other expenses, net, was primarily due to lower interest income in fiscal year 2010 resulting from a decrease in investment balances, as well as foreign exchange losses recognized in fiscal year 2010.
Interest expense. Interest expense primarily represents the interest cost associated with our term loan, senior secured notes and convertible subordinated debt (see Note 9, “Borrowings,” of the Notes to Consolidated Financial Statements). Interest expense is summarized as follows (in thousands, except percentages):
| | | | | | | | | | | | | | | | | | | | | | | | |
| | | October 29,
2011 | | | % of Net
Revenues | | | October 30,
2010 | | | % of Net
Revenues | | | Increase/
(Decrease) | | | %
Change | |
Fiscal year ended | | $ | (97,838 | ) | | | (4.6 | )% | | $ | (85,858 | ) | | | (4.1 | )% | | $ | 11,980 | | | | 14.0 | % |
| | | | | | |
| | | October 30,
2010 | | | % of Net
Revenues | | | October 31,
2009 | | | % of Net
Revenues | | | Increase/
(Decrease) | | | %
Change | |
Fiscal year ended | | $ | (85,858 | ) | | | (4.1 | )% | | $ | (99,294 | ) | | | (5.1 | )% | | $ | (13,436 | ) | | | (13.5 | )% |
Interest expense increased for the year ended October 29, 2011 compared with fiscal year 2010 primarily as a result of the write-off of debt issuance costs and debt discount of $25.5 million related to the refinancing of the term loan facility in the third fiscal quarter of 2011, and capitalization of a portion of interest cost in connection with the development of our San Jose, California campus in fiscal year 2010. This was partially offset by a reduction in debt, with Brocade electing to make accelerated payments towards the principal of the term loan as well as lower interest rates on amending the term debt credit agreement.
Interest expense decreased for the year ended October 30, 2010 compared with fiscal year 2009 primarily as a result of the Company electing to make accelerated payments towards the principal of the term loan since it was obtained in the fourth fiscal quarter of 2008 and the retirement of convertible subordinated debt on February 16, 2010.
We obtained the term loan during the fourth fiscal quarter of 2008. In January 2010, we issued $600 million of long-term fixed rate notes and used the proceeds to pay down a substantial portion of the outstanding term loan, and retire the convertible subordinated debt. In June 2011, we amended our credit agreement for our Senior Secured Credit Facility to refinance all of the outstanding term loan that effectively reduced interest rates, and is expected to provide us greater flexibility, including extending the maturity date on the term loan to October 31, 2014, reducing the required principal payments on a quarterly basis, and providing more flexibility in the use of our cash from operations, including for our share repurchase program. As of October 29, 2011 and October 30, 2010, the carrying value of the outstanding balance of our term loan was $186.9 million and $325.9 million, respectively. We review future compliance with applicable debt covenants and were in compliance with such covenants as of October 29, 2011.
46
Gain (loss) on sale of investments and property, net.Gain (loss) on sale of investments and property, net, is summarized as follows (in thousands, except percentages):
| | | | | | | | | | | | | | | | | | | | | | | | |
| | | October 29,
2011 | | | % of Net
Revenues | | | October 30,
2010 | | | % of Net
Revenues | | | Increase/
(Decrease) | | | %
Change | |
Fiscal year ended | | $ | 124 | | | | — | % | | $ | (8,551 | ) | | | (0.4 | )% | | $ | 8,675 | | | | 101.5 | % |
| | | | | | |
| | | October 30,
2010 | | | % of Net
Revenues | | | October 31,
2009 | | | % of Net
Revenues | | | Increase/
(Decrease) | | | %
Change | |
Fiscal year ended | | $ | (8,551 | ) | | | (0.4 | )% | | $ | (602 | ) | | | — | % | | $ | (7,949 | ) | | | (1,320.4 | )% |
For the year ended October 29, 2011 compared with fiscal year 2010, the increase in gain (loss) on sale of investments and property, net, was primarily due to an immaterial gain on sale of investments, net, for the year ended October 29, 2011 as compared to an $8.7 million loss on the sale of owned property in San Jose during the first quarter of fiscal year 2010 to an unrelated third party.
For the year ended October 30, 2010 compared with fiscal year 2009, the decrease in gain (loss) on sale of investments and property, net, was primarily related to the $8.7 million loss on the sale of owned property in San Jose during the first quarter of fiscal year 2010 to an unrelated third party (see Note 13, “Sale-Leaseback Transaction,” of the Notes to Consolidated Financial Statements).
Income tax provision (benefit). Income tax provision (benefit) and the effective tax rates are summarized as follows (in thousands, except effective tax rates):
| | | | | | | | | | | | |
| | | Fiscal Year Ended | |
| | | October 29,
2011 | | | October 30,
2010 | | | October 31,
2009 | |
Income tax provision (benefit) | | $ | 28,818 | | | $ | (9,553 | ) | | $ | 6,614 | |
Effective tax rate | | | 36.3 | % | | | (8.9 | )% | | | (8.6 | )% |
We recorded a tax provision for the year ended October 29, 2011 compared to a tax benefit in fiscal year 2010 primarily due to the following on a net basis (additionally, see Note 15, “Income Taxes,” of the Notes to Consolidated Financial Statements in Part II, Item 8 of this Form 10-K):
| | • | | A cash repatriation of $200.0 million from our offshore operations; partially offset by |
| | • | | A retroactive reinstatement of the Federal R&D credit provision; and |
| | • | | A benefit from the release of fiscal year 2007 and 2008 Federal R&D credit reserves as a result of the IRS audit settlement. |
Based on the fiscal year 2012 financial forecast, we expect the effective tax rate to be lower than fiscal year 2011. Factors such as the mix of Ethernet versus Data Storage products and domestic versus international profits could affect our tax expense. As estimates and judgments are used to project such domestic and international earnings, the impact to our tax provision could vary if the current planning or assumptions change. Our income tax provision could change from either effects of changing tax laws and regulations, or differences in international revenues and earnings from those historically achieved, a factor largely influenced by the buying behavior of our OEM and channel partners. In addition, we do not forecast discrete events, such as a settlement of tax audits with governmental authorities due to their inherent uncertainty. Such settlements could materially impact the Company’s tax expense. Given that the tax rate is driven by several different factors, it is not possible to estimate our future tax rate with a high degree of certainty.
We recorded a tax benefit for the year ended October 30, 2010 compared to a tax provision in fiscal year 2009 primarily due to the following on a net basis:
| | • | | A benefit from the release of certain reserves relates to the settlement of the Company’s fiscal year 2003 IRS audit; |
47
| | • | | A benefit from the release of pre fiscal year 2005 California R&D credit reserves as a result of the Notice of Proposed Adjusted Carryover Amount issued by the Franchise Tax Board (“FTB”); |
| | • | | A benefit from the release of certain reserves relating to foreign subsidiaries; |
| | • | | A benefit from the confirmation by the U.S. Court of Appeals for the Ninth Circuit of the tax court’s decision inXilinx, Inc. v. Commissioner related to certain stock option treatment; |
| | • | | A benefit from the IRS decision to concede the intercompany gross receipts issue for R&D credit calculations; |
| | • | | A benefit from the settlement of the Foundry IRS audit; |
| | • | | A nonrecurring loss on the sale of property; and |
| | • | | A benefit from a law change allowing 5-year carryback on net operating losses as a result of the American Recovery and Reinvestment Act of 2009 effective on November 20, 2009; partially offset by |
| | • | | The lapse of the Federal R&D credit periods after December 31, 2009 until December 17, 2010 when it was subsequently reinstated. |
The Company accounts for uncertainty in income taxes using a two-step approach to recognizing and measuring uncertain tax positions. The first step is to evaluate the tax position for recognition by determining if the weight of available evidence indicates that it is more likely than not that the position will be sustained on audit, including resolution of related appeals or litigation processes, if any. The second step is to measure the tax benefit as the largest amount that is more than 50% likely of being realized upon settlement. The Company classifies the liability for unrecognized tax benefits as current to the extent that the Company anticipates payment (or receipt) of cash within one year. Interest and penalties related to uncertain tax positions are recognized in the provision for income taxes.
The IRS and other tax authorities regularly examine our income tax returns. We are currently under negotiations with the Appeals division of the IRS for the audit of fiscal years 2004 through 2008, which we expect to resolve fiscal years 2004 through 2006 during the next twelve months. In addition, we are in negotiations with the foreign tax authorities to receive collateral relief on transfer pricing settlements with the IRS. We believe that our reserves for unrecognized tax benefits are adequate for all open tax years. The timing of the resolution of income tax examinations, as well as the amounts and timing of related settlements, is highly uncertain. The Company believes that before the end of fiscal year 2012, it is reasonably possible that either certain audits will conclude or the statute of limitations relating to certain income tax examination periods will expire, or both. Given the uncertainty as to settlement terms, the timing of payments and the impact of such settlements on other uncertain tax positions, the range of estimated potential decreases in underlying uncertain tax positions is between $0 and $24 million in the next twelve months. For additional discussion, see Note 15, “Income Taxes,” of the Notes to Consolidated Financial Statements in Part II, Item 8 of this Form 10-K.
The Company believes that sufficient positive evidence exists from historical operations and projections of taxable income in future years to conclude that it is more likely than not that the Company will realize its deferred tax assets. Accordingly, the Company applies a valuation allowance only on certain deferred tax assets relating to capital loss carryforwards due to the limited carryforward periods of these tax assets. The Governor of the State of California has introduced tax proposals affecting future state income tax apportionment that may have a significant impact on the Company’s ability to realize certain California deferred tax assets. The Company will reevaluate the realization of its California deferred tax assets if and when the current law changes.
48
Liquidity and Capital Resources
| | | | | | | | | | | | |
| | | October 29,
2011 | | | October 30,
2010 | | | Increase/
(Decrease) | |
| | | (in thousands) | | | (in thousands) | | | | |
Cash and cash equivalents | | $ | 414,202 | | | $ | 333,984 | | | $ | 80,218 | |
Short-term investments | | | 774 | | | | 1,998 | | | | (1,224 | ) |
| | | | | | | | | | | | |
Total | | $ | 414,976 | | | $ | 335,982 | | | $ | 78,994 | |
| | | | | | | | | | | | |
Percentage of total assets | | | 12 | % | | | 9 | % | | | | |
We use cash generated by operations as our primary source of liquidity. We expect that cash provided by operating activities may fluctuate in future periods as a result of a number of factors, including fluctuations in our operating results, the rate at which products are shipped during the quarter, accounts receivable collections, inventory and supply chain management, and the timing and amount of tax and other payments. For additional discussion, see “Part I—Item 1A. Risk Factors.”
In June 2011, we amended our credit agreement for our Senior Secured Credit Facility to refinance all of the outstanding term loan that effectively reduced interest rates, and is expected to provide us greater flexibility, including extending the maturity date on the term loan to October 31, 2014, reducing the required principal payments on a quarterly basis, and providing more flexibility in the use of our cash from operations, including for our share repurchase program. In the fourth fiscal quarter of 2011, we repatriated $200.0 million from our offshore operations, with which we repurchased approximately 46.5 million shares of our stock. The Company recorded tax expense of $49.7 million related to this repatriation.
Based on past performance and current expectations, we believe that internally generated cash flows are sufficient to support business operations, capital expenditures, contractual obligations, and other liquidity requirements associated with our operations for at least the next twelve months. Also, we have up to $125 million available under our revolving credit facility, and we can factor our trade receivables up to the maximum amount available at any time under our $50 million factoring facility to provide additional liquidity. There are no other transactions, arrangements, or other relationships with unconsolidated entities or other persons that are reasonably likely to materially affect liquidity and the availability of and our requirements for capital resources.
Our existing cash, cash equivalents and short-term investments totaled $415.0 million as of October 29, 2011. Of this amount, approximately 75% was held by our foreign subsidiaries. Under current tax laws and regulations, if these funds are distributed to the United States in the form of dividends or otherwise, we may be subject to additional U.S. income taxes and foreign withholding taxes.
Financial Condition
Cash, cash equivalents and short-term investments as of October 29, 2011 increased by $79.0 million over the balance as of October 30, 2010 primarily due to increased cash from operating activities and decreased purchases of property and equipment due to completion of our San Jose, California campus construction during fiscal year 2010, partially offset by accelerated payments towards the principal of the term loan and higher repurchases of our Company’s stock.
For the fiscal ended October 29, 2011, we generated $449.2 million in cash from operating activities, which was higher than our net income for the same period primarily as a result of adjustments to net income for non-cash items related to depreciation and amortization, stock-based compensation expense and write-off of debt issuance costs and debt discount, in addition to decrease in account receivables and increases in deferred revenues and other accrued liabilities. This was partially offset by a decrease in accounts payable.
49
Accounts receivable days sales outstanding, which is a measure of the average number of days that a company takes to collect revenue after a sale has been made, for the year ended October 29, 2011 was 42 days, down from 55 days for the year ended October 30, 2010 primarily due to improved sales linearity during the fourth fiscal quarter of 2011.
Net cash used in investing activities for the year ended October 29, 2011 totaled $91.3 million and was primarily the result of $96.8 million in purchases of property and equipment, partially offset by the sales of SBS and short-term investments.
Net cash used in financing activities for the year ended October 29, 2011 totaled $277.1 million and was primarily the result of stock repurchases of $210.7 million and net debt payment related to the term loan of $160.9 million, partially offset by proceeds from the issuance of common stock from ESPP purchases and stock option exercises of $97.2 million. During the third quarter of fiscal year 2011, we refinanced all of the outstanding term loan with a replacement term loan. Additionally, during the fourth fiscal quarter of 2011, we repatriated $200.0 million from our offshore operations, with which we repurchased approximately 46.5 million shares of our stock.
Net proceeds from the issuance of common stock in connection with employee participation in our equity compensation plans have historically been a significant component of our liquidity. The extent to which our employees participate in these programs generally increases or decreases based upon changes in the market price of our common stock. As a result, our cash flow resulting from the issuance of common stock in connection with employee participation in equity compensation plans will vary.
Fiscal Year 2011 Compared to Fiscal Year 2010
Operating Activities.Net cash provided by operating activities increased by $150.7 million for the year ended October 29, 2011 compared with fiscal year 2010. The increase was primarily due to increased accounts receivable collections and decreased payments with respect to accrued employee compensation and other accrued liabilities, partially offset by a decrease in net income during fiscal year 2011.
Investing Activities.Net cash used in investing activities decreased by $77.1 million for the year ended October 29, 2011 compared with fiscal year 2010. The decrease was primarily due to lower purchases of property and equipment and proceeds from the sale of SBS in the fiscal year 2011, partially offset by proceeds of $30.2 million from sale of property in the first fiscal quarter of 2010. Construction of our San Jose, California campus was completed in the third fiscal quarter of 2010.
Financing Activities.Net cash used in financing activities increased by $149.4 million for the year ended October 29, 2011 compared with fiscal year 2010. The increase was primarily due to higher repurchases of our Company’s stock during the fiscal year 2011, partially offset by lower net debt payments and higher proceeds from issuance of common stock during fiscal year 2011.
Fiscal Year 2010 Compared to Fiscal Year 2009
Operating Activities.Net cash provided by operating activities increased by $183.0 million for the year ended October 30, 2010 compared with fiscal year 2009. The increase was primarily due to an increase in net income, and the $160.0 million payment of the liability associated with the settlement of the class action lawsuit in fiscal year 2009. This increase was partially offset by a decrease in accrued employee compensation, and accounts payable during fiscal year 2010.
Investing Activities.Net cash used in investing activities decreased by $30.7 million for the year ended October 30, 2010 compared with fiscal year 2009. The decrease was primarily due to cash paid in connection with the Foundry acquisition during the fiscal year ended October 31, 2009 and increased proceeds from the sale
50
of property during the fiscal year ended October 30, 2010. This decrease was partially offset by a decrease in restricted cash which was released to finance a portion of the Foundry acquisition, as well as increased purchase of property and equipment and decreased proceeds from maturities and sale of short-term and long-term investments.
Financing Activities.Net cash used in financing activities increased by $90.0 million for the year ended October 30, 2010 compared with fiscal year 2009. The increase was primarily due to increased payment of principal related to the term loan, payment to retire the convertible subordinated debt and revolving credit facility, decreased proceeds from the issuance of common stock, and increased common stock repurchases made during the year ended October 30, 2010, partially offset by increased proceeds from the issuance of senior secured notes and decreased payment of senior underwriting fees related to the term loan.
Liquidity
Manufacturing and Purchase Commitments.We have manufacturing arrangements with contract manufacturers under which we provide twelve-month product forecasts and place purchase orders in advance of the scheduled delivery of products to our customers. Our purchase commitments reserve reflects our estimate of purchase commitments we do not expect to consume in normal operations within the next twelve months, in accordance with our policy (see Note 10, “Commitments and Contingencies,” of the Notes to Consolidated Financial Statements in Part II, Item 8 of this Form 10-K).
Income Taxes.We accrue U.S. income taxes on the earnings of our foreign subsidiaries unless the earnings are considered indefinitely reinvested outside of the United States. In the fourth fiscal quarter of 2011, we repatriated $200.0 million from our offshore operations, with which we repurchased approximately 46.5 million shares of our stock. The Company recorded tax expense of $49.7 million related to this one-time cash repatriation to fund the stock repurchase program. Based on past performance and current expectations, we believe that US generated cash flows are sufficient to support our US business operations, capital expenditures, contractual obligations, and other liquidity requirements associated with our operations. Also, we have up to $125 million available under our revolving credit facility, and we can factor our trade receivables up to the maximum amount available at any time of our $50 million factoring facility to provide additional liquidity. We intend to reinvest current and remaining accumulated earnings of our foreign subsidiaries for expansion of our business operations outside the United States for an indefinite period of time.
Our existing cash, cash equivalents and short-term investments totaled $415.0 million as of October 29, 2011. Of this amount, approximately 75% was held by our foreign subsidiaries. Under current tax laws and regulations, if these funds are distributed to the United States in the form of dividends or otherwise, we may be subject to additional U.S. income taxes and foreign withholding taxes.
The IRS and other tax authorities regularly examine our income tax returns (see Note 15, “Income Taxes,” of the Notes to Consolidated Financial Statements in Part II, Item 8 of this Form 10-K). We believe we have adequate reserves for all open tax years.
Senior Secured Credit Facility.A portion of our outstanding debt is related to the financing of the Foundry acquisition, the costs and expenses related to the acquisition, and the ongoing working capital and other general corporate purposes of the combined organization after consummation of the acquisition (see Note 9, “Borrowings,” of the Notes to Consolidated Financial Statements). During the third quarter of fiscal year 2011, we amended our credit agreement to refinance all of the outstanding term loan with a replacement term loan that reduced interest rates on the term loan facility, and to amend certain other provisions of the Credit Agreement to provide us with greater operating flexibility, including extending the maturity date of the term loan facility to October 31, 2014 and removing certain restrictions on the repurchase of the Company’s shares, provided the consolidated senior secured leverage ratio is under 2.00. In addition to the refinancing, during the fiscal year ended October 29, 2011, we paid $160.9 million towards the principal of the Senior Secured Credit Facility,
51
$130.3 million of which were voluntary prepayments. We have the following resources available to obtain short-term or long-term financing, if we need additional liquidity, as of October 29, 2011 (in thousands):
| | | | | | | | | | | | |
| | | Original Amount
Available | | | October 29, 2011 | |
| | | | Used | | | Available | |
Revolving credit facility | | $ | 125,000 | | | $ | — | | | $ | 125,000 | |
Senior Secured Notes.In January 2010, we issued $600 million of long-term fixed rate notes and used the proceeds to pay down a substantial portion of the outstanding term loan, and retire the convertible subordinated debt due on February 15, 2010 (see Note 9, “Borrowings,” of the Notes to Consolidated Financial Statements).
Trade Receivables Factoring Facility. We have an agreement with a financial institution to sell certain of our trade receivables from customers with limited, non-credit related, recourse provisions. The sale of receivables eliminates our credit exposure in relation to these receivables. Total trade receivables sold under our factoring facility are summarized as follows (in thousands):
| | | | | | | | |
| | | Fiscal Year Ended | |
| | | October 29,
2011 | | | October 30,
2010 | |
Trade receivables sold under factoring agreement | | $ | 50,534 | | | $ | 61,408 | |
Under the terms of the factoring agreement, the remaining available amount of the factoring facility as of October 29, 2011 is $50.0 million.
Contractual Obligations
The following table summarizes our contractual obligations, including interest expense, and commitments as of October 29, 2011 (in thousands):
| | | | | | | | | | | | | | | | | | | | |
| | | Total | | | Less than
1 Year | | | 1 – 3 Years | | | 3 – 5 Years | | | More than
5 Years | |
Contractual Obligations: | | | | | | | | | | | | | | | | | | | | |
Term loan (1) | | $ | 201,182 | | | $ | 44,832 | | | $ | 156,350 | | | $ | — | | | $ | — | |
Senior secured notes due 2018 (1) | | | 424,219 | | | | 19,875 | | | | 39,750 | | | | 39,750 | | | | 324,844 | |
Senior secured notes due 2020 (1) | | | 470,156 | | | | 20,625 | | | | 41,250 | | | | 41,250 | | | | 367,031 | |
Non-cancelable operating leases (2) | | | 98,556 | | | | 23,383 | | | | 36,145 | | | | 27,386 | | | | 11,642 | |
Non-cancelable capital lease | | | 7,525 | | | | 2,221 | | | | 4,442 | | | | 862 | | | | — | |
Purchase commitments, gross (3) | | | 257,080 | | | | 257,080 | | | | — | | | | — | | | | — | |
| | | | | | | | | | | | | | | | | | | | |
Total contractual obligations | | $ | 1,458,718 | | | $ | 368,016 | | | $ | 277,937 | | | $ | 109,248 | | | $ | 703,517 | |
| | | | | | | | | | | | | | | | | | | | |
Other Commitments: | | | | | | | | | | | | | | | | | | | | |
Standby letters of credit | | $ | 251 | | | $ | n/a | | | $ | n/a | | | $ | n/a | | | $ | n/a | |
| | | | | | | | | | | | | | | | | | | | |
Unrecognized tax benefits and related accrued interest (4) | | $ | 152,816 | | | $ | n/a | | | $ | n/a | | | $ | n/a | | | $ | n/a | |
| | | | | | | | | | | | | | | | | | | | |
| (1) | Amount reflects total anticipated cash payments, including anticipated interest payments. |
| (2) | Amount excludes contractual sublease income of $35.7 million, which consists of $6.6 million to be received in less than one year, $13.7 million to be received in one to three years, $14.2 million to be received in three to five years and $1.2 million to be received in more than five years. |
| (3) | Amount reflects total gross purchase commitments under our manufacturing arrangements with third-party contract manufacturers. Of this amount, we have accrued $5.1 million for estimated purchase commitments that we do not expect to consume in normal operations within the next twelve months, in accordance with our policy. |
52
| (4) | As of October 29, 2011, we had a liability for unrecognized tax benefits of $149.4 million and a net accrual for the payment of related interest and penalties of $3.4 million. We expect to resolve the fiscal year 2004 through 2006 IRS audit during the next twelve months. As such, after we reach settlement with the IRS, we expect to record a corresponding adjustment to our unrecognized tax benefits. Due to availability of net operating losses, the IRS audit settlement is not expected to result in a significant tax payment. Other than the expected 2004 to 2006 settlement, we are unable to make a reasonably reliable estimate of the timing of payments in individual years due to uncertainties in the timing of tax audit outcome. |
Share Repurchase Program.As of November 29, 2007, our Board of Directors authorized a total of $800.0 million for the repurchase of our common stock. The purchases may be made, from time to time, in the open market or by privately negotiated transactions and will be funded from available working capital. The number of shares to be purchased and the timing of purchases will be based on the level of our cash balances, general business and market conditions, and other factors, including alternative investment opportunities. For the year ended October 29, 2011, we repurchased 48.0 million shares for an aggregate purchase price of $210.7 million. Approximately $178.4 million remains authorized for future repurchases under this program as of October 29, 2011. We are subject to certain covenants relating to our borrowings that restrict the amount of our Company’s shares that we can repurchase. There is no restriction on the repurchase of our Company’s shares under the terms of our Senior Secured Credit Facility, provided our consolidated senior secured leverage ratio as defined in the credit agreement is under 2.00. For the year ended October 30, 2010, we repurchased 4.5 million shares for an aggregate purchase price of $25.0 million.
Off-Balance Sheet Arrangements
As part of our ongoing business, we do not participate in transactions that generate material relationships with unconsolidated entities or financial partnerships, such as entities often referred to as structured finance or special purpose entities, which would have been established for the purpose of facilitating off-balance sheet arrangements or for other contractually narrow or limited purposes. As of October 29, 2011, we did not have any significant off-balance sheet arrangements, as defined in Item 303(a)(4)(ii) of SEC Regulation S-K.
Critical Accounting Estimates
Our discussion and analysis of financial condition and results of operations are based upon our consolidated financial statements, which have been prepared in accordance with U.S. generally accepted accounting principles. The preparation of these Consolidated Financial Statements requires us to make estimates and judgments that affect the reported amounts of assets, liabilities, revenues and expenses, and related disclosure of contingent assets and liabilities. We evaluate, on an ongoing basis, our estimates and judgments, including, but not limited to, those related to sales allowances and programs, bad debts, stock-based compensation, commissions, allocation of purchase price of acquisitions, excess inventory and purchase commitments, restructuring costs, facilities lease losses, impairment of goodwill and intangible assets, litigation, uncertain tax positions and investments. We base our estimates on historical experience and assumptions that we believe to be reasonable under the circumstances, the results of which form the basis for making judgments about the carrying values of assets and liabilities that are not readily apparent from other sources. Actual results may differ from these estimates.
The methods, estimates and judgments we use in applying our most critical accounting policies have a significant impact on the results that we report in our Consolidated Financial Statements. We believe the following critical accounting policies, among others, require significant estimates and judgments used in the preparation of our consolidated financial statements.
Revenue recognition.Our multiple-element product offerings include networking hardware with embedded software products and support, which are considered separate units of accounting. For certain of our products, software and non-software components function together to deliver the tangible products’ essential functionality.
53
We allocate revenue to each element in a multiple-element arrangement based upon their relative selling price. When applying the relative selling price method, we determine the selling price for each deliverable using vendor-specific objective evidence (“VSOE”) of selling price, if it exists, or third-party evidence (“TPE”) of selling price. If neither VSOE nor TPE of selling price exist for a deliverable, we use our best estimate of selling price for that deliverable. Revenue allocated to each element is then recognized when the basic revenue recognition criteria are met for each element.
Consistent with our methodology under previous accounting guidance, we determine VSOE based on our normal pricing and discounting practices for the specific product or service when sold separately. In determining VSOE, we require that a substantial majority of the selling prices for a product or service fall within a reasonably narrow pricing range, generally evidenced by approximately 80% of such historical stand-alone transactions falling within ±15% of the median rates. For post-contract customer support, however, we consider stated renewal rates in determining VSOE.
In most instances, we are not able to establish VSOE for all deliverables in an arrangement with multiple elements. This may be due to us infrequently selling each element separately, not pricing products within a narrow range, or only having a limited sales history. When VSOE cannot be established, we attempt to establish selling price for each element based on TPE. TPE is determined based on competitor prices for similar deliverables when sold separately. Generally, our go-to-market strategy differs from that of our competitors and our offerings contain a significant level of customization and differentiation such that the comparable pricing of products with similar functionality cannot be obtained. Furthermore, we are unable to reliably determine what similar competitor products’ selling prices are on a stand-alone basis. Therefore, we are typically not able to determine TPE.
When we are unable to establish selling price using VSOE or TPE, we use estimated selling price (“ESP”) in our allocation of the arrangement consideration. The objective of ESP is to determine the price at which we would transact a sale if the product or service were sold on a stand-alone basis. ESP is generally used for offerings that are not typically sold on a stand-alone basis or for new or highly customized offerings.
We determine ESP for a product or service by considering multiple factors including, but not limited to, geographies, market conditions, competitive landscape, internal costs, gross margin objectives and pricing practices. The determination of ESP is made through consultation with and formal approval by our management, taking into consideration the go-to-market strategy. If circumstances related to our estimates for revenue recognition change, our allocation of revenue to each element in a multiple-element arrangement may also change.
Stock-based compensation.We grant stock options for shares in the Company’s common stock, restricted stock units and other types of equity compensation awards to our employees and directors under various equity compensation plans. For additional discussion, see Note 14, “Stock-Based Compensation,” of the Notes to Consolidated Financial Statements in Part II, Item 8 of this Form 10-K.
The compensation expense for stock-based awards is adjusted for an estimated impact of forfeitures and is recognized over the expected term of the award under a graded or straight-line vesting method. In addition, we record stock-based compensation expense in connection with shares issued under our employee stock purchase plan using the graded vesting method over the twenty-four month offering period.
We use the Black-Scholes option pricing model to determine the fair value of stock options granted when the measurement date is certain. We also use the Black-Scholes option pricing model to determine the fair value of the option component of employee stock purchase plan shares. The determination of the fair value of stock-based awards using the option pricing model is affected by our stock price as well as assumptions regarding a number of complex and subjective variables. These variables include our expected stock price volatility over the expected term of the awards, projected and actual employee stock option exercise behaviors, risk-free interest rates, estimated forfeitures and expected dividends.
54
We estimate the expected term of stock options granted by calculating the average term from our historical stock option exercise experience. We do not anticipate paying any cash dividends in the foreseeable future, and therefore we use an expected dividend yield of zero in the option pricing model. We are required to estimate forfeitures at the time of grant and revise those estimates in subsequent periods if actual forfeitures differ from those estimates. We use historical data to estimate pre-vesting option forfeitures and record stock-based compensation expense only for those awards that are expected to vest. We use implied volatilities from traded options of the Company’s common stock and historical volatilities of the Company’s common stock to estimate volatility over the expected term of the awards.
The assumptions used in calculating the fair value of stock-based awards represent management’s best estimates, but these estimates involve inherent uncertainties and the application of management judgment. As a result, if factors change and we use different assumptions, our stock-based compensation expense could be materially different in the future.
Acquisitions—Purchase Price Allocation.We allocate the purchase price of an acquired business to the assets acquired and liabilities assumed, including identifiable intangible assets, based on their respective fair values at the acquisition date. The excess of the purchase price over the fair value of the underlying acquired net tangible and intangible assets, if any, is recorded as goodwill. Management estimates the fair value of assets and liabilities based upon quoted market prices, the carrying value of the acquired assets and widely accepted valuation techniques. We adjust the preliminary purchase price allocation, as necessary, typically up to one year after the acquisition closing date as we obtain more information regarding asset valuations and liabilities assumed.
Inventory valuation and purchase commitment liabilities.We write down inventory and record purchase commitment liabilities for estimated excess and obsolete inventory equal to the difference between the cost of inventory and the estimated fair value based upon forecast of future product demand, product transition cycles and market conditions. Any significant unanticipated changes in demand or technological development could have a significant impact on the value of our inventory and purchase commitments, and our reported results. If actual market conditions are less favorable than those projected, additional inventory write-downs, purchase commitment liabilities and charges against earnings may be required.
Restructuring costs and facilities lease losses.We monitor and regularly evaluate our organizational structure and associated operating expenses. Depending on events and circumstances, we may decide to take additional actions to reduce future operating costs as our business requirements evolve. In determining restructuring charges, we analyze our future operating requirements, including the required headcount by business functions and facility space requirements. Our restructuring costs and any resulting accruals involve significant estimates made by management using the best information available at the time the estimates are made. In recording severance accruals, we record a liability when all of the following conditions have been met: employees’ rights to receive compensation for future absences is attributable to employees’ services already rendered; the obligation relates to rights that vest or accumulate; payment of the compensation is probable; and the amount can be reasonably estimated. In recording facilities lease loss accruals, we make various assumptions, including the time period over which the facilities are expected to be vacant, expected sublease terms, expected sublease rates, expected future operating costs, and expected future use of the facilities. Our estimates involve a number of risks and uncertainties, some of which are beyond our control, including future real estate market conditions and our ability to successfully enter into subleases or lease termination agreements with terms as favorable as those assumed when arriving at our estimates. We regularly evaluate a number of factors to determine the appropriateness and reasonableness of our restructuring and facilities lease loss accruals, including the various assumptions noted above. If actual results differ significantly from our estimates, we may be required to adjust our restructuring and facilities lease loss accruals in the future.
Impairment of goodwill and intangible assets. Goodwill is generated as a result of business combinations. We conduct our goodwill impairment test annually, as of the first day of the second fiscal quarter, or whenever events or changes in facts and circumstances indicate that the fair value of the reporting unit may be less than its
55
carrying amount. Events which might indicate impairment include, but are not limited to, strategic decisions made in response to economic and competitive conditions, the impact of the economic environment on our customer base, material negative changes in relationships with significant customers, and/or a significant decline in our stock price for a sustained period. Consistent with prior years, we performed our annual goodwill impairment test using measurement data as of the first day of the second fiscal quarter of 2011.
We apply a two-step approach in testing goodwill for impairment for each reporting unit, which we have determined to be at the operating segment level. The reporting units are determined by the components of our operating segments that constitute a business for which both (i) discrete financial information is available and (ii) segment management regularly reviews the operating results of that component. Our four reporting units are: Data Storage Products; Ethernet Switching & IP Routing, which includes Open Systems Interconnection Reference Model (“OSI”) Layer 2-3 products; Application Delivery Products (“ADP”), which includes OSI Layer 4-7 products; and Global Services.
The first step tests for potential impairment by comparing the fair value of reporting units with reporting units’ net asset values. If the fair value of the reporting unit exceeds the carrying value of the reporting unit’s net assets, then goodwill is not impaired and no further testing is required. If the fair value of reporting unit is below the reporting unit’s carrying value, then the second step is required to measure the amount of potential impairment. The second step requires an assignment of the reporting unit’s fair value to the reporting unit’s assets and liabilities, using the initial acquisition accounting guidance related to business combinations, to determine the implied fair value of the reporting unit’s goodwill. The implied fair value of the reporting unit’s goodwill is then compared with the carrying amount of the reporting unit’s goodwill to determine the goodwill impairment loss to be recognized, if any. If the carrying value of a reporting unit’s goodwill exceeds its implied fair value, we record an impairment loss equal to the difference.
To determine the reporting unit’s fair values, we use the income approach, the market approach, or a combination thereof. The income approach provides an estimate of fair value based on discounted expected future cash flows. The market approach provides an estimate of the fair value of our four reporting units using various prices or market multiples applied to the reporting unit’s operating results and then applying an appropriate control premium. During our fiscal year 2011 annual goodwill impairment test under the first step, we used a combination of approaches to estimate reporting units’ fair values. We believed that at the time of impairment testing performed in second fiscal quarter of 2011, the income approach and the market approach were equally representative of a reporting unit’s fair value.
Determining the fair value of a reporting unit or an intangible asset is judgmental in nature and involves the use of significant estimates and assumptions. We based our fair value estimates on assumptions we believe to be reasonable, but that are unpredictable and inherently uncertain. Estimates and assumptions with respect to the determination of the fair value of our reporting units using the income approach include, among other inputs:
| | • | | Our operating forecasts; |
| | • | | Revenue growth rates; and |
| | • | | Risk-commensurate discount rates and costs of capital. |
Our estimates of revenues and costs are based on historical data, various internal estimates and a variety of external sources, and are developed as part of our regular long-range planning process. The control premium used in market or combined approaches is determined by considering control premiums offered as part of acquisitions that have occurred in a reporting unit’s comparable market segments.
Based on our step one analysis results, we believe that all our reporting units pass the step one test and no further testing is required. However, because some of the inherent assumptions and estimates used in determining the fair value of these reportable segments are outside the control of management, changes in these underlying
56
assumptions can adversely impact fair value. The sensitivity analysis below quantifies the impact of key assumptions on certain reporting units’ fair value estimates. The principal key assumptions impacting our estimates were (i) discount rates and (ii) DCF terminal value multipliers. As the discount rates, ultimately, reflect the risk of achieving reporting units’ revenue and cash flow projections, we do not believe that a separate sensitivity analysis for changes in revenue and cash flow projections is meaningful or useful.
The estimated fair value of the Ethernet Switching & IP Routing reporting unit exceeded its carrying value by approximately $176 million and the ADP reporting unit exceeded its carrying value by approximately $34 million. The respective fair values of our remaining reporting units exceeded carrying value by significant amounts and were not subject to the sensitivity analysis presented below.
The following table summarizes the approximate impact that a change in principal key assumptions would have on the estimated fair value of Ethernet Switching & IP Routing reporting unit, leaving all other assumptions unchanged:
| | | | | | | | | | | | |
| | | Change | | | Approximate
Impact on Fair
Value
(In millions) | | | Excess of
Fair Value over
Carrying Value
(In millions) | |
| | | |
Discount rate | | | ±1 | % | | $ | (28) – 28 | | | $ | 148 – 204 | |
| | | |
DCF terminal value multiplier | | | ±0.5x | | | $ | (47) – 47 | | | $ | 129 – 223 | |
The following table summarizes the approximate impact that a change in principal key assumptions would have on the estimated fair value of ADP reporting unit, leaving all other assumptions unchanged:
| | | | | | | | | | | | |
| | | Change | | | Approximate
Impact on Fair
Value
(In millions) | | | Excess of
Fair Value over
Carrying Value
(In millions) | |
| | | |
Discount rate | | | ±1 | % | | $ | (5) – 5 | | | $ | 29 – 39 | |
| | | |
DCF terminal value multiplier | | | ±0.5x | | | $ | (6) – 6 | | | $ | 28 – 40 | |
Accounting for income taxes.The determination of our tax provision is subject to estimates and judgments due to operations in multiple tax jurisdictions inside and outside the United States. Sales to our international customers are principally taxed at rates that are lower than the United States statutory rates. The ability to maintain our current effective tax rate is contingent upon existing tax laws in both the United States and in the respective countries in which our international subsidiaries are located. Future changes in domestic or international tax laws could affect the continued realization of the tax benefits we are currently receiving and expect to receive from international sales. In addition, an increase in the percentage of our total revenue from international customers or in the mix of international revenue among particular tax jurisdictions could change our overall effective tax rate. In the fourth fiscal quarter of 2011, we repatriated $200.0 million from our offshore operations, with which we repurchased approximately 46.5 million shares of our stock. The Company recorded tax expense of $49.7 million related to this one-time cash repatriation to fund the stock repurchase program. We intend to reinvest current and remaining accumulated earnings of our foreign subsidiaries for expansion of our business operations outside the United States for an indefinite period of time. These earnings could become subject to United States federal and state income taxes and foreign withholding taxes, as applicable, should they be either deemed or actually remitted from our international subsidiaries to the United States. In addition, we evaluate the expected realization of our deferred tax assets and assess the need for a valuation allowance on a quarterly basis. As of October 29, 2011, our net deferred tax asset balance was $263.6 million. We believe that sufficient positive evidence exists from historical operations and projections of U.S. taxable income in future years to conclude that it is more likely than not that we would realize our deferred tax assets. Historical operations showed that we have cumulative profits for the prior 12 quarters ended October 29, 2011.
57
Accordingly, we only apply a valuation allowance on the deferred tax assets relating to capital loss carryforwards due to limited carryforward periods and the character of such tax attributes. In the event future income by jurisdiction is less than what is currently projected, we may be required to apply a valuation allowance to these deferred tax assets in jurisdictions for which realization is no longer determined to be more likely than not.
Accounting for uncertain tax benefits. The calculation of tax liabilities involves significant judgment in estimating the impact of uncertainties in the application of complex tax laws. We apply a recognition threshold and measurement attribute for financial statement disclosure of tax positions taken or expected to be taken on a tax return. Recognition of a tax position is determined when it is more likely than not that a tax position will be sustained upon examination, including resolution of any related appeals or litigation processes. A tax position that meets the more-likely-than-not recognition threshold is measured at the largest amount of benefit that is greater than 50% likely of being realized upon ultimate settlement with a taxing authority. The threshold and measurement attribute requires significant judgment by management. Resolution of these uncertainties in a manner inconsistent with our expectations could have a material impact on our results of operations.
Recent Accounting Pronouncements
For a description of recent accounting pronouncements, including the expected dates of adoption and estimated effects, if any, on our consolidated financial statements, see Note 2, “Summary of Significant Accounting Policies,” of the Notes to Consolidated Financial Statements in Part II, Item 8 of this Form 10-K.
58
| Item 7A. | Quantitative and Qualitative Disclosures About Market Risk |
In the normal course of business, we are exposed to market risks related to changes in interest rates, foreign currency exchange rates and equity prices that could impact our financial position and results of operations. Our risk management strategy with respect to these three market risks may include the use of derivative financial instruments. We use derivative contracts only to manage existing underlying exposures of the Company. Accordingly, we do not use derivative contracts for speculative purposes. Our risks and risk management strategy are outlined below. Actual gains and losses in the future may differ materially from the sensitivity analyses presented below based on changes in the timing and amount of interest rates and our actual exposures and hedges.
Interest Rate Risk
Our exposure to market risk due to changes in the general level of United States interest rates relates primarily to our term loan and cash equivalents.
We are exposed to changes in interest rates as a result of our borrowings under our term loan. As of October 29, 2011, the weighted-average annualized interest rate on the term loan was 5.4%. Based on outstanding principal indebtedness of $190.0 million under our term loan as of October 29, 2011, if market rates average 1% above the current interest rate, our annual interest expense would increase by approximately $1.9 million.
Our cash and cash equivalents are primarily maintained at five major financial institutions. The primary objective of our investment activities is the preservation of principal while maximizing investment income and minimizing risk.
The Company did not have any material investments as of October 29, 2011 and October 30, 2010 that are sensitive to changes in interest rates.
Foreign Currency Exchange Rate Risk
We are exposed to foreign currency exchange rate risk inherent in conducting business globally in numerous currencies, of which the most significant to our operations for fiscal year 2011 were the Chinese yuan, the euro, the Japanese yen, the Indian rupee, the British pound, the Singapore dollar and the Swiss franc. We are primarily exposed to foreign currency fluctuations related to operating expenses denominated in currencies other than the U.S. dollar. As such, we benefit from a stronger U.S. dollar and may be adversely affected by a weaker U.S. dollar relative to the foreign currency. We use foreign currency forward contracts designated as cash flow hedges to protect against the foreign currency exchange rate risks inherent in our forecasted operating expenses denominated in currencies other than the U.S. dollar. We recognize the gains and losses on foreign currency forward contracts in the same period as the remeasurement losses and gains of the related foreign currency denominated exposures.
We also may enter into other non-designated derivatives that consist primarily of forward contracts to minimize the risk associated with the foreign exchange effects of revaluing monetary assets and liabilities. Monetary assets and liabilities denominated in foreign currencies and any associated outstanding forward contracts are marked-to-market with realized and unrealized gains and losses included in earnings.
Alternatively, we may choose not to hedge the foreign currency risk associated with our foreign currency exposures if we believe such exposure acts as a natural foreign currency hedge for other offsetting amounts denominated in the same currency or if the currency is difficult or too expensive to hedge. As of October 29, 2011, we held $135.4 million in derivative instruments. The maximum length of time over which we are hedged as of October 29, 2011 is through October 3, 2012.
59
We have performed a sensitivity analysis as of October 29, 2011, using a modeling technique that measures the change in the fair values arising from a hypothetical 10% adverse movement in the levels of foreign currency exchange rates relative to the U.S. dollar, with all other variables held constant. The analysis covers all of our foreign currency contracts offset by the underlying exposures. The foreign currency exchange rates we used were based on market rates in effect at October 29, 2011. The sensitivity analysis indicated that a hypothetical 10% adverse movement in foreign currency exchange rates would not result in a material foreign exchange loss as of October 29, 2011.
Equity Price Risk
We had no investments in publicly traded equity securities as of October 29, 2011 and October 30, 2010. The aggregate cost of our equity investments in non-publicly traded companies was $7.0 million at October 29, 2011 and October 30, 2010. We monitor our equity investments for impairment on a periodic basis. In the event that the carrying value of the equity investment exceeds its fair value, and we determine the decline in value to be other-than-temporary, we reduce the carrying value to its current fair value. Generally, we do not attempt to reduce or eliminate our market exposure on these equity securities. We do not purchase our equity securities with the intent to use them for speculative purposes.
Our common stock is quoted on the NASDAQ Global Select Market under the symbol “BRCD.” On October 28, 2011, the last business day of our fourth fiscal quarter of 2011, the last reported sale price of our common stock on the NASDAQ Global Select Market was $4.51 per share.
60
| Item 8. | Financial Statements and Supplementary Data |
BROCADE COMMUNICATIONS SYSTEMS, INC.
INDEX TO CONSOLIDATED FINANCIAL STATEMENTS
61
Report of Independent Registered Public Accounting Firm
The Board of Directors and Stockholders
Brocade Communications Systems, Inc.:
We have audited the accompanying consolidated balance sheets of Brocade Communications Systems, Inc. and subsidiaries (the Company) as of October 29, 2011 and October 30, 2010, and the related consolidated statements of operations, stockholders’ equity and comprehensive income (loss), and cash flows for each of the years in the three-year period ended October 29, 2011. In connection with our audit of the consolidated financial statements, we also have audited the accompanying financial statement schedule. These consolidated financial statements and financial statement schedule are the responsibility of the Company’s management. Our responsibility is to express an opinion on these consolidated financial statements and financial statement schedule based on our audits.
We conducted our audits in accordance with the standards of the Public Company Accounting Oversight Board (United States). Those standards require that we plan and perform the audit to obtain reasonable assurance about whether the financial statements are free of material misstatement. An audit also includes examining, on a test basis, evidence supporting the amounts and disclosures in the financial statements, assessing the accounting principles used and significant estimates made by management, as well as evaluating the overall financial statement presentation. We believe that our audits provide a reasonable basis for our opinion.
In our opinion, the consolidated financial statements referred to above present fairly, in all material respects, the financial position of Brocade Communications Systems, Inc. and subsidiaries as of October 29, 2011 and October 30, 2010, and the results of their operations and their cash flows for each of the years in the three-year period ended October 29, 2011, in conformity with U.S. generally accepted accounting principles. Also, in our opinion, the related financial statement schedule, when considered in relation to the basic consolidated financial statements taken as a whole, presents fairly, in all material respects, the information set forth therein.
As discussed in note 2 to the consolidated financial statements, the Company adopted new accounting standards for convertible debt instruments and revenue recognition as of November 1, 2009.
We also have audited, in accordance with the standards of the Public Company Accounting Oversight Board (United States), the Company’s internal control over financial reporting as of October 29, 2011, based on criteria established inInternal Control—Integrated Framework issued by the Committee of Sponsoring Organizations of the Treadway Commission (COSO), and our report dated December 19, 2011 expressed an unqualified opinion on the effectiveness of the Company’s internal control over financial reporting.
/s/ KPMG LLP
Santa Clara, California
December 19, 2011
62
BROCADE COMMUNICATIONS SYSTEMS, INC.
CONSOLIDATED STATEMENTS OF OPERATIONS
| | | | | | | | | | | | |
| | | Fiscal Year Ended | |
| | | October 29,
2011 | | | October 30,
2010 | | | October 31,
2009 | |
| | | (In thousands, except per share amounts) | |
Net revenues | | | | | | | | | | | | |
Product | | $ | 1,789,814 | | | $ | 1,728,814 | | | $ | 1,612,961 | |
Service | | | 357,628 | | | | 362,339 | | | | 337,415 | |
| | | | | | | | | | | | |
Total net revenues | | | 2,147,442 | | | | 2,091,153 | | | | 1,950,376 | |
Cost of revenues (1) | | | | | | | | | | | | |
Product (1) | | | 677,196 | | | | 683,486 | | | | 739,354 | |
Service (1) | | | 186,712 | | | | 176,547 | | | | 180,072 | |
| | | | | | | | | | | | |
Total cost of revenues | | | 863,908 | | | | 860,033 | | | | 919,426 | |
| | | | | | | | | | | | |
Gross margin | | | | | | | | | | | | |
Product | | | 1,112,618 | | | | 1,045,328 | | | | 873,607 | |
Service | | | 170,916 | | | | 185,792 | | | | 157,343 | |
| | | | | | | | | | | | |
Total gross margin | | | 1,283,534 | | | | 1,231,120 | | | | 1,030,950 | |
Operating expenses: | | | | | | | | | | | | |
Research and development | | | 354,401 | | | | 354,260 | | | | 354,809 | |
Sales and marketing (1) | | | 608,513 | | | | 534,458 | | | | 385,155 | |
General and administrative | | | 69,506 | | | | 67,848 | | | | 84,962 | |
Legal fees associated with indemnification obligations and other related costs, net | | | 125 | | | | (163 | ) | | | 23,941 | |
Amortization of intangible assets | | | 60,713 | | | | 65,623 | | | | 68,718 | |
Acquisition and integration costs | | | — | | | | 204 | | | | 5,127 | |
Restructuring costs and facilities lease loss | | | — | | | | 1,059 | | | | 2,329 | |
In-process research and development | | | — | | | | — | | | | 26,900 | |
Goodwill and acquisition-related intangible assets impairment | | | — | | | | — | | | | 53,306 | |
Loss on sale of subsidiary | | | 12,756 | | | | — | | | | — | |
| | | | | | | | | | | | |
Total operating expenses | | | 1,106,014 | | | | 1,023,289 | | | | 1,005,247 | |
| | | | | | | | | | | | |
Income from operations | | | 177,520 | | | | 207,831 | | | | 25,703 | |
Interest income | | | 597 | | | | 763 | | | | 4,896 | |
Other expenses | | | (975 | ) | | | (7,215 | ) | | | (7,278 | ) |
Interest expense | | | (97,838 | ) | | | (85,858 | ) | | | (99,294 | ) |
Gain (loss) on sale of investments and property, net | | | 124 | | | | (8,551 | ) | | | (602 | ) |
| | | | | | | | | | | | |
Income (loss) before income tax provision (benefit) | | | 79,428 | | | | 106,970 | | | | (76,575 | ) |
Income tax provision (benefit) | | | 28,818 | | | | (9,553 | ) | | | 6,614 | |
| | | | | | | | | | | | |
Net income (loss) | | $ | 50,610 | | | $ | 116,523 | | | $ | (83,189 | ) |
| | | | | | | | | | | | |
Net income (loss) per share—basic | | $ | 0.11 | | | $ | 0.26 | | | $ | (0.21 | ) |
| | | | | | | | | | | | |
Net income (loss) per share—diluted | | $ | 0.10 | | | $ | 0.24 | | | $ | (0.21 | ) |
| | | | | | | | | | | | |
Shares used in per share calculation—basic | | | 474,259 | | | | 446,996 | | | | 398,948 | |
| | | | | | | | | | | | |
Shares used in per share calculation—diluted | | | 497,030 | | | | 482,741 | | | | 398,948 | |
| | | | | | | | | | | | |
| (1) | Fiscal year 2009 has not been updated for the new cost classification implemented in 2010 and includes system engineer costs within cost of revenues, as opposed to sales and marketing expenses starting in fiscal year 2010. See Note 1, “Basis of Presentation,” of the Notes to Consolidated Financial Statements. |
See accompanying notes to consolidated financial statements.
63
BROCADE COMMUNICATIONS SYSTEMS, INC.
CONSOLIDATED BALANCE SHEETS
| | | | | | | | |
| | | October 29,
2011 | | | October 30,
2010 | |
| | | (In thousands, except par value) | |
| ASSETS | | | | | | | | |
Current assets: | | | | | | | | |
Cash and cash equivalents | | $ | 414,202 | | | $ | 333,984 | |
Short-term investments | | | 774 | | | | 1,998 | |
| | | | | | | | |
Total cash, cash equivalents and short-term investments | | | 414,976 | | | | 335,982 | |
Accounts receivable, net of allowances of $6,399 and $6,721 at October 29, 2011 and October 30, 2010, respectively | | | 249,141 | | | | 317,363 | |
Inventories | | | 74,172 | | | | 76,808 | |
Deferred tax assets | | | 53,604 | | | | 71,118 | |
Prepaid expenses and other current assets | | | 52,308 | | | | 65,017 | |
| | | | | | | | |
Total current assets | | | 844,201 | | | | 866,288 | |
Property and equipment, net | | | 532,384 | | | | 539,117 | |
Goodwill | | | 1,630,967 | | | | 1,644,950 | |
Intangible assets, net | | | 214,697 | | | | 344,000 | |
Non-current deferred tax assets | | | 210,028 | | | | 203,454 | |
Other assets | | | 42,031 | | | | 48,203 | |
| | | | | | | | |
Total assets | | $ | 3,474,308 | | | $ | 3,646,012 | |
| | | | | | | | |
| LIABILITIES AND STOCKHOLDERS’ EQUITY | | | | | | | | |
Current liabilities: | | | | | | | | |
Accounts payable | | $ | 109,471 | | | $ | 147,130 | |
Accrued employee compensation | | | 118,298 | | | | 91,688 | |
Deferred revenue | | | 201,421 | | | | 185,623 | |
Current liabilities associated with facilities lease losses | | | 1,456 | | | | 5,992 | |
Current portion of capital lease obligations | | | 1,866 | | | | 1,761 | |
Current portion of term loan | | | 38,673 | | | | 28,779 | |
Other accrued liabilities | | | 94,802 | | | | 111,133 | |
| | | | | | | | |
Total current liabilities | | | 565,987 | | | | 572,106 | |
Non-current capital lease obligations, net of current portion | | | 4,916 | | | | 6,782 | |
Term loan, net of current portion | | | 148,185 | | | | 297,118 | |
Senior secured notes | | | 595,803 | | | | 595,373 | |
Non-current liabilities associated with facilities lease losses | | | 2,496 | | | | 3,984 | |
Non-current deferred revenue | | | 69,024 | | | | 65,242 | |
Non-current income tax liability | | | 63,593 | | | | 61,421 | |
Other non-current liabilities | | | 10,166 | | | | 8,581 | |
| | | | | | | | |
Total liabilities | | | 1,460,170 | | | | 1,610,607 | |
| | | | | | | | |
Commitments and contingencies (Note 10) | | | | | | | | |
Stockholders’ equity: | | | | | | | | |
Preferred stock, $0.001 par value, 5,000 shares authorized, no shares issued and outstanding | | | — | | | | — | |
Common stock, $0.001 par value, 800,000 shares authorized: | | | | | | | | |
Issued and outstanding: 448,022 and 461,291 shares at October 29, 2011 and October 30, 2010, respectively | | | 448 | | | | 461 | |
Additional paid-in capital | | | 1,984,830 | | | | 2,047,525 | |
Accumulated other comprehensive loss | | | (11,996 | ) | | | (2,827 | ) |
Retained earnings (accumulated deficit) | | | 40,856 | | | | (9,754 | ) |
| | | | | | | | |
Total stockholders’ equity | | | 2,014,138 | | | | 2,035,405 | |
| | | | | | | | |
Total liabilities and stockholders’ equity | | $ | 3,474,308 | | | $ | 3,646,012 | |
| | | | | | | | |
See accompanying notes to consolidated financial statements.
64
BROCADE COMMUNICATIONS SYSTEMS, INC.
CONSOLIDATED STATEMENTS OF STOCKHOLDERS’ EQUITY AND COMPREHENSIVE INCOME (LOSS)
| | | | | | | | | | | | | | | | | | | | | | | | | | | | |
| | | Common Stock | | | Additional
Paid-In
Capital | | | Accumulated
Other
Comprehensive
Loss | | | Retained
Earnings
(Accumulated
Deficit) | | | Total
Stockholders’
Equity | | | Comprehensive
Income (Loss) | |
| | | Number of
Shares | | | Amount | | | | | | |
| | | (In thousands) | |
Balance at October 25, 2008 | | | 371,858 | | | $ | 372 | | | $ | 1,422,115 | | | $ | (85,877 | ) | | $ | (43,088 | ) | | $ | 1,293,522 | | | $ | 81,670 | |
Issuance of common stock | | | 62,141 | | | | 62 | | | | 105,035 | | | | — | | | | — | | | | 105,097 | | | | — | |
Retirement of common stock | | | (11 | ) | | | — | | | | — | | | | — | | | | — | | | | — | | | | — | |
Stock options and awards assumed upon acquisition | | | — | | | | — | | | | 254,312 | | | | — | | | | — | | | | 254,312 | | | | — | |
Tax benefit or detriment from employee stock plans | | | — | | | | — | | | | (832 | ) | | | — | | | | — | | | | (832 | ) | | | — | |
Stock-based compensation | | | — | | | | — | | | | 120,570 | | | | — | | | | — | | | | 120,570 | | | | — | |
Change in net unrealized gains (losses) on marketable equity securities, cash flow hedges and investments | | | — | | | | — | | | | — | | | | 78,183 | | | | — | | | | 78,183 | | | | 78,183 | |
Change in cumulative translation adjustments | | | — | | | | — | | | | — | | | | 1,774 | | | | — | | | | 1,774 | | | | 1,774 | |
Net loss | | | — | | | | — | | | | — | | | | — | | | | (83,189 | ) | | | (83,189 | ) | | | (83,189 | ) |
| | | | | | | | | | | | | | | | | | | | | | | | | | | | |
Balance at October 31, 2009 | | | 433,988 | | | $ | 434 | | | $ | 1,901,200 | | | $ | (5,920 | ) | | $ | (126,277 | ) | | $ | 1,769,437 | | | $ | (3,232 | ) |
Issuance of common stock | | | 31,757 | | | | 32 | | | | 68,900 | | | | — | | | | — | | | | 68,932 | | | | — | |
Common stock repurchases | | | (4,454 | ) | | | (5 | ) | | | (24,999 | ) | | | — | | | | — | | | | (25,004 | ) | | | — | |
Settlement of stock awards assumed upon acquisition | | | — | | | | — | | | | (1,362 | ) | | | — | | | | — | | | | (1,362 | ) | | | — | |
Tax benefit or detriment from employee stock plans | | | — | | | | — | | | | 2,161 | | | | — | | | | — | | | | 2,161 | | | | — | |
Stock-based compensation | | | — | | | | — | | | | 101,625 | | | | — | | | | — | | | | 101,625 | | | | — | |
Change in net unrealized gains on cash flow hedges | | | — | | | | — | | | | — | | | | 5,346 | | | | — | | | | 5,346 | | | | 5,346 | |
Change in cumulative translation adjustments | | | — | | | | — | | | | — | | | | (2,253 | ) | | | — | | | | (2,253 | ) | | | (2,253 | ) |
Net income | | | — | | | | — | | | | — | | | | — | | | | 116,523 | | | | 116,523 | | | | 116,523 | |
| | | | | | | | | | | | | | | | | | | | | | | | | | | | |
Balance at October 30, 2010 | | | 461,291 | | | $ | 461 | | | $ | 2,047,525 | | | $ | (2,827 | ) | | $ | (9,754 | ) | | $ | 2,035,405 | | | $ | 119,616 | |
Issuance of common stock | | | 34,735 | | | | 35 | | | | 70,119 | | | | — | | | | — | | | | 70,154 | | | | — | |
Common stock repurchases | | | (48,004 | ) | | | (48 | ) | | | (210,650 | ) | | | — | | | | — | | | | (210,698 | ) | | | — | |
Tax benefit or detriment from employee stock plans | | | — | | | | — | | | | (5,240 | ) | | | — | | | | — | | | | (5,240 | ) | | | — | |
Stock-based compensation | | | — | | | | — | | | | 83,076 | | | | — | | | | — | | | | 83,076 | | | | — | |
Change in net unrealized gains on cash flow hedges | | | — | | | | — | | | | — | | | | (8,275 | ) | | | — | | | | (8,275 | ) | | | (8,275 | ) |
Change in cumulative translation adjustments | | | — | | | | — | | | | — | | | | (894 | ) | | | — | | | | (894 | ) | | | (894 | ) |
Net income | | | — | | | | — | | | | — | | | | — | | | | 50,610 | | | | 50,610 | | | | 50,610 | |
| | | | | | | | | | | | | | | | | | | | | | | | | | | | |
Balance at October 29, 2011 | | | 448,022 | | | $ | 448 | | | $ | 1,984,830 | | | $ | (11,996 | ) | | $ | 40,856 | | | $ | 2,014,138 | | | $ | 41,441 | |
| | | | | | | | | | | | | | | | | | | | | | | | | | | | |
See accompanying notes to consolidated financial statements.
65
BROCADE COMMUNICATIONS SYSTEMS, INC.
CONSOLIDATED STATEMENTS OF CASH FLOWS
| | | | | | | | | | | | |
| | | Fiscal Year Ended | |
| | | October 29,
2011 | | | October 30,
2010 | | | October 31,
2009 | |
| | | (In thousands) | |
Cash flows from operating activities: | | | | | | | | | | | | |
Net income (loss) | | $ | 50,610 | | | $ | 116,523 | | | $ | (83,189 | ) |
Adjustments to reconcile net income (loss) to net cash provided by operating activities: | | | | | | | | | | | | |
Excess tax benefits or detriments from stock-based compensation | | | (312 | ) | | | (2,161 | ) | | | 832 | |
Depreciation and amortization | | | 206,352 | | | | 199,637 | | | | 196,573 | |
Loss on disposal of property and equipment | | | 2,325 | | | | 10,412 | | | | 1,478 | |
Loss on sale of subsidiary | | | 12,756 | | | | — | | | | — | |
Amortization of debt issuance costs and original issue discount | | | 13,183 | | | | 21,100 | | | | 24,051 | |
Write-off of debt issuance costs and original issue discount on debt extinguishment | | | 25,465 | | | | — | | | | — | |
Net (gains) losses on investments and marketable equity securities | | | (340 | ) | | | (523 | ) | | | 597 | |
Provision for doubtful accounts receivable and sales allowances | | | 9,343 | | | | 11,811 | | | | 12,681 | |
Non-cash compensation expense | | | 83,076 | | | | 101,625 | | | | 137,219 | |
Non-cash facilities lease loss expense (benefit) | | | — | | | | 513 | | | | (339 | ) |
Capitalization of interest cost | | | — | | | | (7,755 | ) | | | (9,093 | ) |
Assets impairment charge | | | — | | | | — | | | | 53,306 | |
In-process research and development | | | — | | | | — | | | | 26,900 | |
Changes in assets and liabilities, net of acquired assets and assumed liabilities: | | | | | | | | | | | | |
Restricted cash | | | — | | | | 12,502 | | | | (12,502 | ) |
Accounts receivable | | | 53,561 | | | | (39,248 | ) | | | (73,356 | ) |
Inventories | | | 1,327 | | | | (4,657 | ) | | | 25,338 | |
Prepaid expenses and other assets | | | (1,688 | ) | | | 13,657 | | | | 4,214 | |
Deferred tax assets | | | (2,158 | ) | | | (1,134 | ) | | | (802 | ) |
Accounts payable | | | (38,917 | ) | | | (26,421 | ) | | | (11,052 | ) |
Accrued employee compensation | | | 216 | | | | (100,826 | ) | | | (28,685 | ) |
Deferred revenue | | | 19,579 | | | | 15,420 | | | | 26,454 | |
Other accrued liabilities | | | 20,878 | | | | (10,731 | ) | | | (4,669 | ) |
Liabilities associated with facilities lease losses | | | (6,024 | ) | | | (11,231 | ) | | | (10,394 | ) |
Liability associated with class action lawsuit | | | — | | | | — | | | | (160,000 | ) |
| | | | | | | | | | | | |
Net cash provided by operating activities | | | 449,232 | | | | 298,513 | | | | 115,562 | |
| | | | | | | | | | | | |
Cash flows from investing activities: | | | | | | | | | | | | |
Purchases of short-term investments | | | (38 | ) | | | (53 | ) | | | (138 | ) |
Purchases of non-marketable minority equity investments | | | — | | | | (200 | ) | | | — | |
Proceeds from maturities and sale of short-term investments | | | 1,604 | | | | 3,255 | | | | 155,986 | |
Proceeds from maturities and sale of long-term investments | | | — | | | | — | | | | 30,173 | |
Purchases of property and equipment | | | (96,797 | ) | | | (201,621 | ) | | | (162,770 | ) |
Proceeds from sale of property | | | — | | | | 30,185 | | | | — | |
Decrease in restricted cash | | | — | | | | — | | | | 1,075,079 | |
Proceeds from sale of subsidiary | | | 3,905 | | | | — | | | | — | |
Net cash paid in connection with acquisitions | | | — | | | | — | | | | (1,297,482 | ) |
| | | | | | | | | | | | |
Net cash used in investing activities | | | (91,326 | ) | | | (168,434 | ) | | | (199,152 | ) |
| | | | | | | | | | | | |
66
BROCADE COMMUNICATIONS SYSTEMS, INC.
CONSOLIDATED STATEMENTS OF CASH FLOWS—(Continued)
| | | | | | | | | | | | |
| | | Fiscal Year Ended | |
| | | October 29,
2011 | | | October 30,
2010 | | | October 31,
2009 | |
| | | (In thousands) | |
Cash flows from financing activities: | | | | | | | | | | | | |
Payment of fees related to the term loan | | | (1,167 | ) | | | — | | | | (30,525 | ) |
Payment of debt issuance costs related to the senior secured notes | | | — | | | | (3,666 | ) | | | — | |
Payment of principal related to the convertible subordinated debt | | | — | | | | (172,500 | ) | | | — | |
Payment of principal related to the term loan | | | (359,898 | ) | | | (583,029 | ) | | | (166,022 | ) |
Payment of principal related to capital leases | | | (1,761 | ) | | | (1,173 | ) | | | — | |
Common stock repurchases | | | (210,698 | ) | | | (25,004 | ) | | | — | |
Proceeds from senior secured notes | | | — | | | | 587,968 | | | | — | |
Proceeds from issuance of common stock | | | 97,152 | | | | 81,593 | | | | 145,655 | |
Proceeds from term loan | | | 198,950 | | | | — | | | | — | |
Proceeds from (payment of principal related to) the revolving credit facility | | | — | | | | (14,050 | ) | | | 14,050 | |
Excess tax benefits or detriments from stock-based compensation | | | 312 | | | | 2,161 | | | | (832 | ) |
| | | | | | | | | | | | |
Net cash used in financing activities | | | (277,110 | ) | | | (127,700 | ) | | | (37,674 | ) |
| | | | | | | | | | | | |
Effect of exchange rate fluctuations on cash and cash equivalents | | | (578 | ) | | | (2,588 | ) | | | 1,573 | |
| | | | | | | | | | | | |
Net increase (decrease) in cash and cash equivalents | | | 80,218 | | | | (209 | ) | | | (119,691 | ) |
Cash and cash equivalents, beginning of year | | | 333,984 | | | | 334,193 | | | | 453,884 | |
| | | | | | | | | | | | |
Cash and cash equivalents, end of year | | $ | 414,202 | | | $ | 333,984 | | | $ | 334,193 | |
| | | | | | | | | | | | |
Supplemental disclosures of cash flow information: | | | | | | | | | | | | |
Cash paid for interest | | $ | 56,576 | | | $ | 59,549 | | | $ | 83,397 | |
| | | | | | | | | | | | |
Cash paid (refunded) for income taxes | | $ | 1,148 | | | $ | 8,801 | | | $ | (20,000 | ) |
| | | | | | | | | | | | |
Supplemental schedule of non-cash investing activities: | | | | | | | | | | | | |
Fair value of stock options and unvested awards assumed in exchange for acquired Foundry assets | | $ | — | | | $ | — | | | $ | 254,312 | |
| | | | | | | | | | | | |
Note assumed on sale of subsidiary | | $ | 1,218 | | | $ | — | | | $ | — | |
| | | | | | | | | | | | |
Acquisition of property and equipment through capital leases | | $ | — | | | $ | 9,716 | | | $ | — | |
| | | | | | | | | | | | |
See accompanying notes to consolidated financial statements.
67
BROCADE COMMUNICATIONS SYSTEMS, INC.
NOTES TO CONSOLIDATED FINANCIAL STATEMENTS
1. Basis of Presentation
The fiscal year for Brocade Communications Systems, Inc. (“Brocade” or the “Company”) is the 52 or 53 weeks ending on the last Saturday in October. As is customary for companies that use the 52/53-week convention, every fifth year contains a 53-week year. Fiscal years 2011 and 2010 were 52-week fiscal years and fiscal year 2009 was a 53-week fiscal year. The second quarter of fiscal year 2009 consisted of fourteen weeks, which was one week longer than a typical quarter. The Company’s next 53-week fiscal year will be fiscal year 2014 and our next 14-week quarter will be in the second quarter of fiscal year 2014. The Consolidated Financial Statements include the accounts of Brocade and its wholly-owned subsidiaries. All significant intercompany accounts and transactions have been eliminated.
Reclassification
During fiscal year 2010, we reviewed our cost classification, primarily related to our system engineer (“SE”) costs that were previously classified within cost of revenues. The SE’s primary role has migrated over time from assisting with customer support to primarily performing pre-sales activity to generate future business, which was enabled by the growth of our support organization, such that starting in 2010 the majority of the SE’s time was spent on pre-sales activity. As a result of this change, we have reclassified the SE costs within our Consolidated Statements of Operations starting in fiscal year 2010. These costs are now presented within sales and marketing expenses, as opposed to cost of revenues. This reclassification did not impact revenues, income from operations, net income, or earnings per share. Prior period amounts have not been updated for the new cost classification implemented in fiscal year 2010.
For comparative purposes, had the reclassification been affected for fiscal year 2009, the pro forma cost of revenues for each of the Company’s reportable segment and sales and marketing expenses would have been as follows (in thousands):
| | | | |
| | | Pro Forma Amount | |
| | | Fiscal Year Ended
October 31, 2009 | |
Cost of revenues | | | | |
Data Storage Products | | $ | 408,026 | |
Ethernet Products | | | 228,908 | |
Global Services | | | 161,946 | |
| | | | |
Total cost of revenues | | | 798,880 | |
Sales and marketing expenses | | $ | 505,701 | |
Correction of Immaterial Errors
The Company’s prior year financial results, including the fiscal years ended October 30, 2010 and October 31, 2009, respectively, have been adjusted to reflect certain immaterial corrections. During fiscal year 2011, the Company identified errors in its accounting for certain sales discounts and sales incentives that impacted multiple prior periods and that had accumulated to an amount of $17.1 million. The Company concluded that the errors were not material to any of its prior period financial statements under the applicable guidance for accounting changes and error corrections. The correction resulted in immaterial changes to sales discounts allowances and marketing incentive accruals which affected net revenues during fiscal years 2007 through 2010 and the six months ended April 30, 2011, resulting in an overstatement of net revenues in some periods and an understatement in other periods. Although the errors were and continue to be immaterial to prior
68
periods, because of the impact of the cumulative out-of-period correction in the fiscal year 2011, the Company applied the guidance for accounting changes and error corrections and revised its prior period financial statements presented.
As a result of the revisions, net revenues were decreased by $3.2 million and $2.6 million for the fiscal years ended October 30, 2010 and October 31, 2009, respectively. Net revenues decreased by $1.8 million for the six months ended April 30, 2011 and the remaining corrections to net revenues of $9.5 million relates to periods before fiscal year 2009. Total assets and stockholders’ equity were decreased by $8.2 million and $10.9 million, respectively, and total liabilities were increased by $2.7 million, net of tax effect, as of October 30, 2010. Additionally, after tax effects, net income decreased by $2.3 million for the fiscal year ended October 30, 2010 and net loss increased by $1.8 million for the fiscal year ended October 31, 2009.
2. Summary of Significant Accounting Policies
Cash and Cash Equivalents
The Company considers all highly liquid investments with an original or remaining maturity of three months or less at the date of purchase to be cash equivalents.
Investments and Equity Securities
Investment securities with an original maturity of more than three months that mature less than one year from the Consolidated Balance Sheet date are considered short-term investments. Investment securities with an original or remaining maturity of one year or more and which the Company has the ability and intent to hold are considered long-term investments. Investments are classified as available-for-sale and are recorded on the accompanying Consolidated Balance Sheets at fair value.
Unrealized holding gains and losses related to the Company’s investments are included as a separate component of accumulated other comprehensive loss on the accompanying Consolidated Balance Sheets, net of any related tax effect. Realized gains and losses are calculated based on the specific identification method and are included in “Other expenses” on the Consolidated Statements of Operations.
The Company recognizes an impairment charge when the fair values of its investments have fallen below their cost basis and the decline in fair value is assessed to be other-than-temporary. An other-than-temporary impairment is triggered when there is an intent to sell the security, it is more likely than not that the security will be required to be sold before recovery, or the Company is not expected to recover the entire amortized cost basis of the security. The Company also considers various factors in determining whether to recognize an impairment charge, including the length of time and extent to which the fair value has been less than the cost basis and the financial condition and near-term prospects of the issuer. For impairments involving credit losses, the Company recognizes the credit loss component in earnings and the remainder of the impairment is recorded in accumulated other comprehensive loss.
From time to time the Company makes equity investments in non-publicly traded companies. These investments are included in “Other assets” on the accompanying Consolidated Balance Sheets and are generally accounted for under the cost method as the Company does not have the ability to exercise significant influence over the respective issuer’s operating and financial policies nor does it have a liquidation preference that is substantive. The Company monitors its investments in non-publicly traded companies for impairment on a quarterly basis and makes appropriate reductions in carrying values when such impairments are determined to be other-than-temporary. Impairment charges are included in “Other expenses” on the Consolidated Statements of Operations. Factors considered in determining an impairment include, but are not limited to, the current business environment including competition and uncertainty of financial condition, going concern considerations such as the rate at which the issuer company utilizes cash and the issuer company’s ability to obtain additional private financing to fulfill its stated business plan, the need for changes to the issuer company’s existing business model due to changing business environments and its ability to successfully implement necessary changes, and comparable valuations.
69
Fair Value of Financial Instruments
The fair value of the Company’s financial instruments, including cash and cash equivalents, accounts receivable, accounts payable and accrued liabilities, approximate cost because of their short maturities. The fair value of the Company’s investments is primarily determined using quoted market prices for those securities or similar financial instruments.
Derivative Financial Instruments
In the normal course of business, the Company is exposed to fluctuations in interest rates and the exchange rates associated with foreign currencies. The derivatives entered into by the Company qualify for and are designated as foreign currency cash flow hedges.
The derivatives are recognized on the Consolidated Balance Sheets at their respective fair values. Changes in fair values of outstanding cash flow hedges that are highly effective are recorded in accumulated other comprehensive loss until earnings are affected by the variability of cash flows of the underlying hedged transaction. In most cases, amounts recorded in accumulated other comprehensive loss will be released to earnings at maturity of the related derivative. The recognition of effective hedge results offsets the gains or losses on the underlying exposure. Cash flows from derivative transactions are classified according to the nature of the risk being hedged.
The Company formally documents all relationships between hedging instruments and hedged items, as well as the risk-management objective and strategy for undertaking hedge transactions. This documentation includes linking all derivatives either to specific assets and liabilities on the consolidated balance sheets or specific firm commitments or forecasted transactions. The Company also formally assesses both at the hedge’s inception and on an ongoing basis whether the derivatives used in hedging transactions have been highly effective in offsetting changes in the cash flows of hedged items and whether those derivatives may be expected to remain highly effective in future periods.
The Company discontinues hedge accounting prospectively when (i) the derivative is no longer highly effective in offsetting changes in the cash flows of a hedged item (including hedged items such as firm commitments or forecasted transactions); (ii) the derivative expires or is sold, terminated or exercised; (iii) it is no longer probable that the forecasted transaction will occur; or (iv) management determines that designating the derivative as a hedging instrument is no longer appropriate.
When the Company discontinues hedge accounting, but it continues to be probable that the forecasted transaction will occur in the originally expected period, the gain or loss on the derivative remains in accumulated other comprehensive loss and is reclassified into earnings when the forecasted transaction affects earnings. However, if it is no longer probable that a forecasted transaction will occur by the end of the originally specified time period or within an additional two-month period of time thereafter, the gain or loss that was in accumulated other comprehensive loss will be recognized immediately in earnings. In all situations in which hedge accounting is discontinued and the derivative remains outstanding, the Company will carry the derivative at its fair value on the Consolidated Balance Sheet until maturity and will recognize future changes in the fair value in current period earnings. Any hedge ineffectiveness is recorded in current period earnings within “Other expenses.” Effectiveness is assessed based on the comparison of current forward rates to the rates established on the Company’s hedges.
Inventories
Inventories are stated at the lower of cost or market, using the first-in, first-out method. Inventory costs include material, labor and overhead. The Company records inventory write-downs based on excess and obsolete inventory determined primarily by its forecast of future demand. A portion of the Company’s inventory is located offsite at customers, third party managed service depots and at contract manufacturers’ locations. Cash flows related to the sale of inventories are classified as cash flows from operating activities.
70
Property and Equipment
Property and equipment are stated at cost less accumulated depreciation and amortization. Depreciation is computed using the straight-line method over the estimated useful lives of the assets. An estimated useful life of 3 years is used for computer equipment and 4 to 7 years is used for software based on the nature of the software purchased. Estimated useful lives of up to 4 years are used for engineering and other equipment, 7 years is used for furniture and an estimated useful life of 39 years is used for buildings. Leasehold improvements are amortized using the straight-line method over the shorter of the useful life of the asset or the remaining term of the lease.
Brocade evaluates long-lived assets, such as property and equipment, for impairment whenever events or changes in circumstances indicate that the carrying value of an asset may not be recoverable in accordance with ASC 360-10 Property, Plant and Equipment. Brocade assesses the fair value of the assets based on the undiscounted future cash flow the assets are expected to generate and recognizes an impairment loss when estimated undiscounted future cash flow expected to result from the use of the asset plus net proceeds expected to result from the disposition of the asset, if any, are less than the carrying value of the asset. When Brocade identifies an impairment, Brocade reduces the carrying amount of the asset to its estimated fair value based on a discounted cash flow approach or, when available and appropriate, to comparable market values.
Goodwill and Intangible Assets
The Company evaluates goodwill on an annual basis during its second fiscal quarter or whenever events or changes in circumstances indicate that the carrying amount of an asset may not be recoverable. An impairment loss is recognized to the extent that the carrying amount of goodwill exceeds the asset’s implied fair value. Events which might indicate impairment include, but are not limited to, strategic decisions made in response to economic and competitive conditions, the impact of the economic environment on the Company’s customer base, material negative changes in relationships with significant customers, and/or a significant decline in the Company’s stock price for a sustained period.
Intangible assets are carried at cost less accumulated amortization. Amortization is recognized on a straight-line basis over the estimated useful life of the respective asset. The Company evaluates intangible assets for impairment whenever events or changes in circumstances indicate that the carrying value of such assets may not be recoverable. Examples of such events or circumstances include, but are not limited to, significant underperformance relative to historical or projected future operating results, significant changes in the manner of use of acquired assets or the strategy for the Company’s business, significant negative industry or economic trends, and/or a significant decline in the Company’s stock price for a sustained period. Impairment is recognized based on the difference between the fair value of the asset and its carrying value. For additional discussion, see Note 4, “Goodwill and Intangible Assets,” of the Notes to Consolidated Financial Statements.
Litigation Costs
The Company is subject to the possibility of legal actions arising in the ordinary course of business. The Company regularly monitors the status of pending legal actions to evaluate both the magnitude and likelihood of any potential losses. An accrual for these potential losses is made when they are probable and the amount of loss, or possible range of loss, can be reasonably estimated. In addition, recoveries are shown as a reduction in litigation costs in the period in which they are realized.
Concentrations
Financial instruments that potentially subject the Company to concentrations of credit risk consist primarily of cash, cash equivalents, short-term investments and accounts receivable. Cash, cash equivalents and short-term investments are primarily maintained at five major financial institutions. Deposits held with banks may be redeemed upon demand and may exceed the amount of insurance provided on such deposits.
71
A majority of the Company’s accounts receivable balance is derived from sales to OEM partners in the computer storage and server industry. As of October 29, 2011, two customers accounted for 16% and 14%, respectively, of total accounts receivable. As of October 30, 2010, three customers accounted for 17%, 14% and 10%, respectively, of total accounts receivable. The Company performs ongoing credit evaluations of its customers and generally does not require collateral on accounts receivable balances. The Company has established reserves for credit losses, sales allowances, and other allowances.
For the years ended October 29, 2011, October 30, 2010 and October 31, 2009, the same three customers each represented 10% or more of our total net revenues for a combined total of 43% (EMC with 15%, HP with 13% and IBM with 15%), 47% (EMC with 16%, HP with 14% and IBM with 17%) and 48% (EMC with 18%, HP with 13% and IBM with 17%), respectively.
The Company currently relies on single and limited sources for multiple key components used in the manufacture of its products. Additionally, the Company relies on multiple contract manufacturers for the production of its products, including Hon Hai Precision Industry Co., Ltd., Sanmina-SCI Corporation, Asteel Flash Group, Accton Wireless Broadband Corporation, Motorola, Inc. and Quanta Computer Incorporated (collectively the contract manufacturers or “CMs”). Although the Company uses standard parts and components for its products where possible, the Company’s CMs currently purchase, on their behalf, several key components used in the manufacture of products from single or limited supplier sources.
Revenue Recognition
Product revenue.Substantially all of the Company’s products are integrated with software that is essential to the functionality of the equipment. Additionally, the Company provides unspecified software upgrades and enhancements related to the equipment through its maintenance contracts for most of its products. Product revenue is generally recognized when all of the following criteria have been met:
| | • | | Persuasive evidence of an arrangement exists; |
| | • | | The fee is fixed or determinable; and |
| | • | | Collectability is reasonably assured or collection is probable. |
For newly introduced products, many of the Company’s large OEM customers require a product qualification period during which the Company’s products are tested and approved by the OEM customers for sale to their customers. Revenue recognition and related cost are deferred for shipments to new OEM customers and for shipments of newly introduced products to existing OEM customers until satisfactory evidence of completion of the product qualification has been received from the OEM customer. In addition, revenue from sales to the Company’s distributor customers is recognized in the same period in which the product is actually sold by the distributor (sell-through).
The Company reduces revenue for estimated sales allowances at the time of shipment and sales programs at the later of revenue recognition or communication of the commitment for sales incentives. Sales allowances are estimated based on historical sales returns. Sales programs are estimated based on approved sales programs versus claims under such sales programs, current trends and the Company’s expectations regarding future activity. In addition, the Company maintains an allowance for doubtful accounts, which is also accounted for as a reduction in revenue. The Company establishes the allowance for doubtful accounts to ensure accounts receivables are not overstated due to uncollectability. The Company maintains bad debt reserves based upon the analysis of accounts receivable, historical collection patterns, customer concentrations, customer creditworthiness, current economic trends, changes in customer payment terms and practices, and customer communication. The Company records a specific reserve for individual accounts when it becomes aware of a customer’s likely inability to meet its financial obligations, such as in the case of bankruptcy filings or deterioration in the customer’s operating results or financial position. If circumstances related to customers change, the Company would further adjust estimates of the recoverability of receivables.
72
In October 2009, the Financial Accounting Standards Board (“FASB”) amended the accounting standards for revenue recognition to remove tangible products containing software components and non-software components that function together to deliver the products’ essential functionality from the scope of industry-specific software revenue recognition guidance. In October 2009, the FASB also amended the accounting standards for multiple deliverable revenue arrangements to:
| | • | | provide updated guidance on whether multiple deliverables exist, how the deliverables in an arrangement should be separated, and how the consideration should be allocated; |
| | • | | require an entity to allocate revenue in an arrangement using estimated selling price (“ESP”) of deliverables if a vendor does not have vendor-specific objective evidence (“VSOE”) of selling price or third-party evidence (“TPE”) of selling price; and |
| | • | | eliminate the use of the residual method and require an entity to allocate revenue using the relative selling price method. |
The Company elected to early adopt this accounting guidance at the beginning of its first quarter of fiscal year 2010 on a prospective basis for applicable transactions originating or materially modified after October 31, 2009.
Multiple-element arrangements. The Company’s multiple-element product offerings include networking hardware with embedded software products and support, which are considered separate units of accounting. For certain of the Company’s products, software and non-software components function together to deliver the tangible products’ essential functionality.
For transactions entered into prior to the first quarter of fiscal year 2010, the Company allocated revenue to each element in a multiple-element arrangement based upon VSOE of the fair value of the element, or if VSOE was not available for the delivered element, by application of the residual method. In the application of the residual method, the Company allocated revenue to the undelivered elements based on VSOE of fair value for those elements and allocated the residual revenue to the delivered elements. VSOE of the fair value for an element was based upon the price charged when the element was sold separately. Revenue allocated to each element was then recognized when the basic revenue recognition criteria was met for each element. For sales of products that contained multiple elements and where software was incidental, the Company determined the separate units of accounting that existed within the arrangement. If more than one unit of accounting existed, the arrangement consideration was allocated to each unit of accounting using the residual fair value method. Revenue was recognized for each unit of accounting when all the revenue recognition criteria had been met for that unit of accounting.
Under the new accounting guidance, the Company allocates revenue to each element in a multiple-element arrangement based upon their relative selling price. When applying the relative selling price method, the Company determines the selling price for each deliverable using VSOE of selling price, if it exists, or TPE of selling price. If neither VSOE nor TPE of selling price exist for a deliverable, the Company uses its best estimate of selling price for that deliverable. Revenue allocated to each element is then recognized when the basic revenue recognition criteria are met for each element.
Consistent with its methodology under previous accounting guidance, the Company determines VSOE based on its normal pricing and discounting practices for the specific product or service when sold separately. In determining VSOE, the Company requires that a substantial majority of the selling prices for a product or service fall within a reasonably narrow pricing range, generally evidenced by approximately 80% of such historical stand-alone transactions falling within ±15% of the median rates. For post-contract customer support (“PCS”), however, the Company considers stated renewal rates in determining VSOE.
In most instances, the Company is not able to establish VSOE for all deliverables in an arrangement with multiple elements. This may be due to the Company infrequently selling each element separately, not pricing products within a narrow range, or only having a limited sales history. When VSOE cannot be established, the
73
Company attempts to establish selling price for each element based on TPE. TPE is determined based on competitor prices for similar deliverables when sold separately. Generally, the Company’s go-to-market strategy differs from that of its peers and its offerings contain a significant level of customization and differentiation such that the comparable pricing of products with similar functionality cannot be obtained. Furthermore, the Company is unable to reliably determine what similar competitor products’ selling prices are on a stand-alone basis. Therefore, the Company is typically not able to determine TPE.
When the Company is unable to establish selling price using VSOE or TPE, the Company uses ESP in its allocation of the arrangement consideration. The objective of ESP is to determine the price at which the Company would transact a sale if the product or service were sold on a stand-alone basis. ESP is generally used for offerings that are not typically sold on a stand-alone basis or for new or highly customized offerings.
The Company determines ESP for a product or service by considering multiple factors including, but not limited to, geographies, market conditions, competitive landscape, internal costs, gross margin objectives and pricing practices. The determination of ESP is made through consultation with and formal approval by the Company’s management, taking into consideration the go-to-market strategy.
The Company regularly reviews VSOE, TPE and ESP and maintains internal controls over the establishment and updates of these estimates. There was no material impact on revenues during the fiscal year ended October 29, 2011 nor does the Company expect a material impact in the near term from changes in VSOE, TPE or ESP.
The following table shows total net revenues as reported and unaudited pro forma total net revenues that would have been reported during the fiscal year ended October 30, 2010, if the transactions entered into or materially modified after October 31, 2009 were subject to previous accounting guidance:
| | | | | | | | |
| | | As Reported | | | Pro Forma Basis
as if the Previous
Accounting Guidance
Was in Effect | |
| | | In thousands | |
Total net revenues for the year ended October 30, 2010 | | $ | 2,091,153 | | | $ | 2,081,143 | |
The impact to total net revenues during the fiscal years ended October 29, 2011 and October 30, 2010, respectively, of the accounting guidance was primarily to net product revenues. Since the use of the residual method is eliminated under the new accounting standards, any discounts offered by the Company are allocated to all deliverables, rather than only products delivered upfront.
The new accounting standards for revenue recognition if applied in the same manner to the year ended October 31, 2009 would not have had a material impact on total net revenues for that fiscal year.
Services revenue.Services revenue consists of training and maintenance arrangements, including PCS, separately priced extended warranties and other professional services. PCS services are offered under renewable, annual fee-based contracts or as part of multiple-element arrangements, and typically include telephone support and upgrades and enhancements to the Company’s operating system software. Revenue related to PCS elements is deferred and recognized ratably over the contractual period. PCS contracts are typically one to three years in length.
Professional services are offered under hourly or fixed fee-based contracts or as part of multiple-element arrangements. Professional services revenue is recognized as services are performed. Training revenue is recognized upon completion of the training.
74
Warranty Expense
The Company provides standard warranties on its products ranging from one year to limited lifetime warranties. Estimated future warranty costs are accrued at the time of shipment and charged to cost of revenues based upon historical experience, current trends and the Company’s expectations regarding future experience.
Foreign Currency
Assets and liabilities of the Company’s international subsidiaries in which the local currency is the functional currency are translated into U.S. dollars at period-end exchange rates. Income and expenses are translated into U.S. dollars at the average exchange rates during the period. The resulting translation adjustments are included in the Company’s Consolidated Balance Sheets in the stockholders’ equity section as a component of accumulated other comprehensive loss. Foreign exchange gains and losses for assets and liabilities of the Company’s international subsidiaries in which the local currency is the U.S. dollar are recorded in the Company’s Consolidated Statement of Operations.
Software Development Costs
Eligible software development costs are capitalized upon the establishment of technological feasibility, which is defined as being equivalent to completion of a beta-phase working prototype. Total eligible software development costs have not been material to date.
Costs related to internally developed software and software purchased for internal use are capitalized. As of October 29, 2011 and October 30, 2010, a net book value of $4.0 million and $3.7 million, respectively, related to the purchase and subsequent implementation and upgrade of the Company’s enterprise wide integrated business information system was included in “Property and equipment, net.” These costs are being depreciated over the estimated useful lives of four to seven years based on the nature of the software purchased.
Advertising Costs
The Company expenses all advertising costs as incurred. Advertising costs were $12.1 million, $7.9 million and $5.9 million for the years ended October 29, 2011, October 30, 2010 and October 31, 2009, respectively.
Capitalized Interest Costs
Interest costs related to major construction projects, specifically the Company campus project, are capitalized until the asset is ready for service. Capitalized interest is calculated by multiplying the weighted-average interest rate on the Senior Secured Credit Facility, senior secured notes and convertible debt by the qualifying costs. Interest capitalized may not exceed gross interest expense for the period. As the qualifying asset is moved to the depreciation and amortization pool, the related capitalized interest is also transferred and is amortized over the useful life of the related asset. No interest costs were capitalized during the year ended October 29, 2011 since the construction of the Company campus was completed in the third quarter of fiscal year 2010. Interest costs of $7.8 million and $9.1 million were capitalized for the years ended October 30, 2010 and October 31, 2009, respectively.
Income Taxes
The Company recognizes income tax expense for the amount of taxes payable or refundable for the current year. Deferred tax assets and liabilities are recognized for the expected tax consequences of temporary differences between the tax bases of assets and liabilities and their reported amounts, along with net operating loss carry forwards and credit carry forwards. A valuation allowance is recognized to the extent that it is more likely than not that the tax benefits will not be realized.
75
The Company accounts for uncertainty in income taxes using a two-step approach to recognizing and measuring uncertain tax positions. The first step is to evaluate the tax position for recognition by determining if the weight of available evidence indicates that it is more likely than not that the position will be sustained on audit, including resolution of related appeals or litigation processes, if any. The second step is to measure the tax benefit as the largest amount that is more than 50% likely of being realized upon settlement. The Company classifies the liability for unrecognized tax benefits as current to the extent that the Company anticipates payment (or receipt) of cash within one year. Interest and penalties related to uncertain tax positions are recognized in the provision for income taxes. For additional discussion, see Note 15, “Income Taxes,” of the Notes to Consolidated Financial Statements.
Computation of Net Income (Loss) per Share
Basic net income (loss) per share is computed using the weighted-average number of common shares outstanding during the period, less shares subject to repurchase. Diluted net income per share is computed using the weighted-average number of common shares outstanding and potentially dilutive common shares outstanding during the period that have a dilutive effect on earnings per share. Potentially dilutive common shares result from the assumed exercise of outstanding stock options, assumed vesting of outstanding restricted stock units and awards and assumed issuance of stock under the employee stock purchase plan all using the treasury stock method, as well as the assumed conversion of outstanding convertible subordinated debt using the if-converted method. In a net loss position, diluted net loss per share is computed using only the weighted-average number of common shares outstanding during the period, less shares subject to repurchase, as any additional common shares would be antidilutive.
Stock-Based Compensation
The Company accounts for employee equity awards under the fair value method. Accordingly, the Company measures stock-based compensation at the grant date based on the fair value of the award. The fair value of stock options and the Employee Stock Purchase Plan (“ESPP”) is estimated using the Black-Scholes option pricing model. Estimated compensation cost relating to restricted stock units is based on the fair value of the Company’s common stock on the date of the grant. The Company records stock-based compensation expense over the twenty-four month offering period in connection with shares issued under its ESPP. The compensation expense for stock-based awards is reduced by an estimate for forfeitures and is recognized over the expected term of the award under a graded vesting method, except for restricted stock units granted by the Company, which are recognized over the expected term of the award under a straight-line vesting method. For additional discussion, see Note 14, “Stock-Based Compensation,” of the Notes to Consolidated Financial Statements.
The Company accounts for the tax effects of share-based payment awards using the alternative transition method, which includes simplified methods to establish the beginning balance of the additional paid-in capital pool (“APIC Pool”) related to the tax effects of employee stock-based compensation and to determine the subsequent impact on the APIC Pool and consolidated statement of cash flows of the tax effects of employee stock-based compensation awards.
Convertible Debt Instruments
In the first fiscal quarter of 2010, the Company adopted a new standard issued by the Financial Accounting Standards Board that changed the accounting for convertible debt instruments with cash settlement features. As of adoption, this new accounting standard applied to the Company’s convertible subordinated debt that was repaid in the second fiscal quarter of 2010. Under the previous accounting standard, the convertible subordinated debt was recognized entirely as a liability. In accordance with adopting this new accounting standard, Brocade retrospectively recognized both a liability and an equity component of the convertible subordinated debt at fair value. As a result of applying this new accounting standard retrospectively, the accumulated deficit as of the beginning of fiscal year 2009 was increased by $11.2 million.
76
Use of Estimates in Preparation of Consolidated Financial Statements
The preparation of consolidated financial statements and related disclosures in conformity with U.S. generally accepted accounting principles requires management to make estimates and judgments that affect the amounts reported in the consolidated financial statements and accompanying notes. Estimates are used for, but not limited to sales allowances and programs, allowance for doubtful account, stock-based compensation, purchase price allocations, warranty obligations, inventory valuation and purchase commitments, restructuring costs, commissions, facilities lease losses, impairment of goodwill and intangible assets, litigation, income taxes and investments. Actual results may differ materially from these estimates.
Recent Accounting Pronouncements
In September 2011, the FASB issued an update to ASC 350 Intangibles—Goodwill and Other (“ASC 350”): Testing Goodwill for Impairment. The update gives an entity an option to first assess qualitative factors to determine whether the existence of events or circumstances leads to a determination that it is more likely than not that the fair value of a reporting unit is less than its carrying amount. If, after assessing the totality of events or circumstances, an entity determines it is not more likely than not that the fair value of a reporting unit is less than its carrying amount, then performing the two-step impairment test is unnecessary. An entity has the option to bypass the qualitative assessment for any reporting unit in any period and proceed directly to performing the first step of the two-step goodwill impairment test. An entity may resume performing the qualitative assessment in any subsequent period. Under the amendments, an entity no longer is permitted to carry forward its detailed calculation of a reporting unit’s fair value from a prior year as previously permitted by ASC 350. This update to ASC 350 is effective for the Company in the fiscal year 2013, with earlier adoption permitted if the Company’s financial statements for the most recent annual or interim period have not yet been issued. The Company is currently evaluating the impact of the update, but does not expect the adoption of this update to ASC 350 to have a material impact on its financial position, results of operations or cash flows.
In June 2011, the FASB issued an update to ASC 220 Comprehensive Income (“ASC 220”): Presentation of Comprehensive Income. The amendments from this update will result in more converged guidance on how comprehensive income is presented under U.S. GAAP and International Financial Reporting Standards (“IFRS”). With this update to ASC 220, an entity has the option to present the total of comprehensive income, the components of net income, and the components of other comprehensive income either in a single continuous statement of comprehensive income or in two separate but consecutive statements. In both choices, an entity is required to present each component of net income along with total net income, each component of other comprehensive income along with a total for other comprehensive income, and a total amount for comprehensive income. The amendments in this update do not change the items that must be reported in other comprehensive income or when an item of other comprehensive income must be reclassified to net income, nor does it affect how earnings per share is calculated or presented. Current U.S. GAAP allows reporting entities three alternatives for presenting other comprehensive income and its components in financial statements. One of those alternatives is to present the components of other comprehensive income as part of the statement of changes in stockholders’ equity. This update eliminates that option. The update to ASC 220 should be applied retrospectively and will be adopted by the Company in the first quarter of fiscal year 2013. The Company does not expect the adoption of ASC 220 to have an impact on its financial position, results of operations or cash flows.
In May 2011, the FASB issued an update to ASC 820 Fair Value Measurement (“ASC 820”): Amendments to Achieve Common Fair Value Measurement and Disclosure Requirements in U.S. GAAP and IFRS. The amendments result in common fair value measurement and disclosure requirements under U.S. GAAP and IFRS. The update also provides for certain changes in current U.S. GAAP disclosure requirements, for example with respect to the measurement of level 3 assets and for measuring the fair value of an instrument classified in a reporting entity’s shareholders’ equity. The update to ASC 820 should be applied prospectively and it will be adopted by the Company in the second quarter of fiscal year 2012. The Company is currently evaluating the impact of the update but does not expect the adoption of ASC 820 to have a material impact on its financial position, results of operations or cash flows.
77
In December 2010, the FASB issued an update to ASC 350 Intangibles—Goodwill and Other (“ASC 350”): When to Perform Step 2 of the Goodwill Impairment Test for Reporting Units with Zero or Negative Carrying Amounts. The update requires an entity with reporting units that have carrying amounts that are zero or negative to assess whether it is more likely than not that the reporting units’ goodwill is impaired. If the entity determines that it is more likely than not that the goodwill of one or more of its reporting units is impaired, the entity should perform Step 2 of the goodwill impairment test for those reporting unit(s). Any resulting goodwill impairment should be recorded as a cumulative-effect adjustment to beginning retained earnings in the period of adoption. Any goodwill impairments occurring after the initial adoption of the amendments should be included in earnings as required by Section 350-20-35. This update to ASC 350 will be adopted by the Company in the first quarter of fiscal year 2012. The Company is currently evaluating the impact of the update, but does not expect the adoption of ASC 350 to have a material impact on its financial position, results of operations or cash flows.
In December 2010, the FASB issued an update to ASC 805 Business Combinations (“ASC 805”): Disclosure of Supplementary Pro Forma Information for Business Combinations. The amendments in this update specify that if a public entity presents comparative financial statements, the entity should disclose revenue and earnings of the combined entity as though the business combination(s) that occurred during the current year had occurred as of the beginning of the comparable prior annual reporting period only. The amendments in this update also expand the supplemental pro forma disclosures under Topic 805 to include a description of the nature and amount of material, nonrecurring pro forma adjustments directly attributable to the business combination included in the reported pro forma revenue and earnings. The update to ASC 805 will be adopted by the Company for any acquisitions occurring after the beginning of the first quarter of fiscal year 2012, with earlier adoption permitted.
3. Acquisition
Foundry Networks, Inc.
On December 18, 2008, the Company completed its acquisition of Foundry Networks, Inc. (“Foundry”) in accordance with the Agreement and Plan of Merger, which the Company entered into on July 21, 2008, as well as with Amendment No. 1 to the Agreement and Plan of Merger, which the Company entered into on November 7, 2008 (as amended, the “Foundry Merger Agreement”). The total purchase price of the Foundry acquisition was $2.8 billion. As a result of the merger, Foundry is now a wholly-owned subsidiary of the Company and was converted to a limited liability company under applicable Delaware law in the third fiscal quarter of 2009.
The Company recorded the acquisition using the purchase method of accounting and, accordingly, has included the results of operations of Foundry in the accompanying Consolidated Statements of Operations from December 18, 2008, the date the acquisition was completed.
The following unaudited pro forma financial information for the year ended October 31, 2009 presents a summary of the results of operations of the Company assuming the acquisition of Foundry occurred at the beginning of the period presented. The unaudited pro forma financial information is presented for informational purposes only and is not indicative of the results of operations that would have been achieved if the merger had taken place at the beginning of the period presented, nor is it indicative of future operating results (in thousands, except per share amounts):
| | | | |
| | | Year Ended | |
| | | October 31,
2009 | |
Total net revenues | | $ | 2,027,423 | |
Pretax loss | | | (63,453 | ) |
Net loss | | | (56,875 | ) |
Basic net loss per share | | | (0.14 | ) |
Diluted net loss per share | | $ | (0.14 | ) |
78
The Company allocated the total purchase consideration to the net assets acquired and liabilities assumed, including identifiable intangible assets, based on their respective fair values at the acquisition date, resulting in initial goodwill of approximately $1,475.6 million. Goodwill represents the excess of the purchase price over the fair value of the underlying acquired net tangible and intangible assets. The factors that contributed to the recognition of goodwill included securing buyer-specific synergies that increase revenue and profits and are not otherwise available to a marketplace participant, acquiring a talented workforce, and significant cost-saving opportunities. The allocation of the purchase price reflects various estimates and analyses.
The Company also allocated $26.9 million to in-process research and development (“IPR&D”) which was charged to operating expense at the consummation of the business combination. The value assigned to the Foundry IPR&D was determined by estimating costs to develop the purchased IPR&D into commercially viable products, estimating the resulting net cash flows from the projects when completed, and discounting the net cash flows to their present values. The revenue estimates used in the net cash flow forecasts were based on estimates of relevant market sizes and growth factors, expected trends in technology, and the nature and expected timing of new product introductions by Foundry and its competitors.
4. Goodwill and Intangible Assets
The following table summarizes goodwill activity by reportable segment during the fiscal years ended October 29, 2011 and October 30, 2010 (in thousands):
| | | | | | | | | | | | | | | | |
| | | Data
Storage
Products | | | Ethernet
Products | | | Global
Services | | | Total | |
Balance at October 31, 2009 | | | | | | | | | | | | | | | | |
Goodwill | | $ | 176,989 | | | $ | 1,371,688 | | | $ | 157,089 | | | $ | 1,705,766 | |
Accumulated impairment losses (1) | | | — | | | | (45,832 | ) | | | — | | | | (45,832 | ) |
| | | | | | | | | | | | | | | | |
| | | 176,989 | | | | 1,325,856 | | | | 157,089 | | | | 1,659,934 | |
Tax and other adjustments (2) | | | — | | | | (14,984 | ) | | | — | | | | (14,984 | ) |
Balance at October 30, 2010 | | | | | | | | | | | | | | | | |
Goodwill | | $ | 176,989 | | | $ | 1,356,704 | | | $ | 157,089 | | | $ | 1,690,782 | |
Accumulated impairment losses | | | — | | | | (45,832 | ) | | | — | | | | (45,832 | ) |
| | | | | | | | | | | | | | | | |
| | $ | 176,989 | | | $ | 1,310,872 | | | $ | 157,089 | | | $ | 1,644,950 | |
Goodwill disposed (3) | | | — | | | | — | | | | (1,673 | ) | | | (1,673 | ) |
Tax and other adjustments (4) | | | (21 | ) | | | (12,289 | ) | | | — | | | | (12,310 | ) |
Balance at October 29, 2011 | | | | | | | | | | | | | | | | |
Goodwill | | $ | 176,968 | | | $ | 1,344,415 | | | $ | 155,416 | | | $ | 1,676,799 | |
Accumulated impairment losses | | | — | | | | (45,832 | ) | | | — | | | | (45,832 | ) |
| | | | | | | | | | | | | | | | |
| | $ | 176,968 | | | $ | 1,298,583 | | | $ | 155,416 | | | $ | 1,630,967 | |
| (1) | During the second quarter of fiscal year 2009, the Company made a decision to no longer offer its suite of Files products and concluded that the fair value of the Files reporting unit was less than its carrying amount. The fair value of the Files business was determined using comparable companies’ data. The Company conducted the second step of the goodwill impairment test and determined that all of the Files goodwill was impaired. Accordingly, the Company recorded a goodwill impairment charge of $45.8 million for the three months ended May 2, 2009. |
| (2) | The goodwill adjustment of $15.0 million was primarily a result of realization of deferred tax assets and tax benefit of stock options exercised from acquired companies, partially offset by the impact of adoption of the new accounting standard for its convertible debt from acquired companies. |
| (3) | Goodwill disposed relates to sale of Strategic Business Systems, Inc. (“SBS”), a wholly owned subsidiary, see Note 17, “Loss on Sale of Subsidiary,” of the Notes to Consolidated Financial Statements. |
| (4) | The goodwill adjustment of $12.3 million was primarily a result of tax benefit from the exercise of stock awards of acquired companies. |
79
The Company conducts its goodwill impairment test annually, as of the first day of the second fiscal quarter, or whenever events or changes in facts and circumstances indicate that the fair value of the reporting unit may be less than its carrying amount. For the annual goodwill impairment test, the Company uses the income approach, the market approach, or a combination thereof, to determine each reporting unit’s fair value. The income approach provides an estimate of fair value based on discounted expected future cash flows. The market approach provides an estimate of fair value using various prices or market multiples applied to the reporting unit’s operating results and then applying an appropriate control premium. During the fiscal year 2011 annual goodwill impairment test under the first step, the Company used a combination of approaches to estimate each reporting unit’s fair value. The Company believed that at the time of impairment testing performed in second fiscal quarter of 2011, the income approach and the market approach were equally representative of a reporting unit’s fair value.
Determining the fair value of a reporting unit or an intangible asset requires judgment and involves the use of significant estimates and assumptions. The Company based its fair value estimates on assumptions it believes to be reasonable, but that are unpredictable and inherently uncertain. Estimates and assumptions with respect to the determination of the fair value of its reporting units using the income approach include, among other inputs:
| | • | | The Company’s operating forecasts; |
| | • | | Revenue growth rates; and |
| | • | | Risk-commensurate discount rates and costs of capital. |
The Company’s estimates of revenues and costs are based on historical data, various internal estimates and a variety of external sources, and are developed as part of the Company’s regular long-range planning process. The control premium used in market or combined approaches is determined by considering control premiums offered as part of the acquisitions that have occurred in the reporting units’ comparable market segments. Based on goodwill impairment analysis results during the second fiscal quarter of 2011, the Company determined that no impairment needed to be recorded. During the fiscal year ended October 29, 2011, there were no facts and circumstances that indicated that the fair value of the reporting units may be less than their current carrying amount.
The Company records impairment losses on long-lived assets used in operations when indications of impairment are present and the undiscounted cash flows estimated to be generated by those assets are less than the assets’ carrying amounts. If such assets are considered to be impaired, the impairment charge recognized is the amount by which the carrying amount of the assets exceeds the fair value of the assets. As a result of the impairment of the Files reporting unit in fiscal year 2009, the Company performed an impairment analysis for long-lived Files assets, including its intangible assets. The analysis indicated that all of the intangible assets associated with the Files business were not recoverable. As a result, the Company recorded an acquisition-related intangible assets impairment charge associated with the Files business of $7.5 million during the second quarter of fiscal year 2009.
Intangible assets other than goodwill are amortized over the following estimated remaining useful lives, unless the Company has determined these lives to be indefinite. The decrease in intangible assets during the year ended October 29, 2011 resulted from the sale of SBS, see Note 17, “Loss on Sale of Subsidiary,” of the Notes to Consolidated Financial Statements. The following tables present details of the Company’s intangible assets (in thousands, except for weighted-average remaining useful life):
| | | | | | | | | | | | | | | | |
| | | Gross
Carrying
Value | | | Accumulated
Amortization | | | Net
Carrying
Value | | | Weighted-
Average
Remaining
Useful Life
(in years) | |
October 29, 2011 | | | | | | | | | | | | | | | | |
Trade name | | $ | 10,441 | | | $ | 10,422 | | | $ | 19 | | | | 1.17 | |
Core/developed technology | | | 337,858 | | | | 245,855 | | | | 92,003 | | | | 2.04 | |
Customer relationships | | | 352,581 | | | | 229,906 | | | | 122,675 | | | | 2.12 | |
| | | | | | | | | | | | | | | | |
Total intangible assets | | $ | 700,880 | | | $ | 486,183 | | | $ | 214,697 | | | | 2.08 | |
| | | | | | | | | | | | | | | | |
80
| | | | | | | | | | | | | | | | |
| | | Gross
Carrying
Value | | | Accumulated
Amortization | | | Net
Carrying
Value | | | Weighted-
Average
Remaining
Useful Life
(in years) | |
October 30, 2010 | | | | | | | | | | | | | | | | |
Trade name | | $ | 13,941 | | | $ | 11,150 | | | $ | 2,791 | | | | 9.24 | |
Core/developed technology | | | 338,158 | | | | 189,643 | | | | 148,515 | | | | 2.75 | |
Customer relationships | | | 364,981 | | | | 172,287 | | | | 192,694 | | | | 3.23 | |
| | | | | | | | | | | | | | | | |
Total intangible assets | | $ | 717,080 | | | $ | 373,080 | | | $ | 344,000 | | | | 3.07 | |
| | | | | | | | | | | | | | | | |
The following table presents the amortization of intangible assets included on the Consolidated Statements of Operations (in thousands):
| | | | | | | | | | | | |
| | | Fiscal Year Ended | |
| | | October 29,
2011 | | | October 30,
2010 | | | October 31,
2009 | |
Cost of revenues | | $ | 57,489 | | | $ | 61,249 | | | $ | 65,803 | |
Operating expenses | | $ | 60,713 | | | $ | 65,623 | | | $ | 68,718 | |
| | | | | | | | | | | | |
Total | | $ | 118,202 | | | $ | 126,872 | | | $ | 134,521 | |
| | | | | | | | | | | | |
The following table presents the estimated future amortization of intangible assets as of October 29, 2011 (in thousands):
| | | | |
Fiscal Year | | Estimated
Future
Amortization | |
2012 | | $ | 105,432 | |
2013 | | | 93,109 | |
2014 | | | 16,156 | |
| | | | |
Total | | $ | 214,697 | |
| | | | |
5. Liabilities Associated with Facilities Lease Losses
The Company reevaluates its estimates and assumptions on a quarterly basis and makes adjustments to the reserve balance if necessary. The following table summarizes the activity related to the facilities lease loss reserve, net of expected sublease income (in thousands):
| | | | |
| | | Lease Loss
Reserve | |
Reserve balance at October 31, 2009 | | $ | 20,919 | |
Cash payments on facilities leases | | | (11,413 | ) |
Other adjustments, net | | | 470 | |
| | | | |
Reserve balance at October 30, 2010 | | $ | 9,976 | |
Cash payments on facilities leases | | | (6,024 | ) |
| | | | |
Reserve balance at October 29, 2011 | | $ | 3,952 | |
| | | | |
Cash payments for facilities leases related to the above noted facilities lease losses will be paid over the respective lease terms through fiscal year 2017.
81
6. Balance Sheet Details
The following table provides details of selected balance sheet items (in thousands):
| | | | | | | | |
| | | October 29,
2011 | | | October 30,
2010 | |
Accounts Receivable: | | | | | | | | |
Accounts receivable | | $ | 255,540 | | | $ | 324,084 | |
Allowance for doubtful accounts | | | (1,388 | ) | | | (1,838 | ) |
Sales allowances | | | (5,011 | ) | | | (4,883 | ) |
| | | | | | | | |
Total | | $ | 249,141 | | | $ | 317,363 | |
| | | | | | | | |
Inventories: | | | | | | | | |
Raw materials | | $ | 25,535 | | | $ | 19,384 | |
Finished goods | | | 48,637 | | | | 57,424 | |
| | | | | | | | |
Total | | $ | 74,172 | | | $ | 76,808 | |
| | | | | | | | |
Property and equipment, net: | | | | | | | | |
Computer equipment and software | | $ | 55,175 | | | $ | 47,949 | |
Engineering and other equipment | | | 357,827 | | | | 296,383 | |
Furniture and fixtures (1) | | | 29,195 | | | | 28,283 | |
Leasehold improvements | | | 23,793 | | | | 20,908 | |
Land and building (2) | | | 384,666 | | | | 381,480 | |
| | | | | | | | |
Subtotal | | | 850,656 | | | | 775,003 | |
Less: Accumulated depreciation and amortization (3) | | | (318,272 | ) | | | (235,886 | ) |
| | | | | | | | |
Total | | $ | 532,384 | | | $ | 539,117 | |
| | | | | | | | |
Other accrued liabilities: | | | | | | | | |
Income taxes payable | | $ | 12,978 | | | $ | 10,037 | |
Accrued warranty | | | 11,298 | | | | 5,980 | |
Inventory purchase commitments | | | 5,075 | | | | 4,930 | |
Accrued sales programs | | | 30,651 | | | | 29,992 | |
Accrued expenses | | | 24,520 | | | | 53,616 | |
Others | | | 10,280 | | | | 6,578 | |
| | | | | | | | |
Total | | $ | 94,802 | | | $ | 111,133 | |
| | | | | | | | |
| (1) | Furniture and fixtures include the following amounts under leases as of October 29, 2011 and October 30, 2010: |
| | | | | | | | |
| | | October 29,
2011 | | | October 30,
2010 | |
Cost, including taxes | | $ | 10,613 | | | $ | 10,632 | |
Accumulated depreciation | | | (2,131 | ) | | | (615 | ) |
| | | | | | | | |
Total | | $ | 8,482 | | | $ | 10,017 | |
| | | | | | | | |
| (2) | In connection with the purchase of the property located in San Jose, California, the Company obtained a four-year option, exercisable at its sole discretion through May 22, 2012, to purchase a fourth unimproved approximate four acre parcel for a fixed price of approximately $26.0 million. |
| (3) | Depreciation expense was approximately $88.2 million, $72.8 million and $59.9 million for the years ended October 29, 2011, October 30, 2010 and October 31, 2009, respectively. |
Trade Receivables Factoring Facility
In April 2010, the Company entered into a trade receivables factoring facility with a financial institution to sell certain of its trade receivables from customers with limited, non-credit related, recourse provisions. The sale of receivables eliminates the credit exposure of the Company in relation to these receivables. The Company pays
82
facility administration fees to the financial institution on a quarterly basis. Under the terms of the factoring agreement, the maximum available amount of the factoring facility outstanding at any one time is $50.0 million, which is subject to change based on the financial institution’s approval. During the fiscal years ended October 29, 2011 and October 30, 2010, $50.5 million and $61.4 million, respectively, of trade receivables were sold under the terms of the factoring facility. Sales of trade receivables are recorded as a reduction of trade accounts receivable. The discounts on the sale of receivables for the fiscal years ended October 29, 2011 and October 30, 2010 were immaterial and are included in “Other expenses” on the Consolidated Statement of Operations. Facility administration fees for the fiscal years ended October 29, 2011 and October 30, 2010 were immaterial and are included in “General and administrative expenses” on the Consolidated Statements of Operations.
7. Investments
The following table summarizes the Company’s short-term investments (in thousands):
| | | | | | | | | | | | | | | | |
| | | Amortized
Cost | | | Gross
Unrealized
Gains | | | Gross
Unrealized
Losses | | | Fair
Value | |
October 29, 2011 | | | | | | | | | | | | | | | | |
Corporate bonds | | $ | 774 | | | $ | — | | | $ | — | | | $ | 774 | |
October 30, 2010 | | | | | | | | | | | | | | | | |
Corporate bonds | | $ | 1,998 | | | $ | — | | | $ | — | | | $ | 1,998 | |
As of October 29, 2011 and October 30, 2010, the Company had no unrealized holding gains/losses on investments. Net unrealized holding gains or losses on investments, if any, are included in accumulated other comprehensive loss in the accompanying Consolidated Balance Sheets.
8. Fair Value Measurements
Fair value is the price that would be received from selling an asset or paid to transfer a liability in an orderly transaction between market participants at the measurement date. In determining fair value for assets and liabilities required or permitted to be recorded at fair value, the Company considers the principal or most advantageous market in which it would transact and also considers assumptions that market participants would use when pricing the asset or liability. The Company applies fair value measurements for both financial and nonfinancial assets and liabilities. The Company has no nonfinancial assets and liabilities that are required to be measured at fair value on a recurring basis as of October 29, 2011.
The fair value of the Company’s financial instruments, including cash and cash equivalents, accounts receivable, restricted cash, accounts payable and accrued liabilities, approximate cost because of their short maturities.
The Company did not elect to measure any eligible financial instruments at fair value and report unrealized gains and losses on items for which the fair value option has been elected in earnings at each subsequent reporting date.
Fair Value Hierarchy
The Company utilizes a fair value hierarchy that maximizes the use of observable inputs and minimizes the use of unobservable inputs when measuring fair value. A financial instrument’s categorization within the fair value hierarchy is based upon the lowest level of input that is significant to the fair value measurement. There are three levels of inputs that may be used to measure fair value:
Level 1
Observable inputs that reflect quoted prices in active markets for identical assets or liabilities. Brocade’s assets utilizing Level 1 inputs include money market funds.
83
Level 2
Inputs that reflect quoted prices for similar assets or liabilities in active markets, quoted prices for identical assets or liabilities in less active markets, or model-derived valuations in which significant inputs are observable or can be derived principally from, or corroborated by, observable market data. Brocade’s assets and liabilities utilizing Level 2 inputs include corporate bonds and derivative instruments, respectively.
Level 3
Unobservable inputs that reflect the Company’s own assumptions incorporated in valuation techniques used to determine fair value. These assumptions are required to be consistent with market participant assumptions that are reasonably available. Brocade has no assets or liabilities utilizing Level 3 inputs.
Assets and liabilities measured at fair value on a recurring basis as of October 29, 2011 were as follows (in thousands):
| | | | | | | | | | | | | | | | |
| | | Balance as of
October 29,
2011 | | | Fair Value Measurements Using | |
| | | | Quoted Prices in
Active Markets
For Identical
Instruments
(Level 1) | | | Significant Other
Observable
Inputs
(Level 2) | | | Significant
Unobservable
Inputs
(Level 3) | |
Assets: | | | | | | | | | | | | | | | | |
Money market funds (1) | | $ | 138,959 | | | $ | 138,959 | | | $ | — | | | $ | — | |
Corporate bonds | | | 774 | | | | — | | | | 774 | | | | — | |
Derivative assets | | | 1,368 | | | | — | | | | 1,368 | | | | — | |
| | | | | | | | | | | | | | | | |
Total assets measured at fair value | | $ | 141,101 | | | $ | 138,959 | | | $ | 2,142 | | | $ | — | |
| | | | | | | | | | | | | | | | |
Liabilities: | | | | | | | | | | | | | | | | |
Derivative liabilities | | $ | 1,790 | | | $ | — | | | $ | 1,790 | | | $ | — | |
| | | | | | | | | | | | | | | | |
Total liabilities measured at fair value | | $ | 1,790 | | | $ | — | | | $ | 1,790 | | | $ | — | |
| | | | | | | | | | | | | | | | |
| (1) | Money market funds are reported within “Cash and cash equivalents” on the Consolidated Balance Sheets. |
Assets and liabilities measured at fair value on a recurring basis as of October 30, 2010 were as follows (in thousands):
| | | | | | | | | | | | | | | | |
| | | Balance as of
October 30,
2010 | | | Fair Value Measurements Using | |
| | | Quoted Prices in
Active Markets
For Identical
Instruments
(Level 1) | | | Significant Other
Observable
Inputs
(Level 2) | | | Significant
Unobservable
Inputs
(Level 3) | |
Assets: | | | | | | | | | | | | | | | | |
Money market funds (1) | | $ | 92,981 | | | $ | 92,981 | | | $ | — | | | $ | — | |
Corporate bonds | | | 1,998 | | | | — | | | | 1,998 | | | | — | |
Derivative assets | | $ | 6,450 | | | $ | — | | | $ | 6,450 | | | $ | — | |
| | | | | | | | | | | | | | | | |
Total assets measured at fair value | | $ | 101,429 | | | $ | 92,981 | | | $ | 8,448 | | | $ | — | |
| | | | | | | | | | | | | | | | |
| (1) | Money market funds are reported within “Cash and cash equivalents” on the Consolidated Balance Sheets. |
The Company uses a midpoint of the highest bid and lowest offering obtained from market makers to value its corporate bonds. The Company uses observable market prices for comparable instruments to value its derivative instruments.
84
During the fiscal year ended October 29, 2011, the Company had no transfers between levels of the fair value hierarchy of its assets measured at fair value.
9. Borrowings
Senior Secured Notes
On January 20, 2010, the Company issued $300.0 million aggregate principal amount of its 6.625% senior secured notes due 2018 at an issue price of 99.239% of the principal amount of the notes (the “2018 Notes”) and $300.0 million aggregate principal amount of its 6.875% senior secured notes due 2020 at an issue price of 99.114% of the principal amount of the notes (the “2020 Notes” and, together with the 2018 Notes, the “senior secured notes”), in a private placement to “qualified institutional buyers” in the United States defined in Rule 144A under the Securities Act of 1933, as amended (the “Securities Act”), and outside the United States pursuant to Regulation S under the Securities Act (the “Notes Offering”). The 2018 Notes were issued pursuant to an indenture, dated as of January 20, 2010 (the “2018 Indenture”), among the Company, the Subsidiary Guarantors and Wells Fargo Bank, National Association, as trustee. The 2020 Notes were issued pursuant to an indenture, dated as of January 20, 2010 (the “2020 Indenture” and, together with the 2018 Indenture, the “Indentures”), among the Company, the Subsidiary Guarantors and Wells Fargo Bank, National Association, as trustee.
The 2018 Notes mature on January 15, 2018 and bear interest at a rate of 6.625% per annum, payable semi-annually on January 15 and July 15 of each year, commencing on July 15, 2010. The 2020 Notes mature on January 15, 2020 and bear interest at a rate of 6.875% per annum, payable semi-annually on January 15 and July 15 of each year, commencing on July 15, 2010.
The Company’s obligations under the senior secured notes are guaranteed by certain of the Company’s domestic subsidiaries (the “Subsidiary Guarantors”). Pursuant to the terms of the applicable Indenture, a subsidiary’s guarantee of the 2018 Notes or the 2020 Notes will be automatically and unconditionally released and discharged under the following circumstances:
| | • | | upon the sale of the subsidiary or all or substantially all of its assets; |
| | • | | upon the discharge of the guarantees under the credit facility or other debt provided that the credit facility has been paid in full and the applicable series of senior secured notes have an investment grade rating from both Standard & Poor’s and Moody’s; |
| | • | | upon designation of the subsidiary as an “unrestricted subsidiary” under the applicable Indenture; |
| | • | | upon the merger, consolidation or liquidation of the subsidiary into another subsidiary guarantor; and |
| | • | | upon legal or covenant defeasance or the discharge of the Company’s obligations under the applicable indenture. |
The obligations of the Company and the Subsidiary Guarantors under the senior secured notes and the related guarantees are secured by liens, subject to certain exceptions and permitted liens and subject to the terms of an intercreditor agreement, on all assets of the Company and the Subsidiary Guarantors that secure any obligations under the Senior Secured Credit Facility, as described below.
The Company used approximately $435.0 million of the net proceeds of the Notes Offering to prepay a portion of the outstanding term loan under the Senior Secured Credit Facility on January 20, 2010, and used the remaining net proceeds, together with cash on hand, to retire on February 16, 2010 the 2.25% subordinated convertible notes (“2.25% Notes”) originally issued by McDATA Corporation (“McDATA”), a wholly owned subsidiary of Brocade.
85
As of October 29, 2011, the liability associated with the 2018 Notes of $298.1 million, net of the debt discount of $1.9 million, and the liability associated with the 2020 Notes of $297.7 million, net of the debt discount of $2.3 million, are together reported as “senior secured notes,” on the Consolidated Balance Sheets. As of October 30, 2010, the liability associated with the 2018 Notes of $297.9 million, net of the debt discount of $2.1 million, and the liability associated with the 2020 Notes of $297.5 million, net of the debt discount of $2.5 million, are together reported as “Senior Secured Notes,” on the Consolidated Balance Sheets.
Debt issuance costs totaling $11.0 million associated with the senior secured notes are classified entirely as long-term and have been capitalized as deferred financing costs, with $1.7 million and $0.7 million amortized as of October 29, 2011 and October 30, 2010, respectively. As of October 29, 2011 and October 30, 2010, deferred financing costs were $9.3 million and $10.3 million, respectively, and are reported within “Other assets” on the Consolidated Balance Sheets. The deferred financing costs of the 2018 Notes and the 2020 Notes are being amortized using the effective interest method over the eight-year and ten-year term of the debt, respectively. No payments were made towards the principal of the senior secured notes during the fiscal years ended October 29, 2011 and October 30, 2010, respectively. As of October 29, 2011 and October 30, 2010, the fair value of the Company’s senior secured notes was approximately $626.3 million and $645.4 million, respectively, estimated based on broker trading prices.
On or after January 15, 2013, the Company may redeem all or a part of the 2018 Notes at the redemption prices set forth in the 2018 Indenture, plus accrued and unpaid interest and special interest, if any, to the applicable redemption date. In addition, at any time prior to January 15, 2013, the Company may, on one or more than one occasion, redeem some or all of the 2018 Notes at any time at a redemption price equal to 100% of the principal amount of the 2018 Notes redeemed, plus a “make-whole” premium as of, and accrued and unpaid interest and special interest, if any, to the applicable redemption date. On or after January 15, 2015, the Company may redeem all or a part of the 2020 Notes at the redemption prices set forth in the 2020 Indenture, plus accrued and unpaid interest and special interest, if any, to the applicable redemption date. In addition, at any time prior to January 15, 2015, the Company may, on one or more than one occasion, redeem some or all of the 2020 Notes at any time at a redemption price equal to 100% of the principal amount of the 2020 Notes redeemed, plus a “make-whole” premium as of, and accrued and unpaid interest and special interest, if any, to the applicable redemption date. At any time prior to January 15, 2013, the Company may also redeem up to 35% of the aggregate principal amount of the 2018 Notes and 2020 Notes, using the proceeds of certain qualified equity offerings, at the redemption prices set forth in the 2018 Indenture and the 2020 Indenture, respectively.
If the Company experiences specified change of control triggering events, it must offer to repurchase the senior secured notes at a repurchase price equal to 101% of the principal amount of the senior secured notes repurchased, plus accrued and unpaid interest and special interest, if any, to the applicable repurchase date. If the Company or its subsidiaries sell assets under certain specified circumstances, the Company must offer to repurchase the senior secured notes at a repurchase price equal to 100% of the principal amount of the senior secured notes repurchased, plus accrued and unpaid interest and special interest, if any, to the applicable repurchase date.
Each of the Indentures contains covenants that, among other things, restrict the ability of the Company and its restricted subsidiaries to:
| | • | | pay dividends, make investments or make other restricted payments; |
| | • | | incur additional indebtedness; |
| | • | | enter into transactions with affiliates; |
86
| | • | | permit consensual encumbrances or restrictions on the Company’s restricted subsidiaries’ ability to pay dividends or make certain other payments to the Company; |
| | • | | consolidate, merge, sell or otherwise dispose of all or substantially all of the Company’s or its restricted subsidiaries’ assets; and |
| | • | | designate subsidiaries as unrestricted. |
These covenants are subject to a number of other limitations and exceptions set forth in the Indentures. The Company was in compliance with all applicable covenants as of October 29, 2011 and October 30, 2010.
Each of the Indentures provides for customary events of default, including, but not limited to, cross defaults to specified other debt of the Company and its subsidiaries. In the case of an event of default arising from specified events of bankruptcy or insolvency, all outstanding senior secured notes will become due and payable immediately without further action or notice. If any other event of default under either indenture occurs or is continuing, the applicable trustee or holders of at least 25% in aggregate principal amount of the then outstanding 2018 Notes or 2020 Notes, as applicable, may declare all of the 2018 Notes or 2020 Notes, respectively, to be due and payable immediately.
In connection with the issuance of the senior secured notes, the Company and the Subsidiary Guarantors also entered into registration rights agreements with the initial purchasers relating to each series of the senior secured notes. On June 18, 2010, the Company and the Subsidiary Guarantors filed a registration statement on Form S-4 with respect to each series of the senior secured notes relating to an offer to exchange the applicable series of notes for an issue of SEC-registered notes, with terms identical to the applicable series of the senior secured notes (except that the Exchange Notes will not be subject to restrictions on transfer or to any increase in annual interest rate). The registration statement was declared effective by the SEC on August 24, 2010, and both exchange offers were consummated on October 1, 2010. On May 20, 2011, a post-effective amendment to the registration statement was filed to remove from registration $0.5 million of the 2018 Notes that were not issued during the exchange offer.
Senior Secured Credit Facility
On October 7, 2008, the Company entered into a credit agreement with Bank of America, N.A., Morgan Stanley Senior Funding, Inc., HSBC Bank USA National Association, Keybank National Association and the other lenders party thereto. The credit agreement provided for (i) a five-year $1,100.0 million term loan facility and (ii) a five-year $125.0 million revolving credit facility, which includes a $25.0 million swing line loan sub-facility and a $25.0 million letter of credit sub-facility. The net proceeds of the term loan facility were used to finance a portion of the Company’s acquisition of Foundry. Debt issuance costs totaling $31.6 million associated with financing the acquisition was capitalized as deferred financing costs. In addition to the term loan facility, during the year ended October 31, 2009, the Company drew $14.1 million from the $125.0 million revolving credit facility to finance a small portion of the merger. The Company may draw additional proceeds from the revolving credit facility in the future for ongoing working capital and other general corporate purposes. The term loan facility and revolving credit facility are referred to together as the “Senior Secured Credit Facility.”
On January 8, 2010, the Company entered into an amendment and waiver to the credit agreement, among other things, (i) increase flexibility under certain financial and other covenants, (ii) permit the Company to issue additional senior indebtedness in aggregate principal amount outstanding at any time of up to $600.0 million, (iii) permit the Company to issue additional subordinated indebtedness in aggregate principal amount outstanding at any time of up to $600.0 million, and (iv) permit the Company to sell its accounts receivable and lease receivables for fair market value with the aggregate amount paid for such receivables, net of collections, not at any time exceeding $125.0 million. On January 20, 2010, the Company closed the Notes Offering and used approximately $435.0 million of the proceeds to prepay the term loan.
87
On April 30, 2010, the Company fully paid off the principal of the revolving credit facility for an approximate total amount of $14.1 million. There were no principal amounts outstanding under the revolving credit facility as of October 29, 2011 and October 30, 2010.
On June 10, 2011, the Company entered into a second amendment to the credit agreement (“Amendment No. 2”) to, among other things, refinance all of the outstanding term loan with a replacement term loan that reduced interest rates on the term loan facility, and to amend certain other provisions of the Credit Agreement to provide the Company with greater operating flexibility, including extending the maturity date of the term loan facility to October 31, 2014 and removing certain restrictions on the repurchase of the Company shares, provided the consolidated senior secured leverage ratio is under 2.00:1.00. In accordance with the applicable accounting guidance for debt modification and extinguishment, $51.1 million and $198.9 million of the $250.0 million refinanced was accounted as debt modification and debt extinguishment, respectively. The Company expensed $25.5 million of debt issuance cost and original issue discount relating to the portion of the term loan that was extinguished, which was reported within “Interest expense” on the Consolidated Statements of Operations. Additionally, debt issuance costs totaling $1.2 million associated with the refinancing was capitalized as deferred financing costs.
Prior to Amendment No. 2, loans under the Senior Secured Credit Facility bore interest, at the Company’s option, at a rate equal to either the London Interbank Offered Rate (“LIBOR”) rate, plus an applicable margin equal to 4.0% per annum or the prime lending rate, plus an applicable margin equal to 3.0% per annum. The applicable margin with respect to revolving loans was subject to adjustment based on the Company’s consolidated senior secured leverage ratio, as defined in the credit agreement. The LIBOR rate “floor” was 3.0% per annum and the prime lending rate “floor” was 4.0% per annum, in each case, for the life of the Senior Secured Credit Facility. Amendment No. 2 reduced the applicable margin on the term loan to a level not in excess of LIBOR plus 2.375% or the prime lending rate plus 1.375% and eliminated the minimum LIBOR rate “floor” and prime rate “floor” with respect to the term loan facility. For the fiscal year ended October 29, 2011, the weighted-average interest rate on the term loan was 2.8% and as of October 29, 2011, the weighted-average annualized interest rate on the term loan was 5.4%. For the fiscal year ended October 30, 2010, the weighted-average interest rate on the term loan was 7.0% and as of October 30, 2010, the weighted-average annualized interest rate on the term loan was 7.0%.
The Company is permitted to make voluntary prepayments at any time (without payment of a premium, other than in the case of a repricing transaction in respect of the term loan facility), and is required to make mandatory prepayments on the term loan (without payment of a premium) with (i) net cash proceeds from non-ordinary course asset sales (subject to reinvestment rights and other exceptions), (ii) net cash proceeds from issuances of debt (other than certain permitted debt), and (iii) casualty proceeds and condemnation awards (subject to reinvestment rights and other exceptions). Under Amendment No. 2, the Company is required to pay quarterly installments of $12.5 million on the term loan, as adjusted for any voluntary prepayments, with any remaining balance payable on the final maturity date of the term loan. In addition to the refinancing of the term loan facility, during the fiscal year ended October 29, 2011, the Company paid $160.9 million towards the principal of the term loan, $130.3 million of which were voluntary prepayments.
The deferred financing costs are being amortized using the effective interest method over the term of the debt. As of October 29, 2011 and October 30, 2010, deferred financing costs were $3.1 million and $17.3 million, respectively, and are reported within “Other assets” on the Consolidated Balance Sheets. The Company believes that the carrying value of its Senior Secured Credit Facility approximates its fair value as the interest rate is based on a floating market rate.
The obligations of the Company and its subsidiary guarantors under the Senior Secured Credit Facility and the related guarantees there under are secured, subject to customary permitted liens and other agreed upon exceptions, by (i) a first priority pledge of all of the equity interests of each of the Company’s direct and indirect subsidiaries and (ii) a perfected first priority interest in and mortgages on all tangible and intangible assets of the Company and each subsidiary guarantor, except, in the case of a foreign subsidiary, to the extent such pledge
88
would be prohibited by applicable law or would result in materially adverse tax consequences (limited, in the case of a first-tier foreign subsidiary, to 65% of the voting stock and 100% of the non-voting stock of such first-tier foreign subsidiary).
The credit agreement contains customary representations and warranties and customary affirmative and negative covenants applicable to the Company and its subsidiaries, including, among other things, restrictions on liens, indebtedness, investments, fundamental changes, dispositions, capital expenditures, prepayment of other indebtedness, redemption or repurchase of subordinated indebtedness, share repurchases, dividends and other distributions. The credit agreement contains financial covenants that require the Company to maintain a minimum consolidated fixed charge coverage ratio, a maximum consolidated leverage ratio and a maximum consolidated senior secured leverage ratio, each as defined in the credit agreement and described further below. The credit agreement also includes customary events of default, including cross-defaults on the Company’s material indebtedness and change of control. The Company was in compliance with all applicable covenants as of October 29, 2011 and October 30, 2010.
Covenant Compliance
Under the Senior Secured Credit Facility, certain limitations, restrictions and defaults could occur if the Company is not able to satisfy and remain in compliance with specified financial ratios.
Consolidated Earnings Before Interest, Taxes, Depreciation and Amortization (“EBITDA”), as defined in the credit agreement, is used to determine the Company’s compliance with certain covenants in the Senior Secured Credit Facility. Consolidated EBITDA is defined as:
| | • | | Consolidated net income |
Plus:
| | • | | Consolidated interest charges; |
| | • | | Provision for federal, state, local and foreign income taxes; |
| | • | | Depreciation and amortization expense; |
| | • | | Fees, costs and expenses incurred on or prior to the closing date of the Foundry acquisition in connection with the acquisition and the financing thereof; |
| | • | | Any cash restructuring charges and integration costs in connection with the Foundry acquisition, in an aggregate amount not to exceed $75.0 million; |
| | • | | Approved non-cash restructuring charges incurred in connection with the Foundry acquisition and the financing thereof; |
| | • | | Other non-recurring expenses reducing consolidated net income which do not represent a cash item in such period or future periods; |
| | • | | Any non-cash stock-based compensation expense; and |
| | • | | Legal fees associated with the indemnification obligations for the benefit of former officers and directors in connection with Brocade’s historical stock option litigation; |
Minus:
| | • | | Federal, state, local and foreign income tax credits; and |
| | • | | All non-cash items increasing consolidated net income. |
89
In addition, the Company must comply with the following financial covenants as noted below:
Consolidated Fixed Charge Coverage Ratio
Consolidated fixed charge coverage ratio means, at any date of determination, the ratio of (a) (i) consolidated EBITDA (excluding interest expense, if any, attributable to the campus sale-leaseback), plus (ii) rentals payable under leases of real property, less (iii) the aggregate amount of all capital expenditures to (b) consolidated fixed charges; provided that, for purposes of calculating the consolidated fixed charge coverage ratio for any period ending prior to the first anniversary of the closing date, consolidated interest charges shall be an amount equal to actual consolidated interest charges from the closing date through the date of determination multiplied by a fraction the numerator of which is 365 and the denominator of which is the number of days from the closing date through the date of determination.
In accordance with the amendment and waiver to the credit agreement, the Company has agreed that it will not permit the consolidated fixed charge coverage ratio as of the end of any fiscal quarter during any period set forth below to be less than the ratio set forth below opposite such period:
| | | | |
Four Fiscal Quarters Ending During Period: | | Minimum Consolidated
Fixed Charge
Coverage Ratio | |
October 31, 2010 through October 29, 2011 | | | 1.50:1.00 | |
October 30, 2011 through October 27, 2012 | | | 1.75:1.00 | |
October 28, 2012 and thereafter | | | 1.75:1.00 | |
Consolidated Leverage Ratio
Consolidated leverage ratio means, as of any date of determination, the ratio of (a) consolidated funded indebtedness as of such date to (b) consolidated EBITDA for the measurement period ending on such date.
In accordance with the amendment and waiver to the credit agreement, the Company has agreed that it will not permit the consolidated leverage ratio at any time during any period set forth below to be greater than the ratio set forth below opposite such period:
| | | | |
Four Fiscal Quarters Ending During Period: | | Maximum Consolidated
Leverage Ratio | |
October 31, 2010 through October 29, 2011 | | | 3.00:1.00 | |
October 30, 2011 through October 27, 2012 | | | 2.75:1.00 | |
October 28, 2012 and thereafter | | | 2.75:1.00 | |
Consolidated Senior Secured Leverage Ratio
Consolidated senior secured leverage ratio means, as of any date of determination, the ratio of (a) consolidated funded indebtedness as of such date, minus, without duplication, all unsecured senior subordinated or subordinated indebtedness of Brocade or its subsidiaries on a consolidated basis as of such date (including the McDATA convertible subordinated debt prior to being retired on February 16, 2010), to (b) consolidated EBITDA for the measurement period ending on such date.
In accordance with the amendment and waiver to the credit agreement, the Company has agreed that it will not permit the consolidated senior secured leverage ratio at any time during any period set forth below to be greater than the ratio set forth below opposite such period:
| | | | |
Four Fiscal Quarters Ending During Period: | | Maximum Consolidated
Senior Secured
Leverage Ratio | |
October 31, 2010 through October 29, 2011 | | | 2.50:1.00 | |
October 30, 2011 through October 27, 2012 | | | 2.25:1.00 | |
October 28, 2012 and thereafter | | | 2.00:1.00 | |
90
Convertible Subordinated Debt
The 2.25% Notes originally issued by McDATA bore a fixed rate of interest of 2.25% payable semiannually. The Company capitalized a portion of the interest associated with this debt during the fiscal years ended October 30, 2010 and October 31, 2009. In addition, the effective interest rate for the 2.25% Notes was 8.63% for fiscal year 2009 and fiscal year 2010 for the period through February 15, 2010 when the convertible subordinated debt was due. The amount of interest cost recognized relating to both the contractual interest coupon and amortization of the discount on the liability component of the 2.25% Notes was as follows:
| | | | | | | | | | | | |
| | | Fiscal Year Ended | |
In thousands | | October 29,
2011 | | | October 30,
2010 | | | October 31,
2009 | |
Interest expense | | $ | — | | | $ | 4,305 | | | $ | 14,057 | |
Debt Maturities
As of October 29, 2011, our aggregate debt maturities based on outstanding principal were as follows (in thousands):
| | | | |
Fiscal Year | | Principal
Balances | |
2012 | | $ | 40,000 | |
2013 | | | 40,000 | |
2014 | | | 110,000 | |
2015 | | | — | |
2016 | | | — | |
Thereafter | | | 600,000 | |
| | | | |
Total | | $ | 790,000 | |
| | | | |
10. Commitments and Contingencies
Operating Leases
The Company leases certain facilities and certain equipment under various operating agreements expiring through March 2021. In connection with its facilities lease agreements, the Company has signed unconditional, irrevocable letters of credit totaling $0.3 million as security for the leases.
Total rent expense was approximately $17.3 million in fiscal year 2011, $30.0 million in fiscal year 2010 and $30.2 million in fiscal year 2009, net of releases in facilities lease loss reserve, as well as sublease income, of $7.2 million, $12.5 million and $13.9 million, respectively. Future minimum lease payments under all non-cancelable operating leases as of October 29, 2011 total $62.9 million, net of contractual sublease income of $35.7 million. In addition to base rent, many of the facilities lease agreements require that the Company pay a proportional share of the respective facilities’ operating expenses.
Future minimum lease payments under all non-cancelable operating leases as of October 29, 2011, excluding the contractual sublease income stated above, are as follows (in thousands):
| | | | |
Fiscal Year | | Operating
Leases | |
2012 | | $ | 23,383 | |
2013 | | | 19,099 | |
2014 | | | 17,046 | |
2015 | | | 14,584 | |
2016 | | | 12,802 | |
Thereafter | | | 11,642 | |
| | | | |
Total minimum lease payments | | $ | 98,556 | |
| | | | |
91
Capital Lease Obligations
Total payments under capital leases were approximately $2.2 million in fiscal year 2011 and the Company will make payments totaling $7.5 million over the next four years, including $0.7 million for imputed interest expense. Future minimum lease payments under all non-cancelable capital leases as of October 29, 2011 are as follows (in thousands):
| | | | |
Fiscal Year | | Capital
Leases | |
2012 | | $ | 2,221 | |
2013 | | | 2,221 | |
2014 | | | 2,221 | |
2015 | | | 862 | |
| | | | |
Total minimum lease payments | | $ | 7,525 | |
| | | | |
Product Warranties
The Company’s accrued liability for estimated future warranty costs is included in “Other accrued liabilities” in the accompanying Consolidated Balance Sheets. The following table summarizes the activity related to the Company’s accrued liability for estimated future warranty costs during the fiscal years ended October 29, 2011 and October 30, 2010 (in thousands):
| | | | | | | | |
| | | Accrued Warranty | |
| | | Twelve Months Ended | |
| | | October 29,
2011 | | | October 30,
2010 | |
Beginning balance | | $ | 5,980 | | | $ | 5,808 | |
Liabilities accrued for warranties issued during the period | | | 8,388 | | | | 3,480 | |
Warranty claims paid and used during the period | | | (1,394 | ) | | | (1,705 | ) |
Changes in liability for pre-existing warranties during the period | | | (1,676 | ) | | | (1,603 | ) |
| | | | | | | | |
Ending balance | | $ | 11,298 | | | $ | 5,980 | |
| | | | | | | | |
In addition, the Company has standard indemnification clauses contained within its various customer contracts. As such, the Company indemnifies the parties to whom it sells its products with respect to the Company’s product, alone or potentially in combination with others, infringing upon any patents, trademarks, copyrights, or trade secrets, as well as against bodily injury or damage to real or tangible personal property caused by a defective Company product. As of October 29, 2011, there have been no known material events or circumstances that have resulted in a customer contract-related indemnification liability to the Company.
Manufacturing and Purchase Commitments
Brocade has manufacturing arrangements with CMs under which Brocade provides twelve-month product forecasts and places purchase orders in advance of the scheduled delivery of products to Brocade’s customers. The required lead time for placing orders with the CMs depends on the specific product. Brocade issues purchase orders and the CMs then generate invoices based on prices and payment terms mutually agreed upon and set forth in those purchase orders. Although the purchase orders Brocade places with its CMs are cancelable, the terms of the agreements require Brocade to purchase all inventory components not returnable, usable by, or sold to other customers of the CMs.
As of October 29, 2011, the Company’s aggregate commitment to the CMs for inventory components used in the manufacture of Brocade products was $257.1 million, which the Company expects to utilize during future
92
normal ongoing operations, net of a purchase commitments reserve of $5.1 million. The Company’s purchase commitments reserve reflects the Company’s estimate of purchase commitments it does not expect to consume in normal ongoing operations within the next twelve months.
Income Taxes
The Company is subject to several ongoing income tax audits. For additional discussion, see Note 15, “Income Taxes,” of the Notes to Consolidated Financial Statements. The Company believes it has adequate reserves for all open tax years.
Legal Proceedings
Initial Public Offering Litigation
On July 20, 2001, the first of a number of putative class actions for violations of the federal securities laws was filed in the United States District Court for the Southern District of New York against Brocade, certain of its officers and directors, and certain of the underwriters for Brocade’s initial public offering (“IPO”) of securities. A consolidated amended class action captioned, In re Brocade Communications Systems, Inc. Initial Public Offering Securities Litigation, No. 01 Civ. 6613, was filed on April 19, 2002. The complaint generally alleges that various underwriters engaged in improper and undisclosed activities related to the allocation of shares in Brocade’s initial public offering and seeks unspecified damages for claims under the Exchange Act on behalf of a purported class of purchasers of common stock from May 24, 1999 to December 6, 2000. The lawsuit against Brocade was coordinated for pretrial proceedings with a number of other pending litigations challenging underwriter practices in over 300 cases as In re Initial Public Offering Securities Litigation, 21 MC 92 (SAS), including actions against McDATA Corporation, Inrange Technologies Corporation (“Inrange”) (which was first acquired by Computer Network Technology Corporation (“CNT”) and subsequently acquired by McDATA as part of the CNT acquisition), and Foundry (collectively, the “Brocade Entities”), and certain of each entity’s respective officers and directors, and initial public offering underwriters.
The parties have reached a global settlement of the coordinated litigation, under which the insurers will pay the full amount of settlement share allocated to the Brocade Entities, and the Brocade Entities will bear no financial liability. In 2009, the Court granted final approval of the settlement. Certain objectors subsequently filed appeals, a number of which were dismissed by agreement or by the appellate court. In August 2011, the district court issued an order determining that the last remaining appellant was not a class member and thus lacked standing to object to the settlement. Currently on appeal is the district court’s August 2011 ruling that the remaining appellant lacks standing.
Intellectual Property Litigation
On June 21, 2005, Enterasys Networks, Inc. (“Enterasys”) filed a lawsuit against Foundry (and Extreme Networks, Inc.) in the United States District Court for the District of Massachusetts alleging that certain of Foundry’s products infringe six of Enterasys’ patents and seeking injunctive relief, as well as unspecified damages. Enterasys subsequently added Brocade as a defendant. On August 28, 2007, the Court granted Foundry’s motion to stay the case based on petitions that Foundry had filed with the United States Patent and Trademark Office (“USPTO”) in 2007 for reexamination of five of the six Enterasys patents. Two of the patents received final rejections during their respective reexaminations, in which the USPTO held that the claims were invalid. Enterasys filed appeals of those rejections with the USPTO’s Board of Patent Appeals and Interferences in 2009. The Board partially affirmed and partially reversed one of those rejections on January 24, 2011, and Enterasys did not appeal further, which ended the proceedings on those two patents. The USPTO has issued reexamination certificates for the remaining three patents undergoing reexamination indicating that the patents were valid over the references that Foundry had submitted. On March 7, 2011 the USPTO issued a Notice of
93
Intent to Issue a Re-examination Certificate upholding the validity of the third patent. Meanwhile, on May 21, 2010, the Court lifted the stay of the litigation, and Enterasys subsequently dropped from the litigation the two patents it appealed at the USPTO. Accordingly, four patents remain at issue in the litigation. No trial date has been set.
On September 6, 2006, Chrimar Systems, Inc. (“Chrimar”) filed a lawsuit against Foundry (and D-Link Corporation and PowerDsine, Ltd.) in the United States District Court for the Eastern District of Michigan alleging that certain of Foundry’s products infringe Chrimar’s U.S. Patent 5,406,260 and seeking injunctive relief, as well as unspecified damages. Discovery has been completed. No trial date has been set.
On August 4, 2010, Brocade and Foundry Networks LLC (“Plaintiffs”) filed a lawsuit against A10 Networks, Inc. (“A10”), A10’s founder and other individuals in the United States District Court for the Northern District of California. On October 29, 2010, Plaintiffs filed an amended complaint. In the amended complaint, Brocade alleged that A10 and the individual defendants have misappropriated Plaintiff’s trade secrets, infringed copyrighted works, interfered with existing contracts between the Plaintiffs and their employees, breached contracts, breached their fiduciary duties and duties of loyalty, and that certain of A10’s products infringe 13 of Brocade’s patents. Brocade is seeking injunctive relief, as well as monetary damages. On May 16, 2011, A10 filed an answer and counterclaim alleging that certain of Brocade’s products infringe a patent recently acquired by A10 and seeking injunctive relief, as well as unspecified damages. Trial is scheduled for July 16, 2012.
On September 9, 2011, A10 filed a lawsuit against Brocade in the United States District Court for the Northern District of California. A10 alleges that certain of Brocade’s products infringe two additional patents acquired by A10. Brocade has filed a motion to dismiss the complaint. No trial schedule for this lawsuit has been set.
General
From time to time, the Company is subject to other legal proceedings and claims in the ordinary course of business, including claims of alleged infringement of trademarks, copyrights, patents and/or other intellectual property rights and commercial contract disputes. Third parties assert patent infringement claims against the Company from time to time in the form of letters, lawsuits and other forms of communication. In addition, from time to time, the Company receives notification from customers claiming that they are entitled to indemnification or other obligations from the Company related to infringement claims made against them by third parties. Litigation, even if the Company is ultimately successful, can be costly and divert management’s attention away from the day-to-day operations of the Company.
On a quarterly and annual basis, the Company reviews relevant information with respect to litigation contingencies and updates its accruals, disclosures and, when possible, estimates of reasonably possible losses or ranges of loss based on such reviews. However, litigation is inherently unpredictable, and outcomes are typically uncertain, and the Company’s past experience does not provide any additional visibility or predictability to estimate the range of loss that may occur because the costs, outcome and status of these types of claims and proceedings have varied significantly in the past. The Company is not currently able to reasonably estimate the possible loss or range of loss from the above legal proceedings and, accordingly, the Company is unable to estimate the effects of the above on its financial condition, results of operations or cash flows.
The Company records a liability when it is both probable that a liability has been incurred and the amount of the loss can be reasonably estimated.
11. Derivative Instruments and Hedging Activities
In the normal course of business, the Company is exposed to fluctuations in interest rates and the exchange rates associated with foreign currencies. The Company’s primary objective for holding derivative financial instruments is to manage foreign currency exchange rate risk. The Company currently does not enter into derivative instruments to manage credit risk. However, the Company manages its exposure to credit risk through its investment policies. The Company generally enters into derivative transactions with high-credit quality counterparties and, by policy, limits the amount of credit exposure to any one counterparty based on its analysis
94
of that counterparty’s relative credit standing. The amounts subject to credit risk related to derivative instruments are generally limited to the amounts, if any, by which counterparty’s obligations exceed the Company’s obligations with that counterparty.
Foreign Currency Exchange Rate Risk
A majority of the Company’s revenue, expense and capital purchasing activities is transacted in U.S. dollars. However, the Company is exposed to foreign currency exchange rate risk inherent in conducting business globally in numerous currencies, of which the most significant to its operations for the fiscal year ended October 29, 2011 were the Chinese yuan, the euro, the Japanese yen, the Indian rupee, the British pound, the Singapore dollar and the Swiss franc. The Company is primarily exposed to foreign currency fluctuations related to operating expenses denominated in currencies other than the U.S. dollar. The Company has established a foreign currency risk management program to protect against fluctuations in the volatility of future cash flows caused by changes in foreign currency exchange rates. This program reduces, but does not always entirely eliminate, the impact of foreign currency exchange rate movements. The Company’s foreign currency risk management program includes foreign currency derivatives with cash flow hedge accounting designation that utilizes foreign currency forward contracts to hedge exposures to the variability in the U.S. dollar equivalent of anticipated non-U.S. dollar-denominated cash flows. These instruments generally have a maturity of less than one year. For these derivatives, the Company reports the after-tax gain or loss from the effective portion of the hedge as a component of accumulated other comprehensive loss in stockholders’ equity and reclassifies it into earnings in the same period in which the hedged transaction affects earnings. Prior to fiscal year 2011, these gains or losses were included in “Other expenses” on the consolidated statements of operations. Beginning in the first fiscal quarter of 2011, these gains or losses are now presented within “Cost of revenues” and “Operating expenses,” to match the underlying exposure to the related hedge results. Prior period amounts are not material and have not been reclassified. Net gains (losses) relating to the effective portion of foreign currency derivatives recorded in the consolidated statements of operations are as follows (in thousands):
| | | | | | | | | | | | |
| | | Fiscal Year Ended
October 29, 2011 | | | Fiscal Year Ended
October 30, 2010 | | | Fiscal Year Ended
October 31, 2009 | |
Cost of revenues | | $ | 882 | | | $ | — | | | $ | — | |
Research and development | | | 496 | | | | — | | | | — | |
Sales and marketing | | | 5,498 | | | | — | | | | — | |
General and Administrative | | | 416 | | | | — | | | | — | |
Other expenses | | | — | | | | (5,285 | ) | | | (1,814 | ) |
| | | | | | | | | | | | |
Total | | $ | 7,292 | | | $ | (5,285 | ) | | $ | (1,814 | ) |
| | | | | | | | | | | | |
The net foreign currency exchange gains and losses recorded as part of “Other expenses” were losses of $0.6 million, $6.6 million and $4.5 million for the fiscal years ended October 29, 2011, October 30, 2010 and October 31, 2009, respectively.
Volume of Derivative Activity
Total gross notional amounts, presented by currency, are as follows (in thousands):
| | | | | | | | | | | | | | | | |
| | | Derivatives Designated
as Hedging Instruments | | | Derivatives Not Designated
as Hedging Instruments | |
In United States Dollars | | October 29, 2011 | | | October 30, 2010 | | | October 29, 2011 | | | October 30, 2010 | |
Euro | | $ | 57,935 | | | $ | 53,700 | | | $ | — | | | $ | — | |
British pound | | | 25,282 | | | | 22,018 | | | | — | | | | — | |
Japanese yen | | | 17,957 | | | | 14,306 | | | | — | | | | — | |
Singapore dollar | | | 16,136 | | | | 12,427 | | | | — | | | | — | |
Swiss franc | | | 13,060 | | | | 9,554 | | | | 5,012 | | | | — | |
| | | | | | | | | | | | | | | | |
Total | | $ | 130,370 | | | $ | 112,005 | | | $ | 5,012 | | | $ | — | |
| | | | | | | | | | | | | | | | |
95
The Company utilizes a rolling hedge strategy for the majority of its foreign currency derivative instruments with cash flow hedge accounting designation that hedges exposures to the variability in the U.S. dollar equivalent of anticipated non-U.S. dollar-denominated cash flows. All of the Company’s foreign currency forward contracts are single delivery, which are settled at maturity involving one cash payment exchange.
Gross unrealized loss positions are recorded within “Other accrued liabilities,” and gross unrealized gain positions are recorded within “Prepaid and other current assets.” As of October 29, 2011, the Company had gross unrealized loss positions of $1.8 million and gross unrealized gain positions of $1.4 million included in “Other accrued liabilities” and “Prepaid and other current assets,” respectively. Effective cash flow hedges are reported as a component of accumulated other comprehensive loss. Cash flow hedges ineffectiveness, which is included in the Company’s net income as part of “Other expenses,” was not significant.
12. Employee Compensation Plans
In April 2009, the stockholders of Brocade approved the Company’s 2009 Stock Plan, 2009 Director Plan and 2009 Employee Stock Purchase Plan (“2009 ESPP”), and such plans are now part of the Company’s equity compensation plans. The Company’s 1999 Stock Plan, 1999 Director Option Plan and 1999 Employee Stock Purchase Plan each expired in March 2009 by their terms.
2009 Stock Plan
The 2009 Stock Plan provides for the grant of stock options, restricted stock, restricted stock units, stock appreciation rights, performance units and performance shares, and other stock or cash awards to employees, directors and consultants. Per the terms of the 2009 Stock Plan, 48.0 million shares of the Company’s common stock are reserved for issuance under the plan, plus the following:
| | • | | Any shares subject to stock options or similar awards granted under the Company’s 1999 Stock Plan, 1999 Nonstatutory Stock Option Plan (“NSO Plan”) and 2001 McDATA Equity Incentive Plan that expire or otherwise terminate without having been exercised in full; and |
| | • | | Shares issued pursuant to awards granted under the Company’s 1999 Stock Plan, 1999 NSO Plan and 2001 McDATA Equity Incentive Plan that are forfeited to or repurchased by the Company, with the maximum number of shares to be added to the 2009 Stock Plan pursuant to this clause equal to 40.3 million shares. |
2009 Director Plan
The 2009 Director Plan provides for the grant of stock options and restricted stock units to non-employee directors of the Company. The Board of Directors has reserved 2.0 million shares of the Company’s common stock for issuance under the 2009 Director Plan, plus any shares subject to stock options or similar awards granted under the Company’s 1999 Director Option Plan that expire or otherwise terminate without having been exercised in full, and shares issued pursuant to awards granted under the Company’s 1999 Director Option Plan that are forfeited to or repurchased by the Company, with the maximum number of shares to be added to the 2009 Director Plan pursuant to this clause equal to 0.9 million shares.
2009 Employee Stock Purchase Plan
The 2009 ESPP permits eligible employees to purchase shares of the Company’s common stock through payroll deductions for up to 15% of qualified compensation during the offering period. The purchase price is 85% of the lesser of the fair market value of the Company’s common stock on (i) the first trading day of the offering period, or (ii) the last day of each six-month purchase period; provided, however, that the purchase price for subsequent offering periods may be determined by the administrator, subject to compliance with the terms of the 2009 ESPP. A total of 35.0 million shares of the Company’s common stock are reserved for issuance under
96
the 2009 ESPP. The 2009 ESPP is implemented through consecutive, overlapping offering periods of up to approximately twenty-four months. The offering periods generally start with the first trading day on or after June 1 and December 1 each year and end on the last trading day in the periods ending twenty-four months later, unless the fair market value of the Company’s common stock on the last day of a purchase period is lower than the fair market value of the Company’s common stock on the first trading day of the offering period, in which case the offering period will end early, immediately after the purchase period, and a new offering period will commence on or about such date. Each offering period will be divided into four purchase periods of approximately six months in length. Eligible employees may purchase no more than 3,750 shares of the Company’s common stock during each six-month purchase period. As of October 29, 2011, 18.7 million shares were available for issuance under the 2009 ESPP.
Equity Compensation Plans
The Company grants stock options, restricted stock awards and restricted stock units for shares of the Company’s common stock and other types of equity compensation awards to its employees and directors under the various equity compensation plans described above. In accordance with the terms of the 2009 Stock Plan and the 2009 Director Plan, each award granted with an exercise price that is less than fair market value, which includes all grants of restricted stock awards, restricted stock units, performance shares and performance units, will count against the applicable plan’s share reserve as 1.56 shares for every one share subject to such award. In addition, the exercise price of stock options and stock appreciation rights granted under the 2009 Stock Plan must be at least equal to the fair market value of the Company’s common stock on the date of grant and the exercise price of incentive stock options granted to any participant who owns more than 10% of the total voting power of all classes of the Company’s outstanding stock must be at least 110% of the fair market value of the Company’s common stock on the date of grant.
The term of a stock option and a stock appreciation right may not exceed seven years, except that, with respect to any participant who owns 10% of the voting power of all classes of the Company’s outstanding capital stock, the term of an incentive stock option may not exceed five years. The majority of the stock options, restricted stock awards and restricted stock units granted under the Company’s equity compensation plans vest over a period of three to four years. Certain options and awards granted under the 2009 Stock Plan vest over shorter or longer periods.
At October 29, 2011, approximately 100.6 million shares were authorized for future issuance under the Company’s equity compensation plans, which include stock options, shares to be issued pursuant to the 2009 ESPP, restricted stock units and other awards, and shares of Brocade common stock that became issuable in connection with the assumption or substitution of Foundry equity awards. A total of 26.5 million shares of common stock were available for grant under the Company’s equity compensation plans as of October 29, 2011. At October 30, 2010, approximately 149.0 million shares were authorized for future issuance under the Company’s equity compensation plans, which include stock options, shares to be issued pursuant to the 2009 ESPP, restricted stock units and other awards, and shares of Brocade common stock that became issuable in connection with the assumption or substitution of Foundry equity awards. A total of 48.4 million shares of common stock were available for grant under the Company’s equity compensation plans as of October 30, 2010. Awards that expire, or are canceled without delivery of shares, generally become available for issuance under the Company’s equity compensation plans.
1999 Nonstatutory Stock Option Plan
In September 1999, the Board of Directors approved the Company’s 1999 NSO Plan. The 1999 NSO Plan provides for the grant of nonstatutory stock options to employees and consultants. A total of 51.4 million shares of the Company’s common stock have been reserved for issuance under the 1999 NSO Plan. As of October 29, 2011, the Company has reserved 11.4 million shares of authorized but unissued shares of common stock for future issuance upon exercise of options under the 1999 NSO Plan.
97
McDATA Equity Plans
On January 29, 2007, effective upon the consummation of the merger, Brocade assumed the McDATA equity plans. As of October 29, 2011, options to purchase approximately 2.2 million shares of converted common stock, restricted stock and other equity awards remained outstanding under former McDATA equity plans.
Employee 401(k) Plan
The Company sponsors the Brocade Communications Systems, Inc. 401(k) Plan (“401(k) Plan”), which qualifies under Section 401(k) of the Internal Revenue Code and is designed to provide retirement benefits for its eligible employees through tax-deferred salary deductions.
Employees may elect to contribute up to 60% of their eligible compensation to the 401(k) Plan. Employee contributions are limited to a maximum annual amount as set periodically by the Internal Revenue Service (“IRS”). The Company matches employee contributions dollar for dollar up to a maximum of $3,000 per calendar year per person. All matching contributions vest immediately. The Company’s matching contributions to the 401(k) Plan totaled $9.3 million, $8.7 million and $7.8 million for the years ended October 29, 2011, October 30, 2010 and October 31, 2009, respectively.
13. Sale-Leaseback Transaction
During fiscal year 2010, the Company sold an owned real estate property to an unrelated third party. Net proceeds from this sale were $30.2 million. Concurrent with this sale, the Company entered into an agreement to lease the property back from the purchaser over a minimum lease term of two years. The Company considers this lease as a normal leaseback and classified the lease as an operating lease. An $8.7 million loss on the sale of the property was recognized immediately upon execution of the sale and is recorded within “Gain (loss) on sale of investments and property, net” on the Consolidated Statements of Operations.
14. Stock-Based Compensation
Equity Compensation Plan Information
The following table summarizes information with respect to shares of the Company’s common stock that may be issued under the Company’s existing equity compensation plans as of October 29, 2011 (in thousands, except per share amounts):
| | | | | | | | | | | | |
Plan Category | | A
Number of Securities
to be Issued
Upon Exercise of
Outstanding Options,
Warrants and Rights | | | B
Weighted-Average
Exercise Price of
Outstanding Options,
Warrants and Rights | | | C
Number of Securities
Remaining Available
for Future Issuance
Under Equity
Compensation Plans
(Excludes Securities
Reflected in Column A) | |
Equity compensation plans approved by stockholders (1) | | | 38,244 | (3) | | $ | 5.14 | | | | 26,468 | (4) |
Equity compensation plans not approved by stockholders (2) | | | 12,521 | (5) | | $ | 4.21 | | | | — | |
| | | | | | | | | | | | |
Total | | | 50,765 | | | $ | 4.91 | | | | 26,468 | |
| | | | | | | | | | | | |
| (1) | Primarily consist of the 2009 ESPP, the 2009 and 1999 Director Plans and the 2009 and 1999 Stock Plans. |
| (2) | Consist solely of the 1999 NSO Plan described in Note 12, “Employee Compensation Plans,” of the Notes to Consolidated Financial Statements and Foundry’s 2000 NSO Plan, which was assumed in connection with our acquisition of Foundry. |
98
| (3) | Amount excludes purchase rights accrued under the 2009 ESPP. As of October 29, 2011, the 2009 ESPP had a stockholder-approved reserve of 35.0 million shares, of which 18.7 million shares were available for future issuance. |
| (4) | Amount consists of shares available for future issuance under the 2009 ESPP, the 2009 Director Plan and the 2009 Stock Plan. |
| (5) | Substantially all shares were granted prior to the fiscal year ended October 25, 2003. Information relating to equity compensation plans is set forth in Note 12, “Employee Compensation Plans,” of the Notes to Consolidated Financial Statements. |
Stock-based compensation expense, net of estimated forfeitures, was included in the following line items on the Consolidated Statements of Operations as follows (in thousands):
| | | | | | | | | | | | |
| | | Fiscal Year Ended
October 29, 2011 | | | Fiscal Year Ended
October 30, 2010 | | | Fiscal Year Ended
October 31, 2009 | |
Cost of revenues (1) | | $ | 15,607 | | | $ | 13,552 | | | $ | 25,654 | |
Research and development | | | 18,959 | | | | 27,795 | | | | 40,365 | |
Sales and marketing (1) | | | 36,068 | | | | 45,232 | | | | 48,820 | |
General and administrative | | | 12,442 | | | | 15,046 | | | | 22,380 | |
| | | | | | | | | | | | |
Total stock-based compensation | | $ | 83,076 | | | $ | 101,625 | | | $ | 137,219 | |
| | | | | | | | | | | | |
| (1) | Fiscal years 2011 and 2010 reflect the classification of system engineer costs within sales and marketing expenses as opposed to cost of revenues in prior periods. Fiscal year 2009 has not been updated for the new cost classification implemented in 2010. See Note 1, “Basis of Presentation,” of the Notes to Consolidated Financial Statements. |
The following table presents stock-based compensation expense, net of estimated forfeitures, by grant type (in thousands):
| | | | | | | | | | | | |
| | | Fiscal Year Ended
October 29, 2011 | | | Fiscal Year Ended
October 30, 2010 | | | Fiscal Year Ended
October 31, 2009 (1) | |
Stock options, including variable options | | $ | 3,483 | | | $ | 12,383 | | | $ | 24,460 | |
Restricted stock awards and restricted stock units (“RSUs”) | | | 55,750 | | | | 55,580 | | | | 87,543 | |
Employee stock purchase plan (“ESPP”) | | | 23,843 | | | | 33,662 | | | | 25,216 | |
| | | | | | | | | | | | |
Total stock-based compensation | | $ | 83,076 | | | $ | 101,625 | | | $ | 137,219 | |
| | | | | | | | | | | | |
| (1) | ESPP expense for the year ended October 31, 2009 includes $2.5 million of expenses relating to Foundry’s ESPP plan. |
The following table presents unrecognized compensation expense, net of estimated forfeitures, of the Company’s equity compensation plans as of October 29, 2011, which is expected to be recognized over the following weighted-average periods, (in thousands, except for weighted-average period):
| | | | | | | | |
| | | Unrecognized
Compensation
Expense | | | Weighted-
Average Period
(in years) | |
Stock options | | $ | 2,023 | | | | 0.87 | |
RSUs | | $ | 101,555 | | | | 2.03 | |
ESPP | | $ | 10,047 | | | | 0.87 | |
99
Stock Options
When the measurement date is certain, the fair value of each option granted during the respective period is estimated on the date of grant using the Black-Scholes valuation model and the assumptions noted in the following table. The dividend yield reflects that Brocade has not paid any cash dividends since inception and does not anticipate paying cash dividends in the foreseeable future. The risk-free interest rate is based on the implied yield on a U.S. Treasury zero-coupon issue with a remaining term equal to the expected term of the option. The expected volatility is based on an equal weighted-average of implied volatilities from traded options of the Company’s common stock and historical volatility of the Company’s common stock. The expected term is based on historical exercise behavior.
| | | | | | | | | | | | |
| | | Fiscal Year Ended | |
Stock Options | | October 29,
2011 | | | October 30,
2010 | | | October 31,
2009 | |
Expected dividend yield | | | 0.0 | % | | | 0.0 | % | | | 0.0 | % |
Risk-free interest rate | | | 0.1 - 1.6 | % | | | 0.3 - 2.0 | % | | | 0.4 - 1.9 | % |
Expected volatility | | | 50.3 - 61.9 | % | | | 49.3 - 53.3 | % | | | 54.8 - 65.3 | % |
Expected term (in years) | | | 4.0 | | | | 4.0 | | | | 4.0 | |
Compensation expense computed under the fair value method for stock options issued is being amortized under a graded vesting method over the options’ vesting period. A summary of stock option activity under the equity compensation plans for the years ended October 29, 2011, October 30, 2010 and October 31, 2009 is presented as follows:
| | | | | | | | | | | | | | | | |
| | | Shares
(in thousands) | | | Weighted-Average
Exercise Price | | | Weighted-Average
Remaining
Contractual Term
(in years) | | | Aggregate
Intrinsic
Value
(in thousands) | |
Outstanding at October 25, 2008 | | | 35,036 | | | $ | 8.05 | | | | 4.17 | | | $ | 701 | |
Assumed under the Foundry acquisition | | | 92,160 | | | $ | 3.24 | | | | | | | | | |
Granted | | | 5,118 | | | $ | 4.29 | | | | | | | | | |
Exercised | | | (36,022 | ) | | $ | 3.03 | | | | | | | | | |
Forfeited or expired | | | (6,645 | ) | | $ | 6.16 | | | | | | | | | |
| | | | | | | | | | | | | | | | |
Outstanding at October 31, 2009 | | | 89,647 | | | $ | 5.04 | | | | 3.17 | | | $ | 380,991 | |
Granted | | | 1,920 | | | $ | 6.76 | | | | | | | | | |
Exercised | | | (14,210 | ) | | $ | 2.95 | | | | | | | | | |
Forfeited or expired | | | (5,691 | ) | | $ | 13.68 | | | | | | | | | |
| | | | | | | | | | | | | | | | |
Outstanding at October 30, 2010 | | | 71,666 | | | $ | 4.82 | | | | 2.58 | | | $ | 146,199 | |
Granted | | | 243 | | | $ | 5.47 | | | | | | | | | |
Exercised | | | (16,814 | ) | | $ | 3.48 | | | | | | | | | |
Forfeited or expired | | | (4,330 | ) | | $ | 9.03 | | | | | | | | | |
| | | | | | | | | | | | | | | | |
Outstanding at October 29, 2011 | | | 50,765 | | | $ | 4.91 | | | | 1.98 | | | $ | 35,494 | |
| | | | | | | | | | | | | | | | |
Vested and expected to vest at October 29, 2011 | | | 50,123 | | | $ | 4.92 | | | | 1.96 | | | $ | 35,168 | |
| | | | | | | | | | | | | | | | |
Exercisable and vested at: | | | | | | | | | | | | | | | | |
October 29, 2011 | | | 47,824 | | | $ | 4.91 | | | | 1.84 | | | $ | 33,938 | |
| | | | | | | | | | | | | | | | |
The weighted-average grant date fair value of stock options granted during the years ended October 29, 2011, October 30, 2010 and October 31, 2009 was $2.23, $2.89 and $2.10, respectively. The total intrinsic value of stock options exercised for the years ended October 29, 2011, October 30, 2010 and October 31, 2009 was $46.0 million, $51.7 million and $128.9 million, respectively.
100
From May 1999 through July 2003, the Company granted 98.8 million options subject to variable accounting as the measurement date of the options granted was not certain. As of October 29, 2011, 0.2 million options with a weighted-average exercise price of $7.55 and a weighted-average contractual life of 1.01 years remain outstanding and continue to be accounted for under variable accounting.
Employee Stock Purchase Plan
Under Brocade’s employee stock purchase plans, including the 2009 ESPP and the 1999 Employee Stock Purchase Plan (together, the “Brocade ESPP”), eligible employees can participate and purchase shares semi-annually at the lower of 85% of the fair market value of the Company’s common stock on (i) the first trading day of the offering period, or (ii) the last day of each six-month purchase period. The Brocade ESPP permits eligible employees to purchase common stock through payroll deductions for up to 15% of qualified compensation. The Company accounts for the Brocade ESPP as a compensatory plan and recorded compensation expense of $23.8 million, $33.7 million and $22.7 million for the years ended October 29, 2011, October 30, 2010 and October 31, 2009, respectively. Compensation expense computed under the fair value method for ESPP shares issued is being amortized under a graded vesting method over the twenty-four month offering period. In addition, the Company accounts for changes in percentage contribution elected by employees, as well as decreases in the Company’s common stock price on the last day of each six-month purchase period as compared to the common stock price on the first trading day of the offering period, by applying modification accounting which results in an increase in compensation expense during the period of modification.
The fair value of the option component of Brocade ESPP shares was estimated using the Black-Scholes option pricing model using the following weighted-average assumptions:
| | | | | | | | | | | | |
| | | Fiscal Year Ended | |
Employee Stock Purchase Plan | | October 29,
2011 | | | October 30,
2010 | | | October 31,
2009 | |
Expected dividend yield | | | 0.0 | % | | | 0.0 | % | | | 0.0 | % |
Risk-free interest rate | | | 0.6 | % | | | 0.6 | % | | | 0.8 | % |
Expected volatility | | | 65.5 | % | | | 67.8 | % | | | 76.4 | % |
Expected term (in years) | | | 1.1 | | | | 1.5 | | | | 1.2 | |
In addition, as part of its acquisition of Foundry, the Company became the administrator of Foundry’s 1999 Employee Stock Purchase Plan (“Foundry ESPP”), which expired on May 31, 2009. As a result of Brocade’s assumption of rights under the Foundry ESPP, Foundry employees who became Brocade employees were granted the right to purchase shares of the Company’s common stock at the lower of 85% of the fair market value of the Company’s common stock, as adjusted in accordance with the Foundry Merger Agreement at (i) the beginning of a rolling two-year offering period or (ii) the end of each semi-annual offering period, subject to a plan limit on the number of shares that may be purchased in an offering period. During the year ended October 31, 2009, the Company issued 4.9 million shares under the Foundry ESPP. The Company accounts for the Foundry ESPP as a compensatory plan and recorded compensation expense of $2.5 million for the year ended October 31, 2009.
Restricted Stock Awards
No restricted stock awards were issued for the years ended October 29, 2011, October 30, 2010 and October 31, 2009. When and if granted, restricted stock awards are not transferable until fully vested, and all unvested shares upon termination are subject to repurchase. The fair value of each award is based on the Company’s closing stock price on the date of grant.
101
A summary of the nonvested restricted stock awards for the year ended October 31, 2009 is presented as follows:
| | | | | | | | |
| | | Shares
(in thousands) | | | Weighted-Average
Grant Date Fair Value | |
Nonvested at October 25, 2008 | | | 14 | | | $ | 0.01 | |
Granted | | | — | | | $ | — | |
Vested | | | (14 | ) | | $ | 0.01 | |
Forfeited | | | — | | | $ | — | |
| | | | | | | | |
Nonvested at October 31, 2009 | | | — | | | $ | — | |
| | | | | | | | |
Expected to vest at October 31, 2009 | | | — | | | $ | — | |
| | | | | | | | |
Restricted Stock Units
For the years ended October 29, 2011, October 30, 2010 and October 31, 2009, Brocade issued 12.8 million, 10.8 million and 13.3 million restricted stock units, respectively. Typically, vesting of restricted stock units occurs over one to four years and is subject to the employee’s continuing service to Brocade.
A summary of the changes in restricted stock units outstanding under Brocade’s equity compensation plans during the years ended October 29, 2011, October 30, 2010 and October 31, 2009 is presented as follows:
| | | | | | | | |
| | | Shares
(in thousands) | | | Weighted-Average
Grant Date Fair Value | |
Nonvested at October 25, 2008 | | | 8,306 | | | $ | 7.87 | |
Assumed under the Foundry acquisition | | | 26,050 | | | $ | 3.54 | |
Granted | | | 13,334 | | | $ | 6.90 | |
Vested | | | (11,315 | ) | | $ | 7.20 | |
Forfeited | | | (3,682 | ) | | $ | 6.92 | |
| | | | | | | | |
Nonvested at October 31, 2009 | | | 32,693 | | | $ | 4.37 | |
Granted | | | 10,801 | | | $ | 5.84 | |
Vested | | | (12,753 | ) | | $ | 5.26 | |
Forfeited | | | (2,570 | ) | | $ | 6.74 | |
| | | | | | | | |
Nonvested at October 30, 2010 | | | 28,171 | | | $ | 4.32 | |
Granted | | | 12,754 | | | $ | 5.68 | |
Vested | | | (13,434 | ) | | $ | 5.82 | |
Forfeited | | | (4,010 | ) | | $ | 6.37 | |
| | | | | | | | |
Nonvested at October 29, 2011 | | | 23,481 | | | $ | 3.85 | |
| | | | | | | | |
Vested and expected to vest at October 29, 2011 | | | 19,631 | | | $ | 3.85 | |
| | | | | | | | |
The aggregate intrinsic value of restricted stock units outstanding at October 29, 2011, October 30, 2010 and October 31, 2009 was $105.9 million, $178.9 million and $288.1 million, respectively.
102
15. Income Taxes
The domestic and international components of income (loss) before provision for (benefit from) income taxes for the years ended October 29, 2011, October 30, 2010 and October 31, 2009 are presented as follows (in thousands):
| | | | | | | | | | | | |
| | | Fiscal Year Ended | |
| | | October 29,
2011 (1) | | | October 30,
2010 | | | October 31,
2009 | |
United States | | $ | (42,118 | ) | | $ | 36,015 | | | $ | (139,156 | ) |
International | | | 121,546 | | | | 70,955 | | | | 62,581 | |
| | | | | | | | | | | | |
Total | | $ | 79,428 | | | $ | 106,970 | | | $ | (76,575 | ) |
| | | | | | | | | | | | |
| (1) | Excludes the impact of repatriation of $200 million from offshore operations to the United States. |
The income tax provision (benefit) for the years ended October 29, 2011, October 30, 2010 and October 31, 2009 consisted of the following (in thousands):
| | | | | | | | | | | | |
| | | Fiscal Year Ended | |
| | | October 29,
2011 | | | October 30,
2010 | | | October 31,
2009 | |
U.S. federal taxes: | | | | | | | | | | | | |
Current | | $ | 774 | | | $ | (30,768 | ) | | $ | 15,008 | |
Deferred | | | 28,111 | | | | 19,390 | | | | (13,411 | ) |
| | | | | | | | | | | | |
Total U.S. federal taxes | | | 28,885 | | | | (11,378 | ) | | | 1,597 | |
| | | | | | | | | | | | |
State taxes: | | | | | | | | | | | | |
Current | | | 1,250 | | | | 4,282 | | | | 3,173 | |
Deferred | | | (9,187 | ) | | | (10,506 | ) | | | (9,409 | ) |
| | | | | | | | | | | | |
Total state taxes | | | (7,937 | ) | | | (6,224 | ) | | | (6,236 | ) |
| | | | | | | | | | | | |
Non-U.S. taxes: | | | | | | | | | | | | |
Current | | | 7,854 | | | | 8,964 | | | | 10,436 | |
Deferred | | | 16 | | | | (915 | ) | | | 817 | |
| | | | | | | | | | | | |
Total non-U.S. taxes | | | 7,870 | | | | 8,049 | | | | 11,253 | |
| | | | | | | | | | | | |
Total | | $ | 28,818 | | | $ | (9,553 | ) | | $ | 6,614 | |
| | | | | | | | | | | | |
The difference between the U.S. federal statutory income tax rate and the Company’s effective tax rate for the years ended October 29, 2011, October 30, 2010 and October 31, 2009 consisted of the following:
| | | | | | | | | | | | |
| | | Fiscal Year Ended | |
| | | October 29,
2011 | | | October 30,
2010 | | | October 31,
2009 | |
U.S. federal statutory income tax rate | | | 35.0 | % | | | 35.0 | % | | | 35.0 | % |
State taxes, net of federal tax benefit | | | 3.3 | | | | 4.0 | | | | (2.6 | ) |
Foreign income taxed at other than U.S. rates | | | (48.2 | ) | | | (32.6 | ) | | | 7.6 | |
Stock-based compensation | | | 11.8 | | | | 12.6 | | | | (13.1 | ) |
Research and development credit | | | (17.6 | ) | | | (10.4 | ) | | | 22.2 | |
Acquisition-related impairment | | | — | | | | — | | | | (33.3 | ) |
Permanent items | | | 1.2 | | | | 0.9 | | | | (1.9 | ) |
Change in liabilities for uncertain tax positions | | | 2.5 | | | | (29.0 | ) | | | (26.0 | ) |
Repatriation from offshore operations | | | 62.6 | | | | — | | | | — | |
Audit settlement and reinstated tax credit | | | (11.7 | ) | | | 10.2 | | | | — | |
Other | | | (2.6 | ) | | | 0.4 | | | | 3.5 | |
| | | | | | | | | | | | |
Effective tax rate | | | 36.3 | % | | | (8.9 | )% | | | (8.6 | )% |
| | | | | | | | | | | | |
103
In the fourth fiscal quarter of 2011, we repatriated $200.0 million from our offshore operations, with which we repurchased approximately 46.5 million shares of our Company’s stock. The Company recorded tax expense of $49.7 million related to this one-time cash repatriation to fund the stock repurchase program. U.S. federal income taxes and foreign withholding taxes were not provided for on a cumulative total of $266.2 million of undistributed earnings of the Company’s foreign subsidiaries. The Company intends to reinvest current and accumulated earnings of its foreign subsidiaries for expansion of its business operations outside the United States for an indefinite period of time. Our existing cash, cash equivalents and short-term investments totaled $415.0 million as of October 29, 2011. Of this amount, approximately 75% was held by our foreign subsidiaries. If these earnings were distributed to the United States in the form of dividends or otherwise, or if the shares of the relevant foreign subsidiaries were sold or otherwise transferred, the Company could be subject to additional U.S. income taxes, net of foreign tax credits, and foreign withholding taxes. Determination of the amount of unrecognized deferred income tax liability related to these earnings is not practicable.
The components of deferred tax assets and deferred tax liabilities for the years ended October 29, 2011 and October 30, 2010 are presented as follows (in thousands):
| | | | | | | | |
| | | October 29,
2011 | | | October 30,
2010 | |
Net operating loss carry forwards | | $ | 132,765 | | | $ | 155,556 | |
Stock option expense | | | 28,513 | | | | 37,406 | |
Tax credit carry forwards | | | 141,209 | | | | 93,450 | |
Reserves and accruals | | | 104,135 | | | | 128,283 | |
Non-U.S. stock option expense | | | 373 | | | | 643 | |
Capitalized research and development expenditures | | | 8,475 | | | | 14,970 | |
Net unrealized losses on investments | | | 330 | | | | 327 | |
| | | | | | | | |
Gross deferred tax assets | | | 415,800 | | | | 430,635 | |
Less: Valuation allowance | | | (22,566 | ) | | | (22,319 | ) |
| | | | | | | | |
Total deferred tax assets | | | 393,234 | | | | 408,316 | |
Acquired intangibles and goodwill | | | (92,481 | ) | | | (131,402 | ) |
Fixed assets | | | (34,992 | ) | | | — | |
Other | | | (2,129 | ) | | | (2,342 | ) |
| | | | | | | | |
Total deferred tax liabilities | | | (129,602 | ) | | | (133,744 | ) |
| | | | | | | | |
Total net deferred tax assets | | $ | 263,632 | | | $ | 274,572 | |
| | | | | | | | |
The Company believes that sufficient positive evidence exists from historical operations and projections of taxable income in future years to conclude that it is more likely than not that the Company will realize its deferred tax assets. Accordingly, the Company applies a valuation allowance only on the deferred tax assets relating to capital loss carryforwards, due to limited carryforward periods and the character of such tax attributes. As part of the 2011-2012 budget, the Governor of the State of California has introduced tax proposals affecting future state income tax apportionment that may have a significant impact on the Company’s ability to realize certain California deferred tax assets. The Company will reevaluate the realization of its California deferred tax assets if and when the current law changes.
As of October 29, 2011, the Company had federal net operating loss carryforwards of $805.8 million, California state net operating loss carryforwards of $112.1 million and other significant states net operating loss carryforwards of approximately $249.8 million. Additionally, the Company had $134.4 million of federal tax credits and $146.2 million of state tax credits. The federal net operating loss and other tax credit carryforwards expire on various dates between 2011 through 2031. The state net operating loss and credit carryforwards expire on various dates between 2012 through 2031. Under the current tax law, net operating loss and credit carryforwards available to offset future income in any given year may be limited by statute or upon the occurrence of certain events, including significant changes in ownership interests.
104
As a result of the McDATA and Foundry acquisitions, all the tax attributes from both companies are subject to an annual limitation, but the Company expects to use all the tax attributes before expiration.
The Company applies a recognition threshold and measurement attribute for the financial statement recognition and measurement of an income tax position taken or expected to be taken on a tax return. Recognition of a tax position is determined when it is more likely than not that a tax position will be sustained upon examination, including resolution of any related appeals or litigation processes. A tax position that meets the more-likely-than-not recognition threshold is measured at the largest amount of benefit that is greater than 50% likely of being realized upon ultimate settlement with a taxing authority.
A reconciliation of the beginning and ending amount of total gross unrecognized tax benefits, excluding accrued net interest and penalties of $3.4 million, for the year ended October 29, 2011, is as follows (in thousands):
| | | | | | | | |
| | | October 29,
2011 | | | October 30,
2010 | |
Unrecognized tax benefits, beginning balance | | $ | 136,812 | | | $ | 170,947 | |
Gross increases for tax positions taken in prior periods | | | 9,066 | | | | 2,666 | |
Gross decreases for tax positions taken in prior periods | | | (1,730 | ) | | | (4,618 | ) |
Gross increases for tax positions taken in current period | | | 9,601 | | | | 7,805 | |
Changes due to settlements with taxing authorities | | | (1,051 | ) | | | (37,366 | ) |
Reductions resulting from lapses of statutes of limitations | | | (3,268 | ) | | | (2,622 | ) |
| | | | | | | | |
Unrecognized tax benefits, ending balance | | $ | 149,430 | | | $ | 136,812 | |
| | | | | | | | |
As of October 29, 2011, the Company had net unrecognized tax benefits of $140.3 million, all of which, if recognized, would result in a reduction of the Company’s effective tax rate.
For the fiscal year ended October 29, 2011, the Company recorded an income tax expense of $28.8 million, primarily as a result of a cash repatriation from our foreign subsidiary and foreign tax expenses offset by discrete benefits from the retroactive reinstatement of the federal research and development tax credit provision as a result of the Tax Relief, Unemployment Insurance Reauthorization, and Job Creation Act of 2010 (the “Tax Relief Act”), reserve releases from the settlement of the research and development tax credit issues with the IRS regarding the Company’s fiscal year 2007 and 2008 audits, and reserve release from the expiration of the statute of limitation.
For the fiscal year ended October 30, 2010, the Company recorded an income tax benefit of $9.6 million, primarily as a result of foreign taxes, offset by discrete benefits from the release of certain reserves mainly relating to the settlement of the Company’s fiscal year 2003 Internal Revenue Service (“IRS”) audit and related remeasurements of various uncertain tax positions, concession from the IRS on treatment of intercompany gross receipts for the research and development credits, Franchise Tax Board (“FTB”) research and development credits carried forward to fiscal year 2005, and statute expirations of tax years of foreign subsidiaries.
The IRS and other tax authorities regularly examine our income tax returns. We are currently under negotiations with the Appeals division of the IRS for the audit of fiscal years 2004 through 2008, and we expect to resolve fiscal years 2004 through 2006 during the next twelve months. In addition, we are in negotiations with foreign tax authorities to receive correlative relief on transfer pricing settlements with the IRS. We believe that our reserves for unrecognized tax benefits are adequate for all open tax years. The timing of the resolution of income tax examinations, as well as the amounts and timing of related settlements, is highly uncertain. The Company believes that before the end of fiscal year 2012, it is reasonably possible that either certain audits will conclude or the statute of limitations relating to certain income tax examination periods will expire, or both. As such, after we reach settlement with the IRS, we expect to record a corresponding adjustment to our
105
unrecognized tax benefits. Given the uncertainty as to settlement terms, the timing of payments and the impact of such settlements on other uncertain tax positions, the range of estimated potential decreases in underlying uncertain tax positions is between $0 and $24 million in the next twelve months.
The Company classifies interest and penalties related to unrecognized tax benefits as a component of income tax expense. During the fiscal year ended October 29, 2011, the Company expensed $0.4 million for net interest and penalties related to income tax liabilities through income tax expense. The total net interest and penalties accrued as of October 29, 2011 was $3.4 million. During the year ended October 30, 2010, the Company expensed $0.9 million for net interest and penalties related to income tax liabilities through income tax expense. The total net interest and penalties accrued as of October 30, 2010 was $3.0 million.
In May 2011, the Company received the IRS revenue agent’s report for fiscal years 2007 and 2008. The IRS is contesting the Company’s transfer pricing for the cost sharing and buy-in arrangements with its foreign subsidiaries. The IRS’ proposed adjustment would offset approximately $317.4 million of the Company’s net operating loss carryforwards. In June 2011, the Company filed a protest with the Appeals Office of the IRS to challenge the IRS’ proposed adjustment and assessment. The Franchise Tax Board is auditing Foundry’s California income tax returns for calendar years 2006 and 2007. These audits and appeal are still ongoing and the Company believes its reserves are adequate to cover any potential assessments and settlements that may result from these examinations. Due to the availability of net operating losses and credits, the Company does not expect a significant tax liability from the settlement of the audits.
Of the total tax benefits (detriments) resulting from the exercise of employee stock options and employee participation in the Company’s equity compensation plans, the amounts recorded to stockholders’ equity were approximately $(5.2) million in fiscal year 2011, $2.2 million in fiscal year 2010 and $(0.8) million in fiscal year 2009.
16. Segment Information
Operating segments are defined as components of an enterprise about which separate financial information is available that is evaluated regularly by the Chief Operating Decision Maker (“CODM”), or decision-making group, in deciding how to allocate resources and in assessing performance. Currently, the CODM is the Chief Executive Officer.
Brocade is organized into four operating segments, of which two are individually reportable segments: Data Storage Products and Global Services; and the two other operating segments, Ethernet Switching & Internet Protocol Routing and Application Delivery Products (“ADP”), combine to form a third reportable segment: Ethernet Products. These segments are organized principally by product category. The types of products and services from which each reportable segment derives its revenues are as follows:
| | • | | Data Storage Products include infrastructure products and solutions that assist customers in the development and delivery of storage and server consolidation, disaster recovery and data security, and in meeting compliance issues regarding data management. These products are used to build storage area networks (“SAN”s) and are generally used in conjunction with servers and storage subsystems, SAN interconnection components such as host bus adapters (“HBAs”), and server and storage management software applications and tools. Brocade’s family of Fibre Channel (“FC”) SAN backbones, directors, fabric and embedded switches provide interconnections, bandwidth and high-speed routing of data between servers and storage devices. Switches and directors support applications such as data backup, remote mirroring and high-availability clustering, as well as high-volume transaction processing applications such as enterprise resource planning and data warehousing. Brocade’s storage networking products also include HBAs, which connect host computers to a FC network. Additionally, Brocade offers a variety of fabric extension, switching and routing solutions; |
| | • | | Ethernet Products include Open System Interconnection Reference Model (“OSI”) Layer 2 and Layer 3 switches and routers that are designed to connect users in an enterprise network, enabling network |
106
| | connectivity such as access to the Internet, network-based communications, and collaboration through unified messaging applications and mobility. Brocade also offers converged network products, and a portfolio of platforms designed for service provider environments as well as carrier Ethernet products. Additionally, the Company offers OSI Layer 4—7 solutions that are designed for application traffic management and server load balancing; and |
| | • | | Global Services include break/fix maintenance, extended warranty, installation, consulting, network management and software maintenance and customer support revenue. |
Financial decisions and the allocation of resources are based on the information from the Company’s internal management reporting system. At this point in time, the Company does not track all of its assets by operating segments. The majority of the Company’s assets as of October 29, 2011, October 30, 2010 and October 31, 2009 were attributable to its United States operations.
Summarized financial information by reportable segment for the years ended October 29, 2011, October 30, 2010 and October 31, 2009, based on the internal management reporting system, is as follows (in thousands):
| | | | | | | | | | | | | | | | |
| | | Data Storage
Products | | | Ethernet Products | | | Global Services | | | Total | |
Fiscal year ended October 29, 2011 | | | | | | | | | | | | | | | | |
Net revenues | | $ | 1,237,994 | | | $ | 551,820 | | | $ | 357,628 | | | $ | 2,147,442 | |
Cost of revenues (1) | | | 356,013 | | | | 321,183 | | | | 186,712 | | | | 863,908 | |
| | | | | | | | | | | | | | | | |
Gross margin | | $ | 881,981 | | | $ | 230,637 | | | $ | 170,916 | | | $ | 1,283,534 | |
| | | | | | | | | | | | | | | | |
Fiscal year ended October 30, 2010 | | | | | | | | | | | | | | | | |
Net revenues | | $ | 1,240,626 | | | $ | 488,188 | | | $ | 362,339 | | | $ | 2,091,153 | |
Cost of revenues (1) | | | 394,506 | | | | 288,980 | | | | 176,547 | | | | 860,033 | |
| | | | | | | | | | | | | | | | |
Gross margin | | $ | 846,120 | | | $ | 199,208 | | | $ | 185,792 | | | $ | 1,231,120 | |
| | | | | | | | | | | | | | | | |
Fiscal year ended October 31, 2009 | | | | | | | | | | | | | | | | |
Net revenues | | $ | 1,188,527 | | | $ | 424,434 | | | $ | 337,415 | | | $ | 1,950,376 | |
Cost of revenues (1) | | | 467,496 | | | | 271,858 | | | | 180,072 | | | | 919,426 | |
| | | | | | | | | | | | | | | | |
Gross margin | | $ | 721,031 | | | $ | 152,576 | | | $ | 157,343 | | | $ | 1,030,950 | |
| | | | | | | | | | | | | | | | |
| (1) | Fiscal years 2011 and 2010 reflect the classification of system engineer costs within sales and marketing expenses as opposed to cost of revenues in prior periods. Fiscal year 2009 has not been updated for the new cost classification implemented in 2010. See Note 1, “Basis of Presentation,” of the Notes to Consolidated Financial Statements. |
107
Revenues are attributed to geographic areas based on where the Company’s products are shipped. Geographic information for the years ended October 29, 2011, October 30, 2010 and October 31, 2009 is presented below (in thousands):
| | | | | | | | | | | | |
| | | Fiscal Year Ended | |
| | | October 29,
2011 | | | October 30,
2010 | | | October 31,
2009 | |
Net revenues: | | | | | | | | | | | | |
United States | | $ | 1,313,302 | | | $ | 1,338,262 | | | $ | 1,266,844 | |
International | | | | | | | | | | | | |
Europe, the Middle East and Africa (1) | | | 502,999 | | | | 482,707 | | | | 450,159 | |
Asia Pacific | | | 212,636 | | | | 173,243 | | | | 141,511 | |
Japan | | | 75,542 | | | | 58,914 | | | | 59,771 | |
Canada, Central and South America | | | 42,963 | | | | 38,027 | | | | 32,091 | |
| | | | | | | | | | | | |
Total international net revenues | | | 834,140 | | | | 752,891 | | | | 683,532 | |
| | | | | | | | | | | | |
Total net revenues | | $ | 2,147,442 | | | $ | 2,091,153 | | | $ | 1,950,376 | |
| | | | | | | | | | | | |
| (1) | Includes net revenues of $257.5 million, $254.4 million and $177.0 million for the years ended October 29, 2011, October 30, 2010 and October 31, 2009, respectively, relating to the Netherlands. |
| | | | | | | | | | | | |
| | | Fiscal Year Ended | |
| | | October 29,
2011 | | | October 30,
2010 | | | October 31,
2009 | |
Property and equipment, net: | | | | | | | | | | | | |
United States | | $ | 515,940 | | | $ | 524,287 | | | $ | 427,010 | |
International | | | 16,444 | | | | 14,830 | | | | 15,398 | |
| | | | | | | | | | | | |
Total Property and equipment, net | | $ | 532,384 | | | $ | 539,117 | | | $ | 442,408 | |
| | | | | | | | | | | | |
17. Loss on Sale of Subsidiary
In August 2011, the Company committed to a plan to exit a portion of its Global Services business through the sale of SBS, its wholly-owned subsidiary and signed a Stock Purchase Agreement to sell SBS to investors led by the former Managing Director of SBS. The sale was completed in September 2011 and is expected to enable the Company’s Global Services organization to focus on the execution of strategic and core offerings such as support and service for the Company’s products as well as professional consulting.
SBS’s assets and liabilities were classified as held for sale in the fourth quarter of fiscal year 2011 as a result of the Company’s commitment and actions. The net carrying amount of SBS’s assets and liabilities classified as held for sale was $16.2 million, comprising primarily of intangible assets of $11.1 million. Upon classifying the SBS assets as held for sale, the Company recognized an expected loss on disposal of $11.1 million, reducing the carrying amount of its SBS intangible assets to their fair value less costs to sell. Additionally, when the sale was completed, the Company wrote off $1.7 million of the associated Global Services goodwill resulting in a total loss of $12.8 million which is presented in the Company’s consolidated statement of operations as “Loss on sale of subsidiary.”
18. Gain (Loss) on Sale of Investments and Property, net
The Company had an immaterial gain on sale of investments for the years ended October 29, 2011 and October 30, 2010, respectively, and immaterial loss on sale of investment for the year ended October 31, 2009. Additionally, during the year ended October 30, 2010, the Company recognized an $8.7 million loss on the sale of property (see Note 13, “Sale-Leaseback Transaction,” of the Notes to Consolidated Financial Statements). The carrying value of the Company’s equity investments in non-publicly traded companies at October 29, 2011, October 30, 2010 and October 31, 2009 was $7.0 million, $7.0 million and $6.8 million, respectively.
108
19. Net Income (Loss) per Share
The following table presents the calculation of basic and diluted net income (loss) per share (in thousands, except per share amounts):
| | | | | | | | | | | | |
| | | Fiscal Year Ended | |
| | | October 29,
2011 | | | October 30,
2010 | | | October 31,
2009 (2) | |
Basic net income (loss) per share | | | | | | | | | | | | |
Net income (loss) | | $ | 50,610 | | | $ | 116,523 | | | $ | (83,189 | ) |
Weighted-average shares used in computing basic net income (loss) per share | | | 474,259 | | | | 446,996 | | | | 398,948 | |
Basic net income (loss) per share | | $ | 0.11 | | | $ | 0.26 | | | $ | (0.21 | ) |
| | | | | | | | | | | | |
Diluted net income (loss) per share | | | | | | | | | | | | |
Net income (loss) | | $ | 50,610 | | | $ | 116,523 | | | $ | (83,189 | ) |
Weighted-average shares used in computing basic net income (loss) per share | | | 474,259 | | | | 446,996 | | | | 398,948 | |
Dilutive potential common shares in the form of stock options | | | 13,654 | | | | 22,083 | | | | — | |
Dilutive potential common shares in the form of other share based awards | | | 9,117 | | | | 13,662 | | | | — | |
| | | | | | | | | | | | |
Weighted-average shares used in computing diluted net income (loss) per share | | | 497,030 | | | | 482,741 | | | | 398,948 | |
Diluted net income (loss) per share | | $ | 0.10 | | | $ | 0.24 | | | $ | (0.21 | ) |
| | | | | | | | | | | | |
Antidilutive potential common shares in the form of (1) | | | | | | | | | | | | |
Stock options | | | 21,905 | | | | 21,217 | | | | 68,710 | |
Other share based awards | | | 3,075 | | | | 700 | | | | 17,035 | |
Antidilutive potential common shares resulting from the potential conversion of (1) | | | | | | | | | | | | |
Convertible subordinated debt | | | — | | | | 3,552 | | | | 12,083 | |
| (1) | These amounts are excluded from the computation of diluted net income (loss) per share. |
| (2) | As the Company was in a net loss position for the year ended October 31, 2009, there was no dilutive impact of potential common shares associated with stock options and other share based awards, by application of the treasury stock method. |
20. Related Party and Other Transactions
During the normal course of business, the Company purchases certain equipment from vendors who are also its customers and with whom the Company has contractual arrangements. The equipment purchased by the Company is primarily used for testing purposes in its development labs or otherwise consumed internally. The Company believes that all such transactions are on an arms-length basis and are subject to terms no more favorable than those with unrelated parties.
21. Guarantor and Non-Guarantor Subsidiaries
On January 20, 2010, the Company issued in total $600.0 million aggregate principal amount of its senior secured notes. As discussed in Note 9, “Borrowings,” of the Notes to Consolidated Financial Statements, the Company’s obligations under the senior secured notes are guaranteed by certain of the Company’s domestic subsidiaries. The senior secured notes are not guaranteed by the Company’s Canadian or other foreign subsidiaries. The following tables present consolidated financial statements for the parent company, the Subsidiary Guarantors and the foreign non-guarantor subsidiaries, respectively.
109
The following is the consolidated balance sheet as of October 29, 2011 (in thousands):
| | | | | | | | | | | | | | | | | | | | |
| | | Brocade
Communications
Systems, Inc. | | | Subsidiary
Guarantors | | | Foreign
Non-
Guarantor
Subsidiaries | | | Consolidating
Adjustments | | | Total | |
Assets | | | | | | | | | | | | | | | | | | | | |
Current assets: | | | | | | | | | | | | | | | | | | | | |
Cash and cash equivalents and short-term investments | | $ | 101,367 | | | $ | 2,301 | | | $ | 311,308 | | | $ | — | | | $ | 414,976 | |
Accounts receivable, net | | | 157,839 | | | | (2,149 | ) | | | 93,451 | | | | — | | | | 249,141 | |
Inventories | | | 50,000 | | | | — | | | | 24,172 | | | | — | | | | 74,172 | |
Intercompany receivables | | | — | | | | 461,717 | | | | — | | | | (461,717 | ) | | | — | |
Other current assets | | | 87,495 | | | | 805 | | | | 15,609 | | | | 2,003 | | | | 105,912 | |
| | | | | | | | | | | | | | | | | | | | |
Total current assets | | | 396,701 | | | | 462,674 | | | | 444,540 | | | | (459,714 | ) | | | 844,201 | |
Property and equipment, net | | | 460,347 | | | | 55,594 | | | | 16,443 | | | | — | | | | 532,384 | |
Other non-current assets | | | 1,506,086 | | | | 590,318 | | | | 1,319 | | | | — | | | | 2,097,723 | |
| | | | | | | | | | | | | | | | | | | | |
Total assets | | $ | 2,363,134 | | | $ | 1,108,586 | | | $ | 462,302 | | | $ | (459,714 | ) | | $ | 3,474,308 | |
| | | | | | | | | | | | | | | | | | | | |
Liabilities and Stockholders’ Equity | | | | | | | | | | | | | | | | | | | | |
Current liabilities: | | | | | | | | | | | | | | | | | | | | |
Accounts payable | | $ | 85,700 | | | $ | 376 | | | $ | 23,395 | | | $ | — | | | $ | 109,471 | |
Current portion of debt | | | 40,539 | | | | — | | | | — | | | | — | | | | 40,539 | |
Intercompany payables | | | 391,278 | | | | — | | | | 70,439 | | | | (461,717 | ) | | | — | |
Other current liabilities | | | 276,982 | | | | 17,261 | | | | 119,731 | | | | 2,003 | | | | 415,977 | |
| | | | | | | | | | | | | | | | | | | | |
Total current liabilities | | | 794,499 | | | | 17,637 | | | | 213,565 | | | | (459,714 | ) | | | 565,987 | |
Debt, net of current portion | | | 748,904 | | | | — | | | | — | | | | — | | | | 748,904 | |
Other non-current liabilities | | | 104,999 | | | | 580 | | | | 39,700 | | | | — | | | | 145,279 | |
| | | | | | | | | | | | | | | | | | | | |
Total liabilities | | | 1,648,402 | | | | 18,217 | | | | 253,265 | | | | (459,714 | ) | | | 1,460,170 | |
Total stockholders’ equity | | | 714,732 | | | | 1,090,369 | | | | 209,037 | | | | — | | | | 2,014,138 | |
| | | | | | | | | | | | | | | | | | | | |
Total liabilities and stockholders’ equity | | $ | 2,363,134 | | | $ | 1,108,586 | | | $ | 462,302 | | | $ | (459,714 | ) | | $ | 3,474,308 | |
| | | | | | | | | | | | | | | | | | | | |
110
The following is the consolidated balance sheet as of October 30, 2010 (in thousands):
| | | | | | | | | | | | | | | | | | | | |
| | | Brocade
Communications
Systems, Inc. | | | Subsidiary
Guarantors | | | Foreign
Non-
Guarantor
Subsidiaries | | | Consolidating
Adjustments | | | Total | |
Assets | | | | | | | | | | | | | | | | | | | | |
Current assets: | | | | | | | | | | | | | | | | | | | | |
Cash and cash equivalents and short-term investments | | $ | 23,455 | | | $ | 8,905 | | | $ | 303,622 | | | $ | — | | | $ | 335,982 | |
Accounts receivable, net | | | 212,541 | | | | 1,699 | | | | 103,456 | | | | (333 | ) | | | 317,363 | |
Inventories | | | 63,713 | | | | — | | | | 13,095 | | | | — | | | | 76,808 | |
Intercompany receivables | | | — | | | | 396,442 | | | | — | | | | (396,442 | ) | | | — | |
Other current assets | | | 122,192 | | | | 875 | | | | 9,999 | | | | 3,069 | | | | 136,135 | |
| | | | | | | | | | | | | | | | | | | | |
Total current assets | | | 421,901 | | | | 407,921 | | | | 430,172 | | | | (393,706 | ) | | | 866,288 | |
Property and equipment, net | | | 466,247 | | | | 58,040 | | | | 14,830 | | | | — | | | | 539,117 | |
Other non-current assets | | | 1,499,774 | | | | 734,469 | | | | 6,364 | | | | — | | | | 2,240,607 | |
| | | | | | | | | | | | | | | | | | | | |
Total assets | | $ | 2,387,922 | | | $ | 1,200,430 | | | $ | 451,366 | | | $ | (393,706 | ) | | $ | 3,646,012 | |
| | | | | | | | | | | | | | | | | | | | |
Liabilities and Stockholders’ Equity | | | | | | | | | | | | | | | | | | | | |
Current liabilities: | | | | | | | | | | | | | | | | | | | | |
Accounts payable | | $ | 128,182 | | | $ | 389 | | | $ | 18,892 | | | $ | (333 | ) | | $ | 147,130 | |
Current portion of debt | | | 30,540 | | | | — | | | | — | | | | — | | | | 30,540 | |
Intercompany payables | | | 409,129 | | | | — | | | | (12,687 | ) | | | (396,442 | ) | | | — | |
Other current liabilities | | | 258,796 | | | | 29,752 | | | | 102,819 | | | | 3,069 | | | | 394,436 | |
| | | | | | | | | | | | | | | | | | | | |
Total current liabilities | | | 826,647 | | | | 30,141 | | | | 109,024 | | | | (393,706 | ) | | | 572,106 | |
Debt, net of current portion | | | 899,273 | | | | — | | | | — | | | | — | | | | 899,273 | |
Other non-current liabilities | | | 99,679 | | | | 3,361 | | | | 36,188 | | | | — | | | | 139,228 | |
| | | | | | | | | | | | | | | | | | | | |
Total liabilities | | | 1,825,599 | | | | 33,502 | | | | 145,212 | | | | (393,706 | ) | | | 1,610,607 | |
Total stockholders’ equity | | | 562,323 | | | | 1,166,928 | | | | 306,154 | | | | — | | | | 2,035,405 | |
| | | | | | | | | | | | | | | | | | | | |
Total liabilities and stockholders’ equity | | $ | 2,387,922 | | | $ | 1,200,430 | | | $ | 451,366 | | | $ | (393,706 | ) | | $ | 3,646,012 | |
| | | | | | | | | | | | | | | | | | | | |
111
The following is the consolidated statement of operations for the fiscal year ended October 29, 2011 (in thousands):
| | | | | | | | | | | | | | | | | | | | |
| | | Brocade
Communications
Systems, Inc. | | | Subsidiary
Guarantors | | | Foreign
Non-
Guarantor
Subsidiaries | | | Consolidating
Adjustments | | | Total | |
Revenues | | $ | 1,285,732 | | | $ | 27,569 | | | $ | 834,141 | | | $ | — | | | $ | 2,147,442 | |
Intercompany revenues | | | 88,063 | | | | 1,753 | | | | 35,980 | | | | (125,796 | ) | | | — | |
| | | | | | | | | | | | | | | | | | | | |
Total net revenues | | | 1,373,795 | | | | 29,322 | | | | 870,121 | | | | (125,796 | ) | | | 2,147,442 | |
Cost of revenues | | | 531,162 | | | | 85,540 | | | | 233,448 | | | | 13,758 | | | | 863,908 | |
Intercompany cost of revenues | | | (2,263 | ) | | | — | | | | 128,059 | | | | (125,796 | ) | | | — | |
| | | | | | | | | | | | | | | | | | | | |
Total cost of revenues | | | 528,899 | | | | 85,540 | | | | 361,507 | | | | (112,038 | ) | | | 863,908 | |
| | | | | | | | | | | | | | | | | | | | |
Gross margin (loss) | | | 844,896 | | | | (56,218 | ) | | | 508,614 | | | | (13,758 | ) | | | 1,283,534 | |
Operating expenses | | | 821,018 | | | | 76,645 | | | | 222,109 | | | | (13,758 | ) | | | 1,106,014 | |
Intercompany operating expenses | | | (138,789 | ) | | | (25,694 | ) | | | 164,483 | | | | — | | | | — | |
| | | | | | | | | | | | | | | | | | | | |
Total operating expenses | | | 682,229 | | | | 50,951 | | | | 386,592 | | | | (13,758 | ) | | | 1,106,014 | |
| | | | | | | | | | | | | | | | | | | | |
Income (loss) from operations | | | 162,667 | | | | (107,169 | ) | | | 122,022 | | | | — | | | | 177,520 | |
Other income (expense) | | | 109,902 | | | | (7,518 | ) | | | (200,476 | ) | | | — | | | | (98,092 | ) |
| | | | | | | | | | | | | | | | | | | | |
Income (loss) before income tax provision (benefit) | | | 272,569 | | | | (114,687 | ) | | | (78,454 | ) | | | — | | | | 79,428 | |
Income tax provision (benefit) | | | 36,164 | | | | (15,216 | ) | | | 7,870 | | | | — | | | | 28,818 | |
| | | | | | | | | | | | | | | | | | | | |
Net income (loss) | | $ | 236,405 | | | $ | (99,471 | ) | | $ | (86,324 | ) | | $ | — | | | $ | 50,610 | |
| | | | | | | | | | | | | | | | | | | | |
112
The following is the consolidated statement of operations for the fiscal year ended October 30, 2010 (in thousands), which reflects the classification of SE costs within sales and marketing expenses, as opposed to cost of revenues (see Note 1, “Basis of Presentation,” of the Notes to Consolidated Financial Statements). Additionally, we have re-allocated $46.9 million of SE costs between the parent company and foreign non-guarantor subsidiaries to conform to the current period presentation.
| | | | | | | | | | | | | | | | | | | | |
| | | Brocade
Communications
Systems, Inc. | | | Subsidiary
Guarantors | | | Foreign
Non-
Guarantor
Subsidiaries | | | Consolidating
Adjustments | | | Total | |
Revenues | | $ | 1,287,646 | | | $ | 50,731 | | | $ | 752,776 | | | $ | — | | | $ | 2,091,153 | |
Intercompany revenues | | | 102,178 | | | | 13,954 | | | | 25,464 | | | | (141,596 | ) | | | — | |
| | | | | | | | | | | | | | | | | | | | |
Total net revenues | | | 1,389,824 | | | | 64,685 | | | | 778,240 | | | | (141,596 | ) | | | 2,091,153 | |
Cost of revenues | | | 529,641 | | | | 112,477 | | | | 214,024 | | | | 3,891 | | | | 860,033 | |
Intercompany cost of revenues | | | 40,588 | | | | — | | | | 101,008 | | | | (141,596 | ) | | | — | |
| | | | | | | | | | | | | | | | | | | | |
Total cost of revenues | | | 570,229 | | | | 112,477 | | | | 315,032 | | | | (137,705 | ) | | | 860,033 | |
| | | | | | | | | | | | | | | | | | | | |
Gross margin (loss) | | | 819,595 | | | | (47,792 | ) | | | 463,208 | | | | (3,891 | ) | | | 1,231,120 | |
Operating expenses | | | 783,968 | | | | 63,855 | | | | 179,357 | | | | (3,891 | ) | | | 1,023,289 | |
Intercompany operating expenses | | | (167,746 | ) | | | (30,349 | ) | | | 198,095 | | | | — | | | | — | |
| | | | | | | | | | | | | | | | | | | | |
Total operating expenses | | | 616,222 | | | | 33,506 | | | | 377,452 | | | | (3,891 | ) | | | 1,023,289 | |
| | | | | | | | | | | | | | | | | | | | |
Income (loss) from operations | | | 203,373 | | | | (81,298 | ) | | | 85,756 | | | | — | | | | 207,831 | |
Other expense | | | (80,276 | ) | | | (1,628 | ) | | | (14,801 | ) | | | (4,156 | ) | | | (100,861 | ) |
| | | | | | | | | | | | | | | | | | | | |
Income (loss) before income tax provision (benefit) | | | 123,097 | | | | (82,926 | ) | | | 70,955 | | | | (4,156 | ) | | | 106,970 | |
Income tax provision (benefit) | | | (53,938 | ) | | | 36,336 | | | | 8,049 | | | | — | | | | (9,553 | ) |
| | | | | | | | | | | | | | | | | | | | |
Net income (loss) | | $ | 177,035 | | | $ | (119,262 | ) | | $ | 62,906 | | | $ | (4,156 | ) | | $ | 116,523 | |
| | | | | | | | | | | | | | | | | | | | |
113
The following is the consolidated statement of operations for fiscal year ended October 31, 2009 (in thousands):
| | | | | | | | | | | | | | | | | | | | |
| | | Brocade
Communications
Systems, Inc. | | | Subsidiary
Guarantors | | | Foreign
Non-
Guarantor
Subsidiaries | | | Consolidating
Adjustments | | | Total | |
Revenues | | $ | 1,030,016 | | | $ | 299,964 | | | $ | 620,396 | | | $ | — | | | $ | 1,950,376 | |
Intercompany revenues | | | 51,791 | | | | 11,022 | | | | 32,150 | | | | (94,963 | ) | | | — | |
| | | | | | | | | | | | | | | | | | | | |
Total net revenues | | | 1,081,807 | | | | 310,986 | | | | 652,546 | | | | (94,963 | ) | | | 1,950,376 | |
Cost of revenues | | | 494,760 | | | | 216,023 | | | | 190,453 | | | | 18,190 | | | | 919,426 | |
Intercompany cost of revenues | | | (8,483 | ) | | | — | | | | 103,446 | | | | (94,963 | ) | | | — | |
| | | | | | | | | | | | | | | | | | | | |
Total cost of revenues | | | 486,277 | | | | 216,023 | | | | 293,899 | | | | (76,773 | ) | | | 919,426 | |
| | | | | | | | | | | | | | | | | | | | |
Gross margin | | | 595,530 | | | | 94,963 | | | | 358,647 | | | | (18,190 | ) | | | 1,030,950 | |
Operating expenses | | | 798,249 | | | | 102,574 | | | | 122,614 | | | | (18,190 | ) | | | 1,005,247 | |
Intercompany operating expenses | | | (110,688 | ) | | | (93,272 | ) | | | 203,960 | | | | — | | | | — | |
| | | | | | | | | | | | | | | | | | | | |
Total operating expenses | | | 687,561 | | | | 9,302 | | | | 326,574 | | | | (18,190 | ) | | | 1,005,247 | |
| | | | | | | | | | | | | | | | | | | | |
Income (loss) from operations | | | (92,031 | ) | | | 85,661 | | | | 32,073 | | | | — | | | | 25,703 | |
Other income (expense) | | | (88,035 | ) | | | (27,998 | ) | | | 13,755 | | | | — | | | | (102,278 | ) |
Intercompany other income (expense) | | | (24 | ) | | | (16,729 | ) | | | 16,753 | | | | — | | | | — | |
| | | | | | | | | | | | | | | | | | | | |
Total other income (expense) | | | (88,059 | ) | | | (44,727 | ) | | | 30,508 | | | | — | | | | (102,278 | ) |
| | | | | | | | | | | | | | | | | | | | |
Income (loss) before income tax provision (benefit) | | | (180,090 | ) | | | 40,934 | | | | 62,581 | | | | — | | | | (76,575 | ) |
Income tax provision (benefit) | | | (6,004 | ) | | | 1,365 | | | | 11,253 | | | | — | | | | 6,614 | |
| | | | | | | | | | | | | | | | | | | | |
Net income (loss) | | $ | (174,086 | ) | | $ | 39,569 | | | $ | 51,328 | | | $ | | | | $ | (83,189 | ) |
| | | | | | | | | | | | | | | | | | | | |
114
The following is the consolidated statement of cash flows for the fiscal year ended October 29, 2011 (in thousands):
| | | | | | | | | | | | | | | | | | | | |
| | | Brocade
Communications
Systems, Inc. | | | Subsidiary
Guarantors | | | Foreign
Non-
Guarantor
Subsidiaries | | | Consolidating
Adjustments | | | Total | |
Net cash provided by operating activities | | $ | 436,714 | | | $ | (5,851 | ) | | $ | 18,369 | | | $ | — | | | $ | 449,232 | |
| | | | | | | | | | | | | | | | | | | | |
Cash flows from investing activities: | | | | | | | | | | | | | | | | | | | | |
Purchases of short-term investments | | | — | | | | (38 | ) | | | — | | | | — | | | | (38 | ) |
Proceeds from maturities and sale of short-term investments | | | — | | | | 1,604 | | | | — | | | | — | | | | 1,604 | |
Purchases of property and equipment | | | (86,447 | ) | | | (33 | ) | | | (10,317 | ) | | | — | | | | (96,797 | ) |
Proceeds from sale of subsidiary | | | 4,966 | | | | (1,061 | ) | | | — | | | | — | | | | 3,905 | |
| | | | | | | | | | | | | | | | | | | | |
Net cash provided by (used in) investing activities | | | (81,481 | ) | | | 472 | | | | (10,317 | ) | | | — | | | | (91,326 | ) |
| | | | | | | | | | | | | | | | | | | | |
Cash flows from financing activities: | | | | | | | | | | | | | | | | | | | | |
Payment of principal related to the term loan | | | (359,898 | ) | | | — | | | | — | | | | — | | | | (359,898 | ) |
Payment of fees related to the term loan | | | (1,167 | ) | | | — | | | | — | | | | — | | | | (1,167 | ) |
Proceeds from term loan | | | 198,950 | | | | — | | | | — | | | | — | | | | 198,950 | |
Payment of principal related to capital leases | | | (1,761 | ) | | | — | | | | — | | | | — | | | | (1,761 | ) |
Common stock repurchases | | | (210,698 | ) | | | — | | | | — | | | | — | | | | (210,698 | ) |
Proceeds from issuance of common stock | | | 97,152 | | | | — | | | | — | | | | — | | | | 97,152 | |
Excess tax benefits or detriments from stock-based compensation | | | 101 | | | | — | | | | 211 | | | | — | | | | 312 | |
| | | | | | | | | | | | | | | | | | | | |
Net cash provided by (used in) financing activities | | | (277,321 | ) | | | — | | | | 211 | | | | — | | | | (277,110 | ) |
| | | | | | | | | | | | | | | | | | | | |
Effect of exchange rate fluctuations on cash and cash equivalents | | | — | | | | — | | | | (578 | ) | | | — | | | | (578 | ) |
| | | | | | | | | | | | | | | | | | | | |
Net increase (decrease) in cash and cash equivalents | | | 77,912 | | | | (5,379 | ) | | | 7,685 | | | | — | | | | 80,218 | |
Cash and cash equivalents, beginning of period | | | 23,455 | | | | 6,907 | | | | 303,622 | | | | — | | | | 333,984 | |
| | | | | | | | | | | | | | | | | | | | |
Cash and cash equivalents, end of period | | $ | 101,367 | | | $ | 1,528 | | | $ | 311,307 | | | $ | — | | | $ | 414,202 | |
| | | | | | | | | | | | | | | | | | | | |
115
The following is the consolidated statement of cash flows for the fiscal year ended October 30, 2010 (in thousands):
| | | | | | | | | | | | | | | | | | | | |
| | | Brocade
Communications
Systems, Inc. | | | Subsidiary
Guarantors | | | Foreign
Non-
Guarantor
Subsidiaries | | | Consolidating
Adjustments | | | Total | |
Net cash provided by operating activities | | $ | 71,094 | | | $ | 169,986 | | | $ | 57,433 | | | $ | — | | | $ | 298,513 | |
| | | | | | | | | | | | | | | | | | | | |
Cash flows from investing activities: | | | | | | | | | | | | | | | | | | | | |
Purchases of short-term investments | | | — | | | | (53 | ) | | | — | | | | — | | | | (53 | ) |
Purchases of non-marketable minority equity investments | | | (200 | ) | | | — | | | | — | | | | — | | | | (200 | ) |
Proceeds from maturities and sale of short-term investments | | | — | | | | 3,255 | | | | — | | | | — | | | | 3,255 | |
Proceeds from sale of property | | | 30,185 | | | | — | | | | — | | | | — | | | | 30,185 | |
Purchases of property and equipment | | | (196,193 | ) | | | 471 | | | | (5,899 | ) | | | — | | | | (201,621 | ) |
| | | | | | | | | | | | | | | | | | | | |
Net cash provided by (used in) investing activities | | | (166,208 | ) | | | 3,673 | | | | (5,899 | ) | | | — | | | | (168,434 | ) |
| | | | | | | | | | | | | | | | | | | | |
Cash flows from financing activities: | | | | | | | | | | | | | | | | | | | | |
Payment of debt issuance costs related to the Senior Secured Notes | | | (3,666 | ) | | | — | | | | — | | | | — | | | | (3,666 | ) |
Payment of principal related to the revolving credit facility | | | (14,050 | ) | | | — | | | | — | | | | — | | | | (14,050 | ) |
Payment of principal related to the convertible subordinated debt | | | — | | | | (172,500 | ) | | | — | | | | — | | | | (172,500 | ) |
Payment of principal related to the term loan | | | (583,029 | ) | | | — | | | | — | | | | — | | | | (583,029 | ) |
Payment of principal related to capital leases | | | (1,173 | ) | | | — | | | | — | | | | — | | | | (1,173 | ) |
Common stock repurchases | | | (25,004 | ) | | | — | | | | — | | | | — | | | | (25,004 | ) |
Proceeds from Senior Secured Notes | | | 587,968 | | | | — | | | | — | | | | — | | | | 587,968 | |
Proceeds from issuance of common stock | | | 81,593 | | | | — | | | | — | | | | — | | | | 81,593 | |
Excess tax benefits or detriments from stock-based compensation | | | 1,420 | | | | — | | | | 741 | | | | — | | | | 2,161 | |
| | | | | | | | | | | | | | | | | | | | |
Net cash provided by (used in) financing activities | | | 44,059 | | | | (172,500 | ) | | | 741 | | | | — | | | | (127,700 | ) |
| | | | | | | | | | | | | | | | | | | | |
Effect of exchange rate fluctuations on cash and cash equivalents | | | — | | | | — | | | | (2,588 | ) | | | — | | | | (2,588 | ) |
| | | | | | | | | | | | | | | | | | | | |
Net increase (decrease) in cash and cash equivalents | | | (51,055 | ) | | | 1,159 | | | | 49,687 | | | | — | | | | (209 | ) |
Cash and cash equivalents, beginning of period | | | 74,510 | | | | 5,748 | | | | 253,935 | | | | — | | | | 334,193 | |
| | | | | | | | | | | | | | | | | | | | |
Cash and cash equivalents, end of period | | $ | 23,455 | | | $ | 6,907 | | | $ | 303,622 | | | $ | — | | | $ | 333,984 | |
| | | | | | | | | | | | | | | | | | | | |
116
The following is the consolidated statement of cash flows for the fiscal year ended October 31, 2009 (in thousands):
| | | | | | | | | | | | | | | | | | | | |
| | | Brocade
Communications
Systems, Inc. | | | Subsidiary
Guarantors | | | Foreign
Non-
Guarantor
Subsidiaries | | | Consolidating
Adjustments | | | Total | |
Net cash provided by (used in) operating activities | | $ | 126,497 | | | $ | (465 | ) | | $ | (10,470 | ) | | $ | — | | | $ | 115,562 | |
| | | | | | | | | | | | | | | | | | | | |
Cash flows from investing activities: | | | | | | | | | | | | | | | | | | | | |
Purchases of short-term investments | | | — | | | | (138 | ) | | | — | | | | — | | | | (138 | ) |
Proceeds from maturities and sale of short-term investments | | | 101,083 | | | | 149 | | | | 54,754 | | | | — | | | | 155,986 | |
Proceeds from maturities and sale of long-term investments | | | 18,115 | | | | — | | | | 12,058 | | | | — | | | | 30,173 | |
Purchases of property and equipment | | | (153,186 | ) | | | (2,464 | ) | | | (7,120 | ) | | | — | | | | (162,770 | ) |
Decrease in restricted cash | | | 1,075,079 | | | | — | | | | — | | | | — | | | | 1,075,079 | |
Net cash paid in connection with acquisitions | | | (1,297,482 | ) | | | — | | | | — | | | | — | | | | (1,297,482 | ) |
| | | | | | | | | | | | | | | | | | | | |
Net cash provided by (used in) investing activities | | | (256,391 | ) | | | (2,453 | ) | | | 59,692 | | | | — | | | | (199,152 | ) |
| | | | | | | | | | | | | | | | | | | | |
Cash flows from financing activities: | | | | | | | | | | | | | | | | | | | | |
Payment of senior underwriting fees related to the term loan | | | (30,525 | ) | | | — | | | | — | | | | — | | | | (30,525 | ) |
Payment of principal related to the term loan | | | (166,022 | ) | | | — | | | | — | | | | — | | | | (166,022 | ) |
Proceeds from issuance of common stock | | | 145,655 | | | | — | | | | — | | | | — | | | | 145,655 | |
Proceeds from revolving credit facility | | | 14,050 | | | | — | | | | — | | | | — | | | | 14,050 | |
Excess tax benefits or detriments from stock-based compensation | | | (832 | ) | | | — | | | | — | | | | — | | | | (832 | ) |
| | | | | | | | | | | | | | | | | | | | |
Net cash used in financing activities | | | (37,674 | ) | | | — | | | | — | | | | — | | | | (37,674 | ) |
| | | | | | | | | | | | | | | | | | | | |
Effect of exchange rate fluctuations on cash and cash equivalents | | | — | | | | — | | | | 1,573 | | | | — | | | | 1,573 | |
| | | | | | | | | | | | | | | | | | | | |
Net increase (decrease) in cash and cash equivalents | | | (167,568 | ) | | | (2,918 | ) | | | 50,795 | | | | — | | | | (119,691 | ) |
Cash and cash equivalents, beginning of period | | | 242,078 | | | | 8,666 | | | | 203,140 | | | | — | | | | 453,884 | |
| | | | | | | | | | | | | | | | | | | | |
Cash and cash equivalents, end of period | | $ | 74,510 | | | $ | 5,748 | | | $ | 253,935 | | | $ | — | | | $ | 334,193 | |
| | | | | | | | | | | | | | | | | | | | |
22. Subsequent Event
In December 2011, the Company received and accepted an offer from the Internal Revenue Service to settle its federal income tax audit for fiscal years 2004 through 2006. We estimate the settlement will provide a net discrete tax benefit between $6 million and $8 million in the first quarter of fiscal 2012 due to the release of certain reserves.
117
BROCADE COMMUNICATIONS SYSTEMS, INC.
QUARTERLY SUMMARY
(Unaudited)
| | | | | | | | | | | | | | | | | | | | | | | | | | | | | | | | |
| | | Three Months Ended | |
| | | January 29,
2011 | | | April 30,
2011 | | | July 30,
2011 | | | October 29,
2011 | | | January 30,
2010 | | | May 1,
2010 | | | July 31,
2010 | | | October 30,
2010 | |
| | | (In thousands, except per share and stock price amounts) | |
Quarterly Data: | | | | | | | | | | | | | | | | | | | | | | | | | | | | | | | | |
Net revenues | | $ | 545,756 | | | $ | 548,364 | | | $ | 502,850 | | | $ | 550,472 | | | $ | 537,659 | | | $ | 500,613 | | | $ | 504,252 | | | $ | 548,629 | |
Gross margin | | $ | 320,883 | | | $ | 328,609 | | | $ | 306,527 | | | $ | 327,515 | | | $ | 327,305 | | | $ | 295,120 | | | $ | 285,421 | | | $ | 323,274 | |
Income from operations | | $ | 42,404 | | | $ | 46,197 | | | $ | 34,222 | | | $ | 54,697 | | | $ | 81,367 | | | $ | 41,343 | | | $ | 31,088 | | | $ | 54,033 | |
Net income (loss) | | $ | 26,918 | | | $ | 26,079 | | | $ | 1,937 | | | $ | (4,324 | ) | | $ | 49,671 | | | $ | 22,095 | | | $ | 22,530 | | | $ | 22,227 | |
Per share amounts: | | | | | | | | | | | | | | | | | | | | | | | | | | | | | | | | |
Basic | | $ | 0.06 | | | $ | 0.06 | | | $ | 0.00 | | | $ | (0.01 | ) | | $ | 0.11 | | | $ | 0.05 | | | $ | 0.05 | | | $ | 0.05 | |
Diluted | | $ | 0.05 | | | $ | 0.05 | | | $ | 0.00 | | | $ | (0.01 | ) | | $ | 0.10 | | | $ | 0.05 | | | $ | 0.05 | | | $ | 0.05 | |
Shares used in computing per share amounts: | | | | | | | | | | | | | | | | | | | | | | | | | | | | | | | | |
Basic | | | 465,108 | | | | 473,209 | | | | 483,744 | | | | 474,975 | | | | 439,080 | | | | 442,816 | | | | 449,489 | | | | 456,597 | |
Diluted | | | 491,166 | | | | 501,511 | | | | 509,548 | | | | 474,975 | | | | 484,262 | | | | 479,166 | | | | 481,863 | | | | 485,672 | |
Closing prices: | | | | | | | | | | | | | | | | | | | | | | | | | | | | | | | | |
High | | $ | 6.41 | | | $ | 6.45 | | | $ | 7.11 | | | $ | 5.39 | | | $ | 9.25 | | | $ | 6.96 | | | $ | 6.66 | | | $ | 6.35 | |
Low | | $ | 4.97 | | | $ | 5.64 | | | $ | 5.48 | | | $ | 3.22 | | | $ | 6.87 | | | $ | 5.36 | | | $ | 4.94 | | | $ | 4.70 | |
118
| Item 9. | Changes in and Disagreements With Accountants on Accounting and Financial Disclosure |
None.
| Item 9A. | Controls and Procedures |
Evaluation of Disclosure Controls and Procedures
Under the supervision and with the participation of our management, including our Chief Executive Officer and Chief Financial Officer, we conducted an evaluation of the effectiveness of our disclosure controls and procedures, as defined in Rules 13a-15(e) and 15d-15(e) under the Securities Exchange Act of 1934, as amended, as of the end of the period covered by this Annual Report on Form 10-K (the “Evaluation Date”).
The purpose of this evaluation is to determine if, as of the Evaluation Date, our disclosure controls and procedures are effective such that the information required to be disclosed in our Securities and Exchange Commission (“SEC”) reports (i) is recorded, processed, summarized and reported within the time periods specified in SEC rules and forms, and (ii) is accumulated and communicated to our management, including our Chief Executive Officer and Chief Financial Officer, as appropriate to allow timely decisions regarding required disclosure.
Based on this evaluation, our Chief Executive Officer and Chief Financial Officer concluded that, as of the Evaluation Date, our disclosure controls and procedures were effective.
Changes in Internal Control over Financial Reporting
There were no changes in our internal control over financial reporting that occurred during the quarter ended October 29, 2011 that have materially affected, or are reasonably likely to materially affect, our internal control over financial reporting. However, as part of continuous process improvements, the Company implemented certain enhancements to processes relating to marketing incentive accruals, in the fiscal year 2011. As a result of these improvements, the Company identified certain immaterial errors in its prior period financial statements as described in Note 1, “Basis of Presentation” of the Notes to the Consolidated Financial Statements in Part II, Item 8 of this Form 10-K.
Management’s Report on Internal Control over Financial Reporting
The management of Brocade Communications Systems, Inc. is responsible for establishing and maintaining adequate internal control over financial reporting as defined in Rule 13a-15(f) or 15d-15(f) of the Securities Exchange Act of 1934. The Company’s internal control over financial reporting is a process designed by, or under the supervision of, the Company’s principal executive and principal financial officers, and effected by the Company’s Board of Directors, management and other personnel, to provide reasonable assurance regarding the reliability of financial reporting and the preparation of financial statements for external purposes in accordance with generally accepted accounting principles and includes those policies and procedures that:
| | • | | pertain to the maintenance of records that in reasonable detail accurately and fairly reflect the transactions and dispositions of the assets of the Company; |
| | • | | provide reasonable assurance that transactions are recorded as necessary to permit preparation of financial statements in accordance with generally accepted accounting principles, and that receipts and expenditures of the Company are being made only in accordance with authorizations of management and directors of the Company; and |
| | • | | provide reasonable assurance regarding prevention or timely detection of unauthorized acquisition, use or disposition of the Company’s assets that could have a material effect on the financial statements. |
119
Our management, including our Chief Executive Officer and Chief Financial Officer, does not expect that our disclosure controls and procedures or internal control over financial reporting will prevent all errors and all fraud. A control system, no matter how well designed and implemented, can provide only reasonable, not absolute, assurance that the control system’s objectives will be met. Further, the design of a control system must reflect the fact that there are resource constraints and the benefits of controls must be considered relative to their costs. Because of the inherent limitations in all control systems, no evaluation of controls can provide absolute assurance that all control issues within a company are detected. The inherent limitations include the realities that judgments in decision-making can be faulty and that breakdowns can occur because of simple errors or mistakes. Controls can also be circumvented by the individual acts of some persons, by collusion of two or more people or by management override of the controls. Because of the inherent limitations in a cost-effective control system, misstatements due to error or fraud may occur and may not be detected.
Our management assessed the effectiveness of the Company’s internal control over financial reporting as of October 29, 2011, utilizing the criteria set forth by the Committee of Sponsoring Organizations of the Treadway Commission in Internal Control—Integrated Framework. Based on our management’s assessment, we believe that, as of October 29, 2011, our internal control over financial reporting was effective based on those criteria. The effectiveness of our internal control over financial reporting as of October 29, 2011 has been audited by KPMG LLP, Brocade’s independent registered public accounting firm, as stated in their report which is included on page 121 of this Annual Report on Form 10-K.
120
Report of Independent Registered Public Accounting Firm
The Board of Directors and Stockholders
Brocade Communications Systems, Inc.:
We have audited Brocade Communications Systems, Inc. and subsidiaries’ (the Company) internal control over financial reporting as of October 29, 2011, based on criteria established in Internal Control—Integrated Framework issued by the Committee of Sponsoring Organizations of the Treadway Commission (COSO). The Company’s management is responsible for maintaining effective internal control over financial reporting and for its assessment of the effectiveness of internal control over financial reporting, included in the accompanyingManagement’s Report on Internal Control over Financial Reporting appearing in Item 9A. Our responsibility is to express an opinion on the Company’s internal control over financial reporting based on our audit.
We conducted our audit in accordance with the standards of the Public Company Accounting Oversight Board (United States). Those standards require that we plan and perform the audit to obtain reasonable assurance about whether effective internal control over financial reporting was maintained in all material respects. Our audit included obtaining an understanding of internal control over financial reporting, assessing the risk that a material weakness exists, and testing and evaluating the design and operating effectiveness of internal control based on the assessed risk. Our audit also included performing such other procedures as we considered necessary in the circumstances. We believe that our audit provides a reasonable basis for our opinion.
A company’s internal control over financial reporting is a process designed to provide reasonable assurance regarding the reliability of financial reporting and the preparation of financial statements for external purposes in accordance with U.S. generally accepted accounting principles. A company’s internal control over financial reporting includes those policies and procedures that (1) pertain to the maintenance of records that, in reasonable detail, accurately and fairly reflect the transactions and dispositions of the assets of the company; (2) provide reasonable assurance that transactions are recorded as necessary to permit preparation of financial statements in accordance with U.S. generally accepted accounting principles, and that receipts and expenditures of the company are being made only in accordance with authorizations of management and directors of the company; and (3) provide reasonable assurance regarding prevention or timely detection of unauthorized acquisition, use, or disposition of the company’s assets that could have a material effect on the financial statements.
Because of its inherent limitations, internal control over financial reporting may not prevent or detect misstatements. Also, projections of any evaluation of effectiveness to future periods are subject to the risk that controls may become inadequate because of changes in conditions, or that the degree of compliance with the policies or procedures may deteriorate.
In our opinion, the Company maintained, in all material respects, effective internal control over financial reporting as of October 29, 2011, based on criteria established inInternal Control—Integrated Framework issued by the COSO.
We also have audited, in accordance with the standards of the Public Company Accounting Oversight Board (United States), the consolidated balance sheets of Brocade Communications Systems, Inc. and subsidiaries as of October 29, 2011 and October 30, 2010, and the related consolidated statements of operations, stockholders’ equity and comprehensive income (loss), and cash flows for each of the years in the three-year period ended October 29, 2011. In connection with our audits of the consolidated financial statements, we have also audited the accompanying financial statement schedule. Our report dated December 19, 2011 expressed an unqualified opinion on those consolidated financial statements and financial statement schedule.
/s/ KPMG LLP
Santa Clara, California
December 19, 2011
121
| Item 9B. | Other Information |
None.
PART III
Certain information required by Part III is incorporated by reference from the Company’s definitive Proxy Statement to be filed with the Securities and Exchange Commission in connection with the solicitation of proxies for the Company’s 2012 Annual Meeting of Stockholders (the “Proxy Statement”).
| Item 10. | Directors, Executive Officers and Corporate Governance |
The information required by this Item with respect to the Company’s directors is incorporated by reference from the Proxy Statement under the sections entitled “Election of Directors” and “Board of Directors Meetings and Committees.” The information required by this Item with respect to the Company’s executive officers is incorporated by reference from the Proxy Statement under the section entitled “Executive Officers.” The information required by this Item with respect to disclosure of any known late filing or failure by an insider to file a report required by Section 16 of the Exchange Act is incorporated by reference from the Proxy Statement under the section entitled “Section 16(a) Beneficial Ownership Reporting Compliance.” The information regarding the Company’s corporate governance is incorporated by reference from the Proxy Statement.
The Board of Directors has adopted a Code of Ethics for Principal Executive and Senior Financial Officers (the “Code of Ethics”), which applies to the Company’s Chief Executive Officer, Chief Financial Officer and any other principal financial officer, controller and any other principal accounting officer, and any other person performing similar functions. The Code of Ethics is available on the Company’s Web site at www.brocade.com in the “Corporate Governance” section of its investor relations webpage. The Company will also provide a copy of the Code of Ethics upon request made by email to ir@brocade.com or in writing to Brocade Communications Systems, Inc., Attention: Investor Relations, 130 Holger Way, San Jose, California 95134. The Company will disclose any amendment to the Code of Ethics or waiver of a provision of the Code of Ethics that applies to the Company’s Chief Executive Officer, Chief Financial Officer and any other principal financial officer, controller and any other principal accounting officer, and any other person performing similar functions, and relate to certain elements of the Code of Ethics, including the name of the officer to whom the waiver was granted, on its Web site at www.brocade.com on its investor relations webpage.
| Item 11. | Executive Compensation |
The information required by this Item is incorporated by reference from the Proxy Statement under the section entitled “Executive Compensation and Other Matters.”
| Item 12. | Security Ownership of Certain Beneficial Owners and Management and Related Stockholder Matters |
The information required by this Item is incorporated by reference from the Proxy Statement under the sections entitled “Security Ownership of Certain Beneficial Owners and Management” and “Board of Directors Meetings and Committees.” Information with respect to securities authorized for issuance under equity compensation plans is set forth in Note 12 (see “Employee Compensation Plans” of Note 12) of the Notes to Consolidated Financial Statements in Part II, Item 8 of this Form 10-K.
| Item 13. | Certain Relationships and Related Transactions, and Director Independence |
The information required by this Item is incorporated by reference from the Proxy Statement under the section entitled “Certain Relationships and Related Transactions.”
| Item 14. | Principal Accountant Fees and Services |
The information required by this Item is incorporated by reference from the Proxy Statement under the section entitled “Ratification of Selection of Independent Registered Public Accountants.”
122
PART IV
| Item 15. | Exhibits and Financial Statement Schedules |
(a) The following documents are filed as a part of this Form 10-K:
The following financial statements of Brocade Communications Systems, Inc. are filed as a part of this Annual Report.
| | 2. | Financial Statement Schedules: |
The following financial statement schedule of Brocade Communications Systems, Inc. for the years ended October 29, 2011, October 30, 2010 and October 31, 2009 is filed as part of this Annual Report and should be read in conjunction with the Consolidated Financial Statements of Brocade Communications Systems, Inc.
All other schedules have been omitted as the required information is inapplicable or the information is presented in the Consolidated Financial Statements and notes thereto under Item 8 in Part II of this Form 10-K.
EXHIBIT INDEX
| | |
Exhibit Number | | Description of Document |
| |
| 3.1 | | Amended and Restated Certificate of Incorporation (incorporated by reference to Exhibit 3.1 from Brocade’s quarterly report on Form 10-Q for the quarter ended July 28, 2007) |
| |
| 3.2 | | Certificates of Correction and Corrected Amended and Restated Certificate of Incorporation effective as of June 1, 2009 (incorporated by reference to Exhibit 3.5 from Brocade’s quarterly report on Form 10-Q for the quarter ended May 2, 2009) |
| |
| 3.3 | | Certificate of Amendment to Amended and Restated Certificate of Incorporation effective as of April 13, 2010 (incorporated by reference to Exhibit 3.1 from Brocade’s Form 8-K filed on April 13, 2010) |
| |
| 3.4 | | Amended and Restated Bylaws of the Registrant effective as of April 13, 2010 (incorporated by reference to Exhibit 3.2 from Brocade’s Form 8-K filed on April 13, 2010) |
| |
| 3.5 | | Certificate of Designation of Rights, Preferences and Privileges of Series A Participating Preferred Stock of Brocade Communications Systems, Inc. (incorporated by reference to Exhibit 4.1 from Brocade’s Registration Statement on Form 8-A filed on February 11, 2002) |
123
| | |
Exhibit Number | | Description of Document |
| |
| 3.6 | | Certificate of Elimination of Series A Participating Preferred Stock of Brocade (incorporated by reference to Exhibit 3.1 from Brocade’s Form 8-K filed on February 16, 2007) |
| |
| 4.1 | | Form of Registrant’s Common Stock certificate (incorporated by reference to Exhibit 4.1 from Brocade’s Registration Statement on Form S-1 (Reg. No. 333-74711), as amended) |
| |
| 4.2 | | Indenture, dated as of January 20, 2010, by and among Brocade, the Subsidiary Guarantors named therein and Wells Fargo Bank, National Association, as Trustee, governing the 2018 Notes (incorporated by reference to Exhibit 4.1 from Brocade’s Form 8-K filed on January 26, 2010) |
| |
| 4.3 | | Indenture, dated as of January 20, 2010, by and among Brocade, the Subsidiary Guarantors named therein and Wells Fargo Bank, National Association, as Trustee, governing the 2020 Notes (incorporated by reference to Exhibit 4.2 from Brocade’s Form 8-K filed on January 26, 2010) |
| |
| 10.1 | | Form of Indemnification Agreement entered into between Brocade and each of its directors and executive officers (incorporated by reference to Exhibit 10.1 from Brocade’s Registration Statement on Form S-1 (Reg. No. 333-74711), as amended) |
| |
| 10.2† | | Goods Agreement between International Business Machines Corporation and Brocade dated April 15, 1999 (incorporated by reference to Exhibit 10.24 from Brocade’s Annual Report on Form 10-K for the fiscal year ended October 27, 2001) |
| |
| 10.3 | | Amendment #1 to the Goods Agreement between International Business Machines Corporation and Brocade (incorporated by reference to Exhibit 10.25 from Brocade’s Annual Report on Form 10-K for the fiscal year ended October 27, 2001) |
| |
| 10.4† | | Statement of Work #1 between International Business Machines Corporation and Brocade (incorporated by reference to Exhibit 10.26 from Brocade’s Annual Report on Form 10-K for the fiscal year ended October 27, 2001) |
| |
| 10.5† | | Amendment #3 to Statement of Work #1 between International Business Machines Corporation and Brocade (incorporated by reference to Exhibit 10.27 from Brocade’s Annual Report on Form 10-K for the fiscal year ended October 27, 2001) |
| |
| 10.6† | | Amendment #4 to Statement of Work #1 between International Business Machines Corporation and Brocade (incorporated by reference to Exhibit 10.28 from Brocade’s Annual Report on Form 10-K for the fiscal year ended October 27, 2001) |
| |
| 10.7 | | Lease Agreement between MV Golden State San Jose, LLC and Brocade dated December 1, 2000 (incorporated by reference to Exhibit 10.1 from Brocade’s Quarterly Report on Form 10-Q for the fiscal quarter ended January 27, 2001) |
| |
| 10.8† | | Amendment No. 5 to Statement of Work No. 1 between International Business Machines Corporation and Brocade (incorporated by reference to Exhibit 10.2 from Brocade’s Quarterly Report on Form 10-Q for the fiscal quarter ended April 27, 2002) |
| |
| 10.9† | | Amendment No. 6 to Statement of Work No. 1 between International Business Machines Corporation and Brocade (incorporated by reference to Exhibit 10.3 from Brocade’s Quarterly Report on Form 10-Q for the fiscal quarter ended April 27, 2002) |
| |
| 10.10† | | Amendment No. 7 to Statement of Work No. 1 between International Business Machines Corporation and Brocade (incorporated by reference to Exhibit 10.37 from Brocade’s Quarterly Report on Form 10-Q for the fiscal quarter ended July 27, 2002) |
| |
| 10.11† | | Amendment No. 8 to Statement of Work No. 1 between International Business Machines Corporation and Brocade (incorporated by reference to Exhibit 10.36 from Brocade’s Form 10-Q for the quarter ended January 25, 2003) |
124
| | |
Exhibit Number | | Description of Document |
| |
| 10.12† | | OEM Purchase Agreement between Brocade and Hewlett-Packard Company dated December 16, 2002 (incorporated by reference to Exhibit 10.48 from Brocade’s Form 10-Q for the quarter ended January 25, 2003) |
| |
| 10.13† | | Manufacturing and Purchase Agreement between Brocade and Hon Hai Precision Industry Co., Ltd. dated April 5, 2003 (HHPI Manufacturing and Purchase Agreement) (incorporated by reference to Exhibit 10.49 from Brocade’s Quarterly Report on Form 10-Q for the fiscal quarter ended April 26, 2003) |
| |
| 10.14 | | Amendment Number One to HHPI Manufacturing and Purchase Agreement between Brocade and Hon Hai Precision Industry Co., Ltd. dated April 5, 2003 (incorporated by reference to Exhibit 10.50 from Brocade’s Quarterly Report on Form 10-Q for the fiscal quarter ended April 26, 2003) |
| |
| 10.15† | | Manufacturing and Purchase Agreement between Brocade Communications Switzerland SarL and Hon Hai Precision Industry Co., Ltd. dated May 1, 2003 (incorporated by reference to Exhibit 10.51 from Brocade’s Quarterly Report on Form 10-Q for the fiscal quarter ended April 26, 2003) |
| |
| 10.16† | | Manufacturing and Purchase Agreement between Brocade and Solectron Corporation dated February 21, 2003 (Solectron Manufacturing and Purchase Agreement) (incorporated by reference to Exhibit 10.52 from Brocade’s Quarterly Report on Form 10-Q for the fiscal quarter ended April 26, 2003) |
| |
| 10.17 | | Amendment No. 1 to Solectron Manufacturing and Purchase Agreement between Brocade and Solectron Corporation dated March 21, 2003 (incorporated by reference to Exhibit 10.53 from Brocade’s Quarterly Report on Form 10-Q for the fiscal quarter ended April 26, 2003) |
| |
| 10.18† | | Manufacturing and Purchase Agreement between Brocade Communications Switzerland SarL and Solectron Corporation dated March 21, 2003 (incorporated by reference to Exhibit 10.54 from Brocade’s Quarterly Report on Form 10-Q for the fiscal quarter ended April 26, 2003) |
| |
| 10.19† | | Amendment #15 dated March 26, 2004 to Statement of Work #1 between International Business Machines Corporation and Brocade (incorporated by reference to Exhibit 10.71 from Brocade’s Quarterly Report on Form 10-Q for the fiscal quarter ended May 1, 2004) |
| |
| 10.20† | | Amendment #18 dated October 5, 2004 to Statement of Work #1 between International Business Machines Corporation and Brocade (incorporated by reference to Exhibit 10.77 from Brocade’s Annual Report on Form 10-K for the fiscal year ended October 30, 2004) |
| |
| 10.21† | | Amendment #1 dated November 2, 2004 to OEM Purchase Agreement between Brocade and Hewlett-Packard Company dated December 16, 2002 (incorporated by reference to Exhibit 10.80 from Brocade’s Annual Report on Form 10-K for the fiscal year ended October 30, 2004) |
| |
| 10.22† | | Amendment #2 dated October 27, 2004 to OEM Purchase Agreement between Brocade and Hewlett-Packard Company dated December 16, 2002 (incorporated by reference to Exhibit 10.81 from Brocade’s Annual Report on Form 10-K for the fiscal year ended October 30, 2004) |
| |
| 10.23* | | Employment Letter for Michael Klayko (incorporated by reference to Exhibit 10.85 from Brocade’s Annual Report on Form 10-K for the fiscal year ended October 30, 2004) |
| |
| 10.24† | | Amendment #3 dated November 22, 2004 to OEM Purchase Agreement between Brocade and Hewlett-Packard Company dated December 16, 2002 (incorporated by reference to Exhibit 10.89 from Brocade’s quarterly report on Form 10-Q for the quarter ended January 29, 2005) |
| |
| 10.25* | | Amended and Restated Employee Stock Purchase Plan and related forms of agreements (incorporated by reference to Exhibit 10.7 from Brocade’s quarterly report on Form 10-Q for the quarter ended July 30, 2005) |
125
| | |
Exhibit Number | | Description of Document |
| |
| 10.26* | | Amended and Restated 1999 Nonstatutory Stock Option Plan and related forms of agreements (incorporated by reference to Exhibit 10.8 from Brocade’s quarterly report on Form 10-Q for the quarter ended July 30, 2005) |
| |
| 10.27* | | Employment Letter for Ian Whiting dated May 1, 2005 (incorporated by reference to Exhibit 10.92 from Brocade’s annual report on Form 10-K for the fiscal year ended October 29, 2005) |
| |
| 10.28† | | Amendment #6 to Statement of Work No. 3 between International Business Machines Corporation and Brocade dated September 13, 2005 (incorporated by reference to Exhibit 10.94 from Brocade’s annual report on Form 10-K for the fiscal year ended October 29, 2005) |
| |
| 10.29† | | Statement of Work No. 4 between International Business Machines Corporation and Brocade dated August 12, 2005 (incorporated by reference to Exhibit 10.95 from Brocade’s annual report on Form 10-K for the fiscal year ended October 29, 2005) |
| |
| 10.30 | | Tolling Agreement dated as of January 1, 2006 between Gregory L. Reyes and Brocade, David House, William Krause, Nicholas Moore, William O’Brien, Christopher Paisley, Larry Sonsini, Seth Neiman, Neal Dempsey and Sanjay Vaswani (incorporated by reference to Exhibit 10.2 from Brocade’s quarterly report on Form 10-Q for the quarter ended January 28, 2006) |
| |
| 10.31 | | Notice of partial termination of Tolling Agreement dated September 11, 2006 (incorporated by reference to Exhibit 10.80 from Brocade’s annual report on Form 10-K for the fiscal year ended October 27, 2007) |
| |
| 10.32† | | Amendment #23 dated December 15, 2005 to Statement of Work No. 1 between International Business Machines Corporation and Brocade dated August 12, 2005 (incorporated by reference to Exhibit 10.3 from Brocade’s quarterly report on Form 10-Q for the quarter ended January 28, 2006) |
| |
| 10.33† | | Amendment #4 dated January 20, 2006 to the OEM Purchase Agreement between Brocade and Hewlett-Packard Company dated December 16, 2002 (incorporated by reference to Exhibit 10.1 from Brocade’s quarterly report on Form 10-Q for the quarter ended April 29, 2006) |
| |
| 10.34† | | Amendment #4 dated March 30, 2006 to the Goods Agreement between International Business Machines Corporation and Brocade (incorporated by reference to Exhibit 10.4 from Brocade’s quarterly report on Form 10-Q for the quarter ended April 29, 2006) |
| |
| 10.35† | | Amendment #1 to Statement of Work No. 4 between International Business Machines Corporation and Brocade effective May 31, 2006 (incorporated by reference to Exhibit 10.1 from Brocade’s quarterly report on Form 10-Q for the quarter ended July 29, 2006) |
| |
| 10.36† | | Amendment #26 dated September 19, 2006 to Statement of Work No. 1 between International Business Machines Corporation and Brocade dated August 12, 2005 (incorporated by reference to Exhibit 10.103 from Brocade’s annual report on Form 10-K for the fiscal year ended October 28, 2006) |
| |
| 10.37† | | Amendment #6 effective as of August 4, 2006 to OEM Purchase Agreement between Brocade and Hewlett-Packard Company dated December 16, 2002 (incorporated by reference to Exhibit 10.105 from Brocade’s annual report on Form 10-K for the fiscal year ended October 28, 2006) |
| |
| 10.38† | | Amendment #7 dated August 4, 2006 to OEM Purchase Agreement between Brocade and Hewlett-Packard Company dated December 16, 2002 (incorporated by reference to Exhibit 10.106 from Brocade’s annual report on Form 10-K for the fiscal year ended October 28, 2006) |
| |
| 10.39† | | Statement of Work #6 dated May 6, 2007 between International Business Machines Corporation and Brocade (incorporated by reference to Exhibit 10.5 from Brocade’s quarterly report on Form 10-Q for the quarter ended July 28, 2007) |
126
| | |
Exhibit Number | | Description of Document |
| |
| 10.40† | | Amendment #5, dated April 20, 2007 to OEM Purchase Agreement between Hewlett-Packard Company and Brocade (incorporated by reference to Exhibit 10.116 from Brocade’s annual report on Form 10-K for the fiscal year ended October 27, 2007) |
| |
| 10.41† | | Amendment #8, dated September 6, 2007 to OEM Purchase Agreement between Hewlett-Packard Company and Brocade (incorporated by reference to Exhibit 10.117 from Brocade’s annual report on Form 10-K for the fiscal year ended October 27, 2007) |
| |
| 10.42† | | Statement of Work #7, dated October 1, 2007 to Goods Agreement between International Business Machines and Brocade (incorporated by reference to Exhibit 10.118 from Brocade’s annual report on Form 10-K for the fiscal year ended October 27, 2007) |
| |
| 10.43† | | Amendment Number 1 dated November 1, 2007 to SOW #6 of the Goods Agreement between International Business Machines Corporation and Brocade (incorporated by reference to Exhibit 10.1 from Brocade’s quarterly report on Form 10-Q for the quarter ended January 26, 2008) |
| |
| 10.44† | | Ninth Amendment, dated November 5, 2007 to OEM Purchase Agreement dated December 16, 2002 between Hewlett-Packard Company and Brocade (incorporated by reference to Exhibit 10.2 from Brocade’s quarterly report on Form 10-Q for the quarter ended January 26, 2008) |
| |
| 10.45† | | Tenth Amendment, dated December 21, 2007 to OEM Purchase Agreement dated December 16, 2002 between Hewlett-Packard Company and Brocade (incorporated by reference to Exhibit 10.4 from Brocade’s quarterly report on Form 10-Q for the quarter ended January 26, 2008) |
| |
| 10.46† | | Amendment Number 31 dated December 30, 2007 to Statement of Work #1 to Goods Agreement between International Business Machines Corporation and Brocade (incorporated by reference to Exhibit 10.5 from Brocade’s quarterly report on Form 10-Q for the quarter ended January 26, 2008) |
| |
| 10.47† | | Amendment Number 32 dated January 22, 2008 to Statement of Work #1 to Goods Agreement between International Business Machines Corporation and Brocade (incorporated by reference to Exhibit 10.6 from Brocade’s quarterly report on Form 10-Q for the quarter ended January 26, 2008) |
| |
| 10.48* | | 1999 Director Plan as amended and restated April 10, 2008 and related forms of agreements, as amended (incorporated by reference to Exhibit 10.1 from Brocade’s quarterly report on Form 10-Q for the quarter ended April 26, 2008) |
| |
| 10.49* | | 1999 Stock Plan as amended and restated November 27, 2006 and related forms of agreements, as amended (incorporated by reference to Exhibit 10.2 from Brocade’s quarterly report on Form 10-Q for the quarter ended April 26, 2008) |
| |
| 10.50† | | OEM Purchase Agreement dated May 20, 2008 between EMC Corporation and Brocade (incorporated by reference to Exhibit 10.1 from Brocade’s quarterly report on Form 10-Q for the quarter ended July 26, 2008) |
| |
| 10.51† | | Amendment Number 11 dated April 28, 2008 to OEM Purchase Agreement between Hewlett-Packard Company and Brocade (incorporated by reference to Exhibit 10.2 from Brocade’s quarterly report on Form 10-Q for the quarter ended July 26, 2008) |
| |
| 10.52† | | Amendment Number 2 to Statement of Work #6, dated May 12, 2008 to OEM Purchase Agreement between IBM and Brocade (incorporated by reference to Exhibit 10.3 from Brocade’s quarterly report on Form 10-Q for the quarter ended July 26, 2008) |
| |
| 10.53 | | Commitment letter dated as of July 21, 2008 with Bank of America, N.A., Banc of America Bridge LLC and Morgan Stanley Senior Funding, Inc. (incorporated by reference to Exhibit 99.1 from Brocade’s Form 8-K filed on August 14, 2008) |
127
| | |
Exhibit Number | | Description of Document |
| |
| 10.54 | | Stock Purchase Plan and Agreement dated as of August 13, 2008 between Morgan Stanley & Co. Incorporated and Brocade Communications Systems, Inc. (incorporated by reference to Exhibit 10.120 from Brocade’s annual report on Form 10-K filed on December 15, 2008) |
| |
| 10.55† | | Credit Agreement, dated as of October 7, 2008, among the lenders party thereto, Bank of America, N.A., as administrative agent, swing line lender and letter of credit issuer, Morgan Stanley Senior Funding, Inc., as syndication agent, Banc of America Securities LLC and Morgan Stanley Senior Funding, Inc., as joint lead arrangers and joint bookrunners, HSBC Bank USA National Association and Keybank National Association, as co-documentation agents and Brocade Communications Systems, Inc. (incorporated by reference to Exhibit 10.1 from Brocade’s Form 8-K filed on October 14, 2008) |
| |
| 10.56† | | Amendment Number 34 dated June 23, 2008 to Statement of Work #1 to Goods Agreement between International Business Machines Corporation and Brocade Communications Systems, Inc. (incorporated by reference to Exhibit 10.122 from Brocade’s annual report on Form 10-K filed on December 15, 2008) |
| |
| 10.57† | | Amendment Number 12 dated August 21, 2008 to Statement of Work #3 to Goods Agreement between International Business Machines Corporation and Brocade Communications Systems, Inc. (incorporated by reference to Exhibit 10.124 from Brocade’s annual report on Form 10-K filed on December 15, 2008) |
| |
| 10.58† | | Amendment Number 1 dated July 10, 2008 to Statement of Work #7 to Goods Agreement between International Business Machines Corporation and Brocade Communications Systems, Inc. (incorporated by reference to Exhibit 10.125 from Brocade’s annual report on Form 10-K filed on December 15, 2008) |
| |
| 10.59† | | Amendment Number 1 dated January 9, 2009 to OEM Purchase and License Agreement between EMC Corporation and Brocade (incorporated by reference to Exhibit 10.2 from Brocade’s quarterly report on Form 10-Q filed on February 25, 2009) |
| |
| 10.60† | | Amendment Number 36 dated November 1, 2008 to Statement of Work Number 1 of the Goods Agreement between IBM and Brocade (incorporated by reference to Exhibit 10.3 from Brocade’s quarterly report on Form 10-Q filed on February 25, 2009) |
| |
| 10.61† | | Amendment Number 2 dated October 29, 2008 to Statement of Work Number 7 of the Goods Agreement between IBM and Brocade (incorporated by reference to Exhibit 10.4 from Brocade’s quarterly report on Form 10-Q filed on February 25, 2009) |
| |
| 10.62† | | Amendment Number 13 dated December 16, 2008 to Statement of Work Number 3 of the Goods Agreement between IBM and Brocade (incorporated by reference to Exhibit 10.5 from Brocade’s quarterly report on Form 10-Q filed on February 25, 2009) |
| |
| 10.63† | | Amendment Number 12 dated March 11, 2009, with an effective date of February 28, 2008, to OEM Purchase Agreement between Hewlett-Packard Company and Brocade (incorporated by reference to Exhibit 10.1 from Brocade’s quarterly report on Form 10-Q filed on June 4, 2009) |
| |
| 10.64† | | Amendment Number 13 dated March 14, 2009, with an effective date of March 6, 2009, to OEM Purchase Agreement between Hewlett-Packard Company and Brocade (incorporated by reference to Exhibit 10.2 from Brocade’s quarterly report on Form 10-Q filed on June 4, 2009) |
| |
| 10.65† | | Amendment Number 14 dated March 14, 2009, with an effective date as of October 24, 2008, to OEM Purchase Agreement between Hewlett-Packard Company and Brocade (incorporated by reference to Exhibit 10.3 from Brocade’s quarterly report on Form 10-Q filed on June 4, 2009) |
128
| | |
Exhibit Number | | Description of Document |
| |
| 10.66† | | Statement of Work #8, dated April 1, 2009, to Goods Agreement between International Business Machines and Brocade (incorporated by reference to Exhibit 10.4 from Brocade’s quarterly report on Form 10-Q filed on June 4, 2009) |
| |
| 10.67* | | 2009 Stock Plan and related forms of agreements (incorporated by reference to Exhibit 10.1 from Brocade’s current report on Form 8-K filed on April 27, 2009) |
| |
| 10.68* | | 2009 Director Plan and related forms of agreements (incorporated by reference to Exhibit 10.6 from Brocade’s quarterly report on Form 10-Q filed on June 4, 2009) |
| |
| 10.69* | | 2009 Employee Stock Purchase Plan (incorporated by reference to Exhibit 10.1 from Brocade’s Form 10-Q filed on June 3, 2011) |
| |
| 10.70† | | Amendment Number 15 dated May 11, 2009, with an effective date of February 1, 2009, to the Product Purchase Agreement between Hewlett-Packard Company and Brocade (incorporated by reference to Exhibit 10.1 from Brocade’s quarterly report on Form 10-Q filed on August 31, 2009) |
| |
| 10.71† | | Amendment Number 37 dated June 22, 2009, with an effective date of June 19, 2008 [sic], to Statement of Work Number 1 of the Goods Agreement between IBM and Brocade (incorporated by reference to Exhibit 10.2 from Brocade’s quarterly report on Form 10-Q filed on August 31, 2009) |
| |
| 10.72† | | Amendment Number 14 dated June 10, 2009 to Statement of Work Number 3 of the Goods Agreement between IBM and Brocade (incorporated by reference to Exhibit 10.3 from Brocade’s quarterly report on Form 10-Q filed on August 31, 2009) |
| |
| 10.73† | | Amendment Number 15 dated June 23, 2009 to Statement of Work Number 3 of the Goods Agreement between IBM and Brocade (incorporated by reference to Exhibit 10.4 from Brocade’s quarterly report on Form 10-Q filed on August 31, 2009) |
| |
| 10.74† | | Amendment Number 3 dated June 8, 2009, with an effective date of June 5, 2009, to Statement of Work Number 7 of the Goods Agreement between IBM and Brocade (incorporated by reference to Exhibit 10.5 from Brocade’s quarterly report on Form 10-Q filed on August 31, 2009) |
| |
| 10.75 | | Amendment Number 5 dated August 3, 2009 to the Goods Agreement between IBM and Brocade (incorporated by reference to Exhibit 10.148 from Brocade’s quarterly report on Form 10-K filed on December 14, 2009) |
| |
| 10.76† | | Amendment Number 38 dated September 19, 2009 to Statement of Work Number 1 of the Goods Agreement between IBM and Brocade (incorporated by reference to Exhibit 10.149 from Brocade’s quarterly report on Form 10-K filed on December 14, 2009) |
| |
| 10.77† | | Amendment Number 16 dated September 10, 2009, with an effective date of September 18, 2009, to Statement of Work Number 3 of the Goods Agreement between IBM and Brocade (incorporated by reference to Exhibit 10.150 from Brocade’s quarterly report on Form 10-K filed on December 14, 2009) |
| |
| 10.78† | | Amendment Number 17 dated October 30, 2009, with an effective date of October 28, 2009, to Statement of Work Number 3 of the Goods Agreement between IBM and Brocade (incorporated by reference to Exhibit 10.151 from Brocade’s quarterly report on Form 10-K filed on December 14, 2009) |
| |
| 10.79 | | Amendment Number 4 dated September 22, 2009 to Statement of Work Number 7 of the Goods Agreement between IBM and Brocade (incorporated by reference to Exhibit 10.152 from Brocade’s quarterly report on Form 10-K filed on December 14, 2009) |
| |
| 10.80† | | Amendment Number 5 dated September 15, 2009 to Statement of Work Number 7 of the Goods Agreement between IBM and Brocade (incorporated by reference to Exhibit 10.153 from Brocade’s quarterly report on Form 10-K filed on December 14, 2009) |
129
| | |
Exhibit Number | | Description of Document |
| |
| 10.81† | | Amendment Number 1 dated October 3, 2009 to Statement of Work Number 8 of the Goods Agreement between IBM and Brocade (incorporated by reference to Exhibit 10.154 from Brocade’s quarterly report on Form 10-K filed on December 14, 2009) |
| |
| 10.82† | | Amendment Number 2 dated October 13, 2009 to Statement of Work Number 8 of the Goods Agreement between IBM and Brocade (incorporated by reference to Exhibit 10.155 from Brocade’s quarterly report on Form 10-K filed on December 14, 2009) |
| |
| 10.83† | | Amendment Number 3 dated October 1, 2009 to Statement of Work Number 8 of the Goods Agreement between International Business Machines and Brocade (incorporated by reference to Exhibit 10.156 from Brocade’s quarterly report on Form 10-K filed on December 14, 2009) |
| |
| 10.84* | | Senior Leadership Plan (formerly Executive Leadership Plan), as amended as of December 2, 2010 (incorporated by reference to Exhibit 10.1 from Brocade’s Form 10-Q filed on March 3, 2010) |
| |
| 10.85* | | Form of Restricted Stock Unit Agreement (Market Stock Units) under the 2009 Stock Plan (incorporated by reference to Exhibit 10.2 from Brocade’s current report on Form 8-K filed on December 9, 2009) |
| |
| 10.86† | | Amendment Number 39 dated December 15, 2009, to Statement of Work Number 1 of the Goods Agreement between IBM and Brocade (incorporated by reference to Exhibit 10.3 from Brocade’s Form 10-Q filed on March 2, 2010) |
| |
| 10.87 | | Amendment and Waiver No. 1 dated January 8, 2010, to the Credit Agreement, dated as of October 7, 2008, by and among Brocade, the lenders party thereto, Bank of America, N.A., as administrative agent, swing line lender and letter of credit issuer, Morgan Stanley Senior Funding, Inc., as syndication agent, Banc of America Securities LLC and Morgan Stanley Senior Funding, Inc., as joint lead arrangers and joint bookrunners, and HSBC Bank USA National Association and Keybank National Association, as co-documentation agents (incorporated by reference to Exhibit 10.4 from Brocade’s Form 10-Q filed on March 2, 2010) |
| |
| 10.88 | | Purchase Agreement, dated January 13, 2010, between Brocade and J.P. Morgan Inc., as representative of the several Initial Purchasers listed in Schedule 1 thereto (incorporated by reference to Exhibit 10.5 from Brocade’s Form 10-Q filed on March 2, 2010) |
| |
| 10.89 | | Security Agreement, dated as of January 20, 2010, by and among Brocade, the Subsidiary Guarantors listed on the signature pages thereto and Wells Fargo Bank, National Association, as collateral agent (incorporated by reference to Exhibit 10.1 from Brocade’s Form 8-K filed on January 26, 2010) |
| |
| 10.90 | | Security Agreement, dated as of January 20, 2010, by and among Brocade, the Subsidiary Guarantors listed on the signature pages thereto and Wells Fargo Bank, National Association, as collateral agent (incorporated by reference to Exhibit 10.2 from Brocade’s Form 8-K filed on January 26, 2010) |
| |
| 10.91 | | Registration Rights Agreement, dated as of January 20, 2010, by and among Brocade, the Subsidiary Guarantors listed on the signature pages thereto and the purchasers named therein (incorporated by reference to Exhibit 10.3 from Brocade’s Form 8-K filed on January 26, 2010) |
| |
| 10.92 | | Registration Rights Agreement, dated as of January 20, 2010, by and among Brocade, the Subsidiary Guarantors listed on the signature pages thereto and the purchasers named therein (incorporated by reference to Exhibit 10.4 from Brocade’s Form 8-K filed on January 26, 2010) |
| |
| 10.93 | | Real Estate Sale Agreement effective as of January 25, 2010 by and between Brocade Communications Systems Skyport LLC, a wholly-owned subsidiary of Brocade, and CA-Skyport III Limited Partnership (incorporated by reference to Exhibit 10.10 from Brocade’s Form 10-Q filed on March 2, 2010) |
130
| | |
Exhibit Number | | Description of Document |
| |
| 10.94 | | Lease Agreement dated as of January 28, 2010 by and between Brocade and CA-Skyport III Limited Partnership (incorporated by reference to Exhibit 10.11 from Brocade’s Form 10-Q filed on March 2, 2010) |
| |
| 10.95† | | Amendment Number 2 dated February 2, 2010 to OEM Purchase and License Agreement between EMC Corporation and Brocade (incorporated by reference to Exhibit 10.12 from Brocade’s Form 10-Q filed on March 2, 2010) |
| |
| 10.96† | | Amendment Number 3 dated April 13, 2010 to OEM Purchase and License Agreement between EMC Corporation and Brocade (incorporated by reference to Exhibit 10.2 from Brocade’s Form 10-Q filed on June 2, 2010) |
| |
| 10.97† | | Amendment Number 16 dated March 24, 2010, with an effective date as of June 8, 2009, to the Product Purchase Agreement between Hewlett-Packard Company and Brocade (incorporated by reference to Exhibit 10.3 from Brocade’s Form 10-Q filed on June 2, 2010) |
| |
| 10.98† | | Amendment Number 40 dated April 13, 2010 to Statement of Work Number 1 of the Goods Agreement between IBM and Brocade (incorporated by reference to Exhibit 10.4 from Brocade’s Form 10-Q filed on June 2, 2010) |
| |
| 10.99† | | Amendment Number 3 dated April 19, 2010, with an effective date of January 1, 2010, to Statement of Work Number 6 of the Goods Agreement between IBM and Brocade (incorporated by reference to Exhibit 10.5 from Brocade’s Form 10-Q filed on June 2, 2010) |
| |
| 10.100† | | Amendment Number 6 dated April 13, 2010 to Statement of Work Number 7 of the Goods Agreement between IBM and Brocade (incorporated by reference to Exhibit 10.6 from Brocade’s Form 10-Q filed on June 2, 2010) |
| |
| 10.101† | | Amendment Number 17 dated May 21, 2010 to the Product Purchase Agreement between Hewlett-Packard Company and Brocade (incorporated by reference to Exhibit 10.1 from Brocade’s Form 10-Q filed on September 2, 2010) |
| |
| 10.102† | | Amendment Number 4 dated May 18, 2010 to Statement of Work Number 8 of the Goods Agreement between IBM and Brocade (incorporated by reference to Exhibit 10.2 from Brocade’s Form 10-Q filed on September 2, 2010) |
| |
| 10.103† | | Amendment Number 5 dated May 18, 2010, with an effective date of May 14, 2010, to Statement of Work Number 8 of the Goods Agreement between IBM and Brocade (incorporated by reference to Exhibit 10.3 from Brocade’s Form 10-Q filed on September 2, 2010) |
| |
| 10.104† | | Amendment Number 19 dated August 4, 2010 to the Product Purchase Agreement between Hewlett-Packard Company and Brocade (incorporated by reference to Exhibit 10.131 from Brocade’s Form 10-K filed on December 17, 2010) |
| |
| 10.105 | | Amendment Number 6 dated October 22, 2009, with an effective date of October 29, 2010, to the Goods Agreement between IBM and Brocade (incorporated by reference to Exhibit 10.132 from Brocade’s Form 10-K filed on December 17, 2010) |
| |
| 10.106† | | Amendment Number 41 dated September 21, 2010 to Statement of Work Number 1 of the Goods Agreement between IBM and Brocade (incorporated by reference to Exhibit 10.133 from Brocade’s Form 10-K filed on December 17, 2010) |
| |
| 10.107† | | Amendment Number 18 dated September 9, 2010 to Statement of Work Number 3 of the Goods Agreement between IBM and Brocade (incorporated by reference to Exhibit 10.133 from Brocade’s Form 10-K filed on December 17, 2010) |
| |
| 10.108 | | Special Ethernet Bonus Program, as approved on December 2, 2010 (incorporated by reference to Exhibit 10.2 from Brocade’s Form 10-Q filed on March 3, 2011) |
131
| | |
Exhibit Number | | Description of Document |
| |
| 10.109 | | Statement of Work #9, dated April 8, 2011, to Goods Agreement between International Business Machines and Brocade (incorporated by reference to Exhibit 10.2 from Brocade’s Form 10-Q filed on June 3, 2011) |
| |
| 10.110 | | French Sub-Plan under the 2009 Stock Plan and related forms of agreements (incorporated by reference to Exhibit 10.3 from Brocade’s Form 10-Q filed on June 3, 2011) |
| |
| 10.111 | | Amendment No. 2, dated as of June 10, 2011, by and among Brocade Communications Systems, Inc., the lenders party thereto, and Bank of America, N.A., as administrative agent, swing line lender and letter of credit issuer, to the Credit Agreement, dated as of October 7, 2008 (as amended), by and among Brocade Communications Systems, Inc., the lenders party thereto, and Bank of America, N.A., as administrative agent, swing line lender and letter of credit issuer. (incorporated by reference to Exhibit 10.1 from Brocade’s Form 8-K filed on June 10, 2011) |
| |
| 10.112† | | Amendment Number 42 dated June 30, 2011 to Statement of Work Number 1 of the Goods Agreement between IBM and Brocade (incorporated by reference to Exhibit 10.2 from Brocade’s Form 10-Q filed on September 2, 2011) |
| |
| 10.113† | | Amendment Number 7 dated July 20, 2011 to Statement of Work Number 7 of the Goods Agreement between IBM and Brocade (incorporated by reference to Exhibit 10.2 from Brocade’s Form 10-Q filed on September 2, 2011) |
| |
| 10.114**/†† | | Amendment Number 43 dated September 23, 2011 to Statement of Work Number 1 of the Goods Agreement between IBM and Brocade |
| |
| 10.115** | | Amendment Number 19 dated October 12, 2011, with an effective date of October 24, 2011, to Statement of Work Number 3 of the Goods Agreement between IBM and Brocade |
| |
| 10.116*/** | | Senior Leadership Plan, as amended as of October 25, 2011 |
| |
| 10.117*/** | | Rev It Up Plan, as of October 25, 2011 |
| |
| 10.118*/** | | Sales Leader Plan, as of October 28, 2011 |
| |
| 10.119*/** | | Amended and Restated Change of Control Retention Agreement between Brocade and Michael Klayko effective as of December 22, 2008 |
| |
| 10.120*/** | | Form of Amended and Restated Change of Control Retention Agreement between Brocade and each of Tyler Wall and Ian Whiting effective as of December 22, 2008 |
| |
| 10.121*/** | | Form of Change of Control Retention Agreement between Brocade and newly designated executive officers, including Daniel Fairfax effective as of February 23, 2009 |
| |
| 12.1** | | Statement of Computation of Ratio of Earnings to Fixed Charges |
| |
| 21.1** | | Subsidiaries of the Registrant |
| |
| 23.1** | | Consent of Independent Registered Public Accounting Firm |
| |
| 24.1** | | Power of attorney (see signatures page) |
| |
| 31.1** | | Rule 13a-14(a)/15d-14(a) Certification by the Chief Executive Officer |
| |
| 31.2** | | Rule 13a-14(a)/15d-14(a) Certification by the Chief Financial Officer |
| |
| 32.1** | | Certification by the Chief Executive Officer and Chief Financial Officer pursuant to 18 U.S.C. Section 1350, as adopted pursuant to Section 906 of the Sarbanes-Oxley Act of 2002 |
| |
| 101.INS*** | | XBRL Instance Document |
132
| | |
Exhibit Number | | Description of Document |
| |
| 101.SCH*** | | XBRL Taxonomy Extension Schema Document |
| |
| 101.CAL*** | | XBRL Taxonomy Extension Calculation Linkbase Document |
| |
| 101.DEF*** | | XBRL Taxonomy Extension Definition Linkbase Document |
| |
| 101.LAB*** | | XBRL Taxonomy Extension Label Linkbase Document |
| |
| 101.PRE*** | | XBRL Taxonomy Extension Presentation Linkbase Document |
| * | Indicates management contract or compensatory plan or arrangement required to be filed as an exhibit pursuant to Item 15(b) of Form 10-K. |
| *** | XBRL (eXtensible Business Reporting Language) information is furnished and not filed herewith, is not a part of a registration statement or prospectus for purposes of sections 11 or 12 of the Securities Act of 1933, is deemed not filed for purposes of section 18 of the Securities Exchange Act of 1934, and otherwise is not subject to liability under these sections. |
| † | Confidential treatment granted as to certain portions, which portions were omitted and filed separately with the Securities and Exchange Commission. |
| †† | Confidential treatment requested as to certain portions, which portions were omitted and filed separately with the Securities and Exchange Commission. |
(b) Exhibits
See Exhibit Index included in Item 15(a) of this Form 10-K.
(c) Financial Statement Schedules
133
SCHEDULE II
VALUATION AND QUALIFYING ACCOUNTS
Fiscal Years Ended October 29, 2011, October 30, 2010 and October 31, 2009
| | | | | | | | | | | | | | | | |
| | | Balance at
Beginning of
Period | | | Additions
Charged to
Revenues | | | Deductions* | | | Balance at
End of
Period | |
| | | (in thousands) | |
Allowance for doubtful accounts: | | | | | | | | | | | | | | | | |
2011 | | $ | 1,838 | | | $ | 1,357 | | | $ | (1,807 | ) | | $ | 1,388 | |
2010 | | $ | 3,954 | | | $ | — | | | $ | (2,116 | ) | | $ | 1,838 | |
2009 | | $ | 675 | | | $ | 4,246 | | | $ | (967 | ) | | $ | 3,954 | |
Sales allowances: | | | | | | | | | | | | | | | | |
2011 | | $ | 4,883 | | | $ | 9,048 | | | $ | (8,920 | ) | | $ | 5,011 | |
2010 | | $ | 8,619 | | | $ | 11,811 | | | $ | (15,547 | ) | | $ | 4,883 | |
2009 | | $ | 4,369 | | | $ | 17,183 | | | $ | (12,933 | ) | | $ | 8,619 | |
| * | Deductions related to the allowance for doubtful accounts and sales allowances represent amounts written off against the allowance and recoveries. |
134
SIGNATURES
Pursuant to the requirements of Section 13 or 15(d) of the Securities Exchange Act of 1934, the registrant has duly caused this report to be signed on its behalf by the undersigned, thereunto duly authorized.
| | | | | | |
| | | | Brocade Communications Systems, Inc. |
| | | |
| December 15, 2011 | | | | By: | | /S/ MICHAEL KLAYKO |
| | | | | | Michael Klayko |
| | | | | | Chief Executive Officer |
POWER OF ATTORNEY
KNOW ALL PERSONS BY THESE PRESENTS, that each person whose signature appears below constitutes and appoints Michael Klayko and Daniel W. Fairfax, and each of them, his and her true and lawful attorneys-in-fact, each with full power of substitution, for him and her in any and all capacities, to sign any amendments to this report on Form 10-K and to file the same, with exhibits thereto and other documents in connection therewith, with the Securities and Exchange Commission, hereby ratifying and confirming all that each of said attorneys-in-fact, or their substitute or substitutes, may do or cause to be done by virtue hereof.
Pursuant to the requirements of the Securities Exchange Act of 1934, this report has been signed below by the following persons on behalf of the registrant and in the capacities and on the dates indicated.
| | | | |
Signature | | Title | | Date |
| | |
/S/ MICHAEL KLAYKO Michael Klayko | | Director and Chief Executive Officer (Principal Executive Officer) | | December 15, 2011 |
| | |
/S/ DANIEL W. FAIRFAX Daniel W. Fairfax | | Chief Financial Officer and Vice President, Finance (Principal Financial and Accounting Officer) | | December 16, 2011 |
| | |
/S/ DAVID L. HOUSE David L. House | | Chairman of the Board of Directors | | December 16, 2011 |
| | |
/S/ JUDY BRUNER Judy Bruner | | Director | | December 14, 2011 |
| | |
/S/ RENATO DIPENTIMA Renato DiPentima | | Director | | December 14, 2011 |
| | |
/S/ ALAN EARHART Alan Earhart | | Director | | December 15, 2011 |
| | |
/S/ JOHN GERDELMAN John Gerdelman | | Director | | December 19, 2011 |
| | |
/S/ GLENN JONES Glenn Jones | | Director | | December 14, 2011 |
| | |
/S/ L. WILLIAM KRAUSE L. William Krause | | Director | | December 14, 2011 |
| | |
/S/ SANJAY VASWANI Sanjay Vaswani | | Director | | December 14, 2011 |
135