2009 Annual Report
Message From the Chairman
Dear Shareholders:
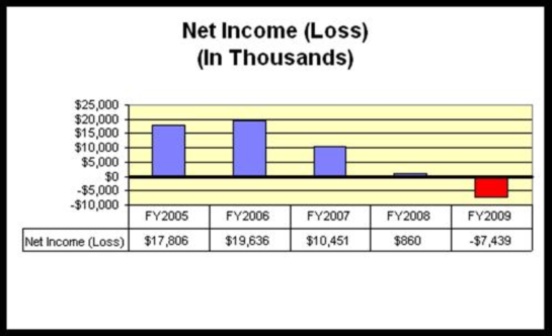
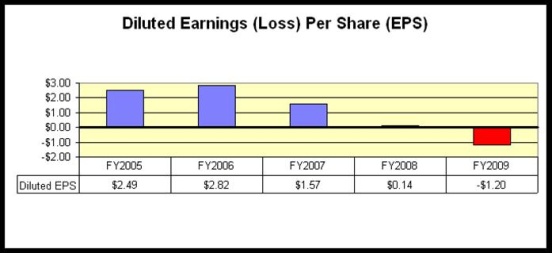
I am pleased to forward our Annual Report for fiscal 2009, which describes a very difficult year for the Company. For the year ended 2009, we reported a net loss of $7.4 million, or a loss of $1.20 per diluted share, significantly lower than the small net income last year and which reflects current challenges facing the financial services industry. Last year in this message, I described that fiscal 2008 was the most demanding operating environment in memory, made difficult by the poor economic conditions and deterioration of credit quality. While true, it turns out that fiscal 2009 was even more difficult, requiring unprecedented actions by the U.S. Department of the Treasury and Federal Reserve to blunt a financial disaster not experienced since the Great Depression. The Company has fared better than some competitors but worse than others making it clear to me that we have much to do to improve our financial results in what will probably be another challenging fiscal year for the Company.
Last year, since we forecast the protracted and difficult operating environment to continue into fiscal 2009, the fiscal 2009 initiatives became relatively clear when we were preparing our fiscal 2009 Business Plan. For the Bank, our Business Plan was prepared to preserve capital, limit asset growth and maintain the Bank’s “well-capitalized” regulatory capital designation. For Provident Bank Mortgage, the primary goal was to return the division to profitable operations.
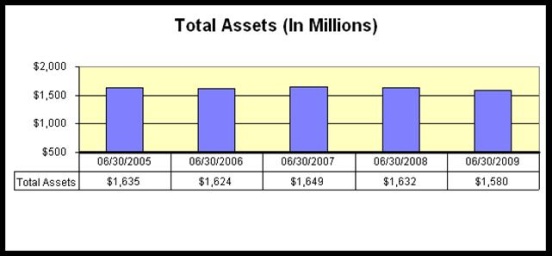
Although fiscal 2009 was very difficult, I am pleased to report that we succeeded in connection with all of the Provident Bank initiatives. Specifically, capital declined by a modest 7% in spite of a very large increase in the provision for loan losses, total assets declined by $52.8 million and the Bank maintained the “well-capitalized” regulatory capital designation throughout the fiscal year.
Just as important, Provident Bank Mortgage returned to profitable operations in fiscal 2009 which helped offset unprofitable community banking results. PBM operating results steadily improved throughout the fiscal year and were helped along by very low mortgage interest rates and an improvement in secondary market liquidity, which was a byproduct of the aggressive actions taken by the Treasury and Federal Reserve.
Provident Bank
I previously described that our fiscal 2010 outlook is guarded since the current operating environment is very challenging. Therefore, we have prepared our Business Plan to preserve capital, deleverage the balance sheet and maintain the Bank’s “well-capitalized” regulatory capital designation, not unlike our fiscal 2009 strategies.
The single most significant matter facing the Bank remains asset quality. We have dedicated a significant number of resources to deal with asset quality issues and expect that we will be unable to reduce those resources for the foreseeable future nor is it wise for us to do so. We remain committed to quickly identifying any problem loans within the loans held for investment portfolio, to timely record any related losses that we may experience, and to quickly dispose of the resultant real estate owned.
Provident Bank Mortgage
Fiscal 2009 turned out to be the recovery year for our mortgage banking business which steadily improved through the fiscal year leading to profitable operations in the third and fourth quarters. The improvement was the result of our specific changes to the operating model completed in prior fiscal years and a return to higher loan volumes resulting from lower interest rates. Loan sale margins also improved to historically profitable levels, the result of fewer competitors in the mortgage banking business given the decline in the industry during the past few years. Our improved outlook for mortgage banking in fiscal 2010 is formulated from our expectations that mortgage interest rates will likely remain at very low levels (from a historical perspective) and competitors will be slow to enter the market as a result of the global credit crisis which has significantly reduced the operating liquidity available to fund a mortgage banking business.
A Final Word
I began my message by describing that fiscal 2009 was a very difficult year for the Company and that the poor current operating environment suggests fiscal 2010 will be a challenging year as well. Recognizing the difficulties ahead, I am committed to taking the necessary actions in fiscal 2010 to assure the Company’s strong
Message From the Chairman
foundation and future growth opportunities which we anticipate will develop once the operating environment becomes more favorable. We must not forget that the strength of the Company’s franchise is inextricably linked to the customers we have served in Riverside (and surrounding communities) since 1956 when the Company was founded. Those customer relationships developed over these many years will survive the current environment and provide the impetus for future growth. In the near-term, however, we will be making the difficult decisions necessary to navigate the stressed operating environment and to satisfy the constituencies we serve; depositors, borrowers, shareholders, employees and regulators.
Sincerely,
Craig G. Blunden
Chairman, President and
Chief Executive Officer
Message From the Chairman
Message From the Chairman
Message From the Chairman
Financial Highlights
The following tables set forth information concerning the consolidated financial position and results of operations of the Corporation and its subsidiary at the dates and for the periods indicated.
| | At or For The Year Ended June 30, |
| | 2009 | 2008 | 2007 | 2006 | 2005 |
| (In Thousands, Except Per Share Information ) | | | | |
| | | | | | | | | | | |
| FINANCIAL CONDITION DATA: | | | | | | | | | | |
| Total assets | $ 1,579,613 | | $ 1,632,447 | | $ 1,648,923 | | $ 1,624,452 | | $ 1,634,690 | |
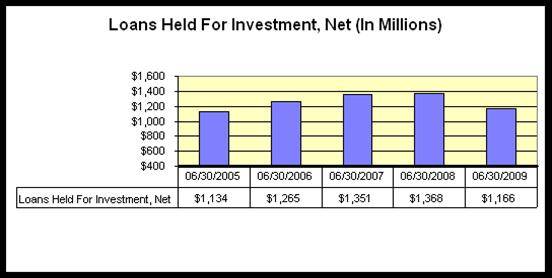
| Loans held for investment, net | 1,165,529 | | 1,368,137 | | 1,350,696 | | 1,264,979 | | 1,134,473 | |
| Loans held for sale, at fair value | 135,490 | | - | | - | | - | | - | |
Loans held for sale, at lower of cost or market | 10,555 | | 28,461 | | 1,337 | | 4,713 | | 5,691 | |
| Receivable from sale of loans | - | | - | | 60,513 | | 99,930 | | 167,813 | |
| Cash and cash equivalents | 56,903 | | 15,114 | | 12,824 | | 16,358 | | 25,902 | |
| Investment securities | 125,279 | | 153,102 | | 150,843 | | 177,189 | | 232,432 | |
| Deposits | 989,245 | | 1,012,410 | | 1,001,397 | | 921,279 | | 923,670 | |
| Borrowings | 456,692 | | 479,335 | | 502,774 | | 546,211 | | 560,845 | |
| Stockholders’ equity | 114,910 | | 123,980 | | 128,797 | | 136,148 | | 122,965 | |
| Book value per share | 18.48 | | 19.97 | | 20.20 | | 19.47 | | 17.68 | |
| | | | | | | | | | | |
| OPERATING DATA: | | | | | | | | | | |
| Interest income | $ 85,924 | | $ 95,749 | | $ 100,968 | | $ 86,627 | | $ 75,495 | |
| Interest expense | 42,156 | | 54,313 | | 59,245 | | 42,635 | | 33,048 | |
| Net interest income | 43,768 | | 41,436 | | 41,723 | | 43,992 | | 42,447 | |
| Provision for loan losses | 48,672 | | 13,108 | | 5,078 | | 1,134 | | 1,641 | |
Net interest (expense) income after provision | (4,904 | ) | 28,328 | | 36,645 | | 42,858 | | 40,806 | |
| Loan servicing and other fees | 869 | | 1,776 | | 2,132 | | 2,572 | | 1,675 | |
| Gain on sale of loans, net | 16,971 | | 1,004 | | 9,318 | | 13,481 | | 18,706 | |
| Deposit account fees | 2,899 | | 2,954 | | 2,087 | | 2,093 | | 1,789 | |
| Net gain on sale of investment securities | 356 | | - | | - | | - | | 384 | |
| Net gain on sale of real estate held for investment | - | | - | | 2,313 | | 6,335 | | - | |
(Loss) gain on sale and operations of real estate owned acquired in the settlement of loans, net | (2,469 | ) | (2,683 | ) | (117 | ) | 20 | | - | |
| Other non-interest income | 1,583 | | 2,160 | | 1,828 | | 1,708 | | 1,864 | |
| Operating expenses | 29,980 | | 30,311 | | 34,631 | | 33,755 | | 33,341 | |
| (Loss) income before income taxes | (14,675 | ) | 3,228 | | 19,575 | | 35,312 | | 31,883 | |
| (Benefit) provision for income taxes | (7,236 | ) | 2,368 | | 9,124 | | 15,676 | | 14,077 | |
| Net (loss) income | $ (7,439 | ) | $ 860 | | $ 10,451 | | $ 19,636 | | $ 17,806 | |
| Basic (loss) earnings per share | $ (1.20 | ) | $ 0.14 | | $ 1.59 | | $ 2.93 | | $ 2.68 | |
| Diluted (loss) earnings per share | $ (1.20 | ) | $ 0.14 | | $ 1.57 | | $ 2.82 | | $ 2.49 | |
| Cash dividend per share | $ 0.16 | | $ 0.64 | | $ 0.69 | | $ 0.58 | | $ 0.52 | |
Financial Highlights
| | | At or For The Year Ended June 30, | | |
| | | 2009 | | 2008 | | 2007 | | 2006 | | 2005 | | |
| | | | | | | | | | | | | |
| KEY OPERATING RATIOS: | | | | | | | | | | | |
| | | | | | | | | | | | | |
| Performance Ratios | | | | | | | | | | | |
| | (Loss) return on average assets | (0.47 | )% | 0.05 | % | 0.61 | % | 1.24 | % | 1.19 | % | |
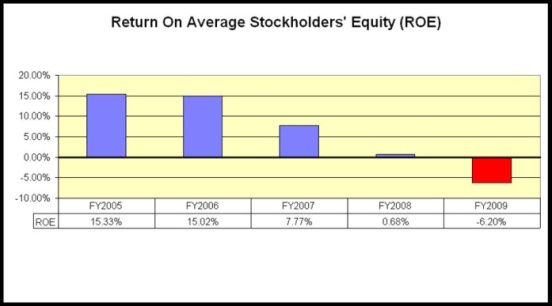
| | (Loss) return on average stockholders’ equity | (6.20 | ) | 0.68 | | 7.77 | | 15.02 | | 15.33 | | |
| | Interest rate spread | 2.68 | | 2.36 | | 2.23 | | 2.64 | | 2.80 | | |
| | Net interest margin | 2.86 | | 2.61 | | 2.51 | | 2.86 | | 2.95 | | |
| | Average interest-earning assets to average interest-bearing liabilities | 106.62 | | 107.35 | | 107.72 | | 107.99 | | 106.65 | | |
| | Operating and administrative expenses as a percentage of average total assets | 1.90 | | 1.87 | | 2.03 | | 2.13 | | 2.24 | | |
| | Efficiency ratio (1) | 46.86 | | 64.98 | | 58.42 | | 48.08 | | 49.86 | | |
| | Stockholders’ equity to total assets ratio | 7.27 | | 7.59 | | 7.81 | | 8.38 | | 7.52 | | |
| | Dividend payout ratio | NM | | 457.14 | | 43.95 | | 20.57 | | 20.88 | | |
| | | | | | | | | | | | | |
| Regulatory Capital Ratios | | | | | | | | | | | |
| | Tangible capital | 6.88 | % | 7.19 | % | 7.62 | % | 8.08 | % | 6.56 | % | |
| | Tier 1 leverage capital | 6.88 | | 7.19 | | 7.62 | | 8.08 | | 6.56 | | |
| | Total risk-based capital | 13.05 | | 12.25 | | 12.49 | | 13.37 | | 11.21 | | |
| | Tier 1 risk-based capital | 11.78 | | 10.99 | | 11.39 | | 12.36 | | 10.29 | | |
| | | | | | | | | | | | | |
| Asset Quality Ratios | | | | | | | | | | | |
| | Non-performing loans as a percentage of loans held for investment, net | 6.16 | % | 1.70 | % | 1.18 | % | 0.20 | % | 0.05 | % | |
| | Non-performing assets as a percentage of total assets | 5.59 | | 1.99 | | 1.20 | | 0.16 | | 0.04 | | |
| | Allowance for loan losses as a percentage of gross loans held for investment | 3.75 | | 1.43 | | 1.09 | | 0.81 | | 0.81 | | |
| | Allowance for loan losses as a percentage of non-performing loans | 63.28 | | 85.79 | | 93.32 | | 407.71 | | 1,561.86 | | |
| | Net charge-offs to average loans receivable, net | 1.72 | | 0.58 | | 0.04 | | - | | - | | |
| | | | | | | | | | | | | |
| (1) | Non-interest expense as a percentage of net interest income, before provision for loan losses, and non-interest income. |
Shareholder Information
ANNUAL MEETING
The annual meeting of shareholders will be held at the Riverside Art Museum at 3425 Mission Inn Avenue, Riverside, California on Tuesday, November 24, 2009 at 9:00 a.m. (Pacific). A formal notice of the meeting, together with a proxy statement and proxy form, will be mailed to shareholders.
CORPORATE OFFICE
Provident Financial Holdings, Inc.
3756 Central Avenue
Riverside, CA 92506
(951) 686-6060
INTERNET ADDRESS
www.myprovident.com
SPECIAL COUNSEL
Breyer & Associates PC
8180 Greensboro Drive, Suite 785
McLean, VA 22102
(703) 883-1100
INDEPENDENT REGISTERED PUBLIC ACCOUNTING FIRM
Deloitte & Touche LLP
350 South Grand Avenue, Suite 200
Los Angeles, CA 90071-3462
(213) 688-0800
TRANSFER AGENT
Registrar and Transfer Company
10 Commerce Drive
Cranford, NJ 07016
(908) 497-2300
MARKET INFORMATION
Provident Financial Holdings, Inc. is traded on the NASDAQ Global Select Market under the symbol PROV.
Shareholder Information
FINANCIAL INFORMATION
Requests for copies of the Form 10-K and Forms 10-Q filed with the Securities and Exchange Commission should be directed in writing to:
Donavon P. Ternes
Chief Operating Officer and Chief Financial Officer
Provident Financial Holdings, Inc.
3756 Central Avenue
Riverside, CA 92506
CORPORATE PROFILE
Provident Financial Holdings, Inc. (the “Corporation”), a Delaware corporation, was organized in January 1996 for the purpose of becoming the holding company for Provident Savings Bank, F.S.B. (the “Bank”) upon the Bank’s conversion from a federal mutual to a federal stock savings bank (“Conversion”). The Conversion was completed on June 27, 1996. The Corporation does not engage in any significant activity other than holding the stock of the Bank. The Bank serves the banking needs of select communities in Riverside and San Bernardino Counties and has mortgage lending operations in Southern and Northern California.
Board of Directors and Senior Officers
| Board of Directors | | Senior Officers |
| | | |
| Joseph P. Barr, CPA | | Provident Financial Holdings, Inc. |
| Principal | | |
| Swenson Accountancy Corporation | | Craig G. Blunden |
| | | Chairman, President and CEO |
| Bruce W. Bennett | | |
| President | | Donavon P. Ternes |
| Community Care & Rehabilitation Center | | Chief Operating Officer |
| | | Chief Financial Officer |
| Craig G. Blunden | | Corporate Secretary |
| Chairman, President and CEO | | |
| Provident Bank | | Provident Bank |
| | | |
| Debbi H. Guthrie | | Craig G. Blunden |
| Private Investor | | Chairman, President and CEO |
| | | |
| Robert G. Schrader | | Richard L. Gale |
| Retired Executive Vice President and COO | | Senior Vice President |
| Provident Bank | | Provident Bank Mortgage |
| | | |
| Roy H. Taylor | | Kathryn R. Gonzales |
| Chief Executive Officer | | Senior Vice President |
| Hub International of California | | Retail Banking |
| Insurance Services, Inc. | | |
| | | Lilian Salter |
| William E. Thomas | | Senior Vice President |
| Principal | | Chief Information Officer |
| William E. Thomas, Inc., | | |
| A Professional Law Corporation | | Donavon P. Ternes |
| | | Executive Vice President |
| | | Chief Operating Officer |
| | | Chief Financial Officer |
| | | Corporate Secretary |
| | | |
| | | David S. Weiant |
| | | Senior Vice President |
| | | Chief Lending Officer |
Provident Locations
| | |
| | | |
| RETAIL BANKING CENTERS | | WHOLESALE OFFICES |
| | | |
| Blythe | | Pleasanton |
| 350 E. Hobson Way | | 5934 Gibraltar Drive, Suite 102 |
| Blythe, CA 92225 | | Pleasanton, CA 94588 |
| | | |
| Canyon Crest | | Rancho Cucamonga |
| 5225 Canyon Crest Drive, Suite 86 | | 10370 Commerce Center Drive, Suite 200 |
| Riverside, CA 92507 | | Rancho Cucamonga, CA 91730 |
| | | |
| Corona | | RETAIL OFFICES |
| 487 Magnolia Avenue, Suite 101 | | |
| Corona, CA 92879 | | Glendora |
| | | 1200 E. Route 66, Suite 102 |
| Corporate Office | | Glendora, CA 91740 |
| 3756 Central Avenue | | |
| Riverside CA 92506 | | Indiana Avenue |
| | | 7111 Indiana Avenue, Suite 200 |
| Downtown Business Center | | Riverside, CA 92504 |
| 4001 Main Street | | |
| Riverside, CA 92501 | | Riverside |
| | | 6529 Riverside Avenue, Suite 160 |
| Hemet | | Riverside, CA 92506 |
| 1690 E. Florida Avenue | | |
| Hemet, CA 92544 | | |
| | | |
| Iris Plaza | | |
| 16110 Perris Boulevard, Suite K | | |
| Moreno Valley, CA 92551 | | |
| | | |
| La Sierra | | |
| 3312 La Sierra Avenue, Suite 105 | | |
| Riverside, CA 92503 | | |
| | | |
| Moreno Valley | | |
| 12460 Heacock Street | | |
| Moreno Valley, CA 92553 | | |
| | | |
| Orangecrest | | |
| 19348 Van Buren Boulevard, Suite 119 | | |
| Riverside, CA 92508 | | |
| | | |
| Rancho Mirage | | |
| 71-991 Highway 111 | | |
| Ranch Mirage, CA 92270 | | |
| | | |
| Redlands | | |
| 125 E. Citrus Avenue | | |
| Redlands, CA 92373 | | |
| | | |
| Sun City | | |
| 27010 Sun City Boulevard | | |
| Sun City, CA 92586 | | |
| | | |
| Temecula | | |
| 40325 Winchester Road | | |
| Temecula, CA 92591 | | |
| | | |
Customer Information 1-800-442-5201 or www.myprovident.com |

Corporate Office
3756 Central Avenue, Riverside, CA 92506
(951) 686-6060
www.myprovident.com
NASDAQ Global Select Market - PROV