EXHIBIT 13
2011 Annual Report to Stockholders
2011 Annual Report
Message From the Chairman
Dear Shareholders:
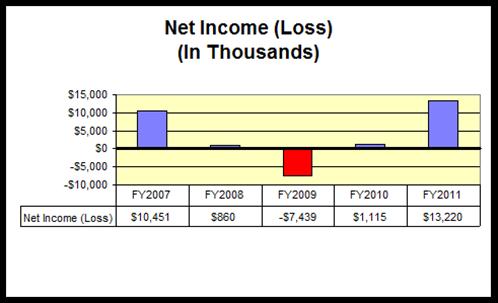
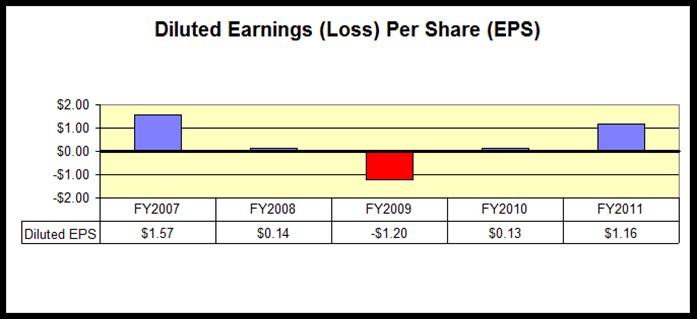
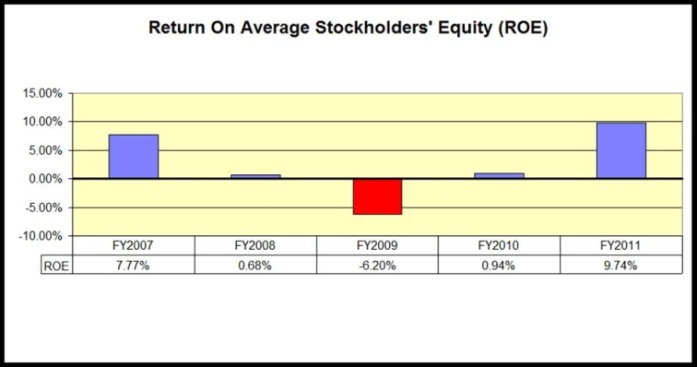
Wow, what a difference a year can make! I am pleased to forward our Annual Report for fiscal 2011, which describes significantly better financial results than those realized during the prior three years. The operating environment for financial institutions is somewhat improved in comparison to the particularly weak environment of the prior three years and we are well-positioned to take advantage of opportunities as they arise. Credit quality continues to improve and we have been capitalizing on favorable mortgage banking conditions resulting in a record year in terms of loans originated for sale. The materially lower provision for loan losses in fiscal 2011 in comparison to fiscal 2010 and the noteworthy increase in revenue from the gain on sale of loans led the way to our strong results. We reported net income of $13.2 million, or $1.16 per diluted share, and a return on equity of 9.7%, which is a solid performance in comparison to many of our peers.
Last year, when we were completing our fiscal 2011 Business Plan, it was apparent that the stubbornly poor general economic conditions would not necessarily be subsiding. As a result, our Business Plan for the Bank once again focused on enhancing capital, slightly deleveraging the balance sheet, addressing asset quality issues and maintaining the Bank’s “well-capitalized” regulatory capital designation. For Provident Bank Mortgage, the primary goal was to capture significant loan origination volume consistent with our forecast of a favorable mortgage banking environment and the investment we made in expanding our origination capacity.
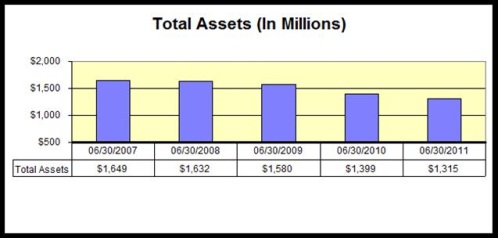
I am pleased to report that we succeeded in connection with all of these initiatives. Specifically, stockholders’ equity increased during fiscal 2011 by $14.0 million, primarily the result of our very good financial results; total assets declined by 6%, approximately half the rate of decline of the prior year; non-performing assets declined by a notable 38%; and the Bank’s capital ratios improved dramatically during the course of fiscal 2011 solidifying the “well-capitalized” regulatory capital designation.
Just as significant, in fiscal 2011, Provident Bank Mortgage originated over $2.1 billion of loans for sale, the best year in our 55 year history in terms of loan origination volume. Additionally, our loan sale margin expanded to 149 basis points from 77 basis points in fiscal 2010, primarily as the result of fewer competitors and the changing composition of loan originations with a larger percentage from the retail channel.
Provident Bank
Our fiscal 2012 Business Plan marks a return to our organic growth strategy although we are still mindful that the operating environment will remain challenging with many headwinds. We are investing in our preferred loan origination capabilities which we believe will result in the growth of our multi-family and commercial real estate loan portfolios. Retail deposit activity remains very important to us and we are forecasting modest deposit growth within our geographic footprint while we begin to explore new branch sites as we return to our de-novo branching strategy in the high growth communities of the Inland Empire. We also believe opportunistic transactions may become available in the markets we serve which we intend to explore as we continue to build our banking franchise.
During the course of fiscal 2012, we will emphasize prudent growth of loans held for investment, the growth of retail deposits (primarily transaction accounts), diligent operating expense control and sound capital management decisions (demonstrated by our recent announcement to increase the quarterly cash dividend to our shareholders and to implement a stock repurchase plan). We believe that successful execution of these strategies will deliver superior financial results which our shareholders have come to expect.
Provident Bank Mortgage
To date, fiscal 2012 mortgage banking fundamentals have been favorable. Mortgage interest rates have remained at very low levels (from a historical perspective) and competitors have been slow to enter the market as a result of tighter regulatory requirements which we believe is providing us with a competitive advantage. We are improving the percentage of retail originations in comparison to wholesale originations and will continue to do so. Increasing production from the retail channel is one of the best strategies for improving mortgage banking profitability. We are actively recruiting high producing originators from those non-regulated firms who are not as well-equipped to bear the potentially higher capital requirements, heightened regulatory scrutiny and more disciplined reporting requirements. Doing so will serve us well in fiscal 2012 and beyond because we believe that
Message From the Chairman
these originators will deliver high quality retail production volume in a very short period of time once they join our Company.
A Final Word
I began my message by suggesting that a year can make a world of difference regarding the financial results of our Company. Truth-be-told, we have endured one of the most trying economic and banking cycles in the 55 year history of Provident and, for us, it has lasted for approximately three years. Our successful emergence from this awful cycle would not have occurred without the diligent efforts of our employees, the exceptional loyalty of our customers from the communities we serve, and the steadfast support of our shareholders. To all of you, thank you for your continued support, patronage and patience. We recognize that our current and future financial results are inextricably linked to each of you and we will continue to do everything necessary at every opportunity to earn your respect, your business and your loyalty.
Sincerely,
Craig G. Blunden
Chairman and Chief Executive Officer
Message From the Chairman
Message From the Chairman
Message From the Chairman
The following tables set forth information concerning the consolidated financial position and results of operations of the Corporation and its subsidiary at the dates and for the periods indicated.
| | | At or For The Year Ended June 30, | |
| | | 2011 | | | 2010 | | | 2009 | | | 2008 | | | 2007 | |
| (In Thousands, Except Per Share Information ) | | | | | | | | | | | | | |
| | | | | | | | | | | | | | | | |
| FINANCIAL CONDITION DATA: | | | | | | | | | | | | | | | |
| Total assets | | $ | 1,314,549 | | | $ | 1,399,401 | | | $ | 1,579,613 | | | $ | 1,632,447 | | | $ | 1,648,923 | |
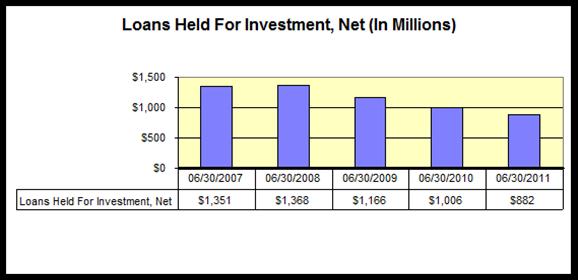
| Loans held for investment, net . | | | 881,610 | | | | 1,006,260 | | | | 1,165,529 | | | | 1,368,137 | | | | 1,350,696 | |
| Loans held for sale, at fair value | | | 191,678 | | | | 170,255 | | | | 135,490 | | | | - | | | | - | |
Loans held for sale, at lower of cost or market | | | - | | | | - | | | | 10,555 | | | | 28,461 | | | | 1,337 | |
| Receivable from sale of loans | | | - | | | | - | | | | - | | | | - | | | | 60,513 | |
| Cash and cash equivalents | | | 142,550 | | | | 96,201 | | | | 56,903 | | | | 15,114 | | | | 12,824 | |
| Investment securities | | | 26,193 | | | | 35,003 | | | | 125,279 | | | | 153,102 | | | | 150,843 | |
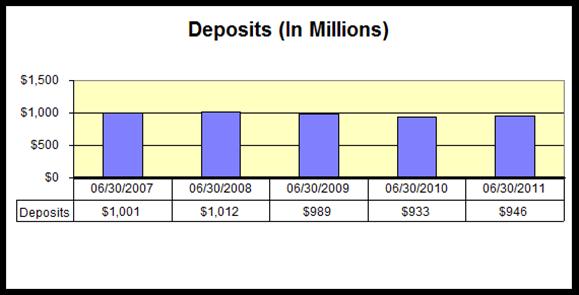
| Deposits | | | 945,767 | | | | 932,933 | | | | 989,245 | | | | 1,012,410 | | | | 1,001,397 | |
| Borrowings | | | 206,598 | | | | 309,647 | | | | 456,692 | | | | 479,335 | | | | 502,774 | |
| Stockholders’ equity | | | 141,743 | | | | 127,744 | | | | 114,910 | | | | 123,980 | | | | 128,797 | |
| Book value per share | | | 12.41 | | | | 11.20 | | | | 18.48 | | | | 19.97 | | | | 20.20 | |
| | | | | | | | | | | | | | | | | | | | | |
| OPERATING DATA: | | | | | | | | | | | | | | | | | | | | |
| Interest income | | $ | 58,689 | | | $ | 70,163 | | | $ | 85,924 | | | $ | 95,749 | | | $ | 100,968 | |
| Interest expense | | | 20,940 | | | | 30,585 | | | | 42,156 | | | | 54,313 | | | | 59,245 | |
| Net interest income | | | 37,749 | | | | 39,578 | | | | 43,768 | | | | 41,436 | | | | 41,723 | |
| Provision for loan losses | | | 5,465 | | | | 21,843 | | | | 48,672 | | | | 13,108 | | | | 5,078 | |
Net interest income (expense) after provision | | | 32,284 | | | | 17,735 | | | | (4,904 | ) | | | 28,328 | | | | 36,645 | |
| Loan servicing and other fees | | | 892 | | | | 797 | | | | 869 | | | | 1,776 | | | | 2,132 | |
| Gain on sale of loans, net | | | 31,194 | | | | 14,338 | | | | 16,971 | | | | 1,004 | | | | 9,318 | |
| Deposit account fees | | | 2,504 | | | | 2,823 | | | | 2,899 | | | | 2,954 | | | | 2,087 | |
| Net gain on sale of investment securities | | | - | | | | 2,290 | | | | 356 | | | | - | | | | - | |
Net gain on sale of real estate held for investment | | | - | | | | - | | | | - | | | | - | | | | 2,313 | |
(Loss) gain on sale and operations of real estate owned acquired in the settlement of loans, net | | | (1,351 | ) | | | 16 | | | | (2,469 | ) | | | (2,683 | ) | | | (117 | ) |
| Gain on sale of premises and equipment | | | 1,089 | | | | - | | | | - | | | | 6 | | | | - | |
| Card and processing fees | | | 1,274 | | | | 1,110 | | | | 825 | | | | 574 | | | | 566 | |
| Other non-interest income | | | 755 | | | | 885 | | | | 758 | | | | 1,580 | | | | 1,262 | |
| Operating expenses | | | 45,372 | | | | 38,139 | | | | 29,980 | | | | 30,311 | | | | 34,631 | |
| Income (loss) before income taxes | | | 23,269 | | | | 1,855 | | | | (14,675 | ) | | | 3,228 | | | | 19,575 | |
| Provision (benefit) for income taxes | | | 10,049 | | | | 740 | | | | (7,236 | ) | | | 2,368 | | | | 9,124 | |
| Net income (loss) | | $ | 13,220 | | | $ | 1,115 | | | $ | (7,439 | ) | | $ | 860 | | | $ | 10,451 | |
| Basic earnings (loss) per share | | $ | 1.16 | | | $ | 0.13 | | | $ | (1.20 | ) | | $ | 0.14 | | | $ | 1.59 | |
| Diluted earnings (loss) per share | | $ | 1.16 | | | $ | 0.13 | | | $ | (1.20 | ) | | $ | 0.14 | | | $ | 1.57 | |
| Cash dividend per share | | $ | 0.04 | | | $ | 0.04 | | | $ | 0.16 | | | $ | 0.64 | | | $ | 0.69 | |
| | | At or For The Year Ended June 30, | |
| | | 2011 | | | 2010 | | | 2009 | | | 2008 | | | 2007 | |
| | | | | | | | | | | | | | | | |
| KEY OPERATING RATIOS: | | | | | | | | | | | | | | | |
| | | | | | | | | | | | | | | | |
| Performance Ratios | | | | | | | | | | | | | | | |
| Return (loss) on average assets | | | 0.97 | % | | | 0.08 | % | | | (0.47 | )% | | | 0.05 | % | | | 0.61 | % |
| Return (loss) on average stockholders’ equity | | | 9.74 | | | | 0.94 | | | | (6.20 | ) | | | 0.68 | | | | 7.77 | |
| Interest rate spread | | | 2.76 | | | | 2.71 | | | | 2.68 | | | | 2.36 | | | | 2.23 | |
| Net interest margin | | | 2.90 | | | | 2.83 | | | | 2.86 | | | | 2.61 | | | | 2.51 | |
Average interest-earning assets to average interest-bearing liabilities | | | 108.31 | | | | 105.68 | | | | 106.62 | | | | 107.35 | | | | 107.72 | |
Operating and administrative expenses as a percentage of average total assets | | | 3.33 | | | | 2.61 | | | | 1.90 | | | | 1.87 | | | | 2.03 | |
Efficiency ratio (1) | | | 61.23 | | | | 61.68 | | | | 46.86 | | | | 64.98 | | | | 58.42 | |
| Stockholders’ equity to total assets ratio | | | 10.78 | | | | 9.13 | | | | 7.27 | | | | 7.59 | | | | 7.81 | |
| Dividend payout ratio | | | 3.45 | | | | 30.77 | | | NM | | | | 457.14 | | | | 43.95 | |
| | | | | | | | | | | | | | | | | | | | | |
| Regulatory Capital Ratios | | | | | | | | | | | | | | | | | | | | |
| Tangible capital | | | 10.53 | % | | | 8.82 | % | | | 6.88 | % | | | 7.19 | % | | | 7.62 | % |
| Core capital | | | 10.53 | | | | 8.82 | | | | 6.88 | | | | 7.19 | | | | 7.62 | |
| Total risk-based capital | | | 17.56 | | | | 13.17 | | | | 13.05 | | | | 12.25 | | | | 12.49 | |
| Tier 1 risk-based capital | | | 16.30 | | | | 11.91 | | | | 11.78 | | | | 10.99 | | | | 11.39 | |
| | | | | | | | | | | | | | | | | | | | | |
| Asset Quality Ratios | | | | | | | | | | | | | | | | | | | | |
Non-performing loans as a percentage of loans held for investment, net | | | 4.21 | % | | | 5.84 | % | | | 6.16 | % | | | 1.70 | % | | | 1.18 | % |
Non-performing assets as a percentage of total assets | | | 3.46 | | | | 5.25 | | | | 5.59 | | | | 1.99 | | | | 1.20 | |
Allowance for loan losses as a percentage of gross loans held for investment | | | 3.34 | | | | 4.14 | | | | 3.75 | | | | 1.43 | | | | 1.09 | |
Allowance for loan losses as a percentage of gross non-performing loans | | | 59.49 | | | | 56.78 | | | | 46.77 | | | | 67.01 | | | | 77.19 | |
| Net charge-offs to average loans receivable, net | | | 1.67 | | | | 1.96 | | | | 1.72 | | | | 0.58 | | | | 0.04 | |
| | | | | | | | | | | | | | | | | | | | | |
| (1) | Non-interest expense as a percentage of net interest income, before provision for loan losses, and non-interest income. |
ANNUAL MEETING
The annual meeting of shareholders will be held at the Riverside Art Museum at 3425 Mission Inn Avenue, Riverside, California on Tuesday, November 29, 2011 at 11:00 a.m. (Pacific). A formal notice of the meeting, together with a proxy statement and proxy form, will be mailed to shareholders.
CORPORATE OFFICE
Provident Financial Holdings, Inc.
3756 Central Avenue
Riverside, CA 92506
(951) 686-6060
INTERNET ADDRESS
www.myprovident.com
SPECIAL COUNSEL
Breyer & Associates PC
8180 Greensboro Drive, Suite 785
McLean, VA 22102
(703) 883-1100
INDEPENDENT REGISTERED PUBLIC ACCOUNTING FIRM
Deloitte & Touche LLP
350 South Grand Avenue, Suite 200
Los Angeles, CA 90071-3462
(213) 688-0800
TRANSFER AGENT
Registrar and Transfer Company
10 Commerce Drive
Cranford, NJ 07016
(908) 497-2300
MARKET INFORMATION
Provident Financial Holdings, Inc. is traded on the NASDAQ Global Select Market under the symbol PROV.
Shareholder Information
FINANCIAL INFORMATION
Requests for copies of the Form 10-K and Forms 10-Q filed with the Securities and Exchange Commission should be directed in writing to:
Donavon P. Ternes
President, COO and CFO
Provident Financial Holdings, Inc.
3756 Central Avenue
Riverside, CA 92506
CORPORATE PROFILE
Provident Financial Holdings, Inc. (the “Corporation”), a Delaware corporation, was organized in January 1996 for the purpose of becoming the holding company for Provident Savings Bank, F.S.B. (the “Bank”) upon the Bank’s conversion from a federal mutual to a federal stock savings bank (“Conversion”). The Conversion was completed on June 27, 1996. The Corporation does not engage in any significant activity other than holding the stock of the Bank. The Bank serves the banking needs of select communities in Riverside and San Bernardino Counties and has mortgage lending operations in Southern and Northern California.
Board of Directors and Senior Officers
| Board of Directors | | Senior Officers |
| | | |
| Joseph P. Barr, CPA | | Provident Financial Holdings, Inc. |
| Principal | | |
| Swenson Accountancy Corporation | | Craig G. Blunden |
| | | Chairman |
| Bruce W. Bennett | | Chief Executive Officer |
| Retired Health Care Executive | | |
| Private Investor | | Donavon P. Ternes |
| | | President |
| Craig G. Blunden | | Chief Operating Officer |
| Chairman and Chief Executive Officer | | Chief Financial Officer |
| Provident Bank | | Corporate Secretary |
| | | |
| Debbi H. Guthrie | | Provident Bank |
| Retired Business Owner | | |
| Private Investor | | Craig G. Blunden |
| | | Chairman |
| Robert G. Schrader | | Chief Executive Officer |
| Retired Executive Vice President | | |
| and Chief Operating Officer | | Richard L. Gale |
| Provident Bank | | Senior Vice President |
| | | Provident Bank Mortgage |
| Roy H. Taylor | | |
| Chief Executive Officer | | Kathryn R. Gonzales |
| Hub International of California | | Senior Vice President |
| Insurance Services, Inc. | | Retail Banking |
| | | |
| William E. Thomas, Esq. | | Lilian Salter |
| Principal | | Senior Vice President |
| William E. Thomas, Inc., | | Chief Information Officer |
| A Professional Law Corporation | | |
| | | Donavon P. Ternes |
| | | President |
| | | Chief Operating Officer |
| | | Chief Financial Officer |
| | | Corporate Secretary |
| | | |
| | | David S. Weiant |
| | | Senior Vice President |
| | | Chief Lending Officer |
Provident Locations
| | |
| | | |
| RETAIL BANKING CENTERS | | WHOLESALE MORTGAGE OFFICES |
| | | |
| Blythe | | Pleasanton |
| 350 E. Hobson Way | | 5934 Gibraltar Drive, Suite 102 |
| Blythe, CA 92225 | | Pleasanton, CA 94588 |
| | | |
| Canyon Crest | | Rancho Cucamonga |
| 5225 Canyon Crest Drive, Suite 86 | | 10370 Commerce Center Drive, Suite 200 |
| Riverside, CA 92507 | | Rancho Cucamonga, CA 91730 |
| | | |
| Corona | | |
| 487 Magnolia Avenue, Suite 101 | | RETAIL MORTGAGE OFFICES |
| Corona, CA 92879 | | |
| | | City of Industry |
| Corporate Office | | 18725 East Gale Avenue, Suite 100 |
| 3756 Central Avenue | | City of Industry, CA 91748 |
| Riverside CA 92506 | | |
| | | Dublin |
| Downtown Business Center | | 7567 Amador Valley Boulevard, Suite 210 |
| 4001 Main Street | | Dublin CA 94568 |
| Riverside, CA 92501 | | |
| | | Escondido |
| Hemet | | 362 West Mission Avenue, Suite 200 |
| 1690 E. Florida Avenue | | Escondido, CA 92025 |
| Hemet, CA 92544 | | |
| | | Glendora |
| Iris Plaza | | 1200 E. Route 66, Suite 102 |
| 16110 Perris Boulevard, Suite K | | Glendora, CA 91740 |
| Moreno Valley, CA 92551 | | |
| | | Hermosa Beach |
| La Sierra | | 1601 Pacific Coast Hwy, Suite 290 |
| 3312 La Sierra Avenue, Suite 105 | | Hermosa Beach, CA 90254 |
| Riverside, CA 92503 | | |
| | | Rancho Cucamonga |
| Moreno Valley | | 8599 Haven Avenue, Suite 210 |
| 12460 Heacock Street | | Rancho Cucamonga, CA 91730 |
| Moreno Valley, CA 92553 | | |
| | | Riverside, Canyon Crest Drive |
| Orangecrest | | 5225 Canyon Crest Drive, Suite 86 |
| 19348 Van Buren Boulevard, Suite 119 | | Riverside, CA 92507 |
| Riverside, CA 92508 | | |
| | | Riverside, Indiana Avenue |
| Rancho Mirage | | 7111 Indiana Avenue, Suite 200 |
| 71-991 Highway 111 | | Riverside, CA 92504 |
| Ranch Mirage, CA 92270 | | |
| | | Riverside, Market Street |
| Redlands | | 2280 Market Street, Suite 230 |
| 125 E. Citrus Avenue | | Riverside, CA 92501 |
| Redlands, CA 92373 | | |
| | | Riverside, Riverside Avenue |
| Sun City | | 6529 Riverside Avenue, Suite 160 |
| 27010 Sun City Boulevard | | Riverside, CA 92506 |
| Sun City, CA 92586 | | |
| | | |
| Temecula | | |
| 40705 Winchester Road, Suite 6 | | |
| Temecula, CA 92591 | | |
| | | |
Customer Information 1-800-442-5201 or www.myprovident.com |
Corporate Office
3756 Central Avenue, Riverside, CA 92506
(951) 686-6060
www.myprovident.com
NASDAQ Global Select Market - PROV