EXHIBIT 13
2013 Annual Report to Stockholders
2013 Annual Report
Message From the Chairman
Dear Shareholders:
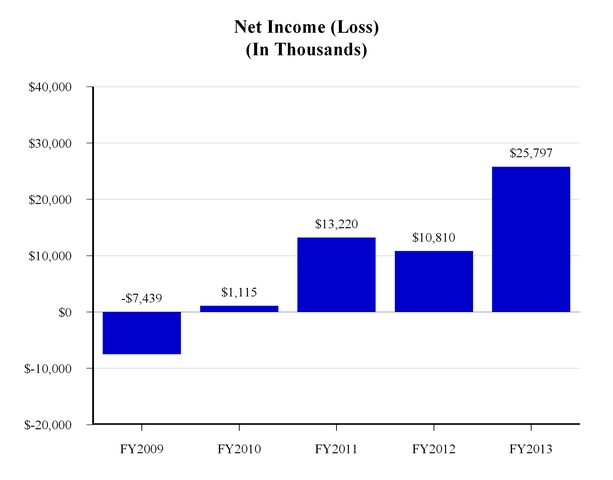
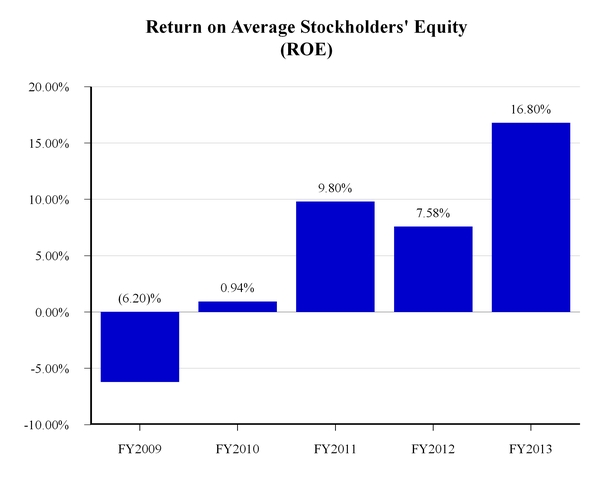
It is my pleasure to forward our Annual Report for fiscal 2013, which describes a record year for our company in terms of net income and significantly improved financial metrics such as strong regulatory capital ratios, considerable levels of liquidity in the form of cash and cash equivalents, and greatly improved asset quality ratios, establishing a formidable foundation for future growth. We are prepared for the return of better economic conditions and can quickly capitalize on an improving banking environment. For fiscal 2013, we reported net income of $25.8 million, diluted earnings per share of $2.38, and a return on equity of 16.8%, which is a superior performance in comparison to many of our peers.
Last year, when we were developing our fiscal 2013 Business Plan, we were encouraged that sustainable, organic growth may be attainable from our community banking business and that the investment we had been making in the mortgage banking business would pay off handsomely. Of course our forecast was predicated on the return of improving general economic conditions and a better banking environment. Unfortunately, general economic conditions while somewhat improved, did not improve sufficiently for us to meet our more aggressive growth goals; however the tepid economic conditions contained a silver lining for us, the protracted and very favorable mortgage banking environment, which was largely responsible for our record earnings. The fiscal 2013 Business Plan for Provident Bank forecast growth in loans held for investment, growth in retail deposits (primarily core deposits), control of operating expenses, and sound capital management decisions. For Provident Bank Mortgage, we established goals to increase the percentage of origination volume from the retail channel, to closely manage our loan sale margin and to respond quickly to deteriorating mortgage banking fundamentals should they arise.
I am pleased to report that we have made progress in all of these initiatives although more progress in some areas than others. Specifically, loan originations and purchases for the held for investment portfolio were $94.1 million in fiscal 2013, a 63% increase from $57.8 million in fiscal 2012, unfortunately very high principal repayments prevented us from achieving the net growth goal; we increased the core deposits balance by 1% at June 30, 2013 from the same date last year, less than what we intended but progress nonetheless; operating expenses while higher than last year were still well controlled as demonstrated by a 62% efficiency ratio in comparison to 69% last year; and, we increased the quarterly cash dividend to $0.10 per share while repurchasing 571,087 shares of our common stock and strengthening our regulatory capital ratios.
Additionally, in fiscal 2013, Provident Bank Mortgage originated $3.5 billion of loans for sale, the best year in our 57 year history in terms of loan origination volume. Also, we increased our retail loan origination volume to 48% of loans originated for sale from 40% last year, our loan sale margin expanded to 194 basis points from 149 basis points and mortgage banking fundamentals were favorable during much of the year.
Provident Bank
Our fiscal 2014 Business Plan outlines a similar growth strategy to last year combined with a capital management plan where we recognize that growth may be difficult given the uncertain economic climate and less than desirable banking environment. We intend to grow the bank but will remain disciplined in our execution returning capital to shareholders in the form of cash dividends and common stock repurchases if we believe the growth opportunities carry excessive risk. We will continue to invest in our preferred loan origination capabilities and retail deposit platform primarily within our geographic footprint.
Similar to last year, during the course of fiscal 2014, we will emphasize prudent increases in loans held for investment, the growth of retail deposits (primarily transaction accounts), diligent control of operating expenses and sound capital management decisions. We believe that successful execution of these strategies will enhance our franchise value while limiting our risk profile.
Provident Bank Mortgage
Mortgage interest rates remain at very low levels (from a historical perspective) but are higher today than last year at this time, rising very quickly over the last four months or so. As a result, current refinance activity has fallen from the elevated levels of last year suggesting that mortgage banking fundamentals are deteriorating to some degree. We expect fiscal 2014 to be a year of transition, from an exceptional mortgage banking environment to one that requires meaningful changes to our mortgage banking operating model. We will change our product offerings commensurate with the changing market; we will continue our focus on purchase money originations versus refinance originations; we will lower our operating expenses consistent with a declining loan origination volume and narrowing loan sale margin; and we will respond to significant changes in regulatory requirements currently scheduled to take effect in January 2014.
A Final Word
I hope that when you review our Annual Report it generates the same sense of pride in each of you that it does for me. These days it seems, subsequent to the Great Recession, I am often struck with this sense of pride. It can strike when I'm attending the 40th anniversary celebration of our longest tenured banking professional; attending a meeting of a local non-profit organization to award a much needed donation; driving past a remodeled commercial building knowing that we provided the financing to the
owner who needed to expand his facility after landing a new contract; or driving through a neighborhood of single-family homes representative of the homes we lend on so families can fulfill their dreams of home ownership. I am proud of our community banking heritage; of helping businesses and families prosper, of supporting the communities we serve; of providing well-paying careers to our dedicated employees; and proud to report above average financial returns to our shareholders.
In closing, I wish to thank our staff of banking professionals for the exceptional year they delivered and express my appreciation for the support we receive from customers in the communities we serve and the trust bestowed upon us by our shareholders as we endeavor to continually enhance the franchise value of the company.
Sincerely,
Craig G. Blunden
Chairman and Chief Executive Officer
Financial Highlights
The following tables set forth information concerning the consolidated financial position and results of operations of the Corporation and its subsidiary at the dates and for the periods indicated.
|
| | | | | | | | | | | | | | | | | | | | |
| | | At or For The Year Ended June 30, |
| | | 2013 | | 2012 | | 2011 | | 2010 | | 2009 |
| (In Thousands, Except Per Share Information ) | | | | | | | | |
| FINANCIAL CONDITION DATA: | | | | | | | | | | |
| Total assets | | $ | 1,211,041 |
| | $ | 1,260,917 |
| | $ | 1,313,724 |
| | $ | 1,398,576 |
| | $ | 1,578,788 |
|
| Loans held for investment, net | | 748,397 |
| | 796,836 |
| | 881,610 |
| | 1,006,260 |
| | 1,165,529 |
|
| Loans held for sale, at fair value | | 188,050 |
| | 231,639 |
| | 191,678 |
| | 170,255 |
| | 135,490 |
|
Loans held for sale, at lower of cost or market | | - |
| | - |
| | - |
| | - |
| | 10,555 |
|
| Cash and cash equivalents | | 193,839 |
| | 145,136 |
| | 142,550 |
| | 96,201 |
| | 56,903 |
|
| Investment securities | | 19,510 |
| | 22,898 |
| | 26,193 |
| | 35,003 |
| | 125,279 |
|
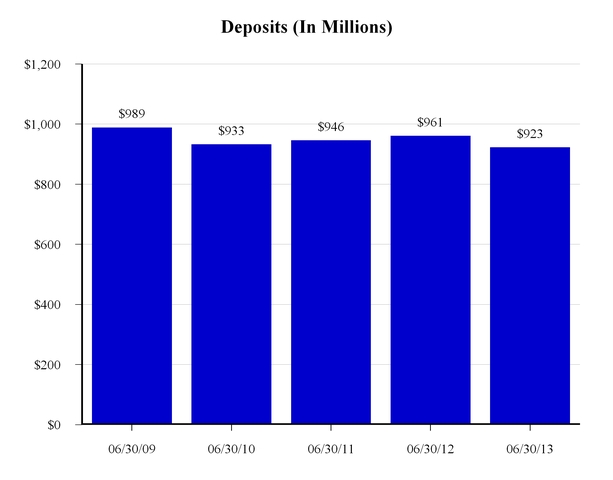
| Deposits | | 923,010 |
| | 961,411 |
| | 945,767 |
| | 932,933 |
| | 989,245 |
|
| Borrowings | | 106,491 |
| | 126,546 |
| | 206,598 |
| | 309,647 |
| | 456,692 |
|
| Stockholders’ equity | | 159,974 |
| | 144,777 |
| | 140,918 |
| | 126,919 |
| | 114,085 |
|
| Book value per share | | 15.40 |
| | 13.34 |
| | 12.34 |
| | 11.13 |
| | 18.34 |
|
| OPERATING DATA: | | |
| | |
| | |
| | |
| | |
|
| Interest income | | $ | 44,161 |
| | $ | 51,435 |
| | $ | 58,689 |
| | $ | 70,163 |
| | $ | 85,924 |
|
| Interest expense | | 10,804 |
| | 14,705 |
| | 20,940 |
| | 30,585 |
| | 42,156 |
|
| Net interest income | | 33,357 |
| | 36,730 |
| | 37,749 |
| | 39,578 |
| | 43,768 |
|
| (Recovery) provision for loan losses | | (1,499 | ) | | 5,777 |
| | 5,465 |
| | 21,843 |
| | 48,672 |
|
| Net interest income (expense) after (recovery) provision for loan losses | | 34,856 |
| | 30,953 |
| | 32,284 |
| | 17,735 |
| | (4,904 | ) |
| Loan servicing and other fees | | 1,093 |
| | 733 |
| | 892 |
| | 797 |
| | 869 |
|
| Gain on sale of loans, net | | 68,493 |
| | 38,017 |
| | 31,194 |
| | 14,338 |
| | 16,971 |
|
| Deposit account fees | | 2,449 |
| | 2,438 |
| | 2,504 |
| | 2,823 |
| | 2,899 |
|
| Net gain on sale of investment securities | | — |
| | — |
| | — |
| | 2,290 |
| | 356 |
|
Gain (loss) on sale and operations of real estate owned acquired in the settlement of loans, net | | 916 |
| | (120 | ) | | (1,351 | ) | | 16 |
| | (2,469 | ) |
| Gain on sale of premises and equipment | | — |
| | — |
| | 1,089 |
| | — |
| | — |
|
| Card and processing fees | | 1,292 |
| | 1,282 |
| | 1,274 |
| | 1,110 |
| | 825 |
|
| Other non-interest income | | 957 |
| | 800 |
| | 755 |
| | 885 |
| | 758 |
|
| Operating expenses | | 67,343 |
| | 55,365 |
| | 45,372 |
| | 38,139 |
| | 29,980 |
|
| Income (loss) before income taxes | | 42,713 |
| | 18,738 |
| | 23,269 |
| | 1,855 |
| | (14,675 | ) |
| Provision (benefit) for income taxes | | 16,916 |
| | 7,928 |
| | 10,049 |
| | 740 |
| | (7,236 | ) |
| Net income (loss) | | $ | 25,797 |
| | $ | 10,810 |
| | $ | 13,220 |
| | $ | 1,115 |
| | $ | (7,439 | ) |
| Basic earnings (loss) per share | | $ | 2.43 |
| | $ | 0.96 |
| | $ | 1.16 |
| | $ | 0.13 |
| | $ | (1.20 | ) |
| Diluted earnings (loss) per share | | $ | 2.38 |
| | $ | 0.96 |
| | $ | 1.16 |
| | $ | 0.13 |
| | $ | (1.20 | ) |
| Cash dividend per share | | $ | 0.24 |
| | $ | 0.14 |
| | $ | 0.04 |
| | $ | 0.04 |
| | $ | 0.16 |
|
Financial Highlights
|
| | | | | | | | | | | | | | | |
| | | At or For The Year Ended June 30, |
| | | 2013 | | 2012 | | 2011 | | 2010 | | 2009 |
| KEY OPERATING RATIOS: | | | | | | | | | | |
| Performance Ratios | | | | | | | | | | |
| Return (loss) on average assets | | 2.09 | % | | 0.84 | % | | 0.97 | % | | 0.08 | % | | (0.47 | )% |
| Return (loss) on average stockholders’ equity | | 16.80 |
| | 7.58 |
| | 9.80 |
| | 0.94 |
| | (6.20 | ) |
| Interest rate spread | | 2.69 |
| | 2.83 |
| | 2.76 |
| | 2.71 |
| | 2.68 |
|
| Net interest margin | | 2.80 |
| | 2.95 |
| | 2.90 |
| | 2.83 |
| | 2.86 |
|
| Average interest-earning assets to average interest-bearing liabilities | | 112.46 |
| | 110.53 |
| | 108.31 |
| | 105.68 |
| | 106.62 |
|
| Operating and administrative expenses as a percentage of average total assets | | 5.44 |
| | 4.29 |
| | 3.33 |
| | 2.61 |
| | 1.90 |
|
Efficiency ratio (1) | | 62.03 |
| | 69.31 |
| | 61.23 |
| | 61.68 |
| | 46.86 |
|
| Stockholders’ equity to total assets ratio | | 13.21 |
| | 11.48 |
| | 10.73 |
| | 9.07 |
| | 7.23 |
|
| Dividend payout ratio | | 10.08 |
| | 14.58 |
| | 3.45 |
| | 30.77 |
| | NM |
| Regulatory Capital Ratios | | |
| | |
| | |
| | |
| | |
|
| Tier 1 leverage capital ratio | | 13.12 | % | | 11.26 | % | | 10.47 | % | | 8.77 | % | | 6.83 | % |
| Tier 1 risk-based capital ratio | | 21.36 |
| | 17.53 |
| | 16.22 |
| | 11.83 |
| | 11.70 |
|
| Total risk-based capital ratio | | 22.64 |
| | 18.79 |
| | 17.48 |
| | 13.10 |
| | 12.97 |
|
| Asset Quality Ratios | | |
| | |
| | |
| | |
| | |
|
| Non-performing loans as a percentage of loans held for investment, net | | 2.90 | % | | 4.33 | % | | 4.21 | % | | 5.84 | % | | 6.16 | % |
| Non-performing assets as a percentage of total assets | | 1.98 |
| | 3.17 |
| | 3.46 |
| | 5.25 |
| | 5.59 |
|
| Allowance for loan losses as a percentage of gross loans held for investment | | 1.96 |
| | 2.63 |
| | 3.34 |
| | 4.14 |
| | 3.75 |
|
| Allowance for loan losses as a percentage of gross non-performing loans | | 58.77 |
| | 52.45 |
| | 59.49 |
| | 56.78 |
| | 46.77 |
|
| Net charge-offs to average loans receivable, net | | 0.51 |
| | 1.38 |
| | 1.67 |
| | 1.96 |
| | 1.72 |
|
| |
(1) | Non-interest expense as a percentage of net interest income and non-interest income. |
Shareholder Information
ANNUAL MEETING
The annual meeting of shareholders will be held at the Riverside Art Museum at 3425 Mission Inn Avenue, Riverside, California on Tuesday, November 26, 2013 at 11:00 a.m. (Pacific). A formal notice of the meeting, together with a proxy statement and proxy form, will be mailed to shareholders.
CORPORATE OFFICE
Provident Financial Holdings, Inc.
3756 Central Avenue
Riverside, CA 92506
(951) 686-6060
INTERNET ADDRESS
www.myprovident.com
SPECIAL COUNSEL
Breyer & Associates PC
8180 Greensboro Drive, Suite 785
McLean, VA 22102
(703) 883-1100
INDEPENDENT REGISTERED PUBLIC ACCOUNTING FIRM
Deloitte & Touche LLP
350 South Grand Avenue, Suite 200
Los Angeles, CA 90071-3462
(213) 688-0800
TRANSFER AGENT
Registrar and Transfer Company
10 Commerce Drive
Cranford, NJ 07016
(908) 497-2300
MARKET INFORMATION
Provident Financial Holdings, Inc. is traded on the NASDAQ Global Select Market under the symbol PROV.
FINANCIAL INFORMATION
Requests for copies of the Form 10-K and Forms 10-Q filed with the Securities and Exchange Commission should be directed in writing to:
Donavon P. Ternes
President, COO and CFO
Provident Financial Holdings, Inc.
3756 Central Avenue
Riverside, CA 92506
CORPORATE PROFILE
Provident Financial Holdings, Inc. (the “Corporation”), a Delaware corporation, was organized in January 1996 for the purpose of becoming the holding company for Provident Savings Bank, F.S.B. (the “Bank”) upon the Bank’s conversion from a federal mutual to a federal stock savings bank (“Conversion”). The Conversion was completed on June 27, 1996. The Corporation does not engage in any significant activity other than holding the stock of the Bank. The Bank serves the banking needs of select communities in Riverside and San Bernardino Counties and has mortgage lending operations in Southern and Northern California.
Board of Directors and Senior Officers
|
| | |
| Board of Directors | | Senior Officers |
| | | |
| Joseph P. Barr, CPA | | Provident Financial Holdings, Inc. |
| Principal | | |
| Swenson Accountancy Corporation | | Craig G. Blunden |
| | | Chairman |
| Bruce W. Bennett | | Chief Executive Officer |
| Retired Health Care Executive | | |
| Private Investor | | Donavon P. Ternes |
| | | President |
| Craig G. Blunden | | Chief Operating Officer |
| Chairman and Chief Executive Officer | | Chief Financial Officer |
| Provident Financial Holdings, Inc. | | Corporate Secretary |
| Provident Bank | | |
| | | Provident Bank |
| Judy A. Carpenter | | |
| President and Chief Operating Officer | | Craig G. Blunden |
| Riverside Medical Clinic | | Chairman |
| | | Chief Executive Officer |
| Debbi H. Guthrie | | |
| Senior Vice President | | Richard L. Gale |
| Raincross Hospitality Corporation | | Senior Vice President |
| | | Provident Bank Mortgage |
| Roy H. Taylor | | |
| Chief Executive Officer | | Kathryn R. Gonzales |
| Hub International of California | | Senior Vice President |
| Insurance Services, Inc. | | Retail Banking |
| | | |
| William E. Thomas, Esq. | | Deborah L. Hill |
| Principal | | Senior Vice President |
| William E. Thomas, Inc., | | Chief Human Resources and |
| A Professional Law Corporation | | Administrative Officer |
| | | |
| | | Lilian Salter |
| | | Senior Vice President |
| | | Chief Information Officer |
| | | |
| | | Donavon P. Ternes |
| | | President |
| | | Chief Operating Officer |
| | | Chief Financial Officer |
| | | Corporate Secretary |
| | | |
| | | David S. Weiant |
| | | Senior Vice President |
| | | Chief Lending Officer |
Provident Locations
|
| | |
| | |
| | | |
| RETAIL BANKING CENTERS | | WHOLESALE MORTGAGE OFFICES |
| | | |
| Blythe | | Pleasanton |
| 350 E. Hobson Way | | 5934 Gibraltar Drive, Suite 102 |
| Blythe, CA 92225 | | Pleasanton, CA 94588 |
| | | |
| Canyon Crest | | Rancho Cucamonga |
| 5225 Canyon Crest Drive, Suite 86 | | 10370 Commerce Center Drive, Suite 200 |
| Riverside, CA 92507 | | Rancho Cucamonga, CA 91730 |
| | | |
| Corona | | |
| 487 Magnolia Avenue, Suite 101 | | RETAIL MORTGAGE OFFICES |
| Corona, CA 92879 | | |
| | | City of Industry |
| Corporate Office | | 18725 East Gale Avenue, Suite 100 |
| 3756 Central Avenue | | City of Industry, CA 91748 |
| Riverside CA 92506 | | |
| | | Escondido |
| Downtown Business Center | | 362 West Mission Avenue, Suite 200 |
| 4001 Main Street | | Escondido, CA 92025 |
| Riverside, CA 92501 | | |
| | | Fairfield |
| Hemet | | 5030 Business Center Drive, Suite 330 |
| 1690 E. Florida Avenue | | Fairfield, CA 94534 |
| Hemet, CA 92544 | | |
| | | Glendora |
| Iris Plaza | | 1200 E. Route 66, Suite 102 |
| 16110 Perris Boulevard, Suite K | | Glendora, CA 91740 |
| Moreno Valley, CA 92551 | | |
| | | Hermosa Beach |
| La Quinta | | 1601 Pacific Coast Hwy., Suite 290 |
| 78752 Highway 111 | | Hermosa Beach, CA 90254 |
| La Quinta, CA 92253 | | |
| | | Pleasanton |
| La Sierra | | 5934 Gibraltar Drive, Suite 100 |
| 3312 La Sierra Avenue, Suite 105 | | Pleasanton, CA 94588 |
| Riverside, CA 92503 | | |
| | | Rancho Cucamonga, Haven Avenue |
| Moreno Valley | | 8599 Haven Avenue, Suite 210 |
| 12460 Heacock Street | | Rancho Cucamonga, CA 91730 |
| Moreno Valley, CA 92553 | | |
|
| | |
| | | Rancho Cucamonga, Commerce Center Drive |
| Orangecrest | | 10370 Commerce Center Drive, Suite 110 |
| 19348 Van Buren Boulevard, Suite 119 | | Rancho Cucamonga, CA 91730 |
| Riverside, CA 92508 | | |
| | | Riverside, Canyon Crest Drive |
| Rancho Mirage | | 5225 Canyon Crest Drive, Suite 86 |
| 71991 Highway 111 | | Riverside, CA 92507 |
| Ranch Mirage, CA 92270 | | |
| | | Riverside, Indiana Avenue |
| Redlands | | 7111 Indiana Avenue, Suite 200 |
| 125 E. Citrus Avenue | | Riverside, CA 92504 |
| Redlands, CA 92373 | | |
| | | Riverside, Market Street |
| Sun City | | 2280 Market Street, Suite 230 |
| 27010 Sun City Boulevard | | Riverside, CA 92501 |
| Sun City, CA 92586 | | |
| | | Riverside, Riverside Avenue |
| Temecula | | 6529 Riverside Avenue, Suite 160 |
| 40705 Winchester Road, Suite 6 | | Riverside, CA 92506 |
| Temecula, CA 92591 | | |
| | | Roseville |
| | | 2998 Douglas Boulevard, Suite 105 |
| | | Roseville, CA 95661 |
| | | |
| | | San Diego |
| | | 362 W. Mission Avenue, Suite 207 |
| | | Escondido, CA 92025 |
| | | |
| | | San Rafael |
| | | 4040 Civic Center Drive, Suite 200 |
| | | San Rafael, CA 94903 |
| | | |
| | | Santa Barbara |
| | | 3710 State Street, Suite B
|
| | | Santa Barbara, CA 93105 |
| | | |
| | | Stockton |
| | | 3443 Dear Park, Suite C |
| | | Stockton, CA 95219 |
| | | |
| | | Westlake Village |
| | | 2659 Townsgate Road, Suite 105 |
| | | Westlake Village, CA 91361 |
| | | |
Customer Information 1-800-442-5201 or www.myprovident.com |
Corporate Office
3756 Central Avenue, Riverside, CA 92506
(951) 686-6060
www.myprovident.com
NASDAQ Global Select Market - PROV