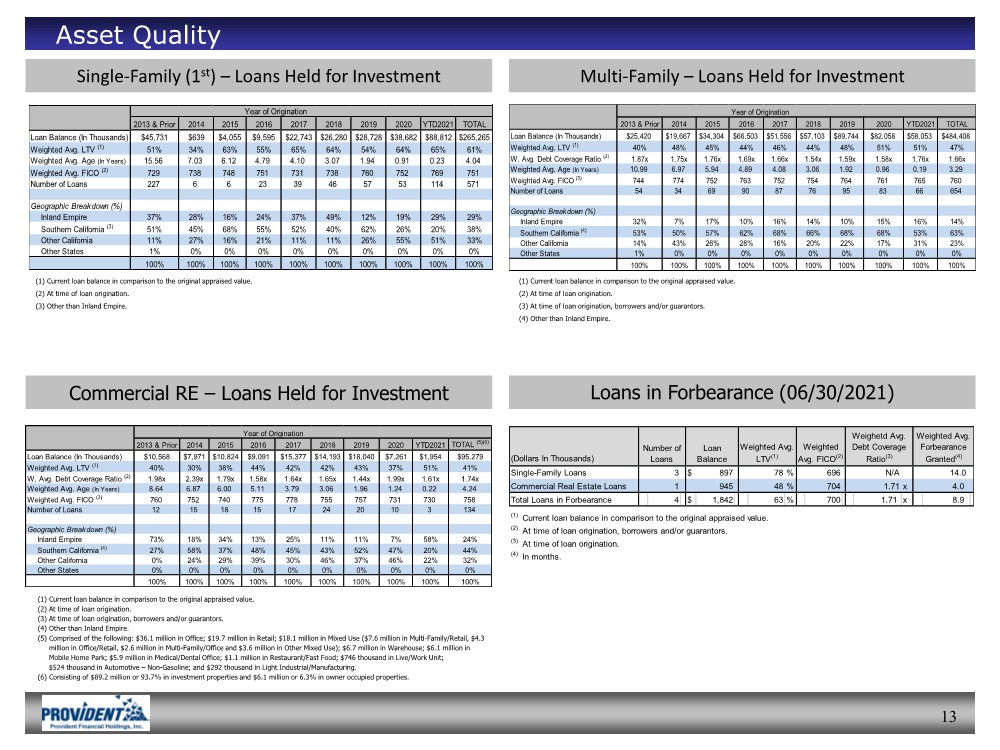
| 13 Asset Quality Single-Family (1st) – Loans Held for Investment Commercial RE – Loans Held for Investment Multi-Family – Loans Held for Investment Loans in Forbearance (06/30/2021) (1) Current loan balance in comparison to the original appraised value. (2) At time of loan origination. (3) Other than Inland Empire. (1) Current loan balance in comparison to the original appraised value. (2) At time of loan origination. (3) At time of loan origination, borrowers and/or guarantors. (4) Other than Inland Empire. (1) Current loan balance in comparison to the original appraised value. (2) At time of loan origination. (3) At time of loan origination, borrowers and/or guarantors. (4) Other than Inland Empire. (5) Comprised of the following: $36.1 million in Office; $19.7 million in Retail; $18.1 million in Mixed Use ($7.6 million in Multi-Family/Retail, $4.3 million in Office/Retail, $2.6 million in Multi-Family/Office and $3.6 million in Other Mixed Use); $6.7 million in Warehouse; $6.1 million in Mobile Home Park; $5.9 million in Medical/Dental Office; $1.1 million in Restaurant/Fast Food; $746 thousand in Live/Work Unit; $524 thousand in Automotive – Non-Gasoline; and $292 thousand in Light Industrial/Manufacturing. (6) Consisting of $89.2 million or 93.7% in investment properties and $6.1 million or 6.3% in owner occupied properties. 2013 & Prior 2014 2015 2016 2017 2018 2019 2020 YTD2021 TOTAL Loan Balance (In Thousands) $45,731 $639 $4,055 $9,595 $22,743 $26,280 $28,728 $38,682 $88,812 $265,265 Weighted Avg. LTV (1) 51% 34% 63% 55% 65% 64% 54% 64% 65% 61% Weighted Avg. Age (In Years) 15.56 7.03 6.12 4.79 4.10 3.07 1.94 0.91 0.23 4.04 Weighted Avg. FICO (2) 729 738 748 751 731 738 760 752 769 751 Number of Loans 227 6 6 23 39 46 57 53 114 571 Geographic Breakdown (%) Inland Empire 37% 28% 16% 24% 37% 49% 12% 19% 29% 29% Southern California (3) 51% 45% 68% 55% 52% 40% 62% 26% 20% 38% Other California 11% 27% 16% 21% 11% 11% 26% 55% 51% 33% Other States 1% 0% 0% 0% 0% 0% 0% 0% 0% 0% 100% 100% 100% 100% 100% 100% 100% 100% 100% 100% Year of Origination 2013 & Prior 2014 2015 2016 2017 2018 2019 2020 YTD2021 TOTAL Loan Balance (In Thousands) $25,420 $19,667 $34,304 $66,503 $51,556 $57,103 $89,744 $82,058 $58,053 $484,408 Weighted Avg. LTV (1) 40% 48% 45% 44% 46% 44% 48% 51% 51% 47% W. Avg. Debt Coverage Ratio (2) 1.87x 1.75x 1.76x 1.69x 1.66x 1.54x 1.59x 1.58x 1.76x 1.66x Weighted Avg. Age (In Years) 10.99 6.97 5.94 4.89 4.08 3.06 1.92 0.96 0.19 3.29 Weighted Avg. FICO (3) 744 774 752 763 752 754 764 761 765 760 Number of Loans 54 34 69 90 87 76 95 83 66 654 Geographic Breakdown (%) Inland Empire 32% 7% 17% 10% 16% 14% 10% 15% 16% 14% Southern California (4) 53% 50% 57% 62% 68% 66% 68% 68% 53% 63% Other California 14% 43% 26% 28% 16% 20% 22% 17% 31% 23% Other States 1% 0% 0% 0% 0% 0% 0% 0% 0% 0% 100% 100% 100% 100% 100% 100% 100% 100% 100% 100% Year of Origination 2013 & Prior 2014 2015 2016 2017 2018 2019 2020 YTD2021 TOTAL (5)(6) Loan Balance (In Thousands) $10,568 $7,971 $10,824 $9,091 $15,377 $14,193 $18,040 $7,261 $1,954 $95,279 Weighted Avg. LTV (1) 40% 30% 38% 44% 42% 42% 43% 37% 51% 41% W. Avg. Debt Coverage Ratio (2) 1.98x 2.39x 1.79x 1.58x 1.64x 1.65x 1.44x 1.99x 1.61x 1.74x Weighted Avg. Age (In Years) 8.64 6.87 6.00 5.11 3.79 3.06 1.96 1.24 0.22 4.24 Weighted Avg. FICO (3) 760 752 740 775 778 755 757 731 730 758 Number of Loans 12 15 18 15 17 24 20 10 3 134 Geographic Breakdown (%) Inland Empire 73% 18% 34% 13% 25% 11% 11% 7% 58% 24% Southern California (4) 27% 58% 37% 48% 45% 43% 52% 47% 20% 44% Other California 0% 24% 29% 39% 30% 46% 37% 46% 22% 32% Other States 0% 0% 0% 0% 0% 0% 0% 0% 0% 0% 100% 100% 100% 100% 100% 100% 100% 100% 100% 100% Year of Origination (Dollars In Thousands) Single-Family Loans 3 $ 897 78 % 696 N/A 14.0 Commercial Real Estate Loans 1 945 48 % 704 1.71 x 4.0 Total Loans in Forbearance 4 $ 1,842 63 % 700 1.71 x 8.9 Weighted Avg. Forbearance Granted(4) (1) Current loan balance in comparison to the original appraised value. (2) At time of loan origination, borrowers and/or guarantors. (3) At time of loan origination. (4) In months. Number of Loans Loan Balance Weighted Avg. LTV(1) Weighted Avg. FICO(2) Weighetd Avg. Debt Coverage Ratio(3) |