Exhibit 99.3

| Pro Forma Hedge Roll Off Mark to Market Reversals to Income ($ Millions) $600 $591 $208 $500 $400 $198 $300 $200 $24 $75 $14 $100 $71 $0 06 2005 2005 2006 2006 2006 (20) 2007+ (30/) 4Q 1Q 2Q 3Q 4Q (9/) Note: Reflects positions and prices at 9/30/05 |
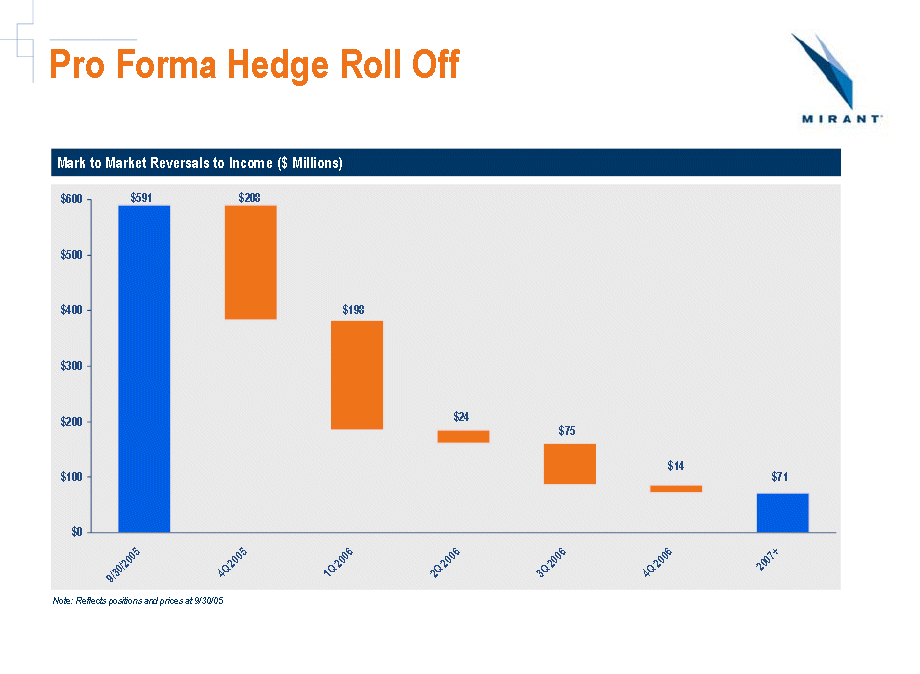
The graph labeled "Mark to Market Reversals to Income ($ Millions)" shows as of September 30, 2005 a $591 million negative mark to market that rolls through the income statement of Mirant North America, LLC in the following amounts and is expected to be reversed as the corresponding hedges expire. $208 million is expected to be reversed in the fourth quarter of 2005, $198 million is expected to be reversed in the first quarter of 2006, $24 million is expected to be reversed in the second quarter of 2006, $75 million in the third quarter of 2006, $14 million in the fourth quarter of 2006 and $71 million thereafter. The graph does not take into account any negative mark to market that may be required for periods after September 30, 2005.
