Exhibit 99.1
Forward Looking Statements
All statements, other than statements of historical facts, included in this presentation that address activities, events or developments that UCI expects, believes or anticipates will or may occur in the future are forward-looking statements. Forward-looking statements give UCI’s current expectations and projections relating to the financial condition, results of operations, plans, objectives, future performance and business of UCI and its subsidiaries. These statements can be identified by the fact that they do not relate strictly to historical or current facts. They are subject to uncertainties and factors relating to UCI’s operations and business environment, all of which are difficult to predict and many of which are beyond UCI’s control. UCI cautions investors that these uncertainties and factors, including those discussed in Item 1A of UCI’s 2005 Annual Report on Form 10-K and in other SEC filings, could cause UCI’s actual results to differ materially from those stated in the forward-looking statements. UCI cautions that investors should not place undue reliance on any of these forward-looking statements. Further, any forward-looking statement speaks only as of the date on which it is made, and except as required by law, UCI undertakes no obligation to update any forward-looking statement to reflect events or circumstances after the date on which it is made or to reflect the occurrence of anticipated or unanticipated events or circumstances.
EBITDA and Adjusted EBITDA
UCI has provided EBITDA and Adjusted EBITDA in these materials because it believes that they provide useful information to investors, in that they facilitate an investor’s comparison of UCI’s operating results to that of companies with different capital structures and with cost basis in assets that have not been revalued and written-up in an allocation of a recent acquisition’s purchase price.
The calculation of Adjusted EBITDA presented herein reflects the calculation of EBITDA as used in the credit agreement for UCI’s senior credit facilities. This Adjusted EBITDA is used to measure compliance with covenants of that agreement such as interest coverage. (The amounts presented herein are for all of UCI. The actual amounts used to measure compliance to the credit agreement covenants may differ in that under certain circumstances the results of certain foreign subsidiaries are excluded.)
EBITDA and Adjusted EBITDA are not measures of financial performance under United States generally accepted accounting principles (“US GAAP”) and should not be considered as alternatives to net income, operating income or any other performance measures derived in accordance with US GAAP or as an alternative to cash flow from operating activities as a measure of liquidity.
I. EXECUTIVE SUMMARY
EXECUTIVE SUMMARY
| A. | Transaction Overview |
On March 9, 2006, United Components, Inc. (“UCI”, the “Borrower” or the “Company”), a portfolio company of The Carlyle Group (“Carlyle”), announced the acquisition of ASC Industries, Inc. (“ASC”), a leading manufacturer and distributor of new aftermarket water pumps for industrial, light-duty and heavy-duty vehicles. Excluding fees and expenses, the headline price for the acquisition is approximately $158.7 million, including (i) $4.0 million of deferred payments, (ii) the assumption of approximately $8.0 million of ASC debt and (iii) $8.3 million of rollover management equity. UCI estimates it will use approximately $20 million of internally generated cash and approximately $113 million of incremental term debt to finance the acquisition, as the headline price is reduced by approximately $14.9 million of factored receivables and $5.1 million of accounts payable related to AutoZone’s pay-on-scan (“POS”) program. Please refer to “Historical Financial Overview – Section V” of this book for further explanation of the purchase price details.
In connection with the acquisition, UCI has mandated Lehman Brothers Inc. (“LBI”) and J.P. Morgan Securities, Inc. (“JPMorgan”) as Joint Lead Arrangers and Joint Bookrunners to amend and restate the Company’s existing Senior Secured Credit Facilities. Lehman Commercial Paper, Inc. will continue to serve as Administrative Agent for the Credit Facilities. The amended and restated $405 million Senior Secured Credit Facilities (the “Credit Facilities”) will consist of the following tranches:
| • | A $75 million Revolving Credit Facility due June 2009 (“the “Revolver”), the terms of which will be consistent with the Company’s existing revolver; and |
| • | A $330 million Term Loan D (“Term Loan”) due June 2012, which will be used to refinance, extend and re-price the Company’s existing $217 million Term Loan C as well as provide approximately $113 million of consideration to fund the acquisition of ASC. |
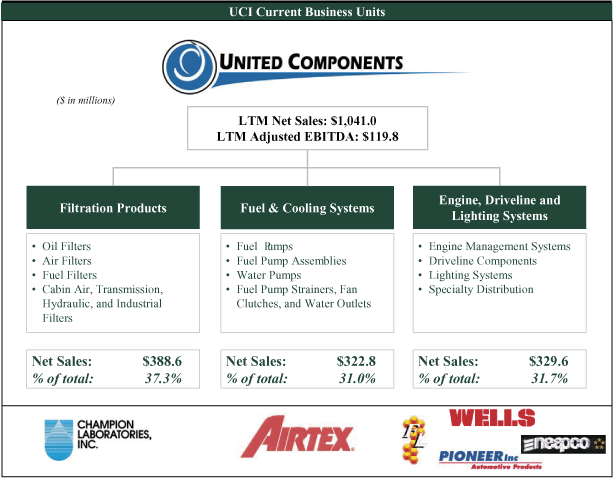
UCI manufactures and distributes a broad range of vehicle replacement parts, primarily servicing the automotive aftermarket. The Company primarily supplies consumable parts including filters, fuel and cooling systems, engine management systems, driveline components and commercial vehicle lighting to the automotive, commercial and off-highway vehicle segments. UCI’s customer base includes some of the largest and fastest growing companies in the aftermarket, including AutoZone, Advance Auto, CARQUEST, Valvoline, and O’Reilly. For the last twelve months ended March 31, 2006 (“LTM”), the Company had net sales1 and adjusted EBITDA of $1,041.0 million and $119.8 million, respectively.
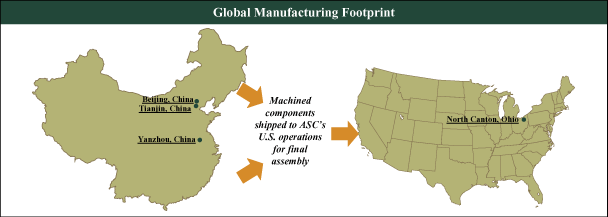
ASC is the leading manufacturer and distributor of new aftermarket water pumps for the automotive and heavy-duty markets (95% of ASC’s sales are to the aftermarket) and is a competitor to Airtex, UCI’s fuel and water pump business. ASC’s expertise lies in its global manufacturing and sourcing capabilities combined with domestic assembly that enables “Just-In-Time” delivery of its products. ASC entered the Chinese market to launch sourcing operations in 1990, and over the last 15 years has effectively developed a robust manufacturing and sourcing strategy. The company manufactures components in its Chinese facilities and then ships them to its North Canton, Ohio plant for assembly and distribution. This unique, low cost business model has helped ASC grow from less than $20 million in sales in 1998 to over $100 million today. For the last twelve months ended March 31, 2006, ASC generated net sales and adjusted EBITDA of $106.6 million and $16.2 million, respectively2.
On a pro forma basis the combined UCI/ASC company will have LTM net sales and adjusted EBITDA3 of $1,147.6 million and $138.1 million, respectively.
| 1 | Net sales includes $14.0 million in warranty reserve adjustments. | |
| 2 | ASC’s 1Q 2006 financial information is based on internal reporting and has not been reviewed by independent external auditors. | |
| 3 | Includes pro forma synergies of $2.1 million. |
 | 1 |  | ||
B. Transaction Rationale
The strategic acquisition of ASC will accelerate the transformation of UCI’s cost structure while meeting the Company’s customers’ needs through the creation of two additional Centers of Excellence, water pumps at ASC and fuel pumps at Airtex.
Global Sourcing and Manufacturing
ASC has a flexible business model that leverages global manufacturing and sourcing capabilities. Over the past 15 years, ASC has developed a robust China sourcing strategy, supported by two manufacturing facilities and an engineering and procurement office in China. Components are manufactured in its Chinese facilities, and then shipped to the U.S. for “Just-in-Time” assembly and distribution. ASC’s Chinese operations are well-run, and the Company has successfully implemented many lean manufacturing practices. ASC’s unique business model distinguishes it from competitors in several ways:
| • | 99% order fill rate to all customers |
| • | 65-70% of products made to order on 3-day notice; one day order fulfillment available through itsRapid Responseprogram |
| • | Customers provided with new and innovative products each year, including late model SKUs |
| • | Low product return rates |
| • | Flexible packaging and customized tracking options |
In acquiring ASC, UCI is obtaining a proven global sourcing and manufacturing platform to drive cost improvements across the Company. ASC’s well established Chinese operations will accelerate UCI’s China strategy, allowing the company to benefit from ASC’s expertise in low cost country manufacturing.
Significant Expected Synergies
UCI expects that the acquisition of ASC will result in significant synergies across a number of categories. Specifically, the transaction is expected to result in cost synergies beginning in the first twelve months after the acquisition, which will gradually increase to $10 to $12 million by 2009. Key categories of improvement include manufacturing, purchasing leverage, and SG&A savings.
The total cost required to realize these synergies is estimated to be approximately $12.9 million over two years, of which $9.0 million is expected to be capitalized and the remaining $3.9 million to be expensed. Though they have not been factored into the forecast, synergies are also expected through manufacturing and procurement opportunities for fuel pumps and engine management components, working capital improvements, and the further implementation of lean manufacturing practices. Management will implement strategies to achieve these savings after the water pump integration is complete.
Additional Opportunities
Leveraging its highly efficient sourcing model and lean manufacturing capabilities, ASC has won numerous new customers and recorded significant sales and EBITDA growth since 2001. The proposed transaction provides additional senior executive talent that will contribute and implement ASC’s best practices across the UCI organization. The management team will be motivated through their equity investment in UCI and their participation in the UCI option pool. The combination of UCI and ASC will bring together two of the leading manufacturers of aftermarket water pumps to offer the broadest product suite in automotive water pumps. ASC will become UCI’s “Center of Excellence” for water pumps and Airtex will become UCI’s “Center of Excellence” for fuel pumps.
Unique Business Model
ASC’s unique business model, which includes industry-leading order fill rates, “Just-in-Time” delivery, broad product offering, flexible packaging, and a first-to-market commitment for new products, has helped it record outstanding sales growth with balanced profitability since 2001. The flexible business model and unique approach will impact the entire UCI organization.
| 2 | | ||
| C. | Sources & Uses of Funds and Pro Forma Capitalization |
The sources and uses of funds for the transaction are highlighted below.
Sources & Uses of Funds
($ in millions)
| Sources of Funds | Uses of Funds | |||||||||
| Cash | $ | 20.9 | Equity Purchase Price | $ | 133.2 | |||||
| New Term Loan D | 330.0 | Refinance Existing Term Loan C Facility | 217.0 | |||||||
| Assumed China Debt | 8.0 | Assumed China Debt | 8.0 | |||||||
| Management Rollover | 8.3 | Fees & Expenses | 9.0 | |||||||
Total Sources | $ | 367.2 | Total Uses | $ | 367.2 | |||||
The following table describes the consolidated capitalization of the Borrower as of March 31, 2006.
Pro Forma Capitalization
($ in millions)
| As of 3/31/06 | ||||||||||||
| UCI | PF Adj. | Pro Forma | ||||||||||
Capitalization | ||||||||||||
LTM Adjusted EBITDA(1) | $ | 119.8 | $ | 18.3 | (2) | $ | 138.1 | |||||
| Cash | $ | 45.1 | ($ | 18.5 | ) | $ | 26.6 | |||||
Revolver(3) | — | — | ||||||||||
Existing Term Loan C Facility(4) | 217.3 | (217.0 | ) | 0.3 | ||||||||
| New Term Loan D Facility | — | 330.0 | 330.0 | |||||||||
| Assumed China Debt | — | 8.0 | 8.0 | |||||||||
| 9 3/8% Sr. Sub. Notes due 2013 | 230.0 | — | 230.0 | |||||||||
Total Debt | $ | 447.3 | $ | 568.3 | ||||||||
| Total Shareholders’ Equity | 286.4 | 8.3 | 294.7 | |||||||||
Total Capitalization | $ | 733.7 | $ | 863.0 | ||||||||
Credit Statistics | ||||||||||||
| Senior Debt / Adj. EBITDA | 1.81 | x | 2.45 | x | ||||||||
| Net Debt / Adj. EBITDA | 3.36 | x | 3.92 | x | ||||||||
| Total Debt / Adj. EBITDA | 3.73 | x | 4.11 | x | ||||||||
| Total Debt / Adj. EBITDA-Capex | 4.90 | x | 5.37 | x | ||||||||
| Adj. EBITDA / Cash Interest | 3.43 | x | 2.92 | x | ||||||||
| Adj. EBITDA - - Capex / Cash Interest | 2.61 | x | 2.23 | x | ||||||||
Note: ASC’s 1Q 2006 financial information is based on internal reporting and has not been reviewed by independent external auditors.
| 1. | Adjusted EBITDA does not add back $0.3 million of factoring expense associated with UCI’s $4.9 million A/R facility and $1.0 million of factoring expense associated with $14.9 million of factored receivables at ASC. | |
| 2. | Assumes $2.1 million of synergies on a pro forma basis anticipated to be realized in the first 12 months after the transaction closes. | |
| 3. | $75 million revolving credit facility is available until 2009. | |
| 4. | Includes $0.3 million of other debt at UCI. |
| 3 | | ||
| D. | Summary Description of the Credit Facility |
The following table summarizes the terms and conditions of the Credit Facilities. The transaction will be effected through an amendment and restatement of the Company’s existing credit agreement.
Summary Terms of the Senior Secured Credit Facilities
Borrower: | United Components, Inc. (“UCI or the “Borrower”) | |
Joint Lead Arrangers and | Lehman Brothers Inc. | |
Book-Runners: | J.P. Morgan | |
Administrative Agent: | Lehman Commercial Paper Inc. | |
Description: | $405 million Amended and Restated Senior Secured Credit Facilities (“Credit Facilities”) comprising the following: | |
• $75 million Senior Secured Revolving Credit Facility (the “R/C”) | ||
• $330 million Senior Secured Term Loan D (the “Term Loan D”), consisting of: |
| o | $217 million to be used to refinance, extend and re-price the Borrower’s existing Tranche C Term Loan Facility (the “Term Loan C”) | ||
| o | $113 incremental Term Loan D to finance the acquisition of ASC and pay related fees and expenses |
Maturity: | • R/C: June 30, 2009 (same as existing credit facility) | |
• Term Loan D: June 30, 2012 | ||
Ratings: | B2 / BB- | |
Initial LIBOR Margin: | R/C: LIBOR plus 325 bps(1) | |
| Term Loan D: LIBOR plus 225 bps | ||
Use of Proceeds: | The net proceeds will be used to finance the acquisition of ASC, refinance the existing Term Loan C and provide for general corporate purposes | |
Term Loan D Amortization: | Amortization of 0.25% quarterly with the remaining balance due in 4 even installments in the final year | |
Security: | Perfected first priority security interests in all tangible and intangible assets of the Borrower and its subsidiaries; secured by a pledge of 100% of the capital stock of the Borrower as well as a pledge of 2/3 of the capital stock of foreign subsidiaries | |
Guarantees: | Each of the Borrower’s domestic subsidiaries as well as any of the Borrower’s foreign subsidiaries to the extent there are no material adverse tax consequences | |
Optional Prepayments: | Prepayable at par | |
Mandatory Prepayments: | • 100% of proceeds from debt issuances | |
• 50% of proceeds from issuance of capital stock | ||
• 100% of asset sales > $5.0 million, subject to reinvestment limitation of $20 million per year | ||
• 50% of excess cash flow, subject to leverage based stepdowns | ||
Financial Covenants: | • Maximum Total Leverage Ratio | |
• Minimum Interest Coverage Ratio | ||
• Maximum Capital Expenditures |
| 1. | Revolver is subject to a leverage based grid. |
| 4 | | ||
II. INVESTMENT HIGHLIGHTS
Summary of Investment Considerations
| A. | Large Market with Favorable Industry Characteristics |
Automotive aftermarket manufacturers have a substantially different business model than those of OEM suppliers; strong aftermarket fundamentals provide stability and predictability not experienced by OEM suppliers.
| • | The North American automotive aftermarket is large and fragmented with an estimated $180 billion of aggregate retail sales in 2005 (excluding tire sales) | ||
| • | Over the last 8 years, the automotive aftermarket (excluding tires) has grown at a 4.6% compound annual growth rate, with the worst year (1998) growing at 2.3% | ||
| • | The automotive aftermarket will continue to benefit from favorable industry trends: |
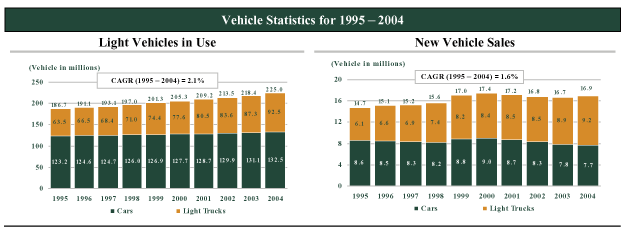
| o | Growing base of vehicles:The size of the installed base of cars has been growing steadily since 1995 at a CAGR of 2.1%. There were approximately 225 million vehicles on the road in 2004. With more vehicles on the road, there is greater need for replacement parts and general maintenance. | ||
| o | Increase in average miles driven per vehicle:The replacement rate of automotive parts and components is heavily influenced by the number of miles a vehicle is driven. Over the past decade, the average passenger car has traveled approximately 26% more miles in 2004 than in 1994. | ||
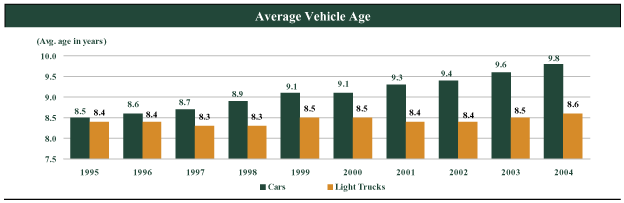
| o | Aging vehicle population which grows the “sweet spot” (6 to 10 year old vehicles) of aftermarket maintenance:Over the last three decades, the median age for passenger cars has increased 96% from 4.9 years in 1970 to a median of 9.8 years in 2004. From 1995 to 2004, the average age of passenger cars in use grew from 8.5 years to 9.8 years, while the average age of light trucks in use remained at approximately 8.6 years | ||
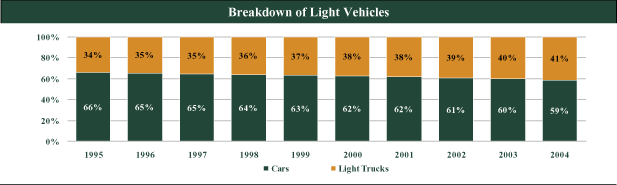
| o | Growth in Light Truck Segment:From 1995 to 2004, the number of light trucks in use grew at a rate of 4.3% per year, as compared to the 0.8% per year increase in passenger cars in use over the same period. Today, light trucks account for over 41% of all light vehicle sales. Light truck consumers tend to be more knowledgeable about automotive components and are often less price sensitive. Light trucks also tend to exert greater stresses on vehicular components than passenger cars, which leads to a higher frequency of replacement. | ||
| o | Strong growth in both the “Do-it-for-me” and “Do-it-yourself markets” / blending of retail and traditional channels |
| 5 | | ||
Unlike the Automotive OEMs and their suppliers, the aftermarket steadily grows more than 4% per year. The following table illustrates the stability of growth in the automotive aftermarket when compared to new vehicle sales in North America.
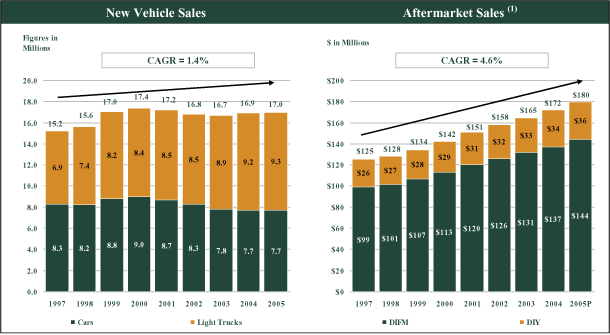
| 1. | Source: Automotive Aftermarket Industry Association (“AAIA”). |
| B. | Solid Position within the Aftermarket |
As displayed below, UCI is well diversified among end markets and products, deriving approximately 78% of its net sales from the aftermarket channels. On a pro forma basis for the acquisition of ASC, UCI will derive approximately 80% of its net sales from the aftermarket channels.
UCI primarily sells two types of aftermarket products, which have relatively short replacement cycles, generating stable and predictable income streams:
| • | Maintenance products, including filtration products, which are the most frequently replaced part on a vehicle | ||
| • | Nondiscretionary products, including fuel and cooling systems and engine management systems, for which replacement is a requirement or the vehicle will not run |
| The following tables illustrate the well diversified suite of products that UCI currently offers its customers through various sales channels. |
| 6 | | ||
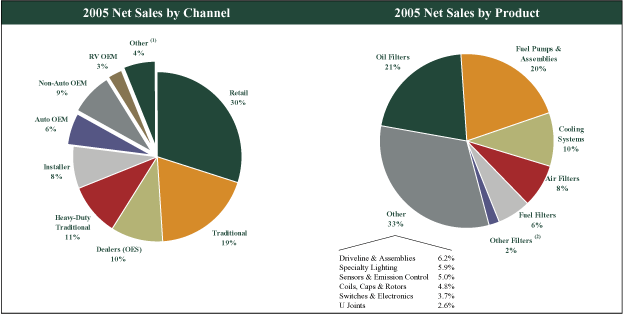
| 1. | Other includes marine, construction, lawn & garden, mining, industrial, and distribution of hard-to-find parts. | |
| 2. | Other filters include transmission filters, hydraulic filters, cabin air filters, PCV valves, and industrial filters. |
Within its channels UCI has solid relationships with the leading aftermarket customers including AutoZone, Advance Auto, CARQUEST, O’Reilly and NAPA. UCI has particularly significant relationships with the fastest growing aftermarket retailers including AutoZone, Advance Auto and O’Reilly (as evidenced in the following chart). While retailers have historically represented a large and stable sales channel for the Company, UCI has improved its customer mix over time, with Advance Auto and O’Reilly growing significantly. This is the direct result of dedicated effort to grow revenues, resulting in major new business wins including the O’Reilly fuel pump contract signed in Q4 2005. Through the ASC acquisition, UCI continues to strengthen its relationship with these fast growing aftermarket retailers.
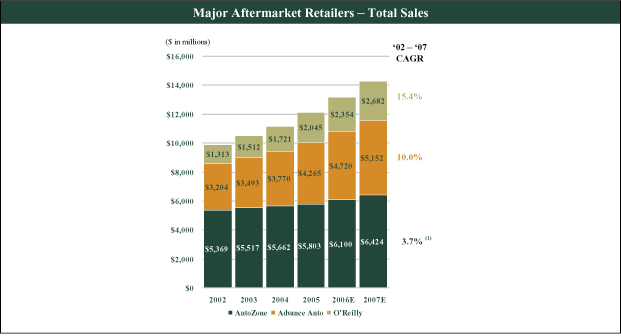
Note: Projections are calendarized based on Wall Street consensus estimates.
| 1. | AutoZone 2005 – 2007E sales CAGR estimated to be 5.2%. |
| 7 | | ||
The following table illustrates the leadership positions the Company has in most of its primary markets and channels.
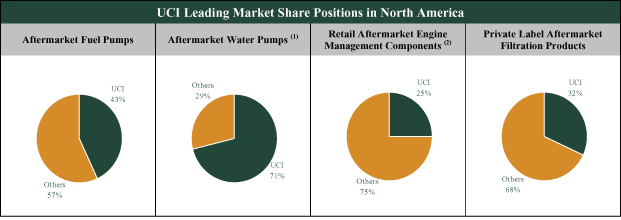
Source: Management estimates.
| 1. | Pro forma for the acquisition of ASC. | |
| 2. | Growth in the traditional channel has resulted in customer diversification. |
| 8 | | ||
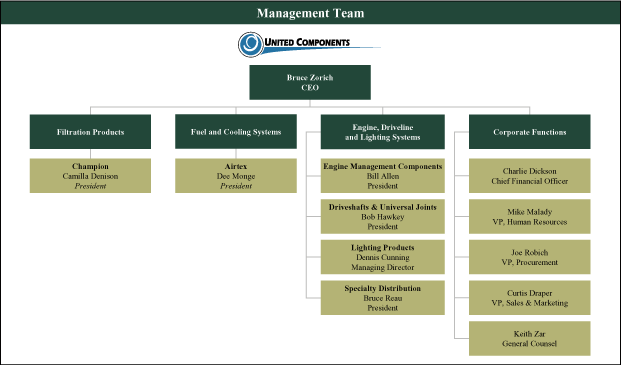
C. Strong Management Team
Since Carlyle acquired UCI in June 2003, UCI has created a corporate organization to better manage what was effectively six autonomous units. In addition, UCI has upgraded select divisional executives including:
| • | Champion:President, VP Sales and Marketing, VP Operations, Controller | ||
| • | Airtex:VP Sales and Marketing, VP Operations, Controller | ||
| • | Other:Wells VP Sales and Marketing, Neapco President, Eurofilter Managing Director |
The following table presents UCI’s current executive management team.
This transaction will provide additional management talent to UCI. ASC’s top two executives (Theodore Swaldo – President and CEO; William Blackerby – COO) have more than 30 years of combined aftermarket experience and ASC also has significant depth of management talent below the CEO and COO level.
| 9 | | ||
| D. | Substantial Investment in Revenue Growth and Cost Reduction |
Since Carlyle acquired UCI in June 2003, UCI has invested over $65 million to position itself for profitable growth. The following table illustrates UCI’s key completed investments and associated benefits.
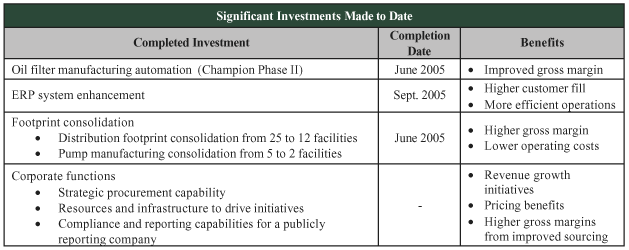
These investments combined with corporate initiatives will result in significant EBITDA growth in 2006 and beyond.
The completed initiatives, excluding incremental costs, will result in approximately $27 million of additional EBITDA (excluding the impact of inflation, additional costs, etc.). Of this amount, approximately 75% or $20 million will be realized in 2006, with the remaining amounts realized in 2007. Approximately $3.7 million of the benefit from the completed initiatives were realized in 1Q 2006. These savings will more than offset wage inflation and rising fuel and raw material costs. The savings from the completed initiatives will also include the benefit from headcount reduction of 390 FTEs.
| 10 | | ||
The Company’s ongoing initiatives are expected to result in more than $10 million of incremental EBITDA. These initiatives, which include headcount reduction of approximately 200 to 250 FTE’s, are incremental to annual cost reductions (make vs. buy) and procurement initiatives that have historically offset inflation and other cost increases.
| E. | Proven Ability to Repay Debt |
Despite the significant investments described above, UCI has reduced net debt by $173 million since its acquisition by Carlyle in June 2003.
The table below illustrates UCI’s significant debt reduction since the acquisition.
Capitalization
($ in millions)
| Actual | ||||||||
| 6/20/03 | 3/31/06 | |||||||
| Revolver | $ | 5.0 | — | |||||
| Term Loan | 350.0 | 217.0 | ||||||
| Subordinated Notes | 230.0 | 230.0 | ||||||
| Other | 2.0 | 0.3 | ||||||
Total Debt | $ | 587.0 | $ | 447.3 | ||||
| Less: Cash | (11.4 | ) | (45.1 | ) | ||||
Net Debt | $ | 575.6 | $ | 402.2 | ||||
| Net Leverage Ratio | 4.3 | x | 3.4 | x | ||||
Liquidity (Cash + Revolver Capacity)(1) | $ | 83.0 | $ | 112.1 | ||||
| 1. | Net of letters of credit, which totaled $3.4 million at 6/20/03 and $8.0 million at 3/31/06. |
| 11 | | ||
III. BUSINESS OVERVIEW
DETAILED COMPANY DESCRIPTIONS
| A. | UCI Overview and Recent Accomplishments |
In June 2003, The Carlyle Group acquired the six aftermarket businesses of UIS, Inc. and renamed the entity United Components, Inc. or UCI. The Company is one of North America’s largest and most diversified companies servicing the aftermarket. UCI supplies a broad range of filtration products, fuel and cooling systems, engine management systems, driveline components and lighting systems to the automotive, trucking, marine, mining, construction, agricultural and industrial vehicle markets. In 2005, approximately 78% of UCI’s net sales were made in the aftermarket, to a customer base that includes some of the largest and fastest growing companies servicing the aftermarket.
UCI has leading market positions in its primary business lines, including fuel and cooling systems, filtration products and engine management systems. UCI continues to expand its product and service offerings to meet the needs of its customers; it offers one of the most comprehensive lines of products in the vehicle replacement parts market consisting of approximately 60,000 part numbers. The breadth of the company’s product offering is a key competitive advantage, which, along with its extensive manufacturing and distribution capabilities, product innovation and reputation for quality and service makes it a leader in the aftermarket. UCI has established a network of manufacturing facilities, distribution centers and offices located in the United States, Europe, Mexico and China, with a global work force of more than 6,200 employees.
Since the acquisition, UCI has generated significant cash flow and meaningfully reduced leverage while heavily investing in the business. UCI has reduced net debt by $173 million over less than three years, significantly more than projected at the time of the LBO, and reduced senior net leverage from 2.7x to 1.4x and total net leverage from 4.3x to 3.4x.
In addition to producing significant free cash flow to repay debt, the following are some of the key accomplishments of UCI since the acquisition:
| • | Developed targeted growth strategies and realized new business wins |
| o | Airtex brand Engine Management line for Wells to leverage the Airtex brand name and channels | ||
| o | “Wrap Around” strategies to provide appropriate incentives to purchase full UCI product line | ||
| o | 2005 new business wins with CARQUEST and O’Reilly |
| • | Made significant investments to improve the overall UCI platform |
| o | Developed a corporate organization to manage the six previously autonomous units | ||
| o | Champion’s capital improvement plan including two high-speed oil filter lines | ||
| o | ERP system for Airtex |
| • | Drove operational improvements across the organization |
| o | Streamlined distribution process by consolidating 13 warehouse distribution facilities | ||
| o | Completed facility rationalization at Airtex from five to two facilities | ||
| o | Implemented procurement improvements and lean manufacturing practices across business units |
| • | Upgraded key divisional management positions |
| o | Champion: President, VP Sales and Marketing, VP Operations, Controller | ||
| o | Airtex: VP Sales and Marketing, VP Operations, Controller | ||
| o | Other: Wells VP Sales and Marketing, Neapco President, Eurofilter Managing Director |
| 12 | |
The table below illustrates UCI’s historical financial performance from 2001 through the twelve months ended March 31, 2006.
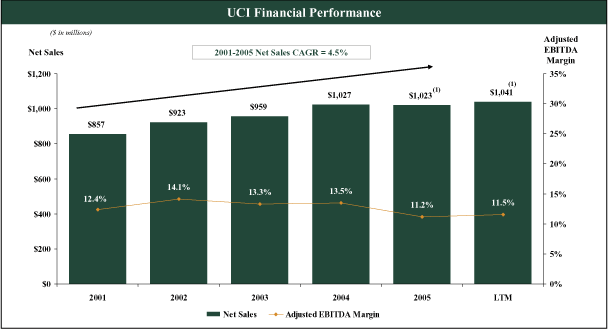
Note: 2005 and LTM net sales include $14.0 million warranty reserve adjustment.
Net Sales
From 2001 to 2003, despite the slowdown in the overall economy and the heightened tensions related to the war in Iraq, UCI performed well realizing 5.8% annual growth. In 2004 net sales were the highest in the Company’s history, up more than 7% due to strong volumes in all market channels. 2005 sales were essentially flat with 2004, primarily driven by market challenges faced by one of the Company’s primary customers; however, the Company has experienced a rebound in 1Q 2006, with net sales up 7.4% over 1Q 2005 due to favorable conditions in the aftermarket, improved market performance by this significant customer and several new customer wins.
Adjusted EBITDA
The Company’s margins remained relatively consistent between 2002 and 2004, resulting in increased adjusted EBITDA on stronger net sales. 2005 proved to be difficult due to cost inflation in the two largest components of UCI’s cost of sales, labor and steel as well as lower volumes at a significant customer and a negative impact from product mix. Since early 2004, global demand for steel has been high and has resulted in supplier-imposed price increases and/or surcharges for this raw material requiring UCI to pay significantly higher prices for the material. In order to offset the negative impact, UCI has implemented price increases on certain products with high steel content. The higher cost of steel, net of UCI price increases, adversely affected adjusted EBITDA by approximately $3.0 million in 2004, compared to steel prices as of the end of 2003. The higher cost of steel, net of the Company’s price increases, has also resulted in approximately $4.5 million lower adjusted EBITDA in 2005, compared to 2004. In response to a more challenging operating environment, the Company has worked aggressively to reduce labor costs through headcount reduction initiatives and the automation of select product lines. The benefit of these efforts during 2005 will be fully realized in 2006 and 2007. However, 1Q 2006 results begin to demonstrate the financial benefits of these initiatives, resulting in higher margins and adjusted LTM EBITDA of $119.8 million.
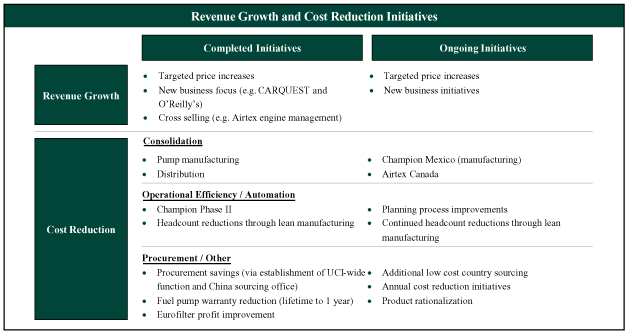
As described in the “Investment Highlights – Section II” of this book, UCI has pursued opportunities to optimize its resources and reduce costs. The Company continually evaluates its manufacturing footprint and distribution network to identify opportunities for consolidations and other operating efficiencies. UCI has also begun expansion into several fast-growing product lines that offer substantial growth opportunities, such as filtration products for the heavy-duty channel and fuel pump assemblies for the aftermarket. These initiatives are expected to result in margin improvements in the coming years.
| 13 | |
The following table provides a snapshot of UCI’s current business units.
| 14 | |
| B. | ASC Company Overview |
ASC, headquartered in North Canton, Ohio, is a leading manufacturer and distributor of new, aftermarket cooling systems for the U.S. automotive and truck markets. ASC leverages a highly efficient, low-cost, global manufacturing and distribution platform for cast iron and aluminum parts and light assemblies to support a broad customer base of automotive aftermarket retailers, warehouse distributors and selective original equipment service providers. Additionally, ASC selectively fulfills low- to medium- volume product opportunities for automotive original equipment manufacturers and industrial products manufacturers.
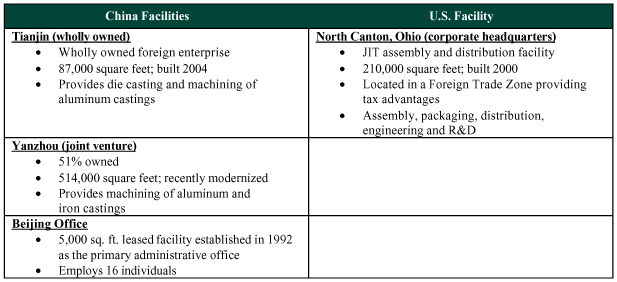
ASC has a unique business model built upon global manufacturing and sourcing capabilities combined with domestic “Just-in-Time” assembly. Over the past 15 years, ASC has developed a robust China sourcing strategy, supported by two manufacturing facilities and an engineering and procurement office in China. Components are manufactured in Chinese facilities, and then shipped to the U.S. for assembly and distribution. The Chinese operations are well-run and the Company successfully implements many lean manufacturing practices.
| 15 | |
Leveraging this unique, flexible business model, ASC distinguishes itself from the competitors in several ways:
| • | 99% order fill rate to all customers | |
| • | 65-70% of products made to order on 3-day notice; one day order fulfillment through itsRapid Responseprogram | |
| • | Customers consistently provided with new and innovative products, including late model SKUs | |
| • | Low product return rates | |
| • | Flexible packaging and customized tracking options |
In 2005, ASC derived approximately 97% of total sales from automotive and heavy-duty water pumps and 3% of total sales from other selected high-margin cast iron and aluminum products and assemblies. Over the last decade, ASC has built close relationships primarily with large retailers and warehouse distributors. Currently, ASC has exclusive relationships with AutoZone, Advance Auto, Pep Boys and CARQUEST.
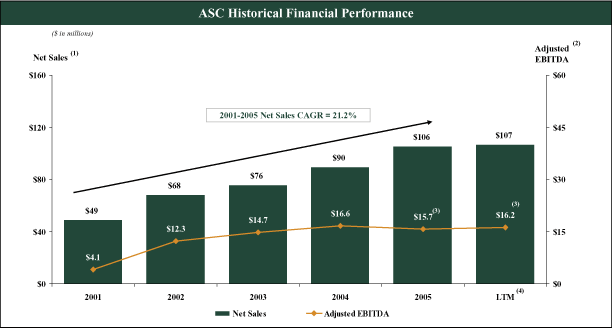
The table below illustrates ASC’s historical financial performance.
| 1. | Net sales adjusted for impact of transition to Pay-on-Scan of $10.1 million in 2004, $4.4 million in 2005, and $4.4 million in the LTM period. | |
| 2. | Includes $0.4 million, $0.8 million, $1.0 million, and $1.0 million of expenses related to A/R factoring arrangement with customers for 2003, 2004, 2005 and the LTM period, respectively. | |
| 3. | Includes startup expense relating to new China facility and new customer ramp-up costs. | |
| 4. | ASC’s 1Q 2006 financial information is based on internal reporting and has not been reviewed by independent external auditors. |
Net Sales
ASC has achieved very strong financial performance since 2001, recording annualized net sales growth of 21.2%. ASC benefits from the stable, consistent growth of the automotive water pump aftermarket and has gained market share through high order fill rates, quality products, and outstanding customer service.
Adjusted EBITDA
While recording strong sales growth, ASC also increased adjusted EBITDA margins from 8.3% in 2001 to 14.9% in 2005. In 2005, ASC’s profit margins were negatively impacted due to one-time costs related to ramp-up costs associated with its new manufacturing facility in Tianjin, China, opened in January 2005. This facility did not begin to approach run rate utilization until late 2005. Additionally during 2005, ASC began servicing several new OES customers requiring additional investments and ramp-up costs. These charges increased the operational expenses and resulted in a decrease in the adjusted EBITDA margin for 2005.
| 16 | |
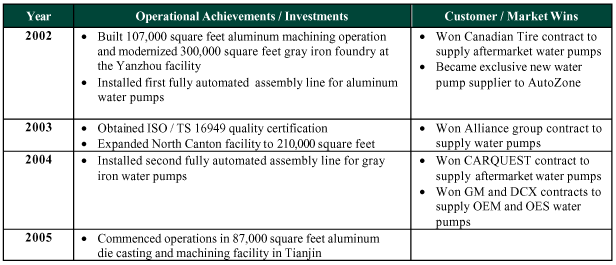
The table below provides an overview of some of the initiatives and investments of ASC since 2002:
The chart below illustrates the sales breakdown and select water pumps for ASC.
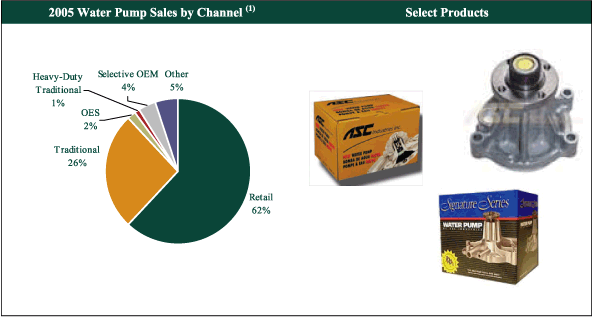
| 1. | Estimates based on gross sales. |
| 17 | |
C. Pro Forma Combined Company Overview
The strategic acquisition of ASC will accelerate the transformation of UCI’s cost structure while meeting customers’ needs through the creation of additional “Centers of Excellence.” On a pro forma basis, the combined company will benefit from:
| • | ASC’s proven global manufacturing and sourcing capabilities, which will drive additional cost improvements across UCI | ||
| • | Significant identified synergies associated with water pump manufacturing | ||
| • | Additional synergy potential from manufacturing other UCI products in China | ||
| • | ASC senior executives impacting the entire UCI organization |
ASC will become UCI’s Center of Excellence for water pumps and Airtex will become UCI’s Center of Excellence for fuel pumps, which will permit each business to focus on its core product offering.
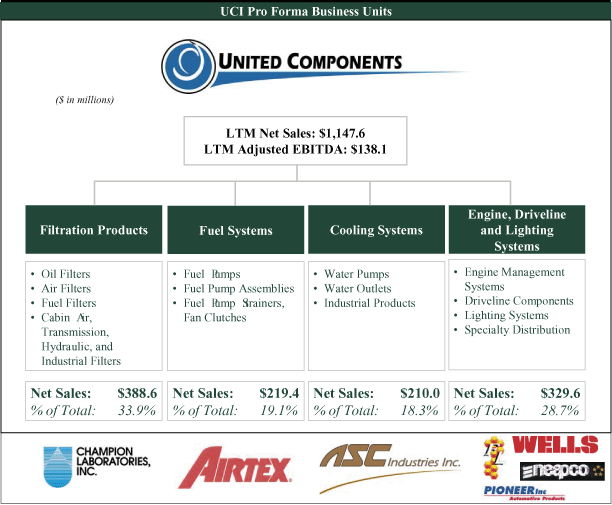
The following table provides a one-page snapshot of UCI’s pro forma business units as well as the global manufacturing footprint of the combined company.
| 18 | |
IV. INDUSTRY UPDATE
INDUSTRY UPDATE
| A. | The Automotive Aftermarket |
The North American automotive aftermarket is organized around two groups of end-users: the Do-It-Yourself (“DIY”) group and the Do-It-For-Me (“DIFM”) group. Each group generally utilizes different distribution channels. The DIY group, which is supplied primarily through the retail channel (e.g.Advance Auto Parts, AutoZone and Pep Boys), represents approximately 20% of aftermarket industry sales and consists of consumers who prefer to do various maintenance and repairs on their vehicles themselves. The DIFM group, which is supplied primarily through the traditional distributor (e.g.Car Quest and NAPA) and OES channels, represents approximately 80% of industry sales and consists of car dealers, repair shops, service stations and independent installers who perform the work for the consumer. Traditional automotive aftermarket retailers, such asAutoZoneandPep Boys, have also begun supplying the DIFM market.
The automotive aftermarket has demonstrated a compound annual growth rate of approximately 4.6% between 1997 and 2005P. Growth of the DIFM market has outpaced DIY market growth over the past few years. This trend, which is expected to continue, is driven by increasing complexity of automotive engines and parts, less availability of time for consumers to make self repairs, and the aging of baby boomers with higher levels of disposable income. Furthermore, many once routine procedures, such as chassis lubes or replacement of spark plugs, are either no longer needed or required far less frequently.
As a result, the DIFM segment is projected to continue to grow more rapidly and at the expense of the DIY segment.
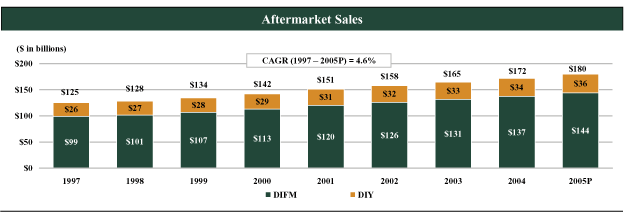
Source: AAIA. Excludes tire sales.
| B. | Drivers of the Automotive Aftermarket |
The automotive aftermarket has demonstrated a compound annual growth rate of approximately 4.9% over the past five years. The primary factors that contribute to the consistent growth of aftermarket sales include the following:
Growing Fleet Size:The number of automotive parts and components sold into the aftermarket is directly related to the number of vehicles in operation. From 1995 to 2004, the number of registered light vehicles increased by approximately 20%. In 2000, the U.S. light vehicle market achieved the highest total sales on record with 17.4 million cars and light trucks sold.
The charts below illustrate the rapid growth in total light vehicles over the last ten years, driven by a growing base of eligible drivers, increasing popularity of pick-up trucks and SUVs, increasing average age of vehicles on the road and increasing average number of cars per household.
| 19 | |
Source: AAIA.
Note: Light trucks refer to SUVs and pick-up trucks.
Increasing Miles Driven:The replacement rate of automotive parts and components is heavily influenced by the number of miles a vehicle is driven. Over the past decade, the average passenger car has put more miles on the odometer, traveling approximately 26% more miles in 2004 than in 1994. Forecasts show total miles driven increasing a faster rate over the next couple of years and surpassing 3 trillion miles in 2006.
In addition, annual miles driven in the U.S. by all types of wheeled vehicles continues to increase. This trend has resulted in increased wear and tear on vehicles and thus increased vehicle maintenance requirements. As more mileage is put on vehicles, the frequency of automotive component replacements is expected to continue to increase.

Source: AAIA.
Note: Light trucks refer to SUVs and pick-up trucks.
Longer Average Vehicle Lives:Over the last three decades, the median age for passenger cars has increased 96% from 4.9 years in 1970 to a median of 9.8 years in 2004. From 1995 to 2004, the average age of passenger cars in use grew from 8.5 years to 9.8 years, while the average age of light trucks in use increased modestly from 8.4 years to 8.6 years.
In general, vehicles that are six years or older require the most maintenance and repair work. Since 1996, there has been steady growth in the number of vehicles that are six years or older. The significant ramp-up in new vehicle sales in the late 1990’s, which has led to a surge of vehicles now entering the prime age for aftermarket maintenance (more than six years), will positively impact the Business over the next few years. The number of vehicles greater than six years old is expected to grow by more than ten million in the next five years, providing long-term sustainable growth to the aftermarket.
| 20 | |
Source: AAIA.
Note: Light trucks refer to SUVs and pick-up trucks.
Note: Light trucks refer to SUVs and pick-up trucks.
Growth in Light Truck Segment:From 1995 to 2004, the number of light trucks in use grew at a rate of 4.3% per year, as compared to the 0.8% per year increase in passenger cars in use over the same period. Today, light trucks account for over 41% of all light vehicle sales. Light truck consumers tend to be more knowledgeable about automotive components and are often less price sensitive. Light trucks also tend to exert greater stresses on vehicular components than passenger cars, which leads to a higher frequency of replacement.
Source: AAIA.
Note: Light trucks refer to SUVs and pick-up trucks.
Note: Light trucks refer to SUVs and pick-up trucks.
| 21 | |
V. MANAGEMENT OVERVIEW
MANAGEMENT OVERVIEW
This section provides information on the top management team and employees at UCI and ASC.
| A. | UCI Management |
UCI’s executive management team has a proven track record of implementing lean manufacturing methodologies under the ownership of a financial sponsor to realize cost savings and improve cash flow. The divisional management team has on average more than 20 years experience with the Company and has been able to organically grow revenues over the last 9 years at a 4.7% compounded annual growth rate through 2005.
Key UCI Management
| Name | Age | Title | ||||
| Bruce M. Zorich | 52 | Chief Executive Officer | ||||
| Charles T. Dickson | 51 | Chief Financial Officer, Executive Vice President | ||||
| Camilla Denison | 42 | President, Filtration Products | ||||
| Dee Monge | 56 | President, Fuel and Cooling Systems | ||||
| Bill Allen | 61 | President, Engine Management Components | ||||
Bruce M. Zorich, 52, Chief Executive Officer:Mr. Zorich has been the CEO and a member of the Board since 2003. From January 2002 through May 2003, Mr. Zorich was President and CEO of Magnatrax Corporation. From 1996 to 2001, Mr. Zorich was President of Huck International. In May of 2003, Magnatrax Corporation filed a voluntary petition to reorganize under Chapter 11 of the U.S. Bankruptcy Code.
Charles T. Dickson, 51, Chief Financial Officer and Executive Vice President:Mr. Dickson has been the CFO and a member of the Board since 2003. From November 1999 to October 2001, Mr. Dickson was CFO of AGENCY.COM. From December 1997 to October 1999, Mr. Dickson was CFO of Winstar Communications. Mr. Dickson was CFO of General Instrument Corporation from January 1994 to November 1997. In April of 2001, Winstar Communications filed a voluntary petition to reorganize under Chapter 11 of the U.S. Bankruptcy Code.
Camilla Denison, 42, President – Filtration Products (Champion Laboratories):Ms Denison is President of Filtration Products (Champion Laboratories) and will continue in her current role at UCI. Ms. Denison has been President since she joined Champion in 2005. From 2002 to 2004, she was CEO of Alemite Corporation. From 2000 to 2002, she was President, Automotive Solutions – Textron Fastening Systems. From 1998 to 2000, she was a business unit director at Visteon Corporation. Ms. Denison received a Bachelor of Science in Electrical Engineering from the GMI Engineering and Management Institute, and Master of Science degrees in Engineering and Management from the Massachusetts Institute of Technology.
Dimitri (Dee) Monge, 56, President – Fuel & Cooling Systems (Airtex):Mr. Monge is President of Fuel & Cooling Systems and will continue in his current role at UCI. Mr. Monge initially joined Airtex in 1968 during college. Mr. Monge was appointed as Chief Accountant in 1975; in 1980 Mr. Monge became Controller; in 1988 he was promoted to Vice President of Operations and was appointed President in 1990. Mr. Monge received a Bachelor degree and a Master of Business Administration from Southern Illinois University.
William (Bill) A. Allen, 61, President – Engine Management Components (Wells):Mr. Allen is President of Engine Management Components (Wells) and will continue in his current role at UCI. Mr. Allen has been President since he joined Wells in 1986. Prior to joining Wells, he held numerous positions with Chicago Pneumatic Tool Company (now a division of Atlas Copco) and Hennessy Industries (now a division of Danaher). Mr. Allen received a Bachelor of Science in Industrial Engineering from the University of Tennessee and an MBA from the University of Missouri, St. Louis. He is a Director of the National Exchange Bank & Trust.
| 22 | |
| B. | ASC Management |
ASC’s current management team built ASC’s profitable global manufacturing and distribution platform, which it has refined for more than 15 years. The Company’s executive management team is led by Ted Swaldo, an industry veteran with more than 18 years of experience and one of the original founders of ASC.
Key ASC Management
| Years of Experience | ||||||||||
| Name | Title | ASC | Industry | |||||||
| Theodore V. Swaldo | President and Chief Executive Officer | 30 | 18 | |||||||
| William Thomas Blackerby | Chief Operating Officer | 15 | 16 | |||||||
Theodore V. Swaldo, 62, President and Chief Executive Officer –Mr. Swaldo is one of the four original founders of American Switchgear Corporation (the predecessor of ASC) in 1976. Mr. Swaldo served as Executive Vice President of ASC until 1989, when he was promoted to his current position. Prior to founding ASC, Mr. Swaldo served as a bearing design engineer in the bearing division of The Timken Company. Mr. Swaldo holds an Associate’s degree in mechanical engineering from Tri-State College.
William Thomas Blackerby, 38, Chief Operating Officer –Mr. Blackerby joined ASC in 1991 as a senior buyer and was promoted to his current position in 2004. In addition, Mr. Blackerby serves as President of ASC Tianjin and Chairman of ASC Liancheng. Mr. Blackerby holds a bachelors degree in finance from Georgia State University and an MBA with a concentration in finance from the University of Akron.
| 23 | |
VI. HISTORICAL FINANCIAL OVERVIEW
HISTORICAL FINANCIAL OVERVIEW
| A. | UCI Financial Overview |
UCI’s objective is to maximize return on invested capital by using its strong market position, breadth of product offering and strong customer relationships to take advantage of the increasing demand for vehicle replacement parts. In 2005, UCI management completed a number of strategic initiatives that will positively impact the Company’s future financial performance. A summary of the key initiatives follows:
| • | In 2005, UCI completed its implementation of a two-year capital investment program at its filtration production operations (“Champ Phase II”), which was designed to expand capacity and reduce manufacturing costs by focusing on lean manufacturing techniques and automation. This project consolidated the operations at two facilities and added new, high-speed assembly lines for UCI’s filtration manufacturing processes. These investments added significant production capacity and have significantly reduced the labor content involved in assembly, which generated substantial cost savings. | ||
| • | Another of UCI’s strategic initiatives was the consolidation of the manufacturing operations in UCI’s fuel and cooling systems business. This project, which was completed in the first half of 2005, reduced the number of manufacturing facilities in this business from five to two. This consolidation is the result of UCI’s focus on lean manufacturing techniques and creating available manufacturing space through inventory reduction. | ||
| • | In early 2005, UCI completed the consolidation of its distribution network from 25 facilities to 12. In the second half of 2005, UCI re-engineered the production planning process at a major manufacturing location and has made substantial progress doing the same at a second major manufacturing location. | ||
| • | Another key strategic operating initiative is the centralization of UCI’s procurement activities. Through this initiative UCI has made significant progress toward leveraging best practices throughout its purchasing process, reducing the number of suppliers and increasing the percentage of UCI’s purchases from foreign sources. These changes continue to reduce UCI’s cost of sales and increase its gross margins. |
In addition to the initiatives the Company completed in 2005, management has had an intense focus on managing working capital over the past two and half years. As a result, UCI has improved inventory turns and extended days payable. These strategies have enabled UCI to reduce debt more quickly than originally projected. As highlighted in the table below, since its acquisition by Carlyle in June 2003, UCI’s has reduced net debt by $173.0 million, resulting in net leverage of 3.4x.
| 24 | |
Capitalization
| Actual | ||||||||
| ($ in millions) | 6/20/03 | 3/31/06 | ||||||
| Revolver | $ | 5.0 | — | |||||
| Term Loan | 350.0 | 217.0 | ||||||
| Subordinated Notes | 230.0 | 230.0 | ||||||
| Other | 2.0 | 0.3 | ||||||
Total Debt | $ | 587.0 | $ | 447.3 | ||||
| Less: Cash | (11.4 | ) | (45.1 | ) | ||||
Net Debt | $ | 575.6 | $ | 402.2 | ||||
| Net Leverage Ratio | 4.3 | x | 3.4 | x | ||||
Liquidity (Cash + Revolver Capacity)(1) | $ | 83.0 | $ | 112.1 | ||||
| 1. | Net of letters of credit, which totaled $3.4 million at 6/20/03 and $8.0 million at 3/31/06. |
UCI’s strong financial performance in 1Q 2006 begins to demonstrate the positive impact of the Company’s completed initiatives. The table below illustrates UCI’s historical financial performance.
UCI Historical Financial Performance
| FYE Dec. 31, | Period Ended March 31, | ||||||||||||||||||||||||
| ($ in millions) | 2003A | 2004A | 2005A | 1Q 2005 | 1Q 2006 | LTM | |||||||||||||||||||
Net Sales(1) | $ | 959.3 | $ | 1,026.7 | $ | 1,022.8 | $ | 245.5 | $ | 263.7 | $ | 1,041.0 | |||||||||||||
% Growth | 3.9 | % | 7.0 | % | (0.4 | %) | 7.4 | % | |||||||||||||||||
| Adjusted EBITDA | $ | 127.2 | $ | 138.5 | $ | 114.9 | $ | 24.6 | $ | 29.5 | $ | 119.8 | |||||||||||||
% Margin | 13.3 | % | 13.5 | % | 11.2 | % | 10.0 | % | 11.2 | % | 11.5 | % | |||||||||||||
| Recurring Capex | $ | 26.4 | $ | 24.8 | $ | 20.8 | $ | 5.7 | $ | 5.0 | $ | 20.1 | |||||||||||||
| Additional Investments | 17.0 | 20.0 | 11.0 | 3.9 | 1.3 | 8.4 | |||||||||||||||||||
| Total Capex | $ | 43.4 | $ | 44.8 | $ | 31.8 | $ | 9.6 | $ | 6.3 | $ | 28.5 | |||||||||||||
% of Net Sales | 4.5 | % | 4.4 | % | 3.1 | % | 3.9 | % | 2.4 | % | 2.7 | % | |||||||||||||
| Adjusted EBITDA - Capex | $ | 83.9 | $ | 93.7 | $ | 83.1 | $ | 15.0 | $ | 23.2 | $ | 91.3 | |||||||||||||
% of Net Sales | 8.7 | % | 9.1 | % | 8.1 | % | 6.1 | % | 8.8 | % | 8.8 | % | |||||||||||||
| 1. | Includes $14.0 million warranty reserve adjustments for 2005 and for the LTM period. |
Net Sales
Net sales increased $67.4 million, or 7.0%, from $959.3 million in 2003 to $1,026.7 million in 2004. The increase was primarily volume driven, with increases in all market channels. Net sales decreased $17.9 million, or 1.7%, from $1,026.7 million in 2004 to $1,008.8 million in 2005. $14.0 million of the sales reduction was attributable to a change in UCI’s estimate of outstanding potential warranty claims, resulting in net sales of $1,022.8 million in 2005. Excluding this $14.0 million, the decrease in sales from 2004 to 2005 was $3.9 million. This decrease was volume driven with lower sales to the retail, traditional and OEM channels, partially offset by higher sales to the OES and heavy-duty channels. Net sales in 1Q 2006 were up $18.2 million or 7.4% compared to 1Q 2005, primarily driven by strong sales in the retail and heavy-duty channels.
Adjusted EBITDA
In 2004, adjusted EBITDA increased $11.3 million, from $127.2 million or 13.3% of net sales, in 2003 to $138.5 million or 13.5% of net sales. The 2004 improvement in margin was attained despite the adverse effect of
| 25 | |
significantly higher steel costs. While the Company was largely successful in raising the selling prices of parts with high steel content, the net effect of increased steel costs, offset by selling price increases, adversely affected the 2004 adjusted EBITDA margin percentage by 0.3 of a percentage point, or $3.0 million. Excluding this net adverse affect, the 2004 adjusted EBITDA margin would have been 13.8%, which is 50 basis points better that the 2003 adjusted EBITDA margin. This improvement is due to gains in manufacturing efficiencies, increased sales volume, savings due to improved procurement of materials and reduced insurance costs.
In 2005, adjusted EBITDA decreased $23.6 million, from $138.5 million, 13.5% of sales, in 2004 to $114.9 million, 11.2% of net sales. Lower sales volume and higher steel costs in 2005 contributed to the adjusted EBITDA decline. The remaining decline in adjusted EBITDA and the associated margin were primarily due to the higher per-unit cost of manufacturing at lower production volumes and a shift in sales mix. These higher costs were partially offset by lower insurance costs and manufacturing cost reductions. Savings due to improved procurement practices offset inflation-driven wage increases and higher freight, non-steel raw material, and fuel costs caused by higher oil prices and general inflation. Additionally, the Company completed numerous headcount, consolidation and rationalization initiatives that will positively impact future period profitability. The partial benefit of these initiatives combined with strong volumes resulted in adjusted EBITDA in 1Q 2006 of $29.5 million, which is up $4.9 million or 19.9% when compared with 1Q 2005.
| B. | ASC Financial Overview |
Over the last few years ASC has recorded rapid growth due to competitive positioning, product quality and high levels of customer service. Throughout this period, numerous new customer wins have resulted in significantly increased sales and EBITDA growth.
The tables below illustrate ASC’s historical financial performance.
ASC Historical Financial Performance
| FYE Dec. 31, | Period Ended March 31, | ||||||||||||||||||||||||
| ($ in millions) | 2003A | 2004A | 2005A | 1Q 2005 | 1Q 2006(1) | LTM | |||||||||||||||||||
Net Sales(2) | $ | 75.8 | $ | 89.6 | $ | 105.6 | $ | 25.2 | $ | 26.2 | $ | 106.6 | |||||||||||||
% Growth | 11.3 | % | 18.1 | % | 17.9 | % | 3.9 | % | |||||||||||||||||
Adjusted EBITDA(3) | $ | 14.7 | $ | 16.6 | $ | 15.7 | (4) | $ | 3.5 | $ | 4.0 | $ | 16.2 | ||||||||||||
% Margin | 19.4 | % | 18.5 | % | 14.9 | % | 14.0 | % | 15.2 | % | 15.2 | % | |||||||||||||
| Capex | $ | 3.8 | $ | 11.7 | $ | 5.3 | $ | 1.8 | $ | 0.3 | $ | 3.8 | |||||||||||||
% of Net Sales | 5.1 | % | 13.1 | % | 5.0 | % | 7.1 | % | 1.1 | % | 3.6 | % | |||||||||||||
| Adjusted EBITDA - Capex | $ | 10.9 | $ | 4.9 | $ | 10.4 | $ | 1.7 | $ | 3.7 | $ | 12.4 | |||||||||||||
% of Net Sales | 14.3 | % | 5.4 | % | 9.9 | % | 6.8 | % | 14.1 | % | 11.6 | % | |||||||||||||
| Note: | ASC’s 1Q 2006 financial information is based on internal reporting and has not been reviewed by independent external auditors. | |
| 1. | Net sales adjusted for impact of transition to Pay-on-Scan of $10.1 million in 2004, $4.4 million in 2005, and $4.4 million in the LTM period. | |
| 2. | Includes $0.4 million, $0.8 million, $1.0 million and $1.0 million of expenses related to A/R factoring arrangement with customers for 2003, 2004, 2005 and the LTM period. | |
| 3. | Includes startup expense relating to new China facility and new customer ramp-up costs. |
Net Sales
ASC has achieved very strong financial performance since 2001, recording an annualized net sales growth of 21.2%, well above the 4.5% average annual growth rate of the automotive aftermarket for the same period. Leveraging its unique business model, ASC gained significant market share and became the market leader in the retail channel for new automotive aftermarket water pumps. Currently, ASC is investing in the traditional and OES channels to diversify its sales base and realize opportunities in those segments. In 1Q 2006 net sales increased $1 million, up 3.9% over 1Q 2005; this was driven by higher sales in the traditional and retail channels.
| 26 | |
Adjusted EBITDA
While recording above average sales growth rates, ASC also managed to increase its adjusted EBITDA margin from 8.3% in to 14.9% in the last four years. In 2005, ASC’s profit margins were negatively impacted due to one-time costs related to ramp-up costs associated with its new manufacturing facility in Tianjin, China, opened in January 2005. This facility did not begin to approach run rate utilization until late 2005. Additionally during 2005, ASC began servicing several new OES customers requiring additional investments and ramp-up costs. These charges increased the operational expenses and resulted in a decrease in the adjusted EBITDA margin relative to 2005. Benefiting from the higher run rate utilizations from its facilities and also the higher sales volumes, ASC experienced higher adjusted EBITDA in 1Q 2006. Adjusted EBITDA was $4.0 million or 14.3% higher in 1Q 2006 relative to 1Q 2005, resulting in LTM adjusted EBITDA of $16.2 million.
| C. | Pro Forma Consolidated Financial Overview |
In calculating the purchase price for the Transaction, certain adjustments are made to the headline price. In addition, the core management team of ASC is retaining ownership in the combined company through a management rollover. The table below provides a breakdown of these adjustments.
Transaction Overview
| ($ in millions) | ||||
Headline Price | $ | 158.7 | ||
| Fees and Expenses | 9.0 | |||
| ASC Excess Cash | 1.5 | |||
| Funding Deductions | ||||
| China Debt (remains outstanding) | ($ | 8.0 | ) | |
| Factored Receivables | (14.9 | ) | ||
| POS Accounts Payable | (5.1 | ) | ||
| Management Rollover | (8.3 | ) | ||
| Total | ($ | 36.2 | ) | |
Funding Required at Closing(1) | $ | 133.0 | ||
| 1. | Estimates, actual amounts may vary at closing. |
| • | Assumed China Debt:ASC has two subsidiaries in China – one is a wholly-owned subsidiary and one is a 51% owned JV. Debt attributable to these operations is $8.0 million and will remain outstanding. | ||
| • | Factored Receivables:Factoring relates to arrangements that ASC has with several customers by which it sells the receivables to manage working capital for cash. This figure represents the amount of receivables ASC has sold for which the factoring bank has not yet received the payment. | ||
| • | POS Accounts Payable:In August 2004, ASC began implementation of a Pay-on-Scan (“POS”) initiative with AutoZone. Under the POS program, inventory supplied to AutoZone by ASC remains on ASC’s books until the products are scanned at AutoZone’s checkout counter. To implement the POS program ASC repurchases inventory previously sold to AutoZone. When ASC repurchases inventory from AutoZone, ASC debits gross sales and credits accounts payable for the repurchase value of the inventory and debits inventory and credits cost of goods sold for the cost of sales related to the inventory. ASC “pays for” the inventory by issuing a monthly credit to AutoZone, which reduces the outstanding receivable from AutoZone by the amount of the credit. This monthly entry is recorded as a credit to accounts receivable and a debit to accounts payable. The program is structured such that each inventory repurchase incorporates certain SKUs into the program. Repurchases are made at 100% of AutoZone’s carrying cost of the repurchased inventory at the time of repurchase. | ||
| • | Management Rollover:ASC Management has agreed to roll $8.3 million of equity as part of the Transaction. |
| 27 | |
The following financial statements illustrate UCI’s financials pro forma for the acquisition of ASC.
Pro Forma Combined Financials
| FYE Dec. 31, | Period Ended March 31, | ||||||||||||||||||||
| ($ in millions) | 2004A | 2005A | 1Q 2005 | 1Q 2006 | LTM | ||||||||||||||||
Total Net Sales(1) | $ | 1,116.2 | $ | 1,128.5 | $ | 270.7 | $ | 289.8 | $ | 1,147.6 | |||||||||||
% Growth | 7.8 | % | 1.1 | % | 7.1 | % | |||||||||||||||
Gross Profit(2) | $ | 239.6 | $ | 209.6 | $ | 51.8 | $ | 61.1 | $ | 219.0 | |||||||||||
% Margin | 21.5 | % | 18.6 | % | 19.1 | % | 21.1 | % | 19.1 | % | |||||||||||
| Total Operating Costs (Excluding D&A) | ($ | 90.0 | ) | ($ | 117.0 | ) | ($ | 25.0 | ) | ($ | 29.4 | ) | ($ | 121.4 | ) | ||||||
Unadjusted EBITDA | $ | 149.6 | $ | 92.6 | $ | 26.8 | $ | 31.7 | $ | 97.5 | |||||||||||
% Margin | 13.4 | % | 8.2 | % | 9.9 | % | 10.9 | % | 8.5 | % | |||||||||||
Adjustments | |||||||||||||||||||||
| UCI Noncash Pension & Option Expense | $ | 1.4 | $ | 1.3 | $ | 0.2 | $ | 0.4 | $ | 1.6 | |||||||||||
UCI Restructuring & Other(3) | 5.9 | 37.3 | 0.6 | 1.6 | 38.3 | ||||||||||||||||
| ASC Adjustments | (0.9 | ) | 0.7 | 0.7 | — | — | |||||||||||||||
| Factoring Expense | (0.9 | ) | (1.3 | ) | (0.2 | ) | (0.3 | ) | (1.4 | ) | |||||||||||
Pro Forma Synergies(4) | — | 2.1 | — | — | 2.1 | ||||||||||||||||
Total Adjustments | $ | 5.5 | $ | 40.1 | $ | 1.3 | $ | 1.8 | $ | 40.6 | |||||||||||
Adjusted EBITDA | $ | 155.1 | $ | 132.7 | $ | 28.1 | $ | 33.5 | $ | 138.1 | |||||||||||
% Margin | 13.9 | % | 11.8 | % | 10.4 | % | 11.6 | % | 12.0 | % | |||||||||||
| Note: | ASC’s 1Q 2006 financial information is based on internal reporting and has not been reviewed by independent external auditors. | |
| 1. | Net sales adjusted for impact of transition to Pay-on-Scan of $10.1 million in 2004, $4.4 million in 2005, and $4.4 million in the LTM period. | |
| 2. | Gross profit adjusted for impact of transition to Pay-on-Scan of $3.6 million in 2004, $1.6 million in 2005, and $1.6 million in the LTM period. | |
| 3. | 2004 primarily includes inventory writedown and restructuring charges of $2.8 million and $1.7 million, respectively. 2005 and the LTM period primarily include warranty reserve adjustment, loss on trademark and impairment of property & equipment of $14.0 million, $18.7 million and $2.8 million, respectively. | |
| 4. | Includes the additional synergies that are expected to be realized in the first 12 months after the transaction closes. |
| 28 | |
Net Sales and Adjusted EBITDA Buildup
| FYE Dec. 31, | Period Ended March 31, | ||||||||||||||||||||||||
| ($ in millions) | 2003A | 2004A | 2005A | 1Q 2005 | 1Q 2006 | LTM | |||||||||||||||||||
NET SALES BUILDUP | |||||||||||||||||||||||||
UCI Net Sales | |||||||||||||||||||||||||
| Filtration Products | $ | 351.6 | $ | 370.8 | $ | 378.1 | $ | 87.3 | $ | 97.8 | $ | 388.6 | |||||||||||||
% Growth | 6.6 | % | 5.5 | % | 2.0 | % | 12.0 | % | |||||||||||||||||
| Fuel & Cooling Systems | $ | 318.8 | $ | 338.9 | $ | 319.4 | $ | 80.7 | $ | 84.1 | $ | 322.8 | |||||||||||||
% Growth | 5.9 | % | 6.3 | % | (5.8 | %) | 4.2 | % | |||||||||||||||||
| Engine, Driveline & Lighting Systems | $ | 292.5 | $ | 323.2 | $ | 339.8 | $ | 83.8 | $ | 84.8 | $ | 340.9 | |||||||||||||
% Growth | (10.0 | %) | 10.5 | % | 5.1 | % | 1.2 | % | |||||||||||||||||
| Corporate | ($ | 3.5 | ) | ($ | 6.3 | ) | ($ | 14.4 | ) | ($ | 6.3 | ) | ($ | 3.1 | ) | ($ | 11.2 | ) | |||||||
Total UCI Net Sales | $ | 959.3 | $ | 1,026.7 | $ | 1,022.8 | $ | 245.5 | $ | 263.7 | $ | 1,041.0 | |||||||||||||
% Growth | 3.3 | % | 7.0 | % | (0.4 | %) | 7.4 | % | |||||||||||||||||
ASC Net Sales(1) | $ | 75.8 | $ | 89.6 | $ | 105.6 | $ | 25.2 | $ | 26.2 | $ | 106.6 | |||||||||||||
% Growth | 11.3 | % | 18.2 | % | 17.9 | % | 3.9 | % | |||||||||||||||||
TOTAL NET SALES | $ | 1,035.1 | $ | 1,116.2 | $ | 1,128.5 | $ | 270.7 | $ | 289.8 | $ | 1,147.6 | |||||||||||||
% Growth | 3.9 | % | 7.8 | % | 1.1 | % | 7.1 | % | |||||||||||||||||
ADJUSTED EBITDA BUILDUP | |||||||||||||||||||||||||
UCI Adjusted EBITDA | $ | 127.2 | $ | 138.5 | $ | 114.9 | $ | 24.6 | $ | 29.5 | $ | 119.8 | |||||||||||||
% Margin | 13.3 | % | 13.5 | % | 11.2 | % | 10.0 | % | 11.2 | % | 11.5 | % | |||||||||||||
ASC Adjusted EBITDA | $ | 14.7 | $ | 16.6 | $ | 15.7 | $ | 3.5 | $ | 4.0 | $ | 16.2 | |||||||||||||
% Margin | 19.4 | % | 18.5 | % | 14.9 | % | 14.0 | % | 15.2 | % | 15.2 | % | |||||||||||||
Pro Forma Synergies(2) | — | — | 2.1 | — | — | 2.1 | |||||||||||||||||||
TOTAL ADJUSTED EBITDA | $ | 142.0 | $ | 155.1 | $ | 132.7 | $ | 28.1 | $ | 33.5 | $ | 138.1 | |||||||||||||
% Margin | 13.7 | % | 13.9 | % | 11.8 | % | 10.4 | % | 11.6 | % | 12.0 | % | |||||||||||||
| Note: | ASC’s 1Q 2006 financial information is based on internal reporting and has not been reviewed by independent external auditors. | |
| 1. | Net sales adjusted for impact of transition to Pay-on-Scan of $10.1 million in 2004 and $4.4 million in 2005 and the LTM period. | |
| 2. | Includes the additional synergies that are expected to be realized in the first 12 months after the transaction closes. |
| 29 | |
Pro Forma Combined Credit Statistics
| LTM | ||||
| ($ in millions) | 3/31/06 | |||
Operating Results | ||||
Total Net Sales(1) | $ | 1,147.6 | ||
| Adjusted EBITDA | $ | 138.1 | ||
| Combined Capex | (32.3 | ) | ||
Balance Sheet | ||||
| Cash | $ | 26.6 | ||
| Total Net Debt | $ | 541.7 | ||
| Senior Secured Debt | $ | 330.0 | ||
| Total Debt | $ | 568.3 | ||
Leverage | ||||
| Total Net Debt / Adjusted EBITDA | 3.92 | x | ||
| Senior Secured Debt / Adjusted EBITDA | 2.39 | x | ||
| Total Debt / Adjusted EBITDA | 4.11 | x | ||
| Total Debt / Adjusted EBITDA-Total Capex | 5.37 | x | ||
| Note: | ASC’s 1Q 2006 financial information is based on internal reporting and has not been reviewed by independent external auditors. | |
| 1. | Net sales adjusted for impact of transition to Pay-on-Scan of $4.4 million in the LTM period. |
Pro Forma Consolidated Balance Sheet as of 3/31/06
| ($ in millions) | ||||
| Assets | ||||
| Cash and cash equivalents | $ | 26.6 | ||
| Accounts receivable | 284.6 | |||
| Inventories | 216.3 | |||
| Other current assets | 48.1 | |||
Total Current Assets | $ | 575.5 | ||
| Fixed assets | $ | 215.2 | ||
| Goodwill | 210.3 | |||
| Other assets | 184.5 | |||
Total Assets | $ | 1,185.6 | ||
| Liabilities and Shareholders’ Equity | ||||
| Accounts payable | $ | 135.2 | ||
| Accrued expenses & other | 107.2 | |||
Total Current Liabilities | $ | 242.4 | ||
| Other liabilities | $ | 80.2 | ||
Total debt | $ | 568.3 | ||
Shareholders’ equity | $ | 294.7 | ||
Total Liabilities & Shareholders’ Equity | $ | 1,185.6 | ||
| Note: | Valuation of intangibles is preliminary, but will be refined through independent valuation analysis. ASC’s 1Q 2006 financial information is based on internal reporting and has not been reviewed by independent external auditors. |
| 30 | |