As filed with the Securities and Exchange Commission on January 16, 2013
Registration No. 333-184678
UNITED STATES
SECURITIES AND EXCHANGE COMMISSION
Washington, DC 20549
FORM N-14
| REGISTRATION STATEMENT | |
| UNDER THE SECURITIES ACT OF 1933 | x |
| | |
| Pre-Effective Amendment No. 1 | x |
| Post-Effective Amendment No. | o |
| (Check appropriate box or boxes) | |
The Universal Institutional Funds, Inc.
(Exact name of Registrant as Specified in its Charter)
522 Fifth Avenue
New York, New York 10036
(Address, Including Zip Code, and Telephone Number, Including Area Code, of Registrant’s Principal Executive Offices)
Stefanie V. Chang Yu, Esq.
Morgan Stanley Investment Management Inc.
522 Fifth Avenue
New York, New York 10036
(Name and Address of Agent for Service)
Copy to:
Carl Frischling, Esq.
Kramer Levin Naftalis & Frankel LLP
1177 Avenue of the Americas
New York, New York 10036 | | Stuart M. Strauss, Esq.
Dechert LLP
1095 Avenue of the Americas
New York, New York 10036 |
Approximate Date of Proposed Public Officer: As soon as practicable after the effective date of this Registration Statement.
No filing fee is required because an indefinite number of common shares of beneficial interest of The Universal Institutional Funds, Inc. have previously been registered pursuant to Section 24f-2 under the Investment Company Act of 1940.
The Registrant hereby amends this Registration Statement on such date or dates as may be necessary to delay its effective date until the Registrant shall file a further amendment which specifically states that this Registration Statement shall thereafter become effective in accordance with Section 8(a) of the Securities Act of 1933 or until this Registration Statement shall become effective on such date as the Commission, acting pursuant to said Section 8(a), may determine.
MORGAN STANLEY VARIABLE INVESTMENT SERIES
522 Fifth Avenue
New York, NY 10036
Dear Variable Life Insurance and Variable Annuity Contract Owners:
Morgan Stanley Variable Investment Series (the "Trust") will hold a special meeting of shareholders of the Strategist Portfolio (the "Acquired Fund") on February 21, 2013 at 9:00 a.m., New York time, at the offices of Morgan Stanley Investment Management Inc., Conference Room 3A, Third Floor, 522 Fifth Avenue, New York, NY 10036. At the meeting, shareholders of the Acquired Fund will be asked to consider and vote upon a proposal to approve the actions and transactions described in that certain Agreement and Plan of Reorganization, dated September 28, 2012 (the "Reorganization Agreement"), between the Trust, on behalf of the Acquired Fund, and The Universal Institutional Funds, Inc., on behalf of the Global Tactical Asset Allocation Portfolio (the "Acquiring Fund"), pursuant to which substantially all of the assets and the liabilities of the Acquired Fund will be transferred to the Acquiring Fund in exchange for shares of the Acquiring Fund of the Class described in the accompanying Proxy Statement and Prospectus and pursuant to which the Acquired Fund will be liquidated and terminated (the "Reorganization"). A formal Notice of Special Meeting of Shareholders appears on the next page, followed by the Proxy Statement and Prospectus, which explains in more detail the proposal to be considered.
Like the Acquired Fund, the Acquiring Fund is currently offered only to certain life insurance companies in connection with particular variable life insurance and/or variable annuity contracts they issue (each an "Insurance Company" and, collectively, the "Insurance Companies"). Please review the enclosed Proxy Statement and Prospectus for a more detailed description of the Reorganization and the specific reasons it is being proposed.
If you are an owner of a variable life insurance and/or variable annuity contract issued by the separate accounts of the Insurance Companies, you are not a shareholder of the Acquired Fund, but you have the right to instruct your Insurance Company how to vote at the Meeting. You may give voting instructions for the number of shares of the Acquired Fund attributable to your variable life insurance policy or variable annuity contract as of the close of business on December 26, 2012.
The Board of Trustees of the Acquired Fund recommends that you give voting instructions in favor of the Reorganization. In order for shares to be voted at the Meeting based on your instructions, we urge you to read the Proxy Statement and Prospectus and then complete and mail your Voting Instruction Form in the enclosed postage-paid envelope. To give voting instructions by touch-tone telephone or via the Internet, follow the instructions on the Voting Instruction Form.
Please take a few moments to review the details of the proposal. If you have any questions regarding the Reorganization, please feel free to call the contact number listed in the enclosed Proxy Statement and Prospectus. We urge you to vote at your earliest convenience.
We appreciate your participation and prompt response in this matter and thank you for your continued support.
Very truly yours,
Arthur Lev
President and Principal Executive Officer
January 18, 2013
MORGAN STANLEY VARIABLE INVESTMENT SERIES
STRATEGIST PORTFOLIO
522 Fifth Avenue
New York, NY 10036
(800) 869-6397
NOTICE OF SPECIAL MEETING OF SHAREHOLDERS
TO BE HELD FEBRUARY 21, 2013
To the Shareholders of the Strategist Portfolio:
Notice is hereby given of a Special Meeting of Shareholders (the "Meeting") of the Strategist Portfolio (the "Acquired Fund"), a series of Morgan Stanley Variable Investment Series (the "Trust"), to be held in Conference Room 3A, 3rd Floor, 522 Fifth Avenue, New York, NY 10036, at 9:00 a.m., New York time, on February 21, 2013, and any adjournments or postponements thereof, for the following purposes:
1. To consider and vote upon a proposal to approve the actions and transactions described in that certain Agreement and Plan of Reorganization, dated September 28, 2012 (the "Reorganization Agreement"), between the Trust, on behalf of the Acquired Fund, and The Universal Institutional Funds, Inc. (the "Company"), on behalf of the Global Tactical Asset Allocation Portfolio (the "Acquiring Fund"), pursuant to which substantially all of the assets and the liabilities of the Acquired Fund will be transferred to the Acquiring Fund in exchange for shares of the Acquiring Fund of the Class described in the accompanying Proxy Statement and Prospectus and pursuant to which the Acquired Fund will be liquidated and terminated (the "Reorganization"). As a result of this transaction, shareholders of the Acquired Fund will become shareholders of the Acquiring Fund receiving shares of the Acquiring Fund with a value equal to the aggregate net asset value of their shares of the Acquired Fund held immediately prior to the Reorganization; and
2. To act upon such other matters as may properly come before the Meeting.
The Reorganization is more fully described in the accompanying Proxy Statement and Prospectus and a form of the Reorganization Agreement is attached as Exhibit A thereto. Shareholders of record of the Acquired Fund as of the close of business on December 26, 2012 are entitled to notice of, and to vote at, the Meeting and any adjournments or postponements thereof. The Board of Trustees of the Acquired Fund recommends that shareholders vote in favor of the Reorganization.
By Order of the Board of Trustees,
Mary E. Mullin
Secretary
January 18, 2013
THE UNIVERSAL INSTITUTIONAL FUNDS, INC.
GLOBAL TACTICAL ASSET ALLOCATION PORTFOLIO
522 Fifth Avenue
New York, NY 10036
(800) 869-6397
This Proxy Statement and Prospectus is being furnished to shareholders ("Shareholders") of the Strategist Portfolio (the "Acquired Fund"), a series of Morgan Stanley Variable Investment Series (the "Trust"), in connection with a Special Meeting of Shareholders (the "Meeting") to be held in Conference Room 3A, 3rd Floor, 522 Fifth Avenue, New York, NY 10036, at 9:00 a.m., New York time, on February 21, 2013, and any adjournments or postponements thereof, for the following purposes:
1. To consider and vote upon a proposal to approve the actions and transactions described in that certain Agreement and Plan of Reorganization, dated September 28, 2012 (the "Reorganization Agreement"), between the Trust, on behalf of the Acquired Fund, and The Universal Institutional Funds, Inc. (the "Company"), on behalf of the Global Tactical Asset Allocation Portfolio (the "Acquiring Fund"), pursuant to which substantially all of the assets and the liabilities of the Acquired Fund will be transferred to the Acquiring Fund in exchange for shares of the Acquiring Fund of the Class described in the accompanying Proxy Statement and Prospectus and pursuant to which the Acquired Fund will be liquidated and terminated (the "Reorganization"). As a result of this transaction, shareholders of the Acquired Fund will become shareholders of the Acquiring Fund receiving shares of the Acquiring Fund with a value equal to the aggregate net asset value ("NAV") of their shares of the Acquired Fund held immediately prior to the Reorganization; and
2. To act upon such other matters as may properly come before the Meeting.
The terms and conditions of the transaction are more fully described in this Proxy Statement and Prospectus and in the form of the Reorganization Agreement attached hereto as Exhibit A. The address and telephone number of the Acquired Fund are the same as those of the Acquiring Fund set forth above. This Proxy Statement also constitutes a Prospectus of the Acquiring Fund, filed by the Company with the Securities and Exchange Commission (the "Commission") as part of the Company's Registration Statement on Form N-14 (the "Registration Statement"). The Acquired Fund and Acquiring Fund are referred to collectively as the "Funds."
The Funds are each series of registered open-end management investment companies. The Acquiring Fund's investment objective of total return is similar to the Acquired Fund's investment objective of high total investment return through a fully managed investment policy utilizing equity, fixed income and money market securities and the writing of covered call and put options. Shares of each Fund are offered only to certain life insurance companies in connection with particular variable life insurance and/or variable annuity contracts they issue (each an "Insurance Company" and, collectively, the "Insurance Companies"). Each Insurance Company is the legal owner of shares of the Acquired Fund and has the right to vote those shares at the Meeting. Although being an owner of a variable life insurance or variable annuity contract (a "Contract") issued by separate accounts of the Insurance Companies does not make you a shareholder of the Acquired Fund, you have the right to instruct your Insurance Company on how to vote at the Meeting.
This Proxy Statement and Prospectus sets forth concisely information about the Acquiring Fund that shareholders of the Acquired Fund should know before voting on the Reorganization Agreement. A copy of the Prospectuses for the Acquiring Fund, each dated April 30, 2012, as may be amended and supplemented from time to time, are attached as Exhibit B, which Prospectuses form a part of Post-Effective Amendment No. 48 to the Company's Registration Statement on Form N-1A (File Nos. 333-03013; 811-07607), and incorporated herein by reference. Also incorporated herein by reference are the Prospectuses of the Acquired Fund, each dated April 30, 2012, as may be amended and supplemented from time to time, which Prospectuses form a part of Post-Effective Amendment No. 50 to the Company's Registration Statement on Form N-1A (File Nos. 333-03013; 811-07607).
In addition, also enclosed and incorporated herein by reference is the Annual Report of the Company relating to the Acquiring Fund for the fiscal year ended December 31, 2011 (File No. 811-07607) and the Semi-Annual
Report of the Company related to the Acquiring Fund for the six-month period ended June 30, 2012 (File No. 811-07607). Also incorporated by reference is the Annual Report of the Trust relating to the Acquired Fund for the fiscal year ended December 31, 2011 (File No. 811-03692) and the Semi-Annual Report of the Trust relating to the Acquired Fund for the six-month period ended June 30, 2012 (File No. 811-03692). A Statement of Additional Information relating to the Reorganization, described in this Proxy Statement and Prospectus, dated January 18, 2013, has been filed with the Commission and is also incorporated herein by reference. Such documents are available upon request and without charge by calling (800) 869-6397 with respect to the Acquired Fund and (800) 281-2715 with respect to the Acquiring Fund or by visiting the Commission's website at www.sec.gov.
Shareholders are advised to read and retain this Proxy Statement and Prospectus for future reference.
The Securities and Exchange Commission has not approved or disapproved these securities or passed upon the adequacy of this Prospectus. Any representation to the contrary is a criminal offense.
This Proxy Statement and Prospectus is dated January 18, 2013.
TABLE OF CONTENTS
PROXY STATEMENT AND PROSPECTUS
Synopsis | | | 1 | | |
General | | | 1 | | |
The Reorganization | | | 1 | | |
Fee Tables | | | 2 | | |
Annual Fund Operating Expenses | | | 4 | | |
Portfolio Turnover | | | 4 | | |
Tax Consequences of the Reorganization | | | 4 | | |
Comparison of the Acquired Fund and Acquiring Fund | | | 4 | | |
Record Date | | | 7 | | |
Voting Information | | | 7 | | |
General | | | 7 | | |
Solicitation of Proxies and Voting Instructions | | | 7 | | |
Voting Procedures | | | 7 | | |
Quorum | | | 8 | | |
Adjournments; Other Business | | | 8 | | |
Expenses of Solicitation | | | 8 | | |
Vote Required | | | 8 | | |
Principal Risk Factors | | | 9 | | |
Performance Information | | | 11 | | |
The Reorganization | | | 14 | | |
The Board's Considerations | | | 14 | | |
The Reorganization Agreement | | | 15 | | |
Tax Aspects of the Reorganization | | | 17 | | |
Description of Shares | | | 18 | | |
Capitalization Tables (unaudited) | | | 18 | | |
Appraisal Rights | | | 19 | | |
Comparison of Investment Objectives, Principal Policies and Restrictions | | | 19 | | |
Investment Objectives and Policies | | | 19 | | |
Investment Restrictions | | | 21 | | |
Additional Information About the Acquiring Fund and the Acquired Fund | | | 22 | | |
General | | | 22 | | |
Rights of Acquired Fund Shareholders and Acquiring Fund Shareholders | | | 22 | | |
Financial Information | | | 23 | | |
Shareholder Proposals | | | 23 | | |
Management | | | 23 | | |
Description of Shares and Shareholder Inquiries | | | 24 | | |
Dividends, Distributions and Taxes | | | 24 | | |
Purchases and Redemptions | | | 24 | | |
Share Information | | | 24 | | |
Financial Statements and Experts | | | 25 | | |
Legal Matters | | | 26 | | |
Available Information | | | 26 | | |
Other Business | | | 26 | | |
Exhibit A—Agreement and Plan of Reorganization | | | A-1 | | |
Exhibit B—Prospectuses of the Acquiring Fund dated April 30, 2012, as they may be
amended and supplemented from time to time | | | B-1 | | |
Exhibit C—Annual Report for the Company relating to the Acquiring Fund for the fiscal year
ended December 31, 2011 | | | C-1 | | |
Exhibit D—Semi-Annual Report of the Company relating to the Acquiring Fund for the six-month
period ended June 30, 2012 | | | D-1 | | |
SYNOPSIS
The following is a synopsis of certain information contained in or incorporated by reference in this Proxy Statement and Prospectus. This synopsis is only a summary and is qualified in its entirety by the more detailed information contained or incorporated by reference in this Proxy Statement and Prospectus and the Reorganization Agreement. Shareholders should carefully review this Proxy Statement and Prospectus and the Reorganization Agreement in their entirety and, in particular, the Acquiring Fund's Prospectuses, which are attached to this Proxy Statement and Prospectus as Exhibit B and incorporated herein by reference.
General
This Proxy Statement and Prospectus is being furnished to Shareholders of the Acquired Fund, a series of an open-end management investment company, in connection with the solicitation by the Board of Trustees of the Trust, on behalf of the Acquired Fund (the "Board" or "Board of Trustees"), of proxies ("Proxies") to be used at the Meeting to consider the Reorganization. It is expected that the first mailing of this Proxy Statement and Prospectus will be made on or about January 22, 2013.
Pursuant to the Reorganization, Class X Shareholders of the Acquired Fund will receive Class I shares of the Acquiring Fund, and Class Y Shareholders of the Acquired Fund will receive Class II shares of the Acquiring Fund. The shares to be issued by the Acquiring Fund in connection with the Reorganization (the "Acquiring Fund Shares") will be issued at NAV without any sales charges. Further information relating to the Acquiring Fund is set forth herein and in the Acquiring Fund's current Prospectuses, each dated April 30, 2012 (the "Acquiring Fund's Prospectuses"), attached to this Proxy Statement and Prospectus as Exhibit B and incorporated herein by reference.
The Board of Directors of the Company, on behalf of the Acquiring Fund (the "Board of Directors"), has authorized the issuance of the Acquiring Fund Shares to Shareholders of the Acquired Fund in connection with the Reorganization. The information concerning the Acquired Fund contained herein has been supplied by the Trust. The information concerning the Acquiring Fund contained herein has been supplied by the Company.
The Reorganization
The Reorganization is being proposed because the Board has determined that such Reorganization is in the best interests of the Acquired Fund and its shareholders. The Reorganization will allow shareholders of the Acquired Fund to be invested in a fund that is managed according to similar investment objectives, strategies and restrictions but with a more flexible global investment mandate. In addition, while contractual management fees are higher for the Acquiring Fund, the Acquiring Fund will have lower total operating expenses due to proposed advisory fee waivers and/or expense reimbursements in place for at least two years from the date of the Reorganization. Moreover, the Reorganization will allow shareholders of the Acquired Fund to be invested in a fund with greater future sales and asset growth potential and a wider distribution through the intermediary insurance channel than the Acquired Fund. There is no assurance that the proposed advisory fee waivers and/or expense reimbursements will continue and therefore the total expense ratio of the Class I and Class II shares of the Acquiring Fund may be higher in the future. See "The Reorganization—The Board's Considerations."
The Reorganization Agreement provides for the transfer of substantially all the assets and the liabilities of the Acquired Fund to the Acquiring Fund in exchange for Acquiring Fund Shares. The aggregate NAV of the Acquiring Fund Shares issued in the exchange will equal the aggregate value of the net assets of the Acquired Fund received by the Acquiring Fund. On or after the closing date scheduled for the Reorganization (the "Closing Date"), the Acquired Fund will distribute the Acquiring Fund Shares received by the Acquired Fund to its Shareholders as of the Valuation Date (as defined below) in complete liquidation of the Acquired Fund and, without further notice, the outstanding shares of the Acquired Fund held by the Shareholders will then be redeemed and canceled as permitted by the organizational documents of the Acquired Fund and applicable law. The Acquired Fund thereafter will be terminated as a series of the Trust. As a result of the Reorganization, each shareholder will receive that number of full and fractional Acquiring Fund Shares equal in value to such shareholder's pro rata interest in the net assets of the Acquired Fund transferred to the Acquiring Fund. Pursuant to the Reorganization, Class X Shareholders of the Acquired Fund will receive Class I shares of the Acquiring Fund and Class Y Shareholders of the Acquired Fund
1
will receive Class II shares of the Acquiring Fund. The Board has determined that the interests of the shareholders will not be diluted as a result of the Reorganization. The "Valuation Date" is the third business day following the receipt of the requisite approval of this Reorganization Agreement by shareholders of the Acquired Fund or at such time on such earlier or later date after such approval as may be mutually agreed upon in writing.
For the reasons set forth below under "The Reorganization—The Board's Considerations," the Board, including the Trustees who are not "interested persons" of the Acquired Fund ("Independent Board Members"), as that term is defined in the Investment Company Act of 1940, as amended (the "1940 Act"), has concluded that the Reorganization is advisable and in the best interests of the Acquired Fund and its Shareholders and recommends approval of the Reorganization.
Fee Tables
The following tables briefly describe the annual Fund operating expenses that Shareholders of the Funds may pay if they buy and hold shares of the Funds. Total Annual Fund Operating Expenses in the tables below do not reflect the impact of any charges by your insurance company. Each Fund pays expenses for management of its assets, distribution of its shares and other services, and those expenses are reflected in the NAV per share of each Fund. These expenses are deducted from each respective Fund's assets and are based on actual expenses incurred by each of the Acquiring Fund and Acquired Fund for its semi-annual period ended June 30, 2012. The tables also set forth pro forma fees for the surviving combined fund (Global Tactical Asset Allocation Portfolio) (the "Combined Fund") reflecting what the fee schedule would have been on June 30, 2012, if the Reorganization had been consummated twelve (12) months prior to that date.
Annual Fund Operating Expenses
(expenses that are deducted from Fund assets)
Strategist Portfolio (Acquired Fund) | | Class X | | Class Y | |
Advisory Fees | | | 0.42 | % | | | 0.42 | % | |
Distribution (12b-1) Fees | | | None | | | | 0.25 | % | |
Other Expenses | | | 0.21 | % | | | 0.21 | % | |
Total Annual Fund Operating Expenses | | | 0.63 | % | | | 0.88 | % | |
Global Tactical Asset Allocation Portfolio (Acquiring Fund) | | Class I | | Class II | |
Advisory Fees | | | 0.75 | % | | | 0.75 | % | |
Distribution (12b-1) Fees | | | None | | | | 0.35 | % | |
Other Expenses | | | 0.98 | % | | | 0.98 | % | |
Acquired Fund Fees & Expenses* | | | 0.01 | % | | | 0.01 | % | |
Total Annual Fund Operating Expenses† | | | 1.74 | % | | | 2.09 | % | |
Fee Waiver and/or Expense Reimbursement † | | | 0.73 | % | | | 0.98 | % | |
Total Annual Fund Operating Expenses After
Fee Waiver and/or Expense Reimbursement† | | | 1.01 | % | | | 1.11 | % | |
2
Pro Forma Combined Fund (Global Tactical Asset Allocation Portfolio) | | Class I | | Class II | |
Advisory Fees | | | 0.75 | % | | | 0.75 | % | |
Distribution (12b-1) Fees | | | None | | | | 0.35 | % | |
Other Expenses | | | 0.50 | % | | | 0.50 | % | |
Acquired Fund Fees & Expenses* | | | 0.01 | % | | | 0.01 | % | |
Total Annual Fund Operating Expenses‡ | | | 1.26 | % | | | 1.61 | % | |
Fee Waiver and/or Expense Reimbursement‡ | | | 0.65 | % | | | 0.90 | % | |
Total Annual Fund Operating Expenses After
Fee Waiver and/or Expense Reimbursement‡ | | | 0.61 | % | | | 0.71 | % | |
* The Acquired Fund may invest a portion of its assets in other investment companies (the "Other Investment Companies"). The Acquiring Fund's shareholders indirectly bear a pro rata portion of the expenses of the Other Investment Companies in which the Acquiring Fund invests. "Acquired Fund Fees & Expenses" in the table is an estimate of those expenses. The estimate is based upon the average allocation of the Acquiring Fund's investments in the Other Investment Companies and upon the actual total operating expenses of the Other Investment Companies (including any current waivers and expense limitations) for the semi-annual period ended June 30, 2012. Actual Acquired Fund fees and expenses incurred by the Acquiring Fund may vary with changes in the allocation of Acquiring Fund assets among the Other Investment Companies and with other events that directly affect the fees and expenses of the Other Investment Companies. Since "Acquired Fund Fees & Expenses" are not directly borne by the Acquiring Fund, they are not reflected in the Acquiring Fund's financial statements, with the result that the information presented in the table will differ from that presented in the Acquiring Fund's financial highlights.
† Morgan Stanley Investment Management Inc. ("MSIM"), the Acquiring Fund's and Acquired Fund's adviser, has agreed to reduce its advisory fee and/or reimburse the Acquiring Fund so that Total Annual Fund Operating Expenses, excluding certain investment related expenses (but including any 12b-1 fee paid to the Acquiring Fund's "Distributor," Morgan Stanley Distribution, Inc., with respect to Class II shares), will not exceed 1.00% for Class I and 1.10% for Class II. The fee waivers and/or expense reimbursements will continue for at least one year or until such time as the Company's Board of Directors acts to discontinue all or a portion of such waivers and/or reimbursements when it deems such action is appropriate. The expenses of the Other Investment Companies are not taken into account when calculating the fee waivers and/or expense reimbursements.
‡ MSIM has agreed to reduce its advisory fee and/or reimburse the Combined Fund so that Total Annual Fund Operating Expenses, excluding certain investment related expenses (but including any 12b-1 fee paid to the Combined Fund's "Distributor," Morgan Stanley Distribution, Inc., with respect to Class II shares), will not exceed 0.60% for Class I and 0.70% for Class II. The fee waivers and/or expense reimbursements will continue for at least two years from the date of the Reorganization or until such time as the Company's Board of Directors acts to discontinue all or a portion of such waivers and/or reimbursements when it deems such action is appropriate. The expenses of the Other Investment Companies are not taken into account when calculating the fee waivers and/or expense reimbursements.
Example
To attempt to show the effect of these expenses on an investment over time, the hypothetical example shown below has been created. The example assumes that an investor invests $10,000 in either the Acquired Fund or Acquiring Fund for the time periods indicated and that an investor then redeems all of his or her shares at the end of those periods. The example also assumes that the investment has a 5% return each year and that the operating expenses for each Fund remains the same (as set forth in the chart above). Although a shareholder's actual costs may be higher or lower, the table below shows a shareholder's costs at the end of each period based on these assumptions.
Strategist Portfolio (Acquired Fund) | | 1 Year | | 3 Years | | 5 Years | | 10 Years | |
Class X | | $ | 64 | | | $ | 202 | | | $ | 351 | | | $ | 786 | | |
Class Y | | $ | 90 | | | $ | 281 | | | $ | 488 | | | $ | 1,084 | | |
3
Global Tactical Asset Allocation Portfolio (Acquiring Fund) | | | 1 Year | | | | 3 Years | | | | 5 Years | | | | 10 Years | | |
Class I | | $ | 103 | | | $ | 322 | | | $ | 558 | | | $ | 1,236 | | |
Class II | | $ | 113 | | | $ | 353 | | | $ | 612 | | | $ | 1,352 | | |
Pro Forma Combined Fund (Global Tactical Asset Allocation Portfolio) | |
Class I | | $ | 62 | | | $ | 195 | | | $ | 340 | | | $ | 762 | | |
Class II | | $ | 73 | | | $ | 227 | | | $ | 395 | | | $ | 883 | | |
Annual Fund Operating Expenses
The purpose of the foregoing fee tables is to assist shareholders in understanding the various costs and expenses that a shareholder in each Fund may pay if they buy and hold shares of the Funds. For a more complete description of these costs and expenses, see "Comparison of Acquired Fund and Acquiring Fund—Investment Advisory Fees," "—Plan of Distribution Fees," "—Other Significant Fees" and "—Purchases and Redemptions" below.
Portfolio Turnover
Each Fund pays transaction costs, such as commissions, when it buys and sells securities (or "turns over" its portfolio). A higher portfolio turnover rate may indicate higher transaction costs. These costs, which are not reflected in Total Annual Fund Operating Expenses or in the Example, affect Fund performance. During the most recent fiscal year, the Acquiring Fund's portfolio turnover rate was 109% of the average value of its portfolio and the Acquired Fund's portfolio turnover rate was 121% of the average value of its portfolio.
Tax Consequences of the Reorganization
As a condition to the Reorganization, the Acquired Fund has requested an opinion of Dechert LLP to the effect that, based upon certain facts, assumptions and representations, the Reorganization will constitute a tax-free reorganization for federal income tax purposes, and no gain or loss will be recognized by the Acquired Fund, the Acquiring Fund or the Acquired Fund's shareholders for federal income tax purposes as a result of the transactions included in the Reorganization. Receipt of such opinion is a condition to the Reorganization. For further information about the tax consequences of the Reorganization, see "The Reorganization—Tax Aspects of the Reorganization" below.
Comparison of Acquired Fund and Acquiring Fund
Investment Objectives. The Acquired Fund's investment objective is to seek high total investment return through a fully managed investment policy utilizing equity, fixed income and money market securities and the writing of covered call and put options. The Acquiring Fund's investment objective is to seek total return.
Principal Investment Policies. Each of the Acquired Fund and the Acquiring Fund is a diversified fund that may invest in a blend of equity and fixed income securities of U.S. and non-U.S. issuers.
With respect to the Acquired Fund, MSIM actively allocates the Fund's assets among the major asset categories of equity securities, fixed income securities and money market instruments based on, among other things, MSIM's assessment of the effects of economic and market trends on different sectors of the market. There is no limit as to the percentage of assets that may be allocated to any one asset class. Within the equity sector, MSIM allocates funds to those economic sectors MSIM expects to benefit from major trends and to individual stocks which MSIM considers to have superior investment potential. Within the fixed income sector of the market, MSIM seeks to maximize the return on its investments by adjusting maturities and coupon rates as well as by exploiting yield differentials among different types of bonds. Within the money market sector of the market, MSIM seeks to maximize returns by exploiting spreads among short-term instruments.
With respect to the Acquiring Fund, MSIM utilizes a top-down investment approach that focuses on asset class, sector, region, country, and currency and thematic allocations, which is based upon MSIM's evaluations and analyses, taking into account results of its fundamental market research and recommendations generated by MSIM's quantitative models. MSIM's research process focuses on three large macro factors across almost all asset classes: 1) valuation (both relative and absolute); 2) dynamics, including earnings revisions, interest rate policy and
4
inflation expectations; and 3) technicals, such as liquidity and sentiment. The Acquiring Fund may invest 10% of its total assets in other investment companies, including exchange-traded funds ("ETFs").
Equity securities in which each Fund may invest include, among others, common stocks, preferred stocks, depositary receipts, rights, warrants and convertible securities. Fixed income securities in which each Fund may invest include, among others, corporate bonds and notes, U.S. government securities and convertible securities.
Each Fund may invest in real estate investment trusts ("REITs") and asset-backed securities, including mortgage securities. The Acquired Fund may also invest in collateralized mortgage obligations ("CMOs"), stripped mortgage-backed securities ("SMBS"), inverse floating rate obligations ("inverse floaters") and to-be-announced pass-through mortgage securities, which settle on a delayed delivery basis ("TBAs").
Each Fund may invest in developing or emerging market countries. Each Fund's investments may be U.S. and non-U.S. dollar denominated. Each Fund may also invest in restricted and illiquid securities and below investment grade fixed income securities (commonly known as "junk bonds"). The Acquired Fund may also invest in sovereign debt securities and corporate debt securities of issuers outside the United States.
Each Fund may use derivative instruments such as options, futures, swaps, structured investments and other related instruments and technique. In particular, each Fund may utilize forward foreign currency exchange contracts in connection with its investments in foreign securities.
The principal differences between the principal investment policies of the Acquired Fund and the Acquiring Fund are more fully described under "Comparison of Investment Objectives, Principal Policies and Restrictions" below.
Fund Management. The Acquiring Fund and Acquired Fund are both managed within MSIM's Global Asset Allocation team, and, if the Reorganization is approved, the Acquiring Fund is expected to continue to be managed within MSIM's Global Asset Allocation team. The team consists of portfolio managers and analysts. Current members of the team jointly and primarily responsible for the day-to-day management of the Acquiring Fund are Mark A. Bavoso and Cyril Moullé-Berteaux.
Mr. Bavoso has been associated with MSIM in an investment management capacity since 1986, and has managed the Acquiring Fund since September 2010. Mr. Moullé-Berteaux has been associated with MSIM in an investment management capacity since August 2011, and has managed the Acquiring Fund since August 2011. Mr. Moullé-Berteaux was a founding partner and portfolio manager of Traxis Partners LP from March 2003 to July 2011.
Additional information about the portfolio managers' compensation structure, other accounts each of managed by the portfolio managers and the portfolio managers' ownership of securities in the Funds is provided in the Trust's and Company's Statement of Additional Information.
Investment Advisory Fees. The Acquiring Fund and Acquired Fund currently obtain advisory services from MSIM. MSIM is a wholly-owned subsidiary of Morgan Stanley with its principal office located at 522 Fifth Avenue, New York, NY 10036. Morgan Stanley is a preeminent global financial services firm engaged in securities trading and brokerage activities, as well as providing investment banking, research and analysis, financing and financial advisory services.
The annual advisory fee (as a percentage of daily net assets) payable by the Funds is set forth below. The Funds pay their advisory fees on a monthly basis.
Strategist Portfolio: | | 0.42% of the portion of the daily net assets not exceeding $1.5 billion; and 0.395% of the portion of the daily net assets exceeding $1.5 billion | |
Global Tactical Asset
Allocation Portfolio*: | | 0.75% of the portion of the daily net assets not exceeding $500 million; 0.70%
of the portion of the daily net assets exceeding $500 million but not exceeding $1 billion; and 0.65% of the portion of the daily net assets exceeding $1 billion | |
* MSIM has agreed to reduce its advisory fee and/or reimburse the Acquiring Fund so that Total Annual Portfolio Operating Expenses, excluding certain investment related expenses (but including any 12b-1 fee paid to the Acquiring Fund's Distributor, with respect to Class II shares), will not exceed 1.00% with respect to Class I
5
shares and 1.10% with respect to Class II shares. The fee waivers and/or expense reimbursements will continue for at least one year or until such time as the Company's Board of Directors acts to discontinue all or a portion of such waivers and/or reimbursements when it deems such action is appropriate. The expenses of the Acquired Funds are not taken into account when calculating the fee waivers and/or expense reimbursements.
Although contractual management fees are higher for the Acquiring Fund, the Acquiring Fund will have lower total operating expenses due to the advisory fee waivers and/or expense reimbursements instituted by MSIM for at least two years from the date of the Reorganization.
Comparison of Other Service Providers. The Acquired Fund and Acquiring Fund have the same transfer agent, custodian, distributor and independent registered public accounting firm. For each Fund, the transfer agent is Morgan Stanley Services Company Inc., the custodian is State Street Bank and Trust Company, the distributor is Morgan Stanley Distribution, Inc., and the independent registered public accounting firm is Ernst & Young LLP. The Acquired Fund's administrator is Morgan Stanley Services Company Inc. The Acquiring Fund's administrator is Morgan Stanley Investment Management Inc.
Plan of Distribution Fees. The Trust has adopted a plan of distribution with respect to Class Y shares of the Acquired Fund, pursuant to Rule 12b-1 under the 1940 Act (the "Trust Plan"). The Company has adopted a plan of distribution with respect to Class II shares of the Acquiring Fund, pursuant to Rule 12b-1 under the 1940 Act (the "Company Plan" and together with the Trust Plan, the "Plans"). Under the Trust Plan, the Acquired Fund pays distribution fees in connection with the sale and distribution of Class Y shares of 0.25% of the average daily net assets of such class. Under the Company Plan, the Acquiring Fund pays distribution fees in connection with the sale and distribution of Class II shares at an annual rate of 0.35% of the Acquiring Fund's average daily net assets attributable to such class. Such amounts are paid to compensate each Fund's distributor for remittance to insurance companies, qualified pension plans or retirement plans (as applicable) which offer the applicable Fund as an investment option. These payments are intended to compensate insurance companies for distribution and/or administrative related expenses incurred or paid in connection with the distribution of the applicable shares of the Funds. The Acquiring Fund's distributor has agreed to waive 0.25% of the 0.35% 12b-1 fee that it may receive. This waiver will continue for at least one year or until such time as the Company's Board of Directors acts to discontinue all or a portion of such waiver when it deems such action is appropriate. MSIM and/or the Acquiring Fund's distributor may pay additional compensation (out of their own funds and not as an expense of the Acquiring Fund) to certain affiliated or unaffiliated brokers, dealers and/or certain insurance companies or other financial intermediaries or service providers in connection with the sale, distribution, marketing and/or retention of shares of the Acquiring Fund and/or shareholder servicing. For a complete description of the arrangement with respect to the Acquired Fund, see the section of the Acquired Fund's prospectuses entitled "Plan of Distribution" and the section of the Acquired Fund's Statement of Additional Information entitled "V. Investment Advisory and Other Services—D. Rule 12b-1 Plan." For a complete description of the arrangement with respect to the Acquiring Fund, see the section of the Acquiring Fund's Prospectuses (attached as Exhibit B) entitled "Distribution Plan" and the section of the Acquiring Fund's Statement of Additional Information entitled "Distribution of Shares (Applicable to Class II Shares Only)."
Other Significant Fees. The Acquiring Fund and Acquired Fund pay additional fees in connection with their operations, including legal, auditing, transfer agent and custodial fees. See "Synopsis—Fee Tables" above for the percentage of average net assets represented by such "Other Expenses."
Purchases and Redemptions. The Company's Board of Directors has authorized the issuance of the Acquiring Fund Shares in connection with the Reorganization.
Acquired Fund. Shares of the Acquired Fund are offered on each day that the New York Stock Exchange ("NYSE") is open for business. The Acquired Fund offers its shares only to insurance company separate accounts that insurance companies establish to fund variable life insurance and/or variable annuity contracts. An insurance company purchases or redeems shares of the Acquired Fund based on, among other things, the amount of net contract premiums or purchase payments allocated to a separate account investment division, transfers to or from a separate account investment division, contract loans and repayments, contract withdrawals and surrenders, and benefit payments. The contract prospectus describes how contract owners may allocate, transfer and withdraw amounts to and from separate accounts.
6
For further information on the purchase and sale of shares of the Acquired Fund, see the sections of the Acquired Fund's prospectuses entitled "Purchase and Sales of Portfolio Shares" and "Pricing Portfolio Shares," as well as the section of the Acquired Fund's Statement of Additional Information entitled "VIII. Purchase, Redemption and Pricing of Shares."
Acquiring Fund. Shares of the Acquiring Fund are offered on each day that the NYSE is open for business. The Acquiring Fund offers its shares only to insurance companies for separate accounts that insurance companies establish to fund variable life insurance and variable annuity contracts, and to other entities under qualified pension and retirement plans. An insurance company purchases or redeems shares of the Acquiring Fund based on, among other things, the amount of net contract premiums or purchase payments allocated to a separate account investment division, transfers to or from a separate account investment division, contract loans and repayments, contract withdrawals and surrenders, and benefit payments. The contract prospectus describes how contract owners may allocate, transfer and withdraw amounts to, and from, separate accounts.
For further information on the purchase and sale of shares of the Acquiring Fund, see the sections of the Acquiring Fund's Prospectuses (attached as Exhibit B) entitled "Purchasing and Selling Portfolio Shares" and "Pricing of Portfolio Shares," as well as the section of the Acquiring Fund's Statement of Additional Information entitled "Net Asset Value."
Dividends. Each Fund declares dividends separately for each of its classes. Each Fund pays dividends from net investment income and distributes net realized capital gains, if any, at least annually.
Record Date
The Board has fixed the close of business on December 26, 2012 as the record date (the "Record Date") for the determination of shareholders of the Acquired Fund entitled to notice of, and to vote at, the Meeting. As of the Record Date, there were 3,281,312 shares of the Acquired Fund issued and outstanding.
VOTING INFORMATION
General
The shares of the Acquired Fund are currently sold to the Insurance Companies as the record owners for allocation to certain of their separate accounts that are registered as investment companies under the 1940 Act.
Solicitation of Proxies and Voting Instructions
The Board is soliciting proxies from the shareholders of the Acquired Fund, including the Insurance Companies, which have the right to vote upon matters that may be voted upon at the Meeting. The Insurance Companies will furnish this Proxy Statement and Prospectus to the owners of Contracts participating in their separate accounts that are registered with the Commission under the 1940 Act ("Registered Accounts") and that hold shares of the Acquired Fund to be voted at the Meeting, and will solicit voting instructions from those Contract owners.
Each Insurance Company will vote shares of the Acquired Fund held in its Registered Accounts: (i) for which timely voting instructions are received from Contract owners, in accordance with such instructions; and (ii) for which no voting instructions are timely received, in the same proportion as the instructions received from Contract owners participating in all its Registered Accounts. The Insurance Companies will vote all other shares of the Acquired Fund held by them in the same proportion as the voting instructions timely received by all the Insurance Companies from Contract owners participating in all their Registered Accounts. The effect of proportional voting as described above is that a small number of Contract owners can determine the outcome of the voting.
Voting Procedures
Proxies from shareholders may be revoked at any time prior to the voting of the shares represented thereby by: (i) mailing written instructions addressed to the Secretary of the Trust, 522 Fifth Avenue, 19th Floor, New York, NY 10036; (ii) signing and returning a new proxy; or (iii) attending the Meeting and voting shares. Attendance at the
7
Meeting will not in and of itself revoke a proxy. All valid proxies will be voted in accordance with specifications thereon, or in the absence of specifications, for approval of the Reorganization. Instructions from Contract owners may be revoked by: (i) mailing written instructions addressed to the Secretary of the Trust, 522 Fifth Avenue, 19th Floor, New York, NY 10036; or (ii) signing and returning a new Voting Instruction Form. A Contract owner may also attend the Meeting in person to revoke previously provided voting instructions and to provide new voting instructions.
Quorum
Shareholders of record as of the close of business on the Record Date are entitled to one vote per share and a fractional vote for a fractional share on each matter submitted to a vote at the Meeting. Shareholders of each class of the Acquired Fund will vote together as a single class in connection with the Reorganization Agreement. The holders of a majority of the shares issued and outstanding and entitled to vote of the Acquired Fund, represented in person or by proxy, will constitute a quorum at the Meeting.
In the event that the necessary quorum to transact business or the vote required to approve or reject the Reorganization is not obtained at the Meeting, the persons named as proxies may propose one or more adjournments of the Meeting to permit further solicitation of proxies. Any such adjournment will require the affirmative vote of the holders of a majority of shares of the Acquired Fund present in person or by proxy at the Meeting. Where an adjournment is proposed because the necessary quorum to transact business is not obtained at the Meeting, the persons named as proxies will vote in favor of such adjournment provided that such persons named as proxies determine that such adjournment and additional solicitation is reasonable and in the interests of shareholders based on all relevant factors, including the nature of the proposal, the percentage of shareholders present, the nature of the proposed solicitation activities and the nature of the reasons for the further solicitation. Where an adjournment is proposed because the vote required to approve or reject the Reorganization is not obtained at the Meeting, the persons named as proxies will vote in favor of such adjournment those proxies which they are entitled to vote in favor of the Reorganization and will vote against any such adjournment those proxies required to be voted against the Reorganization. Abstentions will not be voted either for or against any such adjournment.
Adjournments; Other Business
The Meeting has been called to transact any business that properly comes before it. The only business that management of the Trust intends to present or knows that others will present is the Reorganization. If any other matters properly come before the Meeting, and on all matters incidental to the conduct of the Meeting, the persons named as proxies intend to vote the proxies in accordance with their judgment, unless the Secretary of the Trust has previously received written contrary instructions from the shareholder entitled to vote the shares.
Expenses of Solicitation
Voting instructions will be solicited primarily by mailing this Proxy Statement and Prospectus and its enclosures. In addition to the voting instructions by mail, employees of MSIM and its affiliates, without additional compensation, may solicit voting instructions in person or by telephone, facsimile or oral communication. The expenses of the Reorganization, including the cost of printing, filing and voting instructions solicitation, and legal and accounting expenses, are expected to be approximately $189,050 ($117,000 of which will be borne by the Acquired Fund). The remainder of the Reorganization expenses will be borne by MSIM.
Vote Required
Approval of the Reorganization by shareholders requires the affirmative vote of a majority of the outstanding shares of the Acquired Fund present or represented by Proxy. Abstentions are not considered votes "FOR" the Reorganization at the Meeting. As a result, abstentions have the same effect as a vote against the Reorganization because approval of the Reorganization requires the affirmative vote of a percentage of the voting securities present or represented by proxy.
If the Reorganization is not approved by shareholders of the Acquired Fund, the Acquired Fund will continue in existence and the Board will consider alternative actions for such Fund.
8
PRINCIPAL RISK FACTORS
The principal risks of investing in the Acquiring Fund are substantially similar to those of investing in the Acquired Fund. The value of an investment in all of the Funds is based on the market prices of the securities such Fund holds. These prices change daily due to economic and other events that affect markets generally, as well as those that affect particular regions, countries, industries, companies or governments.
Equity Securities. Each Fund may invest in equity securities. In general, prices of equity securities are more volatile than those of fixed income securities. The prices of equity securities will rise and fall in response to a number of different factors. In particular, prices of equity securities will respond to events that affect entire financial markets or industries (changes in inflation or consumer demand, for example) and to events that affect particular issuers (news about the success or failure of a new product, for example). To the extent that a Fund invests in convertible securities, and the convertible security's investment value is greater than its conversion value, its price will be likely to increase when interest rates fall and decrease when interest rates rise. If the conversion value exceeds the investment value, the price of the convertible security will tend to fluctuate directly with the price of the underlying equity security.
Fixed Income Securities. Each Fund may invest in fixed income securities. Market prices of a Fund's fixed income securities respond to economic developments, especially changes in interest rates, changes in the general level of spreads between U.S. Treasury and non-Treasury securities, as well as to perceptions of the creditworthiness of individual issuers. Generally, fixed income securities decrease in value as interest rates rise and vice versa. Prices of fixed income securities also generally will fall if an issuer's credit rating declines, and rise if it improves. Prices of longer term fixed income securities also are generally more volatile, so the average maturity of the securities in a Fund affects risk. Securities with greater spread durations are likely to be more sensitive to changes in spreads between U.S. Treasury and non-Treasury securities, generally making them more volatile than securities with lesser spread durations. Spread duration measures the change in the value of the security (or portfolio) for a given change in the interest rate spread (difference) between U.S. Treasury and non-Treasury securities.
Lower Rated Fixed Income Securities ("Junk Bonds"). Each Fund may invest in fixed income securities that are rated below investment grade or are not rated, but are of equivalent quality. These fixed income securities are often referred to as high yield securities or "junk bonds." High yield securities range from those for which the prospect for repayment of principal and interest is predominantly speculative to those which are currently in default on principal or interest payments. When a Fund invests in high yield securities, it generally seeks to receive a correspondingly higher return on the securities it holds to compensate it for the additional credit risk and market risk it has assumed. High yield securities may be issued by companies that are restructuring, are smaller and less creditworthy or are more highly indebted than other companies. This means that they may have more difficulty making scheduled payments of principal and interest. Prices of high yield securities will rise and fall primarily in response to actual or perceived changes in the issuer's financial health, although changes in market interest rates also will affect prices. High yield securities may experience reduced liquidity, and sudden and substantial decreases in price.
Mortgage Securities. Each Fund may invest in mortgage securities. The prices of mortgage securities may be particularly sensitive to changes in interest rates because of the risk that borrowers will become more or less likely to refinance their mortgages. For example, an increase in interest rates generally will reduce prepayments, effectively lengthening the maturity of some mortgage securities, and making them subject to more drastic price movements. Because of prepayment issues, it is not possible to predict the ultimate maturity of mortgage securities. Rates of prepayment faster or slower than anticipated by MSIM could result in reduced yields, increased volatility and/or reductions in NAV.
In addition, the Acquired Fund may invest in TBAs. Investments in TBAs may give rise to a form of leverage. Leverage may cause the Acquired Fund to be more volatile than if the Acquired Fund had not been leveraged. Further, TBAs may cause the Acquired Fund's portfolio turnover rate to appear higher.
9
Collateralized Mortgage Obligations. The Acquired Fund may invest in CMOs. The principal and interest on the mortgage loans or mortgage pass-through securities ("Mortgage Assets") comprising a CMO may be allocated among the several classes of a CMO in many ways. The general goal in allocating cash flows on Mortgage Assets to the various classes of a CMO is to create certain tranches on which the expected cash flows have a higher degree of predictability than do the underlying Mortgage Assets. As a general matter, the more predictable the cash flow is on a particular CMO tranche, the lower the anticipated yield on that tranche at the time of issue will be relative to the prevailing market yields on the Mortgage Assets. As part of the process of creating more predictable cash flows on certain tranches of a CMO, one or more tranches generally must be created that absorb most of the changes in the cash flows on the underlying Mortgage Assets. The yields on these tranches are generally higher than prevailing market yields on other mortgage-related securities with similar average lives. Principal prepayments on the underlying Mortgage Assets may cause the CMOs to be retired substantially earlier than their stated maturities or final distribution dates. Because of the uncertainty of the cash flows on these tranches, the market prices and yields of these tranches are more volatile and may increase or decrease in value substantially with changes in interest rates and/or rates of prepayment. Due to the possibility that prepayments (on home mortgages and other collateral) will alter the cash flow on CMOs, it is not possible to determine in advance the final maturity date or average life. Faster prepayment will shorten the average life and slower prepayments will lengthen it. In addition, if the collateral securing CMOs or any third party guarantees are insufficient to make payments, the Portfolio could sustain a loss.
Stripped Mortgage-Backed Securities. The Acquired Fund may invest in SMBS. SMBS are derivative multi-class mortgage securities. SMBS may be issued by agencies or instrumentalities of the U.S. Government, or by private originators. A common type of SMBS will have one class receiving some of the interest and most of the principal from the Mortgage Assets, while the other class receives most of the interest and the remainder of the principal. In the most extreme case, one class will receive all of the interest (the interest-only or "IO" class), while the other class will receive all of the principal (the principal-only or "PO" class). Investments in each class of SMBS are extremely sensitive to changes in interest rates. IOs tend to decrease in value substantially if interest rates decline and prepayment rates become more rapid. POs tend to decrease in value substantially if interest rates increase and the rate of prepayment decreases. If the Acquired Fund invests in SMBS and interest rates move in a manner not anticipated by Fund management, it is possible that the Acquired Fund could lose all or substantially all of its investment.
Inverse Floaters. The Acquired Fund may invest in inverse floaters. Inverse floating rate obligations are obligations which pay interest at rates that vary inversely with changes in market rates of interest. Because the interest rate paid to holders of such obligations is generally determined by subtracting a variable or floating rate from a predetermined amount, the interest rate paid to holders of such obligations will decrease as such variable or floating rate increases and increase as such variable or floating rate decreases. Like most other fixed-income securities, the value of inverse floaters will decrease as interest rates increase. They are more volatile, however, than most other fixed-income securities because the coupon rate on an inverse floater typically changes at a multiple of the change in the relevant index rate. Thus, any rise in the index rate (as a consequence of an increase in interest rates) causes a correspondingly greater drop in the coupon rate of an inverse floater while a drop in the index rate causes a correspondingly greater increase in the coupon of an inverse floater. Some inverse floaters may also increase or decrease substantially because of changes in the rate of prepayments.
REITs. Each Fund may invest in REITs. REITs pool investors' funds for investments primarily in real estate properties or real estate related loans. Like mutual funds, REITs have expenses, including advisory and administration fees, that are paid by their shareholders. Operating REITs requires specialized management skills, and a Fund indirectly bears management expenses along with the indirect expenses of the Fund. The performance of any Fund REIT holdings ultimately depends on the types of real property in which the REITs invest and how well the property is managed. A general downturn in real estate values also can hurt REIT performance. In addition, REITs are subject to certain provisions under federal tax law. The failure of a company to qualify as a REIT could have adverse consequences for a Fund, including significantly reducing the return to the Fund on its investment in such company.
10
Foreign and Emerging Market Securities. Each Fund may invest in foreign and emerging market securities. Investing in foreign countries, particularly emerging market or developing countries, entails the risk that news and events unique to a country or region will affect those markets and their issuers. These same events will not necessarily have an effect on the U.S. economy or similar issuers located in the United States. In addition, investments in certain foreign markets, which have historically been considered stable, may become more volatile and subject to increased risk due to ongoing developments and changing conditions in such markets. Moreover, the growing interconnectivity of global economies and financial markets has increased probability that adverse developments and conditions in one country or region will affect the stability of economies and financial markets in other countries or regions. Furthermore, a Fund's investments in foreign countries generally will be denominated in foreign currencies. As a result, changes in the value of a country's currency compared to the U.S. dollar may affect the value of a Fund's investments. These changes may occur separately from and in response to events that do not otherwise affect the value of the security in the issuer's home country. Hedging a Fund's currency risks through foreign currency forward exchange contracts involves the risk of mismatching the Fund's objectives under a foreign currency forward exchange contract with the value of securities denominated in a particular currency. There is additional risk that such transactions reduce or preclude the opportunity for gain and that currency contracts create exposure to currencies in which a Fund's securities are not denominated.
Restricted and Illiquid Securities. Each Fund may invest in restricted and illiquid securities. A Fund's investments in restricted and illiquid securities may entail greater risk than investments in publicly traded securities. These securities may be more difficult to sell, particularly in times of market turmoil. Illiquid securities may be more difficult to value. If a Fund is forced to sell an illiquid security to fund redemptions or for other cash needs, it may be forced to sell the security at a loss.
Derivatives. Each Fund may invest in derivatives. A derivative instrument often has risks similar to its underlying asset and may have additional risks, including imperfect correlation between the value of the derivative and the underlying asset, risks of default by the counterparty to certain transactions, magnification of losses incurred due to changes in the market value of the securities, instruments, indices or interest rates to which they relate, and risks that the transactions may not be liquid. Certain derivative transactions may give rise to a form of leverage. Leverage magnifies the potential for gain and the risk of loss.
The foregoing discussion is a summary of the principal risk factors. For a more complete discussion of the risks of the Acquiring Fund, see "Details of the Portfolio—Global Tactical Asset Allocation Portfolio—Risks" in the Acquiring Fund's Prospectuses attached hereto as Exhibit B. For a more complete discussion of the risks of the Acquired Fund, see "Portfolio Details—Additional Information About the Portfolio's Investment Objective, Strategies and Risks—Principal Risks" in the Acquired Fund's prospectuses, each incorporated herein by reference.
PERFORMANCE INFORMATION
The bar charts and tables below provide some indication of the risks of investing in the each Fund by showing changes in the performance of the Acquiring Fund's Class I and Class II shares and the Acquired Fund's Class X and Class Y shares from year to year and by showing how the average annual returns of the Acquiring Fund's Class I and Class II shares and the Acquired Fund's Class X and Class Y shares for the one, five and 10 year periods or since inception, as applicable, compare with those of broad measures of market performance over time. This performance information does not include the impact of any charges deducted by your insurance company. If it did, returns would be lower. Each Fund's past performance does not indicate how such Fund will perform in the future.
11
Global Tactical Asset Allocation Portfolio (Acquiring Fund)
Annual Total Returns—Calendar Years (Class I)
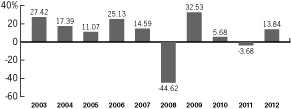
High
Quarter | | 6/30/09: | | | 26.02 | % | |
Low Quarter | | 9/30/08: | | | -21.64 | % | |
Average Annual Total Returns for Periods Ended December 31, 2012 (Class I)
| | Global Tactical
Asset Allocation
Portfolio | | MSCI All
Country
World Index
(reflects no
deduction for
fees, expenses,
or taxes)† | |
Past One Year | | | 13.84 | % | | | 16.13 | % | |
Past Five Years | | | -3.19 | % | | | -1.16 | % | |
Past Ten Years | | | 7.32 | % | | | 8.11 | % | |
† The Morgan Stanley Capital International (MSCI) All Country World Index (ACWI) is a free float-adjusted market capitalization weighted index designed to measure the equity market performance of developed and emerging markets. The term "free float" represents the portion of shares outstanding that are deemed to be available for purchase in the public equity markets by investors. The performance of the index is listed in U.S. dollars and assumes reinvestment of net dividends. It is not possible to invest directly in an index.
Annual Total Returns—Calendar Years (Class II)
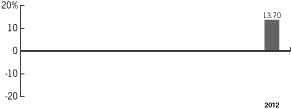
High
Quarter | | 3/31/12: | | | 8.28 | % | |
Low Quarter | | 6/30/12: | | | -3.02 | % | |
12
Average Annual Total Returns for Periods Ended December 31, 2012 (Class II)
| | Global Tactical
Asset Allocation
Portfolio | | MSCI All
Country
World Index
(reflects no
deduction for
fees, expenses,
or taxes)† | |
Past One Year | | | 13.70 | % | | | 16.13 | % | |
Since Inception (3/15/11) | | | 4.99 | % | | | 4.71 | % | |
† The Morgan Stanley Capital International (MSCI) All Country World Index (ACWI) is a free float-adjusted market capitalization weighted index designed to measure the equity market performance of developed and emerging markets. The term "free float" represents the portion of shares outstanding that are deemed to be available for purchase in the public equity markets by investors. The performance of the index is listed in U.S. dollars and assumes reinvestment of net dividends. It is not possible to invest directly in an index.
Strategist Portfolio (Acquired Fund)
Annual Total Returns—Calendar Years (Class X)

High
Quarter | | 6/30/03: | | | 12.71 | % | |
Low Quarter | | 12/31/08: | | | -13.19 | % | |
Average Annual Total Returns for Periods Ended December 31, 2012 (Class X)
| | Strategist
Portfolio | | S&P 500®
Index
(reflects no
deduction for
fees, expenses,
or taxes)1 | | Barclays Capital
U.S. Government/
Credit Index
(reflects no
deduction for
fees, expenses,
or taxes)2 | |
Past 1 Year | | | 6.91 | % | | | 16.00 | % | | | 4.82 | % | |
Past 5 Years | | | -0.88 | % | | | 1.66 | % | | | 6.06 | % | |
Past 10 Years | | | 6.08 | % | | | 7.10 | % | | | 5.25 | % | |
(1) The Standard & Poor's 500® Index (S&P 500®) measures the performance of the large cap segment of the U.S. equities market, covering approximately 75% of the U.S. equities market. The Index includes 500 leading companies in leading industries of the U.S. economy. It is not possible to invest directly in an index.
(2) The Barclays Capital U.S. Government/Credit Index tracks the performance of government and corporate obligations, including U.S. government agency and Treasury securities and corporate and Yankee bonds. It is not possible to invest directly in an index.
13
Annual Total Returns—Calendar Years (Class Y)

High
Quarter | | 6/30/03: | | | 12.75 | % | |
Low Quarter | | 12/31/08: | | | -13.23 | % | |
Average Annual Total Returns for Periods Ended December 31, 2012 (Class Y)
| | Strategist
Portfolio | | S&P 500®
Index
(reflects no
deduction for
fees, expenses,
or taxes)1 | | Barclays Capital
U.S. Government/
Credit Index
(reflects no
deduction for
fees, expenses,
or taxes)2 | |
Past 1 Year | | | 6.68 | % | | | 16.00 | % | | | 4.82 | % | |
Past 5 Years | | | -1.13 | % | | | 1.66 | % | | | 6.06 | % | |
Past 10 Years | | | 5.82 | % | | | 7.10 | % | | | 5.25 | % | |
THE REORGANIZATION
The Board's Considerations
The Board, including the Independent Board Members, unanimously declared advisable and approved the Reorganization on behalf of the Acquired Fund and determined to recommend that shareholders of the Acquired Fund approve the Reorganization. In connection with the Board's review of the Reorganization, MSIM advised the Board about a variety of matters, including, but not limited to:
1. the similarity of the investment objectives, policies and risks of the Acquiring Fund as compared to the Acquired Fund;
2. the similarity of the portfolio management teams;
3. the asset base of the Acquiring Fund as compared to the Acquiring Fund;
4. the current and future sales and asset growth potential of the Acquiring Fund as compared to the Acquired Fund;
5. the advantages to shareholders of the Acquired Fund of investing in a fund with a more flexible global investment mandate and potential for greater diversification;
6. the wider distribution of the Acquiring Fund through the intermediary insurance channel as compared to the Acquired Fund;
7. although contractual management fees are higher for the Acquiring Fund, the Combined Fund will have lower total operating expenses than the Acquired Fund due to the advisory fee waivers and/or expense reimbursements instituted by MSIM for at least two years from the date of the Reorganization;
14
8. the terms and conditions of the Reorganization, which would affect the price of shares to be issued in the Reorganization;
9. that there is not expected to be a significant amount of portfolio turnover as a result of the Reorganization;
10. the estimated expenses of the Reorganization, such as the expenses of this solicitation, including the cost of preparing and mailing this Proxy Statement and Prospectus, which will be borne by the Acquired Fund (up to a maximum of $117,000) in connection with the Reorganization;
11. the tax-free nature of the Reorganization; and
12. while the Reorganization may delay when capital losses can be utilized, there is no expectation that any amount of losses would be written off.
The Board considered the similarity of the investment objectives, policies and risks of the Acquiring Fund and the Acquired Fund and noted that the investments of the Acquired Fund may be held by the Acquiring Fund in accordance with the investment guidelines of the Acquiring Fund. The Board and MSIM discussed that while the Acquiring Fund has a smaller asset base as compared to the Acquired Fund; MSIM believes that the Acquiring Fund has greater potential for future sales and asset growth as compared to the Acquired Fund. In this regard, the parties discussed the wider distribution channel of the Acquiring Fund as compared to the Acquired Fund, which is no longer being utilized in new variable annuity contracts offered by the Insurance Companies. The Board also considered the potential advantages to shareholders of the Acquired Fund of investing in the Acquiring Fund which has a more flexible global investment mandate that allows MSIM to build a more globally diversified portfolio.
The Board noted that while the Acquiring Fund's advisory fee rate (0.75% of average daily net assets) is higher than the Acquired Fund's advisory fee rate (0.42% of average daily net assets), the total annual operating expenses of the Combined Fund will be lower than the total annual operating expenses of the Acquired Fund as a result of the proposed waivers and/or expense reimbursements. The Board also noted that MSIM has agreed, for at least two years following from the date of the Reorganization, to reduce its advisory fee and/or reimburse the Combined Fund, so that total annual operating expenses, excluding certain investment related expenses (but including any 12b-1 fee paid to the Combined Fund's Distributor, Morgan Stanley Distribution, Inc., with respect to Class II shares), will not exceed 0.60% for Class I shares and 0.70% for Class II shares of the Combined Fund.
The Board discussed with MSIM the foreseeable short- and long-term effects of the Reorganization on the Acquired Fund and its Shareholders, including the possibility that the Acquiring Fund may experience increased redemptions in the period of time that follows the closing of the Reorganization and that if this were to occur, it would decrease the anticipated net asset size of the Combined Fund.
In its deliberations, the Board considered all information it received, as described above, as well as advice and analysis from its counsel. The Board considered the Reorganization and the impact of the Reorganization on the Acquired Fund and its shareholders. The Board concluded, based on all of the information presented, that the Reorganization is advisable and in the best interest of the Acquired Fund's Shareholders and that shareholders will not be diluted as a result thereof, and decided to recommend that the Acquired Fund's Shareholders approve the Reorganization.
If shareholders of the Acquired Fund do not approve the Reorganization, the Board will consider other courses of action for the Acquired Fund.
The Reorganization Agreement
The terms and conditions under which the Reorganization would be consummated, as summarized below, are set forth in the Reorganization Agreement. This summary is qualified in its entirety by reference to the Agreement and Plan of Reorganization, a copy of which is attached as Exhibit A to this Proxy Statement and Prospectus.
The Reorganization Agreement provides that (i) the Acquired Fund will transfer substantially all of its assets, including portfolio securities, cash, cash equivalents and receivables, to the Acquiring Fund on the Closing Date in
15
exchange for the assumption by the Acquiring Fund of all liabilities of the Acquired Fund, including all expenses, costs, charges and reserves, as reflected on an unaudited statement of assets and liabilities of Acquired Fund prepared by the Treasurer of the Acquired Fund as of the Valuation Date (as defined below) in accordance with generally accepted accounting principles consistently applied from the prior audited period, and the delivery of the Acquiring Fund Shares; (ii) such Acquiring Fund Shares would be distributed to shareholders on the Closing Date or as soon as practicable thereafter; (iii) the Acquired Fund would be liquidated and terminated; and (iv) the outstanding shares of the Acquired Fund would be canceled.
The number of Acquiring Fund Shares to be delivered to the Acquired Fund will be determined by dividing the aggregate NAV of each class of shares of the Acquired Fund acquired by the Acquiring Fund by the NAV per share of the corresponding class of shares of the Acquiring Fund; these values will be calculated as of the close of business of the NYSE on the third business day following the receipt of the requisite approval by shareholders of the Reorganization Agreement or at such other time as the Acquiring Fund and Acquired Fund may agree (the "Valuation Date"). As an illustration, assume that on the Valuation Date, Class X shares of the Acquired Fund had an aggregate NAV of $100,000. If the NAV per Class I share of the Acquiring Fund were $10 per share at the close of business on the Valuation Date, the number of Class I shares of the Acquiring Fund to be issued would be 10,000 ($100,000 ÷ $10). These 10,000 Class I shares of the Acquiring Fund would be distributed to the former Class X shareholders of the Acquired Fund. This example is given for illustration purposes only and does not bear any relationship to the dollar amounts or shares expected to be involved in the Reorganization.
On the Closing Date or as soon as practicable thereafter, the Acquired Fund will distribute pro rata to its shareholders of record as of the close of business on the Valuation Date, the Acquiring Fund Shares it receives. Each shareholder will receive the class of shares of the Acquiring Fund that corresponds to the class of shares of the Acquired Fund currently held by that shareholder. Accordingly, the Acquiring Fund Shares will be distributed as follows: each of the Class I shares of the Acquiring Fund will be distributed to holders of the Class X shares of the Acquired Fund and each of the Class II shares of the Acquiring Fund will be distributed to holders of Class Y shares of the Acquired Fund. The Acquiring Fund will cause its transfer agent to credit and confirm an appropriate number of the Acquiring Fund's Shares to each shareholder.
The consummation of the Reorganization is contingent upon the approval of the Reorganization by the shareholders and the receipt of the other opinions and certificates set forth in Sections 6, 7 and 8 of the Reorganization Agreement and the occurrence of the events described in those Sections, certain of which may be waived by a Fund. The Reorganization Agreement may be amended in any mutually agreeable manner.
The Reorganization Agreement may be terminated and the Reorganization abandoned at any time, before or after approval by shareholders, by mutual consent of the Trust, on behalf of the Acquiring Fund, and the Acquired Fund. In addition, either party may terminate the Reorganization Agreement upon the occurrence of a material breach of the Reorganization Agreement by the other party or if, by September 28, 2013, any condition set forth in the Reorganization Agreement has not been fulfilled or waived by the party entitled to its benefits.
Under the Reorganization Agreement, within one year after the Closing Date, the Acquired Fund shall either pay or make provision for all of its liabilities to former shareholders of the Acquired Fund that received Acquiring Fund Shares. The Acquired Fund shall be liquidated and terminated following the distribution of the Acquiring Fund Shares to shareholders of record of the Acquired Fund.
The effect of the Reorganization is that shareholders who vote their shares in favor of the Reorganization Agreement are electing to sell their shares of the Acquired Fund and reinvest the proceeds in the Acquiring Fund Shares at NAV and without recognition of taxable gain or loss for federal income tax purposes. See "Tax Aspects of the Reorganization" below. As noted in "Tax Aspects of the Reorganization" below, if the Acquired Fund recognizes net gain from the sale of securities prior to the Closing Date, such gain, to the extent not offset by capital loss carry-forwards, will be distributed to shareholders prior to the Closing Date and will be taxable to shareholders as capital gain.
16
Shareholders will continue to be able to redeem their shares of the Acquired Fund at NAV next determined after receipt of the redemption request until the close of business on the business day next preceding the Closing Date. Redemption requests received by Acquired Fund thereafter will be treated as requests for redemption of shares of the Acquiring Fund.
Tax Aspects of the Reorganization
The following is a general summary of the material federal income tax consequences of the Reorganization and is based upon the current provisions of the Code, the existing U.S. Treasury Regulations thereunder, current administrative rulings of the Internal Revenue Service ("IRS") and published judicial decisions, all of which are subject to change. This discussion is limited to U.S. persons who hold shares of the Acquired Fund as capital assets for federal income tax purposes. This summary does not address all of the U.S. federal income tax consequences that may be relevant to a particular shareholder or to shareholders who may be subject to special treatment under federal income tax laws.
Tax Consequences of the Reorganization to Shareholders. The Reorganization is intended to qualify for federal income tax purposes as a tax-free reorganization under Section 368(a)(1) of the Code.
As a condition to the Reorganization, the Acquired Fund and the Acquiring Fund, has requested an opinion of Dechert LLP substantially to the effect that, based on certain assumptions, facts, the terms of the Reorganization Agreement and representations set forth in the Reorganization Agreement or otherwise provided by the Acquired Fund and the Acquiring Fund:
1. The transfer of substantially all of the assets of the Acquired Fund in exchange solely for the Acquiring Fund Shares and the assumption by the Acquiring Fund of the liabilities of the Acquired Fund followed by the distribution by the Acquired Fund of the Acquiring Fund Shares to shareholders in exchange for their Acquired Fund shares pursuant to and in accordance with the terms of the Reorganization Agreement will constitute a "reorganization" within the meaning of Section 368(a)(1) of the Code;
2. No gain or loss will be recognized by the Acquiring Fund upon the receipt of the assets of the Acquired Fund solely in exchange for the Acquiring Fund Shares and the assumption by the Acquiring Fund of the liabilities of the Acquired Fund;
3. No gain or loss will be recognized by the Acquired Fund upon the transfer of substantially all of the assets of the Acquired Fund to the Acquiring Fund solely in exchange for the Acquiring Fund Shares and the assumption by the Acquiring Fund of the liabilities or upon the distribution of the Acquiring Fund Shares to shareholders in exchange for their Acquired Fund Shares, except that the Acquired Fund may be required to recognize gain or loss with respect to contracts described in Section 1256(b) of the Code or stock in a passive foreign investment company, as defined in Section 1297(a) of the Code;
4. No gain or loss will be recognized by Shareholders upon the exchange of the shares of the Acquired Fund solely for the Acquiring Fund Shares;
5. The aggregate tax basis for the Acquiring Fund Shares received by each Shareholder pursuant to the Reorganization will be the same as the aggregate tax basis of the shares in the Acquired Fund surrendered by each such Shareholder in exchange therefor;
6. The holding period of the Acquiring Fund Shares to be received by each Shareholder will include the period during which the shares in the Acquired Fund surrendered in exchange therefor were held (provided such shares in the Acquired Fund were held as capital assets on the date of the Reorganization);
7. The tax basis of the assets of the Acquired Fund acquired by the Acquiring Fund will be the same as the tax basis of such assets of the Acquired Fund immediately prior to the Reorganization; and
17
8. The holding period of the assets of the Acquired Fund in the hands of the Acquiring Fund will include the period during which those assets were held by the Acquired Fund (except where the investment activities of the Acquiring Fund have the effect of reducing or eliminating such period with respect to an asset).
Prior to the closing of the Reorganization, the Acquired Fund will distribute to its shareholders any undistributed income and gains to the extent required to avoid entity level tax or as otherwise deemed desirable. The advice of counsel is not binding on the IRS or the courts and neither the Acquired Fund nor the Acquiring Fund has sought a ruling with respect to the tax treatment of the Reorganization. The opinion of counsel, if delivered, will be based on the Code, regulations issued by the Treasury Department under the Code, court decisions, and administrative pronouncements issued by the IRS with respect to all of the foregoing, all as in effect on the date of the opinion, and all of which may be repealed, revoked or modified thereafter, possibly on a retroactive basis.
After the Reorganization, you will continue to be responsible for tracking the adjusted tax basis and holding period of your shares for federal income tax purposes.
Shareholders should consult their tax advisors regarding the effect, if any, of the proposed Reorganization in light of their individual circumstances. Because the foregoing discussion only relates to the federal income tax consequences of the proposed Reorganization, shareholders should also consult their tax advisors as to state and local tax consequences, if any, of the proposed Reorganization.
Description of Shares
The Acquiring Fund Shares to be issued pursuant to the Reorganization Agreement will, when issued in exchange for the consideration therefor, be fully paid and non-assessable by the Acquiring Fund and transferable without restrictions and will have no preemptive rights. For greater details regarding the Acquiring Fund's shares, see "Shareholder Information" in the Acquiring Fund's Prospectuses attached hereto as Exhibit B.
Capitalization Tables (unaudited)
The following tables set forth the capitalization of the Acquired Fund as of December 31, 2012 and the Acquiring Fund on a pro forma combined basis as if the Reorganization had occurred on that date:
Strategist Portfolio (Acquired Fund) | | Class X | | Class Y | | Total | |
Net Assets | | $ | 86,391,488 | | | $ | 35,033,806 | | | $ | 121,425,294 | | |
Pro Forma Adjustments† | | $ | (83,243 | ) | | $ | (33,757 | ) | | $ | (117,000 | ) | |
Net Assets minus Pro Forma Adjustments | | $ | 86,308,245 | | | $ | 35,000,049 | | | $ | 121,308,294 | | |
Shares Outstanding | | | 8,050,909 | | | | 3,275,403 | | | | 11,326,312 | | |
Net Asset Value Per Share | | $ | 10.72 | | | $ | 10.69 | | | $ | — | | |
Global Tactical Asset Allocation Portfolio
(Acquiring Fund) | | Class I | | Class II | | Total | |
Net Assets | | $ | 63,317,800 | | | $ | 239,426 | | | $ | 63,557,226 | | |
Shares Outstanding | | | 6,630,307 | | | | 25,100 | | | | 6,655,407 | | |
Net Asset Value Per Share | | $ | 9.55 | | | $ | 9.54 | | | $ | — | | |
Pro Forma Combined Fund
(Global Tactical Asset Allocation Portfolio) | | Class I | | Class II | | Total | |
Net Assets | | $ | 149,626,045 | | | $ | 35,239,475 | | | $ | 184,865,520 | | |
Shares Outstanding | | | 15,667,819 | | | | 3,693,869 | | | | 19,361,688 | | |
Net Asset Value Per Share | | $ | 9.55 | | | $ | 9.54 | | | $ | — | | |
† Reflects the charge for estimated reorganization expenses of $83,243 and $33,757 by Class X shares and Class Y shares, respectively, of the Acquired Fund.
18
Appraisal Rights
Shareholders will have no appraisal rights in connection with the Reorganization.
COMPARISON OF INVESTMENT OBJECTIVES, PRINCIPAL POLICIES AND RESTRICTIONS
Investment Objectives and Policies
The investment objectives of the Acquired Fund and the Acquiring Fund are set forth in the table below:
| | Strategist Portfolio
(Acquired Fund) | | Global Tactical Asset Allocation Portfolio
(Acquiring Fund) | |
Investment Objective | | • seeks high total investment return through a fully managed investment policy utilizing equity, fixed income and money market securities and the writing of covered call and put options | | • seeks total return | |
| | • Acquired Fund's investment objective is a fundamental policy and may not be changed without shareholder approval of a majority of the Fund's outstanding voting securities, as defined in the 1940 Act | | • Acquiring Fund's investment objective may be changed by the Fund's Board of Directors without shareholder approval, but no change is anticipated. If the Fund's investment objective changes, the Fund will notify shareholders | |
Strategist Portfolio (Acquired Fund)
MSIM actively allocates the Acquired Fund's assets among the major asset categories of equity securities, fixed income securities and money market instruments. In determining which securities to buy, hold or sell for the Acquired Fund, MSIM allocates the Acquired Fund's assets based on, among other things, its assessment of the effects of economic and market trends on different sectors of the market. There is no limit as to the percentage of assets that may be allocated to any one asset class.
Within the equity sector, MSIM actively allocates funds to those economic sectors it expects to benefit from major trends and to individual stocks, which it considers to have superior investment potential. Equity securities in which the Acquired Fund may invest include common stocks, preferred stocks, depositary receipts, convertible securities and REITs. The Acquired Fund may invest in equity securities listed or traded outside of the United States, including in emerging market or developing countries.
Common stock is a share ownership or equity interest in a corporation. It may or may not pay dividends, as some companies reinvest all of their profits back into their businesses, while others pay out some of their profits to shareholders as dividends. A depositary receipt is generally issued by a bank or financial institution and represents an ownership interest in the common stock or other equity securities of a foreign company. REITs pool investors' funds for investments primarily in real estate properties and real estate-related loans. They may also include, among other businesses, real estate developers, brokers and operating companies whose products and services are significantly related to the real estate industry such as building suppliers and mortgage lenders.
Within the fixed income sector of the market, MSIM seeks to maximize the return on its investments by adjusting maturities and coupon rates as well as by exploiting yield differentials among different types of investment grade bonds. Fixed income securities in which the Acquired Fund may invest include debt securities such as corporate bonds and notes, U.S. government securities, convertible securities and mortgage-backed securities (including CMOs, SMBS, inverse floaters and TBAs). The Acquired Fund may also invest in debt securities issued by governments other than the United States (sovereign debt securities) as well as by corporate issuers outside the United States, including governments of and issuers in emerging market or developing countries. The Acquired
19
Fund will invest no more than 30% of its net assets in fixed income securities denominated in currencies other than the U.S. dollar. The Acquired Fund is not limited as to the maturities of the U.S. government securities and other debt securities in which it may invest.
The issuer of the debt security borrows money from the investor who buys the security. Most debt securities pay either fixed or adjustable rates of interest at regular intervals until they mature, at which point investors get their principal back. The Acquired Fund's fixed income investments may include zero coupon securities, which are purchased at a discount and generally accrue interest, but make no payments until maturity. The Acquired Fund may invest up to 20% of its net assets in debt securities rated below investment grade by Moody's Investors Service, Inc. or Standard & Poor's Ratings Services, a division of The McGraw-Hill Companies, Inc., or, if not rated, determined to be of comparable quality by MSIM.
The Acquired Fund may invest in privately placed and restricted securities. These securities may include "Rule 144A" securities which are exempt from registration and that may only be resold to qualified institutional buyers and other restricted securities. The Acquired Fund may invest up to 15% of its net assets in illiquid securities, including restricted securities that are illiquid. The Acquired Fund may invest an unlimited amount in restricted securities that are considered by MSIM to be liquid.
Within the money market sector of the market, MSIM seeks to maximize returns by exploiting spreads among short-term instruments.
The Acquired Fund may, but it is not required to, use derivative instruments for a variety of purposes, including hedging, risk management, portfolio management or to earn income. Derivatives are financial instruments whose value is based on the value of an underlying asset, interest rate, index or financial instrument. The Acquired Fund's use of derivatives may involve the purchase and sale of derivative instruments such as options, futures, swaps, structured investments and other related instruments The Acquired Fund may also use foreign currency forward exchange contracts, which are derivatives, in connection with its investments in foreign securities.
Global Tactical Asset Allocation Portfolio (Acquiring Fund)
MSIM will utilize a top-down investment approach that focuses on asset class, sector, region, country, and currency and thematic allocations. The Acquiring Fund's allocations will be based upon MSIM's evaluations and analyses, taking into account results of its fundamental market research and recommendations generated by MSIM's quantitative models. MSIM's research process focuses on three large macro factors across almost all asset classes: 1) valuation (both relative and absolute), 2) dynamics, including earnings revisions, interest rate policy and inflation expectations, and 3) technicals, such as liquidity and sentiment. The Acquiring Fund may invest in any country, including developing or emerging market countries. The Acquiring Fund's investments may be U.S. and non-U.S. dollar denominated. In determining whether to sell a security, MSIM considers a number of factors, including changes in capital appreciation potential, or the overall assessment of asset class, sector, region, country, and currency and thematic allocation shifts. Thematic allocation shifts refers to allocating the Acquiring Fund's assets between different thematic baskets of securities. A thematic basket of securities encompasses a specific investment idea that the MSIM believes will play out within the current global macro environment. Screening processes based on factors adhering to the investment themes are utilized to select securities for inclusion in each thematic basket.
The Acquiring Fund may invest in REITs and mortgage-related or mortgage-backed securities. The Acquiring Fund's equity investments may include convertible securities.
The Acquiring Fund may invest a portion of its assets in below investment grade fixed income securities and repurchase agreements. The Acquiring Fund may also invest up to 10% of its total assets in other investment companies, including ETFs.
The Acquiring Fund may purchase certain non-publicly traded "restricted" securities. These securities may include "Rule 144A" securities which are exempt from registration and that may only be resold to qualified institutional buyers and other restricted securities. The Acquiring Fund may invest up to 15% of its assets in illiquid securities.
20
The Acquiring Fund may, but it is not required to, use derivative instruments for a variety of purposes, including hedging, risk management, portfolio management or to earn income. Derivatives are financial instruments whose value is based on the value of another underlying asset, interest rate, index or financial instrument. The Acquiring Fund's use of derivatives may involve the purchase and sale of derivative instruments such as options, futures, swaps, structured investments and other related instruments and techniques. The Acquiring Fund may also utilize foreign currency forward exchange contracts, which are also derivatives, in connection with its investments in foreign securities. Derivative instruments used by the Acquiring Fund will be counted toward the Acquiring Fund's exposure in the types of securities listed above to the extent they have economic characteristics similar to such securities.
Investment Restrictions
The investment restrictions adopted by the Acquired Fund and Acquiring Fund as fundamental policies are substantially similar. The Acquiring Fund's investment restrictions are summarized under the caption "Investment Limitations" in the Company's Statement of Additional Information dated April 30, 2012, as it may be amended and supplemented from time to time. The Acquired Fund's investment restrictions are summarized under the caption "II. Description of the Fund and Its Investments and Risks—Fund Policies/Investment Restrictions" in the Trust's Statement of Additional Information dated April 30, 2012, as it may be amended and supplemented from time to time.
A fundamental investment restriction cannot be changed without the vote of the majority of the outstanding voting securities of a Fund, which is defined by the 1940 Act as the lesser of (i) at least 67% of the voting securities of a fund or portfolio present at a meeting if the holders of more than 50% of the outstanding voting securities of a fund or portfolio are present or represented by proxy; or (ii) more than 50% of the outstanding voting securities of a fund or portfolio. The only difference in the investment restrictions adopted by the Funds as fundamental policies is that while each Fund will not concentrate its investments in any particular industry; the Acquired Fund may invest up to 25% of its total assets (valued at the time of investment) in any one industry classification used by the Acquired Fund for investment purposes if deemed appropriate for attainment of its investment objective while the Acquiring Fund carves out additional exceptions for certain types of companies classified as being part of separate industries (e.g., utility and financial services companies) and asset-backed securities classified according to the underlying assets securing such securities.
The differences in the non-fundamental investment restrictions of the Acquiring Fund and the Acquired Fund are set forth below:
The Acquiring Fund will not:
1. sell short (other than "against the box") unless the Fund's obligation is covered by unencumbered liquid assets in a segregated account and by collateral held by the lending broker; provided that transactions in futures contracts and options are not deemed to constitute selling securities short;
2. make loans except (i) by purchasing bonds, debentures or similar obligations (including repurchase agreements, subject to the limitations as described in the prospectus) that are publicly distributed and (ii) by lending its portfolio securities to banks, brokers, dealers and other financial institutions, so long as such loans are not inconsistent with the 1940 Act or the Rules and Regulations or interpretations of the Commission thereunder; and
3. purchase on margin, except for use of short-term credit as may be necessary for the clearance of purchases and sales of securities, but it may make margin deposits in connection with transactions in options, futures and options on futures.
The Acquired Fund is not subject to these non-fundamental investment restrictions.
21
ADDITIONAL INFORMATION ABOUT THE ACQUIRING FUND AND THE ACQUIRED FUND
General
For a discussion of the organization and operation of the Acquiring Fund, see "Portfolio Summary" and "Fund Management" in the Acquiring Fund's Prospectuses attached hereto as Exhibit B. For a discussion of the organization and operation of the Company, see "General Information—Fund History" in the Statement of Additional Information relating to the Acquiring Fund.
For a discussion of the organization and operation of the Acquired Fund, see "Portfolio Summary" and "Portfolio Details—Portfolio Management" in the Acquired Fund's prospectuses. For a discussion of the organization and operation of the Trust, see "Fund History" in the Statement of Additional Information relating to the Acquired Fund.
Rights of Acquired Fund Shareholders and Acquiring Fund Shareholders
The Acquiring Fund is organized as a separate portfolio of the Company, a Maryland corporation that is governed by its Charter, as amended, Amended and Restated By-Laws, as may be amended from time to time, and Maryland law. The Acquired Fund is organized as a separate series of the Trust, a Massachusetts business trust that is governed by its Declaration of Trust, as amended, Amended and Restated By-Laws, as may be amended, and Massachusetts law.
While Maryland corporate law contains many provisions specifically applicable to management investment companies and Massachusetts statutory trust law is specifically drafted to accommodate some of the unique corporate governance needs of management investment companies, certain statutory differences do exist and the Company's and Trust's organizational documents contain certain differences summarized below. Each Fund is also subject to federal securities laws, including the 1940 Act and the rules and regulations promulgated by the Commission thereunder.
Consistent with Maryland law, the Company's Board of Directors, on behalf of the Acquiring Fund, has authorized the issuance of a specific number of shares of stock, although the organizational documents authorize such Board of Directors to increase or decrease, from time to time, as it considers necessary, the aggregate number of shares of stock or of any class of stock which the Company has the authority to issue. Consistent with Massachusetts law, the Acquired Fund is authorized to issue an unlimited number of shares. The Company's and Trust's organizational documents allow the respective Boards to create one or more separate investment portfolios and to establish separate series or classes of shares for each portfolio, and to further subdivide the shares of any series into one or more classes.
Neither the Charter, as amended, nor the Amended and Restated By-Laws of the Company contain specific provisions regarding the personal liability of shareholders. However, under the Maryland General Corporation Law, shareholders of a Maryland corporation generally will not be held personally liable for the acts or obligations of the corporation, except that a shareholder may be liable to the extent that (i) consideration for the shares has not been paid, (ii) the shareholder knowingly accepts a distribution in violation of the charter or Maryland law, or (iii) the shareholder receives assets of the corporation upon its liquidation and the corporation is unable to meet its debts and obligations, in which case the shareholder may be liable for such debts and obligations to the extent of the assets received in the distribution.
Under Massachusetts law, shareholders of a business trust may, under certain limited circumstances, be held personally liable as partners for the obligations of the Acquired Fund. However, the Declaration of Trust of the Acquired Fund contains an express disclaimer of shareholder liability for acts or obligations of the Acquired Fund, requires that notice of such Fund obligations include such disclaimer, and provides for indemnification out of the Fund's property for any shareholder held personally liable for the obligations of the Acquired Fund.
No Fund is required, and no Fund anticipates, holding annual meetings of its shareholders. Each Fund has certain mechanics whereby shareholders can call a special meeting of their Fund. Shareholders generally have the
22
right to approve investment advisory agreements, elect trustees/directors, change fundamental investment policies, ratify the selection of independent auditors and vote on other matters required by law or the organizational documents of the Company or Trust, as applicable, or deemed desirable by the Board of Directors or Board of Trustees, as applicable.
The business of the Acquiring Fund and the Acquired Fund is supervised by the respective Boards of the Company and the Trust. The responsibilities, powers and fiduciary duties of directors under Maryland law are generally similar in certain respects to those for trustees under Massachusetts law, although significant differences do exist and shareholders should refer to the provisions of the Company's and the Trust's applicable organizational documents and applicable law for a more thorough comparison. For the Acquiring Fund and the Acquired Fund, director/trustee vacancies generally may be filled by approval of a majority of the directors/trustees then in office subject to provisions of the 1940 Act. The term of a director/trustee lasts until the election of such person's successor, or until such person's earlier resignation, removal or death. In addition, the Acquired Fund's Declaration of Trust specifies that a Trustee's term will terminate in the event of the bankruptcy, adjudicated incompetence or other incapacity to perform the duties of the office of a Trustee. Directors of the Company may be removed with or without cause by vote of a majority of the shares present in person or by proxy at a meeting, provided a quorum is present. Trustees of the Acquired Fund may be removed with or without cause by the action of the shareholders of record of not less than two-thirds of the shares outstanding or by the action of two-thirds of the remaining Trustees.
The foregoing is only a summary of certain differences between the Acquiring Fund and the Acquired Fund under applicable law and their organizational documents. It is not intended to be a complete list of differences and shareholders should refer to the provisions of the Company's and the Trust's applicable organizational documents for a more thorough comparison. Such documents are filed as part of each Fund's registration statements with the Commission, and shareholders may obtain copies of such documents as described herein.
Financial Information
For certain financial information about each Fund, see "Financial Highlights" with respect to such Fund in its Prospectuses.
Shareholder Proposals
The Funds are not required and do not intend to hold regular shareholder meetings unless shareholder action is required in accordance with the 1940 Act. Shareholders who would like to submit proposals for consideration at future shareholder meetings of the Acquired Fund (in the event the Reorganization is not completed) or the Acquiring Fund should send written proposals to Mary E. Mullin, Secretary, 522 Fifth Avenue, New York, NY 10036. To be considered for presentation at a shareholders' meeting, rules promulgated by the Commission require that, among other things, a shareholder's proposal must be received at the offices of the applicable Fund within a reasonable time before a solicitation is made. Timely submission of a proposal does not necessarily mean that such proposal will be included.
Management
For information about the Board of Directors, MSIM and the distributor of the Acquiring Fund, see "Fund Management" in the Acquiring Fund's Prospectuses attached hereto as Exhibit B and "Management of the Fund" in the Company's Statement of Additional Information.
For information about the Board of Trustees, MSIM and the distributor of the Acquired Fund, see "Portfolio Details—Portfolio Management" in the Acquired Fund's prospectuses and "Management of the Fund" in the Trust's Statement of Additional Information.
23
Description of Shares and Shareholder Inquiries
For a description of the nature and most significant attributes of shares of the Acquiring Fund, and information regarding shareholder inquiries, see "General Information" in the Company's Statement of Additional Information as well as "Shareholder Information" and "Where to Find Additional Information" in the Acquiring Fund's Prospectuses attached hereto as Exhibit B.
For a description of the nature and most significant attributes of shares of the Acquired Fund, and information regarding shareholder inquiries, see "VII. Capital Stock and Other Securities" in the Trust's Statement of Additional Information and "Shareholder Information—Additional Information" in the Acquired Fund's prospectuses.
Dividends, Distributions and Taxes
For a discussion of the Acquiring Fund's policies with respect to dividends, distributions and taxes, see "Shareholder Information—Dividends and Distributions" and "Shareholder Information—Taxes" in the Acquiring Fund's Prospectuses, "Taxes" in the Company's Statement of Additional Information, and the discussions herein under "Synopsis—Comparison of the Acquired Fund and Acquiring Fund—Dividends," "Synopsis—Tax Consequences of the Reorganization" and "The Reorganization—Tax Aspects of the Reorganization."
For a discussion of the Acquired Fund's policies with respect to dividends, distributions and taxes, see "Distributions" in Acquired Fund's prospectuses, "IX. Taxation of the Portfolios and Shareholders" in the Trust's Statement of Additional Information, and the discussions herein under "Synopsis—Comparison of the Acquired Fund and Acquiring Fund—Dividends," "Synopsis—Tax Consequences of the Reorganization" and "The Reorganization—Tax Aspects of the Reorganization."
Purchases and Redemptions
For a discussion of how the Acquiring Fund's shares may be purchased and redeemed, see "Shareholder Information—Purchasing and Selling Portfolio Shares" in the Acquiring Fund's Prospectuses, "Purchase of Shares" and "Redemption of Shares" in the Company's Statement of Additional Information, and the discussion herein under "Synopsis—Comparison of the Acquired Fund and Acquiring Fund—Purchases and Redemptions."
For a discussion of how the Acquired Fund's shares may be purchased and redeemed, see "Shareholder Information—Purchase and Sales of Portfolio Shares" in the Acquired Fund's prospectuses, "VII. Purchase, Redemption and Pricing of Shares" in the Trust's Statement of Additional Information, and the discussion herein under "Synopsis—Comparison of the Acquired Fund and Acquiring Fund—Purchases and Redemptions."
For a discussion of the Acquiring Fund's policies with respect to frequent purchases and redemptions, see "Shareholder Information—Frequent Purchases and Redemptions of Shares" in the Acquiring Fund's Prospectuses.
For a discussion of the Acquired Fund's policies with respect to frequent purchases and redemptions, see "Shareholder Information—Frequent Purchases and Redemptions of Shares" in the Acquired Fund's prospectuses.
SHARE INFORMATION
The following persons were known to own of record or beneficially 5% or more of the outstanding shares of a class of the Acquired Fund as of the Record Date:
Shareholder | | Percentage of
Outstanding Shares | |
Class X | |
Allstate Life Insurance Co.
One Security Benefit Place
Topeka, KS 66636-1000 | | | 93.37 | % | |
24
Shareholder | | Percentage of
Outstanding Shares | |
Class Y | |
Allstate Life Insurance Co.
One Security Benefit Place
Topeka, KS 66636-1000 | | | 97.12 | % | |
The following persons were known to own of record or beneficially 5% or more of the outstanding shares of a class of Acquiring Fund as of the Record Date:
Shareholder | | Percentage of
Outstanding Shares | |
Class I | |
Fidelity Investments Life Insurance Co.
100 Salem St. 02N
Smithfield, RI 02917-1234 | | | 52.81 | % | |
Allstate Life INS Co.
554 Lakeview Parkway Suite L3G
Vernon Hills, IL 60061-1826 | | | 19.47 | % | |
Empire Fidelity Investments Life Insurance Co.
100 Salem St. 02N
Smithfield, RI 02917-1234 | | | 5.60 | % | |
Class II | |
Nationwide Life Insurance Co.
P.O. Box 182029
Columbus, OH 43218-2029 | | | 94.76 | % | |
Morgan Stanley Investment Management
One Tower Bridge
100 Front St.
West Conshohocken, PA 19428 | | | 5.24 | % | |
For regulatory reasons, shares of the Funds are only available to separate accounts of participating insurance companies, thus the Board members and officers of the Trust and the Company do not own shares of the Funds.
FINANCIAL STATEMENTS AND EXPERTS
The financial statements of the Acquiring Fund and the Acquired Fund, each for the fiscal year ended December 31, 2011, that are incorporated by reference in the Statement of Additional Information relating to the Registration Statement on Form N-14 of which this Proxy Statement and Prospectus forms a part, have been audited by Ernst & Young LLP the Acquiring Fund's and Acquired Fund's independent registered public accounting firm (except that the financial information for the Acquired Fund for the fiscal years ended prior to 2011 was audited by the Acquired Fund's previous independent registered public accounting firm). The financial statements for the Acquiring Fund and the Acquired Fund, each for the six-month period ended June 30, 2012, have not been audited and are also incorporated by reference in the Statement of Additional Information relating to the Registration Statement on Form N-14 of which this Proxy Statement and Prospectus forms a part. Each set of audited financial statements is incorporated herein by reference in reliance upon such reports given upon the authority of said independent registered public accounting firms as experts in accounting and auditing.
25
LEGAL MATTERS
Certain legal matters concerning the issuance of the Acquiring Fund Shares will be passed upon by Dechert LLP, New York, NY. Such firm will rely on Maryland counsel as to certain matters of Maryland law.
AVAILABLE INFORMATION
Additional information about each Fund is available, as applicable, in the following documents which are incorporated herein by reference: (i) the Acquiring Fund's Prospectuses dated April 30, 2012, attached to this Proxy Statement and Prospectus as Exhibit B, which Prospectuses form a part of Post-Effective Amendment No. 48 to the Company's Registration Statement on Form N-1A (File Nos. 333-03013; 811-07607); (ii) the Acquired Fund's prospectuses dated April 30, 2012, which Prospectuses form a part of Post-Effective Amendment No. 50 to the Trust's Registration Statement on Form N-1A (File Nos. 002-82510; 811-3692); (iii) the Company's Annual Report for its fiscal year ended December 31, 2011; (iv) the Company's Semi-Annual Report for the six-month period ended June 30, 2012; (v) the Trust's Annual Report for its fiscal year ended December 31, 2011; and (vi) the Trust's Semi-Annual Report for the six-month period ended June 30, 2012.
Each Fund is subject to the informational requirements of the Securities Exchange Act of 1934, as amended, and in accordance therewith, files reports and other information with the Commission. Proxy materials, reports and other information about the Funds which are of public record can be viewed and copied at the Commission's Public Reference Room in Washington, D.C. Information about the Reference Room's operations may be obtained by calling the Commission at (202) 551-8090. Reports and other information about the Funds and the Trust are available on the EDGAR Database on the Commission's Internet site (www.sec.gov) and copies of this information may be obtained, after paying a duplicating fee, by electronic request at the following E-mail address: publicinfo@sec.gov, or by writing the Public Reference Branch, Office of Consumer Affairs and Information Services, Securities and Exchange Commission, Washington, D.C. 20549-1520.
OTHER BUSINESS
Management of the Acquired Fund knows of no business other than the matters specified above which will be presented at the Meeting. Since matters not known at the time of the solicitation may come before the Meeting, the Proxy as solicited confers discretionary authority with respect to such matters as properly come before the Meeting, including any adjournment or adjournments thereof, and it is the intention of the persons named as attorneys-in-fact in the Proxy to vote this Proxy in accordance with their judgment on such matters.
By Order of the Board of Trustees,
Mary E. Mullin
Secretary
January 18, 2013
26
Exhibit A
AGREEMENT AND PLAN OF REORGANIZATION
THIS AGREEMENT AND PLAN OF REORGANIZATION ("Agreement") is made as of September 28, 2012, by and between THE UNIVERSAL INSTITUTIONAL FUNDS, INC. (the "Company"), a Maryland corporation, on behalf of the GLOBAL TACTICAL ASSET ALLOCATION PORTFOLIO ("Acquiring Fund"), and MORGAN STANLEY VARIABLE INVESTMENT SERIES (the "Trust"), a Massachusetts business trust, on behalf of the STRATEGIST PORTFOLIO ("Acquired Fund").
This Agreement is intended to be and is adopted as a "plan of reorganization" within the meaning of Treas. Reg. 1.368-2(g), for a reorganization under Section 368(a)(1) of the Internal Revenue Code of 1986, as amended (the "Code"). The reorganization ("Reorganization") will consist of the transfer to Acquiring Fund of substantially all of the assets and the liabilities of Acquired Fund in exchange for the issuance by Acquiring Fund of shares of common stock, par value $0.001 per share (the "Acquiring Fund Shares"), to be distributed, after the Closing Date hereinafter referred to, to the shareholders of Acquired Fund in liquidation of Acquired Fund as provided herein, all upon the terms and conditions hereinafter set forth in this Agreement.
In consideration of the premises and of the covenants and agreements hereinafter set forth, the parties hereto covenant and agree as follows:
1. The Reorganization and Liquidation of Acquired Fund
1.1. Subject to the terms and conditions herein set forth and on the basis of the representations and warranties contained herein, the Trust, on behalf of Acquired Fund, agrees to assign, deliver and otherwise transfer the Acquired Fund Assets (as defined in paragraph 1.2) to Acquiring Fund, and the Company, on behalf of Acquiring Fund, agrees in exchange therefor to assume all of Acquired Fund's liabilities on the Closing Date as set forth in paragraph 1.3 and to deliver to Acquired Fund the number of Acquiring Fund Shares, including fractional Acquiring Fund Shares, determined in the manner set forth in paragraph 2.3. Such transactions shall take place at the closing provided for in paragraph 3.1 ("Closing").
1.2. (a) The "Acquired Fund Assets" shall consist of all assets/property, including without limitation, all cash, cash equivalents, securities and dividend and interest receivables owned by Acquired Fund, and any deferred or prepaid expenses shown as an asset on Acquired Fund's books on the Valuation Date (as defined in Section 2 herein).
(b) On or prior to the Valuation Date, the Trust, on behalf of Acquired Fund, will provide Acquiring Fund with a list of all of Acquired Fund Assets to be assigned, delivered and otherwise transferred to Acquiring Fund and a list of the liabilities to be assumed by Acquiring Fund pursuant to this Agreement. The Trust, on behalf of Acquired Fund, reserves the right to sell any of the securities on such list but will not, without the prior approval of the Company, on behalf of Acquiring Fund, acquire any additional securities other than securities of the type in which Acquiring Fund is permitted to invest and in amounts agreed to in writing by the Company, on behalf of Acquiring Fund. The Company, on behalf of Acquiring Fund, will, within a reasonable time prior to the Valuation Date, furnish Acquired Fund with a statement of Acquiring Fund's investment objective, policies and restrictions and a list of the securities, if any, on the list referred to in the first sentence of this paragraph that do not conform to Acquiring Fund's investment objective, policies and restrictions. In the event that Acquired Fund holds any investments that Acquiring Fund is not permitted to hold, Acquired Fund will dispose of such securities on or prior to the Valuation Date. In addition, if it is determined that the portfolios of Acquired Fund and Acquiring Fund, when aggregated, would contain investments exceeding certain percentage limitations imposed upon Acquiring Fund with respect to such investments, Acquired Fund if requested by the Company, on behalf of Acquiring Fund, will, on or prior to the Valuation Date, dispose of and/or reinvest a sufficient amount of such investments as may be necessary to avoid violating such limitations as of the Closing Date (as defined in paragraph 3.1).
1.3. The Trust, on behalf of Acquired Fund, will endeavor to discharge all of Acquired Fund's liabilities and obligations on or prior to the Valuation Date. The Company, on behalf of Acquiring Fund, will assume all
A-1
liabilities and obligations, which includes, without limitation, all expenses, costs, charges and reserves reflected on an unaudited Statement of Assets and Liabilities of Acquired Fund prepared by the Treasurer of Acquired Fund as of the Valuation Date in accordance with generally accepted accounting principles consistently applied from the prior audited period.
1.4. In order for the Acquired Fund to comply with Section 852(a)(1) of the Code and to avoid having any investment company taxable income or net capital gain (as defined in Sections 852(b)(2) and 1222(11) of the Code, respectively) in the short taxable year ending with its dissolution, the Trust, on behalf of Acquired Fund, will on or before the Valuation Date (a) declare a dividend in an amount large enough so that Acquired Fund will have declared dividends of substantially all of its investment company taxable income and net capital gain, if any, for such taxable year (determined without regard to any deduction for dividends paid) and (b) distribute such dividend.
1.5. On the Closing Date or as soon as practicable thereafter, the Trust, on behalf of Acquired Fund, will distribute Acquiring Fund Shares received by Acquired Fund pursuant to paragraph 1.1 pro rata to Acquired Fund's shareholders of record determined as of the close of business on the Valuation Date ("Acquired Fund Shareholders"). The Acquired Fund Shareholder will receive the class of shares of Acquiring Fund that corresponds to the class of shares of Acquired Fund currently held by that Acquired Fund shareholder. Accordingly, the Acquiring Fund Shares will be distributed as follows: each of the Class I shares of Acquiring Fund will be distributed to holders of Class X shares of Acquired Fund and each of the Class II shares of Acquiring Fund will be distributed to holders of Class Y shares of Acquired Fund. Such distribution will be accomplished by an instruction, signed by Acquired Fund's Secretary, to transfer Acquiring Fund Shares then credited to Acquired Fund's account on the books of Acquiring Fund to open accounts on the books of Acquiring Fund in the names of the Acquired Fund shareholders and representing the respective pro rata number of Acquiring Fund Shares due such Acquired Fund shareholders. All issued and outstanding shares of Acquired Fund simultaneously will be canceled on Acquired Fund's books.
1.6. Ownership of Acquiring Fund Shares will be shown on the books of Acquiring Fund's transfer agent. Acquiring Fund Shares will be issued in the manner described in Acquiring Fund's current Prospectus, as supplemented, and the Company's Statement of Additional Information.
1.7. Any transfer taxes payable upon issuance of Acquiring Fund Shares in a name other than the registered holder of Acquiring Fund Shares on Acquired Fund's books as of the close of business on the Valuation Date shall, as a condition of such issuance and transfer, be paid by the person to whom Acquiring Fund Shares are to be issued and transferred.
1.8. Any reporting responsibility of Acquired Fund is and shall remain the responsibility of Acquired Fund up to and including the date on which Acquired Fund is dissolved and terminated pursuant to paragraph 1.9.
1.9. Within one year after the Closing Date, the Trust, on behalf of Acquired Fund, shall pay or make provision for the payment of all Acquired Fund's liabilities and taxes. If and to the extent that any trust, escrow account, or other similar entity continues after the close of such one-year period in connection either with making provision for payment of liabilities or taxes or with distributions to shareholders of Acquired Fund, such entity shall either (i) qualify as a liquidating trust under Section 7701 of the Code (and applicable Treasury Regulations thereunder) or other entity which does not constitute a continuation of Acquired Fund for federal income tax purposes, or (ii) be subject to a waiver under Section 368(a)(2)(G)(ii) of the complete distribution requirement of Section 368(a)(2)(G)(i) of the Code. Acquired Fund shall be terminated following the making of all distributions pursuant to paragraph 1.5.
1.10. Copies of all books and records maintained on behalf of Acquired Fund in connection with its obligations under the Investment Company Act of 1940, as amended (the "1940 Act"), the Code, state blue sky laws or otherwise in connection with this Agreement will promptly be delivered after the Closing to officers of Acquiring Fund or their designee, and Acquiring Fund or its designee shall comply with applicable record retention requirements to which Acquired Fund is subject under the 1940 Act.
A-2
2. Valuation
2.1. The value of the Acquired Fund Assets shall be the value of such assets computed as of 4:00 p.m. on the New York Stock Exchange on the third business day following the receipt of the requisite approval of this Agreement by shareholders of Acquired Fund or at such time on such earlier or later date after such approval as may be mutually agreed upon in writing (such time and date being hereinafter called the "Valuation Date"), using the valuation procedures set forth in Acquiring Fund's then current Prospectus, as supplemented, and the Company's Statement of Additional Information.
2.2. The net asset value of an Acquiring Fund Share shall be the net asset value per share computed on the Valuation Date, using the valuation procedures set forth in Acquiring Fund's then current Prospectuses, as supplemented, and the Company's Statement of Additional Information.
2.3. The number of Acquiring Fund Shares (including fractional shares, if any) to be issued hereunder shall be determined, with respect to each class, by dividing the aggregate net asset value of each class of Acquired Fund shares (determined in accordance with paragraph 2.1) by the net asset value per share of the corresponding class of shares of Acquiring Fund (determined in accordance with paragraph 2.2).
2.4. All computations of value shall be made by Morgan Stanley Services Company Inc. ("Morgan Stanley Services") in accordance with its regular practice in pricing Acquiring Fund. The Company, on behalf of Acquiring Fund, shall cause Morgan Stanley Services to deliver a copy of Acquiring Fund's valuation report at the Closing.
3. Closing and Closing Date
3.1. The Closing shall take place on the Valuation Date or on the next business day following the Valuation Date (the "Closing Date"). The Closing shall be held as of 9:00 a.m. Eastern time, or at such other time as the parties may agree. The Closing shall be held in a location mutually agreeable to the parties hereto. All acts taking place at the Closing shall be deemed to take place simultaneously as of 9:00 a.m. Eastern time on the Closing Date unless otherwise provided.
3.2. Portfolio securities held by Acquired Fund and represented by a certificate or other written instrument shall be presented by it or on its behalf to State Street Bank and Trust Company (the "Custodian"), as custodian for Acquiring Fund, for examination no later than five business days preceding the Valuation Date. Such portfolio securities (together with any cash or other assets) shall be delivered by Acquired Fund to the Custodian for the account of Acquiring Fund on or before the Closing Date in conformity with applicable custody provisions under the 1940 Act and duly endorsed in proper form for transfer in such condition as to constitute good delivery thereof in accordance with the custom of brokers. The portfolio securities shall be accompanied by all necessary federal and state stock transfer stamps or a check for the appropriate purchase price of such stamps. Portfolio securities and instruments deposited with a securities depository (as defined in Rule 17f-4 under the 1940 Act) shall be delivered on or before the Closing Date by book-entry in accordance with customary practices of such depository and the Custodian. The cash delivered shall be in the form of a Federal Funds wire, payable to the order of "State Street Bank and Trust Company, Custodian for The Universal Institutional Funds, Inc."
3.3. In the event that on the Valuation Date, (a) the New York Stock Exchange shall be closed to trading or trading thereon shall be restricted or (b) trading or the reporting of trading on such Exchange or elsewhere shall be disrupted so that, in the judgment of both the Company, on behalf of Acquiring Fund, and the Trust, on behalf of Acquired Fund, accurate appraisal of the value of the net assets of Acquiring Fund or the Acquired Fund Assets is impracticable, the Valuation Date shall be postponed until the first business day after the day when trading shall have been fully resumed without restriction or disruption and reporting shall have been restored.
3.4. If requested, the Trust, on behalf of Acquired Fund, shall deliver to the Company, on behalf of Acquiring Fund, or its designee (a) at the Closing, a list, certified by the Trust's Secretary, of the names, addresses and taxpayer identification numbers of the Acquired Fund shareholders and the number and percentage ownership of outstanding Acquired Fund shares owned by each such Acquired Fund shareholder, all as of the Valuation Date, and (b) as soon as practicable after the Closing, all original documentation (including Internal Revenue Service forms, certificates,
A-3
certifications and correspondence) relating to the Acquired Fund shareholders' taxpayer identification numbers and their liability for or exemption from back-up withholding. The Company, on behalf of Acquiring Fund, shall issue and deliver to such Secretary a confirmation evidencing delivery of Acquiring Fund Shares to be credited on the Closing Date to Acquired Fund or provide evidence satisfactory to Acquired Fund that such Acquiring Fund Shares have been credited to Acquired Fund's account on the books of Acquiring Fund. At the Closing, each party shall deliver to the other such bills of sale, checks, assignments, share certificates, if any, receipts or other documents as such other party or its counsel may reasonably request.
4. Covenants of Acquiring Fund and Acquired Fund
4.1. Except as otherwise expressly provided herein, the Trust, on behalf of Acquired Fund, and the Company, on behalf of Acquiring Fund, will operate in the ordinary course between the date hereof and the Closing Date, it being understood that such ordinary course of business will include customary dividends and other distributions.
4.2. The Company will prepare and file with the Securities and Exchange Commission ("Commission") a registration statement on Form N-14 under the Securities Act of 1933, as amended ("1933 Act"), relating to Acquiring Fund Shares ("Registration Statement"). The Trust will provide the Proxy Materials as described in paragraph 4.3 below for inclusion in the Registration Statement. The Company, on behalf of Acquiring Fund, and the Trust, on behalf of Acquired Fund, agree that each of Acquired Fund and Acquiring Fund will further provide such other information and documents as are reasonably necessary for the preparation of the Registration Statement.
4.3. The Trust, on behalf of Acquired Fund, will call a meeting of Acquired Fund's shareholders to consider and act upon this Agreement and to take all other action necessary to obtain approval of the transactions contemplated herein. The Trust, on behalf of Acquired Fund, will prepare the notice of meeting, form of proxy and proxy statement (collectively, "Proxy Materials") to be used in connection with such meeting; provided that the Company, on behalf of Acquiring Fund, will furnish the Trust, on behalf of Acquired Fund, with its currently effective prospectus for inclusion in the Proxy Materials and with such other information relating to Acquiring Fund as is reasonably necessary for the preparation of the Proxy Materials.
4.4. The Trust, on behalf of Acquired Fund, will assist Acquiring Fund in obtaining such information as Acquiring Fund reasonably requests concerning the beneficial ownership of Acquired Fund shares.
4.5. Subject to the provisions of this Agreement, the Company, on behalf of Acquiring Fund, and the Trust, on behalf of Acquired Fund, agree that each respective Fund will take, or cause to be taken, all action, and do or cause to be done, all things reasonably necessary, proper or advisable to consummate and make effective the transactions contemplated by this Agreement.
4.6. The Trust, on behalf of Acquired Fund, shall furnish or cause to be furnished to Acquiring Fund within 30 days after the Closing Date a statement of Acquired Fund's assets and liabilities as of the Closing Date, which statement shall be certified by the Acquired Fund's Treasurer and shall be in accordance with generally accepted accounting principles consistently applied. As promptly as practicable, but in any case within 60 days after the Closing Date, Acquired Fund shall furnish Acquiring Fund, in such form as is reasonably satisfactory to Acquiring Fund, a statement certified by the Trust's Treasurer of Acquired Fund's earnings and profits for federal income tax purposes that will be carried over to Acquiring Fund pursuant to Section 381 of the Code.
4.7. As soon after the Closing Date as is reasonably practicable, the Company (a) shall prepare and file all federal and other tax returns and reports of Acquired Fund required by law to be filed with respect to all periods ending on or before the Closing Date but not theretofore filed and (b) shall pay all federal and other taxes shown as due thereon and/or all federal and other taxes that were unpaid as of the Closing Date, including without limitation, all taxes for which the provision for payment was made as of the Closing Date (as represented in paragraph 5.2(k)).
4.8. The Company agrees to use all reasonable efforts to obtain the approvals and authorizations required by the 1933 Act and the 1940 Act and to make such filings required by the state Blue Sky and securities laws as it may deem appropriate in order to continue the Acquiring Fund's operations after the Closing Date.
A-4
5. Representations and Warranties
5.1. The Company, on behalf of Acquiring Fund, represents and warrants to Acquired Fund, as follows:
(a) Acquiring Fund is a series of the Company, a validly existing Maryland corporation with full power to carry on its business as presently conducted;
(b) The Company is a duly registered, open-end management investment company which offers its shares only to insurance companies for accounts which they establish to fund variable life insurance and variable annuity contracts and by other entities under qualified pension and retirement plans, and its registration with the Commission as an investment company under the 1940 Act and the registration of its shares under the 1933 Act are in full force and effect;
(c) All of the issued and outstanding shares of Acquiring Fund have been offered and sold in compliance in all material respects with applicable registration requirements of the 1933 Act and state securities laws. Shares of Acquiring Fund are registered in all jurisdictions in which they are required to be registered under state securities laws and other laws, and said registrations, including any periodic reports or supplemental filings, are complete and current, all fees required to be paid have been paid, and Acquiring Fund is not subject to any stop order and is fully qualified to sell its shares in each state in which its shares have been registered;
(d) The current Prospectus of the Acquiring Fund and Statement of Additional Information of the Company conform in all material respects to the applicable requirements of the 1933 Act and the 1940 Act and the regulations thereunder and do not include any untrue statement of a material fact or omit to state any material fact required to be stated therein or necessary to make the statements therein, in light of the circumstances under which they were made, not misleading;
(e) The Company is not in, and the execution, delivery and performance of this Agreement will not result in a, material violation of any provision of its Articles of Incorporation or By-Laws, each as amended, or of any agreement, indenture, instrument, contract, lease or other undertaking to which Acquiring Fund is a party or by which it is bound;
(f) No litigation or administrative proceeding or investigation of or before any court or governmental body is presently pending or, to its knowledge, threatened against the Company, Acquiring Fund or any of their properties or assets which, if adversely determined, would materially and adversely affect Acquiring Fund's financial condition or the conduct of its business; and the Company knows of no facts that might form the basis for the institution of such proceedings and is not a party to or subject to the provisions of any order, decree or judgment of any court or governmental body which materially and adversely affects, or is reasonably likely to materially and adversely affect, its business or its ability to consummate the transactions herein contemplated;
(g) The Statement of Assets and Liabilities, Statement of Operations, Statements of Changes in Net Assets and Financial Highlights for its last completed fiscal year, audited by Ernst & Young LLP (copies of which will be furnished to Acquired Fund), fairly present, in all material respects, Acquiring Fund's financial condition as of such date in accordance with generally accepted accounting principles, and its results of such operations, changes in its net assets and financial highlights for such period, and as of such date there will be no known liabilities of Acquiring Fund (contingent or otherwise) not disclosed therein that would be required in accordance with generally accepted accounting principles to be disclosed therein;
(h) All issued and outstanding Acquiring Fund Shares are, and at the Closing Date will be, duly and validly issued and outstanding, fully paid and non-assessable with no personal liability attaching to the ownership thereof. Acquiring Fund does not have outstanding any options, warrants or other rights to subscribe for or purchase any of its shares;
(i) The execution, delivery and performance of this Agreement have been duly authorized by all necessary action on the part of the Company, and this Agreement constitutes a valid and binding obligation of Acquiring Fund enforceable in accordance with its terms, subject as to enforcement, to bankruptcy, insolvency, reorganization, moratorium and other laws relating to or affecting creditors' rights and to general equity principles.
A-5
No other consents, authorizations or approvals are necessary in connection with Acquiring Fund's performance of this Agreement;
(j) Acquiring Fund Shares to be issued and delivered to Acquired Fund, for the account of the Acquired Fund shareholders, pursuant to the terms of this Agreement will at the Closing Date have been duly authorized and, when so issued and delivered, will be duly and validly issued Acquiring Fund Shares, and will be fully paid and non-assessable with no personal liability attaching to the ownership thereof;
(k) All material federal and other tax returns and reports of Acquiring Fund required by law to be filed on or before the Closing Date have been filed and are correct, and all federal and other taxes shown as due or required to be shown as due on said returns and reports have been paid or provision has been made for the payment thereof, and to the best of the Company's knowledge, no such return is currently under audit and no assessment has been asserted with respect to any such return;
(l) For each taxable year since its inception, Acquiring Fund has met the requirements of Subchapter M of the Code for qualification and treatment as a "regulated investment company" and neither the execution or delivery of nor the performance of the Company's obligations with respect to Acquiring Fund under this Agreement will adversely affect, and no other events are reasonably likely to occur which will adversely affect, the ability of Acquiring Fund to continue to meet the requirements of Subchapter M of the Code;
(m) Since December 31, 2011, there has been no change by Acquiring Fund in accounting methods, principles, or practices, including those required by generally accepted accounting principles;
(n) The information furnished or to be furnished by the Company on behalf of Acquiring Fund for use in registration statements, proxy materials and other documents which may be necessary in connection with the transactions contemplated hereby shall be accurate and complete in all material respects and shall comply in all material respects with federal securities and other laws and regulations applicable thereto; and
(o) The Proxy Materials to be included in the Registration Statement (only insofar as they relate to Acquiring Fund) will, on the effective date of the Registration Statement and on the Closing Date, not contain any untrue statement of a material fact or omit to state a material fact required to be stated therein or necessary to make the statements therein, in light of the circumstances under which such statements were made, not materially misleading.
5.2. The Trust, on behalf of Acquired Fund, represents and warrants to the Company, on behalf of Acquiring Fund as follows:
(a) Acquired Fund is series of the Trust, a validly existing Massachusetts business trust with full power to carry on its business as presently conducted;
(b) The Trust is a duly registered, open-end management investment company which offers its shares only to insurance companies for accounts which they establish to fund variable life insurance and variable annuity contracts and by other entities under qualified pension and retirement plans, and its registration with the Commission as an investment company under the 1940 Act and the registration of its shares under the 1933 Act are in full force and effect;
(c) All of the issued and outstanding shares of Acquired Fund have been offered and sold in compliance in all material respects with applicable requirements of the 1933 Act and state securities laws. Shares of Acquired Fund are registered in all jurisdictions in which they are required to be registered and said registrations, including any periodic reports or supplemental filings, are complete and current, all fees required to be paid have been paid, and Acquired Fund is not subject to any stop order and is fully qualified to sell its shares in each state in which its shares have been registered;
(d) The current Prospectus, as supplemented, of Acquired Fund and Statement of Additional Information of the Trust conform in all material respects to the applicable requirements of the 1933 Act and the 1940 Act and the regulations thereunder and do not include any untrue statement of a material fact or omit to state
A-6
any material fact required to be stated therein or necessary to make the statements therein, in light of the circumstances under which they were made, not misleading;
(e) The Trust is not in, and the execution, delivery and performance of this Agreement will not result in a, material violation of any provision of its Declaration of Trust or By-Laws, each as amended, or of any agreement, indenture, instrument, contract, lease or other undertaking to which Acquired Fund is a party or by which it is bound;
(f) No litigation or administrative proceeding or investigation of or before any court or governmental body is presently pending or, to its knowledge, threatened against the Trust or any of its properties or assets which, if adversely determined, would materially and adversely affect Acquired Fund's financial condition or the conduct of its business; and the Trust knows of no facts that might form the basis for the institution of such proceedings and is not a party to or subject to the provisions of any order, decree or judgment of any court or governmental body which materially and adversely affects, or is reasonably likely to materially and adversely affect, its business or its ability to consummate the transactions herein contemplated;
(g) The Statement of Assets and Liabilities, Statement of Operations, Statements of Changes in Net Assets and Financial Highlights of Acquired Fund for its last completed fiscal year, audited by Ernst & Young LLP (except that the financial information for the Acquired Fund for the fiscal years ended prior to 2011 was audited by the Acquired Fund's prior independent registered public accounting firm) (copies of which have been or will be furnished to Acquiring Fund) fairly present, in all material respects, Acquired Fund's financial condition as of such date, and its results of operations, changes in its net assets and financial highlights for such period in accordance with generally accepted accounting principles, and as of such date there were no known liabilities of Acquired Fund (contingent or otherwise) not disclosed therein that would be required in accordance with generally accepted accounting principles to be disclosed therein;
(h) Acquired Fund has no material contracts or other commitments (other than this Agreement) that will be terminated with liability to it prior to the Closing Date;
(i) All issued and outstanding shares of Acquired Fund are, and at the Closing Date will be, duly and validly issued and outstanding, fully paid and non-assessable with no personal liability attaching to the ownership thereof. Acquired Fund does not have outstanding any options, warrants or other rights to subscribe for or purchase any of its shares, nor is there outstanding any security convertible to any of its shares. All such shares will, at the time of Closing, be held by the persons and in the amounts set forth in the list of shareholders submitted to Acquiring Fund pursuant to paragraph 3.4;
(j) The execution, delivery and performance of this Agreement will have been duly authorized prior to the Closing Date by all necessary action on the part of the Trust, and subject to the approval of Acquired Fund's shareholders, this Agreement constitutes a valid and binding obligation of Acquired Fund, enforceable in accordance with its terms, subject as to enforcement to bankruptcy, insolvency, reorganization, moratorium and other laws relating to or affecting creditors' rights and to general equity principles. No other consents, authorizations or approvals are necessary in connection with Acquired Fund's performance of this Agreement;
(k) All material federal and other tax returns and reports of Acquired Fund required by law to be filed on or before the Closing Date shall have been filed and are correct and all federal and other taxes shown as due or required to be shown as due on said returns and reports have been paid or provision has been made for the payment thereof, and to the best of the Trust's knowledge, no such return is currently under audit and no assessment has been asserted with respect to any such return;
(l) For each taxable year since its inception, Acquired Fund has met all the requirements of Subchapter M of the Code for qualification and treatment as a "regulated investment company" and neither the execution or delivery of nor the performance of Acquired Fund's obligations under this Agreement will adversely affect, and no other events are reasonably likely to occur which will adversely affect, the ability of Acquired Fund to continue to meet the requirements of Subchapter M of the Code for its final taxable year ending on the Closing Date;
A-7
(m) At the Closing Date, Acquired Fund will have good and valid title to the Acquired Fund Assets, subject to no liens (other than the obligation, if any, to pay the purchase price of portfolio securities purchased by Acquired Fund which have not settled prior to the Closing Date), security interests or other encumbrances, and full right, power and authority to assign, deliver and otherwise transfer such assets hereunder, and upon delivery and payment for such assets, the Company, on behalf of Acquiring Fund, will acquire good and marketable title thereto, subject to no restrictions on the full transfer thereof, including any restrictions as might arise under the 1933 Act;
(n) On the effective date of the Registration Statement, at the time of the meeting of Acquired Fund's shareholders and on the Closing Date, the Proxy Materials (exclusive of the currently effective Acquiring Fund Prospectus contained therein) will (i) comply in all material respects with the provisions of the 1933 Act, the Securities Exchange Act of 1934, as amended ("1934 Act"), and the 1940 Act and the regulations thereunder and (ii) not contain any untrue statement of a material fact or omit to state a material fact required to be stated therein or necessary to make the statements therein not misleading. Any other information furnished by the Trust for use in the Registration Statement or in any other manner that may be necessary in connection with the transactions contemplated hereby shall be accurate and complete and shall comply in all material respects with applicable federal securities and other laws and regulations thereunder;
(o) The Trust, on behalf of Acquired Fund, will, on or prior to the Valuation Date, declare one or more dividends or other distributions to shareholders that, together with all previous dividends and other distributions to shareholders, shall have the effect of distributing to the shareholders all of its investment company taxable income and net capital gain, if any, through the Valuation Date (computed without regard to any deduction for dividends paid);
(p) The Trust, on behalf of Acquired Fund, has maintained or has caused to be maintained on its behalf all books and accounts as required of a registered investment company in compliance with the requirements of Section 31 of the 1940 Act and the rules thereunder; and
(q) Acquired Fund is not acquiring Acquiring Fund Shares to be issued hereunder for the purpose of making any distribution thereof other than in accordance with the terms of this Agreement.
6. Conditions Precedent to Obligations of Acquired Fund
The obligations of the Trust, on behalf of Acquired Fund, to consummate the transactions provided for herein shall be subject, at its election, to the performance by the Company, on behalf of Acquiring Fund, of all the obligations to be performed by it hereunder on or before the Closing Date and, in addition thereto, the following conditions:
6.1. All representations and warranties of the Company made on behalf of Acquiring Fund contained in this Agreement shall be true and correct in all material respects as of the date hereof and, except as they may be affected by the transactions contemplated by this Agreement, as of the Closing Date with the same force and effect as if made on and as of the Closing Date;
6.2. The Company, on behalf of Acquiring Fund, shall have delivered to Acquired Fund a certificate of the Company's President and Treasurer, in a form reasonably satisfactory to Acquired Fund and dated as of the Closing Date, to the effect that the representations and warranties of the Company, on behalf of Acquiring Fund, made in this Agreement are true and correct at and as of the Closing Date, except as they may be affected by the transactions contemplated by this Agreement, and as to such other matters as Acquired Fund, shall reasonably request;
6.3. Acquired Fund, shall have received a favorable opinion from Dechert LLP, counsel to Acquiring Fund, dated as of the Closing Date, to the effect that:
(a) Acquiring Fund is a series of the Company, a validly existing Maryland corporation, and has the power to own all of its properties and assets and to carry on its business as presently conducted (Maryland counsel may be relied upon in delivering such opinion); (b) the Company is a duly registered, open-end, management investment company under the 1940 Act which offers its shares only to insurance companies for accounts which they establish to fund variable life insurance and variable annuity contracts and to other entities under qualified pension and retirement plans, and its registration with the Commission as an investment company under the 1940 Act
A-8
is in full force and effect; (c) this Agreement has been duly authorized, executed and delivered by the Company and, assuming that the Registration Statement complies with the 1933 Act, the 1934 Act and the 1940 Act and regulations thereunder and assuming due authorization, execution and delivery of this Agreement by the Trust, on behalf of Acquired Fund, is a valid and binding obligation of Acquiring Fund enforceable against Acquiring Fund in accordance with its terms, subject as to enforcement, to bankruptcy, insolvency, reorganization, moratorium and other laws relating to or affecting creditors' rights and to general equity principles; (d) Acquiring Fund Shares to be issued to Acquired Fund shareholders as provided by this Agreement are duly authorized and upon such delivery will be validly issued, fully paid and non-assessable, and no shareholder of Acquiring Fund has any preemptive rights to subscription or purchase in respect thereof (Maryland counsel may be relied upon in delivering such opinion); (e) the execution and delivery of this Agreement did not, and the consummation of the transactions contemplated hereby will not, violate the Company's Articles of Incorporation or By-Laws, each as amended; and (f) to the knowledge of such counsel, no consent, approval, authorization or order of any court or governmental authority of the United States or any state is required for the consummation by Acquiring Fund of the transactions contemplated herein, except such as have been obtained under the 1933 Act, the 1934 Act and the 1940 Act and such as may be required under state securities laws; and
6.4. As of the Closing Date, there shall have been no material change in the investment objective, policies and restrictions of Acquiring Fund or any increase in the investment management fees or annual fees pursuant to Acquiring Fund's shareholder services plan from those described in Acquiring Fund's Prospectus dated April 30, 2012, as may be supplemented, and the Company's Statement of Additional Information dated April 30, 2012, as may be supplemented.
7. Conditions Precedent to Obligations of Acquiring Fund
The obligations of the Company, on behalf of Acquiring Fund, to complete the transactions provided for herein shall be subject, at its election, to the performance by Acquired Fund, of all the obligations to be performed by it hereunder on or before the Closing Date and, in addition thereto, the following conditions:
7.1. All representations and warranties of the Trust made on behalf of Acquired Fund contained in this Agreement shall be true and correct in all material respects as of the date hereof and, except as they may be affected by the transactions contemplated by this Agreement, as of the Closing Date with the same force and effect as if made on and as of the Closing Date;
7.2. The Trust, on behalf of Acquired Fund, shall have delivered to Acquiring Fund at the Closing a certificate of the Trust's President and its Treasurer, in form and substance satisfactory to Acquiring Fund and dated as of the Closing Date, to the effect that the representations and warranties of the Trust, on behalf of Acquired Fund, made in this Agreement are true and correct at and as of the Closing Date, except as they may be affected by the transactions contemplated by this Agreement, and as to such other matters as the Company, on behalf of Acquiring Fund, shall reasonably request;
7.3. Acquired Fund shall have delivered to Acquiring Fund a statement of the Acquired Fund Assets and its liabilities, together with a list of Acquired Fund's portfolio securities and other assets showing the respective adjusted bases and holding periods thereof for income tax purposes, as of the Closing Date, certified by the Treasurer of the Acquired Fund;
7.4. The Company, on behalf of Acquiring Fund, shall have received at the Closing a favorable opinion from Dechert LLP, counsel to Acquired Fund, dated as of the Closing Date to the effect that:
(a) Acquired Fund is a series of the Trust, a validly existing Massachusetts business trust, and has the power to own all of its properties and assets and to carry on its business as presently conducted; (b) Acquired Fund is a duly registered, open-end, management investment company under the 1940 Act which offers its shares only to insurance companies for accounts which they establish to fund variable life insurance and variable annuity contracts and to other entities under qualified pension and retirement plans, and its registration with the Commission as an investment company under the 1940 Act is in full force and effect; (c) this Agreement has been duly authorized, executed and delivered by the Trust, and, assuming that the Registration Statement complies with the 1933 Act, the
A-9
1934 Act and the 1940 Act and the regulations thereunder and assuming due authorization, execution and delivery of this Agreement by the Company, on behalf of Acquiring Fund, is a valid and binding obligation of Acquired Fund enforceable against Acquired Fund in accordance with its terms, subject as to enforcement, to bankruptcy, insolvency, reorganization, moratorium and other laws relating to or affecting creditors' rights and to general equity principles; (d) the execution and delivery of this Agreement did not, and the consummation of the transactions contemplated hereby will not, violate the Trust's Declaration of Trust or By-Laws, each as amended; and (e) to the knowledge of such counsel, no consent, approval, authorization or order of any court or governmental authority of the United States or any state is required for the consummation by Acquired Fund of the transactions contemplated herein, except such as have been obtained under the 1933 Act, the 1934 Act and the 1940 Act and such as may be required under state securities laws; and
7.5. On the Closing Date, the Acquired Fund Assets shall include no assets that the Acquiring Fund, by reason of limitations of the Trust's Declaration of Trust, as amended, or otherwise, may not properly acquire.
8. Further Conditions Precedent to Obligations of Acquiring Fund and Acquired Fund
The obligations of the Trust, on behalf of Acquired Fund, and the Company, on behalf of Acquiring Fund, hereunder are each subject to the further conditions that on or before the Closing Date:
8.1. This Agreement and the transactions contemplated herein shall have been approved by the requisite vote of the holders of the outstanding shares of Acquired Fund in accordance with the provisions of the Trust's Declaration of Trust, as amended, and certified copies of the resolutions evidencing such approval shall have been delivered to Acquiring Fund;
8.2. On the Closing Date, no action, suit or other proceeding shall be pending before any court or governmental agency in which it is sought to restrain or prohibit, or obtain damages or other relief in connection with, this Agreement or the transactions contemplated herein;
8.3. All consents of other parties and all other consents, orders and permits of federal, state and local regulatory authorities (including those of the Commission and of state Blue Sky and securities authorities, including "no-action" positions of and exemptive orders from such federal and state authorities) deemed necessary by the Company, on behalf of Acquiring Fund, or Acquired Fund to permit consummation, in all material respects, of the transactions contemplated herein shall have been obtained, except where failure to obtain any such consent, order or permit would not involve risk of a material adverse effect on the assets or properties of Acquiring Fund or Acquired Fund;
8.4. The Registration Statement shall have become effective under the 1933 Act, no stop orders suspending the effectiveness thereof shall have been issued and, to the best knowledge of the parties hereto, no investigation or proceeding for that purpose shall have been instituted or be pending, threatened or contemplated under the 1933 Act;
8.5. The Trust, on behalf of Acquired Fund, shall have declared and paid a dividend or dividends and/or other distribution or distributions that, together with all previous such dividends or distributions, shall have the effect of distributing to the Acquired Fund shareholders all of Acquired Fund's investment company taxable income (computed without regard to any deduction for dividends paid) and all of its net capital gain (after reduction for any capital loss carry-forward and computed without regard to any deduction for dividends paid) for all taxable years ending on or before the Closing Date; and
8.6. The parties shall have received the opinion of the law firm of Dechert LLP (based on certain facts, assumptions and representations), addressed to Acquiring Fund and Acquired Fund, which opinion may be relied upon by the shareholders of Acquired Fund, substantially to the effect that, for federal income tax purposes:
(a) The transfer of substantially all of Acquired Fund's assets in exchange solely for Acquiring Fund Shares and the assumption by Acquiring Fund of the liabilities of Acquired Fund followed by the distribution by Acquired Fund of Acquiring Fund Shares to the Acquired Fund shareholders in exchange for their Acquired
A-10
Fund shares pursuant to and in accordance with the terms of the Reorganization Agreement will constitute a "reorganization" within the meaning of Section 368(a)(1)(C) of the Code;
(b) No gain or loss will be recognized by Acquiring Fund upon the receipt of the assets of Acquired Fund solely in exchange for Acquiring Fund Shares and the assumption by Acquiring Fund of the liabilities of Acquired Fund;
(c) No gain or loss will be recognized by Acquired Fund upon the transfer of substantially all of the assets of Acquired Fund to Acquiring Fund in exchange solely for Acquiring Fund Shares and the assumption by Acquiring Fund of the liabilities or upon the distribution of Acquiring Fund Shares to the Acquired Fund shareholders in exchange for their Acquired Fund shares, except that Acquired Fund may be required to recognize gain or loss with respect to contracts described in Section 1256(b) of the Code or stock in a passive foreign investment company, as defined in Section 1297(a) of the Code;
(d) No gain or loss will be recognized by the Acquired Fund shareholders upon the exchange of the Acquired Fund shares for Acquiring Fund Shares;
(e) The aggregate tax basis for Acquiring Fund Shares received by the Acquired Fund shareholder pursuant to the reorganization will be the same as the aggregate tax basis of the Acquired Fund shares held by each such Acquired Fund shareholder immediately prior to the Reorganization;
(f) The holding period of Acquiring Fund Shares to be received by the Acquired Fund shareholder will include the period during which the Acquired Fund shares surrendered in exchange therefor were held (provided such Acquired Fund shares were held as capital assets on the date of the Reorganization);
(g) The tax basis of the assets of Acquired Fund acquired by Acquiring Fund will be the same as the tax basis of such assets to Acquired Fund in exchange therefor; and
(h) The holding period of the assets of Acquired Fund in the hands of Acquiring Fund will include the period during which those assets were held by Acquired Fund (except where the investment activities of Acquiring Fund have the effect of reducing or eliminating such periods with respect to an asset).
Notwithstanding anything herein to the contrary, neither the Company, on behalf of Acquiring Fund, nor the Trust, on behalf of Acquired Fund, may waive the conditions set forth in this paragraph 8.6.
9. Fees and Expenses
9.1. (a) Acquired Fund shall bear expenses incurred in connection with the entering into, and carrying out of, the provisions of this Agreement, including printing, filing and proxy solicitation expenses, legal, accounting and Commission registration fees up to an amount equal to $117,000. Morgan Stanley Investment Management Inc., the Acquired Fund's investment adviser, shall bear any expenses in excess of such amount.
(b) In the event the transactions contemplated herein are not consummated by reason of Acquired Fund being either unwilling or unable to go forward (other than by reason of the non-fulfillment or failure of any condition to Acquired Fund's obligations specified in this Agreement), Acquired Fund's only obligation hereunder shall be to reimburse Acquiring Fund for all reasonable out-of-pocket fees and expenses incurred by Acquiring Fund in connection with those transactions.
(c) In the event the transactions contemplated herein are not consummated by reason of Acquiring Fund being either unwilling or unable to go forward (other than by reason of the non-fulfillment or failure of any condition to Acquiring Fund's obligations specified in this Agreement), Acquiring Fund's only obligation hereunder shall be to reimburse Acquired Fund for all reasonable out-of-pocket fees and expenses incurred by Acquired Fund in connection with those transactions.
10. Entire Agreement; Survival of Warranties
10.1. This Agreement constitutes the entire agreement between the parties.
A-11
10.2. The representations, warranties and covenants contained in this Agreement or in any document delivered pursuant hereto or in connection herewith shall survive the consummation of the transactions contemplated herein, except that the representations, warranties and covenants of the Trust, on behalf of Acquired Fund, hereunder shall not survive the dissolution and complete liquidation of Acquired Fund in accordance with paragraph 1.9.
11. Termination
11.1. This Agreement may be terminated and the transactions contemplated hereby may be abandoned at any time prior to the Closing:
(a) by the mutual written consent of the Trust, on behalf of Acquired Fund, and the Company, on behalf of Acquiring Fund;
(b) by either the Company, on behalf of Acquiring Fund, or the Trust, on behalf of Acquired Fund, by notice to the other, without liability to the terminating party on account of such termination (providing the terminating party is not otherwise in material default or breach of this Agreement), if the Closing shall not have occurred on or before September 28, 2013; or
(c) by either the Company, on behalf of Acquiring Fund, or the Trust, on behalf of Acquired Fund, in writing without liability to the terminating party on account of such termination (provided the terminating party is not otherwise in material default or breach of this Agreement), if (i) the other party shall fail to perform in any material respect its agreements contained herein required to be performed on or prior to the Closing Date, (ii) the other party materially breaches any of its representations, warranties or covenants contained herein, (iii) the Acquired Fund shareholders fail to approve this Agreement at any meeting called for such purpose at which a quorum was present or (iv) any other condition herein expressed to be precedent to the obligations of the terminating party has not been met and it reasonably appears that it will not or cannot be met.
11.2. (a) Termination of this Agreement pursuant to paragraphs 11.1(a) or (b) shall terminate all obligations of the parties hereunder and there shall be no liability for damages on the part of the Company, Acquiring Fund, the Trust or Acquired Fund, or the directors or officers of the Company, on behalf of Acquiring Fund, or the trustees or officers of the Trust, on behalf of Acquired Fund, to any other party or its directors, trustees or officers.
(b) Termination of this Agreement pursuant to paragraph 11.1(c) shall terminate all obligations of the parties hereunder and there shall be no liability for damages on the part of the Company, Acquiring Fund, the Trust or Acquired Fund, or the directors or officers of the Company, on behalf of Acquiring Fund, or the trustees or officers of the Trust, on behalf of Acquired Fund, except that any party in breach of this Agreement shall, upon demand, reimburse the non-breaching party for all reasonable out-of-pocket fees and expenses incurred in connection with the transactions contemplated by this Agreement, including legal, accounting and filing fees.
12. Amendments
This Agreement may be amended, modified or supplemented in such manner as may be mutually agreed upon in writing by the parties.
13. Miscellaneous
13.1. The article and paragraph headings contained in this Agreement are for reference purposes only and shall not affect in any way the meaning or interpretation of this Agreement.
13.2. This Agreement may be executed in any number of counterparts, each of which shall be deemed an original.
13.3. This Agreement shall be governed by and construed in accordance with the laws of the State of New York.
13.4. This Agreement shall bind and inure to the benefit of the parties hereto and their respective successors and assigns, but no assignment or transfer hereof or of any rights or obligations hereunder shall be made by any party without the written consent of the other party. Nothing herein expressed or implied is intended or shall be
A-12
construed to confer upon or give any person, firm or corporation, other than the parties hereto and their respective successors and assigns, any rights or remedies hereunder or by reason of this Agreement.
13.5. The obligations and liabilities of Acquiring Fund hereunder are solely those of Acquiring Fund. It is expressly agreed that no shareholder, nominee, director, officer, agent, or employee of Acquiring Fund, or the directors or officers of the Company, acting on behalf of Acquiring Fund, shall be personally liable hereunder. The execution and delivery of this Agreement have been authorized by the directors of Acquiring Fund and signed by authorized officers of the Company, acting on behalf of Acquiring Fund, and neither such authorization by such directors nor such execution and delivery by such officers shall be deemed to have been made by any of them individually or to impose any liability on any of them personally.
13.6. The obligations and liabilities of Acquired Fund hereunder are solely those of Acquired Fund. It is expressly agreed that no shareholder, nominee, trustee, officer, agent, or employee of Acquired Fund, or the trustees or officers of the Trust, acting on behalf of Acquired Fund, shall be personally liable hereunder. The execution and delivery of this Agreement have been authorized by the trustees of the Acquired Fund and signed by authorized officers of the Trust, acting on behalf of Acquired Fund, and neither such authorization by such trustees nor such execution and delivery by such officers shall be deemed to have been made by any of them individually or to impose any liability on any of them personally.
IN WITNESS WHEREOF, each of the parties hereto has caused this Agreement to be executed by a duly authorized officer.
THE UNIVERSAL INSTITUTIONAL FUNDS, INC.,
on behalf of the Global Tactical Asset Allocation Portfolio | |
By: /s/ Arthur Lev
Name: Arthur Lev
Title: President and Principal Executive Officer | |
MORGAN STANLEY VARIABLE INVESTMENT SERIES,
on behalf of the Strategist Portfolio | |
By: /s/ Arthur Lev
Name: Arthur Lev
Title: President and Principal Executive Officer | |
A-13
Class I Prospectus
April 30, 2012
The Universal Institutional Funds, Inc.
Global Tactical Asset Allocation Portfolio
Total return.
Adviser
Morgan Stanley Investment Management Inc.
The Universal Institutional Funds, Inc. (the "Fund") is a mutual fund that provides investment vehicles for variable annuity contracts and variable life insurance policies and for certain tax-qualified investors.
The Securities and Exchange Commission (the "SEC") has not approved or disapproved these securities or passed upon the adequacy of this Prospectus. Any representation to the contrary is a criminal offense.
Ticker Symbol: UIMPX
Portfolio Summary | |
Global Tactical Asset Allocation Portfolio | | | 1 | | |
Details of the Portfolio | |
Global Tactical Asset Allocation Portfolio | | | 5 | | |
Additional Risk Factors and Information | | | 8 | | |
Fund Management | | | 13 | | |
Shareholder Information | | | 14 | | |
Financial Highlights | | | 16 | | |
Class I Prospectus
Portfolio Summary
Portfolio Summary
Global Tactical Asset Allocation Portfolio
Objective
The Portfolio seeks total return.
Fees and Expenses of the Portfolio (Class I)
The table below describes the fees and expenses that you may pay if you buy and hold the classes of shares that may be offered by the Portfolio. The Portfolio does not charge any sales loads or other fees when you purchase or redeem shares. The table and example below do not reflect the impact of any charges by your insurance company. If they did, Total Annual Portfolio Operating Expenses would be higher.
Annual Portfolio Operating Expenses
(expenses that you pay each year as a percentage of the value of your investment)
Advisory Fees* | | | 0.75 | % | |
Distribution (12b-1) Fee | | | None | | |
Other Expenses | | | 0.98 | % | |
Acquired Fund Fees & Expenses** | | | 0.01 | % | |
Total Annual Portfolio Operating Expenses*† | | | 1.74 | % | |
Fee Waiver and/or Expense Reimbursement† | | | 0.73 | % | |
Total Annual Portfolio Operating Expenses
After Fee Waiver and/or Expense
Reimbursement*† | | | 1.01 | % | |
* The expense information in the table has been restated to reflect current fees.
** The Portfolio may invest a portion of its assets in other investment companies (the "Acquired Funds"). The Portfolio's shareholders indirectly bear a pro rata portion of the expenses of the Acquired Funds in which the Portfolio invests. "Acquired Fund Fees & Expenses" in the table is an estimate of those expenses. The estimate is based upon the average allocation of the Portfolio's investments in the Acquired Funds and upon the actual total operating expenses of the Acquired Funds (including any current waivers and expense limitations) for the fiscal year ended December 31, 2011. Actual Acquired Fund fees and expenses incurred by the Portfolio may vary with changes in the allocation of Portfolio assets among the Acquired Funds and with other events that directly affect the fees and expenses of the Acquired Funds. Since "Acquired Fund Fees & Expenses" are not directly borne by the Portfolio, they are not reflected in the Portfolio's financial statements, with the result that the information presented in the table will differ from that presented in the Financial Highlights.
† The Portfolio's "Adviser," Morgan Stanley Investment Management Inc., has agreed to reduce its advisory fee and/or reimburse the Portfolio so that Total Annual Portfolio Operating Expenses, excluding certain investment related expenses (such as foreign country tax expense and interest expense on amounts borrowed), will not exceed 1.00%. The fee waivers and/or expense reimbursements will continue for at least one year or until such time as the Fund's Board of Directors acts to discontinue all or a portion of such waivers and/or reimbursements when it deems such action is appropriate. The
expenses of the Acquired Funds are not taken into account when calculating the fee waivers and/or expense reimbursements,
Example
The example below is intended to help you compare the cost of investing in the Portfolio with the cost of investing in other mutual funds.
This example assumes that you invest $10,000 in the Portfolio for the time periods indicated and then redeem all of your shares at the end of those periods. The example assumes that your investment has a 5% return each year and that the Portfolio's operating expenses remain the same. Although your actual costs may be higher or lower, based on these assumptions, your costs would be:
| | | 1 Year | | 3 Years | | 5 Years | | 10 Years | |
Global Tactical Asset
Allocation Portfolio | | $ | 103 | | | $ | 322 | | | $ | 558 | | | $ | 1,236 | | |
Portfolio Turnover
The Portfolio pays transaction costs when it buys and sells securities (or "turns over" its portfolio). A higher portfolio turnover rate may indicate higher transaction costs and may result in higher taxes when Portfolio shares are held in a taxable account. These costs, which are not reflected in Total Annual Portfolio Operating Expenses or in the example, affect the Portfolio's performance. During the most recent fiscal year, the Portfolio's portfolio turnover rate was 109% of the average value of its portfolio.
Principal Investment Strategies
The Portfolio seeks to achieve total return by investing in a blend of equity and fixed income securities of U.S. and non-U.S. issuers. In seeking to achieve this investment objective, the Portfolio will implement a global tactical approach to achieving total return, and to control risk and volatility.
The Adviser will utilize a top-down investment approach that focuses on asset class, sector, region, country, and currency and thematic allocations. The Portfolio's allocations will be based upon the Adviser's evaluations and analyses, taking into account results of its fundamental market research and recommendations generated by the Adviser's quantitative models. The Adviser's research process focuses on three large macro factors across almost all asset classes: 1) valuation (both relative and absolute), 2) dynamics, including earnings revisions, interest rate policy and inflation expectations, and 3) technicals, such as liquidity and sentiment. The
UIF Global Tactical Asset Allocation Portfolio 1
Global Tactical Asset Allocation Portfolio (Cont'd)
Portfolio may invest in any country, including developing or emerging market countries. The Portfolio's investments may be U.S. and non-U.S. dollar denominated. In determining whether to sell a security, the Adviser considers a number of factors, including changes in capital appreciation potential, or the overall assessment of asset class, sector, region, country, and currency and thematic allocation shifts.
The Portfolio may invest in real estate investment trusts ("REITs") and mortgage-related or mortgage-backed securities. The Portfolio may also invest in restricted and illiquid securities.
The Portfolio may invest a portion of its assets in below investment grade fixed income securities (commonly known as "junk bonds") and repurchase agreements. The Portfolio may also invest up to 10% of its total assets in other investment companies, including exchange-traded funds ("ETFs").
The Portfolio may, but it is not required to, use derivative instruments for a variety of purposes, including hedging, risk management, portfolio management or to earn income. Derivatives are financial instruments whose value is based on the value of another underlying asset, interest rate, index or financial instrument. The Portfolio's use of derivatives may involve the purchase and sale of derivative instruments such as options, futures, swaps, structured investments and other related instruments and techniques. The Portfolio may also utilize forward foreign currency exchange contracts, which are also derivatives, in connection with its investments in foreign securities. Derivative instruments used by the Portfolio will be counted toward the Portfolio's exposure in the types of securities listed above to the extent they have economic characteristics similar to such securities.
Principal Risks
An investment in the Portfolio is subject to risks, and you could lose money on your investment in the Portfolio. There can be no assurance that the Portfolio will achieve its investment objective. An investment in the Portfolio is not a deposit of any bank or other insured depository institution and is not insured or guaranteed by the Federal Deposit Insurance Corporation or any other government agency.
The Portfolio's principal investment strategies are subject to the following principal risks:
• Equity Securities. In general, prices of equity securities are more volatile than those of fixed income securities. The prices of equity securities will rise and fall in response to a number of different factors, including events that affect entire financial markets or industries and events that affect particular issuers.
• Fixed Income Securities. Market prices of the Portfolio's fixed income securities respond to economic developments, especially changes in interest rates, changes in the general level of spreads between U.S. Treasury and non-Treasury securities, as well as to perceptions of the creditworthiness of individual issuers. Generally, fixed income securities decrease in value as interest rates rise and vice versa. Prices of fixed income securities also generally will fall if an issuer's credit rating declines, and rise if it improves. Prices of longer term fixed income securities also are generally more volatile, so the average maturity of the securities in the Portfolio affects risk. Securities with greater spread durations are likely to be more sensitive to changes in spreads between U.S. Treasury and non-Treasury securities, generally making them more volatile than securities with lesser spread durations. Spread duration measures the change in the value of the security (or portfolio) for a given change in the interest rate spread (difference) between U.S. Treasury and non-Treasury securities. In addition, a portion of the Portfolio's securities may be rated below investment grade, commonly known as "junk bonds," and may have speculative risk characteristics.
• Mortgage Securities. The prices of mortgage securities may be particularly sensitive to changes in interest rates because of the risk that borrowers will become more or less likely to refinance their mortgages. For example, an increase in interest rates generally will reduce prepayments, effectively lengthening the maturity of some mortgage securities, and making them subject to more drastic price movements. Because of prepayment issues, it is not possible to predict the ultimate maturity of mortgage securities. Rates of prepayment faster or slower than anticipated by the Adviser could result in reduced yields, increased volatility and/or reductions in net asset value.
• REITs. Like mutual funds, REITs have expenses, including advisory and administration fees, that are paid by their shareholders. Operating REITs requires specialized management skills and the Portfolio indirectly bears management expenses along with the
2 UIF Global Tactical Asset Allocation Portfolio
Class I Prospectus
Portfolio Summary
Global Tactical Asset Allocation Portfolio (Cont'd)
direct expenses of the Portfolio. A general downturn in real estate values also can hurt REIT performance. In addition, REITs are subject to certain provisions under federal tax law. The failure of a company to qualify as a REIT could have adverse consequences for the Portfolio, including significantly reducing the return to the Portfolio on its investment in such company.
• Foreign and Emerging Market Securities. Investing in foreign countries, particularly emerging market or developing countries, entails the risk that news and events unique to a country or region will affect those markets and their issuers. In addition, investments in certain foreign markets, which have historically been considered stable, may become more volatile and subject to increased risk due to ongoing developments and changing conditions in such markets. Moreover, the growing interconnectivity of global economies and financial markets has increased the probability that adverse developments and conditions in one country or region will affect the stability of economies and financial markets in other countries or regions. These same events will not necessarily have an effect on the U.S. economy or similar issuers located in the United States. In addition, the Portfolio's investments in foreign countries generally will be denominated in foreign currencies. As a result, changes in the value of a country's currency compared to the U.S. dollar may affect the value of the Portfolio's investments. These changes may occur separately from and in response to events that do not otherwise affect the value of the security in the issuer's home country. Hedging the Portfolio's currency risks through foreign currency forward exchange contracts involves the risk of mismatching the Portfolio's objectives under a foreign currency forward exchange contract with the value of securities denominated in a particular currency. There is additional risk that such transactions reduce or preclude the opportunity for gain and that currency contracts create exposure to currencies in which the Portfolio's securities are not denominated. The use of foreign currency forward exchange contracts involves the risk of loss from the insolvency or bankruptcy of the counterparty to the contract or the failure of the counterparty to make payments or otherwise comply with the terms of the contract.
• Liquidity Risk. The Portfolio's investments in restricted and illiquid securities may entail greater risk than
investments in publicly traded securities. These securities may be more difficult to sell, particularly in times of market turmoil. Illiquid securities may be more difficult to value. If the Portfolio is forced to sell an illiquid security to fund redemptions or for other cash needs, it may be forced to sell the security at a loss.
• Derivatives. A derivative instrument often has risks similar to its underlying asset and may have additional risks, including imperfect correlation between the value of the derivative and the underlying asset, risks of default by the counterparty to certain transactions, magnification of losses incurred due to changes in the market value of the securities, instruments, indices or interest rates to which they relate, and risks that the transactions may not be liquid. Certain derivative transactions may give rise to a form of leverage. Leverage magnifies the potential for gain and the risk of loss.
Performance Information
The bar chart and table below provide some indication of the risks of investing in the Portfolio by showing changes in the performance of the Portfolio's Class I shares year-by-year and by showing how the Portfolio's Class I shares' average annual returns for the past one, five and ten year periods compare with those of a broad measure of market performance over time. This performance information does not include the impact of any charges deducted by your insurance company. If it did, returns would be lower. How the Portfolio has performed in the past does not necessarily indicate how the Portfolio will perform in the future.
Annual Total Returns—Calendar Years (Class I)
Commenced operations on January 2, 1997
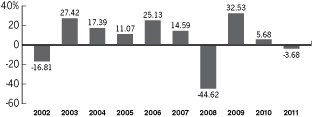
High
Quarter | | 04/09 - 06/09 | | | 26.02 | % | |
Low Quarter | | 07/08 - 09/08 | | | – 21.64 | % | |
UIF Global Tactical Asset Allocation Portfolio 3
Global Tactical Asset Allocation Portfolio (Cont'd)
Average Annual Total Return (Class I)
(for the calendar periods ended December 31, 2011)
| | | Global Tactical
Asset Allocation
Portfolio | | MSCI All
Country
World Index† | |
Past One Year | | | –3.68 | % | | | –7.35 | % | |
Past Five Years | | | –3.06 | % | | | –1.93 | % | |
Past Ten Years | | | 4.00 | % | | | 4.24 | % | |
† The Morgan Stanley Capital International (MSCI) All Country World Index (ACWI) is a free float-adjusted market capitalization weighted index designed to measure the equity market performance of developed and emerging markets. The term "free float" represents the portion of shares outstanding that are deemed to be available for purchase in the public equity markets by investors. The performance of the index is listed in U.S. dollars and assumes reinvestment of net dividends. It is not possible to invest directly in an index.
Adviser
Adviser. Morgan Stanley Investment Management Inc.
Portfolio Manager. The Portfolio is managed by members of the Global Asset Allocation team. Information about the members jointly and primarily responsible for the day-to-day management of the Portfolio are shown below:
Name | | Title with Adviser | | Date Began
Managing the
Portfolio | |
Mark A. Bavoso | | Managing Director | | September 2010 | |
Cyril Moullé-Berteaux | | Managing Director | | August 2011 | |
Purchase and Sale of Portfolio Shares
This Prospectus offers Class I shares of the Global Tactical Asset Allocation Portfolio. The Fund also offers Class II shares of the Portfolio through a separate prospectus. Class II shares are subject to higher expenses due to the imposition of a 12b-1 fee. For eligibility information, contact your insurance company or qualified pension or retirement plan.
Fund shares will be sold at the net asset value ("NAV") next determined after we receive the redemption request on your behalf.
The Portfolio offers its shares only to insurance companies for separate accounts that they establish to fund variable life insurance and variable annuity contracts, and to other entities under qualified pension and retirement plans. An insurance company purchases or redeems shares of the Portfolio based on, among other things, the amount of net contract premiums or purchase payments allocated to a separate account investment division, transfers to or from a separate account investment division, contract loans and repayments, contract withdrawals and surrenders, and benefit payments. The contract prospectus describes how contract owners may allocate, transfer and withdraw amounts to, and from, separate accounts.
For more information, please refer to the "Shareholder Information—Purchasing and Selling Portfolio Shares" section of this Prospectus.
Tax Information
Special tax rules apply to life insurance companies, variable annuity contracts and variable life insurance contracts. For information on federal income taxation of a life insurance company with respect to its receipt of distributions from the Portfolio and federal income taxation of owners of variable annuity or variable life insurance contracts, refer to the contract prospectus.
For more information, please refer to the "Shareholder Information—Taxes" section of this Prospectus.
Payments to Insurance Companies, Broker-Dealers and Other Financial Intermediaries
The Adviser and/or the Portfolio's "Distributor," Morgan Stanley Distribution, Inc., may pay insurance companies or their affiliates, broker-dealers and/or other financial intermediaries for the sale of Portfolio shares and related services. These payments, which may be significant in amount, may create a conflict of interest by influencing the intermediary and your salesperson to recommend the Portfolio over another investment or be a factor in an insurance company's decision to include the Portfolio as an underlying investment option in its variable insurance products. Ask your salesperson or visit your insurance company's or other intermediary's web site for more information.
4 UIF Global Tactical Asset Allocation Portfolio
Class I Prospectus
Details of the Portfolio
Details of the Portfolio
Global Tactical Asset Allocation Portfolio
Objective
The Portfolio seeks total return.
The Portfolio's investment objective may be changed by the Fund's Board of Directors without shareholder approval, but no change is anticipated. If the Portfolio's investment objective changes, the Portfolio will notify shareholders and shareholders should consider whether the Portfolio remains an appropriate investment in light of the change.
Approach
The Portfolio seeks to achieve total return by investing in a blend of equity and fixed income securities of U.S. and non-U.S. issuers. In seeking to achieve this investment objective, the Portfolio will implement a global tactical approach to achieving total return, and to control risk and volatility.
Process
The Adviser will utilize a top-down investment approach that focuses on asset class, sector, region, country, and currency and thematic allocations. The Portfolio's allocations will be based upon the Adviser's evaluations and analyses, taking into account results of its fundamental market research and recommendations generated by the Adviser's quantitative models. The Adviser's research process focuses on three large macro factors across almost all asset classes: 1) valuation (both relative and absolute), 2) dynamics, including earnings revisions, interest rate policy and inflation expectations, and 3) technicals, such as liquidity and sentiment. The Portfolio may invest in any country, including developing or emerging market countries. The Portfolio's investments may be U.S. and non-U.S. dollar denominated. In determining whether to sell a security, the Adviser considers a number of factors, including changes in capital appreciation potential, or the overall assessment of asset class, sector, region, country, and currency and thematic allocation shifts. Thematic allocation shifts refers to allocating the Portfolio's assets between different thematic baskets of securities. A thematic basket of securities encompasses a specific investment idea that the Adviser believes will play out within the current global macro environment. Screening processes based on factors adhering to the investment themes are utilized to select securities for inclusion in each thematic basket.
The Portfolio may invest in REITs and mortgage-related or mortgage-backed securities. The Portfolio's equity investments may include convertible securities.
The Portfolio may invest a portion of its assets in below investment grade fixed income securities (commonly known as "junk bonds") and repurchase agreements. The Portfolio may also invest up to 10% of its total assets in other investment companies, including ETFs.
The Portfolio may purchase certain non-publicly traded "restricted" securities. These securities may include "Rule 144A" securities which are exempt from registration and that may only be resold to qualified institutional buyers and other restricted securities. The Portfolio may invest up to 15% of its assets in illiquid securities.
The Portfolio may, but it is not required to, use derivative instruments for a variety of purposes, including hedging, risk management, portfolio management or to earn income. Derivatives are financial instruments whose value is based on the value of another underlying asset, interest rate, index or financial instrument. The Portfolio's use of derivatives may involve the purchase and sale of derivative instruments such as options, futures, swaps, structured investments and other related instruments and techniques. The Portfolio may also utilize foreign currency forward exchange contracts, which are also derivatives, in connection with its investments in foreign securities. Derivative instruments used by the Portfolio will be counted toward the Portfolio's exposure in the types of securities listed above to the extent they have economic characteristics similar to such securities.
Risks
There is no assurance that the Portfolio will achieve its investment objective. Investing in the Portfolio may be appropriate for you if you are willing to accept the risks and uncertainties of investing in a portfolio of equity and fixed income securities of U.S. and non-U.S. issuers. In general, prices of equity securities are more volatile than those of fixed income securities. The prices of equity securities will rise and fall in response to a number of different factors. In particular, prices of equity securities will respond to events that affect entire financial markets or industries (changes in inflation or consumer demand, for example) and to events that affect particular issuers (news about the success or failure of a new product, for example). To the extent that
UIF Global Tactical Asset Allocation Portfolio 5
Global Tactical Asset Allocation Portfolio (Cont'd)
the Portfolio invests in convertible securities, and the convertible security's investment value is greater than its conversion value, its price will be likely to increase when interest rates fall and decrease when interest rates rise. If the conversion value exceeds the investment value, the price of the convertible security will tend to fluctuate directly with the price of the underlying equity security.
Market prices of the Portfolio's fixed income securities respond to economic developments, especially changes in interest rates, changes in the general level of spreads between U.S. Treasury and non-Treasury securities, as well as to perceptions of the creditworthiness of individual issuers. Generally, fixed income securities decrease in value as interest rates rise and vice versa. Prices of fixed income securities also generally will fall if an issuer's credit rating declines, and rise if it improves. Prices of longer term fixed income securities also are generally more volatile, so the average maturity of the securities in the Portfolio affects risk. Securities with greater spread durations are likely to be more sensitive to changes in spreads between U.S. Treasury and non-Treasury securities, generally making them more volatile than securities with lesser spread durations. Spread duration measures the change in the value of the security (or portfolio) for a given change in the interest rate spread (difference) between U.S. Treasury and non-Treasury securities.
The Portfolio may invest in fixed income securities that are rated below investment grade or are not rated, but are of equivalent quality. These fixed income securities are often referred to as high yield securities or "junk bonds." High yield securities range from those for which the prospect for repayment of principal and interest is predominantly speculative to those which are currently in default on principal or interest payments. When the Portfolio invests in high yield securities, it generally seeks to receive a correspondingly higher return on the securities it holds to compensate it for the additional credit risk and market risk it has assumed. High yield securities may be issued by companies that are restructuring, are smaller and less creditworthy or are more highly indebted than other companies. This means that they may have more difficulty making scheduled payments of principal and interest. Prices of high yield securities will rise and fall primarily in response to actual or perceived changes in the issuer's financial health, although changes in market interest rates also will affect prices. High yield securities may experience reduced liquidity, and sudden and substantial decreases in price.
The prices of mortgage securities may be particularly sensitive to changes in interest rates because of the risk that borrowers will become more or less likely to refinance their mortgages. For example, an increase in interest rates generally will reduce prepayments, effectively lengthening the maturity of some mortgage securities, and making them subject to more drastic price movements. Because of prepayment issues, it is not possible to predict the ultimate maturity of mortgage securities. Rates of prepayment faster or slower than anticipated by the Adviser could result in reduced yields, increased volatility and/or reductions in NAV.
REITs pool investors' funds for investments primarily in real estate properties or real estate related loans. Like mutual funds, REITs have expenses, including advisory and administration fees, that are paid by their shareholders. Operating REITs requires specialized management skills and the Portfolio indirectly bears management expenses along with the indirect expenses of the Portfolio. The performance of any Portfolio REIT holdings ultimately depends on the types of real property in which the REITs invest and how well the property is managed. A general downturn in real estate values also can hurt REIT performance. In addition, REITs are subject to certain provisions under federal tax law. The failure of a company to qualify as a REIT could have adverse consequences for the Portfolio, including significantly reducing the return to the Portfolio on its investment in such company.
Investing in foreign countries, particularly emerging market or developing countries, entails the risk that news and events unique to a country or region will affect those markets and their issuers. These same events will not necessarily have an effect on the U.S. economy or similar issuers located in the United States. In addition, investments in certain foreign markets, which have historically been considered stable, may become more volatile and subject to increased risk due to ongoing developments and changing conditions in such markets. Moreover, the growing interconnectivity of global economies and financial markets has increased probability that adverse developments and conditions in one country or region will affect the stability of economies and financial markets in other countries or regions. Furthermore, the Portfolio's investments in foreign countries generally will be denominated in foreign currencies. As a result, changes in the value of a country's currency compared to the U.S. dollar may affect the value of the Portfolio's investments. These changes may occur separately from and in response to events that do not otherwise affect
6 UIF Global Tactical Asset Allocation Portfolio
Class I Prospectus
Details of the Portfolio
Global Tactical Asset Allocation Portfolio (Cont'd)
the value of the security in the issuer's home country. Hedging the Portfolio's currency risks through foreign currency forward exchange contracts involves the risk of mismatching the Portfolio's objectives under a foreign currency forward exchange contract with the value of securities denominated in a particular currency. There is additional risk that such transactions reduce or preclude the opportunity for gain and that currency contracts create exposure to currencies in which the Portfolio's securities are not denominated.
The Portfolio's investments in restricted and illiquid securities may entail greater risk than investments in publicly traded securities. These securities may be more difficult to sell, particularly in times of market turmoil. Illiquid securities may be more difficult to value. If the Portfolio is forced to sell an illiquid security to fund redemptions or for other cash needs, it may be forced to sell the security at a loss.
A derivative instrument often has risks similar to its underlying asset and may have additional risks, including imperfect correlation between the value of the derivative and the underlying asset, risks of default by the counterparty to certain transactions, magnification of losses incurred due to changes in the market value of the securities, instruments, indices or interest rates to which they relate, and risks that the transactions may not be liquid. Certain derivative transactions may give rise to a form of leverage. Leverage magnifies the potential for gain and the risk of loss.
Please see "Additional Risk Factors and Information" for further information about these and other risks of investing in the Portfolio.
UIF Global Tactical Asset Allocation Portfolio 7
Additional Risk Factors and Information
This section discusses additional risk factors and information relating to the Portfolio. The Portfolio's investment practices and limitations are described in more detail in the Statement of Additional Information ("SAI"), which is incorporated by reference and legally is a part of this Prospectus. For details on how to obtain a copy of the SAI and other reports and information, see the back cover of this Prospectus.
Price Volatility
The value of your investment in the Portfolio is based on the market prices of the securities the Portfolio holds. These prices change daily due to economic and other events that affect markets generally, as well as those that affect particular regions, countries, industries, companies or governments. These price movements, sometimes called volatility, may be greater or less depending on the types of securities the Portfolio owns and the markets in which the securities trade. Over time, equity securities have generally shown gains superior to fixed income securities, although they have tended to be more volatile in the short term. As a result of price volatility, there is a risk that you may lose money by investing in the Portfolio.
Equity Securities
Equity securities include common stock, preferred stock, convertible securities, depositary receipts, rights, warrants and limited partnership interests. The Portfolios may invest in equity securities that are publicly traded on securities exchanges or over the counter or in equity securities that are not publicly traded. Securities that are not publicly traded may be more difficult to sell and their value may fluctuate more dramatically than other securities. The prices of convertible securities are affected by changes similar to those of equity and fixed income securities. The value of a convertible security tends to decline as interest rates rise and, because of the conversion feature, tends to vary with fluctuations in the market value of the underlying equity security.
Fixed Income Securities
Fixed income securities generally are subject to risks related to changes in interest rates and in the financial health or credit rating of the issuers. The value of a fixed income security typically moves in the opposite direction of prevailing interest rates: if rates rise, the value of a fixed income security falls; if rates fall, the value increases. The maturity and duration of a fixed income instrument also affect the extent to which the price of the security will change in response to these and other factors. Longer term securities tend to experience larger changes than shorter term securities because they are more sensitive to changes in interest rates or in the credit ratings of the issuers. The average duration of a fixed income portfolio measures its exposure to the risk of changing interest rates. The Portfolio with a lower average duration generally will experience less price volatility in response to changes in interest rates as compared with a portfolio with a higher dura-
tion. Certain types of fixed income securities, such as inverse floaters, are designed to respond differently to changes in interest rates.
Mortgage Securities
Mortgage securities are fixed income securities representing an interest in a pool of underlying mortgage loans. They are sensitive to changes in interest rates, but may respond to these changes differently from other fixed income securities due to the possibility of prepayment of the underlying mortgage loans. As a result, it may not be possible to determine in advance the actual maturity date or average life of a mortgage security. Rising interest rates tend to discourage refinancings, with the result that the average life and volatility of the security will increase and its market price will decrease. When interest rates fall, however, mortgage securities may not gain as much in market value because additional mortgage prepayments must be reinvested at lower interest rates. Prepayment risk may make it difficult to calculate the average maturity of a portfolio of mortgage securities and, therefore, to assess the volatility risk of that portfolio.
The Portfolio may invest in mortgage securities that are issued or guaranteed by the U.S. Government or its agencies or instrumentalities. These securities are either direct obligations of the U.S. Government or the issuing agency or instrumentality has the right to borrow from the U.S. Treasury to meet its obligations although the U.S. Treasury is not legally required to extend credit to the agency or instrumentality. Certain of these mortgage securities purchased by the Portfolio, such as those issued by the Government National Mortgage Association and the Federal Housing Administration, are backed by the full faith and credit of the United States. Other of these mortgage securities purchased by the Portfolio, such as those issued by the Federal National Mortgage Association ("Fannie Mae") and Federal Home Loan Mortgage Corporation ("Freddie Mac"), are not backed by the full faith and credit of the United States and there is a risk that the U.S. Government will not provide financial support to these agencies if it is not obligated to do so by law. In September 2008, the U.S. Treasury Department announced that the government would be taking over Fannie Mae and Freddie Mac and placing the companies into a conservatorship. In addition, the U.S. Treasury announced additional steps that it intended to take with respect to the debt and mortgage-based securities issued by Fannie Mae and Freddie Mac in order to support the conservatorship. No assurance
8 UIF Global Tactical Asset Allocation Portfolio
Class I Prospectus
Risk Factors and Information
Additional Risk Factors and Information (Cont'd)
can be given that these initiatives will be successful. The maximum potential liability of the issuers of some of the mortgage securities held by the Portfolio may greatly exceed their current resources, including their legal right to support from the U.S. Treasury. It is possible that these issuers will not have the funds to meet their payment obligations in the future.
To the extent the Portfolio invests in mortgage securities offered by non-governmental issuers, such as commercial banks, savings and loan institutions, private mortgage insurance companies, mortgage bankers and other secondary market issuers, the Portfolio may be subject to additional risks. Timely payment of interest and principal of non-governmental issuers are supported by various forms of private insurance or guarantees, including individual loan, title, pool and hazard insurance purchased by the issuer. There can be no assurance that the private insurers can meet their obligations under the policies. An unexpectedly high rate of defaults on the mortgages held by a mortgage pool may adversely affect the value of a mortgage backed security and could result in losses to the Portfolio. The risk of such defaults is generally higher in the case of mortgage pools that include subprime mortgages. Subprime mortgages refer to loans made to borrowers with weakened credit histories or with a lower capacity to make timely payments on their mortgages.
Foreign Securities
Foreign issuers generally are subject to different accounting, auditing and financial reporting standards than U.S. issuers. There may be less information available to the public about foreign issuers. Securities of foreign issuers can be less liquid and experience greater price movements. In addition, the prices of such securities may be susceptible to influence by large traders, due to the limited size of many foreign securities markets. Moreover, investments in certain foreign markets, which have historically been considered stable, may become more volatile and subject to increased risk due to ongoing developments and changing conditions in such markets. Also, the growing interconnectivity of global economies and financial markets has increased the probability that adverse developments and conditions in one country or region will affect the stability of economies and financial markets in other countries or regions. In some foreign countries, there is also the risk of government expropriation, excessive taxation, political or social instability, the imposition of currency controls, or diplomatic developments that could affect the Portfolio's investment. There also can be difficulty
obtaining and enforcing judgments against issuers in foreign countries. Foreign stock exchanges, broker-dealers, and listed issuers may be subject to less government regulation and oversight. The cost of investing in foreign securities, including brokerage commissions and custodial expenses, can be higher than in the United States.
In connection with its investments in foreign securities, the Portfolio also may enter into contracts with banks, brokers or dealers to purchase or sell securities or foreign currencies at a future date. A foreign currency forward exchange contract is a negotiated agreement between two parties to exchange specified amounts of two or more currencies at a specified future time at a specified rate. The rate specified by the foreign currency forward exchange contract can be higher or lower than the spot rate between the currencies that are the subject of the contract. Foreign currency forward exchange contracts may be used to protect against uncertainty in the level of future foreign currency exchange rates or to gain or modify exposure to a particular currency. In addition, the Portfolio may use cross currency hedging or proxy hedging with respect to currencies in which the Portfolio has or expects to have portfolio or currency exposure. Cross currency hedges involve the sale of one currency against the positive exposure to a different currency and may be used for hedging purposes or to establish an active exposure to the exchange rate between any two currencies. Hedging the Portfolio's currency risks involves the risk of mismatching the Portfolio's objectives under a forward or futures contract with the value of securities denominated in a particular currency. Furthermore, such transactions reduce or preclude the opportunity for gain if the value of the currency should move in the direction opposite to the position taken. There is an additional risk to the effect that currency contracts create exposure to currencies in which the Portfolio's securities are not denominated. Unanticipated changes in currency prices may result in poorer overall performance for the Portfolio than if it had not entered into such contracts. The use of foreign currency forward exchange contracts involves the risk of loss from the insolvency or bankruptcy of the counterparty to the contract or the failure of the counterparty to make payments or otherwise comply with the terms of the contract.
Emerging Market Risks
Emerging market or developing countries are countries that major international financial institutions, such as the World Bank, generally consider to be less economically
UIF Global Tactical Asset Allocation Portfolio 9
Additional Risk Factors and Information (Cont'd)
mature than developed nations, such as the United States or most nations in Western Europe. Emerging market or developing countries can include every nation in the world except the United States, Canada, Japan, Australia, New Zealand and most nations located in Western Europe. Emerging market or developing countries may be more likely to experience political turmoil or rapid changes in economic conditions than more developed countries, and the financial condition of issuers in emerging market or developing countries may be more precarious than in other countries. In addition, emerging market securities generally are less liquid and subject to wider price and currency fluctuations than securities issued in more developed countries. These characteristics result in greater risk of price volatility in emerging market or developing countries, which may be heightened by currency fluctuations relative to the U.S. dollar.
Foreign Currency
The Portfolio's investments generally will be denominated in foreign currencies. The value of foreign currencies fluctuates relative to the value of the U.S. dollar. Since the Portfolio may invest in such non-U.S. dollar-denominated securities, and therefore may convert the value of such securities into U.S. dollars, changes in currency exchange rates can increase or decrease the U.S. dollar value of the Portfolio's assets. The Investment Teams may use derivatives to reduce this risk. The Investment Teams may in their discretion choose not to hedge against currency risk. In addition, certain market conditions may make it impossible or uneconomical to hedge against currency risk.
Asset-Backed Securities
Asset-backed securities apply the securitization techniques used to develop mortgage-backed securities to a broad range of other assets. Various types of assets, primarily automobile and credit card receivables and home equity loans, are pooled and securitized in pass-through structures similar to pass-through structures developed with respect to mortgage securitizations. Asset-backed securities have risk characteristics similar to mortgage-backed securities. Like mortgage-backed securities, they generally decrease in value as a result of interest rate increases, but may benefit less than other fixed-income securities from declining interest rates, principally because of prepayments. Also, as in the case of mortgage-backed securities, prepayments generally increase during a period of declining interest rates, although other factors, such as changes in credit use and payment patterns, may also influence prepayment
rates. Asset-backed securities also involve the risk that various federal and state consumer laws and other legal, regulatory and economic factors may result in the collateral backing the securities being insufficient to support payment on the securities.
Derivatives and Other Investments
The Portfolio may, but it is not required to, use derivative instruments for a variety of purposes, including hedging, risk management, portfolio management or to earn income. Derivatives are financial instruments whose value is based on the value of another underlying asset, interest rate, index or financial instrument.
A derivative instrument often has risks similar to its underlying asset and may have additional risks, including imperfect correlation between the value of the derivative and the underlying asset, risks of default by the counterparty to certain transactions, magnification of losses incurred due to changes in the market value of the securities, instruments, indices or interest rates to which they relate, and risks that the transactions may not be liquid. The use of derivatives involves risks that are different from, and possibly greater than, the risks associated with other portfolio investments. Derivatives may involve the use of highly specialized instruments that require investment techniques and risk analyses different from those associated with other portfolio investments.
Certain derivative transactions may give rise to a form of leverage. Leverage magnifies the potential for gain and the risk of loss. Leverage associated with derivative transactions may cause the Portfolio to liquidate portfolio positions when it may not be advantageous to do so to satisfy its obligations or to meet earmarking or segregation requirements, pursuant to applicable SEC rules and regulations, or may cause the Portfolio to be more volatile than if the Portfolio had not been leveraged. Although the Adviser seeks to use derivatives to further the Portfolio's investment objective, there is no assurance that the use of derivatives will achieve this result.
The derivative instruments and techniques that the Portfolio may principally use include the following:
Options. If the Portfolio buys an option, it buys a legal contract giving it the right to buy or sell a specific amount of the underlying instrument or futures contract on the underlying instrument at an agreed-upon price typically in exchange for a premium paid by the Portfolio. If the Portfolio sells an option, it sells to
10 UIF Global Tactical Asset Allocation Portfolio
Class I Prospectus
Risk Factors and Information
Additional Risk Factors and Information (Cont'd)
another person the right to buy from or sell to the Portfolio a specific amount of the underlying instrument or futures contract on the underlying instrument at an agreed-upon price typically in exchange for a premium received by the Portfolio. A decision as to whether, when and how to use options involves the exercise of skill and judgment and even a well-conceived option transaction may be unsuccessful because of market behavior or unexpected events. The prices of options can be highly volatile and the use of options can lower total returns.
Futures. A futures contract is a standardized, exchange-traded agreement to buy or sell a specific quantity of an underlying instrument at a specific price at a specific future time. The value of a futures contract tends to increase and decrease in tandem with the value of the underlying instrument. Depending on the terms of the particular contract, futures contracts are settled through either physical delivery of the underlying instrument on the settlement date or by payment of a cash settlement amount on the settlement date. A decision as to whether, when and how to use futures involves the exercise of skill and judgment and even a well conceived futures transaction may be unsuccessful because of market behavior or unexpected events. In addition to the derivatives risks discussed above, the prices of futures can be highly volatile, using futures can lower total return, and the potential loss from futures can exceed the Portfolio's initial investment in such contracts.
Swaps. An over-the-counter ("OTC") swap contract is an agreement between two parties pursuant to which the parties exchange payments at specified dates on the basis of a specified notional amount, with the payments calculated by reference to specified securities, indexes, reference rates, currencies or other instruments. A small percentage of swap contracts are cleared through a central clearinghouse. Most swap agreements provide that when the period payment dates for both parties are the same, the payments are made on a net basis (i.e., the two payment streams are netted out, with only the net amount paid by one party to the other). The Portfolio's obligations or rights under a swap contract entered into on a net basis will generally be equal only to the net amount to be paid or received under the agreement, based on the relative values of the positions held by each counterparty. Most swap agreements are not entered into or traded on exchanges and often there is no central clearing or guaranty function for swaps. These OTC swaps are often subject to
credit risk or the risk of default or non-performance by the counterparty. Swaps could result in losses if interest rates or foreign currency exchange rates or credit quality changes are not correctly anticipated by the Portfolio or if the reference index, security or investments do not perform as expected. The Portfolio's use of swaps may include those based on the credit of an underlying security, commonly referred to as "credit default swaps." Where the Portfolio is the buyer of a credit default swap contract, it would be entitled to receive the par (or other agreed-upon) value of a referenced debt obligation from the counterparty to the contract only in the event of a default or similar event by a third party on the debt obligation. If no default occurs, the Portfolio would have paid to the counterparty a periodic stream of payments over the term of the contract and received no benefit from the contract. When the Portfolio is the seller of a credit default swap contract, it receives the stream of payments but is obligated to pay an amount equal to the par (or other agreed upon) value of a referenced debt obligation upon the default or similar event of that referenced debt obligation.
Structured Investments. The Portfolio also may invest a portion of its assets in structured investments. A structured investment is a derivative security designed to offer a return linked to a particular underlying security, currency, commodity or market. Structured investments may come in various forms including notes, warrants and options to purchase securities. The Portfolio will typically use structured investments to gain exposure to a permitted underlying security, currency, commodity or market when direct access to a market is limited or inefficient from a tax or cost standpoint. Investments in structured investments involve risks including issuer risk, counterparty risk and market risk. Holders of structured investments bear risks of the underlying investment and are subject to issuer or counterparty risk because the Portfolio is relying on the creditworthiness of such issuer or counterparty and has no rights with respect to the issuer of the underlying investment. Certain structured investments may be thinly traded or have a limited trading market and may have the effect of increasing the Portfolio's illiquidity to the extent that the Portfolio, at a particular point in time, may be unable to find qualified buyers for these securities.
Investment Companies and ETFs
An investment in an investment company, including ETFs, is subject to the underlying risks of that entity's portfolio securities. For example, if an investment
UIF Global Tactical Asset Allocation Portfolio 11
Additional Risk Factors and Information (Cont'd)
company held common stocks, the Portfolio would also be exposed to the risk of investing in common stocks. In addition to the Portfolio's fees and expenses, the Portfolio would bear its share of the investment company's or ETF's fees and expenses. Certain ETFs utilize leverage, which may magnify the gains or losses realized from their underlying investments.
Repurchase Agreements
Repurchase agreements are subject to risks associated with the possibility of default by the seller at a time when the collateral has declined in value, or insolvency of the seller, which may affect the Portfolio's right to control the collateral.
Investment Discretion
In pursuing the Portfolio's investment objective, the Adviser has considerable leeway in deciding which investments it buys, holds or sells on a day-to-day basis, and which trading strategies it uses. For example, the Adviser, in its discretion, may determine to use some permitted trading strategies while not using
others. The success or failure of such decisions will affect the Portfolio's performance.
Temporary Defensive Investments
When the Investment Teams believe that changes in economic, financial or political conditions warrant, the Portfolio may invest without limit in certain short- and medium-term fixed income securities that may be inconsistent with its principal investment strategies for temporary defensive purposes. If the Investment Teams incorrectly predict the effects of these changes, such defensive investments may adversely affect the Portfolio's performance and the Portfolio may not achieve its investment objective.
Portfolio Turnover
Consistent with its investment policies, the Portfolio will purchase and sell securities without regard to the effect on portfolio turnover. Higher portfolio turnover (e.g., over 100% per year) will cause the Portfolio to incur additional transaction costs. The Portfolio may engage in frequent trading of securities to achieve its investment objective.
12 UIF Global Tactical Asset Allocation Portfolio
Class I Prospectus
Fund Management
Adviser
The Adviser is Morgan Stanley Investment Management Inc. The Adviser, with principal offices at 522 Fifth Avenue, New York, NY 10036, conducts a worldwide portfolio management business and provides a broad range of portfolio management services to customers in the United States and abroad. Morgan Stanley is the direct parent of the Adviser and the indirect parent of the Distributor. Morgan Stanley is a preeminent global financial services firm engaged in securities trading and brokerage activities, as well as providing investment banking, research and analysis, financing and financial advisory services. As of December 31, 2011, the Adviser, together with its affiliated asset management companies, had approximately $287.4 billion in assets under management or supervision.
Advisory Fee
For the fiscal year ended December 31, 2011, the Adviser received a fee for advisory services (net of fee waivers and/or expense reimbursements) equal to 0.00% of the Portfolio's average daily net assets.
The Adviser has agreed to reduce its advisory fee and/or reimburse the Portfolio, if necessary, if such fees would cause the total annual operating expenses of the Portfolio to exceed 1.00% of average daily net assets. In determining the actual amount of fee waiver and/or expense reimbursement for the Portfolio, if any, the Adviser excludes from annual operating expenses certain investment related expenses (such as foreign country tax expense and interest expense on amounts borrowed). The fee waivers and/or expense reimbursements for the Portfolio will continue for at least one year or until such time as the Fund's Board of Directors acts to discontinue all or a portion of such waivers and/or reimbursements when it deems such action is appropriate.
A discussion regarding the Board of Directors' approval of the investment advisory agreement is available in the Fund's semi-annual report to shareholders for the period ended June 30, 2011.
The Adviser and/or the Distributor may pay compensation (out of their own funds and not as an expense of the Portfolio) to certain affiliated or unaffiliated brokers, dealers and/or certain insurance companies or other financial intermediaries or service providers in connection with the sale, distribution, marketing and/or retention of shares of the Portfolio and/or shareholder servicing. Such compensation may be significant in amount and the prospect of receiving any such compensation may provide such affiliated or unaffiliated entities with an incentive to favor sales of the Portfolio's shares over other investment options. Any such payments will not change the NAV or the price of the Portfolio's shares. For more information, please see the Fund's SAI.
Portfolio Management
The Portfolio is managed by members of the Global Asset Allocation team. The team consists of portfolio managers and analysts. Current members of the team jointly and primarily responsible for the day-to-day management of the Portfolio are Mark A. Bavoso and Cyril Moullé-Berteaux.
Mr. Bavoso has been associated with the Adviser in an investment management capacity since 1986. Mr. Moullé-Berteaux has been associated with the Adviser in an investment management capacity since August 2011. Mr. Moullé-Berteaux was a founding partner and portfolio manager of Traxis Partners LP from March 2003 to July 2011.
Team members collaborate to manage the assets of the Portfolio.
The Fund's SAI provides additional information about the portfolio managers' compensation structure, other accounts managed by the portfolio managers and the portfolio managers' ownership of securities in the Portfolio.
The composition of the team may change from time to time.
UIF Global Tactical Asset Allocation Portfolio 13
Share Class
This Prospectus offers Class I shares of the Global Tactical Asset Allocation Portfolio. The Fund also offers Class II shares of the Portfolio through a separate prospectus. Class II shares are subject to higher expenses due to the imposition of a 12b-1 fee. For eligibility information, contact your insurance company or qualified pension or retirement plan.
Purchasing and Selling Portfolio Shares
Shares are offered on each day that the New York Stock Exchange (the "NYSE") is open for business.
The Portfolio offers its shares only to insurance companies for separate accounts that they establish to fund variable life insurance and variable annuity contracts, and to other entities under qualified pension and retirement plans. An insurance company purchases or redeems shares of the Portfolio based on, among other things, the amount of net contract premiums or purchase payments allocated to a separate account investment division, transfers to or from a separate account investment division, contract loans and repayments, contract withdrawals and surrenders, and benefit payments. The contract prospectus describes how contract owners may allocate, transfer and withdraw amounts to, and from, separate accounts.
There are no known disadvantages to variable product contract owners or qualified plan participants arising out of the fact that the Portfolio offers its shares to separate accounts of various insurance companies that offer variable annuity and variable life insurance products and various other entities under qualified pension and retirement plans. Nevertheless, the Board of Directors that oversees the Portfolio intends to monitor events to identify any material irreconcilable conflicts that may possibly arise due to these arrangements and to determine what action, if any, should be taken in response.
Pricing of Portfolio Shares
The price per share will be the NAV per share next determined after the Fund or the insurance company receives your purchase or redemption order. The NAV for one share is the value of that share's portion of all of the net assets in the Portfolio. The Fund determines the NAV per share for the Portfolio as of the close of the NYSE (normally 4:00 p.m. Eastern Time) on each day that the NYSE is open for business.
About Net Asset Value
The NAV per share of the Portfolio is determined by dividing the total of the value of the Portfolio's investments and other assets, less any liabilities, by the total number of outstanding shares of the Portfolio. In making this calculation, the Portfolio generally values securities at market price. If market prices are unavailable or may be unreliable because of events occurring after the close of trading, the value for those securities will be determined in good faith at fair value using methods approved by the Board of Directors. In addition, with respect to securities that primarily are listed on foreign exchanges, when an event occurs after the close of such exchanges that is likely to have changed the value of the securities (e.g., a percentage change in value of one or more U.S. securities indices in excess of specified thresholds), such securities will be valued at their fair value, as determined under procedures established by the Fund's Board of Directors. Securities also may be fair valued in the event of a significant development affecting a country or region or an issuer-specific development which is likely to have changed the value of the security. In these cases, the Portfolio's NAV will reflect certain portfolio securities' fair value rather than their market price. To the extent the Portfolio invests in open-end management companies that are registered under the Investment Company Act of 1940, as amended, the Portfolio's NAV is calculated based upon the NAV of such funds. The prospectuses for such funds explain the circumstances under which they will use fair value pricing and its effects.
Fair value pricing involves subjective judgments and it is possible that the fair value determined for a security is materially different than the value that could be realized upon the sale of that security. The Portfolio may hold securities that are listed on foreign exchanges. These securities may trade on weekends or other days when the Portfolio does not calculate its NAV. As a result, the value of these investments may change on days when you cannot purchase or sell shares.
The NAV of Class I shares will differ from that of Class II shares because of class-specific expenses that each class may pay.
Dividends and Distributions
The Portfolio distributes its net investment income, if any, at least annually as dividends and makes distributions of its net realized capital gains, if any, at least annually.
14 UIF Global Tactical Asset Allocation Portfolio
Class I Prospectus
Shareholder Information
Shareholder Information (Cont'd)
Taxes
The Portfolio expects that it will not have to pay federal income taxes if it distributes annually all of its net investment income and net realized capital gains. The Portfolio does not expect to be subject to federal excise taxes with respect to undistributed income.
Special tax rules apply to life insurance companies, variable annuity contracts and variable life insurance contracts. For information on federal income taxation of a life insurance company with respect to its receipt of distributions from the Portfolio and federal income taxation of owners of variable annuity or variable life insurance contracts, refer to the contract prospectus.
Because each investor's tax circumstances are unique and the tax laws may change, you should consult your tax advisor about the federal, state and local tax consequences applicable to your investment.
Frequent Purchases and Redemptions of Shares
Frequent purchases and redemptions of shares pursuant to the instructions of insurance company contract owners or qualified plan participants is referred to as "market-timing" or "short-term trading" and may present risks for other contract owners or participants with long-term interests in the Portfolio, which may include, among other things, dilution in the value of the Portfolio's shares indirectly held by contract owners or participants with long-term interests in the Portfolio, interference with the efficient management of the Portfolio, increased brokerage and administrative costs and forcing the Portfolio to hold excess levels of cash.
In addition, the Portfolio is subject to the risk that market-timers and/or short-term traders may take advantage of time zone differences between the foreign markets on which the Portfolio's securities trade and the time the Portfolio's NAV is calculated ("time-zone arbitrage"). For example, a market-timer may submit instructions for the purchase of shares of the Portfolio based on events occurring after foreign market closing prices are established, but before the Portfolio's NAV calculation that are likely to result in higher prices in foreign markets the following day. The market-timer would submit instructions to redeem the Portfolio's shares the next day when the Portfolio's share price would reflect the increased prices in foreign markets for a quick profit at the expense of contract owners or participants with long-term interests in the Portfolio.
Investments in other types of securities also may be susceptible to short-term trading strategies. These investments include securities that are, among other things, thinly traded, traded infrequently or relatively illiquid, which have the risk that the current market price for the securities may not accurately reflect current market
values. A contract owner may seek to engage in short-term trading to take advantage of these pricing differences (referred to as "price-arbitrage"). The Portfolio's policies with respect to valuing portfolio securities are described above in "About Net Asset Value."
The Fund's Board of Directors has adopted policies and procedures to discourage frequent purchases and redemptions of Portfolio shares by Portfolio shareholders. Insurance companies or qualified plans generally do not provide specific contract owner or plan participant transaction instructions to the Portfolio on an ongoing basis. Therefore, to some extent, the Portfolio relies on the insurance companies and qualified plans to monitor frequent short-term trading by contract owners. However, the Portfolio has entered into agreements with insurance companies and qualified plans whereby the insurance companies and qualified plans are required to provide certain contract owner identification and transaction information upon the Portfolio's request. The Portfolio may use this information to help identify and prevent market-timing activity in the Portfolio. There can be no assurance that the Portfolio will be able to identify or prevent all market-timing activity.
If the Portfolio identifies suspected market-timing activity, the insurance company or qualified plan will be contacted and asked to take steps to prevent further market-timing activity (e.g., sending warning letters or blocking frequent trading by underlying contract owners or participants). Insurance companies may be prohibited by the terms of the underlying insurance contract from restricting short-term trading of mutual fund shares by contract owners, thereby limiting the ability of such insurance company to implement remedial steps to prevent market-timing activity in the Portfolio. If the insurance company or qualified plan is unwilling or unable to take remedial steps to discourage or prevent frequent trading, or does not take action promptly, certain contract owners or participants may be able to engage in frequent trading to the detriment of contract owners or participants with long-term interests in the Portfolio. If the insurance company or qualified plan refuses to take remedial action, or takes action that the Portfolio deems insufficient, a determination will be made whether it is appropriate to terminate the relationship with such insurance company or qualified plan.
Portfolio Holdings Information
A description of the Fund's policies and procedures with respect to the disclosure of the Portfolio's securities is available in the Fund's SAI.
UIF Global Tactical Asset Allocation Portfolio 15
Class I Prospectus
Financial Highlights
The financial highlights table is intended to help you understand the financial performance of the Portfolio's Class I shares for the past five fiscal years. Certain information reflects financial results for a single Portfolio share. The total returns in the table represent the rate that an investor would have earned (or lost) on an investment in the Portfolio (assuming reinvestment of all dividends and distributions). In addition, this performance information does not include the impact of any charges by your insurance company. If it did, returns would be lower. The ratio of expenses to average net assets listed in the table below are based on the average net assets of the Portfolio for each of the periods listed in the table. To the extent that the Portfolio's average net assets decrease over the
Portfolio's next fiscal year, such expense ratios can be expected to increase, potentially significantly, because certain fixed costs will be spread over a smaller amount of assets. The information has been audited by Ernst & Young LLP, an independent registered public accounting firm. Ernst & Young LLP's report, along with the Portfolio's financial statements, are incorporated by reference in the SAI and are included in the Fund's Annual Report to Shareholders. The Annual Report to Shareholders and the Portfolio's financial statements, as well as the SAI, are available at no cost from the Portfolio at the toll free number noted on the back cover to this Prospectus or from your insurance company.
| | | Year Ended December 31, | |
Selected Per Share Data and Ratios | | 2011 | | 2010 | | 2009 | | 2008 | | 2007 | |
Net Asset Value, Beginning of Period | | $ | 9.02 | | | $ | 8.81 | | | $ | 6.86 | | | $ | 14.50 | | | $ | 14.26 | | |
Income (Loss) from Investment Operations: | |
Net Investment Income† | | | 0.13 | | | | 0.11 | | | | 0.13 | | | | 0.30 | | | | 0.17 | | |
Net Realized and Unrealized Gain (Loss) | | | (0.45 | ) | | | 0.34 | | | | 2.05 | | | | (6.09 | ) | | | 1.89 | | |
Total from Investment Operations | | | (0.32 | ) | | | 0.45 | | | | 2.18 | | | | (5.79 | ) | | | 2.06 | | |
Distributions from and/or in Excess of: | |
Net Investment Income | | | (0.12 | ) | | | (0.25 | ) | | | (0.23 | ) | | | (0.38 | ) | | | (0.23 | ) | |
Net Realized Gain | | | – | | | | – | | | | – | | | | (1.47 | ) | | | (1.59 | ) | |
Total Distributions | | | (0.12 | ) | | | (0.25 | ) | | | (0.23 | ) | | | (1.85 | ) | | | (1.82 | ) | |
Regulatory Settlement Proceeds | | | – | | | | 0.01 | # | | | – | | | | – | | | | – | | |
Net Asset Value, End of Period | | $ | 8.58 | | | $ | 9.02 | | | $ | 8.81 | | | $ | 6.86 | | | $ | 14.50 | | |
Total Return++ | | | (3.68 | )% | | | 5.68 | % | | | 32.53 | % | | | (44.62 | )% | | | 14.59 | % | |
Ratios and Supplemental Data: | |
Net Assets, End of Period (Thousands) | | $ | 64,668 | | | $ | 85,752 | | | $ | 98,707 | | | $ | 86,530 | | | $ | 209,933 | | |
Ratio of Expenses to Average Net Assets(1) | | | 0.96 | %+^ | | | 1.03 | %+ | | | 1.04 | %+ | | | 1.05 | %+ | | | 1.05 | %+ | |
Ratio of Expenses to Average Net Assets Excluding Non Operating
Expenses | | | N/A | | | | 1.03 | %+ | | | N/A | | | | N/A | | | | N/A | | |
Ratio of Net Investment Income to Average Net Assets(1) | | | 1.42 | %+ | | | 1.35 | %+ | | | 1.75 | %+ | | | 2.72 | %+ | | | 1.15 | %+ | |
Ratio of Rebate from Morgan Stanley Affiliates to Average Net
Assets | | | 0.06 | % | | | 0.02 | % | | | 0.01 | % | | | 0.00 | %§ | | | 0.00 | %§ | |
Portfolio Turnover Rate | | | 109 | % | | | 183 | % | | | 30 | % | | | 26 | % | | | 43 | % | |
(1) Supplemental Information on the Ratios to Average Net Assets: | |
Ratios Before Expense Limitation: | |
Expenses to Average Net Assets | | | 1.76 | % | | | 1.45 | %+ | | | 1.21 | %+ | | | 1.19 | %+ | | | 1.15 | %+ | |
Net Investment Income to Average Net Assets | | | 0.62 | % | | | 0.93 | %+ | | | 1.58 | %+ | | | 2.58 | %+ | | | 1.05 | %+ | |
† Per share amount is based on average shares outstanding.
# During the year ended December 31, 2010, the Portfolio received a regulatory settlement from an unaffiliated third party, which had an impact of 0.11% on the total return. This was a one-time settlement, and as a result, the impact on the NAV and consequently the performance will not likely be repeated in the future. Had this settlement not occurred, the total return for Class I would have been approximately 5.57%.
++ Calculated based on the net asset value as of the last business day of the period. Performance does not reflect fees and expenses imposed by your insurance company's separate account. If performance information included the effect of these additional charges, the total return would be lower.
+ The Ratios of Expenses and Net Investment Income reflect the rebate of certain Portfolio expenses in connection with the investments in Morgan Stanley affiliates during the period. The effect of the rebate on the ratios is disclosed in the above table as "Ratio of Rebate from Morgan Stanley Affiliates to Average Net Assets."
§ Amount is less than 0.005%.
^ Effective July 1, 2011, the Adviser has agreed to limit the ratio of expenses to average net assets to the maximum ratio of 1.00% for Class I shares. Prior to July 1, 2011, the maximum ratio was 1.05% for Class I shares.
16 UIF Global Tactical Asset Allocation Portfolio
Where to Find Additional Information
Statement of Additional Information
In addition to this Prospectus, the Fund has a Statement of Additional Information, dated April 30, 2012, which contains additional, more detailed information about the Fund and the Portfolio. The Statement of Additional Information is incorporated by reference into this Prospectus and, therefore, legally forms a part of this Prospectus.
Shareholder Reports
The Fund publishes annual and semi-annual reports containing financial statements. These reports contain additional information about the Portfolio's investments. In the Fund's shareholder reports, you will find a discussion of the market conditions and the investment strategies that significantly affected the Portfolio's performance during that period.
For additional Fund information, including information regarding the investments comprising the Portfolio, and to make shareholder inquiries, please call 1-800-281-2715 or contact your insurance company.
You may obtain the Statement of Additional Information and shareholder reports without charge by contacting the Fund at the toll-free number above or your insurance company or on our web site at www.morganstanley.com/im.
Information about the Fund, including the Statement of Additional Information, and the annual and semi-annual reports, may be obtained from the SEC in any of the following ways: (1) in person: you may review and copy documents in the SEC's Public Reference Room in Washington, D.C. (for information on the operation of the Public Reference Room, call 1-202-551-8090); (2) on-line: you may retrieve information from the EDGAR Database on the SEC's web site at http://www.sec.gov; or (3) by mail: you may request documents, upon payment of a duplicating fee, by writing to the Securities and Exchange Commission, Public Reference Section, Washington, D.C. 20549-1520. You may also obtain this information, upon payment of a duplicating fee, by e-mailing the SEC at the following address: publicinfo@sec.gov. To aid you in obtaining this information, the Fund's Investment Company Act registration number is 811-7607.
Class II Prospectus
April 30, 2012
The Universal Institutional Funds, Inc.
Global Tactical Asset Allocation Portfolio
Total return.
Adviser
Morgan Stanley Investment Management Inc.
The Universal Institutional Funds, Inc. (the "Fund") is a mutual fund that provides investment vehicles for variable annuity contracts and variable life insurance policies and for certain tax-qualified investors.
The Securities and Exchange Commission (the "SEC") has not approved or disapproved these securities or passed upon the adequacy of this Prospectus. Any representation to the contrary is a criminal offense.
Ticker Symbol: UGTPX
Portfolio Summary | |
Global Tactical Asset Allocation Portfolio | | | 1 | | |
Details of the Portfolio | |
Global Tactical Asset Allocation Portfolio | | | 5 | | |
Additional Risk Factors and Information | | | 8 | | |
Fund Management | | | 13 | | |
Shareholder Information | | | 15 | | |
Financial Highlights | | | 17 | | |
Class II Prospectus
Portfolio Summary
Portfolio Summary
Global Tactical Asset Allocation Portfolio
Objective
The Portfolio seeks total return.
Fees and Expenses of the Portfolio (Class II)
The table below describes the fees and expenses that you may pay if you buy and hold the classes of shares that may be offered by the Portfolio. The Portfolio does not charge any sales loads or other fees when you purchase or redeem shares. The table and example below do not reflect the impact of any charges by your insurance company. If they did, Total Annual Portfolio Operating Expenses would be higher.
Annual Portfolio Operating Expenses
(expenses that you pay each year as a percentage of the value of your investment)
Advisory Fees* | | | 0.75 | % | |
Distribution (12b-1) Fee | | | 0.35 | % | |
Other Expenses | | | 0.98 | % | |
Acquired Fund Fees & Expenses** | | | 0.01 | % | |
Total Annual Portfolio Operating Expenses*† | | | 2.09 | % | |
Fee Waiver and/or Expense Reimbursement† | | | 0.98 | % | |
Total Annual Portfolio Operating Expenses
After Fee Waiver and/or Expense
Reimbursement*† | | | 1.11 | % | |
* The expense information in the table has been restated to reflect current fees.
** The Portfolio may invest a portion of its assets in other investment companies (the "Acquired Funds"). The Portfolio's shareholders indirectly bear a pro rata portion of the expenses of the Acquired Funds in which the Portfolio invests. "Acquired Fund Fees & Expenses" in the table is an estimate of those expenses. The estimate is based upon the average allocation of the Portfolio's investments in the Acquired Funds and upon the actual total operating expenses of the Acquired Funds (including any current waivers and expense limitations) for the fiscal year ended December 31, 2011. Actual Acquired Fund fees and expenses incurred by the Portfolio may vary with changes in the allocation of Portfolio assets among the Acquired Funds and with other events that directly affect the fees and expenses of the Acquired Funds. Since "Acquired Fund Fees & Expenses" are not directly borne by the Portfolio, they are not reflected in the Portfolio's financial statements, with the result that the information presented in the table will differ from that presented in the Financial Highlights.
† The Portfolio's "Adviser," Morgan Stanley Investment Management Inc., has agreed to reduce its advisory fee and/or reimburse the Portfolio so that Total Annual Portfolio Operating Expenses, excluding certain investment related expenses (such as foreign country tax expense and interest expense on amounts borrowed) (but including any 12b-1 fee paid to the Portfolio's "Distributor," Morgan Stanley Distribution, Inc.), will not exceed 1.10%. The fee waivers and/or expense reimbursements will continue for at least one year or until such time as the Fund's Board of Directors acts to discontinue all or
a portion of such waivers and/or reimbursements when it deems such action is appropriate. The expenses of the Acquired Funds are not taken into account when calculating the fee waivers and/or expense reimbursements,
Example
The example below is intended to help you compare the cost of investing in the Portfolio with the cost of investing in other mutual funds.
This example assumes that you invest $10,000 in the Portfolio for the time periods indicated and then redeem all of your shares at the end of those periods. The example assumes that your investment has a 5% return each year and that the Portfolio's operating expenses remain the same. Although your actual costs may be higher or lower, based upon these assumptions your costs would be:
| | | 1 Year | | 3 Years | | 5 Years | | 10 Years | |
Global Tactical Asset
Allocation Portfolio | | $ | 113 | | | $ | 353 | | | $ | 612 | | | $ | 1,352 | | |
Portfolio Turnover
The Portfolio pays transaction costs when it buys and sells securities (or "turns over" its portfolio). A higher portfolio turnover rate may indicate higher transaction costs and may result in higher taxes when Portfolio shares are held in a taxable account. These costs, which are not reflected in Total Annual Portfolio Operating Expenses or in the example, affect the Portfolio's performance. During the most recent fiscal year, the Portfolio's portfolio turnover rate was 109% of the average value of its portfolio.
Principal Investment Strategies
The Portfolio seeks to achieve total return by investing in a blend of equity and fixed income securities of U.S. and non-U.S. issuers. In seeking to achieve this investment objective, the Portfolio will implement a global tactical approach to achieving total return, and to control risk and volatility.
The Adviser will utilize a top-down investment approach that focuses on asset class, sector, region, country, and currency and thematic allocations. The Portfolio's allocations will be based upon the Adviser's evaluations and analyses, taking into account results of its fundamental market research and recommendations generated by the Adviser's quantitative models. The Adviser's research process focuses on three large macro factors across almost all asset classes: 1) valuation (both relative and absolute), 2) dynamics, including earnings revisions, interest rate policy and inflation expectations,
UIF Global Tactical Asset Allocation Portfolio 1
Global Tactical Asset Allocation Portfolio (Cont'd)
and 3) technicals, such as liquidity and sentiment. The Portfolio may invest in any country, including developing or emerging market countries. The Portfolio's investments may be U.S. and non-U.S. dollar denominated. In determining whether to sell a security, the Adviser considers a number of factors, including changes in capital appreciation potential, or the overall assessment of asset class, sector, region, country, and currency and thematic allocation shifts.
The Portfolio may invest in real estate investment trusts ("REITs") and mortgage-related or mortgage-backed securities. The Portfolio may also invest in restricted and illiquid securities.
The Portfolio may invest a portion of its assets in below investment grade fixed income securities (commonly known as "junk bonds") and repurchase agreements. The Portfolio may also invest up to 10% of its total assets in other investment companies, including exchange-traded funds ("ETFs").
The Portfolio may, but it is not required to, use derivative instruments for a variety of purposes, including hedging, risk management, portfolio management or to earn income. Derivatives are financial instruments whose value is based on the value of another underlying asset, interest rate, index or financial instrument. The Portfolio's use of derivatives may involve the purchase and sale of derivative instruments such as options, futures, swaps, structured investments and other related instruments and techniques. The Portfolio may also utilize foreign currency forward exchange contracts, which are also derivatives, in connection with its investments in foreign securities. Derivative instruments used by the Portfolio will be counted toward the Portfolio's exposure in the types of securities listed above to the extent they have economic characteristics similar to such securities.
Principal Risks
An investment in the Portfolio is subject to risks, and you could lose money on your investment in the Portfolio. There can be no assurance that the Portfolio will achieve its investment objective. An investment in the Portfolio is not a deposit of any bank or other insured depository institution and is not insured or guaranteed by the Federal Deposit Insurance Corporation or any other government agency.
The Portfolio's principal investment strategies are subject to the following principal risks:
• Equity Securities. In general, prices of equity securities are more volatile than those of fixed income securities. The prices of equity securities will rise and fall in response to a number of different factors, including events that affect entire financial markets or industries and events that affect particular issuers.
• Fixed Income Securities. Market prices of the Portfolio's fixed income securities respond to economic developments, especially changes in interest rates, changes in the general level of spreads between U.S. Treasury and non-Treasury securities, as well as to perceptions of the creditworthiness of individual issuers. Generally, fixed income securities decrease in value as interest rates rise and vice versa. Prices of fixed income securities also generally will fall if an issuer's credit rating declines, and rise if it improves. Prices of longer term fixed income securities also are generally more volatile, so the average maturity of the securities in the Portfolio affects risk. Securities with greater spread durations are likely to be more sensitive to changes in spreads between U.S. Treasury and non-Treasury securities, generally making them more volatile than securities with lesser spread durations. Spread duration measures the change in the value of the security (or portfolio) for a given change in the interest rate spread (difference) between U.S. Treasury and non-Treasury securities. In addition, a portion of the Portfolio's securities may be rated below investment grade, commonly known as "junk bonds," and may have speculative risk characteristics.
• Mortgage Securities. The prices of mortgage securities may be particularly sensitive to changes in interest rates because of the risk that borrowers will become more or less likely to refinance their mortgages. For example, an increase in interest rates generally will reduce prepayments, effectively lengthening the maturity of some mortgage securities, and making them subject to more drastic price movements. Because of prepayment issues, it is not possible to predict the ultimate maturity of mortgage securities. Rates of prepayment faster or slower than anticipated by the Adviser could result in reduced yields, increased volatility and/or reductions in net asset value.
• REITs. Like mutual funds, REITs have expenses, including advisory and administration fees, that are paid by their shareholders. Operating REITs requires
2 UIF Global Tactical Asset Allocation Portfolio
Class II Prospectus
Portfolio Summary
Global Tactical Asset Allocation Portfolio (Cont'd)
specialized management skills and the Portfolio indirectly bears management expenses along with the direct expenses of the Portfolio. A general downturn in real estate values also can hurt REIT performance. In addition, REITs are subject to certain provisions under federal tax law. The failure of a company to qualify as a REIT could have adverse consequences for the Portfolio, including significantly reducing the return to the Portfolio on its investment in such company.
• Foreign and Emerging Market Securities. Investing in foreign countries, particularly emerging market or developing countries, entails the risk that news and events unique to a country or region will affect those markets and their issuers. In addition, investments in certain foreign markets, which have historically been considered stable, may become more volatile and subject to increased risk due to ongoing developments and changing conditions in such markets. Moreover, the growing interconnectivity of global economies and financial markets has increased the probability that adverse developments and conditions in one country or region will affect the stability of economies and financial markets in other countries or regions. These same events will not necessarily have an effect on the U.S. economy or similar issuers located in the United States. In addition, the Portfolio's investments in foreign countries generally will be denominated in foreign currencies. As a result, changes in the value of a country's currency compared to the U.S. dollar may affect the value of the Portfolio's investments. These changes may occur separately from and in response to events that do not otherwise affect the value of the security in the issuer's home country. Hedging the Portfolio's currency risks through foreign currency forward exchange contracts involves the risk of mismatching the Portfolio's objectives under a foreign currency forward exchange contract with the value of securities denominated in a particular currency. There is additional risk that such transactions reduce or preclude the opportunity for gain and that currency contracts create exposure to currencies in which the Portfolio's securities are not denominated. The use of foreign currency forward exchange contracts involves the risk of loss from the insolvency or bankruptcy of the counterparty to the contract or the failure of the counterparty to make payments or otherwise comply with the terms of the contract.
• Liquidity Risk. The Portfolio's investments in restricted and illiquid securities may entail greater risk than investments in publicly traded securities. These securities may be more difficult to sell, particularly in
times of market turmoil. Illiquid securities may be more difficult to value. If the Portfolio is forced to sell an illiquid security to fund redemptions or for other cash needs, it may be forced to sell the security at a loss.
• Derivatives. A derivative instrument often has risks similar to its underlying asset and may have additional risks, including imperfect correlation between the value of the derivative and the underlying asset, risks of default by the counterparty to certain transactions, magnification of losses incurred due to changes in the market value of the securities, instruments, indices or interest rates to which they relate, and risks that the transactions may not be liquid. Certain derivative transactions may give rise to a form of leverage. Leverage magnifies the potential for gain and the risk of loss.
Performance Information
The bar chart and table below provide some indication of the risks of investing in the Portfolio by showing changes in the performance of the Portfolio's Class I shares year-by-year and by showing how the Portfolio's Class I shares'* average annual returns for the past one, five and ten year periods compare with those of a broad measure of market performance over time. This performance information does not include the impact of any charges deducted by your insurance company. If it did, returns would be lower. How the Portfolio has performed in the past does not necessarily indicate how the Portfolio will perform in the future.
Annual Total Returns—Calendar Years (Class I)*
Commenced operations on January 2, 1997

High
Quarter | | 04/09 - 06/09 | | | 26.02 | % | |
Low Quarter | | 07/08 - 09/08 | | | – 21.64 | % | |
* Performance shown for the Portfolio's Class II shares reflects the performance of the Class I shares of the Portfolio. The returns for Class II shares would be lower than the returns for Class I shares of the Portfolio as expenses of Class II are higher.
UIF Global Tactical Asset Allocation Portfolio 3
Global Tactical Asset Allocation Portfolio (Cont'd)
Average Annual Total Returns (Class I)#
(for the calendar periods ended December 31, 2011)
| | | Global Tactical
Asset Allocation
Portfolio | | MSCI All
Country
World Index† | |
Past One Year | | | –3.68 | % | | | –7.35 | % | |
Past Five Years | | | –3.06 | % | | | –1.93 | % | |
Past Ten Years | | | 4.00 | % | | | 4.24 | % | |
# Class I shares are not offered in this Prospectus. Return information for the Portfolio's Class II shares will be shown in future prospectuses offering the Portfolio's Class II shares after the Portfolio's Class II shares have a full calendar year of return information to report. The returns for Class II shares would be lower than the returns for Class I shares of the Portfolio as expenses of Class II are higher.
† The Morgan Stanley Capital International (MSCI) All Country World Index (ACWI) is a free float-adjusted market capitalization weighted index designed to measure the equity market performance of developed and emerging markets. The term "free float" represents the portion of shares outstanding that are deemed to be available for purchase in the public equity markets by investors. The performance of the index is listed in U.S. dollars and assumes reinvestment of net dividends. It is not possible to invest directly in an index.
Adviser
Adviser. Morgan Stanley Investment Management Inc.
Portfolio Managers. The Portfolio is managed by members of the Global Asset Allocation team. Information about the members jointly and primarily responsible for the day-to-day management of the Portfolio are shown below:
Name | | Title with Adviser | | Date Began
Managing the
Portfolio | |
Mark A. Bavoso | | Managing Director | | September 2010 | |
Cyril Moullé-Berteaux | | Managing Director | | August 2011 | |
Purchase and Sale of Portfolio Shares
This Prospectus offers Class II shares of the Global Tactical Asset Allocation Portfolio. The Fund also offers Class I shares of the Portfolio through a separate prospectus. Class I shares are subject to lower expenses, but may not be available through your insurance company, qualified pension plan or retirement plan. For eligibility information, contact your insurance company or qualified pension or retirement plan.
Fund shares will be sold at the net asset value ("NAV") next determined after we receive the redemption request on your behalf.
The Portfolio offers its shares only to insurance companies for separate accounts that they establish to fund variable life insurance and variable annuity contracts, and to other entities under qualified pension and retirement plans. An insurance company purchases or redeems shares of the Portfolio based on, among other things, the amount of net contract premiums or purchase payments allocated to a separate account investment division, transfers to or from a separate account investment division, contract loans and repayments, contract withdrawals and surrenders, and benefit payments. The contract prospectus describes how contract owners may allocate, transfer and withdraw amounts to, and from, separate accounts.
For more information, please refer to the "Shareholder Information—Purchasing and Selling Portfolio Shares" section of this Prospectus.
Tax Information
Special tax rules apply to life insurance companies, variable annuity contracts and variable life insurance contracts. For information on federal income taxation of a life insurance company with respect to its receipt of distributions from the Portfolio and federal income taxation of owners of variable annuity or variable life insurance contracts, refer to the contract prospectus.
For more information, please refer to the "Shareholder Information—Taxes" section of this Prospectus.
Payments to Insurance Companies, Broker-Dealers and Other Financial Intermediaries
The Adviser and/or the Portfolio's Distributor may pay insurance companies or their affiliates, broker-dealers and/or other financial intermediaries for the sale of Portfolio shares and related services. These payments, which may be significant in amount, may create a conflict of interest by influencing the intermediary and your salesperson to recommend the Portfolio over another investment or be a factor in an insurance company's decision to include the Portfolio as an underlying investment option in its variable insurance products. Ask your salesperson or visit your insurance company's or other intermediary's web site for more information.
4 UIF Global Tactical Asset Allocation Portfolio
Class II Prospectus
Details of the Portfolio
Details of the Portfolio
Global Tactical Asset Allocation Portfolio
Objective
The Portfolio seeks total return.
The Portfolio's investment objective may be changed by the Fund's Board of Directors without shareholder approval, but no change is anticipated. If the Portfolio's investment objective changes, the Portfolio will notify shareholders and shareholders should consider whether the Portfolio remains an appropriate investment in light of the change.
Approach
The Portfolio seeks to achieve total return by investing in a blend of equity and fixed income securities of U.S. and non-U.S. issuers. In seeking to achieve this investment objective, the Portfolio will implement a global tactical approach to achieving total return, and to control risk and volatility.
Process
The Adviser will utilize a top-down investment approach that focuses on asset class, sector, region, country, and currency and thematic allocations. The Portfolio's allocations will be based upon the Adviser's evaluations and analyses, taking into account results of its fundamental market research and recommendations generated by the Adviser's quantitative models. The Adviser's research process focuses on three large macro factors across almost all asset classes: 1) valuation (both relative and absolute), 2) dynamics, including earnings revisions, interest rate policy and inflation expectations, and 3) technicals, such as liquidity and sentiment. The Portfolio may invest in any country, including developing or emerging market countries. The Portfolio's investments may be U.S. and non-U.S. dollar denominated. In determining whether to sell a security, the Adviser considers a number of factors, including changes in capital appreciation potential, or the overall assessment of asset class, sector, region, country, and currency and thematic allocation shifts. Thematic allocation shifts refers to allocating the Portfolio's assets between different thematic baskets of securities. A thematic basket of securities encompasses a specific investment idea that the Adviser believes will play out within the current global macro environment. Screening processes based on factors adhering to the investment themes are utilized to select securities for inclusion in each thematic basket.
The Portfolio may invest in REITs and mortgage-related or mortgage-backed securities. The Portfolio's equity investments may include convertible securities.
The Portfolio may invest a portion of its assets in below investment grade fixed income securities (commonly known as "junk bonds") and repurchase agreements. The Portfolio may also invest up to 10% of its total assets in other investment companies, including ETFs.
The Portfolio may purchase certain non-publicly traded "restricted" securities. These securities may include "Rule 144A" securities which are exempt from registration and that may only be resold to qualified institutional buyers and other restricted securities. The Portfolio may invest up to 15% of its assets in illiquid securities.
The Portfolio may, but it is not required to, use derivative instruments for a variety of purposes, including hedging, risk management, portfolio management or to earn income. Derivatives are financial instruments whose value is based on the value of another underlying asset, interest rate, index or financial instrument. The Portfolio's use of derivatives may involve the purchase and sale of derivative instruments such as options, futures, swaps, structured investments and other related instruments and techniques. The Portfolio may also utilize foreign currency forward exchange contracts, which are also derivatives, in connection with its investments in foreign securities. Derivative instruments used by the Portfolio will be counted toward the Portfolio's exposure in the types of securities listed above to the extent they have economic characteristics similar to such securities.
Risks
There is no assurance that the Portfolio will achieve its investment objective. Investing in the Portfolio may be appropriate for you if you are willing to accept the risks and uncertainties of investing in a portfolio of equity and fixed income securities of U.S. and non-U.S. issuers. In general, prices of equity securities are more volatile than those of fixed income securities. The prices of equity securities will rise and fall in response to a number of different factors. In particular, prices of equity securities will respond to events that affect entire financial markets or industries (changes in inflation or consumer demand, for example) and to events that affect particular issuers (news about the success or failure
UIF Global Tactical Asset Allocation Portfolio 5
Global Tactical Asset Allocation Portfolio (Cont'd)
of a new product, for example). To the extent that the Portfolio invests in convertible securities, and the convertible security's investment value is greater than its conversion value, its price will be likely to increase when interest rates fall and decrease when interest rates rise. If the conversion value exceeds the investment value, the price of the convertible security will tend to fluctuate directly with the price of the underlying equity security.
Market prices of the Portfolio's fixed income securities respond to economic developments, especially changes in interest rates, changes in the general level of spreads between U.S. Treasury and non-Treasury securities, as well as to perceptions of the creditworthiness of individual issuers. Generally, fixed income securities decrease in value as interest rates rise and vice versa. Prices of fixed income securities also generally will fall if an issuer's credit rating declines, and rise if it improves. Prices of longer term fixed income securities also are generally more volatile, so the average maturity of the securities in the Portfolio affects risk. Securities with greater spread durations are likely to be more sensitive to changes in spreads between U.S. Treasury and non-Treasury securities, generally making them more volatile than securities with lesser spread durations. Spread duration measures the change in the value of the security (or portfolio) for a given change in the interest rate spread (difference) between U.S. Treasury and non-Treasury securities.
The Portfolio may invest in fixed income securities that are rated below investment grade or are not rated, but are of equivalent quality. These fixed income securities are often referred to as high yield securities or "junk bonds." High yield securities range from those for which the prospect for repayment of principal and interest is predominantly speculative to those which are currently in default on principal or interest payments. When the Portfolio invests in high yield securities, it generally seeks to receive a correspondingly higher return on the securities it holds to compensate it for the additional credit risk and market risk it has assumed. High yield securities may be issued by companies that are restructuring, are smaller and less creditworthy or are more highly indebted than other companies. This means that they may have more difficulty making scheduled payments of principal and interest. Prices of high yield securities will rise and fall primarily in response to actual or perceived changes in the issuer's financial health, although changes in market interest rates also will affect prices. High yield securities
may experience reduced liquidity, and sudden and substantial decreases in price.
The prices of mortgage securities may be particularly sensitive to changes in interest rates because of the risk that borrowers will become more or less likely to refinance their mortgages. For example, an increase in interest rates generally will reduce prepayments, effectively lengthening the maturity of some mortgage securities, and making them subject to more drastic price movements. Because of prepayment issues, it is not possible to predict the ultimate maturity of mortgage securities. Rates of prepayment faster or slower than anticipated by the Adviser could result in reduced yields, increased volatility and/or reductions in NAV.
REITs pool investors' funds for investments primarily in real estate properties or real estate related loans. Like mutual funds, REITs have expenses, including advisory and administration fees, that are paid by their shareholders. Operating REITs requires specialized management skills and the Portfolio indirectly bears management expenses along with the indirect expenses of the Portfolio. The performance of any Portfolio REIT holdings ultimately depends on the types of real property in which the REITs invest and how well the property is managed. A general downturn in real estate values also can hurt REIT performance. In addition, REITs are subject to certain provisions under federal tax law. The failure of a company to qualify as a REIT could have adverse consequences for the Portfolio, including significantly reducing the return to the Portfolio on its investment in such company.
Investing in foreign countries, particularly emerging market or developing countries, entails the risk that news and events unique to a country or region will affect those markets and their issuers. These same events will not necessarily have an effect on the U.S. economy or similar issuers located in the United States. In addition, investments in certain foreign markets, which have historically been considered stable, may become more volatile and subject to increased risk due to ongoing developments and changing conditions in such markets. Moreover, the growing interconnectivity of global economies and financial markets has increased probability that adverse developments and conditions in one country or region will affect the stability of economies and financial markets in other countries or regions. Furthermore, the Portfolio's investments in foreign countries generally will be denominated in foreign currencies. As a result, changes in the value of a
6 UIF Global Tactical Asset Allocation Portfolio
Class II Prospectus
Details of the Portfolio
Global Tactical Asset Allocation Portfolio (Cont'd)
country's currency compared to the U.S. dollar may affect the value of the Portfolio's investments. These changes may occur separately from and in response to events that do not otherwise affect the value of the security in the issuer's home country. Hedging the Portfolio's currency risks through foreign currency forward exchange contracts involves the risk of mismatching the Portfolio's objectives under a foreign currency forward exchange contract with the value of securities denominated in a particular currency. There is additional risk that such transactions reduce or preclude the opportunity for gain and that currency contracts create exposure to currencies in which the Portfolio's securities are not denominated.
The Portfolio's investments in restricted and illiquid securities may entail greater risk than investments in publicly traded securities. These securities may be more difficult to sell, particularly in times of market turmoil. Illiquid securities may be more difficult to value. If the
Portfolio is forced to sell an illiquid security to fund redemptions or for other cash needs, it may be forced to sell the security at a loss.
A derivative instrument often has risks similar to its underlying asset and may have additional risks, including imperfect correlation between the value of the derivative and the underlying asset, risks of default by the counterparty to certain transactions, magnification of losses incurred due to changes in the market value of the securities, instruments, indices or interest rates to which they relate, and risks that the transactions may not be liquid. Certain derivative transactions may give rise to a form of leverage. Leverage magnifies the potential for gain and the risk of loss.
Please see "Additional Risk Factors and Information" for further information about these and other risks of investing in the Portfolio.
UIF Global Tactical Asset Allocation Portfolio 7
Additional Risk Factors and Information
This section discusses additional risk factors and information relating to the Portfolio. The Portfolio's investment practices and limitations are described in more detail in the Statement of Additional Information ("SAI"), which is incorporated by reference and legally is a part of this Prospectus. For details on how to obtain a copy of the SAI and other reports and information, see the back cover of this Prospectus.
Price Volatility
The value of your investment in the Portfolio is based on the market prices of the securities the Portfolio holds. These prices change daily due to economic and other events that affect markets generally, as well as those that affect particular regions, countries, industries, companies or governments. These price movements, sometimes called volatility, may be greater or less depending on the types of securities the Portfolio owns and the markets in which the securities trade. Over time, equity securities have generally shown gains superior to fixed income securities, although they have tended to be more volatile in the short term. As a result of price volatility, there is a risk that you may lose money by investing in the Portfolio.
Equity Securities
Equity securities include common stock, preferred stock, convertible securities, depositary receipts, rights, warrants and limited partnership interests. The Portfolios may invest in equity securities that are publicly traded on securities exchanges or over the counter or in equity securities that are not publicly traded. Securities that are not publicly traded may be more difficult to sell and their value may fluctuate more dramatically than other securities. The prices of convertible securities are affected by changes similar to those of equity and fixed income securities. The value of a convertible security tends to decline as interest rates rise and, because of the conversion feature, tends to vary with fluctuations in the market value of the underlying equity security.
Fixed Income Securities
Fixed income securities generally are subject to risks related to changes in interest rates and in the financial health or credit rating of the issuers. The value of a fixed income security typically moves in the opposite direction of prevailing interest rates: if rates rise, the value of a fixed income security falls; if rates fall, the value increases. The maturity and duration of a fixed income instrument also affect the extent to which the price of the security will change in response to these and other factors. Longer term securities tend to experience larger changes than shorter term securities because they are more sensitive to changes in interest rates or in the credit ratings of the issuers. The average duration of a fixed income portfolio measures its exposure to the risk of changing interest rates. The Portfolio with a lower average duration generally will experience less price volatility in response to changes in interest rates as compared with a portfolio with a higher
duration. Certain types of fixed income securities, such as inverse floaters, are designed to respond differently to changes in interest rates.
Mortgage Securities
Mortgage securities are fixed income securities representing an interest in a pool of underlying mortgage loans. They are sensitive to changes in interest rates, but may respond to these changes differently from other fixed income securities due to the possibility of prepayment of the underlying mortgage loans. As a result, it may not be possible to determine in advance the actual maturity date or average life of a mortgage security. Rising interest rates tend to discourage refinancings, with the result that the average life and volatility of the security will increase and its market price will decrease. When interest rates fall, however, mortgage securities may not gain as much in market value because additional mortgage prepayments must be reinvested at lower interest rates. Prepayment risk may make it difficult to calculate the average maturity of a portfolio of mortgage securities and, therefore, to assess the volatility risk of that portfolio.
The Portfolio may invest in mortgage securities that are issued or guaranteed by the U.S. Government or its agencies or instrumentalities. These securities are either direct obligations of the U.S. Government or the issuing agency or instrumentality has the right to borrow from the U.S. Treasury to meet its obligations although the U.S. Treasury is not legally required to extend credit to the agency or instrumentality. Certain of these mortgage securities purchased by the Portfolio, such as those issued by the Government National Mortgage Association and the Federal Housing Administration, are backed by the full faith and credit of the United States. Other of these mortgage securities purchased by the Portfolio, such as those issued by the Federal National Mortgage Association ("Fannie Mae") and Federal Home Loan Mortgage Corporation ("Freddie Mac"), are not backed by the full faith and credit of the United States and there is a risk that the U.S. Government will not provide financial support to these agencies if it is not obligated to do so by law. In September 2008, the U.S. Treasury Department announced that the government would be taking over Fannie Mae and Freddie Mac and placing the companies into a conservatorship. In addition, the U.S. Treasury announced additional steps that it intended to take with respect to the debt and mortgage-based securities issued by Fannie Mae and Freddie Mac in order to support the conservatorship. No assurance can be given that these initiatives will be successful. The
8 UIF Global Tactical Asset Allocation Portfolio
Class II Prospectus
Risk Factors and Information
Additional Risk Factors and Information (Cont'd)
maximum potential liability of the issuers of some of the mortgage securities held by the Portfolio may greatly exceed their current resources, including their legal right to support from the U.S. Treasury. It is possible that these issuers will not have the funds to meet their payment obligations in the future.
To the extent the Portfolio invests in mortgage securities offered by non-governmental issuers, such as commercial banks, savings and loan institutions, private mortgage insurance companies, mortgage bankers and other secondary market issuers, the Portfolio may be subject to additional risks. Timely payment of interest and principal of non-governmental issuers are supported by various forms of private insurance or guarantees, including individual loan, title, pool and hazard insurance purchased by the issuer. There can be no assurance that the private insurers can meet their obligations under the policies. An unexpectedly high rate of defaults on the mortgages held by a mortgage pool may adversely affect the value of a mortgage backed security and could result in losses to the Portfolio. The risk of such defaults is generally higher in the case of mortgage pools that include subprime mortgages. Subprime mortgages refer to loans made to borrowers with weakened credit histories or with a lower capacity to make timely payments on their mortgages.
Foreign Securities
Foreign issuers generally are subject to different accounting, auditing and financial reporting standards than U.S. issuers. There may be less information available to the public about foreign issuers. Securities of foreign issuers can be less liquid and experience greater price movements. In addition, the prices of such securities may be susceptible to influence by large traders, due to the limited size of many foreign securities markets. Moreover, investments in certain foreign markets, which have historically been considered stable, may become more volatile and subject to increased risk due to ongoing developments and changing conditions in such markets. Also, the growing interconnectivity of global economies and financial markets has increased the probability that adverse developments and conditions in one country or region will affect the stability of economies and financial markets in other countries or regions. In some foreign countries, there is also the risk of government expropriation, excessive taxation, political or social instability, the imposition of currency controls, or diplomatic developments that could affect the Portfolio's investment. There also can be difficulty obtaining and enforcing judgments against issuers in
foreign countries. Foreign stock exchanges, broker-dealers, and listed issuers may be subject to less government regulation and oversight. The cost of investing in foreign securities, including brokerage commissions and custodial expenses, can be higher than in the United States.
In connection with its investments in foreign securities, the Portfolio also may enter into contracts with banks, brokers or dealers to purchase or sell securities or foreign currencies at a future date. A foreign currency forward exchange contract is a negotiated agreement between two parties to exchange specified amounts of two or more currencies at a specified future time at a specified rate. The rate specified by the foreign currency forward exchange contract can be higher or lower than the spot rate between the currencies that are the subject of the contract. Foreign currency forward exchange contracts may be used to protect against uncertainty in the level of future foreign currency exchange rates or to gain or modify exposure to a particular currency. In addition, the Portfolio may use cross currency hedging or proxy hedging with respect to currencies in which the Portfolio has or expects to have portfolio or currency exposure. Cross currency hedges involve the sale of one currency against the positive exposure to a different currency and may be used for hedging purposes or to establish an active exposure to the exchange rate between any two currencies. Hedging the Portfolio's currency risks involves the risk of mismatching the Portfolio's objectives under a forward or futures contract with the value of securities denominated in a particular currency. Furthermore, such transactions reduce or preclude the opportunity for gain if the value of the currency should move in the direction opposite to the position taken. There is an additional risk to the effect that currency contracts create exposure to currencies in which the Portfolio's securities are not denominated. Unanticipated changes in currency prices may result in poorer overall performance for the Portfolio than if it had not entered into such contracts. The use of foreign currency forward exchange contracts involves the risk of loss from the insolvency or bankruptcy of the counterparty to the contract or the failure of the counterparty to make payments or otherwise comply with the terms of the contract.
Emerging Market Risks
Emerging market or developing countries are countries that major international financial institutions, such as the World Bank, generally consider to be less economically mature than developed nations, such as the
UIF Global Tactical Asset Allocation Portfolio 9
Additional Risk Factors and Information (Cont'd)
United States or most nations in Western Europe. Emerging market or developing countries can include every nation in the world except the United States, Canada, Japan, Australia, New Zealand and most nations located in Western Europe. Emerging market or developing countries may be more likely to experience political turmoil or rapid changes in economic conditions than more developed countries, and the financial condition of issuers in emerging market or developing countries may be more precarious than in other countries. In addition, emerging market securities generally are less liquid and subject to wider price and currency fluctuations than securities issued in more developed countries. These characteristics result in greater risk of price volatility in emerging market or developing countries, which may be heightened by currency fluctuations relative to the U.S. dollar.
Foreign Currency
The Portfolio's investments generally will be denominated in foreign currencies. The value of foreign currencies fluctuates relative to the value of the U.S. dollar. Since the Portfolio may invest in such non-U.S. dollar-denominated securities, and therefore may convert the value of such securities into U.S. dollars, changes in currency exchange rates can increase or decrease the U.S. dollar value of the Portfolio's assets. The Investment Teams may use derivatives to reduce this risk. The Investment Teams may in their discretion choose not to hedge against currency risk. In addition, certain market conditions may make it impossible or uneconomical to hedge against currency risk.
Asset-Backed Securities
Asset-backed securities apply the securitization techniques used to develop mortgage-backed securities to a broad range of other assets. Various types of assets, primarily automobile and credit card receivables and home equity loans, are pooled and securitized in pass-through structures similar to pass-through structures developed with respect to mortgage securitizations. Asset-backed securities have risk characteristics similar to mortgage-backed securities. Like mortgage-backed securities, they generally decrease in value as a result of interest rate increases, but may benefit less than other fixed-income securities from declining interest rates, principally because of prepayments. Also, as in the case of mortgage-backed securities, prepayments generally increase during a period of declining interest rates, although other factors, such as changes in credit use and payment patterns, may also influence prepayment rates. Asset-backed securities also involve the risk that
various federal and state consumer laws and other legal, regulatory and economic factors may result in the collateral backing the securities being insufficient to support payment on the securities.
Derivatives and Other Investments
The Portfolio may, but it is not required to, use derivative instruments for a variety of purposes, including hedging, risk management, portfolio management or to earn income. Derivatives are financial instruments whose value is based on the value of another underlying asset, interest rate, index or financial instrument.
A derivative instrument often has risks similar to its underlying asset and may have additional risks, including imperfect correlation between the value of the derivative and the underlying asset, risks of default by the counterparty to certain transactions, magnification of losses incurred due to changes in the market value of the securities, instruments, indices or interest rates to which they relate, and risks that the transactions may not be liquid. The use of derivatives involves risks that are different from, and possibly greater than, the risks associated with other portfolio investments. Derivatives may involve the use of highly specialized instruments that require investment techniques and risk analyses different from those associated with other portfolio investments.
Certain derivative transactions may give rise to a form of leverage. Leverage magnifies the potential for gain and the risk of loss. Leverage associated with derivative transactions may cause the Portfolio to liquidate portfolio positions when it may not be advantageous to do so to satisfy its obligations or to meet earmarking or segregation requirements, pursuant to applicable SEC rules and regulations, or may cause the Portfolio to be more volatile than if the Portfolio had not been leveraged. Although the Adviser seeks to use derivatives to further the Portfolio's investment objective, there is no assurance that the use of derivatives will achieve this result.
The derivative instruments and techniques that the Portfolio may principally use include the following:
Options. If the Portfolio buys an option, it buys a legal contract giving it the right to buy or sell a specific amount of the underlying instrument or futures contract on the underlying instrument at an agreed-upon price typically in exchange for a premium paid by the Portfolio. If the Portfolio sells an option, it
10 UIF Global Tactical Asset Allocation Portfolio
Class II Prospectus
Risk Factors and Information
Additional Risk Factors and Information (Cont'd)
sells to another person the right to buy from or sell to the Portfolio a specific amount of the underlying instrument or futures contract on the underlying instrument at an agreed-upon price typically in exchange for a premium received by the Portfolio. A decision as to whether, when and how to use options involves the exercise of skill and judgment and even a well-conceived option transaction may be unsuccessful because of market behavior or unexpected events. The prices of options can be highly volatile and the use of options can lower total returns.
Futures. A futures contract is a standardized, exchange-traded agreement to buy or sell a specific quantity of an underlying instrument at a specific price at a specific future time. The value of a futures contract tends to increase and decrease in tandem with the value of the underlying instrument. Depending on the terms of the particular contract, futures contracts are settled through either physical delivery of the underlying instrument on the settlement date or by payment of a cash settlement amount on the settlement date. A decision as to whether, when and how to use futures involves the exercise of skill and judgment and even a well conceived futures transaction may be unsuccessful because of market behavior or unexpected events. In addition to the derivatives risks discussed above, the prices of futures can be highly volatile, using futures can lower total return, and the potential loss from futures can exceed the Portfolio's initial investment in such contracts.
Swaps. An over-the-counter ("OTC") swap contract is an agreement between two parties pursuant to which the parties exchange payments at specified dates on the basis of a specified notional amount, with the payments calculated by reference to specified securities, indexes, reference rates, currencies or other instruments. A small percentage of swap contracts are cleared through a central clearinghouse. Most swap agreements provide that when the period payment dates for both parties are the same, the payments are made on a net basis (i.e., the two payment streams are netted out, with only the net amount paid by one party to the other). The Portfolio's obligations or rights under a swap contract entered into on a net basis will generally be equal only to the net amount to be paid or received under the agreement, based on the relative values of the positions held by each counterparty. Most swap agreements are not entered into or traded on exchanges and often there is no central clearing or guaranty function for swaps. These OTC swaps are often subject to credit risk or the risk of default or non-performance by the counterparty.
Swaps could result in losses if interest rates or foreign currency exchange rates or credit quality changes are not correctly anticipated by the Portfolio or if the reference index, security or investments do not perform as expected. The Portfolio's use of swaps may include those based on the credit of an underlying security, commonly referred to as "credit default swaps." Where the Portfolio is the buyer of a credit default swap contract, it would be entitled to receive the par (or other agreed-upon) value of a referenced debt obligation from the counterparty to the contract only in the event of a default or similar event by a third party on the debt obligation. If no default occurs, the Portfolio would have paid to the counterparty a periodic stream of payments over the term of the contract and received no benefit from the contract. When the Portfolio is the seller of a credit default swap contract, it receives the stream of payments but is obligated to pay an amount equal to the par (or other agreed upon) value of a referenced debt obligation upon the default or similar event of that referenced debt obligation.
Structured Investments. The Portfolio also may invest a portion of its assets in structured investments. A structured investment is a derivative security designed to offer a return linked to a particular underlying security, currency, commodity or market. Structured investments may come in various forms including notes, warrants and options to purchase securities. The Portfolio will typically use structured investments to gain exposure to a permitted underlying security, currency, commodity or market when direct access to a market is limited or inefficient from a tax or cost standpoint. Investments in structured investments involve risks including issuer risk, counterparty risk and market risk. Holders of structured investments bear risks of the underlying investment and are subject to issuer or counterparty risk because the Portfolio is relying on the creditworthiness of such issuer or counterparty and has no rights with respect to the issuer of the underlying investment. Certain structured investments may be thinly traded or have a limited trading market and may have the effect of increasing the Portfolio's illiquidity to the extent that the Portfolio, at a particular point in time, may be unable to find qualified buyers for these securities.
Investment Companies and ETFs
An investment in an investment company, including ETFs, is subject to the underlying risks of that entity's portfolio securities. For example, if an investment company held common stocks, the Portfolio would also be
UIF Global Tactical Asset Allocation Portfolio 11
Additional Risk Factors and Information (Cont'd)
exposed to the risk of investing in common stocks. In addition to the Portfolio's fees and expenses, the Portfolio would bear its share of the investment company's or ETF's fees and expenses. Certain ETFs utilize leverage, which may magnify the gains or losses realized from their underlying investments.
Repurchase Agreements
Repurchase agreements are subject to risks associated with the possibility of default by the seller at a time when the collateral has declined in value, or insolvency of the seller, which may affect the Portfolio's right to control the collateral.
Investment Discretion
In pursuing the Portfolio's investment objective, the Adviser has considerable leeway in deciding which investments it buys, holds or sells on a day-to-day basis, and which trading strategies it uses. For example, the Adviser, in its discretion, may determine to use some permitted trading strategies while not using others. The success or failure of such decisions will affect the Portfolio's performance.
Temporary Defensive Investments
When the Investment Teams believe that changes in economic, financial or political conditions warrant, the Portfolio may invest without limit in certain short- and medium-term fixed income securities that may be inconsistent with its principal investment strategies for temporary defensive purposes. If the Investment Teams incorrectly predict the effects of these changes, such defensive investments may adversely affect the Portfolio's performance and the Portfolio may not achieve its investment objective.
Portfolio Turnover
Consistent with its investment policies, the Portfolio will purchase and sell securities without regard to the effect on portfolio turnover. Higher portfolio turnover (e.g., over 100% per year) will cause the Portfolio to incur additional transaction costs. The Portfolio may engage in frequent trading of securities to achieve its investment objective.
12 UIF Global Tactical Asset Allocation Portfolio
Class II Prospectus
Fund Management
Adviser
The Adviser is Morgan Stanley Investment Management Inc. The Adviser, with principal offices at 522 Fifth Avenue, New York, NY 10036, conducts a worldwide portfolio management business and provides a broad range of portfolio management services to customers in the United States and abroad. Morgan Stanley is the direct parent of the Adviser and the indirect parent of the Distributor. Morgan Stanley is a preeminent global financial services firm engaged in securities trading and brokerage activities, as well as providing investment banking, research and analysis, financing and financial advisory services. As of December 31, 2011, the Adviser, together with its affiliated asset management companies, had approximately $287.4 billion in assets under management or supervision.
Advisory Fee
For the fiscal year ended December 31, 2011, the Adviser received a fee for advisory services (net of fee waivers and/or expense reimbursements) equal to 0.00% of the Portfolio's average daily net assets.
The Adviser has agreed to reduce its advisory fee and/or reimburse the Portfolio, if necessary, if such fees would cause the total annual operating expenses of the Portfolio to exceed 1.10% of average daily net assets. In determining the actual amount of fee waiver and/or expense reimbursement for the Portfolio, if any, the Adviser excludes from annual operating expenses certain investment related expenses (such as foreign country tax expense and interest expense on amounts borrowed) (but including any 12b-1 fee paid to the Distributor). The fee waivers and/or expense reimbursements for the Portfolio will continue for at least one year or until such time as the Fund's Board of Directors acts to discontinue all or a portion of such waivers and/or reimbursements when it deems such action is appropriate.
A discussion regarding the Board of Directors' approval of the investment advisory agreement is available in the Fund's semi-annual report to shareholders for the period ended June 30, 2011.
Portfolio Management
The Portfolio is managed by members of the Global Asset Allocation team. The team consists of portfolio managers and analysts. Current members of the team jointly and primarily responsible for the day-to-day management of the Portfolio are Mark A. Bavoso and Cyril Moullé-Berteaux.
Mr. Bavoso has been associated with the Adviser in an investment management capacity since 1986. Mr. Moullé-Berteaux has been associated with the Adviser in an investment management capacity since August 2011. Mr. Moullé-Berteaux was a founding partner and portfolio manager of Traxis Partners LP from March 2003 to July 2011.
Team members collaborate to manage the assets of the Portfolio.
The Fund's SAI provides additional information about the portfolio managers' compensation structure, other accounts managed by the portfolio managers and the portfolio managers' ownership of securities in the Portfolio.
The composition of the team may change from time to time.
Distribution Plan
The Fund has adopted a Plan of Distribution for the Portfolio's Class II shares pursuant to Rule 12b-1 under the Investment Company Act of 1940, as amended (the "Plan"). Under the Plan, the Portfolio is authorized to pay the Distributor a monthly 12b-1 fee at an annual rate of 0.35% of the Portfolio's average daily net assets attributable to Class II shares. Such amount shall be paid to compensate the Distributor for remittance to insurance companies, qualified pension plans or retirement plans which offer the Portfolio as an investment option. These payments are intended to compensate insurance companies for distribution and/or administrative related expenses incurred or paid in connection with the distribution of Class II shares of the Portfolio. The Distributor has agreed to waive 0.25% of the 0.35% 12b-1 fee that it may receive. This waiver will continue for at least one year or until such time as the Fund's Board of Directors acts to discontinue all or a portion of such waiver when it deems such action is appropriate.
Since the 12b-1 fees associated with the Plan are paid out of the Portfolio's assets on an on-going basis, over time these fees will increase the cost of your investment and may cost you more than paying other types of sales charges.
The Adviser and/or the Distributor may pay additional compensation (out of their own funds and not as an expense of the Portfolio) to certain affiliated or unaffiliated brokers, dealers and/or certain insurance companies or other financial intermediaries or service
UIF Global Tactical Asset Allocation Portfolio 13
providers in connection with the sale, distribution, marketing and/or retention of shares of the Portfolio and/or shareholder servicing. Such compensation may be significant in amount and the prospect of receiving any such additional compensation may provide such
affiliated or unaffiliated entities with an incentive to favor sales of the Portfolio's shares over other investment options. Any such payments will not change the NAV or the price of the Portfolio's shares. For more information, please see the Fund's SAI.
14 UIF Global Tactical Asset Allocation Portfolio
Class II Prospectus
Shareholder Information
Share Class
This Prospectus offers Class II shares of the Global Tactical Asset Allocation Portfolio. The Fund also offers Class I shares of the Portfolio through a separate prospectus. Class I shares are subject to lower expenses, but may not be available through your insurance company, qualified pension plan or retirement plan. For eligibility information, contact your insurance company or qualified pension or retirement plan.
Purchasing and Selling Portfolio Shares
Shares are offered on each day that the New York Stock Exchange (the "NYSE") is open for business.
The Portfolio offers its shares only to insurance companies for separate accounts that they establish to fund variable life insurance and variable annuity contracts, and to other entities under qualified pension and retirement plans. An insurance company purchases or redeems shares of the Portfolio based on, among other things, the amount of net contract premiums or purchase payments allocated to a separate account investment division, transfers to or from a separate account investment division, contract loans and repayments, contract withdrawals and surrenders, and benefit payments. The contract prospectus describes how contract owners may allocate, transfer and withdraw amounts to, and from, separate accounts.
There are no known disadvantages to variable product contract owners or qualified plan participants arising out of the fact that the Portfolio offers its shares to separate accounts of various insurance companies that offer variable annuity and variable life insurance products and various other entities under qualified pension and retirement plans. Nevertheless, the Board of Directors that oversees the Portfolio intends to monitor events to identify any material irreconcilable conflicts that may possibly arise due to these arrangements and to determine what action, if any, should be taken in response.
Pricing of Portfolio Shares
The price per share will be the NAV per share next determined after the Fund or the insurance company receives your purchase or redemption order. The NAV for one share is the value of that share's portion of all of the net assets in the Portfolio. The Fund determines the NAV per share for the Portfolio as of the close of the NYSE (normally 4:00 p.m. Eastern Time) on each day that the NYSE is open for business.
About Net Asset Value
The NAV per share of the Portfolio is determined by dividing the total of the value of the Portfolio's invest-
ments and other assets, less any liabilities, by the total number of outstanding shares of the Portfolio. In making this calculation, the Portfolio generally values securities at market price. If market prices are unavailable or may be unreliable because of events occurring after the close of trading, the value for those securities will be determined in good faith at fair value using methods approved by the Board of Directors. In addition, with respect to securities that primarily are listed on foreign exchanges, when an event occurs after the close of such exchanges that is likely to have changed the value of the securities (e.g., a percentage change in value of one or more U.S. securities indices in excess of specified thresholds), such securities will be valued at their fair value, as determined under procedures established by the Fund's Board of Directors. Securities also may be fair valued in the event of a significant development affecting a country or region or an issuer-specific development which is likely to have changed the value of the security. In these cases, the Portfolio's NAV will reflect certain portfolio securities' fair value rather than their market price. To the extent the Portfolio invests in open-end management companies that are registered under the Investment Company Act of 1940, as amended, the Portfolio's NAV is calculated based upon the NAV of such funds. The prospectuses for such funds explain the circumstances under which they will use fair value pricing and its effects.
Fair value pricing involves subjective judgments and it is possible that the fair value determined for a security is materially different than the value that could be realized upon the sale of that security. The Portfolio may hold securities that are listed on foreign exchanges. These securities may trade on weekends or other days when the Portfolio does not calculate its NAV. As a result, the value of these investments may change on days when you cannot purchase or sell shares.
The NAV of Class II shares will differ from that of Class I shares because of class-specific expenses that each class may pay.
Dividends and Distributions
The Portfolio distributes its net investment income, if any, at least annually as dividends and makes distributions of its net realized capital gains, if any, at least annually.
Taxes
The Portfolio expects that it will not have to pay federal income taxes if it distributes annually all of its net investment income and net realized capital gains. The Portfolio does not expect to be subject to federal excise taxes with respect to undistributed income.
UIF Global Tactical Asset Allocation Portfolio 15
Shareholder Information (Cont'd)
Special tax rules apply to life insurance companies, variable annuity contracts and variable life insurance contracts. For information on federal income taxation of a life insurance company with respect to its receipt of distributions from the Portfolio and federal income taxation of owners of variable annuity or variable life insurance contracts, refer to the contract prospectus.
Because each investor's tax circumstances are unique and the tax laws may change, you should consult your tax advisor about the federal, state and local tax consequences applicable to your investment.
Frequent Purchases and Redemptions of Shares
Frequent purchases and redemptions of shares pursuant to the instructions of insurance company contract owners or qualified plan participants is referred to as "market-timing" or "short-term trading" and may present risks for other contract owners or participants with long-term interests in the Portfolio, which may include, among other things, dilution in the value of the Portfolio's shares indirectly held by contract owners or participants with long-term interests in the Portfolio, interference with the efficient management of the Portfolio, increased brokerage and administrative costs and forcing the Portfolio to hold excess levels of cash.
In addition, the Portfolio is subject to the risk that market-timers and/or short-term traders may take advantage of time zone differences between the foreign markets on which the Portfolio's securities trade and the time the Portfolio's NAV is calculated ("time-zone arbitrage"). For example, a market-timer may submit instructions for the purchase of shares of the Portfolio based on events occurring after foreign market closing prices are established, but before the Portfolio's NAV calculation that are likely to result in higher prices in foreign markets the following day. The market-timer would submit instructions to redeem the Portfolio's shares the next day, when the Portfolio's share price would reflect the increased prices in foreign markets for a quick profit at the expense of contract owners or participants with long-term interests in the Portfolio.
Investments in other types of securities also may be susceptible to short-term trading strategies. These investments include securities that are, among other things, thinly traded, traded infrequently or relatively illiquid, which have the risk that the current market price for the securities may not accurately reflect current market values. A contract owner may seek to engage in short-term trading to take advantage of these
pricing differences (referred to as "price-arbitrage"). The Portfolio's policies with respect to valuing portfolio securities are described above in "About Net Asset Value."
The Fund's Board of Directors has adopted policies and procedures to discourage frequent purchases and redemptions of Portfolio shares by Portfolio shareholders. Insurance companies or qualified plans generally do not provide specific contract owner or plan participant transaction instructions to the Portfolio on an ongoing basis. Therefore, to some extent, the Portfolio relies on the insurance companies and qualified plans to monitor frequent short-term trading by contract owners. However, the Portfolio has entered into agreements with insurance companies and qualified plans whereby the insurance companies and qualified plans are required to provide certain contract owner identification and transaction information upon the Portfolio's request. The Portfolio may use this information to help identify and prevent market-timing activity in the Portfolio. There can be no assurance that the Portfolio will be able to identify or prevent all market-timing activity.
If the Portfolio identifies suspected market-timing activity, the insurance company or qualified plan will be contacted and asked to take steps to prevent further market-timing activity (e.g., sending warning letters or blocking frequent trading by underlying contract owners or participants). Insurance companies may be prohibited by the terms of the underlying insurance contract from restricting short-term trading of mutual fund shares by contract owners, thereby limiting the ability of such insurance company to implement remedial steps to prevent market-timing activity in the Portfolio. If the insurance company or qualified plan is unwilling or unable to take remedial steps to discourage or prevent frequent trading, or does not take action promptly, certain contract owners or participants may be able to engage in frequent trading to the detriment of contract owners or participants with long-term interests in the Portfolio. If the insurance company or qualified plan refuses to take remedial action, or takes action that the Portfolio deems insufficient, a determination will be made whether it is appropriate to terminate the relationship with such insurance company or qualified plan.
Portfolio Holdings Information
A description of the Fund's policies and procedures with respect to the disclosure of the Portfolio's securities is available in the Fund's SAI.
16 UIF Global Tactical Asset Allocation Portfolio
Class II Prospectus
Financial Highlights
The financial highlights table is intended to help you understand the financial performance of the Portfolio's Class II shares since inception. Certain information reflects financial results for a single Portfolio share. The total returns in the table represent the rate that an investor would have earned (or lost) on an investment in the Portfolio (assuming reinvestment of all dividends and distributions). In addition, this performance information does not include the impact of any charges by your insurance company. If it did, returns would be lower. The ratio of expenses to average net assets listed in the table below are based on the average net assets of the Portfolio for each of the periods listed in the table. To the extent that the Portfolio's average
net assets decrease over the Portfolio's next fiscal year, such expense ratios can be expected to increase, potentially significantly, because certain fixed costs will be spread over a smaller amount of assets. The information has been audited by Ernst & Young LLP, an independent registered public accounting firm. Ernst & Young LLP's report, along with the Portfolio's financial statements, are incorporated by reference in the SAI and are included in the Fund's Annual Report to Shareholders. The Annual Report to Shareholders and the Portfolio's financial statements, as well as the SAI, are available at no cost from the Portfolio at the toll free number noted on the back cover to this Prospectus or from your insurance company.
Period from March 15, 2011^
Selected Per Share Data and Ratios | | to December 31, 2011 | |
Net Asset Value, Beginning of Period | | $ | 9.04 | | |
Income (Loss) from Investment Operations: | |
Net Investment Income† | | | 0.11 | | |
Net Realized and Unrealized Loss | | | (0.46 | ) | |
Total from Investment Operations | | | (0.35 | ) | |
Distributions from and/or in Excess of: | |
Net Investment Income | | | (0.12 | ) | |
Net Asset Value, End of Period | | $ | 8.57 | | |
Total Return++ | | | (4.00 | )%# | |
Ratios and Supplemental Data: | |
Net Assets, End of Period (Thousands) | | $ | 65 | | |
Ratio of Expenses to Average Net Assets(1) | | | 1.06 | %+*^^ | |
Ratio of Net Investment Income to Average Net Assets(1) | | | 1.32 | %+* | |
Ratio of Rebate from Morgan Stanley Affiliates to Average Net Assets | | | 0.06 | %* | |
Portfolio Turnover Rate | | | 109 | %# | |
(1) Supplemental Information on the Ratios to Average Net Assets: | |
Ratios Before Expense Limitation: | |
Expenses to Average Net Assets | | | 2.11 | %* | |
Net Investment Income to Average Net Assets | | | 0.27 | %* | |
^ Commencement of Operations.
† Per share amount is based on average shares outstanding.
++ Calculated based on the net asset value as of the last business day of the period. Performance does not reflect fees and expenses imposed by your insurance company's separate account. If performance information included the effect of these additional charges, the total return would be lower.
+ The Ratios of Expenses and Net Investment Income reflect the rebate of certain Portfolio expenses in connection with the investments in Morgan Stanley affiliates during the period. The effect of the rebate on the ratios is disclosed in the above table as "Ratio of Rebate from Morgan Stanley Affiliates to Average Net Assets."
# Not Annualized.
* Annualized.
^^ Effective July 1, 2011, the Adviser has agreed to limit the ratio of expenses to average net assets to the maximum ratio of 1.10% for Class II shares. Prior to July 1, 2011, the maximum ratio was 1.15% for Class II shares.
UIF Global Tactical Asset Allocation Portfolio 17
Where to Find Additional Information
Statement of Additional Information
In addition to this Prospectus, the Fund has a Statement of Additional Information, dated April 30, 2012, which contains additional, more detailed information about the Fund and the Portfolio. The Statement of Additional Information is incorporated by reference into this Prospectus and, therefore, legally forms a part of this Prospectus.
Shareholder Reports
The Fund publishes annual and semi-annual reports containing financial statements. These reports contain additional information about the Portfolio's investments. In the Fund's shareholder reports, you will find a discussion of the market conditions and the investment strategies that significantly affected the Portfolio's performance during that period.
For additional Fund information, including information regarding the investments comprising the Portfolio, and to make shareholder inquiries, please call 1-800-281-2715 or contact your insurance company.
You may obtain the Statement of Additional Information and shareholder reports without charge by contacting the Fund at the toll-free number above or your insurance company or on our web site at www.morganstanley.com/im.
Information about the Fund, including the Statement of Additional Information, and the annual and semi-annual reports, may be obtained from the SEC in any of the following ways: (1) in person: you may review and copy documents in the SEC's Public Reference Room in Washington, D.C. (for information on the operation of the Public Reference Room, call 1-202-551-8090); (2) on-line: you may retrieve information from the EDGAR Database on the SEC's web site at http://www.sec.gov; or (3) by mail: you may request documents, upon payment of a duplicating fee, by writing to the Securities and Exchange Commission, Public Reference Section, Washington, D.C. 20549-1520. You may also obtain this information, upon payment of a duplicating fee, by e-mailing the SEC at the following address: publicinfo@sec.gov. To aid you in obtaining this information, the Fund's Investment Company Act registration number is 811-7607.

The Universal Institutional Funds, Inc.
Annual Report – December 31, 2011
Global Tactical Asset Allocation Portfolio
The Portfolio is intended to be a funding vehicle for variable annuity contracts and variable life insurance policies offered by the separate accounts of certain life insurance companies.
The Universal Institutional Funds, Inc.
Annual Report – December 31, 2011
Table of Contents
| Expense Examples | | | 2 | | |
|
| Investment Overview | | | 3 | | |
|
| Portfolio of Investments | | | 6 | | |
|
| Statement of Assets and Liabilities | | | 24 | | |
|
| Statement of Operations | | | 25 | | |
|
| Statements of Changes in Net Assets | | | 26 | | |
|
| Financial Highlights | | | 27 | | |
|
| Notes to Financial Statements | | | 29 | | |
|
| Report of Independent Registered Public Accounting Firm | | | 37 | | |
|
| Federal Income Tax Information | | | 38 | | |
|
| Director and Officer Information | | | 39 | | |
|
1
The Universal Institutional Funds, Inc.
Annual Report – December 31, 2011
Expense Examples (unaudited)
Global Tactical Asset Allocation Portfolio
As a shareholder of the Portfolio, you incur two types of costs: (1) insurance company charges, and (2) ongoing costs, including management fees, distribution (12b-1) fees and other Portfolio expenses. These examples are intended to help you understand your ongoing costs (in dollars) of investing in the Portfolio and to compare these costs with the ongoing costs of investing in other mutual funds.
These examples are based on an investment of $1,000 invested at the beginning of the six-month period ended December 31, 2011 and held for the entire six-month period.
Actual Expenses
The table below provides information about actual account values and actual expenses. You may use the information in this table, together with the amount you invested, to estimate the expenses that you paid over the period. Simply divide your account value by $1,000 (for example, an $8,600 account value divided by $1,000 = 8.6), then multiply the result by the number in the table under the heading entitled "Actual Expenses Paid During Period" to estimate the expenses you paid on your account during this period.
Please note that "Actual Expenses Paid During Period" are grossed up to reflect Portfolio expenses prior to the effect of Expense Offset (See Note F in the Notes to Financial Statements). Therefore, the annualized net expense ratios may differ from the ratio of expenses to average net assets shown in the Financial Highlights.
Hypothetical Example for Comparison Purposes
The table below provides information about hypothetical account values and hypothetical expenses based on the Portfolio's actual expense ratio and an assumed rate of return of 5% per year before expenses, which is not the Portfolio's actual return. The hypothetical account values and expenses may not be used to estimate the actual ending account balance or expenses you paid for the period. You may use this information to compare the ongoing costs of investing in the Portfolio and other funds. To do so, compare this 5% hypothetical example with the 5% hypothetical examples that appear in the shareholder reports of the other funds.
Please note that the expenses shown in the table are meant to highlight your ongoing costs only and do not reflect any insurance company charges. Therefore, the table below is useful in comparing ongoing costs, but will not help you determine the relative total cost of owning different funds. In addition, if these insurance company charges were included, your costs would have been higher.
| | | Beginning
Account Value
7/1/11 | | Actual Ending
Account Value
12/31/11 | | Hypothetical
Ending
Account Value | | Actual
Expenses Paid
During Period* | | Hypothetical
Expenses Paid
During Period* | | Net Expense
Ratio During
Period** | |
| Global Tactical Asset Allocation Portfolio Class I | | $ | 1,000.00 | | | $ | 922.30 | | | $ | 1,020.47 | | | $ | 4.55 | | | $ | 4.79 | | | | 0.94 | % | |
| Global Tactical Asset Allocation Portfolio Class II | | | 1,000.00 | | | | 922.30 | | | | 1,019.96 | | | | 5.04 | | | | 5.30 | | | | 1.04 | | |
* Expenses are calculated using each Portfolio Class' annualized net expense ratio (as disclosed), multiplied by the average account value over the period, and multiplied by 184/365 (to reflect the most recent one-half year period).
** Annualized.
2
The Universal Institutional Funds, Inc.
Annual Report – December 31, 2011
Investment Overview (unaudited)
Global Tactical Asset Allocation Portfolio
The Global Tactical Asset Allocation Portfolio (the "Portfolio") seeks total return. The Portfolio seeks to achieve total return by investing in a blend of equity and fixed income securities of U.S. and non-U.S. issuers. In seeking to achieve this investment objective, the Portfolio will implement a global tactical approach to achieving total return, and to control risk and volatility.
Performance
For the fiscal year ended December 31, 2011, the Portfolio had a total return based on net asset value and reinvestment of distributions per share of –3.68%, net of fees, for Class I shares. The Portfolio's Class I shares outperformed against its benchmark, the MSCI All Country World Index (the "Index"), which returned –7.35%.
Factors Affecting Performance
• At the start of 2011, global equities traded well against a backdrop of lukewarm economic data, strong capital flows, geopolitical tension, and natural disasters. However, global risk sentiment quickly cratered following the earthquake and tsunami in Northern Japan. Global supply chain disruptions emanating from this disaster impacted economic data as well, with the U.S. in particular hitting a soft patch. The second quarter saw the end of the Federal Reserve's asset purchases (the second round of quantitative easing, dubbed QE2), debt ceiling negotiations, and a downgrade of the U.S. credit rating from AAA to AA+. Most importantly, however, markets entered a new phase of the eurozone debt crisis, with Italian bond yields coming under pressure. This perfect storm of bad news saw markets re-price global growth expectations in early August and risk assets plunge in accordance. However, we believe a combination of positive seasonal factors and resilient U.S. data has buffeted equity markets from further harm since August. In the fourth quarter, global equity markets recovered the bulk of heavy losses incurred during the previous quarter, even as news flow surrounding Europe took a more negative tone. This rebound in risk assets followed upside surprises in U.S. economic data, with U.S. growth likely exceeding 3.0% for the fourth quarter. All told, the S&P 500® Index ended the year effectively unchanged, highlighting incredible resilience in spite of global volatility levels not seen since 2008.
• Within U.S. equities, an allocation to high dividend-paying equities added to relative performance as investors found their yields attractive in an otherwise low-yielding environment. In addition, overweight exposure to U.S. equities and underweight exposure to emerging market equities bolstered returns.
• Within currencies, overweight exposure to China and Japan as well as underweight exposure to the eurozone added to performance as low beta (or less volatile) currencies such as those of China and Japan outperformed in an environment of increased global volatility.
• However, exposure to sovereign debt and overweight exposure to global corporate credit negatively affected relative returns.
• Within equities, an overweight allocation to German equities detracted from performance as the tensions in the eurozone hurt German growth. Within U.S. equities, an allocation to equities that benefit from increased merger and acquisition (M&A) activity detracted from performance as the uncertain macro outlook caused corporations to focus on protecting cash assets as opposed to using cash to acquire peers.
Management Strategies
• As of December 31, 2011, the Portfolio's allocation was approximately 62% global equities, 31% global fixed income, 5% commodities, and 2% cash.
• We remain fully cognizant of the challenges facing the G-3 economies and societies. Our base case, tenuous as it may be, is one of below-trend growth (e.g. under 2% in the U.S.) over the next five years, 2012 being no exception. Short-term deviations from this trend are possible, and we believe it is likely that the fourth quarter 2011 GDP growth rate will be positive, driven by the reverse effect of the oil shock and inventory adjustment. Over the coming months, we expect growth to normalize to a more subdued pace. Downward deviations from this anemic trend are also likely, and, given the fragility of the economic and social situations, they could end up catastrophic.
• We remain concerned that growth in emerging markets may disappoint expectations in the medium term. We expect a more subdued pace of investment and overall growth in China in the coming years given the stock of fixed assets that has been built up, more limited opportunity to grow exports, a slowing pace of urbanization, and rising dependency ratio. We doubt that the incoming leadership has the political will or political capital to enact bold reforms, which have been to a great degree the foundation of China's recent growth performance. The commodity boom driven to large degree by China's breakneck investment pace has masked, and
3
The Universal Institutional Funds, Inc.
Annual Report – December 31, 2011
Investment Overview (unaudited) (cont'd)
Global Tactical Asset Allocation Portfolio
indeed created, fundamental weaknesses in many economies globally. It has led to a real estate bubble in Australia, prevented Brazil from making necessary fiscal reforms, and entrenched an unsustainable authoritarian regime in Russia, to name just a few. As the commodity boom ebbs, we expect these problems will come into focus and be reflected across multiple asset classes.
• On the other hand, the commodity boom hurt users and importers, such as Turkey, Japan, and the U.S. consumer. If our expectation of stable or declining commodity prices proves correct, we would expect this reversal to become a major investment theme over the medium-term horizon.
• Could outsourcing be nearing an inflection point as well? Emerging market currencies appreciated by nearly 40% in real effective terms over the past 10 years, and wage pressures in many economies have become substantial. We expect that a manufacturing renaissance in the U.S. and Europe will emerge as a significant investment theme over the medium term, and are actively looking for opportunities to invest around it.
• In the short term, the cyclical picture does not call for great directional bets (i.e., overweighting equities relative to fixed income), in our opinion. Potentially positive drivers for equities, such as a better-than-expected growth picture in the U.S., have already been priced into the market, leaving limited upside from here. Lower commodity prices and the recent growth slowdown are enabling central banks globally to begin to reflate and several (Australia, Brazil, the eurozone, Indonesia, Thailand, Russia, Israel, and the U.K.) have cut rates or eased in other manners recently. This is likely to continue, though in many economies core inflation pressures will likely make policy easing gradual and modest. Although all this may continue to lift risky assets further in the short term, we expect any further upside to be modest given our structural concerns and a lack of sufficiently anomalous valuation and sentiment readings in most major asset classes. G-10 government bonds (excluding Italy) continued to be expensively priced but maintained their role as an anchor against the potential deflationary storm. At the moment, we believe the Portfolio has moderate directional risk (i.e. a small overweight to global equities) and we are concentrating on the thematic, country and sector bets, which remain largely unchanged since our last update.
Performance Compared to the Morgan Stanley Capital International (MSCI) All Country World Index(1)
| | | Period Ended December 31, 2011 | |
| | | Total Returns(2) | |
| | | | | Average Annual | |
| | | One
Year | | Five
Years | | Ten
Years | | Since
Inception(5) | |
| Portfolio – Class I(3) | | | –3.68 | % | | | –3.06 | % | | | 4.00 | % | | | 2.88 | % | |
| MSCI All Country World Index | | | –7.35 | | | | –1.93 | | | | 4.24 | | | | 4.29 | | |
| Portfolio – Class II(4) | | | — | | | | — | | | | — | | | | –4.00 | | |
| MSCI All Country World Index | | | — | | | | — | | | | — | | | | –6.48 | | |
Performance data quoted represents past performance, which is no guarantee of future results, and current performance may be lower or higher than the figures shown. Performance assumes that all dividends and distributions, if any, were reinvested. For the most recent month-end performance figures, please contact the issuing insurance company or speak with your financial advisor. Investment return and principal value will fluctuate so that Portfolio shares, when redeemed, may be worth more or less than their original cost. Total returns do not reflect the deduction of taxes that a shareholder would pay on Portfolio distributions or the redemption of Portfolio shares. Performance shown does not reflect fees and expenses imposed by your insurance company's separate account. If performance information included the effect of these additional charges, the total returns would be lower.
(1) The Morgan Stanley Capital International (MSCI) All Country World Index (ACWI) is a free float-adjusted market capitalization weighted index designed to measure the equity market performance of developed and emerging markets. The term "free float" represents the portion of shares outstanding that are deemed to be available for purchase in the public equity markets by investors. The Index is unmanaged and its returns do not include any sales charges or fees. Such costs would lower performance. It is not possible to invest directly in an index.
(2) Total returns for the Portfolio reflect fees waived and expenses reimbursed, if applicable, by the Adviser. Without such waivers and reimbursements, total returns would have been lower. The fee waivers and/or expense reimbursements will continue for one year or until such time as the Board of Directors acts to discontinue all or a portion of such waivers and/or expense reimbursements when it deems that such action is appropriate.
(3) Commenced operations on January 2, 1997.
(4) Commenced offering on March 15, 2011.
(5) For comparative purposes, average annual since inception returns listed for the Index refers to the inception date or initial offering of the respective share class of the Portfolio, not the inception of the Index. Periods less than one year are not annualized.
4
The Universal Institutional Funds, Inc.
Annual Report – December 31, 2011
Investment Overview (unaudited) (cont'd)
Global Tactical Asset Allocation Portfolio

In accordance with SEC regulations, Portfolio performance shown assumes that all recurring fees (including management fees) were deducted and all dividends and distributions were reinvested. The performance of Class II shares will vary from the Class I shares based upon its different inception date and will be negatively impacted by additional fees assessed to that class.
Portfolio Composition*
| Classification | | Percentage of
Total Investments | |
| Common Stocks | | | 44.5 | % | |
| Fixed Income Securities | | | 41.3 | | |
| Other** | | | 9.2 | | |
| Investment Companies | | | 5.0 | | |
| Total Investments | | | 100.0 | %*** | |
* Percentages indicated are based upon total investments (excluding Securities held as Collateral on Loaned Securities) as of December 31, 2011.
** Industries and/or investment types representing less than 5% of total investments.
*** Does not include open foreign currency exchange contracts with net unrealized appreciation of approximately $69,000. Does not include open long/short futures contracts with an underlying face amount of approximately $26,908,000 and net unrealized appreciation of approximately $190,000. Also does not include open swap agreements with net unrealized depreciation of approximately $104,000.
5
The Universal Institutional Funds, Inc.
Annual Report – December 31, 2011
Portfolio of Investments
Global Tactical Asset Allocation Portfolio
| | | Face Amount
(000) | | Value
(000) | |
| Fixed Income Securities (40.6%) | |
| Agency Fixed Rate Mortgages (6.2%) | |
| United States (6.2%) | |
Federal Home Loan Mortgage Corporation,
Gold Pools:
4.00%, 12/1/41 | | $ | 135 | | | $ | 142 | | |
| 6.00%, 2/1/38 | | | 67 | | | | 73 | | |
| January TBA: | |
| 3.00%, 1/25/42 (a) | | | 275 | | | | 284 | | |
| 3.50%, 1/25/42 (a) | | | 275 | | | | 282 | | |
Federal National Mortgage Association,
Conventional Pools:
4.00%, 11/1/41 - 12/1/41 | | | 664 | | | | 698 | | |
| 4.50%, 8/1/40 - 8/1/41 | | | 483 | | | | 515 | | |
| 5.00%, 1/1/41 - 3/1/41 | | | 350 | | | | 381 | | |
| 5.50%, 2/1/38 - 5/1/39 | | | 434 | | | | 474 | | |
| 6.00%, 3/1/37 - 1/1/38 | | | 299 | | | | 329 | | |
| 6.50%, 8/1/38 | | | 75 | | | | 83 | | |
Government National Mortgage Association,
January TBA:
4.00%, 1/25/42 (a) | | | 300 | | | | 322 | | |
| Various Pools: | |
| 4.50%, 6/15/39 - 8/15/39 | | | 383 | | | | 419 | | |
| Total Agency Fixed Rate Mortgages (Cost $3,974) | | | 4,002 | | |
| Asset-Backed Securities (0.7%) | |
| United States (0.7%) | |
Ally Auto Receivables Trust,
0.97%, 8/17/15 | | | 125 | | | | 125 | | |
CNH Equipment Trust,
1.20%, 5/16/16 | | | 125 | | | | 125 | | |
CVS Pass-Through Trust,
6.04%, 12/10/28 | | | 65 | | | | 68 | | |
North Carolina State Education
Assistance Authority,
1.22%, 7/25/25 (b) | | | 100 | | | | 97 | | |
| Total Asset-Backed Securities (Cost $415) | | | 415 | | |
| Commercial Mortgage Backed Securities (1.3%) | |
| United States (1.3%) | |
Banc of America Merrill Lynch Commercial
Mortgage, Inc.,
5.64%, 4/10/49 (b) | | | 75 | | | | 70 | | |
Bear Stearns Commercial Mortgage
Securities,
5.36%, 2/11/44 | | | 70 | | | | 55 | | |
Citigroup Commercial Mortgage Trust
(See Note H),
5.70%, 12/10/49 (b) | | | 120 | | | | 119 | | |
| 5.73%, 3/15/49 (b) | | | 40 | | | | 41 | | |
Greenwich Capital Commercial Funding Corp.,
5.48%, 3/10/39 | | | 65 | | | | 61 | | |
| 5.87%, 12/10/49 (b) | | | 200 | | | | 178 | | |
JP Morgan Chase Commercial Mortgage
Securities Corp.,
4.17%, 8/15/46 | | | 105 | | | | 113 | | |
| 5.89%, 2/12/51 (b) | | | 50 | | | | 50 | | |
| 6.06%, 2/15/51 (b) | | | 65 | | | | 61 | | |
| | | Face Amount
(000) | | Value
(000) | |
LB-UBS Commercial Mortgage Trust,
6.01%, 9/15/45 (b) | | $ | 75 | | | $ | 71 | | |
| Total Commercial Mortgage Backed Securities (Cost $860) | | | 819 | | |
| Corporate Bonds (12.5%) | |
| Australia (0.7%) | |
Australia & New Zealand Banking
Group Ltd.,
5.13%, 9/10/19 | | EUR | 50 | | | | 65 | | |
FMG Resources August 2006 Pty Ltd.,
6.38%, 2/1/16 (c) | | $ | 40 | | | | 39 | | |
| 6.88%, 2/1/18 (c) | | | 15 | | | | 15 | | |
Macquarie Bank Ltd.,
6.63%, 4/7/21 (c) | | | 35 | | | | 32 | | |
Macquarie Group Ltd.,
6.00%, 1/14/20 (c) | | | 50 | | | | 47 | | |
National Australia Bank Ltd.,
3.50%, 1/23/15 | | EUR | 50 | | | | 66 | | |
Santos Finance Ltd.,
8.25%, 9/22/70 (b) | | | 50 | | | | 60 | | |
Telstra Corp., Ltd.,
4.80%, 10/12/21 (c) | | $ | 40 | | | | 43 | | |
Wesfarmers Ltd.,
2.98%, 5/18/16 (c) | | | 30 | | | | 30 | | |
Westpac Banking Corp.,
3.00%, 12/9/15 (d) | | | 50 | | | | 50 | | |
| | | | 447 | | |
| Belgium (0.1%) | |
Anheuser-Busch InBev Worldwide, Inc.,
5.00%, 4/15/20 | | | 50 | | | | 57 | | |
| Brazil (0.2%) | |
Petrobras International Finance Co.,
5.75%, 1/20/20 (d) | | | 50 | | | | 54 | | |
Vale Overseas Ltd.,
5.63%, 9/15/19 | | | 85 | | | | 94 | | |
| | | | 148 | | |
| Cayman Islands (0.1%) | |
Transocean, Inc.,
6.38%, 12/15/21 (d) | | | 35 | | | | 37 | | |
| France (0.8%) | |
Banque Federative du Credit Mutuel SA,
3.00%, 10/29/15 | | EUR | 50 | | | | 63 | | |
BNP Paribas SA,
5.00%, 1/15/21 (d) | | $ | 60 | | | | 58 | | |
| 2.63%, 9/16/16 | | EUR | 52 | | | | 66 | | |
Cie Generale des Etablissements Michelin,
Zero Coupon, 1/1/17 | | | 52 | | | | 75 | | |
Credit Agricole SA,
3.90%, 4/19/21 | | | 50 | | | | 45 | | |
| 5.88%, 6/11/19 | | | 50 | | | | 56 | | |
Crown European Holdings SA,
7.13%, 8/15/18 | | | 50 | | | | 66 | | |
RTE EDF Transport SA,
5.13%, 9/12/18 | | | 50 | | | | 72 | | |
Societe Generale SA,
6.13%, 8/20/18 | | | 50 | | | | 58 | | |
| | | | 559 | | |
The accompanying notes are an integral part of the financial statements.
6
The Universal Institutional Funds, Inc.
Annual Report – December 31, 2011
Portfolio of Investments (cont'd)
Global Tactical Asset Allocation Portfolio
| | | Face Amount
(000) | | Value
(000) | |
| Germany (0.7%) | |
Celesio Finance B.V.,
3.75%, 10/29/14 | | EUR | 50 | | | $ | 62 | | |
Daimler Finance North America LLC,
8.50%, 1/18/31 | | $ | 75 | | | | 105 | | |
Deutsche Bank AG,
5.00%, 6/24/20 | | EUR | 50 | | | | 59 | | |
HeidelbergCement Finance BV,
8.00%, 1/31/17 | | | 50 | | | | 66 | | |
Kreditanstalt fuer Wiederaufbau,
1.50%, 7/30/14 | | | 100 | | | | 143 | | |
| | | | 435 | | |
| Ireland (0.2%) | |
Ardagh Glass Finance PLC,
8.75%, 2/1/20 | | | 50 | | | | 56 | | |
Smurfit Kappa Acquisitions,
7.25%, 11/15/17 | | | 50 | | | | 66 | | |
| | | | 122 | | |
| Israel (0.1%) | |
Teva Pharmaceutical Finance IV BV,
3.65%, 11/10/21 | | $ | 50 | | | | 51 | | |
| Italy (0.8%) | |
Enel Finance International N.V.,
5.13%, 10/7/19 (c) | | | 100 | | | | 90 | | |
Finmeccanica Finance SA,
8.13%, 12/3/13 | | EUR | 100 | | | | 132 | | |
Intesa Sanpaolo SpA,
6.50%, 2/24/21 (c) | | $ | 100 | | | | 82 | | |
Italcementi Finance SA,
5.38%, 3/19/20 | | EUR | 50 | | | | 47 | | |
Telecom Italia Finance SA,
7.75%, 1/24/33 | | | 30 | | | | 34 | | |
UniCredit SpA,
4.38%, 2/10/14 | | | 50 | | | | 62 | | |
| 5.75%, 9/26/17 | | | 50 | | | | 49 | | |
| | | | 496 | | |
| Luxembourg (0.3%) | |
ArcelorMittal,
9.38%, 6/3/16 | | | 50 | | | | 72 | | |
| 9.85%, 6/1/19 (d) | | $ | 75 | | | | 83 | | |
ITW Finance Europe SA,
5.25%, 10/1/14 | | EUR | 50 | | | | 71 | | |
| | | | 226 | | |
| Netherlands (0.4%) | |
ABN Amro Bank N.V.,
3.63%, 10/6/17 | | EUR | 50 | | | | 63 | | |
Aegon N.V.,
4.63%, 12/1/15 | | $ | 50 | | | | 52 | | |
Cooperatieve Centrale
Raiffeisen-Boerenleenbank BA,
3.75%, 11/9/20 | | EUR | 50 | | | | 57 | | |
Ziggo Bond Co. BV,
8.00%, 5/15/18 | | | 50 | | | | 66 | | |
| | | | 238 | | |
| | | Face Amount
(000) | | Value
(000) | |
| Spain (0.2%) | |
Gas Natural Capital Markets SA,
4.13%, 1/26/18 | | EUR | 50 | | | $ | 61 | | |
Santander Holdings USA, Inc.,
4.63%, 4/19/16 (d) | | $ | 20 | | | | 19 | | |
Telefonica Europe BV,
8.25%, 9/15/30 | | | 65 | | | | 72 | | |
| | | | 152 | | |
| Sweden (0.2%) | |
Industrivarden AB,
1.88%, 2/27/17 | | EUR | 50 | | | | 58 | | |
Nordea Bank AB,
4.00%, 3/29/21 | | | 70 | | | | 77 | | |
| | | | 135 | | |
| Switzerland (0.3%) | |
ABB Treasury Center USA, Inc.,
2.50%, 6/15/16 (c) | | $ | 25 | | | | 25 | | |
Credit Suisse AG,
4.75%, 8/5/19 | | EUR | 75 | | | | 102 | | |
UBS AG,
6.00%, 4/18/18 | | | 65 | | | | 93 | | |
| | | | 220 | | |
| United Arab Emirates (0.2%) | |
Aabar Investments PJSC,
4.00%, 5/27/16 | | | 100 | | | | 113 | | |
| United Kingdom (1.8%) | |
Abbey National Treasury Services PLC,
3.63%, 10/14/16 | | | 100 | | | | 129 | | |
BAA Funding Ltd.,
4.60%, 2/15/18 | | | 50 | | | | 66 | | |
Barclays Bank PLC,
6.00%, 1/23/18 - 1/14/21 | | | 100 | | | | 112 | | |
BAT International Finance PLC,
5.38%, 6/29/17 | | | 50 | | | | 73 | | |
HSBC Holdings PLC,
4.50%, 4/30/14 | | | 50 | | | | 68 | | |
| 6.25%, 3/19/18 | | | 50 | | | | 67 | | |
Imperial Tobacco Finance PLC,
8.38%, 2/17/16 | | | 50 | | | | 77 | | |
Lloyds TSB Bank PLC,
6.38%, 6/17/16 | | | 65 | | | | 87 | | |
| 6.38%, 1/21/21 (d) | | $ | 55 | | | | 55 | | |
Mondi Finance PLC,
5.75%, 4/3/17 | | EUR | 50 | | | | 67 | | |
National Grid Gas PLC,
5.13%, 5/14/13 | | | 50 | | | | 68 | | |
Nationwide Building Society,
6.25%, 2/25/20 (c) | | $ | 100 | | | | 99 | | |
Royal Bank of Scotland PLC (The),
4.88%, 1/20/17 | | EUR | 75 | | | | 92 | | |
Standard Chartered PLC,
5.75%, 4/30/14 | | | 50 | | | | 69 | | |
WPP Finance 2010,
4.75%, 11/21/21 (c) | | $ | 30 | | | | 30 | | |
| | | | 1,159 | | |
The accompanying notes are an integral part of the financial statements.
7
The Universal Institutional Funds, Inc.
Annual Report – December 31, 2011
Portfolio of Investments (cont'd)
Global Tactical Asset Allocation Portfolio
| | | Face Amount
(000) | | Value
(000) | |
| United States (5.4%) | |
Agilent Technologies, Inc.,
5.50%, 9/14/15 (d) | | $ | 30 | | | $ | 33 | | |
Altria Group, Inc.,
9.25%, 8/6/19 | | | 75 | | | | 101 | | |
American International Group, Inc.,
6.40%, 12/15/20 | | | 25 | | | | 25 | | |
ARAMARK Corp.,
8.50%, 2/1/15 (d) | | | 125 | | | | 129 | | |
AT&T, Inc.,
6.30%, 1/15/38 | | | 40 | | | | 49 | | |
BA Covered Bond Issuer,
4.13%, 4/5/12 | | EUR | 100 | | | | 130 | | |
Bank of America Corp.,
5.65%, 5/1/18 | | $ | 90 | | | | 86 | | |
Barrick North America Finance LLC,
4.40%, 5/30/21 | | | 40 | | | | 43 | | |
BNP Paribas/BNP Paribas US Medium-Term
Note Program LLC,
5.13%, 1/15/15 (c) | | | 25 | | | | 24 | | |
Boston Scientific Corp.,
6.00%, 1/15/20 | | | 45 | | | | 50 | | |
CBS Corp.,
5.75%, 4/15/20 | | | 35 | | | | 39 | | |
CenturyLink, Inc.,
6.45%, 6/15/21 | | | 15 | | | | 15 | | |
Citigroup, Inc. (See Note H),
8.50%, 5/22/19 | | | 75 | | | | 88 | | |
Comcast Corp.,
5.15%, 3/1/20 | | | 50 | | | | 57 | | |
Constellation Brands, Inc.,
7.25%, 5/15/17 | | | 120 | | | | 133 | | |
CRH America, Inc.,
6.00%, 9/30/16 | | | 55 | | | | 59 | | |
CSC Holdings LLC,
6.75%, 11/15/21 (c)(d) | | | 30 | | | | 32 | | |
DirecTV Holdings LLC/DirecTV Financing
Co., Inc.,
4.60%, 2/15/21 | | | 60 | | | | 63 | | |
Frontier Communications Corp.,
8.50%, 4/15/20 (d) | | | 15 | | | | 16 | | |
General Electric Capital Corp.,
5.30%, 2/11/21 | | | 40 | | | | 43 | | |
Series G
6.00%, 8/7/19 | | | 125 | | | | 144 | | |
Genworth Financial, Inc.,
7.20%, 2/15/21 | | | 50 | | | | 46 | | |
Georgia-Pacific LLC,
7.75%, 11/15/29 | | | 30 | | | | 38 | | |
| 8.88%, 5/15/31 | | | 40 | | | | 55 | | |
Gilead Sciences, Inc.,
1.00%, 5/1/14 | | | 73 | | | | 80 | | |
| 4.50%, 4/1/21 | | | 50 | | | | 53 | | |
Goldman Sachs Group, Inc. (The),
4.38%, 3/16/17 | | EUR | 50 | | | | 61 | | |
| 6.75%, 10/1/37 | | $ | 100 | | | | 93 | | |
| | | Face Amount
(000) | | Value
(000) | |
Hewlett-Packard Co.,
4.65%, 12/9/21 | | $ | 60 | | | $ | 63 | | |
Home Depot, Inc.,
5.40%, 9/15/40 | | | 100 | | | | 120 | | |
Intel Corp.,
2.95%, 12/15/35 | | | 111 | | | | 116 | | |
International Paper Co.,
7.50%, 8/15/21 (d) | | | 30 | | | | 37 | | |
Jefferies Group, Inc.,
3.88%, 11/9/15 (d) | | | 35 | | | | 31 | | |
JPMorgan Chase & Co.,
4.25%, 10/15/20 | | | 100 | | | | 101 | | |
L-3 Communications Corp.,
4.75%, 7/15/20 | | | 80 | | | | 79 | | |
Lam Research Corp.,
1.25%, 5/15/18 (c) | | | 92 | | | | 87 | | |
Life Technologies Corp.,
6.00%, 3/1/20 | | | 35 | | | | 39 | | |
Marathon Petroleum Corp.,
5.13%, 3/1/21 | | | 35 | | | | 37 | | |
MeadWestvaco Corp.,
7.38%, 9/1/19 | | | 15 | | | | 18 | | |
Merrill Lynch & Co., Inc.,
6.75%, 5/21/13 | | EUR | 50 | | | | 65 | | |
Microsoft Corp.,
Zero Coupon, 6/15/13 (c)(d) | | $ | 101 | | | | 103 | | |
NASDAQ OMX Group, Inc. (The),
5.55%, 1/15/20 | | | 40 | | | | 41 | | |
NBC Universal Media LLC,
4.38%, 4/1/21 | | | 100 | | | | 106 | | |
News America, Inc.,
4.50%, 2/15/21 (d) | | | 20 | | | | 21 | | |
Plains All American Pipeline LP/PAA
Finance Corp.,
8.75%, 5/1/19 | | | 50 | | | | 64 | | |
PPL WEM Holdings PLC,
3.90%, 5/1/16 (c) | | | 60 | | | | 60 | | |
Prudential Financial, Inc.,
7.38%, 6/15/19 | | | 50 | | | | 59 | | |
Reinsurance Group of America, Inc.,
6.45%, 11/15/19 | | | 50 | | | | 56 | | |
Simon Property Group LP,
4.13%, 12/1/21 | | | 50 | | | | 52 | | |
SLM Corp.,
6.25%, 1/25/16 | | | 65 | | | | 63 | | |
SUPERVALU, Inc.,
8.00%, 5/1/16 (d) | | | 130 | | | | 135 | | |
UnitedHealth Group, Inc.,
3.38%, 11/15/21 (d) | | | 30 | | | | 31 | | |
| 4.63%, 11/15/41 (d) | | | 30 | | | | 32 | | |
Verizon Communications, Inc.,
7.35%, 4/1/39 | | | 35 | | | | 49 | | |
Wells Fargo Bank NA,
6.00%, 5/23/13 | | EUR | 50 | | | | 68 | | |
| | | | 3,518 | | |
| Total Corporate Bonds (Cost $8,663) | | | 8,113 | | |
The accompanying notes are an integral part of the financial statements.
8
The Universal Institutional Funds, Inc.
Annual Report – December 31, 2011
Portfolio of Investments (cont'd)
Global Tactical Asset Allocation Portfolio
| | | Face Amount
(000) | | Value
(000) | |
| Sovereign (14.8%) | |
| Australia (0.6%) | |
Australia Government Bond,
5.25%, 3/15/19 | | AUD | 40 | | | $ | 46 | | |
Treasury Corp. of Victoria,
5.75%, 11/15/16 | | | 300 | | | | 327 | | |
| | | | 373 | | |
| Canada (1.2%) | |
Canadian Government Bond,
4.25%, 6/1/18 | | CAD | 580 | | | | 665 | | |
Province of Ontario Canada,
4.00%, 12/3/19 | | EUR | 85 | | | | 122 | | |
| | | | 787 | | |
| Denmark (0.1%) | |
Denmark Government Bond,
4.00%, 11/15/17 | | DKK | 485 | | | | 99 | | |
| France (0.3%) | |
France Government Bond OAT,
5.50%, 4/25/29 | | EUR | 135 | | | | 216 | | |
| Germany (3.5%) | |
Bundesrepublik Deutschland,
3.25%, 7/4/15 | | | 450 | | | | 638 | | |
| 3.50%, 7/4/19 | | | 200 | | | | 296 | | |
| 4.25%, 7/4/17 - 7/4/39 | | | 125 | | | | 209 | | |
| 4.75%, 7/4/34 | | | 325 | | | | 584 | | |
Bundesschatzanweisungen,
1.00%, 12/14/12 | | | 400 | | | | 522 | | |
| | | | 2,249 | | |
| Italy (0.8%) | |
Italy Buoni Poliennali Del Tesoro,
3.00%, 6/15/15 | | | 200 | | | | 238 | | |
| 4.00%, 9/1/20 | | | 150 | | | | 163 | | |
| 5.00%, 8/1/39 | | EUR | 85 | | | | 87 | | |
| | | | 488 | | |
| Japan (4.2%) | |
Japan Government Ten Year Bond,
1.30%, 12/20/13 | | JPY | 45,000 | | | | 598 | | |
| 1.40%, 9/20/15 | | | 58,000 | | | | 785 | | |
| 1.70%, 6/20/18 | | | 10,000 | | | | 140 | | |
| 1.90%, 6/20/16 | | | 5,000 | | | | 69 | | |
Japan Government Thirty Year Bond,
1.70%, 6/20/33 | | | 87,000 | | | | 1,117 | | |
| | | | 2,709 | | |
| Mexico (0.5%) | |
Mexican Bonos,
10.00%, 12/5/24 | | MXN | 3,600 | | | | 332 | | |
| Netherlands (0.6%) | |
Netherlands Government Bond,
4.00%, 7/15/19 | | EUR | 275 | | | | 408 | | |
| Poland (0.4%) | |
Poland Government Bond,
5.25%, 10/25/17 | | PLN | 875 | | | | 251 | | |
| | | Face Amount
(000) | | Value
(000) | |
| South Africa (0.1%) | |
South Africa Government Bond,
7.25%, 1/15/20 | | ZAR | 400 | | | $ | 48 | | |
| Sweden (0.3%) | |
Sweden Government Bond,
4.25%, 3/12/19 | | SEK | 1,300 | | | | 225 | | |
| United Kingdom (2.2%) | |
United Kingdom Gilt,
3.75%, 9/7/20 | | GBP | 50 | | | | 90 | | |
| 4.25%, 6/7/32 - 9/7/39 | | | 390 | | | | 741 | | |
| 4.50%, 3/7/13 | | | 80 | | | | 131 | | |
| 5.00%, 3/7/18 | | | 180 | | | | 342 | | |
United Kingdom Treasury Bond,
4.25%, 3/7/36 | | | 50 | | | | 95 | | |
| | | | 1,399 | | |
| Total Sovereign (Cost $9,537) | | | 9,584 | | |
| U.S. Treasury Securities (5.1%) | |
| United States (5.1%) | |
U.S. Treasury Bonds,
3.50%, 2/15/39 | | $ | 580 | | | | 653 | | |
| 6.88%, 8/15/25 | | | 300 | | | | 462 | | |
U.S. Treasury Notes,
2.38%, 10/31/14 | | | 730 | | | | 771 | | |
| 2.75%, 2/28/18 | | | 950 | | | | 1,042 | | |
| 3.13%, 5/15/19 | | | 200 | | | | 224 | | |
| 3.63%, 2/15/21 | | | 110 | | | | 128 | | |
| Total U.S. Treasury Securities (Cost $3,062) | | | 3,280 | | |
| Total Fixed Income Securities (Cost $26,511) | | | 26,213 | | |
| | | Shares | | | |
| Common Stocks (43.6%) | |
| Australia (2.3%) | |
| AGL Energy Ltd. | | | 904 | | | | 13 | | |
| Alumina Ltd. | | | 9,345 | | | | 11 | | |
| Amcor Ltd. | | | 2,905 | | | | 21 | | |
| AMP Ltd. | | | 7,518 | | | | 31 | | |
| ASX Ltd. | | | 521 | | | | 16 | | |
| Australia & New Zealand Banking Group Ltd. | | | 5,259 | | | | 111 | | |
| BHP Billiton Ltd. | | | 6,142 | | | | 216 | | |
| Brambles Ltd. | | | 3,179 | | | | 23 | | |
| Coca-Cola Amatil Ltd. | | | 560 | | | | 7 | | |
| Commonwealth Bank of Australia (d) | | | 2,661 | | | | 134 | | |
| CSL Ltd. | | | 1,047 | | | | 34 | | |
| Echo Entertainment Group Ltd. (e) | | | 378 | | | | 1 | | |
| Fortescue Metals Group Ltd. (d) | | | 3,024 | | | | 13 | | |
| GPT Group REIT (Stapled Securities) (f) | | | 7,895 | | | | 25 | | |
| Incitec Pivot Ltd. | | | 4,364 | | | | 14 | | |
| Insurance Australia Group Ltd. | | | 5,277 | | | | 16 | | |
| Leighton Holdings Ltd. (d) | | | 433 | | | | 9 | | |
| Macquarie Group Ltd. | | | 781 | | | | 19 | | |
| National Australia Bank Ltd. (d) | | | 3,819 | | | | 91 | | |
| Newcrest Mining Ltd. | | | 1,373 | | | | 42 | | |
The accompanying notes are an integral part of the financial statements.
9
The Universal Institutional Funds, Inc.
Annual Report – December 31, 2011
Portfolio of Investments (cont'd)
Global Tactical Asset Allocation Portfolio
| | | Shares | | Value
(000) | |
| Australia (cont'd) | |
| Orica Ltd. | | | 1,136 | | | $ | 28 | | |
| Origin Energy Ltd. | | | 2,512 | | | | 34 | | |
| QBE Insurance Group Ltd. | | | 3,321 | | | | 44 | | |
| Rio Tinto Ltd. (d) | | | 827 | | | | 51 | | |
| Santos Ltd. | | | 1,903 | | | | 24 | | |
| Stockland REIT (Stapled Securities) (f)(g) | | | 8,454 | | | | 28 | | |
| Suncorp Group Ltd. | | | 3,090 | | | | 27 | | |
| TABCORP Holdings Ltd. | | | 379 | | | | 1 | | |
| Telstra Corp, Ltd. | | | 7,625 | | | | 26 | | |
| Transurban Group (Stapled Securities) (f) | | | 3,556 | | | | 21 | | |
| Treasury Wine Estates Ltd. | | | 1,702 | | | | 6 | | |
| Wesfarmers Ltd. | | | 1,835 | | | | 55 | | |
| Wesfarmers Ltd. (PPS) | | | 285 | | | | 9 | | |
| Westfield Group REIT (Stapled Securities) (f)(g) | | | 4,870 | | | | 39 | | |
| Westfield Retail Trust REIT | | | 4,870 | | | | 12 | | |
| Westpac Banking Corp. (d) | | | 5,241 | | | | 107 | | |
| Woodside Petroleum Ltd. | | | 1,157 | | | | 36 | | |
| Woolworths Ltd. | | | 2,227 | | | | 57 | | |
| | | | 1,452 | | |
| Austria (0.0%) | |
| Erste Group Bank AG | | | 537 | | | | 9 | | |
| Immofinanz AG (e) | | | 955 | | | | 3 | | |
| Verbund AG, Class A (d) | | | 128 | | | | 3 | | |
| Voestalpine AG | | | 270 | | | | 8 | | |
| | | | 23 | | |
| Belgium (0.2%) | |
| Ageas | | | 3,749 | | | | 6 | | |
| Anheuser-Busch InBev N.V. | | | 975 | | | | 60 | | |
| Colruyt SA | | | 121 | | | | 4 | | |
| Groupe Bruxelles Lambert SA | | | 202 | | | | 13 | | |
| KBC Groep N.V. | | | 151 | | | | 2 | | |
| Solvay SA, Class A | | | 98 | | | | 8 | | |
| Umicore SA | | | 216 | | | | 9 | | |
| | | | 102 | | |
| Canada (2.9%) | |
| Agnico-Eagle Mines Ltd. (d) | | | 400 | | | | 15 | | |
| Agrium, Inc. | | | 400 | | | | 27 | | |
| Bank of Montreal (d) | | | 1,100 | | | | 60 | | |
| Bank of Nova Scotia (d) | | | 1,600 | | | | 80 | | |
| Barrick Gold Corp. (d) | | | 2,100 | | | | 95 | | |
| BCE, Inc. (d) | | | 2,000 | | | | 83 | | |
| Brookfield Asset Management, Inc., Class A | | | 1,400 | | | | 39 | | |
| Cameco Corp. (d) | | | 1,000 | | | | 18 | | |
| Canadian Imperial Bank of Commerce (d) | | | 900 | | | | 65 | | |
| Canadian National Railway Co. | | | 1,000 | | | | 79 | | |
| Canadian Natural Resources Ltd. (d) | | | 2,000 | | | | 75 | | |
| Canadian Pacific Railway Ltd. (d) | | | 400 | | | | 27 | | |
| Cenovus Energy, Inc. | | | 1,600 | | | | 53 | | |
| Crescent Point Energy Corp. (d) | | | 600 | | | | 27 | | |
| Eldorado Gold Corp. | | | 1,200 | | | | 17 | | |
| Enbridge, Inc. (d) | | | 1,800 | | | | 67 | | |
| | | Shares | | Value
(000) | |
| Encana Corp. | | | 1,800 | | | $ | 33 | | |
| Goldcorp, Inc. | | | 1,600 | | | | 71 | | |
| Imperial Oil Ltd. (d) | | | 200 | | | | 9 | | |
| Kinross Gold Corp. | | | 2,400 | | | | 27 | | |
| Magna International, Inc. | | | 600 | | | | 20 | | |
| Manulife Financial Corp. (d) | | | 5,800 | | | | 62 | | |
| National Bank of Canada (d) | | | 300 | | | | 21 | | |
| Nexen, Inc. | | | 1,500 | | | | 24 | | |
| Penn West Petroleum Ltd. (d) | | | 900 | | | | 18 | | |
| Potash Corp. of Saskatchewan, Inc. | | | 1,800 | | | | 74 | | |
| Power Corp. of Canada (d) | | | 1,300 | | | | 30 | | |
| Research In Motion Ltd. (e) | | | 1,000 | | | | 15 | | |
| Rogers Communications, Inc. (d) | | | 700 | | | | 27 | | |
| Royal Bank of Canada (d) | | | 2,300 | | | | 117 | | |
| Shoppers Drug Mart Corp. (d) | | | 1,000 | | | | 40 | | |
| Silver Wheaton Corp. (d) | | | 700 | | | | 20 | | |
| Sun Life Financial, Inc. (d) | | | 1,600 | | | | 30 | | |
| Suncor Energy, Inc. | | | 3,100 | | | | 89 | | |
| Talisman Energy, Inc. (d) | | | 2,000 | | | | 26 | | |
| Teck Resources Ltd. | | | 1,000 | | | | 35 | | |
| Thomson Reuters Corp. (d) | | | 900 | | | | 24 | | |
| Toronto-Dominion Bank (The) (d) | | | 1,800 | | | | 135 | | |
| TransCanada Corp. (d) | | | 1,200 | | | | 53 | | |
| Yamana Gold, Inc. | | | 1,700 | | | | 25 | | |
| | | | 1,852 | | |
| Chile (0.0%) | |
| Antofagasta PLC | | | 742 | | | | 14 | | |
| China (0.0%) | |
| Wynn Macau Ltd. (d)(h) | | | 5,600 | | | | 14 | | |
| Denmark (0.2%) | |
| AP Moller — Maersk A/S | | | 1 | | | | 6 | | |
| AP Moller — Maersk A/S Series B | | | 2 | | | | 13 | | |
| Danske Bank A/S (e) | | | 684 | | | | 9 | | |
| DSV A/S | | | 376 | | | | 7 | | |
| Novo Nordisk A/S Series B | | | 888 | | | | 102 | | |
| Novozymes A/S Series B | | | 330 | | | | 10 | | |
| Vestas Wind Systems A/S (e) | | | 387 | | | | 4 | | |
| | | | 151 | | |
| Finland (0.2%) | |
| Elisa Oyj (d) | | | 277 | | | | 6 | | |
| Fortum Oyj | | | 651 | | | | 14 | | |
| Kone Oyj, Class B | | | 292 | | | | 15 | | |
| Metso Oyj | | | 204 | | | | 7 | | |
| Nokia Oyj | | | 5,675 | | | | 28 | | |
| Nokian Renkaat Oyj | | | 240 | | | | 8 | | |
| Sampo Oyj, Class A | | | 605 | | | | 15 | | |
| Stora Enso Oyj, Class R | | | 1,002 | | | | 6 | | |
| UPM-Kymmene Oyj | | | 554 | | | | 6 | | |
| Wartsila Oyj | | | 291 | | | | 8 | | |
| | | | 113 | | |
The accompanying notes are an integral part of the financial statements.
10
The Universal Institutional Funds, Inc.
Annual Report – December 31, 2011
Portfolio of Investments (cont'd)
Global Tactical Asset Allocation Portfolio
| | | Shares | | Value
(000) | |
| France (1.8%) | |
| Aeroports de Paris | | | 55 | | | $ | 4 | | |
| Air Liquide SA | | | 428 | | | | 53 | | |
| Alcatel-Lucent (d)(e) | | | 6,226 | | | | 10 | | |
| Alstom SA | | | 406 | | | | 12 | | |
| ArcelorMittal | | | 1,340 | | | | 25 | | |
| AXA SA | | | 3,059 | | | | 40 | | |
| BNP Paribas SA | | | 2,156 | | | | 85 | | |
| Bouygues SA (d) | | | 355 | | | | 11 | | |
| Cap Gemini SA | | | 333 | | | | 10 | | |
| Carrefour SA | | | 744 | | | | 17 | | |
| Christian Dior SA | | | 127 | | | | 15 | | |
| Cie de St-Gobain | | | 696 | | | | 27 | | |
| Cie Generale d'Optique Essilor International SA | | | 303 | | | | 21 | | |
| Cie Generale de Geophysique-Veritas (e) | | | 256 | | | | 6 | | |
| Cie Generale des Etablissements Michelin Series B | | | 364 | | | | 22 | | |
| Credit Agricole SA | | | 2,594 | | | | 15 | | |
| Danone | | | 736 | | | | 46 | | |
| EDF SA (d) | | | 431 | | | | 11 | | |
| European Aeronautic Defence and Space Co. N.V. | | | 675 | | | | 21 | | |
| Fonciere Des Regions REIT | | | 53 | | | | 3 | | |
| France Telecom SA | | | 2,874 | | | | 45 | | |
| GDF Suez | | | 1,973 | | | | 54 | | |
| Gecina SA REIT | | | 37 | | | | 3 | | |
| Groupe Eurotunnel SA | | | 949 | | | | 6 | | |
| Klepierre REIT | | | 187 | | | | 5 | | |
| L'Oreal SA | | | 420 | | | | 44 | | |
| Lafarge SA (d) | | | 345 | | | | 12 | | |
| Legrand SA | | | 195 | | | | 6 | | |
| LVMH Moet Hennessy Louis Vuitton SA | | | 315 | | | | 45 | | |
| Pernod-Ricard SA | | | 351 | | | | 33 | | |
| Peugeot SA | | | 386 | | | | 6 | | |
| Publicis Groupe SA | | | 312 | | | | 14 | | |
| Renault SA | | | 330 | | | | 11 | | |
| Safran SA | | | 251 | | | | 8 | | |
| Sanofi | | | 845 | | | | 62 | | |
| Schneider Electric SA | | | 782 | | | | 41 | | |
| SES SA | | | 614 | | | | 15 | | |
| Societe Generale SA | | | 1,480 | | | | 33 | | |
| Sodexo | | | 272 | | | | 20 | | |
| Technip SA | | | 158 | | | | 15 | | |
| Thales SA (d) | | | 156 | | | | 5 | | |
| Total SA | | | 2,424 | | | | 124 | | |
| Unibail-Rodamco SE REIT | | | 89 | | | | 16 | | |
| Vallourec SA | | | 167 | | | | 11 | | |
| Veolia Environnement SA | | | 586 | | | | 6 | | |
| Vinci SA | | | 830 | | | | 36 | | |
| Vivendi SA | | | 1,701 | | | | 37 | | |
| | | | 1,167 | | |
| Germany (1.8%) | |
| Adidas AG | | | 339 | | | | 22 | | |
| Allianz SE (Registered) | | | 832 | | | | 80 | | |
| BASF SE | | | 1,220 | | | | 85 | | |
| | | Shares | | Value
(000) | |
| Bayer AG (Registered) | | | 1,377 | | | $ | 88 | | |
| Bayerische Motoren Werke AG | | | 683 | | | | 46 | | |
| Commerzbank AG (d)(e) | | | 871 | | | | 1 | | |
| Continental AG (e) | | | 162 | | | | 10 | | |
| Daimler AG (Registered) | | | 1,424 | | | | 63 | | |
| Deutsche Bank AG (Registered) | | | 1,321 | | | | 50 | | |
| Deutsche Boerse AG (e) | | | 295 | | | | 15 | | |
| Deutsche Lufthansa AG (Registered) | | | 480 | | | | 6 | | |
| Deutsche Post AG (Registered) | | | 1,164 | | | | 18 | | |
| Deutsche Telekom AG (Registered) | | | 4,124 | | | | 47 | | |
| E.ON AG | | | 3,099 | | | | 67 | | |
| Esprit Holdings Ltd. (h) | | | 3,544 | | | | 5 | | |
| Fraport AG Frankfurt Airport Services Worldwide | | | 40 | | | | 2 | | |
| Fresenius Medical Care AG & Co. KGaA | | | 357 | | | | 24 | | |
| Fresenius SE & Co. KGaA | | | 260 | | | | 24 | | |
| HeidelbergCement AG | | | 163 | | | | 7 | | |
| Henkel AG & Co. KGaA | | | 306 | | | | 15 | | |
| Henkel AG & Co. KGaA (Preference) | | | 360 | | | | 21 | | |
| Infineon Technologies AG | | | 2,448 | | | | 18 | | |
| K+S AG (Registered) | | | 236 | | | | 11 | | |
| Lanxess AG | | | 139 | | | | 7 | | |
| Linde AG | | | 293 | | | | 44 | | |
| Merck KGaA | | | 187 | | | | 19 | | |
| Metro AG | | | 199 | | | | 7 | | |
| Muenchener Rueckversicherungs AG (Registered) | | | 392 | | | | 48 | | |
| Porsche Automobil Holding SE (Preference) | | | 504 | | | | 27 | | |
| QIAGEN N.V. (e) | | | 899 | | | | 12 | | |
| RWE AG | | | 930 | | | | 33 | | |
| Salzgitter AG | | | 82 | | | | 4 | | |
| SAP AG | | | 1,649 | | | | 87 | | |
| Siemens AG (Registered) | | | 1,196 | | | | 114 | | |
| ThyssenKrupp AG | | | 542 | | | | 12 | | |
| Volkswagen AG | | | 41 | | | | 6 | | |
| Volkswagen AG (Preference) | | | 287 | | | | 43 | | |
| | | | 1,188 | | |
| Greece (0.0%) | |
| National Bank of Greece SA (e) | | | 1,384 | | | | 3 | | |
| Hong Kong (1.1%) | |
| Bank of East Asia Ltd. (d) | | | 5,780 | | | | 22 | | |
| BOC Hong Kong Holdings Ltd. | | | 13,000 | | | | 31 | | |
| Cheung Kong Holdings Ltd. | | | 5,000 | | | | 59 | | |
| CLP Holdings Ltd. | | | 7,500 | | | | 64 | | |
| Hang Lung Group Ltd. (d) | | | 3,000 | | | | 16 | | |
| Hang Lung Properties Ltd. | | | 7,000 | | | | 20 | | |
| Hang Seng Bank Ltd. (d) | | | 4,700 | | | | 56 | | |
| Henderson Land Development Co., Ltd. | | | 5,103 | | | | 25 | | |
| Hong Kong & China Gas Co., Ltd. | | | 12,100 | | | | 28 | | |
| Hong Kong Exchanges and Clearing Ltd. (d) | | | 3,700 | | | | 59 | | |
| Hutchison Whampoa Ltd. | | | 7,000 | | | | 59 | | |
| Kerry Properties Ltd. | | | 2,500 | | | | 8 | | |
| Link REIT (The) (d) | | | 7,307 | | | | 27 | | |
| MTR Corp. | | | 5,588 | | | | 18 | | |
The accompanying notes are an integral part of the financial statements.
11
The Universal Institutional Funds, Inc.
Annual Report – December 31, 2011
Portfolio of Investments (cont'd)
Global Tactical Asset Allocation Portfolio
| | | Shares | | Value
(000) | |
| Hong Kong (cont'd) | |
| New World Development , Ltd. | | | 9,632 | | | $ | 8 | | |
| Power Assets Holdings Ltd. | | | 5,500 | | | | 41 | | |
| Sands China Ltd. (e) | | | 8,800 | | | | 25 | | |
| Sino Land Co., Ltd. (d) | | | 9,125 | | | | 13 | | |
| Sun Hung Kai Properties Ltd. | | | 5,000 | | | | 63 | | |
| Swire Pacific Ltd. | | | 2,500 | | | | 30 | | |
| Wharf Holdings Ltd. | | | 4,400 | | | | 20 | | |
| | | | 692 | | |
| India (0.0%) | |
| Cairn Energy PLC (e) | | | 2,403 | | | | 10 | | |
| Ireland (0.0%) | |
| CRH PLC | | | 832 | | | | 17 | | |
| Italy (0.5%) | |
| Assicurazioni Generali SpA | | | 2,726 | | | | 41 | | |
| Atlantia SpA | | | 530 | | | | 8 | | |
| Banco Popolare SC (d) | | | 4,013 | | | | 5 | | |
| Enel Green Power SpA | | | 2,893 | | | | 6 | | |
| Enel SpA | | | 13,052 | | | | 53 | | |
| Eni SpA | | | 2,877 | | | | 60 | | |
| Exor SpA | | | 94 | | | | 2 | | |
| Fiat Industrial SpA (e) | | | 998 | | | | 9 | | |
| Fiat SpA (d) | | | 786 | | | | 4 | | |
| Finmeccanica SpA | | | 598 | | | | 2 | | |
| Intesa Sanpaolo SpA | | | 23,263 | | | | 39 | | |
| Luxottica Group SpA | | | 179 | | | | 5 | | |
| Mediobanca SpA (d) | | | 766 | | | | 4 | | |
| Saipem SpA | | | 424 | | | | 18 | | |
| Snam Rete Gas SpA | | | 2,878 | | | | 13 | | |
| Telecom Italia SpA | | | 13,589 | | | | 15 | | |
| Terna Rete Elettrica Nazionale SpA | | | 2,573 | | | | 9 | | |
| UniCredit SpA (d) | | | 2,864 | | | | 24 | | |
| Unione di Banche Italiane SCPA (d) | | | 1,110 | | | | 4 | | |
| | | | 321 | | |
| Japan (4.9%) | |
| Aeon Co., Ltd. (d) | | | 1,900 | | | | 26 | | |
| Aisin Seiki Co., Ltd. | | | 400 | | | | 11 | | |
| Ajinomoto Co., Inc. | | | 2,000 | | | | 24 | | |
| Asahi Glass Co., Ltd. (d) | | | 2,000 | | | | 17 | | |
| Asahi Group Holdings Ltd. (d) | | | 900 | | | | 20 | | |
| Asahi Kasei Corp. | | | 4,000 | | | | 24 | | |
| Astellas Pharma, Inc. | | | 700 | | | | 28 | | |
| Bank of Yokohama Ltd. (The) | | | 6,000 | | | | 28 | | |
| Bridgestone Corp. (d) | | | 1,500 | | | | 34 | | |
| Canon, Inc. (d) | | | 1,700 | | | | 75 | | |
| Central Japan Railway Co. | | | 3 | | | | 25 | | |
| Chubu Electric Power Co., Inc. | | | 1,100 | | | | 21 | | |
| Chugoku Electric Power Co., Inc. (The) (d) | | | 700 | | | | 12 | | |
| Dai Nippon Printing Co., Ltd. | | | 1,000 | | | | 10 | | |
| Dai-ichi Life Insurance Co., Ltd. (The) (d) | | | 22 | | | | 22 | | |
| Daiichi Sankyo Co., Ltd. | | | 1,000 | | | | 20 | | |
| Daikin Industries Ltd. | | | 400 | | | | 11 | | |
| | | Shares | | Value
(000) | |
| Daiwa House Industry Co., Ltd. | | | 2,000 | | | $ | 24 | | |
| Daiwa Securities Group, Inc. (d) | | | 6,000 | | | | 19 | | |
| Denso Corp. | | | 700 | | | | 19 | | |
| East Japan Railway Co. | | | 700 | | | | 45 | | |
| Eisai Co., Ltd. | | | 600 | | | | 25 | | |
| Fanuc Corp. | | | 300 | | | | 46 | | |
| Fast Retailing Co., Ltd. | | | 100 | | | | 18 | | |
| FUJIFILM Holdings Corp. | | | 1,000 | | | | 24 | | |
| Fujitsu Ltd. | | | 4,000 | | | | 21 | | |
| Hankyu Hanshin Holdings, Inc. | | | 6,000 | | | | 25 | | |
| Hitachi Ltd. | | | 7,000 | | | | 37 | | |
| Honda Motor Co., Ltd. (d) | | | 2,500 | | | | 76 | | |
| Hoya Corp. | | | 900 | | | | 19 | | |
| Inpex Corp. | | | 4 | | | | 25 | | |
| ITOCHU Corp. | | | 2,800 | | | | 28 | | |
| Japan Tobacco, Inc. | | | 8 | | | | 38 | | |
| JFE Holdings, Inc. | | | 900 | | | | 16 | | |
| JS Group Corp. | | | 1,100 | | | | 21 | | |
| JX Holdings, Inc. | | | 5,500 | | | | 33 | | |
| Kansai Electric Power Co., Inc. (The) | | | 1,200 | | | | 18 | | |
| Kao Corp. | | | 700 | | | | 19 | | |
| KDDI Corp. (d) | | | 4 | | | | 26 | | |
| Keyence Corp. | | | 200 | | | | 48 | | |
| Kintetsu Corp. (d) | | | 6,000 | | | | 23 | | |
| Kirin Holdings Co., Ltd. (d) | | | 2,000 | | | | 24 | | |
| Kobe Steel Ltd. | | | 8,000 | | | | 12 | | |
| Komatsu Ltd. | | | 2,100 | | | | 49 | | |
| Konica Minolta Holdings, Inc. | | | 1,500 | | | | 11 | | |
| Kubota Corp. (d) | | | 3,000 | | | | 25 | | |
| Kuraray Co., Ltd. | | | 1,000 | | | | 14 | | |
| Kyocera Corp. | | | 300 | | | | 24 | | |
| Kyushu Electric Power Co., Inc. | | | 800 | | | | 11 | | |
| Marubeni Corp. | | | 4,000 | | | | 24 | | |
| Mitsubishi Chemical Holdings Corp. (d) | | | 3,500 | | | | 19 | | |
| Mitsubishi Corp. | | | 2,300 | | | | 46 | | |
| Mitsubishi Electric Corp. | | | 4,000 | | | | 38 | | |
| Mitsubishi Estate Co., Ltd. | | | 2,000 | | | | 30 | | |
| Mitsubishi Heavy Industries Ltd. | | | 9,000 | | | | 38 | | |
| Mitsui & Co., Ltd. | | | 2,800 | | | | 44 | | |
| Mitsui Fudosan Co., Ltd. | | | 2,000 | | | | 29 | | |
| Mitsui OSK Lines Ltd. | | | 3,000 | | | | 12 | | |
| Mizuho Financial Group, Inc. | | | 37,100 | | | | 50 | | |
| MS&AD Insurance Group Holdings | | | 1,100 | | | | 20 | | |
| Murata Manufacturing Co., Ltd. (d) | | | 400 | | | | 21 | | |
| NEC Corp. (e) | | | 8,000 | | | | 16 | | |
| NGK Insulators Ltd. | | | 1,000 | | | | 12 | | |
| Nidec Corp. | | | 200 | | | | 17 | | |
| Nikon Corp. | | | 800 | | | | 18 | | |
| Nintendo Co., Ltd. | | | 100 | | | | 14 | | |
| Nippon Building Fund, Inc. REIT (d) | | | 2 | | | | 16 | | |
| Nippon Steel Corp. (d) | | | 9,000 | | | | 22 | | |
| Nippon Telegraph & Telephone Corp. | | | 900 | | | | 46 | | |
| Nippon Yusen KK (d) | | | 3,000 | | | | 8 | | |
The accompanying notes are an integral part of the financial statements.
12
The Universal Institutional Funds, Inc.
Annual Report – December 31, 2011
Portfolio of Investments (cont'd)
Global Tactical Asset Allocation Portfolio
| | | Shares | | Value
(000) | |
| Japan (cont'd) | |
| Nissan Motor Co., Ltd. (d) | | | 3,800 | | | $ | 34 | | |
| Nitto Denko Corp. (d) | | | 400 | | | | 14 | | |
| NKSJ Holdings, Inc. | | | 1,000 | | | | 20 | | |
| Nomura Holdings, Inc. | | | 6,800 | | | | 21 | | |
| NTT DoCoMo, Inc. | | | 27 | | | | 50 | | |
| Odakyu Electric Railway Co., Ltd. (d) | | | 3,000 | | | | 29 | | |
| Olympus Corp. (d) | | | 500 | | | | 7 | | |
| Omron Corp. (d) | | | 700 | | | | 14 | | |
| Oriental Land Co., Ltd. (d) | | | 200 | | | | 21 | | |
| ORIX Corp. (d) | | | 220 | | | | 18 | | |
| Osaka Gas Co., Ltd. | | | 5,000 | | | | 20 | | |
| Panasonic Corp. | | | 2,800 | | | | 24 | | |
| Rakuten, Inc. (d) | | | 20 | | | | 22 | | |
| Ricoh Co., Ltd. (d) | | | 2,000 | | | | 17 | | |
| Rohm Co., Ltd. | | | 300 | | | | 14 | | |
| Secom Co., Ltd. | | | 700 | | | | 32 | | |
| Sekisui House Ltd. | | | 2,000 | | | | 18 | | |
| Seven & I Holdings Co., Ltd. | | | 1,500 | | | | 42 | | |
| Sharp Corp. (d) | | | 2,000 | | | | 18 | | |
| Shikoku Electric Power Co., Inc. | | | 500 | | | | 14 | | |
| Shin-Etsu Chemical Co., Ltd. | | | 700 | | | | 34 | | |
| Shionogi & Co., Ltd. | | | 1,200 | | | | 15 | | |
| Shiseido Co., Ltd. (d) | | | 800 | | | | 15 | | |
| Shizuoka Bank Ltd. (The) (d) | | | 3,000 | | | | 32 | | |
| SMC Corp. (d) | | | 200 | | | | 32 | | |
| Softbank Corp. | | | 1,400 | | | | 41 | | |
| Sony Corp. | | | 1,700 | | | | 31 | | |
| Sumitomo Chemical Co., Ltd. (d) | | | 3,000 | | | | 11 | | |
| Sumitomo Corp. | | | 1,900 | | | | 26 | | |
| Sumitomo Electric Industries Ltd. | | | 1,200 | | | | 13 | | |
| Sumitomo Metal Industries Ltd. | | | 6,000 | | | | 11 | | |
| Sumitomo Metal Mining Co., Ltd. | | | 1,000 | | | | 13 | | |
| Sumitomo Mitsui Financial Group, Inc. | | | 2,400 | | | | 67 | | |
| Sumitomo Mitsui Trust Holdings, Inc. | | | 6,000 | | | | 18 | | |
| Sumitomo Realty & Development Co., Ltd. | | | 1,000 | | | | 18 | | |
| Suzuki Motor Corp. | | | 700 | | | | 15 | | |
| T&D Holdings, Inc. | | | 1,700 | | | | 16 | | |
| Takeda Pharmaceutical Co., Ltd. | | | 1,100 | | | | 48 | | |
| TDK Corp. | | | 400 | | | | 18 | | |
| Terumo Corp. | | | 500 | | | | 24 | | |
| Tohoku Electric Power Co., Inc. (d) | | | 1,000 | | | | 10 | | |
| Tokio Marine Holdings, Inc. | | | 1,400 | | | | 31 | | |
| Tokyo Electric Power Co., Inc. (The) (d)(e) | | | 3,400 | | | | 8 | | |
| Tokyo Electron Ltd. | | | 500 | | | | 25 | | |
| Tokyo Gas Co., Ltd. | | | 5,000 | | | | 23 | | |
| Tokyu Corp. (d) | | | 4,000 | | | | 20 | | |
| Toray Industries, Inc. (d) | | | 4,000 | | | | 29 | | |
| Toshiba Corp. (d) | | | 7,000 | | | | 29 | | |
| Toyota Industries Corp. (d) | | | 800 | | | | 22 | | |
| Toyota Motor Corp. | | | 4,400 | | | | 147 | | |
| West Japan Railway Co. | | | 400 | | | | 17 | | |
| Yahoo! Japan Corp. (d) | | | 47 | | | | 15 | | |
| | | Shares | | Value
(000) | |
| Yamada Denki Co., Ltd. (d) | | | 250 | | | $ | 17 | | |
| Yamato Holdings Co., Ltd. | | | 400 | | | | 7 | | |
| | | | 3,158 | | |
| Kazakhstan (0.0%) | |
| Kazakhmys PLC | | | 553 | | | | 8 | | |
| Netherlands (0.5%) | |
| Akzo Nobel N.V. (d) | | | 388 | | | | 19 | | |
| ASML Holding N.V. | | | 662 | | | | 28 | | |
| Corio N.V. REIT | | | 115 | | | | 5 | | |
| Fugro N.V. CVA | | | 96 | | | | 6 | | |
| Heineken N.V. | | | 613 | | | | 28 | | |
| ING Groep N.V. (e) | | | 5,653 | | | | 41 | | |
| Koninklijke Ahold N.V. | | | 1,733 | | | | 23 | | |
| Koninklijke KPN N.V. | | | 1,823 | | | | 22 | | |
| Koninklijke Philips Electronics N.V. | | | 1,872 | | | | 39 | | |
| Koninklijke Vopak N.V. | | | 116 | | | | 6 | | |
| PostNL N.V. | | | 586 | | | | 2 | | |
| TNT Express N.V. | | | 586 | | | | 4 | | |
| Unilever N.V. CVA | | | 2,128 | | | | 73 | | |
| | | | 296 | | |
| Norway (0.2%) | |
| Aker Solutions ASA | | | 246 | | | | 3 | | |
| DnB NOR ASA | | | 2,312 | | | | 23 | | |
| Kvaerner ASA (e) | | | 246 | | | | — | @ | |
| Norsk Hydro ASA | | | 1,778 | | | | 8 | | |
| Orkla ASA | | | 1,208 | | | | 9 | | |
| Renewable Energy Corp. ASA (d)(e) | | | 1,171 | | | | 1 | | |
| Statoil ASA | | | 2,488 | | | | 64 | | |
| Subsea 7 SA (e) | | | 420 | | | | 8 | | |
| Telenor ASA | | | 995 | | | | 16 | | |
| Yara International ASA | | | 352 | | | | 14 | | |
| | | | 146 | | |
| Poland (0.0%) | |
| Jeronimo Martins SGPS SA (e) | | | 411 | | | | 7 | | |
| Portugal (0.0%) | |
| EDP — Energias de Portugal SA | | | 4,041 | | | | 13 | | |
| Galp Energia SGPS SA | | | 421 | | | | 6 | | |
| Portugal Telecom SGPS SA (Registered) (d) | | | 1,039 | | | | 6 | | |
| | | | 25 | | |
| South Africa (0.1%) | |
| SABMiller PLC | | | 1,566 | | | | 55 | | |
| Spain (0.8%) | |
| Abertis Infraestructuras SA | | | 502 | | | | 8 | | |
| ACS Actividades de Construccion y Servicios SA (d) | | | 323 | | | | 10 | | |
| Banco Bilbao Vizcaya Argentaria SA | | | 9,091 | | | | 79 | | |
| Banco de Sabadell SA (d) | | | 2,278 | | | | 9 | | |
| Banco Popular Espanol SA (d) | | | 1,762 | | | | 8 | | |
| Banco Santander SA | | | 16,671 | | | | 127 | | |
| CaixaBank (d) | | | 1,494 | | | | 7 | | |
| Distribuidora Internacional de Alimentacion SA (d)(e) | | | 744 | | | | 3 | | |
| Enagas SA | | | 316 | | | | 6 | | |
| Ferrovial SA | | | 872 | | | | 10 | | |
The accompanying notes are an integral part of the financial statements.
13
The Universal Institutional Funds, Inc.
Annual Report – December 31, 2011
Portfolio of Investments (cont'd)
Global Tactical Asset Allocation Portfolio
| | | Shares | | Value
(000) | |
| Spain (cont'd) | |
| Iberdrola SA | | | 7,045 | | | $ | 44 | | |
| Inditex SA | | | 505 | | | | 41 | | |
| International Consolidated Airlines Group SA (e) | | | 1,797 | | | | 4 | | |
| Red Electrica Corp. SA (d) | | | 227 | | | | 10 | | |
| Repsol YPF SA | | | 3,176 | | | | 98 | | |
| Telefonica SA | | | 4,708 | | | | 81 | | |
| | | | 545 | | |
| Sweden (0.8%) | |
| Alfa Laval AB | | | 719 | | | | 14 | | |
| Assa Abloy AB, Class B | | | 568 | | | | 14 | | |
| Atlas Copco AB, Class A | | | 1,379 | | | | 30 | | |
| Atlas Copco AB, Class B | | | 701 | | | | 13 | | |
| Boliden AB | | | 453 | | | | 7 | | |
| Electrolux AB Series B | | | 323 | | | | 5 | | |
| Hennes & Mauritz AB, Class B | | | 1,670 | | | | 54 | | |
| Hexagon AB, Class B | | | 400 | | | | 6 | | |
| Husqvarna AB, Class B | | | 622 | | | | 3 | | |
| Investor AB, Class B | | | 738 | | | | 14 | | |
| Kinnevik Investment AB | | | 188 | | | | 4 | | |
| Millicom International Cellular SA SDR | | | 134 | | | | 13 | | |
| Nordea Bank AB | | | 5,219 | | | | 40 | | |
| Ratos AB, Class B | | | 310 | | | | 4 | | |
| Sandvik AB | | | 2,004 | | | | 25 | | |
| Scania AB, Class B | | | 537 | | | | 8 | | |
| Skandinaviska Enskilda Banken AB | | | 3,850 | | | | 22 | | |
| Skanska AB, Class B | | | 408 | | | | 7 | | |
| SKF AB, Class B | | | 610 | | | | 13 | | |
| Svenska Cellulosa AB, Class B | | | 978 | | | | 14 | | |
| Svenska Handelsbanken AB, Class A | | | 1,267 | | | | 33 | | |
| Swedbank AB, Class A | | | 878 | | | | 11 | | |
| Swedish Match AB | | | 725 | | | | 26 | | |
| Tele2 AB, Class B | | | 560 | | | | 11 | | |
| Telefonaktiebolaget LM Ericsson, Class B | | | 5,064 | | | | 52 | | |
| TeliaSonera AB | | | 7,441 | | | | 50 | | |
| Volvo AB, Class B | | | 2,789 | | | | 30 | | |
| | | | 523 | | |
| Switzerland (1.7%) | |
| ABB Ltd. (Registered) (e) | | | 3,378 | | | | 64 | | |
| Actelion Ltd. (e) | | | 305 | | | | 10 | | |
| Adecco SA (Registered) (e) | | | 317 | | | | 13 | | |
| Baloise-Holding AG (Registered) | | | 121 | | | | 8 | | |
| Cie Financiere Richemont SA | | | 644 | | | | 33 | | |
| Credit Suisse Group AG (Registered) (e) | | | 1,645 | | | | 39 | | |
| GAM Holding AG (e) | | | 420 | | | | 5 | | |
| Geberit AG (Registered) (e) | | | 101 | | | | 19 | | |
| Givaudan SA (Registered) (e) | | | 16 | | | | 15 | | |
| Holcim Ltd. (Registered) (e) | | | 297 | | | | 16 | | |
| Julius Baer Group Ltd. (e) | | | 322 | | | | 13 | | |
| Kuehne & Nagel International AG (Registered) | | | 95 | | | | 11 | | |
| Lonza Group AG (Registered) (e) | | | 151 | | | | 9 | | |
| Nestle SA (Registered) | | | 4,211 | | | | 242 | | |
| Novartis AG (Registered) | | | 1,619 | | | | 92 | | |
| | | Shares | | Value
(000) | |
| Roche Holding AG (Genusschein) | | | 1,507 | | | $ | 255 | | |
| Schindler Holding AG | | | 108 | | | | 13 | | |
| SGS SA (Registered) | | | 15 | | | | 25 | | |
| Sonova Holding AG (Registered) (e) | | | 159 | | | | 17 | | |
| Swatch Group AG (The) | | | 43 | | | | 16 | | |
| Swiss Life Holding AG (Registered) (e) | | | 49 | | | | 4 | | |
| Swiss Re AG (e) | | | 187 | | | | 9 | | |
| Syngenta AG (Registered) (e) | | | 170 | | | | 50 | | |
| Synthes, Inc. (Registered) (c) | | | 84 | | | | 14 | | |
| UBS AG (Registered) (e) | | | 5,035 | | | | 60 | | |
| Zurich Financial Services AG (e) | | | 273 | | | | 62 | | |
| | | | 1,114 | | |
| United Kingdom (4.3%) | |
| 3i Group PLC | | | 1,738 | | | | 5 | | |
| Admiral Group PLC | | | 480 | | | | 6 | | |
| AMEC PLC | | | 582 | | | | 8 | | |
| Anglo American PLC | | | 1,690 | | | | 62 | | |
| ARM Holdings PLC | | | 3,157 | | | | 29 | | |
| AstraZeneca PLC | | | 1,076 | | | | 50 | | |
| Aviva PLC | | | 5,013 | | | | 23 | | |
| BAE Systems PLC | | | 6,470 | | | | 29 | | |
| Barclays PLC | | | 25,136 | | | | 69 | | |
| BG Group PLC | | | 4,215 | | | | 90 | | |
| BHP Billiton PLC | | | 3,050 | | | | 89 | | |
| BP PLC | | | 16,271 | | | | 116 | | |
| British American Tobacco PLC | | | 2,537 | | | | 120 | | |
| British Land Co., PLC REIT | | | 1,752 | | | | 13 | | |
| British Sky Broadcasting Group PLC | | | 2,612 | | | | 30 | | |
| BT Group PLC | | | 17,422 | | | | 52 | | |
| Burberry Group PLC | | | 568 | | | | 10 | | |
| Capita Group PLC (The) | | | 1,466 | | | | 14 | | |
| Capital Shopping Centres Group PLC REIT | | | 1,090 | | | | 5 | | |
| Centrica PLC | | | 8,109 | | | | 36 | | |
| Compass Group PLC | | | 3,720 | | | | 35 | | |
| Diageo PLC | | | 3,376 | | | | 74 | | |
| Experian PLC | | | 2,008 | | | | 27 | | |
| G4S PLC | | | 4,668 | | | | 20 | | |
| GlaxoSmithKline PLC | | | 3,788 | | | | 87 | | |
| Hammerson PLC REIT | | | 1,386 | | | | 8 | | |
| HSBC Holdings PLC | | | 11,047 | | | | 84 | | |
| ICAP PLC | | | 838 | | | | 5 | | |
| Imperial Tobacco Group PLC | | | 1,426 | | | | 54 | | |
| Inmarsat PLC | | | 301 | | | | 2 | | |
| International Power PLC | | | 2,772 | | | | 15 | | |
| Investec PLC | | | 1,018 | | | | 5 | | |
| Johnson Matthey PLC | | | 352 | | | | 10 | | |
| Land Securities Group PLC REIT | | | 1,495 | | | | 15 | | |
| Legal & General Group PLC | | | 8,309 | | | | 13 | | |
| Lloyds Banking Group PLC (e) | | | 34,284 | | | | 14 | | |
| Man Group PLC | | | 2,954 | | | | 6 | | |
| Marks & Spencer Group PLC | | | 1,874 | | | | 9 | | |
| National Grid PLC | | | 4,893 | | | | 48 | | |
| Next PLC | | | 430 | | | | 18 | | |
The accompanying notes are an integral part of the financial statements.
14
The Universal Institutional Funds, Inc.
Annual Report – December 31, 2011
Portfolio of Investments (cont'd)
Global Tactical Asset Allocation Portfolio
| | | Shares | | Value
(000) | |
| United Kingdom (cont'd) | |
| Old Mutual PLC | | | 7,779 | | | $ | 16 | | |
| Petrofac Ltd. | | | 509 | | | | 11 | | |
| Prudential PLC | | | 4,785 | | | | 47 | | |
| Randgold Resources Ltd. | | | 113 | | | | 12 | | |
| Reckitt Benckiser Group PLC | | | 1,043 | | | | 52 | | |
| Reed Elsevier PLC | | | 2,457 | | | | 20 | | |
| Resolution Ltd. | | | 2,787 | | | | 11 | | |
| Rexam PLC | | | 1,501 | | | | 8 | | |
| Rio Tinto PLC | | | 1,931 | | | | 94 | | |
| Rolls-Royce Holdings PLC (e) | | | 4,685 | | | | 54 | | |
| Royal Bank of Scotland Group PLC (e) | | | 42,301 | | | | 13 | | |
| Royal Dutch Shell PLC, Class A | | | 4,232 | | | | 156 | | |
| Royal Dutch Shell PLC, Class B | | | 3,390 | | | | 129 | | |
| RSA Insurance Group PLC | | | 6,889 | | | | 11 | | |
| Schroders PLC | | | 174 | | | | 4 | | |
| Segro PLC REIT | | | 1,460 | | | | 5 | | |
| Severn Trent PLC | | | 378 | | | | 9 | | |
| Shire PLC | | | 1,488 | | | | 52 | | |
| Smith & Nephew PLC | | | 2,021 | | | | 20 | | |
| Smiths Group PLC | | | 786 | | | | 11 | | |
| SSE PLC | | | 1,494 | | | | 30 | | |
| Standard Chartered PLC | | | 1,916 | | | | 42 | | |
| Standard Life PLC | | | 3,659 | | | | 12 | | |
| Tesco PLC | | | 9,275 | | | | 58 | | |
| Tullow Oil PLC | | | 1,414 | | | | 31 | | |
| Unilever PLC | | | 1,769 | | | | 59 | | |
| United Utilities Group PLC | | | 1,153 | | | | 11 | | |
| Vodafone Group PLC | | | 89,770 | | | | 249 | | |
| Weir Group PLC (The) | | | 345 | | | | 11 | | |
| WM Morrison Supermarkets PLC | | | 3,846 | | | | 19 | | |
| Wolseley PLC | | | 454 | | | | 15 | | |
| WPP PLC | | | 4,667 | | | | 49 | | |
| Xstrata PLC | | | 3,372 | | | | 51 | | |
| | | | 2,777 | | |
| United States (19.3%) | |
| 3M Co. | | | 17 | | | | 1 | | |
| Abbott Laboratories (d) | | | 3,270 | | | | 184 | | |
| Accenture PLC, Class A | | | 383 | | | | 20 | | |
| Adobe Systems, Inc. (d)(e) | | | 458 | | | | 13 | | |
| AES Corp. (The) (e) | | | 320 | | | | 4 | | |
| Aetna, Inc. (d) | | | 133 | | | | 6 | | |
| Agilent Technologies, Inc. (e) | | | 201 | | | | 7 | | |
| Alexion Pharmaceuticals, Inc. (e) | | | 110 | | | | 8 | | |
| Allergan, Inc. (d) | | | 577 | | | | 51 | | |
| Alliant Techsystems, Inc. (d) | | | 1,054 | | | | 60 | | |
| Alpha Natural Resources, Inc. (d)(e) | | | 123 | | | | 3 | | |
| Altera Corp. | | | 191 | | | | 7 | | |
| Altria Group, Inc. (d) | | | 340 | | | | 10 | | |
| Amazon.com, Inc. (e) | | | 132 | | | | 23 | | |
| Ameren Corp. | | | 194 | | | | 6 | | |
| American Electric Power Co., Inc. | | | 366 | | | | 15 | | |
| American Express Co. (d) | | | 617 | | | | 29 | | |
| | | Shares | | Value
(000) | |
| American Tower Corp., Class A | | | 419 | | | $ | 25 | | |
| Ameriprise Financial, Inc. (d) | | | 200 | | | | 10 | | |
| AmerisourceBergen Corp. (d) | | | 167 | | | | 6 | | |
| Amgen, Inc. | | | 957 | | | | 61 | | |
| Amphenol Corp., Class A | | | 282 | | | | 13 | | |
| Anadarko Petroleum Corp. | | | 2,375 | | | | 181 | | |
| Analog Devices, Inc. (d) | | | 176 | | | | 6 | | |
| Annaly Capital Management, Inc. REIT (d) | | | 618 | | | | 10 | | |
| Apache Corp. | | | 114 | | | | 10 | | |
| Apple, Inc. (e) | | | 420 | | | | 170 | | |
| Arrow Electronics, Inc. (d)(e) | | | 2,884 | | | | 108 | | |
| Assurant, Inc. | | | 2,143 | | | | 88 | | |
| AT&T, Inc. (d) | | | 1,746 | | | | 53 | | |
| Automatic Data Processing, Inc. | | | 146 | | | | 8 | | |
| Avery Dennison Corp. (d) | | | 126 | | | | 4 | | |
| Baker Hughes, Inc. | | | 510 | | | | 25 | | |
| Bank of America Corp. | | | 6,132 | | | | 34 | | |
| Bank of New York Mellon Corp. (The) | | | 863 | | | | 17 | | |
| Baxter International, Inc. | | | 179 | | | | 9 | | |
| BB&T Corp. (d) | | | 846 | | | | 21 | | |
| Becton Dickinson and Co. (d) | | | 122 | | | | 9 | | |
| Bed Bath & Beyond, Inc. (d)(e) | | | 136 | | | | 8 | | |
| Biogen Idec, Inc. (e) | | | 265 | | | | 29 | | |
| BlackRock, Inc. | | | 74 | | | | 13 | | |
| Boeing Co. (The) | | | 18 | | | | 1 | | |
| BorgWarner, Inc. (d)(e) | | | 1,443 | | | | 92 | | |
| Boston Properties, Inc. REIT (d) | | | 79 | | | | 8 | | |
| Boston Scientific Corp. (d)(e) | | | 780 | | | | 4 | | |
| Bristol-Myers Squibb Co. (d) | | | 6,757 | | | | 238 | | |
| Broadcom Corp., Class A (e) | | | 209 | | | | 6 | | |
| C.H. Robinson Worldwide, Inc. (d) | | | 104 | | | | 7 | | |
| Cablevision Systems Corp. | | | 334 | | | | 5 | | |
| Cameron International Corp. (d)(e) | | | 206 | | | | 10 | | |
| Capital One Financial Corp. (d) | | | 200 | | | | 8 | | |
| Cardinal Health, Inc. | | | 182 | | | | 7 | | |
| CareFusion Corp. (d)(e) | | | 238 | | | | 6 | | |
| Carnival Corp. (d) | | | 1 | | | | — | @ | |
| Caterpillar, Inc. (d) | | | 19 | | | | 2 | | |
| CBS Corp., Class B | | | 586 | | | | 16 | | |
| Celgene Corp. (d)(e) | | | 251 | | | | 17 | | |
| CenterPoint Energy, Inc. | | | 193 | | | | 4 | | |
| CenturyLink, Inc. | | | 2,737 | | | | 102 | | |
| Cerner Corp. (e) | | | 133 | | | | 8 | | |
| CF Industries Holdings, Inc. | | | 571 | | | | 83 | | |
| Charles Schwab Corp. (The) (d) | | | 1,306 | | | | 15 | | |
| Chesapeake Energy Corp. (d) | | | 3,409 | | | | 76 | | |
| Chevron Corp. | | | 1,909 | | | | 203 | | |
| Chipotle Mexican Grill, Inc. (d)(e) | | | 20 | | | | 7 | | |
| Chubb Corp. (The) | | | 2,551 | | | | 177 | | |
| CIGNA Corp. (e) | | | 12,304 | | | | 149 | | |
| CIGNA Corp. | | | 137 | | | | 6 | | |
| Cintas Corp. | | | 184 | | | | 6 | | |
| Cisco Systems, Inc. | | | 2,478 | | | | 45 | | |
The accompanying notes are an integral part of the financial statements.
15
The Universal Institutional Funds, Inc.
Annual Report – December 31, 2011
Portfolio of Investments (cont'd)
Global Tactical Asset Allocation Portfolio
| | | Shares | | Value
(000) | |
| United States (cont'd) | |
| CIT Group, Inc. (e) | | | 162 | | | $ | 6 | | |
| Citigroup, Inc. (See Note H) (d) | | | 1,761 | | | | 46 | | |
| Citrix Systems, Inc. (e) | | | 107 | | | | 6 | | |
| Cliffs Natural Resources, Inc. (d) | | | 9 | | | | 1 | | |
| CME Group, Inc. | | | 39 | | | | 10 | | |
| Coach, Inc. | | | 151 | | | | 9 | | |
| Coca-Cola Co. (The) | | | 633 | | | | 44 | | |
| Coca-Cola Enterprises, Inc. | | | 219 | | | | 6 | | |
| Cognizant Technology Solutions Corp., Class A (e) | | | 222 | | | | 14 | | |
| Colgate-Palmolive Co. | | | 806 | | | | 74 | | |
| Comcast Corp., Class A (d) | | | 474 | | | | 11 | | |
| Comcast Corp., Special Class A (d) | | | 442 | | | | 10 | | |
| Comerica, Inc. (d) | | | 100 | | | | 3 | | |
| ConAgra Foods, Inc. | | | 5,399 | | | | 143 | | |
| Concho Resources, Inc. (d)(e) | | | 54 | | | | 5 | | |
| ConocoPhillips (d) | | | 2,518 | | | | 183 | | |
| Consol Energy, Inc. | | | 147 | | | | 5 | | |
| Consolidated Edison, Inc. (d) | | | 148 | | | | 9 | | |
| Constellation Energy Group, Inc. | | | 140 | | | | 6 | | |
| Costco Wholesale Corp. (d) | | | 444 | | | | 37 | | |
| Coventry Health Care, Inc. (d)(e) | | | 4,066 | | | | 123 | | |
| Covidien PLC | | | 206 | | | | 9 | | |
| CR Bard, Inc. (d) | | | 55 | | | | 5 | | |
| Crown Castle International Corp. (d)(e) | | | 557 | | | | 25 | | |
| CSX Corp. | | | 455 | | | | 10 | | |
| Cummins, Inc. (d) | | | 5 | | | | — | @ | |
| CVS Caremark Corp. | | | 323 | | | | 13 | | |
| Danaher Corp. (d) | | | 19 | | | | 1 | | |
| DaVita, Inc. (d)(e) | | | 95 | | | | 7 | | |
| Deere & Co. (d) | | | 13 | | | | 1 | | |
| Dell, Inc. (e) | | | 769 | | | | 11 | | |
| Deltic Timber Corp. (d) | | | 96 | | | | 6 | | |
| Devon Energy Corp. | | | 168 | | | | 10 | | |
| DIRECTV, Class A (e) | | | 546 | | | | 23 | | |
| Discover Financial Services | | | 342 | | | | 8 | | |
| Discovery Communications, Inc. (d)(e) | | | 342 | | | | 14 | | |
| Discovery Communications, Inc., Class C (e) | | | 342 | | | | 13 | | |
| Dominion Resources, Inc. | | | 167 | | | | 9 | | |
| D.R. Horton, Inc. (d) | | | 9,076 | | | | 114 | | |
| DTE Energy Co. | | | 122 | | | | 7 | | |
| Duke Energy Corp. (d) | | | 346 | | | | 8 | | |
| Dun & Bradstreet Corp. (The) (d) | | | 72 | | | | 5 | | |
| Eagle Materials, Inc. (d) | | | 343 | | | | 9 | | |
| Eaton Corp. | | | 16 | | | | 1 | | |
| eBay, Inc. (e) | | | 560 | | | | 17 | | |
| Ecolab, Inc. | | | 17 | | | | 1 | | |
| Edison International (d) | | | 264 | | | | 11 | | |
| Edwards Lifesciences Corp. (d)(e) | | | 73 | | | | 5 | | |
| EI du Pont de Nemours & Co. | | | 2,750 | | | | 126 | | |
| El Paso Corp. | | | 841 | | | | 22 | | |
| Eli Lilly & Co. (d) | | | 356 | | | | 15 | | |
| EMC Corp. (e) | | | 1,059 | | | | 23 | | |
| | | Shares | | Value
(000) | |
| Emerson Electric Co. | | | 20 | | | $ | 1 | | |
| Entergy Corp. | | | 123 | | | | 9 | | |
| EOG Resources, Inc. (d) | | | 292 | | | | 29 | | |
| Equity Residential REIT | | | 159 | | | | 9 | | |
| Estee Lauder Cos., Inc. (The), Class A (d) | | | 137 | | | | 15 | | |
| Exelon Corp. (d) | | | 250 | | | | 11 | | |
| Express Scripts, Inc. (d)(e) | | | 171 | | | | 8 | | |
| Exxon Mobil Corp. (d) | | | 2,908 | | | | 246 | | |
| Fastenal Co. (d) | | | 8 | | | | — | @ | |
| FedEx Corp. (d) | | | 150 | | | | 13 | | |
| Fidelity National Financial, Inc. (d) | | | 4,813 | | | | 77 | | |
| Fifth Third Bancorp (d) | | | 1,002 | | | | 13 | | |
| FirstEnergy Corp. | | | 236 | | | | 10 | | |
| Fluor Corp. | | | 24 | | | | 1 | | |
| FMC Technologies, Inc. (d)(e) | | | 211 | | | | 11 | | |
| Ford Motor Co. (d)(e) | | | 1,157 | | | | 12 | | |
| Forest Laboratories, Inc. (d)(e) | | | 702 | | | | 21 | | |
| Foster Wheeler AG (d)(e) | | | 3,073 | | | | 59 | | |
| Franklin Resources, Inc. (d) | | | 83 | | | | 8 | | |
| Frontier Communications Corp. (d) | | | 743 | | | | 4 | | |
| Gap, Inc. (The) (d) | | | 7,594 | | | | 141 | | |
| General Dynamics Corp. (d) | | | 39 | | | | 3 | | |
| General Electric Co. | | | 8,169 | | | | 146 | | |
| General Growth Properties, Inc. REIT (d) | | | 702 | | | | 11 | | |
| General Mills, Inc. (d) | | | 603 | | | | 24 | | |
| Georgia Gulf Corp. (d)(e) | | | 258 | | | | 5 | | |
| Gilead Sciences, Inc. (d)(e) | | | 512 | | | | 21 | | |
| Goldman Sachs Group, Inc. (The) | | | 302 | | | | 27 | | |
| Goodrich Corp. (d) | | | 3 | | | | — | @ | |
| Google, Inc., Class A (e) | | | 179 | | | | 116 | | |
| H.J. Heinz Co. (d) | | | 139 | | | | 8 | | |
| Halliburton Co. | | | 895 | | | | 31 | | |
| HCP, Inc. REIT | | | 219 | | | | 9 | | |
| Health Care, Inc. REIT | | | 159 | | | | 9 | | |
| HealthSouth Corp. (d)(e) | | | 6,100 | | | | 108 | | |
| Henry Schein, Inc. (d)(e) | | | 74 | | | | 5 | | |
| Hershey Co. (The) (d) | | | 74 | | | | 5 | | |
| Hess Corp. | | | 1,587 | | | | 90 | | |
| Hewlett-Packard Co. | | | 2,993 | | | | 77 | | |
| Home Depot, Inc. (d) | | | 4,138 | | | | 174 | | |
| Honeywell International, Inc. | | �� | 24 | | | | 1 | | |
| Hospira, Inc. (d)(e) | | | 350 | | | | 11 | | |
| Hudson City Bancorp, Inc. (d) | | | 200 | | | | 1 | | |
| Human Genome Sciences, Inc. (d)(e) | | | 641 | | | | 5 | | |
| Humana, Inc. | | | 59 | | | | 5 | | |
| Illinois Tool Works, Inc. (d) | | | 2,521 | | | | 118 | | |
| Integrys Energy Group, Inc. (d) | | | 2,486 | | | | 135 | | |
| Intel Corp. | | | 5,188 | | | | 126 | | |
| IntercontinentalExchange, Inc. (e) | | | 57 | | | | 7 | | |
| International Business Machines Corp. (d) | | | 1,333 | | | | 245 | | |
| Interpublic Group of Cos., Inc. (The) (d) | | | 759 | | | | 7 | | |
| Intuit, Inc. | | | 243 | | | | 13 | | |
| Intuitive Surgical, Inc. (e) | | | 21 | | | | 10 | | |
The accompanying notes are an integral part of the financial statements.
16
The Universal Institutional Funds, Inc.
Annual Report – December 31, 2011
Portfolio of Investments (cont'd)
Global Tactical Asset Allocation Portfolio
| | | Shares | | Value
(000) | |
| United States (cont'd) | |
| Invesco Ltd. | | | 415 | | | $ | 8 | | |
| Iron Mountain, Inc. (d) | | | 257 | | | | 8 | | |
| Johnson & Johnson (d) | | | 346 | | | | 23 | | |
| Johnson Controls, Inc. | | | 4,113 | | | | 129 | | |
| Joy Global, Inc. (d) | | | 24 | | | | 2 | | |
| JPMorgan Chase & Co. | | | 5,950 | | | | 198 | | |
| Juniper Networks, Inc. (d)(e) | | | 620 | | | | 13 | | |
| KB Home (d) | | | 1,937 | | | | 13 | | |
| Kellogg Co. (d) | | | 341 | | | | 17 | | |
| KeyCorp | | | 669 | | | | 5 | | |
| Kimco Realty Corp. REIT (d) | | | 402 | | | | 7 | | |
| Kohl's Corp. | | | 131 | | | | 6 | | |
| Kraft Foods, Inc., Class A | | | 252 | | | | 9 | | |
| Kroger Co. (The) (d) | | | 610 | | | | 15 | | |
| Laboratory Corp. of America Holdings (e) | | | 77 | | | | 7 | | |
| Las Vegas Sands Corp. (e) | | | 173 | | | | 7 | | |
| Lennar Corp., Class A (d) | | | 5,153 | | | | 101 | | |
| Li & Fung Ltd. (d)(h) | | | 16,000 | | | | 30 | | |
| Liberty Global, Inc. Series A (d)(e) | | | 217 | | | | 9 | | |
| Liberty Global, Inc. Series C (d)(e) | | | 242 | | | | 10 | | |
| Liberty Property Trust REIT (d) | | | 261 | | | | 8 | | |
| Life Technologies Corp. (e) | | | 158 | | | | 6 | | |
| Lincoln National Corp. (d) | | | 2,656 | | | | 52 | | |
| Lockheed Martin Corp. (d) | | | 8 | | | | 1 | | |
| Louisiana-Pacific Corp. (d)(e) | | | 1,037 | | | | 8 | | |
| Lowe's Cos., Inc. | | | 501 | | | | 13 | | |
| Ltd. Brands, Inc. (d) | | | 165 | | | | 7 | | |
| M&T Bank Corp. (d) | | | 90 | | | | 7 | | |
| M/I Homes, Inc. (d)(e) | | | 489 | | | | 5 | | |
| Macerich Co. (The) REIT | | | 159 | | | | 8 | | |
| Manpower, Inc. (d) | | | 117 | | | | 4 | | |
| Marathon Oil Corp. (d) | | | 283 | | | | 8 | | |
| Marathon Petroleum Corp. | | | 250 | | | | 8 | | |
| Marriott International, Inc., Class A (d) | | | 1 | | | | — | @ | |
| Masco Corp. (d) | | | 2,707 | | | | 28 | | |
| Mastercard, Inc., Class A (d) | | | 136 | | | | 51 | | |
| McDonald's Corp. | | | 1,968 | | | | 197 | | |
| McGraw-Hill Cos., Inc. (The) | | | 288 | | | | 13 | | |
| McKesson Corp. | | | 131 | | | | 10 | | |
| MDC Holdings, Inc. (d) | | | 1,175 | | | | 21 | | |
| Mead Johnson Nutrition Co. | | | 217 | | | | 15 | | |
| MeadWestvaco Corp. (d) | | | 3,393 | | | | 102 | | |
| Medco Health Solutions, Inc. (e) | | | 123 | | | | 7 | | |
| Medtronic, Inc. (d) | | | 312 | | | | 12 | | |
| Merck & Co., Inc. | | | 251 | | | | 9 | | |
| Meritage Homes Corp. (d)(e) | | | 826 | | | | 19 | | |
| Microsoft Corp. | | | 8,054 | | | | 209 | | |
| Mohawk Industries, Inc. (e) | | | 525 | | | | 31 | | |
| Molycorp, Inc. (d)(e) | | | 1,497 | | | | 36 | | |
| Monsanto Co. | | | 28 | | | | 2 | | |
| Mosaic Co. (The) | | | 15 | | | | 1 | | |
| Motorola Mobility Holdings, Inc. (e) | | | 420 | | | | 16 | | |
| | | Shares | | Value
(000) | |
| Murphy Oil Corp. | | | 148 | | | $ | 8 | | |
| NASDAQ OMX Group, Inc. (The) (e) | | | 200 | | | | 5 | | |
| National Oilwell Varco, Inc. (d) | | | 338 | | | | 23 | | |
| NetApp, Inc. (d)(e) | | | 478 | | | | 17 | | |
| New York Community Bancorp, Inc. (d) | | | 200 | | | | 2 | | |
| Newfield Exploration Co. (d)(e) | | | 157 | | | | 6 | | |
| Newmont Mining Corp. | | | 26 | | | | 2 | | |
| News Corp., Class A | | | 926 | | | | 17 | | |
| News Corp., Class B (d) | | | 551 | | | | 10 | | |
| NextEra Energy, Inc. | | | 140 | | | | 9 | | |
| NII Holdings, Inc. (e) | | | 112 | | | | 2 | | |
| NIKE, Inc., Class B | | | 200 | | | | 19 | | |
| Noble Corp. (e) | | | 200 | | | | 6 | | |
| Noble Energy, Inc. | | | 89 | | | | 8 | | |
| Nordstrom, Inc. | | | 62 | | | | 3 | | |
| Norfolk Southern Corp. (d) | | | 2,317 | | | | 169 | | |
| Northrop Grumman Corp. (d) | | | 10 | | | | 1 | | |
| NRG Energy, Inc. (d)(e) | | | 3,123 | | | | 57 | | |
| NVR, Inc. (d)(e) | | | 140 | | | | 96 | | |
| O'Reilly Automotive, Inc. (d)(e) | | | 114 | | | | 9 | | |
| Occidental Petroleum Corp. | | | 750 | | | | 70 | | |
| Omnicare, Inc. (d) | | | 3,743 | | | | 129 | | |
| Omnicom Group, Inc. (d) | | | 220 | | | | 10 | | |
| Oneok, Inc. (d) | | | 122 | | | | 11 | | |
| Oracle Corp. | | | 1,754 | | | | 45 | | |
| Owens Corning (d)(e) | | | 914 | | | | 26 | | |
| PACCAR, Inc. (d) | | | 12 | | | | — | @ | |
| PartnerRe Ltd. | | | 1,047 | | | | 67 | | |
| Peabody Energy Corp. | | | 341 | | | | 11 | | |
| People's United Financial, Inc. (d) | | | 100 | | | | 1 | | |
| PepsiCo, Inc. | | | 677 | | | | 45 | | |
| Pfizer, Inc. | | | 966 | | | | 21 | | |
| PG&E Corp. (d) | | | 262 | | | | 11 | | |
| Philip Morris International, Inc. | | | 2,720 | | | | 213 | | |
| Pioneer Natural Resources Co. (d) | | | 131 | | | | 12 | | |
| Pitney Bowes, Inc. (d) | | | 267 | | | | 5 | | |
| Plum Creek Timber Co., Inc. REIT (d) | | | 261 | | | | 10 | | |
| PNC Financial Services Group, Inc. (d) | | | 354 | | | | 20 | | |
| PPL Corp. | | | 276 | | | | 8 | | |
| Praxair, Inc. | | | 15 | | | | 2 | | |
| Precision Castparts Corp. | | | 3 | | | | — | @ | |
| Priceline.com, Inc. (d)(e) | | | 24 | | | | 11 | | |
| Principal Financial Group, Inc. (d) | | | 2,482 | | | | 61 | | |
| Procter & Gamble Co. (The) | | | 2,512 | | | | 168 | | |
| Progress Energy, Inc. | | | 72 | | | | 4 | | |
| ProLogis, Inc. REIT | | | 118 | | | | 3 | | |
| Public Service Enterprise Group, Inc. (d) | | | 325 | | | | 11 | | |
| Public Storage REIT | | | 75 | | | | 10 | | |
| Pulte Group, Inc. (d)(e) | | | 10,761 | | | | 68 | | |
| Qualcomm, Inc. | | | 818 | | | | 45 | | |
| Quest Diagnostics, Inc. (d) | | | 115 | | | | 7 | | |
| Range Resources Corp. (d) | | | 65 | | | | 4 | | |
| Rayonier, Inc. REIT (d) | | | 270 | | | | 12 | | |
The accompanying notes are an integral part of the financial statements.
17
The Universal Institutional Funds, Inc.
Annual Report – December 31, 2011
Portfolio of Investments (cont'd)
Global Tactical Asset Allocation Portfolio
| | | Shares | | Value
(000) | |
| United States (cont'd) | |
| Raytheon Co. (d) | | | 3,022 | | | $ | 146 | | |
| Red Hat, Inc. (d)(e) | | | 2,519 | | | | 104 | | |
| Regions Financial Corp. | | | 913 | | | | 4 | | |
| Republic Services, Inc. | | | 288 | | | | 8 | | |
| Reynolds American, Inc. (d) | | | 2,982 | | | | 124 | | |
| Robert Half International, Inc. (d) | | | 200 | | | | 6 | | |
| Rockwell Automation, Inc. (d) | | | 5 | | | | — | @ | |
| Ross Stores, Inc. | | | 148 | | | | 7 | | |
| Royal Caribbean Cruises Ltd. (d) | | | 1 | | | | — | @ | |
| Ryland Group, Inc. (The) (d) | | | 1,066 | | | | 17 | | |
| Safeway, Inc. (d) | | | 4,503 | | | | 95 | | |
| Salesforce.com, Inc. (d)(e) | | | 56 | | | | 6 | | |
| SanDisk Corp. (e) | | | 2,826 | | | | 139 | | |
| Schlumberger Ltd. (d) | | | 889 | | | | 61 | | |
| Scripps Networks Interactive, Inc., Class A (d) | | | 171 | | | | 7 | | |
| Sempra Energy (d) | | | 156 | | | | 9 | | |
| Simon Property Group, Inc. REIT (d) | | | 214 | | | | 28 | | |
| Skyline Corp. (d) | | | 50 | | | | — | @ | |
| Smithfield Foods, Inc. (d)(e) | | | 5,491 | | | | 133 | | |
| Southern Co. (d) | | | 323 | | | | 15 | | |
| Southwestern Energy Co. (e) | | | 326 | | | | 10 | | |
| Spectra Energy Corp. | | | 383 | | | | 12 | | |
| Sprint Nextel Corp. (d)(e) | | | 1,847 | | | | 4 | | |
| St. Jude Medical, Inc. | | | 162 | | | | 6 | | |
| Standard Pacific Corp. (d)(e) | | | 8,473 | | | | 27 | | |
| Staples, Inc. | | | 350 | | | | 5 | | |
| Starbucks Corp. | | | 239 | | | | 11 | | |
| State Street Corp. (d) | | | 315 | | | | 13 | | |
| Steel Dynamics, Inc. (d) | | | 8,113 | | | | 107 | | |
| Stericycle, Inc. (d)(e) | | | 117 | | | | 9 | | |
| Stryker Corp. (d) | | | 143 | | | | 7 | | |
| SunTrust Banks, Inc. | | | 305 | | | | 5 | | |
| Symantec Corp. (e) | | | 340 | | | | 5 | | |
| Sysco Corp. (d) | | | 558 | | | | 16 | | |
| T. Rowe Price Group, Inc. (d) | | | 221 | | | | 13 | | |
| Target Corp. | | | 173 | | | | 9 | | |
| TE Connectivity Ltd. | | | 183 | | | | 6 | | |
| Tenaris SA (d) | | | 830 | | | | 15 | | |
| Texas Instruments, Inc. | | | 392 | | | | 11 | | |
| Thermo Fisher Scientific, Inc. (e) | | | 583 | | | | 26 | | |
| Time Warner Cable, Inc. | | | 164 | | | | 10 | | |
| Time Warner, Inc. (d) | | | 4,546 | | | | 164 | | |
| TJX Cos., Inc. | | | 187 | | | | 12 | | |
| Toll Brothers, Inc. (d)(e) | | | 9,705 | | | | 198 | | |
| Tyco International Ltd. (d) | | | 3,299 | | | | 154 | | |
| Ultra Petroleum Corp. (d)(e) | | | 135 | | | | 4 | | |
| Union Pacific Corp. (d) | | | 218 | | | | 23 | | |
| United Parcel Service, Inc., Class B (d) | | | 225 | | | | 16 | | |
| United Technologies Corp. | | | 26 | | | | 2 | | |
| UnitedHealth Group, Inc. | | | 136 | | | | 7 | | |
| Universal Forest Products, Inc. (d) | | | 149 | | | | 5 | | |
| Universal Health Services, Inc., Class B | | | 2,500 | | | | 97 | | |
| | | Shares | | Value
(000) | |
| Unum Group | | | 4,049 | | | $ | 85 | | |
| URS Corp. (e) | | | 2,906 | | | | 102 | | |
| US Bancorp | | | 809 | | | | 22 | | |
| Valero Energy Corp. | | | 363 | | | | 8 | | |
| Varian Medical Systems, Inc. (d)(e) | | | 119 | | | | 8 | | |
| Ventas, Inc. REIT (d) | | | 159 | | | | 9 | | |
| Verisk Analytics, Inc., Class A (e) | | | 176 | | | | 7 | | |
| Verizon Communications, Inc. (d) | | | 4,891 | | | | 196 | | |
| Vertex Pharmaceuticals, Inc. (e) | | | 300 | | | | 10 | | |
| VF Corp. | | | 1,054 | | | | 134 | | |
| Viacom, Inc., Class B | | | 227 | | | | 10 | | |
| Virgin Media, Inc. | | | 242 | | | | 5 | | |
| Visa, Inc., Class A | | | 237 | | | | 24 | | |
| Vornado Realty Trust REIT | | | 59 | | | | 5 | | |
| Wal-Mart Stores, Inc. (d) | | | 1,234 | | | | 74 | | |
| Walgreen Co. (d) | | | 741 | | | | 24 | | |
| Walt Disney Co. (The) (d) | | | 281 | | | | 11 | | |
| Waste Management, Inc. (d) | | | 295 | | | | 10 | | |
| Watsco, Inc. (d) | | | 248 | | | | 16 | | |
| Watson Pharmaceuticals, Inc. (d)(e) | | | 264 | | | | 16 | | |
| Weatherford International Ltd. (e) | | | 937 | | | | 14 | | |
| WellPoint, Inc. (d) | | | 151 | | | | 10 | | |
| Wells Fargo & Co. | | | 3,025 | | | | 83 | | |
| Western Union Co. (The) (d) | | | 206 | | | | 4 | | |
| Weyerhaeuser Co. REIT (d) | | | 378 | | | | 7 | | |
| Whole Foods Market, Inc. (d) | | | 252 | | | | 18 | | |
| Williams Cos., Inc. (The) | | | 961 | | | | 32 | | |
| Wisconsin Energy Corp. (d) | | | 199 | | | | 7 | | |
| WW Grainger, Inc. | | | 2 | | | | — | @ | |
| Wynn Resorts Ltd. | | | 51 | | | | 6 | | |
| Xcel Energy, Inc. | | | 228 | | | | 6 | | |
| Xerox Corp. | | | 976 | | | | 8 | | |
| Xylem, Inc. | | | 71 | | | | 2 | | |
| Yahoo!, Inc. (d)(e) | | | 4,854 | | | | 78 | | |
| Yum! Brands, Inc. | | | 2,661 | | | | 157 | | |
| Zimmer Holdings, Inc. (e) | | | 117 | | | | 6 | | |
| | | | 12,457 | | |
| Total Common Stocks (Cost $30,044) | | | 28,230 | | |
| Commodity Linked Security (4.7%) | |
| United States (4.7%) | |
Deutsche Bank AG,
Zero Coupon, 12/3/12 (Cost $3,103) (i) | | | 3,103,000 | | | | 3,064 | | |
| Investment Companies (4.9%) | |
| Russia (0.5%) | |
| Market Vectors Russia ETF (d) | | | 11,800 | | | | 314 | | |
| United States (4.4%) | |
| iShares MSCI Emerging Markets Index Fund | | | 7,100 | | | | 269 | | |
Morgan Stanley Institutional Fund, Inc. —
Emerging Markets Portfolio (See Note H) | | | 105,470 | | | | 2,292 | | |
| Technology Select Sector SPDR Fund (d) | | | 12,200 | | | | 311 | | |
| | | | 2,872 | | |
| Total Investment Companies (Cost $3,762) | | | 3,186 | | |
The accompanying notes are an integral part of the financial statements.
18
The Universal Institutional Funds, Inc.
Annual Report – December 31, 2011
Portfolio of Investments (cont'd)
Global Tactical Asset Allocation Portfolio
| | | Shares | | Value
(000) | |
| Short-Term Investments (20.3%) | |
| Securities held as Collateral on Loaned Securities (16.0%) | |
| Investment Company (11.8%) | |
Morgan Stanley Institutional Liquidity
Funds — Money Market Portfolio —
Institutional Class (See Note H) | | | 7,614,427 | | | $ | 7,614 | | |
| | | Face Amount
(000) | | | |
| Repurchase Agreements (4.2%) | |
Barclays Capital, Inc., (0.02%, dated
12/30/11, due 1/3/12; proceeds
$327; fully collateralized by a
U.S. Government Obligation; U.S.
Treasury Bond 4.50% due 5/15/38;
valued at $334) | | $ | 327 | | | | 327 | | |
Merrill Lynch & Co., Inc., (0.07%,
dated 12/30/11, due 1/3/12;
proceeds $2,429; fully collateralized
by a U.S. Government Agency;
Government National Mortgage
Association 3.50% due 11/20/41;
valued at $2,478) | | | 2,429 | | | | 2,429 | | |
| | | | 2,756 | | |
Total Securities held as Collateral on
Loaned Securities (Cost $10,370) | | | 10,370 | | |
| | | Shares | | | |
| Investment Company (4.3%) | |
Morgan Stanley Institutional Liquidity
Funds — Money Market Portfolio —
Institutional Class (See Note H)
(Cost $2,805) | | | 2,804,776 | | | | 2,805 | | |
| Total Short-Term Investments (Cost $13,175) | | | 13,175 | | |
Total Investments (114.1%) (Cost $76,595)
Including $10,308 of Securities Loaned (j) | | | 73,868 | | |
| Liabilities in Excess of Other Assets (-14.1%) | | | (9,135 | ) | |
| Net Assets (100.0%) | | $ | 64,733 | | |
(a) Security is subject to delayed delivery.
(b) Variable/Floating Rate Security — Interest rate changes on these instruments are based on changes in a designated base rate. The rates shown are those in effect on December 31, 2011.
(c) 144A security — Certain conditions for public sale may exist. Unless otherwise noted, these securities are deemed to be liquid.
(d) All or a portion of this security was on loan at December 31, 2011.
(e) Non-income producing security.
(f) Comprised of securities in separate entities that are traded as a single stapled security.
(g) Consists of one or more classes of securities traded together as a unit; stocks with attached warrants.
(h) Security trades on the Hong Kong exchange.
(i) Security is linked to the Dow Jones UBS Commodities Index Total Return. The index is currently comprised of futures contracts on nineteen physical commodities traded on U.S. exchanges, with the exception of aluminum, nickel, and zinc, which trade on the London Metal Exchange.
(j) Securities are available for collateral in connection with securities purchased on a forward commitment basis, open foreign currency exchange contracts, futures contracts and swap agreements.
@ Value is less than $500.
CVA Certificaten Van Aandelen.
OAT Obligations Assimilables du Trésor (French Treasury Obligation).
PPS Price Protected Shares
REIT Real Estate Investment Trust.
SDR Swedish Depositary Receipt.
SPDR Standard & Poor's Depository Receipt.
TBA To Be Announced.
Foreign Currency Exchange Contracts Information:
The Portfolio had the following foreign currency exchange contracts open at period end:
| Counterparty | | Currency
to Deliver
(000) | | Value
(000) | | Settlement
Date | | In Exchange For
(000) | | Value
(000) | | Unrealized
Appreciation
(Depreciation)
(000) | |
| Bank of America NA | | MYR | 411 | | | $ | 129 | | | 1/19/12 | | USD | 130 | | | $ | 130 | | | $ | 1 | | |
| Credit Suisse | | HUF | 50,048 | | | | 205 | | | 1/19/12 | | USD | 215 | | | | 215 | | | | 10 | | |
| Deutsche Bank AG | | CNY | 4,956 | | | | 787 | | | 1/19/12 | | USD | 780 | | | | 780 | | | | (7 | ) | |
| Deutsche Bank AG | | CNY | 2,458 | | | | 390 | | | 1/19/12 | | USD | 386 | | | | 386 | | | | (4 | ) | |
| Deutsche Bank AG | | EUR | 785 | | | | 1,016 | | | 1/19/12 | | USD | 1,028 | | | | 1,028 | | | | 12 | | |
| Deutsche Bank AG | | JPY | 27,539 | | | | 358 | | | 1/19/12 | | USD | 354 | | | | 354 | | | | (4 | ) | |
| Deutsche Bank AG | | USD | 218 | | | | 218 | | | 1/19/12 | | PLN | 762 | | | | 220 | | | | 2 | | |
| Goldman Sachs International | | EUR | 265 | | | | 344 | | | 1/19/12 | | USD | 348 | | | | 348 | | | | 4 | | |
| JPMorgan Chase Bank | | CNY | 5,512 | | | | 876 | | | 1/19/12 | | USD | 865 | | | | 865 | | | | (11 | ) | |
| JPMorgan Chase Bank | | NOK | 331 | | | | 55 | | | 1/19/12 | | USD | 56 | | | | 56 | | | | 1 | | |
| JPMorgan Chase Bank | | USD | 2,033 | | | | 2,033 | | | 1/19/12 | | CNY | 12,926 | | | | 2,053 | | | | 20 | | |
The accompanying notes are an integral part of the financial statements.
19
The Universal Institutional Funds, Inc.
Annual Report – December 31, 2011
Portfolio of Investments (cont'd)
Global Tactical Asset Allocation Portfolio
Foreign Currency Exchange Contracts Information: (cont'd)
| Counterparty | | Currency
to Deliver
(000) | | Value
(000) | | Settlement
Date | | In Exchange For
(000) | | Value
(000) | | Unrealized
Appreciation
(Depreciation)
(000) | |
| Royal Bank of Scotland | | CAD | 541 | | | $ | 531 | | | 1/19/12 | | USD | 525 | | | $ | 525 | | | $ | (6 | ) | |
| Royal Bank of Scotland | | CZK | 6,444 | | | | 326 | | | 1/19/12 | | USD | 329 | | | | 329 | | | | 3 | | |
| Royal Bank of Scotland | | MXN | 2,384 | | | | 170 | | | 1/19/12 | | USD | 172 | | | | 172 | | | | 2 | | |
| Royal Bank of Scotland | | PLN | 604 | | | | 175 | | | 1/19/12 | | USD | 173 | | | | 173 | | | | (2 | ) | |
| Royal Bank of Scotland | | USD | 142 | | | | 142 | | | 1/19/12 | | ILS | 536 | | | | 141 | | | | (1 | ) | |
| State Street Bank and Trust Co. | | USD | 401 | | | | 401 | | | 1/19/12 | | TWD | 12,129 | | | | 400 | | | | (1 | ) | |
| UBS AG | | AUD | 268 | | | | 273 | | | 1/19/12 | | USD | 269 | | | | 269 | | | | (4 | ) | |
| UBS AG | | CAD | 68 | | | | 67 | | | 1/19/12 | | USD | 67 | | | | 67 | | | | — | @ | |
| UBS AG | | CLP | 80,217 | | | | 154 | | | 1/19/12 | | USD | 154 | | | | 154 | | | | (— | @) | |
| UBS AG | | DKK | 279 | | | | 49 | | | 1/19/12 | | USD | 49 | | | | 49 | | | | — | @ | |
| UBS AG | | EUR | 1,133 | | | | 1,468 | | | 1/19/12 | | USD | 1,485 | | | | 1,485 | | | | 17 | | |
| UBS AG | | EUR | 335 | | | | 433 | | | 1/19/12 | | USD | 434 | | | | 434 | | | | 1 | | |
| UBS AG | | GBP | 617 | | | | 958 | | | 1/19/12 | | USD | 958 | | | | 958 | | | | — | @ | |
| UBS AG | | GBP | 127 | | | | 196 | | | 1/19/12 | | USD | 196 | | | | 196 | | | | (— | @) | |
| UBS AG | | HKD | 5,101 | | | | 656 | | | 1/19/12 | | USD | 655 | | | | 655 | | | | (1 | ) | |
| UBS AG | | INR | 19,740 | | | | 371 | | | 1/19/12 | | USD | 375 | | | | 375 | | | | 4 | | |
| UBS AG | | JPY | 75,037 | | | | 975 | | | 1/19/12 | | USD | 965 | | | | 965 | | | | (10 | ) | |
| UBS AG | | JPY | 37,032 | | | | 482 | | | 1/19/12 | | USD | 477 | | | | 477 | | | | (5 | ) | |
| UBS AG | | USD | 715 | | | | 715 | | | 1/19/12 | | BRL | 1,306 | | | | 697 | | | | (18 | ) | |
| UBS AG | | USD | 264 | | | | 264 | | | 1/19/12 | | CAD | 272 | | | | 267 | | | | 3 | | |
| UBS AG | | USD | 80 | | | | 80 | | | 1/19/12 | | CHF | 76 | | | | 80 | | | | — | @ | |
| UBS AG | | USD | 148 | | | | 148 | | | 1/19/12 | | CHF | 138 | | | | 148 | | | | (— | @) | |
| UBS AG | | USD | 404 | | | | 404 | | | 1/19/12 | | HKD | 3,144 | | | | 405 | | | | 1 | | |
| UBS AG | | USD | 284 | | | | 284 | | | 1/19/12 | | KRW | 324,672 | | | | 282 | | | | (2 | ) | |
| UBS AG | | USD | 93 | | | | 93 | | | 1/19/12 | | MXN | 1,286 | | | | 92 | | | | (1 | ) | |
| UBS AG | | USD | 363 | | | | 363 | | | 1/19/12 | | RUB | 11,514 | | | | 357 | | | | (6 | ) | |
| UBS AG | | USD | 189 | | | | 189 | | | 1/19/12 | | SGD | 247 | | | | 190 | | | | 1 | | |
| UBS AG | | USD | 203 | | | | 203 | | | 1/19/12 | | ZAR | 1,690 | | | | 209 | | | | 6 | | |
| Goldman Sachs International | | EUR | 924 | | | | 1,196 | | | 1/20/12 | | USD | 1,237 | | | | 1,237 | | | | 41 | | |
| Goldman Sachs International | | USD | 78 | | | | 78 | | | 1/20/12 | | CAD | 79 | | | | 78 | | | | (— | @) | |
| Goldman Sachs International | | USD | 528 | | | | 528 | | | 1/20/12 | | EUR | 400 | | | | 518 | | | | (10 | ) | |
| JPMorgan Chase Bank | | CHF | 212 | | | | 226 | | | 1/20/12 | | USD | 224 | | | | 224 | | | | (2 | ) | |
| JPMorgan Chase Bank | | MXN | 3,770 | | | | 270 | | | 1/20/12 | | USD | 278 | | | | 278 | | | | 8 | | |
| JPMorgan Chase Bank | | SEK | 980 | | | | 142 | | | 1/20/12 | | USD | 145 | | | | 145 | | | | 3 | | |
| JPMorgan Chase Bank | | USD | 229 | | | | 229 | | | 1/20/12 | | CHF | 212 | | | | 226 | | | | (3 | ) | |
| JPMorgan Chase Bank | | USD | 232 | | | | 232 | | | 1/20/12 | | KRW | 262,405 | | | | 228 | | | | (4 | ) | |
| JPMorgan Chase Bank | | ZAR | 1,855 | | | | 229 | | | 1/20/12 | | USD | 229 | | | | 229 | | | | (— | @) | |
| UBS AG | | AUD | 90 | | | | 91 | | | 1/20/12 | | USD | 91 | | | | 91 | | | | (— | @) | |
| UBS AG | | GBP | 30 | | | | 47 | | | 1/20/12 | | USD | 47 | | | | 47 | | | | — | @ | |
| UBS AG | | PLN | 1,227 | | | | 355 | | | 1/20/12 | | USD | 367 | | | | 367 | | | | 12 | | |
| UBS AG | | USD | 248 | | | | 248 | | | 1/20/12 | | CLP | 126,800 | | | | 244 | | | | (4 | ) | |
| UBS AG | | USD | 4 | | | | 4 | | | 1/20/12 | | GBP | 2 | | | | 4 | | | | (— | @) | |
| UBS AG | | USD | 3,329 | | | | 3,329 | | | 1/20/12 | | JPY | 258,611 | | | | 3,361 | | | | 32 | | |
| UBS AG | | USD | 164 | | | | 164 | | | 1/20/12 | | NOK | 950 | | | | 158 | | | | (6 | ) | |
| UBS AG | | USD | 176 | | | | 176 | | | 1/20/12 | | SGD | 226 | | | | 175 | | | | (1 | ) | |
| UBS AG | | USD | 66 | | | | 66 | | | 1/20/12 | | THB | 2,050 | | | | 64 | | | | (2 | ) | |
| | | | | | | $ | 24,591 | | | | | | | | | | | $ | 24,660 | | | $ | 69 | | |
The accompanying notes are an integral part of the financial statements.
20
The Universal Institutional Funds, Inc.
Annual Report – December 31, 2011
Portfolio of Investments (cont'd)
Global Tactical Asset Allocation Portfolio
Futures Contracts:
The Portfolio had the following futures contracts open at period end:
| | | Number
of
Contracts | | Value
(000) | | Expiration
Date | | Unrealized
Appreciation
(Depreciation)
(000) | |
| Long: | |
10 yr. Japan Government
Bond (Japan) | | | 1 | | | $ | 1,850 | | | Mar-12 | | $ | 10 | | |
| CAC 40 Index (France) | | | 8 | | | | 328 | | | Jan-12 | | | (2 | ) | |
| DAX Index (Germany) | | | 3 | | | | 573 | | | Mar-12 | | | 2 | | |
Euro Stoxx 50 Index
(Germany) | | | 4 | | | | 120 | | | Mar-12 | | | 4 | | |
FTSE 100 Index
(United Kingdom) | | | 9 | | | | 773 | | | Mar-12 | | | 19 | | |
| IBEX 35 Index (Spain) | | | 3 | | | | 329 | | | Jan-12 | | | 3 | | |
MSCI Emerging Market E MINI
(United States) | | | 75 | | | | 3,456 | | | Mar-12 | | | 8 | | |
S+P 500 E MINI Index
(United States) | | | 96 | | | | 6,012 | | | Mar-12 | | | 180 | | |
S+P Mid Cap 400 E MINI
Index (United States) | | | 8 | | | | 702 | | | Mar-12 | | | 21 | | |
SGX MSCI Singapore Index
(Singapore) | | | 5 | | | | 232 | | | Jan-12 | | | (3 | ) | |
| TOPIX Index (Japan) | | | 2 | | | | 189 | | | Mar-12 | | | (2 | ) | |
| | | Number
of
Contracts | | Value
(000) | | Expiration
Date | | Unrealized
Appreciation
(Depreciation)
(000) | |
| Short: | |
ASX Spi 200 Index
(Australia) | | | 2 | | | $ | (206 | ) | | Mar-12 | | $ | 5 | | |
German Euro BOBL
(Germany) | | | 2 | | | | (324 | ) | | Mar-12 | | | (5 | ) | |
Hang Seng Index
(Hong Kong) | | | 3 | | | | (356 | ) | | Jan-12 | | | 3 | | |
S+P TSE 60 Index
(Canada) | | | 1 | | | | (134 | ) | | Mar-12 | | | — | @ | |
SGX CNX NIFTY Index
(Singapore) | | | 66 | | | | (611 | ) | | Jan-12 | | | 18 | | |
U.S. Treasury 5 yr. Note
(United States) | | | 47 | | | | (5,793 | ) | | Mar-12 | | | (11 | ) | |
U.S. Treasury 10 yr. Note
(United States) | | | 32 | | | | (4,196 | ) | | Mar-12 | | | (56 | ) | |
U.S. Treasury 30 yr. Bond
(United States) | | | 5 | | | | (724 | ) | | Mar-12 | | | (4 | ) | |
| | | $ | 190 | | |
Interest Rate Swap Agreements:
The Portfolio had the following interest rate swap agreements open at period end:
| Swap Counterparty | | Floating Rate
Index | | Pay/Receive
Floating Rate | | Fixed
Rate | | Termination
Date | | Notional
Amount
(000) | | Unrealized
Appreciation
(Depreciation)
(000) | |
| Bank of America NA | | 6 Month EURIBOR | | Pay | | | 4.26 | % | | 8/18/26 | | EUR | 1,400 | | | $ | 62 | | |
| Bank of America NA | | 3 Month LIBOR | | Receive | | | 4.35 | | | 8/18/26 | | $ | 1,875 | | | | (76 | ) | |
| Bank of America NA | | 6 Month EURIBOR | | Receive | | | 3.61 | | | 8/18/31 | | EUR | 1,770 | | | | (62 | ) | |
| Bank of America NA | | 3 Month LIBOR | | Pay | | | 4.15 | | | 8/18/31 | | $ | 2,325 | | | | 84 | | |
| Barclays Capital | | 3 Month STIBOR | | Pay | | | 2.76 | | | 7/30/12 | | SEK | 40,910 | | | | 65 | | |
| Barclays Capital | | 3 Month STIBOR | | Pay | | | 2.30 | | | 9/12/12 | | | 20,460 | | | | 16 | | |
| Barclays Capital | | 3 Month STIBOR | | Receive | | | 2.89 | | | 7/29/13 | | | 47,927 | | | | (73 | ) | |
| | | $ | 16 | | |
Total Return Swap Agreements:
The Portfolio had the following total return swap agreements open at period end:
| Swap Counterparty | | Index | | Notional
Amount
(000) | | Floating
Rate | | Pay/Receive
Total Return
of Referenced
Index | | Maturity
Date | | Unrealized
Appreciation
(Depreciation)
(000) | |
| Bank of America NA | | Custom Miners Index | | $ | 471 | | | 1-Month USD-LIBOR minus 0.45% | | Pay | | 10/24/12 | | $ | (24 | ) | |
| Bank of America NA | | Custom Miners Index | | | 429 | | | 1-Month USD-LIBOR minus 0.45% | | Pay | | 10/24/12 | | | (22 | ) | |
| Bank of America NA | | Merrill Lynch Custom Luxury Basket Index | | | 410 | | | 3-Month USD-LIBOR | | Pay | | 12/20/12 | | | (18 | ) | |
| Bank of America NA | | Merrill Lynch Custom Luxury Basket Index | | | 326 | | | 3-Month USD-LIBOR | | Pay | | 12/20/12 | | | (9 | ) | |
| Bank of America NA | | Merrill Lynch Custom Luxury Basket Index | | | 224 | | | 3-Month USD-LIBOR | | Pay | | 12/20/12 | | | (13 | ) | |
| Bank of America NA | | Merrill Lynch Custom Test Index | | | 907 | | | 1-Month USD-LIBOR minus 0.45% | | Pay | | 11/23/12 | | | (25 | ) | |
| Bank of America NA | | S&P 500 Consumer Staples Index | | | 240 | | | 3-Month USD-LIBOR minus 0.08% | | Receive | | 12/27/12 | | | 1 | | |
| Bank of America NA | | S&P 500 Health Care Index | | | 242 | | | 3-Month USD-LIBOR minus 0.08% | | Receive | | 12/27/12 | | | 3 | | |
| Bank of America NA | | S&P 500 Real Estate Index | | | 1,000 | | | 3-Month USD-LIBOR minus 0.45% | | Receive | | 12/27/12 | | | (23 | ) | |
| Bank of America NA | | S&P 500 Telecom Services Index | | | 240 | | | 3-Month USD-LIBOR minus 0.08% | | Receive | | 12/27/12 | | | 7 | | |
| Bank of America NA | | S&P 500 Utilities Index | | | 239 | | | 3-Month USD-LIBOR minus 0.08% | | Receive | | 12/27/12 | | | 3 | | |
| | | $ | (120 | ) | |
The accompanying notes are an integral part of the financial statements.
21
The Universal Institutional Funds, Inc.
Annual Report – December 31, 2011
Portfolio of Investments (cont'd)
Global Tactical Asset Allocation Portfolio
@ Value is less than $500.
EURIBOR Euro Interbank Offered Rate.
LIBOR London Interbank Offered Rate.
STIBOR Stockholm Interbank Offered Rate.
AUD — Australian Dollar
BRL — Brazilian Real
CAD — Canadian Dollar
CHF — Swiss Franc
CLP — Chilean Peso
CNY — Chinese Yuan Renminbi
CZK — Czech Koruna
DKK — Danish Krone
EUR — Euro
GBP — British Pound
HKD — Hong Kong Dollar
HUF — Hungarian Forint
ILS — Israeli Shekel
INR — Indian Rupee
JPY — Japanese Yen
KRW — South Korean Won
MXN — Mexican New Peso
MYR — Malaysian Ringgit
NOK — Norwegian Krone
PLN — Polish Zloty
RUB — Russian Ruble
SEK — Swedish Krona
SGD — Singapore Dollar
THB — Thai Baht
TWD — Taiwan Dollar
USD — United States Dollar
ZAR — South African Rand
Fair Value Measurement Information:
The following is a summary of the inputs used to value the Portfolio's investments as of December 31, 2011. (See Note A-7 to the financial statements for further information regarding fair value measurement.)
| Investment Type | | Level 1
Unadjusted
quoted
prices
(000) | | Level 2
Other
significant
observable
inputs
(000) | | Level 3
Significant
unobservable
inputs
(000) | | Total
(000) | |
| Assets: | |
| Fixed Income Securities | |
Agency Fixed Rate
Mortgages | | $ | — | | | $ | 4,002 | | | $ | — | | | $ | 4,002 | | |
| Asset-Backed Securities | | | — | | | | 415 | | | | — | | | | 415 | | |
Commercial Mortgage
Backed Securities | | | — | | | | 819 | | | | — | | | | 819 | | |
| Corporate Bonds | | | — | | | | 8,113 | | | | — | | | | 8,113 | | |
| Sovereign | | | — | | | | 9,584 | | | | — | | | | 9,584 | | |
| U.S. Treasury Securities | | | — | | | | 3,280 | | | | — | | | | 3,280 | | |
Total Fixed Income
Securities | | | — | | | | 26,213 | | | | — | | | | 26,213 | | |
| Common Stocks | |
| Aerospace & Defense | | | 334 | | | | — | | | | — | | | | 334 | | |
| Air Freight & Logistics | | | 67 | | | | — | | | | — | | | | 67 | | |
| Airlines | | | 10 | | | | — | | | | — | | | | 10 | | |
| Auto Components | | | 367 | | | | — | | | | — | | | | 367 | | |
| Automobiles | | | 490 | | | | — | | | | — | | | | 490 | | |
| Beverages | | | 402 | | | | — | | | | — | | | | 402 | | |
| Biotechnology | | | 195 | | | | — | | | | — | | | | 195 | | |
| Building Products | | | 168 | | | | — | | | | — | | | | 168 | | |
| Capital Markets | | | 383 | | | | — | | | | — | | | | 383 | | |
| Chemicals | | | 843 | | | | — | | | | — | | | | 843 | | |
| Commercial Banks | | | 2,224 | | | | — | | | | — | | | | 2,224 | | |
Commercial Services &
Supplies | | | 135 | | | | — | | | | — | | | | 135 | | |
Communications
Equipment | | | 373 | | | | — | | | | — | | | | 373 | | |
| Computers & Peripherals | | | 503 | | | | — | | | | — | | | | 503 | | |
Construction &
Engineering | | | 245 | | | | — | | | | — | | | | 245 | | |
| Construction Materials | | | 61 | | | | — | | | | — | | | | 61 | | |
| Consumer Finance | | | 45 | | | | — | | | | — | | | | 45 | | |
| Containers & Packaging | | | 29 | | | | — | | | | — | | | | 29 | | |
| Distributors | | | 30 | | | | — | | | | — | | | | 30 | | |
Diversified Financial
Services | | | 482 | | | | — | | | | — | | | | 482 | | |
Diversified
Telecommunication
Services | | | 900 | | | | — | | | | — | | | | 900 | | |
| Electric Utilities | | | 553 | | | | — | | | | — | | | | 553 | | |
| Electrical Equipment | | | 196 | | | | — | | | | — | | | | 196 | | |
Electronic Equipment,
Instruments &
Components | | | 338 | | | | — | | | | — | | | | 338 | | |
The accompanying notes are an integral part of the financial statements.
22
The Universal Institutional Funds, Inc.
Annual Report – December 31, 2011
Portfolio of Investments (cont'd)
Global Tactical Asset Allocation Portfolio
Fair Value Measurement Information: (cont'd)
| Investment Type | | Level 1
Unadjusted
quoted
prices
(000) | | Level 2
Other
significant
observable
inputs
(000) | | Level 3
Significant
unobservable
inputs
(000) | | Total
(000) | |
| Common Stocks (cont'd) | |
Energy Equipment &
Services | | $ | 271 | | | $ | — | | | $ | — | | | $ | 271 | | |
| Food & Staples Retailing | | | 659 | | | | — | | | | — | | | | 659 | | |
| Food Products | | | 798 | | | | — | | | | — | | | | 798 | | |
| Gas Utilities | | | 101 | | | | — | | | | — | | | | 101 | | |
Health Care Equipment &
Supplies | | | 199 | | | | — | | | | — | | | | 199 | | |
Health Care Providers &
Services | | | 603 | | | | — | | | | — | | | | 603 | | |
| Health Care Technology | | | 8 | | | | — | | | | — | | | | 8 | | |
Hotels, Restaurants &
Leisure | | | 502 | | | | — | | | | — | | | | 502 | | |
| Household Durables | | | 809 | | | | — | | | | — | | | | 809 | | |
| Household Products | | | 330 | | | | — | | | | — | | | | 330 | | |
Independent Power
Producers & Energy
Traders | | | 88 | | | | — | | | | — | | | | 88 | | |
| Industrial Conglomerates | | | 559 | | | | — | | | | — | | | | 559 | | |
Information Technology
Services | | | 376 | | | | — | | | | — | | | | 376 | | |
| Insurance | | | 1,408 | | | | — | | | | — | | | | 1,408 | | |
| Internet & Catalog Retail | | | 56 | | | | — | | | | — | | | | 56 | | |
Internet Software &
Services | | | 226 | | | | — | | | | — | | | | 226 | | |
Leisure Equipment &
Products | | | 18 | | | | — | | | | — | | | | 18 | | |
Life Sciences Tools &
Services | | | 60 | | | | — | | | | — | | | | 60 | | |
| Machinery | | | 535 | | | | — | | | | — | | | | 535 | | |
| Marine | | | 50 | | | | — | | | | — | | | | 50 | | |
| Media | | | 527 | | | | — | | | | — | | | | 527 | | |
| Metals & Mining | | | 1,252 | | | | — | | | | — | | | | 1,252 | | |
| Multi-Utilities | | | 404 | | | | — | | | | — | | | | 404 | | |
| Multiline Retail | | | 45 | | | | — | | | | — | | | | 45 | | |
| Office Electronics | | | 111 | | | | — | | | | — | | | | 111 | | |
Oil, Gas & Consumable
Fuels | | | 2,792 | | | | — | | | | — | | | | 2,792 | | |
| Paper & Forest Products | | | 142 | | | | — | | | | — | | | | 142 | | |
| Personal Products | | | 93 | | | | — | | | | — | | | | 93 | | |
| Pharmaceuticals | | | 1,532 | | | | — | | | | — | | | | 1,532 | | |
| Professional Services | | | 101 | | | | — | | | | — | | | | 101 | | |
Real Estate Investment
Trusts (REITs) | | | 388 | | | | — | | | | — | | | | 388 | | |
Real Estate
Management &
Development | | | 405 | | | | — | | | | — | | | | 405 | | |
| Road & Rail | | | 492 | | | | — | | | | — | | | | 492 | | |
| Investment Type | | Level 1
Unadjusted
quoted
prices
(000) | | Level 2
Other
significant
observable
inputs
(000) | | Level 3
Significant
unobservable
inputs
(000) | | Total
(000) | |
| Common Stocks (cont'd) | |
Semiconductors &
Semiconductor
Equipment | | $ | 271 | | | $ | — | | | $ | — | | | $ | 271 | | |
| Software | | | 502 | | | | — | | | | — | | | | 502 | | |
| Specialty Retail | | | 511 | | | | — | | | | — | | | | 511 | | |
Textiles, Apparel &
Luxury Goods | | | 308 | | | | — | | | | — | | | | 308 | | |
Thrifts & Mortgage
Finance | | | 4 | | | | — | | | | — | | | | 4 | | |
| Tobacco | | | 585 | | | | — | | | | — | | | | 585 | | |
Trading Companies &
Distributors | | | 199 | | | | — | | | | — | | | | 199 | | |
Transportation
Infrastructure | | | 55 | | | | — | | | | — | | | | 55 | | |
| Water Utilities | | | 20 | | | | — | | | | — | | | | 20 | | |
Wireless
Telecommunication
Services | | | 462 | | | | — | | | | — | | | | 462 | | |
| Total Common Stocks | | | 28,230 | | | | — | | | | — | | | | 28,230 | | |
Commodity Linked
Security | | | — | | | | 3,064 | | | | — | | | | 3,064 | | |
| Investment Companies | | | 3,186 | | | | — | | | | — | | | | 3,186 | | |
| Short-Term Investments | |
| Investment Company | | | 10,419 | | | | — | | | | — | | | | 10,419 | | |
| Repurchase Agreements | | | — | | | | 2,756 | | | | — | | | | 2,756 | | |
Total Short-Term
Investments | | | 10,419 | | | | 2,756 | | | | — | | | | 13,175 | | |
Foreign Currency
Exchange Contracts | | | — | | | | 184 | | | | — | | | | 184 | | |
| Futures Contracts | | | 273 | | | | — | | | | — | | | | 273 | | |
Interest Rate Swap
Agreements | | | — | | | | 227 | | | | — | | | | 227 | | |
Total Return Swap
Agreements | | | — | | | | 14 | | | | — | | | | 14 | | |
| Total Assets | | | 42,108 | | | | 32,458 | | | | — | | | | 74,566 | | |
| Liabilities: | |
Foreign Currency
Exchange Contracts | | | — | | | | (115 | ) | | | — | | | | (115 | ) | |
| Futures Contracts | | | (83 | ) | | | — | | | | — | | | | (83 | ) | |
Interest Rate Swap
Agreements | | | — | | | | (211 | ) | | | — | | | | (211 | ) | |
Total Return Swap
Agreements | | | — | | | | (134 | ) | | | — | | | | (134 | ) | |
| Total Liabilities | | | (83 | ) | | | (460 | ) | | | — | | | | (543 | ) | |
| Total | | $ | 42,025 | | | $ | 31,998 | | | $ | — | | | $ | 74,023 | | |
Transfers between investment levels may occur as the markets fluctuate and/or the availability of data used in an investment's valuation changes. The Portfolio recognizes transfers between the levels as of the end of the period. As of December 31, 2011, the Porfolio did not have any significant investments transfer between investment levels.
The accompanying notes are an integral part of the financial statements.
23
The Universal Institutional Funds, Inc.
Annual Report – December 31, 2011
Global Tactical Asset Allocation Portfolio
| Statement of Assets and Liabilities | | December 31, 2011
(000) | |
| Assets: | |
| Investments in Securities of Unaffiliated Issuers, at Value(1) (Cost $63,082) | | $ | 60,863 | | |
| Investment in Security of Affiliated Issuer, at Value (Cost $13,513) | | | 13,005 | | |
| Total Investments in Securities, at Value (Cost $76,595) | | | 73,868 | | |
| Cash | | | 75 | | |
| Foreign Currency, at Value (Cost $604) | | | 610 | | |
| Receivable for Variation Margin | | | 1,319 | | |
| Receivable for Investments Sold | | | 532 | | |
| Interest Receivable | | | 281 | | |
| Unrealized Appreciation on Swap Agreements | | | 241 | | |
| Unrealized Appreciation on Foreign Currency Exchange Contracts | | | 184 | | |
| Tax Reclaim Receivable | | | 63 | | |
| Due from Adviser | | | 55 | | |
| Dividends Receivable | | | 43 | | |
| Receivable from Affiliate | | | 2 | | |
| Receivable for Portfolio Shares Sold | | | 1 | | |
| Other Assets | | | 1 | | |
| Total Assets | | | 77,275 | | |
| Liabilities: | |
| Collateral on Securities Loaned, at Value | | | 10,445 | | |
| Payable for Investments Purchased | | | 1,497 | | |
| Unrealized Depreciation on Swap Agreements | | | 345 | | |
| Unrealized Depreciation on Foreign Currency Exchange Contracts | | | 115 | | |
| Payable for Professional Fees | | | 29 | | |
| Payable for Swap Agreements Termination | | | 26 | | |
| Payable for Custodian Fees | | | 25 | | |
| Payable for Administration Fees | | | 14 | | |
| Payable for Portfolio Shares Redeemed | | | 11 | | |
| Payable for Directors' Fees and Expenses | | | 2 | | |
| Distribution Fees — Class II Shares | | | — | @ | |
| Other Liabilities | | | 33 | | |
| Total Liabilities | | | 12,542 | | |
| NET ASSETS | | $ | 64,733 | | |
| Net Assets Consist of: | |
| Paid-in-Capital | | $ | 86,396 | | |
| Undistributed Net Investment Income | | | 1,386 | | |
| Accumulated Net Realized Loss | | | (20,471 | ) | |
| Unrealized Appreciation (Depreciation) on: | |
| Investments | | | (2,219 | ) | |
| Investments in Affiliates | | | (508 | ) | |
| Futures Contracts | | | 190 | | |
| Swap Agreements | | | (104 | ) | |
| Foreign Currency Exchange Contracts | | | 69 | | |
| Foreign Currency Translations | | | (6 | ) | |
| Net Assets | | $ | 64,733 | | |
| CLASS I: | |
| Net Assets | | $ | 64,668 | | |
Net Asset Value, Offering and Redemption Price Per Share Applicable to 7,541,012 Outstanding
$0.001 Par Value Shares (Authorized 500,000,000 Shares) | | $ | 8.58 | | |
| CLASS II: | |
| Net Assets | | $ | 65 | | |
Net Asset Value, Offering and Redemption Price Per Share Applicable to 7,602 Outstanding
$0.001 Par Value Shares (Authorized 500,000,000 Shares) | | $ | 8.57 | | |
| (1) Including: | |
| Securities on Loan, at Value: | | $ | 10,308 | | |
@ Amount is less than $500.
The accompanying notes are an integral part of the financial statements.
24
The Universal Institutional Funds, Inc.
Annual Report – December 31, 2011
Global Tactical Asset Allocation Portfolio
| Statement of Operations | | Year Ended
December 31, 2011
(000) | |
| Investment Income: | |
| Dividends from Securities of Unaffiliated Issuers (Net of $60 of Foreign Taxes Withheld) | | $ | 999 | | |
| Interest from Securities of Unaffiliated Issuers (Net of $ —@ Foreign Taxes Withheld) | | | 684 | | |
| Dividends from Securities of Affiliated Issuer | | | 50 | | |
| Income from Securities Loaned — Net | | | 44 | | |
| Interest from Securities of Affiliated Issuers | | | 9 | | |
| Total Investment Income | | | 1,786 | | |
| Expenses: | |
| Investment Advisory Fees (Note B) | | | 584 | | |
| Custodian Fees (Note F) | | | 191 | | |
| Administration Fees (Note C) | | | 188 | | |
| Professional Fees | | | 142 | | |
| Shareholder Reporting Fees | | | 117 | | |
| Pricing Fees | | | 87 | | |
| Directors' Fees and Expenses | | | 3 | | |
| Distribution Fees — Class II Shares (Note D) | | | — | @ | |
| Other Expenses | | | 13 | | |
| Total Expenses | | | 1,325 | | |
| Waiver of Investment Advisory Fees (Note B) | | | (553 | ) | |
| Rebate from Morgan Stanley Affiliates (Note H) | | | (46 | ) | |
| Distribution Fees — Class II Shares Waived (Note D) | | | (— | @) | |
| Net Expenses | | | 726 | | |
| Net Investment Income | | | 1,060 | | |
| Realized Gain (Loss): | |
| Investments Sold | | | 1,165 | | |
| Investments in Affiliates | | | (130 | ) | |
| Foreign Currency Exchange Contracts | | | 541 | | |
| Foreign Currency Transactions | | | (6 | ) | |
| Futures Contracts | | | (597 | ) | |
| Swap Agreements | | | (92 | ) | |
| Net Realized Gain | | | 881 | | |
| Change in Unrealized Appreciation (Depreciation): | |
| Investments | | | (3,557 | ) | |
| Investments in Affiliates | | | (582 | ) | |
| Foreign Currency Exchange Contracts | | | (49 | ) | |
| Foreign Currency Translations | | | (17 | ) | |
| Futures Contracts | | | 5 | | |
| Swap Agreements | | | (120 | ) | |
| Net Change in Unrealized Appreciation (Depreciation) | | | (4,320 | ) | |
| Net Realized Gain and Change in Unrealized Appreciation (Depreciation) | | | (3,439 | ) | |
| Net Decrease in Net Assets Resulting from Operations | | $ | (2,379 | ) | |
@ Amount is less than $500.
The accompanying notes are an integral part of the financial statements.
25
The Universal Institutional Funds, Inc.
Annual Report – December 31, 2011
Global Tactical Asset Allocation Portfolio
| Statements of Changes in Net Assets | | Year Ended
December 31, 2011
(000) | | Year Ended
December 31, 2010
(000) | |
| Increase (Decrease) in Net Assets: | |
| Operations: | |
| Net Investment Income | | $ | 1,060 | | | $ | 1,198 | | |
| Net Realized Gain | | | 881 | | | | 3,473 | | |
| Net Change in Unrealized Appreciation (Depreciation) | | | (4,320 | ) | | | (351 | ) | |
| Net Increase (Decrease) in Net Assets Resulting from Operations | | | (2,379 | ) | | | 4,320 | | |
| Distributions from and/or in Excess of: | |
| Class I: | |
| Net Investment Income | | | (981 | ) | | | (2,632 | ) | |
| Class II: | |
| Net Investment Income | | | (— | @) | | | — | | |
| Total Distributions | | | (981 | ) | | | (2,632 | ) | |
| Capital Share Transactions:(1) | |
| Class I: | |
| Subscribed | | | 3,413 | | | | 8,513 | | |
| Distributions Reinvested | | | 981 | | | | 2,632 | | |
| Redeemed | | | (22,122 | ) | | | (25,865 | ) | |
| Class II: | |
| Subscribed | | | 114 | * | | | — | | |
| Distributions Reinvested | | | — | @* | | | — | | |
| Redeemed | | | (45 | )* | | | — | | |
| Net Decrease in Net Assets Resulting from Capital Share Transactions | | | (17,659 | ) | | | (14,720 | ) | |
| Regulatory Settlement Proceeds: | |
| Net Increase from Regulatory Settlement (Note I) | | | — | | | | 77 | | |
| Total Decrease in Net Assets | | | (21,019 | ) | | | (12,955 | ) | |
| Net Assets: | |
| Beginning of Period | | | 85,752 | | | | 98,707 | | |
| End of Period (Including Undistributed Net Investment Income of $1,386 and $886) | | $ | 64,733 | | | $ | 85,752 | | |
| (1) Capital Share Transactions: | |
| Class I: | |
| Shares Subscribed | | | 379 | | | | 1,008 | | |
| Shares Issued on Distributions Reinvested | | | 104 | | | | 351 | | |
| Shares Redeemed | | | (2,453 | ) | | | (3,047 | ) | |
| Net Decrease in Class I Shares Outstanding | | | (1,970 | ) | | | (1,688 | ) | |
| Class II: | |
| Shares Subscribed | | | 13 | * | | | — | | |
| Shares Issued on Distributions Reinvested | | | — | @@* | | | — | | |
| Shares Redeemed | | | (5 | )* | | | — | | |
| Net Increase in Class II Shares Outstanding | | | 8 | * | | | — | | |
* For the period March 15, 2011 (commencement of operations) through December 31, 2011.
@ Amount is less than $500.
@@ Amount is less than 500 shares.
The accompanying notes are an integral part of the financial statements.
26
The Universal Institutional Funds, Inc.
Annual Report – December 31, 2011
Financial Highlights
Global Tactical Asset Allocation Portfolio
| | | Class I | |
| | | Year Ended December 31, | |
| Selected Per Share Data and Ratios | | 2011 | | 2010 | | 2009 | | 2008 | | 2007 | |
| Net Asset Value, Beginning of Period | | $ | 9.02 | | | $ | 8.81 | | | $ | 6.86 | | | $ | 14.50 | | | $ | 14.26 | | |
| Income (Loss) from Investment Operations: | |
| Net Investment Income† | | | 0.13 | | | | 0.11 | | | | 0.13 | | | | 0.30 | | | | 0.17 | | |
| Net Realized and Unrealized Gain (Loss) | | | (0.45 | ) | | | 0.34 | | | | 2.05 | | | | (6.09 | ) | | | 1.89 | | |
| Total from Investment Operations | | | (0.32 | ) | | | 0.45 | | | | 2.18 | | | | (5.79 | ) | | | 2.06 | | |
| Distributions from and/or in Excess of: | |
| Net Investment Income | | | (0.12 | ) | | | (0.25 | ) | | | (0.23 | ) | | | (0.38 | ) | | | (0.23 | ) | |
| Net Realized Gain | | | — | | | | — | | | | — | | | | (1.47 | ) | | | (1.59 | ) | |
| Total Distributions | | | (0.12 | ) | | | (0.25 | ) | | | (0.23 | ) | | | (1.85 | ) | | | (1.82 | ) | |
| Regulatory Settlement Proceeds | | | — | | | | 0.01 | # | | | — | | | | — | | | | — | | |
| Net Asset Value, End of Period | | $ | 8.58 | | | $ | 9.02 | | | $ | 8.81 | | | $ | 6.86 | | | $ | 14.50 | | |
| Total Return ++ | | | (3.68 | )% | | | 5.68 | % | | | 32.53 | % | | | (44.62 | )% | | | 14.59 | % | |
| Ratios and Supplemental Data: | |
| Net Assets, End of Period (Thousands) | | $ | 64,668 | | | $ | 85,752 | | | $ | 98,707 | | | $ | 86,530 | | | $ | 209,933 | | |
| Ratio of Expenses to Average Net Assets(1) | | | 0.96 | %+^ | | | 1.03 | %+ | | | 1.04 | %+ | | | 1.05 | %+ | | | 1.05 | %+ | |
Ratio of Expenses to Average Net Assets Excluding
Non Operating Expenses | | | N/A | | | | 1.03 | %+ | | | N/A | | | | N/A | | | | N/A | | |
| Ratio of Net Investment Income to Average Net Assets(1) | | | 1.42 | %+ | | | 1.35 | %+ | | | 1.75 | %+ | | | 2.72 | %+ | | | 1.15 | %+ | |
| Ratio of Rebate from Morgan Stanley Affiliates to Average Net Assets | | | 0.06 | % | | | 0.02 | % | | | 0.01 | % | | | 0.00 | %§ | | | 0.00 | %§ | |
| Portfolio Turnover Rate | | | 109 | % | | | 183 | % | | | 30 | % | | | 26 | % | | | 43 | % | |
| (1) Supplemental Information on the Ratios to Average Net Assets: | |
| Ratios Before Expense Limitation: | |
| Expenses to Average Net Assets | | | 1.76 | % | | | 1.45 | %+ | | | 1.21 | %+ | | | 1.19 | %+ | | | 1.15 | %+ | |
| Net Investment Income to Average Net Assets | | | 0.62 | % | | | 0.93 | %+ | | | 1.58 | %+ | | | 2.58 | %+ | | | 1.05 | %+ | |
† Per share amount is based on average shares outstanding.
# During the year ended December 31, 2010, the Portfolio received a regulatory settlement from an unaffiliated third party, which had an impact of 0.11% on the total return. This was a one-time settlement, and as a result, the impact on the NAV and consequently the performance will not likely be repeated in the future. Had this settlement not occurred, the total return for Class I would have been approximately 5.57%.
++ Calculated based on the net asset value as of the last business day of the period. Performance does not reflect fees and expenses imposed by your insurance company's separate account. If performance information included the effect of these additional charges, the total return would be lower.
+ The Ratios of Expenses and Net Investment Income reflect the rebate of certain Portfolio expenses in connection with the investments in Morgan Stanley affiliates during the period. The effect of the rebate on the ratios is disclosed in the above table as "Ratio of Rebate from Morgan Stanley Affiliates to Average Net Assets."
§ Amount is less than 0.005%.
^ Effective July 1, 2011, the Adviser has agreed to limit the ratio of expenses to average net assets to the maximum ratio of 1.00% for Class I shares. Prior to July 1, 2011, the maximum ratio was 1.05% for Class I shares.
The accompanying notes are an integral part of the financial statements.
27
The Universal Institutional Funds, Inc.
Annual Report – December 31, 2011
Financial Highlights
Global Tactical Asset Allocation Portfolio
| | | Class II | |
| Selected Per Share Data and Ratios | | Period from March 15, 2011^
to December 31, 2011 | |
| Net Asset Value, Beginning of Period | | $ | 9.04 | | |
| Income (Loss) from Investment Operations: | |
| Net Investment Income† | | | 0.11 | | |
| Net Realized and Unrealized Loss | | | (0.46 | ) | |
| Total from Investment Operations | | | (0.35 | ) | |
| Distributions from and/or in Excess of: | |
| Net Investment Income | | | (0.12 | ) | |
| Net Asset Value, End of Period | | $ | 8.57 | | |
| Total Return ++ | | | (4.00 | )%# | |
| Ratios and Supplemental Data: | |
| Net Assets, End of Period (Thousands) | | $ | 65 | | |
| Ratio of Expenses to Average Net Assets(1) | | | 1.06 | %+*^^ | |
| Ratio of Net Investment Income to Average Net Assets(1) | | | 1.32 | %+* | |
| Ratio of Rebate from Morgan Stanley Affiliates to Average Net Assets | | | 0.06 | %* | |
| Portfolio Turnover Rate | | | 109 | %# | |
| (1) Supplemental Information on the Ratios to Average Net Assets: | |
| Ratios Before Expense Limitation: | |
| Expenses to Average Net Assets | | | 2.11 | %* | |
| Net Investment Income to Average Net Assets | | | 0.27 | %* | |
^ Commencement of Operations.
† Per share amount is based on average shares outstanding.
++ Calculated based on the net asset value as of the last business day of the period. Performance does not reflect fees and expenses imposed by your insurance company's separate account. If performance information included the effect of these additional charges, the total return would be lower.
+ The Ratios of Expenses and Net Investment Income reflect the rebate of certain Portfolio expenses in connection with the investments in Morgan Stanley affiliates during the period. The effect of the rebate on the ratios is disclosed in the above table as "Ratio of Rebate from Morgan Stanley Affiliates to Average Net Assets."
# Not Annualized.
* Annualized.
^^ Effective July 1, 2011, the Adviser has agreed to limit the ratio of expenses to average net assets to the maximum ratio of 1.10% for Class II shares. Prior to July 1, 2011, the maximum ratio was 1.15% for Class II shares.
The accompanying notes are an integral part of the financial statements.
28
The Universal Institutional Funds, Inc.
Annual Report – December 31, 2011
Notes to Financial Statements
The Universal Institutional Funds, Inc. (the "Fund") is registered under the Investment Company Act of 1940, as amended (the "Act"), as an open-end management investment company. The Fund is comprised of ten separate active, diversified and non-diversified portfolios (individually referred to as a "Portfolio", collectively as the "Portfolios"). Effective March 15, 2011, the Class II shares commenced operations.
The accompanying financial statements relate to the Global Tactical Asset Allocation Portfolio. The Portfolio seeks total return. The Portfolio seeks to achieve total return by investing in a blend of equity and fixed income securities of U.S. and non-U.S. issuers. In seeking to achieve this investment objective, the Portfolio will implement a global tactical approach to achieving total return, and to control risk and volatility. The Portfolio offers two classes of shares — Class I and Class II. Both classes of shares have identical voting rights (except that shareholders of a Class have exclusive voting rights regarding any matter relating solely to that Class of shares), dividend, liquidation and other rights.
The Fund is intended to be the funding vehicle for variable annuity contracts and variable life insurance policies offered by the separate accounts of certain life insurance companies.
A. Significant Accounting Policies: The following significant accounting policies are in conformity with U.S. generally accepted accounting principles ("GAAP"). Such policies are consistently followed by the Fund in the preparation of its financial statements. GAAP may require management to make estimates and assumptions that affect the reported amounts and disclosures in the financial statements. Actual results may differ from those estimates.
1. Security Valuation: Securities listed on a foreign exchange are valued at their closing price. Unlisted securities and listed securities not traded on the valuation date for which market quotations are readily available are valued at the mean between the current bid and ask prices. Equity securities listed on a U.S. exchange are valued at the latest quoted sales price on the valuation date. Equity securities listed or traded on NASDAQ, for which market quotations are available, are valued at the NASDAQ Official Closing Price. Bonds and other fixed income securities may be valued according to the broadest and most representative market. In addition, bonds and other fixed income securities may be valued on the basis of prices provided by a pricing service. The prices provided by a pricing service take into account broker dealer market price quotations for institutional size trading in similar groups of securities, security quality, maturity, coupon and other security characteristics as well as any developments related to the specific securities. Short-term debt securities purchased with remaining maturities of 60 days or less are valued at amortized cost, unless the Board of Directors (the "Directors") determines such valuation does not reflect the securities' fair value, in which case these securities will be valued at their fair value as determined in good faith under procedures adopted by the Directors.
All other securities and investments for which market values are not readily available, including restricted securities, and those securities for which it is inappropriate to determine prices in accordance with the aforementioned procedures, are valued at fair value as determined in good faith under procedures adopted by the Directors, although the actual calculations may be done by others. Factors considered in making this determination may include, but are not limited to, information obtained by contacting the issuer, analysts, or the appropriate stock exchange (for exchange-traded securities), analysis of the issuer's financial statements or other available documents and, if necessary, available information concerning other securities in similar circumstances.
Most foreign markets close before the New York Stock Exchange ("NYSE"). Occasionally, developments that could affect the closing prices of securities and other assets may occur between the times at which valuations of such securities are determined (that is, close of the foreign market on which the securities trade) and the close of business on the NYSE. If these developments are expected to materially affect the value of the securities, the valuations may be adjusted to reflect the estimated fair value as of the close of the NYSE, as determined in good faith under procedures established by the Directors.
2. Foreign Currency Translation and Foreign Investments: The books and records of the Fund are maintained in U.S. dollars. Foreign currency amounts are translated into U.S. dollars at the mean of the bid and ask prices of such currencies against U.S. dollars last quoted by a major bank as follows:
• investments, other assets and liabilities at the prevailing rate of exchange on the valuation date;
• investment transactions and investment income at the prevailing rates of exchange on the dates of such transactions.
Although the net assets of the Fund are presented at the foreign exchange rates and market values at the close of the period, the Fund does not isolate that portion of the results of operations arising as a result of changes in the foreign exchange rates from the fluctuations arising from changes in the market prices of the securities held at
29
The Universal Institutional Funds, Inc.
Annual Report – December 31, 2011
Notes to Financial Statements (cont'd)
period end. Similarly, the Fund does not isolate the effect of changes in foreign exchange rates from the fluctuations arising from changes in the market prices of securities sold during the period. Accordingly, realized and unrealized foreign currency gains (losses) on investments in securities are included in the reported net realized and unrealized gains (losses) on investment transactions and balances. However, pursuant to U.S. Federal income tax regulations, gains and losses from certain foreign currency transactions and the foreign currency portion of gains and losses realized on sales and maturities of foreign denominated debt securities are treated as ordinary income for U.S. Federal income tax purposes.
Net realized gains (losses) on foreign currency transactions represent net foreign exchange gains (losses) from foreign currency exchange contracts, disposition of foreign currencies, currency gains (losses) realized between the trade and settlement dates on securities transactions, and the difference between the amount of investment income and foreign withholding taxes recorded on the Fund's books and the U.S. dollar equivalent amounts actually received or paid. Net unrealized currency gains (losses) from valuing foreign currency denominated assets and liabilities at period end exchange rates are reflected as a component of unrealized appreciation (depreciation) on the Statement of Assets and Liabilities. The change in unrealized currency gains (losses) on foreign currency translations for the period is reflected in the Statement of Operations.
Foreign security and currency transactions may involve certain considerations and risks not typically associated with those of U.S. dollar denominated transactions as a result of, among other factors, the possibility of lower levels of governmental supervision and regulation of foreign securities markets and the possibility of political or economic instability.
At December 31, 2011, the net assets of the Portfolio were substantially comprised of foreign denominated securities and currency. Changes in currency exchange rates will affect the U.S. dollar value of and investment income from such securities.
Governmental approval for foreign investments may be required in advance of making an investment under certain circumstances in some countries, and the extent of foreign investments in domestic companies may be subject to limitation in other countries. Foreign ownership limitations also may be imposed by the charters of individual companies to prevent, among other concerns, violations of foreign investment limitations. As a result, an additional class of shares (identified as "Foreign" in the Portfolio of Investments) may be created and offered for investment. The "local" and "foreign shares" market values may differ. In the absence of trading of the foreign shares in such markets, the Fund values the foreign shares at the closing exchange price of the local shares. Such securities, if any, are identified as fair valued in the Portfolio of Investments.
3. Derivatives: The Portfolio uses derivative instruments for a variety of purposes, including hedging, risk management, portfolio management or to earn income. Derivatives are financial instruments whose value is based on the value of another underlying asset, interest rate, index or financial instrument. A derivative instrument often has risks similar to its underlying instrument and may have additional risks, including imperfect correlation between the value of the derivative and the underlying instrument, risks of default by the other party to certain transactions, magnification of losses incurred due to changes in the market value of the securities, instruments, indices or interest rates to which they relate, and risks that the transactions may not be liquid. The use of derivatives involves risks that are different from, and possibly greater than, the risks associated with other portfolio investments. Derivatives may involve the use of highly specialized instruments that require investment techniques and risk analyses different from those associated with other portfolio investments. All of the Portfolio's holdings, including derivative instruments, marked-to-market each day with the change in value reflected in unrealized appreciation (depreciation). Upon disposition, a realized gain or loss is recognized.
Certain derivative transactions may give rise to a form of leverage. Leverage associated with derivative transactions may cause the Portfolio to liquidate portfolio positions when it may not be advantageous to do so to satisfy its obligations or to meet earmarking or segregation requirements, pursuant to applicable Securities and Exchange Commission rules and regulations, or may cause the Portfolio to be more volatile than if the Portfolio had not been leveraged. Although the Adviser seeks to use derivatives to further the Portfolio's investment objectives, there is no assurance that the use of derivatives will achieve this result.
Following is a description of the derivative instruments and techniques that the Portfolio used during the period and their associated risks:
Foreign Currency Exchange Contracts: In connection with its investments in foreign securities, the
30
The Universal Institutional Funds, Inc.
Annual Report – December 31, 2011
Notes to Financial Statements (cont'd)
Portfolio also entered into contracts with banks, brokers or dealers to purchase or sell securities or foreign currencies at a future date. A foreign currency exchange contract ("currency contracts") is a negotiated agreement between the contracting parties to exchange a specified amount of currency at a specified future time at a specified rate. The rate can be higher or lower than the spot rate between the currencies that are the subject of the contract. Currency contracts are used to protect against uncertainty in the level of future foreign currency exchange rates or to gain or modify exposure to a particular currency. Hedging the Portfolio's currency risks involves the risk of mismatching the Portfolio's objectives under a currency contract with the value of securities denominated in a particular currency. Furthermore, such transactions reduce or preclude the opportunity for gain if the value of the currency should move in the direction opposite to the position taken. There is an additional risk to the effect that currency contracts create exposure to currencies in which the Portfolio's securities are not denominated. Unanticipated changes in currency prices may result in poorer overall performance for the Portfolio than if it had not entered into such contracts. A currency contract is marked-to-market daily and the change in market value is recorded by the Portfolio as unrealized gain or (loss). The Portfolio records realized gains (losses) when the currency contract is closed equal to the difference between the value of the currency contract at the time it was opened and the value at the time it was closed.
Futures: A futures contract is a standardized agreement between two parties to buy or sell a specific quantity of an underlying instrument at a specific price at a specific future time. The value of a futures contract tends to increase and decrease in tandem with the value of the underlying instrument. Futures contracts are bilateral agreements, with both the purchaser and the seller equally obligated to complete the transaction. Depending on the terms of the particular contract, futures contracts are settled through either physical delivery of the underlying instrument on the settlement date or by payment of a cash settlement amount on the settlement date. During the period the futures contract is open, payments are received from or made to the broker based upon changes in the value of the contract (the variation margin). A decision as to whether, when and how to use futures involves the exercise of skill and judgment and even a well conceived futures transaction may be unsuccessful because of market behavior or unexpected events. In addition to the derivatives risks discussed above, the prices of futures can be highly volatile, using futures can lower total return, and the potential loss from futures can exceed the Portfolio's initial investment in such contracts.
Swaps: A swap agreement is an agreement between two parties pursuant to which the parties exchange payments at specified dates on the basis of a specified notional amount, with the payments calculated by reference to specified securities, indexes, reference rates, currencies or other instruments. Most swap agreements provide that when the period payment dates for both parties are the same, the payments are made on a net basis (i.e., the two payment streams are netted out, with only the net amount paid by one party to the other). The Portfolio's obligations or rights under a swap agreement entered into on a net basis will generally be equal only to the net amount to be paid or received under the agreement, based on the relative values of the positions held by each counterparty. Swap agreements are not entered into or traded on exchanges and there is no central clearing or guaranty function for swaps. Therefore, swaps are subject to credit risk or the risk of default or non-performance by the counterparty. Swaps could result in losses if interest rate or foreign currency exchange rates or credit quality changes are not correctly anticipated by the Portfolio or if the reference index, security or investments do not perform as expected. The Portfolio's use of swaps during the period included those based on the credit of an underlying security and commonly referred to as credit default swaps. Where a Portfolio is the buyer of a credit default swap agreement, it would be entitled to receive the par (or other agreed-upon) value of a referenced debt obligation from the counterparty to the agreement only in the event of a default by a third party on the debt obligation. If no default occurs, a Portfolio would have paid to the counterparty a periodic stream of payments over the term of the agreement and received no benefit from the agreement. When a Portfolio is the seller of a credit default swap agreement, it receives the stream of payments but is obligated to pay upon default of the referenced debt obligation.
Upfront payments received or paid by a Portfolio will be reflected as an asset or liability in the Statement of Assets and Liabilities.
Financial Accounting Standards Board ("FASB") Accounting Standards CodificationTM ("ASC") 815, "Derivatives and Hedging: Overall" ("ASC 815"), is intended to improve financial reporting about derivative instruments by requiring enhanced disclosures to enable investors to better understand how and why the Portfolio uses derivative instruments, how these derivative instruments are accounted
31
The Universal Institutional Funds, Inc.
Annual Report – December 31, 2011
Notes to Financial Statements (cont'd)
for and their effects on the Portfolio's financial position and results of operations.
The following table sets forth the fair value of the Portfolio's derivative contracts by primary risk exposure as of December 31, 2011.
Primary Risk
Exposure | | Statement of
Assets and
Liabilities | | Futures
Contracts
(000)(a) | | Swap
Agreements
(000) | | Foreign
Currency
Exchange
Contracts
(000) | |
| Assets: | |
| Foreign Currency Risk | | Receivables | | $ | — | | | $ | — | | | $ | 184 | | |
| Equity Risk | | Receivables | | | 263 | | | | 14 | | | | — | | |
| Interest Rate Risk | | Receivables | | | 10 | | | | 227 | | | | — | | |
| Total Receivables | | | | $ | 273 | | | $ | 241 | | | $ | 184 | | |
| Liabilities: | |
| Foreign Currency Risk | | Payables | | $ | — | | | $ | — | | | $ | (115 | ) | |
| Equity Risk | | Payables | | | (7 | ) | | | (134 | ) | | | — | | |
| Interest Rate Risk | | Payables | | | (76 | ) | | | (211 | ) | | | — | | |
| Total Payables | | | | $ | (83 | ) | | $ | (345 | ) | | $ | (115 | ) | |
(a) This amount represents the cumulative appreciation (depreciation) of futures contracts as reported in the Portfolio of Investments. The Statement of Assets and Liabilities only reflect the current day variation margin.
The following tables set forth by primary risk exposure the Portfolio's realized gains (losses) and change in unrealized appreciation (depreciation) by type of derivative contract for the year ended December 31, 2011 in accordance with ASC 815.
| Realized Gain (Loss) | |
| Primary Risk Exposure | | Derivative
Type | | Value
(000) | |
| Foreign Currency Risk | | Foreign Currency | |
| |
| | | Exchange Contracts | | $ | 541 | | |
| Equity Risk | | Futures Contracts | | | 123 | | |
| Interest Rate Risk | | Futures Contracts | | | (720 | ) | |
| Equity Risk | | Swap Agreements | | | 33 | | |
| Interest Rate Risk | | Swap Agreements | | | (125 | ) | |
| | | Total | | $ | (148 | ) | |
| Change in Unrealized Appreciation (Depreciation) | |
| Primary Risk Exposure | | Derivative
Type | | Value
(000) | |
| Foreign Currency Risk | | Foreign Currency | |
| |
| | | Exchange Contracts | | $ | (49 | ) | |
| Equity Risk | | Futures Contracts | | | 144 | | |
| Interest Rate Risk | | Futures Contracts | | | (139 | ) | |
| Equity Risk | | Swap Agreements | | | (113 | ) | |
| Interest Rate Risk | | Swap Agreements | | | (7 | ) | |
| | | Total | | $ | (164 | ) | |
For the year ended December 31, 2011, the average monthly principal amount of foreign currency exchange contracts was approximately $23,814,000, the average monthly original value of futures contracts was approximately $23,437,000 and the average monthly notional amount of swap agreements was approximately $14,005,000.
4. Structured Investments: The Portfolio invested a portion of its assets in structured investments. A structured investment is a derivative security designed to offer a return linked to a particular underlying security, currency or market. Structured investments may come in various forms including notes, warrants and options to purchase securities. The Portfolio will typically use structured investments to gain exposure to a permitted underlying security, currency or market when direct access to a market is limited or inefficient from a tax or cost standpoint. Investments in structured investments involve risks including counterparty risk and market risk. Holders of structured investments bear risks of the underlying investment and are subject to counterparty risk because the Portfolio is relying on the creditworthiness of such counterparty and has no rights with respect to the underlying investment. Certain structured investments may be thinly traded or have a limited trading market and may have the effect of increasing the Portfolio's illiquidity to the extent that the Portfolio, at a particular time, may be unable to find qualified buyers for these securities.
5. When-Issued/Delayed Delivery Securities: The Portfolio purchases and sells when-issued and delayed delivery securities. Securities purchased on a when-issued or delayed delivery basis are purchased for delivery beyond the normal settlement date at a stated price and yield, and no income accrues to the Portfolio on such securities prior to delivery date. Payment and delivery for when-issued and delayed delivery securities can take place up to 120 days after the date of the transaction. When the Portfolio enters into a purchase transaction on a when-issued or delayed delivery basis, securities are available for collateral in an amount at least equal in value to the Portfolio's commitments to purchase such securities. Purchasing securities on a when-issued or delayed delivery basis may involve a risk that the market price at the time of delivery may be lower than the agreed upon purchase price, in which case there could be an unrealized loss at the time of delivery. Purchasing investments on a when-issued or delayed delivery basis may be considered a form of leverage which may increase the impact that gains (losses) may have on the Portfolio.
6. Security Lending: The Portfolio lends securities to qualified financial institutions, such as broker-dealers, to earn additional income. Any increase or decrease in the fair value of the securities loaned that might occur and any interest earned or dividends declared on those securities during the term of the loan would remain in the
32
The Universal Institutional Funds, Inc.
Annual Report – December 31, 2011
Notes to Financial Statements (cont'd)
Portfolio. The Portfolio would receive cash or securities as collateral in an amount equal to or exceeding 100% of the current fair value of the loaned securities. The collateral is marked-to-market daily, by the securities lending agent, to ensure that a minimum of 100% collateral coverage is maintained.
Based on pre-established guidelines, the securities lending agent invests any cash collateral that is received in an affiliated money market portfolio and repurchase agreements. Securities lending income is generated from the earnings on the invested collateral and borrowing fees, less any rebates owed to the borrowers and compensation to the lending agent, and is recorded as "Income from Securities Loaned – Net" in the Portfolio's Statement of Operations. Risks in securities lending transactions are that a borrower may not provide additional collateral when required or return the securities when due, and that the value of the short-term investments will be less than the amount of cash collateral plus any rebate that is required to be returned to the borrower.
The value of loaned securities and related collateral outstanding at December 31, 2011 were approximately $10,308,000 and $10,617,000, respectively. The Portfolio received cash collateral of approximately $10,370,000 which was subsequently invested in Repurchase Agreements and Morgan Stanley Institutional Liquidity Funds as reported in the Portfolio of Investments. At December 31, 2011, there was uninvested cash collateral of approximately $75,000, which is not reflected in the Portfolio of Investments. The remaining collateral of $172,000 was received in the form of common stock, which the fund cannot sell or re-pledge, and accordingly is not reflected in the Portfolio of Investments. The Portfolio has the right under the lending agreement to recover the securities from the borrower on demand.
7. Fair Value Measurement: FASB ASC 820, "Fair Value Measurements and Disclosures" ("ASC 820"), defines fair value as the value that the Fund would receive to sell an investment or pay to transfer a liability in a timely transaction with an independent buyer in the principal market, or in the absence of a principal market the most advantageous market for the investment or liability. ASC 820 establishes a three-tier hierarchy to distinguish between (1) inputs that reflect the assumptions market participants would use in valuing an asset or liability developed based on market data obtained from sources independent of the reporting entity (observable inputs) and (2) inputs that reflect the reporting entity's own assumptions about the assumptions market participants would use in valuing an asset or liability developed based on the best information available in the circumstances (unobservable inputs) and to establish classification of fair value measurements for disclosure purposes. Various inputs are used in determining the value of the Fund's investments. The inputs are summarized in the three broad levels listed below.
• Level 1 – unadjusted quoted prices in active markets for identical investments
• Level 2 – other significant observable inputs (including quoted prices for similar investments, interest rates, prepayment speeds, credit risk, etc.)
• Level 3 – significant unobservable inputs including the Fund's own assumptions in determining the fair value of investments. Factors considered in making this determination may include, but are not limited to, information obtained by contacting the issuer, analysts, or the appropriate stock exchange (for exchange-traded securities), analysis of the issuer's financial statements or other available documents and, if necessary, available information concerning other securities in similar circumstances
The inputs or methodology used for valuing securities are not necessarily an indication of the risk associated with investing in those securities and the determination of the significance of a particular input to the fair value measurement in its entirety requires judgment and considers factors specific to each security.
In May 2011, FASB issued Accounting Standards Update ("ASU") 2011-04. The amendments in this update are the results of the work of FASB and the International Accounting Standards Board to develop common requirements for measuring fair value and for disclosing information about fair value measurements, which are effective during interim and annual periods beginning after December 15, 2011. Consequently, these amendments improve the comparability of fair value measurements presented and disclosed in the financial statements prepared in accordance with GAAP and International Financial Reporting Standards. At this time, the Fund's management is evaluating the implications of ASU 2011-04.
8. Indemnifications: The Fund enters into contracts that contain a variety of indemnifications. The Fund's maximum exposure under these arrangements is unknown. However, the Fund has not had prior claims or losses pursuant to these contracts and expects the risk of loss to be remote.
33
The Universal Institutional Funds, Inc.
Annual Report – December 31, 2011
Notes to Financial Statements (cont'd)
9. Other: Security transactions are accounted for on the date the securities are purchased or sold. Realized gains (losses) on the sale of investment securities are determined on the specific identified cost basis. Dividend income and distributions are recorded on the ex-dividend date (except for certain foreign dividends that may be recorded as soon as the Fund is informed of such dividends), net of applicable withholding taxes where recovery of such taxes is not reasonably assured. Interest income is recognized on the accrual basis except where collection is in doubt and is recorded net of foreign withholding tax. Discounts and premiums on securities purchased are amortized according to the effective yield method over their respective lives. Most expenses of the Fund can be directly attributed to a particular Portfolio. Expenses which cannot be directly attributed are apportioned among the Portfolios based upon relative net assets. Income, expenses (other than class specific expenses) and realized and unrealized gains or losses are allocated to each class of shares based upon their relative net assets or other appropriate measures.
Settlement and registration of foreign securities transactions may be subject to significant risks not normally associated with investments in the United States. In certain markets, ownership of shares is defined according to entries in the issuer's share register. It is possible that a Portfolio holding these securities could lose its share registration through fraud, negligence or even mere oversight. In addition, shares being delivered for sales and cash being paid for purchases may be delivered before the exchange is complete. This may subject the Portfolio to further risk of loss in the event of a failure to complete the transaction by the counterparty.
B. Investment Advisory/Sub-Advisory Fees: Morgan Stanley Investment Management Inc. (the "Adviser" or "MS Investment Management"), a wholly-owned subsidiary of Morgan Stanley, provides the Portfolio with investment advisory services for a fee, paid quarterly, at the annual rate based on average daily net assets as follows:
First $500
million | | Next $500
million | | Over $1
billion | |
| | 0.80 | % | | | 0.75 | % | | | 0.70 | % | |
Effective July 1, 2011, the investment advisory service fees were reduced to the annual rate based on average daily net assets as follows:
First $500
million | | Next $500
million | | Over $1
billion | |
| | 0.75 | % | | | 0.70 | % | | | 0.65 | % | |
MS Investment Management has agreed to waive fees payable to it and/or reimburse the Portfolio for certain expenses, after giving effect to custody fee offsets, if necessary, to the extent that the total annual operating expenses, excluding bank overdraft, certain foreign taxes and extraordinary expenses, expressed as a percentage of average daily net assets, exceed the maximum ratio of 1.05% for Class I shares and 1.15% for Class II shares. Effective July 1, 2011, the maximum ratio for Class I shares and Class II shares were reduced to 1.00% and 1.10%, respectively. The fee waivers and/or expense reimbursements will continue for one year or until such time as the Board of Directors acts to discontinue all or a portion of such waivers and/or expense reimbursements when it deems that such action is appropriate. For the year ended December 31, 2011, this waiver amounted to approximately $553,000.
Morgan Stanley Investment Management Limited, ("MSIM Limited") and Morgan Stanley Investment Management Company ("MSIM Company"), each a wholly-owned subsidiary of Morgan Stanley, serve as investment sub-advisers (the "Sub-Advisers") for the Portfolio on a day-to-day basis. MSIM Limited and MSIM Company each select, buy and sell securities for the Portfolio under the supervision of the Adviser. The Adviser pays each of the Sub-Advisers on a monthly basis a portion of the net advisory fees the Adviser receives from the Portfolio.
C. Administration Fees: MS Investment Management (the "Administrator") also provides the Portfolio with administrative services pursuant to an administration agreement for a monthly fee, which on an annual basis equals 0.25% of the average daily net assets of the Portfolio, plus reimbursement of out-of-pocket expenses. Under a sub-administration agreement between the Administrator and State Street Bank and Trust Company ("State Street"), State Street provides certain administrative services to the Fund. For such services, the Administrator pays State Street a portion of the fee the Administrator receives from the Fund.
D. Distribution Fees: Morgan Stanley Distribution, Inc. ("MSDI" or the "Distributor"), a wholly-owned subsidiary of the Adviser, serves as the Distributor of the Portfolio and provides the Portfolio's Class II shareholders with distribution services pursuant to a Distribution Plan (the "Plan") in accordance with Rule 12b-1 under the Act. Under the Plan, the Portfolio is authorized to pay the Distributor a distribution fee, which is accrued daily and paid monthly, at an annual rate of 0.35% of the Portfolio's average daily net assets attributable to Class II shares. The Distributor has agreed to waive 0.25% of the 0.35% distribution fee that it may receive. For
34
The Universal Institutional Funds, Inc.
Annual Report – December 31, 2011
Notes to Financial Statements (cont'd)
the year ended December 31, 2011, this waiver amounted to less than $500.
E. Dividend Disbursing and Transfer Agent: The Fund's dividend disbursing and transfer agent is Morgan Stanley Services Company Inc. ("Morgan Stanley Services").
F. Custodian Fees: State Street (the "Custodian") serves as Custodian for the Fund in accordance with a custodian agreement. The Custodian holds cash, securities, and other assets of the Fund as required by the Act. Custody fees are payable monthly based on assets held in custody, investment purchases and sales activity and account maintenance fees, plus reimbursement for certain out-of-pocket expenses.
The Fund has entered into an arrangement with its Custodian whereby credits realized on uninvested cash balances were used to offset a portion of the Portfolio's expenses. If applicable, these custodian credits are shown as "Expense Offset" in the Statement of Operations.
G. Federal Income Taxes: It is the Portfolio's intention to continue to qualify as a regulated investment company and distribute all of its taxable income. Accordingly, no provision for Federal income taxes is required in the financial statements. Dividend income and distributions to shareholders are recorded on the ex-dividend date.
The Portfolio may be subject to taxes imposed by countries in which it invests. Such taxes are generally based on income and/or capital gains earned or repatriated. Taxes are accrued and applied to net investment income, net realized gains and net unrealized appreciation as such income and/or gains are earned. Taxes may also be based on transactions in foreign currency and are accrued based on the value of investments denominated in such currency.
FASB ASC 740-10 "Income Taxes — Overall" sets forth a minimum threshold for financial statement recognition of the benefit of a tax position taken or expected to be taken in a tax return. Management has concluded there are no significant uncertain tax positions that would require recognition in the financial statements. If applicable, the Portfolio recognizes interest accrued related to unrecognized tax benefits in "Interest Expense" and penalties in ''Other Expenses" in the Statement of Operations. The Portfolio files tax returns with the U.S. Internal Revenue Service, New York and various states. Each of the tax years in the four-year period ended December 31, 2011, remains subject to examination by taxing authorities.
The tax character of distributions paid may differ from the character of distributions shown in the Statements of Changes in Net Assets due to short-term capital gains being treated as ordinary income for tax purposes. The tax character of distributions paid during fiscal 2011 and 2010 was as follows:
2011 Distributions
Paid From: | | 2010 Distributions
Paid From: | |
Ordinary
Income
(000) | | Long-Term
Capital Gain
(000) | | Ordinary
Income
(000) | | Long-Term
Capital Gain
(000) | |
| $ | 981 | | | $ | — | | | $ | 2,632 | | | $ | — | | |
The amount and character of income and capital gain distributions to be paid by the Portfolio are determined in accordance with Federal income tax regulations, which may differ from GAAP. These book/tax differences are considered either temporary or permanent in nature.
Temporary differences are attributable to differing book and tax treatments for the timing of the recognition of gains (losses) on certain investment transactions and the timing of the deductibility of certain expenses.
Permanent differences, primarily due to differing treatments of gains (losses) related to foreign currency transactions and on certain equity securities designated as issued by passive foreign investment companies, paydown adjustments and a reclass of long term dividends received, resulted in the following reclassifications among the components of net assets at December 31, 2011:
Undistributed
(Distributions in
Excess of) Net
Investment
Income (Loss)
(000) | | Accumulated
Net Realized
Gain (Loss)
(000) | | Paid-in
Capital
(000) | |
| $ | 421 | | | $ | (421 | ) | | $ | — | | |
At December 31, 2011, the Portfolio had distributable earnings on a tax basis as follows:
Undistributed
Ordinary
Income
(000) | | Undistributed
Long-Term
Capital Gain
(000) | |
| $ | 1,348 | | | $ | — | | |
At December 31, 2011, cost and unrealized appreciation (depreciation) for U.S. Federal income tax purposes of the investments of the Portfolio were:
Cost
(000) | | Appreciation
(000) | | Depreciation
(000) | | Net
Appreciation
(Depreciation)
(000) | |
| $ | 77,309 | | | $ | 4,066 | | | $ | (7,507 | ) | | $ | (3,441 | ) | |
On December 22, 2010, the Regulated Investment Company Modernization Act of 2010 (the "Modernization Act") was signed into law. The Modernization Act modernizes several tax provisions related to Regulated Investment Companies ("RICs") and their shareholders. One key change made by the
35
The Universal Institutional Funds, Inc.
Annual Report – December 31, 2011
Notes to Financial Statements (cont'd)
Modernization Act is that capital losses will generally retain their character as short-term or long-term and may be carried forward indefinitely to offset future gains. These losses are utilized before other capital loss carryforwards that expire. Generally, the Modernization Act is effective for taxable years beginning after December 22, 2010.
At December 31, 2011, the Portfolio had available for Federal income tax purposes unused capital losses, of approximately $19,405,000, of which $48,000 will expire on December 31, 2016 and $19,357,000 will expire on December 31, 2017.
To the extent that capital loss carryforwards are used to offset any future capital gains realized during the carryforward period as provided by U.S. Federal income tax regulations, no capital gains tax liability will be incurred by the Portfolio for gains realized and not distributed. To the extent that capital gains are offset, such gains will not be distributed to the shareholders.
During the year ended December 31, 2011, the Portfolio utilized capital loss carryforwards for U.S. Federal income tax purposes of approximately $771,000.
H. Security Transactions and Transactions with Affiliates: For the year ended December 31, 2011, purchases and sales of investment securities for the Portfolio, other than long-term U.S. Government securities and short-term investments, were approximately $51,098,000 and $59,916,000, respectively. For the year ended December 31, 2011, purchases and sales of long-term U.S. Government securities were approximately $22,415,000 and $22,436,000, respectively.
The Portfolio invests in Morgan Stanley Institutional Fund, Inc. — Emerging Markets Portfolio, an open-end management investment company managed by the Adviser. The Morgan Stanley Institutional Fund, Inc. — Emerging Markets Portfolio has a cost basis of approximately $2,793,000 at December 31, 2011. Investment Advisory fees paid by the Portfolio are reduced by an amount equal to its pro-rata share of the advisory and administration fees paid by the Morgan Stanley Institutional Fund, Inc. — Emerging Markets Portfolio. For the year ended December 31, 2011, advisory fees paid were reduced by approximately $38,000 relating to the Portfolio's investment in the Morgan Stanley Institutional Fund, Inc. — Emerging Markets Portfolio.
A summary of the Portfolio's transactions in shares of the Morgan Stanley Institutional Fund, Inc. — Emerging Markets Portfolio during the year ended December 31, 2011 is as follows:
Value
December 31,
2010
(000) | | Purchases
at Cost
(000) | | Sales
(000) | | Realized
Gain/Loss
(000) | | Dividend
Income
(000) | | Value
December 31,
2011
(000) | |
| $ | 3,602 | | | $ | 42 | | | $ | 662 | | | $ | (114 | ) | | $ | 42 | | | $ | 2,292 | | |
The Portfolio invests in the Institutional Class of the Morgan Stanley Institutional Liquidity Funds — Money Market Portfolio (the "Liquidity Funds"), an open-end management investment company managed by the Adviser, both directly, and as a portion of the securities held as collateral on loaned securities. Investment Advisory fees paid by the Portfolio are reduced by an amount equal to its pro-rata share of the advisory and administration fees paid by the Portfolio due to its investment in the Liquidity Funds. For the year ended December 31, 2011, advisory fees paid were reduced by approximately $8,000 relating to the Portfolio's investment in the Liquidity Funds.
A summary of the Portfolio's transactions in shares of the Liquidity Funds during the year ended December 31, 2011 is as follows:
Value
December 31,
2010
(000) | | Purchases
at Cost
(000) | | Sales
(000) | | Dividend
Income
(000) | | Value
December 31,
2011
(000) | |
| $ | 25,889 | | | $ | 37,935 | | | $ | 53,405 | | | $ | 8 | | | $ | 10,419 | | |
For the year ended December 31, 2011, the Portfolios invested in Citigroup, Inc., and its affiliated broker/dealers which may be deemed affiliates of the Adviser, Administrator and Distributor under Section 17 of the Act.
Value
December 31,
2010
(000) | | Purchases
at Cost
(000) | | Sales
(000) | | Realized
Gain/Loss
(000) | | Interest
Income
(000) | | Value
December 31,
2011
(000) | |
| $ | 114 | | | $ | 522 | | | $ | 318 | | | $ | (16 | ) | | $ | 9 | | | $ | 294 | | |
I. Regulatory Settlement Proceeds: For the year ended December 31, 2010, the Portfolio received approximately $77,000 in settlement of administrative proceedings against other unaffiliated third parties involving findings by the SEC of market timing and/or late trading of mutual funds. The settlement is recorded as an increase to paid-in capital in the accompanying financial statements.
J. Other (unaudited): At December 31, 2011, the Portfolio had otherwise unaffiliated record owners of 10% or greater. Investment activities of these shareholders could have a material impact on the Portfolio. The aggregate percentage of such owners was 73.2% and 85.5%, for Class I and Class II, respectively.
36
The Universal Institutional Funds, Inc.
Annual Report – December 31, 2011
Report of Independent Registered Public Accounting Firm
To the Shareholders and Board of Directors of
The Universal Institutional Funds, Inc. —
Global Tactical Asset Allocation Portfolio
We have audited the accompanying statement of assets and liabilities of Global Tactical Asset Allocation Portfolio (one of the portfolios constituting The Universal Institutional Funds, Inc.) (the "Portfolio"), including the portfolio of investments, as of December 31, 2011, and the related statement of operations for the year then ended, the statements of changes in net assets for each of the two years in the period then ended, and the financial highlights for each of the periods indicated therein. These financial statements and financial highlights are the responsibility of the Portfolio's management. Our responsibility is to express an opinion on these financial statements and financial highlights based on our audits.
We conducted our audits in accordance with the standards of the Public Company Accounting Oversight Board (United States). Those standards require that we plan and perform the audit to obtain reasonable assurance about whether the financial statements and financial highlights are free of material misstatement. We were not engaged to perform an audit of the Portfolio's internal control over financial reporting. Our audits included consideration of internal control over financial reporting as a basis for designing audit procedures that are appropriate in the circumstances, but not for the purpose of expressing an opinion on the effectiveness of the Portfolio's internal control over financial reporting. Accordingly, we express no such opinion. An audit also includes examining, on a test basis, evidence supporting the amounts and disclosures in the financial statements and financial highlights, assessing the accounting principles used and significant estimates made by management, and evaluating the overall financial statement presentation. Our procedures included confirmation of securities owned as of December 31, 2011, by correspondence with the custodian and others or by other appropriate auditing procedures where replies from others were not received. We believe that our audits provide a reasonable basis for our opinion.
In our opinion, the financial statements and financial highlights referred to above present fairly, in all material respects, the financial position of Global Tactical Asset Allocation Portfolio of The Universal Institutional Funds, Inc. at December 31, 2011, the results of its operations for the year then ended, the changes in its net assets for each of the two years in the period then ended, and the financial highlights for each of the periods indicated therein, in conformity with U.S. generally accepted accounting principles.

Boston, Massachusetts
February 17, 2012
37
The Universal Institutional Funds, Inc.
Annual Report – December 31, 2011
Federal Income Tax Information (unaudited)
For Federal income tax purposes, the following information is furnished with respect to the distributions paid by the Portfolio during its taxable year ended December 31, 2011.
For corporate shareholders 2.8% of the dividends qualified for the dividends received deduction.
In January, the Portfolio provides tax information to shareholders for the preceding calendar year.
38
The Universal Institutional Funds, Inc.
Annual Report – December 31, 2011
Director and Officer Information (unaudited)
Independent Directors:
Name, Age and Address of
Independent Director | | Position(s)
Held with
Registrant | | Length of
Time
Served* | | Principal Occupation(s) During Past 5 Years | | Number of
Portfolios in
Fund
Complex
Overseen
by
Independent
Director** | | Other Directorships Held by Independent
Directors†† | |
Frank L. Bowman (67)
c/o Kramer Levin Naftalis &
Frankel LLP
Counsel to the Independent Directors
1177 Avenue of the Americas New York, NY 10036 | | Director | | Since
August
2006 | | President, Strategic Decisions, LLC (consulting) (since February 2009); Director or Trustee of various Morgan Stanley Funds (since August 2006); Chairperson of the Insurance Sub-Committee of the Compliance and Insurance Committee (since February 2007); served as President and Chief Executive Officer of the Nuclear Energy Institute (policy organization) (February 2005-November 2008); retired as Admiral, U.S. Navy after serving over 38 years on active duty including 8 years as Director of the Naval Nuclear Propulsion Program in the Department of the Navy and the U.S. Department of Energy (1996-2004); served as Chief of Naval Personnel (July 1994-September 1996); and on the Joint Staff as Director of Political Military Affairs (June 1992-July 1994); Knighted as Honorary Knight Commander of the Most Excellent Order of the British Empire; Awarded the Officer de l'Orde National du Mérite by the French Government; elected to the National Academy of Engineering (2009). | | | 102 | | | Director of BP p.l.c.; Director of Naval and Nuclear Technologies LLP; Director of the Armed Services YMCA of the USA and the Naval Submarine League; Director of the American Shipbuilding Suppliers Association; Member of the National Security Advisory Council of the Center for U.S. Global Engagement and a member of the CNA Military Advisory Board; Member of the American Lung Association's President's Council. | |
|
Michael Bozic (71)
c/o Kramer Levin Naftalis & Frankel LLP
Counsel to the Independent Directors
1177 Avenue of the Americas New York, NY 10036 | | Director | | Since
April
1994 | | Private investor; Chairperson of the Compliance and Insurance Committee (since October 2006); Director or Trustee of various Morgan Stanley Funds (since July 2003); formerly, Chairperson of the Insurance Committee (July 2006-September 2006); Vice Chairman of Kmart Corporation (December 1998-October 2000), Chairman and Chief Executive Officer of Levitz Furniture Corporation (November 1995-November 1998) and President and Chief Executive Officer of Hills Department Stores (May 1991-July 1995); variously Chairman, Chief Executive Officer, President and Chief Operating Officer (1987-1991) of the Sears Merchandise Group of Sears, Roebuck & Co. | | | 104 | | | Director of various business organizations. | |
|
Kathleen A. Dennis (58)
c/o Kramer Levin Naftalis & Frankel LLP
Counsel to the Independent Directors
1177 Avenue of the Americas New York, NY 10036 | | Director | | Since
August
2006 | | President, Cedarwood Associates (mutual fund and investment management consulting) (since July 2006); Chairperson of the Money Market and Alternatives Sub-Committee of the Investment Committee (since October 2006) and Director or Trustee of various Morgan Stanley Funds (since August 2006); formerly, Senior Managing Director of Victory Capital Management (1993-2006). | | | 102 | | | Director of various non-profit organizations. | |
|
Dr. Manuel H. Johnson (63)
c/o Johnson Smick
Group, Inc.
888 16th Street, N.W. Suite 740
Washington, D.C. 20006 | | Director | | Since
July
1991 | | Senior Partner, Johnson Smick International, Inc. (consulting firm); Chairperson of the Investment Committee (since October 2006) and Director or Trustee of various Morgan Stanley Funds (since July 1991); Co-Chairman and a founder of the Group of Seven Council (G7C) (international economic commission); formerly, Chairperson of the Audit Committee (July 1991-September 2006); Vice Chairman of the Board of Governors of the Federal Reserve System and Assistant Secretary of the U.S. Treasury. | | | 104 | | | Director of NVR, Inc. (home construction). | |
|
39
The Universal Institutional Funds, Inc.
Annual Report – December 31, 2011
Director and Officer Information (unaudited) (cont'd)
Independent Directors (cont'd):
Name, Age and Address of
Independent Director | | Position(s)
Held with
Registrant | | Length of
Time
Served* | | Principal Occupation(s) During Past 5 Years | | Number of
Portfolios in
Fund
Complex
Overseen
by
Independent
Director** | | Other Directorships Held by Independent
Directors†† | |
Joseph J. Kearns (69)
c/o Kearns & Associates LLC PMB754
22631 Pacific Coast Highway Malibu, CA 90265 | | Director | | Since
August
1994 | | President, Kearns & Associates LLC (investment consulting); Chairperson of the Audit Committee (since October 2006) and Director or Trustee of various Morgan Stanley Funds (since August 1994); formerly Deputy Chairperson of the Audit Committee (July 2003-September 2006) and Chairperson of the Audit Committee of various Morgan Stanley Funds and since August 1994); CFO of the J. Paul Getty Trust. | | | 105 | | | Director of Electro Rent Corporation (equipment leasing) and The Ford Family Foundation. | |
|
Michael F. Klein (53)
c/o Kramer Levin Naftalis & Frankel LLP
Counsel to the
Independent Directors
1177 Avenue of the Americas
New York, NY 10036 | | Director | | Since
August
2006 | | Managing Director, Aetos Capital, LLC (since March 2000) and Co-President, Aetos Alternatives Management, LLC (since January 2004); Chairperson of the Fixed Income Sub-Committee of the Investment Committee (since October 2006) and Director or Trustee of various Morgan Stanley Funds (since August 2006); formerly, Managing Director, Morgan Stanley & Co., Inc. and Morgan Stanley Dean Witter Investment Management, President, various Morgan Stanley Funds (June 1998-March 2000) and Principal, Morgan Stanley & Co., Inc. and Morgan Stanley Dean Witter Investment Management (August 1997-December 1999). | | | 102 | | | Director of certain investment funds managed or sponsored by Aetos Capital LLC. Director of Sanitized AG and Sanitized Marketing AG (specialty chemicals). | |
|
Michael E. Nugent (75)
c/o Triumph Capital, L.P.
445 Park Avenue
New York, NY 10022 | | Chairperson of the
Board and Director | | Chairperson of the Boards since July 2006 and Director since July 1991 | | General Partner, Triumph Capital, L.P. (private investment partnership); Chairperson of the Boards of various Morgan Stanley Funds (since July 2006); Director or Trustee of various Morgan Stanley Funds (since July 1991); formerly, Chairperson of the Insurance Committee (until July 2006). | | | 104 | | | None. | |
|
W. Allen Reed (64)
c/o Kramer Levin Naftalis & Frankel LLP
Counsel to the
Independent Directors
1177 Avenue of the Americas
New York, NY 10036 | | Director | | Since
August
2006 | | Chairperson of the Equity Sub-Committee of the Investment Committee (since October 2006) and Director or Trustee of various Morgan Stanley Funds (since August 2006); formerly, President and CEO of General Motors Asset Management; Chairman and Chief Executive Officer of the GM Trust Bank and Corporate Vice President of General Motors Corporation (July 1994-December 2005). | | | 102 | | | Director of Temple-Inland Industries (packaging and forest products), Director of Legg Mason, Inc. and Director of the Auburn University Foundation. | |
|
Fergus Reid (79)
c/o Joe Pietryka, Inc.
85 Charles Colman Blvd. Pawling, NY 12564 | | Director | | Since
June
1992 | | Chairman, Joe Pietryka, Inc.; Chairperson of the Governance Committee and Director or Trustee of various Morgan Stanley Funds (since June 1992). | | | 105 | | | Trustee and Director of certain investment companies in the JPMorgan Funds complex managed by JP Morgan Investment Management Inc. | |
|
40
The Universal Institutional Funds, Inc.
Annual Report – December 31, 2011
Director and Officer Information (unaudited) (cont'd)
Interested Director:
Name, Age and Address of
Interested Director | | Position(s)
Held with
Registrant | | Term of
Office and
Length of
Time
Served* | | Principal Occupation(s) During Past 5 Years | | Number of
Portfolios in
Fund
Complex
Overseen by
Interested
Director** | | Other Directorships Held by Interested
Director†† | |
James F. Higgins (64)
c/o Morgan Stanley Services Company Inc.
Harborside Financial Center
201 Plaza Two
Jersey City, NJ 07311 | | Director | | Since
June
2000 | | Director or Trustee of various Morgan Stanley Funds (since June 2000); Senior Advisor of Morgan Stanley (since August 2000). | | | 103 | | | Director of AXA Financial, Inc. and The Equitable Life Assurance Society of the United States (financial services). | |
|
* Each Director serves an indefinite term, until his or her successor is elected.
†† This includes any directorships at public companies and registered investment companies held by the Director at any time during the past five years.
** The Fund Complex includes (as of December 31, 2011) all open-end and closed-end funds (including all of their portfolios) advised by Morgan Stanley Investment Management Inc. (the "Adviser") and any funds that have an adviser that is an affiliated person of the Adviser (including, but not limited to, Morgan Stanley AIP GP LP).
41
The Universal Institutional Funds, Inc.
Annual Report – December 31, 2011
Director and Officer Information (unaudited) (cont'd)
Executive Officers:
| Name, Age and Address of Executive Officer | | Position(s)
Held with
Registrant | | Term of Office
and Length of
Time Served* | | Principal Occupation(s) During Past 5 Years | |
Arthur Lev (50)
522 Fifth Avenue
New York, NY 10036 | | President and Principal Executive Officer — Equity and Fixed Income Funds | | Since June 2011 | | President and Principal Executive Officer (since June 2011) of the Equity and Fixed Income Funds in the Fund Complex; Head of the Long Only Business of Morgan Stanley Investment Management (since February 2011); Managing Director of the Adviser and various entities affiliated with the Adviser (since December 2006). Formerly, Chief Strategy Officer of Morgan Stanley Investment Management's Traditional Asset Management business (November 2010-February 2011); General Counsel of Morgan Stanley Investment Management (December 2006-October 2010); Partner and General Counsel of FrontPoint Partners LLC (July 2002 to December 2006); Managing Director and General Counsel of Morgan Stanley Investment Management (May 2000-June 2002). | |
|
Mary Ann Picciotto (38)
c/o Morgan Stanley Services
Company Inc.
Harborside Financial Center
201 Plaza Two
Jersey City, NJ 07311 | | Chief Compliance Officer | | Since
May
2010 | | Managing Director of the Adviser and various entities affiliated with the Adviser; Chief Compliance Officer of the various Morgan Stanley Funds (since May 2010); Chief Compliance Officer of the Adviser (since April 2007). | |
|
Stefanie V. Chang Yu (45)
522 Fifth Avenue
New York, NY 10036 | | Vice President | | Since
December
1997 | | Managing Director of the Adviser and various entities affiliated with the Adviser; Vice President of the various Morgan Stanley Funds (since December 1997). | |
|
Mary E. Mullin (44)
522 Fifth Avenue
New York, NY 10036 | | Secretary | | Since
June
1999 | | Executive Director of the Adviser and various entities affiliated with the Adviser; Secretary of the various Morgan Stanley Funds (since June 1999). | |
|
Francis J. Smith (46)
c/o Morgan Stanley Services
Company Inc.
Harborside Financial Center
201 Plaza Two
Jersey City, NJ 07311 | | Treasurer and Principal Financial Officer | | Treasurer since July 2003 and Principal Financial Officer since September 2002 | | Executive Director of the Adviser and various entities affiliated with the Adviser; Treasurer and Principal Financial Officer of the various Morgan Stanley Funds (since July 2003). | |
|
* Each Officer serves an indefinite term, until his or her successor is elected.
42
(This page has been left blank intentionally.)
(This page has been left blank intentionally.)
The Universal Institutional Funds, Inc.
Annual Report – December 31, 2011
Investment Adviser and Administrator
Morgan Stanley Investment Management Inc.
522 Fifth Avenue
New York, New York 10036
Distributor
Morgan Stanley Distribution, Inc.
100 Front Street, Suite 400
West Conshohocken, Pennsylvania 19428
Dividend Disbursing and Transfer Agent
Morgan Stanley Services Company Inc.
P.O. Box 219804
Kansas City, Missouri 64121
Custodian
State Street Bank and Trust Company
One Lincoln Street
Boston, Massachusetts 02111
Legal Counsel
Dechert LLP
1095 Avenue of the Americas
New York, New York 10036
Independent Registered Public Accounting Firm
Ernst & Young LLP
200 Clarendon Street
Boston, Massachusetts 02116
Reporting to Shareholders
Each Morgan Stanley fund provides a complete schedule of portfolio holdings in its semi-annual and annual reports within 60 days of the end of the fund's second and fourth fiscal quarters by filing the schedule electronically with the Securities and Exchange Commission (SEC). The semi-annual reports are filed on Form N-CSRS and the annual reports are filed on Form N-CSR. Morgan Stanley also delivers the semi-annual and annual reports to fund shareholders and makes these reports available on its public website, www.morganstanley.com. Each Morgan Stanley fund also files a complete schedule of portfolio holdings with the SEC for the fund's first and third fiscal quarters on Form N-Q. Morgan Stanley does not deliver the reports for the first and third fiscal quarters to shareholders, nor are the reports posted to the Morgan Stanley public website. You may, however, obtain the Form N-Q filings (as well as the Form N-CSR and N-CSRS filings) by accessing the SEC's website, www.sec.gov. You may also review and copy them at the SEC's Public Reference Room in Washington, DC. Information on the operation of the SEC's Public Reference Room may be obtained by calling the SEC toll free at 1-800-SEC-0330. You can also request copies of these materials, upon payment of a duplicating fee, by electronic request at the SEC's email address (publicinfo@sec.gov) or by writing the Public Reference Room of the SEC, Washington, DC 20549-0102.
Proxy Voting Policies and Procedures and Proxy Voting Record
You may obtain a copy of the Fund's Proxy Voting Policy and Procedures and information regarding how the Fund voted proxies relating to portfolio securities during the most recent twelve-month period ended June 30, without charge, upon request, by calling toll free 1-800-281-2715 or by visiting our website at www.morganstanley.com. This information is also available on the SEC's website at www.sec.gov.
This report is submitted for the general information of the shareholders of the Portfolio. For more detailed information about the Portfolio, its fees and expenses and other pertinent information, please read its Prospectus. The Fund's Statement of Additional Information contains additional information about the Portfolio, including its Directors. It is available, without charge, by calling 1-800-281-2715.
This report is not authorized for distribution to prospective investors in the Portfolio unless preceded or accompanied by an effective Prospectus. Read the Prospectus carefully before investing.
UIFIMANN
IU12-00220P-Y12/11

The Universal Institutional Funds, Inc.
Semi-Annual Report – June 30, 2012
Global Tactical Asset Allocation Portfolio
The Portfolio is intended to be a funding vehicle for variable annuity contracts and variable life insurance policies offered by the separate accounts of certain life insurance companies.
The Universal Institutional Funds, Inc.
Semi-Annual Report – June 30, 2012
Table of Contents
| Expense Example | | | 2 | | |
|
| Investment Advisory Agreement Approval | | | 3 | | |
|
| Portfolio of Investments | | | 5 | | |
|
| Statement of Assets and Liabilities | | | 21 | | |
|
| Statement of Operations | | | 22 | | |
|
| Statements of Changes in Net Assets | | | 23 | | |
|
| Financial Highlights | | | 24 | | |
|
| Notes to Financial Statements | | | 26 | | |
|
| Director and Officer Information | | Back Cover | |
|
1
The Universal Institutional Funds, Inc.
Semi-Annual Report – June 30, 2012
Expense Example (unaudited)
Global Tactical Asset Allocation Portfolio
As a shareholder of the Portfolio, you incur two types of costs: (1) insurance company charges, and (2) ongoing costs, including management fees, distribution (12b-1) fees and other Portfolio expenses. This example is intended to help you understand your ongoing costs (in dollars) of investing in the Portfolio and to compare these costs with the ongoing costs of investing in other mutual funds.
This example is based on an investment of $1,000 invested at the beginning of the six-month period ended June 30, 2012 and held for the entire six-month period.
Actual Expenses
The table below provides information about actual account values and actual expenses. You may use the information in this table, together with the amount you invested, to estimate the expenses that you paid over the period. Simply divide your account value by $1,000 (for example, an $8,600 account value divided by $1,000 = 8.6), then multiply the result by the number in the table under the heading entitled "Actual Expenses Paid During Period" to estimate the expenses you paid on your account during this period.
Please note that "Actual Expenses Paid During Period" are grossed up to reflect Portfolio expenses prior to the effect of Expense Offset (See Note F in the Notes to Financial Statements). Therefore, the annualized net expense ratios may differ from the ratio of expenses to average net assets shown in the Financial Highlights.
Hypothetical Example for Comparison Purposes
The table below provides information about hypothetical account values and hypothetical expenses based on the Portfolio's actual expense ratio and an assumed rate of return of 5% per year before expenses, which is not the Portfolio's actual return. The hypothetical account values and expenses may not be used to estimate the actual ending account balance or expenses you paid for the period. You may use this information to compare the ongoing costs of investing in the Portfolio and other funds. To do so, compare this 5% hypothetical example with the 5% hypothetical examples that appear in the shareholder reports of the other funds.
Please note that the expenses shown in the table are meant to highlight your ongoing costs only and do not reflect any insurance company charges. Therefore, the table below is useful in comparing ongoing costs, but will not help you determine the relative total cost of owning different funds. In addition, if these insurance company charges were included, your costs would have been higher.
| | | Beginning
Account Value
1/1/12 | | Actual Ending
Account Value
6/30/12 | | Hypothetical
Ending
Account Value | | Actual
Expenses Paid
During Period* | | Hypothetical
Expenses Paid
During Period* | | Net Expense
Ratio During
Period** | |
| Global Tactical Asset Allocation Portfolio Class I | | $ | 1,000.00 | | | $ | 1,051.30 | | | $ | 1,020.19 | | | $ | 4.79 | | | $ | 4.72 | | | | 0.94 | % | |
| Global Tactical Asset Allocation Portfolio Class II | | | 1,000.00 | | | | 1,050.20 | | | | 1,019.69 | | | | 5.30 | | | | 5.22 | | | | 1.04 | | |
* Expenses are calculated using each Portfolio Class' annualized net expense ratio (as disclosed), multiplied by the average account value over the period, and multiplied by 182/366 (to reflect the most recent one-half year period).
** Annualized.
2
The Universal Institutional Funds, Inc.
Semi-Annual Report – June 30, 2012
Investment Advisory Agreement Approval (unaudited)
Nature, Extent and Quality of Services
The Board reviewed and considered the nature and extent of the investment advisory services provided by the Adviser (as defined herein) under the advisory agreement, including portfolio management, investment research and equity and fixed income securities trading. The Board also reviewed and considered the nature and extent of the non-advisory, administrative services provided by the Portfolio's Adviser under the administration agreement, including accounting, clerical, bookkeeping, compliance, business management and planning, and the provision of supplies, office space and utilities at the Adviser's expense. (The advisory and administration agreements together are referred to as the "Management Agreement.") The Board also compared the nature of the services provided by the Adviser with similar services provided by non-affiliated advisers as reported to the Board by Lipper, Inc. ("Lipper").
The Board reviewed and considered the qualifications of the portfolio managers, the senior administrative managers and other key personnel of the Adviser who provide the administrative and advisory services to the Portfolio. The Board determined that the Adviser's portfolio managers and key personnel are well qualified by education and/or training and experience to perform the services in an efficient and professional manner. The Board concluded that the nature and extent of the advisory and administrative services provided were necessary and appropriate for the conduct of the business and investment activities of the Portfolio and supported its decision to approve the Management Agreement.
Performance, Fees and Expenses of the Portfolio
The Board reviewed the performance, fees and expenses of the Portfolio compared to its peers, as determined by Lipper, and to appropriate benchmarks where applicable. The Board discussed with the Adviser the performance goals and the actual results achieved in managing the Portfolio. When considering a fund's performance, the Board and the Adviser place emphasis on trends and longer-term returns (focusing on one-year, three-year and five-year performance, as of December 31, 2011, or since inception, as applicable). When a fund underperforms its benchmark and/or its peer group average, they discuss the causes of such underperformance and, where necessary, they discuss specific changes to investment strategy or investment personnel. The Board noted that the Portfolio's performance was better than its peer group average for the one- and three-year periods but below its peer group average for the five-year period. The Board discussed with the Adviser the level of the advisory and administration fees (together, the "management fee") for this Portfolio relative to comparable funds and/or other accounts advised by the Adviser and/or compared to its peers as determined by Lipper. In addition to the management fee, the Board also reviewed the Portfolio's total expense ratio. When a fund's management fee and/or its expense ratio are higher than comparable funds or peers, the Board and the Adviser discuss the reasons for this and, where appropriate, they discuss possible waivers and/or caps. The Board noted that the Portfolio's management fee and total expense ratio were higher than its peer group average. After discussion, the Board concluded that (i) the Portfolio's performance was competitive with its peer group average, and (ii) the Portfolio's management fee and total expense ratio, although higher than its peer group average, were acceptable given the quality and nature of services provided.
Economies of Scale
The Board considered the size and growth prospects of the Portfolio and how that relates to the Portfolio's total expense ratio and particularly the Portfolio's management fee rate, which includes breakpoints. In conjunction with its review of the Adviser's profitability, the Board discussed with the Adviser how a change in assets can affect the efficiency or effectiveness of managing the Portfolio and whether the management fee level is appropriate relative to current and projected asset levels and/or whether the management fee structure reflects economies of scale as asset levels change. The Board has determined that its review of the actual and potential economies of scale of the Portfolio supports its decision to approve the Management Agreement.
Profitability of the Adviser and Affiliates
The Board considered information concerning the costs incurred and profits realized by the Adviser and its affiliates during the last year from their relationship with the Portfolio and during the last two years from their relationship with the Morgan Stanley Fund Complex and reviewed with the Adviser the cost allocation methodology used to determine the profitability of the Adviser
3
The Universal Institutional Funds, Inc.
Semi-Annual Report – June 30, 2012
Investment Advisory Agreement Approval (unaudited) (cont'd)
and affiliates. The Board has determined that its review of the analysis of the Adviser's expenses and profitability supports its decision to approve the Management Agreement.
Other Benefits of the Relationship
The Board considered other benefits to the Adviser and its affiliates derived from their relationship with the Portfolio and other funds advised by the Adviser. These benefits may include, among other things, "float" benefits derived from handling of checks for purchases and sales, research received by the Adviser generated from commission dollars spent on funds' portfolio trading and fees for distribution and/or shareholder servicing. The Board reviewed with the Adviser each of these arrangements and the reasonableness of the Adviser's costs relative to the services performed. The Board has determined that its review of the other benefits received by the Adviser or its affiliates supports its decision to approve the Management Agreement.
Resources of the Adviser and Historical Relationship Between the Portfolio and the Adviser
The Board considered whether the Adviser is financially sound and has the resources necessary to perform its obligations under the Management Agreement. The Board also reviewed and considered the historical relationship between the Portfolio and the Adviser, including the organizational structure of the Adviser, the policies and procedures formulated and adopted by the Adviser for managing the Portfolio's operations and the Board's confidence in the competence and integrity of the senior managers and key personnel of the Adviser. The Board concluded that the Adviser has the financial resources necessary to fulfill its obligations under the Management Agreement and that it is beneficial for the Portfolio to continue its relationship with the Adviser.
Other Factors and Current Trends
The Board considered the controls and procedures adopted and implemented by the Adviser and monitored by the Fund's Chief Compliance Officer and concluded that the conduct of business by the Adviser indicates a good faith effort on its part to adhere to high ethical standards in the conduct of the Portfolio's business.
General Conclusion
After considering and weighing all of the above factors, the Board concluded that it would be in the best interest of the Portfolio and its shareholders to approve renewal of the Management Agreement for another year. In reaching this conclusion the Board did not give particular weight to any single factor referenced above. The Board considered these factors over the course of numerous meetings, some of which were in executive session with only the independent Board members and their counsel present. It is possible that individual Board members may have weighed these factors differently in reaching their individual decisions to approve the Management Agreement.
4
The Universal Institutional Funds, Inc.
Semi-Annual Report – June 30, 2012 (unaudited)
Portfolio of Investments
Global Tactical Asset Allocation Portfolio
| | | Face Amount
(000) | | Value
(000) | |
| Fixed Income Securities (39.4%) | |
| Agency Fixed Rate Mortgages (4.7%) | |
| United States (4.7%) | |
Federal Home Loan Mortgage Corporation,
Gold Pool
4.00%, 12/1/41 | | $ | 126 | | | $ | 134 | | |
July TBA:
3.00%, 7/25/27 (a) | | | 75 | | | | 78 | | |
| 3.50%, 7/25/42 (a) | | | 275 | | | | 289 | | |
Federal National Mortgage Association,
Conventional Pools:
4.00%, 11/1/41 - 12/1/41 | | | 640 | | | | 682 | | |
| 5.00%, 1/1/41 - 3/1/41 | | | 332 | | | | 365 | | |
| 5.50%, 2/1/38 | | | 152 | | | | 167 | | |
| 6.00%, 1/1/38 | | | 221 | | | | 244 | | |
| 6.50%, 8/1/38 | | | 51 | | | | 57 | | |
July TBA:
5.00%, 7/25/42 (a) | | | 200 | | | | 216 | | |
Government National Mortgage Association,
July TBA:
4.00%, 7/25/42 (a) | | | 590 | | | | 644 | | |
Various Pool
4.50%, 8/15/39 | | | 94 | | | | 103 | | |
| Total Agency Fixed Rate Mortgages (Cost $2,943) | | | 2,979 | | |
| Asset-Backed Securities (0.7%) | |
| United States (0.7%) | |
Ally Auto Receivables Trust,
0.97%, 8/17/15 | | | 125 | | | | 125 | | |
CNH Equipment Trust,
1.20%, 5/16/16 | | | 125 | | | | 126 | | |
CVS Pass-Through Trust,
6.04%, 12/10/28 | | | 64 | | | | 73 | | |
North Carolina State Education Assistance
Authority,
1.27%, 7/25/25 (b) | | | 100 | | | | 100 | | |
| Total Asset-Backed Securities (Cost $413) | | | 424 | | |
| Commercial Mortgage Backed Securities (0.2%) | |
| United States (0.2%) | |
JP Morgan Chase Commercial Mortgage
Securities Corp.,
4.17%, 8/15/46 | | | 105 | | | | 115 | | |
UBS-Barclays Commercial Mortgage Trust,
3.53%, 5/10/63 | | | 40 | | | | 41 | | |
| Total Commercial Mortgage Backed Securities (Cost $147) | | | 156 | | |
| Corporate Bonds (9.4%) | |
| Australia (0.8%) | |
Australia & New Zealand Banking Group Ltd.,
5.13%, 9/10/19 | | EUR | 100 | | | | 134 | | |
Commonwealth Bank of Australia,
5.00%, 10/15/19 (c)(d) | | $ | 125 | | | | 138 | | |
Macquarie Bank Ltd.,
6.63%, 4/7/21 (c) | | | 35 | | | | 35 | | |
Macquarie Group Ltd.,
6.00%, 1/14/20 (c)(d) | | | 50 | | | | 50 | | |
| | | Face Amount
(000) | | Value
(000) | |
National Australia Bank Ltd.,
3.50%, 1/23/15 | | EUR | 50 | | | $ | 66 | | |
Wesfarmers Ltd.,
2.98%, 5/18/16 (c) | | $ | 30 | | | | 31 | | |
Westpac Banking Corp.,
3.00%, 12/9/15 | | | 50 | | | | 52 | | |
| | | | 506 | | |
| Belgium (0.1%) | |
Anheuser-Busch InBev Worldwide, Inc.,
5.00%, 4/15/20 | | | 50 | | | | 59 | | |
| Brazil (0.2%) | |
Petrobras International Finance Co.,
5.75%, 1/20/20 | | | 50 | | | | 55 | | |
Vale Overseas Ltd.,
5.63%, 9/15/19 | | | 85 | | | | 94 | | |
| | | | 149 | | |
| France (0.5%) | |
Banque Federative du Credit Mutuel SA,
3.00%, 10/29/15 | | EUR | 50 | | | | 65 | | |
BNP Paribas SA,
5.00%, 1/15/21 (d) | | $ | 60 | | | | 61 | | |
Credit Agricole SA,
3.90%, 4/19/21 | | EUR | 50 | | | | 51 | | |
| 5.88%, 6/11/19 | | | 50 | | | | 61 | | |
Veolia Environnement SA,
6.75%, 4/24/19 | | | 50 | | | | 77 | | |
| | | | 315 | | |
| Germany (0.3%) | |
Daimler Finance North America LLC,
8.50%, 1/18/31 | | $ | 75 | | | | 115 | | |
Deutsche Bank AG,
5.00%, 6/24/20 | | EUR | 50 | | | | 64 | | |
| | | | 179 | | |
| Israel (0.1%) | |
Teva Pharmaceutical Finance IV BV,
3.65%, 11/10/21 (d) | | $ | 50 | | | | 53 | | |
| Italy (0.6%) | |
Enel Finance International N.V.,
5.13%, 10/7/19 (c)(d) | | | 100 | | | | 96 | | |
Finmeccanica Finance SA,
8.13%, 12/3/13 | | EUR | 100 | | | | 134 | | |
Telecom Italia Finance SA,
7.75%, 1/24/33 | | | 30 | | | | 38 | | |
UniCredit SpA,
4.38%, 2/10/14 | | | 50 | | | | 63 | | |
| 5.75%, 9/26/17 | | | 50 | | | | 59 | | |
| | | | 390 | | |
| Luxembourg (0.4%) | |
ArcelorMittal,
9.38%, 6/3/16 | | | 50 | | | | 74 | | |
| 9.85%, 6/1/19 | | $ | 75 | | | | 89 | | |
ITW Finance Europe SA,
5.25%, 10/1/14 | | EUR | 50 | | | | 69 | | |
| | | | 232 | | |
The accompanying notes are an integral part of the financial statements.
5
The Universal Institutional Funds, Inc.
Semi-Annual Report – June 30, 2012 (unaudited)
Portfolio of Investments (cont'd)
Global Tactical Asset Allocation Portfolio
| | | Face Amount
(000) | | Value
(000) | |
| Netherlands (0.3%) | |
ABN Amro Bank N.V.,
3.63%, 10/6/17 | | EUR | 50 | | | $ | 66 | | |
Aegon N.V.,
4.63%, 12/1/15 (d) | | $ | 50 | | | | 53 | | |
Cooperatieve Centrale
Raiffeisen-Boerenleenbank BA,
3.75%, 11/9/20 | | EUR | 50 | | | | 61 | | |
| | | | 180 | | |
| Spain (0.1%) | |
Gas Natural Capital Markets SA,
4.13%, 1/26/18 | | | 50 | | | | 55 | | |
Santander Holdings USA, Inc.,
4.63%, 4/19/16 | | $ | 20 | | | | 19 | | |
| | | | 74 | | |
| Sweden (0.1%) | |
Nordea Bank AB,
4.00%, 3/29/21 | | EUR | 70 | | | | 83 | | |
| Switzerland (0.2%) | |
ABB Treasury Center USA, Inc.,
2.50%, 6/15/16 (c)(d) | | $ | 25 | | | | 26 | | |
Credit Suisse AG,
4.75%, 8/5/19 | | EUR | 75 | | | | 106 | | |
| | | | 132 | | |
| United Kingdom (1.9%) | |
Abbey National Treasury Services PLC,
3.63%, 10/14/16 | | | 100 | | | | 134 | | |
BAA Funding Ltd.,
4.60%, 2/15/18 | | | 50 | | | | 68 | | |
Barclays Bank PLC,
6.00%, 1/23/18 - 1/14/21 | | | 100 | | | | 121 | | |
BAT International Finance PLC,
5.38%, 6/29/17 | | | 50 | | | | 73 | | |
Diageo Capital PLC,
1.50%, 5/11/17 (d) | | $ | 25 | | | | 25 | | |
Diageo Investment Corp.,
2.88%, 5/11/22 (d) | | | 25 | | | | 26 | | |
HSBC Holdings PLC,
4.50%, 4/30/14 | | EUR | 50 | | | | 67 | | |
| 6.25%, 3/19/18 | | | 50 | | | | 69 | | |
Imperial Tobacco Finance PLC,
8.38%, 2/17/16 | | | 50 | | | | 76 | | |
Lloyds TSB Bank PLC,
6.38%, 6/17/16 - 1/21/21 | | $ | 120 | | | | 154 | | |
National Grid Gas PLC,
5.13%, 5/14/13 | | EUR | 50 | | | | 66 | | |
Nationwide Building Society,
6.25%, 2/25/20 (c) | | $ | 100 | | | | 108 | | |
Royal Bank of Scotland PLC (The),
4.88%, 1/20/17 | | EUR | 75 | | | | 101 | | |
Standard Chartered PLC,
5.75%, 4/30/14 | | | 50 | | | | 68 | | |
| | | | 1,156 | | |
| | | Face Amount
(000) | | Value
(000) | |
| United States (3.8%) | |
Agilent Technologies, Inc.,
5.50%, 9/14/15 | | $ | 30 | | | $ | 34 | | |
Altria Group, Inc.,
9.25%, 8/6/19 | | | 75 | | | | 104 | | |
AT&T, Inc.,
6.30%, 1/15/38 | | | 40 | | | | 50 | | |
Bank of America Corp.,
5.65%, 5/1/18 | | | 115 | | | | 123 | | |
BNP Paribas/BNP Paribas
US Medium-Term Note Program LLC,
5.13%, 1/15/15 (c) | | | 25 | | | | 25 | | |
Boston Scientific Corp.,
6.00%, 1/15/20 | | | 45 | | | | 54 | | |
CBS Corp.,
5.75%, 4/15/20 (d) | | | 35 | | | | 41 | | |
CenturyLink, Inc.,
6.45%, 6/15/21 | | | 15 | | | | 16 | | |
Citigroup, Inc.(See Note H),
8.50%, 5/22/19 | | | 150 | | | | 185 | | |
CRH America, Inc.,
6.00%, 9/30/16 | | | 55 | | | | 60 | | |
DirecTV Holdings LLC/DirecTV Financing
Co., Inc.,
4.60%, 2/15/21 | | | 60 | | | | 64 | | |
General Electric Capital Corp.,
5.30%, 2/11/21 | | | 40 | | | | 45 | | |
Series G
6.00%, 8/7/19 | | | 125 | | | | 146 | | |
Genworth Financial, Inc.,
7.20%, 2/15/21 | | | 50 | | | | 48 | | |
Georgia-Pacific LLC,
8.88%, 5/15/31 | | | 40 | | | | 57 | | |
Gilead Sciences, Inc.,
4.50%, 4/1/21 | | | 50 | | | | 56 | | |
Goldman Sachs Group, Inc. (The),
4.38%, 3/16/17 | | EUR | 50 | | | | 65 | | |
| 6.75%, 10/1/37 | | $ | 100 | | | | 98 | | |
Hewlett-Packard Co.,
4.65%, 12/9/21 | | | 60 | | | | 63 | | |
Home Depot, Inc.,
5.40%, 9/15/40 | | | 100 | | | | 123 | | |
JPMorgan Chase & Co.,
4.25%, 10/15/20 | | | 100 | | | | 105 | | |
L-3 Communications Corp.,
4.75%, 7/15/20 | | | 80 | | | | 85 | | |
Marathon Petroleum Corp.,
5.13%, 3/1/21 | | | 35 | | | | 39 | | |
Merrill Lynch & Co., Inc.,
6.75%, 5/21/13 | | EUR | 50 | | | | 66 | | |
NBC Universal Media LLC,
4.38%, 4/1/21 | | $ | 90 | | | | 99 | | |
Omnicom Group, Inc.,
3.63%, 5/1/22 | | | 50 | | | | 51 | | |
Plains All American Pipeline LP/PAA
Finance Corp.,
8.75%, 5/1/19 | | | 50 | | | | 66 | | |
The accompanying notes are an integral part of the financial statements.
6
The Universal Institutional Funds, Inc.
Semi-Annual Report – June 30, 2012 (unaudited)
Portfolio of Investments (cont'd)
Global Tactical Asset Allocation Portfolio
| | | Face Amount
(000) | | Value
(000) | |
| United States (cont'd) | |
PPL WEM Holdings PLC,
3.90%, 5/1/16 (c) | | $ | 60 | | | $ | 63 | | |
Prudential Financial, Inc.,
7.38%, 6/15/19 (d) | | | 50 | | | | 61 | | |
SLM Corp.,
6.25%, 1/25/16 | | | 65 | | | | 69 | | |
United Technologies Corp.,
4.50%, 6/1/42 | | | 45 | | | | 50 | | |
UnitedHealth Group, Inc.,
3.38%, 11/15/21 (d) | | | 30 | | | | 32 | | |
| 4.63%, 11/15/41 | | | 30 | | | | 32 | | |
Verizon Communications, Inc.,
7.35%, 4/1/39 | | | 35 | | | | 50 | | |
Wells Fargo Bank NA,
6.00%, 5/23/13 | | EUR | 50 | | | | 66 | | |
| | | | 2,391 | | |
| Total Corporate Bonds (Cost $6,031) | | | 5,899 | | |
| Sovereign (18.0%) | |
| Australia (0.8%) | |
| Australia Government Bond, | |
| 5.25%, 3/15/19 | | AUD | 125 | | | | 147 | | |
Treasury Corp. of Victoria,
5.75%, 11/15/16 | | | 300 | | | | 336 | | |
| | | | 483 | | |
| Brazil (0.2%) | |
Banco Nacional de Desenvolvimento,
Economico e Social,
5.50%, 7/12/20 | | $ | 100 | | | | 114 | | |
| Canada (1.4%) | |
Canadian Government Bond,
4.25%, 6/1/18 | | CAD | 670 | | | | 765 | | |
Province of Ontario Canada,
4.00%, 12/3/19 | | EUR | 85 | | | | 124 | | |
| | | | 889 | | |
| Chile (0.4%) | |
Chile Government International Bond,
5.50%, 8/5/20 | | CLP | 130,000 | | | | 278 | | |
| Denmark (0.2%) | |
Denmark Government Bond,
4.00%, 11/15/19 | | DKK | 485 | | | | 100 | | |
| France (1.6%) | |
France Government Bond OAT,
5.50%, 4/25/29 | | EUR | 135 | | | | 218 | | |
French Treasury Note BTAN,
3.00%, 7/12/14 | | | 600 | | | | 798 | | |
| | | | 1,016 | | |
| Germany (2.5%) | |
Bundesrepublik Deutschland,
1.75%, 7/4/22 | | | 130 | | | | 167 | | |
| 3.25%, 7/4/15 | | | 300 | | | | 414 | | |
| 4.25%, 7/4/17 - 7/4/39 | | | 255 | | | | 414 | | |
| 4.75%, 7/4/34 | | | 315 | | | | 564 | | |
| | | | 1,559 | | |
| | | Face Amount
(000) | | Value
(000) | |
| Italy (1.1%) | |
Italy Buoni Poliennali Del Tesoro,
3.00%, 6/15/15 | | EUR | 200 | | | $ | 245 | | |
| 4.00%, 9/1/20 | | | 400 | | | | 460 | | |
| | | | 705 | | |
| Japan (4.2%) | |
Japan Government Ten Year Bond,
1.30%, 12/20/13 | | JPY | 45,000 | | | | 573 | | |
| 1.40%, 9/20/15 | | | 58,000 | | | | 756 | | |
| 1.70%, 6/20/18 | | | 10,000 | | | | 135 | | |
| 1.90%, 6/20/16 | | | 5,000 | | | | 67 | | |
Japan Government Thirty Year Bond,
1.70%, 6/20/33 | | | 87,000 | | | | 1,088 | | |
| | | | 2,619 | | |
| Mexico (0.6%) | |
Mexican Bonos,
10.00%, 12/5/24 | | MXN | 3,600 | | | | 379 | | |
| Netherlands (0.6%) | |
Netherlands Government Bond,
4.00%, 7/15/19 | | EUR | 275 | | | | 401 | | |
| Poland (0.4%) | |
Poland Government Bond,
5.25%, 10/25/17 | | PLN | 875 | | | | 268 | | |
| Qatar (0.2%) | |
Qatar Government International Bond,
4.00%, 1/20/15 (c) | | $ | 150 | | | | 158 | | |
| Russia (0.3%) | |
Russian Foreign Bond — Eurobond,
3.25%, 4/4/17 (c) | | | 200 | | | | 202 | | |
| South Africa (0.2%) | |
South Africa Government Bond,
7.25%, 1/15/20 | | ZAR | 900 | | | | 111 | | |
| Supernational (0.4%) | |
European Union,
2.75%, 6/3/16 | | EUR | 200 | | | | 270 | | |
| Sweden (0.4%) | |
Sweden Government Bond,
4.25%, 3/12/19 | | SEK | 1,300 | | | | 223 | | |
| United Kingdom (2.5%) | |
United Kingdom Gilt,
2.75%, 1/22/15 | | GBP | 25 | | | | 41 | | |
| 3.75%, 9/7/20 | | | 50 | | | | 92 | | |
| 4.00%, 3/7/22 | | | 35 | | | | 66 | | |
| 4.25%, 6/7/32 - 9/7/39 | | | 525 | | | | 1,015 | | |
| 5.00%, 3/7/18 | | | 180 | | | | 345 | | |
| | | | 1,559 | | |
| Total Sovereign (Cost $11,255) | | | 11,334 | | |
The accompanying notes are an integral part of the financial statements.
7
The Universal Institutional Funds, Inc.
Semi-Annual Report – June 30, 2012 (unaudited)
Portfolio of Investments (cont'd)
Global Tactical Asset Allocation Portfolio
| | | Face Amount
(000) | | Value
(000) | |
| U.S. Treasury Securities (6.4%) | |
| United States (6.4%) | |
U.S. Treasury Bond,
3.50%, 2/15/39 (d) | | $ | 930 | | | $ | 1,076 | | |
U.S. Treasury Notes,
0.25%, 2/15/15 | | | 400 | | | | 399 | | |
| 0.88%, 2/28/17 (d) | | | 430 | | | | 434 | | |
| 1.50%, 6/30/16 | | | 100 | | | | 104 | | |
| 2.38%, 10/31/14 | | | 730 | | | | 764 | | |
| 2.75%, 2/28/18 | | | 900 | | | | 993 | | |
| 3.63%, 2/15/21 | | | 210 | | | | 248 | | |
| Total U.S. Treasury Securities (Cost $3,801) | | | 4,018 | | |
| Total Fixed Income Securities (Cost $24,590) | | | 24,810 | | |
| | | Shares | | | |
| Common Stocks (41.5%) | |
| Australia (2.3%) | |
| AGL Energy Ltd. | | | 922 | | | | 14 | | |
| Alumina Ltd. (d) | | | 9,345 | | | | 8 | | |
| Amcor Ltd. | | | 2,905 | | | | 21 | | |
| AMP Ltd. | | | 7,531 | | | | 30 | | |
| ASX Ltd. | | | 521 | | | | 16 | | |
| Australia & New Zealand Banking Group Ltd. | | | 5,259 | | | | 119 | | |
| BHP Billiton Ltd. | | | 6,142 | | | | 200 | | |
| Brambles Ltd. | | | 3,179 | | | | 20 | | |
| Coca-Cola Amatil Ltd. | | | 560 | | | | 8 | | |
| Commonwealth Bank of Australia (d) | | | 2,661 | | | | 146 | | |
| CSL Ltd. | | | 1,047 | | | | 42 | | |
| Echo Entertainment Group Ltd. | | | 378 | | | | 2 | | |
| Fortescue Metals Group Ltd. (d) | | | 3,024 | | | | 15 | | |
| GPT Group REIT (Stapled Securities) (e) | | | 7,895 | | | | 27 | | |
| Incitec Pivot Ltd. | | | 4,364 | | | | 13 | | |
| Insurance Australia Group Ltd. | | | 5,277 | | | | 19 | | |
| Leighton Holdings Ltd. (d) | | | 433 | | | | 7 | | |
| Macquarie Group Ltd. | | | 781 | | | | 21 | | |
| National Australia Bank Ltd. (d) | | | 3,819 | | | | 93 | | |
| Newcrest Mining Ltd. | | | 1,373 | | | | 32 | | |
| Orica Ltd. | | | 1,136 | | | | 29 | | |
| Origin Energy Ltd. | | | 2,512 | | | | 32 | | |
| QBE Insurance Group Ltd. | | | 3,324 | | | | 46 | | |
| Rio Tinto Ltd. | | | 827 | | | | 49 | | |
| Santos Ltd. | | | 1,904 | | | | 21 | | |
| Stockland REIT (Stapled Securities) (e)(f) | | | 8,454 | | | | 27 | | |
| Suncorp Group Ltd. | | | 3,090 | | | | 26 | | |
| TABCORP Holdings Ltd. | | | 379 | | | | 1 | | |
| Telstra Corp, Ltd. | | | 7,625 | | | | 29 | | |
| Transurban Group (Stapled Securities) (e) | | | 3,556 | | | | 21 | | |
| Treasury Wine Estates Ltd. | | | 1,702 | | | | 8 | | |
| Wesfarmers Ltd. | | | 1,835 | | | | 56 | | |
| Wesfarmers Ltd. (PPS) | | | 285 | | | | 9 | | |
| Westfield Group REIT (Stapled Securities) (e)(f) | | | 4,870 | | | | 47 | | |
| Westfield Retail Trust REIT | | | 4,870 | | | | 14 | | |
| Westpac Banking Corp. (d) | | | 5,241 | | | | 114 | | |
| | | Shares | | Value
(000) | |
| Woodside Petroleum Ltd. | | | 1,157 | | | $ | 37 | | |
| Woolworths Ltd. | | | 2,227 | | | | 61 | | |
| | | | 1,480 | | |
| Austria (0.0%) | |
| Erste Group Bank AG (g) | | | 537 | | | | 10 | | |
| Immofinanz AG (g) | | | 955 | | | | 3 | | |
| Verbund AG, Class A | | | 128 | | | | 3 | | |
| Voestalpine AG (d) | | | 270 | | | | 7 | | |
| | | | 23 | | |
| Belgium (0.2%) | |
| Ageas | | | 3,749 | | | | 7 | | |
| Anheuser-Busch InBev N.V. | | | 975 | | | | 76 | | |
| Colruyt SA | | | 121 | | | | 5 | | |
| Groupe Bruxelles Lambert SA | | | 202 | | | | 14 | | |
| KBC Groep N.V. (d) | | | 151 | | | | 3 | | |
| Solvay SA, Class A | | | 98 | | | | 10 | | |
| Umicore SA | | | 216 | | | | 10 | | |
| | | | 125 | | |
| Canada (2.9%) | |
| Agnico-Eagle Mines Ltd. (d) | | | 400 | | | | 16 | | |
| Agrium, Inc. (d) | | | 400 | | | | 35 | | |
| Bank of Montreal | | | 1,100 | | | | 61 | | |
| Bank of Nova Scotia (d) | | | 1,600 | | | | 83 | | |
| Barrick Gold Corp. (d) | | | 2,100 | | | | 79 | | |
| BCE, Inc. | | | 2,000 | | | | 83 | | |
| Brookfield Asset Management, Inc., Class A | | | 1,400 | | | | 46 | | |
| Cameco Corp. (d) | | | 1,000 | | | | 22 | | |
| Canadian Imperial Bank of Commerce (d) | | | 900 | | | | 63 | | |
| Canadian National Railway Co. (d) | | | 1,000 | | | | 85 | | |
| Canadian Natural Resources Ltd. | | | 2,000 | | | | 54 | | |
| Canadian Pacific Railway Ltd. | | | 400 | | | | 29 | | |
| Cenovus Energy, Inc. | | | 1,600 | | | | 51 | | |
| Crescent Point Energy Corp. (d) | | | 600 | | | | 22 | | |
| Eldorado Gold Corp. | | | 1,200 | | | | 15 | | |
| Enbridge, Inc. (d) | | | 1,800 | | | | 72 | | |
| Encana Corp. (d) | | | 1,800 | | | | 38 | | |
| Goldcorp, Inc. | | | 1,600 | | | | 60 | | |
| Imperial Oil Ltd. | | | 200 | | | | 8 | | |
| Kinross Gold Corp. | | | 2,400 | | | | 20 | | |
| Magna International, Inc. (d) | | | 600 | | | | 24 | | |
| Manulife Financial Corp. | | | 5,800 | | | | 63 | | |
| National Bank of Canada (d) | | | 300 | | | | 21 | | |
| Nexen, Inc. | | | 1,500 | | | | 25 | | |
| Penn West Petroleum Ltd. (d) | | | 900 | | | | 12 | | |
| Potash Corp. of Saskatchewan, Inc. | | | 1,800 | | | | 79 | | |
| Power Corp. of Canada | | | 1,300 | | | | 31 | | |
| Research In Motion Ltd. (d)(g) | | | 1,000 | | | | 7 | | |
| Rogers Communications, Inc. (d) | | | 700 | | | | 25 | | |
| Royal Bank of Canada (d) | | | 2,300 | | | | 118 | | |
| Shoppers Drug Mart Corp. (d) | | | 1,000 | | | | 40 | | |
| Silver Wheaton Corp. (d) | | | 700 | | | | 19 | | |
| Sun Life Financial, Inc. | | | 1,600 | | | | 35 | | |
The accompanying notes are an integral part of the financial statements.
8
The Universal Institutional Funds, Inc.
Semi-Annual Report – June 30, 2012 (unaudited)
Portfolio of Investments (cont'd)
Global Tactical Asset Allocation Portfolio
| | | Shares | | Value
(000) | |
| Canada (cont'd) | |
| Suncor Energy, Inc. | | | 3,100 | | | $ | 90 | | |
| Talisman Energy, Inc. | | | 2,000 | | | | 23 | | |
| Teck Resources Ltd. | | | 1,000 | | | | 31 | | |
| Thomson Reuters Corp. (d) | | | 900 | | | | 26 | | |
| Toronto-Dominion Bank (The) (d) | | | 1,800 | | | | 141 | | |
| TransCanada Corp. (d) | | | 1,200 | | | | 50 | | |
| Yamana Gold, Inc. | | | 1,700 | | | | 26 | | |
| | | | 1,828 | | |
| Chile (0.0%) | |
| Antofagasta PLC | | | 742 | | | | 13 | | |
| China (1.4%) | |
| Agile Property Holdings Ltd. (d)(h) | | | 32,550 | | | | 42 | | |
| China Overseas Land & Investment Ltd. (d)(h) | | | 78,499 | | | | 184 | | |
| China Resources Land Ltd. (d)(h) | | | 56,310 | | | | 116 | | |
| Country Garden Holdings Co., Ltd. (h) | | | 166,998 | | | | 66 | | |
| Evergrande Real Estate Group Ltd. (d)(h) | | | 144,483 | | | | 75 | | |
| Franshion Properties China Ltd. (d)(h) | | | 86,877 | | | | 26 | | |
| Greentown China Holdings Ltd. (h) | | | 15,374 | | | | 16 | | |
Guangzhou R&F Properties Co., Ltd. H
Shares (h) | | | 31,365 | | | | 42 | | |
| KWG Property Holding Ltd. (h) | | | 29,744 | | | | 19 | | |
| Longfor Properties Co., Ltd. (h) | | | 50,074 | | | | 79 | | |
| Poly Hong Kong Investments Ltd. (g)(h) | | | 34,761 | | | | 19 | | |
| Renhe Commercial Holdings Co., Ltd. (d)(g)(h) | | | 217,993 | | | | 9 | | |
| Shimao Property Holdings Ltd. (h) | | | 33,694 | | | | 52 | | |
| Shui On Land Ltd. (h) | | | 56,082 | | | | 23 | | |
| Sino-Ocean Land Holdings Ltd. (h) | | | 54,947 | | | | 27 | | |
| Soho China Ltd. (h) | | | 50,429 | | | | 39 | | |
| Wynn Macau Ltd. (d)(h) | | | 5,600 | | | | 13 | | |
| Yuexiu Property Co., Ltd. (h) | | | 89,366 | | | | 22 | | |
| | | | 869 | | |
| Denmark (0.3%) | |
| AP Moller - Maersk A/S | | | 1 | | | | 6 | | |
| AP Moller - Maersk A/S Series B | | | 2 | | | | 13 | | |
| Danske Bank A/S (g) | | | 684 | | | | 10 | | |
| DSV A/S | | | 376 | | | | 7 | | |
| Novo Nordisk A/S Series B | | | 888 | | | | 129 | | |
| Novozymes A/S Series B | | | 330 | | | | 9 | | |
| Vestas Wind Systems A/S (g) | | | 387 | | | | 2 | | |
| | | | 176 | | |
| Finland (0.2%) | |
| Elisa Oyj | | | 277 | | | | 6 | | |
| Fortum Oyj | | | 651 | | | | 12 | | |
| Kone Oyj, Class B | | | 292 | | | | 18 | | |
| Metso Oyj | | | 204 | | | | 7 | | |
| Nokia Oyj | | | 5,675 | | | | 12 | | |
| Nokian Renkaat Oyj | | | 240 | | | | 9 | | |
| Sampo Oyj, Class A | | | 605 | | | | 16 | | |
| Stora Enso Oyj, Class R | | | 1,002 | | | | 6 | | |
| UPM-Kymmene Oyj (d) | | | 554 | | | | 6 | | |
| Wartsila Oyj | | | 291 | | | | 9 | | |
| | | | 101 | | |
| | | Shares | | Value
(000) | |
| France (1.8%) | |
| Aeroports de Paris (ADP) (d) | | | 55 | | | $ | 4 | | |
| Air Liquide SA | | | 470 | | | | 54 | | |
| Alcatel-Lucent (d)(g) | | | 6,226 | | | | 10 | | |
| Alstom SA (d) | | | 406 | | | | 13 | | |
| AXA SA | | | 3,059 | | | | 41 | | |
| BNP Paribas SA | | | 2,156 | | | | 83 | | |
| Bouygues SA | | | 355 | | | | 10 | | |
| Cap Gemini SA | | | 333 | | | | 12 | | |
| Carrefour SA (d) | | | 744 | | | | 14 | | |
| Christian Dior SA | | | 127 | | | | 17 | | |
| Cie de St-Gobain | | | 696 | | | | 26 | | |
| Cie Generale d'Optique Essilor International SA | | | 303 | | | | 28 | | |
| Cie Generale de Geophysique-Veritas (g) | | | 256 | | | | 7 | | |
| Cie Generale des Etablissements Michelin Series B | | | 364 | | | | 24 | | |
| Credit Agricole SA (g) | | | 2,594 | | | | 11 | | |
| Danone SA | | | 736 | | | | 46 | | |
| Electricite de France SA (d) | | | 431 | | | | 10 | | |
| European Aeronautic Defense and Space Co., N.V. | | | 675 | | | | 24 | | |
| Fonciere Des Regions REIT | | | 53 | | | | 4 | | |
| France Telecom SA | | | 2,874 | | | | 38 | | |
| GDF Suez | | | 1,973 | | | | 47 | | |
| Gecina SA REIT (d) | | | 37 | | | | 3 | | |
| Groupe Eurotunnel SA | | | 949 | | | | 8 | | |
| Klepierre REIT | | | 187 | | | | 6 | | |
| L'Oreal SA | | | 420 | | | | 49 | | |
| Lafarge SA (d) | | | 345 | | | | 15 | | |
| Legrand SA | | | 195 | | | | 7 | | |
| LVMH Moet Hennessy Louis Vuitton SA | | | 315 | | | | 48 | | |
| Pernod-Ricard SA (d) | | | 351 | | | | 38 | | |
| Peugeot SA (d)(g) | | | 386 | | | | 4 | | |
| Publicis Groupe SA (d) | | | 312 | | | | 14 | | |
| Renault SA | | | 330 | | | | 13 | | |
| Safran SA | | | 251 | | | | 9 | | |
| Sanofi | | | 845 | | | | 64 | | |
| Schneider Electric SA | | | 782 | | | | 44 | | |
| SES SA | | | 614 | | | | 15 | | |
| Societe Generale SA (g) | | | 1,480 | | | | 35 | | |
| Sodexo | | | 272 | | | | 21 | | |
| Technip SA | | | 158 | | | | 16 | | |
| Thales SA (d) | | | 156 | | | | 5 | | |
| Total SA (d) | | | 2,424 | | | | 109 | | |
| Unibail-Rodamco SE REIT | | | 89 | | | | 16 | | |
| Vallourec SA | | | 167 | | | | 7 | | |
| Veolia Environnement SA | | | 586 | | | | 7 | | |
| Vinci SA | | | 830 | | | | 39 | | |
| Vivendi SA | | | 1,756 | | | | 33 | | |
| | | | 1,148 | | |
| Germany (2.0%) | |
| Adidas AG | | | 339 | | | | 24 | | |
| Allianz SE (Registered) | | | 832 | | | | 84 | | |
| BASF SE | | | 1,220 | | | | 85 | | |
| Bayer AG (Registered) | | | 1,377 | | | | 99 | | |
The accompanying notes are an integral part of the financial statements.
9
The Universal Institutional Funds, Inc.
Semi-Annual Report – June 30, 2012 (unaudited)
Portfolio of Investments (cont'd)
Global Tactical Asset Allocation Portfolio
| | | Shares | | Value
(000) | |
| Germany (cont'd) | |
| Bayerische Motoren Werke AG | | | 683 | | | $ | 49 | | |
| Commerzbank AG (g) | | | 871 | | | | 1 | | |
| Continental AG | | | 162 | | | | 13 | | |
| Daimler AG (Registered) | | | 1,424 | | | | 64 | | |
| Deutsche Bank AG (Registered) | | | 1,321 | | | | 48 | | |
| Deutsche Boerse AG | | | 295 | | | | 16 | | |
| Deutsche Lufthansa AG (Registered) | | | 480 | | | | 6 | | |
| Deutsche Post AG (Registered) | | | 1,164 | | | | 21 | | |
| Deutsche Telekom AG (Registered) | | | 4,124 | | | | 45 | | |
| E.ON AG | | | 3,099 | | | | 67 | | |
| Esprit Holdings Ltd. (d)(h) | | | 3,594 | | | | 5 | | |
| Fraport AG Frankfurt Airport Services Worldwide | | | 40 | | | | 2 | | |
| Fresenius Medical Care AG & Co., KGaA | | | 357 | | | | 25 | | |
| Fresenius SE & Co., KGaA | | | 260 | | | | 27 | | |
| HeidelbergCement AG | | | 163 | | | | 8 | | |
| Henkel AG & Co., KGaA | | | 306 | | | | 17 | | |
| Henkel AG & Co., KGaA (Preference) | | | 360 | | | | 24 | | |
| Infineon Technologies AG | | | 2,448 | | | | 17 | | |
| K&S AG (Registered) | | | 236 | | | | 11 | | |
| Lanxess AG | | | 139 | | | | 9 | | |
| Linde AG | | | 293 | | | | 46 | | |
| Merck KGaA | | | 187 | | | | 19 | | |
| Metro AG | | | 199 | | | | 6 | | |
| Muenchener Rueckversicherungs AG (Registered) | | | 392 | | | | 55 | | |
| Porsche Automobil Holding SE (Preference) (d) | | | 504 | | | | 25 | | |
| QIAGEN N.V. (g) | | | 899 | | | | 15 | | |
| RWE AG | | | 930 | | | | 38 | | |
| Salzgitter AG | | | 82 | | | | 3 | | |
| SAP AG | | | 1,649 | | | | 97 | | |
| Siemens AG (Registered) | | | 1,196 | | | | 101 | | |
| ThyssenKrupp AG | | | 542 | | | | 9 | | |
| Volkswagen AG | | | 41 | | | | 6 | | |
| Volkswagen AG (Preference) | | | 287 | | | | 45 | | |
| | | | 1,232 | | |
| Greece (0.0%) | |
| National Bank of Greece SA (g) | | | 1,384 | | | | 3 | | |
| Hong Kong (1.2%) | |
| Bank of East Asia Ltd. (d) | | | 5,881 | | | | 21 | | |
| BOC Hong Kong Holdings Ltd. | | | 13,000 | | | | 40 | | |
| Cheung Kong Holdings Ltd. | | | 5,000 | | | | 62 | | |
| CLP Holdings Ltd. | | | 7,500 | | | | 64 | | |
| Hang Lung Group Ltd. | | | 3,000 | | | | 19 | | |
| Hang Lung Properties Ltd. | | | 7,000 | | | | 24 | | |
| Hang Seng Bank Ltd. | | | 4,700 | | | | 64 | | |
| Henderson Land Development Co., Ltd. | | | 5,103 | | | | 28 | | |
| Hong Kong & China Gas Co., Ltd. | | | 13,310 | | | | 28 | | |
| Hong Kong Exchanges and Clearing Ltd. (d) | | | 3,761 | | | | 54 | | |
| Hutchison Whampoa Ltd. | | | 7,000 | | | | 61 | | |
| Kerry Properties Ltd. | | | 2,500 | | | | 11 | | |
| Link REIT (The) | | | 7,472 | | | | 31 | | |
| MTR Corp. | | | 5,588 | | | | 19 | | |
| New World Development Co., Ltd. (d) | | | 9,740 | | | | 12 | | |
| | | Shares | | Value
(000) | |
| Power Assets Holdings Ltd. | | | 5,500 | | | $ | 41 | | |
| Sands China Ltd. | | | 8,800 | | | | 28 | | |
| Sino Land Co., Ltd. | | | 9,192 | | | | 14 | | |
| Sun Hung Kai Properties Ltd. | | | 5,166 | | | | 61 | | |
| Swire Pacific Ltd. | | | 2,500 | | | | 29 | | |
| Swire Properties Ltd. | | | 1,750 | | | | 5 | | |
| Wharf Holdings Ltd. | | | 4,400 | | | | 24 | | |
| | | | 740 | | |
| India (0.0%) | |
| Cairn Energy PLC (g) | | | 946 | | | | 4 | | |
| Ireland (0.0%) | |
| CRH PLC | | | 832 | | | | 16 | | |
| Italy (0.5%) | |
| Assicurazioni Generali SpA (d) | | | 2,726 | | | | 37 | | |
| Atlantia SpA | | | 556 | | | | 7 | | |
| Banco Popolare SC (g) | | | 4,013 | | | | 5 | | |
| Enel Green Power SpA | | | 2,893 | | | | 5 | | |
| Enel SpA | | | 13,052 | | | | 42 | | |
| Eni SpA | | | 2,877 | | | | 62 | | |
| Exor SpA (d) | | | 94 | | | | 2 | | |
| Fiat Industrial SpA | | | 998 | | | | 10 | | |
| Fiat SpA (g) | | | 786 | | | | 4 | | |
| Finmeccanica SpA (d)(g) | | | 598 | | | | 3 | | |
| Intesa Sanpaolo SpA | | | 23,263 | | | | 33 | | |
| Luxottica Group SpA | | | 179 | | | | 6 | | |
| Mediobanca SpA | | | 766 | | | | 3 | | |
| Saipem SpA | | | 424 | | | | 19 | | |
| Snam SpA | | | 2,878 | | | | 13 | | |
| Telecom Italia SpA | | | 13,589 | | | | 13 | | |
| Terna Rete Elettrica Nazionale SpA | | | 2,573 | | | | 9 | | |
| UniCredit SpA (g) | | | 2,864 | | | | 11 | | |
| Unione di Banche Italiane SCPA | | | 1,110 | | | | 4 | | |
| | | | 288 | | |
| Japan (5.2%) | |
| Aeon Co., Ltd. (d) | | | 1,900 | | | | 24 | | |
| Aisin Seiki Co., Ltd. | | | 400 | | | | 13 | | |
| Ajinomoto Co., Inc. | | | 2,000 | | | | 28 | | |
| Asahi Glass Co., Ltd. (d) | | | 2,000 | | | | 13 | | |
| Asahi Group Holdings Ltd. | | | 900 | | | | 19 | | |
| Asahi Kasei Corp. | | | 4,000 | | | | 22 | | |
| Astellas Pharma, Inc. | | | 700 | | | | 31 | | |
| Bank of Yokohama Ltd. (The) | | | 6,000 | | | | 28 | | |
| Bridgestone Corp. (d) | | | 1,500 | | | | 34 | | |
| Canon, Inc. (d) | | | 1,700 | | | | 68 | | |
| Central Japan Railway Co. | | | 3 | | | | 24 | | |
| Chubu Electric Power Co., Inc. | | | 1,100 | | | | 18 | | |
| Chugoku Electric Power Co., Inc. (The) | | | 700 | | | | 12 | | |
| Dai Nippon Printing Co., Ltd. | | | 1,000 | | | | 8 | | |
| Dai-ichi Life Insurance Co., Ltd. (The) | | | 22 | | | | 26 | | |
| Daiichi Sankyo Co., Ltd. | | | 1,000 | | | | 17 | | |
| Daikin Industries Ltd. | | | 400 | | | | 11 | | |
| Daiwa House Industry Co., Ltd. | | | 2,000 | | | | 28 | | |
| Daiwa Securities Group, Inc. | | | 6,000 | | | | 23 | | |
The accompanying notes are an integral part of the financial statements.
10
The Universal Institutional Funds, Inc.
Semi-Annual Report – June 30, 2012 (unaudited)
Portfolio of Investments (cont'd)
Global Tactical Asset Allocation Portfolio
| | | Shares | | Value
(000) | |
| Japan (cont'd) | |
| Denso Corp. | | | 700 | | | $ | 24 | | |
| East Japan Railway Co. | | | 700 | | | | 44 | | |
| Eisai Co., Ltd. | | | 600 | | | | 26 | | |
| FANUC Corp. | | | 300 | | | | 49 | | |
| Fast Retailing Co., Ltd. | | | 100 | | | | 20 | | |
| FUJIFILM Holdings Corp. | | | 1,000 | | | | 19 | | |
| Fujitsu Ltd. | | | 4,000 | | | | 19 | | |
| Hankyu Hanshin Holdings, Inc. | | | 6,000 | | | | 30 | | |
| Hitachi Ltd. | | | 7,000 | | | | 43 | | |
| Honda Motor Co., Ltd. (d) | | | 2,500 | | | | 87 | | |
| Hoya Corp. | | | 900 | | | | 20 | | |
| Inpex Corp. | | | 4 | | | | 22 | | |
| ITOCHU Corp. | | | 2,800 | | | | 29 | | |
| Japan Tobacco, Inc. | | | 1,600 | | | | 47 | | |
| JFE Holdings, Inc. | | | 900 | | | | 15 | | |
| JS Group Corp. | | | 1,100 | | | | 23 | | |
| JX Holdings, Inc. | | | 5,500 | | | | 28 | | |
| Kansai Electric Power Co., Inc. (The) | | | 1,200 | | | | 14 | | |
| Kao Corp. | | | 700 | | | | 19 | | |
| KDDI Corp. | | | 4 | | | | 26 | | |
| Keyence Corp. (d) | | | 200 | | | | 49 | | |
| Kintetsu Corp. (d) | | | 6,000 | | | | 24 | | |
| Kirin Holdings Co., Ltd. (d) | | | 2,000 | | | | 24 | | |
| Kobe Steel Ltd. | | | 8,000 | | | | 10 | | |
| Komatsu Ltd. | | | 2,100 | | | | 50 | | |
| Konica Minolta Holdings, Inc. | | | 1,500 | | | | 12 | | |
| Kubota Corp. | | | 3,000 | | | | 28 | | |
| Kuraray Co., Ltd. | | | 1,000 | | | | 13 | | |
| Kyocera Corp. | | | 300 | | | | 26 | | |
| Kyushu Electric Power Co., Inc. | | | 800 | | | | 10 | | |
| Marubeni Corp. | | | 4,000 | | | | 27 | | |
| Mitsubishi Chemical Holdings Corp. | | | 3,500 | | | | 15 | | |
| Mitsubishi Corp. | | | 2,300 | | | | 46 | | |
| Mitsubishi Electric Corp. | | | 4,000 | | | | 33 | | |
| Mitsubishi Estate Co., Ltd. | | | 2,000 | | | | 36 | | |
| Mitsubishi Heavy Industries Ltd. | | | 9,000 | | | | 37 | | |
| Mitsui & Co., Ltd. | | | 2,800 | | | | 42 | | |
| Mitsui Fudosan Co., Ltd. | | | 2,000 | | | | 39 | | |
| Mitsui OSK Lines Ltd. | | | 3,000 | | | | 11 | | |
| Mizuho Financial Group, Inc. | | | 37,100 | | | | 63 | | |
| MS&AD Insurance Group Holdings | | | 1,100 | | | | 19 | | |
| Murata Manufacturing Co., Ltd. | | | 400 | | | | 21 | | |
| NEC Corp. (d)(g) | | | 8,000 | | | | 12 | | |
| NGK Insulators Ltd. | | | 1,000 | | | | 11 | | |
| Nidec Corp. (d) | | | 200 | | | | 15 | | |
| Nikon Corp. | | | 800 | | | | 24 | | |
| Nintendo Co., Ltd. | | | 100 | | | | 12 | | |
| Nippon Building Fund, Inc. REIT (d) | | | 2 | | | | 19 | | |
| Nippon Steel Corp. | | | 9,000 | | | | 20 | | |
| Nippon Telegraph & Telephone Corp. | | | 900 | | | | 42 | | |
| Nippon Yusen KK | | | 3,000 | | | | 8 | | |
| Nissan Motor Co., Ltd. | | | 3,800 | | | | 36 | | |
| Nitto Denko Corp. | | | 400 | | | | 17 | | |
| | | Shares | | Value
(000) | |
| NKSJ Holdings, Inc. | | | 1,000 | | | $ | 21 | | |
| Nomura Holdings, Inc. | | | 6,800 | | | | 25 | | |
| NTT DoCoMo, Inc. | | | 27 | | | | 45 | | |
| Odakyu Electric Railway Co., Ltd. (d) | | | 3,000 | | | | 30 | | |
| Olympus Corp. (d)(g) | | | 500 | | | | 8 | | |
| Omron Corp. | | | 700 | | | | 15 | | |
| Oriental Land Co., Ltd. | | | 200 | | | | 23 | | |
| ORIX Corp. (d) | | | 220 | | | | 21 | | |
| Osaka Gas Co., Ltd. | | | 5,000 | | | | 21 | | |
| Panasonic Corp. | | | 2,800 | | | | 23 | | |
| Rakuten, Inc. (d) | | | 2,000 | | | | 21 | | |
| Ricoh Co., Ltd. (d) | | | 2,000 | | | | 17 | | |
| Rohm Co., Ltd. | | | 300 | | | | 12 | | |
| Secom Co., Ltd. | | | 700 | | | | 32 | | |
| Sekisui House Ltd. | | | 2,000 | | | | 19 | | |
| Seven & I Holdings Co., Ltd. | | | 1,500 | | | | 45 | | |
| Sharp Corp. (d) | | | 2,000 | | | | 10 | | |
| Shikoku Electric Power Co., Inc. | | | 500 | | | | 11 | | |
| Shin-Etsu Chemical Co., Ltd. | | | 700 | | | | 39 | | |
| Shionogi & Co., Ltd. | | | 1,200 | | | | 16 | | |
| Shiseido Co., Ltd. | | | 800 | | | | 13 | | |
| Shizuoka Bank Ltd. (The) (d) | | | 3,000 | | | | 31 | | |
| SMC Corp. | | | 200 | | | | 35 | | |
| Softbank Corp. | | | 1,400 | | | | 52 | | |
| Sony Corp. | | | 1,700 | | | | 24 | | |
| Sumitomo Chemical Co., Ltd. | | | 3,000 | | | | 9 | | |
| Sumitomo Corp. | | | 1,900 | | | | 27 | | |
| Sumitomo Electric Industries Ltd. | | | 1,200 | | | | 15 | | |
| Sumitomo Metal Industries Ltd. | | | 6,000 | | | | 10 | | |
| Sumitomo Metal Mining Co., Ltd. | | | 1,000 | | | | 11 | | |
| Sumitomo Mitsui Financial Group, Inc. | | | 2,400 | | | | 79 | | |
| Sumitomo Mitsui Trust Holdings, Inc. | | | 6,000 | | | | 18 | | |
| Sumitomo Realty & Development Co., Ltd. | | | 1,000 | | | | 25 | | |
| Suzuki Motor Corp. | | | 700 | | | | 14 | | |
| T&D Holdings, Inc. | | | 1,700 | | | | 18 | | |
| Takeda Pharmaceutical Co., Ltd. | | | 1,100 | | | | 50 | | |
| TDK Corp. | | | 400 | | | | 16 | | |
| Terumo Corp. | | | 500 | | | | 21 | | |
| Tohoku Electric Power Co., Inc. (d)(g) | | | 1,000 | | | | 10 | | |
| Tokio Marine Holdings, Inc. | | | 1,400 | | | | 35 | | |
| Tokyo Electric Power Co., Inc. (The) (g) | | | 3,400 | | | | 7 | | |
| Tokyo Electron Ltd. | | | 500 | | | | 23 | | |
| Tokyo Gas Co., Ltd. | | | 5,000 | | | | 26 | | |
| Tokyu Corp. | | | 4,000 | | | | 19 | | |
| Toray Industries, Inc. | | | 4,000 | | | | 27 | | |
| Toshiba Corp. | | | 7,000 | | | | 27 | | |
| Toyota Industries Corp. | | | 800 | | | | 23 | | |
| Toyota Motor Corp. | | | 4,400 | | | | 177 | | |
| West Japan Railway Co. | | | 400 | | | | 16 | | |
| Yahoo! Japan Corp. | | | 47 | | | | 15 | | |
| Yamada Denki Co., Ltd. (d) | | | 250 | | | | 13 | | |
| Yamato Holdings Co., Ltd. (d) | | | 400 | | | | 6 | | |
| | | | 3,248 | | |
The accompanying notes are an integral part of the financial statements.
11
The Universal Institutional Funds, Inc.
Semi-Annual Report – June 30, 2012 (unaudited)
Portfolio of Investments (cont'd)
Global Tactical Asset Allocation Portfolio
| | | Shares | | Value
(000) | |
| Kazakhstan (0.0%) | |
| Kazakhmys PLC | | | 553 | | | $ | 6 | | |
| Netherlands (0.5%) | |
| Akzo Nobel N.V. | | | 388 | | | | 18 | | |
| ArcelorMittal | | | 1,340 | | | | 21 | | |
| ASML Holding N.V. | | | 662 | | | | 34 | | |
| Corio N.V. REIT | | | 116 | | | | 5 | | |
| Fugro N.V. CVA | | | 96 | | | | 6 | | |
| Heineken N.V. (d) | | | 613 | | | | 32 | | |
| ING Groep N.V. CVA (g) | | | 5,653 | | | | 38 | | |
| Koninklijke Ahold N.V. | | | 1,733 | | | | 22 | | |
| Koninklijke KPN N.V. (d) | | | 1,823 | | | | 17 | | |
| Koninklijke Philips Electronics N.V. | | | 1,872 | | | | 37 | | |
| Koninklijke Vopak N.V. | | | 116 | | | | 7 | | |
| PostNL N.V. | | | 618 | | | | 3 | | |
| TNT Express N.V. | | | 586 | | | | 7 | | |
| Unilever N.V. CVA | | | 2,128 | | | | 71 | | |
| | | | 318 | | |
| Norway (0.2%) | |
| Aker Solutions ASA | | | 246 | | | | 4 | | |
| DnB ASA | | | 2,312 | | | | 23 | | |
| Kvaerner ASA | | | 246 | | | | 1 | | |
| Norsk Hydro ASA (d) | | | 1,778 | | | | 8 | | |
| Orkla ASA | | | 1,208 | | | | 9 | | |
| Renewable Energy Corp., ASA (d)(g) | | | 1,171 | | | | — | @ | |
| Statoil ASA | | | 2,488 | | | | 59 | | |
| Subsea 7 SA | | | 420 | | | | 8 | | |
| Telenor ASA | | | 995 | | | | 17 | | |
| Veripos, Inc. (g)(i) | | | 42 | | | | — | @ | |
| Yara International ASA | | | 352 | | | | 15 | | |
| | | | 144 | | |
| Poland (0.0%) | |
| Jeronimo Martins SGPS SA | | | 411 | | | | 7 | | |
| Portugal (0.0%) | |
| EDP - Energias de Portugal SA | | | 4,041 | | | | 9 | | |
| Galp Energia SGPS SA | | | 421 | | | | 5 | | |
| Portugal Telecom SGPS SA (Registered) (d) | | | 1,039 | | | | 5 | | |
| | | | 19 | | |
| South Africa (0.1%) | |
| SABMiller PLC | | | 1,566 | | | | 63 | | |
| Spain (0.7%) | |
| Abertis Infraestructuras SA | | | 502 | | | | 7 | | |
| ACS Actividades de Construccion y Servicios SA (d) | | | 323 | | | | 7 | | |
| Banco Bilbao Vizcaya Argentaria SA | | | 9,091 | | | | 66 | | |
| Banco de Sabadell SA (d) | | | 2,358 | | | | 5 | | |
| Banco Popular Espanol SA (d) | | | 1,762 | | | | 4 | | |
| Banco Santander SA | | | 16,671 | | | | 111 | | |
| CaixaBank (d) | | | 1,494 | | | | 5 | | |
| Distribuidora Internacional de Alimentacion SA (g) | | | 744 | | | | 3 | | |
| Enagas SA | | | 316 | | | | 6 | | |
| Ferrovial SA | | | 872 | | | | 10 | | |
| Iberdrola SA | | | 7,045 | | | | 33 | | |
| | | Shares | | Value
(000) | |
| Inditex SA | | | 505 | | | $ | 52 | | |
| International Consolidated Airlines Group SA (g) | | | 1,797 | | | | 4 | | |
| Red Electrica Corp., SA (d) | | | 227 | | | | 10 | | |
| Repsol YPF SA (d) | | | 3,176 | | | | 51 | | |
| Telefonica SA | | | 4,708 | | | | 62 | | |
| | | | 436 | | |
| Sweden (0.9%) | |
| Alfa Laval AB | | | 719 | | | | 12 | | |
| Assa Abloy AB, Class B | | | 568 | | | | 16 | | |
| Atlas Copco AB, Class A | | | 1,379 | | | | 30 | | |
| Atlas Copco AB, Class B | | | 701 | | | | 13 | | |
| Boliden AB | | | 453 | | | | 6 | | |
| Electrolux AB, Class B | | | 323 | | | | 6 | | |
| Hennes & Mauritz AB, Class B | | | 1,670 | | | | 60 | | |
| Hexagon AB, Class B | | | 400 | | | | 7 | | |
| Husqvarna AB, Class B | | | 622 | | | | 3 | | |
| Investment AB Kinnevik | | | 188 | | | | 4 | | |
| Investor AB, Class B | | | 738 | | | | 14 | | |
| Millicom International Cellular SA SDR | | | 134 | | | | 13 | | |
| Nordea Bank AB | | | 5,219 | | | | 45 | | |
| Ratos AB, Class B (d) | | | 310 | | | | 3 | | |
| Sandvik AB | | | 2,004 | | | | 26 | | |
| Scania AB, Class B | | | 537 | | | | 9 | | |
| Skandinaviska Enskilda Banken AB | | | 3,850 | | | | 25 | | |
| Skanska AB, Class B | | | 408 | | | | 6 | | |
| SKF AB, Class B | | | 610 | | | | 12 | | |
| Svenska Cellulosa AB, Class B | | | 978 | | | | 15 | | |
| Svenska Handelsbanken AB, Class A | | | 1,267 | | | | 42 | | |
| Swedbank AB, Class A | | | 878 | | | | 14 | | |
| Swedish Match AB | | | 725 | | | | 29 | | |
| Tele2 AB, Class B | | | 560 | | | | 9 | | |
| Telefonaktiebolaget LM Ericsson, Class B | | | 5,064 | | | | 46 | | |
| TeliaSonera AB | | | 7,441 | | | | 48 | | |
| Volvo AB, Class B | | | 2,789 | | | | 32 | | |
| | | | 545 | | |
| Switzerland (1.8%) | |
| ABB Ltd. (Registered) (g) | | | 3,378 | | | | 55 | | |
| Actelion Ltd. (Registered) (g) | | | 305 | | | | 13 | | |
| Adecco SA (Registered) (g) | | | 317 | | | | 14 | | |
| Baloise Holding AG (Registered) | | | 121 | | | | 8 | | |
| Cie Financiere Richemont SA | | | 644 | | | | 35 | | |
| Credit Suisse Group AG (Registered) (g) | | | 1,645 | | | | 30 | | |
| GAM Holding AG (g) | | | 420 | | | | 5 | | |
| Geberit AG (Registered) (g) | | | 101 | | | | 20 | | |
| Givaudan SA (Registered) (g) | | | 16 | | | | 16 | | |
| Holcim Ltd. (Registered) (g) | | | 297 | | | | 16 | | |
| Julius Baer Group Ltd. (g) | | | 322 | | | | 12 | | |
| Kuehne & Nagel International AG (Registered) | | | 95 | | | | 10 | | |
| Lonza Group AG (Registered) (g) | | | 151 | | | | 6 | | |
| Nestle SA (Registered) | | | 4,211 | | | | 251 | | |
| Novartis AG (Registered) | | | 1,619 | | | | 90 | | |
| Roche Holding AG (Genusschein) | | | 1,507 | | | | 260 | | |
| Schindler Holding AG | | | 108 | | | | 12 | | |
The accompanying notes are an integral part of the financial statements.
12
The Universal Institutional Funds, Inc.
Semi-Annual Report – June 30, 2012 (unaudited)
Portfolio of Investments (cont'd)
Global Tactical Asset Allocation Portfolio
| | | Shares | | Value
(000) | |
| Switzerland (cont'd) | |
| SGS SA (Registered) | | | 15 | | | $ | 28 | | |
| Sonova Holding AG (Registered) (g) | | | 159 | | | | 15 | | |
| Swatch Group AG (The) | | | 43 | | | | 17 | | |
| Swiss Life Holding AG (Registered) (g) | | | 49 | | | | 5 | | |
| Swiss Re AG (g) | | | 187 | | | | 12 | | |
| Syngenta AG (Registered) | | | 170 | | | | 58 | | |
| UBS AG (Registered) (g) | | | 5,035 | | | | 59 | | |
| Zurich Insurance Group AG (g) | | | 273 | | | | 62 | | |
| | | | 1,109 | | |
| United Kingdom (4.5%) | |
| 3i Group PLC | | | 1,738 | | | | 5 | | |
| Admiral Group PLC | | | 480 | | | | 9 | | |
| AMEC PLC | | | 582 | | | | 9 | | |
| Anglo American PLC | | | 1,690 | | | | 55 | | |
| ARM Holdings PLC | | | 3,157 | | | | 25 | | |
| AstraZeneca PLC | | | 1,076 | | | | 48 | | |
| Aviva PLC | | | 5,013 | | | | 22 | | |
| BAE Systems PLC | | | 6,470 | | | | 29 | | |
| Barclays PLC | | | 25,136 | | | | 64 | | |
| BG Group PLC | | | 4,215 | | | | 86 | | |
| BHP Billiton PLC | | | 3,050 | | | | 87 | | |
| BP PLC | | | 16,271 | | | | 109 | | |
| British American Tobacco PLC | | | 2,537 | | | | 129 | | |
| British Land Co., PLC REIT | | | 1,752 | | | | 14 | | |
| British Sky Broadcasting Group PLC | | | 2,612 | | | | 29 | | |
| BT Group PLC | | | 17,422 | | | | 58 | | |
| Burberry Group PLC | | | 568 | | | | 12 | | |
| Capita PLC | | | 1,466 | | | | 15 | | |
| Capital Shopping Centres Group PLC REIT | | | 1,090 | | | | 6 | | |
| Centrica PLC | | | 8,109 | | | | 40 | | |
| Compass Group PLC | | | 3,720 | | | | 39 | | |
| Diageo PLC | | | 3,376 | | | | 87 | | |
| Experian PLC | | | 2,008 | | | | 28 | | |
| G4S PLC | | | 4,668 | | | | 20 | | |
| GlaxoSmithKline PLC | | | 3,788 | | | | 86 | | |
| Hammerson PLC REIT | | | 1,386 | | | | 10 | | |
| HSBC Holdings PLC | | | 11,047 | | | | 97 | | |
| ICAP PLC | | | 838 | | | | 4 | | |
| Imperial Tobacco Group PLC | | | 1,426 | | | | 55 | | |
| Inmarsat PLC | | | 301 | | | | 2 | | |
| International Power PLC | | | 2,772 | | | | 18 | | |
| Investec PLC | | | 1,018 | | | | 6 | | |
| Johnson Matthey PLC | | | 352 | | | | 12 | | |
| Land Securities Group PLC REIT | | | 1,495 | | | | 17 | | |
| Legal & General Group PLC | | | 8,309 | | | | 17 | | |
| Lloyds Banking Group PLC (g) | | | 34,284 | | | | 17 | | |
| Man Group PLC | | | 2,954 | | | | 4 | | |
| Marks & Spencer Group PLC | | | 1,874 | | | | 10 | | |
| National Grid PLC | | | 4,893 | | | | 52 | | |
| Next PLC | | | 430 | | | | 22 | | |
| Old Mutual PLC | | | 6,806 | | | | 16 | | |
| Petrofac Ltd. | | | 509 | | | | 11 | | |
| | | Shares | | Value
(000) | |
| Prudential PLC | | | 4,785 | | | $ | 55 | | |
| Randgold Resources Ltd. | | | 113 | | | | 10 | | |
| Reckitt Benckiser Group PLC | | | 1,043 | | | | 55 | | |
| Reed Elsevier PLC | | | 2,457 | | | | 20 | | |
| Resolution Ltd. | | | 2,787 | | | | 9 | | |
| Rexam PLC | | | 1,501 | | | | 10 | | |
| Rio Tinto PLC | | | 1,931 | | | | 92 | | |
| Rolls-Royce Holdings PLC (g) | | | 4,685 | | | | 63 | | |
| Royal Bank of Scotland Group PLC (g) | | | 4,230 | | | | 14 | | |
| Royal Dutch Shell PLC, Class A | | | 4,232 | | | | 143 | | |
| Royal Dutch Shell PLC, Class B | | | 3,390 | | | | 118 | | |
| RSA Insurance Group PLC | | | 6,889 | | | | 12 | | |
| Schroders PLC | | | 174 | | | | 4 | | |
| Segro PLC REIT | | | 1,460 | | | | 5 | | |
| Severn Trent PLC | | | 378 | | | | 10 | | |
| Shire PLC | | | 1,488 | | | | 43 | | |
| Smith & Nephew PLC | | | 2,021 | | | | 20 | | |
| Smiths Group PLC | | | 786 | | | | 13 | | |
| SSE PLC | | | 1,494 | | | | 33 | | |
| Standard Chartered PLC | | | 1,916 | | | | 42 | | |
| Standard Life PLC | | | 3,659 | | | | 13 | | |
| Tesco PLC | | | 9,275 | | | | 45 | | |
| Tullow Oil PLC | | | 1,414 | | | | 33 | | |
| Unilever PLC | | | 1,769 | | | | 59 | | |
| United Utilities Group PLC | | | 1,153 | | | | 12 | | |
| Vodafone Group PLC | | | 89,770 | | | | 252 | | |
| Weir Group PLC (The) | | | 345 | | | | 8 | | |
| WM Morrison Supermarkets PLC | | | 3,846 | | | | 16 | | |
| Wolseley PLC | | | 454 | | | | 17 | | |
| WPP PLC | | | 4,667 | | | | 57 | | |
| Xstrata PLC | | | 3,372 | | | | 43 | | |
| | | | 2,807 | | |
| United States (14.8%) | |
| 3M Co. | | | 17 | | | | 2 | | |
| Abbott Laboratories (d) | | | 1,701 | | | | 110 | | |
| Accenture PLC, Class A (d) | | | 383 | | | | 23 | | |
| ACCO Brands Corp. (d)(g) | | | 559 | | | | 6 | | |
| Adobe Systems, Inc. (g) | | | 458 | | | | 15 | | |
| AES Corp. (The) (g) | | | 320 | | | | 4 | | |
| Aetna, Inc. | | | 133 | | | | 5 | | |
| Agilent Technologies, Inc. (d) | | | 201 | | | | 8 | | |
| Alexion Pharmaceuticals, Inc. (d)(g) | | | 110 | | | | 11 | | |
| Allergan, Inc. (d) | | | 577 | | | | 53 | | |
| Alpha Natural Resources, Inc. (g) | | | 123 | | | | 1 | | |
| Altera Corp. (d) | | | 1,240 | | | | 42 | | |
| Altria Group, Inc. | | | 340 | | | | 12 | | |
| Amazon.com, Inc. (g) | | | 132 | | | | 30 | | |
| Ameren Corp. | | | 194 | | | | 6 | | |
| American Electric Power Co., Inc. (d) | | | 366 | | | | 15 | | |
| American Express Co. | | | 617 | | | | 36 | | |
| American Tower Corp. REIT (d) | | | 419 | | | | 29 | | |
| Ameriprise Financial, Inc. | | | 200 | | | | 10 | | |
| AmerisourceBergen Corp. (d) | | | 167 | | | | 7 | | |
The accompanying notes are an integral part of the financial statements.
13
The Universal Institutional Funds, Inc.
Semi-Annual Report – June 30, 2012 (unaudited)
Portfolio of Investments (cont'd)
Global Tactical Asset Allocation Portfolio
| | | Shares | | Value
(000) | |
| United States (cont'd) | |
| Amgen, Inc. | | | 957 | | | $ | 70 | | |
| Amphenol Corp., Class A (d) | | | 282 | | | | 15 | | |
| Anadarko Petroleum Corp. | | | 445 | | | | 29 | | |
| Analog Devices, Inc. (d) | | | 1,147 | | | | 43 | | |
| Annaly Capital Management, Inc. REIT (d) | | | 618 | | | | 10 | | |
| Apache Corp. | | | 114 | | | | 10 | | |
| Apple, Inc. (g) | | | 420 | | | | 245 | | |
| Applied Materials, Inc. | | | 4,066 | | | | 47 | | |
| AT&T, Inc. (d) | | | 1,746 | | | | 62 | | |
| Automatic Data Processing, Inc. (d) | | | 146 | | | | 8 | | |
| Avago Technologies Ltd. (d) | | | 790 | | | | 28 | | |
| Avery Dennison Corp. (d) | | | 126 | | | | 3 | | |
| Baker Hughes, Inc. (d) | | | 510 | | | | 21 | | |
| Bank of America Corp. | | | 6,132 | | | | 50 | | |
| Bank of New York Mellon Corp. (The) (d) | | | 863 | | | | 19 | | |
| Baxter International, Inc. (d) | | | 179 | | | | 9 | | |
| BB&T Corp. (d) | | | 846 | | | | 26 | | |
| Becton Dickinson and Co. (d) | | | 122 | | | | 9 | | |
| Bed Bath & Beyond, Inc. (g) | | | 136 | | | | 8 | | |
| Biogen Idec, Inc. (d)(g) | | | 265 | | | | 38 | | |
| BlackRock, Inc. | | | 74 | | | | 13 | | |
| Boeing Co. (The) | | | 18 | | | | 1 | | |
| Boston Properties, Inc. REIT (d) | | | 79 | | | | 9 | | |
| Boston Scientific Corp. (g) | | | 780 | | | | 4 | | |
| Bristol-Myers Squibb Co. (d) | | | 3,516 | | | | 126 | | |
| Broadcom Corp., Class A (g) | | | 1,757 | | | | 59 | | |
| C.H. Robinson Worldwide, Inc. (d) | | | 104 | | | | 6 | | |
| Cablevision Systems Corp. (d) | | | 334 | | | | 4 | | |
| Cameron International Corp. (g) | | | 206 | | | | 9 | | |
| Capital One Financial Corp. (d) | | | 200 | | | | 11 | | |
| Cardinal Health, Inc. (d) | | | 182 | | | | 8 | | |
| CareFusion Corp. (g) | | | 238 | | | | 6 | | |
| Carnival Corp. (d) | | | 1 | | | | — | @ | |
| Caterpillar, Inc. | | | 19 | | | | 2 | | |
| CBS Corp., Class B | | | 586 | | | | 19 | | |
| Celgene Corp. (g) | | | 251 | | | | 16 | | |
| CenterPoint Energy, Inc. | | | 193 | | | | 4 | | |
| CenturyLink, Inc. (d) | | | 1,611 | | | | 64 | | |
| Cerner Corp. (d)(g) | | | 133 | | | | 11 | | |
| CF Industries Holdings, Inc. (d) | | | 4 | | | | 1 | | |
| Charles Schwab Corp. (The) (d) | | | 1,306 | | | | 17 | | |
| Chesapeake Energy Corp. (d) | | | 290 | | | | 5 | | |
| Chevron Corp. | | | 1,158 | | | | 122 | | |
| Chipotle Mexican Grill, Inc. (d)(g) | | | 20 | | | | 8 | | |
| Chubb Corp. (The) | | | 1,276 | | | | 93 | | |
| Cigna Corp. (d) | | | 137 | | | | 6 | | |
| Cintas Corp. (d) | | | 184 | | | | 7 | | |
| Cisco Systems, Inc. | | | 2,478 | | | | 43 | | |
| CIT Group, Inc. (g) | | | 162 | | | | 6 | | |
| Citigroup, Inc. (See Note H) | | | 1,761 | | | | 49 | | |
| Citrix Systems, Inc. (g) | | | 107 | | | | 8 | | |
| Cliffs Natural Resources, Inc. (d) | | | 9 | | | | — | @ | |
| | | Shares | | Value
(000) | |
| CME Group, Inc. | | | 39 | | | $ | 10 | | |
| Coach, Inc. (d) | | | 151 | | | | 9 | | |
| Coca-Cola Co. (The) (d) | | | 633 | | | | 49 | | |
| Coca-Cola Enterprises, Inc. | | | 219 | | | | 6 | | |
| Cognizant Technology Solutions Corp., Class A (g) | | | 222 | | | | 13 | | |
| Colgate-Palmolive Co. (d) | | | 806 | | | | 84 | | |
| Comcast Corp., Class A | | | 474 | | | | 15 | | |
| Comcast Corp., Special Class A (d) | | | 442 | | | | 14 | | |
| Comerica, Inc. | | | 100 | | | | 3 | | |
| ConAgra Foods, Inc. | | | 2,700 | | | | 70 | | |
| Concho Resources, Inc. (d)(g) | | | 54 | | | | 5 | | |
| ConocoPhillips (d) | | | 1,418 | | | | 79 | | |
| CONSOL Energy, Inc. (d) | | | 147 | | | | 4 | | |
| Consolidated Edison, Inc. (d) | | | 148 | | | | 9 | | |
| Costco Wholesale Corp. (d) | | | 444 | | | | 42 | | |
| Covidien PLC | | | 206 | | | | 11 | | |
| CR Bard, Inc. (d) | | | 55 | | | | 6 | | |
| Crown Castle International Corp. (g) | | | 557 | | | | 33 | | |
| CSX Corp. (d) | | | 455 | | | | 10 | | |
| Cummins, Inc. | | | 5 | | | | — | @ | |
| CVS Caremark Corp. | | | 323 | | | | 15 | | |
| D.R. Horton, Inc. (d) | | | 8,900 | | | | 164 | | |
| Danaher Corp. (d) | | | 19 | | | | 1 | | |
| DaVita, Inc. (g) | | | 95 | | | | 9 | | |
| Deere & Co. (d) | | | 13 | | | | 1 | | |
| Dell, Inc. (d)(g) | | | 769 | | | | 10 | | |
| Deltic Timber Corp. (d) | | | 100 | | | | 6 | | |
| Devon Energy Corp. (d) | | | 168 | | | | 10 | | |
| DIRECTV, Class A (d)(g) | | | 546 | | | | 27 | | |
| Discover Financial Services | | | 342 | | | | 12 | | |
| Discovery Communications, Inc. (d)(g) | | | 342 | | | | 18 | | |
| Discovery Communications, Inc., Class C (d)(g) | | | 342 | | | | 17 | | |
| Dominion Resources, Inc. | | | 167 | | | | 9 | | |
| DTE Energy Co. (d) | | | 122 | | | | 7 | | |
| Duke Energy Corp. (d) | | | 346 | | | | 8 | | |
| Dun & Bradstreet Corp. (The) (d) | | | 72 | | | | 5 | | |
| Eagle Materials, Inc. (d) | | | 400 | | | | 15 | | |
| Eaton Corp. | | | 16 | | | | 1 | | |
| eBay, Inc. (d)(g) | | | 560 | | | | 24 | | |
| Ecolab, Inc. (d) | | | 17 | | | | 1 | | |
| Edison International (d) | | | 264 | | | | 12 | | |
| Edwards Lifesciences Corp. (d)(g) | | | 73 | | | | 8 | | |
| EI du Pont de Nemours & Co. (d) | | | 1,375 | | | | 70 | | |
| Eli Lilly & Co. | | | 356 | | | | 15 | | |
| EMC Corp. (d)(g) | | | 1,059 | | | | 27 | | |
| Emerson Electric Co. | | | 20 | | | | 1 | | |
| Entergy Corp. (d) | | | 123 | | | | 8 | | |
| EOG Resources, Inc. | | | 292 | | | | 26 | | |
| Equity Residential REIT (d) | | | 159 | | | | 10 | | |
| Estee Lauder Cos., Inc. (The), Class A | | | 274 | | | | 15 | | |
| Exelon Corp. | | | 380 | | | | 14 | | |
| Express Scripts Holding Co. (g) | | | 270 | | | | 15 | | |
| Exxon Mobil Corp. | | | 1,992 | | | | 170 | | |
The accompanying notes are an integral part of the financial statements.
14
The Universal Institutional Funds, Inc.
Semi-Annual Report – June 30, 2012 (unaudited)
Portfolio of Investments (cont'd)
Global Tactical Asset Allocation Portfolio
| | | Shares | | Value
(000) | |
| United States (cont'd) | |
| Fastenal Co. | | | 8 | | | $ | — | @ | |
| FedEx Corp. (d) | | | 150 | | | | 14 | | |
| Fifth Third Bancorp (d) | | | 1,002 | | | | 13 | | |
| FirstEnergy Corp. | | | 236 | | | | 12 | | |
| Fluor Corp. | | | 24 | | | | 1 | | |
| FMC Technologies, Inc. (d)(g) | | | 211 | | | | 8 | | |
| Ford Motor Co. (d) | | | 1,157 | | | | 11 | | |
| Forest Laboratories, Inc. (g) | | | 702 | | | | 25 | | |
| Franklin Resources, Inc. (d) | | | 83 | | | | 9 | | |
| Frontier Communications Corp. (d) | | | 743 | | | | 3 | | |
| General Dynamics Corp. (d) | | | 39 | | | | 3 | | |
| General Electric Co. | | | 4,225 | | | | 88 | | |
| General Growth Properties, Inc. REIT (d) | | | 702 | | | | 13 | | |
| General Mills, Inc. (d) | | | 603 | | | | 23 | | |
| Georgia Gulf Corp. (d) | | | 300 | | | | 8 | | |
| Gilead Sciences, Inc. (d)(g) | | | 512 | | | | 26 | | |
| Goldman Sachs Group, Inc. (The) | | | 302 | | | | 29 | | |
| Goodrich Corp. | | | 3 | | | | — | @ | |
| Google, Inc., Class A (g) | | | 179 | | | | 104 | | |
| H.J. Heinz Co. (d) | | | 139 | | | | 8 | | |
| Halliburton Co. | | | 895 | | | | 25 | | |
| HCP, Inc. REIT | | | 219 | | | | 10 | | |
| Health Care, Inc. REIT | | | 159 | | | | 9 | | |
| Henry Schein, Inc. (d)(g) | | | 74 | | | | 6 | | |
| Hershey Co. (The) (d) | | | 74 | | | | 5 | | |
| Hess Corp. (d) | | | 104 | | | | 5 | | |
| Hewlett-Packard Co. (d) | | | 1,809 | | | | 36 | | |
| Home Depot, Inc. (d) | | | 2,069 | | | | 110 | | |
| Honeywell International, Inc. | | | 24 | | | | 1 | | |
| Hospira, Inc. (d)(g) | | | 350 | | | | 12 | | |
| Hudson City Bancorp, Inc. (d) | | | 200 | | | | 1 | | |
| Human Genome Sciences, Inc. (d)(g) | | | 641 | | | | 8 | | |
| Humana, Inc. (d) | | | 59 | | | | 5 | | |
| Illinois Tool Works, Inc. (d) | | | 1,268 | | | | 67 | | |
| Integrys Energy Group, Inc. (d) | | | 1,243 | | | | 71 | | |
| Intel Corp. | | | 18,311 | | | | 488 | | |
| IntercontinentalExchange, Inc. (d)(g) | | | 57 | | | | 8 | | |
| International Business Machines Corp. | | | 939 | | | | 184 | | |
| Interpublic Group of Cos., Inc. (The) | | | 759 | | | | 8 | | |
| Intuit, Inc. (d) | | | 243 | | | | 14 | | |
| Intuitive Surgical, Inc. (d)(g) | | | 21 | | | | 12 | | |
| Invesco Ltd. | | | 415 | | | | 9 | | |
| Iron Mountain, Inc. (d) | | | 257 | | | | 8 | | |
| Johnson & Johnson (d) | | | 490 | | | | 33 | | |
| Johnson Controls, Inc. (d) | | | 2,224 | | | | 62 | | |
| Joy Global, Inc. | | | 24 | | | | 1 | | |
| JPMorgan Chase & Co. | | | 4,198 | | | | 150 | | |
| Juniper Networks, Inc. (g) | | | 620 | | | | 10 | | |
| KB Home (d) | | | 2,200 | | | | 22 | | |
| Kellogg Co. (d) | | | 341 | | | | 17 | | |
| KeyCorp (d) | | | 669 | | | | 5 | | |
| Kimco Realty Corp. REIT (d) | | | 402 | | | | 8 | | |
| | | Shares | | Value
(000) | |
| KLA-Tencor Corp. | | | 444 | | | $ | 22 | | |
| Kohl's Corp. (d) | | | 131 | | | | 6 | | |
| Kraft Foods, Inc., Class A (d) | | | 252 | | | | 10 | | |
| Kroger Co. (The) (d) | | | 610 | | | | 14 | | |
| Laboratory Corp. of America Holdings (d)(g) | | | 77 | | | | 7 | | |
| Lam Research Corp. (g) | | | 633 | | | | 24 | | |
| Las Vegas Sands Corp. | | | 173 | | | | 8 | | |
| Lennar Corp., Class A (d) | | | 5,000 | | | | 155 | | |
| Li & Fung Ltd. (h) | | | 16,000 | | | | 31 | | |
| Liberty Global, Inc. Series A (d)(g) | | | 217 | | | | 11 | | |
| Liberty Global, Inc. Series C (d)(g) | | | 242 | | | | 12 | | |
| Liberty Property Trust REIT (d) | | | 261 | | | | 10 | | |
| Life Technologies Corp. (d)(g) | | | 158 | | | | 7 | | |
| Linear Technology Corp. (d) | | | 691 | | | | 22 | | |
| Lockheed Martin Corp. (d) | | | 8 | | | | 1 | | |
| Louisiana-Pacific Corp. (d)(g) | | | 1,200 | | | | 13 | | |
| Lowe's Cos., Inc. (d) | | | 501 | | | | 14 | | |
| LSI Corp. (d)(g) | | | 2,585 | | | | 16 | | |
| Ltd. Brands, Inc. (d) | | | 165 | | | | 7 | | |
| M&T Bank Corp. (d) | | | 90 | | | | 7 | | |
| M/I Homes, Inc. (d)(g) | | | 500 | | | | 9 | | |
| Macerich Co. (The) REIT (d) | | | 159 | | | | 9 | | |
| Manpower, Inc. (d) | | | 117 | | | | 4 | | |
| Marathon Oil Corp. | | | 283 | | | | 7 | | |
| Marathon Petroleum Corp. | | | 250 | | | | 11 | | |
| Marriott International, Inc., Class A (d) | | | 1 | | | | — | @ | |
| Marvell Technology Group Ltd. | | | 1,493 | | | | 17 | | |
| Masco Corp. (d) | | | 3,000 | | | | 42 | | |
| Mastercard, Inc., Class A (d) | | | 136 | | | | 58 | | |
| Maxim Integrated Products, Inc. | | | 944 | | | | 24 | | |
| McDonald's Corp. | | | 1,148 | | | | 102 | | |
| McGraw-Hill Cos., Inc. (The) (d) | | | 288 | | | | 13 | | |
| McKesson Corp. | | | 131 | | | | 12 | | |
| MDC Holdings, Inc. | | | 1,300 | | | | 42 | | |
| Mead Johnson Nutrition Co. (d) | | | 217 | | | | 17 | | |
| MeadWestvaco Corp. (d) | | | 1,697 | | | | 49 | | |
| Medtronic, Inc. | | | 312 | | | | 12 | | |
| Merck & Co., Inc. | | | 251 | | | | 10 | | |
| Meritage Homes Corp. (d)(g) | | | 900 | | | | 31 | | |
| Microchip Technology, Inc. (d) | | | 629 | | | | 21 | | |
| Micron Technology, Inc. (g) | | | 2,947 | | | | 19 | | |
| Microsoft Corp. | | | 5,150 | | | | 158 | | |
| Mohawk Industries, Inc. (d)(g) | | | 600 | | | | 42 | | |
| Monsanto Co. | | | 28 | | | | 2 | | |
| Mosaic Co. (The) | | | 15 | | | | 1 | | |
| Murphy Oil Corp. (d) | | | 148 | | | | 7 | | |
| NASDAQ OMX Group, Inc. (The) | | | 200 | | | | 5 | | |
| National Oilwell Varco, Inc. | | | 338 | | | | 22 | | |
| NetApp, Inc. (d)(g) | | | 478 | | | | 15 | | |
| New York Community Bancorp, Inc. (d) | | | 200 | | | | 2 | | |
| Newfield Exploration Co. (g) | | | 157 | | | | 5 | | |
| Newmont Mining Corp. | | | 26 | | | | 1 | | |
| News Corp., Class A (d) | | | 926 | | | | 21 | | |
The accompanying notes are an integral part of the financial statements.
15
The Universal Institutional Funds, Inc.
Semi-Annual Report – June 30, 2012 (unaudited)
Portfolio of Investments (cont'd)
Global Tactical Asset Allocation Portfolio
| | | Shares | | Value
(000) | |
| United States (cont'd) | |
| News Corp., Class B | | | 551 | | | $ | 12 | | |
| NextEra Energy, Inc. | | | 140 | | | | 10 | | |
| NII Holdings, Inc. (d)(g) | | | 112 | | | | 1 | | |
| NIKE, Inc., Class B | | | 200 | | | | 18 | | |
| Noble Corp. (g) | | | 200 | | | | 6 | | |
| Noble Energy, Inc. | | | 89 | | | | 8 | | |
| Nordstrom, Inc. (d) | | | 62 | | | | 3 | | |
| Norfolk Southern Corp. | | | 1,375 | | | | 99 | | |
| Northrop Grumman Corp. (d) | | | 10 | | | | 1 | | |
| NVIDIA Corp. (d)(g) | | | 1,732 | | | | 24 | | |
| NVR, Inc. (d)(g) | | | 100 | | | | 85 | | |
| O'Reilly Automotive, Inc. (d)(g) | | | 114 | | | | 10 | | |
| Occidental Petroleum Corp. | | | 750 | | | | 64 | | |
| Omnicom Group, Inc. (d) | | | 220 | | | | 11 | | |
| Oneok, Inc. (d) | | | 244 | | | | 10 | | |
| Oracle Corp. | | | 1,754 | | | | 52 | | |
| Owens Corning (d)(g) | | | 1,000 | | | | 29 | | |
| PACCAR, Inc. (d) | | | 12 | | | | — | @ | |
| Peabody Energy Corp. | | | 341 | | | | 8 | | |
| People's United Financial, Inc. (d) | | | 100 | | | | 1 | | |
| PepsiCo, Inc. | | | 677 | | | | 48 | | |
| Pfizer, Inc. | | | 966 | | | | 22 | | |
| PG&E Corp. (d) | | | 262 | | | | 12 | | |
| Philip Morris International, Inc. | | | 1,718 | | | | 150 | | |
| Phillips 66 (g) | | | 709 | | | | 24 | | |
| Pioneer Natural Resources Co. | | | 131 | | | | 12 | | |
| Pitney Bowes, Inc. (d) | | | 267 | | | | 4 | | |
| Plum Creek Timber Co., Inc. REIT (d) | | | 261 | | | | 10 | | |
| PNC Financial Services Group, Inc. | | | 354 | | | | 22 | | |
| PPL Corp. (d) | | | 276 | | | | 8 | | |
| Praxair, Inc. (d) | | | 15 | | | | 2 | | |
| Precision Castparts Corp. | | | 3 | | | | — | @ | |
| Priceline.com, Inc. (d)(g) | | | 24 | | | | 16 | | |
| Procter & Gamble Co. (The) | | | 2,512 | | | | 154 | | |
| Progress Energy, Inc. (d) | | | 72 | | | | 4 | | |
| ProLogis, Inc. REIT (d) | | | 118 | | | | 4 | | |
| Public Service Enterprise Group, Inc. (d) | | | 325 | | | | 11 | | |
| Public Storage REIT (d) | | | 75 | | | | 11 | | |
| Pulte Group, Inc. (d)(g) | | | 10,700 | | | | 114 | | |
| Qualcomm, Inc. | | | 818 | | | | 46 | | |
| Quest Diagnostics, Inc. (d) | | | 115 | | | | 7 | | |
| Range Resources Corp. (d) | | | 65 | | | | 4 | | |
| Rayonier, Inc. REIT (d) | | | 270 | | | | 12 | | |
| Raytheon Co. (d) | | | 1,517 | | | | 86 | | |
| Regions Financial Corp. (d) | | | 913 | | | | 6 | | |
| Republic Services, Inc. (d) | | | 288 | | | | 8 | | |
| Reynolds American, Inc. (d) | | | 1,491 | | | | 67 | | |
| Robert Half International, Inc. (d) | | | 200 | | | | 6 | | |
| Rockwell Automation, Inc. (d) | | | 5 | | | | — | @ | |
| Ross Stores, Inc. | | | 148 | | | | 9 | | |
| Rouse Properties, Inc. REIT (d)(g) | | | 26 | | | | — | @ | |
| Royal Caribbean Cruises Ltd. | | | 1 | | | | — | @ | |
| | | Shares | | Value
(000) | |
| Ryland Group, Inc. (The) (d) | | | 1,200 | | | $ | 31 | | |
| Safeway, Inc. (d) | | | 2,252 | | | | 41 | | |
| Salesforce.com, Inc. (d)(g) | | | 56 | | | | 8 | | |
| SanDisk Corp. (d)(g) | | | 231 | | | | 8 | | |
| Schlumberger Ltd. | | | 889 | | | | 58 | | |
| Scripps Networks Interactive, Inc., Class A | | | 171 | | | | 10 | | |
| Sempra Energy (d) | | | 156 | | | | 11 | | |
| Simon Property Group, Inc. REIT (d) | | | 214 | | | | 33 | | |
| Southern Co. (The) (d) | | | 323 | | | | 15 | | |
| Southwestern Energy Co. (d)(g) | | | 326 | | | | 10 | | |
| Spectra Energy Corp. (d) | | | 383 | | | | 11 | | |
| Sprint Nextel Corp. (d)(g) | | | 1,847 | | | | 6 | | |
| St. Jude Medical, Inc. (d) | | | 162 | | | | 6 | | |
| Standard Pacific Corp. (d)(g) | | | 9,700 | | | | 60 | | |
| Staples, Inc. (d) | | | 350 | | | | 5 | | |
| Starbucks Corp. | | | 239 | | | | 13 | | |
| State Street Corp. (d) | | | 315 | | | | 14 | | |
| Stericycle, Inc. (d)(g) | | | 117 | | | | 11 | | |
| Stryker Corp. (d) | | | 143 | | | | 8 | | |
| SunTrust Banks, Inc. | | | 305 | | | | 7 | | |
| Symantec Corp. (g) | | | 340 | | | | 5 | | |
| Sysco Corp. (d) | | | 558 | | | | 17 | | |
| T. Rowe Price Group, Inc. (d) | | | 221 | | | | 14 | | |
| Target Corp. | | | 173 | | | | 10 | | |
| TE Connectivity Ltd. (d) | | | 183 | | | | 6 | | |
| Tenaris SA (d) | | | 830 | | | | 14 | | |
| Texas Instruments, Inc. | | | 3,892 | | | | 112 | | |
| Thermo Fisher Scientific, Inc. | | | 583 | | | | 30 | | |
| Time Warner Cable, Inc. | | | 164 | | | | 13 | | |
| Time Warner, Inc. | | | 2,407 | | | | 93 | | |
| TJX Cos., Inc. | | | 374 | | | | 16 | | |
| Toll Brothers, Inc. (d)(g) | | | 4,500 | | | | 134 | | |
| Tyco International Ltd. | | | 1,658 | | | | 88 | | |
| Ultra Petroleum Corp. (d)(g) | | | 135 | | | | 3 | | |
| Union Pacific Corp. | | | 218 | | | | 26 | | |
| United Parcel Service, Inc., Class B (d) | | | 225 | | | | 18 | | |
| United Technologies Corp. (d) | | | 26 | | | | 2 | | |
| UnitedHealth Group, Inc. | | | 136 | | | | 8 | | |
| Universal Forest Products, Inc. (d) | | | 200 | | | | 8 | | |
| US Bancorp (d) | | | 809 | | | | 26 | | |
| Valero Energy Corp. | | | 363 | | | | 9 | | |
| Varian Medical Systems, Inc. (d)(g) | | | 119 | | | | 7 | | |
| Ventas, Inc. REIT (d) | | | 159 | | | | 10 | | |
| Verisk Analytics, Inc., Class A (g) | | | 176 | | | | 9 | | |
| Verizon Communications, Inc. | | | 2,916 | | | | 130 | | |
| Vertex Pharmaceuticals, Inc. (g) | | | 300 | | | | 17 | | |
| VF Corp. (d) | | | 554 | | | | 74 | | |
| Viacom, Inc., Class B | | | 227 | | | | 11 | | |
| Virgin Media, Inc. (d) | | | 242 | | | | 6 | | |
| Visa, Inc., Class A (d) | | | 237 | | | | 29 | | |
| Vornado Realty Trust REIT | | | 59 | | | | 5 | | |
| Wal-Mart Stores, Inc. | | | 1,234 | | | | 86 | | |
| Walgreen Co. (d) | | | 741 | | | | 22 | | |
The accompanying notes are an integral part of the financial statements.
16
The Universal Institutional Funds, Inc.
Semi-Annual Report – June 30, 2012 (unaudited)
Portfolio of Investments (cont'd)
Global Tactical Asset Allocation Portfolio
| | | Shares | | Value
(000) | |
| United States (cont'd) | |
| Walt Disney Co. (The) | | | 281 | | | $ | 14 | | |
| Waste Management, Inc. (d) | | | 295 | | | | 10 | | |
| Watsco, Inc. (d) | | | 300 | | | | 22 | | |
| Watson Pharmaceuticals, Inc. (g) | | | 264 | | | | 20 | | |
| Weatherford International Ltd. (d)(g) | | | 937 | | | | 12 | | |
| WellPoint, Inc. | | | 151 | | | | 10 | | |
| Wells Fargo & Co. | | | 3,025 | | | | 101 | | |
| Western Union Co. (The) (d) | | | 206 | | | | 3 | | |
| Weyerhaeuser Co. REIT (d) | | | 378 | | | | 8 | | |
| Whole Foods Market, Inc. (d) | | | 252 | | | | 24 | | |
| Williams Cos., Inc. (The) | | | 961 | | | | 28 | | |
| Wisconsin Energy Corp. (d) | | | 199 | | | | 8 | | |
| WPX Energy, Inc. (d)(g) | | | 320 | | | | 5 | | |
| WW Grainger, Inc. (d) | | | 2 | | | | — | @ | |
| Wynn Resorts Ltd. (d) | | | 51 | | | | 5 | | |
| Xcel Energy, Inc. (d) | | | 228 | | | | 6 | | |
| Xerox Corp. (d) | | | 976 | | | | 8 | | |
| Xilinx, Inc. (d) | | | 853 | | | | 29 | | |
| Xylem, Inc. (d) | | | 71 | | | | 2 | | |
| Yahoo!, Inc. (d)(g) | | | 624 | | | | 10 | | |
| Yum! Brands, Inc. (d) | | | 1,474 | | | | 95 | | |
| Zimmer Holdings, Inc. (d) | | | 117 | | | | 8 | | |
| | | | 9,313 | | |
| Total Common Stocks (Cost $27,129) | | | 26,061 | | |
| Commodity Linked Security (2.4%) | |
| United States (2.4%) | |
Deutsche Bank AG
Zero Coupon, 12/3/12 (c)(j) (Cost $1,552) | | | 1,552,000 | | | | 1,484 | | |
| | | No. of
Rights | | | |
| Rights (0.0%) | |
| Australia (0.0%) | |
| Echo Entertainment Group Ltd. (g) (Cost $—) | | | 75 | | | | — | @ | |
| | | Shares | | | |
| Investment Companies (4.9%) | |
| United States (4.9%) | |
| iShares MSCI Emerging Markets Index Fund | | | 7,100 | | | | 278 | | |
Morgan Stanley Institutional Fund, Inc. —
Emerging Markets Portfolio (See Note H) | | | 105,470 | | | | 2,430 | | |
| Technology Select Sector SPDR Fund (d) | | | 12,200 | | | | 351 | | |
| Total Investment Companies (Cost $3,444) | | | 3,059 | | |
| Short-Term Investments (23.3%) | |
| Securities held as Collateral on Loaned Securities (13.3%) | |
| Investment Company (13.0%) | |
Morgan Stanley Institutional Liquidity
Funds — Money Market Portfolio —
Institutional Class (See Note H) | | | 8,147,131 | | | | 8,147 | | |
| | | Face Amount
(000) | | Value
(000) | |
| Repurchase Agreements (0.3%) | |
Barclays Capital, Inc., (0.15%, dated
6/29/12, due 7/2/12; proceeds
$98; fully collateralized by a U.S.
Government Obligation; U.S.
Treasury Bond 3.13% due 2/15/42;
valued at $100) | | $ | 98 | | | $ | 98 | | |
Merrill Lynch & Co., Inc., (0.18%, dated
6/29/12, due 7/2/12; proceeds
$127; fully collateralized by a U.S.
Government Agency; Federal Home
Loan Mortgage Corporation 3.75%
due 3/27/19; valued at $130) | | | 127 | | | | 127 | | |
| | | | 225 | | |
Total Securities held as Collateral on
Loaned Securities (Cost $8,372) | | | 8,372 | | |
| | | Shares | | | |
| Investment Company (6.1%) | |
Morgan Stanley Institutional Liquidity
Funds — Money Market Portfolio —
Institutional Class (See Note H)
(Cost $3,806) | | | 3,805,864 | | | | 3,806 | | |
| | | Face Amount
(000) | | | |
| U.S. Treasury Securities (3.9%) | |
U.S. Treasury Bills,
0.08%, 8/2/12 (d)(k) | | $ | 585 | | | $ | 585 | | |
| 0.11%, 10/4/12 (k) | | | 700 | | | | 700 | | |
| 0.14%, 11/29/12 (k) | | | 1,200 | | | | 1,199 | | |
| Total U.S. Treasury Securities (Cost $2,484) | | | 2,484 | | |
| Total Short-Term Investments (Cost $14,662) | | | 14,662 | | |
Total Investments (111.5%) (Cost $71,377)
Including $9,515 of Securities Loaned (l)(m) | | | 70,076 | | |
| Liabilities in Excess of Other Assets (-11.5%) | | | (7,208 | ) | |
| Net Assets (100.0%) | | $ | 62,868 | | |
(a) Security is subject to delayed delivery.
(b) Variable/Floating Rate Security — Interest rate changes on these instruments are based on changes in a designated base rate. The rates shown are those in effect on June 30, 2012.
(c) 144A security — Certain conditions for public sale may exist. Unless otherwise noted, these securities are deemed to be liquid.
(d) All or a portion of this security was on loan at June 30, 2012.
(e) Comprised of securities in separate entities that are traded as a single stapled security.
(f) Consists of one or more classes of securities traded together as a unit; stocks with attached warrants.
(g) Non-income producing security.
(h) Security trades on the Hong Kong exchange.
(i) At June 30, 2012, the Portfolio held a fair valued security valued at less than $500, representing less than 0.05% of net assets. This security has been fair valued as determined in good faith under procedures established by and under the general supervision of the Fund's Directors.
The accompanying notes are an integral part of the financial statements.
17
The Universal Institutional Funds, Inc.
Semi-Annual Report – June 30, 2012 (unaudited)
Portfolio of Investments (cont'd)
Global Tactical Asset Allocation Portfolio
(j) Security is linked to the Dow Jones UBS Commodities Index Total Return. The index is currently comprised of futures contracts on nineteen physical commodities traded on U.S. exchanges, with the exception of aluminum, nickel, and zinc, which trade on the London Metal Exchange.
(k) Rate shown is the yield to maturity at June 30, 2012.
(l) Securities are available for collateral in connection with purchase of when-issued securities, securities purchased on a forward commitment basis, open foreign currency exchange contracts, futures contracts and swap agreements.
(m) The approximate fair value and percentage of net assets, $14,965,000 and 23.8%, respectively, represent the securities that have been fair valued under the fair valuation policy for international investments as described in Note A-1 within the Notes to the Financial Statements.
@ Value is less than $500.
BTAN Bons du Trésor à Intérets Annuels (Treasury Bill Annual Interest).
CVA Certificaten Van Aandelen.
OAT Obligations Assimilables du Trésor (French Treasury Obligation).
PPS Price Protected Shares.
REIT Real Estate Investment Trust.
SDR Swedish Depositary Receipt.
SPDR Standard & Poor's Depository Receipt.
TBA To Be Announced.
Foreign Currency Exchange Contracts Information:
The Portfolio had the following foreign currency exchange contracts open at period end:
| Counterparty | | Currency
to Deliver
(000) | | Value
(000) | | Settlement
Date | | In Exchange For
(000) | | Value
(000) | | Unrealized
Appreciation
(Depreciation)
(000) | |
| Goldman Sachs International | | EUR | 576 | | | $ | 729 | | | 7/13/12 | | USD | 713 | | | $ | 713 | | | $ | (16 | ) | |
| Goldman Sachs International | | MXN | 1,550 | | | | 116 | | | 7/13/12 | | USD | 109 | | | | 109 | | | | (7 | ) | |
| Goldman Sachs International | | USD | 42 | | | | 42 | | | 7/13/12 | | NOK | 255 | | | | 43 | | | | 1 | | |
| Goldman Sachs International | | USD | 64 | | | | 64 | | | 7/13/12 | | THB | 2,050 | | | | 64 | | | | — | @ | |
| Goldman Sachs International | | ZAR | 514 | | | | 63 | | | 7/13/12 | | USD | 60 | | | | 60 | | | | (3 | ) | |
| JPMorgan Chase Bank | | PLN | 708 | | | | 212 | | | 7/13/12 | | USD | 199 | | | | 199 | | | | (13 | ) | |
| JPMorgan Chase Bank | | USD | 281 | | | | 281 | | | 7/13/12 | | SGD | 362 | | | | 286 | | | | 5 | | |
| UBS AG | | CLP | 69,660 | | | | 139 | | | 7/13/12 | | USD | 134 | | | | 134 | | | | (5 | ) | |
| UBS AG | | USD | 69 | | | | 69 | | | 7/13/12 | | GBP | 45 | | | | 70 | | | | 1 | | |
| Wells Fargo Bank | | AUD | 252 | | | | 258 | | | 7/13/12 | | USD | 244 | | | | 244 | | | | (14 | ) | |
| Wells Fargo Bank | | SEK | 370 | | | | 54 | | | 7/13/12 | | USD | 51 | | | | 51 | | | | (3 | ) | |
| Wells Fargo Bank | | USD | 389 | | | | 389 | | | 7/13/12 | | CAD | 401 | | | | 394 | | | | 5 | | |
| Wells Fargo Bank | | USD | 3,236 | | | | 3,236 | | | 7/13/12 | | JPY | 253,517 | | | | 3,172 | | | | (64 | ) | |
| Bank of America NA | | MYR | 411 | | | | 129 | | | 7/19/12 | | USD | 130 | | | | 130 | | | | 1 | | |
| Deutsche Bank AG | | AUD | 497 | | | | 508 | | | 7/19/12 | | USD | 499 | | | | 499 | | | | (9 | ) | |
| Deutsche Bank AG | | USD | 210 | | | | 210 | | | 7/19/12 | | AUD | 207 | | | | 211 | | | | 1 | | |
| Goldman Sachs International | | BRL | 339 | | | | 168 | | | 7/19/12 | | USD | 168 | | | | 168 | | | | (— | @) | |
| Goldman Sachs International | | CAD | 197 | | | | 193 | | | 7/19/12 | | USD | 193 | | | | 193 | | | | — | @ | |
| Goldman Sachs International | | EUR | 133 | | | | 168 | | | 7/19/12 | | USD | 167 | | | | 167 | | | | (1 | ) | |
| Goldman Sachs International | | JPY | 6,787 | | | | 85 | | | 7/19/12 | | USD | 85 | | | | 85 | | | | (— | @) | |
| Goldman Sachs International | | JPY | 32,617 | | | | 409 | | | 7/19/12 | | USD | 409 | | | | 409 | | | | — | @ | |
| Goldman Sachs International | | USD | 88 | | | | 88 | | | 7/19/12 | | CAD | 91 | | | | 89 | | | | 1 | | |
| JPMorgan Chase Bank | | NOK | 331 | | | | 56 | | | 7/19/12 | | USD | 56 | | | | 56 | | | | — | @ | |
| Royal Bank of Scotland | | CAD | 541 | | | | 531 | | | 7/19/12 | | USD | 531 | | | | 531 | | | | (— | @) | |
| Royal Bank of Scotland | | MXN | 1,098 | | | | 82 | | | 7/19/12 | | USD | 80 | | | | 80 | | | | (2 | ) | |
| Royal Bank of Scotland | | USD | 139 | | | | 139 | | | 7/19/12 | | ILS | 536 | | | | 137 | | | | (2 | ) | |
| State Street Bank and Trust Co. | | CLP | 59,605 | | | | 119 | | | 7/19/12 | | USD | 119 | | | | 119 | | | | (— | @) | |
| State Street Bank and Trust Co. | | USD | 248 | | | | 248 | | | 7/19/12 | | TWD | 7,399 | | | | 248 | | | | — | @ | |
| UBS AG | | CAD | 266 | | | | 261 | | | 7/19/12 | | USD | 261 | | | | 261 | | | | (— | @) | |
| UBS AG | | DKK | 279 | | | | 48 | | | 7/19/12 | | USD | 48 | | | | 48 | | | | — | @ | |
| UBS AG | | EUR | 900 | | | | 1,139 | | | 7/19/12 | | USD | 1,141 | | | | 1,141 | | | | 2 | | |
| UBS AG | | GBP | 317 | | | | 496 | | | 7/19/12 | | USD | 494 | | | | 494 | | | | (2 | ) | |
| UBS AG | | HKD | 1,957 | | | | 252 | | | 7/19/12 | | USD | 252 | | | | 252 | | | | (— | @) | |
| UBS AG | | JPY | 144,788 | | | | 1,812 | | | 7/19/12 | | USD | 1,833 | | | | 1,833 | | | | 21 | | |
The accompanying notes are an integral part of the financial statements.
18
The Universal Institutional Funds, Inc.
Semi-Annual Report – June 30, 2012 (unaudited)
Portfolio of Investments (cont'd)
Global Tactical Asset Allocation Portfolio
Foreign Currency Exchange Contracts Information: (cont'd)
| Counterparty | | Currency
to Deliver
(000) | | Value
(000) | | Settlement
Date | | In Exchange For
(000) | | Value
(000) | | Unrealized
Appreciation
(Depreciation)
(000) | |
| UBS AG | | USD | 636 | | | $ | 636 | | | 7/19/12 | | BRL | 1,306 | | | $ | 648 | | | $ | 12 | | |
| UBS AG | | USD | 420 | | | | 420 | | | 7/19/12 | | CHF | 397 | | | | 419 | | | | (1 | ) | |
| UBS AG | | USD | 188 | | | | 188 | | | 7/19/12 | | GBP | 120 | | | | 187 | | | | (1 | ) | |
| UBS AG | | USD | 278 | | | | 278 | | | 7/19/12 | | KRW | 324,672 | | | | 283 | | | | 5 | | |
| UBS AG | | USD | 352 | | | | 352 | | | 7/19/12 | | RUB | 11,514 | | | | 354 | | | | 2 | | |
| UBS AG | | USD | 195 | | | | 195 | | | 7/19/12 | | SGD | 247 | | | | 195 | | | | (— | @) | |
| UBS AG | | USD | 205 | | | | 205 | | | 7/19/12 | | ZAR | 1,690 | | | | 207 | | | | 2 | | |
| | | | | | | $ | 15,067 | | | | | | | | | | | $ | 14,983 | | | $ | (84 | ) | |
Futures Contracts:
The Portfolio had the following futures contracts open at period end:
| | | Number
of
Contracts | | Value
(000) | | Expiration
Date | | Unrealized
Appreciation
(Depreciation)
(000) | |
| Long: | |
10 yr. Japan Government
Bond (Japan) | | | 1 | | | $ | 1,801 | | | Sep-12 | | $ | 3 | | |
| CAC 40 Index (France) | | | 58 | | | | 2,342 | | | Jul-12 | | | 108 | | |
| DAX Index (Germany) | | | 4 | | | | 811 | | | Sep-12 | | | 27 | | |
Euro Stoxx 50 Index
(Germany) | | | 5 | | | | 143 | | | Sep-12 | | | (1 | ) | |
FTSE 100 Index
(United Kingdom) | | | 7 | | | | 606 | | | Sep-12 | | | 10 | | |
MSCI Emerging
Market E MINI
(United States) | | | 47 | | | | 2,220 | | | Sep-12 | | | 55 | | |
NIKKEI 225 Index
(United States) | | | 10 | | | | 570 | | | Sep-12 | | | 40 | | |
S&P 500 E MINI Index
(United States) | | | 104 | | | | 7,053 | | | Sep-12 | | | 247 | | |
S&P Mid Cap 400 E MINI
Index (United States) | | | 8 | | | | 752 | | | Sep-12 | | | 17 | | |
SGX MSCI Singapore Index
(Singapore) | | | 5 | | | | 262 | | | Jul-12 | | | 6 | | |
| TOPIX Index (Japan) | | | 1 | | | | 96 | | | Sep-12 | | | 6 | | |
U.S. Treasury 5 yr. Note
(United States) | | | 1 | | | | 124 | | | Sep-12 | | | — | @ | |
U.S. Treasury 30 yr. Bond
(United States) | | | 8 | | | | 1,184 | | | Sep-12 | | | 8 | | |
| | | Number
of
Contracts | | Value
(000) | | Expiration
Date | | Unrealized
Appreciation
(Depreciation)
(000) | |
| Short: | |
ASX Spi 200 Index
(Australia) | | | 2 | | | $ | (207 | ) | | Sep-12 | | $ | 2 | | |
German Euro BOBL
(Germany) | | | 3 | | | | (478 | ) | | Sep-12 | | | 6 | | |
German Euro Bund
(Germany) | | | 27 | | | | (4,813 | ) | | Sep-12 | | | 95 | | |
Hang Seng Index
(Hong Kong) | | | 3 | | | | (376 | ) | | Jul-12 | | | (5 | ) | |
S&P TSE 60 Index
(Canada) | | | 1 | | | | (130 | ) | | Sep-12 | | | (2 | ) | |
U.S. Treasury 5 yr. Note
(United States) | | | 54 | | | | (6,694 | ) | | Sep-12 | | | (14 | ) | |
U.S. Treasury 10 yr. Note
(United States) | | | 32 | | | | (4,268 | ) | | Sep-12 | | | 3 | | |
U.S. Treasury 30 yr. Bond
(United States) | | | 4 | | | | (592 | ) | | Sep-12 | | | (3 | ) | |
| | | $ | 608 | | |
Interest Rate Swap Agreements:
The Portfolio had the following interest rate swap agreements open at period end:
| Swap Counterparty | | Floating Rate
Index | | Pay/Receive
Floating Rate | | Fixed
Rate | | Termination
Date | | Notional
Amount
(000) | | Unrealized
Appreciation
(Depreciation)
(000) | |
| Bank of America NA | | 6 Month EURIBOR | | Pay | | | 4.26 | % | | 8/18/26 | | EUR | 1,400 | | | $ | 91 | | |
| Bank of America NA | | 3 Month LIBOR | | Receive | | | 4.35 | | | 8/18/26 | | $ | 1,875 | | | | (85 | ) | |
| Bank of America NA | | 6 Month EURIBOR | | Receive | | | 3.61 | | | 8/18/31 | | EUR | 1,770 | | | | (95 | ) | |
| Bank of America NA | | 3 Month LIBOR | | Pay | | | 4.15 | | | 8/18/31 | | $ | 2,325 | | | | 83 | | |
| | | $ | (6 | ) | |
The accompanying notes are an integral part of the financial statements.
19
The Universal Institutional Funds, Inc.
Semi-Annual Report – June 30, 2012 (unaudited)
Portfolio of Investments (cont'd)
Global Tactical Asset Allocation Portfolio
Total Return Swap Agreements:
The Portfolio had the following total return swap agreements open at period end:
| Swap Counterparty | | Index | | Notional
Amount
(000) | | Floating
Rate | | Pay/Receive
Total Return
of Referenced
Index | | Maturity
Date | | Unrealized
Appreciation
(Depreciation)
(000) | |
| Goldman Sachs | | Goldman Sachs China Retail
Custom Basket Index | | $ | 6,758 | | | 3-Month HKD-HIBOR-minus 1.24% | | Pay | | 6/21/13 | | $ | (21 | ) | |
| Goldman Sachs | | Goldman Sachs South Africa Consumer
Discretionary Custom Basket Index | | | 920 | | | 3-Month USD-LIBOR-minus 0.55% | | Pay | | 6/21/13 | | | 17 | | |
| Bank of America | | Merrill Lynch Custom Luxury Basket Index | | | 629 | | | 3-Month USD-LIBOR-minus 0.15% | | Pay | | 5/29/13 | | | (3 | ) | |
| Bank of America | | Merrill Lynch Custom Luxury Basket Index | | | 630 | | | 3-Month USD-LIBOR-minus 0.15% | | Pay | | 5/29/13 | | | (14 | ) | |
| Bank of America | | Merrill Lynch Custom Test Index | | | 120 | | | 3-Month USD-LIBOR-minus 1.02% | | Pay | | 5/13/13 | | | 11 | | |
| Bank of America | | Merrill Lynch Custom Test Index | | | 120 | | | 3-Month USD-LIBOR-minus 1.02% | | Pay | | 5/13/13 | | | 8 | | |
| Bank of America | | Merrill Lynch Custom Test Index | | | 441 | | | 3-Month USD-LIBOR-minus 1.02% | | Pay | | 5/13/13 | | | 39 | | |
| | | $ | 37 | | |
@ Value is less than $500.
EURIBOR Euro Interbank Offered Rate.
HIBOR Hong Kong Interbank Offered Rate.
LIBOR London Interbank Offered Rate.
AUD — Australian Dollar
BRL — Brazilian Real
CAD — Canadian Dollar
CHF — Swiss Franc
CLP — Chilean Peso
DKK — Danish Krone
EUR — Euro
GBP — British Pound
HKD — Hong Kong Dollar
ILS — Israeli Shekel
JPY — Japanese Yen
KRW — South Korean Won
MXN — Mexican New Peso
MYR — Malaysian Ringgit
NOK — Norwegian Krone
PLN — Polish Zloty
RUB — Russian Ruble
SEK — Swedish Krona
SGD — Singapore Dollar
THB — Thai Baht
TWD — Taiwan Dollar
USD — United States Dollar
ZAR — South African Rand
Portfolio Composition*
| Classification | | Percentage of
Total Investments | |
| Common Stocks | | | 42.3 | % | |
| Fixed Income Securities | | | 40.2 | | |
| Short-Term Investments | | | 10.2 | | |
| Investment Companies | | | 5.0 | | |
| Other** | | | 2.3 | | |
| Total Investments | | | 100.0 | %*** | |
* Percentages indicated are based upon total investments (excluding Securities held as Collateral on Loaned Securities) as of June 30, 2012.
** Industries and/or investment types representing less than 5% of total investments.
*** Does not include open foreign currency exchange contracts with net unrealized depreciation of approximately $84,000. Does not include open long/short futures contracts with an underlying face amount of approximately $406,000 and net unrealized appreciation of approximately $608,000. Does not include open swap agreements with net unrealized appreciation of approximately $31,000.
The accompanying notes are an integral part of the financial statements.
20
The Universal Institutional Funds, Inc.
Semi-Annual Report – June 30, 2012 (unaudited)
Global Tactical Asset Allocation Portfolio
| Statement of Assets and Liabilities | | June 30, 2012
(000) | |
| Assets: | |
| Investments in Securities of Unaffiliated Issuers, at Value(1) (Cost $56,400) | | $ | 55,459 | | |
| Investment in Security of Affiliated Issuer, at Value (Cost $14,977) | | | 14,617 | | |
| Total Investments in Securities, at Value (Cost $71,377) | | | 70,076 | | |
| Foreign Currency, at Value (Cost $978) | | | 980 | | |
| Cash | | | — | @ | |
| Receivable for Variation Margin | | | 1,625 | | |
| Interest Receivable | | | 276 | | |
| Receivable for Investments Sold | | | 263 | | |
| Unrealized Appreciation on Swap Agreements | | | 249 | | |
| Unrealized Appreciation on Foreign Currency Exchange Contracts | | | 59 | | |
| Dividends Receivable | | | 55 | | |
| Tax Reclaim Receivable | | | 33 | | |
| Receivable for Portfolio Shares Sold | | | 5 | | |
| Receivable from Affiliate | | | 2 | | |
| Other Assets | | | 8 | | |
| Total Assets | | | 73,631 | | |
| Liabilities: | |
| Collateral on Securities Loaned, at Value | | | 8,373 | | |
| Payable for Investments Purchased | | | 1,523 | | |
| Due to Broker | | | 260 | | |
| Unrealized Depreciation on Swap Agreements | | | 218 | | |
| Unrealized Depreciation on Foreign Currency Exchange Contracts | | | 143 | | |
| Payable for Professional Fees | | | 64 | | |
| Payable for Portfolio Shares Redeemed | | | 61 | | |
| Payable for Custodian Fees | | | 19 | | |
| Payable for Advisory Fees | | | 16 | | |
| Payable for Administration Fees | | | 13 | | |
| Payable for Directors' Fees and Expenses | | | 1 | | |
| Distribution Fees — Class II Shares | | | — | @ | |
| Other Liabilities | | | 72 | | |
| Total Liabilities | | | 10,763 | | |
| NET ASSETS | | $ | 62,868 | | |
| Net Assets Consist of: | |
| Paid-in-Capital | | $ | 81,250 | | |
| Undistributed Net Investment Income | | | 1,962 | | |
| Accumulated Net Realized Loss | | | (19,590 | ) | |
| Unrealized Appreciation (Depreciation) on: | |
| Investments | | | (941 | ) | |
| Investments in Affiliates | | | (360 | ) | |
| Futures Contracts | | | 608 | | |
| Swap Agreements | | | 31 | | |
| Foreign Currency Exchange Contracts | | | (84 | ) | |
| Foreign Currency Translations | | | (8 | ) | |
| Net Assets | | $ | 62,868 | | |
| CLASS I: | |
| Net Assets | | $ | 62,720 | | |
Net Asset Value, Offering and Redemption Price Per Share Applicable to 6,963,978 Outstanding
$0.001 Par Value Shares (Authorized 500,000,000 Shares) | | $ | 9.01 | | |
| CLASS II: | |
| Net Assets | | $ | 148 | | |
Net Asset Value, Offering and Redemption Price Per Share Applicable to 16,500 Outstanding
$0.001 Par Value Shares (Authorized 500,000,000 Shares) | | $ | 9.00 | | |
| (1) Including: | |
| Securities on Loan, at Value: | | $ | 9,515 | | |
@ Amount is less than $500.
The accompanying notes are an integral part of the financial statements.
21
The Universal Institutional Funds, Inc.
Semi-Annual Report – June 30, 2012 (unaudited)
Global Tactical Asset Allocation Portfolio
| Statement of Operations | | Six Months Ended
June 30, 2012
(000) | |
| Investment Income: | |
| Dividends from Securities of Unaffiliated Issuers (Net of $36 of Foreign Taxes Withheld) | | $ | 501 | | |
| Interest from Securities of Unaffiliated Issuers | | | 351 | | |
| Income from Securities Loaned — Net | | | 25 | | |
| Dividends from Security of Affiliated Issuer | | | 4 | | |
| Interest from Securities of Affiliated Issuers | | | 4 | | |
| Total Investment Income | | | 885 | | |
| Expenses: | |
| Advisory Fees (Note B) | | | 246 | | |
| Custodian Fees (Note F) | | | 83 | | |
| Administration Fees (Note C) | | | 82 | | |
| Pricing Fees | | | 56 | | |
| Professional Fees | | | 55 | | |
| Shareholder Reporting Fees | | | 38 | | |
| Directors' Fees and Expenses | | | 2 | | |
| Distribution Fees — Class II Shares (Note D) | | | — | @ | |
| Other Expenses | | | 6 | | |
| Expenses Before Non-Operating Expenses | | | 568 | | |
| Interest Expense | | | — | @ | |
| Total Expenses | | | 568 | | |
| Distribution Fees — Class II Shares Waived (Note D) | | | (— | @) | |
| Waiver of Advisory Fees (Note B) | | | (238 | ) | |
| Rebate from Morgan Stanley Affiliates (Note H) | | | (21 | ) | |
| Net Expenses | | | 309 | | |
| Net Investment Income | | | 576 | | |
| Realized Gain (Loss): | |
| Investments Sold | | | 417 | | |
| Investments in Affiliates | | | 8 | | |
| Foreign Currency Exchange Contracts | | | 304 | | |
| Foreign Currency Transactions | | | 23 | | |
| Futures Contracts | | | 407 | | |
| Swap Agreements | | | (278 | ) | |
| Net Realized Gain | | | 881 | | |
| Change in Unrealized Appreciation (Depreciation): | |
| Investments | | | 1,278 | | |
| Investments in Affiliates | | | 148 | | |
| Foreign Currency Exchange Contracts | | | (153 | ) | |
| Foreign Currency Translations | | | (2 | ) | |
| Futures Contracts | | | 418 | | |
| Swap Agreements | | | 135 | | |
| Net Change in Unrealized Appreciation (Depreciation) | | | 1,824 | | |
| Net Realized Gain and Change in Unrealized Appreciation (Depreciation) | | | 2,705 | | |
| Net Increase in Net Assets Resulting from Operations | | $ | 3,281 | | |
@ Amount is less than $500.
The accompanying notes are an integral part of the financial statements.
22
The Universal Institutional Funds, Inc.
Semi-Annual Report – June 30, 2012
Global Tactical Asset Allocation Portfolio
| Statements of Changes in Net Assets | | Six Months Ended
June 30, 2012
(unaudited)
(000) | | Year Ended
December 31, 2011
(000) | |
| Increase (Decrease) in Net Assets: | |
| Operations: | |
| Net Investment Income | | $ | 576 | | | $ | 1,060 | | |
| Net Realized Gain | | | 881 | | | | 881 | | |
| Net Change in Unrealized Appreciation (Depreciation) | | | 1,824 | | | | (4,320 | ) | |
| Net Increase (Decrease) in Net Assets Resulting from Operations | | | 3,281 | | | | (2,379 | ) | |
| Distributions from and/or in Excess of: | |
| Class I: | |
| Net Investment Income | | | — | | | | (981 | ) | |
| Class II: | |
| Net Investment Income | | | — | | | | (— | @) | |
| Total Distributions | | | — | | | | (981 | ) | |
| Capital Share Transactions:(1) | |
| Class I: | |
| Subscribed | | | 1,983 | | | | 3,413 | | |
| Distributions Reinvested | | | — | | | | 981 | | |
| Redeemed | | | (7,208 | ) | | | (22,122 | ) | |
| Class II: | |
| Subscribed | | | 134 | | | | 114 | * | |
| Distributions Reinvested | | | — | | | | — | @* | |
| Redeemed | | | (55 | ) | | | (45 | )* | |
| Net Decrease in Net Assets Resulting from Capital Share Transactions | | | (5,146 | ) | | | (17,659 | ) | |
| Total Decrease in Net Assets | | | (1,865 | ) | | | (21,019 | ) | |
| Net Assets: | |
| Beginning of Period | | | 64,733 | | | | 85,752 | | |
| End of Period (Including Undistributed Net Investment Income of $1,962 and $1,386) | | $ | 62,868 | | | $ | 64,733 | | |
| (1) Capital Share Transactions: | |
| Class I: | |
| Shares Subscribed | | | 223 | | | | 379 | | |
| Shares Issued on Distributions Reinvested | | | — | | | | 104 | | |
| Shares Redeemed | | | (800 | ) | | | (2,453 | ) | |
| Net Decrease in Class I Shares Outstanding | | | (577 | ) | | | (1,970 | ) | |
| Class II: | |
| Shares Subscribed | | | 15 | | | | 13 | * | |
| Shares Issued on Distributions Reinvested | | | — | | | | — | @@* | |
| Shares Redeemed | | | (6 | ) | | | (5 | )* | |
| Net Increase in Class II Shares Outstanding | | | 9 | | | | 8 | * | |
* For the period March 15, 2011 (commencement of operations) through December 31, 2011.
@ Amount is less than $500.
@@ Amount is less than 500 shares.
The accompanying notes are an integral part of the financial statements.
23
The Universal Institutional Funds, Inc.
Semi-Annual Report – June 30, 2012
Financial Highlights
Global Tactical Asset Allocation Portfolio
| | | Class I | |
| | | Six Months Ended
June 30, 2012 | | Year Ended December 31, | |
| Selected Per Share Data and Ratios | | (unaudited) | | 2011 | | 2010 | | 2009 | | 2008 | | 2007 | |
| Net Asset Value, Beginning of Period | | $ | 8.58 | | | $ | 9.02 | | | $ | 8.81 | | | $ | 6.86 | | | $ | 14.50 | | | $ | 14.26 | | |
| Income (Loss) from Investment Operations: | |
| Net Investment Income† | | | 0.08 | | | | 0.13 | | | | 0.11 | | | | 0.13 | | | | 0.30 | | | | 0.17 | | |
| Net Realized and Unrealized Gain (Loss) | | | 0.35 | | | | (0.45 | ) | | | 0.34 | | | | 2.05 | | | | (6.09 | ) | | | 1.89 | | |
| Total from Investment Operations | | | 0.43 | | | | (0.32 | ) | | | 0.45 | | | | 2.18 | | | | (5.79 | ) | | | 2.06 | | |
| Distributions from and/or in Excess of: | |
| Net Investment Income | | | — | | | | (0.12 | ) | | | (0.25 | ) | | | (0.23 | ) | | | (0.38 | ) | | | (0.23 | ) | |
| Net Realized Gain | | | — | | | | — | | | | — | | | | — | | | | (1.47 | ) | | | (1.59 | ) | |
| Total Distributions | | | — | | | | (0.12 | ) | | | (0.25 | ) | | | (0.23 | ) | | | (1.85 | ) | | | (1.82 | ) | |
| Regulatory Settlement Proceeds | | | — | | | | — | | | | 0.01 | ^^ | | | — | | | | — | | | | — | | |
| Net Asset Value, End of Period | | $ | 9.01 | | | $ | 8.58 | | | $ | 9.02 | | | $ | 8.81 | | | $ | 6.86 | | | $ | 14.50 | | |
| Total Return ++ | | | 5.13 | %# | | | (3.68 | )% | | | 5.68 | % | | | 32.53 | % | | | (44.62 | )% | | | 14.59 | % | |
| Ratios and Supplemental Data: | |
| Net Assets, End of Period (Thousands) | | $ | 62,720 | | | $ | 64,668 | | | $ | 85,752 | | | $ | 98,707 | | | $ | 86,530 | | | $ | 209,933 | | |
| Ratio of Expenses to Average Net Assets(1) | | | 0.94 | %+††* | | | 0.96 | %+^ | | | 1.03 | %+ | | | 1.04 | %+ | | | 1.05 | %+ | | | 1.05 | %+ | |
Ratio of Expenses to Average Net Assets Excluding
Non Operating Expenses | | | 0.94 | %+††* | | | N/A | | | | 1.03 | %+ | | | N/A | | | | N/A | | | | N/A | | |
| Ratio of Net Investment Income to Average Net Assets(1) | | | 1.76 | %+††* | | | 1.42 | %+ | | | 1.35 | %+ | | | 1.75 | %+ | | | 2.72 | %+ | | | 1.15 | %+ | |
| Ratio of Rebate from Morgan Stanley Affiliates to Average Net Assets | | | 0.06 | %††* | | | 0.06 | % | | | 0.02 | % | | | 0.01 | % | | | 0.00 | %§ | | | 0.00 | %§ | |
| Portfolio Turnover Rate | | | 35 | %# | | | 109 | % | | | 183 | % | | | 30 | % | | | 26 | % | | | 43 | % | |
| (1) Supplemental Information on the Ratios to Average Net Assets: | |
| Ratios Before Expense Limitation: | |
| Expenses to Average Net Assets | | | 1.73 | %††* | | | 1.76 | % | | | 1.45 | %+ | | | 1.21 | %+ | | | 1.19 | %+ | | | 1.15 | %+ | |
| Net Investment Income to Average Net Assets | | | 0.97 | %††* | | | 0.62 | % | | | 0.93 | %+ | | | 1.58 | %+ | | | 2.58 | %+ | | | 1.05 | %+ | |
† Per share amount is based on average shares outstanding.
++ Calculated based on the net asset value as of the last business day of the period. Performance does not reflect fees and expenses imposed by your insurance company's separate account. If performance information included the effect of these additional charges, the total return would be lower.
+ The Ratios of Expenses and Net Investment Income reflect the rebate of certain Portfolio expenses in connection with the investments in Morgan Stanley affiliates during the period. The effect of the rebate on the ratios is disclosed in the above table as "Ratio of Rebate from Morgan Stanley Affiliates to Average Net Assets."
†† Reflects overall Portfolio ratios for investment income and non-class specific expenses.
^ Effective July 1, 2011, the Adviser has agreed to limit the ratio of expenses to average net assets to the maximum ratio of 1.00% for Class I shares. Prior to July 1, 2011, the maximum ratio was 1.05% for Class I shares.
§ Amount is less than 0.005%.
^^ During the year ended December 31, 2010, the Portfolio received a regulatory settlement from an unaffiliated third party, which had an impact of 0.11% on total return. This was a one-time settlement, and as a result, the impact on the NAV and consequently the performance will not likely be repeated in the future. Had this settlement not occurred, the total return for Class I would have been approximately 5.57%.
# Not Annualized.
* Annualized.
The accompanying notes are an integral part of the financial statements.
24
The Universal Institutional Funds, Inc.
Semi-Annual Report – June 30, 2012
Financial Highlights
Global Tactical Asset Allocation Portfolio
| | | Class II | |
| Selected Per Share Data and Ratios | | Six Months Ended
June 30, 2012
(unaudited) | | Period from
March 15, 2011^ to
December 31, 2011 | |
| Net Asset Value, Beginning of Period | | $ | 8.57 | | | $ | 9.04 | | |
| Income (Loss) from Investment Operations: | |
| Net Investment Income† | | | 0.07 | | | | 0.11 | | |
| Net Realized and Unrealized Gain (Loss) | | | 0.36 | | | | (0.46 | ) | |
| Total from Investment Operations | | | 0.43 | | | | (0.35 | ) | |
| Distributions from and/or in Excess of: | |
| Net Investment Income | | | — | | | | (0.12 | ) | |
| Net Asset Value, End of Period | | $ | 9.00 | | | $ | 8.57 | | |
| Total Return ++ | | | 5.02 | %# | | | (4.00 | )%# | |
| Ratios and Supplemental Data: | |
| Net Assets, End of Period (Thousands) | | $ | 148 | | | $ | 65 | | |
| Ratio of Expenses to Average Net Assets(1) | | | 1.04 | %+††* | | | 1.06 | %+*^^ | |
| Ratio of Expenses to Average Net Assets Excluding Non Operating Expenses | | | 1.04 | %+††* | | | N/A | | |
| Ratio of Net Investment Income to Average Net Assets(1) | | | 1.66 | %+††* | | | 1.32 | %+* | |
| Ratio of Rebate from Morgan Stanley Affiliates to Average Net Assets | | | 0.06 | %††* | | | 0.06 | %* | |
| Portfolio Turnover Rate | | | 35 | %# | | | 109 | %# | |
| (1) Supplemental Information on the Ratios to Average Net Assets: | |
| Ratios Before Expense Limitation: | |
| Expenses to Average Net Assets | | | 2.08 | %††* | | | 2.11 | %* | |
| Net Investment Income to Average Net Assets | | | 0.62 | %††* | | | 0.27 | %* | |
^ Commencement of Operations.
† Per share amount is based on average shares outstanding.
++ Calculated based on the net asset value as of the last business day of the period. Performance does not reflect fees and expenses imposed by your insurance company's separate account. If performance information included the effect of these additional charges, the total return would be lower.
+ The Ratios of Expenses and Net Investment Income reflect the rebate of certain Portfolio expenses in connection with the investments in Morgan Stanley affiliates during the period. The effect of the rebate on the ratios is disclosed in the above table as "Ratio of Rebate from Morgan Stanley Affiliates to Average Net Assets."
†† Reflects overall Portfolio ratios for investment income and non-class specific expenses.
# Not Annualized.
* Annualized.
^^ Effective July 1, 2011, the Adviser has agreed to limit the ratio of expenses to average net assets to the maximum ratio of 1.10% for Class II shares. Prior to July 1, 2011, the maximum ratio was 1.15% for Class II shares.
The accompanying notes are an integral part of the financial statements.
25
The Universal Institutional Funds, Inc.
Semi-Annual Report – June 30, 2012 (unaudited)
Notes to Financial Statements
The Universal Institutional Funds, Inc. (the "Fund") is registered under the Investment Company Act of 1940, as amended (the "Act"), as an open-end management investment company. The Fund is comprised of ten separate active, diversified and non-diversified portfolios (individually referred to as a "Portfolio", collectively as the "Portfolios").
The accompanying financial statements relate to the Global Tactical Asset Allocation Portfolio. The Portfolio's adviser, Morgan Stanley Investment Management Inc. (the "Adviser") seeks total return by investing in a blend of equity and fixed income securities of U.S. and non-U.S. issuers. In seeking to achieve this investment objective, the Portfolio will implement a global tactical approach to achieving total return, and to control risk and volatility. The Portfolio offers two classes of shares – Class I and Class II. Both classes of shares have identical voting rights (except that shareholders of a Class have exclusive voting rights regarding any matter relating solely to that Class of shares), dividend, liquidation and other rights. Effective April 30, 2012, the Sub-Advisory Agreement between the Adviser and the Portfolio's former sub-advisers, Morgan Stanley Investment Management Limited ("MSIM Limited") and Morgan Stanley Investment Management Company ("MSIM Company") (together, the "Sub-Advisers") was terminated.
The Fund is intended to be the funding vehicle for variable annuity contracts and variable life insurance policies offered by the separate accounts of certain life insurance companies.
A. Significant Accounting Policies: The following significant accounting policies are in conformity with U.S. generally accepted accounting principles ("GAAP"). Such policies are consistently followed by the Fund in the preparation of its financial statements. GAAP may require management to make estimates and assumptions that affect the reported amounts and disclosures in the financial statements. Actual results may differ from those estimates.
1. Security Valuation: Securities listed on a foreign exchange are valued at their closing price except as noted below. Unlisted securities and listed securities not traded on the valuation date for which market quotations are readily available are valued at the mean between the last reported bid and ask prices. Equity securities listed on a U.S. exchange are valued at the latest quoted sales price on the valuation date. Equity securities listed or traded on NASDAQ, for which market quotations are available, are valued at the NASDAQ Official Closing Price. Bonds and other fixed income securities may be valued according to the broadest and most representative market. In addition, bonds and other fixed income securities may be valued on the basis of prices provided by a pricing service. The prices provided by a pricing service take into account broker-dealer market price quotations for institutional size trading in similar groups of securities, security quality, maturity, coupon and other security characteristics as well as any developments related to the specific securities. Short-term debt securities purchased with remaining maturities of 60 days or less are valued at amortized cost, unless the Fund's Board of Directors (the "Directors") determines such valuation does not reflect the securities' fair value, in which case these securities will be valued at their fair value as determined in good faith under procedures adopted by the Directors.
Under procedures approved by the Directors, the Fund's Adviser has formed a Valuation Committee. The Valuation Committee provides administration and oversight of the Fund's valuation policies and procedures, which are reviewed at least annually by the Directors. Among other things, these procedures allow the Fund to utilize independent pricing services, quotations from securities and financial instrument dealers, and other market sources to determine fair value.
The Fund has procedures to determine the fair value of securities and other financial instruments for which market prices are not readily available. Under these procedures, the Valuation Committee convenes on a regular and adhoc basis to review such securities and considers a number of factors, including valuation methodologies and significant unobservable valuation inputs, when arriving at fair value. The Valuation Committee may employ a market-based approach which may use related or comparable assets or liabilities, recent transactions, market multiples, book values, and other relevant information for the investment to determine the fair value of the investment. An income-based valuation approach may also be used in which the anticipated future cash flows of the investment are discounted to calculate fair value. Discounts may also be applied due to the nature or duration of any restrictions on the disposition of the investments. Due to the inherent uncertainty of valuations of such investments, the fair values may differ significantly from the values that would have been used had an active market existed. The Valuation Committee employs various methods for calibrating these valuation approaches including a regular review of valuation methodologies, key inputs and assumptions, transactional back-testing or disposition analysis, and reviews of any related market activity.
Most foreign markets close before the New York Stock Exchange ("NYSE"). Occasionally, developments that
26
The Universal Institutional Funds, Inc.
Semi-Annual Report – June 30, 2012 (unaudited)
Notes to Financial Statements (cont'd)
could affect the closing prices of securities and other assets may occur between the times at which valuations of such securities are determined (that is, close of the foreign market on which the securities trade) and the close of business on the NYSE. If these developments are expected to materially affect the value of the securities, the valuations may be adjusted to reflect the estimated fair value as of the close of the NYSE, as determined in good faith under procedures established by the Directors.
2. Fair Value Measurement: Financial Accounting Standards Boards ("FASB") Accounting Standards CodificationTM ("ASC") 820, "Fair Value Measurements and Disclosures" ("ASC 820"), defines fair value as the value that the Fund would receive to sell an investment or pay to transfer a liability in a timely transaction with an independent buyer in the principal market, or in the absence of a principal market the most advantageous market for the investment or liability. ASC 820 establishes a three-tier hierarchy to distinguish between (1) inputs that reflect the assumptions market participants would use in valuing an asset or liability developed based on market data obtained from sources independent of the reporting entity (observable inputs) and (2) inputs that reflect the reporting entity's own assumptions about the assumptions market participants would use in valuing an asset or liability developed based on the best information available in the circumstances (unobservable inputs) and to establish classification of fair value measurements for disclosure purposes. Various inputs are used in determining the value of the Fund's investments. The inputs are summarized in the three broad levels listed below.
• Level 1 – unadjusted quoted prices in active markets for identical investments
• Level 2 – other significant observable inputs (including quoted prices for similar investments, interest rates, prepayment speeds, credit risk, etc.)
• Level 3 – significant unobservable inputs including the Fund's own assumptions in determining the fair value of investments. Factors considered in making this determination may include, but are not limited to, information obtained by contacting the issuer, analysts, or the appropriate stock exchange (for exchange-traded securities), analysis of the issuer's financial statements or other available documents and, if necessary, available information concerning other securities in similar circumstances
The inputs or methodology used for valuing securities are not necessarily an indication of the risk associated with investing in those securities and the determination of the significance of a particular input to the fair value measurement in its entirety requires judgment and considers factors specific to each security.
The following is a summary of the inputs used to value the Portfolio's investments as of June 30, 2012.
| Investment Type | | Level 1
Unadjusted
quoted
prices
(000) | | Level 2
Other
significant
observable
inputs
(000) | | Level 3
Significant
unobservable
inputs
(000) | | Total
(000) | |
| Assets: | |
| Fixed Income Securities | |
Agency Fixed Rate
Mortgages | | $ | — | | | $ | 2,979 | | | $ | — | | | $ | 2,979 | | |
| Asset-Backed Securities | | | — | | | | 424 | | | | — | | | | 424 | | |
Commercial Mortgage
Backed Securities | | | — | | | | 156 | | | | — | | | | 156 | | |
| Corporate Bonds | | | — | | | | 5,899 | | | | — | | | | 5,899 | | |
| Sovereign | | | — | | | | 11,334 | | | | — | | | | 11,334 | | |
| U.S. Treasury Securities | | | — | | | | 4,018 | | | | — | | | | 4,018 | | |
Total Fixed Income
Securities | | | — | | | | 24,810 | | | | — | | | | 24,810 | | |
| Common Stocks | |
| Aerospace & Defense | | | 95 | | | | 133 | | | | — | | | | 228 | | |
| Air Freight & Logistics | | | 38 | | | | 37 | | | | — | | | | 75 | | |
| Airlines | | | — | | | | 10 | | | | — | | | | 10 | | |
| Auto Components | | | 86 | | | | 140 | | | | — | | | | 226 | | |
| Automobiles | | | 11 | | | | 524 | | | | — | | | | 535 | | |
| Beverages | | | 103 | | | | 355 | | | | — | | | | 458 | | |
| Biotechnology | | | 186 | | | | 55 | | | | — | | | | 241 | | |
| Building Products | | | 79 | | | | 109 | | | | — | | | | 188 | | |
| Capital Markets | | | 134 | | | | 145 | | | | — | | | | 279 | | |
| Chemicals | | | 199 | | | | 537 | | | | — | | | | 736 | | |
| Commercial Banks | | | 859 | | | | 1,706 | | | | — | | | | 2,565 | | |
Commercial Services &
Supplies | | | 57 | | | | 80 | | | | — | | | | 137 | | |
Communications
Equipment | | | 106 | | | | 68 | | | | — | | | | 174 | | |
| Computers & Peripherals | | | 341 | | | | 58 | | | | — | | | | 399 | | |
Construction &
Engineering | | | 1 | | | | 79 | | | | — | | | | 80 | | |
| Construction Materials | | | 15 | | | | 55 | | | | — | | | | 70 | | |
| Consumer Finance | | | 59 | | | | — | | | | — | | | | 59 | | |
| Containers & Packaging | | | — | | | | 31 | | | | — | | | | 31 | | |
| Distributors | | | — | | | | 31 | | | | — | | | | 31 | | |
Diversified Financial
Services | | | 121 | | | | 179 | | | | — | | | | 300 | | |
Diversified
Telecommunication
Services | | | 342 | | | | 424 | | | | — | | | | 766 | | |
| Electric Utilities | | | 106 | | | | 415 | | | | — | | | | 521 | | |
| Electrical Equipment | | | 1 | | | | 184 | | | | — | | | | 185 | | |
27
The Universal Institutional Funds, Inc.
Semi-Annual Report – June 30, 2012 (unaudited)
Notes to Financial Statements (cont'd)
| Investment Type | | Level 1
Unadjusted
quoted
prices
(000) | | Level 2
Other
significant
observable
inputs
(000) | | Level 3
Significant
unobservable
inputs
(000) | | Total
(000) | |
| Common Stocks (cont'd) | |
Electronic Equipment,
Instruments &
Components | | $ | 21 | | | $ | 216 | | | $ | — | | | $ | 237 | | |
Energy Equipment &
Services | | | 161 | | | | 95 | | | | — | @ | | | 256 | | |
| Food & Staples Retailing | | | 301 | | | | 313 | | | | — | | | | 614 | | |
| Food Products | | | 150 | | | | 455 | | | | — | | | | 605 | | |
| Gas Utilities | | | 10 | | | | 94 | | | | — | | | | 104 | | |
Health Care Equipment &
Supplies | | | 106 | | | | 92 | | | | — | | | | 198 | | |
Health Care Providers &
Services | | | 105 | | | | 52 | | | | — | | | | 157 | | |
| Health Care Technology | | | 11 | | | | — | | | | — | | | | 11 | | |
Hotels, Restaurants &
Leisure | | | 231 | | | | 127 | | | | — | | | | 358 | | |
| Household Durables | | | 889 | | | | 85 | | | | — | | | | 974 | | |
| Household Products | | | 238 | | | | 96 | | | | — | | | | 334 | | |
Independent Power
Producers & Energy
Traders | | | 4 | | | | 23 | | | | — | | | | 27 | | |
| Industrial Conglomerates | | | 179 | | | | 251 | | | | — | | | | 430 | | |
Information Technology
Services | | | 318 | | | | 12 | | | | — | | | | 330 | | |
| Insurance | | | 222 | | | | 720 | | | | — | | | | 942 | | |
| Internet & Catalog Retail | | | 46 | | | | 21 | | | | — | | | | 67 | | |
Internet Software &
Services | | | 138 | | | | 15 | | | | — | | | | 153 | | |
Leisure Equipment &
Products | | | — | | | | 24 | | | | — | | | | 24 | | |
Life Sciences Tools &
Services | | | 45 | | | | 21 | | | | — | | | | 66 | | |
| Machinery | | | 74 | | | | 415 | | | | — | | | | 489 | | |
| Marine | | | — | | | | 48 | | | | — | | | | 48 | | |
| Media | | | 375 | | | | 135 | | | | — | | | | 510 | | |
| Metals & Mining | | | 267 | | | | 730 | | | | — | | | | 997 | | |
| Multi-Utilities | | | 154 | | | | 198 | | | | — | | | | 352 | | |
| Multiline Retail | | | 19 | | | | 32 | | | | — | | | | 51 | | |
| Office Electronics | | | 8 | | | | 97 | | | | — | | | | 105 | | |
Oil, Gas & Consumable
Fuels | | | 1,149 | | | | 919 | | | | — | | | | 2,068 | | |
| Paper & Forest Products | | | 68 | | | | 27 | | | | — | | | | 95 | | |
| Personal Products | | | 15 | | | | 81 | | | | — | | | | 96 | | |
| Pharmaceuticals | | | 426 | | | | 978 | | | | — | | | | 1,404 | | |
| Professional Services | | | 24 | | | | 85 | | | | — | | | | 109 | | |
Real Estate Investment
Trusts (REITs) | | | 210 | | | | 251 | | | | — | | | | 461 | | |
Real Estate
Management &
Development | | | 46 | | | | 1,276 | | | | — | | | | 1,322 | | |
| Road & Rail | | | 249 | | | | 183 | | | | — | | | | 432 | | |
| Investment Type | | Level 1
Unadjusted
quoted
prices
(000) | | Level 2
Other
significant
observable
inputs
(000) | | Level 3
Significant
unobservable
inputs
(000) | | Total
(000) | |
| Common Stocks (cont'd) | |
Semiconductors &
Semiconductor
Equipment | | $ | 1,037 | | | $ | 111 | | | $ | — | | | $ | 1,148 | | |
| Software | | | 261 | | | | 109 | | | | — | | | | 370 | | |
| Specialty Retail | | | 179 | | | | 150 | | | | — | | | | 329 | | |
Textiles, Apparel &
Luxury Goods | | | 101 | | | | 159 | | | | — | | | | 260 | | |
Thrifts & Mortgage
Finance | | | 4 | | | | — | | | | — | | | | 4 | | |
| Tobacco | | | 229 | | | | 260 | | | | — | | | | 489 | | |
Trading Companies &
Distributors | | | 22 | | | | 188 | | | | — | | | | 210 | | |
Transportation
Infrastructure | | | — | | | | 56 | | | | — | | | | 56 | | |
| Water Utilities | | | — | | | | 22 | | | | — | | | | 22 | | |
Wireless
Telecommunication
Services | | | 65 | | | | 388 | | | | — | | | | 453 | | |
| Total Common Stocks | | | 11,096 | | | | 14,965 | | | | — | | | | 26,061 | | |
Commodity Linked
Security | | | — | | | | 1,484 | | | | — | | | | 1,484 | | |
| Rights | | | — | | | | — | @ | | | — | | | | — | @ | |
| Investment Companies | | | 3,059 | | | | — | | | | — | | | | 3,059 | | |
| Short-Term Investments | |
| Investment Companies | | | 11,953 | | | | — | | | | — | | | | 11,953 | | |
| Repurchase Agreements | | | — | | | | 225 | | | | — | | | | 225 | | |
| U.S. Treasury Securities | | | — | | | | 2,484 | | | | — | | | | 2,484 | | |
Foreign Currency
Exchange Contracts | | | — | | | | 59 | | | | — | | | | 59 | | |
| Futures Contracts | | | 633 | | | | — | | | | — | | | | 633 | | |
Interest Rate Swap
Agreements | | | — | | | | 174 | | | | — | | | | 174 | | |
Total Return Swap
Agreements | | | — | | | | 75 | | | | — | | | | 75 | | |
| Total Assets | | | 26,741 | | | | 44,276 | | | | — | | | | 71,017 | | |
| Liabilities: | |
Foreign Currency
Exchange Contracts | | | — | | | | (143 | ) | | | — | | | | (143 | ) | |
| Futures Contracts | | | (25 | ) | | | — | | | | — | | | | (25 | ) | |
Interest Rate Swap
Agreements | | | — | | | | (180 | ) | | | — | | | | (180 | ) | |
Total Return Swap
Agreements | | | — | | | | (38 | ) | | | — | | | | (38 | ) | |
| Total Liabilities | | | (25 | ) | | | (361 | ) | | | — | | | | (386 | ) | |
| Total | | $ | 26,716 | | | $ | 43,915 | | | $ | — | | | $ | 70,631 | | |
Transfers between investment levels may occur as the markets fluctuate and/or the availability of data used in an investment's valuation changes. The Portfolio recognizes transfers between the levels as of the end of the period. As of June 30, 2012, securities with a total value of
28
The Universal Institutional Funds, Inc.
Semi-Annual Report – June 30, 2012 (unaudited)
Notes to Financial Statements (cont'd)
approximately $14,054,000 transferred from Level 1 to Level 2. At June 30, 2012, the fair market value of certain securities were adjusted due to developments which occurred between the time of the close of the foreign markets on which they trade and the close of business on the NYSE which resulted in their Level 2 classification.
Following is a reconciliation of investments in which significant unobservable inputs (Level 3) were used in determining fair value.
| | | Common
Stock | |
| Beginning Balance | | $ | — | | |
| Purchases | | | — | @ | |
| Sales | | | — | | |
| Amortization of discount | | | — | | |
| Transfers in | | | — | | |
| Transfers out | | | — | | |
| Change in unrealized appreciation/depreciation | | | (— | @) | |
| Realized gains (losses) | | | — | | |
| Ending Balance | | $ | — | @ | |
Net change in unrealized appreciation/depreciation
from investments still held as of June 30, 2012 | | $ | (— | @) | |
@ Value is less than $500.
3. Foreign Currency Translation and Foreign Investments: The books and records of the Fund are maintained in U.S. dollars. Foreign currency amounts are translated into U.S. dollars at the mean of the bid and ask prices of such currencies against U.S. dollars last quoted by a major bank as follows:
– investments, other assets and liabilities at the prevailing rate of exchange on the valuation date;
– investment transactions and investment income at the prevailing rates of exchange on the dates of such transactions.
Although the net assets of the Fund are presented at the foreign exchange rates and market values at the close of the period, the Fund does not isolate that portion of the results of operations arising as a result of changes in the foreign exchange rates from the fluctuations arising from changes in the market prices of the securities held at period end. Similarly, the Fund does not isolate the effect of changes in foreign exchange rates from the fluctuations arising from changes in the market prices of securities sold during the period. Accordingly, realized and unrealized foreign currency gains (losses) on investments in securities are included in the reported net realized and unrealized gains (losses) on investment transactions and balances. However, pursuant to U.S. Federal income tax regulations, gains and losses from certain foreign currency transactions and the foreign currency portion of gains and losses realized on sales and maturities of foreign denominated debt securities are treated as ordinary income for U.S. Federal income tax purposes.
Net realized gains (losses) on foreign currency transactions represent net foreign exchange gains (losses) from foreign currency exchange contracts, disposition of foreign currencies, currency gains (losses) realized between the trade and settlement dates on securities transactions, and the difference between the amount of investment income and foreign withholding taxes recorded on the Fund's books and the U.S. dollar equivalent amounts actually received or paid. Net unrealized currency gains (losses) from valuing foreign currency denominated assets and liabilities at period end exchange rates are reflected as a component of unrealized appreciation (depreciation) on the Statement of Assets and Liabilities. The change in unrealized currency gains (losses) on foreign currency translations for the period is reflected in the Statement of Operations.
Foreign security and currency transactions may involve certain considerations and risks not typically associated with those of U.S. dollar denominated transactions as a result of, among other factors, the possibility of lower levels of governmental supervision and regulation of foreign securities markets and the possibility of political or economic instability.
At June 30, 2012, the net assets of the Portfolio were substantially comprised of foreign denominated securities and currency. Changes in currency exchange rates will affect the U.S. dollar value of and investment income from such securities.
Governmental approval for foreign investments may be required in advance of making an investment under certain circumstances in some countries, and the extent of foreign investments in domestic companies may be subject to limitation in other countries. Foreign ownership limitations also may be imposed by the charters of individual companies to prevent, among other concerns, violations of foreign investment limitations. As a result, an additional class of shares (identified as "Foreign" in the Portfolio of Investments) may be created and offered for investment. The "local" and "foreign shares" market values may differ. In the absence of trading of the foreign shares in such markets, the Fund values the foreign shares at the closing exchange price of the local shares. Such
29
The Universal Institutional Funds, Inc.
Semi-Annual Report – June 30, 2012 (unaudited)
Notes to Financial Statements (cont'd)
securities, if any, are identified as fair valued in the Portfolio of Investments.
4. Derivatives: The Portfolio may, but is not required to, use derivative instruments for a variety of purposes, including hedging, risk management, portfolio management or to earn income. Derivatives are financial instruments whose value is based on the value of an underlying asset, interest rate, index or financial instrument. A derivative instrument often has risks similar to its underlying asset and may have additional risks, including imperfect correlation between the value of the derivative and the underlying asset, risks of default by the counterparty to certain transactions, magnification of losses incurred due to changes in the market value of the securities, instruments, indices or interest rates to which they relate, and risks that the transactions may not be liquid. The use of derivatives involves risks that are different from, and possibly greater than, the risks associated with other portfolio investments. Derivatives may involve the use of highly specialized instruments that require investment techniques and risk analyses different from those associated with other portfolio investments. All of the Portfolio's holdings, including derivative instruments, marked-to-market each day with the change in value reflected in unrealized appreciation (depreciation). Upon disposition, a realized gain or loss is recognized.
Certain derivative transactions may give rise to a form of leverage. Leverage magnifies the potential for gain and risk for loss. Leverage associated with derivative transactions may cause the Portfolio to liquidate portfolio positions when it may not be advantageous to do so to satisfy its obligations or to meet earmarking or segregation requirements, pursuant to applicable Securities and Exchange Commission rules and regulations, or may cause the Portfolio to be more volatile than if the Portfolio had not been leveraged. Although the Adviser seeks to use derivatives to further the Portfolio's investment objectives, there is no assurance that the use of derivatives will achieve this result.
Following is a description of the derivative instruments and techniques that the Portfolio used during the period and their associated risks:
Foreign Currency Exchange Contracts: In connection with its investments in foreign securities, the Portfolio also entered into contracts with banks, brokers or dealers to purchase or sell securities or foreign currencies at a future date. A foreign currency exchange contract ("currency contracts") is a negotiated agreement between two parties to exchange specified amounts of two or more currencies at a specified future time at a specified rate. The rate specified by the currency contract can be higher or lower than the spot rate between the currencies that are the subject of the contract. Currency contracts may be used to protect against uncertainty in the level of future foreign currency exchange rates or to gain or modify exposure to a particular currency. Hedging the Portfolio's currency risks involves the risk of mismatching the Portfolio's objectives under a currency contract with the value of securities denominated in a particular currency. Furthermore, such transactions reduce or preclude the opportunity for gain if the value of the currency should move in the direction opposite to the position taken. There is an additional risk to the effect that currency contracts create exposure to currencies in which the Portfolio's securities are not denominated. Unanticipated changes in currency prices may result in poorer overall performance for the Portfolio than if it had not entered into such currency contracts. The use of currency contracts involves the risk of loss from the insolvency or bankruptcy of the counterparty to the contract or the failure of the counterparty to make payments or otherwise comply with the terms of the contract. A currency contract is marked-to-market daily and the change in market value is recorded by the Portfolio as unrealized gain or (loss). The Portfolio records realized gains (losses) when the currency contract is closed equal to the difference between the value of the currency contract at the time it was opened and the value at the time it was closed.
Futures: A futures contract is a standardized agreement between two parties to buy or sell a specific quantity of an underlying instrument at a specific price at a specific future time. The value of a futures contract tends to increase and decrease in tandem with the value of the underlying instrument. Depending on the terms of the particular contract, futures contracts are settled through either physical delivery of the underlying instrument on the settlement date or by payment of a cash settlement amount on the settlement date. During the period the futures contract is open, payments are received from or made to the broker based upon changes in the value of the contract (the variation margin). A decision as to whether, when and how to use futures involves the exercise of skill and judgment and even a well conceived futures transaction may be unsuccessful because of market behavior or unexpected events. In addition to the derivatives risks discussed above, the prices of futures can be highly volatile, using futures can lower total return, and
30
The Universal Institutional Funds, Inc.
Semi-Annual Report – June 30, 2012 (unaudited)
Notes to Financial Statements (cont'd)
the potential loss from futures can exceed the Portfolio's initial investment in such contracts.
Swaps: An over-the-counter ("OTC") swap agreement is an agreement between two parties pursuant to which the parties exchange payments at specified dates on the basis of a specified notional amount, with the payments calculated by reference to specified securities, indexes, reference rates, currencies or other instruments. A small percentage of swap agreements are cleared through a central clearing house. Most swap agreements provide that when the period payment dates for both parties are the same, the payments are made on a net basis (i.e., the two payment streams are netted out, with only the net amount paid by one party to the other). The Portfolio's obligations or rights under a swap agreement entered into on a net basis will generally be equal only to the net amount to be paid or received under the agreement, based on the relative values of the positions held by each counterparty. Most swap agreements are not entered into or traded on exchanges and there is no central clearing or guaranty function for swaps. These OTC swaps are often subject to credit risk or the risk of default or non-performance by the counterparty. Swaps could result in losses if interest rate or foreign currency exchange rates or credit quality changes are not correctly anticipated by the Portfolio or if the reference index, security or investments do not perform as expected.
When the Portfolio has an unrealized loss on a swap agreement, the Portfolio has instructed the custodian to pledge cash or liquid securities as collateral with a value approximately equal to the amount of the unrealized loss. Collateral pledges are monitored and subsequently adjusted if and when the swap valuations fluctuate. Cash collateral is included with "Due from (to) Broker" in the Statement of Assets and Liabilities. Cash collateral has been offset against open swap agreements under the provisions of FASB ASC "Balance Sheet" (ASC 210). Offsetting of Amounts Related to Certain Contracts, an interpretation of ASC 210-20, are included within "Unrealized Appreciation/Depreciation on Swap Agreements" in the Statement of Assets and Liabilities. For cash collateral received, the Portfolio pays a monthly fee to the counterparty based on the effective rate for Federal Funds. This fee, when paid, is included within realized gain (loss) on swap agreements in the Statement of Operations.
Upfront payments received or paid by a Portfolio will be reflected as an asset or liability in the Statement of Assets and Liabilities.
FASB ASC 815, "Derivatives and Hedging: Overall" ("ASC 815"), is intended to improve financial reporting about derivative instruments by requiring enhanced disclosures to enable investors to better understand how and why the Portfolio uses derivative instruments, how these derivative instruments are accounted for and their effects on the Portfolio's financial position and results of operations.
The following table sets forth the fair value of the Portfolio's derivative contracts by primary risk exposure as of June 30, 2012.
Primary Risk
Exposure | | Statement of
Assets and
Liabilities | | Futures
Contracts
(000)(a) | | Swap
Agreements
(000) | | Foreign
Currency
Exchange
Contracts
(000) | |
| Assets: | |
| Foreign Currency Risk | | Receivables | | $ | — | | | $ | — | | | $ | 59 | | |
| Equity Risk | | Receivables | | | 518 | | | | 75 | | | | — | | |
| Interest Rate Risk | | Receivables | | | 115 | | | | 174 | | | | — | | |
| Total Receivables | | | | | | $ | 633 | | | $ | 249 | | | $ | 59 | | |
| Liabilities: | |
| Foreign Currency Risk | | Payables | | $ | — | | | $ | — | | | $ | (143 | ) | |
| Equity Risk | | Payables | | | (8 | ) | | | (38 | ) | | | — | | |
| Interest Rate Risk | | Payables | | | (17 | ) | | | (180 | ) | | | — | | |
| Total Payables | | | | | | $ | (25 | ) | | $ | (218 | ) | | $ | (143 | ) | |
(a) This amount represents the cumulative appreciation (depreciation) of futures contracts as reported in the Portfolio of Investments. The Statement of Assets and Liabilities only reflect the current day net variation margin.
The following tables set forth by primary risk exposure the Portfolio's realized gains (losses) and change in unrealized appreciation (depreciation) by type of derivative contract for the six months ended June 30, 2012 in accordance with ASC 815.
| Realized Gain (Loss) | |
| Primary Risk Exposure | | Derivative
Type | | Value
(000) | |
| Foreign Currency Risk | | Foreign Currency | |
| |
| | | | | Exchange Contracts | | $ | 304 | | |
| Equity Risk | | Futures Contracts | | | 751 | | |
| Interest Rate Risk | | Futures Contracts | | | (344 | ) | |
| Equity Risk | | Swap Agreements | | | 13 | | |
| Interest Rate Risk | | Swap Agreements | | | (291 | ) | |
| Total | | | | | | $ | 433 | | |
| Change in Unrealized Appreciation (Depreciation) | |
| Primary Risk Exposure | | Derivative
Type | | Value
(000) | |
| Foreign Currency Risk | | Foreign Currency | |
| |
| | | | | Exchange Contracts | | $ | (153 | ) | |
| Equity Risk | | Futures Contracts | | | 254 | | |
| Interest Rate Risk | | Futures Contracts | | | 164 | | |
| Equity Risk | | Swap Agreements | | | 157 | | |
| Interest Rate Risk | | Swap Agreements | | | (22 | ) | |
| Total | | | | | | $ | 400 | | |
31
The Universal Institutional Funds, Inc.
Semi-Annual Report – June 30, 2012 (unaudited)
Notes to Financial Statements (cont'd)
For the six months ended June 30, 2012, the average monthly principal amount of foreign currency exchange contracts was approximately $26,093,000, the average monthly original value of futures contracts was approximately $34,903,000 and the average monthly notional amount of swap agreements was approximately $18,654,000.
5. Structured Investments: The Portfolio invested a portion of its assets in structured investments. A structured investment is a derivative security designed to offer a return linked to a particular underlying security, currency, commodity or market. Structured investments may come in various forms including notes, warrants and options to purchase securities. The Portfolio will typically use structured investments to gain exposure to a permitted underlying security, currency, commodity or market when direct access to a market is limited or inefficient from a tax or cost standpoint. Investments in structured investments involve risks including issuer risk, counterparty risk and market risk. Holders of structured investments bear risks of the underlying investment and are subject to issuer or counterparty risk because the Portfolio is relying on the creditworthiness of such issuer or counterparty and has no rights with respect to the underlying investment. Certain structured investments may be thinly traded or have a limited trading market and may have the effect of increasing the Portfolio's illiquidity to the extent that the Portfolio, at a particular time, may be unable to find qualified buyers for these securities.
6. When-Issued/Delayed Delivery Securities: The Portfolio purchases and sells when-issued and delayed delivery securities. Securities purchased on a when-issued or delayed delivery basis are purchased for delivery beyond the normal settlement date at a stated price and yield, and no income accrues to the Portfolio on such securities prior to delivery date. Payment and delivery for when-issued and delayed delivery securities can take place up to 120 days after the date of the transaction. When the Portfolio enters into a purchase transaction on a when-issued or delayed delivery basis, securities are available for collateral in an amount at least equal in value to the Portfolio's commitments to purchase such securities. Purchasing securities on a when-issued or delayed delivery basis may involve a risk that the market price at the time of delivery may be lower than the agreed upon purchase price, in which case there could be an unrealized loss at the time of delivery. Purchasing investments on a when-issued or delayed delivery basis may be considered a form of leverage which may increase the impact that gains (losses) may have on the Portfolio.
7. Security Lending: The Portfolio lends securities to qualified financial institutions, such as broker-dealers, to earn additional income. Any increase or decrease in the fair value of the securities loaned that might occur and any interest earned or dividends declared on those securities during the term of the loan would remain in the Portfolio. The Portfolio would receive cash or securities as collateral in an amount equal to or exceeding 100% of the current fair value of the loaned securities. The collateral is marked-to-market daily, by the securities lending agent, to ensure that a minimum of 100% collateral coverage is maintained.
Based on pre-established guidelines, the securities lending agent invests any cash collateral that is received in an affiliated money market portfolio and repurchase agreements. Securities lending income is generated from the earnings on the invested collateral and borrowing fees, less any rebates owed to the borrowers and compensation to the lending agent, and is recorded as "Income from Securities Loaned – Net" in the Portfolio's Statement of Operations. Risks in securities lending transactions are that a borrower may not provide additional collateral when required or return the securities when due, and that the value of the short-term investments will be less than the amount of cash collateral plus any rebate that is required to be returned to the borrower.
The value of loaned securities and related collateral outstanding at June 30, 2012 were approximately $9,515,000 and $9,632,000, respectively. The Portfolio received cash collateral of approximately $8,373,000, of which, approximately $8,372,000 was subsequently invested in Repurchase Agreements and Morgan Stanley Institutional Liquidity Funds as reported in the Portfolio of Investments. At June 30, 2012, there was uninvested cash collateral of less than $500, which is not reflected in the Portfolio of Investments. The remaining collateral of approximately $1,260,000 was received in the form of U.S. Government Obligations, which the Portfolio cannot sell or repledge, and accordingly are not reflected in the Portfolio of Investments. The Portfolio has the right under the lending agreement to recover the securities from the borrower on demand.
8. Indemnifications: The Fund enters into contracts that contain a variety of indemnifications. The Fund's maximum exposure under these arrangements is unknown. However, the Fund has not had prior claims or losses pursuant to these contracts and expects the risk of loss to be remote.
32
The Universal Institutional Funds, Inc.
Semi-Annual Report – June 30, 2012 (unaudited)
Notes to Financial Statements (cont'd)
9. Other: Security transactions are accounted for on the date the securities are purchased or sold. Realized gains (losses) on the sale of investment securities are determined on the specific identified cost basis. Dividend income and distributions are recorded on the ex-dividend date (except for certain foreign dividends that may be recorded as soon as the Fund is informed of such dividends), net of applicable withholding taxes where recovery of such taxes is not reasonably assured. Interest income is recognized on the accrual basis except where collection is in doubt and is recorded net of foreign withholding tax. Discounts and premiums on securities purchased are amortized according to the effective yield method over their respective lives. Most expenses of the Fund can be directly attributed to a particular Portfolio. Expenses which cannot be directly attributed are apportioned among the Portfolios based upon relative net assets. Income, expenses (other than class specific expenses) and realized and unrealized gains or losses are allocated to each class of shares based upon their relative net assets or other appropriate measures.
Settlement and registration of foreign securities transactions may be subject to significant risks not normally associated with investments in the United States. In certain markets, ownership of shares is defined according to entries in the issuer's share register. It is possible that a Portfolio holding these securities could lose its share registration through fraud, negligence or even mere oversight. In addition, shares being delivered for sales and cash being paid for purchases may be delivered before the exchange is complete. This may subject the Portfolio to further risk of loss in the event of a failure to complete the transaction by the counterparty.
B. Advisory/Sub-Advisory Fees: The Adviser, a wholly-owned subsidiary of Morgan Stanley, provides the Portfolio with advisory services under the terms of an Investment Advisory Agreement, paid quarterly, at the annual rate based on the average daily net assets as follows:
First $500
million | | Next $500
million | | Over $1
billion | |
| | 0.75 | % | | | 0.70 | % | | | 0.65 | % | |
The Adviser has agreed to reduce its advisory fee and/or reimburse the Portfolio so that total annual portfolio operating expenses, excluding certain investment related expenses, will not exceed 1.00% for Class I shares and 1.10% for Class II shares. The fee waivers and/or expense reimbursements will continue for at least one year or until such time as the Fund's Board of Directors acts to discontinue all or a portion of such waivers and/or expense reimbursements when it deems that such action is appropriate. For the six months ended June 30, 2012, approximately $238,000 of advisory fees were waived and/or reimbursed pursuant to this arrangement.
The Adviser previously entered into a Sub-Advisory Agreement with the Sub-Advisers, each a wholly-owned subsidiary of Morgan Stanley. The Sub-Advisers provided the Portfolio with advisory services subject to the overall supervision of the Adviser and the Fund's Officers and Directors. The Adviser paid the Sub-Advisers on a monthly basis a portion of the net advisory fees the Adviser received from the Portfolio. Effective April 30, 2012, the Sub-Advisory Agreement between the Adviser and Sub-Advisers was terminated.
C. Administration Fees: The Adviser also serves as Administrator to the Fund and provides administrative services pursuant to an administration agreement for an annual fee, accrued daily and paid monthly, of 0.25% of the Portfolio's average daily net assets. Under a Sub-Administration Agreement between the Administrator and State Street Bank and Trust Company ("State Street"), State Street provides certain administrative services to the Fund. For such services, the Administrator pays State Street a portion of the fee the Administrator receives from the Fund.
D. Distribution Fees: Morgan Stanley Distribution, Inc. ("MSDI" or the "Distributor"), a wholly-owned subsidiary of the Adviser, serves as the Distributor of the Portfolio and provides the Portfolio's Class II shareholders with distribution services pursuant to a Distribution Plan (the "Plan") in accordance with Rule 12b-1 under the Act. Under the Plan, the Portfolio is authorized to pay the Distributor a distribution fee, which is accrued daily and paid monthly, at an annual rate of 0.35% of the Portfolio's average daily net assets attributable to Class II shares. The Distributor has agreed to waive 0.25% of the 0.35% distribution fee that it may receive. For the six months ended June 30, 2012, this waiver amounted to less than $500.
E. Dividend Disbursing and Transfer Agent: The Fund's dividend disbursing and transfer agent is Morgan Stanley Services Company Inc. ("Morgan Stanley Services").
F. Custodian Fees: State Street (the "Custodian") serves as Custodian for the Fund in accordance with a custodian agreement. The Custodian holds cash, securities, and other assets of the Fund as required by the Act. Custody fees are payable monthly based on assets held in custody, investment purchases and sales activity and account maintenance fees, plus reimbursement for certain out-of-pocket expenses.
The Fund has entered into an arrangement with its Custodian whereby credits realized on uninvested cash balances were used to offset a portion of the Portfolio's expenses. If
33
The Universal Institutional Funds, Inc.
Semi-Annual Report – June 30, 2012 (unaudited)
Notes to Financial Statements (cont'd)
applicable, these custodian credits are shown as "Expense Offset" in the Statement of Operations.
G. Federal Income Taxes: It is the Portfolio's intention to continue to qualify as a regulated investment company and distribute all of its taxable income. Accordingly, no provision for Federal income taxes is required in the financial statements. Dividend income and distributions to shareholders are recorded on the ex-dividend date.
The Portfolio may be subject to taxes imposed by countries in which it invests. Such taxes are generally based on income and/or capital gains earned or repatriated. Taxes are accrued and applied to net investment income, net realized gains and net unrealized appreciation as such income and/or gains are earned. Taxes may also be based on transactions in foreign currency and are accrued based on the value of investments denominated in such currency.
FASB ASC 740-10 "Income Taxes – Overall" sets forth a minimum threshold for financial statement recognition of the benefit of a tax position taken or expected to be taken in a tax return. Management has concluded there are no significant uncertain tax positions that would require recognition in the financial statements. If applicable, the Portfolio recognizes interest accrued related to unrecognized tax benefits in "Interest Expense" and penalties in "Other Expenses" in the Statement of Operations. The Portfolio files tax returns with the U.S. Internal Revenue Service, New York and various states. Each of the tax years in the four-year period ended December 31, 2011, remains subject to examination by taxing authorities.
The tax character of distributions paid may differ from the character of distributions shown in the Statements of Changes in Net Assets due to short-term capital gains being treated as ordinary income for tax purposes. The tax character of distributions paid during fiscal 2011 and 2010 was as follows:
2011 Distributions
Paid From: | | 2010 Distributions
Paid From: | |
Ordinary
Income
(000) | | Long-Term
Capital Gain
(000) | | Ordinary
Income
(000) | | Long-Term
Capital Gain
(000) | |
| $ | 981 | | | $ | — | | | $ | 2,632 | | | $ | — | | |
The amount and character of income and capital gain distributions to be paid by the Portfolio are determined in accordance with Federal income tax regulations, which may differ from GAAP. These book/tax differences are considered either temporary or permanent in nature.
Temporary differences are attributable to differing book and tax treatments for the timing of the recognition of gains (losses) on certain investment transactions and the timing of the deductibility of certain expenses.
Permanent differences, primarily due to differing treatments of gains (losses) related to foreign currency transactions, and on certain equity securities designated as issued by passive foreign investment companies, paydown adjustments and a reclass of long term dividends received, resulted in the following reclassifications among the components of net assets at December 31, 2011:
Undistributed
(Distributions in
Excess of) Net
Investment
Income (Loss)
(000) | | Accumulated
Net Realized
Gain (Loss)
(000) | | Paid-in
Capital
(000) | |
| $ | 421 | | | $ | (421 | ) | | $ | — | | |
At December 31, 2011, the Portfolio had distributable earnings on a tax basis as follows:
Undistributed
Ordinary
Income
(000) | | Undistributed
Long-Term
Capital Gain
(000) | |
| $ | 1,348 | | | $ | — | | |
At June 30, 2012, the aggregate cost for federal income tax purposes approximates the aggregate cost for book purposes. The aggregate gross unrealized appreciation is approximately $3,010,000 and the aggregate gross unrealized depreciation is approximately $4,311,000 resulting in net unrealized depreciation of approximately $1,301,000.
On December 22, 2010, the Regulated Investment Company Modernization Act of 2010 (the "Modernization Act") was signed into law. The Modernization Act modernizes several tax provisions related to Regulated Investment Companies ("RICs") and their shareholders. One key change made by the Modernization Act is that capital losses will generally retain their character as short-term or long-term and may be carried forward indefinitely to offset future gains. These losses are utilized before other capital loss carryforwards that expire. Generally, the Modernization Act is effective for taxable years beginning after December 22, 2010.
At December 31, 2011, the Portfolio had available for Federal income tax purposes unused capital losses, of approximately $19,405,000, of which $48,000 will expire on December 31, 2016 and $19,357,000 will expire on December 31, 2017.
To the extent that capital loss carryforwards are used to offset any future capital gains realized during the carryover period as provided by U.S. Federal income tax regulations, no capital gains tax liability will be incurred by the Portfolio for gains realized and not distributed. To the extent that capital gains are offset, such gains will not be distributed to the shareholders. During the year ended December 31, 2011, the Portfolio utilized capital loss carryforwards for U.S. Federal income tax purposes of approximately $771,000.
34
The Universal Institutional Funds, Inc.
Semi-Annual Report – June 30, 2012 (unaudited)
Notes to Financial Statements (cont'd)
H. Security Transactions and Transactions with Affiliates: For the six months ended June 30, 2012, purchases and sales of investment securities for the Portfolio, other than long-term U.S. Government securities and short-term investments, were approximately $9,848,000 and $16,446,000, respectively. For the six months ended June 30, 2012, purchases and sales of long-term U.S. Government securities were approximately $11,021,000 and $11,387,000, respectively.
The Portfolio invests in Morgan Stanley Institutional Fund, Inc. – Emerging Markets Portfolio, an open-end management investment company managed by the Adviser. The Morgan Stanley Institutional Fund, Inc. – Emerging Markets Portfolio has a cost basis of approximately $2,793,000 at June 30, 2012. Advisory fees paid by the Portfolio are reduced by an amount equal to its pro-rata share of the advisory and administration fees paid by the Morgan Stanley Institutional Fund, Inc. – Emerging Markets Portfolio. For the six months ended June 30, 2012, advisory fees paid were reduced by approximately $17,000 relating to the Portfolio's investment in the Morgan Stanley Institutional Fund, Inc. – Emerging Markets Portfolio.
A summary of the Portfolio's transactions in shares of the Morgan Stanley Institutional Fund, Inc. – Emerging Markets Portfolio during the six months ended June 30, 2012 is as follows:
Value
December 31,
2011
(000) | | Purchases
at Cost
(000) | | Sales
(000) | | Realized
Gain
(Loss)
(000) | | Dividend
Income
(000) | | Value
June 30,
2012
(000) | |
| $ | 2,292 | | | $ | — | | | $ | — | | | $ | — | | | $ | — | | | $ | 2,430 | | |
The Portfolio invests in the Institutional Class of the Morgan Stanley Institutional Liquidity Funds – Money Market Portfolio (the "Liquidity Funds"), an open-end management investment company managed by the Adviser, both directly, and as a portion of the securities held as collateral on loaned securities. Advisory fees paid by the Portfolio are reduced by an amount equal to its pro-rata share of the advisory and administration fees paid by the Portfolio due to its investment in the Liquidity Funds. For the six months ended June 30, 2012, advisory fees paid were reduced by approximately $4,000 relating to the Portfolio's investment in the Liquidity Funds.
A summary of the Portfolio's transactions in shares of the Liquidity Funds during the six months ended June 30, 2012 is as follows:
Value
December 31,
2011
(000) | | Purchases
at Cost
(000) | | Sales
(000) | | Dividend
Income
(000) | | Value
June 30,
2012
(000) | |
| $ | 10,419 | | | $ | 27,597 | | | $ | 26,063 | | | $ | 4 | | | $ | 11,953 | | |
For the six months ended June 30, 2012, the Portfolio had transactions with Citigroup, Inc., and its affiliated broker-dealers which may be deemed affiliates of the Adviser, Distributor and Administrator under Section 17 of the Act.
Value
December 31,
2011
(000) | | Purchases
at Cost
(000) | | Sales
(000) | | Realized
Gain
(000) | | Dividend/
Interest
Income
(000) | | Value
June 30,
2012
(000) | |
| $ | 294 | | | $ | 122 | | | $ | 199 | | | $ | 8 | | | $ | 4 | | | $ | 234 | | |
I. Other: At June 30, 2012, the Portfolio had otherwise unaffiliated record owners of 10% or greater. Investment activities of these shareholders could have a material impact on the Portfolio. The aggregate percentage of such owners was 73.0% and 93.3%, for Class I and Class II, respectively.
J. Accounting Pronouncement: In December 2011, FASB issued Accounting Standards Update ("ASU") 2011-11, Balance Sheet: Disclosures about Offsetting Assets and Liabilities. The pronouncement improves disclosures for recognized financial and derivative instruments that are either offset on the balance sheet in accordance with the offsetting guidance in ASC 210-20-45 or ASC 815-10-45 or are subject to an enforceable master netting agreements or similar. The Fund will be required to disclose information about rights to offset and related arrangements (such as collateral agreements) in order to enable financial statement users to understand the effect of those rights and arrangements on its financial position as well as disclose the following (1) gross amounts; (2) amounts offset in the statement of financial position; (3) any other amounts that can be offset in the event of bankruptcy, insolvency or default of any of the parties (including cash and noncash financial collateral); and (4) the Fund's net exposure. The requirements are effective for annual reporting periods beginning on or after January 1, 2013, and must be applied retrospectively. At this time, the Fund's management is evaluating the implications of ASU 2011-11 and its impact, if any, on the financial statements.
35
(This page has been left blank intentionally.)
The Universal Institutional Funds, Inc.
Semi-Annual Report – June 30, 2012 (unaudited)
Director and Officer Information
Directors
Michael E. Nugent
Frank L. Bowman
Michael Bozic
Kathleen A. Dennis
James F. Higgins
Dr. Manuel H. Johnson
Joseph J. Kearns
Michael F. Klein
W. Allen Reed
Fergus Reid
Adviser and Administrator
Morgan Stanley Investment Management Inc.
522 Fifth Avenue
New York, New York 10036
Distributor
Morgan Stanley Distribution, Inc.
522 Fifth Avenue
New York, New York 10036
Dividend Disbursing and Transfer Agent
Morgan Stanley Services Company Inc.
P.O. Box 219804
Kansas City, Missouri 64121
Officers
Michael E. Nugent
Chairperson of the Board and Director
Arthur Lev
President and Principal Executive Officer
Mary Ann Picciotto
Chief Compliance Officer
Stefanie V. Chang Yu
Vice President
Mary E. Mullin
Secretary
Francis J. Smith
Treasurer and Principal Financial Officer
Custodian
State Street Bank and Trust Company
One Lincoln Street
Boston, Massachusetts 02111
Legal Counsel
Dechert LLP
1095 Avenue of the Americas
New York, New York 10036
Independent Registered Public Accounting Firm
Ernst & Young LLP
200 Clarendon Street
Boston, Massachusetts 02116
Reporting to Shareholders
Each Morgan Stanley fund provides a complete schedule of portfolio holdings in its semi-annual and annual reports within 60 days of the end of the fund's second and fourth fiscal quarters by filing the schedule electronically with the Securities and Exchange Commission (SEC). The semi-annual reports are filed on Form N-CSRS and the annual reports are filed on Form N-CSR. Morgan Stanley also delivers the semi-annual and annual reports to fund shareholders and makes these reports available on its public website, www.morganstanley.com. Each Morgan Stanley fund also files a complete schedule of portfolio holdings with the SEC for the fund's first and third fiscal quarters on Form N-Q. Morgan Stanley does not deliver the reports for the first and third fiscal quarters to shareholders, nor are the reports posted to the Morgan Stanley public website. You may, however, obtain the Form N-Q filings (as well as the Form N-CSR and N-CSRS filings) by accessing the SEC's website, www.sec.gov. You may also review and copy them at the SEC's Public Reference Room in Washington, DC. Information on the operation of the SEC's Public Reference Room may be obtained by calling the SEC toll free at 1-800-SEC-0330. You can also request copies of these materials, upon payment of a duplicating fee, by electronic request at the SEC's email address (publicinfo@sec.gov) or by writing the Public Reference Room of the SEC, Washington, DC 20549-0102.
Proxy Voting Policies and Procedures and Proxy Voting Record
You may obtain a copy of the Fund's Proxy Voting Policy and Procedures and information regarding how the Fund voted proxies relating to portfolio securities during the most recent twelve-month period ended June 30, without charge, upon request, by calling toll free 1-800-281-2715 or by visiting our website at www.morganstanley.com. This information is also available on the SEC's website at www.sec.gov.
This report is submitted for the general information of the shareholders of the Portfolio. For more detailed information about the Portfolio, its fees and expenses and other pertinent information, please read its Prospectus. The Fund's Statement of Additional Information contains additional information about the Portfolio, including its Directors. It is available, without charge, by calling 1-800-281-2715.
This report is not authorized for distribution to prospective investors in the Portfolio unless preceded or accompanied by an effective Prospectus. Read the Prospectus carefully before investing.
UIFIMASAN
IU12-01655P-Y06/12

October 4, 2012
Supplement
SUPPLEMENT DATED OCTOBER 4, 2012 TO THE PROSPECTUS OF
MORGAN STANLEY VARIABLE INVESTMENT SERIES
THE STRATEGIST PORTFOLIO
CLASS X and CLASS Y
Dated April 30, 2012
The Board of Trustees (the "Board") of Morgan Stanley Variable Investment Series (the "Fund") approved an Agreement and Plan of Reorganization by and between the Fund, on behalf of its series Strategist Portfolio (the "Portfolio") and The Universal Institutional Funds, Inc., on behalf of its series Global Tactical Asset Allocation Portfolio ("Global Tactical Asset Allocation"), pursuant to which substantially all of the assets of the Portfolio would be combined with those of Global Tactical Asset Allocation and shareholders of the Portfolio would become shareholders of Global Tactical Asset Allocation, receiving shares of Global Tactical Asset Allocation equal to the value of their holdings in the Portfolio (the "Reorganization"). Each shareholder of the Portfolio would receive the Class of shares of Global Tactical Asset Allocation that corresponds to the Class of shares of the Portfolio currently held by that shareholder. The Reorganization is subject to the approval of shareholders of the Portfolio at a special meeting of shareholders scheduled to be held during the first quarter of 2013. A proxy statement formally detailing the proposal, the reasons for the Reorganization and information concerning Global Tactical Asset Allocation is expected to be distributed to shareholders of the Portfolio during the first quarter of 2013.
PLEASE RETAIN THIS SUPPLEMENT FOR FUTURE REFERENCE.
PROSPECTUS n APRIL 30, 2012

VARIABLE INVESTMENT SERIES
THE STRATEGIST PORTFOLIO
Class X
Morgan Stanley Variable Investment Series is a mutual fund comprised of eight separate portfolios, each with its own distinct investment objective(s) and policies. In this Prospectus, shares of the Strategist Portfolio (the "Portfolio") are being offered.
Shares of the Portfolio are sold exclusively to certain life insurance companies in connection with particular variable life insurance and/or variable annuity contracts they issue. The insurance companies invest in shares of the Portfolio in accordance with instructions received from owners of variable life insurance or variable annuity contracts.
This Prospectus must be accompanied by a current prospectus for the variable life insurance and/or annuity contract issued by your insurance company.
The Securities and Exchange Commission ("SEC") has not approved or disapproved these securities or passed upon
the adequacy of this Prospectus. Any representation to the contrary is a criminal offense.
Contents
Portfolio Summary | | INVESTMENT OBJECTIVE | | | 1 | | |
| | FEES AND EXPENSES OF THE PORTFOLIO | | | 1 | | |
| | PORTFOLIO TURNOVER | | | 1 | | |
| | PRINCIPAL INVESTMENT STRATEGIES | | | 1 | | |
| | PRINCIPAL RISKS | | | 2 | | |
| | PAST PERFORMANCE | | | 3 | | |
| | ADVISER | | | 3 | | |
| | PURCHASE AND SALE OF PORTFOLIO SHARES | | | 3 | | |
| | TAX INFORMATION | | | 3 | | |
| | PAYMENTS TO BROKER-DEALERS AND OTHER FINANCIAL INTERMEDIARIES | | | 3 | | |
Portfolio Details | | ADDITIONAL INFORMATION ABOUT THE PORTFOLIO'S INVESTMENT OBJECTIVE,
STRATEGIES AND RISKS | | | 4 | | |
| | PORTFOLIO MANAGEMENT | | | 13 | | |
Shareholder Information | | PURCHASES AND SALES OF PORTFOLIO SHARES | | | 14 | | |
| | FREQUENT PURCHASES AND REDEMPTIONS OF SHARES | | | 14 | | |
| | PRICING PORTFOLIO SHARES | | | 15 | | |
| | DISTRIBUTIONS | | | 16 | | |
| | TAX CONSEQUENCES | | | 16 | | |
| | PORTFOLIO HOLDINGS INFORMATION | | | 16 | | |
| | ADDITIONAL INFORMATION | | | 16 | | |
Financial Highlights | | | | | 17 | | |
This Prospectus contains important information about the Strategist Portfolio and the Morgan Stanley Variable Investment Series. Please read it carefully and keep it for future reference.
Investment Objective
The Portfolio seeks high total investment return through a fully managed investment policy utilizing equity, fixed-income and money market securities and the writing of covered call and put options.
Fees and Expenses of the Portfolio
The table below describes the fees and expenses that you may pay if you buy and hold Class X shares of the Portfolio. Total annual Portfolio operating expenses in the table and the Example below do not reflect the impact of any charges by your insurance company. If they did, expenses would be higher.
Annual Portfolio Operating Expenses
(expenses that you pay each year as a percentage of the value of your investment)
Advisory fee | | | 0.42 | % | |
Distribution and service (12b-1) fees | | | None | | |
Other expenses | | | 0.19 | % | |
Total annual Portfolio operating expenses | | | 0.61 | % | |
Example
The example below is intended to help you compare the cost of investing in the Portfolio with the cost of investing in other mutual funds.
The example assumes that you invest $10,000 in the Portfolio, your investment has a 5% return each year, and the Portfolio's operating expenses remain the same. Although your actual costs may be higher or lower, based on these assumptions your costs would be:
| | | Expenses Over Time | |
| | | 1 Year | | 3 Years | | 5 Years | | 10 Years | |
| | | | | $ | 62 | | | $ | 195 | | | $ | 340 | | | $ | 762 | | |
Portfolio Turnover
The Portfolio pays transaction costs, such as commissions, when it buys and sells securities (or "turns over" its portfolio). A higher portfolio turnover rate may indicate higher transaction costs. These costs, which are not reflected in Total annual Portfolio operating expenses or in the Example, affect the Portfolio's performance. During the most recent fiscal year, the Portfolio's portfolio turnover rate was 121% of the average value of its portfolio.
Principal Investment Strategies
The Portfolio's "Adviser," Morgan Stanley Investment Management Inc., actively allocates the Portfolio's assets among the major asset categories of equity securities, fixed-income securities and money market instruments. The Adviser allocates the Portfolio's assets based on, among other things, its assessment of the effects of economic and market trends on different sectors of the market. There is no limit as to the percentage of assets that may be allocated to any one asset class.
Within the equity sector, the Adviser actively allocates funds to those economic sectors it expects to benefit from major trends and to individual stocks, which it considers to have superior investment potential. Equity securities in which the Portfolio may invest include, among others, common stocks, preferred stocks, depositary receipts, convertible securities and real estate investment trusts (commonly known as "REITs"). The Portfolio may invest in equity securities listed or traded outside of the United States, including in emerging market or developing countries.
Within the fixed-income sector of the market, the Adviser seeks to maximize the return on its investments by adjusting maturities and coupon rates as well as by exploiting yield differentials among different types of investment grade bonds and below investment grade bonds (known as "junk bonds"). Fixed-income securities in which the Portfolio may invest include debt securities such as corporate bonds and notes, U.S. government securities, convertible securities and mortgage-backed securities. The Portfolio may also invest in sovereign debt securities and corporate debt securities of issuers outside the United States, including governments of and issuers in emerging market or developing countries.
Certain of the securities in which the Portfolio may invest are mortgage-backed securities. The mortgage-backed securities in which the Portfolio may invest include mortgage pass-through securities, collateralized mortgage obligations ("CMOs"), stripped mortgage-backed securities ("SMBS") and inverse floating rate obligations ("inverse floaters"). In addition, the Portfolio may invest in to-be-announced pass-through mortgage securities, which settle on a delayed delivery basis ("TBAs"). The Portfolio may also invest in restricted and illiquid securities.
Within the money market sector of the market, the Adviser seeks to maximize returns by exploiting spreads among short-term instruments.
The Portfolio may, but it is not required to, use derivative instruments for a variety of purposes, including hedging, risk
VIS — The Strategist Portfolio
1
management, portfolio management or to earn income. The Portfolio's use of derivatives may involve the purchase and sale of derivative instruments such as options, futures, swaps, structured investments and other related instruments and techniques. The Portfolio may utilize foreign currency forward exchange contracts, which are also derivatives, in connection with its investments in foreign securities.
Principal Risks
There is no assurance that the Portfolio will achieve its investment objective and you can lose money investing in this Portfolio. The principal risks of investing in the Portfolio include:
• Common Stocks and Other Equity Securities. In general, common stock and other equity security values fluctuate, and sometimes widely fluctuate, in response to activities specific to the company as well as general market, economic and political conditions. To the extent that the Portfolio invests in convertible securities, and the convertible security's investment value is greater than its conversion value, its price will be likely to increase when interest rates fall and decrease when interest rates rise. If the conversion value exceeds the investment value, the price of the convertible security will tend to fluctuate directly with the price of the underlying equity security.
• Fixed-Income Securities. All fixed-income securities are subject to two types of risk: credit risk and interest rate risk. Credit risk refers to the possibility that the issuer of a security will be unable to make interest payments and/or repay the principal on its debt. When the general level of interest rates goes up, the prices of most fixed-income securities go down. When the general level of interest rates goes down, the prices of most fixed-income securities go up. Because the Fund is not limited as to the maturities of the fixed-income securities in which it may invest, a rise in the general level of interest rates may cause the price of the Fund's portfolio securities to fall substantially.
• U.S. Government Securities. With respect to U.S. government securities that are not backed by the full faith and credit of the U.S. Government, there is the risk that the U.S. Government will not provide financial support to such U.S. government agencies, instrumentalities or sponsored enterprises if it is not obligated to do so by law.
• Mortgage-Backed Securities. Mortgage-backed securities entail prepayment risk, which generally increases during a period of falling interest rates. Certain mortgage-backed securities may be more volatile and less liquid than other traditional types of debt securities. In addition, an unexpectedly high rate of defaults on the mortgages held by a mortgage pool may adversely affect the value of a mortgage-backed security and could result in losses to the Portfolio. The risk of such defaults is generally higher in the case of mortgage pools that include subprime mortgages.
• Liquidity Risk. The Portfolio's investments in restricted and illiquid securities may entail greater risk than investments in publicly traded securities. These securities may be more difficult to sell, particularly in times of market turmoil. Illiquid securities may be more difficult to value. If the Portfolio is forced to sell
an illiquid security to fund redemptions or for other cash needs, it may be forced to sell the security at a loss.
• Lower Rated Fixed-Income Securities ("Junk Bonds"). The prices of these securities are likely to be more sensitive to adverse economic changes, resulting in increased volatility of market prices of these securities during periods of economic uncertainty, or adverse individual corporate developments, than higher rated securities. In addition, during an economic downturn or substantial period of rising interest rates, junk bond issuers and, in particular, highly leveraged issuers may experience financial stress.
• REITs. REITs are susceptible to risks associated with the ownership of real estate and the real estate industry in general. In addition, REITs depend on specialized management skills, may not be diversified, may have less trading volume and may be subject to more abrupt or erratic price movements than the overall securities market. Investments in REITs may involve duplication of management fees and certain other expenses.
• Foreign and Emerging Market Securities. Investments in foreign markets entail special risks such as currency, political, economic and market risks. There also may be greater market volatility, less reliable financial information, higher transaction and custody costs, decreased market liquidity and less government and exchange regulation associated with investments in foreign markets. In addition, investments in certain foreign markets, which have historically been considered stable, may become more volatile and subject to increased risk due to ongoing developments and changing conditions in such markets. Moreover, the growing interconnectivity of global economies and financial markets has increased probability that adverse developments and conditions in one country or region will affect the stability of economies and financial markets in other countries or regions. The risks of investing in emerging market countries are greater than risks associated with investments in foreign developed countries. In addition, the Portfolio's investments may be denominated in foreign currencies and therefore, changes in the value of a country's currency compared to the U.S. dollar may affect the value of the Portfolio's investments. Hedging the Portfolio's currency risks through foreign currency forward exchange contracts involves the risk of mismatching the Portfolio's objectives under a foreign currency forward exchange contract with the value of securities denominated in a particular currency. There is additional risk that such transactions reduce or preclude the opportunity for gain and that currency contracts create exposure to currencies in which the Portfolio's securities are not denominated. The use of foreign currency forward exchange contracts involves the risk of loss from the insolvency or bankruptcy of the counterparty to the contract or the failure of the counterparty to make payments or otherwise comply with the terms of the contract.
• Derivatives. A derivative instrument often has risks similar to its underlying instrument and may have additional risks, including imperfect correlation between the value of the derivative and the underlying instrument, risks of default by the counterparty to certain transactions, magnification of losses
VIS — The Strategist Portfolio
2
incurred due to changes in the market value of the securities, instruments, indices or interest rates to which they relate, and risks that the transactions may not be liquid. Certain derivative transactions may give rise to a form of leverage. Leverage magnifies the potential for gain and the risk of loss.
Shares of the Portfolio are not bank deposits and are not guaranteed or insured by the Federal Deposit Insurance Corporation or any other government agency.
Past Performance
The bar chart and table below provide some indication of the risks of investing in the Portfolio by showing changes in the performance of the Portfolio's Class X shares from year to year and by showing how the average annual returns of the Portfolio's Class X shares for the one, five and 10 year periods compare with those of broad measures of market performance over time. This performance information does not include the impact of any charges deducted by your insurance company. If it did, returns would be lower. The Portfolio's past performance does not indicate how the Portfolio will perform in the future.
Annual Total Returns—Calendar Years
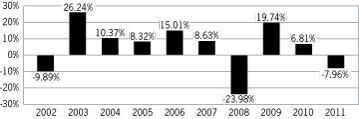
High Quarter 6/30/03: 12.71%
Low Quarter 12/31/08: –13.19%
Average Annual Total Returns For Periods Ended December 31, 2011
| | | Past
1 Year | | Past
5 Years | | Past
10 Years | |
Strategist Portfolio | | | –7.96 | % | | | –0.56 | % | | | 4.28 | % | |
S&P 500® Index
(reflects no deduction for
fees, expenses, or taxes)1 | | | 2.11 | % | | | –0.25 | % | | | 2.92 | % | |
Barclays Capital U.S. Government/
Credit Index (reflects no deduction
for fees, expenses, or taxes)2 | | | 8.74 | % | | | 6.55 | % | | | 5.85 | % | |
(1) The Standard & Poor's 500® Index (S&P 500®) measures the performance of the large cap segment of the U.S. equities market, covering approximately 75% of the U.S. equities market. The Index includes 500 leading companies in leading industries of the U.S. economy. It is not possible to invest directly in an index.
(2) The Barclays Capital U.S. Government/Credit Index tracks the performance of government and corporate obligations, including U.S. government agency and Treasury securities and corporate and Yankee bonds. It is not possible to invest directly in an index.
Adviser
Adviser. Morgan Stanley Investment Management Inc.
Portfolio Managers. The Portfolio is managed by members of the Global Asset Allocation and the Taxable Fixed Income teams. Information about the members jointly and primarily responsible for the day-to-day management of the Portfolio is shown below:
Name | | Title with Adviser | | Date Began
Managing Portfolio | |
Mark A. Bavoso | | Managing Director | | September 1995 | |
Jaidip Singh | | Executive Director | | January 2012 | |
Neil Stone | | Managing Director | | January 2012 | |
Purchase and Sale of Portfolio Shares
This Prospectus offers Class X shares of the Strategist Portfolio. The Portfolio also offers Class Y shares of the Portfolio through a separate prospectus. Class Y shares are subject to different expenses. For eligibility information, contact your insurance company.
Portfolio shares will be sold at the next price calculated after we receive the redemption request on your behalf.
The Portfolio offers its shares only to insurance companies' separate accounts that insurance companies establish to fund variable life insurance and/or variable annuity contracts. An insurance company purchases or redeems shares of the Portfolio based on, among other things, the amount of net contract premiums or purchase payments allocated to a separate account investment division, transfers to or from a separate account investment division, contract loans and repayments, contract withdrawals and surrenders, and benefit payments. The contract prospectus describes how contract owners may allocate, transfer and withdraw amounts to, and from, separate accounts.
For more information, please refer to the "Shareholder Information—Purchases and Sales of Portfolio Shares" section of this Prospectus.
Tax Information
Special tax rules apply to life insurance companies, variable annuity contracts and variable life insurance contracts. For information on federal income taxation of a life insurance company with respect to its receipt of distributions from the Portfolio and federal income taxation of owners of variable annuity or variable life insurance contracts, see the accompanying contract prospectus.
Payments to Broker-Dealers and
Other Financial Intermediaries
If you purchase the Portfolio through an insurance company or other financial intermediary (such as a bank), the Adviser and/or the Portfolio's "Distributor," Morgan Stanley Distribution, Inc., may pay the intermediary for the sale of Portfolio shares and related services. These payments, which may be significant in amount, may create a conflict of interest by influencing the insurance company or other intermediary and your salesperson to recommend the Portfolio over another investment. Ask your salesperson or visit your financial intermediary's web site for more information.
VIS — The Strategist Portfolio
3
Portfolio Details
ADDITIONAL INFORMATION ABOUT THE PORTFOLIO'S INVESTMENT OBJECTIVE, STRATEGIES AND RISKS
INVESTMENT OBJECTIVE
The Portfolio seeks high total investment return through a fully managed investment policy utilizing equity, fixed-income and money market securities and the writing of covered call and put options.
PRINCIPAL INVESTMENT STRATEGIES
The Adviser actively allocates the Portfolio's assets among the major asset categories of equity securities, fixed-income securities and money market instruments. In determining which securities to buy, hold or sell for the Portfolio, the Adviser allocates the Portfolio's assets based on, among other things, its assessment of the effects of economic and market trends on different sectors of the market. There is no limit as to the percentage of assets that may be allocated to any one asset class.
Within the equity sector, the Adviser actively allocates funds to those economic sectors it expects to benefit from major trends and to individual stocks, which it considers to have superior investment potential. Equity securities in which the Portfolio may invest include common stocks, preferred stocks, depositary receipts, convertible securities and REITs. The Portfolio may invest in equity securities listed or traded outside of the United States, including in emerging market or developing countries.
Common stock is a share ownership or equity interest in a corporation. It may or may not pay dividends, as some companies reinvest all of their profits back into their businesses, while others pay out some of their profits to shareholders as dividends. A depositary receipt is generally issued by a bank or financial institution and represents an ownership interest in the common stock or other equity securities of a foreign company. REITs pool investors' funds for investments primarily in real estate properties and real estate-related loans. They may also include, among other businesses, real estate developers, brokers and operating companies whose products and services are significantly related to the real estate industry such as building suppliers and mortgage lenders.
Within the fixed-income sector of the market, the Adviser seeks to maximize the return on its investments by adjusting maturities and coupon rates as well as by exploiting yield differentials among different types of investment grade bonds. Fixed-income securities in which the Portfolio may invest include debt securities such as corporate bonds and notes, U.S. government securities, convertible securities and mortgage-backed securities (including CMOs, SMBS, inverse floaters and TBAs). The Portfolio may also invest in debt securities issued by governments other than the United States (sovereign debt securities) as well as by corporate issuers outside the United States, including governments of and issuers in emerging market or developing countries. The Portfolio will invest no more than 30% of its net assets in fixed-income securities denominated in currencies other than the U.S. dollar. The Portfolio is not limited as to the maturities of the U.S. government securities and other debt securities in which it may invest.
TOTAL RETURN
An investment objective having the goal of selecting securities with the potential to rise in price and pay out income.
VIS — The Strategist Portfolio
4
The issuer of the debt security borrows money from the investor who buys the security. Most debt securities pay either fixed or adjustable rates of interest at regular intervals until they mature, at which point investors get their principal back. The Portfolio's fixed-income investments may include zero coupon securities, which are purchased at a discount and generally accrue interest, but make no payments until maturity. The Portfolio may invest up to 20% of its net assets in debt securities rated below investment grade by Moody's Investors Service, Inc. or Standard & Poor's Ratings Services, a division of The McGraw-Hill Companies, Inc., or, if not rated, determined to be of comparable quality by the Adviser. Securities rated below investment grade are commonly known as "junk bonds."
Mortgage-Backed Securities. One type of mortgage-backed security in which the Portfolio may invest is a mortgage pass-through security. These securities represent a participation interest in a pool of mortgage loans originated by U.S. Governmental or private lenders such as banks. They differ from conventional debt securities, which provide for periodic payment of interest in fixed amounts and principal payments at maturity or on specified call dates. Mortgage pass-through securities provide for monthly payments that are a "pass-through" of the monthly interest and principal payments made by the individual borrowers on the pooled mortgage loans. Mortgage pass-through securities may be collateralized by mortgages with fixed rates of interest or adjustable rates. In addition, the Portfolio may invest in TBAs, which are mortgage derivatives that settle on a delayed delivery basis.
Collateralized Mortgage Obligations. CMOs are debt obligations collateralized by mortgage loans or mortgage pass-through securities ("Mortgage Assets"). Payments of principal and interest on the Mortgage Assets and any reinvestment income are used to make payments on the CMOs. CMOs are issued in multiple classes. Each class has a fixed or floating coupon rate and a stated maturity or final distribution date. The principal and interest on the Mortgage Assets may be allocated among the classes in a number of different ways. Certain classes will, as a result of the allocation, have more predictable cash flows than others. As a general matter, the more predictable the cash flow, the lower the yield relative to other Mortgage Assets. The less predictable the cash flow, the higher the yield and the greater the risk. The Portfolio may invest in any class of CMOs.
Stripped Mortgage-Backed Securities. SMBS are derivative multi-class mortgage securities. SMBS may be issued by agencies or instrumentalities of the U.S. Government, or by private originators. A common type of SMBS will have one class receiving some of the interest and most of the principal from the Mortgage Assets, while the other class receives most of the interest and the remainder of the principal. In the most extreme case, one class will receive all of the interest (the interest-only or "IO" class), while the other class will receive all of the principal (the principal-only or "PO" class).
Inverse Floaters. Inverse floating rate obligations are obligations which pay interest at rates that vary inversely with changes in market rates of interest. Because the interest rate paid to holders of such obligations is generally determined by subtracting a variable or floating rate from a predetermined amount, the interest rate paid to holders of such obligations will decrease as such variable or floating rate increases and increase as such variable or floating rate decreases.
Restricted and Illiquid Securities. The Portfolio may purchase certain non-publicly traded "restricted" securities. These securities may include "Rule 144A" securities which are exempt from registration and that may only be resold to qualified institutional buyers and other restricted securities. The Portfolio may invest up to 15% of its net assets in illiquid securities, including restricted securities that are illiquid. The Portfolio may invest an unlimited amount in restricted securities that are considered by the Adviser to be liquid.
Within the money market sector of the market, the Adviser seeks to maximize returns by exploiting spreads among short-term instruments.
Derivatives. The Portfolio may, but it is not required to, use derivative instruments for a variety of purposes, including hedging, risk management, portfolio management or to earn income. Derivatives are financial instruments whose value is based on the value of an underlying asset, interest rate, index or financial instrument. The Portfolio's use of derivatives may involve the purchase and sale of derivative instruments such as options, futures, swaps, structured investments and other related instruments
VIS — The Strategist Portfolio
5
and techniques. The Portfolio may also use foreign currency forward exchange contracts, which are also derivatives, in connection with its investments in foreign securities.
In pursuing the Portfolio's investment objective, the Adviser has considerable leeway in deciding which investments it buys, holds or sells on a day-to-day basis and which trading strategies it uses. For example, the Adviser in its discretion may determine to use some permitted trading strategies while not using others.
ADDITIONAL INVESTMENT STRATEGY INFORMATION
This section provides additional information relating to the Portfolio's investment strategies.
Exchange-Traded Funds ("ETFs"). The Portfolio may invest in shares of various ETFs that seek to track the performance of various portions or segments of the equity and bond markets. No more than 5% of the Portfolio's net assets will be invested in any one ETF. Certain of the ETFs in which the Portfolio may invest may be leveraged.
Asset-Backed Securities. Asset-backed securities represent an interest in a pool of assets such as, but not limited to, automobile loans, credit card receivables, student loans or home equity (prime and subprime) loans that have been securitized in pass-through structures similar to mortgage-backed securities. These types of pass-through securities provide for monthly payments that are a "pass-through" of the monthly interest and principal payments made by the individual borrowers on the pooled receivables.
Municipal Securities. The Portfolio may invest in municipal securities, which may include Build America Bonds. Municipal securities are fixed-income securities issued by local, state and regional governments that provide interest income, which is exempt from federal income taxes. However, the Portfolio may purchase municipal bonds that pay interest that is subject to the federal alternative minimum tax, and securities on which the interest payments are taxable. General obligation securities are secured by the issuer's faith and credit including its taxing power for payment of principal and interest. Revenue bonds, however, are generally payable from a specific revenue source. They are issued for a wide variety of projects such as financing public utilities, hospitals, housing, airports, highways and educational facilities. Municipal notes are issued to meet the short-term funding requirements of local, regional and state governments. Build America Bonds are taxable municipal securities on which the issuer receives federal support of the interest paid. Assuming certain specified conditions are satisfied, issuers of Build America Bonds may either (i) receive reimbursement from the U.S. Treasury with respect to a portion of its interest payments on the bonds ("direct pay" Build America Bonds) or (ii) provide tax credits to investors in the bonds ("tax credit" Build America Bonds). Unlike most other municipal securities, interest received on Build America Bonds is subject to federal and state income tax.
Defensive Investing. The Portfolio may take temporary "defensive" positions in attempting to respond to adverse market conditions. The Portfolio may invest any amount of its assets in cash or money market instruments in a defensive posture that may be inconsistent with its principal investment strategies when the Adviser believes it advisable to do so.
Although taking a defensive posture is designed to protect the Portfolio from an anticipated market downturn, it could have the effect of reducing the benefit from any upswing in the market. When the Portfolio takes a defensive position, it may not achieve its investment objective.
* * *
The percentage limitations relating to the composition of the Portfolio apply at the time the Portfolio acquires an investment. Subsequent percentage changes that result from market fluctuations generally will not require the Portfolio to sell any portfolio security. However, the Portfolio may be required to reduce its borrowings, if any, in response to fluctuations in the value of such holdings. The Portfolio may change its principal investment strategies without shareholder approval; however, you would be notified of any changes.
VIS — The Strategist Portfolio
6
PRINCIPAL RISKS
There is no assurance that the Portfolio will achieve its investment objective. The Portfolio's share price and return will fluctuate with changes in the market value of its portfolio securities. When you sell Portfolio shares, they may be worth less than what you paid for them and, accordingly, you can lose money investing in this Portfolio.
Common Stocks and Other Equity Securities. A principal risk of investing in the Portfolio is associated with its common stock and other equity investments. In general, common stock and other equity security prices fluctuate in response to activities specific to the company as well as general market, economic and political conditions. These prices can fluctuate widely in response to these factors.
Investments in convertible securities may subject the Portfolio to the risks associated with both fixed-income securities and common stocks. To the extent that a convertible security's investment value is greater than its conversion value, its price will be likely to increase when interest rates fall and decrease when interest rates rise, as with a fixed-income security. If the conversion value exceeds the investment value, the price of the convertible security will tend to fluctuate directly with the price of the underlying equity security.
A portion of the Portfolio's investments in convertible securities may have speculative characteristics.
Fixed-Income Securities. Fixed-income securities are subject to two types of risk: credit risk and interest rate risk. Credit risk refers to the possibility that the issuer of a security will be unable to make interest payments and/or repay the principal on its debt. Interest rate risk refers to fluctuations in the value of a fixed-income security resulting from changes in the general level of interest rates. When the general level of interest rates goes up, the prices of most fixed-income securities go down. When the general level of interest rates goes down, the prices of most fixed-income securities go up. (Zero coupon securities are typically subject to greater price fluctuations than comparable securities that pay current interest.)
The Portfolio is not limited as to the maturities of the fixed-income securities in which it may invest. Thus, a rise in the general level of interest rates may cause the price of the Portfolio's portfolio securities to fall substantially. Securities rated below investment grade are commonly known as "junk bonds" and may have speculative credit risk characteristics.
U.S. Government Securities. The U.S. government securities that the Portfolio may purchase include U.S. Treasury bills, notes and bonds, all of which are direct obligations of the U.S. Government. In addition, the Portfolio may purchase securities issued by agencies and instrumentalities of the U.S. Government which are backed by the full faith and credit of the United States. Among the agencies and instrumentalities issuing these obligations are the Government National Mortgage Association ("Ginnie Mae") and the Federal Housing Administration. The Portfolio may also purchase securities issued by agencies and instrumentalities which are not backed by the full faith and credit of the U.S., but whose issuing agency or instrumentality has the right to borrow, to meet its obligations, from the U.S. Treasury. Among these agencies and instrumentalities are the Federal National Mortgage Association ("Fannie Mae"), the Federal Home Loan Mortgage Corporation ("Freddie Mac") and the Federal Home Loan Banks. In September 2008, the U.S. Treasury Department announced that the U.S. Government would be taking over Freddie Mac and Fannie Mae and placing the companies into a conservatorship. In addition, the U.S. Treasury announced additional steps that it intended to take with respect to the debt and mortgage-backed securities issued by Fannie Mae and Freddie Mac in order to support the conservatorship. No assurance can be given that these initiatives will be successful. Further, the Portfolio may purchase securities issued by agencies and instrumentalities, which are backed solely by the credit of the issuing agency or instrumentality. Among these agencies and instrumentalities is the Federal Farm Credit System. Because these securities are not backed by the full faith and credit of the U.S., there is a risk that the U.S. Government will not provide financial support to these agencies if it is not obligated to do so by law. The maximum potential liability of the issuers of some U.S. government securities held by the Fund may greatly exceed their current resources, including their legal right to support from the U.S. Treasury. It is possible that these issuers will not have the funds to meet their payment obligations in the future.
VIS — The Strategist Portfolio
7
Mortgage-Backed Securities. Mortgage-backed securities in which the Portfolio may invest have different risk characteristics than traditional debt securities. Although generally the value of fixed-income securities increases during periods of falling interest rates and decreases during periods of rising interest rates, this is not always the case with mortgage-backed securities. This is due to the fact that principal on underlying mortgages may be prepaid at any time as well as other factors. Generally, prepayments will increase during a period of falling interest rates and decrease during a period of rising interest rates. The rate of prepayments also may be influenced by economic and other factors. Prepayment risk includes the possibility that, as interest rates fall, securities with stated interest rates may have the principal prepaid earlier than expected, requiring the Portfolio to invest the proceeds at generally lower interest rates.
Investments in mortgage-backed securities are made based upon, among other things, expectations regarding the rate of prepayments on underlying mortgage pools. Rates of prepayment, faster or slower than expected by the Adviser, could reduce the Portfolio's yield, increase the volatility of the Portfolio and/or cause a decline in net asset value. Certain mortgage-backed securities, especially privately issued mortgage-backed securities, are more volatile and less liquid than other traditional types of securities.
To the extent the Portfolio invests in mortgage securities offered by non-governmental issuers, such as commercial banks, savings and loan institutions, private mortgage insurance companies, mortgage bankers and other secondary market issuers, the Portfolio may be subject to additional risks. Timely payment of interest and principal of non-governmental issuers are supported by various forms of private insurance or guarantees, including individual loan, title, pool and hazard insurance purchased by the issuer. There can be no assurance that the private insurers can meet their obligations under the policies. An unexpectedly high rate of defaults on the mortgages held by a mortgage pool may adversely affect the value of a mortgage-backed security and could result in losses to the Portfolio. The risk of such defaults is generally higher in the case of mortgage pools that include subprime mortgages. Subprime mortgages refer to loans made to borrowers with weakened credit histories or with a lower capacity to make timely payments on their mortgages.
In addition, the Portfolio may invest in TBAs. Investments in TBAs may give rise to a form of leverage. Leverage may cause the Portfolio to be more volatile than if the Portfolio had not been leveraged. Further, TBAs may cause the Portfolio's portfolio turnover rate to appear higher.
Collateralized Mortgage Obligations. The principal and interest on the Mortgage Assets comprising a CMO may be allocated among the several classes of a CMO in many ways. The general goal in allocating cash flows on Mortgage Assets to the various classes of a CMO is to create certain tranches on which the expected cash flows have a higher degree of predictability than do the underlying Mortgage Assets. As a general matter, the more predictable the cash flow is on a particular CMO tranche, the lower the anticipated yield on that tranche at the time of issue will be relative to the prevailing market yields on the Mortgage Assets. As part of the process of creating more predictable cash flows on certain tranches of a CMO, one or more tranches generally must be created that absorb most of the changes in the cash flows on the underlying Mortgage Assets. The yields on these tranches are generally higher than prevailing market yields on other mortgage-related securities with similar average lives. Principal prepayments on the underlying Mortgage Assets may cause the CMOs to be retired substantially earlier than their stated maturities or final distribution dates. Because of the uncertainty of the cash flows on these tranches, the market prices and yields of these tranches are more volatile and may increase or decrease in value substantially with changes in interest rates and/or rates of prepayment. Due to the possibility that prepayments (on home mortgages and other collateral) will alter the cash flow on CMOs, it is not possible to determine in advance the final maturity date or average life. Faster prepayment will shorten the average life and slower prepayments will lengthen it. In addition, if the collateral securing CMOs or any third party guarantees are insufficient to make payments, the Portfolio could sustain a loss.
Stripped Mortgage-Backed Securities. Investments in each class of SMBS are extremely sensitive to changes in interest rates. IOs tend to decrease in value substantially if interest rates decline and prepayment rates become more rapid. POs tend to decrease in value substantially if interest rates increase and the rate of prepayment decreases. If the Portfolio invests in SMBS
VIS — The Strategist Portfolio
8
and interest rates move in a manner not anticipated by Portfolio management, it is possible that the Portfolio could lose all or substantially all of its investment.
Inverse Floaters. Like most other fixed-income securities, the value of inverse floaters will decrease as interest rates increase. They are more volatile, however, than most other fixed-income securities because the coupon rate on an inverse floater typically changes at a multiple of the change in the relevant index rate. Thus, any rise in the index rate (as a consequence of an increase in interest rates) causes a correspondingly greater drop in the coupon rate of an inverse floater while a drop in the index rate causes a correspondingly greater increase in the coupon of an inverse floater. Some inverse floaters may also increase or decrease substantially because of changes in the rate of prepayments.
Lower Rated Fixed-Income Securities ("Junk Bonds"). The Portfolio's investments in fixed-income securities rated lower than investment grade, or if unrated, of comparable quality as determined by the Adviser, otherwise known as "junk bonds," pose significant risks. The prices of junk bonds are likely to be more sensitive to adverse economic changes or individual corporate developments than higher rated securities. During an economic downturn or substantial period of rising interest rates, junk bond issuers and, in particular, highly leveraged issuers may experience financial stress that would adversely affect their ability to service their principal and interest payment obligations, to meet their projected business goals or to obtain additional financing. In the event of a default, the Portfolio may incur additional expenses to seek recovery. The secondary market for junk bonds may be less liquid than the markets for higher quality securities and, as such, may have an adverse effect on the market prices of certain securities.
Liquidity Risk. The Portfolio's investments in restricted and illiquid securities may entail greater risk than investments in publicly traded securities. These securities may be more difficult to sell, particularly in times of market turmoil. Illiquid securities may be more difficult to value. If the Portfolio is forced to sell an illiquid security to fund redemptions or for other cash needs, it may be forced to sell the security at a loss.
REITs. REITs generally derive their income from rents on the underlying properties or interest on the underlying loans, and their value is impacted by changes in the value of the underlying property or changes in interest rates affecting the underlying loans owned by the REITs. REITs are more susceptible to risks associated with the ownership of real estate and the real estate industry in general. These risks can include fluctuations in the value of underlying properties; defaults by borrowers or tenants; market saturation; changes in general and local economic conditions; decreases in market rates for rents; increases in competition, property taxes, capital expenditures or operating expenses; and other economic, political or regulatory occurrences affecting the real estate industry. In addition, REITs depend upon specialized management skills, may not be diversified (which may increase the volatility of a REIT's value), may have less trading volume and may be subject to more abrupt or erratic price movements than the overall securities market. Operating REITs requires specialized management skills and the Portfolio indirectly bears REIT management expenses along with the direct expenses of the Portfolio. REITs are not taxed on income distributed to shareholders provided they comply with several requirements of the Internal Revenue Code of 1986, as amended (the "Code"). REITs are subject to the risk of failing to qualify for tax-free pass-through of income under the Code.
Foreign and Emerging Market Securities. The Portfolio's investments in foreign securities involves risks that are in addition to the risks associated with domestic securities. One additional risk is currency risk. While the price of Portfolio shares is quoted in U.S. dollars, the Portfolio may convert U.S. dollars to a foreign market's local currency to purchase a security in that market. If the value of that local currency falls relative to the U.S. dollar, the U.S. dollar value of the foreign security will decrease. This is true even if the foreign security's local price remains unchanged.
Foreign securities also have risks related to economic and political developments abroad, including expropriations, confiscatory taxation, exchange control regulation, limitations on the use or transfer of Portfolio assets and any effects of foreign social, economic or political instability. Foreign companies, in general, are not subject to the regulatory requirements of U.S. companies and as such, there may be less publicly available information about these companies. Moreover, foreign accounting, auditing and financial reporting standards generally are different from those applicable to U.S. companies. Finally, in the event of a default of
VIS — The Strategist Portfolio
9
any foreign debt obligations, it may be more difficult for the Fund to obtain or enforce a judgment against the issuers of the securities.
Securities of foreign issuers may be less liquid than comparable securities of U.S. issuers and, as such, their price changes may be more volatile. In addition, the prices of such securities may be susceptible to influence by large traders, due to the limited size of many foreign securities markets. Moreover, investments in certain foreign markets, which have historically been considered stable, may become more volatile and subject to increased risk due to ongoing developments and changing conditions in such markets. Also, the growing interconnectivity of global economies and financial markets has increased probability that adverse developments and conditions in one country or region will affect the stability of economies and financial markets in other countries or regions. Furthermore, foreign exchanges and broker-dealers are generally subject to less government and exchange scrutiny and regulation than their U.S. counterparts. In addition, differences in clearance and settlement procedures in foreign markets may cause delays in settlement of the Portfolio's trades effected in those markets and could result in losses to the Portfolio due to subsequent declines in the value of the securities subject to the trades.
The foreign securities in which the Portfolio may invest may be issued by issuers located in emerging market or developing countries. Compared to the United States and other developed countries, emerging market or developing countries may have relatively unstable governments, economies based on only a few industries and securities markets that trade a small number of securities. Securities issued by issuers located in these countries tend to be especially volatile and may be less liquid than securities traded in developed countries. In the past, securities in these countries have been characterized by greater potential loss than securities of companies located in developed countries.
Investments in sovereign debt are subject to the risk that a government entity may delay or refuse to pay interest or repay principal on its sovereign debt. Some of these reasons may include cash flow problems, insufficient foreign currency reserves, political considerations, the relative size of its debt position to its economy or its failure to put in place economic reforms required by the International Monetary Fund or other multilateral agencies. If a government entity defaults, it may ask for more time in which to pay or for further loans. There is no legal process for collecting on a sovereign debt that a government does not pay or bankruptcy proceeding by which all or part of the sovereign debt that a government entity has not repaid may be collected.
Depositary receipts involve many of the same risks as those associated with direct investment in foreign securities. In addition, the underlying issuers of certain depositary receipts, particularly unsponsored or unregistered depositary receipts, are under no obligation to distribute shareholder communications to the holders of such receipts, or to pass through to them any voting rights with respect to the deposited securities.
In connection with its investments in foreign securities, the Portfolio also may enter into foreign currency forward exchange contracts. A foreign currency forward exchange contract is a negotiated agreement between the contracting parties to exchange a specified amount of currency at a specified future time at a specified rate. The rate can be higher or lower than the spot rate between the currencies that are the subject of the contract. Foreign currency forward exchange contracts may be used to protect against uncertainty in the level of future foreign currency exchange rates or to gain or modify exposure to a particular currency. In addition, the Portfolio may use cross currency hedging or proxy hedging with respect to currencies in which the Portfolio has or expects to have portfolio or currency exposure. Cross currency hedges involve the sale of one currency against the positive exposure to a different currency and may be used for hedging purposes or to establish an active exposure to the exchange rate between any two currencies. Hedging the Portfolio's currency risks involves the risk of mismatching the Portfolio's objectives under a foreign currency forward exchange or futures contract with the value of securities denominated in a particular currency. Furthermore, such transactions reduce or preclude the opportunity for gain if the value of the currency should move in the direction opposite to the position taken. There is an additional risk to the effect that currency contracts create exposure to currencies in which the Portfolio's securities are not denominated. Unanticipated changes in currency prices may result in poorer overall performance for the Portfolio than if it had not entered into such contracts. The use of foreign currency forward
VIS — The Strategist Portfolio
10
exchange contracts involves the risk of loss from the insolvency or bankruptcy of the counterparty to the contract or the failure of the counterparty to make payments or otherwise comply with the terms of the contract.
Derivatives. A derivative instrument often has risks similar to its underlying asset and may have additional risks, including imperfect correlation between the value of the derivative and the underlying asset, risks of default by the counterparty to certain transactions, magnification of losses incurred due to changes in the market value of the securities, instruments, indices or interest rates to which they relate, and risks that the transactions may not be liquid. The use of derivatives involves risks that are different from, and possibly greater than, the risks associated with other portfolio investments. Derivatives may involve the use of highly specialized instruments that require investment techniques and risk analyses different from those associated with other portfolio investments.
Certain derivative transactions may give rise to a form of leverage. Leverage magnifies the potential for gain and the risk of loss. Leverage associated with derivative transactions may cause the Portfolio to liquidate portfolio positions when it may not be advantageous to do so to satisfy its obligations or to meet earmarking or segregation requirements, pursuant to applicable SEC rules and regulations, or may cause the Portfolio to be more volatile than if the Portfolio had not been leveraged. Although the Adviser seeks to use derivatives to further the Portfolio's investment objective, there is no assurance that the use of derivatives will achieve this result.
The derivative instruments and techniques that the Portfolio may principally use include:
Futures. A futures contract is a standardized, exchange-traded agreement to buy or sell a specific quantity of an underlying instrument at a specific price at a specific future time. The value of a futures contract tends to increase and decrease in tandem with the value of the underlying instrument. Depending on the terms of the particular contract, futures contracts are settled through either physical delivery of the underlying instrument on the settlement date or by payment of a cash settlement amount on the settlement date. A decision as to whether, when and how to use futures involves the exercise of skill and judgment and even a well-conceived futures transaction may be unsuccessful because of market behavior or unexpected events. In addition to the derivatives risks discussed above, the prices of futures can be highly volatile, using futures can lower total return, and the potential loss from futures can exceed the Portfolio's initial investment in such contracts.
Options. If the Portfolio buys an option, it buys a legal contract giving it the right to buy or sell a specific amount of the underlying instrument or futures contract on the underlying instrument at an agreed-upon price typically in exchange for a premium paid by the Portfolio. If the Portfolio sells an option, it sells to another person the right to buy from or sell to the Portfolio a specific amount of the underlying instrument or futures contract on the underlying instrument at an agreed-upon price typically in exchange for a premium received by the Portfolio. A decision as to whether, when and how to use options involves the exercise of skill and judgment and even a well-conceived option transaction may be unsuccessful because of market behavior or unexpected events. The prices of options can be highly volatile and the use of options can lower total returns.
Swaps. An over-the-counter ("OTC") swap contract is an agreement between two parties pursuant to which the parties exchange payments at specified dates on the basis of a specified notional amount, with the payments calculated by reference to specified securities, indices, reference rates, currencies or other instruments. A small percentage of swap contracts are cleared through a central clearinghouse. Most swap agreements provide that when the period payment dates for both parties are the same, the payments are made on a net basis (i.e., the two payment streams are netted out, with only the net amount paid by one party to the other). The Portfolio's obligations or rights under a swap contract entered into on a net basis will generally be equal only to the net amount to be paid or received under the agreement, based on the relative values of the positions held by each counterparty. Most swap agreements are generally not entered into or traded on exchanges and often there is no central clearing or guaranty function for swaps. Therefore, these OTC swaps are generally subject to credit risk or the risk of default or non-performance by the counterparty. Swaps could result in losses if interest rate or foreign currency exchange rates or credit quality changes are not correctly anticipated by the Portfolio or if the reference index, security or investments do not perform as expected. The Portfolio's use of swaps may include those based on the credit of an underlying security and commonly referred to as "credit default swaps." Where the Portfolio is the buyer of a credit default swap contract, it would be entitled to receive the par (or other
VIS — The Strategist Portfolio
11
agreed-upon) value of a referenced debt obligation from the counterparty to the contract only in the event of a default by a third party on the debt obligation. If no default occurs, the Portfolio would have paid to the counterparty a periodic stream of payments over the term of the contract and received no benefit from the contract. When the Portfolio is the seller of a credit default swap contract, it receives the stream of payments but is obligated to pay an amount equal to the par (or other agreed-upon) value of a referenced debt obligation upon the default of that referenced debt obligation.
Structured Investments. The Portfolio also may invest a portion of its assets in structured investments. A structured investment is a derivative security designed to offer a return linked to a particular underlying security, currency or market. Structured investments may come in various forms including notes, warrants and options to purchase securities. The Portfolio will typically use structured investments to gain exposure to a permitted underlying security, currency or market when direct access to a market is limited or inefficient from a tax or cost standpoint. Investments in structured investments involve risks including issuer risk, counterparty risk and market risk. Holders of structured investments bear risks of the underlying investment and are subject to issuer or counterparty risk because the Portfolio is relying on the creditworthiness of such issuer or counterparty and has no rights with respect to the issuer of the underlying investment. Certain structured investments may be thinly traded or have a limited trading market and may have the effect of increasing the Portfolio's illiquidity to the extent that the Portfolio, at a particular point in time, may be unable to find qualified buyers for these securities.
Other Risks. The performance of the Portfolio also will depend on whether or not the Adviser is successful in applying the Portfolio's investment strategies. The Portfolio is also subject to other risks from its permissible investments, including the risks associated with its investments in ETFs, asset-backed securities and municipal securities. For more information about these risks, see the "Additional Risk Information" section.
ADDITIONAL RISK INFORMATION
This section provides additional information relating to the risks of investing in the Portfolio.
Exchange-Traded Funds. Shares of ETFs have many of the same risks as direct investments in common stocks or bonds. In addition, their market value is expected to rise and fall as the value of the underlying index or bonds rises and falls. The market value of their shares may differ from the net asset value of the particular fund. If the Portfolio invests in shares of ETFs it would, in addition to its own expenses, indirectly bear its ratable share of the ETF's expenses (e.g., advisory or administrative fees). In addition, the Portfolio would have increased market exposure to those companies held in its portfolio that are also held by the ETF. Certain ETFs involve leverage, which may magnify the gains or losses realized from their underlying investments.
Asset-Backed Securities. Asset-backed securities involve the risk that various federal and state consumer laws and other legal and economic factors may result in the collateral backing the securities being insufficient to support payment on the securities. Asset-backed securities also have risk characteristics similar to mortgage-backed securities. Like mortgage-backed securities, they generally decrease in value as a result of interest rate increases, but may benefit less than other fixed-income securities from declining interest rates, principally because of prepayments. Also, as in the case of mortgage-backed securities, prepayments generally increase during a period of declining interest rates, although other factors, such as changes in credit use and payment patterns, may also influence prepayment rates.
Municipal Securities. Municipal securities may be general obligations or revenue bonds. General obligation securities are secured by the issuer's full faith and credit as well as its taxing power for payment of principal or interest. Revenue bonds are payable solely from the revenues derived from a specified revenue source. These bonds involve the risk that the revenues so derived will not be sufficient to meet interest and/or principal payment obligations. Municipal securities involve the risk that an issuer may call securities for redemption, which could force the Portfolio to reinvest the proceeds at a lower rate of interest.
Issuance of Build America Bonds ceased on December 31, 2010. The number of Build America Bonds available in the market will be limited, which may negatively affect the value of the Build America Bonds.
VIS — The Strategist Portfolio
12
PORTFOLIO MANAGEMENT
The Fund has retained the Adviser—Morgan Stanley Investment Management Inc.—to provide investment advisory services. The Adviser is a wholly-owned subsidiary of Morgan Stanley, a preeminent global financial services firm engaged in securities trading and brokerage activities, as well as providing investment banking, research and analysis, financing and financial advisory services. The Adviser's address is 522 Fifth Avenue, New York, NY 10036.
The Portfolio is managed by members of the Global Asset Allocation and the Taxable Fixed Income teams. The teams consist of portfolio managers and analysts. Current members of the teams jointly and primarily responsible for the day-to-day management of the Portfolio are Mark A. Bavoso, Jaidip Singh and Neil Stone.
Mr. Bavoso has been associated with the Adviser in an investment management capacity since 1986. Mr. Singh has been associated with the Adviser in an investment management capacity since 1996. Mr. Stone has been associated with the Adviser in an investment management capacity since 1995.
Mr. Bavoso is the lead manager of the Portfolio. Messrs. Singh and Stone are responsible for specific sectors and for the day-to-day management of the fixed-income portion of the Portfolio. All team members collaborate to manage the assets of the Portfolio.
The Fund's Statement of Additional Information ("SAI") provides additional information about the portfolio managers' compensation structure, other accounts managed by the portfolio managers and the portfolio managers' ownership of securities in the Portfolio.
The composition of the teams may change from time to time.
The Portfolio pays the Adviser a monthly advisory fee as full compensation for the services and facilities furnished to the Portfolio, and for Portfolio expenses assumed by the Adviser. The fee is based on the Portfolio's average daily net assets. For the fiscal year ended December 31, 2011, the Portfolio paid total investment advisory compensation amounting to 0.40% of the Portfolio's average daily net assets.
A discussion regarding the Board of Trustees' approval of the investment advisory agreement is available in the Fund's semiannual report to shareholders for the period ended June 30, 2011.
MORGAN STANLEY INVESTMENT MANAGEMENT INC.
The Adviser, together with its affiliated asset management companies, had approximately $287.4 billion in assets under management or supervision as of December 31, 2011.
VIS — The Strategist Portfolio
13
Shareholder Information
PURCHASES AND SALES OF PORTFOLIO SHARES
Shares are offered on each day that the New York Stock Exchange ("NYSE") is open for business. The Portfolio offers its shares only to insurance company separate accounts that insurance companies establish to fund variable life insurance and/or variable annuity contracts. An insurance company purchases or redeems shares of the Portfolio based on, among other things, the amount of net contract premiums or purchase payments allocated to a separate account investment division, transfers to or from a separate account investment division, contract loans and repayments, contract withdrawals and surrenders, and benefit payments. The contract prospectus describes how contract owners may allocate, transfer and withdraw amounts to and from separate accounts.
The Portfolio currently does not foresee any disadvantages to variable product contract owners arising out of the fact that the Portfolio offers its shares to separate accounts of various insurance companies that offer variable life insurance and/or variable annuity products. Nevertheless, the Board of Trustees that oversees the Portfolio intends to monitor events to identify any material irreconcilable conflicts that may arise due to these arrangements and to determine what action, if any, should be taken in response.
If the Adviser determines that it is in the best interest of the Portfolio not to pay redemption proceeds in cash, and subject to applicable agreements with life insurance companies and other qualified investors, the Portfolio may pay a portion or all of a redemption by distributing securities held by the Portfolio. Such in-kind securities may be illiquid and difficult or impossible to sell at a time and at a price that a shareholder would like. In addition, shareholders receiving distributions in-kind may incur brokerage costs when subsequently selling shares of those securities.
FREQUENT PURCHASES AND REDEMPTIONS OF SHARES
Frequent purchases and redemptions of shares pursuant to the instructions of insurance company contract owners are referred to as "market-timing" or "short-term trading" and may present risks for other contract owners with long-term interests in the Portfolio, which may include, among other things, dilution in the value of Portfolio shares indirectly held by contract owners with long-term interests in the Portfolio, interference with the efficient management of the Portfolio, increased brokerage and administrative costs, and forcing the Portfolio to hold excess levels of cash.
In addition, the Portfolio is subject to the risk that market-timers and/or short-term traders may take advantage of time zone differences between the foreign markets on which the Portfolio's securities trade and the time the Portfolio's net asset value is calculated ("time-zone arbitrage"). For example, a market-timer may submit instructions for the purchase of shares of the Portfolio based on events occurring after foreign market closing prices are established, but before the Portfolio's net asset value calculation, that are likely to result in higher prices in foreign markets the following day. The market-timer would submit instructions to redeem the Portfolio's shares the next day, when the Portfolio's share price would reflect the increased prices in foreign markets for a quick profit at the expense of contract owners or participants with long-term interests in the Portfolio.
Investments in other types of securities also may be susceptible to short-term trading strategies. These investments include securities that are, among other things, thinly traded, traded infrequently, or relatively illiquid, which have the risk that the current market price for the securities may not accurately reflect current market values. A contract owner may seek to engage in short-term trading to take advantage of these pricing differences (referred to as "price-arbitrage"). Investments in certain fixed-income securities, such as high yield bonds, may be adversely affected by price arbitrage trading strategies.
The Portfolio's policies with respect to valuing portfolio securities are described below in the "Pricing Portfolio Shares" section.
VIS — The Strategist Portfolio
14
The Fund's Board of Trustees has adopted policies and procedures to discourage frequent purchases and redemptions of Portfolio shares by Portfolio shareholders. Insurance companies generally do not provide specific contract owner transaction instructions to the Portfolio on an ongoing basis. Therefore, to some extent, the Portfolio relies on the insurance companies to monitor frequent short-term trading by contract owners. However, the Portfolio or the Distributor has entered into agreements with insurance companies whereby the insurance companies are required to provide certain contract owner identification and transaction information upon the Portfolio's request. The Portfolio may use this information to help identify and prevent market-timing activity in the Portfolio. There can be no assurance that the Portfolio will be able to identify or prevent all market-timing activity.
If the Portfolio identifies suspected market-timing activity, the insurance company will be contacted and asked to take steps to prevent further market-timing activity (e.g., sending warning letters or blocking frequent trading by underlying contract owners). Insurance companies may be prohibited by the terms of the underlying insurance contract from restricting short-term trading of mutual fund shares by contract owners, thereby limiting the ability of such insurance company to implement remedial steps to prevent market-timing activity in the Portfolio. If the insurance company is unwilling or unable to take remedial steps to discourage or prevent frequent trading, or does not take action promptly, certain contract owners may be able to engage in frequent trading to the detriment of contract owners with long-term interests in the Portfolio. If the insurance company refuses to take remedial action, or takes action that the Portfolio deems insufficient, a determination will be made whether it is appropriate to terminate the relationship with such insurance company.
PRICING PORTFOLIO SHARES
The price of Portfolio shares, called "net asset value," is based on the value of its portfolio securities.
The net asset value per share of the Portfolio is calculated once daily at the NYSE close (normally 4:00 p.m. Eastern time) on each day that the NYSE is open. Shares will not be priced on days that the NYSE is closed.
The value of the Portfolio's securities is based on the securities' market price when available. When a market price is not readily available, including circumstances under which the Adviser determines that a security's market price is not accurate, a portfolio security is valued at its fair value, as determined under procedures established by the Fund's Board of Trustees.
In addition, with respect to securities that primarily are listed on foreign exchanges, when an event occurs after the close of such exchanges that is likely to have changed the value of the securities (e.g., a percentage change in value of one or more U.S. securities indices in excess of specified thresholds), such securities will be valued at their fair value, as determined under procedures established by the Fund's Board of Trustees. Securities also may be fair valued in the event of a significant development affecting a country or region or an issuer-specific development, which is likely to have changed the value of the security. In these cases, the Portfolio's net asset value will reflect certain portfolio securities' fair value rather than their market price. Fair value pricing involves subjective judgment and it is possible that the fair value determined for a security is materially different than the value that could be realized upon the sale of that security. With respect to securities that are primarily listed on foreign exchanges, the value of the Portfolio's securities may change on days when shareholders will not be able to purchase or sell their shares.
To the extent the Portfolio invests in open-end management companies that are registered under the Investment Company Act of 1940, as amended, the Portfolio's net asset value is calculated based upon the net asset value of such funds. The prospectuses for such funds explain the circumstances under which they will use fair value pricing and its effects.
An exception to the general policy of using market prices concerns the Portfolio's short-term debt portfolio securities. Debt securities with remaining maturities of 60 days or less at the time of purchase are valued at amortized cost. However, if the cost does not reflect the securities' market value, these securities will be valued at their fair value.
VIS — The Strategist Portfolio
15
DISTRIBUTIONS
The Portfolio passes substantially all of its earnings from income and capital gains along to its investors as "distributions." The Portfolio earns income from stocks and interest from fixed-income investments. These amounts are passed along to the Portfolio shareholders as "income dividend distributions." The Portfolio realizes capital gains whenever it sells securities for a higher price than it paid for them. These amounts may be passed along as "capital gains distributions."
Dividends from net investment income and capital gains distributions, if any, are declared and paid at least once per year.
TAX CONSEQUENCES
For information concerning the federal income tax consequences to holders of the underlying variable annuity or variable life insurance contracts, see the accompanying contract prospectus.
PORTFOLIO HOLDINGS INFORMATION
A description of the Fund's policies and procedures with respect to the disclosure of the Portfolio's securities is available in the Fund's SAI.
ADDITIONAL INFORMATION
The Adviser and/or Distributor may pay compensation (out of their own funds and not as an expense of the Portfolio) to certain affiliated or unaffiliated broker-dealers or other financial intermediaries or service providers, including insurance companies and their affiliates, in connection with the sale, distribution, marketing or retention of Portfolio shares and/or shareholder servicing. Such compensation may be significant in amount and the prospect of receiving any such additional compensation may provide such affiliated or unaffiliated entities with an incentive to favor sales of shares of the Portfolio over other investment options. Any such payments will not change the net asset value or the price of the Portfolio's shares. For more information, please see the Fund's SAI.
VIS — The Strategist Portfolio
16
The financial highlights table is intended to help you understand the financial performance of the Portfolio's Class X shares for the past five years. Certain information reflects financial results for a single Portfolio share throughout each period. The total returns in the table represent the rate an investor would have earned or lost on an investment in the Portfolio (assuming reinvestment of all dividends and distributions). The ratio of expenses to average net assets listed in the table below is based on the average net assets of the Portfolio for each of the periods listed in the table. To the extent that the Portfolio's average net assets decrease over the Portfolio's next fiscal year, such expense ratios can be expected to increase, potentially significantly, because certain fixed costs will be spread over a smaller amount of assets.
The information for the fiscal year ended December 31, 2011 has been audited by Ernst & Young LLP, an independent registered public accounting firm, whose report, along with the Portfolio's financial statements, is incorporated by reference in the SAI from the Fund's annual report, which is available upon request. The financial highlights for each of the years in the four-year period ended December 31, 2010 have been audited by another independent registered public accounting firm.
Further information about the performance of the Portfolio is contained in its annual report to shareholders. See the accompanying contract prospectus for either the variable annuity or the variable life contract issued by your insurance company for a description of charges which are applicable thereto. These charges are not reflected in the financial highlights below. Inclusion of any of these charges would reduce the total return figures for all periods shown.
For the Year Ended December 31, | | 2011 | | 2010^ | | 2009^ | | 2008^ | | 2007^ | |
Selected Per Share Data: | |
Net asset value beginning of period | | $ | 12.96 | | | $ | 12.40 | | | $ | 10.60 | | | $ | 15.55 | | | $ | 16.53 | | |
Net investment income(a) | | | 0.18 | | | | 0.24 | | | | 0.16 | | | | 0.30 | | | | 0.46 | | |
Net realized and unrealized gain (loss) | | | (1.06 | ) | | | 0.59 | | | | 1.90 | | | | (3.76 | ) | | | 0.92 | | |
Total from investment operations | | | (0.88 | ) | | | 0.83 | | | | 2.06 | | | | (3.46 | ) | | | 1.38 | | |
Dividends to shareholders | | | (0.27 | ) | | | (0.20 | ) | | | (0.26 | ) | | | (0.10 | ) | | | (0.46 | ) | |
Distributions to shareholders | | | (1.41 | ) | | | (0.07 | ) | | | — | | | | (1.39 | ) | | | (1.90 | ) | |
Total dividends and distributions | | | (1.68 | ) | | | (0.27 | ) | | | (0.26 | ) | | | (1.49 | ) | | | (2.36 | ) | |
Net asset value end of period | | $ | 10.40 | | | $ | 12.96 | | | $ | 12.40 | | | $ | 10.60 | | | $ | 15.55 | | |
Total Return(b) | | | (7.96 | )% | | | 6.81 | % | | | 19.74 | % | | | (23.98 | )% | | | 8.63 | % | |
Ratio to Average Net Assets:(c) | |
Expenses | | | 0.59 | %(d) | | | 0.59 | %(d) | | | 0.55 | %(d) | | | 0.54 | %(d) | | | 0.54 | % | |
Net investment income | | | 1.52 | %(d) | | | 1.89 | %(d) | | | 1.41 | %(d) | | | 2.28 | %(d) | | | 2.84 | % | |
Rebate from Morgan Stanley affiliate | | | 0.02 | % | | | 0.02 | % | | | 0.03 | % | | | 0.02 | % | | | — | | |
Supplemental Data: | |
Net assets end of period (000's) | | $ | 97,169 | | | $ | 128,254 | | | $ | 137,731 | | | $ | 134,668 | | | $ | 217,265 | | |
Portfolio turnover rate | | | 121 | % | | | 119 | % | | | 96 | % | | | 52 | % | | | 34 | % | |
^ Beginning with the year ended December 31, 2011, the Fund was audited by Ernst & Young LLP. The previous years were audited by another independent registered public accounting firm.
(a) The per share amounts were computed using an average number of shares outstanding during the period.
(b) Calculated based on the net asset value as of the last business day of the period. Performance shown does not reflect fees and expenses imposed by your insurance company. If performance information included the effect of these additional charges, the total returns would be lower.
(c) Reflects overall Portfolio ratios for investment income and non-class specific expenses.
(d) The ratios reflect the rebate of certain Portfolio expenses in connection with investments in a Morgan Stanley affiliate during the period. The effect of the rebate on the ratios is disclosed in the above table as "Rebate from Morgan Stanley affiliate."
VIS — The Strategist Portfolio
17
Morgan Stanley Variable Investment Series

ADDITIONAL INFORMATION ABOUT THE PORTFOLIO'S INVESTMENTS is available in the Fund's Annual and Semiannual Reports to Shareholders. In the Fund's Annual Report, you will find a discussion of the market conditions and investment strategies that significantly affected the Portfolio's performance during its last fiscal year. The Fund's Statement of Additional Information also provides additional information about the Portfolio. The Statement of Additional Information is incorporated herein by reference (legally is part of this Prospectus). For a free copy of the Fund's Annual Report, Semiannual Report or Statement of Additional Information, to request information about the Portfolio or to make shareholder inquiries, please call toll-free (800) 869-NEWS. Free copies of these documents are also available from our Internet site at: www.morganstanley.com/im.

YOU ALSO MAY OBTAIN INFORMATION ABOUT THE FUND BY CALLING your Morgan Stanley Smith Barney Financial Advisor or by visiting our Internet site.

INFORMATION ABOUT THE FUND (including the Statement of Additional Information) can be viewed and copied at the SEC Public Reference Room in Washington, DC. Information about the Reference Room's operations may be obtained by calling the SEC at (202) 551-8090. Reports and other information about the Fund and the Portfolio are available on the EDGAR Database on the SEC's Internet site at: www.sec.gov, and copies of this information may be obtained, after paying a duplicating fee, by electronic request at the following E-mail address: publicinfo@sec.gov, or by writing to the Public Reference Section of the SEC, Washington, DC 20549-1520.
(THE FUND'S INVESTMENT COMPANY ACT FILE NO. IS 811-3692)
October 4, 2012
Supplement
SUPPLEMENT DATED OCTOBER 4, 2012 TO THE PROSPECTUS OF
MORGAN STANLEY VARIABLE INVESTMENT SERIES
THE STRATEGIST PORTFOLIO
CLASS X and CLASS Y
Dated April 30, 2012
The Board of Trustees (the "Board") of Morgan Stanley Variable Investment Series (the "Fund") approved an Agreement and Plan of Reorganization by and between the Fund, on behalf of its series Strategist Portfolio (the "Portfolio") and The Universal Institutional Funds, Inc., on behalf of its series Global Tactical Asset Allocation Portfolio ("Global Tactical Asset Allocation"), pursuant to which substantially all of the assets of the Portfolio would be combined with those of Global Tactical Asset Allocation and shareholders of the Portfolio would become shareholders of Global Tactical Asset Allocation, receiving shares of Global Tactical Asset Allocation equal to the value of their holdings in the Portfolio (the "Reorganization"). Each shareholder of the Portfolio would receive the Class of shares of Global Tactical Asset Allocation that corresponds to the Class of shares of the Portfolio currently held by that shareholder. The Reorganization is subject to the approval of shareholders of the Portfolio at a special meeting of shareholders scheduled to be held during the first quarter of 2013. A proxy statement formally detailing the proposal, the reasons for the Reorganization and information concerning Global Tactical Asset Allocation is expected to be distributed to shareholders of the Portfolio during the first quarter of 2013.
PLEASE RETAIN THIS SUPPLEMENT FOR FUTURE REFERENCE.
PROSPECTUS n APRIL 30, 2012

VARIABLE INVESTMENT SERIES
THE STRATEGIST PORTFOLIO
Class Y
Morgan Stanley Variable Investment Series is a mutual fund comprised of eight separate portfolios, each with its own distinct investment objective(s) and policies. In this Prospectus, shares of the Strategist Portfolio (the "Portfolio") are being offered.
Shares of the Portfolio are sold exclusively to certain life insurance companies in connection with particular variable life insurance and/or variable annuity contracts they issue. The insurance companies invest in shares of the Portfolio in accordance with instructions received from owners of variable life insurance or variable annuity contracts.
This Prospectus must be accompanied by a current prospectus for the variable life insurance and/or annuity contract issued by your insurance company.
The Securities and Exchange Commission ("SEC") has not approved or disapproved these securities or passed upon
the adequacy of this Prospectus. Any representation to the contrary is a criminal offense.
Contents
Portfolio Summary | | INVESTMENT OBJECTIVE | | | 1 | | |
| | FEES AND EXPENSES OF THE PORTFOLIO | | | 1 | | |
| | PORTFOLIO TURNOVER | | | 1 | | |
| | PRINCIPAL INVESTMENT STRATEGIES | | | 1 | | |
| | PRINCIPAL RISKS | | | 2 | | |
| | PAST PERFORMANCE | | | 3 | | |
| | ADVISER | | | 3 | | |
| | PURCHASE AND SALE OF PORTFOLIO SHARES | | | 3 | | |
| | TAX INFORMATION | | | 3 | | |
| | PAYMENTS TO BROKER-DEALERS AND OTHER FINANCIAL INTERMEDIARIES | | | 3 | | |
Portfolio Details | | ADDITIONAL INFORMATION ABOUT THE PORTFOLIO'S INVESTMENT OBJECTIVE,
STRATEGIES AND RISKS | | | 4 | | |
| | PORTFOLIO MANAGEMENT | | | 13 | | |
Shareholder Information | | PURCHASES AND SALES OF PORTFOLIO SHARES | | | 14 | | |
| | FREQUENT PURCHASES AND REDEMPTIONS OF SHARES | | | 14 | | |
| | PRICING PORTFOLIO SHARES | | | 15 | | |
| | PLAN OF DISTRIBUTION | | | 16 | | |
| | DISTRIBUTIONS | | | 16 | | |
| | TAX CONSEQUENCES | | | 16 | | |
| | PORTFOLIO HOLDINGS INFORMATION | | | 16 | | |
| | ADDITIONAL INFORMATION | | | 16 | | |
Financial Highlights | | | | | 17 | | |
This Prospectus contains important information about the Strategist Portfolio and the Morgan Stanley Variable Investment Series. Please read it carefully and keep it for future reference.
Investment Objective
The Portfolio seeks high total investment return through a fully managed investment policy utilizing equity, fixed-income and money market securities and the writing of covered call and put options.
Fees and Expenses of the Portfolio
The table below describes the fees and expenses that you may pay if you buy and hold Class Y shares of the Portfolio. Total annual Portfolio operating expenses in the table and the Example below do not reflect the impact of any charges by your insurance company. If they did, expenses would be higher.
Annual Portfolio Operating Expenses
(expenses that you pay each year as a percentage of the value of your investment)
Advisory fee | | | 0.42 | % | |
Distribution and service (12b-1) fees | | | 0.25 | % | |
Other expenses | | | 0.19 | % | |
Total annual Portfolio operating expenses | | | 0.86 | % | |
Example
The example below is intended to help you compare the cost of investing in the Portfolio with the cost of investing in other mutual funds.
The example assumes that you invest $10,000 in the Portfolio, your investment has a 5% return each year, and the Portfolio's operating expenses remain the same. Although your actual costs may be higher or lower, based on these assumptions your costs would be:
| | | Expenses Over Time | |
| | | 1 Year | | 3 Years | | 5 Years | | 10 Years | |
| | | | | $ | 88 | | | $ | 274 | | | $ | 477 | | | $ | 1,061 | | |
Portfolio Turnover
The Portfolio pays transaction costs, such as commissions, when it buys and sells securities (or "turns over" its portfolio). A higher portfolio turnover rate may indicate higher transaction costs. These costs, which are not reflected in Total annual Portfolio operating expenses or in the Example, affect the Portfolio's performance. During the most recent fiscal year, the Portfolio's portfolio turnover rate was 121% of the average value of its portfolio.
Principal Investment Strategies
The Portfolio's "Adviser," Morgan Stanley Investment Management Inc., actively allocates the Portfolio's assets among the major asset categories of equity securities, fixed-income securities and money market instruments. The Adviser allocates the Portfolio's assets based on, among other things, its assessment of the effects of economic and market trends on different sectors of the market. There is no limit as to the percentage of assets that may be allocated to any one asset class.
Within the equity sector, the Adviser actively allocates funds to those economic sectors it expects to benefit from major trends and to individual stocks, which it considers to have superior investment potential. Equity securities in which the Portfolio may invest include, among others, common stocks, preferred stocks, depositary receipts, convertible securities and real estate investment trusts (commonly known as "REITs"). The Portfolio may invest in equity securities listed or traded outside of the United States, including in emerging market or developing countries.
Within the fixed-income sector of the market, the Adviser seeks to maximize the return on its investments by adjusting maturities and coupon rates as well as by exploiting yield differentials among different types of investment grade bonds and below investment grade bonds (known as "junk bonds"). Fixed-income securities in which the Portfolio may invest include debt securities such as corporate bonds and notes, U.S. government securities, convertible securities and mortgage-backed securities. The Portfolio may also invest in sovereign debt securities and corporate debt securities of issuers outside the United States, including governments of and issuers in emerging market or developing countries.
Certain of the securities in which the Portfolio may invest are mortgage-backed securities. The mortgage-backed securities in which the Portfolio may invest include mortgage pass-through securities, collateralized mortgage obligations ("CMOs"), stripped mortgage-backed securities ("SMBS") and inverse floating rate obligations ("inverse floaters"). In addition, the Portfolio may invest in to-be-announced pass-through mortgage securities, which settle on a delayed delivery basis ("TBAs"). The Portfolio may also invest in restricted and illiquid securities.
Within the money market sector of the market, the Adviser seeks to maximize returns by exploiting spreads among short-term instruments.
VIS — The Strategist Portfolio
1
The Portfolio may, but it is not required to, use derivative instruments for a variety of purposes, including hedging, risk management, portfolio management or to earn income. The Portfolio's use of derivatives may involve the purchase and sale of derivative instruments such as options, futures, swaps, structured investments and other related instruments and techniques. The Portfolio may utilize foreign currency forward exchange contracts, which are also derivatives, in connection with its investments in foreign securities.
Principal Risks
There is no assurance that the Portfolio will achieve its investment objective and you can lose money investing in this Portfolio. The principal risks of investing in the Portfolio include:
• Common Stocks and Other Equity Securities. In general, common stock and other equity security values fluctuate, and sometimes widely fluctuate, in response to activities specific to the company as well as general market, economic and political conditions. To the extent that the Portfolio invests in convertible securities, and the convertible security's investment value is greater than its conversion value, its price will be likely to increase when interest rates fall and decrease when interest rates rise. If the conversion value exceeds the investment value, the price of the convertible security will tend to fluctuate directly with the price of the underlying equity security.
• Fixed-Income Securities. All fixed-income securities are subject to two types of risk: credit risk and interest rate risk. Credit risk refers to the possibility that the issuer of a security will be unable to make interest payments and/or repay the principal on its debt. When the general level of interest rates goes up, the prices of most fixed-income securities go down. When the general level of interest rates goes down, the prices of most fixed-income securities go up. Because the Fund is not limited as to the maturities of the fixed-income securities in which it may invest, a rise in the general level of interest rates may cause the price of the Fund's portfolio securities to fall substantially.
• U.S. Government Securities. With respect to U.S. government securities that are not backed by the full faith and credit of the U.S. Government, there is the risk that the U.S. Government will not provide financial support to such U.S. government agencies, instrumentalities or sponsored enterprises if it is not obligated to do so by law.
• Mortgage-Backed Securities. Mortgage-backed securities entail prepayment risk, which generally increases during a period of falling interest rates. Certain mortgage-backed securities may be more volatile and less liquid than other traditional types of debt securities. In addition, an unexpectedly high rate of defaults on the mortgages held by a mortgage pool may adversely affect the value of a mortgage-backed security and could result in losses to the Portfolio. The risk of such defaults is generally higher in the case of mortgage pools that include subprime mortgages.
• Liquidity Risk. The Portfolio's investments in restricted and illiquid securities may entail greater risk than investments in publicly traded securities. These securities may be more difficult
to sell, particularly in times of market turmoil. Illiquid securities may be more difficult to value. If the Portfolio is forced to sell an illiquid security to fund redemptions or for other cash needs, it may be forced to sell the security at a loss.
• Lower Rated Fixed-Income Securities ("Junk Bonds") The prices of these securities are likely to be more sensitive to adverse economic changes, resulting in increased volatility of market prices of these securities during periods of economic uncertainty, or adverse individual corporate developments, than higher rated securities. In addition, during an economic downturn or substantial period of rising interest rates, junk bond issuers and, in particular, highly leveraged issuers may experience financial stress.
• REITs. REITs are susceptible to risks associated with the ownership of real estate and the real estate industry in general. In addition, REITs depend on specialized management skills, may not be diversified, may have less trading volume and may be subject to more abrupt or erratic price movements than the overall securities market. Investments in REITs may involve duplication of management fees and certain other expenses.
• Foreign and Emerging Market Securities. Investments in foreign markets entail special risks such as currency, political, economic and market risks. There also may be greater market volatility, less reliable financial information, higher transaction and custody costs, decreased market liquidity and less government and exchange regulation associated with investments in foreign markets. In addition, investments in certain foreign markets, which have historically been considered stable, may become more volatile and subject to increased risk due to ongoing developments and changing conditions in such markets. Moreover, the growing interconnectivity of global economies and financial markets has increased probability that adverse developments and conditions in one country or region will affect the stability of economies and financial markets in other countries or regions. The risks of investing in emerging market countries are greater than risks associated with investments in foreign developed countries. In addition, the Portfolio's investments may be denominated in foreign currencies and therefore, changes in the value of a country's currency compared to the U.S. dollar may affect the value of the Portfolio's investments. Hedging the Portfolio's currency risks through foreign currency forward exchange contracts involves the risk of mismatching the Portfolio's objectives under a foreign currency forward exchange contract with the value of securities denominated in a particular currency. There is additional risk that such transactions reduce or preclude the opportunity for gain and that currency contracts create exposure to currencies in which the Portfolio's securities are not denominated. The use of foreign currency forward exchange contracts involves the risk of loss from the insolvency or bankruptcy of the counterparty to the contract or the failure of the counterparty to make payments or otherwise comply with the terms of the contract.
• Derivatives. A derivative instrument often has risks similar to its underlying instrument and may have additional risks, including
VIS — The Strategist Portfolio
2
imperfect correlation between the value of the derivative and the underlying instrument, risks of default by the counterparty to certain transactions, magnification of losses incurred due to changes in the market value of the securities, instruments, indices or interest rates to which they relate, and risks that the transactions may not be liquid. Certain derivative transactions may give rise to a form of leverage. Leverage magnifies the potential for gain and the risk of loss.
Shares of the Portfolio are not bank deposits and are not guaranteed or insured by the Federal Deposit Insurance Corporation or any other government agency.
Past Performance
The bar chart and table below provide some indication of the risks of investing in the Portfolio by showing changes in the performance of the Portfolio's Class Y shares from year to year and by showing how the average annual returns of the Portfolio's Class Y shares for the one, five and 10 year periods compare with those of broad measures of market performance over time. This performance information does not include the impact of any charges deducted by your insurance company. If it did, returns would be lower. The Portfolio's past performance does not indicate how the Portfolio will perform in the future.
Annual Total Returns—Calendar Years

High Quarter 6/30/03: 12.75%
Low Quarter 12/31/08: –13.23%
Average Annual Total Returns For Periods Ended December 31, 2011
| | | Past
1 Year | | Past
5 Years | | Past
10 Years | |
Strategist Portfolio | | | –8.13 | % | | | –0.81 | % | | | 4.02 | % | |
S&P 500® Index
(reflects no deduction for
fees, expenses, or taxes)1 | | | 2.11 | % | | | –0.25 | % | | | 2.92 | % | |
Barclays Capital U.S. Government/
Credit Index (reflects no deduction
for fees, expenses, or taxes)2 | | | 8.74 | % | | | 6.55 | % | | | 5.85 | % | |
(1) The Standard & Poor's 500® Index (S&P 500®) measures the performance of the large cap segment of the U.S. equities market, covering approximately 75% of the U.S. equities market. The Index includes 500 leading companies in leading industries of the U.S. economy. It is not possible to invest directly in an index.
(2) The Barclays Capital U.S. Government/Credit Index tracks the performance of government and corporate obligations, including U.S. government agency and Treasury securities and corporate and Yankee bonds. It is not possible to invest directly in an index.
Adviser
Adviser. Morgan Stanley Investment Management Inc.
Portfolio Managers. The Portfolio is managed by members of the Global Asset Allocation and the Taxable Fixed Income teams. Information about the members jointly and primarily responsible for the day-to-day management of the Portfolio is shown below:
Name | | Title with Adviser | | Date Began
Managing Portfolio | |
Mark A. Bavoso | | Managing Director | | September 1995 | |
Jaidip Singh | | Executive Director | | January 2012 | |
Neil Stone | | Managing Director | | January 2012 | |
Purchase and Sale of Portfolio Shares
This Prospectus offers Class Y shares of the Strategist Portfolio. The Portfolio also offers Class X shares of the Portfolio through a separate prospectus. Class X shares are subject to different expenses. For eligibility information, contact your insurance company.
Portfolio shares will be sold at the next price calculated after we receive the redemption request on your behalf.
The Portfolio offers its shares only to insurance companies' separate accounts that insurance companies establish to fund variable life insurance and/or variable annuity contracts. An insurance company purchases or redeems shares of the Portfolio based on, among other things, the amount of net contract premiums or purchase payments allocated to a separate account investment division, transfers to or from a separate account investment division, contract loans and repayments, contract withdrawals and surrenders, and benefit payments. The contract prospectus describes how contract owners may allocate, transfer and withdraw amounts to, and from, separate accounts.
For more information, please refer to the "Shareholder Information—Purchases and Sales of Portfolio Shares" section of this Prospectus.
Tax Information
Special tax rules apply to life insurance companies, variable annuity contracts and variable life insurance contracts. For information on federal income taxation of a life insurance company with respect to its receipt of distributions from the Portfolio and federal income taxation of owners of variable annuity or variable life insurance contracts, see the accompanying contract prospectus.
Payments to Broker-Dealers and
Other Financial Intermediaries
If you purchase the Portfolio through an insurance company or other financial intermediary (such as a bank), the Adviser and/or the Portfolio's "Distributor," Morgan Stanley Distribution, Inc., may pay the intermediary for the sale of Portfolio shares and related services. These payments, which may be significant in amount, may create a conflict of interest by influencing the insurance company or other intermediary and your salesperson to recommend the Portfolio over another investment. Ask your salesperson or visit your financial intermediary's web site for more information.
VIS — The Strategist Portfolio
3
Portfolio Details
ADDITIONAL INFORMATION ABOUT THE PORTFOLIO'S INVESTMENT OBJECTIVE, STRATEGIES AND RISKS
INVESTMENT OBJECTIVE
The Portfolio seeks high total investment return through a fully managed investment policy utilizing equity, fixed-income and money market securities and the writing of covered call and put options.
TOTAL RETURN
An investment objective having the goal of selecting securities with the potential to rise in price and pay out income.
PRINCIPAL INVESTMENT STRATEGIES
The Adviser actively allocates the Portfolio's assets among the major asset categories of equity securities, fixed-income securities and money market instruments. In determining which securities to buy, hold or sell for the Portfolio, the Adviser allocates the Portfolio's assets based on, among other things, its assessment of the effects of economic and market trends on different sectors of the market. There is no limit as to the percentage of assets that may be allocated to any one asset class.
Within the equity sector, the Adviser actively allocates funds to those economic sectors it expects to benefit from major trends and to individual stocks, which it considers to have superior investment potential. Equity securities in which the Portfolio may invest include common stocks, preferred stocks, depositary receipts, convertible securities and REITs. The Portfolio may invest in equity securities listed or traded outside of the United States, including in emerging market or developing countries.
Common stock is a share ownership or equity interest in a corporation. It may or may not pay dividends, as some companies reinvest all of their profits back into their businesses, while others pay out some of their profits to shareholders as dividends. A depositary receipt is generally issued by a bank or financial institution and represents an ownership interest in the common stock or other equity securities of a foreign company. REITs pool investors' funds for investments primarily in real estate properties and real estate-related loans. They may also include, among other businesses, real estate developers, brokers and operating companies whose products and services are significantly related to the real estate industry such as building suppliers and mortgage lenders.
Within the fixed-income sector of the market, the Adviser seeks to maximize the return on its investments by adjusting maturities and coupon rates as well as by exploiting yield differentials among different types of investment grade bonds. Fixed-income securities in which the Portfolio may invest include debt securities such as corporate bonds and notes, U.S. government securities, convertible securities and mortgage-backed securities (including CMOs, SMBS, inverse floaters and TBAs). The Portfolio may also invest in debt securities issued by governments other than the United States (sovereign debt securities) as well as by corporate issuers outside the United States, including governments of and issuers in emerging market or developing countries. The Portfolio will invest no more than 30% of its net assets in fixed-income securities denominated in currencies other than the U.S. dollar. The Portfolio is not limited as to the maturities of the U.S. government securities and other debt securities in which it may invest.
VIS — The Strategist Portfolio
4
The issuer of the debt security borrows money from the investor who buys the security. Most debt securities pay either fixed or adjustable rates of interest at regular intervals until they mature, at which point investors get their principal back. The Portfolio's fixed-income investments may include zero coupon securities, which are purchased at a discount and generally accrue interest, but make no payments until maturity. The Portfolio may invest up to 20% of its net assets in debt securities rated below investment grade by Moody's Investors Service, Inc. or Standard & Poor's Ratings Services, a division of The McGraw-Hill Companies, Inc., or, if not rated, determined to be of comparable quality by the Adviser. Securities rated below investment grade are commonly known as "junk bonds."
Mortgage-Backed Securities. One type of mortgage-backed security in which the Portfolio may invest is a mortgage pass-through security. These securities represent a participation interest in a pool of mortgage loans originated by U.S. Governmental or private lenders such as banks. They differ from conventional debt securities, which provide for periodic payment of interest in fixed amounts and principal payments at maturity or on specified call dates. Mortgage pass-through securities provide for monthly payments that are a "pass-through" of the monthly interest and principal payments made by the individual borrowers on the pooled mortgage loans. Mortgage pass-through securities may be collateralized by mortgages with fixed rates of interest or adjustable rates. In addition, the Portfolio may invest in TBAs, which are mortgage derivatives that settle on a delayed delivery basis.
Collateralized Mortgage Obligations. CMOs are debt obligations collateralized by mortgage loans or mortgage pass-through securities ("Mortgage Assets"). Payments of principal and interest on the Mortgage Assets and any reinvestment income are used to make payments on the CMOs. CMOs are issued in multiple classes. Each class has a fixed or floating coupon rate and a stated maturity or final distribution date. The principal and interest on the Mortgage Assets may be allocated among the classes in a number of different ways. Certain classes will, as a result of the allocation, have more predictable cash flows than others. As a general matter, the more predictable the cash flow, the lower the yield relative to other Mortgage Assets. The less predictable the cash flow, the higher the yield and the greater the risk. The Portfolio may invest in any class of CMOs.
Stripped Mortgage-Backed Securities. SMBS are derivative multi-class mortgage securities. SMBS may be issued by agencies or instrumentalities of the U.S. Government, or by private originators. A common type of SMBS will have one class receiving some of the interest and most of the principal from the Mortgage Assets, while the other class receives most of the interest and the remainder of the principal. In the most extreme case, one class will receive all of the interest (the interest-only or "IO" class), while the other class will receive all of the principal (the principal-only or "PO" class).
Inverse Floaters. Inverse floating rate obligations are obligations which pay interest at rates that vary inversely with changes in market rates of interest. Because the interest rate paid to holders of such obligations is generally determined by subtracting a variable or floating rate from a predetermined amount, the interest rate paid to holders of such obligations will decrease as such variable or floating rate increases and increase as such variable or floating rate decreases.
Restricted and Illiquid Securities. The Portfolio may purchase certain non-publicly traded "restricted" securities. These securities may include "Rule 144A" securities which are exempt from registration and that may only be resold to qualified institutional buyers and other restricted securities. The Portfolio may invest up to 15% of its net assets in illiquid securities, including restricted securities that are illiquid. The Portfolio may invest an unlimited amount in restricted securities that are considered by the Adviser to be liquid.
Within the money market sector of the market, the Adviser seeks to maximize returns by exploiting spreads among short-term instruments.
Derivatives. The Portfolio may, but it is not required to, use derivative instruments for a variety of purposes, including hedging, risk management, portfolio management or to earn income. Derivatives are financial instruments whose value is based on the value of an underlying asset, interest rate, index or financial instrument. The Portfolio's use of derivatives may involve the
VIS — The Strategist Portfolio
5
purchase and sale of derivative instruments such as options, futures, swaps, structured investments and other related instruments and techniques. The Portfolio may also use foreign currency forward exchange contracts, which are also derivatives, in connection with its investments in foreign securities.
In pursuing the Portfolio's investment objective, the Adviser has considerable leeway in deciding which investments it buys, holds or sells on a day-to-day basis and which trading strategies it uses. For example, the Adviser in its discretion may determine to use some permitted trading strategies while not using others.
ADDITIONAL INVESTMENT STRATEGY INFORMATION
This section provides additional information relating to the Portfolio's investment strategies.
Exchange-Traded Funds ("ETFs"). The Portfolio may invest in shares of various ETFs that seek to track the performance of various portions or segments of the equity and bond markets. No more than 5% of the Portfolio's net assets will be invested in any one ETF. Certain of the ETFs in which the Portfolio may invest may be leveraged.
Asset-Backed Securities. Asset-backed securities represent an interest in a pool of assets such as, but not limited to, automobile loans, credit card receivables, student loans or home equity (prime and subprime) loans that have been securitized in pass-through structures similar to mortgage-backed securities. These types of pass-through securities provide for monthly payments that are a "pass-through" of the monthly interest and principal payments made by the individual borrowers on the pooled receivables.
Municipal Securities. The Portfolio may invest in municipal securities, which may include Build America Bonds. Municipal securities are fixed-income securities issued by local, state and regional governments that provide interest income, which is exempt from federal income taxes. However, the Portfolio may purchase municipal bonds that pay interest that is subject to the federal alternative minimum tax, and securities on which the interest payments are taxable. General obligation securities are secured by the issuer's faith and credit including its taxing power for payment of principal and interest. Revenue bonds, however, are generally payable from a specific revenue source. They are issued for a wide variety of projects such as financing public utilities, hospitals, housing, airports, highways and educational facilities. Municipal notes are issued to meet the short-term funding requirements of local, regional and state governments. Build America Bonds are taxable municipal securities on which the issuer receives federal support of the interest paid. Assuming certain specified conditions are satisfied, issuers of Build America Bonds may either (i) receive reimbursement from the U.S. Treasury with respect to a portion of its interest payments on the bonds ("direct pay" Build America Bonds) or (ii) provide tax credits to investors in the bonds ("tax credit" Build America Bonds). Unlike most other municipal securities, interest received on Build America Bonds is subject to federal and state income tax.
Defensive Investing. The Portfolio may take temporary "defensive" positions in attempting to respond to adverse market conditions. The Portfolio may invest any amount of its assets in cash or money market instruments in a defensive posture that may be inconsistent with its principal investment strategies when the Adviser believes it advisable to do so.
Although taking a defensive posture is designed to protect the Portfolio from an anticipated market downturn, it could have the effect of reducing the benefit from any upswing in the market. When the Portfolio takes a defensive position, it may not achieve its investment objective.
* * *
The percentage limitations relating to the composition of the Portfolio apply at the time the Portfolio acquires an investment. Subsequent percentage changes that result from market fluctuations generally will not require the Portfolio to sell any portfolio security. However, the Portfolio may be required to reduce its borrowings, if any, in response to fluctuations in the value of such holdings. The Portfolio may change its principal investment strategies without shareholder approval; however, you would be notified of any changes.
VIS — The Strategist Portfolio
6
PRINCIPAL RISKS
There is no assurance that the Portfolio will achieve its investment objective. The Portfolio's share price and return will fluctuate with changes in the market value of its portfolio securities. When you sell Portfolio shares, they may be worth less than what you paid for them and, accordingly, you can lose money investing in this Portfolio.
Common Stocks and Other Equity Securities. A principal risk of investing in the Portfolio is associated with its common stock and other equity investments. In general, common stock and other equity security prices fluctuate in response to activities specific to the company as well as general market, economic and political conditions. These prices can fluctuate widely in response to these factors.
Investments in convertible securities may subject the Portfolio to the risks associated with both fixed-income securities and common stocks. To the extent that a convertible security's investment value is greater than its conversion value, its price will be likely to increase when interest rates fall and decrease when interest rates rise, as with a fixed-income security. If the conversion value exceeds the investment value, the price of the convertible security will tend to fluctuate directly with the price of the underlying equity security.
A portion of the Portfolio's investments in convertible securities may have speculative characteristics.
Fixed-Income Securities. Fixed-income securities are subject to two types of risk: credit risk and interest rate risk. Credit risk refers to the possibility that the issuer of a security will be unable to make interest payments and/or repay the principal on its debt. Interest rate risk refers to fluctuations in the value of a fixed-income security resulting from changes in the general level of interest rates. When the general level of interest rates goes up, the prices of most fixed-income securities go down. When the general level of interest rates goes down, the prices of most fixed-income securities go up. (Zero coupon securities are typically subject to greater price fluctuations than comparable securities that pay current interest.)
The Portfolio is not limited as to the maturities of the fixed-income securities in which it may invest. Thus, a rise in the general level of interest rates may cause the price of the Portfolio's portfolio securities to fall substantially. Securities rated below investment grade are commonly known as "junk bonds" and may have speculative credit risk characteristics.
U.S. Government Securities. The U.S. government securities that the Portfolio may purchase include U.S. Treasury bills, notes and bonds, all of which are direct obligations of the U.S. Government. In addition, the Portfolio may purchase securities issued by agencies and instrumentalities of the U.S. Government which are backed by the full faith and credit of the United States. Among the agencies and instrumentalities issuing these obligations are the Government National Mortgage Association ("Ginnie Mae") and the Federal Housing Administration. The Portfolio may also purchase securities issued by agencies and instrumentalities which are not backed by the full faith and credit of the U.S., but whose issuing agency or instrumentality has the right to borrow, to meet its obligations, from the U.S. Treasury. Among these agencies and instrumentalities are the Federal National Mortgage Association ("Fannie Mae"), the Federal Home Loan Mortgage Corporation ("Freddie Mac") and the Federal Home Loan Banks. In September 2008, the U.S. Treasury Department announced that the U.S. Government would be taking over Freddie Mac and Fannie Mae and placing the companies into a conservatorship. In addition, the U.S. Treasury announced additional steps that it intended to take with respect to the debt and mortgage-backed securities issued by Fannie Mae and Freddie Mac in order to support the conservatorship. No assurance can be given that these initiatives will be successful. Further, the Portfolio may purchase securities issued by agencies and instrumentalities, which are backed solely by the credit of the issuing agency or instrumentality. Among these agencies and instrumentalities is the Federal Farm Credit System. Because these securities are not backed by the full faith and credit of the U.S., there is a risk that the U.S. Government will not provide financial support to these agencies if it is not obligated to do so by law. The maximum potential liability of the issuers of some U.S. government securities held by the Fund may greatly exceed their current resources, including their legal right to support from the U.S. Treasury. It is possible that these issuers will not have the funds to meet their payment obligations in the future.
VIS — The Strategist Portfolio
7
Mortgage-Backed Securities. Mortgage-backed securities in which the Portfolio may invest have different risk characteristics than traditional debt securities. Although generally the value of fixed-income securities increases during periods of falling interest rates and decreases during periods of rising interest rates, this is not always the case with mortgage-backed securities. This is due to the fact that principal on underlying mortgages may be prepaid at any time as well as other factors. Generally, prepayments will increase during a period of falling interest rates and decrease during a period of rising interest rates. The rate of prepayments also may be influenced by economic and other factors. Prepayment risk includes the possibility that, as interest rates fall, securities with stated interest rates may have the principal prepaid earlier than expected, requiring the Portfolio to invest the proceeds at generally lower interest rates.
Investments in mortgage-backed securities are made based upon, among other things, expectations regarding the rate of prepayments on underlying mortgage pools. Rates of prepayment, faster or slower than expected by the Adviser, could reduce the Portfolio's yield, increase the volatility of the Portfolio and/or cause a decline in net asset value. Certain mortgage-backed securities, especially privately issued mortgage-backed securities, are more volatile and less liquid than other traditional types of securities.
To the extent the Portfolio invests in mortgage securities offered by non-governmental issuers, such as commercial banks, savings and loan institutions, private mortgage insurance companies, mortgage bankers and other secondary market issuers, the Portfolio may be subject to additional risks. Timely payment of interest and principal of non-governmental issuers are supported by various forms of private insurance or guarantees, including individual loan, title, pool and hazard insurance purchased by the issuer. There can be no assurance that the private insurers can meet their obligations under the policies. An unexpectedly high rate of defaults on the mortgages held by a mortgage pool may adversely affect the value of a mortgage-backed security and could result in losses to the Portfolio. The risk of such defaults is generally higher in the case of mortgage pools that include subprime mortgages. Subprime mortgages refer to loans made to borrowers with weakened credit histories or with a lower capacity to make timely payments on their mortgages.
In addition, the Portfolio may invest in TBAs. Investments in TBAs may give rise to a form of leverage. Leverage may cause the Portfolio to be more volatile than if the Portfolio had not been leveraged. Further, TBAs may cause the Portfolio's portfolio turnover rate to appear higher.
Collateralized Mortgage Obligations. The principal and interest on the Mortgage Assets comprising a CMO may be allocated among the several classes of a CMO in many ways. The general goal in allocating cash flows on Mortgage Assets to the various classes of a CMO is to create certain tranches on which the expected cash flows have a higher degree of predictability than do the underlying Mortgage Assets. As a general matter, the more predictable the cash flow is on a particular CMO tranche, the lower the anticipated yield on that tranche at the time of issue will be relative to the prevailing market yields on the Mortgage Assets. As part of the process of creating more predictable cash flows on certain tranches of a CMO, one or more tranches generally must be created that absorb most of the changes in the cash flows on the underlying Mortgage Assets. The yields on these tranches are generally higher than prevailing market yields on other mortgage-related securities with similar average lives. Principal prepayments on the underlying Mortgage Assets may cause the CMOs to be retired substantially earlier than their stated maturities or final distribution dates. Because of the uncertainty of the cash flows on these tranches, the market prices and yields of these tranches are more volatile and may increase or decrease in value substantially with changes in interest rates and/or rates of prepayment. Due to the possibility that prepayments (on home mortgages and other collateral) will alter the cash flow on CMOs, it is not possible to determine in advance the final maturity date or average life. Faster prepayment will shorten the average life and slower prepayments will lengthen it. In addition, if the collateral securing CMOs or any third party guarantees are insufficient to make payments, the Portfolio could sustain a loss.
Stripped Mortgage-Backed Securities. Investments in each class of SMBS are extremely sensitive to changes in interest rates. IOs tend to decrease in value substantially if interest rates decline and prepayment rates become more rapid. POs tend to decrease in value substantially if interest rates increase and the rate of prepayment decreases. If the Portfolio invests in SMBS
VIS — The Strategist Portfolio
8
and interest rates move in a manner not anticipated by Portfolio management, it is possible that the Portfolio could lose all or substantially all of its investment.
Inverse Floaters. Like most other fixed-income securities, the value of inverse floaters will decrease as interest rates increase. They are more volatile, however, than most other fixed-income securities because the coupon rate on an inverse floater typically changes at a multiple of the change in the relevant index rate. Thus, any rise in the index rate (as a consequence of an increase in interest rates) causes a correspondingly greater drop in the coupon rate of an inverse floater while a drop in the index rate causes a correspondingly greater increase in the coupon of an inverse floater. Some inverse floaters may also increase or decrease substantially because of changes in the rate of prepayments.
Lower Rated Fixed-Income Securities ("Junk Bonds"). The Portfolio's investments in fixed-income securities rated lower than investment grade, or if unrated, of comparable quality as determined by the Adviser, otherwise known as "junk bonds," pose significant risks. The prices of junk bonds are likely to be more sensitive to adverse economic changes or individual corporate developments than higher rated securities. During an economic downturn or substantial period of rising interest rates, junk bond issuers and, in particular, highly leveraged issuers may experience financial stress that would adversely affect their ability to service their principal and interest payment obligations, to meet their projected business goals or to obtain additional financing. In the event of a default, the Portfolio may incur additional expenses to seek recovery. The secondary market for junk bonds may be less liquid than the markets for higher quality securities and, as such, may have an adverse effect on the market prices of certain securities.
Liquidity Risk. The Portfolio's investments in restricted and illiquid securities may entail greater risk than investments in publicly traded securities. These securities may be more difficult to sell, particularly in times of market turmoil. Illiquid securities may be more difficult to value. If the Portfolio is forced to sell an illiquid security to fund redemptions or for other cash needs, it may be forced to sell the security at a loss.
REITs. REITs generally derive their income from rents on the underlying properties or interest on the underlying loans, and their value is impacted by changes in the value of the underlying property or changes in interest rates affecting the underlying loans owned by the REITs. REITs are more susceptible to risks associated with the ownership of real estate and the real estate industry in general. These risks can include fluctuations in the value of underlying properties; defaults by borrowers or tenants; market saturation; changes in general and local economic conditions; decreases in market rates for rents; increases in competition, property taxes, capital expenditures or operating expenses; and other economic, political or regulatory occurrences affecting the real estate industry. In addition, REITs depend upon specialized management skills, may not be diversified (which may increase the volatility of a REIT's value), may have less trading volume and may be subject to more abrupt or erratic price movements than the overall securities market. Operating REITs requires specialized management skills and the Portfolio indirectly bears REIT management expenses along with the direct expenses of the Portfolio. REITs are not taxed on income distributed to shareholders provided they comply with several requirements of the Internal Revenue Code of 1986, as amended (the "Code"). REITs are subject to the risk of failing to qualify for tax-free pass-through of income under the Code.
Foreign and Emerging Market Securities. The Portfolio's investments in foreign securities involves risks that are in addition to the risks associated with domestic securities. One additional risk is currency risk. While the price of Portfolio shares is quoted in U.S. dollars, the Portfolio may convert U.S. dollars to a foreign market's local currency to purchase a security in that market. If the value of that local currency falls relative to the U.S. dollar, the U.S. dollar value of the foreign security will decrease. This is true even if the foreign security's local price remains unchanged.
Foreign securities also have risks related to economic and political developments abroad, including expropriations, confiscatory taxation, exchange control regulation, limitations on the use or transfer of Portfolio assets and any effects of foreign social, economic or political instability. Foreign companies, in general, are not subject to the regulatory requirements of U.S. companies
VIS — The Strategist Portfolio
9
and as such, there may be less publicly available information about these companies. Moreover, foreign accounting, auditing and financial reporting standards generally are different from those applicable to U.S. companies. Finally, in the event of a default of any foreign debt obligations, it may be more difficult for the Fund to obtain or enforce a judgment against the issuers of the securities.
Securities of foreign issuers may be less liquid than comparable securities of U.S. issuers and, as such, their price changes may be more volatile. In addition, the prices of such securities may be susceptible to influence by large traders, due to the limited size of many foreign securities markets. Moreover, investments in certain foreign markets, which have historically been considered stable, may become more volatile and subject to increased risk due to ongoing developments and changing conditions in such markets. Also, the growing interconnectivity of global economies and financial markets has increased probability that adverse developments and conditions in one country or region will affect the stability of economies and financial markets in other countries or regions. Furthermore, foreign exchanges and broker-dealers are generally subject to less government and exchange scrutiny and regulation than their U.S. counterparts. In addition, differences in clearance and settlement procedures in foreign markets may cause delays in settlement of the Portfolio's trades effected in those markets and could result in losses to the Portfolio due to subsequent declines in the value of the securities subject to the trades.
The foreign securities in which the Portfolio may invest may be issued by issuers located in emerging market or developing countries. Compared to the United States and other developed countries, emerging market or developing countries may have relatively unstable governments, economies based on only a few industries and securities markets that trade a small number of securities. Securities issued by issuers located in these countries tend to be especially volatile and may be less liquid than securities traded in developed countries. In the past, securities in these countries have been characterized by greater potential loss than securities of companies located in developed countries.
Investments in sovereign debt are subject to the risk that a government entity may delay or refuse to pay interest or repay principal on its sovereign debt. Some of these reasons may include cash flow problems, insufficient foreign currency reserves, political considerations, the relative size of its debt position to its economy or its failure to put in place economic reforms required by the International Monetary Fund or other multilateral agencies. If a government entity defaults, it may ask for more time in which to pay or for further loans. There is no legal process for collecting on a sovereign debt that a government does not pay or bankruptcy proceeding by which all or part of the sovereign debt that a government entity has not repaid may be collected.
Depositary receipts involve many of the same risks as those associated with direct investment in foreign securities. In addition, the underlying issuers of certain depositary receipts, particularly unsponsored or unregistered depositary receipts, are under no obligation to distribute shareholder communications to the holders of such receipts, or to pass through to them any voting rights with respect to the deposited securities.
In connection with its investments in foreign securities, the Portfolio also may enter into foreign currency forward exchange contracts. A foreign currency forward exchange contract is a negotiated agreement between the contracting parties to exchange a specified amount of currency at a specified future time at a specified rate. The rate can be higher or lower than the spot rate between the currencies that are the subject of the contract. Foreign currency forward exchange contracts may be used to protect against uncertainty in the level of future foreign currency exchange rates or to gain or modify exposure to a particular currency. In addition, the Portfolio may use cross currency hedging or proxy hedging with respect to currencies in which the Portfolio has or expects to have portfolio or currency exposure. Cross currency hedges involve the sale of one currency against the positive exposure to a different currency and may be used for hedging purposes or to establish an active exposure to the exchange rate between any two currencies. Hedging the Portfolio's currency risks involves the risk of mismatching the Portfolio's objectives under a foreign currency forward exchange or futures contract with the value of securities denominated in a particular currency. Furthermore, such transactions reduce or preclude the opportunity for gain if the value of the currency should move in the direction opposite to the position taken. There is an additional risk to the effect that currency contracts create exposure to currencies in which the Portfolio's securities are not denominated. Unanticipated changes in currency prices may result in poorer
VIS — The Strategist Portfolio
10
overall performance for the Portfolio than if it had not entered into such contracts. The use of foreign currency forward exchange contracts involves the risk of loss from the insolvency or bankruptcy of the counterparty to the contract or the failure of the counterparty to make payments or otherwise comply with the terms of the contract.
Derivatives. A derivative instrument often has risks similar to its underlying asset and may have additional risks, including imperfect correlation between the value of the derivative and the underlying asset, risks of default by the counterparty to certain transactions, magnification of losses incurred due to changes in the market value of the securities, instruments, indices or interest rates to which they relate, and risks that the transactions may not be liquid. The use of derivatives involves risks that are different from, and possibly greater than, the risks associated with other portfolio investments. Derivatives may involve the use of highly specialized instruments that require investment techniques and risk analyses different from those associated with other portfolio investments.
Certain derivative transactions may give rise to a form of leverage. Leverage magnifies the potential for gain and the risk of loss. Leverage associated with derivative transactions may cause the Portfolio to liquidate portfolio positions when it may not be advantageous to do so to satisfy its obligations or to meet earmarking or segregation requirements, pursuant to applicable SEC rules and regulations, or may cause the Portfolio to be more volatile than if the Portfolio had not been leveraged. Although the Adviser seeks to use derivatives to further the Portfolio's investment objective, there is no assurance that the use of derivatives will achieve this result.
The derivative instruments and techniques that the Portfolio may principally use include:
Futures. A futures contract is a standardized, exchange-traded agreement to buy or sell a specific quantity of an underlying instrument at a specific price at a specific future time. The value of a futures contract tends to increase and decrease in tandem with the value of the underlying instrument. Depending on the terms of the particular contract, futures contracts are settled through either physical delivery of the underlying instrument on the settlement date or by payment of a cash settlement amount on the settlement date. A decision as to whether, when and how to use futures involves the exercise of skill and judgment and even a well-conceived futures transaction may be unsuccessful because of market behavior or unexpected events. In addition to the derivatives risks discussed above, the prices of futures can be highly volatile, using futures can lower total return, and the potential loss from futures can exceed the Portfolio's initial investment in such contracts.
Options. If the Portfolio buys an option, it buys a legal contract giving it the right to buy or sell a specific amount of the underlying instrument or futures contract on the underlying instrument at an agreed-upon price typically in exchange for a premium paid by the Portfolio. If the Portfolio sells an option, it sells to another person the right to buy from or sell to the Portfolio a specific amount of the underlying instrument or futures contract on the underlying instrument at an agreed-upon price typically in exchange for a premium received by the Portfolio. A decision as to whether, when and how to use options involves the exercise of skill and judgment and even a well-conceived option transaction may be unsuccessful because of market behavior or unexpected events. The prices of options can be highly volatile and the use of options can lower total returns.
Swaps. An over-the-counter ("OTC") swap contract is an agreement between two parties pursuant to which the parties exchange payments at specified dates on the basis of a specified notional amount, with the payments calculated by reference to specified securities, indices, reference rates, currencies or other instruments. A small percentage of swap contracts are cleared through a central clearinghouse. Most swap agreements provide that when the period payment dates for both parties are the same, the payments are made on a net basis (i.e., the two payment streams are netted out, with only the net amount paid by one party to the other). The Portfolio's obligations or rights under a swap contract entered into on a net basis will generally be equal only to the net amount to be paid or received under the agreement, based on the relative values of the positions held by each counterparty. Most swap agreements are generally not entered into or traded on exchanges and often there is no central clearing or guaranty function for swaps. Therefore, these OTC swaps are generally subject to credit risk or the risk of default or non-performance by the counterparty. Swaps could result in losses if interest rate or foreign currency exchange rates or credit quality changes are not correctly anticipated by the Portfolio or if the reference index, security or investments do not perform as expected. The Portfolio's use of swaps may include those based on the credit of an underlying security and commonly referred to as "credit
VIS — The Strategist Portfolio
11
default swaps." Where the Portfolio is the buyer of a credit default swap contract, it would be entitled to receive the par (or other agreed-upon) value of a referenced debt obligation from the counterparty to the contract only in the event of a default by a third party on the debt obligation. If no default occurs, the Portfolio would have paid to the counterparty a periodic stream of payments over the term of the contract and received no benefit from the contract. When the Portfolio is the seller of a credit default swap contract, it receives the stream of payments but is obligated to pay an amount equal to the par (or other agreed-upon) value of a referenced debt obligation upon the default of that referenced debt obligation.
Structured Investments. The Portfolio also may invest a portion of its assets in structured investments. A structured investment is a derivative security designed to offer a return linked to a particular underlying security, currency or market. Structured investments may come in various forms including notes, warrants and options to purchase securities. The Portfolio will typically use structured investments to gain exposure to a permitted underlying security, currency or market when direct access to a market is limited or inefficient from a tax or cost standpoint. Investments in structured investments involve risks including issuer risk, counterparty risk and market risk. Holders of structured investments bear risks of the underlying investment and are subject to issuer or counterparty risk because the Portfolio is relying on the creditworthiness of such issuer or counterparty and has no rights with respect to the issuer of the underlying investment. Certain structured investments may be thinly traded or have a limited trading market and may have the effect of increasing the Portfolio's illiquidity to the extent that the Portfolio, at a particular point in time, may be unable to find qualified buyers for these securities.
Other Risks. The performance of the Portfolio also will depend on whether or not the Adviser is successful in applying the Portfolio's investment strategies. The Portfolio is also subject to other risks from its permissible investments, including the risks associated with its investments in ETFs, asset-backed securities and municipal securities. For more information about these risks, see the "Additional Risk Information" section.
ADDITIONAL RISK INFORMATION
This section provides additional information relating to the risks of investing in the Portfolio.
Exchange-Traded Funds. Shares of ETFs have many of the same risks as direct investments in common stocks or bonds. In addition, their market value is expected to rise and fall as the value of the underlying index or bonds rises and falls. The market value of their shares may differ from the net asset value of the particular fund. If the Portfolio invests in shares of ETFs it would, in addition to its own expenses, indirectly bear its ratable share of the ETF's expenses (e.g., advisory or administrative fees). In addition, the Portfolio would have increased market exposure to those companies held in its portfolio that are also held by the ETF. Certain ETFs involve leverage, which may magnify the gains or losses realized from their underlying investments.
Asset-Backed Securities. Asset-backed securities involve the risk that various federal and state consumer laws and other legal and economic factors may result in the collateral backing the securities being insufficient to support payment on the securities. Asset-backed securities also have risk characteristics similar to mortgage-backed securities. Like mortgage-backed securities, they generally decrease in value as a result of interest rate increases, but may benefit less than other fixed-income securities from declining interest rates, principally because of prepayments. Also, as in the case of mortgage-backed securities, prepayments generally increase during a period of declining interest rates, although other factors, such as changes in credit use and payment patterns, may also influence prepayment rates.
Municipal Securities. Municipal securities may be general obligations or revenue bonds. General obligation securities are secured by the issuer's full faith and credit as well as its taxing power for payment of principal or interest. Revenue bonds are payable solely from the revenues derived from a specified revenue source. These bonds involve the risk that the revenues so derived will not be sufficient to meet interest and/or principal payment obligations. Municipal securities involve the risk that an issuer may call securities for redemption, which could force the Portfolio to reinvest the proceeds at a lower rate of interest.
Issuance of Build America Bonds ceased on December 31, 2010. The number of Build America Bonds available in the market will be limited, which may negatively affect the value of the Build America Bonds.
VIS — The Strategist Portfolio
12
MORGAN STANLEY INVESTMENT MANAGEMENT INC.
The Adviser, together with its affiliated asset management companies, had approximately $287.4 billion in assets under management or supervision as of December 31, 2011.
PORTFOLIO MANAGEMENT
The Fund has retained the Adviser—Morgan Stanley Investment Management Inc.—to provide investment advisory services. The Adviser is a wholly-owned subsidiary of Morgan Stanley, a preeminent global financial services firm engaged in securities trading and brokerage activities, as well as providing investment banking, research and analysis, financing and financial advisory services. The Adviser's address is 522 Fifth Avenue, New York, NY 10036.
The Portfolio is managed by members of the Global Asset Allocation and the Taxable Fixed Income teams. The teams consist of portfolio managers and analysts. Current members of the teams jointly and primarily responsible for the day-to-day management of the Portfolio are Mark A. Bavoso, Jaidip Singh and Neil Stone.
Mr. Bavoso has been associated with the Adviser in an investment management capacity since 1986. Mr. Singh has been associated with the Adviser in an investment management capacity since 1996. Mr. Stone has been associated with the Adviser in an investment management capacity since 1995.
Mr. Bavoso is the lead manager of the Portfolio. Messrs. Singh and Stone are responsible for specific sectors and for the day-to-day management of the fixed-income portion of the Portfolio. All team members collaborate to manage the assets of the Portfolio.
The Fund's Statement of Additional Information ("SAI") provides additional information about the portfolio managers' compensation structure, other accounts managed by the portfolio managers and the portfolio managers' ownership of securities in the Portfolio.
The composition of the teams may change from time to time.
The Portfolio pays the Adviser a monthly advisory fee as full compensation for the services and facilities furnished to the Portfolio, and for Portfolio expenses assumed by the Adviser. The fee is based on the Portfolio's average daily net assets. For the fiscal year ended December 31, 2011, the Portfolio paid total investment advisory compensation amounting to 0.40% of the Portfolio's average daily net assets.
A discussion regarding the Board of Trustees' approval of the investment advisory agreement is available in the Fund's semiannual report to shareholders for the period ended June 30, 2011.
VIS — The Strategist Portfolio
13
Shareholder Information
PURCHASES AND SALES OF PORTFOLIO SHARES
Shares are offered on each day that the New York Stock Exchange ("NYSE") is open for business. The Portfolio offers its shares only to insurance company separate accounts that insurance companies establish to fund variable life insurance and/or variable annuity contracts. An insurance company purchases or redeems shares of the Portfolio based on, among other things, the amount of net contract premiums or purchase payments allocated to a separate account investment division, transfers to or from a separate account investment division, contract loans and repayments, contract withdrawals and surrenders, and benefit payments. The contract prospectus describes how contract owners may allocate, transfer and withdraw amounts to and from separate accounts.
The Portfolio currently does not foresee any disadvantages to variable product contract owners arising out of the fact that the Portfolio offers its shares to separate accounts of various insurance companies that offer variable life insurance and/or variable annuity products. Nevertheless, the Board of Trustees that oversees the Portfolio intends to monitor events to identify any material irreconcilable conflicts that may arise due to these arrangements and to determine what action, if any, should be taken in response.
If the Adviser determines that it is in the best interest of the Portfolio not to pay redemption proceeds in cash, and subject to applicable agreements with life insurance companies and other qualified investors, the Portfolio may pay a portion or all of a redemption by distributing securities held by the Portfolio. Such in-kind securities may be illiquid and difficult or impossible to sell at a time and at a price that a shareholder would like. In addition, shareholders receiving distributions in-kind may incur brokerage costs when subsequently selling shares of those securities.
FREQUENT PURCHASES AND REDEMPTIONS OF SHARES
Frequent purchases and redemptions of shares pursuant to the instructions of insurance company contract owners are referred to as "market-timing" or "short-term trading" and may present risks for other contract owners with long-term interests in the Portfolio, which may include, among other things, dilution in the value of Portfolio shares indirectly held by contract owners with long-term interests in the Portfolio, interference with the efficient management of the Portfolio, increased brokerage and administrative costs, and forcing the Portfolio to hold excess levels of cash.
In addition, the Portfolio is subject to the risk that market-timers and/or short-term traders may take advantage of time zone differences between the foreign markets on which the Portfolio's securities trade and the time the Portfolio's net asset value is calculated ("time-zone arbitrage"). For example, a market-timer may submit instructions for the purchase of shares of the Portfolio based on events occurring after foreign market closing prices are established, but before the Portfolio's net asset value calculation, that are likely to result in higher prices in foreign markets the following day. The market-timer would submit instructions to redeem the Portfolio's shares the next day, when the Portfolio's share price would reflect the increased prices in foreign markets for a quick profit at the expense of contract owners or participants with long-term interests in the Portfolio.
Investments in other types of securities also may be susceptible to short-term trading strategies. These investments include securities that are, among other things, thinly traded, traded infrequently, or relatively illiquid, which have the risk that the current market price for the securities may not accurately reflect current market values. A contract owner may seek to engage in short-term trading to take advantage of these pricing differences (referred to as "price-arbitrage"). Investments in certain fixed-income securities, such as high yield bonds, may be adversely affected by price arbitrage trading strategies.
The Portfolio's policies with respect to valuing portfolio securities are described below in the "Pricing Portfolio Shares" section.
VIS — The Strategist Portfolio
14
The Fund's Board of Trustees has adopted policies and procedures to discourage frequent purchases and redemptions of Portfolio shares by Portfolio shareholders. Insurance companies generally do not provide specific contract owner transaction instructions to the Portfolio on an ongoing basis. Therefore, to some extent, the Portfolio relies on the insurance companies to monitor frequent short-term trading by contract owners. However, the Portfolio or the Distributor has entered into agreements with insurance companies whereby the insurance companies are required to provide certain contract owner identification and transaction information upon the Portfolio's request. The Portfolio may use this information to help identify and prevent market-timing activity in the Portfolio. There can be no assurance that the Portfolio will be able to identify or prevent all market-timing activity.
If the Portfolio identifies suspected market-timing activity, the insurance company will be contacted and asked to take steps to prevent further market-timing activity (e.g., sending warning letters or blocking frequent trading by underlying contract owners). Insurance companies may be prohibited by the terms of the underlying insurance contract from restricting short-term trading of mutual fund shares by contract owners, thereby limiting the ability of such insurance company to implement remedial steps to prevent market-timing activity in the Portfolio. If the insurance company is unwilling or unable to take remedial steps to discourage or prevent frequent trading, or does not take action promptly, certain contract owners may be able to engage in frequent trading to the detriment of contract owners with long-term interests in the Portfolio. If the insurance company refuses to take remedial action, or takes action that the Portfolio deems insufficient, a determination will be made whether it is appropriate to terminate the relationship with such insurance company.
PRICING PORTFOLIO SHARES
The price of Portfolio shares, called "net asset value," is based on the value of its portfolio securities.
The net asset value per share of the Portfolio is calculated once daily at the NYSE close (normally 4:00 p.m. Eastern time) on each day that the NYSE is open. Shares will not be priced on days that the NYSE is closed.
The value of the Portfolio's securities is based on the securities' market price when available. When a market price is not readily available, including circumstances under which the Adviser determines that a security's market price is not accurate, a portfolio security is valued at its fair value, as determined under procedures established by the Fund's Board of Trustees.
In addition, with respect to securities that primarily are listed on foreign exchanges, when an event occurs after the close of such exchanges that is likely to have changed the value of the securities (e.g., a percentage change in value of one or more U.S. securities indices in excess of specified thresholds), such securities will be valued at their fair value, as determined under procedures established by the Fund's Board of Trustees. Securities also may be fair valued in the event of a significant development affecting a country or region or an issuer-specific development, which is likely to have changed the value of the security. In these cases, the Portfolio's net asset value will reflect certain portfolio securities' fair value rather than their market price. Fair value pricing involves subjective judgment and it is possible that the fair value determined for a security is materially different than the value that could be realized upon the sale of that security. With respect to securities that are primarily listed on foreign exchanges, the value of the Portfolio's securities may change on days when shareholders will not be able to purchase or sell their shares.
To the extent the Portfolio invests in open-end management companies that are registered under the Investment Company Act of 1940, as amended, the Portfolio's net asset value is calculated based upon the net asset value of such funds. The prospectuses for such funds explain the circumstances under which they will use fair value pricing and its effects.
An exception to the general policy of using market prices concerns the Portfolio's short-term debt portfolio securities. Debt securities with remaining maturities of 60 days or less at the time of purchase are valued at amortized cost. However, if the cost does not reflect the securities' market value, these securities will be valued at their fair value.
VIS — The Strategist Portfolio
15
PLAN OF DISTRIBUTION
The Fund has adopted a Plan of Distribution for the Portfolio in accordance with Rule 12b-1 under the Investment Company Act of 1940, as amended. Class Y shares are subject to a distribution (12b-1) fee of 0.25% of the average daily net assets of the Class. The Plan allows Class Y shares of the Portfolio to bear distribution fees in connection with the sale and distribution of Class Y shares. It also allows the Portfolio to pay for services to Class Y shareholders. Because these fees are paid out of the assets of the Portfolio's Class Y shares on an ongoing basis, over time these fees will increase the cost of your investment and may cost you more than paying other types of sales charges.
DISTRIBUTIONS
The Portfolio passes substantially all of its earnings from income and capital gains along to its investors as "distributions." The Portfolio earns income from stocks and interest from fixed-income investments. These amounts are passed along to the Portfolio shareholders as "income dividend distributions." The Portfolio realizes capital gains whenever it sells securities for a higher price than it paid for them. These amounts may be passed along as "capital gains distributions."
Dividends from net investment income and capital gains distributions, if any, are declared and paid at least once per year.
TAX CONSEQUENCES
For information concerning the federal income tax consequences to holders of the underlying variable annuity or variable life insurance contracts, see the accompanying contract prospectus.
PORTFOLIO HOLDINGS INFORMATION
A description of the Fund's policies and procedures with respect to the disclosure of the Portfolio's securities is available in the Fund's SAI.
ADDITIONAL INFORMATION
The Adviser and/or Distributor may pay compensation (out of their own funds and not as an expense of the Portfolio) to certain affiliated or unaffiliated broker-dealers or other financial intermediaries or service providers, including insurance companies and their affiliates, in connection with the sale, distribution, marketing or retention of Portfolio shares and/or shareholder servicing. Such compensation may be significant in amount and the prospect of receiving any such additional compensation may provide such affiliated or unaffiliated entities with an incentive to favor sales of shares of the Portfolio over other investment options. Any such payments will not change the net asset value or the price of the Portfolio's shares. For more information, please see the Fund's SAI.
VIS — The Strategist Portfolio
16
The financial highlights table is intended to help you understand the financial performance of the Portfolio's Class Y shares for the past five years. Certain information reflects financial results for a single Portfolio share throughout each period. The total returns in the table represent the rate an investor would have earned or lost on an investment in the Portfolio (assuming reinvestment of all dividends and distributions). The ratio of expenses to average net assets listed in the table below is based on the average net assets of the Portfolio for each of the periods listed in the table. To the extent that the Portfolio's average net assets decrease over the Portfolio's next fiscal year, such expense ratios can be expected to increase, potentially significantly, because certain fixed costs will be spread over a smaller amount of assets.
The information for the fiscal year ended December 31, 2011 has been audited by Ernst & Young LLP, an independent registered public accounting firm, whose report, along with the Portfolio's financial statements, is incorporated by reference in the SAI from the Fund's annual report, which is available upon request. The financial highlights for each of the years in the four-year period ended December 31, 2010 have been audited by another independent registered public accounting firm.
Further information about the performance of the Portfolio is contained in its annual report to shareholders. See the accompanying contract prospectus for either the variable annuity or the variable life contract issued by your insurance company for a description of charges which are applicable thereto. These charges are not reflected in the financial highlights below. Inclusion of any of these charges would reduce the total return figures for all periods shown.
For the Year Ended December 31, | | 2011 | | 2010^ | | 2009^ | | 2008^ | | 2007^ | |
Selected Per Share Data: | |
Net asset value beginning of period | | $ | 12.90 | | | $ | 12.35 | | | $ | 10.56 | | | $ | 15.53 | | | $ | 16.51 | | |
Net investment income(a) | | | 0.15 | | | | 0.21 | | | | 0.13 | | | | 0.27 | | | | 0.42 | | |
Net realized and unrealized gain (loss) | | | (1.05 | ) | | | 0.58 | | | | 1.89 | | | | (3.76 | ) | | | 0.92 | | |
Total from investment operations | | | (0.90 | ) | | | 0.79 | | | | 2.02 | | | | (3.49 | ) | | | 1.34 | | |
Dividends to shareholders | | | (0.23 | ) | | | (0.17 | ) | | | (0.23 | ) | | | (0.09 | ) | | | (0.42 | ) | |
Distributions to shareholders | | | (1.41 | ) | | | (0.07 | ) | | | — | | | | (1.39 | ) | | | (1.90 | ) | |
Total dividends and distributions | | | (1.64 | ) | | | (0.24 | ) | | | (0.23 | ) | | | (1.48 | ) | | | (2.32 | ) | |
Net asset value end of period | | $ | 10.36 | | | $ | 12.90 | | | $ | 12.35 | | | $ | 10.56 | | | $ | 15.53 | | |
Total Return(b) | | | (8.13 | )% | | | 6.50 | % | | | 19.44 | % | | | (24.20 | )% | | | 8.37 | % | |
Ratio to Average Net Assets:(c) | |
Expenses | | | 0.84 | %(d) | | | 0.84 | %(d) | | | 0.80 | %(d) | | | 0.79 | %(d) | | | 0.79 | % | |
Net investment income | | | 1.27 | %(d) | | | 1.64 | %(d) | | | 1.16 | %(d) | | | 2.03 | %(d) | | | 2.59 | % | |
Rebate from Morgan Stanley affiliate | | | 0.02 | % | | | 0.02 | % | | | 0.03 | % | | | 0.02 | % | | | — | | |
Supplemental Data: | |
Net assets end of period (000's) | | $ | 39,844 | | | $ | 56,361 | | | $ | 59,737 | | | $ | 53,046 | | | $ | 88,651 | | |
Portfolio turnover rate | | | 121 | % | | | 119 | % | | | 96 | % | | | 52 | % | | | 34 | % | |
^ Beginning with the year ended December 31, 2011, the Fund was audited by Ernst & Young LLP. The previous years were audited by another independent registered public accounting firm.
(a) The per share amounts were computed using an average number of shares outstanding during the period.
(b) Calculated based on the net asset value as of the last business day of the period. Performance shown does not reflect fees and expenses imposed by your insurance company. If performance information included the effect of these additional charges, the total returns would be lower.
(c) Reflects overall Portfolio ratios for investment income and non-class specific expenses.
(d) The ratios reflect the rebate of certain Portfolio expenses in connection with investments in a Morgan Stanley affiliate during the period. The effect of the rebate on the ratios is disclosed in the above table as "Rebate from Morgan Stanley affiliate."
VIS — The Strategist Portfolio
17
Morgan Stanley Variable Investment Series

ADDITIONAL INFORMATION ABOUT THE PORTFOLIO'S INVESTMENTS is available in the Fund's Annual and Semiannual Reports to Shareholders. In the Fund's Annual Report, you will find a discussion of the market conditions and investment strategies that significantly affected the Portfolio's performance during its last fiscal year. The Fund's Statement of Additional Information also provides additional information about the Portfolio. The Statement of Additional Information is incorporated herein by reference (legally is part of this Prospectus). For a free copy of the Fund's Annual Report, Semiannual Report or Statement of Additional Information, to request information about the Portfolio or to make shareholder inquiries, please call toll-free (800) 869-NEWS. Free copies of these documents are also available from our Internet site at: www.morganstanley.com/im.

YOU ALSO MAY OBTAIN INFORMATION ABOUT THE FUND BY CALLING your Morgan Stanley Smith Barney Financial Advisor or by visiting our Internet site.

INFORMATION ABOUT THE FUND (including the Statement of Additional Information) can be viewed and copied at the SEC Public Reference Room in Washington, DC. Information about the Reference Room's operations may be obtained by calling the SEC at (202) 551-8090. Reports and other information about the Fund and the Portfolio are available on the EDGAR Database on the SEC's Internet site at: www.sec.gov, and copies of this information may be obtained, after paying a duplicating fee, by electronic request at the following E-mail address: publicinfo@sec.gov, or by writing to the Public Reference Section of the SEC, Washington, DC 20549-1520.
(THE FUND'S INVESTMENT COMPANY ACT FILE NO. IS 811-3692)
MORGAN STANLEY
VARIABLE INVESTMENT SERIES
Annual Report
DECEMBER 31, 2011
The Portfolios are intended to be the funding vehicle for variable annuity contracts and variable life insurance policies offered by the separate accounts of certain life insurance companies.
Morgan Stanley Variable Investment Series
Table of Contents
| Letter to the Shareholders | | | 1 | | |
|
| Expense Example | | | 19 | | |
|
| Portfolios of Investments: | |
|
| Money Market | | | 23 | | |
|
| Limited Duration | | | 26 | | |
|
| Income Plus | | | 33 | | |
|
| Global Infrastructure | | | 43 | | |
|
| European Equity | | | 46 | | |
|
| Multi Cap Growth | | | 49 | | |
|
| Aggressive Equity | | | 51 | | |
|
| Strategist | | | 53 | | |
|
| Financial Statements: | |
|
| Statements of Assets and Liabilities | | | 66 | | |
|
| Statements of Operations | | | 68 | | |
|
| Statements of Changes in Net Assets | | | 70 | | |
|
| Notes to Financial Statements | | | 78 | | |
|
| Financial Highlights | | | 106 | | |
|
| Report of Independent Registered Public Accounting Firm | | | 114 | | |
|
| Trustee and Officer Information | | | 115 | | |
|
| Federal Tax Notice | | | 120 | | |
|
Morgan Stanley Variable Investment Series
Letter to the Shareholders n December 31, 2011 (unaudited)
Dear Shareholder:
Investors faced a number of disappointments in 2011 but the year closed with some encouraging signs. During the year, the global economy looked less robust than many had hoped given the path of past recovery cycles. Investor confidence was further eroded by the deepening European debt crisis and policy makers' struggle to craft a truly decisive solution. Natural disasters and nuclear crisis in Japan disrupted global supply chains, and political strife in the Middle East drove oil prices higher. Political wrangling in the U.S. nearly derailed an increase to the nation's borrowing limit (failure to do so would have resulted in default) and also factored into Standard & Poor's (S&P) decision to downgrade the U.S.'s credit rating. While recession risk in developed markets seemed to be increasing, investors also worried about the potential for aggressive monetary tightening in China to slow its economy too much. Later in the year, however, signs of improvement in some U.S. economic data, a well-received plan for the euro zone, and monetary easing in the emerging markets helped risk assets to rally in the fourth quarter of 2011.
Domestic Equity Overview
The U.S. stock market (as represented by the S&P 500® Index) showed a measure of resiliency despite highly volatile conditions, recovering from earlier losses to finish the year ended December 31, 2011 with a 2.11% gain. In the first half of the year, the U.S. economy was posting disappointing numbers, the European debt crisis was intensifying, and politics became yet another element of uncertainty in an already fragile recovery, as investors worried about the ability of policy makers in the U.S. and Europe to do what was necessary to put their respective economies back on the right track.
Nevertheless, many corporations posted another year of strong profits and better-than-expected earnings. Corporate balance sheets also continued to be healthy with high levels of cash on the books. The S&P 500® Index hit its low for the year in October, but rallied to a stronger finish by year's end. Economic data improved in the fourth quarter of the year, bolstering investor confidence and supporting expectations that the fourth quarter Gross Domestic Product (GDP) growth rate could be above 3 percent (annualized).
In the U.S. equity market, large-cap stocks outperformed mid- and small-cap stocks, and growth stocks surpassed value stocks (as measured by their respective Russell indexes) for the year ended December 31, 2011.
Fixed Income Overview
Investors' preference for the relative safety of bonds helped bonds outperform equities for the year ended December 31, 2011 (as measured by the Barclays Capital U.S. Aggregate Index, which was up 7.84%, and
Morgan Stanley Variable Investment Series
Letter to the Shareholders n December 31, 2011 (unaudited) continued
the S&P 500® Index, which rose 2.11%). The Federal Reserve's second round of quantitative easing (QE2), an asset purchase program intended to stimulate the economy by encouraging banks to lend, ended in June. Amidst renewed weakness in economic indicators, the Federal Open Market Committee (FOMC) announced in September that it would extend the maturity of its Treasury holdings to put downward pressure on longer-term interest rates, in an attempt to keep borrowing costs down. In addition, to provide support to the mortgage market, the Fed will re-invest principal payments from its mortgage and agency holdings into mortgages instead of Treasuries.
Treasury bonds performed strongly during the period as risk-averse investors continued to prefer the relative safety of Treasuries, even with default fears intensifying during the debt ceiling debate in Congress and S&P's downgrade. The agency mortgage sector underperformed Treasuries with similar durations. The sector came under pressure as the Federal Housing Finance Agency (FHFA) and the government-sponsored entities (Fannie Mae and Freddie Mac) announced changes to the Home Affordable Refinance program (HARP) to help borrowers re-finance. After spreads versus Treasuries narrowed earlier in the year, the investment-grade corporate sector suffered in the second half of the year amid the increased risk aversion due to the European debt crisis and signs of slowing economic growth. Conditions for the money markets remained challenging, as yields on the short end of the curve remained anchored by the Fed's near-zero interest rate policy. The Fed indicated in its August 2011 statement that it may continue to maintain its federal funds target rate near zero through mid-2013. The money markets were also disrupted during the period by concerns about U.S. money funds' exposure to European banks' commercial paper.
International Equity Overview
While the U.S. equity market finished the year essentially flat, many international markets posted declines for the year ended December 31, 2011. The MSCI EAFE Index, a measure of developed market equities (excluding the U.S.), fell 12.14% and the MSCI Emerging Markets Index, declined 18.42% for the year ended December 31, 2011.
European markets were hurt by headlines coming out of the debt crisis. Greece appeared on the verge of insolvency and some feared that Italy would be next. Exposure to euro-zone debt made European banks, particularly those in France (a so-called "core" country) look vulnerable, and S&P warned in December of a potential downgrade of all euro zone member countries. Summits throughout the year yielded some quick fixes and the plan announced later in the year was especially well received, but still fell short of addressing some of the major issues. Elsewhere, emerging markets felt the impact of problems in the developed world
2
Morgan Stanley Variable Investment Series
Letter to the Shareholders n December 31, 2011 (unaudited) continued
and heightened risk aversion among investors contributed to volatility in emerging market asset prices. In Japan, the earthquake, tsunami, and nuclear disaster, coupled with a strong yen, kept share prices depressed.
Money Market Portfolio
An investment in a money market fund is not insured or guaranteed by the Federal Deposit Insurance Corporation or any other government agency. Although money market funds seek to preserve the value of an investment at $1.00 per share, it is possible to lose money by investing in such funds.
As of December 31, 2011, Variable Investment Series – Money Market Portfolio had net assets of approximately $107 million with an average portfolio maturity of 18 days. For the seven-day period ended December 31, 2011, the Portfolio's Class X shares provided an effective annualized yield of 0.01% (subsidized) and – 0.43% (non-subsidized) and a current yield of 0.01% (subsidized) and – 0.43% (non-subsidized), while its 30-day moving average yield for December 31, 2011 was 0.01% (subsidized) and – 0.43% (non-subsidized). Yield quotations more closely reflect the current earnings of the Portfolio. The non-subsidized yield reflects what the yield would have been had a fee and/or expense waiver not been in place during the period shown. For the 12-month period ended December 31, 2011, the Portfolio's Class X shares returned 0.01%. Past performance is no guarantee of future results.
For the seven-day period ended December 31, 2011, the Portfolio's Class Y shares provided an effective annualized yield of 0.01% (subsidized) and – 0.68% (non-subsidized) and a current yield of 0.01% (subsidized) and – 0.68% (non-subsidized), while its 30-day moving average yield for December 31, 2011 was 0.01% (subsidized) and – 0.68% (non-subsidized). Yield quotations more closely reflect the current earnings of the Portfolio. The non-subsidized yield reflects what the yield would have been had a fee and/or expense waiver not been in place during the period shown. For the 12-month period ended December 31, 2011, the Portfolio's Class Y shares returned 0.01%. Past performance is no guarantee of future results.
The performance of the Portfolio's two share classes varies because each has different expenses. The Portfolio's total returns assume the reinvestment of all distributions but do not reflect the deduction of any charges by your insurance company. Such costs would lower performance.
We remained cautious in our management of the portfolios throughout the period. We remain quite comfortable in our conservative approach to managing our money market funds. We believe our investment process and focus on credit research and risk management, combined with the high degree of liquidity and short maturity position of our funds has put us in a favorable position to respond to market uncertainty. We expect to maintain conservative, liquid and short weighted average maturity (WAM) and
3
Morgan Stanley Variable Investment Series
Letter to the Shareholders n December 31, 2011 (unaudited) continued
weighted average life (WAL) portfolios, and continue to selectively, and prudently, look for opportunities in the market to take advantage of the positioning of our portfolios. With the continued volatility and uncertainty in the market we believe we remain positioned extremely well for this environment.
With the market continuing to focus on events in Europe and the health of European banks, wholesale funding conditions remained challenged and LIBOR levels continued to increase. As such, we focused most of our investment activity on the short end of the money market curve, primarily in the one through three month sector.
There is no guarantee that any sectors mentioned will continue to perform as discussed above or that securities in such sectors will be held by the Portfolio in the future.
4
Morgan Stanley Variable Investment Series
Letter to the Shareholders n December 31, 2011 (unaudited) continued
Limited Duration Portfolio
For the 12-month period ended December 31, 2011, Variable Investment Series – Limited Duration Portfolio Class X shares produced a total return of 2.75%, underperforming the Barclays Capital U.S. Government/Credit Index (1-5 Year) (the "Index"), which returned 3.14%. For the same period, the Portfolio's Class Y shares returned 2.45%. Past performance is no guarantee of future results.
The performance of the Portfolio's two share classes varies because each has different expenses. The Portfolio's total returns assume the reinvestment of all distributions but do not reflect the deduction of any charges by your insurance company. Such costs would lower performance.
The Portfolio was overweight the credit sector, which detracted from relative performance. Short maturity corporate spreads versus Treasuries widened by almost 80 basis points. The financial sector (in which the Portfolio had exposure) was the worst performing sector, with spreads ending the year about 150 basis points wider.
The Portfolio was positioned to benefit from an anticipated flattening (a reduction in the difference of yield spreads) between the short and intermediate points of the yield curve. This trade was unwound profitably in the third quarter. The Portfolio's allocation to asset-backed securities, which are not represented in the Index, also helped performance as spreads in the sector narrowed during the year.

Performance data quoted represents past performance, which is no guarantee of future results and current performance may be lower or higher than the figures shown. For most recent month-end performance figures, please contact the issuing insurance company or speak with your Financial Advisor. Investment return and principal value will fluctuate. When you sell Portfolio shares, they may be worth less than their original cost. Total returns do not reflect the deduction of taxes that a shareholder would pay on Portfolio distributions or the redemption of Portfolio shares. Performance for Class Y shares will vary from the performance of Class X shares due to differences in expenses. Performance assumes reinvestment of all distributions for the underlying portfolio based on net asset value (NAV). It does not reflect the deduction of insurance expenses, an annual contract maintenance fee, or surrender charges. If performance information included the effect of these additional charges, the total returns would be lower.
Average Annual Total Returns as of December 31, 2011
| | | 1 Year | | 5 Years | | 10 Years | | Since Inception* | |
| Class X | | | 2.75 | % | | | –0.52 | % | | | 1.11 | % | | | 1.98 | % | |
| Class Y | | | 2.45 | % | | | –0.74 | % | | | 0.86 | % | | | 1.62 | % | |
(1) Ending value on December 31, 2011 for the underlying portfolio. This figure does not reflect the deduction of any account fees or sales charges.
(2) The Barclays Capital U.S. Government/Credit Index (1-5 Year) tracks the performance of U.S. government and corporate obligations, including U.S. government agency and Treasury securities, and corporate and Yankee bonds with maturities of one to five years. The Index is unmanaged and its returns do not include any sales charges or fees. Such costs would lower performance. It is not possible to invest directly in an index.
* Inception dates of May 4, 1999 for Class X and June 5, 2000 for Class Y.
5
Morgan Stanley Variable Investment Series
Letter to the Shareholders n December 31, 2011 (unaudited) continued
There is no guarantee that any sectors mentioned will continue to perform as discussed above or that securities in such sectors will be held by the Portfolio in the future.
Income Plus Portfolio
For the 12-month period ended December 31, 2011, Variable Investment Series – Income Plus Portfolio Class X shares produced a total return of 5.01%, underperforming the Barclays Capital U.S. Corporate Index (the "Index"), which returned 8.15%. For the same period, the Portfolio's Class Y shares returned 4.71%. Past performance is no guarantee of future results.
The performance of the Portfolio's two share classes varies because each has different expenses. The Portfolio's total returns assume the reinvestment of all distributions but do not reflect the deduction of any charges by your insurance company. Such costs would lower performance.
The Portfolio began the year overweight investment grade corporate bonds, and with exposure to high yield corporates and convertible bonds as well. These positions were initiated to benefit from a continuing global economic recovery and rally in risky assets. These overweight positions, particularly in investment grade corporate bonds, contributed positively to performance during the first half of 2011. Most of the outperformance came from the financial sector (banking, insurance, finance and real estate investment trusts), which collectively represented the Portfolio's largest overweight relative to the Index. Our preference for owning these positions remains predicated on the belief that
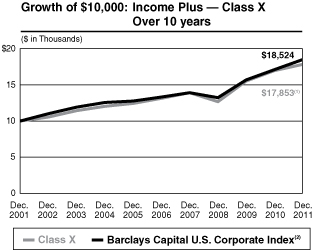
Performance data quoted represents past performance, which is no guarantee of future results and current performance may be lower or higher than the figures shown. For most recent month-end performance figures, please contact the issuing insurance company or speak with your Financial Advisor. Investment return and principal value will fluctuate. When you sell Portfolio shares, they may be worth less than their original cost. Total returns do not reflect the deduction of taxes that a shareholder would pay on Portfolio distributions or the redemption of Portfolio shares. Performance for Class Y shares will vary from the performance of Class X shares due to differences in expenses. Performance assumes reinvestment of all distributions for the underlying portfolio based on net asset value (NAV). It does not reflect the deduction of insurance expenses, an annual contract maintenance fee, or surrender charges. If performance information included the effect of these additional charges, the total returns would be lower.
Average Annual Total Returns as of December 31, 2011
| | | 1 Year | | 5 Years | | 10 Years | | Since Inception* | |
| Class X | | | 5.01 | % | | | 6.31 | % | | | 5.97 | % | | | 7.26 | % | |
| Class Y | | | 4.71 | % | | | 6.05 | % | | | 5.70 | % | | | 6.45 | % | |
(1) Ending value on December 31, 2011 for the underlying portfolio. This figure does not reflect the deduction of any account fees or sales charges.
(2) The Barclays Capital U.S. Corporate Index covers U.S. dollar-denominated, investment-grade, fixed rate, taxable securities sold by industrial, utility and financial issuers. It includes publicly issued U.S. corporate and foreign debentures and secured notes that meet specified maturity, liquidity and quality requirements. The Index is unmanaged and its returns do not include any sales charges or fees. Such costs would lower performance. It is not possible to invest directly in an index.
* Inception dates of March 1, 1987 for Class X and June 5, 2000 for Class Y.
6
Morgan Stanley Variable Investment Series
Letter to the Shareholders n December 31, 2011 (unaudited) continued
these companies will continue to increase capital while working to reduce balance sheet risks.
However, these overweight positions hurt the Portfolio in the second half of 2011 as risky assets responded negatively to the deteriorating European sovereign debt crisis and slower global growth. Volatility and spread widening was especially notable in the banking sector, the Portfolio's largest overweight position, as the sector faced a particularly challenging environment. Investors were concerned about banks' exposure to European sovereign debt and the regulatory requirements for holding such debt in their portfolios, as well as the broader backdrop of slower economic growth. The Portfolio benefited from underweights to select non-financial sectors, such as railroads and health care; although gains made by these positions did not offset underperformance from other holdings in the Portfolio. While volatility is likely to continue in 2012, we believe strong credit fundamentals should ultimately lead to tighter corporate credit spreads as macro concerns subside and global economic growth stabilizes.
There is no guarantee that any sectors mentioned will continue to perform as discussed above or that securities in such sectors will be held by the Portfolio in the future.
Global Infrastructure Portfolio
For the 12-month period ended December 31, 2011, Variable Investment Series – Global Infrastructure Portfolio Class X shares produced a total return of 16.07%, outperforming the Dow Jones Brookfield
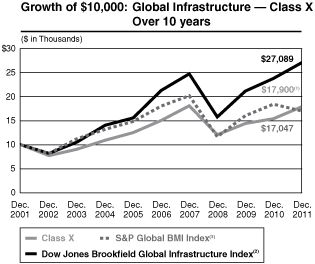
Performance data quoted represents past performance, which is no guarantee of future results and current performance may be lower or higher than the figures shown. For most recent month-end performance figures, please contact the issuing insurance company or speak with your Financial Advisor. Investment return and principal value will fluctuate. When you sell Portfolio shares, they may be worth less than their original cost. Total returns do not reflect the deduction of taxes that a shareholder would pay on Portfolio distributions or the redemption of Portfolio shares. Performance for Class Y shares will vary from the performance of Class X shares due to differences in expenses. Performance assumes reinvestment of all distributions for the underlying portfolio based on net asset value (NAV). It does not reflect the deduction of insurance expenses, an annual contract maintenance fee, or surrender charges. If performance information included the effect of these additional charges, the total returns would be lower.
Average Annual Total Returns as of December 31, 2011
| | | 1 Year | | 5 Years | | 10 Years | | Since Inception* | |
| Class X | | | 16.07 | % | | | 3.51 | % | | | 5.99 | % | | | 7.72 | % | |
| Class Y | | | 15.82 | % | | | 3.25 | % | | | 5.73 | % | | | 2.42 | % | |
(1) Ending value on December 31, 2011 for the underlying portfolio. This figure does not reflect the deduction of any account fees or sales charges.
(2) Dow Jones Brookfield Global Infrastructure IndexSM is a float-adjusted market capitalization weighted index that measures the stock performance of companies that exhibit strong infrastructure characteristics. The Index intends to measure all sectors of the infrastructure market. The Index was first published in July 2008; however, back-tested hypothetical performance information is available for this Index since December 31, 2002. Returns are calculated using the return data of the S&P Global BMI Index through December 31, 2002 and the return data of the Dow Jones Brookfield Global Infrastructure Index for periods thereafter. The Index is unmanaged and its returns do not include any sales charges or fees. Such costs would lower performance. It is not possible to invest directly in an index.
(3) The Standard & Poor's Global BMI Index (S&P Global BMI Index) is a broad market index designed to capture exposure to equities in all countries in the world that meet minimum size and liquidity requirements. As of the date of this Report, there are approximately 11,000 index members representing 26 developed and 20 emerging market countries. The Index is unmanaged and its returns do not include any sales charges or fees. Such costs would lower performance. It is not possible to invest directly in an index.
* Inception dates of March 1, 1990 for Class X and June 5, 2000 for Class Y.
7
Morgan Stanley Variable Investment Series
Letter to the Shareholders n December 31, 2011 (unaudited) continued
Global Infrastructure Index (the "Index"), which returned 13.75%, and the S&P Global BMI Index, which returned – 7.72%. For the same period, the Portfolio's Class Y shares returned 15.82%. Past performance is no guarantee of future results.
The performance of the Portfolio's two share classes varies because each has different expenses. The Portfolio's total returns assume the reinvestment of all distributions but do not reflect the deduction of any charges by your insurance company. Such costs would lower performance.
Infrastructure shares appreciated 13.75% during the period, as measured by the Index. Among the major infrastructure sectors, the gas midstream, pipeline companies, and transmission and distribution sectors exhibited relative outperformance, while the toll road, European regulated utilities, and communications sectors underperformed the Index. Gas distribution utilities performed in-line with the Index for the year. Among the smaller sectors, the water sector exhibited modest relative underperformance, and the ports and airport sectors exhibited meaningful relative underperformance.
For the year ended December 31, 2011, the Portfolio realized favorable performance from both bottom-up stock selection and top-down allocation, with bottom-up stock selection being the more significant driver of outperformance. From a bottom-up perspective, stock selection was particularly favorable in the toll roads, gas distribution utilities sectors, and European regulated utilities, and stock selection in all sectors was favorable or neutral aside from slight underperformance in the communications sector. From a top-down perspective, our positioning was favorable in all sectors except for underweights to the gas midstream and transmission and distribution sectors.
Concerning the broader equity markets, 2011 was characterized by significant equity market (and credit market outside North America) volatility brought on by investor uncertainty over the health of credit/lending markets, national banking systems, and government fiscal balance sheets across the globe, and the potential for credit market and balance sheet weakness to put significant pressure on various national economies. While no region was spared entirely, the U.S. equity markets outperformed their regional counterparts, with meaningful declines in the European and Asia Pacific stock markets.
Despite broader macroeconomic uncertainty, operating trends within infrastructure remained quite resilient in 2011 and were the primary cause for infrastructure stock outperformance relative to the broader global equity markets, as measured by the MSCI World Index. Favorable operating fundamentals spanned most infrastructure sectors in 2011 but were most readily apparent in the energy infrastructure category in North America, where the buildout of new long-haul pipelines for crude oil transportation and gathering and processing networks associated with natural gas and natural gas liquids (NGLs) continued to be robust.
8
Morgan Stanley Variable Investment Series
Letter to the Shareholders n December 31, 2011 (unaudited) continued
Backlog for projects associated with this area of infrastructure extends out for the next several years, and the medium to longer-term attractiveness of this sector was underscored by a number of merger and acquisition (M&A) transactions that occurred within the sector in 2011. Another area of robust growth in 2011 was communications, where wireless phone providers struggled to keep up with the ever-increasing demand brought on by incremental smartphone usage. While this increased demand did not translate into stock outperformance for our wireless tower companies in the past year, this incremental demand has only reinforced what is already a multi-year backlog of equipment enhancements and new tower builds needed to meet wireless carrier needs. It is worth pointing out that despite significant share price underperformance in 2011 of companies in the ports and airport infrastructure sectors, operating trends even for these companies were favorable, with most companies reporting year-over-year volume growth and price/tariff increases.
We remain committed to our core investment philosophy as an infrastructure value investor. As value-oriented, bottom-up driven investors, our investment perspective is that over the medium and long-terms, the key factor in determining the performance of infrastructure securities will be underlying infrastructure asset values. Given the large and growing private infrastructure market, we believe that there are limits as to the level of premium or discount at which the public sector should trade relative to its underlying private infrastructure value. These limits can be viewed as the point at which the arbitrage opportunity between owning infrastructure in the private versus public markets becomes compelling. In aiming to achieve core infrastructure exposure in a cost-effective manner, we invest in equity securities of publicly listed infrastructure companies we believe offer the best value relative to their underlying infrastructure value and intrinsic value growth prospects. Our research currently leads us to an overweighting in the Portfolio (amongst the largest sectors) to a group of companies in the communications, gas distribution, toll roads, and pipeline companies sectors, and an underweighting to companies in the transmission and distribution, gas midstream, and European regulated utilities sectors.
Looking toward 2012, we are most positive regarding our positions in Asia in the utility (particularly gas distribution) and toll road sectors, which we believe have the most favorable risk-return characteristics in our investment universe and possess a compelling combination of meaningful discounts to intrinsic value and strong growth outlooks. We believe operating results for companies in these two sectors should remain favorable despite the potential for a more moderate growth trajectory in China. We are also favorable on companies within the communications sector, which while trading at more modest discounts than our overweight positions in Asia, in our view continue to possess very resilient secular fundamental trends and may produce sustainable cash flow growth that is not currently fully reflected in share prices. For energy
9
Morgan Stanley Variable Investment Series
Letter to the Shareholders n December 31, 2011 (unaudited) continued
infrastructure, while we believe fundamental trends will remain strong in the coming year, we are more cautious on valuations, in particular in the midstream sector, where we believe near-term valuation levels are stretched relative to historical levels. Due to these stretched near-term valuation levels and operating fundamentals that are more sensitive to volume and end-product pricing relative to the pipeline sector, our preference is to favor pipelines. For electricity transmission and distribution and gas distribution utilities in North America, we find current valuations less favorable, but acknowledge the appeal of these companies among certain investors looking for safety in an uncertain macroeconomic environment. Finally, we expect to remain selective in the European regulated utility sector due to ongoing regulatory risk, in particular for those utilities in continental Europe.
There is no guarantee that any sectors mentioned will continue to perform as discussed above or that securities in such sectors will be held by the Portfolio in the future.
European Equity Portfolio
For the 12-month period ended December 31, 2011, Variable Investment Series – European Equity Portfolio Class X shares produced a total return of – 9.64%, outperforming the MSCI Europe Index (the "Index"), which returned – 11.06%. For the same period, the Portfolio's Class Y shares returned – 9.85%. Past performance is no guarantee of future results.
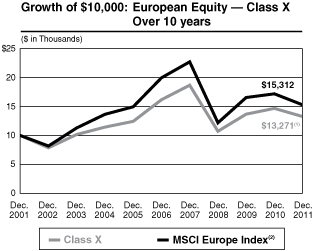
Performance data quoted represents past performance, which is no guarantee of future results and current performance may be lower or higher than the figures shown. For most recent month-end performance figures, please contact the issuing insurance company or speak with your Financial Advisor. Investment return and principal value will fluctuate. When you sell Portfolio shares, they may be worth less than their original cost. Total returns do not reflect the deduction of taxes that a shareholder would pay on Portfolio distributions or the redemption of Portfolio shares. Performance for Class Y shares will vary from the performance of Class X shares due to differences in expenses. Performance assumes reinvestment of all distributions for the underlying portfolio based on net asset value (NAV). It does not reflect the deduction of insurance expenses, an annual contract maintenance fee, or surrender charges. If performance information included the effect of these additional charges, the total returns would be lower.
Average Annual Total Returns as of December 31, 2011
| | | 1 Year | | 5 Years | | 10 Years | | Since Inception* | |
| Class X | | | –9.64 | % | | | –3.90 | % | | | 2.87 | % | | | 8.11 | % | |
| Class Y | | | –9.85 | % | | | –4.13 | % | | | 2.62 | % | | | –0.14 | % | |
(1) Ending value on December 31, 2011 for the underlying portfolio. This figure does not reflect the deduction of any account fees or sales charges.
(2) The Morgan Stanley Capital International (MSCI) Europe Index is a free float-adjusted market capitalization index that is designed to measure developed market equity performance in Europe. The term "free float" represents the portion of shares outstanding that are deemed to be available for purchase in the public equity markets by investors. The performance of the Index is listed in U.S. dollars and assumes reinvestment of net dividends. The Index is unmanaged and its returns do not include any sales charges or fees. Such costs would lower performance. It is not possible to invest directly in an index.
* Inception dates of March 1, 1991 for Class X and June 5, 2000 for Class Y.
10
Morgan Stanley Variable Investment Series
Letter to the Shareholders n December 31, 2011 (unaudited) continued
The performance of the Portfolio's two share classes varies because each has different expenses. The Portfolio's total returns assume the reinvestment of all distributions but do not reflect the deduction of any charges by your insurance company. Such costs would lower performance.
In the 12-month period, the European market was turbulent, with shifting investor sentiment driving sharp swings in sector performance. Nevertheless, we can identify a clear trend of outperformance among more defensive (or less economically sensitive) sectors, such as health care equipment and food, beverage and tobacco, along with some of the more cyclical (or economically sensitive) industries such as energy and luxury goods. The latter were driven mainly by demand from emerging markets, as the developed western economies continued their long-term deleveraging process.
On an industry level, key contributors included both stock selection and an overweight allocation to energy. In particular, performance was bolstered by a position in a U.K. oil and drilling company, which delivered promising exploration results in new fields off the coast of Brazil and in West Africa. Stock selection in capital goods; food, beverage and tobacco; commercial services; and telecommunications also aided relative returns. Notable positions within these industries included two U.K. tobacco companies, whose stable cash flow generation, earnings visibility and emerging markets exposure helped boost both sales and prices. Positive relative performance was also driven by exposure to a U.K. industrial company with a high proportion of recurring revenues from maintenance and services, which provided some stability to the company's revenue stream. A U.K. food supermarket chain that successfully expanded its distribution efforts in southeast England and gained market share against larger competitors was also a top contributor to performance during the period. In addition, underweight positions in diversified financials and technology, along with an overweight allocation to pharmaceuticals, were additive.
Detractors from performance included stock selection in automobiles and components, retailing, consumer services, and materials. Among the weakest performers within these industries were a Luxembourg-based global steel producer, a U.K. diversified mining company, a German consumer retailer and a France-based worldwide hotel chain operator. These holdings underperformed during the period due to concerns about the global economic recovery.
Although the financials sector overall was a positive contributor to performance during the period, not surprisingly, some of the Portfolio's weakest performing holdings included two French banks with exposure to Italy, which has been under scrutiny from institutional investors recently due to its lack of economic growth and high level of debt, and a U.K. bank. It will take a while before the sovereign debt crisis and deleveraging can be considered behind us. In the second half of the year, we selectively continued
11
Morgan Stanley Variable Investment Series
Letter to the Shareholders n December 31, 2011 (unaudited) continued
to add to our position in financials, where the Portfolio is still underweight — although within the sector it is now overweight retail banks.
On a country level, key contributors to performance included both stock selection and an overweight allocation to the U.K. along with stock selection in Switzerland and Finland. In addition, the Portfolio's underweight allocation to two troubled peripheral countries (Italy and Greece) was positive for the overall performance. On the contrary, the primary detractors from performance were stock selection in France, Germany and Sweden.
The outlook for the European economy worsened in the second half of 2011. Economists now do not exclude the chance of a mild temporary recession in Europe in the first half of 2012. We acknowledge a slowdown in the economy and we believe that a mild recession is already priced in the current valuations. Concerns remain on sovereign debt for some peripheral countries, but we believe that the current scenario provides opportunities in the market. We expect that the European economy should be a major beneficiary of a global recovery, with its high exposure to emerging markets. We see recent weakness in the market as an opportunity to selectively add stocks to the Portfolio, as European valuations are cheap compared to historical levels, in our view. We believe that European equities are well positioned to be a positive surprise for the years to come, especially once we have more visibility from politicians on the outcome of the euro crisis. Our investment approach remains the same. We continue to seek high quality companies that we believe have high earnings visibility and predictability, stable and strong cash flow and low levels of debt trading at attractive valuations.
There is no guarantee that any sectors mentioned will continue to perform as discussed above or that securities in such sectors will be held by the Portfolio in the future.
12
Morgan Stanley Variable Investment Series
Letter to the Shareholders n December 31, 2011 (unaudited) continued
Multi Cap Growth Portfolio
For the 12-month period ended December 31, 2011, Variable Investment Series – Multi Cap Growth (formerly Capital Opportunities) Portfolio Class X shares produced a total return of – 6.74%, underperforming the Russell 3000® Growth Index (the "Index"), which returned 2.18%. For the same period, the Portfolio's Class Y shares returned – 6.97%. Past performance is no guarantee of future results.
The performance of the Portfolio's two share classes varies because each has different expenses. The Portfolio's total returns assume the reinvestment of all distributions but do not reflect the deduction of any charges by your insurance company. Such costs would lower performance.
Stock selection in the consumer discretionary sector detracted the most from relative performance during the period. A video streaming service, an online retailer, and a South African diversified media company (not represented in the Index) were among the weakest-performing holdings. Stock selection in the financial services sector also dampened performance, with negative performance driven by a holding in an independent investment bank and out-of-benchmark exposures to a Brazilian securities exchange operator and a global property, power and infrastructure asset management company based in Canada. Stock selection and an overweight allocation in the materials and processing sector were disadvantageous as well. Two mineral mining companies were the main detractors.
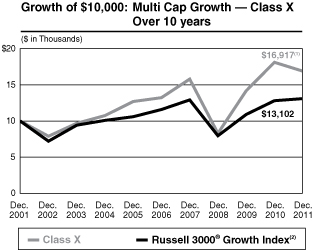
Performance data quoted represents past performance, which is no guarantee of future results and current performance may be lower or higher than the figures shown. For most recent month-end performance figures, please contact the issuing insurance company or speak with your Financial Advisor. Investment return and principal value will fluctuate. When you sell Portfolio shares, they may be worth less than their original cost. Total returns do not reflect the deduction of taxes that a shareholder would pay on Portfolio distributions or the redemption of Portfolio shares. Performance for Class Y shares will vary from the performance of Class X shares due to differences in expenses. Performance assumes reinvestment of all distributions for the underlying portfolio based on net asset value (NAV). It does not reflect the deduction of insurance expenses, an annual contract maintenance fee, or surrender charges. If performance information included the effect of these additional charges, the total returns would be lower.
Average Annual Total Returns as of December 31, 2011
| | | 1 Year | | 5 Years | | 10 Years | | Since Inception* | |
| Class X | | | –6.74 | % | | | 5.03 | % | | | 5.40 | % | | | 10.71 | % | |
| Class Y | | | –6.97 | % | | | 4.76 | % | | | 5.14 | % | | | 1.26 | % | |
(1) Ending value on December 31, 2011 for the underlying portfolio. This figure does not reflect the deduction of any account fees or sales charges.
(2) The Russell 3000® Growth Index measures the performance of the broad growth segment of the U.S. equity universe. It includes those Russell 3000® Index companies with higher price-to-book ratios and higher forecasted growth values. The Russell 3000® Index measures the performance of the largest 3000 U.S. companies representing approximately 98% of the investable U.S. equity market. The Index is unmanaged and its returns do not include any sales charges or fees. Such costs would lower performance. It is not possible to invest directly in an index.
* Inception dates of March 9, 1984 for Class X and June 5, 2000 for Class Y.
13
Morgan Stanley Variable Investment Series
Letter to the Shareholders n December 31, 2011 (unaudited) continued
However, the technology sector was the main positive contributor to performance. The sector was led by a personal computer, mobile communications, and media devices manufacturer and a Chinese internet search provider (which is not represented in the Index).
There is no guarantee that any sectors mentioned will continue to perform as discussed above or that securities in such sectors will be held by the Portfolio in the future.
Aggressive Equity Portfolio
For the 12-month period ended December 31, 2011, Variable Investment Series – Aggressive Equity Portfolio Class X shares produced a total return of – 7.33%, underperforming the Russell 3000® Growth Index (the "Index"), which returned 2.18%. For the same period, the Portfolio's Class Y shares returned – 7.59%. Past performance is no guarantee of future results.
The performance of the Portfolio's two share classes varies because each has different expenses. The Portfolio's total returns assume the reinvestment of all distributions but do not reflect the deduction of any charges by your insurance company. Such costs would lower performance.
Stock selection in the consumer discretionary sector detracted the most from relative performance during the period. A video streaming service, an online retailer, and a South African diversified media company (not represented in the Index) were among the weakest-performing holdings. Stock

Performance data quoted represents past performance, which is no guarantee of future results and current performance may be lower or higher than the figures shown. For most recent month-end performance figures, please contact the issuing insurance company or speak with your Financial Advisor. Investment return and principal value will fluctuate. When you sell Portfolio shares, they may be worth less than their original cost. Total returns do not reflect the deduction of taxes that a shareholder would pay on Portfolio distributions or the redemption of Portfolio shares. Performance for Class Y shares will vary from the performance of Class X shares due to differences in expenses. Performance assumes reinvestment of all distributions for the underlying portfolio based on net asset value (NAV). It does not reflect the deduction of insurance expenses, an annual contract maintenance fee, or surrender charges. If performance information included the effect of these additional charges, the total returns would be lower.
Average Annual Total Returns as of December 31, 2011
| | | 1 Year | | 5 Years | | 10 Years | | Since Inception* | |
| Class X | | | –7.33 | % | | | 3.90 | % | | | 5.87 | % | | | 4.83 | % | |
| Class Y | | | –7.59 | % | | | 3.64 | % | | | 5.60 | % | | | 1.59 | % | |
(1) Ending value on December 31, 2011 for the underlying portfolio. This figure does not reflect the deduction of any account fees or sales charges.
(2) The Russell 3000® Growth Index measures the performance of the broad growth segment of the U.S. equity universe. It includes those Russell 3000® Index companies with higher price-to-book ratios and higher forecasted growth values. The Russell 3000® Index measures the performance of the largest 3000 U.S. companies representing approximately 98% of the investable U.S. equity market. The Index is unmanaged and its returns do not include any sales charges or fees. Such costs would lower performance. It is not possible to invest directly in an index.
* Inception dates of May 4, 1999 for Class X and June 5, 2000 for Class Y.
14
Morgan Stanley Variable Investment Series
Letter to the Shareholders n December 31, 2011 (unaudited) continued
selection in the financial services sector also dampened performance, with negative performance driven by a holding in an independent investment bank, and out-of-benchmark exposures to a Brazilian securities exchange operator and a global property, power and infrastructure asset management company based in Canada. Stock selection and an overweight allocation in the materials and processing sector were disadvantageous as well. Two mineral mining companies were the main detractors.
However, the technology sector was the main positive contributor to performance. The sector was led by a personal computer, mobile communications, and media devices manufacturer and a Chinese internet search provider (which is not represented in the Index).
There is no guarantee that any sectors mentioned will continue to perform as discussed above or that securities in such sectors will be held by the Portfolio in the future.
Strategist Portfolio
For the 12-month period ended December 31, 2011, Variable Investment Series – Strategist Portfolio Class X shares produced a total return of – 7.96%, underperforming the S&P 500® Index (the "Index"), which returned 2.11%, and underperforming the Barclays Capital U.S. Government/Credit Index, which returned 8.74%. For the same period, the Portfolio's Class Y shares returned – 8.13%. Past performance is no guarantee of future results.
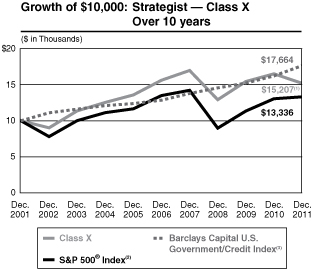
Performance data quoted represents past performance, which is no guarantee of future results and current performance may be lower or higher than the figures shown. For most recent month-end performance figures, please contact the issuing insurance company or speak with your Financial Advisor. Investment return and principal value will fluctuate. When you sell Portfolio shares, they may be worth less than their original cost. Total returns do not reflect the deduction of taxes that a shareholder would pay on Portfolio distributions or the redemption of Portfolio shares. Performance for Class Y shares will vary from the performance of Class X shares due to differences in expenses. Performance assumes reinvestment of all distributions for the underlying portfolio based on net asset value (NAV). It does not reflect the deduction of insurance expenses, an annual contract maintenance fee, or surrender charges. If performance information included the effect of these additional charges, the total returns would be lower.
Average Annual Total Returns as of December 31, 2011
| | | 1 Year | | 5 Years | | 10 Years | | Since Inception* | |
| Class X | | | –7.96 | % | | | –0.56 | % | | | 4.28 | % | | | 7.46 | % | |
| Class Y | | | –8.13 | % | | | –0.81 | % | | | 4.02 | % | | | 2.49 | % | |
(1) Ending value on December 31, 2011 for the underlying portfolio. This figure does not reflect the deduction of any account fees or sales charges.
(2) The Standard & Poor's 500® Index (S&P 500®) measures the performance of the large cap segment of the U.S. equities market, covering approximately 75% of the U.S. equities market. The Index includes 500 leading companies in leading industries of the U.S. economy. The Index is unmanaged and its returns do not include any sales charges or fees. Such costs would lower performance. It is not possible to invest directly in an index.
(3) The Barclays Capital U.S. Government/Credit Index tracks the performance of government and corporate obligations, including U.S. government agency and Treasury securities and corporate and Yankee bonds. The Index is unmanaged and its returns do not include any sales charges or fees. Such costs would lower performance. It is not possible to invest directly in an index.
* Inception dates of March 1, 1987 for Class X and June 5, 2000 for Class Y.
15
Morgan Stanley Variable Investment Series
Letter to the Shareholders n December 31, 2011 (unaudited) continued
The performance of the Portfolio's two share classes varies because each has different expenses. The Portfolio's total returns assume the reinvestment of all distributions but do not reflect the deduction of any charges by your insurance company. Such costs would lower performance.
Strategist Portfolio's flexible investment approach allows investment across stocks, bonds, cash and other investment classes. To determine the specific allocation among asset classes throughout the period, we rigorously evaluate a comprehensive array of quantitative and qualitative factors. The quantitative analysis comprises an extensive "top-down" asset class review of many macroeconomic variables, with primary focus on three core factors: monetary policy and its impact on liquidity, inflation trends and corporate profitability. A second, more qualitative process then broadens the analysis to determine which sectors and industries would offer the best opportunities, in our view, given the macroeconomic climate. Individual holdings are then selected to provide desired exposure to asset classes and sectors.
Portfolio returns over the course of 2011 did not match our historic track record or the underlying performance of our benchmarks. While the portfolio management team's research and portfolio construction disciplines did not change, the market's appetite for risk remained quite low, creating an unfavorable environment for most value plays. Additionally, our view that economic growth would resume in early 2011, supported by the rise in U.S. government bond yields and the improvement in a number of macroeconomic indicators (such as consumer confidence, corporate profits, survey data, etc.), fell short as oil prices spiked in the first quarter and the Japanese earthquake and tsunami disrupted an already fragile global supply chain.
After outperforming our Lipper Variable Annuity Flexible Portfolio Underlying Funds category peer group in the first quarter of 2011, the Strategist Portfolio underperformed those same peers over the balance of the year. While the economic recovery finally took hold in the U.S. during the fourth quarter, our pivot back to a defensive, cash-rich asset allocation during the summer prevented our investors from fully capitalizing on the "risk rally" that ensued.
In November, we shifted our asset allocation relative to an average balanced fund to an equal weight position in equities (55% percent of total Portfolio assets), a slight overweight position in cash (19%), and an underweight position in fixed income (26%), and in turn outperformed our category peer group for the month ended December 31, 2011. At year-end, the Portfolio's asset allocation stood at approximately 56% equities (versus an average balanced fund's weight of 55%), 26% fixed income (versus an average balanced fund's weight of 35%) and 18% cash equivalents (versus an average balanced fund's weight of 10%).
16
Morgan Stanley Variable Investment Series
Letter to the Shareholders n December 31, 2011 (unaudited) continued
There is no guarantee that any sectors mentioned will continue to perform as discussed above or that securities in such sectors will be held by the Portfolio in the future.
We appreciate your ongoing support of Morgan Stanley Variable Investment Series and look forward to continuing to serve your investment needs.
Very truly yours,

Arthur Lev
President and Principal Executive Officer
17
Morgan Stanley Variable Investment Series
Letter to the Shareholders n December 31, 2011 (unaudited) continued
For More Information About Portfolio Holdings
Each Morgan Stanley fund provides a complete schedule of portfolio holdings in its semiannual and annual reports within 60 days of the end of the fund's second and fourth fiscal quarters. The semiannual reports and the annual reports are filed electronically with the Securities and Exchange Commission (SEC) on Form N-CSRS and Form N-CSR, respectively. Morgan Stanley also delivers the semiannual and annual reports to fund shareholders and makes these reports available on its public web site, www.morganstanley.com. Each Morgan Stanley fund also files a complete schedule of portfolio holdings with the SEC for the fund's first and third fiscal quarters on Form N-Q and monthly holdings for each money market fund on Form N-MFP. Morgan Stanley does not deliver these reports to shareholders, nor are the first and third fiscal quarter reports posted to the Morgan Stanley public web site. However, the holdings for each money market fund are posted to the Morgan Stanley public web site. You may obtain the Form N-Q filings (as well as the Form N-CSR, N-CSRS and N-MFP filings) by accessing the SEC's web site, http://www.sec.gov. You may also review and copy them at the SEC's public reference room in Washington, DC. Information on the operation of the SEC's public reference room may be obtained by calling the SEC at (800) SEC-0330. You can also request copies of these materials, upon payment of a duplicating fee, by electronic request at the SEC's e-mail address (publicinfo@sec.gov) or by writing the public reference section of the SEC, Washington, DC 20549-1520.
Proxy Voting Policy and Procedures and Proxy Voting Record
You may obtain a copy of the Portfolio's Proxy Voting Policy and Procedures without charge, upon request, by calling toll free (800) 869-NEWS or by visiting the Mutual Fund Center on our web site at www.morganstanley.com. It is also available on the SEC's web site at http://www.sec.gov.
You may obtain information regarding how the Portfolios voted proxies relating to portfolio securities during the most recent twelve-month period ended June 30 without charge by visiting the Mutual Fund Center on our web site at www.morganstanley.com. This information is also available on the SEC's web site at http://www.sec.gov.
18
Morgan Stanley Variable Investment Series
Expense Example n December 31, 2011 (unaudited)
As a shareholder of the Portfolio, you incur two types of costs: (1) insurance company charges; and (2) ongoing costs, including advisory fees; distribution and service (12b-1) fees; and other Portfolio expenses. This example is intended to help you understand your ongoing costs (in dollars) of investing in the Portfolio and to compare these costs with the ongoing costs of investing in other mutual funds.
The example is based on an investment of $1,000 invested at the beginning of the period and held for the entire period 07/01/11 – 12/31/11.
Actual Expenses
The first line of the table below provides information about actual account values and actual expenses. You may use the information in this line, together with the amount you invested, to estimate the expenses that you paid over the period. Simply divide your account value by $1,000 (for example, an $8,600 account value divided by $1,000 = 8.6), then multiply the result by the number in the first line under the heading entitled "Expenses Paid During Period" to estimate the expenses you paid on your account during this period.
Hypothetical Example for Comparison Purposes
The second line of the table below provides information about hypothetical expenses based on the Portfolio's actual expense ratio and an assumed rate of return of 5% per year before expenses, which is not the Portfolio's actual return. The hypothetical account values and expenses may not be used to estimate the actual ending account balance or expenses you paid for the period. You may use this information to compare the ongoing cost of investing in the Portfolio and other funds. To do so, compare this 5% hypothetical example with the 5% hypothetical examples that appear in the shareholder reports of the other funds.
Please note that the expenses shown in the table are meant to highlight your ongoing costs only and do not reflect any insurance company charges. Therefore, the second line of the table is useful in comparing ongoing costs, and will not help you determine the relative total cost of owning different funds. In addition, if these insurance company charges were included, your costs would have been higher.
19
Morgan Stanley Variable Investment Series
Expense Example n December 31, 2011 (unaudited) continued
Money Market
| | | Beginning
Account Value | | Ending
Account Value | | Expenses Paid
During Period@ | |
| | | 07/01/11 | | 12/31/11 | | 07/01/11 –
12/31/11 | |
| Class X | |
| Actual (0.01% return) | | $ | 1,000.00 | | | $ | 1,000.10 | | | $ | 1.40 | | |
| Hypothetical (5% annual return before expenses) | | $ | 1,000.00 | | | $ | 1,023.66 | | | $ | 1.42 | | |
| Class Y | |
| Actual (0.01% return) | | $ | 1,000.00 | | | $ | 1,000.10 | | | $ | 1.40 | | |
| Hypothetical (5% annual return before expenses) | | $ | 1,000.00 | | | $ | 1,023.66 | | | $ | 1.42 | | |
@ Expenses are equal to the Portfolio's annualized expense ratios of 0.28% and 0.28% for Class X and Class Y shares, respectively, multiplied by the average account value over the period, multiplied by 183/365 (to reflect the one-half year period). If the Portfolio had borne all of its expenses, the annualized expense ratios would have been 0.60% and 0.85% for Class X and Class Y shares, respectively.
Limited Duration
| | | Beginning
Account Value | | Ending
Account Value | | Expenses Paid
During Period@ | |
| | | 07/01/11 | | 12/31/11 | | 07/01/11 –
12/31/11 | |
| Class X | |
| Actual (0.79% return) | | $ | 1,000.00 | | | $ | 1,007.90 | | | $ | 3.19 | | |
| Hypothetical (5% annual return before expenses) | | $ | 1,000.00 | | | $ | 1,022.03 | | | $ | 3.21 | | |
| Class Y | |
| Actual (0.66% return) | | $ | 1,000.00 | | | $ | 1,006.60 | | | $ | 4.45 | | |
| Hypothetical (5% annual return before expenses) | | $ | 1,000.00 | | | $ | 1,020.77 | | | $ | 4.48 | | |
@ Expenses are equal to the Portfolio's annualized expense ratios of 0.63% and 0.88% for Class X and Class Y shares, respectively, multiplied by the average account value over the period, multiplied by 184/365 (to reflect the one-half year period).
Income Plus
| | | Beginning
Account Value | | Ending
Account Value | | Expenses Paid
During Period@ | |
| | | 07/01/11 | | 12/31/11 | | 07/01/11 –
12/31/11 | |
| Class X | |
| Actual (1.37% return) | | $ | 1,000.00 | | | $ | 1,013.70 | | | $ | 3.05 | | |
| Hypothetical (5% annual return before expenses) | | $ | 1,000.00 | | | $ | 1,022.18 | | | $ | 3.06 | | |
| Class Y | |
| Actual (1.19% return) | | $ | 1,000.00 | | | $ | 1,011.90 | | | $ | 4.31 | | |
| Hypothetical (5% annual return before expenses) | | $ | 1,000.00 | | | $ | 1,020.92 | | | $ | 4.33 | | |
@ Expenses are equal to the Portfolio's annualized expense ratios of 0.60% and 0.85% for Class X and Class Y shares, respectively, multiplied by the average account value over the period, multiplied by 184/365 (to reflect the one-half year period).
20
Morgan Stanley Variable Investment Series
Expense Example n December 31, 2011 (unaudited) continued
Global Infrastructure
| | | Beginning
Account Value | | Ending
Account Value | | Expenses Paid
During Period@ | |
| | | 07/01/11 | | 12/31/11 | | 07/01/11 –
12/31/11 | |
| Class X | |
| Actual (3.56% return) | | $ | 1,000.00 | | | $ | 1,035.60 | | | $ | 4.52 | | |
| Hypothetical (5% annual return before expenses) | | $ | 1,000.00 | | | $ | 1,020.77 | | | $ | 4.48 | | |
| Class Y | |
| Actual (3.45% return) | | $ | 1,000.00 | | | $ | 1,034.50 | | | $ | 5.79 | | |
| Hypothetical (5% annual return before expenses) | | $ | 1,000.00 | | | $ | 1,019.51 | | | $ | 5.75 | | |
@ Expenses are equal to the Portfolio's annualized expense ratios of 0.88% and 1.13% for Class X and Class Y shares, respectively, multiplied by the average account value over the period, multiplied by 184/365 (to reflect the one-half year period).
European Equity
| | | Beginning
Account Value | | Ending
Account Value | | Expenses Paid
During Period@ | |
| | | 07/01/11 | | 12/31/11 | | 07/01/11 –
12/31/11 | |
| Actual (-16.58% return) | | $ | 1,000.00 | | | $ | 834.20 | | | $ | 4.62 | | |
| Hypothetical (5% annual return before expenses) | | $ | 1,000.00 | | | $ | 1,020.16 | | | $ | 5.09 | | |
| Class Y | |
| Actual (-16.69% return) | | $ | 1,000.00 | | | $ | 833.10 | | | $ | 5.78 | | |
| Hypothetical (5% annual return before expenses) | | $ | 1,000.00 | | | $ | 1,018.90 | | | $ | 6.36 | | |
@ Expenses are equal to the Portfolio's annualized expense ratios of 1.00% and 1.25% for Class X and Class Y shares, respectively, multiplied by the average account value over the period, multiplied by 184/365 (to reflect the one-half year period).
Multi Cap Growth
| | | Beginning
Account Value | | Ending
Account Value | | Expenses Paid
During Period@ | |
| | | 07/01/11 | | 12/31/11 | | 07/01/11 –
12/31/11 | |
| Actual (-11.23% return) | | $ | 1,000.00 | | | $ | 887.70 | | | $ | 2.62 | | |
| Hypothetical (5% annual return before expenses) | | $ | 1,000.00 | | | $ | 1,022.43 | | | $ | 2.80 | | |
| Class Y | |
| Actual (-11.33% return) | | $ | 1,000.00 | | | $ | 886.70 | | | $ | 3.80 | | |
| Hypothetical (5% annual return before expenses) | | $ | 1,000.00 | | | $ | 1,021.17 | | | $ | 4.08 | | |
@ Expenses are equal to the Portfolio's annualized expense ratios of 0.55% and 0.80% for Class X and Class Y shares, respectively, multiplied by the average account value over the period, multiplied by 184/365 (to reflect the one-half year period).
21
Morgan Stanley Variable Investment Series
Expense Example n December 31, 2011 (unaudited) continued
Aggressive Equity
| | | Beginning
Account Value | | Ending
Account Value | | Expenses Paid
During Period@ | |
| | | 07/01/11 | | 12/31/11 | | 07/01/11 –
12/31/11 | |
| Class X | |
| Actual (-11.49% return) | | $ | 1,000.00 | | | $ | 885.10 | | | $ | 5.18 | | |
| Hypothetical (5% annual return before expenses) | | $ | 1,000.00 | | | $ | 1,019.71 | | | $ | 5.55 | | |
| Class Y | |
| Actual (-11.60% return) | | $ | 1,000.00 | | | $ | 884.00 | | | $ | 6.36 | | |
| Hypothetical (5% annual return before expenses) | | $ | 1,000.00 | | | $ | 1,018.45 | | | $ | 6.82 | | |
@ Expenses are equal to the Portfolio's annualized expense ratios of 1.09% and 1.34% for Class X and Class Y shares, respectively, multiplied by the average account value over the period, multiplied by 184/365 (to reflect the one-half year period).
Strategist
| | | Beginning
Account Value | | Ending
Account Value | | Expenses Paid
During Period@ | |
| | | 07/01/11 | | 12/31/11 | | 07/01/11 –
12/31/11 | |
| Class X | |
| Actual (-8.93% return) | | $ | 1,000.00 | | | $ | 910.70 | | | $ | 2.89 | | |
| Hypothetical (5% annual return before expenses) | | $ | 1,000.00 | | | $ | 1,022.18 | | | $ | 3.06 | | |
| Class Y | |
| Actual (-9.04% return) | | $ | 1,000.00 | | | $ | 909.60 | | | $ | 4.09 | | |
| Hypothetical (5% annual return before expenses) | | $ | 1,000.00 | | | $ | 1,020.92 | | | $ | 4.33 | | |
@ Expenses are equal to the Portfolio's annualized expense ratios of 0.60% and 0.85% for Class X and Class Y shares, respectively, multiplied by the average account value over the period, multiplied by 184/365 (to reflect the one-half year period). If the Portfolio had borne all of its expenses, the annualized expense ratios would have been 0.63% and 0.88% for Class X and Class Y shares, respectively.
22
Morgan Stanley Variable Investment Series - Money Market
Portfolio of Investments n December 31, 2011
PRINCIPAL
AMOUNT IN
THOUSANDS | |
| | ANNUALIZED
YIELD
ON DATE OF
PURCHASE | | MATURITY
DATE | | VALUE | |
| | | Repurchase Agreements (52.8%) | |
| $ | 20,000 | | | Bank of Nova Scotia, (dated 12/30/11;
proceeds $20,000,067; fully collateralized by
U.S. Government Obligations; U.S. Treasury
Bond 8.00% due 11/15/21; U.S. Treasury
Note 1.75% due 03/31/14; valued at
$20,400,125) | | | 0.03 | % | | 01/03/12 | | $ | 20,000,000 | | |
| | 11,655 | | | BNP Paribas Securities Corp., (dated 12/30/11;
proceeds $11,655,039; fully collateralized by
a U.S. Government Obligation; U.S. Treasury
Note 4.50% due 11/15/15; valued at
$11,888,156) | | | 0.03 | | | 01/03/12 | | | 11,655,000 | | |
| | 5,000 | | | Credit Agricole CIB, (dated 12/30/11;
proceeds $5,000,017; fully collateralized by
a U.S. Government Obligation; U.S. Treasury
Bond 3.38% due 04/15/32; valued at
$5,100,044) | | | 0.03 | | | 01/03/12 | | | 5,000,000 | | |
| | 5,000 | | | ING Financial Markets LLC, (dated 12/30/11;
proceeds $5,000,008; fully collateralized by
U.S. Government Agencies; Federal Home
Loan Mortgage Corporation 2.34%
due 10/01/33; valued at $5,159,524) | | | 0.03 | | | 01/03/12 | | | 5,000,000 | | |
| | 15,000 | | | TD Securities USA LLC, (dated 12/30/11;
proceeds $15,000,017; fully collateralized by
a U.S. Government Obligation; U.S. Treasury
Bond 3.88% due 04/15/29; valued at
$15,300,158) | | | 0.01 | | | 01/03/12 | | | 15,000,000 | | |
| | | Total Repurchase Agreements
(Cost $56,655,000) | | | 56,655,000 | | |
| | | Commercial Paper (26.1%) | |
| | | Domestic Bank (2.6%) | |
| | 2,730 | | | HSBC Bank USA | | | 0.24 | | | 02/21/12 | | | 2,729,053 | | |
| | | International Banks (23.5%) | |
| | 4,705 | | | ABN Amro Funding USA LLC (a) | | | 0.52 - 0.61 | | | 01/26/12 - 01/31/12 | | | 4,702,837 | | |
| | 5,000 | | | Deutsche Bank Financial LLC | | | 0.25 | | | 01/05/12 | | | 4,999,826 | | |
| | 5,000 | | | ING US Funding LLC | | | 0.15 | | | 01/05/12 | | | 4,999,896 | | |
| | 3,000 | | | Nordea North America, Inc. | | | 0.52 | | | 03/15/12 | | | 2,996,781 | | |
| | 3,000 | | | Oversea Chinese Banking | | | 0.43 | | | 01/17/12 - 01/19/12 | | | 2,999,367 | | |
See Notes to Financial Statements
23
Morgan Stanley Variable Investment Series - Money Market
Portfolio of Investments n December 31, 2011 continued
PRINCIPAL
AMOUNT IN
THOUSANDS | |
| | ANNUALIZED
YIELD
ON DATE OF
PURCHASE | | MATURITY
DATE | | VALUE | |
| $ | 1,000 | | | UOB Funding LLC | | | 0.41 | % | | 01/09/12 | | $ | 999,899 | | |
| | 3,500 | | | Westpac Securities NZ Ltd. (a) | | | 0.43 | | | 02/03/12 | | | 3,498,612 | | |
| | | | 25,197,218 | | |
| | | Total Commercial Paper
(Cost $27,926,271) | | | 27,926,271 | | |
| | | Certificates of Deposit (9.3%) | |
| | | International Banks | |
| | 4,000 | | | Skandin Ens Banken | | | 0.38 | | | 02/03/12 | | | 4,000,000 | | |
| | 4,000 | | | Sumitomo Mitsui Banking Corp. | | | 0.21 | | | 01/12/12 | | | 4,000,000 | | |
| | 2,000 | | | Svenska Handelsbanken AB | | | 0.39 - 0.55 | | | 02/06/12 - 04/16/12 | | | 2,000,020 | | |
| | | Total Certificates of Deposit
(Cost $10,000,020) | | | 10,000,020 | | |
| | |
| | COUPON
RATE(b) | | DEMAND
DATE(c) | |
| |
| |
| | | Floating Rate Notes (9.3%) | |
| | | International Banks | |
| | 2,000 | | | ANZ National International Ltd. (a) | | | 0.61 | % | | 03/12/12 | | 06/12/12 | | | 2,000,000 | | |
| | 4,000 | | | Barclays Bank PLC | | | 0.48 | | | 02/06/12 | | 11/05/12 | | | 4,000,000 | | |
| | 3,000 | | | Royal Bank of Canada | | | 0.51 | | | 02/27/12 | | 02/27/12 | | | 3,000,000 | | |
| | 1,000 | | | Westpac Banking Corp. | | | 0.62 | | | 04/05/12 | | 07/05/12 | | | 1,000,000 | | |
| | | | | Total Floating Rate Notes
(Cost $10,000,000) | | | | | | | | | 10,000,000 | | |
| | | Tax-Exempt Instruments (2.8%) | |
| | | Weekly Variable Rate Bonds | |
| | 3,000 | | | Miami-Dade County, FL, Professional
Sports Franchise Facilities
Tax Ser 2009 E
(Cost $3,000,000) | | | 0.09 | | | 01/06/12 | | 10/01/48 | | | 3,000,000 | | |
| | | | | Total Investments
(Cost $107,581,291) | | | 100.3 | % | | | 107,581,291 | | |
| | | | | Liabilities in Excess of Other Assets | | | | | (0.3 | ) | | | (301,183 | ) | |
| | | Net Assets | | | | | 100.0 | % | | $ | 107,280,108 | | |
See Notes to Financial Statements
24
Morgan Stanley Variable Investment Series - Money Market
Portfolio of Investments n December 31, 2011 continued
(a) 144A security — Certain conditions for public sale may exist. Unless otherwise noted, these securities are deemed to be liquid.
(b) Rate shown is the rate in effect at December 31, 2011.
(c) Date of next interest rate reset.
SUMMARY OF INVESTMENTS
MATURITY SCHEDULE†
| 1 - 30 Days | | | 74 | % | |
| 31 - 60 Days | | | 19 | | |
| 61 - 90 Days | | | 5 | | |
| 91 - 120 Days | | | 2 | | |
| | | | 100 | % | |
† As a percentage of total investments.
See Notes to Financial Statements
25
Morgan Stanley Variable Investment Series - Limited Duration
Portfolio of Investments n December 31, 2011
PRINCIPAL
AMOUNT IN
THOUSANDS | |
| | COUPON
RATE | | MATURITY
DATE | | VALUE | |
| | | Corporate Bonds (57.6%) | |
| | | Basic Materials (3.5%) | |
| $ | 350 | | | Anglo American Capital PLC (United Kingdom) (a) | | | 9.375 | % | | 04/08/14 | | $ | 399,747 | | |
| | 190 | | | ArcelorMittal (Luxembourg) | | | 9.00 | | | 02/15/15 | | | 210,205 | | |
| | 230 | | | Barrick Gold Corp. (Canada) | | | 1.75 | | | 05/30/14 | | | 232,404 | | |
| | 350 | | | Dow Chemical Co. (The) | | | 5.90 | | | 02/15/15 | | | 389,733 | | |
| | 115 | | | Ecolab, Inc. | | | 3.00 | | | 12/08/16 | | | 119,093 | | |
| | 260 | | | Kinross Gold Corp. (Canada) (a) | | | 3.625 | | | 09/01/16 | | | 253,582 | | |
| | 350 | | | Potash Corp. of Saskatchewan, Inc. (Canada) | | | 5.25 | | | 05/15/14 | | | 384,340 | | |
| | | | | | 1,989,104 | | |
| | | Communications (5.7%) | |
| | 375 | | | AT&T, Inc. | | | 2.50 | | | 08/15/15 | | | 388,637 | | |
| | 300 | | | Comcast Corp. | | | 6.50 | | | 01/15/15 | | | 340,328 | | |
| | 215 | | | COX Communications, Inc. | | | 4.625 | | | 06/01/13 | | | 226,723 | | |
| | 220 | | | DirecTV Holdings LLC/DirecTV Financing Co., Inc. | | | 4.75 | | | 10/01/14 | | | 237,790 | | |
| | 290 | | | NBC Universal Media LLC | | | 2.10 | | | 04/01/14 | | | 294,939 | | |
| | 145 | | | News America, Inc. | | | 5.30 | | | 12/15/14 | | | 158,031 | | |
| | 375 | | | Telecom Italia Capital SA (Italy) | | | 5.25 | | | 11/15/13 | | | 360,375 | | |
| | 200 | | | Time Warner Cable, Inc. | | | 8.25 | | | 02/14/14 | | | 225,542 | | |
| | 250 | | | Verizon Communications, Inc. | | | 1.25 | | | 11/03/14 | | | 251,411 | | |
| | 350 | | | Viacom, Inc. | | | 4.375 | | | 09/15/14 | | | 375,177 | | |
| | 340 | | | Vodafone Group PLC (United Kingdom) | | | 5.00 | | | 12/16/13 | | | 364,990 | | |
| | | | | | 3,223,943 | | |
| | | Consumer, Cyclical (2.4%) | |
| | 305 | | | Best Buy Co., Inc. | | | 3.75 | | | 03/15/16 | | | 300,758 | | |
| | 280 | | | Daimler Finance North America LLC (a) | | | 1.875 | | | 09/15/14 | | | 278,666 | | |
| | 220 | | | Home Depot, Inc. | | | 5.40 | | | 03/01/16 | | | 254,333 | | |
| | 420 | | | Marriott International, Inc. | | | 4.625 | | | 06/15/12 | | | 425,536 | | |
| | 135 | | | Wesfarmers Ltd. (Australia) (a) | | | 2.983 | | | 05/18/16 | | | 136,213 | | |
| | | | | | 1,395,506 | | |
| | | Consumer, Non-Cyclical (6.6%) | |
| | 250 | | | Altria Group, Inc. | | | 4.125 | | | 09/11/15 | | | 271,633 | | |
| | 165 | | | Anheuser-Busch InBev Worldwide, Inc. (Belgium) | | | 4.125 | | | 01/15/15 | | | 178,024 | | |
| | 205 | | | Anheuser-Busch InBev Worldwide, Inc. (Belgium) | | | 5.375 | | | 11/15/14 | | | 227,934 | | |
| | 200 | | | Aristotle Holding, Inc. (a) | | | 2.75 | | | 11/21/14 | | | 202,564 | | |
| | 265 | | | Bacardi Ltd. (Bermuda) (a) | | | 7.45 | | | 04/01/14 | | | 298,836 | | |
| | 260 | | | Bunge Ltd. Finance Corp. | | | 5.35 | | | 04/15/14 | | | 272,848 | | |
| | 330 | | | Delhaize Group SA (Belgium) | | | 5.875 | | | 02/01/14 | | | 358,350 | | |
| | 350 | | | Gilead Sciences, Inc. | | | 3.05 | | | 12/01/16 | | | 358,627 | | |
| | 300 | | | Kraft Foods, Inc. | | | 6.75 | | | 02/19/14 | | | 333,569 | | |
See Notes to Financial Statements
26
Morgan Stanley Variable Investment Series - Limited Duration
Portfolio of Investments n December 31, 2011 continued
PRINCIPAL
AMOUNT IN
THOUSANDS | |
| | COUPON
RATE | | MATURITY
DATE | | VALUE | |
| $ | 225 | | | Kroger Co. (The) | | | 7.50 | % | | 01/15/14 | | $ | 251,575 | | |
| | 370 | | | McKesson Corp. | | | 3.25 | | | 03/01/16 | | | 391,961 | | |
| | 320 | | | Quest Diagnostics, Inc. | | | 3.20 | | | 04/01/16 | | | 331,661 | | |
| | 250 | | | Stryker Corp. | | | 2.00 | | | 09/30/16 | | | 256,122 | | |
| | | | | | 3,733,704 | | |
| | | Energy (2.3%) | |
| | 225 | | | Enterprise Products Operating LLC, Series O | | | 9.75 | | | 01/31/14 | | | 260,032 | | |
| | 380 | | | Marathon Petroleum Corp. | | | 3.50 | | | 03/01/16 | | | 387,171 | | |
| | 320 | | | Plains All American Pipeline LP/PAA Finance Corp. | | | 4.25 | | | 09/01/12 | | | 326,474 | | |
| | 305 | | | Spectra Energy Capital LLC | | | 5.90 | | | 09/15/13 | | | 324,869 | | |
| | | | | | 1,298,546 | | |
| | | Finance (31.1%) | |
| | 265 | | | ABB Treasury Center USA, Inc. (Switzerland) (a) | | | 2.50 | | | 06/15/16 | | | 266,745 | | |
| | 255 | | | Abbey National Treasury Services PLC
(United Kingdom) | | | 2.875 | | | 04/25/14 | | | 237,854 | | |
| | 575 | | | Abbey National Treasury Services PLC
(United Kingdom) (a) | | | 3.875 | | | 11/10/14 | | | 539,997 | | |
| | 110 | | | Aflac, Inc. | | | 3.45 | | | 08/15/15 | | | 113,614 | | |
| | 475 | | | American Express Co. | | | 7.25 | | | 05/20/14 | | | 530,763 | | |
| | 260 | | | American International Group, Inc. | | | 3.65 | | | 01/15/14 | | | 252,639 | | |
| | 230 | | | Banco Bradesco SA (Brazil) (a) | | | 4.125 | | | 05/16/16 | | | 233,105 | | |
| | 620 | | | Bank of America Corp., Series 1 | | | 3.75 | | | 07/12/16 | | | 574,654 | | |
| | 405 | | | Bank One Corp. | | | 5.25 | | | 01/30/13 | | | 418,878 | | |
| | 315 | | | Barclays Bank PLC (United Kingdom) | | | 2.50 | | | 01/23/13 | | | 313,737 | | |
| | 330 | | | BBVA Bancomer SA (Mexico) (a) | | | 4.50 | | | 03/10/16 | | | 325,050 | | |
| | 200 | | | BBVA US Senior SAU (Spain) | | | 3.25 | | | 05/16/14 | | | 189,551 | | |
| | 320 | | | BNP Paribas SA (France) | | | 3.60 | | | 02/23/16 | | | 300,435 | | |
| | 205 | | | BP Capital Markets PLC (United Kingdom) | | | 3.875 | | | 03/10/15 | | | 219,065 | | |
| | 390 | | | Canadian Imperial Bank of Commerce (Canada) | | | 1.45 | | | 09/13/13 | | | 390,154 | | |
| | 300 | | | Capital One Financial Corp. | | | 7.375 | | | 05/23/14 | | | 329,795 | | |
| | 500 | | | Cie de Financement Foncier (France) (a) | | | 2.25 | | | 03/07/14 | | | 491,755 | | |
| | 475 | | | Citigroup, Inc. (See Note 6) | | | 4.587 | | | 12/15/15 | | | 478,467 | | |
| | 575 | | | Commonwealth Bank of Australia (Australia) (a) | | | 2.75 | | | 10/15/12 | | | 581,718 | | |
| | 340 | | | Credit Suisse (Switzerland) | | | 5.50 | | | 05/01/14 | | | 353,596 | | |
| | 355 | | | Deutsche Bank AG (Germany) | | | 2.375 | | | 01/11/13 | | | 352,457 | | |
| | 975 | | | General Electric Capital Corp. | | | 2.95 | | | 05/09/16 | | | 1,003,792 | | |
| | 300 | | | Genworth Life Institutional Funding Trust (a) | | | 5.875 | | | 05/03/13 | | | 304,992 | | |
| | 425 | | | Goldman Sachs Group, Inc. (The) | | | 3.625 | | | 02/07/16 | | | 411,030 | | |
| | 250 | | | Harley-Davidson Funding Corp. (a) | | | 5.25 | | | 12/15/12 | | | 257,641 | | |
| | 200 | | | HCP, Inc. | | | 2.70 | | | 02/01/14 | | | 199,809 | | |
| | 350 | | | HSBC Finance Corp. | | | 5.25 | | | 04/15/15 | | | 357,438 | | |
See Notes to Financial Statements
27
Morgan Stanley Variable Investment Series - Limited Duration
Portfolio of Investments n December 31, 2011 continued
PRINCIPAL
AMOUNT IN
THOUSANDS | |
| | COUPON
RATE | | MATURITY
DATE | | VALUE | |
| $ | 120 | | | Intesa Sanpaolo SpA (Italy) (a) | | | 3.625 | % | | 08/12/15 | | $ | 99,486 | | |
| | 75 | | | Jefferies Group, Inc. | | | 3.875 | | | 11/09/15 | | | 67,125 | | |
| | 135 | | | JPMorgan Chase & Co. | | | 3.15 | | | 07/05/16 | | | 135,773 | | |
| | 500 | | | Lloyds TSB Bank PLC (United Kingdom) (a) | | | 2.80 | | | 04/02/12 | | | 502,250 | | |
| | 230 | | | Macquarie Group Ltd. (Australia) (a) | | | 7.30 | | | 08/01/14 | | | 239,593 | | |
| | 325 | | | Metropolitan Life Global Funding I (See Note 6) (a) | | | 2.00 | | | 01/10/14 | | | 327,079 | | |
| | 350 | | | Monumental Global Funding III (a) | | | 5.25 | | | 01/15/14 | | | 367,983 | | |
| | 270 | | | Nationwide Building Society (United Kingdom) (a) | | | 4.65 | | | 02/25/15 | | | 267,940 | | |
| | 30 | | | Nissan Motor Acceptance Corp. (Japan) (a) | | | 3.25 | | | 01/30/13 | | | 30,395 | | |
| | 365 | | | Nordea Bank AB (Sweden) (a) | | | 2.50 | | | 11/13/12 | | | 367,499 | | |
| | 270 | | | Principal Financial Group, Inc. | | | 7.875 | | | 05/15/14 | | | 301,203 | | |
| | 320 | | | Prudential Financial, Inc., MTN | | | 4.75 | | | 09/17/15 | | | 338,173 | | |
| | 2,300 | | | Royal Bank of Scotland PLC (The)
(United Kingdom) (a) | | | 2.625 | | | 05/11/12 | | | 2,315,093 | | |
| | 110 | | | Societe Generale SA (France) (a) | | | 3.10 | | | 09/14/15 | | | 96,358 | | |
| | 300 | | | Standard Chartered PLC (United Kingdom) (a) | | | 3.85 | | | 04/27/15 | | | 302,172 | | |
| | 95 | | | SunTrust Banks, Inc. | | | 3.50 | | | 01/20/17 | | | 95,600 | | |
| | 225 | | | Svenska Handelsbanken AB (Sweden) (a) | | | 2.875 | | | 09/14/12 | | | 227,167 | | |
| | 365 | | | TD Ameritrade Holding Corp. | | | 2.95 | | | 12/01/12 | | | 369,645 | | |
| | 365 | | | UBS AG (Switzerland) | | | 3.875 | | | 01/15/15 | | | 364,254 | | |
| | 330 | | | US Bancorp | | | 2.20 | | | 11/15/16 | | | 333,547 | | |
| | 470 | | | Wells Fargo & Co. | | | 3.676 | | | 06/15/16 | | | 491,652 | | |
| | | | | | 17,668,718 | | |
| | | Industrials (1.3%) | |
| | 385 | | | Agilent Technologies, Inc. | | | 4.45 | | | 09/14/12 | | | 392,604 | | |
| | 90 | | | Danaher Corp. | | | 1.30 | | | 06/23/14 | | | 91,348 | | |
| | 250 | | | Waste Management, Inc. | | | 2.60 | | | 09/01/16 | | | 254,034 | | |
| | | | | | 737,986 | | |
| | | Technology (1.4%) | |
| | 160 | | | Applied Materials, Inc. | | | 2.65 | | | 06/15/16 | | | 163,970 | | |
| | 285 | | | Hewlett-Packard Co. | | | 3.30 | | | 12/09/16 | | | 291,345 | | |
| | 330 | | | Texas Instruments, Inc. | | | 1.375 | | | 05/15/14 | | | 334,302 | | |
| | | | | | 789,617 | | |
| | | Utilities (3.3%) | |
| | 300 | | | Commonwealth Edison Co. | | | 1.625 | | | 01/15/14 | | | 302,326 | | |
| | 350 | | | EDF SA (France) (a) | | | 5.50 | | | 01/26/14 | | | 373,971 | | |
| | 350 | | | Enel Finance International N.V. (Italy) (a) | | | 3.875 | | | 10/07/14 | | | 340,942 | | |
| | 215 | | | FirstEnergy Solutions Corp. | | | 4.80 | | | 02/15/15 | | | 229,634 | | |
See Notes to Financial Statements
28
Morgan Stanley Variable Investment Series - Limited Duration
Portfolio of Investments n December 31, 2011 continued
PRINCIPAL
AMOUNT IN
THOUSANDS | |
| | COUPON
RATE | | MATURITY
DATE | | VALUE | |
| $ | 265 | | | NextEra Energy Capital Holdings, Inc. | | | 5.35 | % | | 06/15/13 | | $ | 279,644 | | |
| | 320 | | | Sempra Energy | | | 2.00 | | | 03/15/14 | | | 324,228 | | |
| | | | | | 1,850,745 | | |
| | | | | Total Corporate Bonds
(Cost $32,491,413) | | | | | | | 32,687,869 | | |
| | | Asset-Backed Securities (22.3%) | | | |
| | | Ally Master Owner Trust | | | |
| | 100 | | | (a) | | | 2.028 | (b) | | 01/15/15 | | | 101,240 | | |
| | 200 | | | | | | | | 2.15 | | | 01/15/16 | | | 202,260 | | |
| | 225 | | | (a) | | | 2.88 | | | 04/15/15 | | | 228,782 | | |
| | 800 | | | American Express Credit Account Master Trust | | | 1.528 | (b) | | 03/15/17 | | | 823,318 | | |
| | 72 | | | ARI Fleet Lease Trust (a) | | | 1.728 | (b) | | 08/15/18 | | | 71,689 | | |
| | 807 | | | Capital One Multi-Asset Execution Trust | | | 0.358 | (b) | | 09/15/15 | | | 806,012 | | |
| | 225 | | | CarMax Auto Owner Trust | | | 1.29 | | | 09/15/15 | | | 226,236 | | |
| | 87 | | | Chesapeake Funding LLC (a) | | | 2.278 | (b) | | 12/15/20 | | | 87,641 | | |
| | 600 | | | Citibank Credit Card Issuance Trust (See Note 6) | | | 2.25 | | | 12/23/14 | | | 609,013 | | |
| | | CNH Equipment Trust | | | |
| | 551 | | | | | | | | 1.17 | | | 05/15/15 | | | 551,250 | | |
| | 256 | | | | | | | | 1.54 | | | 07/15/14 | | | 256,624 | | |
| | 850 | | | Discover Card Master Trust | | | 1.578 | (b) | | 12/15/14 | | | 855,066 | | |
| | | Ford Credit Floorplan Master Owner Trust | | | |
| | 775 | | | | | | | | 1.828 | (b) | | 09/15/14 | | | 780,981 | | |
| | 375 | | | (a) | | | 4.20 | | | 02/15/17 | | | 403,364 | | |
| | 1,150 | | | GE Capital Credit Card Master Note Trust | | | 2.378 | (b) | | 04/15/15 | | | 1,156,904 | | |
| | 330 | | | GE Dealer Floorplan Master Note Trust | | | 0.885 | (b) | | 07/20/16 | | | 329,790 | | |
| | 425 | | | GE Equipment Midticket LLC (a) | | | 0.94 | | | 07/14/14 | | | 424,840 | | |
| | | Harley-Davidson Motorcycle Trust | | | |
| | 625 | | | | | | | | 1.16 | | | 02/15/15 | | | 626,535 | | |
| | 174 | | | | | | | | 1.87 | | | 02/15/14 | | | 174,348 | | |
| | 26 | | | Huntington Auto Trust (a) | | | 3.94 | | | 06/17/13 | | | 25,934 | | |
| | 310 | | | Hyundai Auto Lease Securitization Trust 2011-A (a) | | | 1.02 | | | 08/15/14 | | | 309,414 | | |
| | 535 | | | Hyundai Auto Receivables Trust | | | 1.50 | | | 10/15/14 | | | 536,797 | | |
| | 525 | | | Macquarie Equipment Funding Trust (a) | | | 1.21 | | | 09/20/13 | | | 524,948 | | |
| | 240 | | | MMAF Equipment Finance LLC (a) | | | 2.37 | | | 11/15/13 | | | 240,897 | | |
| | | MMCA Automobile Trust | | | |
| | 225 | | | (a) | | | 1.22 | | | 01/15/15 | | | 225,412 | | |
| | 326 | | | (a) | | | 1.39 | | | 01/15/14 | | | 326,591 | | |
| | 13 | | | Navistar Financial Corp. Owner Trust (a) | | | 1.47 | | | 10/18/12 | | | 12,999 | | |
| | 575 | | | Nissan Auto Lease Trust | | | 1.12 | | | 12/15/13 | | | 576,477 | | |
| | 200 | | | Nissan Master Owner Trust Receivables (a) | | | 1.428 | (b) | | 01/15/15 | | | 201,528 | | |
See Notes to Financial Statements
29
Morgan Stanley Variable Investment Series - Limited Duration
Portfolio of Investments n December 31, 2011 continued
PRINCIPAL
AMOUNT IN
THOUSANDS | |
| | COUPON
RATE | | MATURITY
DATE | | VALUE | |
| | | North Carolina State Education Assistance Authority | | | |
| $ | 277 | | | | | | 0.868 | (b)% | | 01/25/21 | | $ | 277,010 | | |
| | 225 | | | | | | | | 1.218 | (b) | | 07/25/25 | | | 217,748 | | |
| | 100 | | | Panhandle-Plains Higher Education Authority, Inc. | | | 1.322 | (b) | | 07/01/24 | | | 97,894 | | |
| | 270 | | | Toyota Auto Receivables Owner Trust | | | 1.27 | | | 12/16/13 | | | 270,414 | | |
| | 89 | | | Wheels SPV LLC (a) | | | 1.828 | (b) | | 03/15/18 | | | 89,140 | | |
| | | | | Total Asset-Backed Securities
(Cost $12,568,783) | | | | | | | 12,649,096 | | |
| | | U.S. Treasury Securities (8.5%) | | | |
| | | U.S. Treasury Notes | | | |
| | 2,315 | | | | | | | | 1.25 | | | 08/31/15 | | | 2,376,855 | | |
| | 2,275 | | | | | | | | 2.25 | | | 03/31/16 | | | 2,426,963 | | |
| | | | | Total U.S. Treasury Securities
(Cost $4,730,500) | | | | | | | 4,803,818 | | |
| | | Non-U.S. Government - Guaranteed (5.8%) | | | |
| | 900 | | | Commonwealth Bank of Australia (Australia) (a) | | | 2.50 | | | 12/10/12 | | | 915,432 | | |
| | 1,545 | | | Swedbank AB (Sweden) (a) | | | 2.90 | | | 01/14/13 | | | 1,582,117 | | |
| | 810 | | | Westpac Securities NZ Ltd. (New Zealand) (a) | | | 2.50 | | | 05/25/12 | | | 815,034 | | |
| | | | | Total Non-U.S. Government - Guaranteed
(Cost $3,249,897) | | | | | | | 3,312,583 | | |
| | | Sovereign (1.0%) | | | |
| | 577 | | | Societe Financement de l'Economie Francaise (France)
(Cost $574,767) (a) | | | 3.375 | | | 05/05/14 | | | 591,810 | | |
| | | Agency Fixed Rate Mortgages (0.8%) | | | |
| | | Federal National Mortgage Association,
Conventional Pools: | | | |
| | 281 | | | | | | | | 6.50 | | | 01/01/32 - 11/01/33 | | | 319,221 | | |
| | 126 | | | | | | | | 7.00 | | | 08/01/29 - 06/01/32 | | | 146,757 | | |
| | | | | Total Agency Fixed Rate Mortgages
(Cost $424,874) | | | | | | | 465,978 | | |
| | | Agency Adjustable Rate Mortgages (0.7%) | | | |
| | 88 | | | Federal Home Loan Mortgage Corporation,
Conventional Pools | | | 5.462 | (b) | | 01/01/38 | | | 94,326 | | |
| | 271 | | | Federal National Mortgage Association,
Conventional Pools | | | 2.396 | (b) | | 05/01/35 | | | 286,018 | | |
| | | | | Total Agency Adjustable Rate Mortgages
(Cost $378,208) | | | | | | | 380,344 | | |
See Notes to Financial Statements
30
Morgan Stanley Variable Investment Series - Limited Duration
Portfolio of Investments n December 31, 2011 continued
PRINCIPAL
AMOUNT IN
THOUSANDS | |
| | COUPON
RATE | | MATURITY
DATE | | VALUE | |
| | | Collateralized Mortgage Obligation - Agency Collateral Series (0.6%) | |
| $ | 307 | | | Federal Home Loan Mortgage Corporation, REMIC
(Cost $328,119) | | | 7.50 | % | | 09/15/29 | | $ | 356,141 | | |
| | | Municipal Bond (0.5%) | |
| | 300 | | | New Jersey Economic Development Authority
(Cost $300,000) | | | 1.546 | (b) | | 06/15/13 | | | 300,066 | | |
| | | Commercial Mortgage Backed Security (0.4%) | |
| | 190 | | | Wachovia Bank Commercial Mortgage Trust
(Cost $193,399) | | | 5.316 | (b) | | 07/15/41 | | | 204,468 | | |
| | | Short-Term Investments (1.4%) | |
| | | U.S. Treasury Security (1.2%) | |
| | 675 | | | U.S. Treasury Bill
(Cost $674,973) (c)(d) | | | 0.018 | | | 03/22/12 | | | 674,978 | | |
NUMBER OF
SHARES (000) | |
| |
| |
| |
| |
| | | Investment Company (0.2%) | |
| | | 111Morgan Stanley Institutional Liquidity Funds - Money
Market Portfolio - Institutional Class (See Note 6)
(Cost $110,511) | | | 110,511 | | |
| | | | | Total Short-Term Investments
(Cost $785,484) | | | | | | | 785,489 | | |
| | | | | Total Investments
(Cost $56,025,444) (e) | | | | | 99.6 | % | | | 56,537,662 | | |
| | | | | Other Assets in Excess of Liabilities | | | | | 0.4 | | | | 239,786 | | |
| | | | | Net Assets | | | | | 100.0 | % | | $ | 56,777,448 | | |
MTN Medium Term Note.
REMIC Real Estate Mortgage Investment Conduit.
(a) 144A security — Certain conditions for public sale may exist. Unless otherwise noted, these securities are deemed to be liquid.
(b) Variable/Floating Rate Security — Interest rate changes on these instruments are based on changes in a designated base rate. The rates shown are those in effect on December 31, 2011.
(c) A portion of this security has been physically segregated in connection with open futures contracts and swap agreements.
(d) Rate shown is the yield to maturity at December 31, 2011.
(e) Securities are available for collateral in connection with open futures contracts and swap agreements.
See Notes to Financial Statements
31
Morgan Stanley Variable Investment Series - Limited Duration
Portfolio of Investments n December 31, 2011 continued
FUTURES CONTRACTS OPEN AT DECEMBER 31, 2011:
NUMBER OF
CONTRACTS | | LONG/SHORT | | DESCRIPTION, DELIVERY
MONTH AND YEAR | | UNDERLYING FACE
AMOUNT AT VALUE | | UNREALIZED
APPRECIATION
(DEPRECIATION) | |
| | 48 | | | Long | | U.S. Treasury 2 yr. Note,
Mar-12 | | $ | 10,586,250 | | | $ | 5,778 | | |
| | 42 | | | Long | | U.S. Treasury 5 yr. Note,
Mar-12 | | | 5,176,828 | | | | 23,953 | | |
| | 2 | | | Short | | U.S. Treasury 10 yr. Note,
Mar-12 | | | (262,250 | ) | | | (2,133 | ) | |
| Net Unrealized Appreciation | | $ | 27,598 | | |
ZERO COUPON SWAP AGREEMENTS OPEN AT DECEMBER 31, 2011:
SWAP
COUNTERPARTY | | NOTIONAL
AMOUNT
(000) | |
FLOATING
RATE INDEX | |
PAY/RECEIVE
FLOATING RATE | |
TERMINATION
DATE | | UNREALIZED
APPRECIATION
(DEPRECIATION) | |
| Barclays Bank PLC | | $ | 1,153 | | | 3 Month LIBOR | | Pay | | 11/15/19 | | $ | 213,184 | | |
| Barclays Bank PLC | | | 973 | | | 3 Month LIBOR | | Receive | | 11/15/19 | | | (383,383 | ) | |
| Deutsche Bank | | | 626 | | | 3 Month LIBOR | | Receive | | 11/15/21 | | | (256,907 | ) | |
| Deutsche Bank | | | 733 | | | 3 Month LIBOR | | Pay | | 11/15/21 | | | 156,113 | | |
| Net Unrealized Depreciation | | $ | (270,993 | ) | |
LIBOR London Interbank Offered Rate.
| LONG TERM CREDIT ANALYSIS++ | |
| AAA | | | 35.6 | % | |
| AA | | | 25.8 | | |
| A | | | 20.5 | | |
| BBB | | | 17.9 | | |
| Not Rated | | | 0.2 | | |
| | | | 100.0 | %+ | |
+ Does not include open long/short futures contracts with an underlying face amount of $16,025,328 and net unrealized appreciation of $27,598. Also does not include open swap agreements with net unrealized depreciation of $270,993.
++ The ratings shown are based on the Portfolio's security ratings as determined by Standard & Poor's, Moody's or Fitch, each a Nationally Recognized Statistical Ratings Organization ("NRSRO").
See Notes to Financial Statements
32
Morgan Stanley Variable Investment Series - Income Plus
Portfolio of Investments n December 31, 2011
PRINCIPAL
AMOUNT IN
THOUSANDS | |
| | COUPON
RATE | | MATURITY
DATE | | VALUE | |
| | | Corporate Bonds (94.7%) | |
| | | Basic Materials (6.5%) | |
| $ | 820 | | | ArcelorMittal (Luxembourg) | | | 9.85 | % | | 06/01/19 | | $ | 913,235 | | |
| | 1,570 | | | CF Industries, Inc. | | | 6.875 | | | 05/01/18 | | | 1,801,575 | | |
| | 550 | | | Ecolab, Inc. | | | 3.00 | | | 12/08/16 | | | 569,576 | | |
| | 215 | | | Ecolab, Inc. | | | 4.35 | | | 12/08/21 | | | 230,061 | | |
| | 540 | | | FMG Resources August 2006 Pty Ltd.
(Australia) (a) | | | 6.375 | | | 02/01/16 | | | 526,500 | | |
| | 205 | | | FMG Resources August 2006 Pty Ltd.
(Australia) (a) | | | 6.875 | | | 02/01/18 | | | 197,313 | | |
| | 440 | | | Georgia-Pacific LLC | | | 7.75 | | | 11/15/29 | | | 555,228 | | |
| | 595 | | | Georgia-Pacific LLC | | | 8.875 | | | 05/15/31 | | | 820,051 | | |
| | 203 | | | Goldcorp, Inc. (Canada) | | | 2.00 | | | 08/01/14 | | | 249,436 | | |
| | 535 | | | Incitec Pivot Ltd. (Australia) (a) | | | 4.00 | | | 12/07/15 | | | 546,434 | | |
| | 580 | | | Kinross Gold Corp. (Canada) (a) | | | 5.125 | | | 09/01/21 | | | 570,293 | | |
| | 545 | | | Lubrizol Corp. | | | 8.875 | | | 02/01/19 | | | 749,901 | | |
| | 164 | | | Lyondell Chemical Co. | | | 8.00 | | | 11/01/17 | | | 179,990 | | |
| | 110 | | | LyondellBasell Industries (Netherlands) (a) | | | 6.00 | | | 11/15/21 | | | 114,675 | | |
| | 1,325 | | | MeadWestvaco Corp. | | | 7.375 | | | 09/01/19 | | | 1,541,566 | | |
| | 1,075 | | | Reliance Steel & Aluminum Co. | | | 6.85 | | | 11/15/36 | | | 1,076,281 | | |
| | 605 | | | Teck Resources Ltd. (Canada) | | | 4.75 | | | 01/15/22 | | | 651,615 | | |
| | 705 | | | Teck Resources Ltd. (Canada) | | | 6.25 | | | 07/15/41 | | | 817,378 | | |
| | 195 | | | Vale Overseas Ltd. (Brazil) | | | 6.875 | | | 11/21/36 | | | 222,993 | | |
| | 210 | | | Vale Overseas Ltd. (Brazil) | | | 6.875 | | | 11/10/39 | | | 241,584 | | |
| | | | | | 12,575,685 | | |
| | | Communications (12.3%) | |
| | 1,700 | | | AT&T, Inc. | | | 5.35 | | | 09/01/40 | | | 1,919,710 | | |
| | 875 | | | AT&T, Inc. | | | 6.30 | | | 01/15/38 | | | 1,078,042 | | |
| | 310 | | | Cablevision Systems Corp. | | | 7.75 | | | 04/15/18 | | | 330,150 | | |
| | 655 | | | CenturyLink, Inc. | | | 6.45 | | | 06/15/21 | | | 657,356 | | |
| | 325 | | | CenturyLink, Inc., Series Q | | | 6.15 | | | 09/15/19 | | | 326,981 | | |
| | 700 | | | Comcast Corp. | | | 5.15 | | | 03/01/20 | | | 797,408 | | |
| | 820 | | | Comcast Corp. | | | 6.40 | | | 05/15/38 | | | 988,593 | | |
| | 100 | | | Comcast Corp. | | | 6.45 | | | 03/15/37 | | | 121,636 | | |
| | 505 | | | Corning, Inc. | | | 7.25 | | | 08/15/36 | | | 610,662 | | |
| | 110 | | | COX Communications, Inc. (a) | | | 8.375 | | | 03/01/39 | | | 147,752 | | |
| | 195 | | | CSC Holdings LLC (a) | | | 6.75 | | | 11/15/21 | | | 206,213 | | |
| | 315 | | | Deutsche Telekom International Finance BV
(Germany) | | | 6.75 | | | 08/20/18 | | | 376,142 | | |
| | 300 | | | Deutsche Telekom International Finance BV
(Germany) | | | 8.75 | | | 06/15/30 | | | 419,578 | | |
See Notes to Financial Statements
33
Morgan Stanley Variable Investment Series - Income Plus
Portfolio of Investments n December 31, 2011 continued
PRINCIPAL
AMOUNT IN
THOUSANDS | |
| | COUPON
RATE | | MATURITY
DATE | | VALUE | |
| $ | 500 | | | DirecTV Holdings LLC/DirecTV
Financing Co., Inc. | | | 5.875 | % | | 10/01/19 | | $ | 563,697 | | |
| | 175 | | | Expedia, Inc. | | | 5.95 | | | 08/15/20 | | | 176,771 | | |
| | 75 | | | Frontier Communications Corp. | | | 8.50 | | | 04/15/20 | | | 77,156 | | |
| | 381 | | | Liberty Interactive LLC | | | 3.125 | | | 03/30/23 | | | 428,149 | | |
| | 1,045 | | | NBC Universal Media LLC | | | 4.375 | | | 04/01/21 | | | 1,104,937 | | |
| | 510 | | | News America, Inc. | | | 6.40 | | | 12/15/35 | | | 560,633 | | |
| | 165 | | | News America, Inc. | | | 6.65 | | | 11/15/37 | | | 187,546 | | |
| | 375 | | | Omnicom Group, Inc. | | | 0.00 | | | 07/01/38 | | | 397,500 | | |
| | 260 | | | Qwest Corp. | | | 6.875 | | | 09/15/33 | | | 259,555 | | |
| | 430 | | | Sable International Finance Ltd.
(United Kingdom) (a) | | | 7.75 | | | 02/15/17 | | | 432,150 | | |
| | 351 | | | SBA Communications Corp. | | | 1.875 | | | 05/01/13 | | | 397,946 | | |
| | 305 | | | SBA Telecommunications, Inc. | | | 8.25 | | | 08/15/19 | | | 333,213 | | |
| | 350 | | | Symantec Corp., Series B | | | 1.00 | | | 06/15/13 | | | 391,563 | | |
| | 1,280 | | | Telecom Italia Capital SA (Italy) | | | 7.175 | | | 06/18/19 | | | 1,201,181 | | |
| | 1,330 | | | Telefonica Europe BV (Spain) | | | 8.25 | | | 09/15/30 | | | 1,466,368 | | |
| | 640 | | | Telstra Corp., Ltd. (Australia) (a) | | | 4.80 | | | 10/12/21 | | | 680,083 | | |
| | 1,200 | | | Time Warner Cable, Inc. | | | 6.75 | | | 07/01/18 | | | 1,427,174 | | |
| | 610 | | | Time Warner, Inc. | | | 6.50 | | | 11/15/36 | | | 738,459 | | |
| | 1,295 | | | Time Warner, Inc. | | | 7.70 | | | 05/01/32 | | | 1,694,429 | | |
| | 980 | | | Verizon Communications, Inc. | | | 4.75 | | | 11/01/41 | | | 1,059,041 | | |
| | 150 | | | Verizon Communications, Inc. | | | 6.40 | | | 02/15/38 | | | 191,084 | | |
| | 715 | | | Verizon Communications, Inc. | | | 8.95 | | | 03/01/39 | | | 1,148,864 | | |
| | 335 | | | Vivendi SA (France) (a) | | | 6.625 | | | 04/04/18 | | | 381,234 | | |
| | 555 | | | WPP Finance 2010 (United Kingdom) (a) | | | 4.75 | | | 11/21/21 | | | 552,032 | | |
| | | | | | 23,830,988 | | |
| | | Consumer, Cyclical (4.5%) | |
| | 1,105 | | | Chrysler Group LLC/CG Co-Issuer, Inc. (a) | | | 8.00 | | | 06/15/19 | | | 1,016,600 | | |
| | 395 | | | Daimler Finance North America LLC (Germany) | | | 8.50 | | | 01/18/31 | | | 553,794 | | |
| | 164 | | | DR Horton, Inc., Series DHI | | | 2.00 | | | 05/15/14 | | | 192,290 | | |
| | 925 | | | Gap, Inc. (The) | | | 5.95 | | | 04/12/21 | | | 883,806 | | |
| | 405 | | | Hyatt Hotels Corp. (a) | | | 6.875 | | | 08/15/19 | | | 452,623 | | |
| | 105 | | | Ingram Micro, Inc. | | | 5.25 | | | 09/01/17 | | | 108,291 | | |
| | 208 | | | International Game Technology | | | 3.25 | | | 05/01/14 | | | 247,260 | | |
| | 210 | | | JC Penney Co., Inc. | | | 5.65 | | | 06/01/20 | | | 206,850 | | |
| | 455 | | | JC Penney Corp., Inc. | | | 6.375 | | | 10/15/36 | | | 382,769 | | |
| | 285 | | | Levi Strauss & Co. | | | 7.625 | | | 05/15/20 | | | 292,481 | | |
| | 620 | | | QVC, Inc. (a) | | | 7.125 | | | 04/15/17 | | | 660,300 | | |
| | 227 | | | RadioShack Corp. (a) | | | 2.50 | | | 08/01/13 | | | 218,204 | | |
| | 315 | | | Whirlpool Corp., MTN | | | 8.60 | | | 05/01/14 | | | 351,768 | | |
See Notes to Financial Statements
34
Morgan Stanley Variable Investment Series - Income Plus
Portfolio of Investments n December 31, 2011 continued
PRINCIPAL
AMOUNT IN
THOUSANDS | |
| | COUPON
RATE | | MATURITY
DATE | | VALUE | |
| $ | 800 | | | Wyndham Worldwide Corp. | | | 5.625 | % | | 03/01/21 | | $ | 827,526 | | |
| | 365 | | | Wyndham Worldwide Corp. | | | 5.75 | | | 02/01/18 | | | 386,892 | | |
| | 590 | | | Wynn Las Vegas LLC/Wynn Las Vegas
Capital Corp. | | | 7.75 | | | 08/15/20 | | | 657,850 | | |
| | 1,040 | | | Yum! Brands, Inc. | | | 6.875 | | | 11/15/37 | | | 1,332,160 | | |
| | | | | | 8,771,464 | | |
| | | Consumer, Non-Cyclical (7.5%) | |
| | 245 | | | Amgen, Inc. | | | 3.875 | | | 11/15/21 | | | 247,737 | | |
| | 416 | | | Archer-Daniels-Midland Co. | | | 0.875 | | | 02/15/14 | | | 420,160 | | |
| | 795 | | | Boston Scientific Corp. | | | 6.00 | | | 01/15/20 | | | 888,922 | | |
| | 580 | | | Bunge Ltd. Finance Corp. | | | 8.50 | | | 06/15/19 | | | 707,008 | | |
| | 995 | | | Cigna Corp. | | | 2.75 | | | 11/15/16 | | | 993,943 | | |
| | 740 | | | ConAgra Foods, Inc. | | | 8.25 | | | 09/15/30 | | | 941,280 | | |
| | 165 | | | Constellation Brands, Inc. | | | 7.25 | | | 09/01/16 | | | 182,119 | | |
| | 1,185 | | | Delhaize Group SA (Belgium) | | | 5.70 | | | 10/01/40 | | | 1,220,831 | | |
| | 420 | | | Gilead Sciences, Inc. | | | 1.00 | | | 05/01/14 | | | 462,000 | | |
| | 180 | | | Gilead Sciences, Inc. | | | 5.65 | | | 12/01/41 | | | 200,039 | | |
| | 490 | | | Grupo Bimbo SAB de CV (Mexico) (a) | | | 4.875 | | | 06/30/20 | | | 521,065 | | |
| | 700 | | | Kraft Foods, Inc. | | | 6.875 | | | 02/01/38 | | | 930,136 | | |
| | 400 | | | Kraft Foods, Inc. | | | 6.875 | | | 01/26/39 | | | 534,771 | | |
| | 300 | | | Life Technologies Corp. | | | 1.50 | | | 02/15/24 | | | 301,500 | | |
| | 415 | | | Life Technologies Corp. | | | 6.00 | | | 03/01/20 | | | 464,662 | | |
| | 835 | | | Lorillard Tobacco Co. | | | 8.125 | | | 06/23/19 | | | 996,085 | | |
| | 330 | | | Molson Coors Brewing Co. | | | 2.50 | | | 07/30/13 | | | 351,038 | | |
| | 300 | | | Mylan, Inc. | | | 1.25 | | | 03/15/12 | | | 302,250 | | |
| | 365 | | | Quest Diagnostics, Inc. | | | 6.95 | | | 07/01/37 | | | 455,308 | | |
| | 800 | | | Sigma Alimentos SA de CV (Mexico) (a) | | | 5.625 | | | 04/14/18 | | | 820,000 | | |
| | 665 | | | Teva Pharmaceutical Finance IV BV (Israel) | | | 3.65 | | | 11/10/21 | | | 677,789 | | |
| | 520 | | | TreeHouse Foods, Inc. | | | 7.75 | | | 03/01/18 | | | 564,200 | | |
| | 630 | | | Verisk Analytics, Inc. | | | 5.80 | | | 05/01/21 | | | 679,421 | | |
| | 280 | | | Vertex Pharmaceuticals, Inc. | | | 3.35 | | | 10/01/15 | | | 295,050 | | |
| | 235 | | | Viropharma, Inc. | | | 2.00 | | | 03/15/17 | | | 373,062 | | |
| | | | | | 14,530,376 | | |
| | | Energy (7.2%) | |
| | 356 | | | Alpha Natural Resources, Inc. | | | 2.375 | | | 04/15/15 | | | 332,860 | | |
| | 85 | | | Alpha Natural Resources, Inc. | | | 6.00 | | | 06/01/19 | | | 82,875 | | |
| | 370 | | | Alpha Natural Resources, Inc. | | | 6.25 | | | 06/01/21 | | | 360,750 | | |
| | 600 | | | Anadarko Petroleum Corp. | | | 6.95 | | | 06/15/19 | | | 717,362 | | |
| | 175 | | | Anadarko Petroleum Corp. | | | 8.70 | | | 03/15/19 | | | 223,736 | | |
| | 394 | | | Chesapeake Energy Corp. | | | 2.75 | | | 11/15/35 | | | 387,105 | | |
See Notes to Financial Statements
35
Morgan Stanley Variable Investment Series - Income Plus
Portfolio of Investments n December 31, 2011 continued
PRINCIPAL
AMOUNT IN
THOUSANDS | |
| | COUPON
RATE | | MATURITY
DATE | | VALUE | |
| $ | 150 | | | Concho Resources, Inc. | | | 7.00 | % | | 01/15/21 | | $ | 161,812 | | |
| | 745 | | | Continental Resources, Inc. | | | 7.125 | | | 04/01/21 | | | 812,050 | | |
| | 1,320 | | | Energy Transfer Partners LP | | | 9.00 | | | 04/15/19 | | | 1,572,261 | | |
| | 275 | | | Enterprise Products Operating LLC | | | 5.25 | | | 01/31/20 | | | 304,140 | | |
| | 850 | | | Enterprise Products Operating LLC | | | 5.95 | | | 02/01/41 | | | 956,207 | | |
| | 625 | | | EQT Corp. | | | 4.875 | | | 11/15/21 | | | 632,130 | | |
| | 360 | | | EQT Corp. | | | 8.125 | | | 06/01/19 | | | 422,872 | | |
| | 400 | | | Gazprom OAO Via Gaz Capital SA (Russia) (a) | | | 6.51 | | | 03/07/22 | | | 408,000 | | |
| | 885 | | | Kinder Morgan Finance Co. ULC | | | 5.70 | | | 01/05/16 | | | 909,337 | | |
| | 325 | | | Marathon Petroleum Corp. | | | 5.125 | | | 03/01/21 | | | 340,139 | | |
| | 775 | | | Marathon Petroleum Corp. | | | 6.50 | | | 03/01/41 | | | 881,294 | | |
| | 325 | | | MarkWest Energy Partners LP/MarkWest Energy
Finance Corp. | | | 6.25 | | | 06/15/22 | | | 341,250 | | |
| | 410 | | | Petrobras International Finance Co. (Brazil) | | | 5.75 | | | 01/20/20 | | | 440,799 | | |
| | 1,095 | | | Plains All American Pipeline LP/PAA
Finance Corp. | | | 6.70 | | | 05/15/36 | | | 1,305,145 | | |
| | 675 | | | Plains All American Pipeline LP/PAA
Finance Corp. | | | 8.75 | | | 05/01/19 | | | 863,532 | | |
| | 225 | | | Spectra Energy Capital LLC | | | 8.00 | | | 10/01/19 | | | 283,570 | | |
| | 485 | | | Transocean, Inc. (Cayman Islands) | | | 6.375 | | | 12/15/21 | | | 516,453 | | |
| | 700 | | | Valero Energy Corp. | | | 6.125 | | | 02/01/20 | | | 779,884 | | |
| | | | | | 14,035,563 | | |
| | | Finance (42.6%) | |
| | 1,125 | | | Aegon N.V. (Netherlands) | | | 4.625 | | | 12/01/15 | | | 1,167,327 | | |
| | 700 | | | Ally Financial, Inc. | | | 6.25 | | | 12/01/17 | | | 677,845 | | |
| | 1,285 | | | American Financial Group, Inc. | | | 9.875 | | | 06/15/19 | | | 1,496,661 | | |
| | 720 | | | American International Group, Inc. | | | 6.40 | | | 12/15/20 | | | 727,872 | | |
| | 432 | | | Ares Capital Corp. (a) | | | 5.75 | | | 02/01/16 | | | 417,960 | | |
| | 1,150 | | | Banco de Credito del Peru (Peru) (a) | | | 4.75 | | | 03/16/16 | | | 1,158,625 | | |
| | 990 | | | Banco Votorantim SA (Brazil) (a) | | | 5.25 | | | 02/11/16 | | | 1,005,840 | | |
| | 1,865 | | | Bank of America Corp. | | | 5.75 | | | 12/01/17 | | | 1,763,689 | | |
| | 780 | | | Barclays Bank PLC (United Kingdom) (a) | | | 6.05 | | | 12/04/17 | | | 708,726 | | |
| | 700 | | | Barclays Bank PLC (United Kingdom) | | | 6.75 | | | 05/22/19 | | | 777,177 | | |
| | 1,135 | | | BBVA Bancomer SA (Mexico) (a) | | | 4.50 | | | 03/10/16 | | | 1,117,975 | | |
| | 900 | | | BBVA US Senior SAU (Spain) | | | 3.25 | | | 05/16/14 | | | 852,979 | | |
| | 610 | | | Bear Stearns Cos. LLC (The) | | | 5.55 | | | 01/22/17 | | | 645,600 | | |
| | 540 | | | BNP Paribas SA (France) | | | 5.00 | | | 01/15/21 | | | 520,676 | | |
| | 950 | | | Boston Properties LP | | | 3.70 | | | 11/15/18 | | | 971,493 | | |
| | 1,025 | | | Brandywine Operating Partnership LP | | | 4.95 | | | 04/15/18 | | | 1,010,332 | | |
| | 490 | | | Brookfield Asset Management, Inc. (Canada) | | | 5.80 | | | 04/25/17 | | | 520,625 | | |
| | 780 | | | Capital One Bank, USA NA | | | 8.80 | | | 07/15/19 | | | 893,567 | | |
See Notes to Financial Statements
36
Morgan Stanley Variable Investment Series - Income Plus
Portfolio of Investments n December 31, 2011 continued
PRINCIPAL
AMOUNT IN
THOUSANDS | |
| | COUPON
RATE | | MATURITY
DATE | | VALUE | |
| $ | 800 | | | Capital One Capital VI | | | 8.875 | % | | 05/15/40 | | $ | 834,313 | | |
| | 1,735 | | | Citigroup, Inc. (See Note 6) | | | 5.875 | | | 05/29/37 | | | 1,738,531 | | |
| | 1,230 | | | Citigroup, Inc. (See Note 6) | | | 8.50 | | | 05/22/19 | | | 1,449,856 | | |
| | 700 | | | CNA Financial Corp. | | | 7.35 | | | 11/15/19 | | | 781,332 | | |
| | 260 | | | Cooperatieve Centrale Raiffeisen-Boerenleenbank
BA (Netherlands) (a) | | | 11.00 | (b) | | 06/30/19(c) | | | 305,530 | | |
| | 1,455 | | | Credit Agricole SA (France) (a) | | | 8.375 | (b) | | 10/13/19(c) | | | 1,098,525 | | |
| | 765 | | | Credit Suisse (Switzerland) | | | 5.40 | | | 01/14/20 | | | 722,671 | | |
| | 280 | | | Credit Suisse (Switzerland) | | | 6.00 | | | 02/15/18 | | | 276,493 | | |
| | 800 | | | Dexus Diversified Trust/Dexus Office Trust
(Australia) (a) | | | 5.60 | | | 03/15/21 | | | 814,426 | | |
| | 775 | | | Digital Realty Trust LP | | | 5.25 | | | 03/15/21 | | | 777,854 | | |
| | 425 | | | Discover Bank | | | 7.00 | | | 04/15/20 | | | 445,363 | | |
| | 715 | | | Discover Bank | | | 8.70 | | | 11/18/19 | | | 816,419 | | |
| | 270 | | | ERP Operating LP | | | 4.625 | | | 12/15/21 | | | 275,869 | | |
| | 750 | | | Farmers Insurance Exchange (a) | | | 8.625 | | | 05/01/24 | | | 931,019 | | |
| | 600 | | | Ford Motor Credit Co. LLC | | | 5.00 | | | 05/15/18 | | | 603,056 | | |
| | 545 | | | General Electric Capital Corp. | | | 5.30 | | | 02/11/21 | | | 583,636 | | |
| | 75 | | | General Electric Capital Corp., MTN | | | 5.875 | | | 01/14/38 | | | 79,740 | | |
| | 6,350 | | | General Electric Capital Corp., Series G | | | 6.00 | | | 08/07/19 | | | 7,305,103 | | |
| | 1,195 | | | Genworth Financial, Inc. | | | 7.70 | | | 06/15/20 | | | 1,139,284 | | |
| | 2,215 | | | Goldman Sachs Group, Inc. (The) | | | 6.15 | | | 04/01/18 | | | 2,289,025 | | |
| | 1,565 | | | Goldman Sachs Group, Inc. (The) | | | 6.75 | | | 10/01/37 | | | 1,460,511 | | |
| | 950 | | | Goodman Funding Pty Ltd. (Australia) (a) | | | 6.375 | | | 04/15/21 | | | 968,329 | | |
| | 550 | | | Harley-Davidson Funding Corp. (a) | | | 6.80 | | | 06/15/18 | | | 643,620 | | |
| | 600 | | | Hartford Financial Services Group, Inc. | | | 5.50 | | | 03/30/20 | | | 609,956 | | |
| | 1,675 | | | HBOS PLC, Series G (United Kingdom) (a) | | | 6.75 | | | 05/21/18 | | | 1,344,638 | | |
| | 250 | | | HCP, Inc. | | | 5.625 | | | 05/01/17 | | | 265,441 | | |
| | 300 | | | Health Care REIT, Inc. | | | 4.75 | | | 07/15/27 | | | 343,500 | | |
| | 600 | | | Health Care REIT, Inc. | | | 6.125 | | | 04/15/20 | | | 622,676 | | |
| | 595 | | | Huntington Bancshares, Inc. | | | 7.00 | | | 12/15/20 | | | 675,476 | | |
| | 915 | | | International Lease Finance Corp. | | | 5.75 | | | 05/15/16 | | | 849,498 | | |
| | 945 | | | International Lease Finance Corp. | | | 6.25 | | | 05/15/19 | | | 874,234 | | |
| | 510 | | | Intesa Sanpaolo SpA (Italy) (a) | | | 6.50 | | | 02/24/21 | | | 419,238 | | |
| | 200 | | | Jefferies Group, Inc. | | | 3.875 | | | 11/09/15 | | | 179,000 | | |
| | 710 | | | Jefferies Group, Inc. | | | 6.875 | | | 04/15/21 | | | 646,100 | | |
| | 2,610 | | | JPMorgan Chase Capital XXVII | | | 7.00 | | | 11/01/39 | | | 2,652,412 | | |
| | 745 | | | Lincoln National Corp. | | | 8.75 | | | 07/01/19 | | | 907,479 | | |
| | 260 | | | Lloyds TSB Bank PLC (United Kingdom) | | | 6.375 | | | 01/21/21 | | | 260,998 | | |
| | 505 | | | Lloyds TSB Bank PLC, MTN
(United Kingdom) (a) | | | 5.80 | | | 01/13/20 | | | 480,189 | | |
See Notes to Financial Statements
37
Morgan Stanley Variable Investment Series - Income Plus
Portfolio of Investments n December 31, 2011 continued
PRINCIPAL
AMOUNT IN
THOUSANDS | |
| | COUPON
RATE | | MATURITY
DATE | | VALUE | |
| $ | 710 | | | Macquarie Bank Ltd. (Australia) (a) | | | 6.625 | % | | 04/07/21 | | $ | 655,687 | | |
| | 705 | | | Macquarie Group Ltd. (Australia) (a) | | | 6.00 | | | 01/14/20 | | | 662,321 | | |
| | 930 | | | Merrill Lynch & Co., Inc. | | | 7.75 | | | 05/14/38 | | | 886,010 | | |
| | 3,625 | | | Merrill Lynch & Co., Inc., MTN | | | 6.875 | | | 04/25/18 | | | 3,578,535 | | |
| | 965 | | | MetLife, Inc. (See Note 6) | | | 10.75 | | | 08/01/39 | | | 1,276,994 | | |
| | 165 | | | NASDAQ OMX Group, Inc. (The) | | | 5.25 | | | 01/16/18 | | | 173,384 | | |
| | 1,665 | | | Nationwide Building Society
(United Kingdom) (a) | | | 6.25 | | | 02/25/20 | | | 1,654,584 | | |
| | 525 | | | Nationwide Financial Services (a) | | | 5.375 | | | 03/25/21 | | | 516,605 | | |
| | 1,100 | | | Nordea Bank AB (Sweden) (a) | | | 4.875 | | | 05/13/21 | | | 931,401 | | |
| | 370 | | | Platinum Underwriters Finance, Inc., Series B | | | 7.50 | | | 06/01/17 | | | 389,829 | | |
| | 1,025 | | | Principal Financial Group, Inc. | | | 8.875 | | | 05/15/19 | | | 1,277,970 | | |
| | 925 | | | Protective Life Corp. | | | 7.375 | | | 10/15/19 | | | 1,028,039 | | |
| | 635 | | | Prudential Financial, Inc., MTN | | | 6.625 | | | 12/01/37 | | | 697,574 | | |
| | 775 | | | QBE Capital Funding III Ltd. (Australia) (a) | | | 7.25 | (b) | | 05/24/41 | | | 683,526 | | |
| | 1,240 | | | Regions Financial Corp. | | | 5.75 | | | 06/15/15 | | | 1,196,600 | | |
| | 775 | | | Reinsurance Group of America, Inc. | | | 6.45 | | | 11/15/19 | | | 872,034 | | |
| | 925 | | | Royal Bank of Scotland Group PLC
(United Kingdom) | | | 6.40 | | | 10/21/19 | | | 867,269 | | |
| | 360 | | | Santander Holdings USA, Inc. (Spain) | | | 4.625 | | | 04/19/16 | | | 346,042 | | |
| | 1,300 | | | Santander US Debt SA Unipersonal (Spain) (a) | | | 3.724 | | | 01/20/15 | | | 1,181,245 | | |
| | 700 | | | Simon Property Group LP | | | 4.125 | | | 12/01/21 | | | 733,459 | | |
| | 1,060 | | | SLM Corp., MTN | | | 6.25 | | | 01/25/16 | | | 1,031,734 | | |
| | 495 | | | SLM Corp., MTN | | | 8.00 | | | 03/25/20 | | | 501,188 | | |
| | 885 | | | Standard Chartered Bank (United Kingdom) (a) | | | 6.40 | | | 09/26/17 | | | 912,359 | | |
| | 525 | | | SunTrust Banks, Inc. | | | 3.50 | | | 01/20/17 | | | 528,313 | | |
| | 800 | | | UBS AG (Switzerland) | | | 4.875 | | | 08/04/20 | | | 795,922 | | |
| | 450 | | | Ventas Realty LP/Ventas Capital Corp. | | | 4.75 | | | 06/01/21 | | | 435,128 | | |
| | 300 | | | Vornado Realty LP | | | 3.875 | | | 04/15/25 | | | 307,500 | | |
| | 600 | | | Vornado Realty LP | | | 5.00 | | | 01/15/22 | | | 606,158 | | |
| | 975 | | | WEA Finance LLC (Australia) (a) | | | 4.625 | | | 05/10/21 | | | 958,753 | | |
| | 900 | | | Wells Operating Partnership II LP | | | 5.875 | | | 04/01/18 | | | 924,804 | | |
| | 900 | | | Willis Group Holdings PLC | | | 4.125 | | | 03/15/16 | | | 914,949 | | |
| | 1,000 | | | XL Group Ltd. (Cayman Islands) | | | 5.75 | | | 10/01/21 | | | 1,057,352 | | |
| | | | | | 82,489,577 | | |
| | | Industrials (5.8%) | |
| | 1,060 | | | BAA Funding Ltd. (United Kingdom) (a) | | | 4.875 | | | 07/15/21 | | | 1,092,752 | | |
| | 540 | | | Ball Corp. | | | 7.375 | | | 09/01/19 | | | 594,000 | | |
| | 500 | | | Bemis Co., Inc. | | | 4.50 | | | 10/15/21 | | | 530,710 | | |
| | 255 | | | Bombardier, Inc. (Canada) (a) | | | 7.50 | | | 03/15/18 | | | 274,125 | | |
| | 505 | | | Bombardier, Inc. (Canada) (a) | | | 7.75 | | | 03/15/20 | | | 552,975 | | |
See Notes to Financial Statements
38
Morgan Stanley Variable Investment Series - Income Plus
Portfolio of Investments n December 31, 2011 continued
PRINCIPAL
AMOUNT IN
THOUSANDS | |
| | COUPON
RATE | | MATURITY
DATE | | VALUE | |
| $ | 820 | | | CRH America, Inc. | | | 6.00 | % | | 09/30/16 | | $ | 876,843 | | |
| | 480 | | | CRH America, Inc. | | | 8.125 | | | 07/15/18 | | | 548,392 | | |
| | 585 | | | Crown Americas LLC/Crown Americas
Capital Corp. III | | | 6.25 | | | 02/01/21 | | | 614,250 | | |
| | 510 | | | DISH DBS Corp. | | | 7.125 | | | 02/01/16 | | | 552,075 | | |
| | 217 | | | General Cable Corp. | | | 0.875 | | | 11/15/13 | | | 200,725 | | |
| | 545 | | | Holcim US Finance Sarl & Cie SCS
(Switzerland) (a) | | | 6.00 | | | 12/30/19 | | | 562,493 | | |
| | 430 | | | Joy Global, Inc. | | | 5.125 | | | 10/15/21 | | | 459,894 | | |
| | 915 | | | L-3 Communications Corp. | | | 4.95 | | | 02/15/21 | | | 908,464 | | |
| | 670 | | | Lafarge SA (France) (a) | | | 6.20 | | | 07/09/15 | | | 682,378 | | |
| | 615 | | | Meccanica Holdings USA, Inc. (Italy) (a) | | | 7.375 | | | 07/15/39 | | | 462,938 | | |
| | 750 | | | Odebrecht Finance Ltd. (Brazil) (a) | | | 6.00 | | | 04/05/23 | | | 755,625 | | |
| | 286 | | | Orbital Sciences Corp. | | | 2.438 | | | 01/15/27 | | | 288,860 | | |
| | 374 | | | Owens-Brockway Glass Container, Inc. (a) | | | 3.00 | | | 06/01/15 | | | 349,690 | | |
| | 135 | | | Sonoco Products Co. | | | 4.375 | | | 11/01/21 | | | 140,103 | | |
| | 470 | | | Sonoco Products Co. | | | 5.75 | | | 11/01/40 | | | 504,014 | | |
| | 275 | | | Stanley Black & Decker, Inc. | | | 0.00 | (b) | | 05/17/12 | | | 305,766 | | |
| | | | | | 11,257,072 | | |
| | | Technology (1.7%) | |
| | 845 | | | Hewlett-Packard Co. | | | 4.65 | | | 12/09/21 | | | 893,320 | | |
| | 234 | | | Intel Corp. | | | 2.95 | | | 12/15/35 | | | 244,823 | | |
| | 905 | | | KLA-Tencor Corp. | | | 6.90 | | | 05/01/18 | | | 1,044,965 | | |
| | 255 | | | Lam Research Corp. (a) | | | 1.25 | | | 05/15/18 | | | 240,338 | | |
| | 434 | | | Microsoft Corp. (a) | | | 0.00 | | | 06/15/13 | | | 441,595 | | |
| | 350 | | | SanDisk Corp. | | | 1.00 | | | 05/15/13 | | | 342,562 | | |
| | | | | | 3,207,603 | | |
| | | Utilities (6.6%) | |
| | 1,610 | | | AES Corp. (The) | | | 8.00 | | | 06/01/20 | | | 1,779,050 | | |
| | 775 | | | CMS Energy Corp. | | | 6.25 | | | 02/01/20 | | | 817,715 | | |
| | 750 | | | EDP Finance BV (Portugal) (a) | | | 4.90 | | | 10/01/19 | | | 579,600 | | |
| | 1,175 | | | Enel Finance International N.V. (Italy) (a) | | | 5.125 | | | 10/07/19 | | | 1,051,312 | | |
| | 2,100 | | | Exelon Generation Co., LLC | | | 4.00 | | | 10/01/20 | | | 2,162,746 | | |
| | 975 | | | FirstEnergy Solutions Corp. | | | 6.05 | | | 08/15/21 | | | 1,083,952 | | |
| | 975 | | | FirstEnergy Solutions Corp. | | | 6.80 | | | 08/15/39 | | | 1,095,374 | | |
| | 875 | | | Iberdrola Finance Ireland Ltd. (Spain) (a) | | | 5.00 | | | 09/11/19 | | | 855,946 | | |
| | 900 | | | PPL WEM Holdings PLC (a) | | | 3.90 | | | 05/01/16 | | | 903,057 | | |
See Notes to Financial Statements
39
Morgan Stanley Variable Investment Series - Income Plus
Portfolio of Investments n December 31, 2011 continued
PRINCIPAL
AMOUNT IN
THOUSANDS | |
| | COUPON
RATE | | MATURITY
DATE | | VALUE | |
| $ | 1,150 | | | Puget Energy, Inc. | | | 6.50 | % | | 12/15/20 | | $ | 1,229,947 | | |
| | 1,200 | | | UIL Holdings Corp. | | | 4.625 | | | 10/01/20 | | | 1,246,002 | | |
| | | | | | 12,804,701 | | |
| | | Total Corporate Bonds
(Cost $175,228,497) | | | 183,503,029 | | |
| | | Asset-Backed Securities (1.8%) | |
| | 850 | | | America West Airlines 2001-1 Pass-Through
Trust, Series 011G (AMBAC) | | | 7.10 | | | 04/02/21 | | | 790,567 | | |
| | | CVS Pass-Through Trust | |
| | 1,461 | | | | | | | | 6.036 | | | 12/10/28 | | | 1,524,030 | | |
| | 115 | | | (a) | | | 8.353 | | | 07/10/31 | | | 140,925 | | |
| | 1,060 | | | FUEL Trust (a) | | | 4.207 | | | 04/15/16 | | | 1,070,038 | | |
| | | Total Asset-Backed Securities
(Cost $3,491,189) | | | 3,525,560 | | |
| | | Municipal Bond (0.4%) | |
| | 600 | | | State of California, General Obligation Bonds
(Cost $603,036) | | | 5.95 | | | 04/01/16 | | | 676,788 | | |
| | | Sovereign (0.2%) | |
| | 395 | | | Korea Development Bank (Korea, Republic of)
(Cost $393,219) | | | 3.875 | | | 05/04/17 | | | 391,044 | | |
| | | Agency Fixed Rate Mortgage (0.0%) | |
| | 1 | | | Federal Home Loan Mortgage Corporation,
Gold Pools
(Cost $1,440) | | | 6.50 | | | 12/01/28 | | | 1,588 | | |
NUMBER OF
SHARES | | | | | | | |
| |
| | | Convertible Preferred Stocks (0.3%) | |
| | | Diversified Financial Services (0.2%) | |
| | 350 | | | Bank of America Corp., Series L | | | | | | | | | | | 275,807 | | |
| | | Electric Utilities (0.1%) | |
| | 4,430 | | | PPL Corp. | | | | | | | | | | | 247,327 | | |
| | | Total Convertible Preferred Stocks
(Cost $585,890) | | | 523,134 | | |
| | | Preferred Stock (0.2%) | |
| | | Consumer Finance | |
| | 22,725 | | | GMAC Capital Trust I
(Cost $574,065) | | | | | | | | | | | 439,501 | | |
See Notes to Financial Statements
40
Morgan Stanley Variable Investment Series - Income Plus
Portfolio of Investments n December 31, 2011 continued
PRINCIPAL
AMOUNT IN
THOUSANDS | |
| | COUPON
RATE | | MATURITY
DATE | | VALUE | |
| | | Short-Term Investments (0.3%) | |
| | | U.S. Treasury Security (0.2%) | |
| $ | 475 | | | U.S. Treasury Bill
(Cost $474,981) (d)(e) | | | 0.018 | % | | 03/22/12 | | $ | 474,984 | | |
NUMBER OF
SHARES (000) | |
| |
| |
| |
| |
| | | Investment Company (0.1%) | |
| | | 208Morgan Stanley Institutional Liquidity Funds - Money
Market Portfolio - Institutional Class (See Note 6)
(Cost $208,270) | | | 208,270 | | |
| | | Total Short-Term Investments
(Cost $683,251) | | | 683,254 | | |
| | | Total Investments
(Cost $181,560,587) (f) | | | | | 97.9 | % | | | 189,743,898 | | |
| | | Other Assets in Excess of Liabilities | | | | | 2.1 | | | | 4,080,052 | | |
| | | Net Assets | | | | | 100.0 | % | | $ | 193,823,950 | | |
MTN Medium Term Note.
REIT Real Estate Investment Trust.
(a) 144A security — Certain conditions for public sale may exist. Unless otherwise noted, these securities are deemed to be liquid.
(b) Variable/Floating Rate Security — Interest rate changes on these instruments are based on changes in a designated base rate. The rates shown are those in effect on December 31, 2011.
(c) Perpetual — Security does not have a predetermined maturity date. Rate for this security is fixed for a period of time then reverts to a floating rate. The interest shown is the rate in effect at December 31, 2011.
(d) Rate shown is the yield to maturity at December 31, 2011.
(e) A portion of this security has been physically segregated in connection with open futures contracts.
(f) Securities are available for collateral in connection with open futures contracts and swap agreements.
Bond Insurance:
AMBAC AMBAC Assurance Corporation.
See Notes to Financial Statements
41
Morgan Stanley Variable Investment Series - Income Plus
Portfolio of Investments n December 31, 2011 continued
FUTURES CONTRACTS OPEN AT DECEMBER 31, 2011:
NUMBER OF
CONTRACTS | | LONG/SHORT | | DESCRIPTION, DELIVERY
MONTH AND YEAR | | UNDERLYING FACE
AMOUNT AT VALUE | | UNREALIZED
APPRECIATION
(DEPRECIATION) | |
| | 101 | | | Long | | U.S. Treasury 2 yr. Note,
Mar-12 | | $ | 22,275,234 | | | $ | 12,202 | | |
| | 103 | | | Long | | U.S. Treasury 5 yr. Note,
Mar-12 | | | 12,695,555 | | | | 58,742 | | |
| | 63 | | | Long | | U.S. Treasury Ultra Long
Bond, Mar-12 | | | 10,091,813 | | | | 54,141 | | |
| | 40 | | | Short | | U.S. Treasury 30 yr. Bond,
Mar-12 | | | (5,792,500 | ) | | | (36,594 | ) | |
| | 298 | | | Short | | U.S. Treasury 10 yr. Note,
Mar-12 | | | (39,075,250 | ) | | | (297,289 | ) | |
| Net Unrealized Depreciation | | $ | (208,798 | ) | |
CREDIT DEFAULT SWAP AGREEMENT OPEN AT DECEMBER 31, 2011:
SWAP
COUNTERPARTY &
REFERENCE
OBLIGATION | | BUY/SELL
PROTECTION | | NOTIONAL
AMOUNT
(000'S) | | INTEREST
RATE | | TERMINATION
DATE | | UNREALIZED
DEPRECIATION | | UPFRONT
PAYMENTS | | VALUE | | CREDIT
RATING OF
REFERENCE
OBLIGATION† | |
| | | | | | | | | | | | | | | | | (unaudited) | |
Barclays Capital
Whirlpool Corp. | | Buy | | $ | 315 | | | | 1.00 | % | | June 20, 2014 | | $ | (10,900 | ) | | $ | 16,985 | | | $ | 6,085 | | | BBB- | |
† Credit rating as issued by Standard & Poor's.
| LONG TERM CREDIT ANALYSIS++ | | | |
| AAA | | | 0.6 | % | |
| AA | | | 8.0 | | |
| A | | | 27.5 | | |
| BBB | | | 50.7 | | |
| BB | | | 10.2 | | |
| B or Below | | | 2.2 | | |
| Not Rated | | | 0.8 | | |
| | | | 100.0 | %+ | |
+ Does not include open long/short futures contracts with an underlying face amount of $89,930,352 and net unrealized depreciation of $208,798. Also does not include open swap agreements with total unrealized depreciation of $10,900.
++ The ratings shown are based on the Portfoio's security ratings as determined by Standard & Poor's, Moody's or Fitch, each a Nationally Recognized Statistical Ratings Organization ("NRSRO").
See Notes to Financial Statements
42
Morgan Stanley Variable Investment Series - Global Infrastructure
Portfolio of Investments n December 31, 2011
NUMBER OF
SHARES | |
| | VALUE | |
| | | Common Stocks (97.0%)
Australia (5.2%) | |
| | | Airports | |
| | 36,500 | | | Australian Infrastructure Fund
(Stapled Securities) (a)(b) | | $ | 72,051 | | |
| | 301,513 | | | Sydney Airport (Stapled
Securities) (a) | | | 820,311 | | |
| | | | 892,362 | | |
| | | Diversified | |
| | 271,480 | | | DUET Group (Stapled
Securities) (a)(b) | | | 487,311 | | |
| | | Oil & Gas Storage &
Transportation | |
| | 122,600 | | | APA Group (Stapled
Securities) (a)(b) | | | 563,025 | | |
| | | Toll Roads | |
| | 74,800 | | | Macquarie Atlas Roads Group
(Stapled Securities) (a)(c) | | | 103,283 | | |
| | 229,100 | | | Transurban Group (Stapled
Securities) (a) | | | 1,316,898 | | |
| | | | 1,420,181 | | |
| | | Transmission & Distribution | |
| | 318,106 | | | Spark Infrastructure Group | | | 447,368 | | |
| | | | | Total Australia | | | 3,810,247 | | |
| | | Brazil (0.6%) | |
| | | Water | |
| | 7,800 | | | Cia de Saneamento Basico
do Estado de Sao Paulo
ADR (c) | | | 434,070 | | |
| | | Canada (13.6%) | |
| | | Oil & Gas Storage &
Transportation | |
| | 108,500 | | | Enbridge, Inc. | | | 4,056,702 | | |
| | 130,310 | | | TransCanada Corp. | | | 5,695,906 | | |
| | | | 9,752,608 | | |
NUMBER OF
SHARES | |
| | VALUE | |
| | | Ports | |
| | 10,150 | | | Westshore Terminals
Investment Corp. (Stapled
Securities) (a)(b) | | $ | 227,958 | | |
| | | | | Total Canada | | | 9,980,566 | | |
| | | China (13.9%) | |
| | | Oil & Gas Storage &
Transportation | |
| | 705,000 | | | Beijing Enterprises
Holdings Ltd. (d) | | | 4,230,036 | | |
| | 5,968,000 | | | China Gas Holdings Ltd. (d) | | | 2,743,255 | | |
| | 277,000 | | | ENN Energy Holdings Ltd. (d) | | | 888,072 | | |
| | 1,693,000 | | | Sichuan Expressway Co. Ltd.,
H Shares (d) | | | 680,112 | | |
| | | | 8,541,475 | | |
| | | Ports | |
| | 223,529 | | | China Merchants Holdings
International Co., Ltd. (d) | | | 649,007 | | |
| | | Toll Roads | |
| | 1,150,000 | | | Jiangsu Expressway Co., Ltd.,
H Shares (d) | | | 1,058,700 | | |
| | | | | Total China | | | 10,249,182 | | |
| | | France (3.4%) | |
| | | Communications | |
| | 6,387 | | | Eutelsat Communications SA | | | 249,231 | | |
| | 92,580 | | | SES SA | | | 2,222,094 | | |
| | | | | Total France | | | 2,471,325 | | |
| | | Germany (0.3%) | |
| | | Airports | |
| | 4,073 | | | Fraport AG Frankfurt Airport
Services Worldwide | | | 200,316 | | |
| | | Hong Kong (2.3%) | |
| | | Oil & Gas Storage &
Transportation | |
| | 739,800 | | | Hong Kong & China Gas
Co., Ltd. | | | 1,714,573 | | |
See Notes to Financial Statements
43
Morgan Stanley Variable Investment Series - Global Infrastructure
Portfolio of Investments n December 31, 2011 continued
NUMBER OF
SHARES | |
| | VALUE | |
| | | Italy (4.0%) | |
| | | Oil & Gas Storage &
Transportation | |
| | 294,296 | | | Snam Rete Gas SpA | | $ | 1,297,321 | | |
| | | Toll Roads | |
| | 30,590 | | | Atlantia SpA | | | 489,742 | | |
| | 135,245 | | | Societa Iniziative Autostradali e
Servizi SpA | | | 1,018,738 | | |
| | | | 1,508,480 | | |
| | | Transmission & Distribution | |
| | 31,700 | | | Terna Rete Elettrica
Nazionale SpA | | | 106,836 | | |
| | | | | Total Italy | | | 2,912,637 | | |
| | | Japan (0.4%) | |
| | | Oil & Gas Storage &
Transportation | |
| | 64,000 | | | Tokyo Gas Co., Ltd. | | | 294,348 | | |
| | | Netherlands (0.9%) | |
| | | Oil & Gas Storage &
Transportation | |
| | 12,788 | | | Koninklijke Vopak N.V. | | | 675,689 | | |
| | | Spain (3.3%) | |
| | | Diversified | |
| | 47,640 | | | Ferrovial SA | | | 574,962 | | |
| | | Oil & Gas Storage &
Transportation | |
| | 28,172 | | | Enagas SA | | | 521,037 | | |
| | | Toll Roads | |
| | 58,405 | | | Abertis Infraestructuras SA | | | 932,789 | | |
| | | Transmission & Distribution | |
| | 10,060 | | | Red Electrica Corp. SA | | | 430,511 | | |
| | | | | Total Spain | | | 2,459,299 | | |
| | | Switzerland (0.7%) | |
| | | Airports | |
| | 1,440 | | | Flughafen Zuerich AG
(Registered) | | | 499,776 | | |
NUMBER OF
SHARES | |
| | VALUE | |
| | | United Kingdom (11.5%) | |
| | | Transmission & Distribution | |
| | 657,200 | | | National Grid PLC | | $ | 6,378,948 | | |
| | | Water | |
| | 32,900 | | | Pennon Group PLC | | | 364,809 | | |
| | 31,700 | | | Severn Trent PLC | | | 736,482 | | |
| | 99,100 | | | United Utilities Group PLC | | | 932,648 | | |
| | | | 2,033,939 | | |
| | | | | Total United Kingdom | | | 8,412,887 | | |
| | | United States (36.9%) | |
| | | Communications | |
| | 70,750 | | | American Tower Corp.,
Class A | | | 4,245,708 | | |
| | 53,950 | | | Crown Castle International
Corp. (c) | | | 2,416,960 | | |
| | 29,290 | | | SBA Communications Corp.,
Class A (c) | | | 1,258,298 | | |
| | | | 7,920,966 | | |
| | | Diversified | |
| | 93,220 | | | CenterPoint Energy, Inc. | | | 1,872,790 | | |
| | | Oil & Gas Storage &
Transportation | |
| | 7,790 | | | AGL Resources, Inc. | | | 329,205 | | |
| | 5,250 | | | Atmos Energy Corp. | | | 175,088 | | |
| | 38,154 | | | Enbridge Energy
Management LLC (c) | | | 1,326,233 | | |
| | 14,208 | | | Kinder Morgan
Management LLC (c) | | | 1,115,612 | | |
| | 47,250 | | | NiSource, Inc. | | | 1,125,023 | | |
| | 3,270 | | | Northwest Natural Gas Co. | | | 156,731 | | |
| | 14,410 | | | Oneok, Inc. | | | 1,249,203 | | |
| | 18,100 | | | PG&E Corp. | | | 746,082 | | |
| | 46,670 | | | Sempra Energy | | | 2,566,850 | | |
| | 9,580 | | | Southwest Gas Corp. | | | 407,054 | | |
| | 102,166 | | | Spectra Energy Corp. | | | 3,141,604 | | |
| | | | 12,338,685 | | |
| | | Transmission & Distribution | |
| | 23,860 | | | ITC Holdings Corp. | | | 1,810,497 | | |
| | 39,390 | | | Northeast Utilities | | | 1,420,797 | | |
See Notes to Financial Statements
44
Morgan Stanley Variable Investment Series - Global Infrastructure
Portfolio of Investments n December 31, 2011 continued
NUMBER OF
SHARES | |
| | VALUE | |
| | 21,180 | | | NSTAR | | $ | 994,613 | | |
| | 12,860 | | | Pepco Holdings, Inc. | | | 261,058 | | |
| | | | 4,486,965 | | |
| | | Water | | | |
| | 15,810 | | | American Water
Works Co., Inc. | | | 503,707 | | |
| | | | | Total United States | | | 27,123,113 | | |
| | | | | Total Common Stocks
(Cost $59,339,593) | | | 71,238,028 | | |
NUMBER OF
SHARES (000) | | | | | |
| | | Short-Term Investment (2.7%) | | | |
| | | Investment Company | | | |
| | 1,993 | | | Morgan Stanley Institutional
Liquidity Funds - Money
Market Portfolio - Institutional
Class (See Note 6)
(Cost $1,993,348) | | | 1,993,348 | | |
Total Investments
(Cost $61,332,941) | | | 99.7 | % | | | 73,231,376 | | |
Other Assets in Excess of
Liabilities | | | 0.3 | | | | 239,448 | | |
| Net Assets | | | 100.0 | % | | $ | 73,470,824 | | |
ADR American Depositary Receipt.
(a) Comprised of securities in separate entities that are traded as a single stapled security.
(b) Consists of one or more classes of securities traded together as a unit; stocks with attached warrants.
(c) Non-income producing security.
(d) Security trades on the Hong Kong exchange.
SUMMARY OF INVESTMENTS
INDUSTRY | | VALUE | | PERCENT OF
TOTAL
INVESTMENTS | |
Oil & Gas Storage &
Transportation | | $ | 35,698,761 | | | | 48.7 | % | |
| Transmission & Distribution | | | 11,850,628 | | | | 16.2 | | |
| Communications | | | 10,392,291 | | | | 14.2 | | |
| Toll Roads | | | 4,920,150 | | | | 6.7 | | |
| Water | | | 2,971,716 | | | | 4.1 | | |
| Diversified | | | 2,935,063 | | | | 4.0 | | |
| Investment Company | | | 1,993,348 | | | | 2.7 | | |
| Airports | | | 1,592,454 | | | | 2.2 | | |
| Ports | | | 876,965 | | | | 1.2 | | |
| | | $ | 73,231,376 | | | | 100.0 | % | |
See Notes to Financial Statements
45
Morgan Stanley Variable Investment Series - European Equity
Portfolio of Investments n December 31, 2011
NUMBER OF
SHARES | |
| | VALUE | |
| | | Common Stocks (98.6%)
Belgium (1.5%) | |
| | | Chemicals | |
| | 19,693 | | | Umicore SA | | $ | 812,292 | | |
| | | Finland (1.5%) | |
| | | Machinery | |
| | 15,525 | | | Kone Oyj, Class B | | | 805,739 | | |
| | | France (10.4%) | |
| | | Commercial Banks | |
| | 25,527 | | | BNP Paribas SA | | | 1,002,713 | | |
| | 25,712 | | | Societe Generale SA | | | 572,544 | | |
| | | | 1,575,257 | | |
| | | Electrical Equipment | |
| | 17,640 | | | Schneider Electric SA | | | 928,748 | | |
| | | Hotels, Restaurants & Leisure | |
| | 23,048 | | | Accor SA | | | 584,218 | | |
| | | Media | |
| | 29,687 | | | SES SA | | | 712,544 | | |
| | | Metals & Mining | |
| | 42,044 | | | ArcelorMittal | | | 768,891 | | |
| | | Multi-Utilities | |
| | 33,111 | | | GDF Suez | | | 905,075 | | |
| | | | | Total France | | | 5,474,733 | | |
| | | Germany (13.7%) | |
| | | Automobiles | |
| | 24,953 | | | Daimler AG (Registered) | | | 1,095,461 | | |
| | | Food & Staples Retailing | |
| | 15,061 | | | Metro AG | | | 549,694 | | |
| | | Health Care Providers &
Services | |
| | 11,749 | | | Fresenius SE & Co. KGaA | | | 1,086,936 | | |
| | | Industrial Conglomerates | |
| | 17,933 | | | Siemens AG (Registered) | | | 1,716,132 | | |
| | | Insurance | |
| | 6,934 | | | Muenchener
Rueckversicherungs
AG (Registered) | | | 850,587 | | |
| | | Machinery | |
| | 8,811 | | | MAN SE | | | 783,430 | | |
NUMBER OF
SHARES | |
| | VALUE | |
| | | Pharmaceuticals | |
| | 18,143 | | | Bayer AG (Registered) | | $ | 1,159,991 | | |
| | | | | Total Germany | | | 7,242,231 | | |
| | | Netherlands (1.9%) | |
| | | Media | |
| | 86,794 | | | Reed Elsevier N.V. | | | 1,011,785 | | |
| | | Portugal (1.2%) | |
| | | Oil, Gas & Consumable Fuels | |
| | 42,135 | | | Galp Energia SGPS SA,
Class B | | | 620,588 | | |
| | | Spain (3.7%) | |
| | | Commercial Banks | |
| | 131,533 | | | Banco Bilbao Vizcaya
Argentaria SA | | | 1,137,181 | | |
| | | Information Technology Services | |
| | 51,168 | | | Amadeus IT Holding SA,
Class A | | | 830,120 | | |
| | | | | Total Spain | | | 1,967,301 | | |
| | | Switzerland (14.5%) | |
| | | Food Products | |
| | 46,903 | | | Nestle SA (Registered) | | | 2,696,435 | | |
| | | Insurance | |
| | 5,122 | | | Zurich Financial
Services AG (a) | | | 1,158,762 | | |
| | | Pharmaceuticals | |
| | 34,000 | | | Novartis AG (Registered) | | | 1,943,788 | | |
| | 11,028 | | | Roche Holding AG
(Genusschein) | | | 1,869,113 | | |
| | | | 3,812,901 | | |
| | | | | Total Switzerland | | | 7,668,098 | | |
| | | United Kingdom (50.2%) | |
| | | Aerospace & Defense | |
| | 112,059 | | | Rolls-Royce Holdings PLC (a) | | | 1,299,116 | | |
| | | Commercial Banks | |
| | 350,236 | | | Barclays PLC | | | 957,565 | | |
| | 262,788 | | | HSBC Holdings PLC | | | 2,004,023 | | |
| | | | 2,961,588 | | |
See Notes to Financial Statements
46
Morgan Stanley Variable Investment Series - European Equity
Portfolio of Investments n December 31, 2011 continued
NUMBER OF
SHARES | |
| | VALUE | |
| | | Food & Staples Retailing | |
| | 197,166 | | | WM Morrison Supermarkets
PLC | | $ | 998,820 | | |
| | | Household Products | |
| | 23,693 | | | Reckitt Benckiser Group
PLC | | | 1,170,088 | | |
| | | Insurance | |
| | 105,789 | | | Prudential PLC | | | 1,048,994 | | |
| | | Metals & Mining | |
| | 40,084 | | | Anglo American PLC | | | 1,480,938 | | |
| | 70,203 | | | Xstrata PLC | | | 1,066,267 | | |
| | | | 2,547,205 | | |
| | | Oil, Gas & Consumable Fuels | |
| | 84,252 | | | BG Group PLC | | | 1,801,059 | | |
| | 280,967 | | | BP PLC | | | 2,009,354 | | |
| | 65,236 | | | Royal Dutch Shell PLC,
Class A | | | 2,402,096 | | |
| | 43,390 | | | Tullow Oil PLC | | | 944,733 | | |
| | | | 7,157,242 | | |
| | | Pharmaceuticals | |
| | 81,084 | | | GlaxoSmithKline PLC | | | 1,852,964 | | |
| | | Professional Services | |
| | 91,900 | | | Experian PLC | | | 1,249,520 | | |
| | | Specialty Retail | |
| | 163,542 | | | Carphone Warehouse Group
PLC | | | 784,800 | | |
| | | Tobacco | |
| | 38,784 | | | British American Tobacco PLC | | | 1,840,375 | | |
| | 38,419 | | | Imperial Tobacco Group PLC | | | 1,452,836 | | |
| | | | 3,293,211 | | |
NUMBER OF
SHARES | |
| | VALUE | |
| | | Wireless Telecommunication
Services | | | |
| | 781,074 | | | Vodafone Group PLC | | $ | 2,170,071 | | |
| | | | | Total United Kingdom | | | 26,533,619 | | |
| | | | | Total Common Stocks
(Cost $48,318,220) | | | 52,136,386 | | |
NUMBER OF
SHARES (000) | | | | | |
| | | Short-Term Investment (1.4%) | | | |
| | | Investment Company | | | |
| | 719 | | | Morgan Stanley Institutional
Liquidity Funds - Money
Market Portfolio - Institutional
Class (See Note 6)
(Cost $718,547) | | | 718,547 | | |
Total Investments
(Cost $49,036,767) (b) | | | 100.0 | % | | | 52,854,933 | | |
Liabilities in Excess of
Other Assets | | | 0.0 | (c) | | | (5,275 | ) | |
| Net Assets | | | 100.0 | % | | $ | 52,849,658 | | |
(a) Non-income producing security.
(b) Securities are available for collateral in connection with open foreign currency exchange contracts.
(c) Amount is less than 0.05%.
FOREIGN CURRENCY EXCHANGE CONTRACTS OPEN AT DECEMBER 31, 2011:
| COUNTERPARTY | | CONTRACTS
TO DELIVER | | IN EXCHANGE
FOR | | DELIVERY
DATE | | UNREALIZED
DEPRECIATION | |
| State Street Bank London | | GBP | 3,805,000 | | | EUR | 4,451,417 | | | 01/13/12 | | $ | (147,144 | ) | |
Currency Abbreviations:
EUR Euro.
GBP British Pound.
See Notes to Financial Statements
47
Morgan Stanley Variable Investment Series - European Equity
Summary of Investments n December 31, 2011
| INDUSTRY | | VALUE | | PERCENT OF
TOTAL
INVESTMENTS | |
Oil, Gas & Consumable
Fuels | | $ | 7,777,830 | | | | 14.7 | % | |
| Pharmaceuticals | | | 6,825,856 | | | | 12.9 | | |
| Commercial Banks | | | 5,674,026 | | | | 10.7 | | |
| Metals & Mining | | | 3,316,096 | | | | 6.3 | | |
| Tobacco | | | 3,293,211 | | | | 6.2 | | |
| Insurance | | | 3,058,343 | | | | 5.8 | | |
| Food Products | | | 2,696,435 | | | | 5.1 | | |
Wireless Telecommunication
Services | | | 2,170,071 | | | | 4.1 | | |
| Media | | | 1,724,329 | | | | 3.3 | | |
| Industrial Conglomerates | | | 1,716,132 | | | | 3.2 | | |
| Machinery | | | 1,589,169 | | | | 3.0 | | |
| Food & Staples Retailing | | | 1,548,514 | | | | 2.9 | | |
| Aerospace & Defense | | | 1,299,116 | | | | 2.5 | | |
| Professional Services | | | 1,249,520 | | | | 2.4 | | |
| Household Products | | | 1,170,088 | | | | 2.2 | | |
| INDUSTRY | | VALUE | | PERCENT OF
TOTAL
INVESTMENTS | |
| Automobiles | | $ | 1,095,461 | | | | 2.1 | % | |
Health Care Providers &
Services | | | 1,086,936 | | | | 2.0 | | |
| Electrical Equipment | | | 928,748 | | | | 1.8 | | |
| Multi-Utilities | | | 905,075 | | | | 1.7 | | |
Information Technology
Services | | | 830,120 | | | | 1.6 | | |
| Chemicals | | | 812,292 | | | | 1.5 | | |
| Specialty Retail | | | 784,800 | | | | 1.5 | | |
| Investment Company | | | 718,547 | | | | 1.4 | | |
Hotels, Restaurants &
Leisure | | | 584,218 | | | | 1.1 | | |
| | | $ | 52,854,933 | + | | | 100.0 | % | |
+ Does not include open foreign currency exchange contracts with net unrealized depreciation of $147,144.
See Notes to Financial Statements
48
Morgan Stanley Variable Investment Series - Multi Cap Growth
Portfolio of Investments n December 31, 2011
NUMBER OF
SHARES | |
| | VALUE | |
| | | Common Stocks (93.1%) | |
| | | Air Transport (1.9%) | |
| | 104,274 | | | Expeditors International of
Washington, Inc. | | $ | 4,271,063 | | |
| | | Alternative Energy (4.4%) | |
| | 85,888 | | | Range Resources Corp. | | | 5,319,903 | | |
| | 153,869 | | | Ultra Petroleum Corp. (a) | | | 4,559,138 | | |
| | | | 9,879,041 | | |
| | | Asset Management &
Custodian (1.6%) | |
| | 96,484 | | | Greenhill & Co., Inc. | | | 3,509,123 | | |
| | | Biotechnology (1.7%) | |
| | 123,026 | | | Illumina, Inc. (a) | | | 3,749,833 | | |
| | | Chemicals: Diversified (2.9%) | |
| | 92,154 | | | Monsanto Co. | | | 6,457,231 | | |
| | | Commercial Finance &
Mortgage Companies (1.7%) | |
| | 708,808 | | | BM&F Bovespa SA (Brazil) | | | 3,724,068 | | |
| | | Commercial Services (5.2%) | |
| | 120,180 | | | CoStar Group, Inc. (a) | | | 8,019,612 | | |
| | 156,272 | | | Leucadia National Corp. | | | 3,553,625 | | |
| | | | 11,573,237 | | |
| | | Communications
Technology (4.2%) | |
| | 201,350 | | | Motorola Solutions, Inc. | | | 9,320,492 | | |
| | | Computer Services,
Software & Systems (18.6%) | |
| | 59,751 | | | Baidu, Inc. ADR (China) (a) | | | 6,959,199 | | |
| | 327,898 | | | Facebook, Inc.,
Class B (a)(b)(c) | | | 8,853,246 | | |
| | 24,573 | | | Google, Inc., Class A (a) | | | 15,871,700 | | |
| | 55,674 | | | LinkedIn Corp., Class A (a) | | | 3,508,019 | | |
| | 44,954 | | | Salesforce.com, Inc. (a) | | | 4,561,033 | | |
| | 182,042 | | | Zynga, Inc., Class A (a) | | | 1,713,015 | | |
| | | | 41,466,212 | | |
| | | Computer Technology (11.1%) | |
| | 51,326 | | | Apple, Inc. (a) | | | 20,787,030 | | |
| | 206,438 | | | Yandex N.V., Class A
(Russia) (a) | | | 4,066,829 | | |
| | | | 24,853,859 | | |
NUMBER OF
SHARES | |
| | VALUE | |
| | | Diversified Retail (13.9%) | |
| | 95,234 | | | Amazon.com, Inc. (a) | | $ | 16,485,005 | | |
| | 161,667 | | | Fastenal Co. | | | 7,050,298 | | |
| | 254,966 | | | Groupon, Inc. (a) | | | 5,259,949 | | |
| | 30,472 | | | NetFlix, Inc. (a) | | | 2,111,405 | | |
| | | | 30,906,657 | | |
| | | Financial Data &
Systems (5.3%) | |
| | 179,631 | | | MSCI, Inc., Class A (a) | | | 5,915,249 | | |
| | 144,770 | | | Verisk Analytics, Inc.,
Class A (a) | | | 5,809,620 | | |
| | | | 11,724,869 | | |
| | | Health Care Services (3.0%) | |
| | 136,892 | | | athenahealth, Inc. (a) | | | 6,724,135 | | |
| | | Medical Equipment (3.7%) | |
| | 17,930 | | | Intuitive Surgical, Inc. (a) | | | 8,301,769 | | |
| | | Metals & Minerals:
Diversified (2.4%) | |
| | 2,771,679 | | | Lynas Corp. Ltd.
(Australia) (a) | | | 2,962,443 | | |
| | 104,852 | | | Molycorp, Inc. (a) | | | 2,514,351 | | |
| | | | 5,476,794 | | |
| | | Pharmaceuticals (2.9%) | |
| | 95,828 | | | Mead Johnson Nutrition Co. | | | 6,586,258 | | |
| | | Real Estate Investment Trusts
(REIT) (3.4%) | |
| | 274,767 | | | Brookfield Asset Management,
Inc., Class A (Canada) | | | 7,550,597 | | |
| | | Recreational Vehicles &
Boats (3.3%) | |
| | 300,011 | | | Edenred (France) | | | 7,385,264 | | |
| | | Wholesale & International
Trade (1.9%) | |
| | 2,296,000 | | | Li & Fung Ltd. (d) | | | 4,251,085 | | |
| | | | | Total Common Stocks
(Cost $171,939,872) | | | 207,711,587 | | |
See Notes to Financial Statements
49
Morgan Stanley Variable Investment Series - Multi Cap Growth
Portfolio of Investments n December 31, 2011 continued
NUMBER OF
SHARES | |
| | VALUE | |
| | | Convertible Preferred Stocks (1.4%) | | | |
| | | Alternative Energy (1.2%) | | | |
| | 586,326 | | | Better Place, Inc. (a)(b)(c) | | $ | 2,661,920 | | |
| | | Computer Services,
Software & Systems (0.2%) | | | |
| | 28,236 | | | Workday, Inc. (a)(b)(c) | | | 374,409 | | |
| | | | | Total Convertible
Preferred Stocks
(Cost $1,840,224) | | | 3,036,329 | | |
NUMBER OF
SHARES (000) | | | | | |
| | | Short-Term Investment (5.5%) | | | |
| | | Investment Company | | | |
| | 12,217 | | | Morgan Stanley Institutional
Liquidity Funds - Money
Market Portfolio - Institutional
Class (See Note 6)
(Cost $12,216,664) | | | 12,216,664 | | |
Total Investments
(Cost $185,996,760) | | | 100.0 | % | | | 222,964,580 | | |
Liabilities in Excess of
Other Assets | | | 0.0 | (e) | | | (2,319 | ) | |
| Net Assets | | | 100.0 | % | | $ | 222,962,261 | | |
ADR American Depositary Receipt.
(a) Non-income producing security.
(b) At December 31, 2011, the Portfolio held fair valued securities valued at $11,889,575, representing 5.3% of net assets. These securities have been fair valued as determined in good faith under procedures established by and under the general supervision of the Fund's Trustees.
(c) Illiquid security. Resale is restricted to qualified institutional investors.
(d) Security trades on the Hong Kong exchange.
(e) Amount is less than 0.05%.
SUMMARY OF INVESTMENTS
INDUSTRY | | VALUE | | PERCENT OF
TOTAL
INVESTMENTS | |
Computer Services,
Software & Systems | | $ | 41,840,621 | | | | 18.8 | % | |
| Diversified Retail | | | 30,906,657 | | | | 13.9 | | |
| Computer Technology | | | 24,853,859 | | | | 11.1 | | |
| Alternative Energy | | | 12,540,961 | | | | 5.6 | | |
| Investment Company | | | 12,216,664 | | | | 5.5 | | |
| Financial Data & Systems | | | 11,724,869 | | | | 5.3 | | |
| Commercial Services | | | 11,573,237 | | | | 5.2 | | |
Communications
Technology | | | 9,320,492 | | | | 4.2 | | |
| Medical Equipment | | | 8,301,769 | | | | 3.7 | | |
Real Estate Investment
Trusts (REIT) | | | 7,550,597 | | | | 3.4 | | |
Recreational Vehicles &
Boats | | | 7,385,264 | | | | 3.3 | | |
| Health Care Services | | | 6,724,135 | | | | 3.0 | | |
| Pharmaceuticals | | | 6,586,258 | | | | 2.9 | | |
| Chemicals: Diversified | | | 6,457,231 | | | | 2.9 | | |
Metals & Minerals:
Diversified | | | 5,476,794 | | | | 2.4 | | |
| Air Transport | | | 4,271,063 | | | | 1.9 | | |
Wholesale & International
Trade | | | 4,251,085 | | | | 1.9 | | |
| Biotechnology | | | 3,749,833 | | | | 1.7 | | |
Commercial Finance &
Mortgage Companies | | | 3,724,068 | | | | 1.7 | | |
Asset Management &
Custodian | | | 3,509,123 | | | | 1.6 | | |
| | | $ | 222,964,580 | | | | 100.0 | % | |
See Notes to Financial Statements
50
Morgan Stanley Variable Investment Series - Aggressive Equity
Portfolio of Investments n December 31, 2011
NUMBER OF
SHARES | |
| | VALUE | |
| | | Common Stocks (92.5%) | |
| | | Air Transport (1.9%) | |
| | 12,916 | | | Expeditors International of
Washington, Inc. | | $ | 529,039 | | |
| | | Alternative Energy (4.1%) | |
| | 10,066 | | | Range Resources Corp. | | | 623,488 | | |
| | 18,034 | | | Ultra Petroleum Corp. (a) | | | 534,348 | | |
| | | | 1,157,836 | | |
| | | Asset Management &
Custodian (1.5%) | |
| | 11,308 | | | Greenhill & Co., Inc. | | | 411,272 | | |
| | | Biotechnology (1.6%) | |
| | 14,419 | | | Illumina, Inc. (a) | | | 439,491 | | |
| | | Chemicals: Diversified (3.1%) | |
| | 12,216 | | | Monsanto Co. | | | 855,975 | | |
| | | Commercial Finance &
Mortgage Companies (1.8%) | |
| | 93,281 | | | BM&F Bovespa SA (Brazil) | | | 490,097 | | |
| | | Commercial Services (5.1%) | |
| | 14,085 | | | CoStar Group, Inc. (a) | | | 939,892 | | |
| | 20,715 | | | Leucadia National Corp. | | | 471,059 | | |
| | | | 1,410,951 | | |
| | | Communications
Technology (4.0%) | |
| | 23,944 | | | Motorola Solutions, Inc. | | | 1,108,368 | | |
| | | Computer Services, Software &
Systems (18.6%) | |
| | 7,934 | | | Baidu, Inc. ADR (China) (a) | | | 924,073 | | |
| | 39,222 | | | Facebook, Inc.,
Class B (a)(b)(c) | | | 1,058,994 | | |
| | 3,076 | | | Google, Inc., Class A (a) | | | 1,986,788 | | |
| | 6,423 | | | LinkedIn Corp., Class A (a) | | | 404,713 | | |
| | 5,923 | | | Salesforce.com, Inc. (a) | | | 600,948 | | |
| | 22,787 | | | Zynga, Inc., Class A (a) | | | 214,426 | | |
| | | | 5,189,942 | | |
| | | Computer Technology (11.0%) | |
| | 6,379 | | | Apple, Inc. (a) | | | 2,583,495 | | |
| | 24,689 | | | Yandex N.V., Class A
(Russia) (a) | | | 486,373 | | |
| | | | 3,069,868 | | |
NUMBER OF
SHARES | |
| | VALUE | |
| | | Diversified Retail (13.9%) | |
| | 11,836 | | | Amazon.com, Inc. (a) | | $ | 2,048,812 | | |
| | 20,402 | | | Fastenal Co. | | | 889,731 | | |
| | 31,894 | | | Groupon, Inc. (a) | | | 657,973 | | |
| | 4,039 | | | NetFlix, Inc. (a) | | | 279,862 | | |
| | | | 3,876,378 | | |
| | | Financial Data &
Systems (5.4%) | |
| | 22,657 | | | MSCI, Inc., Class A (a) | | | 746,095 | | |
| | 19,190 | | | Verisk Analytics, Inc.,
Class A (a) | | | 770,095 | | |
| | | | 1,516,190 | | |
| | | Health Care Services (2.8%) | |
| | 16,213 | | | athenahealth, Inc. (a) | | | 796,383 | | |
| | | Medical Equipment (3.7%) | |
| | 2,239 | | | Intuitive Surgical, Inc. (a) | | | 1,036,679 | | |
| | | Metals & Minerals:
Diversified (2.3%) | |
| | 324,848 | | | Lynas Corp. Ltd.
(Australia) (a) | | | 347,206 | | |
| | 12,289 | | | Molycorp, Inc. (a) | | | 294,690 | | |
| | | | 641,896 | | |
| | | Pharmaceuticals (2.9%) | |
| | 11,739 | | | Mead Johnson
Nutrition Co. | | | 806,822 | | |
| | | Real Estate Investment
Trusts (REIT) (3.6%) | |
| | 36,202 | | | Brookfield Asset Management,
Inc., Class A (Canada) | | | 994,831 | | |
| | | Recreational Vehicles &
Boats (3.2%) | |
| | 36,626 | | | Edenred (France) | | | 901,609 | | |
| | | Wholesale & International
Trade (2.0%) | |
| | 302,000 | | | Li & Fung Ltd. (d) | | | 559,158 | | |
| | | | | Total Common Stocks
(Cost $21,573,421) | | | 25,792,785 | | |
See Notes to Financial Statements
51
Morgan Stanley Variable Investment Series - Aggressive Equity
Portfolio of Investments n December 31, 2011 continued
NUMBER OF
SHARES | |
| | VALUE | |
| | | Convertible Preferred Stocks (1.3%) | | | |
| | | Alternative Energy (1.1%) | | | |
| | 70,908 | | | Better Place, Inc. (a)(b)(c) | | $ | 321,922 | | |
| | | Computer Services,
Software & Systems (0.2%) | | | |
| | 3,313 | | | Workday, Inc. (a)(b)(c) | | | 43,931 | | |
| | | | | Total Convertible
Preferred Stocks
(Cost $221,200) | | | 365,853 | | |
NUMBER OF
SHARES (000) | | | | | |
| | | Short-Term Investment (6.4%) | | | |
| | | Investment Company | | | |
| | 1,791 | | | Morgan Stanley Institutional
Liquidity Funds - Money
Market Portfolio - Institutional
Class (See Note 6)
(Cost $1,790,916) | | | 1,790,916 | | |
Total Investments
(Cost $23,585,537) | | | 100.2 | % | | | 27,949,554 | | |
Liabilities in Excess of
Other Assets | | | (0.2 | ) | | | (51,176 | ) | |
| Net Assets | | | 100.0 | % | | $ | 27,898,378 | | |
ADR American Depositary Receipt.
(a) Non-income producing security.
(b) At December 31, 2011, the Portfolio held fair valued securities valued at $1,424,847, representing 5.1% of net assets. These securities have been fair valued as determined in good faith under procedures established by and under the general supervision of the Fund's Trustees.
(c) Illiquid security. Resale is restricted to qualified institutional investors.
(d) Security trades on the Hong Kong exchange.
SUMMARY OF INVESTMENTS
INDUSTRY | | VALUE | | PERCENT OF
TOTAL
INVESTMENTS | |
Computer Services,
Software & Systems | | $ | 5,233,873 | | | | 18.7 | % | |
| Diversified Retail | | | 3,876,378 | | | | 13.9 | | |
| Computer Technology | | | 3,069,868 | | | | 11.0 | | |
| Investment Company | | | 1,790,916 | | | | 6.4 | | |
| Financial Data & Systems | | | 1,516,190 | | | | 5.4 | | |
| Alternative Energy | | | 1,479,758 | | | | 5.3 | | |
| Commercial Services | | | 1,410,951 | | | | 5.0 | | |
Communications
Technology | | | 1,108,368 | | | | 4.0 | | |
| Medical Equipment | | | 1,036,679 | | | | 3.7 | | |
Real Estate Investment
Trusts (REIT) | | | 994,831 | | | | 3.6 | | |
Recreational Vehicles &
Boats | | | 901,609 | | | | 3.2 | | |
| Chemicals: Diversified | | | 855,975 | | | | 3.1 | | |
| Pharmaceuticals | | | 806,822 | | | | 2.9 | | |
| Health Care Services | | | 796,383 | | | | 2.8 | | |
Metals & Minerals:
Diversified | | | 641,896 | | | | 2.3 | | |
Wholesale & International
Trade | | | 559,158 | | | | 2.0 | | |
| Air Transport | | | 529,039 | | | | 1.9 | | |
Commercial Finance &
Mortgage Companies | | | 490,097 | | | | 1.7 | | |
| Biotechnology | | | 439,491 | | | | 1.6 | | |
Asset Management &
Custodian | | | 411,272 | | | | 1.5 | | |
| | | $ | 27,949,554 | | | | 100.0 | % | |
See Notes to Financial Statements
52
Morgan Stanley Variable Investment Series - Strategist
Portfolio of Investments n December 31, 2011
NUMBER OF
SHARES | |
| | VALUE | |
| | | Common Stocks (55.9%) | |
| | | Aerospace & Defense (1.1%) | |
| | 31,100 | | | Raytheon Co. | | $ | 1,504,618 | | |
| | | Auto Components (1.0%) | |
| | 45,180 | | | Johnson Controls, Inc. | | | 1,412,327 | | |
| | | Biotechnology (0.7%) | |
| | 30,700 | | | Vertex Pharmaceuticals, Inc. (a) | | | 1,019,547 | | |
| | | Chemicals (1.0%) | |
| | 29,670 | | | EI du Pont de Nemours & Co. | | | 1,358,293 | | |
| | | Commercial Banks (2.0%) | |
| | 100,000 | | | Wells Fargo & Co. | | | 2,756,000 | | |
| | | Computers & Peripherals (7.3%) | |
| | 8,765 | | | Apple, Inc. (a) | | | 3,549,825 | | |
| | 101,300 | | | Hewlett-Packard Co. | | | 2,609,488 | | |
| | 77,700 | | | SanDisk Corp. (a) | | | 3,823,617 | | |
| | | | 9,982,930 | | |
| | | Diversified Financial Services (2.6%) | |
| | 45,000 | | | Citigroup, Inc. (See Note 6) | | | 1,183,950 | | |
| | 71,445 | | | JPMorgan Chase & Co. | | | 2,375,546 | | |
| | | | 3,559,496 | | |
| | | Diversified Telecommunication Services (4.1%) | |
| | 110,770 | | | CenturyLink, Inc. | | | 4,120,644 | | |
| | 37,650 | | | Verizon Communications, Inc. | | | 1,510,518 | | |
| | | | 5,631,162 | | |
| | | Food & Staples Retailing (1.1%) | |
| | 71,100 | | | Safeway, Inc. | | | 1,495,944 | | |
| | | Food Products (1.1%) | |
| | 56,700 | | | ConAgra Foods, Inc. | | | 1,496,880 | | |
| | | Hotels, Restaurants & Leisure (3.2%) | |
| | 29,050 | | | McDonald's Corp. | | | 2,914,587 | | |
| | 25,000 | | | Yum! Brands, Inc. | | | 1,475,250 | | |
| | | | 4,389,837 | | |
| | | Industrial Conglomerates (2.2%) | |
| | 89,950 | | | General Electric Co. | | | 1,611,004 | | |
| | 29,480 | | | Tyco International Ltd. | | | 1,377,011 | | |
| | | | 2,988,015 | | |
| | | Insurance (2.3%) | |
| | 45,050 | | | Chubb Corp. (The) | | | 3,118,361 | | |
See Notes to Financial Statements
53
Morgan Stanley Variable Investment Series - Strategist
Portfolio of Investments n December 31, 2011 continued
NUMBER OF
SHARES | |
| | VALUE | |
| | | Machinery (1.1%) | |
| | 31,000 | | | Illinois Tool Works, Inc. | | $ | 1,448,010 | | |
| | | Media (1.1%) | |
| | 40,650 | | | Time Warner, Inc. | | | 1,469,091 | | |
| | | Metals & Mining (2.6%) | |
| | 254,000 | | | Alcoa, Inc. | | | 2,197,100 | | |
| | 37,060 | | | Freeport-McMoRan Copper & Gold, Inc. | | | 1,363,437 | | |
| | | | 3,560,537 | | |
| | | Multi-Utilities (1.1%) | |
| | 27,630 | | | Integrys Energy Group, Inc. | | | 1,496,993 | | |
| | | Oil, Gas & Consumable Fuels (5.2%) | |
| | 26,550 | | | Chevron Corp. | | | 2,824,920 | | |
| | 39,035 | | | ConocoPhillips | | | 2,844,481 | | |
| | 17,690 | | | Exxon Mobil Corp. | | | 1,499,404 | | |
| | | | 7,168,805 | | |
| | | Paper & Forest Products (1.0%) | |
| | 47,670 | | | MeadWestvaco Corp. | | | 1,427,717 | | |
| | | Pharmaceuticals (5.2%) | |
| | 55,485 | | | Abbott Laboratories | | | 3,119,922 | | |
| | 113,060 | | | Bristol-Myers Squibb Co. | | | 3,984,234 | | |
| | | | 7,104,156 | | |
| | | Real Estate Investment Trusts (REIT) (0.7%) | |
| | 25,825 | | | Plum Creek Timber Co., Inc. REIT | | | 944,162 | | |
| | | Road & Rail (1.0%) | |
| | 18,600 | | | Norfolk Southern Corp. | | | 1,355,196 | | |
| | | Semiconductors & Semiconductor Equipment (2.0%) | |
| | 83,805 | | | Intel Corp. | | | 2,032,271 | | |
| | 50,000 | | | NVIDIA Corp. (a) | | | 693,000 | | |
| | | | 2,725,271 | | |
| | | Software (1.1%) | |
| | 55,340 | | | Microsoft Corp. | | | 1,436,626 | | |
| | | Specialty Retail (2.2%) | |
| | 73,120 | | | Home Depot, Inc. | | | 3,073,965 | | |
| | | Textiles, Apparel & Luxury Goods (0.9%) | |
| | 10,170 | | | VF Corp. | | | 1,291,488 | | |
| | | Tobacco (1.0%) | |
| | 34,280 | | | Reynolds American, Inc. | | | 1,419,878 | | |
| | | | | Total Common Stocks
(Cost $79,773,969) | | | 76,635,305 | | |
See Notes to Financial Statements
54
Morgan Stanley Variable Investment Series - Strategist
Portfolio of Investments n December 31, 2011 continued
PRINCIPAL
AMOUNT IN
THOUSANDS | |
| | COUPON
RATE | | MATURITY
DATE | | VALUE | |
| | | Corporate Bonds (10.5%) | |
| | | Basic Materials (0.7%) | |
| $ | 105 | | | Air Products & Chemicals, Inc. | | | 2.00 | % | | 08/02/16 | | $ | 107,958 | | |
| | 100 | | | Anglo American Capital PLC (United Kingdom) (b) | | | 9.375 | | | 04/08/19 | | | 127,418 | | |
| | 15 | | | ArcelorMittal (Luxembourg) | | | 7.00 | | | 10/15/39 | | | 13,980 | | |
| | 50 | | | ArcelorMittal (Luxembourg) | | | 9.85 | | | 06/01/19 | | | 55,685 | | |
| | 55 | | | Barrick North America Finance LLC | | | 4.40 | | | 05/30/21 | | | 59,680 | | |
| | 105 | | | Cliffs Natural Resources, Inc. | | | 4.875 | | | 04/01/21 | | | 104,814 | | |
| | 50 | | | Ecolab, Inc. | | | 3.00 | | | 12/08/16 | | | 51,780 | | |
| | 20 | | | Ecolab, Inc. | | | 4.35 | | | 12/08/21 | | | 21,401 | | |
| | 15 | | | FMG Resources August 2006 Pty Ltd. (Australia) (b) | | | 6.875 | | | 02/01/18 | | | 14,438 | | |
| | 35 | | | Georgia-Pacific LLC | | | 7.75 | | | 11/15/29 | | | 44,166 | | |
| | 50 | | | Georgia-Pacific LLC | | | 8.875 | | | 05/15/31 | | | 68,912 | | |
| | 75 | | | Kinross Gold Corp. (Canada) (b) | | | 5.125 | | | 09/01/21 | | | 73,745 | | |
| | 20 | | | MeadWestvaco Corp. | | | 7.375 | | | 09/01/19 | | | 23,269 | | |
| | 20 | | | Rio Tinto Finance USA Ltd. (Australia) | | | 9.00 | | | 05/01/19 | | | 27,335 | | |
| | 65 | | | Teck Resources Ltd. (Canada) | | | 4.75 | | | 01/15/22 | | | 70,008 | | |
| | 70 | | | Teck Resources Ltd. (Canada) | | | 6.25 | | | 07/15/41 | | | 81,158 | | |
| | 60 | | | Vale Overseas Ltd. (Brazil) | | | 5.625 | | | 09/15/19 | | | 66,396 | | |
| | 15 | | | Vale Overseas Ltd. (Brazil) | | | 6.875 | | | 11/10/39 | | | 17,256 | | |
| | | | 1,029,399 | | |
| | | Communications (1.2%) | |
| | 50 | | | AT&T, Inc. | | | 3.875 | | | 08/15/21 | | | 52,994 | | |
| | 85 | | | AT&T, Inc. | | | 6.30 | | | 01/15/38 | | | 104,724 | | |
| | 50 | | | CBS Corp. | | | 8.875 | | | 05/15/19 | | | 64,311 | | |
| | 45 | | | CenturyLink, Inc. | | | 6.45 | | | 06/15/21 | | | 45,162 | | |
| | 50 | | | Comcast Corp. | | | 5.15 | | | 03/01/20 | | | 56,958 | | |
| | 45 | | | Comcast Corp. | | | 5.70 | | | 05/15/18 | | | 51,854 | | |
| | 15 | | | Comcast Corp. | | | 6.45 | | | 03/15/37 | | | 18,245 | | |
| | 15 | | | COX Communications, Inc. (b) | | | 8.375 | | | 03/01/39 | | | 20,148 | | |
| | 45 | | | Deutsche Telekom International Finance BV (Germany) | | | 8.75 | | | 06/15/30 | | | 62,937 | | |
| | 30 | | | DirecTV Holdings LLC/DirecTV Financing Co., Inc. | | | 7.625 | | | 05/15/16 | | | 31,867 | | |
| | 20 | | | Expedia, Inc. | | | 5.95 | | | 08/15/20 | | | 20,202 | | |
| | 40 | | | NBC Universal Media LLC | | | 4.375 | | | 04/01/21 | | | 42,294 | | |
| | 65 | | | NBC Universal Media LLC | | | 5.15 | | | 04/30/20 | | | 72,493 | | |
| | 65 | | | News America, Inc. | | | 4.50 | | | 02/15/21 | | | 68,281 | | |
| | 40 | | | Qwest Corp. | | | 6.875 | | | 09/15/33 | | | 39,932 | | |
| | 100 | | | Sable International Finance Ltd. (United Kingdom) (b) | | | 7.75 | | | 02/15/17 | | | 100,500 | | |
| | 65 | | | Telecom Italia Capital SA (Italy) | | | 7.175 | | | 06/18/19 | | | 60,997 | | |
| | 95 | | | Telefonica Europe BV (Spain) | | | 8.25 | | | 09/15/30 | | | 104,740 | | |
See Notes to Financial Statements
55
Morgan Stanley Variable Investment Series - Strategist
Portfolio of Investments n December 31, 2011 continued
PRINCIPAL
AMOUNT IN
THOUSANDS | |
| | COUPON
RATE | | MATURITY
DATE | | VALUE | |
| $ | 55 | | | Telstra Corp., Ltd. (Australia) (b) | | | 4.80 | % | | 10/12/21 | | $ | 58,445 | | |
| | 55 | | | Time Warner, Inc. | | | 4.75 | | | 03/29/21 | | | 59,758 | | |
| | 25 | | | Time Warner, Inc. | | | 4.875 | | | 03/15/20 | | | 27,137 | | |
| | 40 | | | Time Warner, Inc. | | | 5.875 | | | 11/15/16 | | | 46,219 | | |
| | 25 | | | Time Warner, Inc. | | | 7.70 | | | 05/01/32 | | | 32,711 | | |
| | 35 | | | Verizon Communications, Inc. | | | 4.60 | | | 04/01/21 | | | 39,586 | | |
| | 35 | | | Verizon Communications, Inc. | | | 4.75 | | | 11/01/41 | | | 37,823 | | |
| | 55 | | | Verizon Communications, Inc. | | | 8.95 | | | 03/01/39 | | | 88,374 | | |
| | 45 | | | Vivendi SA (France) (b) | | | 6.625 | | | 04/04/18 | | | 51,211 | | |
| | 40 | | | WPP Finance 2010 (United Kingdom) (b) | | | 4.75 | | | 11/21/21 | | | 39,786 | | |
| | 100 | | | WPP Finance UK (United Kingdom) | | | 8.00 | | | 09/15/14 | | | 111,459 | | |
| | | | 1,611,148 | | |
| | | Consumer, Cyclical (0.5%) | |
| | 90 | | | Best Buy Co., Inc. | | | 3.75 | | | 03/15/16 | | | 88,748 | | |
| | 60 | | | Daimler Finance North America LLC (Germany) | | | 7.30 | | | 01/15/12 | | | 60,112 | | |
| | 65 | | | Gap, Inc. (The) | | | 5.95 | | | 04/12/21 | | | 62,105 | | |
| | 90 | | | Home Depot, Inc. | | | 5.875 | | | 12/16/36 | | | 113,345 | | |
| | 40 | | | Hyatt Hotels Corp. (b) | | | 6.875 | | | 08/15/19 | | | 44,704 | | |
| | 20 | | | Ingram Micro, Inc. | | | 5.25 | | | 09/01/17 | | | 20,627 | | |
| | 25 | | | JC Penney Co., Inc. | | | 5.65 | | | 06/01/20 | | | 24,625 | | |
| | 49 | | | JC Penney Corp., Inc. | | | 6.375 | | | 10/15/36 | | | 41,221 | | |
| | 70 | | | VF Corp. | | | 3.50 | | | 09/01/21 | | | 72,862 | | |
| | 40 | | | Wal-Mart Stores, Inc. | | | 5.25 | | | 09/01/35 | | | 48,020 | | |
| | 45 | | | Wesfarmers Ltd. (Australia) (b) | | | 2.983 | | | 05/18/16 | | | 45,404 | | |
| | 75 | | | Wyndham Worldwide Corp. | | | 5.625 | | | 03/01/21 | | | 77,581 | | |
| | 5 | | | Yum! Brands, Inc. | | | 6.875 | | | 11/15/37 | | | 6,405 | | |
| | | | 705,759 | | |
| | | Consumer, Non-Cyclical (1.3%) | |
| | 50 | | | Altria Group, Inc. | | | 4.125 | | | 09/11/15 | | | 54,327 | | |
| | 60 | | | Altria Group, Inc. | | | 9.25 | | | 08/06/19 | | | 80,682 | | |
| | 50 | | | Amgen, Inc. | | | 2.50 | | | 11/15/16 | | | 50,657 | | |
| | 15 | | | Amgen, Inc. | | | 3.875 | | | 11/15/21 | | | 15,168 | | |
| | 50 | | | BAT International Finance PLC (United Kingdom) (b) | | | 9.50 | | | 11/15/18 | | | 67,985 | | |
| | 60 | | | Boston Scientific Corp. | | | 6.00 | | | 01/15/20 | | | 67,088 | | |
| | 45 | | | Bunge Ltd. Finance Corp. | | | 8.50 | | | 06/15/19 | | | 54,854 | | |
| | 90 | | | Cigna Corp. | | | 2.75 | | | 11/15/16 | | | 89,904 | | |
| | 55 | | | ConAgra Foods, Inc. | | | 8.25 | | | 09/15/30 | | | 69,960 | | |
| | 65 | | | Coventry Health Care, Inc. | | | 5.45 | | | 06/15/21 | | | 72,364 | | |
| | 96 | | | Delhaize Group SA (Belgium) | | | 5.70 | | | 10/01/40 | | | 98,903 | | |
| | 65 | | | Gilead Sciences, Inc. | | | 4.50 | | | 04/01/21 | | | 69,046 | | |
See Notes to Financial Statements
56
Morgan Stanley Variable Investment Series - Strategist
Portfolio of Investments n December 31, 2011 continued
PRINCIPAL
AMOUNT IN
THOUSANDS | |
| | COUPON
RATE | | MATURITY
DATE | | VALUE | |
| $ | 100 | | | Grupo Bimbo SAB de CV (Mexico) (b) | | | 4.875 | % | | 06/30/20 | | $ | 106,340 | | |
| | 180 | | | Kraft Foods, Inc. | | | 7.00 | | | 08/11/37 | | | 241,293 | | |
| | 70 | | | Life Technologies Corp. | | | 6.00 | | | 03/01/20 | | | 78,377 | | |
| | 50 | | | Quest Diagnostics, Inc. | | | 6.95 | | | 07/01/37 | | | 62,371 | | |
| | 75 | | | Sanofi (France) | | | 4.00 | | | 03/29/21 | | | 83,257 | | |
| | 120 | | | Teva Pharmaceutical Finance IV BV (Israel) | | | 3.65 | | | 11/10/21 | | | 122,308 | | |
| | 115 | | | UnitedHealth Group, Inc. | | | 6.625 | | | 11/15/37 | | | 148,154 | | |
| | 55 | | | Verisk Analytics, Inc. | | | 5.80 | | | 05/01/21 | | | 59,315 | | |
| | 65 | | | Woolworths Ltd. (Australia) (b) | | | 4.00 | | | 09/22/20 | | | 67,183 | | |
| | | | 1,759,536 | | |
| | | Energy (0.8%) | |
| | 45 | | | Anadarko Petroleum Corp. | | | 6.95 | | | 06/15/19 | | | 53,802 | | |
| | 75 | | | Energy Transfer Partners LP | | | 8.50 | | | 04/15/14 | | | 84,133 | | |
| | 35 | | | Enterprise Products Operating LLC | | | 5.25 | | | 01/31/20 | | | 38,709 | | |
| | 90 | | | Enterprise Products Operating LLC, Series N | | | 6.50 | | | 01/31/19 | | | 104,955 | | |
| | 50 | | | EQT Corp. | | | 4.875 | | | 11/15/21 | | | 50,570 | | |
| | 25 | | | EQT Corp. | | | 8.125 | | | 06/01/19 | | | 29,366 | | |
| | 100 | | | Gazprom OAO Via Gaz Capital SA (Russia) (b) | | | 6.51 | | | 03/07/22 | | | 102,000 | | |
| | 75 | | | Hess Corp. | | | 6.00 | | | 01/15/40 | | | 89,061 | | |
| | 50 | | | Kinder Morgan Energy Partners LP | | | 5.95 | | | 02/15/18 | | | 57,197 | | |
| | 80 | | | Kinder Morgan Finance Co. ULC | | | 5.70 | | | 01/05/16 | | | 82,200 | | |
| | 35 | | | Marathon Petroleum Corp. | | | 5.125 | | | 03/01/21 | | | 36,630 | | |
| | 80 | | | Petrobras International Finance Co. (Brazil) | | | 5.75 | | | 01/20/20 | | | 86,010 | | |
| | 60 | | | Plains All American Pipeline LP/PAA Finance Corp. | | | 6.70 | | | 05/15/36 | | | 71,515 | | |
| | 60 | | | Plains All American Pipeline LP/PAA Finance Corp. | | | 8.75 | | | 05/01/19 | | | 76,758 | | |
| | 50 | | | Spectra Energy Capital LLC | | | 7.50 | | | 09/15/38 | | | 65,275 | | |
| | 55 | | | Texas Eastern Transmission LP | | | 7.00 | | | 07/15/32 | | | 70,357 | | |
| | | | 1,098,538 | | |
| | | Finance (4.5%) | |
| | 100 | | | ABB Treasury Center USA, Inc. (Switzerland) (b) | | | 2.50 | | | 06/15/16 | | | 100,658 | | |
| | 100 | | | Abbey National Treasury Services PLC
(United Kingdom) (b) | | | 3.875 | | | 11/10/14 | | | 93,913 | | |
| | 75 | | | Aegon N.V. (Netherlands) | | | 4.625 | | | 12/01/15 | | | 77,822 | | |
| | 135 | | | American International Group, Inc. | | | 6.40 | | | 12/15/20 | | | 136,476 | | |
| | 100 | | | Australia & New Zealand Banking Group Ltd.
(Australia) (b) | | | 4.875 | | | 01/12/21 | | | 105,810 | | |
| | 30 | | | Bank of America Corp. | | | 5.75 | | | 12/01/17 | | | 28,370 | | |
| | 135 | | | Bank of America Corp., Series L | | | 5.65 | | | 05/01/18 | | | 128,789 | | |
| | 175 | | | Barclays Bank PLC (United Kingdom) | | | 6.75 | | | 05/22/19 | | | 194,294 | | |
| | 60 | | | Bear Stearns Cos. LLC (The) | | | 6.40 | | | 10/02/17 | | | 67,115 | | |
See Notes to Financial Statements
57
Morgan Stanley Variable Investment Series - Strategist
Portfolio of Investments n December 31, 2011 continued
PRINCIPAL
AMOUNT IN
THOUSANDS | |
| | COUPON
RATE | | MATURITY
DATE | | VALUE | |
| $ | 170 | | | Bear Stearns Cos. LLC (The) | | | 7.25 | % | | 02/01/18 | | $ | 199,550 | | |
| | 130 | | | Berkshire Hathaway, Inc. | | | 3.75 | | | 08/15/21 | | | 135,349 | | |
| | 75 | | | BNP Paribas SA (France) | | | 5.00 | | | 01/15/21 | | | 72,316 | | |
| | 75 | | | Brandywine Operating Partnership LP | | | 4.95 | | | 04/15/18 | | | 73,927 | | |
| | 45 | | | Brookfield Asset Management, Inc. (Canada) | | | 5.80 | | | 04/25/17 | | | 47,813 | | |
| | 35 | | | Citigroup, Inc. (See Note 6) | | | 5.875 | | | 05/29/37 | | | 35,071 | | |
| | 160 | | | Citigroup, Inc. (See Note 6) | | | 6.125 | | | 11/21/17 | | | 170,968 | | |
| | 70 | | | Citigroup, Inc. (See Note 6) | | | 6.125 | | | 05/15/18 | | | 74,603 | | |
| | 95 | | | CNA Financial Corp. | | | 5.75 | | | 08/15/21 | | | 97,119 | | |
| | 240 | | | Credit Suisse (Switzerland) | | | 5.40 | | | 01/14/20 | | | 226,720 | | |
| | 25 | | | Credit Suisse (Switzerland) | | | 6.00 | | | 02/15/18 | | | 24,687 | | |
| | 60 | | | Dexus Diversified Trust/Dexus Office Trust
(Australia) (b) | | | 5.60 | | | 03/15/21 | | | 61,082 | | |
| | 115 | | | Digital Realty Trust LP | | | 4.50 | | | 07/15/15 | | | 117,395 | | |
| | 25 | | | ERP Operating LP | | | 4.625 | | | 12/15/21 | | | 25,543 | | |
| | 140 | | | Farmers Exchange Capital (b) | | | 7.05 | | | 07/15/28 | | | 148,541 | | |
| | 60 | | | General Electric Capital Corp. | | | 5.30 | | | 02/11/21 | | | 64,253 | | |
| | 160 | | | General Electric Capital Corp. | | | 5.625 | | | 05/01/18 | | | 179,441 | | |
| | 270 | | | General Electric Capital Corp., Series G | | | 6.00 | | | 08/07/19 | | | 310,611 | | |
| | 75 | | | Genworth Financial, Inc. | | | 7.20 | | | 02/15/21 | | | 68,553 | | |
| | 190 | | | Goldman Sachs Group, Inc. (The) | | | 6.15 | | | 04/01/18 | | | 196,350 | | |
| | 80 | | | Goldman Sachs Group, Inc. (The) | | | 6.75 | | | 10/01/37 | | | 74,659 | | |
| | 60 | | | Goldman Sachs Group, Inc. (The) | | | 7.50 | | | 02/15/19 | | | 66,357 | | |
| | 45 | | | Harley-Davidson Funding Corp. (b) | | | 6.80 | | | 06/15/18 | | | 52,660 | | |
| | 60 | | | Hartford Financial Services Group, Inc. | | | 5.50 | | | 03/30/20 | | | 60,996 | | |
| | 130 | | | HBOS PLC, Series G (United Kingdom) (b) | | | 6.75 | | | 05/21/18 | | | 104,360 | | |
| | 30 | | | Health Care REIT, Inc. | | | 6.125 | | | 04/15/20 | | | 31,134 | | |
| | 210 | | | HSBC Holdings PLC (United Kingdom) | | | 5.10 | | | 04/05/21 | | | 223,558 | | |
| | 60 | | | JPMorgan Chase & Co. | | | 4.25 | | | 10/15/20 | | | 60,531 | | |
| | 15 | | | JPMorgan Chase & Co. | | | 4.95 | | | 03/25/20 | | | 15,970 | | |
| | 70 | | | Lloyds TSB Bank PLC (United Kingdom) | | | 6.375 | | | 01/21/21 | | | 70,269 | | |
| | 50 | | | Macquarie Bank Ltd. (Australia) (b) | | | 6.625 | | | 04/07/21 | | | 46,175 | | |
| | 55 | | | Macquarie Group Ltd. (Australia) (b) | | | 6.00 | | | 01/14/20 | | | 51,670 | | |
| | 225 | | | Merrill Lynch & Co., Inc., MTN | | | 6.875 | | | 04/25/18 | | | 222,116 | | |
| | 35 | | | MetLife, Inc. (See Note 6) | | | 7.717 | | | 02/15/19 | | | 43,951 | | |
| | 35 | | | NASDAQ OMX Group, Inc. (The) | | | 5.55 | | | 01/15/20 | | | 35,915 | | |
| | 170 | | | Nationwide Building Society (United Kingdom) (b) | | | 6.25 | | | 02/25/20 | | | 168,936 | | |
| | 50 | | | Nationwide Financial Services (b) | | | 5.375 | | | 03/25/21 | | | 49,201 | | |
| | 75 | | | Pacific LifeCorp (b) | | | 6.00 | | | 02/10/20 | | | 79,951 | | |
| | 60 | | | Platinum Underwriters Finance, Inc., Series B | | | 7.50 | | | 06/01/17 | | | 63,215 | | |
| | 50 | | | Principal Financial Group, Inc. | | | 8.875 | | | 05/15/19 | | | 62,340 | | |
See Notes to Financial Statements
58
Morgan Stanley Variable Investment Series - Strategist
Portfolio of Investments n December 31, 2011 continued
PRINCIPAL
AMOUNT IN
THOUSANDS | |
| | COUPON
RATE | | MATURITY
DATE | | VALUE | |
| $ | 40 | | | Prudential Financial, Inc., MTN | | | 6.625 | % | | 12/01/37 | | $ | 43,942 | | |
| | 50 | | | Regions Financial Corp. | | | 5.75 | | | 06/15/15 | | | 48,250 | | |
| | 60 | | | Reinsurance Group of America, Inc. | | | 6.45 | | | 11/15/19 | | | 67,512 | | |
| | 25 | | | Santander Holdings USA, Inc. (Spain) | | | 4.625 | | | 04/19/16 | | | 24,031 | | |
| | 50 | | | Simon Property Group LP | | | 4.125 | | | 12/01/21 | | | 52,390 | | |
| | 70 | | | SLM Corp., MTN | | | 6.25 | | | 01/25/16 | | | 68,133 | | |
| | 100 | | | Standard Chartered Bank (United Kingdom) (b) | | | 6.40 | | | 09/26/17 | | | 103,091 | | |
| | 55 | | | SunTrust Banks, Inc. | | | 3.50 | | | 01/20/17 | | | 55,347 | | |
| | 105 | | | TD Ameritrade Holding Corp. | | | 5.60 | | | 12/01/19 | | | 113,713 | | |
| | 100 | | | UBS AG (Switzerland) | | | 5.75 | | | 04/25/18 | | | 103,744 | | |
| | 100 | | | Ventas Realty LP/Ventas Capital Corp. | | | 4.75 | | | 06/01/21 | | | 96,695 | | |
| | 75 | | | Vornado Realty LP | | | 5.00 | | | 01/15/22 | | | 75,770 | | |
| | 60 | | | Wachovia Corp. | | | 5.625 | | | 10/15/16 | | | 65,391 | | |
| | 75 | | | WEA Finance LLC (Australia) (b) | | | 4.625 | | | 05/10/21 | | | 73,750 | | |
| | 95 | | | Wells Fargo & Co. | | | 5.625 | | | 12/11/17 | | | 108,394 | | |
| | 80 | | | Wells Operating Partnership II LP | | | 5.875 | | | 04/01/18 | | | 82,205 | | |
| | 80 | | | Willis Group Holdings PLC | | | 4.125 | | | 03/15/16 | | | 81,329 | | |
| | | | 6,110,790 | | |
| | | Industrials (0.6%) | |
| | 100 | | | BAA Funding Ltd. (United Kingdom) (b) | | | 4.875 | | | 07/15/23 | | | 103,090 | | |
| | 65 | | | Bemis Co., Inc. | | | 4.50 | | | 10/15/21 | | | 68,993 | | |
| | 90 | | | Cooper US, Inc. | | | 5.25 | | | 11/15/12 | | | 93,459 | | |
| | 75 | | | CRH America, Inc. | | | 6.00 | | | 09/30/16 | | | 80,199 | | |
| | 30 | | | Holcim US Finance Sarl & Cie SCS (Switzerland) (b) | | | 6.00 | | | 12/30/19 | | | 30,963 | | |
| | 75 | | | L-3 Communications Corp. | | | 4.95 | | | 02/15/21 | | | 74,464 | | |
| | 55 | | | Lafarge SA (France) (b) | | | 6.20 | | | 07/09/15 | | | 56,016 | | |
| | 10 | | | Norfolk Southern Corp. (b) | | | 4.837 | | | 10/01/41 | | | 10,653 | | |
| | 50 | | | Norfolk Southern Corp. | | | 7.25 | | | 02/15/31 | | | 69,582 | | |
| | 70 | | | Sonoco Products Co. | | | 5.75 | | | 11/01/40 | | | 75,066 | | |
| | 40 | | | Union Pacific Corp. | | | 6.125 | | | 02/15/20 | | | 49,045 | | |
| | 80 | | | Waste Management, Inc. | | | 6.125 | | | 11/30/39 | | | 98,495 | | |
| | | | 810,025 | | |
| | | Technology (0.3%) | |
| | 50 | | | Fiserv, Inc. | | | 3.125 | | | 06/15/16 | | | 50,962 | | |
| | 125 | | | Hewlett-Packard Co. | | | 4.65 | | | 12/09/21 | | | 132,148 | | |
| | 100 | | | International Business Machines Corp. | | | 7.625 | | | 10/15/18 | | | 134,383 | | |
| | 45 | | | KLA-Tencor Corp. | | | 6.90 | | | 05/01/18 | | | 51,960 | | |
| | | | 369,453 | | |
See Notes to Financial Statements
59
Morgan Stanley Variable Investment Series - Strategist
Portfolio of Investments n December 31, 2011 continued
PRINCIPAL
AMOUNT IN
THOUSANDS | |
| | COUPON
RATE | | MATURITY
DATE | | VALUE | |
| | | Utilities (0.6%) | | | |
| $ | 50 | | | EDF SA (France) (b) | | | 4.60 | % | | 01/27/20 | | $ | 51,190 | | |
| | 125 | | | Enel Finance International N.V. (Italy) (b) | | | 5.125 | | | 10/07/19 | | | 111,842 | | |
| | 150 | | | Exelon Generation Co., LLC | | | 6.25 | | | 10/01/39 | | | 183,435 | | |
| | 140 | | | FirstEnergy Solutions Corp. | | | 6.05 | | | 08/15/21 | | | 155,644 | | |
| | 75 | | | Iberdrola Finance Ireland Ltd. (Spain) (b) | | | 5.00 | | | 09/11/19 | | | 73,367 | | |
| | 75 | | | Ohio Power Co., Series M | | | 5.375 | | | 10/01/21 | | | 86,199 | | |
| | 80 | | | Oncor Electric Delivery Co., LLC | | | 6.80 | | | 09/01/18 | | | 97,422 | | |
| | 75 | | | PPL WEM Holdings PLC (b) | | | 3.90 | | | 05/01/16 | | | 75,255 | | |
| | | | 834,354 | | |
| | | | | Total Corporate Bonds
(Cost $13,425,935) | | | | | | | 14,329,002 | | |
| | | Sovereign (0.3%) | | | |
| | 230 | | | Brazilian Government International Bond (Brazil) | | | 6.00 | | | 01/17/17 | | | 269,100 | | |
| | 105 | | | Republic of Italy (Italy) | | | 6.875 | | | 09/27/23 | | | 102,207 | | |
| | | | | Total Sovereign
(Cost $350,899) | | | | | | | 371,307 | | |
| | | Municipal Bonds (0.4%) | | | |
| | 75 | | | Chicago, IL, Transit Authority | | | 6.20 | | | 12/01/40 | | | 84,721 | | |
| | 30 | | | City of Chicago, IL | | | 6.395 | | | 01/01/40 | | | 36,846 | | |
| | 70 | | | City of New York, NY, Series G-1 | | | 5.968 | | | 03/01/36 | | | 83,383 | | |
| | 85 | | | Illinois State Toll Highway Authority, Highway
Revenue, Build America Bonds | | | 6.184 | | | 01/01/34 | | | 100,748 | | |
| | | Municipal Electric Authority of Georgia | | | |
| | 50 | | | | | | | | 6.637 | | | 04/01/57 | | | 52,970 | | |
| | 95 | | | | | | | | 6.655 | | | 04/01/57 | | | 97,523 | | |
| | 65 | | | New York City Transitional Finance Authority | | | 5.267 | | | 05/01/27 | | | 81,091 | | |
| | | State of California, | | | |
| | | General Obligation Bonds | | | |
| | 45 | | | | | | | | 5.95 | | | 04/01/16 | | | 50,759 | | |
| | 30 | | | | | | | | 6.65 | | | 03/01/22 | | | 35,001 | | |
| | | | | Total Municipal Bonds
(Cost $547,369) | | | | | | | 623,042 | | |
| | | Agency Fixed Rate Mortgages (0.0%) | | | |
| | 2 | | | Federal Home Loan Mortgage Corporation,
Gold Pools | | | 6.50 | | | 05/01/29 - 12/01/31 | | | 2,824 | | |
| | 1 | | | Federal National Mortgage Association,
Conventional Pools | | | 6.50 | | | 11/01/29 | | | 647 | | |
| | | | | Total Agency Fixed Rate Mortgages
(Cost $3,155) | | | | | | | 3,471 | | |
See Notes to Financial Statements
60
Morgan Stanley Variable Investment Series - Strategist
Portfolio of Investments n December 31, 2011 continued
PRINCIPAL
AMOUNT IN
THOUSANDS | |
| | COUPON
RATE | | MATURITY
DATE | | VALUE | |
| | | Asset-Backed Securities (1.0%) | | | |
| $ | 100 | | | Ally Master Owner Trust | | | 1.148 | (c)% | | 01/15/16 | | $ | 100,297 | | |
| | 123 | | | America West Airlines 2001-1 Pass-Through Trust,
Series 011G (AMBAC) | | | 7.10 | | | 10/02/22 | | | 114,075 | | |
| | 31 | | | Brazos Student Finance Corp. | | | 1.258 | (c) | | 06/25/35 | | | 31,177 | | |
| | 144 | | | CVS Pass-Through Trust | | | 6.036 | | | 12/10/28 | | | 150,129 | | |
| | 200 | | | FUEL Trust (b) | | | 4.207 | | | 04/15/16 | | | 201,894 | | |
| | 100 | | | GE Dealer Floorplan Master Note Trust (b) | | | 1.828 | (c) | | 10/20/14 | | | 100,883 | | |
| | 175 | | | Louisiana Public Facilities Authority | | | 1.318 | (c) | | 04/26/27 | | | 169,477 | | |
| | 150 | | | Nissan Auto Receivables Owner Trust | | | 1.18 | | | 02/16/15 | | | 150,711 | | |
| | 180 | | | PFS Financing Corp. (b) | | | 1.778 | (c) | | 10/17/16 | | | 180,133 | | |
| | 125 | | | World Omni Automobile Lease Securitization Trust | | | 1.49 | | | 10/15/14 | | | 125,772 | | |
| | | | | Total Asset-Backed Securities
(Cost $1,325,757) | | | | | | | 1,324,548 | | |
| | | Agency Bond - Banking (FDIC Guaranteed) (0.7%) | | | |
| | 1,000 | | | Citigroup Funding, Inc. (See Note 6)
(Cost $1,000,690) (d) | | | 2.25 | | | 12/10/12 | | | 1,018,808 | | |
| | | U.S. Treasury Securities (9.8%) | | | |
| | | U.S. Treasury Bonds | | | |
| | 1,830 | | | | | | | | 3.50 | | | 02/15/39 | | | 2,058,750 | | |
| | 280 | | | | | | | | 3.875 | | | 08/15/40 | | | 335,694 | | |
| | 730 | | | | | | | | 6.875 | | | 08/15/25 | | | 1,124,314 | | |
| | | U.S. Treasury Notes | | | |
| | 610 | | | | | | | | 0.50 | | | 10/15/13 | | | 612,740 | | |
| | 1,975 | | | | | | | | 1.25 | | | 08/31/15 | | | 2,027,770 | | |
| | 3,275 | | | | | | | | 1.75 | | | 01/31/14 - 07/31/15 | | | 3,395,561 | | |
| | 1,345 | | | | | | | | 2.25 | | | 01/31/15 | | | 1,420,972 | | |
| | 2,300 | | | | | | | | 2.375 | | | 08/31/14 | | | 2,423,266 | | |
| | | | | Total U.S. Treasury Securities
(Cost $12,741,745) | | | | | | | 13,399,067 | | |
| | | U.S. Agency Securities (1.6%) | | | |
| | | Federal Home Loan Mortgage Corporation | | | |
| | 260 | | | | | | | | 0.625 | | | 12/29/14 | | | 260,002 | | |
| | 365 | | | | | | | | 1.00 | | | 07/30/14 | | | 369,148 | | |
| | 150 | | | | | | | | 3.75 | | | 03/27/19 | | | 171,504 | | |
| | 45 | | | | | | | | 6.75 | | | 03/15/31 | | | 67,857 | | |
See Notes to Financial Statements
61
Morgan Stanley Variable Investment Series - Strategist
Portfolio of Investments n December 31, 2011 continued
PRINCIPAL
AMOUNT IN
THOUSANDS | |
| | COUPON
RATE | | MATURITY
DATE | | VALUE | |
| | | Federal National Mortgage Association | |
| $ | 700 | | | | | | | | 4.375 | % | | 10/15/15 | | $ | 791,691 | | |
| | 450 | | | | | | | | 5.375 | | | 06/12/17 | | | 544,358 | | |
| | | | | Total U.S. Agency Securities
(Cost $2,111,456) | | | | | | | 2,204,560 | | |
| | | Short-Term Investments (19.5%) | |
| | | U.S. Treasury Security (0.1%) | |
| | 100 | | | U.S. Treasury Bill
(Cost $99,996) (e)(f) | | | 0.018 | | | 03/22/12 | | | 99,997 | | |
NUMBER OF
SHARES (000) | |
| |
| |
| |
| |
| | | Investment Company (19.4%) | |
| | 26,626 | | | Morgan Stanley Institutional Liquidity Funds - Money
Market Portfolio - Institutional Class (See Note 6)
(Cost $26,626,452) | | | 26,626,452 | | |
| | | | | Total Short-Term Investments
(Cost $26,726,448) | | | | | | | 26,726,449 | | |
| | | | | Total Investments
(Cost $138,007,423) (g) | | | | | 99.7 | % | | | 136,635,559 | | |
| | | | | Other Assets in Excess of Liabilities | | | | | 0.3 | | | | 376,770 | | |
| | | | | Net Assets | | | | | 100.0 | % | | $ | 137,012,329 | | |
FDIC Federal Deposit Insurance Corporation.
MTN Medium Term Note.
(a) Non-income producing security.
(b) 144A security — Certain conditions for public sale may exist. Unless otherwise noted, these securities are deemed to be liquid.
(c) Variable/Floating Rate Security — Interest rate changes on these instruments are based on changes in a designated base rate. The rates shown are those in effect on December 31, 2011.
(d) Agency Bonds — Banking (FDIC Guaranteed)
(e) A portion of this security has been physically segregated in connection with open futures contracts and swap agreements.
(f) Rate shown is the yield to maturity at December 31, 2011.
(g) Securities are available for collateral in connection with open foreign currency exchange contracts, futures contracts and swap agreements.
Bond Insurance:
AMBAC AMBAC Assurance Corporation.
See Notes to Financial Statements
62
Morgan Stanley Variable Investment Series - Strategist
Portfolio of Investments n December 31, 2011 continued
FOREIGN CURRENCY EXCHANGE CONTRACTS OPEN AT DECEMBER 31, 2011:
| COUNTERPARTY | | CONTRACTS
TO DELIVER | | IN EXCHANGE
FOR | | DELIVERY
DATE | | UNREALIZED
APPRECIATION
(DEPRECIATION) | |
| UBS AG | | $ | 178,321 | | | NOK | 1,030,000 | | | 01/20/12 | | $ | (6,192 | ) | |
| JPMorgan Chase Bank | | CHF | 66,000 | | | $ | 71,375 | | | 01/20/12 | | | 1,091 | | |
| JPMorgan Chase Bank | | SEK | 360,000 | | | $ | 53,295 | | | 01/20/12 | | | 1,027 | | |
| Net Unrealized Depreciation | | $ | (4,074 | ) | |
FUTURES CONTRACTS OPEN AT DECEMBER 31, 2011:
NUMBER OF
CONTRACTS | | LONG/SHORT | | DESCRIPTION, DELIVERY
MONTH AND YEAR | | UNDERLYING FACE
AMOUNT AT VALUE | | UNREALIZED
APPRECIATION
(DEPRECIATION) | |
| | 2 | | | Long | | U.S. Treasury 5 yr. Note,
Mar-12 | | $ | 246,516 | | | $ | 265 | | |
| | 1 | | | Long | | U.S. Treasury 2 yr. Note,
Mar-12 | | | 220,547 | | | | 118 | | |
| | 1 | | | Short | | U.S. Treasury Ultra Long Bond,
Mar-12 | | | (160,187 | ) | | | (781 | ) | |
| | 3 | | | Short | | U.S. Treasury 30 yr. Bond,
Mar-12 | | | (434,438 | ) | | | (2,625 | ) | |
| Net Unrealized Depreciation | | $ | (3,023 | ) | |
See Notes to Financial Statements
63
Morgan Stanley Variable Investment Series - Strategist
Portfolio of Investments n December 31, 2011 continued
INTEREST RATE SWAP AGREEMENTS OPEN AT DECEMBER 31, 2011:
SWAP
COUNTERPARTY | | NOTIONAL
AMOUNT
(000) | | FLOATING
RATE INDEX | | PAY/RECEIVE
FLOATING RATE | | FIXED RATE | | TERMINATION
DATE | | UNREALIZED
APPRECIATION
(DEPRECIATION) | |
| Goldman Sachs | | $ | 5,640 | | | 3 Month CDOR | | Receive | | | 2.70 | % | | 07/15/15 | | $ | (147,395 | ) | |
| Barclays Capital | | | 59,956 | | | 3 Month STIBOR | | Receive | | | 2.89 | | | 07/29/13 | | | (91,873 | ) | |
| Bank of America NA | | | 2,305 | | | 3 Month LIBOR | | Receive | | | 4.35 | | | 08/18/26 | | | (93,796 | ) | |
| Barclays Capital | | | 24,090 | | | 3 Month STIBOR | | Receive | | | 2.30 | | | 09/12/12 | | | 19,456 | | |
| Bank of America NA | | | 2,175 | | | 6 Month EURIBOR | | Receive | | | 3.61 | | | 08/18/31 | | | (76,446 | ) | |
| Bank of America NA | | | 1,720 | | | 6 Month EURIBOR | | Pay | | | 4.26 | | | 08/18/26 | | | 76,636 | | |
| Bank of America | | | 2,860 | | | 3 Month LIBOR | | Pay | | | 4.15 | | | 08/18/31 | | | 103,291 | | |
| Credit Suisse | | | 1,388 | | | 3 Month CDOR | | Pay | | | 4.07 | | | 09/08/20 | | | 88,111 | | |
| Credit Suisse | | | 1,000 | | | 3 Month CDOR | | Pay | | | 4.12 | | | 09/08/20 | | | 66,086 | | |
| Barclays Capital | | | 51,185 | | | 3 Month STIBOR | | Pay | | | 2.76 | | | 07/29/12 | | | 82,475 | | |
| Net Unrealized Appreciation | | $ | 26,545 | | |
ZERO COUPON SWAP AGREEMENTS OPEN AT DECEMBER 31, 2011:
SWAP
COUNTERPARTY | | NOTIONAL
AMOUNT
(000) | | FLOATING
RATE INDEX | | PAY/RECEIVE
FLOATING RATE | | TERMINATION
DATE | | UNREALIZED
APPRECIATION
(DEPRECIATION) | |
| Barclays Bank PLC | | $ | 515 | | | 3 Month LIBOR | | Pay | | 11/15/19 | | $ | 95,195 | | |
| Barclays Bank PLC | | | 435 | | | 3 Month LIBOR | | Receive | | 11/15/19 | | | (171,196 | ) | |
| Net Unrealized Depreciation | | $ | (76,001 | ) | |
CDOR Canadian Dealer Offered Rate.
EURIBOR Euro Interbank Offered Rate.
LIBOR London Interbank Offered Rate.
STIBOR Stockholm Interbank Offered Rate.
Currency Abbreviations:
CHF Swiss Franc.
NOK Norwegian Krone.
SEK Swedish Krona.
See Notes to Financial Statements
64
Morgan Stanley Variable Investment Series - Strategist
Summary of Investments n December 31, 2011
| PORTFOLIO COMPOSITION | | VALUE | | PERCENT OF
TOTAL
INVESTMENTS | |
| Common Stocks | | $ | 76,635,305 | | | | 56.1 | % | |
| Investment Company | | | 26,626,452 | | | | 19.5 | | |
| Corporate Bonds | | | 14,329,002 | | | | 10.5 | | |
| U.S. Treasury Securities | | | 13,499,064 | | | | 9.9 | | |
| U.S. Agency Securities | | | 2,204,560 | | | | 1.6 | | |
| Asset-Backed Securities | | | 1,324,548 | | | | 1.0 | | |
| Agency Bond - Banking (FDIC Guaranteed) | | | 1,018,808 | | | | 0.7 | | |
| Municipal Bonds | | | 623,042 | | | | 0.4 | | |
| Sovereign | | | 371,307 | | | | 0.3 | | |
| Agency Fixed Rate Mortgages | | | 3,471 | | | | 0.0 | + | |
| | | $ | 136,635,559 | ++ | | | 100.0 | % | |
+ Amount is less that 0.05%
++ Does not include open long/short futures contracts with an underlying face amount of $1,061,688 and net unrealized depreciation of $3,023. Also does not include open foreign currency exchange contracts with net unrealized depreciation of $4,074 and open swap agreements with net unrealized depreciation of $49,456.
See Notes to Financial Statements
65
Morgan Stanley Variable Investment Series
Financial Statements
Statements of Assets and Liabilities
December 31, 2011
| | | Money
Market | | Limited
Duration | | Income
Plus | | Global
Infrastructure | |
| Assets: | |
| Investments in securities, at value* | | $ | 107,581,291 | (1) | | $ | 55,012,592 | | | $ | 185,070,247 | | | $ | 71,238,028 | | |
| Investment in affiliate, at value** | | | — | | | | 1,525,070 | | | | 4,673,651 | | | | 1,993,348 | | |
| Total investments in securities, at value | | | 107,581,291 | | | | 56,537,662 | | | | 189,743,898 | | | | 73,231,376 | | |
| Unrealized appreciation on open swap agreements | | | — | | | | 369,297 | | | | — | | | | — | | |
| Unrealized appreciation on open foreign currency exchange contracts | | | — | | | | — | | | | — | | | | — | | |
| Cash | | | 10,785 | | | | — | | | | 16,350 | | | | 31,825 | (2) | |
| Receivable for: | |
| Investments sold | | | — | | | | — | | | | 666,654 | | | | — | | |
| Interest | | | 8,068 | | | | 396,556 | | | | 2,481,710 | | | | — | | |
| Shares of beneficial interest sold | | | 727,309 | | | | 170,382 | | | | 1,120,153 | | | | 7 | | |
| Dividends | | | — | | | | — | | | | 11,604 | | | | 330,533 | | |
| Foreign withholding taxes reclaimed | | | — | | | | — | | | | 572 | | | | 29,231 | | |
| Interest and dividends from affiliates | | | — | | | | 1,316 | | | | 63,640 | | | | 85 | | |
| Variation margin | | | — | | | | 10,406 | | | | — | | | | — | | |
| Premium paid on open swap agreements | | | — | | | | — | | | | 16,985 | | | | — | | |
| Prepaid expenses and other assets | | | 5,567 | | | | 5,037 | | | | 4,810 | | | | 2,286 | | |
| Total Assets | | | 108,333,020 | | | | 57,490,656 | | | | 194,126,376 | | | | 73,625,343 | | |
| Liabilities: | |
| Unrealized depreciation on open swap agreements | | | — | | | | 640,290 | | | | 10,900 | | | | — | | |
| Unrealized depreciation on open foreign currency exchange contracts | | | — | | | | — | | | | — | | | | — | | |
| Payable for: | |
| Investments purchased | | | 1,000,014 | | | | — | | | | — | | | | 27,279 | | |
| Shares of beneficial interest redeemed | | | 115 | | | | 31 | | | | 87,775 | | | | 36,741 | | |
| Investment advisory fee | | | 605 | | | | 14,493 | | | | 68,576 | | | | 34,805 | | |
| Variation margin | | | — | | | | — | | | | 35,282 | | | | — | | |
| Distribution fee (Class Y) | | | — | | | | 9,381 | | | | 21,541 | | | | 3,019 | | |
| Administration fee | | | 4,418 | | | | 3,865 | | | | 13,062 | | | | 4,885 | | |
| Transfer agent fee | | | 493 | | | | 417 | | | | 500 | | | | 500 | | |
| Accrued expenses and other payables | | | 47,267 | | | | 44,731 | | | | 64,790 | | | | 47,290 | | |
| Total Liabilities | | | 1,052,912 | | | | 713,208 | | | | 302,426 | | | | 154,519 | | |
| Net Assets | | $ | 107,280,108 | | | $ | 56,777,448 | | | $ | 193,823,950 | | | $ | 73,470,824 | | |
| Composition of Net Assets: | |
| Paid-in-capital | | $ | 107,282,061 | | | $ | 90,211,343 | | | $ | 195,124,681 | | | $ | 53,816,923 | | |
| Net unrealized appreciation (depreciation) | | | — | | | | 268,823 | | | | 7,963,613 | | | | 11,897,343 | | |
| Accumulated undistributed net investment income (net investment loss) | | | 58 | | | | 1,499,321 | | | | 10,694,720 | | | | 1,649,890 | | |
| Accumulated net realized gain (loss) | | | (2,011 | ) | | | (35,202,039 | ) | | | (19,959,064 | ) | | | 6,106,668 | | |
| Net Assets | | $ | 107,280,108 | | | $ | 56,777,448 | | | $ | 193,823,950 | | | $ | 73,470,824 | | |
| * Cost | | $ | 107,581,291 | | | $ | 54,497,173 | | | $ | 177,449,907 | | | $ | 59,339,593 | | |
| ** Affiliated Cost | | $ | — | | | $ | 1,528,271 | | | $ | 4,110,680 | | | $ | 1,993,348 | | |
| Class X Shares: | |
| Net Assets | | $ | 51,431,164 | | | $ | 12,692,678 | | | $ | 90,875,979 | | | $ | 58,998,494 | | |
| Shares Outstanding (unlimited shares authorized, $0.01 par value) | | | 51,432,028 | | | | 1,649,509 | | | | 8,161,558 | | | | 6,762,529 | | |
| Net Asset Value Per Share | | $ | 1.00 | | | $ | 7.69 | | | $ | 11.13 | | | $ | 8.72 | | |
| Class Y Shares: | |
| Net Assets | | $ | 55,848,944 | | | $ | 44,084,770 | | | $ | 102,947,971 | | | $ | 14,472,330 | | |
| Shares Outstanding (unlimited shares authorized, $0.01 par value) | | | 55,850,039 | | | | 5,747,334 | | | | 9,280,033 | | | | 1,664,584 | | |
| Net Asset Value Per Share | | $ | 1.00 | | | $ | 7.67 | | | $ | 11.09 | | | $ | 8.69 | | |
(1) Including repurchase agreements of $56,655,000
(2) Including foreign currency valued at $31,825, $20,368, and $87, respectively with a cost of $31,795, $20,349, and $87, respectively.
See Notes to Financial Statements
66
| | | European
Equity | | Multi Cap
Growth | | Aggressive
Equity | | Strategist | |
| Assets: | |
| Investments in securities, at value* | | $ | 52,136,386 | | | $ | 210,747,916 | | | $ | 26,158,638 | | | $ | 107,481,756 | | |
| Investment in affiliate, at value** | | | 718,547 | | | | 12,216,664 | | | | 1,790,916 | | | | 29,153,803 | | |
| Total investments in securities, at value | | | 52,854,933 | | | | 222,964,580 | | | | 27,949,554 | | | | 136,635,559 | | |
| Unrealized appreciation on open swap agreements | | | — | | | | — | | | | — | | | | 531,250 | | |
| Unrealized appreciation on open foreign currency exchange contracts | | | — | | | | — | | | | — | | | | 2,118 | | |
| Cash | | | 20,368 | (2) | | | — | | | | — | | | | 987 | (2) | |
| Receivable for: | |
| Investments sold | | | 12,732 | | | | — | | | | — | | | | 8,040,560 | | |
| Interest | | | — | | | | — | | | | — | | | | 334,240 | | |
| Shares of beneficial interest sold | | | 2,466 | | | | 201,436 | | | | 6,520 | | | | 942 | | |
| Dividends | | | 144,498 | | | | 120,901 | | | | 14,383 | | | | 106,446 | | |
| Foreign withholding taxes reclaimed | | | 64,894 | | | | — | | | | — | | | | 41 | | |
| Interest and dividends from affiliates | | | 69 | | | | 944 | | | | 185 | | | | 6,697 | | |
| Variation margin | | | — | | | | — | | | | — | | | | 25,446 | | |
| Premium paid on open swap agreements | | | — | | | | — | | | | — | | | | — | | |
| Prepaid expenses and other assets | | | 2,115 | | | | 9,046 | | | | 3,378 | | | | 7,924 | | |
| Total Assets | | | 53,102,075 | | | | 223,296,907 | | | | 27,974,020 | | | | 145,692,210 | | |
| Liabilities: | |
| Unrealized depreciation on open swap agreements | | | — | | | | — | | | | — | | | | 580,706 | | |
| Unrealized depreciation on open foreign currency exchange contracts | | | 147,144 | | | | — | | | | — | | | | 6,192 | | |
| Payable for: | |
| Investments purchased | | | — | | | | 156,352 | | | | 19,649 | | | | 7,737,241 | | |
| Shares of beneficial interest redeemed | | | 29,232 | | | | 14,120 | | | | 11,819 | | | | 232,415 | | |
| Investment advisory fee | | | 26,187 | | | | 81,298 | | | | 16,245 | | | | 48,980 | | |
| Variation margin | | | — | | | | — | | | | — | | | | — | | |
| Distribution fee (Class Y) | | | 2,474 | | | | 10,750 | | | | 3,443 | | | | 8,511 | | |
| Administration fee | | | 3,586 | | | | 15,485 | | | | 1,940 | | | | 9,330 | | |
| Transfer agent fee | | | 500 | | | | 584 | | | | 417 | | | | 500 | | |
| Accrued expenses and other payables | | | 43,294 | | | | 56,057 | | | | 22,129 | | | | 56,006 | | |
| Total Liabilities | | | 252,417 | | | | 334,646 | | | | 75,642 | | | | 8,679,881 | | |
| Net Assets | | $ | 52,849,658 | | | $ | 222,962,261 | | | $ | 27,898,378 | | | $ | 137,012,329 | | |
| Composition of Net Assets: | |
| Paid-in-capital | | $ | 62,200,242 | | | $ | 182,013,144 | | | $ | 21,371,337 | | | $ | 134,637,224 | | |
| Net unrealized appreciation (depreciation) | | | 3,664,714 | | | | 36,965,474 | | | | 4,363,742 | | | | (1,431,592 | ) | |
| Accumulated undistributed net investment income (net investment loss) | | | 1,565,150 | | | | (240,492 | ) | | | (33,028 | ) | | | 2,444,177 | | |
| Accumulated net realized gain (loss) | | | (14,580,448 | ) | | | 4,224,135 | | | | 2,196,327 | | | | 1,362,520 | | |
| Net Assets | | $ | 52,849,658 | | | $ | 222,962,261 | | | $ | 27,898,378 | | | $ | 137,012,329 | | |
| * Cost | | $ | 48,318,220 | | | $ | 173,780,096 | | | $ | 21,794,621 | | | $ | 107,872,867 | | |
| ** Affiliated Cost | | $ | 718,547 | | | $ | 12,216,664 | | | $ | 1,790,916 | | | $ | 30,134,556 | | |
| Class X Shares: | |
| Net Assets | | $ | 41,181,413 | | | $ | 173,283,896 | | | $ | 12,077,694 | | | $ | 97,168,826 | | |
| Shares Outstanding (unlimited shares authorized, $0.01 par value) | | | 2,902,944 | | | | 4,644,388 | | | | 672,697 | | | | 9,341,162 | | |
| Net Asset Value Per Share | | $ | 14.19 | | | $ | 37.31 | | | $ | 17.95 | | | $ | 10.40 | | |
| Class Y Shares: | |
| Net Assets | | $ | 11,668,245 | | | $ | 49,678,365 | | | $ | 15,820,684 | | | $ | 39,843,503 | | |
| Shares Outstanding (unlimited shares authorized, $0.01 par value) | | | 826,186 | | | | 1,342,682 | | | | 902,796 | | | | 3,845,400 | | |
| Net Asset Value Per Share | | $ | 14.12 | | | $ | 37.00 | | | $ | 17.52 | | | $ | 10.36 | | |
67
Morgan Stanley Variable Investment Series
Financial Statements continued
Statements of Operations
For the year ended December 31, 2011
| | | Money
Market | | Limited
Duration | | Income
Plus | | Global
Infrastructure | |
| Net Investment Income: | |
| Income | |
| Interest† | | $ | 273,988 | | | $ | 1,664,759 | | | $ | 11,345,175 | | | | — | | |
| Dividends† | | | — | | | | — | | | | 72,259 | | | $ | 2,500,836 | | |
| Interest and dividends from affiliates (Note 6) | | | — | | | | 46,457 | | | | 504,011 | | | | 1,717 | | |
| Income from securities loaned - net | | | — | | | | — | | | | — | | | | — | | |
| Total Income | | | 273,988 | | | | 1,711,216 | | | | 11,921,445 | | | | 2,502,553 | | |
| †Net of foreign withholding taxes | | | — | | | | — | | | | — | | | | 145,788 | | |
| Expenses | |
| Investment advisory fee (Note 4) | | | 525,074 | | | | 187,130 | | | | 893,580 | | | | 426,740 | | |
| Distribution fee (Class Y shares) (Note 5) | | | 154,136 | | | | 121,663 | | | | 284,274 | | | | 37,356 | | |
| Administration fee (Note 4) | | | 58,342 | | | | 49,901 | | | | 170,205 | | | | 59,893 | | |
| Professional fees | | | 61,813 | | | | 66,355 | | | | 78,761 | | | | 70,852 | | |
| Shareholder reports and notices | | | 21,489 | | | | 26,071 | | | | 39,219 | | | | 24,707 | | |
| Custodian fees | | | 22,689 | | | | 11,560 | | | | 15,261 | | | | 41,158 | | |
| Trustees' fees and expenses | | | 4,136 | | | | 2,489 | | | | 7,479 | | | | 2,901 | | |
| Transfer agent fees and expenses | | | 2,993 | | | | 2,417 | | | | 3,000 | | | | 3,000 | | |
| Other | | | 6,727 | | | | 26,801 | | | | 46,031 | | | | 15,893 | | |
| Total Expenses | | | 857,399 | | | | 494,387 | | | | 1,537,810 | | | | 682,500 | | |
| Less: amounts waived | | | (595,451 | ) | | | — | | | | — | | | | — | | |
| Less: rebate from Morgan Stanley affiliated cash sweep (Note 6) | | | — | | | | (1,009 | ) | | | (1,719 | ) | | | (1,419 | ) | |
| Net Expenses | | | 261,948 | | | | 493,378 | | | | 1,536,091 | | | | 681,081 | | |
| Net Investment Income (Loss) | | | 12,040 | | | | 1,217,838 | | | | 10,385,354 | | | | 1,821,472 | | |
| Realized and Unrealized Gain (Loss): | |
| Realized Gain (Loss) on: | |
| Investments | | | (2,034 | ) | | | 377,923 | | | | 6,231,226 | | | | 6,396,662 | | |
| Investments in affiliates (Note 6) | | | — | | | | 26,644 | | | | 449,298 | | | | — | | |
| Futures contracts | | | — | | | | 611,416 | | | | (1,409,742 | ) | | | — | | |
| Swap agreements | | | — | | | | (675,647 | ) | | | 402,198 | | | | — | | |
| Foreign currency exchange contracts | | | — | | | | — | | | | — | | | | — | | |
| Foreign currency translation | | | — | | | | — | | | | — | | | | (124,640 | ) | |
| Net Realized Gain (Loss) | | | (2,034 | ) | | | 340,336 | | | | 5,672,980 | | | | 6,272,022 | | |
| Change in Unrealized Appreciation/Depreciation on: | |
| Investments | | | — | | | | (258,359 | ) | | | (4,576,750 | ) | | | 3,168,021 | | |
| Investments in affiliates (Note 6) | | | — | | | | (41,593 | ) | | | (538,885 | ) | | | — | | |
| Futures contracts | | | — | | | | 44,090 | | | | (675,018 | ) | | | — | | |
| Swap agreements | | | — | | | | 330,785 | | | | 113,226 | | | | — | | |
| Foreign currency exchange contracts | | | — | | | | — | | | | — | | | | — | | |
| Foreign currency translation | | | — | | | | — | | | | — | | | | (4,852 | ) | |
| Net Change in Unrealized Appreciation/Depreciation | | | — | | | | 74,923 | | | | (5,677,427 | ) | | | 3,163,169 | | |
| Net Gain (Loss) | | | (2,034 | ) | | | 415,259 | | | | (4,447 | ) | | | 9,435,191 | | |
| Net Increase (Decrease) | | $ | 10,006 | | | $ | 1,633,097 | | | $ | 10,380,907 | | | $ | 11,256,663 | | |
See Notes to Financial Statements
68
| | | European
Equity | | Multi Cap
Growth | | Aggressive
Equity | | Strategist | |
| Net Investment Income: | |
| Income | |
| Interest† | | $ | 30 | | | $ | 317 | | | | — | | | $ | 1,343,351 | | |
| Dividends† | | | 2,236,914 | | | | 1,538,618 | | | $ | 184,019 | | | | 2,009,227 | | |
| Interest and dividends from affiliates (Note 6) | | | 1,321 | | | | 11,490 | | | | 1,407 | | | | 79,943 | | |
| Income from securities loaned - net | | | 96,083 | | | | — | | | | — | | | | — | | |
| Total Income | | | 2,334,348 | | | | 1,550,425 | | | | 185,426 | | | | 3,432,521 | | |
| †Net of foreign withholding taxes | | | 192,930 | | | | 65,215 | | | | 7,663 | | | | 224 | | |
| Expenses | |
| Investment advisory fee (Note 4) | | | 570,255 | | | | 1,104,601 | | | | 209,841 | | | | 683,171 | | |
| Distribution fee (Class Y shares) (Note 5) | | | 39,636 | | | | 148,411 | | | | 42,962 | | | | 120,780 | | |
| Administration fee (Note 4) | | | 52,437 | | | | 210,400 | | | | 25,056 | | | | 130,128 | | |
| Professional fees | | | 72,076 | | | | 72,004 | | | | 60,095 | | | | 77,375 | | |
| Shareholder reports and notices | | | 32,569 | | | | 36,177 | | | | 15,963 | | | | 32,029 | | |
| Custodian fees | | | 19,914 | | | | 24,572 | | | | 7,881 | | | | 20,627 | | |
| Trustees' fees and expenses | | | 2,664 | | | | 9,107 | | | | 1,440 | | | | 5,956 | | |
| Transfer agent fees and expenses | | | 3,000 | | | | 3,554 | | | | 2,501 | | | | 3,000 | | |
| Other | | | 15,494 | | | | 17,478 | | | | 9,760 | | | | 39,562 | | |
| Total Expenses | | | 808,045 | | | | 1,626,304 | | | | 375,499 | | | | 1,112,628 | | |
| Less: amounts waived | | | (112,937 | ) | | | — | | | | — | | | | — | | |
| Less: rebate from Morgan Stanley affiliated cash sweep (Note 6) | | | (1,140 | ) | | | (11,007 | ) | | | (1,351 | ) | | | (31,209 | ) | |
| Net Expenses | | | 693,968 | | | | 1,615,297 | | | | 374,148 | | | | 1,081,419 | | |
| Net Investment Income (Loss) | | | 1,640,380 | | | | (64,872 | ) | | | (188,722 | ) | | | 2,351,102 | | |
| Realized and Unrealized Gain (Loss): | |
| Realized Gain (Loss) on: | |
| Investments | | | 1,358,256 | | | | 32,692,019 | | | | 4,226,644 | | | | 3,546,862 | | |
| Investments in affiliates (Note 6) | | | — | | | | — | | | | — | | | | (1,203,292 | ) | |
| Futures contracts | | | — | | | | — | | | | — | | | | (165,494 | ) | |
| Swap agreements | | | — | | | | — | | | | — | | | | (400,820 | ) | |
| Foreign currency exchange contracts | | | 92,515 | | | | — | | | | — | | | | (8,678 | ) | |
| Foreign currency translation | | | (57,591 | ) | | | (46,468 | ) | | | (4,588 | ) | | | 1,225 | | |
| Net Realized Gain (Loss) | | | 1,393,180 | | | | 32,645,551 | | | | 4,222,056 | | | | 1,769,803 | | |
| Change in Unrealized Appreciation/Depreciation on: | |
| Investments | | | (8,661,312 | ) | | | (48,026,045 | ) | | | (6,086,325 | ) | | | (15,607,287 | ) | |
| Investments in affiliates (Note 6) | | | — | | | | — | | | | — | | | | (1,050,344 | ) | |
| Futures contracts | | | — | | | | — | | | | — | | | | (52,939 | ) | |
| Swap agreements | | | — | | | | — | | | | — | | | | 240,859 | | |
| Foreign currency exchange contracts | | | (203,880 | ) | | | — | | | | — | | | | (3,017 | ) | |
| Foreign currency translation | | | (12,777 | ) | | | (2,500 | ) | | | (294 | ) | | | (2,977 | ) | |
| Net Change in Unrealized Appreciation/Depreciation | | | (8,877,969 | ) | | | (48,028,545 | ) | | | (6,086,619 | ) | | | (16,475,705 | ) | |
| Net Gain (Loss) | | | (7,484,789 | ) | | | (15,382,994 | ) | | | (1,864,563 | ) | | | (14,705,902 | ) | |
| Net Increase (Decrease) | | $ | (5,844,409 | ) | | $ | (15,447,866 | ) | | $ | (2,053,285 | ) | | $ | (12,354,800 | ) | |
69
Morgan Stanley Variable Investment Series
Financial Statements continued
Statements of Changes in Net Assets
| | | Money Market | | Limited Duration | | Income Plus | |
| | | For The Year
Ended
December 31, 2011 | | For The Year
Ended
December 31, 2010^ | | For The Year
Ended
December 31, 2011 | | For The Year
Ended
December 31, 2010^ | | For The Year
Ended
December 31, 2011 | | For The Year
Ended
December 31, 2010^ | |
| Increase (Decrease) in Net Assets: | |
| Operations: | |
| Net investment income | | $ | 12,040 | | | $ | 8,852 | | | $ | 1,217,838 | | | $ | 1,509,025 | | | $ | 10,385,354 | | | $ | 12,408,378 | | |
| Net realized gain (loss) | | | (2,034 | ) | | | 1,958 | | | | 340,336 | | | | 940,308 | | | | 5,672,980 | | | | 11,573,449 | | |
| Net change in unrealized appreciation/depreciation | | | — | | | | — | | | | 74,923 | | | | (810,317 | ) | | | (5,677,427 | ) | | | (2,449,027 | ) | |
| Net Increase (Decrease) | | | 10,006 | | | | 10,810 | | | | 1,633,097 | | | | 1,639,016 | | | | 10,380,907 | | | | 21,532,800 | | |
| Dividends and Distributions to Shareholders from: | |
| Net investment income | |
| Class X Shares | | | (5,521 | ) | | | (7,144 | ) | | | (456,806 | ) | | | (562,429 | ) | | | (5,809,741 | ) | | | (6,824,574 | ) | |
| Class Y Shares | | | (6,188 | ) | | | (7,532 | ) | | | (1,462,462 | ) | | | (1,897,146 | ) | | | (6,427,424 | ) | | | (7,792,022 | ) | |
| Net realized gain | |
| Class X Shares | | | — | | | | — | | | | — | | | | — | | | | — | | | | — | | |
| Class Y Shares | | | — | | | | — | | | | — | | | | — | | | | — | | | | — | | |
| Total Dividends and Distributions | | | (11,709 | ) | | | (14,676 | ) | | | (1,919,268 | ) | | | (2,459,575 | ) | | | (12,237,165 | ) | | | (14,616,596 | ) | |
Net decrease from transactions in shares of
beneficial interest | | | (19,788,308 | ) | | | (38,557,210 | ) | | | (11,618,059 | ) | | | (8,139,476 | ) | | | (35,004,480 | ) | | | (38,827,172 | ) | |
| Net Decrease | | | (19,790,011 | ) | | | (38,561,076 | ) | | | (11,904,230 | ) | | | (8,960,035 | ) | | | (36,860,738 | ) | | | (31,910,968 | ) | |
| Regulatory Settlement Proceeds: | | | — | | | | — | | | | — | | | | — | | | | — | | | | — | | |
| Net Assets: | |
| Beginning of period | | | 127,070,119 | | | | 165,631,195 | | | | 68,681,678 | | | | 77,641,713 | | | | 230,684,688 | | | | 262,595,656 | | |
| End of Period | | $ | 107,280,108 | | | $ | 127,070,119 | | | $ | 56,777,448 | | | $ | 68,681,678 | | | $ | 193,823,950 | | | $ | 230,684,688 | | |
Accumulated Undistributed Net Investment
Income (Loss) | | $ | 58 | | | $ | (166 | ) | | $ | 1,499,321 | | | $ | 1,500,506 | | | $ | 10,694,720 | | | $ | 11,785,302 | | |
^ Beginning with the year ended December 31, 2011, the Fund was audited by Ernst & Young LLP. The previous year was audited by another independent registered public accounting firm.
See Notes to Financial Statements
70
| | | Global Infrastructure | | European Equity | |
| | | For The Year
Ended
December 31, 2011 | | For The Year
Ended
December 31, 2010^ | | For The Year
Ended
December 31, 2011 | | For The Year
Ended
December 31, 2010^ | |
| Increase (Decrease) in Net Assets: | |
| Operations: | |
| Net investment income | | $ | 1,821,472 | | | $ | 2,073,599 | | | $ | 1,640,380 | | | $ | 1,247,197 | | |
| Net realized gain (loss) | | | 6,272,022 | | | | 5,114,667 | | | | 1,393,180 | | | | (2,469,262 | ) | |
| Net change in unrealized appreciation/depreciation | | | 3,163,169 | | | | (2,435,382 | ) | | | (8,877,969 | ) | | | 5,518,693 | | |
| Net Increase (Decrease) | | | 11,256,663 | | | | 4,752,884 | | | | (5,844,409 | ) | | | 4,296,628 | | |
| Dividends and Distributions to Shareholders from: | |
| Net investment income | |
| Class X Shares | | | (1,548,002 | ) | | | (1,869,792 | ) | | | (1,159,573 | ) | | | (1,420,614 | ) | |
| Class Y Shares | | | (341,922 | ) | | | (440,577 | ) | | | (329,209 | ) | | | (416,655 | ) | |
| Net realized gain | |
| Class X Shares | | | (3,167,474 | ) | | | (5,105,356 | ) | | | — | | | | — | | |
| Class Y Shares | | | (781,261 | ) | | | (1,313,510 | ) | | | — | | | | — | | |
| Total Dividends and Distributions | | | (5,838,659 | ) | | | (8,729,235 | ) | | | (1,488,782 | ) | | | (1,837,269 | ) | |
Net decrease from transactions in shares of
beneficial interest | | | (9,143,834 | ) | | | (5,393,355 | ) | | | (12,462,693 | ) | | | (10,418,618 | ) | |
| Net Decrease | | | (3,725,830 | ) | | | (9,369,706 | ) | | | (19,795,884 | ) | | | (7,959,259 | ) | |
| Regulatory Settlement Proceeds: | | | — | | | | — | | | | — | | | | 84,956 | | |
| Net Assets: | |
| Beginning of period | | | 77,196,654 | | | | 86,566,360 | | | | 72,645,542 | | | | 80,519,845 | | |
| End of Period | | $ | 73,470,824 | | | $ | 77,196,654 | | | $ | 52,849,658 | | | $ | 72,645,542 | | |
Accumulated Undistributed Net Investment
Income (Loss) | | $ | 1,649,890 | | | $ | 1,836,870 | | | $ | 1,565,150 | | | $ | 1,378,682 | | |
71
Morgan Stanley Variable Investment Series
Financial Statements continued
Statements of Changes in Net Assets continued
| | | Multi Cap Growth | | Aggressive Equity | |
| | | For The Year
Ended
December 31, 2011 | | For The Year
Ended
December 31, 2010^ | | For The Year
Ended
December 31, 2011 | | For The Year
Ended
December 31, 2010^ | |
| Increase (Decrease) in Net Assets: | |
| Operations: | |
| Net investment income (loss) | | $ | (64,872 | ) | | $ | 330,653 | | | $ | (188,722 | ) | | $ | (139,804 | ) | |
| Net realized gain | | | 32,645,551 | | | | 27,894,016 | | | | 4,222,056 | | | | 3,081,471 | | |
| Net change in unrealized appreciation/depreciation | | | (48,028,545 | ) | | | 36,811,414 | | | | (6,086,619 | ) | | | 4,245,027 | | |
| Net Increase (Decrease) | | | (15,447,866 | ) | | | 65,036,083 | | | | (2,053,285 | ) | | | 7,186,694 | | |
| Dividends and Distributions to Shareholders from: | |
| Net investment income | |
| Class X Shares | | | (327,521 | ) | | | (333,905 | ) | | | — | | | | — | | |
| Class Y Shares | | | — | | | | — | | | | — | | | | — | | |
| Net realized gain | |
| Class X Shares | | | — | | | | — | | | | — | | | | — | | |
| Class Y Shares | | | — | | | | — | | | | — | | | | — | | |
| Total Dividends and Distributions | | | (327,521 | ) | | | (333,905 | ) | | | — | | | | — | | |
| Net decrease from transactions in shares of beneficial interest | | | (49,118,412 | ) | | | (43,247,359 | ) | | | (4,238,872 | ) | | | (5,434,742 | ) | |
| Net Increase (Decrease) | | | (64,893,799 | ) | | | 21,454,819 | | | | (6,292,157 | ) | | | 1,751,952 | | |
| Net Assets: | |
| Beginning of period | | | 287,856,060 | | | | 266,401,241 | | | | 34,190,535 | | | | 32,438,583 | | |
| End of Period | | $ | 222,962,261 | | | $ | 287,856,060 | | | $ | 27,898,378 | | | $ | 34,190,535 | | |
| Accumulated Undistributed Net Investment Income (Loss) | | $ | (240,492 | ) | | $ | 33,893 | | | $ | (33,028 | ) | | $ | (33,495 | ) | |
^ Beginning with the year ended December 31, 2011, the Fund was audited by Ernst & Young LLP. The previous year was audited by another independent registered public accounting firm.
See Notes to Financial Statements
72
| | | Strategist | |
| | | For The Year
Ended
December 31, 2011 | | For The Year
Ended
December 31, 2010^ | |
| Increase (Decrease) in Net Assets: | |
| Operations: | |
| Net investment income (loss) | | $ | 2,351,102 | | | $ | 3,426,081 | | |
| Net realized gain | | | 1,769,803 | | | | 17,577,561 | | |
| Net change in unrealized appreciation/depreciation | | | (16,475,705 | ) | | | (8,886,455 | ) | |
| Net Increase (Decrease) | | | (12,354,800 | ) | | | 12,117,187 | | |
| Dividends and Distributions to Shareholders from: | |
| Net investment income | |
| Class X Shares | | | (2,406,851 | ) | | | (2,078,387 | ) | |
| Class Y Shares | | | (860,346 | ) | | | (786,800 | ) | |
| Net realized gain | |
| Class X Shares | | | (12,604,023 | ) | | | (699,178 | ) | |
| Class Y Shares | | | (5,258,076 | ) | | | (311,234 | ) | |
| Total Dividends and Distributions | | | (21,129,296 | ) | | | (3,875,599 | ) | |
| Net decrease from transactions in shares of beneficial interest | | | (14,118,840 | ) | | | (21,094,433 | ) | |
| Net Increase (Decrease) | | | (47,602,936 | ) | | | (12,852,845 | ) | |
| Net Assets: | |
| Beginning of period | | | 184,615,265 | | | | 197,468,110 | | |
| End of Period | | $ | 137,012,329 | | | $ | 184,615,265 | | |
| Accumulated Undistributed Net Investment Income (Loss) | | $ | 2,444,177 | | | $ | 3,145,376 | | |
73
Morgan Stanley Variable Investment Series
Financial Statements continued
Statements of Changes in Net Assets continued
Summary of Transactions in Shares of Beneficial Interest
| | | Money Market | | Limited Duration | | Income Plus | |
| | | For The Year
Ended
December 31, 2011 | | For The Year
Ended
December 31, 2010^ | | For The Year
Ended
December 31, 2011 | | For The Year
Ended
December 31, 2010^ | | For The Year
Ended
December 31, 2011 | | For The Year
Ended
December 31, 2010^ | |
| Class X Shares | |
| Shares | |
| Sold | | | 9,528,528 | | | | 7,067,298 | | | | 37,891 | | | | 182,994 | | | | 120,523 | | | | 87,443 | | |
| Reinvestment of dividends and distributions | | | 5,521 | | | | 7,144 | | | | 59,870 | | | | 73,810 | | | | 529,120 | | | | 646,266 | | |
| Redeemed | | | (18,033,730 | ) | | | (31,627,402 | ) | | | (375,310 | ) | | | (484,177 | ) | | | (1,931,499 | ) | | | (1,707,768 | ) | |
| Net Decrease - Class X | | | (8,499,681 | ) | | | (24,552,960 | ) | | | (277,549 | ) | | | (227,373 | ) | | | (1,281,856 | ) | | | (974,059 | ) | |
| Amount | |
| Sold | | $ | 9,528,528 | | | $ | 7,067,298 | | | $ | 292,242 | | | $ | 1,424,485 | | | $ | 1,351,724 | | | $ | 974,412 | | |
| Reinvestment of dividends and distributions | | | 5,521 | | | | 7,144 | | | | 456,806 | | | | 562,429 | | | | 5,809,741 | | | | 6,824,574 | | |
| Redeemed | | | (18,033,730 | ) | | | (31,627,402 | ) | | | (2,907,547 | ) | | | (3,778,238 | ) | | | (21,828,131 | ) | | | (19,049,643 | ) | |
| Net Decrease - Class X | | $ | (8,499,681 | ) | | $ | (24,552,960 | ) | | $ | (2,158,499 | ) | | $ | (1,791,324 | ) | | $ | (14,666,666 | ) | | $ | (11,250,657 | ) | |
| Class Y Shares | |
| Shares | |
| Sold | | | 14,834,425 | | | | 12,204,944 | | | | 159,097 | | | | 459,275 | | | | 238,653 | | | | 456,727 | | |
| Reinvestment of dividends and distributions | | | 6,188 | | | | 7,532 | | | | 191,924 | | | | 249,624 | | | | 586,444 | | | | 739,983 | | |
| Redeemed | | | (26,129,240 | ) | | | (26,216,726 | ) | | | (1,571,630 | ) | | | (1,519,333 | ) | | | (2,627,052 | ) | | | (3,645,566 | ) | |
| Net Decrease - Class Y | | | (11,288,627 | ) | | | (14,004,250 | ) | | | (1,220,609 | ) | | | (810,434 | ) | | | (1,801,955 | ) | | | (2,448,856 | ) | |
| Amount | |
| Sold | | $ | 14,834,425 | | | $ | 12,204,944 | | | $ | 1,222,848 | | | $ | 3,550,343 | | | $ | 2,668,015 | | | $ | 5,104,104 | | |
| Reinvestment of dividends and distributions | | | 6,188 | | | | 7,532 | | | | 1,462,462 | | | | 1,897,146 | | | | 6,427,424 | | | | 7,792,022 | | |
| Redeemed | | | (26,129,240 | ) | | | (26,216,726 | ) | | | (12,144,870 | ) | | | (11,795,641 | ) | | | (29,433,253 | ) | | | (40,472,641 | ) | |
| Net Decrease - Class Y | | $ | (11,288,627 | ) | | $ | (14,004,250 | ) | | $ | (9,459,560 | ) | | $ | (6,348,152 | ) | | $ | (20,337,814 | ) | | $ | (27,576,515 | ) | |
| Regulatory Settlement Proceeds: | | | — | | | | — | | | | — | | | | — | | | | — | | | | — | | |
^ Beginning with the year ended December 31, 2011, the Fund was audited by Ernst & Young LLP. The previous year was audited by another independent registered public accounting firm.
See Notes to Financial Statements
74
| | | Global Infrastructure | | European Equity | |
| | | For The Year
Ended
December 31, 2011 | | For The Year
Ended
December 31, 2010^ | | For The Year
Ended
December 31, 2011 | | For The Year
Ended
December 31, 2010^ | |
| Class X Shares | |
| Shares | |
| Sold | | | 41,008 | | | | 46,011 | | | | 10,124 | | | | 7,727 | | |
| Reinvestment of dividends and distributions | | | 560,033 | | | | 1,047,320 | | | | 68,170 | | | | 111,246 | | |
| Redeemed | | | (1,394,386 | ) | | | (1,462,098 | ) | | | (590,445 | ) | | | (672,452 | ) | |
| Net Decrease - Class X | | | (793,345 | ) | | | (368,767 | ) | | | (512,151 | ) | | | (553,479 | ) | |
| Amount | |
| Sold | | $ | 350,997 | | | $ | 379,861 | | | $ | 152,977 | | | $ | 111,210 | | |
| Reinvestment of dividends and distributions | | | 4,715,476 | | | | 6,975,148 | | | | 1,159,573 | | | | 1,420,614 | | |
| Redeemed | | | (11,775,763 | ) | | | (11,546,584 | ) | | | (9,410,517 | ) | | | (9,737,700 | ) | |
| Net Decrease - Class X | | $ | (6,709,290 | ) | | $ | (4,191,575 | ) | | $ | (8,097,967 | ) | | $ | (8,205,876 | ) | |
| Class Y Shares | |
| Shares | |
| Sold | | | 37,827 | | | | 41,158 | | | | 4,450 | | | | 19,373 | | |
| Reinvestment of dividends and distributions | | | 133,712 | | | | 263,773 | | | | 19,411 | | | | 32,730 | | |
| Redeemed | | | (456,268 | ) | | | (416,792 | ) | | | (312,722 | ) | | | (195,961 | ) | |
| Net Decrease - Class Y | | | (284,729 | ) | | | (111,861 | ) | | | (288,861 | ) | | | (143,858 | ) | |
| Amount | |
| Sold | | $ | 315,142 | | | $ | 325,071 | | | $ | 67,572 | | | $ | 273,981 | | |
| Reinvestment of dividends and distributions | | | 1,123,183 | | | | 1,754,087 | | | | 329,209 | | | | 416,655 | | |
| Redeemed | | | (3,872,869 | ) | | | (3,280,938 | ) | | | (4,761,507 | ) | | | (2,903,378 | ) | |
| Net Decrease - Class Y | | $ | (2,434,544 | ) | | $ | (1,201,780 | ) | | $ | (4,364,726 | ) | | $ | (2,212,742 | ) | |
| Regulatory Settlement Proceeds: | | | — | | | | — | | | | — | | | $ | 84,956 | | |
75
Morgan Stanley Variable Investment Series
Financial Statements continued
Statements of Changes in Net Assets continued
Summary of Transactions in Shares of Beneficial Interest
| | | Multi Cap Growth | | Aggressive Equity | |
| | | For The Year
Ended
December 31, 2011 | | For The Year
Ended
December 31, 2010^ | | For The Year
Ended
December 31, 2011 | | For The Year
Ended
December 31, 2010^ | |
| Class X Shares | |
| Shares | |
| Sold | | | 23,630 | | | | 19,352 | | | | 22,589 | | | | 21,087 | | |
| Reinvestment of dividends and distributions | | | 7,793 | | | | 10,719 | | | | — | | | | — | | |
| Redeemed | | | (891,278 | ) | | | (964,108 | ) | | | (145,437 | ) | | | (194,973 | ) | |
| Net Decrease - Class X | | | (859,855 | ) | | | (934,037 | ) | | | (122,848 | ) | | | (173,886 | ) | |
| Amount | |
| Sold | | $ | 952,101 | | | $ | 644,195 | | | $ | 434,357 | | | $ | 338,664 | | |
| Reinvestment of dividends and distributions | | | 327,521 | | | | 333,905 | | | | — | | | | — | | |
| Redeemed | | | (36,256,926 | ) | | | (32,044,596 | ) | | | (2,852,868 | ) | | | (3,118,178 | ) | |
| Net Decrease - Class X | | $ | (34,977,304 | ) | | $ | (31,066,496 | ) | | $ | (2,418,511 | ) | | $ | (2,779,514 | ) | |
| Class Y Shares | |
| Shares | |
| Sold | | | 44,490 | | | | 22,133 | | | | 154,196 | | | | 50,042 | | |
| Reinvestment of dividends and distributions | | | — | | | | — | | | | — | | | | — | | |
| Redeemed | | | (394,005 | ) | | | (384,584 | ) | | | (241,830 | ) | | | (223,151 | ) | |
| Net Decrease - Class Y | | | (349,515 | ) | | | (362,451 | ) | | | (87,634 | ) | | | (173,109 | ) | |
| Amount | |
| Sold | | $ | 1,698,262 | | | $ | 704,927 | | | $ | 2,809,245 | | | $ | 800,661 | | |
| Reinvestment of dividends and distributions | | | — | | | | — | | | | — | | | | — | | |
| Redeemed | | | (15,839,370 | ) | | | (12,885,790 | ) | | | (4,629,606 | ) | | | (3,455,889 | ) | |
| Net Decrease - Class Y | | $ | (14,141,108 | ) | | $ | (12,180,863 | ) | | $ | (1,820,361 | ) | | $ | (2,655,228 | ) | |
^ Beginning with the year ended December 31, 2011, the Fund was audited by Ernst & Young LLP. The previous year was audited by another independent registered public accounting firm.
See Notes to Financial Statements
76
| | | Strategist | |
| | | For The Year
Ended
December 31, 2011 | | For The Year
Ended
December 31, 2010^ | |
| Class X Shares | |
| Shares | |
| Sold | | | 33,714 | | | | 54,599 | | |
| Reinvestment of dividends and distributions | | | 1,314,437 | | | | 229,551 | | |
| Redeemed | | | (1,905,781 | ) | | | (1,492,547 | ) | |
| Net Decrease - Class X | | | (557,630 | ) | | | (1,208,397 | ) | |
| Amount | |
| Sold | | $ | 381,164 | | | $ | 677,302 | | |
| Reinvestment of dividends and distributions | | | 15,010,874 | | | | 2,777,565 | | |
| Redeemed | | | (22,742,640 | ) | | | (18,715,821 | ) | |
| Net Decrease - Class X | | $ | (7,350,602 | ) | | $ | (15,260,954 | ) | |
| Class Y Shares | |
| Shares | |
| Sold | | | 11,243 | | | | 106,023 | | |
| Reinvestment of dividends and distributions | | | 537,175 | | | | 90,972 | | |
| Redeemed | | | (1,070,631 | ) | | | (665,609 | ) | |
| Net Decrease - Class Y | | | (522,213 | ) | | | (468,614 | ) | |
| Amount | |
| Sold | | $ | 130,345 | | | $ | 1,342,545 | | |
| Reinvestment of dividends and distributions | | | 6,118,422 | | | | 1,098,034 | | |
| Redeemed | | | (13,017,005 | ) | | | (8,274,058 | ) | |
| Net Decrease - Class Y | | $ | (6,768,238 | ) | | $ | (5,833,479 | ) | |
77
Morgan Stanley Variable Investment Series
Notes to Financial Statements n December 31, 2011
1. Organization and Accounting Policies
Morgan Stanley Variable Investment Series (the "Fund") is registered under the Investment Company Act of 1940, as amended (the "Act"), as a diversified, open-end management investment company. The Fund is offered exclusively to life insurance companies in connection with particular life insurance and/or annuity contracts they offer.
The Fund, organized on February 25, 1983 as a Massachusetts business trust, consists of eight Portfolios ("Portfolios") which commenced operations as follows:
| PORTFOLIO | | COMMENCEMENT OF
OPERATIONS | | PORTFOLIO | | COMMENCEMENT OF
OPERATIONS | |
| Money Market | | March 9, 1984 | | European Equity | | March 1, 1991 | |
|
| Limited Duration | | May 4, 1999 | | Multi Cap Growth | | March 9, 1984 | |
|
| Income Plus | | March 1, 1987 | | Aggressive Equity | | May 4, 1999 | |
|
| Global Infrastructure | | March 1, 1990 | | Strategist | | March 1, 1987 | |
|
On June 5, 2000, the Fund commenced offering one additional class of shares (Class Y shares). The two classes are identical except that Class Y shares incur distribution expenses. Class X shares are generally available to holders of contracts offered before May 1, 2000. Class Y shares are available to holders of contracts offered on or after June 5, 2000.
The investment objectives of each Portfolio are as follows:
| Money Market | | Seeks high current income, preservation of capital and liquidity. | |
|
| Limited Duration | | Seeks to provide a high level of current income, consistent with the preservation of capital. | |
|
| Income Plus | | Seeks, as its primary objective, to provide a high level of current income and, as a secondary objective, capital appreciation, but only when consistent with its primary objective. | |
|
| Global Infrastructure | | Seeks both capital appreciation and current income. | |
|
| European Equity | | Seeks to maximize the capital appreciation of its investments. | |
|
Multi Cap Growth*
(Formerly Capital
Opportunities) | | Seeks, as its primary objective, growth of capital and, as a secondary objective, income, but
only when consistent with its primary objective. | |
|
| Aggressive Equity | | Seeks long-term capital growth. | |
|
| Strategist | | Seeks high total investment return. | |
|
* Name change effective April 29, 2011.
78
Morgan Stanley Variable Investment Series
Notes to Financial Statements n December 31, 2011 continued
The following is a summary of significant policies:
A. Valuation of Investments — Money Market: Portfolio securities are valued at amortized cost, which approximates fair value, in accordance with Rule 2a-7 under the Act. All remaining Portfolios: (1) an equity portfolio security listed or traded on the New York Stock Exchange ("NYSE") or American Stock Exchange or other domestic exchange is valued at its latest sale price prior to the time when assets are valued; if there were no sales that day, the security is valued at the mean between the last reported bid and ask price; (2) an equity portfolio security listed or traded on the Nasdaq is valued at the Nasdaq Official Closing Price; if there were no sales that day, the security is valued at the mean between the last reported bid and ask price; (3) all other domestic securities for which over-the-counter market quotations are readily available are valued at the mean between the last reported bid and ask price. In cases where a security is traded on more than one domestic exchange, the security is valued on the exchange designated as the primary market; (4) swaps are marked-to-market daily based upon quotations from market makers; (5) for equity securities traded on foreign exchanges, the last reported sale price or the latest bid price may be used if there were no sales on a particular day; (6) futures are valued at the latest price published by the commodities exchange on which they trade; (7) when market quotations are not readily available, including circumstances under which Morgan Stanley Investment Management Inc. (the "Adviser") or Morgan Stanley Investment Management Limited or Morgan Stanley Investment Management Company (each, a "Sub-Adviser"), each a wholly owned subsidiary of Morgan Stanley, determines that the latest sale price, the bid price or the mean between the last reported bid and ask price do not reflect a security's fair value, portfolio securities are valued at their fair value as determined in good faith under procedures established by and under the general supervision of the Fund's Trustees. Occasionally, developments affecting the closing prices of securities and other assets may occur between the times at which valuations of such securities are determined (that is, close of the foreign market on which the securities trade) and the close of business on the NYSE. If developments occur during such periods that are expected to materially affect the value of such securities, such valuations may be adjusted to reflect the estimated fair value of such securities as of the close of the NYSE, as determined in good faith by the Fund's Trustees or by the Adviser using a pricing service and/or procedures approved by the Trustees of the Fund; (8) certain portfolio securities may be valued by an outside pricing service approved by the Fund's Trustees. The prices provided by a pricing service take into account broker-dealer market price quotations for trading in similar groups of securities, security quality, maturity, coupon and other security characteristics as well as any developments related to the specific securities; (9) investments in mutual funds, including the Morgan Stanley Institutional Liquidity Funds, are valued at the net asset value as of the close of each business day; and (10) short-term debt securities having a maturity date of more than sixty days at time of purchase are valued on a mark-to-market basis until sixty days prior to maturity and thereafter at amortized cost based on their value on the 61st day. Short-term debt securities having a maturity date of sixty days or less at the time of purchase are valued at amortized cost, which approximates fair value.
79
Morgan Stanley Variable Investment Series
Notes to Financial Statements n December 31, 2011 continued
B. Accounting for Investments — Security transactions are accounted for on the trade date (date the order to buy or sell is executed). Realized gains and losses on security transactions are determined by the identified cost method. Dividend income and other distributions are recorded on the ex-dividend date except for certain dividends on foreign securities which are recorded as soon as the Fund is informed after the ex-dividend date. Interest income is accrued daily as earned except where collection is not expected. Discounts are accreted and premiums are amortized over the life of the respective securities and are included in interest income.
C. Repurchase Agreements — The Fund invests directly with institutions in repurchase agreements. The Fund's custodian receives the collateral, which is marked-to-market daily to determine that the value of the collateral does not decrease below the repurchase price plus accrued interest as earned. If such a decrease occurs, additional collateral will be requested and, when received, will be added to the account to maintain full collateralization.
D. Multiple Class Allocations — Investment income, expenses (other than distribution fees), and realized and unrealized gains and losses are allocated to each class of shares based upon the relative net asset value on the date such items are recognized. Distribution fees are charged directly to the respective class.
E. Foreign Currency Translation — The books and records of the Fund are maintained in U.S. dollars as follows: (1) the foreign currency market value of investment securities, other assets and liabilities and foreign currency exchange contracts are translated at the exchange rates prevailing at the end of the period; and (2) purchases, sales, income and expenses are translated at the exchange rates prevailing on the respective dates of such transactions. The resultant exchange gains and losses are recorded as realized and unrealized gains/losses on foreign currency exchange contracts and foreign currency translations. Pursuant to U.S. federal income tax regulations, certain foreign exchange gains/losses included in realized and unrealized gains/losses are included in or are a reduction of ordinary income for federal income tax purposes. The Fund does not isolate that portion of the results of operations arising as a result of changes in the foreign exchange rates from the changes in the market prices of the securities held.
F. Structured Investments — Certain Portfolios also may invest a portion of its assets in structured investments. A structured investment is a derivative security designed to offer a return linked to a particular underlying security, currency or market. Structured investments may come in various forms including notes, warrants and options to purchase securities. The Portfolio will typically use structured investments to gain exposure to a permitted underlying security, currency or market when direct access to a market is limited or inefficient from a tax or cost standpoint.
80
Morgan Stanley Variable Investment Series
Notes to Financial Statements n December 31, 2011 continued
G. Dividends and Distributions to Shareholders — The Fund records dividends and distributions to its shareholders on the ex-dividend date.
H. Expenses — Direct expenses are charged to the respective Portfolio and general Fund expenses are allocated on the basis of relative net assets or equally among the Portfolios.
I. Use of Estimates — The preparation of financial statements in accordance with generally accepted accounting principles in the United States ("GAAP") requires management to make estimates and assumptions that affect the reported amounts and disclosures. Actual results could differ from those estimates.
J. Indemnifications — The Fund enters into contracts that contain a variety of indemnifications. The Fund's maximum exposure under these arrangements is unknown. However, the Fund has not had prior claims or losses pursuant to these contracts and expects the risk of loss to be remote.
2. Fair Valuation Measurements
Financial Accounting Standards Board ("FASB") Accounting Standards Codification ("ASC") 820, Fair Value Measurements and Disclosures ("ASC 820"), defines fair value as the value that the Fund would receive to sell an investment or pay to transfer a liability in a timely transaction with an independent buyer in the principal market, or in the absence of a principal market the most advantageous market for the investment or liability. ASC 820 establishes a three-tier hierarchy to distinguish between (1) inputs that reflect the assumptions market participants would use in valuing an asset or liability developed based on market data obtained from sources independent of the reporting entity (observable inputs); and (2) inputs that reflect the reporting entity's own assumptions about the assumptions market participants would use in valuing an asset or liability developed based on the best information available in the circumstances (unobservable inputs) and to establish classification of fair value measurements for disclosure purposes. Various inputs are used in determining the value of the Fund's investments. The inputs are summarized in the three broad levels listed below.
• Level 1 — unadjusted quoted prices in active markets for identical investments
• Level 2 — other significant observable inputs (including quoted prices for similar investments, interest rates, prepayment speeds, credit risk, etc.)
81
Morgan Stanley Variable Investment Series
Notes to Financial Statements n December 31, 2011 continued
• Level 3 — significant unobservable inputs including the Fund's own assumptions in determining the fair value of investments. Factors considered in making this determination may include, but are not limited to, information obtained by contacting the issuer, analysts, or the appropriate stock exchange (for exchange-traded securities), analysis of the issuer's financial statements or other available documents and, if necessary, available information concerning other securities in similar circumstances
The inputs or methodology used for valuing securities are not necessarily an indication of the risk associated with investing in those securities and the determination of the significance of a particular input to the fair value measurement in its entirety requires judgment and considers factors specific to each security.
The following is a summary of the inputs used to value the Fund's investments as of December 31, 2011.
| Investment Type | | Level 1
Unadjusted
Quoted
Prices | | Level 2
Other
Significant
Observable
Inputs | | Level 3
Significant
Unobservable
Inputs | | Total | |
| Money Market | |
| Assets: | |
| Repurchase Agreements | | | — | | | $ | 56,655,000 | | | | — | | | $ | 56,655,000 | | |
| Commercial Paper | | | — | | | | 27,926,271 | | | | — | | | | 27,926,271 | | |
| Certificates of Deposit | | | — | | | | 10,000,020 | | | | — | | | | 10,000,020 | | |
| Floating Rate Notes | | | — | | | | 10,000,000 | | | | — | | | | 10,000,000 | | |
| Weekly Variable Rate Bonds | | | — | | | | 3,000,000 | | | | — | | | | 3,000,000 | | |
| Total Assets | | | — | | | $ | 107,581,291 | | | | — | | | $ | 107,581,291 | | |
| Limited Duration | |
| Assets: | |
| Fixed Income Securities | |
| Corporate Bonds | | | — | | | $ | 32,687,869 | | | | — | | | $ | 32,687,869 | | |
| Asset-Backed Securities | | | — | | | | 12,649,096 | | | | — | | | | 12,649,096 | | |
| U.S. Treasury Securities | | | — | | | | 4,803,818 | | | | — | | | | 4,803,818 | | |
| Non-U.S. Government — Guaranteed | | | — | | | | 3,312,583 | | | | — | | | | 3,312,583 | | |
| Sovereign | | | — | | | | 591,810 | | | | — | | | | 591,810 | | |
| Agency Fixed Rate Mortgages | | | — | | | | 465,978 | | | | — | | | | 465,978 | | |
| Agency Adjustable Rate Mortgages | | | — | | | | 380,344 | | | | — | | | | 380,344 | | |
Collateralized Mortgage Obligation — Agency
Collateral Series | | | — | | | | 356,141 | | | | — | | | | 356,141 | | |
| Municipal Bond | | | — | | | | 300,066 | | | | — | | | | 300,066 | | |
| Commercial Mortgage Backed Security | | | — | | | | 204,468 | | | | — | | | | 204,468 | | |
| Total Fixed Income Securities | | | — | | | | 55,752,173 | | | | — | | | | 55,752,173 | | |
82
Morgan Stanley Variable Investment Series
Notes to Financial Statements n December 31, 2011 continued
| Investment Type | | Level 1
Unadjusted
Quoted
Prices | | Level 2
Other
Significant
Observable
Inputs | | Level 3
Significant
Unobservable
Inputs | | Total | |
| Short-Term Investments | |
| U.S. Treasury Security | | | — | | | $ | 674,978 | | | | — | | | $ | 674,978 | | |
| Investment Company | | $ | 110,511 | | | | — | | | | — | | | | 110,511 | | |
| Total Short-Term Investments | | | 110,511 | | | | 674,978 | | | | — | | | | 785,489 | | |
| Futures Contracts | | | 29,731 | | | | — | | | | — | | | | 29,731 | | |
| Zero Coupon Swap Agreements | | | — | | | | 369,297 | | | | — | | | | 369,297 | | |
| Total Assets | | | 140,242 | | | | 56,796,448 | | | | — | | | | 56,936,690 | | |
| Liabilities: | |
| Futures Contracts | | | (2,133 | ) | | | — | | | | — | | | | (2,133 | ) | |
| Zero Coupon Swap Agreements | | | — | | | | (640,290 | ) | | | — | | | | (640,290 | ) | |
| Total Liabilities | | | (2,133 | ) | | | (640,290 | ) | | | — | | | | (642,423 | ) | |
| Total | | $ | 138,109 | | | $ | 56,156,158 | | | | — | | | $ | 56,294,267 | | |
| Income Plus | |
| Assets: | |
| Fixed Income Securities | |
| Corporate Bonds | | | — | | | $ | 183,503,029 | | | | — | | | $ | 183,503,029 | | |
| Asset-Backed Securities | | | — | | | | 3,525,560 | | | | — | | | | 3,525,560 | | |
| Municipal Bond | | | — | | | | 676,788 | | | | — | | | | 676,788 | | |
| Sovereign | | | — | | | | 391,044 | | | | — | | | | 391,044 | | |
| Agency Fixed Rate Mortgage | | | — | | | | 1,588 | | | | — | | | | 1,588 | | |
| Total Fixed Income Securities | | | — | | | | 188,098,009 | | | | — | | | | 188,098,009 | | |
| Convertible Preferred Stocks | | $ | 523,134 | | | | — | | | | — | | | | 523,134 | | |
| Preferred Stock | | | 439,501 | | | | — | | | | — | | | | 439,501 | | |
| Short-Term Investments | |
| U.S. Treasury Security | | | — | | | | 474,984 | | | | — | | | | 474,984 | | |
| Investment Company | | | 208,270 | | | | — | | | | — | | | | 208,270 | | |
| Total Short-Term Investments | | | 208,270 | | | | 474,984 | | | | — | | | | 683,254 | | |
| Futures Contracts | | | 125,085 | | | | — | | | | — | | | | 125,085 | | |
| Total Assets | | | 1,295,990 | | | | 188,572,993 | | | | — | | | | 189,868,983 | | |
| Liabilities: | |
| Futures Contracts | | | (333,883 | ) | | | — | | | | — | | | | (333,883 | ) | |
| Credit Default Swap Agreement | | | — | | | | (10,900 | ) | | | — | | | | (10,900 | ) | |
| Total Liabilities | | | (333,883 | ) | | | (10,900 | ) | | | — | | | | (344,783 | ) | |
| Total | | $ | 962,107 | | | $ | 188,562,093 | | | | — | | | $ | 189,524,200 | | |
83
Morgan Stanley Variable Investment Series
Notes to Financial Statements n December 31, 2011 continued
| Investment Type | | Level 1
Unadjusted
Quoted
Prices | | Level 2
Other
Significant
Observable
Inputs | | Level 3
Significant
Unobservable
Inputs | | Total | |
| Global Infrastructure | |
| Assets: | |
| Common Stocks | |
| Airports | | $ | 1,592,454 | | | | — | | | | — | | | $ | 1,592,454 | | |
| Communications | | | 10,392,291 | | | | — | | | | — | | | | 10,392,291 | | |
| Diversified | | | 2,935,063 | | | | — | | | | — | | | | 2,935,063 | | |
| Oil & Gas Storage & Transportation | | | 35,698,761 | | | | — | | | | — | | | | 35,698,761 | | |
| Ports | | | 876,965 | | | | — | | | | — | | | | 876,965 | | |
| Toll Roads | | | 4,920,150 | | | | — | | | | — | | | | 4,920,150 | | |
| Transmission & Distribution | | | 11,850,628 | | | | — | | | | — | | | | 11,850,628 | | |
| Water | | | 2,971,716 | | | | — | | | | — | | | | 2,971,716 | | |
| Total Common Stocks | | | 71,238,028 | | | | — | | | | — | | | | 71,238,028 | | |
| Short-Term Investment — Investment Company | | | 1,993,348 | | | | — | | | | — | | | | 1,993,348 | | |
| Total Assets | | $ | 73,231,376 | | | | — | | | | — | | | $ | 73,231,376 | | |
| European Equity | |
| Assets: | |
| Common Stocks | |
| Aerospace & Defense | | $ | 1,299,116 | | | | — | | | | — | | | $ | 1,299,116 | | |
| Automobiles | | | 1,095,461 | | | | — | | | | — | | | | 1,095,461 | | |
| Chemicals | | | 812,292 | | | | — | | | | — | | | | 812,292 | | |
| Commercial Banks | | | 5,674,026 | | | | — | | | | — | | | | 5,674,026 | | |
| Electrical Equipment | | | 928,748 | | | | — | | | | — | | | | 928,748 | | |
| Food & Staples Retailing | | | 1,548,514 | | | | — | | | | — | | | | 1,548,514 | | |
| Food Products | | | 2,696,435 | | | | — | | | | — | | | | 2,696,435 | | |
| Health Care Providers & Services | | | 1,086,936 | | | | — | | | | — | | | | 1,086,936 | | |
| Hotels, Restaurants & Leisure | | | 584,218 | | | | — | | | | — | | | | 584,218 | | |
| Household Products | | | 1,170,088 | | | | — | | | | — | | | | 1,170,088 | | |
| Industrial Conglomerates | | | 1,716,132 | | | | — | | | | — | | | | 1,716,132 | | |
| Information Technology Services | | | 830,120 | | | | — | | | | — | | | | 830,120 | | |
| Insurance | | | 3,058,343 | | | | — | | | | — | | | | 3,058,343 | | |
| Machinery | | | 1,589,169 | | | | — | | | | — | | | | 1,589,169 | | |
| Media | | | 1,724,329 | | | | — | | | | — | | | | 1,724,329 | | |
| Metals & Mining | | | 3,316,096 | | | | — | | | | — | | | | 3,316,096 | | |
| Multi-Utilities | | | 905,075 | | | | — | | | | — | | | | 905,075 | | |
| Oil, Gas & Consumable Fuels | | | 7,777,830 | | | | — | | | | — | | | | 7,777,830 | | |
| Pharmaceuticals | | | 6,825,856 | | | | — | | | | — | | | | 6,825,856 | | |
| Professional Services | | | 1,249,520 | | | | — | | | | — | | | | 1,249,520 | | |
84
Morgan Stanley Variable Investment Series
Notes to Financial Statements n December 31, 2011 continued
| Investment Type | | Level 1
Unadjusted
Quoted
Prices | | Level 2
Other
Significant
Observable
Inputs | | Level 3
Significant
Unobservable
Inputs | | Total | |
| Specialty Retail | | $ | 784,800 | | | | — | | | | — | | | $ | 784,800 | | |
| Tobacco | | | 3,293,211 | | | | — | | | | — | | | | 3,293,211 | | |
| Wireless Telecommunication Services | | | 2,170,071 | | | | — | | | | — | | | | 2,170,071 | | |
| Total Common Stocks | | | 52,136,386 | | | | — | | | | — | | | | 52,136,386 | | |
| Short-Term Investment — Investment Company | | | 718,547 | | | | — | | | | — | | | | 718,547 | | |
| Total Assets | | | 52,854,933 | | | | — | | | | — | | | | 52,854,933 | | |
| Liabilities: | |
| Foreign Currency Exchange Contracts | | | — | | | $ | (147,144 | ) | | | — | | | | (147,144 | ) | |
| Total | | $ | 52,854,933 | | | $ | (147,144 | ) | | | — | | | $ | 52,707,789 | | |
| Multi Cap Growth | |
| Assets: | |
| Common Stocks | |
| Air Transport | | $ | 4,271,063 | | | | — | | | | — | | | $ | 4,271,063 | | |
| Alternative Energy | | | 9,879,041 | | | | — | | | | — | | | | 9,879,041 | | |
| Asset Management & Custodian | | | 3,509,123 | | | | — | | | | — | | | | 3,509,123 | | |
| Biotechnology | | | 3,749,833 | | | | — | | | | — | | | | 3,749,833 | | |
| Chemicals: Diversified | | | 6,457,231 | | | | — | | | | — | | | | 6,457,231 | | |
| Commercial Finance & Mortgage Companies | | | 3,724,068 | | | | — | | | | — | | | | 3,724,068 | | |
| Commercial Services | | | 11,573,237 | | | | — | | | | — | | | | 11,573,237 | | |
| Communications Technology | | | 9,320,492 | | | | — | | | | — | | | | 9,320,492 | | |
| Computer Services, Software & Systems | | | 32,612,966 | | | | — | | | $ | 8,853,246 | | | | 41,466,212 | | |
| Computer Technology | | | 24,853,859 | | | | — | | | | — | | | | 24,853,859 | | |
| Diversified Retail | | | 30,906,657 | | | | — | | | | — | | | | 30,906,657 | | |
| Financial Data & Systems | | | 11,724,869 | | | | — | | | | — | | | | 11,724,869 | | |
| Health Care Services | | | 6,724,135 | | | | — | | | | — | | | | 6,724,135 | | |
| Medical Equipment | | | 8,301,769 | | | | — | | | | — | | | | 8,301,769 | | |
| Metals & Minerals: Diversified | | | 5,476,794 | | | | — | | | | — | | | | 5,476,794 | | |
| Pharmaceuticals | | | 6,586,258 | | | | — | | | | — | | | | 6,586,258 | | |
| Real Estate Investment Trusts (REIT) | | | 7,550,597 | | | | — | | | | — | | | | 7,550,597 | | |
| Recreational Vehicles & Boats | | | 7,385,264 | | | | — | | | | — | | | | 7,385,264 | | |
| Wholesale & International Trade | | | 4,251,085 | | | | — | | | | — | | | | 4,251,085 | | |
| Total Common Stocks | | | 198,858,341 | | | | — | | | | 8,853,246 | | | | 207,711,587 | | |
| Convertible Preferred Stocks | | | — | | | | — | | | | 3,036,329 | | | | 3,036,329 | | |
| Short-Term Investment — Investment Company | | | 12,216,664 | | | | — | | | | — | | | | 12,216,664 | | |
| Total Assets | | $ | 211,075,005 | | | | — | | | $ | 11,889,575 | | | $ | 222,964,580 | | |
85
Morgan Stanley Variable Investment Series
Notes to Financial Statements n December 31, 2011 continued
| Investment Type | | Level 1
Unadjusted
Quoted
Prices | | Level 2
Other
Significant
Observable
Inputs | | Level 3
Significant
Unobservable
Inputs | | Total | |
| Aggressive Equity | |
| Assets: | |
| Common Stocks | |
| Air Transport | | $ | 529,039 | | | | — | | | | — | | | $ | 529,039 | | |
| Alternative Energy | | | 1,157,836 | | | | — | | | | — | | | | 1,157,836 | | |
| Asset Management & Custodian | | | 411,272 | | | | — | | | | — | | | | 411,272 | | |
| Biotechnology | | | 439,491 | | | | — | | | | — | | | | 439,491 | | |
| Chemicals: Diversified | | | 855,975 | | | | — | | | | — | | | | 855,975 | | |
| Commercial Finance & Mortgage Companies | | | 490,097 | | | | — | | | | — | | | | 490,097 | | |
| Commercial Services | | | 1,410,951 | | | | — | | | | — | | | | 1,410,951 | | |
| Communications Technology | | | 1,108,368 | | | | — | | | | — | | | | 1,108,368 | | |
| Computer Services, Software & Systems | | | 4,130,948 | | | | — | | | $ | 1,058,994 | | | | 5,189,942 | | |
| Computer Technology | | | 3,069,868 | | | | — | | | | — | | | | 3,069,868 | | |
| Diversified Retail | | | 3,876,378 | | | | — | | | | — | | | | 3,876,378 | | |
| Financial Data & Systems | | | 1,516,190 | | | | — | | | | — | | | | 1,516,190 | | |
| Health Care Services | | | 796,383 | | | | — | | | | — | | | | 796,383 | | |
| Medical Equipment | | | 1,036,679 | | | | — | | | | — | | | | 1,036,679 | | |
| Metals & Minerals: Diversified | | | 641,896 | | | | — | | | | — | | | | 641,896 | | |
| Pharmaceuticals | | | 806,822 | | | | — | | | | — | | | | 806,822 | | |
| Real Estate Investment Trusts (REIT) | | | 994,831 | | | | — | | | | — | | | | 994,831 | | |
| Recreational Vehicles & Boats | | | 901,609 | | | | — | | | | — | | | | 901,609 | | |
| Wholesale & International Trade | | | 559,158 | | | | — | | | | — | | | | 559,158 | | |
| Total Common Stocks | | | 24,733,791 | | | | — | | | | 1,058,994 | | | | 25,792,785 | | |
| Convertible Preferred Stocks | | | — | | | | — | | | | 365,853 | | | | 365,853 | | |
| Short-Term Investment — Investment Company | | | 1,790,916 | | | | — | | | | — | | | | 1,790,916 | | |
| Total Assets | | $ | 26,524,707 | | | | — | | | $ | 1,424,847 | | | $ | 27,949,554 | | |
| Strategist | |
| Assets: | |
| Common Stocks | |
| Aerospace & Defense | | $ | 1,504,618 | | | | — | | | | — | | | $ | 1,504,618 | | |
| Auto Components | | | 1,412,327 | | | | — | | | | — | | | | 1,412,327 | | |
| Biotechnology | | | 1,019,547 | | | | — | | | | — | | | | 1,019,547 | | |
| Chemicals | | | 1,358,293 | | | | — | | | | — | | | | 1,358,293 | | |
| Commercial Banks | | | 2,756,000 | | | | — | | | | — | | | | 2,756,000 | | |
| Computers & Peripherals | | | 9,982,930 | | | | — | | | | — | | | | 9,982,930 | | |
| Diversified Financial Services | | | 3,559,496 | | | | — | | | | — | | | | 3,559,496 | | |
| Diversified Telecommunication Services | | | 5,631,162 | | | | — | | | | — | | | | 5,631,162 | | |
86
Morgan Stanley Variable Investment Series
Notes to Financial Statements n December 31, 2011 continued
| Investment Type | | Level 1
Unadjusted
Quoted
Prices | | Level 2
Other
Significant
Observable
Inputs | | Level 3
Significant
Unobservable
Inputs | | Total | |
| Food & Staples Retailing | | $ | 1,495,944 | | | | — | | | | — | | | $ | 1,495,944 | | |
| Food Products | | | 1,496,880 | | | | — | | | | — | | | | 1,496,880 | | |
| Hotels, Restaurants & Leisure | | | 4,389,837 | | | | — | | | | — | | | | 4,389,837 | | |
| Industrial Conglomerates | | | 2,988,015 | | | | — | | | | — | | | | 2,988,015 | | |
| Insurance | | | 3,118,361 | | | | — | | | | — | | | | 3,118,361 | | |
| Machinery | | | 1,448,010 | | | | — | | | | — | | | | 1,448,010 | | |
| Media | | | 1,469,091 | | | | — | | | | — | | | | 1,469,091 | | |
| Metals & Mining | | | 3,560,537 | | | | — | | | | — | | | | 3,560,537 | | |
| Multi-Utilities | | | 1,496,993 | | | | — | | | | — | | | | 1,496,993 | | |
| Oil, Gas & Consumable Fuels | | | 7,168,805 | | | | — | | | | — | | | | 7,168,805 | | |
| Paper & Forest Products | | | 1,427,717 | | | | — | | | | — | | | | 1,427,717 | | |
| Pharmaceuticals | | | 7,104,156 | | | | — | | | | — | | | | 7,104,156 | | |
| Real Estate Investment Trusts (REIT) | | | 944,162 | | | | — | | | | — | | | | 944,162 | | |
| Road & Rail | | | 1,355,196 | | | | — | | | | — | | | | 1,355,196 | | |
| Semiconductors & Semiconductor Equipment | | | 2,725,271 | | | | — | | | | — | | | | 2,725,271 | | |
| Software | | | 1,436,626 | | | | — | | | | — | | | | 1,436,626 | | |
| Specialty Retail | | | 3,073,965 | | | | — | | | | — | | | | 3,073,965 | | |
| Textiles, Apparel & Luxury Goods | | | 1,291,488 | | | | — | | | | — | | | | 1,291,488 | | |
| Tobacco | | | 1,419,878 | | | | — | | | | — | | | | 1,419,878 | | |
| Total Common Stocks | | | 76,635,305 | | | | — | | | | — | | | | 76,635,305 | | |
| Fixed Income Securities | |
| Corporate Bonds | | | — | | | $ | 14,329,002 | | | | — | | | | 14,329,002 | | |
| Sovereign | | | — | | | | 371,307 | | | | — | | | | 371,307 | | |
| Municipal Bonds | | | — | | | | 623,042 | | | | — | | | | 623,042 | | |
| Agency Fixed Rate Mortgages | | | — | | | | 3,471 | | | | — | | | | 3,471 | | |
| Asset-Backed Securities | | | — | | | | 1,324,548 | | | | — | | | | 1,324,548 | | |
| Agency Bond — Banking (FDIC Guaranteed) | | | — | | | | 1,018,808 | | | | — | | | | 1,018,808 | | |
| U.S. Treasury Securities | | | — | | | | 13,399,067 | | | | — | | | | 13,399,067 | | |
| U.S. Agency Securities | | | — | | | | 2,204,560 | | | | — | | | | 2,204,560 | | |
| Total Fixed Income Securities | | | — | | | | 33,273,805 | | | | — | | | | 33,273,805 | | |
| Short-Term Investments | |
| U.S. Treasury Security | | | — | | | | 99,997 | | | | — | | | | 99,997 | | |
| Investment Company | | | 26,626,452 | | | | — | | | | — | | | | 26,626,452 | | |
| Total Short-Term Investments | | | 26,626,452 | | | | 99,997 | | | | — | | | | 26,726,449 | | |
87
Morgan Stanley Variable Investment Series
Notes to Financial Statements n December 31, 2011 continued
| Investment Type | | Level 1
Unadjusted
Quoted
Prices | | Level 2
Other
Significant
Observable
Inputs | | Level 3
Significant
Unobservable
Inputs | | Total | |
| Foreign Currency Exchange Contracts | | | — | | | $ | 2,118 | | | | — | | | $ | 2,118 | | |
| Futures Contracts | | $ | 383 | | | | — | | | | — | | | | 383 | | |
| Interest Rate Swap Agreements | | | — | | | | 436,055 | | | | — | | | | 436,055 | | |
| Zero Coupon Swap Agreements | | | — | | | | 95,195 | | | | — | | | | 95,195 | | |
| Total Assets | | | 103,262,140 | | | | 33,907,170 | | | | — | | | | 137,169,310 | | |
| Liabilities: | |
| Foreign Currency Exchange Contracts | | | — | | | | (6,192 | ) | | | — | | | | (6,192 | ) | |
| Futures Contracts | | | (3,406 | ) | | | — | | | | — | | | | (3,406 | ) | |
| Interest Rate Swap Agreements | | | — | | | | (409,510 | ) | | | — | | | | (409,510 | ) | |
| Zero Coupon Swap Agreements | | | — | | | | (171,196 | ) | | | — | | | | (171,196 | ) | |
| Total Liabilities | | | (3,406 | ) | | | (586,898 | ) | | | — | | | | (590,304 | ) | |
| Total | | $ | 103,258,734 | | | $ | 33,320,272 | | | | — | | | $ | 136,579,006 | | |
Transfers between investment levels may occur as the markets fluctuate and/or the availability of data used in an investment's valuation changes. The Fund recognizes transfers between the levels as of the end of the period. As of December 31, 2011, Global Infrastructure held a security that transferred from level 2 to level 1. This security was valued using other significant observable inputs at December 31, 2010 and was valued using an unadjusted quoted price at December 31, 2011. The value of the transfer was as follows:
GLOBAL
INFRASTRUCTURE | |
| $2,743,255 | |
Following is a reconciliation of investments in which significant unobservable inputs (Level 3) were used in determining fair value:
| | | Multi Cap Growth | | Aggressive Equity | |
| | | Common
Stock | | Convertible
Preferred
Stocks | | Common
Stock | | Convertible
Preferred
Stocks | |
| Beginning Balance | | $ | 5,231,372 | | | $ | 1,465,815 | | | | — | | | $ | 177,270 | | |
| Purchases | | | — | | | | 374,409 | | | $ | 862,949 | | | | 43,931 | | |
| Sales | | | — | | | | — | | | | — | | | | — | | |
| Amortization of discount | | | — | | | | — | | | | — | | | | — | | |
| Transfers in | | | — | | | | — | | | | — | | | | — | | |
88
Morgan Stanley Variable Investment Series
Notes to Financial Statements n December 31, 2011 continued
| | | Multi Cap Growth | | Aggressive Equity | |
| | | Common
Stock | | Convertible
Preferred
Stocks | | Common
Stock | | Convertible
Preferred
Stocks | |
| Transfers out | | | — | | | | — | | | | — | | | | — | | |
Change in unrealized appreciation
(depreciation) | | $ | 3,621,874 | | | $ | 1,196,105 | | | $ | 196,045 | | | $ | 144,652 | | |
| Realized gains (losses) | | | — | | | | — | | | | — | | | | — | | |
| Ending Balance | | $ | 8,853,246 | | | $ | 3,036,329 | | | $ | 1,058,994 | | | $ | 365,853 | | |
Net change in unrealized appreciation/depreciation from
investments still held as of December 31, 2011. | | $ | 3,621,874 | | | $ | 1,196,105 | | | $ | 196,045 | | | $ | 144,652 | | |
3. Derivatives
Certain Portfolios use derivative instruments for a variety of purposes, including hedging, risk management, portfolio management or to earn income. Derivatives are financial instruments whose value is based on the value of another underlying asset, interest rate, index or financial instrument. A derivative instrument often has risks similar to its underlying instrument and may have additional risks, including imperfect correlation between the value of the derivative and the underlying instrument, risks of default by the other party to certain transactions, magnification of losses incurred due to changes in the market value of the securities, instruments, indices or interest rates to which they relate, and risks that the transactions may not be liquid. The use of derivatives involves risks that are different from, and possibly greater than, the risks associated with other portfolio investments. Derivatives may involve the use of highly specialized instruments that require investment techniques and risk analyses different from those associated with other portfolio investments. All of a Portfolio's holdings, including derivative instruments, are marked-to-market each day with the change in value reflected in unrealized appreciation (depreciation). Upon disposition, a realized gain or loss is recognized.
Certain derivative transactions may give rise to a form of leverage. Leverage associated with derivative transactions may cause the Portfolios to liquidate portfolio positions when it may not be advantageous to do so to satisfy its obligations or to meet earmarking or segregation requirements, pursuant to applicable Securities and Exchange Commission rules and regulations, or may cause the Portfolios to be more volatile than if the Portfolios had not been leveraged. Although the Adviser and/or Sub-Advisers seek to use derivatives to further the Portfolio's investment objectives, there is no assurance that the use of derivatives will achieve this result.
89
Morgan Stanley Variable Investment Series
Notes to Financial Statements n December 31, 2011 continued
Following is a description of the derivative instruments and techniques that the Portfolios used during the period and their associated risks:
Foreign Currency Exchange Contracts In connection with its investments in foreign securities, certain Portfolios entered into contracts with banks, brokers or dealers to purchase or sell foreign currencies at a future date. A foreign currency exchange contract ("currency contracts") is a negotiated agreement between the contracting parties to exchange a specified amount of currency at a specified future time at a specified rate. The rate can be higher or lower than the spot rate between the currencies that are the subject of the currency contract. Currency contracts are used to protect against uncertainty in the level of future foreign currency exchange rates or to gain or modify exposure to a particular currency. In addition, certain Portfolios may use cross currency hedging or proxy hedging with respect to currencies in which a Portfolio has or expects to have portfolio or currency exposure. Cross currency hedges involve the sale of one currency against the positive exposure to a different currency and may be used for hedging purposes or to establish an active exposure to the exchange rate between any two currencies. Hedging a Portfolio's currency risks involves the risk of mismatching a Portfolio's objectives under a currency contract with the value of securities denominated in a particular currency. Furthermore, such transactions reduce or preclude the opportunity for gain if the value of the currency should move in the direction opposite to the position taken. There is an additional risk to the effect that currency contracts create exposure to currencies in which a Portfolio's securities are not denominated. Unanticipated changes in currency prices may result in poorer overall performance for a Portfolio than if it had not entered into such contracts. A currency contract is marked-to-market daily and the change in market value is recorded by a Portfolio as unrealized gain or (loss). A Portfolio records realized gains (losses) when the currency contract is closed equal to the difference between the value of the currency contract at the time it was opened and the value at the time it was closed.
Futures A futures contract is a standardized agreement between two parties to buy or sell a specific quantity of an underlying instrument at a specific price at a specific future time. The value of a futures contract tends to increase and decrease in tandem with the value of the underlying instrument. Futures contracts are bilateral agreements, with both the purchaser and the seller equally obligated to complete the transaction. Depending on the terms of the particular contract, futures contracts are settled through either physical delivery of the underlying instrument on the settlement date or by payment of a cash settlement amount on the settlement date. During the period the futures contract is open, payments are received from or made to the broker based upon changes in the value of the contract (the variation margin). A decision as to whether, when and how to use futures involves the exercise of skill and judgment and even a well conceived futures transaction may be unsuccessful because of market behavior or unexpected events. In addition to the
90
Morgan Stanley Variable Investment Series
Notes to Financial Statements n December 31, 2011 continued
derivatives risks discussed above, the prices of futures can be highly volatile, using futures can lower total return, and the potential loss from futures can exceed a Portfolio's initial investment in such contracts.
Swaps A swap agreement is an agreement between two parties pursuant to which the parties exchange payments at specified dates on the basis of a specified notional amount, with the payments calculated by reference to specified securities, indexes, reference rates, currencies or other instruments. Most swap agreements provide that when the period payment dates for both parties are the same, the payments are made on a net basis (i.e., the two payment streams are netted out, with only the net amount paid by one party to the other). A Portfolio's obligations or rights under a swap agreement entered into on a net basis will generally be equal only to the net amount to be paid or received under the agreement, based on the relative values of the positions held by each counterparty. Swap agreements are not entered into or traded on exchanges and there is no central clearing or guaranty function for swaps. Therefore, swaps are subject to credit risk or the risk of default or non-performance by the counterparty. Swaps could result in losses if interest rate or foreign currency exchange rates or credit quality changes are not correctly anticipated by a Portfolio or if the reference index, security or investments do not perform as expected.
A Portfolio's use of swaps during the period included those based on the credit of an underlying security and commonly referred to as credit default swaps. Where a Portfolio is the buyer of a credit default swap agreement, it would be entitled to receive the par (or other agreed-upon) value of a referenced debt obligation from the counterparty to the agreement only in the event of a default by a third party on the debt obligation. If no default occurs, a Portfolio would have paid to the counterparty a periodic stream of payments over the term of the agreement and received no benefit from the agreement. When a Portfolio is the seller of a credit default swap agreement, it receives the stream of payments but is obligated to pay upon default of the referenced debt obligation. The current credit rating of each individual issuer is listed in the table following the Portfolio of Investments and serves as an indicator of the current status of the payment/performance risk of the credit derivative. Alternatively, for credit default swaps on an index of credits, the quoted market prices and current values serve as an indicator of the current status of the payment/performance risk of the credit derivative. Generally, lower credit ratings and increasing market values, in absolute terms, represent a deterioration of the credit and a greater likelihood of an adverse credit event of the issuer.
When a Portfolio has an unrealized loss on a swap agreement, the Portfolio has instructed the custodian to pledge cash or liquid securities as collateral with a value approximately equal to the amount of the unrealized loss. Collateral pledges are monitored and subsequently adjusted if and when the swap valuations fluctuate. If applicable, cash collateral is included with "Due from (to) Broker" in the Statements of Assets and Liabilities.
91
Morgan Stanley Variable Investment Series
Notes to Financial Statements n December 31, 2011 continued
FASB ASC 815, Derivatives and Hedging: Overall ("ASC 815"), is intended to improve financial reporting about derivative instruments by requiring enhanced disclosures to enable investors to better understand how and why a Portfolio uses derivative instruments, how these derivative instruments are accounted for and their effects on a Portfolio's financial position and results of operations.
The following table sets forth the fair value of each Portfolio's derivative contracts by primary risk exposure as of December 31, 2011.
| PORTFOLIO | | PRIMARY RISK
EXPOSURE | | ASSET DERIVATIVES
STATEMENTS OF
ASSETS AND
LIABILITIES LOCATION | | FAIR VALUE | | LIABILITIES DERIVATIVES
STATEMENTS OF
ASSETS AND
LIABILITIES LOCATION | | FAIR VALUE | |
| Limited Duration | | Interest Rate
Risk
| | Variation margin
Unrealized appreciation
on open swap agreements | | $ | 29,731
369,297 | † | | Variation margin
Unrealized depreciation
on open swap agreements | | $ | (2,133
(640,290) | )† | |
| | | | | | | | | $ | 399,028 | | | | | $ | (642,423 | ) | |
| Income Plus | | Interest Rate
Risk
Credit Risk | | Variation margin
Unrealized appreciation
on open swap agreements | | $ | 125,085
— | † | | Variation margin
Unrealized depreciation
on open swap agreements | | $ | (333,883
(10,900) | )† | |
| | | | | | | $ | 125,085 | | | | | $ | (344,783 | ) | |
| European Equity | | Currency Risk | | Unrealized appreciation
on open foreign currency
exchange contracts | | | — | | | Unrealized depreciation
on open foreign currency
exchange contracts | | $ | (147,144 | ) | |
| Strategist | | Interest Rate
Risk | | Variation margin
Unrealized appreciation
on open swap agreements | | $ | 383
531,250 | † | | Variation margin
Unrealized depreciation
on open swap agreements | | $ | (3,406
(580,706) | )† | |
| | | Currency Risk | | Unrealized appreciation
on open foreign currency
exchange contracts | | | 2,118 | | | Unrealized depreciation
on open foreign currency
exchange contracts | | | (6,192 | ) | |
| | | | | | | $ | 533,751 | | | | | $ | (590,304 | ) | |
† Includes cumulative appreciation/depreciation of futures contracts as reported in the Portfolio of Investments. Only current day's net variation margin is reported within the Statements of Assets and Liabilities.
92
Morgan Stanley Variable Investment Series
Notes to Financial Statements n December 31, 2011 continued
The following tables set forth by primary risk exposure of the Portfolio's realized gains (losses) and change in unrealized appreciation (depreciation) by type of derivative contract for the year ended December 31, 2011 in accordance with ASC 815.
AMOUNT OF REALIZED GAIN (LOSS) ON DERIVATIVE CONTRACTS
| PORTFOLIO | | PRIMARY RISK
EXPOSURE | | FUTURES | | SWAPS | | FOREIGN
CURRENCY
EXCHANGE | |
| Limited Duration | | Interest Rate Risk | | $ | 611,416 | | | $ | (675,647 | ) | | | — | | |
| Income Plus | | Interest Rate Risk | | $ | (1,409,742 | ) | | $ | 402,198 | | | | — | | |
| European Equity | | Currency Risk | | | — | | | | — | | | $ | 92,515 | | |
| Strategist | | Interest Rate Risk | | $ | (165,494 | ) | | $ | (400,820 | ) | | | — | | |
| | | Currency Risk | | | — | | | | — | | | $ | (8,678 | ) | |
| | | Total | | $ | (165,494 | ) | | $ | (400,820 | ) | | $ | (8,678 | ) | |
CHANGE IN UNREALIZED APPRECIATION (DEPRECIATION) ON DERIVATIVE CONTRACTS
| PORTFOLIO | | PRIMARY RISK
EXPOSURE | | FUTURES | | SWAPS | | FOREIGN
CURRENCY
EXCHANGE | |
| Limited Duration | | Interest Rate Risk | | $ | 44,090 | | | $ | 330,785 | | | | — | | |
| Income Plus | | Interest Rate Risk | | $ | (675,018 | ) | | $ | 113,226 | | | | — | | |
| European Equity | | Currency Risk | | | — | | | | — | | | $ | (203,880 | ) | |
| Strategist | | Interest Rate Risk | | $ | (52,939 | ) | | $ | 240,859 | | | | — | | |
| | | Currency Risk | | | — | | | | — | | | $ | (3,017 | ) | |
| | | Total | | $ | (52,939 | ) | | $ | 240,859 | | | $ | (3,017 | ) | |
For the year ended December 31, 2011, Income Plus and Limited Duration Portfolios' average monthly original value of futures contracts was $103,589,587 and $13,685,353, respectively, and average monthly notional amount of swap agreements was $29,407,083 and $16,884,317, respectively. European Equity Portfolio's average monthly principal amount of foreign currency exchange contracts was $8,335,338. Strategist Portfolio's average monthly principal amount of foreign currency exchange contracts was $1,283,987, the average monthly original value of futures contracts was $4,584,936 and the average monthly notional amount of swap agreements was $44,163,739.
93
Morgan Stanley Variable Investment Series
Notes to Financial Statements n December 31, 2011 continued
4. Investment Advisory/Administration and Sub-Advisory Agreements
Pursuant to an Investment Advisory Agreement with the Adviser and Sub-Advisers, the Fund pays an advisory fee, accrued daily and payable monthly, by applying the annual rates listed below to each Portfolio's net assets determined at the close of each business day.
Money Market — 0.45% to the portion of the daily net assets not exceeding $250 million; 0.375% to the portion of the daily net assets exceeding $250 million but not exceeding $750 million; 0.325% to the portion of the daily net assets exceeding $750 million but not exceeding $1.25 billion; 0.30% to the portion of the daily net assets exceeding $1.25 billion but not exceeding $1.5 billion; and 0.275% to the portion of the daily net assets in excess of $1.5 billion.
Limited Duration — 0.30%.
Income Plus — 0.42% to the portion of the daily net assets not exceeding $500 million; 0.35% to the portion of the daily net assets exceeding $500 million but not exceeding $1.25 billion; and 0.22% to the portion of the daily net assets in excess of $1.25 billion.
Global Infrastructure — 0.57% to the portion of the daily net assets not exceeding $500 million; 0.47% to the portion of the daily net assets exceeding $500 million but not exceeding $1 billion; 0.445% to the portion of the daily net assets exceeding $1 billion but not exceeding $1.5 billion; 0.42% to the portion of the daily net assets exceeding $1.5 billion but not exceeding $2.5 billion; 0.395% to the portion of the daily net assets exceeding $2.5 billion but not exceeding $3.5 billion; 0.37% to the portion of the daily net assets exceeding $3.5 billion but not exceeding $5 billion; and 0.345% to the portion of the daily net assets in excess of $5 billion.
European Equity — 0.87% to the portion of the daily net assets not exceeding $500 million; 0.82% to the portion of the daily net assets exceeding $500 million but not exceeding $2 billion; 0.77% to the portion of the daily net assets exceeding $2 billion but not exceeding $3 billion; and 0.745% to the portion of the daily net assets in excess of $3 billion.
Multi Cap Growth — 0.42% to the portion of the daily net assets not exceeding $1 billion; 0.395% to the portion of the daily net assets exceeding $1 billion but not exceeding $2 billion; and 0.37% to the portion of the daily net assets in excess of $2 billion.
Aggressive Equity — 0.67% to the portion of the daily net assets not exceeding $500 million; 0.645% to the portion of the daily net assets exceeding $500 million but not exceeding $2 billion; 0.62% to the portion of the daily net assets exceeding $2 billion but not exceeding $3 billion; and 0.595% to the portion of the daily net assets in excess of $3 billion.
94
Morgan Stanley Variable Investment Series
Notes to Financial Statements n December 31, 2011 continued
Strategist — 0.42% to the portion of the daily net assets not exceeding $1.5 billion; and 0.395% to the portion of the daily net assets in excess of $1.5 billion.
Under the Sub-Advisory Agreement between the Adviser and the Sub-Advisers, the Sub-Advisers provide Global Infrastructure and European Equity Portfolios with investment advisory services, subject to the overall supervision of the Adviser and the Fund's Officers and Trustees. The Adviser pays the Sub-Advisers on a monthly basis a portion of the net advisory fees the Adviser receives from each Portfolio.
The Adviser has agreed to cap European Equity's operating expenses (except for brokerage and 12b-1 fees) by assuming the Portfolio's "other expenses" and/or waiving the Portfolio's advisory fees, and Morgan Stanley Services Company Inc. (the "Administrator") has agreed to waive the Portfolio's administrative fees, to the extent such operating expenses exceed 1.00% of the average daily net assets of the Portfolio on an annualized basis. These fee waivers and/or expense reimbursements will continue for one year or until such time as the Board of Trustees acts to discontinue such waivers and/or reimbursements when it deems that such action is appropriate.
Pursuant to an Administration Agreement with the Administrator, an affiliate of the Adviser and Sub-Advisers, each Portfolio pays an administration fee, accrued daily and payable monthly, by applying the annual rate of 0.08% (Money Market 0.05%) to the Portfolio's daily net assets.
Under a Sub-Administration agreement between the Administrator and State Street Bank and Trust Company ("State Street"), State Street provides certain administrative services to the Fund. For such services, the Administrator pays State Street a portion of the fee the Administrator receives from the Fund.
5. Plan of Distribution
Shares of the Fund are distributed by Morgan Stanley Distribution, Inc. (the "Distributor"), an affiliate of the Adviser, Administrator and Sub-Advisers. The Fund has adopted a Plan of Distribution (the "Plan") pursuant to Rule 12b-1 under the Act. Under the Plan, Class Y shares of each Portfolio bear a distribution fee which is accrued daily and paid monthly at the annual rate of 0.25% of the average daily net assets of the class.
The Distributor, Adviser and Administrator have agreed to waive/reimburse all or a portion of the Money Market Portfolio's distribution fee, advisory fee and administration fee, respectively, to the extent that total expenses exceed total income of the Money Market Portfolio on a daily basis. For the year ended December 31, 2011, the Distributor waived $154,136, the Adviser waived $434,703 and the Administrator waived $6,612. These fee waivers and/or expense reimbursements will continue for one year or until such
95
Morgan Stanley Variable Investment Series
Notes to Financial Statements n December 31, 2011 continued
time that the Board of Trustees acts to discontinue such waivers and/or expense reimbursements when it deems such action is appropriate.
6. Security Transactions/Transactions with Affiliates and Interfund Transactions
For the year ended December 31, 2011, purchases and sales of investment securities, excluding short-term investments, were as follows:
| | | U.S. GOVERNMENT
SECURITIES | | OTHER | |
| | | PURCHASES | | SALES | | PURCHASES | | SALES | |
| Limited Duration | | $ | 13,615,052 | | | $ | 17,107,591 | | | $ | 14,016,752 | | | $ | 21,355,862 | | |
| Income Plus | | | — | | | | | | | | 88,890,145 | | | | 124,090,545 | | |
| Global Infrastructure | | | — | | | | — | | | | 26,616,878 | | | | 39,236,618 | | |
| European Equity | | | — | | | | — | | | | 7,459,170 | | | | 19,239,592 | | |
| Multi Cap Growth | | | — | | | | — | | | | 61,531,782 | | | | 112,692,181 | | |
| Aggressive Equity | | | — | | | | — | | | | 8,435,485 | | | | 13,402,173 | | |
| Strategist | | | 7,151,029 | | | | 7,401,226 | | | | 159,477,436 | | | | 211,033,833 | | |
Each Portfolio (except Money Market) invests in the Institutional Class of the Morgan Stanley Institutional Liquidity Funds — Money Market Portfolio (the "Liquidity Funds"), an open-end management investment company managed by the Adviser, both directly, and as a portion of the securities held as collateral on loaned securities. Investment advisory fees paid by the Fund are reduced by an amount equal to its pro-rata share of advisory and administration fees paid by the Fund due to its investment in the Liquidity Funds.
A summary of the Portfolio's transactions in shares of the Liquidity Funds during the year ended December 31, 2011 is as follows:
| PORTFOLIO | | VALUE
DECEMBER 31, 2010 | | PURCHASES
AT COST | | SALES | | DIVIDEND
INCOME | | VALUE
DECEMBER 31, 2011 | |
| Limited Duration | | $ | 830,785 | | | $ | 21,803,215 | | | $ | 22,523,489 | | | $ | 959 | | | $ | 110,511 | | |
| Income Plus | | | 3,382,277 | | | | 55,159,765 | | | | 58,333,772 | | | | 2,003 | | | | 208,270 | | |
| Global Infrastructure | | | 2,007,943 | | | | 20,724,175 | | | | 20,738,770 | | | | 1,717 | | | | 1,993,348 | | |
| European Equity | | | 1,187,046 | | | | 12,117,920 | | | | 12,586,419 | | | | 1,321 | | | | 718,547 | | |
| Multi Cap Growth | | | 10,848,140 | | | | 84,483,328 | | | | 83,114,804 | | | | 11,490 | | | | 12,216,664 | | |
| Aggressive Equity | | | 1,244,382 | | | | 12,870,063 | | | | 12,323,529 | | | | 1,407 | | | | 1,790,916 | | |
| Strategist | | | 7,186,645 | | | | 96,560,674 | | | | 77,120,867 | | | | 29,669 | | | | 26,626,452 | | |
96
Morgan Stanley Variable Investment Series
Notes to Financial Statements n December 31, 2011 continued
In addition, the table also identifies the income distributions earned, if any, by each Portfolio for that Portfolio's investment in the Liquidity Funds.
Income distributions are included in "interest and dividends from affiliates" in the Statements of Operations.
| PORTFOLIO | | ADVISORY FEE
REDUCTION | |
| Limited Duration | | $ | 1,009 | | |
| Income Plus | | | 1,719 | | |
| Global Infrastructure | | | 1,419 | | |
| European Equity | | | 1,140 | | |
| Multi Cap Growth | | | 11,007 | | |
| Aggressive Equity | | | 1,351 | | |
| Strategist | | | 31,209 | | |
The following Portfolios had transactions in the following affiliates of the Fund:
| PORTFOLIO | | ISSUER | | VALUE
DECEMBER 31,
2010 | | PURCHASES
AT COST | | SALES | | NET
REALIZED
GAIN | | INTEREST
INCOME | | VALUE
DECEMBER 31,
2011 | |
Limited
Duration | | MetLife Global | | $ | 226,235 | | | $ | 328,646 | | | $ | 229,402 | | | $ | 3,395 | | | $ | 6,119 | | | $ | 327,079 | | |
| Income Plus | | MetLife, Inc. | | | 1,296,422 | | | | — | | | | — | | | | — | | | | 103,641 | | | | 1,276,994 | | |
| Strategist | | Allstate Corp. (The) | | | 60,780 | | | | — | | | | 61,526 | | | | 10,492 | | | | 168 | | | | — | | |
| | | MetLife, Inc. | | | 55,334 | | | | 43,164 | | | | 55,375 | | | | 3,372 | | | | 1,673 | | | | 43,951 | | |
The following Portfolios had transactions with Citigroup, Inc., and its affiliated broker/dealers, which may be deemed to be affiliates of the Adviser, Sub-Advisers, Administrator and Distributor under Section 17 of the Act, for the year ended December 31, 2011:
| PORTFOLIO | | VALUE
DECEMBER 31,
2010 | | PURCHASES
AT COST | | SALES | | NET
REALIZED
GAIN (LOSS) | | DIVIDEND/
INTEREST
INCOME | | VALUE
DECEMBER 31,
2011 | |
| Limited Duration | | $ | 1,250,914 | | | $ | 498,322 | | | $ | 639,540 | | | $ | 23,249 | | | $ | 39,379 | | | $ | 1,087,480 | | |
| Income Plus | | | 7,222,659 | | | | 704,602 | | | | 4,010,624 | | | | 449,298 | | | | 398,367 | | | | 3,188,387 | | |
| Strategist | | | 4,074,750 | | | | 3,667,730 | | | | 3,007,111 | | | | (1,217,156 | ) | | | 48,433 | | | | 2,483,400 | | |
97
Morgan Stanley Variable Investment Series
Notes to Financial Statements n December 31, 2011 continued
The following Portfolio had transactions with other Morgan Stanley funds for the year ended December 31, 2011:
| PORTFOLIO | | SALES | | REALIZED
GAIN | |
| Multi Cap Growth | | $ | 5,035,807 | | | $ | 1,567,592 | | |
For the year ended December 31, 2011, the following Portfolios incurred brokerage commissions with Morgan Stanley & Co., LLC, an affiliate of the Adviser, Sub-Advisers, Administrator and Distributor, for portfolio transactions executed on behalf of the each Portfolio:
GLOBAL
INFRASTRUCTURE | | MULTI CAP
GROWTH | | AGGRESSIVE
EQUITY | | STRATEGIST | |
| $ | 246 | | | $ | 5,619 | | | $ | 579 | | | $ | 245,802 | | |
For the year ended December 31, 2011, the following Portfolios incurred brokerage commissions with Citigroup, Inc., and its affiliated broker/dealers, which may be deemed affiliates of the Adviser, Sub-Advisers, Administrator and Distributor under Section 17 of the Act, for portfolio transactions executed on behalf of each Portfolio:
GLOBAL
INFRASTRUCTURE | | EUROPEAN
EQUITY | | MULTI CAP
GROWTH | | AGGRESSIVE
EQUITY | |
| $ | 9,358 | | | $ | 721 | | | $ | 365 | | | $ | 14 | | |
Morgan Stanley Services Company Inc., an affiliate of the Adviser, Sub-Advisers and Distributor, is the Fund's transfer agent.
The Fund has an unfunded noncontributory defined benefit pension plan covering certain independent Trustees of the Fund who will have served as independent Trustees for at least five years at the time of retirement. Benefits under this plan are based on factors which include years of service and compensation. The Trustees voted to close the plan to new participants and eliminate the future benefits growth due to increases to compensation after July 31, 2003.
98
Morgan Stanley Variable Investment Series
Notes to Financial Statements n December 31, 2011 continued
Aggregate pension costs for the year ended December 31, 2011, included in "trustees' fees and expenses" in the Statements of Operations and the accrued pension liability included in "accrued expenses and other payables" in the Statements of Assets and Liabilities are as follows:
AGGREGATE PENSION COSTS
MONEY
MARKET | | LIMITED
DURATION | | INCOME
PLUS | | GLOBAL
INFRASTRUCTURE | | EUROPEAN
EQUITY | | MULTI CAP
GROWTH | | AGGRESSIVE
EQUITY | | STRATEGIST | |
| $ | 324 | | | $ | 179 | | | $ | 610 | | | $ | 234 | | | $ | 201 | | | $ | 766 | | | $ | 91 | | | $ | 505 | | |
AGGREGATE PENSION LIABILITY
MONEY
MARKET | | LIMITED
DURATION | | INCOME
PLUS | | GLOBAL
INFRASTRUCTURE | | EUROPEAN
EQUITY | | MULTI CAP
GROWTH | | AGGRESSIVE
EQUITY | | STRATEGIST | |
| $ | 5,440 | | | $ | 2,832 | | | $ | 9,415 | | | $ | 2,896 | | | $ | 2,585 | | | $ | 9,914 | | | $ | 1,178 | | | $ | 7,416 | | |
The Fund has an unfunded Deferred Compensation Plan (the "Compensation Plan"), which allows each independent Trustee to defer payment of all, or a portion, of the fees he or she receives for serving on the Board of Trustees. Each eligible Trustee generally may elect to have the deferred amounts credited with a return equal to the total return on one or more of the Morgan Stanley funds that are offered as investment options under the Compensation Plan. Appreciation/depreciation and distributions received from these investments are recorded with an offsetting increase/decrease in the deferred compensation obligation and do not affect the net asset value of the Fund.
7. Federal Income Tax Status
It is the Portfolios' intention to continue to qualify as a regulated investment company and distribute all of its taxable and tax-exempt income. Accordingly, no provision for Federal income taxes is required in the financial statements.
Dividend income and distributions to shareholders are recorded on the ex-dividend date. Interest income is recognized on an accrual basis. Dividends from net investment income, if any, are declared and paid annually. Net realized capital gains, if any, are distributed at least annually.
A Portfolio may be subject to taxes imposed by countries in which it invests. Such taxes are generally based on income and/or capital gains earned or repatriated. Taxes are accrued based on net investment income, net realized gains and net unrealized appreciation as such income and/or gains are earned. Taxes may also be based on transactions in foreign currency and are accrued based on the value of investments denominated in such currency.
99
Morgan Stanley Variable Investment Series
Notes to Financial Statements n December 31, 2011 continued
FASB ASC 740-10 "Income Taxes — Overall" sets forth a minimum threshold for financial statement recognition of the benefit of a tax position taken or expected to be taken in a tax return. Management has concluded there are no significant uncertain tax positions that would require recognition in the financial statements. If applicable, the Portfolios recognize interest accrued related to unrecognized tax benefits in "interest expense" and penalties in "other expenses" in the Statements of Operations. The Portfolios file tax returns with the U.S. Internal Revenue Service, New York and various states. Each of the tax years in the four-year period ended December 31, 2011, remains subject to examination by taxing authorities.
The tax character of distributions paid may differ from the character of distributions shown in the Statements of Changes in Net Assets due to short-term capital gains being treated as ordinary income for tax purposes. The tax character of distributions paid during fiscal 2011 and 2010 was as follows:
| | | 2011 DISTRIBUTIONS PAID FROM: | | 2010 DISTRIBUTIONS PAID FROM: | |
| | | ORDINARY
INCOME | | LONG-TERM
CAPITAL GAIN | | ORDINARY
INCOME | | LONG-TERM
CAPITAL GAIN | |
| Money Market | | $ | 11,709 | | | | — | | | $ | 14,474 | | | $ | 202 | | |
| Limited Duration | | | 1,919,268 | | | | — | | | | 2,459,575 | | | | — | | |
| Income Plus | | | 12,237,165 | | | | — | | | | 14,616,596 | | | | — | | |
| Global Infrastructure | | | 1,889,924 | | | $ | 3,948,735 | | | | 5,523,941 | | | | 3,205,294 | | |
| European Equity | | | 1,488,782 | | | | — | | | | 1,837,269 | | | | — | | |
| Multi Cap Growth | | | 327,516 | | | | 5 | | | | 333,905 | | | | — | | |
| Strategist | | | 5,463,608 | | | | 15,665,688 | | | | 2,865,187 | | | | 1,010,412 | | |
The amount and character of income and gains to be distributed are determined in accordance with income tax regulations which may differ from GAAP. These book/tax differences are either considered temporary or permanent in nature.
Temporary differences are primarily due to differing book and tax treatments for the timing of the recognition of gains (losses) on certain investment transactions and the timing of the deductibility of certain expenses.
Permanent differences, primarily due to differing treatments of gains (losses) related to foreign currency transactions, swap transactions, paydown adjustments, expiring capital losses, net operating losses, REIT adjustments, partnership basis adjustments, distribution redesignations, nondeductible expenses and certain
100
Morgan Stanley Variable Investment Series
Notes to Financial Statements n December 31, 2011 continued
equity securities designated as issued by passive foreign investment companies, resulted in the following reclassifications among the Portfolios' components of net assets at December 31, 2011:
| | | ACCUMULATED UNDISTRIBUTED
(DISTRIBUTIONS IN EXCESS OF)
NET INVESTMENT INCOME | | ACCUMULATED
NET REALIZED GAIN (LOSS) | | PAID-IN-CAPITAL | |
| Money Market | | $ | (107 | ) | | $ | 107 | | | $ | — | | |
| Limited Duration | | | 700,245 | | | | 603,087 | | | | (1,303,332 | ) | |
| Income Plus | | | 761,229 | | | | (761,229 | ) | | | — | | |
| Global Infrastructure | | | (118,528 | ) | | | 118,543 | | | | (15 | ) | |
| European Equity | | | 34,870 | | | | (34,877 | ) | | | 7 | | |
| Multi Cap Growth | | | 118,008 | | | | (40,804 | ) | | | (77,204 | ) | |
| Aggressive Equity | | | 189,189 | | | | (2,163 | ) | | | (187,026 | ) | |
| Strategist | | | 214,896 | | | | (214,894 | ) | | | (2 | ) | |
At December 31, 2011, the components of distributable earnings on a tax basis were as follows:
| PORTFOLIO | | UNDISTRIBUTED
ORDINARY
INCOME | | UNDISTRIBUTED
LONG-TERM
CAPITAL GAIN | |
| Money Market | | $ | 7,605 | | | | — | | |
| Limited Duration | | | 1,503,207 | | | | — | | |
| Income Plus | | | 10,700,252 | | | | — | | |
| Global Infrastructure | | | 2,854,240 | | | $ | 5,230,378 | | |
| European Equity | | | 1,421,623 | | | | — | | |
| Multi Cap Growth | | | — | | | | 4,886,438 | | |
| Aggressive Equity | | | — | | | | 2,196,459 | | |
| Strategist | | | 2,450,279 | | | | 1,953,002 | | |
At December 31, 2011, cost, unrealized appreciation, unrealized depreciation, and net unrealized appreciation (depreciation) for U.S. Federal income tax purposes of the investments of each of the Portfolios were:
| PORTFOLIO | | COST | | APPRECIATION | | DEPRECIATION | | NET APPRECIATION
(DEPRECIATION) | |
| Money Market | | $ | 107,581,291 | | | | — | | | | — | | | | — | | |
| Limited Duration | | | 56,487,005 | | | $ | 626,338 | | | $ | (575,681 | ) | | $ | 50,657 | | |
| Income Plus | | | 182,154,362 | | | | 11,524,943 | | | | (3,935,407 | ) | | | 7,589,536 | | |
| Global Infrastructure | | | 61,598,095 | | | | 12,712,294 | | | | (1,079,013 | ) | | | 11,633,281 | | |
| European Equity | | | 49,750,277 | | | | 9,384,842 | | | | (6,280,186 | ) | | | 3,104,656 | | |
| Multi Cap Growth | | | 186,885,788 | | | | 61,599,853 | | | | (25,521,061 | ) | | | 36,078,792 | | |
| Aggressive Equity | | | 23,617,061 | | | | 7,254,523 | | | | (2,922,030 | ) | | | 4,332,493 | | |
| Strategist | | | 138,237,082 | | | | 8,233,516 | | | | (9,835,039 | ) | | | (1,601,523 | ) | |
101
Morgan Stanley Variable Investment Series
Notes to Financial Statements n December 31, 2011 continued
On December 22, 2010, the Regulated Investment Company Modernization Act of 2010 (the "Modernization Act") was signed into law. The Modernization Act modernizes several tax provisions related to Regulated Investment Companies ("RICs") and their shareholders. One key change made by the Modernization Act is that capital losses will generally retain their character as short-term or long-term and may be carried forward indefinitely to offset future gains. These losses are utilized before other capital loss carryforwards that expire. Generally, the Modernization Act is effective for taxable years beginning after December 22, 2010.
At December 31, 2011, the following Portfolios had available for Federal income tax purposes unused short term capital losses that will not expire:
| PORTFOLIO | | SHORT TERM LOSSES
(NO EXPIRATION) | |
| Money Market | | $ | 2,011 | | |
In addition, at December 31, 2011, the following Portfolios had available capital loss carryforwards to offset future net capital gains, to the extent provided by regulations, through the indicated expiration dates:
| | | AMOUNTS IN THOUSANDS AVAILABLE THROUGH DECEMBER 31, | |
| PORTFOLIO | | 2012 | | 2013 | | 2014 | | 2015 | | 2016 | | 2017 | | 2018 | | TOTAL | |
| Limited Duration | | $ | 4,026 | | | $ | 1,267 | | | $ | 2,233 | | | $ | 1,063 | | | $ | 17,119 | | | $ | 8,980 | | | | — | | | $ | 34,688 | | |
| Income Plus | | | — | | | | — | | | | — | | | | 344 | | | | 19,232 | | | | — | | | | — | | | | 19,576 | | |
| European Equity | | | — | | | | — | | | | — | | | | — | | | | — | | | | 10,552 | | | $ | 3,315 | | | | 13,867 | | |
During the year ended December 31, 2011, the following Portfolios expired capital loss carryforwards for U.S. Federal income tax purposes as follows:
| PORTFOLIO | | EXPIRED CAPITAL LOSS
CARRYFORWARDS | |
| Limited Duration | | $ | 1,303,332 | | |
During the year ended December 31, 2011, the following Portfolios utilized capital loss carryforwards for U.S. Federal income tax purposes as follows:
| PORTFOLIO | | UTILIZED CAPITAL LOSS
CARRYFORWARDS | |
| Limited Duration | | $ | 88,554 | | |
| Income Plus | | | 4,828,845 | | |
| European Equity | | | 1,331,481 | | |
| Multi Cap Growth | | | 27,708,593 | | |
| Aggressive Equity | | | 1,987,158 | | |
102
Morgan Stanley Variable Investment Series
Notes to Financial Statements n December 31, 2011 continued
To the extent that capital loss carryforwards are used to offset any future capital gains realized during the carryover period as provided by U.S. Federal income tax regulations, no capital gains tax liability will be incurred by a Portfolio for gains realized and not distributed. To the extent that capital gains are offset, such gains will not be distributed to the shareholders.
8. Purposes of and Risks Relating to Certain Financial Instruments
Certain Portfolios may lend securities to qualified financial institutions, such as broker-dealers, to earn additional income. Risks in securities lending transactions are that a borrower may not provide additional collateral when required or return the securities when due, and that the value of the short-term investments will be less than the amount of cash collateral plus any rebate that is required to be returned to the borrower.
Certain Portfolios may invest in mortgage securities, including securities issued by Federal National Mortgage Association ("FNMA") and Federal Home Loan Mortgage Corporation ("FHLMC"). These are fixed income securities that derive their value from or represent interests in a pool of mortgages or mortgage securities. An unexpectedly high rate of defaults on the mortgages held by a mortgage pool may adversely affect the value of a mortgage backed security and could result in losses to the Portfolio. The risk of such defaults is generally higher in the case of mortgage pools that include sub-prime mortgages. Subprime mortgages refer to loans made to borrowers with weakened credit histories or with a lower capacity to make timely payments on their mortgages. The securities issued by FNMA and FHLMC that are held by the Portfolios are not backed by sub-prime mortgages.
Additionally, securities issued by FNMA and FHLMC are not backed by or entitled to the full faith and credit of the United States; rather, they are supported by the right of the issuer to borrow from the U.S. Department of the Treasury.
The Federal Housing Finance Agency ("FHFA") serves as conservator of FNMA and FHLMC and the U.S. Department of the Treasury has agreed to provide capital as needed to ensure FNMA and FHLMC continue to provide liquidity to the housing and mortgage markets.
Certain Portfolios may enter into repurchase agreements under which a Portfolio lends excess cash and takes possession of securities with an agreement that the counterparty will repurchase such securities. In the event of default on the obligation to repurchase, the Portfolio has the right to liquidate the collateral and apply the proceeds in satisfaction of the obligation. In the event of default or bankruptcy by the counterparty to the agreement, realization of the collateral proceeds may be subject to certain costs and delays.
103
Morgan Stanley Variable Investment Series
Notes to Financial Statements n December 31, 2011 continued
Certain Portfolios may invest in structured investments, which involve risks including counterparty risk and market risk. Holders of structured investments bear risks of the underlying investment and are subject to counterparty risk because the Portfolio is relying on the creditworthiness of such counterparty and has no rights with respect to the issuer of the underlying investment. Certain structured investments may be thinly traded or have a limited trading market and may have the effect of increasing the Portfolio's illiquidity to the extent that the Portfolio, at a particular point in time, may be unable to find qualified buyers for these securities.
At December 31, 2011, European Equity Portfolio's investments in securities of issuers in the United Kingdom, Switzerland, Germany and France represented 50.2%, 14.5%, 13.7% and 10.4%, respectively of the Portfolio's net assets. These investments, as well as other non-U.S. investments, which involve risks and considerations not present with respect to U.S. securities, may be affected by economic or political developments in these countries.
9. Expense Offset
The Fund has entered into an arrangement with State Street (the "Custodian"), whereby credits realized on uninvested cash balances were used to offset a portion of the Fund's expenses. If applicable, these custodian credits are shown as "expense offset" in the Statements of Operations.
10. Accounting Pronouncement
In May 2011, FASB issued Accounting Standards Update ("ASU") 2011-04. The amendments in this update are the results of the work of FASB and the International Accounting Standards Board to develop common requirements for measuring fair value and for disclosing information about fair value measurements, which are effective during interim and annual periods beginning after December 15, 2011. Consequently, these amendments improve the comparability of fair value measurements presented and disclosed in the financial statements prepared in accordance with GAAP and International Financial Reporting Standards. At this time, the Fund's management is evaluating the implications of ASU 2011-04.
11. Regulatory Settlement Proceeds
In July 2010, the European Equity Portfolio received $84,956 in a settlement of administrative proceedings against other unaffiliated third parties involving findings by the SEC of market timing and/or late trading of mutual funds. The settlement is recorded as an increase to paid-in capital in the accompanying financial statements.
104
(This page has been intentionally left blank.)
Morgan Stanley Variable Investment Series
Financial Highlights
| | | | | | | | | | | | | | | | |
FOR THE YEAR
DECEMBER 31 ENDED | | NET ASSET
VALUE
BEGINNING
OF PERIOD | | NET
INVESTMENT
INCOME(a) | | NET REALIZED
AND
UNREALIZED
GAIN (LOSS) | | TOTAL FROM
INVESTMENT
OPERATIONS | | DIVIDENDS
TO
SHAREHOLDERS | | DISTRIBUTIONS
TO
SHAREHOLDERS | | TOTAL
DIVIDENDS
AND
DISTRIBUTIONS | |
MONEY MARKET
CLASS X SHARES | |
| | 2007 | ^ | | $ | 1.00 | | | $ | 0.050 | | | | — | | | $ | 0.050 | | | $ | (0.050 | ) | | | — | | | $ | (0.050 | ) | |
| | 2008 | ^ | | | 1.00 | | | | 0.020 | | | | — | | | | 0.020 | | | | (0.020 | ) | | | — | | | | (0.020 | ) | |
| | 2009 | ^ | | | 1.00 | | | | 0.000 | (e) | | | — | | | | 0.000 | (e) | | | (0.000 | )(e) | | | — | | | | (0.000 | )(e) | |
| | 2010 | ^ | | | 1.00 | | | | 0.000 | (e) | | | — | | | | 0.000 | (e) | | | (0.000 | )(e) | | | — | | | | (0.000 | )(e) | |
| | 2011 | | | | 1.00 | | | | 0.000 | (e) | | | (0.000 | )(e) | | | 0.000 | (e) | | | (0.000 | )(e) | | | — | | | | (0.000 | )(e) | |
| CLASS Y SHARES | |
| | 2007 | ^ | | | 1.00 | | | | 0.050 | | | | — | | | | 0.050 | | | | (0.050 | ) | | | — | | | | (0.050 | ) | |
| | 2008 | ^ | | | 1.00 | | | | 0.020 | | | | — | | | | 0.020 | | | | (0.020 | ) | | | — | | | | (0.020 | ) | |
| | 2009 | ^ | | | 1.00 | | | | 0.000 | (e) | | | — | | | | 0.000 | (e) | | | (0.000 | )(e) | | | — | | | | (0.000 | )(e) | |
| | 2010 | ^ | | | 1.00 | | | | 0.000 | (e) | | | — | | | | 0.000 | (e) | | | (0.000 | )(e) | | | — | | | | (0.000 | )(e) | |
| | 2011 | | | | 1.00 | | | | 0.000 | (e) | | | (0.000 | )(e) | | | 0.000 | (e) | | | (0.000 | )(e) | | | — | | | | (0.000 | )(e) | |
LIMITED DURATION
CLASS X SHARES | |
| | 2007 | ^ | | | 9.49 | | | | 0.47 | | | $ | (0.19 | ) | | | 0.28 | | | | (0.50 | ) | | | — | | | | (0.50 | ) | |
| | 2008 | ^ | | | 9.27 | | | | 0.36 | | | | (1.72 | ) | | | (1.36 | ) | | | (0.15 | ) | | | — | | | | (0.15 | ) | |
| | 2009 | ^ | | | 7.76 | | | | 0.20 | | | | 0.24 | | | | 0.44 | | | | (0.36 | ) | | | — | | | | (0.36 | ) | |
| | 2010 | ^ | | | 7.84 | | | | 0.18 | | | | 0.00 | | | | 0.18 | | | | (0.28 | ) | | | — | | | | (0.28 | ) | |
| | 2011 | | | | 7.74 | | | | 0.17 | | | | 0.04 | | | | 0.21 | | | | (0.26 | ) | | | — | | | | (0.26 | ) | |
| CLASS Y SHARES | |
| | 2007 | ^ | | | 9.48 | | | | 0.44 | | | | (0.19 | ) | | | 0.25 | | | | (0.47 | ) | | | — | | | | (0.47 | ) | |
| | 2008 | ^ | | | 9.26 | | | | 0.34 | | | | (1.73 | ) | | | (1.39 | ) | | | (0.14 | ) | | | — | | | | (0.14 | ) | |
| | 2009 | ^ | | | 7.73 | | | | 0.18 | | | | 0.24 | | | | 0.42 | | | | (0.34 | ) | | | — | | | | (0.34 | ) | |
| | 2010 | ^ | | | 7.81 | | | | 0.16 | | | | 0.01 | | | | 0.17 | | | | (0.26 | ) | | | — | | | | (0.26 | ) | |
| | 2011 | | | | 7.72 | | | | 0.15 | | | | 0.04 | | | | 0.19 | | | | (0.24 | ) | | | — | | | | (0.24 | ) | |
INCOME PLUS
CLASS X SHARES | |
| | 2007 | ^ | | | 10.51 | | | | 0.53 | | | | 0.08 | | | | 0.61 | | | | (0.56 | ) | | | — | | | | (0.56 | ) | |
| | 2008 | ^ | | | 10.56 | | | | 0.53 | | | | (1.46 | ) | | | (0.93 | ) | | | (0.18 | ) | | | — | | | | (0.18 | ) | |
| | 2009 | ^ | | | 9.45 | | | | 0.57 | | | | 1.50 | | | | 2.07 | | | | (0.53 | ) | | | — | | | | (0.53 | ) | |
| | 2010 | ^ | | | 10.99 | | | | 0.58 | | | | 0.39 | | | | 0.97 | | | | (0.70 | ) | | | — | | | | (0.70 | ) | |
| | 2011 | | | | 11.26 | | | | 0.57 | | | | (0.02 | ) | | | 0.55 | | | | (0.68 | ) | | | — | | | | (0.68 | ) | |
See Notes to Financial Statements
106
| | | | | | | | | RATIO TO AVERAGE
NET ASSETS(c) | | | | | |
FOR THE YEAR
DECEMBER 31 ENDED | | NET ASSET
VALUE
END OF
PERIOD | | TOTAL
RETURN(b) | | NET ASSETS
END OF
PERIOD
(000'S) | | EXPENSES | | NET
INVESTMENT
INCOME | | REBATE FROM
MORGAN STANLEY
AFFILIATE | | PORTFOLIO
TURNOVER
RATE | |
MONEY MARKET
CLASS X SHARES | |
| | 2007 | ^ | | $ | 1.00 | | | | 4.93 | %(d) | | $ | 111,478 | | | | 0.55 | % | | | 4.79 | % | | | — | | | | N/A | | |
| | 2008 | ^ | | | 1.00 | | | | 2.45 | | | | 115,415 | | | | 0.57 | | | | 2.40 | | | | — | | | | N/A | | |
| | 2009 | ^ | | | 1.00 | | | | 0.03 | | | | 84,486 | | | | 0.40 | (f)(g) | | | 0.03 | (f)(g) | | | — | | | | N/A | | |
| | 2010 | ^ | | | 1.00 | | | | 0.01 | | | | 59,932 | | | | 0.29 | (g) | | | 0.00 | (g)(h) | | | — | | | | N/A | | |
| | 2011 | | | | 1.00 | | | | 0.01 | | | | 51,431 | | | | 0.22 | (g) | | | 0.01 | (g) | | | — | | | | N/A | | |
| CLASS Y SHARES | |
| | 2007 | ^ | | | 1.00 | | | | 4.67 | (d) | | | 101,524 | | | | 0.80 | | | | 4.54 | | | | — | | | | N/A | | |
| | 2008 | ^ | | | 1.00 | | | | 2.19 | | | | 112,113 | | | | 0.82 | | | | 2.15 | | | | — | | | | N/A | | |
| | 2009 | ^ | | | 1.00 | | | | 0.01 | | | | 81,145 | | | | 0.41 | (f)(g) | | | 0.01 | (f)(g) | | | — | | | | N/A | | |
| | 2010 | ^ | | | 1.00 | | | | 0.01 | | | | 67,139 | | | | 0.29 | (g) | | | 0.00 | (g)(h) | | | — | | | | N/A | | |
| | 2011 | | | | 1.00 | | | | 0.01 | | | | 55,849 | | | | 0.22 | (g) | | | 0.01 | (g) | | | — | | | | N/A | | |
LIMITED DURATION
CLASS X SHARES | |
| | 2007 | ^ | | | 9.27 | | | | 2.95 | | | | 26,214 | | | | 0.47 | | | | 4.95 | | | | — | | | | 49 | % | |
| | 2008 | ^ | | | 7.76 | | | | (14.91 | ) | | | 16,405 | | | | 0.48 | (i) | | | 4.27 | (i) | | | 0.01 | % | | | 54 | | |
| | 2009 | ^ | | | 7.84 | | | | 5.76 | | | | 16,889 | | | | 0.49 | (i) | | | 2.61 | (i) | | | 0.00 | (h) | | | 105 | | |
| | 2010 | ^ | | | 7.74 | | | | 2.35 | | | | 14,921 | | | | 0.55 | (i) | | | 2.25 | (i) | | | 0.00 | (h) | | | 88 | | |
| | 2011 | | | | 7.69 | | | | 2.75 | | | | 12,693 | | | | 0.60 | (i) | | | 2.15 | (i) | | | 0.00 | (h) | | | 45 | | |
| CLASS Y SHARES | |
| | 2007 | ^ | | | 9.26 | | | | 2.80 | | | | 101,066 | | | | 0.72 | | | | 4.70 | | | | — | | | | 49 | | |
| | 2008 | ^ | | | 7.73 | | | | (15.22 | ) | | | 63,223 | | | | 0.73 | (i) | | | 4.02 | (i) | | | 0.01 | | | | 54 | | |
| | 2009 | ^ | | | 7.81 | | | | 5.56 | | | | 60,753 | | | | 0.74 | (i) | | | 2.36 | (i) | | | 0.00 | (h) | | | 105 | | |
| | 2010 | ^ | | | 7.72 | | | | 2.22 | | | | 53,760 | | | | 0.80 | (i) | | | 2.00 | (i) | | | 0.00 | (h) | | | 88 | | |
| | 2011 | | | | 7.67 | | | | 2.45 | | | | 44,085 | | | | 0.85 | (i) | | | 1.90 | (i) | | | 0.00 | (h) | | | 45 | | |
INCOME PLUS
CLASS X SHARES | |
| | 2007 | ^ | | | 10.56 | | | | 5.99 | | | | 155,879 | | | | 0.55 | | | | 5.02 | | | | — | | | | 125 | | |
| | 2008 | ^ | | | 9.45 | | | | (8.92 | ) | | | 109,833 | | | | 0.55 | (i) | | | 5.34 | (i) | | | 0.00 | (h) | | | 55 | | |
| | 2009 | ^ | | | 10.99 | | | | 22.57 | | | | 114,488 | | | | 0.56 | (i) | | | 5.64 | (i) | | | 0.00 | (h) | | | 75 | | |
| | 2010 | ^ | | | 11.26 | | | | 9.28 | | | | 106,363 | | | | 0.59 | (i) | | | 5.23 | (i) | | | 0.00 | (h) | | | 53 | | |
| | 2011 | | | | 11.13 | | | | 5.01 | | | | 90,876 | | | | 0.59 | (i) | | | 5.01 | (i) | | | 0.00 | (h) | | | 43 | | |
107
Morgan Stanley Variable Investment Series
Financial Highlights continued
| | | | | | | | | | | | | | | | |
FOR THE YEAR
DECEMBER 31 ENDED | | NET ASSET
VALUE
BEGINNING
OF PERIOD | | NET
INVESTMENT
INCOME(a) | | NET REALIZED
AND
UNREALIZED
GAIN (LOSS) | | TOTAL FROM
INVESTMENT
OPERATIONS | | DIVIDENDS
TO
SHAREHOLDERS | | DISTRIBUTIONS
TO
SHAREHOLDERS | | TOTAL
DIVIDENDS
AND
DISTRIBUTIONS | |
INCOME PLUS
CLASS Y SHARES | |
| | 2007 | ^ | | $ | 10.49 | | | $ | 0.50 | | | $ | 0.08 | | | $ | 0.58 | | | $ | (0.53 | ) | | | — | | | $ | (0.53 | ) | |
| | 2008 | ^ | | | 10.54 | | | | 0.51 | | | | (1.45 | ) | | | (0.94 | ) | | | (0.18 | ) | | | — | | | | (0.18 | ) | |
| | 2009 | ^ | | | 9.42 | | | | 0.55 | | | | 1.49 | | | | 2.04 | | | | (0.51 | ) | | | — | | | | (0.51 | ) | |
| | 2010 | ^ | | | 10.95 | | | | 0.55 | | | | 0.39 | | | | 0.94 | | | | (0.67 | ) | | | — | | | | (0.67 | ) | |
| | 2011 | | | | 11.22 | | | | 0.54 | | | | (0.02 | ) | | | 0.52 | | | | (0.65 | ) | | | — | | | | (0.65 | ) | |
GLOBAL INFRASTRUCTURE
CLASS X SHARES | |
| | 2007 | ^ | | | 19.44 | | | | 0.39 | | | | 3.38 | | | | 3.77 | | | | (0.39 | ) | | $ | (2.16 | ) | | | (2.55 | ) | |
| | 2008 | ^ | | | 20.66 | | | | 0.40 | | | | (6.21 | ) | | | (5.81 | ) | | | (0.11 | ) | | | (3.44 | ) | | | (3.55 | ) | |
| | 2009 | ^ | | | 11.30 | | | | 0.31 | | | | 1.16 | | | | 1.47 | | | | (0.38 | ) | | | (3.71 | ) | | | (4.09 | ) | |
| | 2010 | ^ | | | 8.68 | | | | 0.21 | | | | 0.18 | | | | 0.39 | | | | (0.25 | ) | | | (0.69 | ) | | | (0.94 | ) | |
| | 2011 | | | | 8.13 | | | | 0.21 | | | | 1.07 | | | | 1.28 | | | | (0.23 | ) | | | (0.46 | ) | | | (0.69 | ) | |
| CLASS Y SHARES | |
| | 2007 | ^ | | | 19.43 | | | | 0.34 | | | | 3.38 | | | | 3.72 | | | | (0.34 | ) | | | (2.16 | ) | | | (2.50 | ) | |
| | 2008 | ^ | | | 20.65 | | | | 0.35 | | | | (6.20 | ) | | | (5.85 | ) | | | (0.09 | ) | | | (3.44 | ) | | | (3.53 | ) | |
| | 2009 | ^ | | | 11.27 | | | | 0.28 | | | | 1.15 | | | | 1.43 | | | | (0.35 | ) | | | (3.71 | ) | | | (4.06 | ) | |
| | 2010 | ^ | | | 8.64 | | | | 0.19 | | | | 0.19 | | | | 0.38 | | | | (0.23 | ) | | | (0.69 | ) | | | (0.92 | ) | |
| | 2011 | | | | 8.10 | | | | 0.19 | | | | 1.06 | | | | 1.25 | | | | (0.20 | ) | | | (0.46 | ) | | | (0.66 | ) | |
EUROPEAN EQUITY
CLASS X SHARES | |
| | 2007 | ^ | | | 25.34 | | | | 0.47 | | | | 3.48 | | | | 3.95 | | | | (0.46 | ) | | | — | | | | (0.46 | ) | |
| | 2008 | ^ | | | 28.83 | | | | 0.63 | | | | (11.31 | ) | | | (10.68 | ) | | | (0.61 | ) | | | (4.22 | ) | | | (4.83 | ) | |
| | 2009 | ^ | | | 13.32 | | | | 0.36 | | | | 3.01 | | | | 3.37 | | | | (0.56 | ) | | | (0.71 | ) | | | (1.27 | ) | |
| | 2010 | ^ | | | 15.42 | | | | 0.26 | | | | 0.76 | | | | 1.02 | | | | (0.39 | ) | | | — | | | | (0.39 | ) | |
| | 2011 | | | | 16.05 | | | | 0.41 | | | | (1.90 | ) | | | (1.49 | ) | | | (0.37 | ) | | | — | | | | (0.37 | ) | |
| CLASS Y SHARES | |
| | 2007 | ^ | | | 25.19 | | | | 0.40 | | | | 3.46 | | | | 3.86 | | | | (0.40 | ) | | | — | | | | (0.40 | ) | |
| | 2008 | ^ | | | 28.65 | | | | 0.58 | | | | (11.25 | ) | | | (10.67 | ) | | | (0.52 | ) | | | (4.22 | ) | | | (4.74 | ) | |
| | 2009 | ^ | | | 13.24 | | | | 0.32 | | | | 3.00 | | | | 3.32 | | | | (0.50 | ) | | | (0.71 | ) | | | (1.21 | ) | |
| | 2010 | ^ | | | 15.35 | | | | 0.22 | | | | 0.76 | | | | 0.98 | | | | (0.35 | ) | | | — | | | | (0.35 | ) | |
| | 2011 | | | | 15.98 | | | | 0.37 | | | | (1.90 | ) | | | (1.53 | ) | | | (0.33 | ) | | | — | | | | (0.33 | ) | |
See Notes to Financial Statements
108
| | | | | | | | | RATIO TO AVERAGE
NET ASSETS(c) | | | | | |
FOR THE YEAR
DECEMBER 31 ENDED | | NET ASSET
VALUE
END OF
PERIOD | | TOTAL
RETURN(b) | | NET ASSETS
END OF
PERIOD
(000'S) | | EXPENSES | | NET
INVESTMENT
INCOME | | REBATE FROM
MORGAN STANLEY
AFFILIATE | | PORTFOLIO
TURNOVER
RATE | |
INCOME PLUS
CLASS Y SHARES | |
| | 2007 | ^ | | $ | 10.54 | | | | 5.73 | % | | $ | 196,774 | | | | 0.80 | % | | | 4.77 | % | | | — | | | | 125 | % | |
| | 2008 | ^ | | | 9.42 | | | | (9.11 | ) | | | 135,850 | | | | 0.80 | (i) | | | 5.09 | (i) | | | 0.00 | %(h) | | | 55 | | |
| | 2009 | ^ | | | 10.95 | | | | 22.29 | | | | 148,108 | | | | 0.81 | (i) | | | 5.39 | (i) | | | 0.00 | (h) | | | 75 | | |
| | 2010 | ^ | | | 11.22 | | | | 9.01 | | | | 124,322 | | | | 0.84 | (i) | | | 4.98 | (i) | | | 0.00 | (h) | | | 53 | | |
| | 2011 | | | | 11.09 | | | | 4.71 | | | | 102,948 | | | | 0.84 | (i) | | | 4.76 | (i) | | | 0.00 | (h) | | | 43 | | |
GLOBAL INFRASTRUCTURE
CLASS X SHARES | |
| | 2007 | ^ | | | 20.66 | | | | 20.34 | | | | 133,507 | | | | 0.70 | | | | 1.90 | | | | — | | | | 8 | | |
| | 2008 | ^ | | | 11.30 | | | | (33.27 | ) | | | 70,951 | | | | 0.74 | (i) | | | 2.46 | (i) | | | 0.00 | (h) | | | 76 | | |
| | 2009 | ^ | | | 8.68 | | | | 19.26 | | | | 68,748 | | | | 0.96 | (i) | | | 3.37 | (i) | | | 0.00 | (h) | | | 280 | | |
| | 2010 | ^ | | | 8.13 | | | | 6.93 | | | | 61,408 | | | | 0.87 | (i) | | | 2.71 | (i) | | | 0.00 | (h) | | | 148 | | |
| | 2011 | | | | 8.72 | | | | 16.07 | | | | 58,998 | | | | 0.86 | (i) | | | 2.48 | (i) | | | 0.00 | (h) | | | 36 | | |
| CLASS Y SHARES | |
| | 2007 | ^ | | | 20.65 | | | | 20.04 | | | | 31,780 | | | | 0.95 | | | | 1.65 | | | | — | | | | 8 | | |
| | 2008 | ^ | | | 11.27 | | | | (33.45 | ) | | | 16,545 | | | | 0.99 | (i) | | | 2.21 | (i) | | | 0.00 | (h) | | | 76 | | |
| | 2009 | ^ | | | 8.64 | | | | 18.83 | | | | 17,818 | | | | 1.21 | (i) | | | 3.12 | (i) | | | 0.00 | (h) | | | 280 | | |
| | 2010 | ^ | | | 8.10 | | | | 6.74 | | | | 15,789 | | | | 1.12 | (i) | | | 2.46 | (i) | | | 0.00 | (h) | | | 148 | | |
| | 2011 | | | | 8.69 | | | | 15.82 | | | | 14,472 | | | | 1.11 | (i) | | | 2.23 | (i) | | | 0.00 | (h) | | | 36 | | |
EUROPEAN EQUITY
CLASS X SHARES | |
| | 2007 | ^ | | | 28.83 | | | | 15.59 | | | | 127,071 | | | | 1.00 | (j) | | | 1.73 | (j) | | | — | | | | 41 | | |
| | 2008 | ^ | | | 13.32 | | | | (42.70 | ) | | | 57,734 | | | | 1.00 | (i)(j) | | | 3.01 | (i)(j) | | | 0.00 | (h) | | | 15 | | |
| | 2009 | ^ | | | 15.42 | | | | 27.73 | | | | 61,197 | | | | 1.00 | (i)(j) | | | 2.67 | (i)(j) | | | 0.00 | (h) | | | 26 | | |
| | 2010 | ^ | | | 16.05 | | | | 7.23 | (k) | | | 54,824 | | | | 1.00 | (i)(j) | | | 1.81 | (i)(j) | | | 0.00 | (h) | | | 22 | | |
| | 2011 | | | | 14.19 | | | | (9.64 | ) | | | 41,181 | | | | 1.00 | (i)(j) | | | 2.56 | (i)(j) | | | 0.00 | (h) | | | 11 | | |
| CLASS Y SHARES | |
| | 2007 | ^ | | | 28.65 | | | | 15.34 | | | | 40,721 | | | | 1.25 | (j) | | | 1.48 | (j) | | | — | | | | 41 | | |
| | 2008 | ^ | | | 13.24 | | | | (42.84 | ) | | | 17,845 | | | | 1.25 | (i)(j) | | | 2.76 | (i)(j) | | | 0.00 | (h) | | | 15 | | |
| | 2009 | ^ | | | 15.35 | | | | 27.41 | | | | 19,323 | | | | 1.25 | (i)(j) | | | 2.42 | (i)(j) | | | 0.00 | (h) | | | 26 | | |
| | 2010 | ^ | | | 15.98 | | | | 6.96 | (k) | | | 17,821 | | | | 1.25 | (i)(j) | | | 1.56 | (i)(j) | | | 0.00 | (h) | | | 22 | | |
| | 2011 | | | | 14.12 | | | | (9.85 | ) | | | 11,668 | | | | 1.25 | (i)(j) | | | 2.31 | (i)(j) | | | 0.00 | (h) | | | 11 | | |
109
Morgan Stanley Variable Investment Series
Financial Highlights continued
| | | | | | | | | | | | | | | | |
FOR THE YEAR
DECEMBER 31 ENDED | | NET ASSET
VALUE
BEGINNING
OF PERIOD | | NET
INVESTMENT
INCOME (LOSS)(a) | | NET REALIZED
AND
UNREALIZED
GAIN (LOSS) | | TOTAL FROM
INVESTMENT
OPERATIONS | | DIVIDENDS
TO
SHAREHOLDERS | | DISTRIBUTIONS
TO
SHAREHOLDERS | | TOTAL
DIVIDENDS
AND
DISTRIBUTIONS | |
MULTI CAP GROWTH
CLASS X SHARES | |
| | 2007 | ^ | | $ | 29.63 | | | $ | 0.21 | | | $ | 5.57 | | | $ | 5.78 | | | $ | (0.18 | ) | | | — | | | $ | (0.18 | ) | |
| | 2008 | ^ | | | 35.23 | | | | 0.03 | | | | (16.78 | ) | | | (16.75 | ) | | | (0.07 | ) | | | — | | | | (0.07 | ) | |
| | 2009 | ^ | | | 18.41 | | | | 0.11 | | | | 12.99 | | | | 13.10 | | | | (0.09 | ) | | | — | | | | (0.09 | ) | |
| | 2010 | ^ | | | 31.42 | | | | 0.06 | | | | 8.65 | | | | 8.71 | | | | (0.06 | ) | | | — | | | | (0.06 | ) | |
| | 2011 | | | | 40.07 | | | | 0.01 | | | | (2.70 | ) | | | (2.69 | ) | | | (0.07 | ) | | | — | | | | (0.07 | ) | |
| CLASS Y SHARES | |
| | 2007 | ^ | | | 29.43 | | | | 0.13 | | | | 5.54 | | | | 5.67 | | | | (0.04 | ) | | | — | | | | (0.04 | ) | |
| | 2008 | ^ | | | 35.06 | | | | (0.05 | ) | | | (16.67 | ) | | | (16.72 | ) | | | (0.05 | ) | | | — | | | | (0.05 | ) | |
| | 2009 | ^ | | | 18.29 | | | | 0.05 | | | | 12.90 | | | | 12.95 | | | | (0.03 | ) | | | — | | | | (0.03 | ) | |
| | 2010 | ^ | | | 31.21 | | | | (0.02 | ) | | | 8.58 | | | | 8.56 | | | | — | | | | — | | | | — | | |
| | 2011 | | | | 39.77 | | | | (0.09 | ) | | | (2.68 | ) | | | (2.77 | ) | | | — | | | | — | | | | — | | |
AGGRESSIVE EQUITY
CLASS X SHARES | |
| | 2007 | ^ | | | 14.85 | | | | 0.06 | | | | 2.86 | | | | 2.92 | | | | — | | | | — | | | | — | | |
| | 2008 | ^ | | | 17.77 | | | | (0.04 | ) | | | (8.63 | ) | | | (8.67 | ) | | | (0.03 | ) | | | — | | | | (0.03 | ) | |
| | 2009 | ^ | | | 9.07 | | | | 0.00 | | | | 6.30 | | | | 6.30 | | | | — | | | | — | | | | — | | |
| | 2010 | ^ | | | 15.37 | | | | (0.05 | ) | | | 4.05 | | | | 4.00 | | | | — | | | | — | | | | — | | |
| | 2011 | | | | 19.37 | | | | (0.09 | ) | | | (1.33 | ) | | | (1.42 | ) | | | — | | | | — | | | | — | | |
| CLASS Y SHARES | |
| | 2007 | ^ | | | 14.65 | | | | 0.02 | | | | 2.82 | | | | 2.84 | | | | — | | | | — | | | | — | | |
| | 2008 | ^ | | | 17.49 | | | | (0.08 | ) | | | (8.49 | ) | | | (8.57 | ) | | | — | | | | — | | | | — | | |
| | 2009 | ^ | | | 8.92 | | | | (0.03 | ) | | | 6.19 | | | | 6.16 | | | | — | | | | — | | | | — | | |
| | 2010 | ^ | | | 15.08 | | | | (0.09 | ) | | | 3.97 | | | | 3.88 | | | | — | | | | — | | | | — | | |
| | 2011 | | | | 18.96 | | | | (0.14 | ) | | | (1.30 | ) | | | (1.44 | ) | | | — | | | | — | | | | — | | |
STRATEGIST
CLASS X SHARES | |
| | 2007 | ^ | | | 16.53 | | | | 0.46 | | | | 0.92 | | | | 1.38 | | | | (0.46 | ) | | $ | (1.90 | ) | | | (2.36 | ) | |
| | 2008 | ^ | | | 15.55 | | | | 0.30 | | | | (3.76 | ) | | | (3.46 | ) | | | (0.10 | ) | | | (1.39 | ) | | | (1.49 | ) | |
| | 2009 | ^ | | | 10.60 | | | | 0.16 | | | | 1.90 | | | | 2.06 | | | | (0.26 | ) | | | — | | | | (0.26 | ) | |
| | 2010 | ^ | | | 12.40 | | | | 0.24 | | | | 0.59 | | | | 0.83 | | | | (0.20 | ) | | | (0.07 | ) | | | (0.27 | ) | |
| | 2011 | | | | 12.96 | | | | 0.18 | | | | (1.06 | ) | | | (0.88 | ) | | | (0.27 | ) | | | (1.41 | ) | | | (1.68 | ) | |
See Notes to Financial Statements
110
| | | | | | | | | RATIO TO AVERAGE
NET ASSETS(c) | | | | | |
FOR THE YEAR
DECEMBER 31 ENDED | | NET ASSET
VALUE
END OF
PERIOD | | TOTAL
RETURN(b) | | NET ASSETS
END OF
PERIOD
(000'S) | | EXPENSES | | NET
INVESTMENT
INCOME (LOSS) | | REBATE FROM
MORGAN STANLEY
AFFILIATE | | PORTFOLIO
TURNOVER
RATE | |
MULTI CAP GROWTH
CLASS X SHARES | |
| | 2007 | ^ | | $ | 35.23 | | | | 19.54 | % | | $ | 331,243 | | | | 0.54 | % | | | 0.66 | % | | | — | | | | 55 | % | |
| | 2008 | ^ | | | 18.41 | | | | (47.62 | ) | | | 140,041 | | | | 0.55 | (i) | | | 0.08 | (i) | | | 0.01 | % | | | 33 | | |
| | 2009 | ^ | | | 31.42 | | | | 71.32 | | | | 202,279 | | | | 0.55 | (i) | | | 0.44 | (i) | | | 0.00 | (h) | | | 23 | | |
| | 2010 | ^ | | | 40.07 | | | | 27.76 | | | | 220,553 | | | | 0.58 | (i) | | | 0.19 | (i) | | | 0.00 | (h) | | | 29 | | |
| | 2011 | | | | 37.31 | | | | (6.74 | ) | | | 173,284 | | | | 0.56 | (i) | | | 0.03 | (i) | | | 0.00 | (h) | | | 24 | | |
| CLASS Y SHARES | |
| | 2007 | ^ | | | 35.06 | | | | 19.24 | | | | 107,710 | | | | 0.79 | | | | 0.41 | | | | — | | | | 55 | | |
| | 2008 | ^ | | | 18.29 | | | | (47.75 | ) | | | 45,671 | | | | 0.80 | (i) | | | (0.17 | )(i) | | | 0.01 | | | | 33 | | |
| | 2009 | ^ | | | 31.21 | | | | 70.85 | | | | 64,122 | | | | 0.80 | (i) | | | 0.19 | (i) | | | 0.00 | (h) | | | 23 | | |
| | 2010 | ^ | | | 39.77 | | | | 27.43 | | | | 67,303 | | | | 0.83 | (i) | | | (0.06 | )(i) | | | 0.00 | (h) | | | 29 | | |
| | 2011 | | | | 37.00 | | | | (6.97 | ) | | | 49,678 | | | | 0.81 | (i) | | | (0.22 | )(i) | | | 0.00 | (h) | | | 24 | | |
AGGRESSIVE EQUITY
CLASS X SHARES | |
| | 2007 | ^ | | | 17.77 | | | | 19.66 | | | | 26,035 | | | | 0.87 | | | | 0.34 | | | | — | | | | 56 | | |
| | 2008 | ^ | | | 9.07 | | | | (48.86 | ) | | | 10,289 | | | | 0.90 | (i) | | | (0.29 | )(i) | | | 0.00 | (h) | | | 33 | | |
| | 2009 | ^ | | | 15.37 | | | | 69.46 | | | | 14,898 | | | | 1.01 | (i) | | | (0.02 | )(i) | | | 0.01 | | | | 23 | | |
| | 2010 | ^ | | | 19.37 | | | | 26.02 | | | | 15,413 | | | | 1.09 | (i) | | | (0.32 | )(i) | | | 0.00 | (h) | | | 27 | | |
| | 2011 | | | | 17.95 | | | | (7.33 | ) | | | 12,078 | | | | 1.06 | (i) | | | (0.47 | )(i) | | | 0.00 | (h) | | | 28 | | |
| CLASS Y SHARES | |
| | 2007 | ^ | | | 17.49 | | | | 19.39 | | | | 29,837 | | | | 1.12 | | | | 0.09 | | | | — | | | | 56 | | |
| | 2008 | ^ | | | 8.92 | | | | (49.00 | ) | | | 12,272 | | | | 1.15 | (i) | | | (0.54 | )(i) | | | 0.00 | (h) | | | 33 | | |
| | 2009 | ^ | | | 15.08 | | | | 69.06 | | | | 17,541 | | | | 1.26 | (i) | | | (0.27 | )(i) | | | 0.01 | | | | 23 | | |
| | 2010 | ^ | | | 18.96 | | | | 25.73 | | | | 18,777 | | | | 1.34 | (i) | | | (0.57 | )(i) | | | 0.00 | (h) | | | 27 | | |
| | 2011 | | | | 17.52 | | | | (7.59 | ) | | | 15,821 | | | | 1.31 | (i) | | | (0.72 | )(i) | | | 0.00 | (h) | | | 28 | | |
STRATEGIST
CLASS X SHARES | |
| | 2007 | ^ | | | 15.55 | | | | 8.63 | | | | 217,265 | | | | 0.54 | | | | 2.84 | | | | — | | | | 34 | | |
| | 2008 | ^ | | | 10.60 | | | | (23.98 | ) | | | 134,668 | | | | 0.54 | (i) | | | 2.28 | (i) | | | 0.02 | | | | 52 | | |
| | 2009 | ^ | | | 12.40 | | | | 19.74 | | | | 137,731 | | | | 0.55 | (i) | | | 1.41 | (i) | | | 0.03 | | | | 96 | | |
| | 2010 | ^ | | | 12.96 | | | | 6.81 | | | | 128,254 | | | | 0.59 | (i) | | | 1.89 | (i) | | | 0.02 | | | | 119 | | |
| | 2011 | | | | 10.40 | | | | (7.96 | ) | | | 97,169 | | | | 0.59 | (i) | | | 1.52 | (i) | | | 0.02 | | | | 121 | | |
111
Morgan Stanley Variable Investment Series
Financial Highlights continued
| | | | | | | | | | | | | | | | |
FOR THE YEAR
DECEMBER 31 ENDED | | NET ASSET
VALUE
BEGINNING
OF PERIOD | | NET
INVESTMENT
INCOME (LOSS)(a) | | NET REALIZED
AND
UNREALIZED
GAIN (LOSS) | | TOTAL FROM
INVESTMENT
OPERATIONS | | DIVIDENDS
TO
SHAREHOLDERS | | DISTRIBUTIONS
TO
SHAREHOLDERS | | TOTAL
DIVIDENDS
AND
DISTRIBUTIONS | |
STRATEGIST
CLASS Y SHARES | |
| | 2007 | ^ | | $ | 16.51 | | | $ | 0.42 | | | $ | 0.92 | | | $ | 1.34 | | | $ | (0.42 | ) | | $ | (1.90 | ) | | $ | (2.32 | ) | |
| | 2008 | ^ | | | 15.53 | | | | 0.27 | | | | (3.76 | ) | | | (3.49 | ) | | | (0.09 | ) | | | (1.39 | ) | | | (1.48 | ) | |
| | 2009 | ^ | | | 10.56 | | | | 0.13 | | | | 1.89 | | | | 2.02 | | | | (0.23 | ) | | | — | | | | (0.23 | ) | |
| | 2010 | ^ | | | 12.35 | | | | 0.21 | | | | 0.58 | | | | 0.79 | | | | (0.17 | ) | | | (0.07 | ) | | | (0.24 | ) | |
| | 2011 | | | | 12.90 | | | | 0.15 | | | | (1.05 | ) | | | (0.90 | ) | | | (0.23 | ) | | | (1.41 | ) | | | (1.64 | ) | |
^ Beginning with the year ended December 31, 2011, the Fund was audited by Ernst & Young LLP. The previous years were audited by another independent registered public accounting firm.
(a) The per share amounts were computed using an average number of shares outstanding during the period.
(b) Calculated based on the net asset value as of the last business day of the period. Performance shown does not reflect fees and expenses imposed by your insurance company. If performance information included the effect of these additional charges, the total returns would be lower.
(c) Reflects overall Portfolio ratios for investment income and non-class specific expenses.
(d) The Adviser fully reimbursed the Portfolio for losses incurred resulting from the disposal of an investment. Without this reimbursement, the total return was 4.79% and 4.52% for Class X and Y, respectively.
(e) Amount is less than $0.001.
(f) Reflects fees paid in connection with the U.S. Treasury's Temporary Guarantee Program for Money Market Funds. This fee had an effect of 0.04% for the year ended 2009.
(g) If the Portfolio had borne all of its expenses that were reimbursed or waived by the Distributor, Adviser, and Administrator, the annualized expense and net investment loss ratios, would have been as follows:
| PERIOD ENDED | | EXPENSE
RATIO | | NET INVESTMENT LOSS
RATIO | |
| December 31, 2011 | | | | | | | | | |
| Class X | | | 0.60 | % | | | (0.37 | )% | |
| Class Y | | | 0.85 | | | | (0.62 | ) | |
| December 31, 2010 | | | | | | | | | |
| Class X | | | 0.62 | | | | (0.33 | ) | |
| Class Y | | | 0.87 | | | | (0.58 | ) | |
| December 31, 2009 | | | | | | | | | |
| Class X | | | 0.59 | | | | (0.16 | ) | |
| Class Y | | | 0.84 | | | | (0.42 | ) | |
See Notes to Financial Statements
112
| | | | | | | | | RATIO TO AVERAGE
NET ASSETS(c) | | | | | |
FOR THE YEAR
DECEMBER 31 ENDED | | NET ASSET
VALUE
END OF
PERIOD | | TOTAL
RETURN(b) | | NET ASSETS
END OF
PERIOD
(000'S) | | EXPENSES | | NET
INVESTMENT
INCOME | | REBATE FROM
MORGAN STANLEY
AFFILIATE | | PORTFOLIO
TURNOVER
RATE | |
STRATEGIST
CLASS Y SHARES | |
| | 2007 | ^ | | $ | 15.53 | | | | 8.37 | % | | $ | 88,651 | | | | 0.79 | % | | | 2.59 | % | | | — | | | | 34 | % | |
| | 2008 | ^ | | | 10.56 | | | | (24.20 | ) | | | 53,046 | | | | 0.79 | (i) | | | 2.03 | (i) | | | 0.02 | % | | | 52 | | |
| | 2009 | ^ | | | 12.35 | | | | 19.44 | | | | 59,737 | | | | 0.80 | (i) | | | 1.16 | (i) | | | 0.03 | | | | 96 | | |
| | 2010 | ^ | | | 12.90 | | | | 6.50 | | | | 56,361 | | | | 0.84 | (i) | | | 1.64 | (i) | | | 0.02 | | | | 119 | | |
| | 2011 | | | | 10.36 | | | | (8.13 | ) | | | 39,844 | | | | 0.84 | (i) | | | 1.27 | (i) | | | 0.02 | | | | 121 | | |
(h) Amount is less than 0.005%.
(i) The ratios reflect the rebate of certain Portfolio expenses in connection with investments in a Morgan Stanley affiliate during the period. The effect of the rebate on the ratios is disclosed in the above table as "Rebate from Morgan Stanley affiliate."
(j) If the Portfolio had borne all of its expenses that were reimbursed or waived by the Adviser and Administrator, the annualized expense and net investment income ratios, would have been as follows:
| PERIOD ENDED | | EXPENSE
RATIO | | NET INVESTMENT INCOME
RATIO | |
| December 31, 2011 | | | | | | | | | |
| Class X | | | 1.17 | % | | | 2.39 | % | |
| Class Y | | | 1.42 | | | | 2.14 | | |
| December 31, 2010 | | | | | | | | | |
| Class X | | | 1.16 | | | | 1.65 | | |
| Class Y | | | 1.41 | | | | 1.40 | | |
| December 31, 2009 | | | | | | | | | |
| Class X | | | 1.12 | | | | 2.55 | | |
| Class Y | | | 1.37 | | | | 2.30 | | |
| December 31, 2008 | | | | | | | | | |
| Class X | | | 1.08 | | | | 2.93 | | |
| Class Y | | | 1.33 | | | | 2.68 | | |
| December 31, 2007 | | | | | | | | | |
| Class X | | | 1.04 | | | | 1.69 | | |
| Class Y | | | 1.29 | | | | 1.44 | | |
(k) During the year ended December 31, 2010, the Portfolio received a regulatory settlement from an unaffiliated third party which had an impact of approximately 0.14% and 0.14% for Class X and Y, respectively, on the total return. This was a one-time settlement, and as a result, the impact on the NAV and consequently the performance will not likely be repeated in the future. Had this settlement not occurred, the total return for Class X and Y shares would have been approximately 7.09% and 6.82%, respectively.
113
Morgan Stanley Variable Investment Series
Report of Independent Registered Public Accounting Firm
To the Shareholders and Board of Trustees of
Morgan Stanley Variable Investment Series:
We have audited the accompanying statements of assets and liabilities of Money Market Portfolio, Limited Duration Portfolio, Income Plus Portfolio, Global Infrastructure Portfolio, European Equity Portfolio, Multi Cap Growth Portfolio, Aggressive Equity Portfolio, and Strategist Portfolio (the "Portfolios") (eight of the portfolios comprising Morgan Stanley Variable Investment Series), including the portfolios of investments, as of December 31, 2011, and the related statements of operations and changes in net assets and the financial highlights for the year then ended. These financial statements and financial highlights are the responsibility of the Portfolios' management. Our responsibility is to express an opinion on these financial statements and financial highlights based on our audits. The statements of changes in net assets for the year ended December 31, 2010 and the financial highlights for the four years ended December 31, 2010 were audited by another independent registered public accounting firm whose report, dated February 25, 2011, expressed an unqualified opinion on those statements of changes in net assets and financial highlights.
We conducted our audits in accordance with the standards of the Public Company Accounting Oversight Board (United States). Those standards require that we plan and perform the audit to obtain reasonable assurance about whether the financial statements and financial highlights are free of material misstatement. We were not engaged to perform an audit of the Portfolios' internal control over financial reporting. Our audits included consideration of internal control over financial reporting as a basis for designing audit procedures that are appropriate in the circumstances, but not for the purpose of expressing an opinion on the effectiveness of the Portfolios' internal control over financial reporting. Accordingly, we express no such opinion. An audit also includes examining, on a test basis, evidence supporting the amounts and disclosures in the financial statements, assessing the accounting principles used and significant estimates made by management, as well as evaluating the overall financial statement presentation. Our procedures included confirmation of securities owned as of December 31, 2011, by correspondence with the custodian and others or by other appropriate auditing procedures where replies from others were not received. We believe that our audits provide a reasonable basis for our opinion.
In our opinion, the financial statements and financial highlights referred to above present fairly, in all material respects, the financial position of the aforementioned portfolios constituting Morgan Stanley Variable Investment Series as of December 31, 2011, the results of their operations, the changes in their net assets, and the financial highlights for the year then ended, in conformity with U.S. generally accepted accounting principles.

Boston, Massachusetts
February 17, 2012
114
Morgan Stanley Variable Investment Series
Trustee and Officer Information (unaudited)
Independent Trustees:
Name, Age and Address of
Independent Trustee | | Position(s)
Held with
Registrant | | Length of
Time Served* | | Principal Occupation(s)
During Past 5 Years | | Number of
Portfolios
in Fund
Complex
Overseen by
Independent
Trustee** | | Other Directorships
Held by Independent Trustee*** | |
Frank L. Bowman (67)
c/o Kramer Levin Naftalis & Frankel LLP
Counsel to the Independent Trustees
1177 Avenue of the Americas
New York, NY 10036 | | Trustee | | Since
August 2006 | | President, Strategic Decisions, LLC (consulting) (since February 2009); Director or Trustee of various Morgan Stanley Funds (since August 2006); Chairperson of the Insurance Sub-Committee of the Compliance and Insurance Committee (since February 2007); served as President and Chief Executive Officer of the Nuclear Energy Institute (policy organization) (February 2005-November 2008); retired as Admiral, U.S. Navy after serving over 38 years on active duty including 8 years as Director of the Naval Nuclear Propulsion Program in the Department of the Navy and the U.S. Department of Energy (1996-2004); served as Chief of Naval Personnel (July 1994-September 1996); and on the Joint Staff as Director of Political Military Affairs (June 1992-July 1994); Knighted as Honorary Knight Commander of the Most Excellent Order of the British Empire; Awarded the Officer de l'Orde National du Mérite by the French Government; elected to the National Academy of Engineering (2009). | | | 102 | | | Director of BP p.l.c.; Director of Naval and Nuclear Technologies LLP; Director of the Armed Services YMCA of the USA and the Naval Submarine League; Director of the American Shipbuilding Suppliers Association; Member of the National Security Advisory Council of the Center for U.S. Global Engagement and a member of the CNA Military Advisory Board. Member of the American Lung Association's President's Council. | |
|
Michael Bozic (71)
c/o Kramer Levin Naftalis & Frankel LLP
Counsel to the Independent Trustees
1177 Avenue of the Americas
New York, NY 10036 | | Trustee | | Since
April 1994 | | Private investor; Chairperson of the Compliance and Insurance Committee (since October 2006); Director or Trustee of various Morgan Stanley Funds (since April 1994); formerly, Chairperson of the Insurance Committee (July 2006-September 2006); Vice Chairman of Kmart Corporation (December 1998-October 2000), Chairman and Chief Executive Officer of Levitz Furniture Corporation (November 1995-November 1998) and President and Chief Executive Officer of Hills Department Stores (May 1991-July 1995); variously Chairman, Chief Executive Officer, President and Chief Operating Officer (1987-1991) of the Sears Merchandise Group of Sears, Roebuck & Co. | | | 104 | | | Director of various business
organizations. | |
|
115
Morgan Stanley Variable Investment Series
Trustee and Officer Information (unaudited) continued
Name, Age and Address of
Independent Trustee | | Position(s)
Held with
Registrant | | Length of
Time Served* | | Principal Occupation(s)
During Past 5 Years | | Number of
Portfolios
in Fund
Complex
Overseen by
Independent
Trustee** | | Other Directorships
Held by Independent Trustee*** | |
Kathleen A. Dennis (58)
c/o Kramer Levin Naftalis & Frankel LLP
Counsel to the Independent Trustees
1177 Avenue of the Americas
New York, NY 10036 | | Trustee | | Since
August 2006 | | President, Cedarwood Associates (mutual fund and investment management consulting) (since July 2006); Chairperson of the Money Market and Alternatives Sub-Committee of the Investment Committee (since October 2006) and Director or Trustee of various Morgan Stanley Funds (since August 2006); formerly, Senior Managing Director of Victory Capital Management (1993-2006). | | | 102 | | | Director of various non-profit organizations. | |
|
Dr. Manuel H. Johnson (63)
c/o Johnson Smick Group, Inc.
888 16th Street, N.W.
Suite 740
Washington, D.C. 20006 | | Trustee | | Since
July 1991 | | Senior Partner, Johnson Smick International, Inc. (consulting firm); Chairperson of the Investment Committee (since October 2006) and Director or Trustee of various Morgan Stanley Funds (since July 1991); Co-Chairman and a founder of the Group of Seven Council (G7C) (international economic commission); formerly, Chairperson of the Audit Committee (July 1991-September 2006), Vice Chairman of the Board of Governors of the Federal Reserve System and Assistant Secretary of the U.S. Treasury. | | | 104 | | | Director of NVR, Inc. (home construction). | |
|
Joseph J. Kearns (69)
c/o Kearns & Associates LLC
PMB754
22631 Pacific Coast Highway
Malibu, CA 90265 | | Trustee | | Since
August 1994 | | President, Kearns & Associates LLC (investment consulting); Chairperson of the Audit Committee (since October 2006) and Director or Trustee of various Morgan Stanley Funds (since August 1994); formerly, Deputy Chairperson of the Audit Committee (July 2003-September 2006) and Chairperson of the Audit Committee of various Morgan Stanley Funds (since August 1994); CFO of the J. Paul Getty Trust. | | | 105 | | | Director of Electro Rent Corporation (equipment leasing) and The Ford Family Foundation. | |
|
116
Morgan Stanley Variable Investment Series
Trustee and Officer Information (unaudited) continued
Name, Age and Address of
Independent Trustee | | Position(s)
Held with
Registrant | | Length of
Time Served* | | Principal Occupation(s)
During Past 5 Years | | Number of
Portfolios
in Fund
Complex
Overseen by
Independent
Trustee** | | Other Directorships
Held by Independent Trustee*** | |
Michael F. Klein (53)
c/o Kramer Levin Naftalis & Frankel LLP
Counsel to the Independent Trustees
1177 Avenue of the Americas
New York, NY 10036 | | Trustee | | Since
August 2006 | | Managing Director, Aetos Capital, LLC (since March 2000) and Co-President, Aetos Alternatives Management, LLC (since January 2004); Chairperson of the Fixed Income Sub-Committee of the Investment Committee (since October 2006) and Director or Trustee of various Morgan Stanley Funds (since August 2006); formerly, Managing Director, Morgan Stanley & Co. Inc. and Morgan Stanley Dean Witter Investment Management, President, various Morgan Stanley Funds (June 1998-March 2000) and Principal, Morgan Stanley & Co. Inc. and Morgan Stanley Dean Witter Investment Management (August 1997-December 1999). | | | 102 | | | Director of certain investment funds managed or sponsored by Aetos Capital, LLC. Director of Sanitized AG and Sanitized Marketing AG (specialty chemicals). | |
|
Michael E. Nugent (75)
c/o Triumph Capital, L.P.
445 Park Avenue
New York, NY 10022 | | Chairperson of the Board and Trustee | | Chairperson of the Boards since July 2006 and Trustee since July 1991 | | General Partner, Triumph Capital, L.P. (private investment partnership); Chairperson of the Boards of various Morgan Stanley Funds (since July 2006); Director or Trustee of various Morgan Stanley Funds (since July 1991); formerly, Chairperson of the Insurance Committee (until July 2006). | | | 104 | | | None. | |
|
117
Morgan Stanley Variable Investment Series
Trustee and Officer Information (unaudited) continued
Name, Age and Address of
Independent Trustee | | Position(s)
Held with
Registrant | | Length of
Time Served* | | Principal Occupation(s)
During Past 5 Years | | Number of
Portfolios
in Fund
Complex
Overseen by
Independent
Trustee** | | Other Directorships
Held by Independent Trustee*** | |
W. Allen Reed (64)
c/o Kramer Levin Naftalis & Frankel LLP
Counsel to the Independent Trustees
1177 Avenue of the Americas
New York, NY 10036 | | Trustee | | Since
August 2006 | | Chairperson of the Equity Sub-Committee of the Investment Committee (since October 2006) and Director or Trustee of various Morgan Stanley Funds (since August 2006); formerly, President and CEO of General Motors Asset Management; Chairman and Chief Executive Officer of the GM Trust Bank and Corporate Vice President of General Motors Corporation (August 1994-December 2005). | | | 102 | | | Director of Temple-Inland Industries (packaging and forest products); Director of Legg Mason, Inc. and Director of the Auburn University Foundation. | |
|
Fergus Reid (79)
c/o Joe Pietryka, Inc.
85 Charles Colman Blvd.
Pawling, NY 12564 | | Trustee | | Since
June 1992 | | Chairman, Joe Pietryka, Inc.; Chairperson of the Governance Committee and Director or Trustee of various Morgan Stanley Funds (since June 1992). | | | 105 | | | Trustee and Director of certain investment companies in the JPMorgan Funds complex managed by JP Morgan Investment Management Inc. | |
|
Interested Trustee:
Name, Age and Address of
Interested Trustee | | Position(s)
Held with
Registrant | | Length of
Time Served* | | Principal Occupation(s)
During Past 5 Years | | Number of
Portfolios
in Fund
Complex
Overseen by
Interested
Trustee** | | Other Directorships
Held by Interested Trustee*** | |
James F. Higgins (64)
c/o Morgan Stanley Services Company Inc.
Harborside Financial Center
201 Plaza Two
Jersey City, NJ 07311 | | Trustee | | Since
June 2000 | | Director or Trustee of various Morgan Stanley Funds (since June 2000); Senior Advisor of Morgan Stanley (since August 2000). | | | 103 | | | Director of AXA Financial, Inc. and The Equitable Life Assurance Society of the United States (financial services). | |
|
* Each Trustee serves an indefinite term, until his or her successor is elected.
** The Fund Complex includes (as of December 31, 2011) all open-end and closed-end funds (including all of their portfolios) advised by Morgan Stanley Investment Management Inc. (the "Adviser") and any funds that have an adviser that is an affiliated person of the Adviser (including, but not limited to, Morgan Stanley AIP GP LP).
*** This includes any directorships at public companies and registered investment companies held by the Trustee at any time during the past five years.
118
Morgan Stanley Variable Investment Series
Trustee and Officer Information (unaudited) continued
Executive Officers:
Name, Age and Address of
Executive Officer | | Position(s)
Held with
Registrant | | Length of
Time Served* | | Principal Occupation(s) During Past 5 Years | |
Arthur Lev (50)
522 Fifth Avenue
New York, NY 10036 | | President and Principal Executive Officer – Equity and Fixed Income Funds | | Since June 2011 | | President and Principal Executive Officer (since June 2011) of the Equity and Fixed Income Funds in the Fund Complex; Head of the Long Only Business of Morgan Stanley Investment Management (since February 2011); Managing Director of the Adviser and various entities affiliated with the Adviser (since December 2006). Formerly, Chief Strategy Officer of Morgan Stanley Investment Management Traditional Asset Management business (November 2010-February 2011); General Counsel of Morgan Stanley Investment Management (December 2006-October 2010); Partner and General Counsel of FrontPoint Partners LLC (July 2002-December 2006); Managing Director and General Counsel of Morgan Stanley Investment Management (May 2000-June 2002). | |
|
Mary Ann Picciotto (38)
c/o Morgan Stanley Services
Company Inc.
Harborside Financial Center
201 Plaza Two
Jersey City, NJ 07311 | | Chief Compliance Officer | | Since May 2010 | | Managing Director of the Adviser and various entities affiliated with the Adviser; Chief Compliance Officer of various Morgan Stanley Funds (since May 2010); Chief Compliance Officer of the Adviser (since April 2007). | |
|
Stefanie V. Chang Yu (45)
522 Fifth Avenue
New York, NY 10036 | | Vice President | | Since December 1997 | | Managing Director of the Adviser and various entities affiliated with the Adviser; Vice President of various Morgan Stanley Funds (since December 1997). | |
|
Francis J. Smith (46)
c/o Morgan Stanley Services Company Inc.
Harborside Financial Center
201 Plaza Two
Jersey City, NJ 07311 | | Treasurer and Principal Financial
Officer | | Treasurer since July 2003 and Principal Financial Officer since September 2002 | | Executive Director of the Adviser and various entities affiliated with the Adviser; Treasurer and Principal Financial Officer of various Morgan Stanley Funds (since July 2003). | |
|
Mary E. Mullin (44)
522 Fifth Avenue
New York, NY 10036 | | Secretary | | Since June 1999 | | Executive Director of the Adviser and various entities affiliated with the Adviser; Secretary of various Morgan Stanley Funds (since June 1999). | |
|
* Each officer serves an indefinite term, until his or her successor is elected.
119
Morgan Stanley Variable Investment Series
Federal Tax Notice n December 31, 2011 (unaudited)
For Federal income tax purposes, the following information is furnished with respect to the distributions paid by each applicable Portfolio during the taxable year ended December 31, 2011. For corporate shareholders, the following percentages of dividends paid by each of the applicable Portfolios qualified for the dividends received deduction.
| FUND | | DIVIDENDS RECEIVED
DEDUCTION% | |
| Global Infrastructure Portfolio | | | 34.92 | % | |
| Multi Cap Growth Portfolio | | | 100.00 | % | |
| Strategist Portfolio | | | 50.55 | % | |
Each of the applicable Portfolios designated and paid the following amounts as a long-term capital gain distribution:
| FUND | | AMOUNT | |
| Global Infrastructure Portfolio | | $ | 3,948,735 | | |
| Strategist Portfolio | | | 15,665,688 | | |
For Federal income tax purposes, the following information is furnished with respect to the earnings of each applicable Portfolio for the taxable year ended December 31, 2011. The European Equity Portfolio intends to pass through foreign tax credits of $92,644, and has derived income from sources within foreign countries amounting to $2,427,065. The Global Infrastructure Portfolio intends to pass through foreign tax credits of $104,375, and has derived income from sources within foreign countries amounting to $2,018,304.
120
| Trustees | |
| Frank L. Bowman | | Joseph J. Kearns | |
|
| Michael Bozic | | Michael F. Klein | |
|
| Kathleen A. Dennis | | Michael E. Nugent | |
|
| James F. Higgins | | W. Allen Reed | |
|
| Dr. Manuel H. Johnson | | Fergus Reid | |
|
| Officers | |
Michael E. Nugent
Chairperson of the Board | |
|
Arthur Lev
President and Principal Executive Officer | |
|
Mary Ann Picciotto
Chief Compliance Officer | |
|
Stefanie V. Chang Yu
Vice President | |
|
Francis J. Smith
Treasurer and Principal Financial Officer | |
|
Mary E. Mullin
Secretary | |
|
| Transfer Agent | | Custodian | |
Morgan Stanley Services Company Inc.
P.O. Box 219886
Kansas City, Missouri 64121 | | State Street Bank and Trust Company
One Lincoln Street
Boston, Massachusetts 02111 | |
|
| Independent Registered Public Accounting Firm | | Legal Counsel | |
Ernst & Young LLP
200 Clarendon Street
Boston, Massachusetts 02116 | | Dechert LLP
1095 Avenue of the Americas
New York, New York 10036 | |
|
| Counsel to the Independent Trustees | | Investment Adviser | |
Kramer Levin Naftalis & Frankel LLP
1177 Avenue of the Americas
New York, New York 10036 | | Morgan Stanley Investment Management Inc.
522 Fifth Avenue
New York, New York 10036 | |
|
Sub-Adviser (Global Infrastructure and
European Equity) | |
Morgan Stanley Investment Management Limited
25 Cabot Square, Canary Wharf
London, E14 4QA, England | |
|
Morgan Stanley Investment Management Company
23 Church Street
16-01 Capital Square 049481 Singapore | |
|
This report is submitted for the general information of shareholders of the Fund. For more detailed information about the Fund, its fees and expenses and other pertinent information, please read its Prospectus. The Fund's Statement of Additional Information contains additional information about the Fund, including its trustees. It is available without charge, by calling (800) 869-NEWS.
This report is not authorized for distribution to prospective investors in the Fund unless preceded or accompanied by an effective Prospectus. Read the Prospectus carefully before investing.
Morgan Stanley Distribution, Inc., member FINRA.
VARINANN
IU12-00299P-Y12/11
#40113A
MORGAN STANLEY
VARIABLE INVESTMENT SERIES
Semi-Annual Report
JUNE 30, 2012
The Portfolios are intended to be the funding vehicle for variable annuity contracts and variable life insurance policies offered by the separate accounts of certain life insurance companies.
Morgan Stanley Variable Investment Series
Table of Contents
| Letter to the Shareholders | | | 1 | | |
|
| Fund Performance | | | 15 | | |
|
| Expense Examples | | | 17 | | |
|
| Investment Advisory Agreement Approval | | | 21 | | |
|
| Portfolio of Investments: | |
|
| Money Market | | | 25 | | |
|
| Limited Duration | | | 28 | | |
|
| Income Plus | | | 35 | | |
|
| Global Infrastructure | | | 46 | | |
|
| European Equity | | | 49 | | |
|
| Multi Cap Growth | | | 52 | | |
|
| Aggressive Equity | | | 55 | | |
|
| Strategist | | | 58 | | |
|
| Financial Statements: | |
|
| Statements of Assets and Liabilities | | | 68 | | |
|
| Statements of Operations | | | 70 | | |
|
| Statements of Changes in Net Assets | | | 72 | | |
|
| Notes to Financial Statements | | | 80 | | |
|
| Financial Highlights | | | 110 | | |
|
Morgan Stanley Variable Investment Series
Letter to the Shareholders n June 30, 2012 (unaudited)
Dear Shareholder:
After starting the year on a relatively optimistic note, financial markets endured some disappointments but ultimately finished the six-month period ended June 30, 2012 mostly higher. While sluggish economic growth across Europe was expected given the ongoing debt crisis and the resulting austerity measures, indications of slowing in the U.S. and China further tempered investors' outlooks on the global economy. Some progress was made on containing Europe's debt woes, including the European Central Bank's (ECB) two long-term refinancing operations (or LTROs, in December 2011 and February 2012), which provided three-year loans to European banks, and coordinated monetary policy responses from central banks around the world, which boosted liquidity in the system. However, Greece's embattled legislative election in the spring and a bank bailout in Spain were a reminder that many fundamental issues have yet to be resolved. In the final days of the reporting period, the latest European summit yielded some positive developments, including a willingness to enable bank supervision at a federal, rather than national level and an easing of restrictions on access to rescue funds.
Domestic Equity Overview
In the first few months of 2012, improving data from the labor market, housing market, and consumer confidence and spending bolstered investor confidence about the U.S. economy's prospects. However, part of the improvement in jobs and consumer data was due to the unseasonably warm spring, and the positive momentum in these metrics did not last beyond April. The economy began to appear more sluggish in the second quarter of 2012. Concerns about the effects of the ongoing European debt crisis on economies in Europe and China also contributed to volatility in stock prices. Despite the challenging backdrop, corporate earnings generally remained within or above expectations during the period, although signs emerged after the close of the period (as second quarter earnings reports were being released) that earnings expectations would need to be lowered going forward. While U.S. stock market performance was weaker in the second quarter of 2012 than in the first quarter, the S&P 500 Index closed the six-month period up 9.49%.
Fixed Income Overview
In 2011, the Federal Open Market Committee announced that it expected to keep interest rates on hold until at least mid-2013. Yields on the short end of the yield curve remained anchored by the Fed's near-zero interest rate policy, keeping money market yields low. Given the weaker-than-expected economic conditions, the Federal Reserve (the Fed) extended its timeline to late-2014 at the beginning of this year. Since October 2011, the Fed has been buying longer-maturity Treasuries and selling short-term Treasuries
Morgan Stanley Variable Investment Series
Letter to the Shareholders n June 30, 2012 (unaudited) continued
to put downward pressure on longer-term interest rates. This program was scheduled to end in June 2012, but has been extended to December 2012.
Treasury yields rose in the first quarter but then declined in the second quarter, reflecting weaker growth as well as a flight to quality due to the European debt crisis. The 10-year Treasury yield reached an all time low of 1.47% at the beginning of June.
Agency mortgage-backed securities performed well over the period. The sector offers an attractive yield advantage in the current low yield environment. Despite historically low mortgage rates, refinancing activity has been slower than it has been in the past under similar rate incentives. Many borrowers are unable to refinance due to tighter underwriting standards. The U.S. housing market appears to be trying to find a bottom. The headline home price index was still showing a negative year-over-year trend at the end of the review period, but the momentum of the decline had meaningfully slowed.
The corporate segment outperformed Treasuries, aided by strong corporate balance sheets and low borrowing costs. The high yield corporate sector saw increased volatility in the second quarter of 2012 amid worries about the European debt crisis. For the period overall, the financial sector was the best-performing corporate sector.
International Equity Overview
Despite the concerns about the European debt crisis and the slackening pace of China's economy, many international equity markets posted gains for the six-month period ended June 30, 2012. The outcome of the European summit on June 28 and 29 surprised the markets, leading to a rally in the final days of the reporting period. However, the proposals' implementation details have yet to be worked out and the larger issue of developing a more sustainable framework for economic growth in the region remains. Meanwhile, European economies continued to show signs of deterioration, even within the so-called "core" countries. China's economy also cooled during the period, as export demand from the U.S. and Europe declined and credit remained restricted. The country's central bank unexpectedly cut interest rates in June (and again in July, just after the end of the reporting period) in attempt to keep economic growth from sliding further.
Money Market Portfolio
An investment in a money market fund is not insured or guaranteed by the Federal Deposit Insurance Corporation or any other government agency. Although money market funds seek to preserve the value of an investment at $1.00 per share, it is possible to lose money by investing in such funds.
2
Morgan Stanley Variable Investment Series
Letter to the Shareholders n June 30, 2012 (unaudited) continued
As of June 30, 2012, Variable Investment Series – Money Market Portfolio had net assets of approximately $97 million with an average portfolio maturity of 19 days. For the seven-day period ended June 30, 2012, the Portfolio's Class X shares provided an effective annualized yield of 0.01% (subsidized) and – 0.33% (non-subsidized) and a current yield of 0.01% (subsidized) and – 0.33% (non-subsidized), while its 30-day moving average yield for June was 0.01% (subsidized) and – 0.32% (non-subsidized). Yield quotations more closely reflect the current earnings of the Portfolio. The non-subsidized yield reflects what the yield would have been had a fee and/or expense waiver not been in place during the period shown. For the six-month period ended June 30, 2012, the Portfolio's Class X shares returned 0.00%. Past performance is no guarantee of future results.
For the seven-day period ended June 30, 2012, the Portfolio's Class Y shares provided an effective annualized yield of 0.01% (subsidized) and – 0.58% (non-subsidized) and a current yield of 0.01% (subsidized) and – 0.58% (non-subsidized), while its 30-day moving average yield for June was 0.01% (subsidized) and – 0.57% (non-subsidized). Yield quotations more closely reflect the current earnings of the Portfolio. The non-subsidized yield reflects what the yield would have been had a fee and/or expense waiver not been in place during the period shown. For the six-month period ended June 30, 2012, the Portfolio's Class Y shares returned 0.00%. Past performance is no guarantee of future results.
The performance of the Portfolio's two share classes varies because each has different expenses. The Portfolio's total returns assume the reinvestment of all distributions but do not reflect the deduction of any charges by your insurance company. Such costs would lower performance.
We continued to remain cautious in our investment approach, focusing on high liquidity and short durations. We believe our investment process and focus on credit research and risk management have placed the Portfolio in a favorable position to respond to market uncertainty. Most of our investment activity has been focused on rolling significant amounts of overnight and short-dated maturities, with occasional selective purchases of one-month, three-month, and six-month fixed rate maturities, as well as selective purchases of nine-month and one-year floating rate paper.
There is no guarantee that any sectors mentioned will continue to perform as discussed above or that securities in such sectors will be held by the Portfolio in the future.
Limited Duration Portfolio
For the six-month period ended June 30, 2012, Variable Investment Series – Limited Duration Portfolio Class X shares produced a total return of 1.86%, outperforming the Barclays Capital U.S. Government/Credit
3
Morgan Stanley Variable Investment Series
Letter to the Shareholders n June 30, 2012 (unaudited) continued
Index (1-5 Year) (the "Index"),1 which returned 1.13%. For the same period, the Portfolio's Class Y shares returned 1.71%. Past performance is no guarantee of future results.
The performance of the Portfolio's two share classes varies because each has different expenses. The Portfolio's total returns assume the reinvestment of all distributions but do not reflect the deduction of any charges by your insurance company. Such costs would lower performance.
The Portfolio's overweight to the credit sector was the main driver of performance as spread (or non-government) sectors outperformed Treasuries during the period. Short maturity corporate spreads retraced most of their widening from the second half of last year, and overall corporate spreads ended the period 60 basis points tighter. The financial sector was the best performing corporate sector, with short-maturity financial spreads tightening by about 100 basis points during the period. The Portfolio's allocation to short-maturity, high-quality asset-backed securities also helped performance.
Conversely, the Portfolio was underweight in the agency sector, which detracted slightly from relative performance as spreads tightened over the period. Interest-rate positioning did not have an impact on performance as the Portfolio had been positioned to be neutral relative to the Index.
There is no guarantee that any sectors mentioned will continue to perform as discussed above or that securities in such sectors will be held by the Portfolio in the future.
Income Plus Portfolio
For the six-month period ended June 30, 2012, Variable Investment Series – Income Plus Portfolio Class X shares produced a total return of 6.56%, outperforming the Barclays Capital U.S. Corporate Index (the "Index"),2 which returned 4.65%. For the same period, the Portfolio's Class Y shares returned 6.38%. Past performance is no guarantee of future results.
The performance of the Portfolio's two share classes varies because each has different expenses. The Portfolio's total returns assume the reinvestment of all distributions but do not reflect the deduction of any charges by your insurance company. Such costs would lower performance.
1 The Barclays Capital U.S. Government/Credit Index (1-5 Year) tracks the performance of U.S. government and corporate obligations, including U.S. government agency and Treasury securities, and corporate and Yankee bonds with maturities of one to five years. The Index is unmanaged and its returns do not include any sales charges or fees. Such costs would lower performance. It is not possible to invest directly in an index.
2 The Barclays Capital U.S. Corporate Index covers U.S. dollar-denominated, investment-grade, fixed rate, taxable securities sold by industrial, utility and financial issuers. It includes publicly issued U.S. corporate and foreign debentures and secured notes that meet specified maturity, liquidity and quality requirements. The Index is unmanaged and its returns do not include any sales charges or fees. Such costs would lower performance. It is not possible to invest directly in an index.
4
Morgan Stanley Variable Investment Series
Letter to the Shareholders n June 30, 2012 (unaudited) continued
Following a period of historic volatility in risk assets during the latter half of 2011, the Portfolio entered 2012 overweight investment grade corporate bonds and with exposure to high yield corporate bonds and convertible bonds as well. These positions were designed to attempt to benefit from a normalization of credit spreads, which we believed would be driven by supportive global monetary policy and a continued modest U.S. economic recovery.
Although fears of a European financial collapse dominated headlines late in 2011, sentiment dramatically reversed early in 2012, in large part due to supportive actions by the European Central Bank (ECB). In particular, the ECB's long-term refinancing operations, or LTROs, had a substantial positive impact on the market by reducing liquidity pressures on European banks. These actions helped lower yields across many asset classes, most notably those securities with direct exposure to Europe.
Financial sector corporate bonds, which remain one of the Portfolio's largest overweights, responded strongly to the improved sentiment surrounding Europe and these exposures generated the majority of the Portfolio's outperformance of the period. High yield bonds held in the Portfolio also performed well during this period. We responded to this strong relative performance by modestly decreasing risk in those sectors which outperformed the most, particularly financials, and rotating into less volatile segments of the market. Underweights to select non-financial corporate sectors, such as health care and pharmaceuticals, detracted from relative performance during the period.
Over the last few months of the period, the market once again became concerned about the European fiscal crisis. In addition, a slowing U.S. economy pressured risk assets. While the future of Europe is certain to remain volatile, we believe that absent a significant downward spiral in Europe, the U.S. economy will continue to follow a path of slow growth. This slow growth environment is expected to remain supportive of credit fundamentals, in our opinion, ultimately leading to tighter credit spreads and potentially benefiting the Portfolio's current positioning.
There is no guarantee that any sectors mentioned will continue to perform as discussed above or that securities in such sectors will be held by the Portfolio in the future.
Global Infrastructure Portfolio
For the six-month period ended June 30, 2012, Variable Investment Series – Global Infrastructure Portfolio Class X shares produced a total return of 7.06%, outperforming the Dow Jones Brookfield Global
5
Morgan Stanley Variable Investment Series
Letter to the Shareholders n June 30, 2012 (unaudited) continued
Infrastructure IndexSM (the "Index"),3 which returned 6.44%, and the S&P Global BMI Index,4 which returned 6.09%. For the same period, the Portfolio's Class Y shares returned 6.93%. Past performance is no guarantee of future results.
The performance of the Portfolio's two share classes varies because each has different expenses. The Portfolio's total returns assume the reinvestment of all distributions but do not reflect the deduction of any charges by your insurance company. Such costs would lower performance.
Infrastructure shares appreciated 6.44% during the first half of 2012, as measured by the Index. Among the major infrastructure sectors, the communications, European regulated utilities, and gas distribution utilities sectors exhibited relative outperformance over the Index, while the gas midstream, toll roads, pipeline companies, and transmission and distribution sectors underperformed the Index. In addition, all of the smaller sectors exhibited relative outperformance, with the water sector realizing the strongest gains.
Despite indications of slowing economic growth globally, the first half of 2012 ended on a high note for the broader equity markets as investors cheered the prospect of a common European banking regulator and the potential for direct bank bailouts within the European Union (EU) that will bypass sovereign governments (thus breaking the circular, co-dependent relationship between governments and banks that plagues the current crisis). While many would welcome these potential measures, we are cautious given the continued lack of specifics and the seemingly different interpretations of EU summit promises as expressed by members of the German and Spanish governments. Certain northern European countries have also threatened to block such initiatives unless current austerity drives are implemented in full.
If certain announcements in Europe are cause for optimism, such optimism may be in short supply as economic statistics elsewhere indicate a global economy struggling to escape from the global financial crisis. Job growth in the United States remains lackluster at best, and business optimism has started to deteriorate again, after improving earlier in the year. In Asia, the Chinese government has announced policy measures to stimulate growth and has lowered borrowing rates, but recent disclosure of various economic statistics indicate a broad slowing of growth in that country.
3 The Dow Jones Brookfield Global Infrastructure IndexSM is a float-adjusted market capitalization weighted index that measures the stock performance of companies that exhibit strong infrastructure characteristics. The Index intends to measure all sectors of the infrastructure market. The Index is unmanaged and its returns do not include any sales charges or fees. Such costs would lower performance. It is not possible to invest directly in an index.
4 The Standard & Poor's Global BMI Index (S&P Global BMI Index) is a broad market index designed to capture exposure to equities in all countries in the world that meet minimum size and liquidity requirements. As of the date of this Report, there are approximately 11,000 index members representing 26 developed and 20 emerging market countries. The Index is unmanaged and its returns do not include any sales charges or fees. Such costs would lower performance. It is not possible to invest directly in an index.
6
Morgan Stanley Variable Investment Series
Letter to the Shareholders n June 30, 2012 (unaudited) continued
Within infrastructure, the strength of operating fundamentals exhibited in the first half of the year varies by sector and region. One of the strongest areas from a fundamental perspective remains the communications sector, where U.S.-based wireless tower operators in particular are enjoying robust growth, driven by upgrades to telecommunications companies' wireless networks. Utility assets globally that focus on transmission, distribution, and storage initiatives are also witnessing very stable, steady growth. Within energy infrastructure in North America, there has been some softening in fundamentals off the very robust growth achieved over the last couple of years as lower natural gas, crude oil, and natural gas liquids (NGL) prices have curtailed exploration and production company drilling plans somewhat, lessening the utilization of existing infrastructure in certain parts of the value chain (in particular, gathering and processing). We view this softening as temporary, however, as the long-term need for takeaway capacity and processing is significant and the geographical location of both resource and demand centers continues to evolve. We would also note that recent merger and acquisition activity in the exploration and production space for North American commodity resources by Asian buyers underscores the medium- to long-term demand for natural gas, crude oil, and commodity byproducts that will require infrastructure investment for some time to come. It is important to note the distinction between energy infrastructure company share prices, some of which were weak in the first half of 2012 — in particular within gas midstream — and the magnitude of their capital programs, which remain very robust.
As a final note, while the operating fundamentals (i.e., traffic) of European toll road companies have for the most part been weak for the first half of the year, current valuation levels are difficult to ignore. Current share prices imply a long-term cost of capital and/or indefinite weakness in traffic, which is difficult to justify despite the current financial and economic crises surrounding the countries in which these concessionaires are domiciled.
For the first half of 2012, the Portfolio realized favorable performance from both bottom-up stock selection and top-down allocation. From a bottom-up perspective, the Portfolio benefited from stock selection in the gas distribution utilities, communications, European regulated utilities, and gas midstream sectors, but relative gains were partially offset by adverse selection in the pipeline companies sector. From a top-down perspective, the Portfolio benefited from an underweight to the gas midstream sector and overweights to the communications and gas distribution utilities sectors. This outperformance was partially offset by overweights to the toll roads and pipeline companies sectors.
We remain committed to our core investment philosophy as an infrastructure value investor. As value-oriented, bottom-up driven investors, our investment perspective is that over the medium and long term, the key factor in determining the performance of infrastructure securities will be underlying infrastructure asset values.
7
Morgan Stanley Variable Investment Series
Letter to the Shareholders n June 30, 2012 (unaudited) continued
Given the large and growing private infrastructure market, we believe that there are limits as to the level of premium or discount at which the public sector should trade relative to its underlying private infrastructure value. These limits can be viewed as the point at which the arbitrage opportunity between owning infrastructure in the private versus public markets becomes compelling. In aiming to achieve core infrastructure exposure in a cost effective manner, we invest in equity securities of publicly listed infrastructure companies we believe offer the best value relative to their underlying infrastructure value and Net Asset Value growth prospects.
Our research currently leads us to an overweighting in the Portfolio (amongst the largest sectors) to a group of companies in the gas distribution utilities, communications, toll road, and pipeline companies sectors, and an underweighting to companies in the gas midstream and transmission and distribution sectors. Since our year-end commentary dated December 31, 2011, the only change from a sector perspective is that we now hold close to a market-weight position in the European regulated utilities sector.
Looking forward, we continue to believe the toll road sector presents an attractive opportunity from a valuation perspective, and we also like the secular growth stories within the communications sector and energy infrastructure sector — in particular, gas distribution utilities within Asia and pipeline companies within North America. For more processing and fractionation-focused midstream companies, we remain underweight but believe they have become more attractively valued given the absolute declines observed in the first half of the year.
There is no guarantee that any sectors mentioned will continue to perform as discussed above or that securities in such sectors will be held by the Portfolio in the future.
European Equity Portfolio
For the six-month period ended June 30, 2012, Variable Investment Series – European Equity Portfolio Class X shares produced a total return of 3.04%, outperforming the MSCI Europe Index (the "Index"),5 which returned 2.40%. For the same period, the Portfolio's Class Y shares returned 2.90%. Past performance is no guarantee of future results.
5 The Morgan Stanley Capital International (MSCI) Europe Index is a free float-adjusted market capitalization index that is designed to measure developed market equity performance in Europe. The term "free float" represents the portion of shares outstanding that are deemed to be available for purchase in the public equity markets by investors. The performance of the Index is listed in U.S. dollars and assumes reinvestment of net dividends. The Index is unmanaged and its returns do not include any sales charges or fees. Such costs would lower performance. It is not possible to invest directly in an index.
8
Morgan Stanley Variable Investment Series
Letter to the Shareholders n June 30, 2012 (unaudited) continued
The performance of the Portfolio's two share classes varies because each has different expenses. The Portfolio's total returns assume the reinvestment of all distributions but do not reflect the deduction of any charges by your insurance company. Such costs would lower performance.
On a sector basis, the Portfolio's outperformance was driven by stock selection in capital goods, insurance, software and services, and banks. The largest contributor to relative performance was a holding in a Spanish IT company that is the world's largest provider of reservations management software and systems for the travel industry. Other major contributors included holdings in a French hotel chain that recently sold off its underperforming U.S. business operation, a German truck maker that was recently acquired, a U.K. insurance provider, and a U.K. aerospace equipment company. Strong stock selection and an underweight in the telecommunications sector also aided relative results.
However, stock selection in the materials, retail, and utilities sectors diminished relative gains. Relative weakness came from holdings in a Spanish bank that saw its credit rating lowered by Moody's Investor Service in June although the bank's financials have remained relatively healthy, a French utility company that we believed had an uncertain outlook, a U.K. mining company that has underperformed since its merger, and a U.K. supermarket chain that has been losing market share in the sluggish economic environment.
On a country level, positive contributors included stock selection in Germany, Finland, and Switzerland. Both stock selection and an underweight in Spain were beneficial as well. The only detractor on a country basis during the period was stock selection in the U.K.
In the first half of the period, the financials and other cyclical (or economically sensitive) sectors rallied strongly. However, from mid-March through the end of the period, the outperformance of these sectors faded amid rising concerns about the global economy (including emerging markets) and disappointing news from the development of the European debt crisis. At the same time, valuations of some of the more defensive (or less economically sensitive) stocks were quite expensive, as investors largely preferred to position defensively.
In this environment, we have sought to maintain what we believe is a balanced and diversified stance in the Portfolio. In fact, the Portfolio is overweight in energy and industrials, which are more cyclical sectors, counterbalanced by an overweight in consumer staples and health care, which are more defensive. On the contrary, we are underweight in defensive utilities and telecommunications sectors, but also underweight in cyclical materials, consumer discretionary (with no exposure to luxury goods due to expensive valuations), and financials (with an overweight in banks) sectors.
9
Morgan Stanley Variable Investment Series
Letter to the Shareholders n June 30, 2012 (unaudited) continued
Central banks around the world have shifted their tone, as the markets expected a possible third quantitative easing program (dubbed QE3) from the U.S. Federal Reserve in second half of 2012. In addition, we saw recently action from the Bank of England, which pumped £50 billion into the system, the European Central Bank (ECB) cutting interest rates by 25 basis points, Brazil cutting by 50 basis points, and South Korea by 25 basis points. These coordinated easing actions have been in the past a positive catalyst for the equity markets. We also look with favor toward the recent trend in oil prices, which potentially point to further falls in inflation over the coming months. This trend should help those central banks wishing to add further monetary stimulus, but also lowers input costs for the corporate sector — thereby improving margin trends — and may provide support for consumers' disposable income.
Although concerns remain on sovereign debt for some European "peripheral" countries, we believe that the current scenario has provided opportunities in the market. In Europe we still see large economic imbalances (between north and south, "core" and "periphery") and a lack of fiscal integration. While it is possible to overcome these deficiencies, it will take some years.
Over the long term, we expect that the European economy should be a major beneficiary of a global recovery, with its high exposure to emerging markets. We see recent market weakness as an opportunity to selectively add quality stocks to the portfolio, as we believe European valuations are cheap compared to historical levels. Current equity valuations have priced a low-growth environment for Europe, which we believe seems to be the most likely scenario for the next few years. Economic growth in core European countries versus poor results from peripheral Europe, emerging markets exposure, asset allocation shift out of fixed income into developed equities and cheap valuations provide strong back up to our favorable thesis on the asset class. Our investment approach remains the same. We continue to seek high quality companies that we believe have high earnings visibility and predictability, stable and strong cash flow and low levels of debt trading at attractive valuations.
There is no guarantee that any sectors mentioned will continue to perform as discussed above or that securities in such sectors will be held by the Portfolio in the future.
Multi Cap Growth Portfolio
For the six-month period ended June 30, 2012, Variable Investment Series – Multi Cap Growth Portfolio Class X shares produced a total return of 9.85%, underperforming the Russell 3000® Growth Index (the
10
Morgan Stanley Variable Investment Series
Letter to the Shareholders n June 30, 2012 (unaudited) continued
"Index"),6 which returned 9.98%. For the same period, the Portfolio's Class Y shares returned 9.72%. Past performance is no guarantee of future results.
The performance of the Portfolio's two share classes varies because each has different expenses. The Portfolio's total returns assume the reinvestment of all distributions but do not reflect the deduction of any charges by your insurance company. Such costs would lower performance.
Stock selection in the technology sector was by far the largest detractor from performance. Several holdings in the computer services, software and systems industry were among the weakest performers in the portfolio during the period. Stock selection in materials and processing dampened relative performance, due to positions in two companies specializing in rare earth minerals production. Stock selection in financial services also hurt relative returns. The Portfolio's position in an auto insurance provider and a lack of exposure to real estate investment trusts (REITs), a group that performed well in the Index, were the main reasons for the Portfolio's underperformance within the sector.
Conversely, stock selection in health care was additive to relative performance. The Portfolio held several stocks that performed well, including a provider of billing services to medical group practices and companies making medical and dental instrument and supplies. Stock selection in consumer discretionary was another positive contributor, mostly due to strong gains from a position in an online retailer. Stock selection in producer durables further benefited relative returns. Within the sector, the Portfolio was helped by exposure to companies involved in back office support, human resources, and consulting, as well as holdings in commercial services providers.
There is no guarantee that any sectors mentioned will continue to perform as discussed above or that securities in such sectors will be held by the Portfolio in the future.
Aggressive Equity Portfolio
For the six-month period ended June 30, 2012, Variable Investment Series – Aggressive Equity Portfolio Class X shares produced a total return of 9.80%, underperforming the Russell 3000® Growth Index (the "Index"),6 which returned 9.98%. For the same period, the Portfolio's Class Y shares returned 9.70%. Past performance is no guarantee of future results.
6 The Russell 3000® Growth Index measures the performance of the broad growth segment of the U.S. equity universe. It includes those Russell 3000® Index companies with higher price-to-book ratios and higher forecasted growth values. The Russell 3000® Index measures the performance of the largest 3000 U.S. companies representing approximately 98% of the investable U.S. equity market. The Index is unmanaged and its returns do not include any sales charges or fees. Such costs would lower performance. It is not possible to invest directly in an index.
11
Morgan Stanley Variable Investment Series
Letter to the Shareholders n June 30, 2012 (unaudited) continued
The performance of the Portfolio's two share classes varies because each has different expenses. The Portfolio's total returns assume the reinvestment of all distributions but do not reflect the deduction of any charges by your insurance company. Such costs would lower performance.
Stock selection in the technology sector was by far the largest detractor from performance. Several holdings in the computer services, software and systems industry were among the weakest performers in the portfolio during the period. Stock selection in materials and processing dampened relative performance, due to positions in two companies specializing in rare earth minerals production. Stock selection in financial services also hurt relative returns. The Portfolio's position in an auto insurance provider and a lack of exposure to real estate investment trusts (REITs), a group that performed well in the Index, were the main reasons for the Portfolio's underperformance within the sector.
Conversely, stock selection in health care was additive to relative performance. The Portfolio held several stocks that performed well, including a provider of billing services to medical group practices and companies making medical and dental instrument and supplies. Stock selection in consumer discretionary was another positive contributor, mostly due to strong gains from a position in an online retailer. Stock selection in producer durables further benefited relative returns. Within the sector, the Portfolio was helped by exposure to companies involved in back office support, human resources, and consulting, as well as holdings in commercial services providers.
There is no guarantee that any sectors mentioned will continue to perform as discussed above or that securities in such sectors will be held by the Portfolio in the future.
Strategist Portfolio
For the six-month period ended June 30, 2012, Variable Investment Series – Strategist Portfolio Class X shares produced a total return of 4.41%, underperforming the S&P 500® Index (the "Index"),7 which returned 9.49%, and outperforming the Barclays Capital U.S. Government/Credit Index,8 which returned 2.65%. For the same period, the Portfolio's Class Y shares returned 4.28%. In addition, the Portfolio's Class X and Y shares outperformed their peers within the Lipper Variable Annuity Flexible Portfolio Underlying Funds category by 70 and 57 basis points, respectively, for the period under review, according to Lipper Analytics. Past performance is no guarantee of future results.
7 The Standard & Poor's 500® Index (S&P 500®) measures the performance of the large cap segment of the U.S. equities market, covering approximately 75% of the U.S. equities market. The Index includes 500 leading companies in leading industries of the U.S. economy. The Index is unmanaged and its returns do not include any sales charges or fees. Such costs would lower performance. It is not possible to invest directly in an index.
8 The Barclays Capital U.S. Government/Credit Index tracks the performance of government and corporate obligations, including U.S. government agency and Treasury securities and corporate and Yankee bonds. The Index is unmanaged and its returns do not include any sales charges or fees. Such costs would lower performance. It is not possible to invest directly in an index.
12
Morgan Stanley Variable Investment Series
Letter to the Shareholders n June 30, 2012 (unaudited) continued
The performance of the Portfolio's two share classes varies because each has different expenses. The Portfolio's total returns assume the reinvestment of all distributions but do not reflect the deduction of any charges by your insurance company. Such costs would lower performance.
Strategist Portfolio's flexible investment approach allows investment across stocks, bonds, cash and other investment classes. To determine the specific allocation among asset classes throughout the period, we rigorously evaluate a comprehensive array of quantitative and qualitative factors. The quantitative analysis comprises an extensive "top-down" asset class review of many macroeconomic variables, with primary focus on three core factors: monetary policy and its impact on liquidity, inflation trends and corporate profitability. A second, more qualitative process then broadens the analysis to determine which sectors and industries would offer the best opportunities, in our view, given the macroeconomic climate. Individual holdings are then selected in an effort to provide desired exposure to asset classes and sectors.
During the first half of 2012, there were no material changes to the Portfolio's asset allocation. At period-end, the Portfolio's asset allocation (as a percentage of total Portfolio assets) stood at approximately 61% equities, 24% fixed income and 15% cash equivalents. The Portfolio's equity exposure continued to be focused in large capitalization, high free-cash flow generating companies featuring dividend yields in excess of the average equity security. These stocks have tended to underperform the general market in periods of strong rallies and outperformed during market corrections. The equity portfolio's largest sector exposures include consumer discretionary, industrials and information technology holdings; these three sectors make up approximately half of the Portfolio's total equity exposure.
The fixed income portfolio is diversified among a number of sectors as well, with U.S. government-issued exposures totaling 61% of the fixed income portfolio and corporate credit exposures totaling 32%. The balance of the Portfolio's fixed income holdings is spread among asset-backed instruments, municipal bonds and cash equivalents.
There is no guarantee that any sectors mentioned will continue to perform as discussed above or that securities in such sectors will be held by the Portfolio in the future.
We appreciate your ongoing support of Morgan Stanley Variable Investment Series and look forward to continuing to serve your investment needs.
Very truly yours,

Arthur Lev
President and Principal Executive Officer
13
Morgan Stanley Variable Investment Series
Letter to the Shareholders n June 30, 2012 (unaudited) continued
For More Information About Portfolio Holdings
Each Morgan Stanley fund provides a complete schedule of portfolio holdings in its semiannual and annual reports within 60 days of the end of the fund's second and fourth fiscal quarters. The semiannual reports and the annual reports are filed electronically with the Securities and Exchange Commission (SEC) on Form N-CSRS and Form N-CSR, respectively. Morgan Stanley also delivers the semiannual and annual reports to fund shareholders and makes these reports available on its public web site, www.morganstanley.com. Each Morgan Stanley fund also files a complete schedule of portfolio holdings with the SEC for the fund's first and third fiscal quarters on Form N-Q and monthly holdings for each money market fund on Form N-MFP. Morgan Stanley does not deliver these reports to shareholders, nor are the first and third fiscal quarter reports posted to the Morgan Stanley public web site. However, the holdings for each money market fund are posted to the Morgan Stanley public web site. You may obtain the Form N-Q filings (as well as the Form N-CSR, N-CSRS and N-MFP filings) by accessing the SEC's web site, http://www.sec.gov. You may also review and copy them at the SEC's public reference room in Washington, DC. Information on the operation of the SEC's public reference room may be obtained by calling the SEC at (800) SEC-0330. You can also request copies of these materials, upon payment of a duplicating fee, by electronic request at the SEC's e-mail address (publicinfo@sec.gov) or by writing the public reference section of the SEC, Washington, DC 20549-1520.
Proxy Voting Policy and Procedures and Proxy Voting Record
You may obtain a copy of the Portfolio's Proxy Voting Policy and Procedures without charge, upon request, by calling toll free (800) 869-NEWS or by visiting the Mutual Fund Center on our web site at www.morganstanley.com. It is also available on the SEC's web site at http://www.sec.gov.
You may obtain information regarding how the Portfolios voted proxies relating to portfolio securities during the most recent twelve-month period ended June 30 without charge by visiting the Mutual Fund Center on our web site at www.morganstanley.com. This information is also available on the SEC's web site at http://www.sec.gov.
14
Morgan Stanley Variable Investment Series
Fund Performance n June 30, 2012 (unaudited)
| Average Annual Total Returns—Period Ended June 30, 2012(1) | |
| Class X | | 1 Year | | 5 Years | | 10 Years | | Since
Inception | | Gross Expense
Ratio | | Date of
Inception | |
| Aggressive Equity | | | -2.82 | % | | | 3.96 | % | | | 8.13 | % | | | 5.39 | % | | | 1.06 | % | | 5/4/1999 | |
| European Equity | | | -14.04 | | | | -5.61 | | | | 3.81 | | | | 8.06 | | | | 1.17 | | | 3/1/1991 | |
| Global Infrastructure | | | 10.88 | | | | 2.52 | | | | 8.71 | | | | 7.87 | | | | 0.86 | | | 3/1/1990 | |
| Income Plus | | | 8.02 | | | | 7.57 | | | | 6.59 | | | | 7.38 | | | | 0.59 | | | 3/1/1987 | |
| Limited Duration | | | 2.66 | | | | -0.61 | | | | 1.13 | | | | 2.04 | | | | 0.60 | | | 5/4/1999 | |
| Money Market | | | 0.01 | | | | 0.98 | | | | 1.68 | | | | 4.27 | | | | 0.60 | | | 3/9/1984 | |
| Multi Cap Growth | | | -2.49 | | | | 5.07 | | | | 7.37 | | | | 10.89 | | | | 0.56 | | | 3/9/1984 | |
| Strategist | | | -4.91 | | | | -0.92 | | | | 5.20 | | | | 7.49 | | | | 0.61 | | | 3/1/1987 | |
Performance data quoted represents past performance, which is no guarantee of future results and current performance may be lower or higher than the figures shown. For most recent month-end performance figures, please contact the issuing insurance company or speak with your Financial Advisor. Investment return and principal value will fluctuate. When you sell Portfolio shares, they may be worth less than their original cost. Total returns do not reflect the deduction of taxes that a shareholder would pay on Portfolio distributions or the redemption of Portfolio shares. Performance for Class Y shares will vary from the performance of Class X shares due to differences in expenses.
(1) Figure assumes reinvestment of all distributions for the underlying fund based on net asset value (NAV). It does not reflect the deduction of insurance expenses, an annual contract maintenance fee, or surrender charges. If performance information included the effect of these additional charges, the total returns would be lower.
15
Morgan Stanley Variable Investment Series
Fund Performance n June 30, 2012 (unaudited) continued
| Average Annual Total Returns—Period Ended June 30, 2012(1) | |
| Class Y | | 1 Year | | 5 Years | | 10 Years | | Since
Inception | | Gross Expense
Ratio | | Date of
Inception | |
| Aggressive Equity | | | -3.03 | % | | | 3.71 | % | | | 7.86 | % | | | 2.31 | % | | | 1.31 | % | | 6/5/2000 | |
| European Equity | | | -14.27 | | | | -5.84 | | | | 3.55 | | | | 0.11 | | | | 1.42 | | | 6/5/2000 | |
| Global Infrastructure | | | 10.62 | | | | 2.27 | | | | 8.44 | | | | 2.89 | | | | 1.11 | | | 6/5/2000 | |
| Income Plus | | | 7.64 | | | | 7.30 | | | | 6.32 | | | | 6.72 | | | | 0.84 | | | 6/5/2000 | |
| Limited Duration | | | 2.38 | | | | -0.83 | | | | 0.88 | | | | 1.70 | | | | 0.85 | | | 6/5/2000 | |
| Money Market | | | 0.01 | | | | 0.90 | | | | 1.52 | | | | 1.89 | | | | 0.85 | | | 6/5/2000 | |
| Multi Cap Growth | | | -2.72 | | | | 4.80 | | | | 7.10 | | | | 1.98 | | | | 0.81 | | | 6/5/2000 | |
| Strategist | | | -5.15 | | | | -1.16 | | | | 4.93 | | | | 2.74 | | | | 0.86 | | | 6/5/2000 | |
Performance data quoted represents past performance, which is no guarantee of future results and current performance may be lower or higher than the figures shown. For most recent month-end performance figures, please contact the issuing insurance company or speak with your Financial Advisor. Investment return and principal value will fluctuate. When you sell Portfolio shares, they may be worth less than their original cost. Total returns do not reflect the deduction of taxes that a shareholder would pay on Portfolio distributions or the redemption of Portfolio shares. Performance for Class Y shares will vary from the performance of Class X shares due to differences in expenses.
(1) Figure assumes reinvestment of all distributions for the underlying fund based on net asset value (NAV). It does not reflect the deduction of insurance expenses, an annual contract maintenance fee, or surrender charges. If performance information included the effect of these additional charges, the total returns would be lower.
16
Morgan Stanley Variable Investment Series
Expense Examples n June 30, 2012 (unaudited)
As a shareholder of the Portfolio, you incur two types of costs: (1) insurance company charges; and (2) ongoing costs, including advisory fees; distribution and service (12b-1) fees; and other Portfolio expenses. These examples are intended to help you understand your ongoing costs (in dollars) of investing in the Portfolio and to compare these costs with the ongoing costs of investing in other mutual funds.
These examples are based on an investment of $1,000 invested at the beginning of the period and held for the entire period 01/01/12 – 06/30/12.
Actual Expenses
The first line of the table below provides information about actual account values and actual expenses. You may use the information in this line, together with the amount you invested, to estimate the expenses that you paid over the period. Simply divide your account value by $1,000 (for example, an $8,600 account value divided by $1,000 = 8.6), then multiply the result by the number in the first line under the heading entitled "Expenses Paid During Period" to estimate the expenses you paid on your account during this period.
Hypothetical Example for Comparison Purposes
The second line of the table below provides information about hypothetical expenses based on the Portfolio's actual expense ratio and an assumed rate of return of 5% per year before expenses, which is not the Portfolio's actual return. The hypothetical account values and expenses may not be used to estimate the actual ending account balance or expenses you paid for the period. You may use this information to compare the ongoing cost of investing in the Portfolio and other funds. To do so, compare this 5% hypothetical example with the 5% hypothetical examples that appear in the shareholder reports of the other funds.
Please note that the expenses shown in the table are meant to highlight your ongoing costs only and do not reflect any insurance company charges. Therefore, the second line of the table is useful in comparing ongoing costs, and will not help you determine the relative total cost of owning different funds. In addition, if these insurance company charges were included, your costs would have been higher.
17
Morgan Stanley Variable Investment Series
Expense Examples n June 30, 2012 (unaudited) continued
Money Market
| | | Beginning
Account Value | | Ending
Account Value | | Expenses Paid
During Period@ | |
| | | 01/01/12 | | 06/30/12 | | 01/01/12 –
06/30/12 | |
| Class X | |
| Actual (0.00% return) | | $ | 1,000.00 | | | $ | 1,000.00 | | | $ | 1.29 | | |
| Hypothetical (5% annual return before expenses) | | $ | 1,000.00 | | | $ | 1,023.57 | | | $ | 1.31 | | |
| Class Y | |
| Actual (0.00% return) | | $ | 1,000.00 | | | $ | 1,000.00 | | | $ | 1.29 | | |
| Hypothetical (5% annual return before expenses) | | $ | 1,000.00 | | | $ | 1,023.57 | | | $ | 1.31 | | |
@ Expenses are equal to the Portfolio's annualized expense ratios of 0.26% and 0.26% for Class X and Class Y shares, respectively, multiplied by the average account value over the period, multiplied by 182/366 (to reflect the one-half year period). If the Portfolio had borne all of its expenses, the annualized expense ratios would have been 0.63% and 0.88% for Class X and Class Y shares, respectively.
Limited Duration
| | | Beginning
Account Value | | Ending
Account Value | | Expenses Paid
During Period@ | |
| | | 01/01/12 | | 06/30/12 | | 01/01/12 –
06/30/12 | |
| Class X | |
| Actual (1.86% return) | | $ | 1,000.00 | | | $ | 1,018.60 | | | $ | 2.91 | | |
| Hypothetical (5% annual return before expenses) | | $ | 1,000.00 | | | $ | 1,021.98 | | | $ | 2.92 | | |
| Class Y | |
| Actual (1.71% return) | | $ | 1,000.00 | | | $ | 1,017.10 | | | $ | 4.16 | | |
| Hypothetical (5% annual return before expenses) | | $ | 1,000.00 | | | $ | 1,020.74 | | | $ | 4.17 | | |
@ Expenses are equal to the Portfolio's annualized expense ratios of 0.58% and 0.83% for Class X and Class Y shares, respectively, multiplied by the average account value over the period, multiplied by 182/366 (to reflect the one-half year period).
Income Plus
| | | Beginning
Account Value | | Ending
Account Value | | Expenses Paid
During Period@ | |
| | | 01/01/12 | | 06/30/12 | | 01/01/12 –
06/30/12 | |
| Class X | |
| Actual (6.56% return) | | $ | 1,000.00 | | | $ | 1,065.60 | | | $ | 2.98 | | |
| Hypothetical (5% annual return before expenses) | | $ | 1,000.00 | | | $ | 1,021.98 | | | $ | 2.92 | | |
| Class Y | |
| Actual (6.38% return) | | $ | 1,000.00 | | | $ | 1,063.80 | | | $ | 4.26 | | |
| Hypothetical (5% annual return before expenses) | | $ | 1,000.00 | | | $ | 1,020.74 | | | $ | 4.17 | | |
@ Expenses are equal to the Portfolio's annualized expense ratios of 0.58% and 0.83% for Class X and Class Y shares, respectively, multiplied by the average account value over the period, multiplied by 182/366 (to reflect the one-half year period).
18
Morgan Stanley Variable Investment Series
Expense Examples n June 30, 2012 (unaudited) continued
Global Infrastructure
| | | Beginning
Account Value | | Ending
Account Value | | Expenses Paid
During Period@ | |
| | | 01/01/12 | | 06/30/12 | | 01/01/12 –
06/30/12 | |
| Class X | |
| Actual (7.06% return) | | $ | 1,000.00 | | | $ | 1,070.60 | | | $ | 4.27 | | |
| Hypothetical (5% annual return before expenses) | | $ | 1,000.00 | | | $ | 1,020.74 | | | $ | 4.17 | | |
| Class Y | |
| Actual (6.93% return) | | $ | 1,000.00 | | | $ | 1,069.30 | | | $ | 5.56 | | |
| Hypothetical (5% annual return before expenses) | | $ | 1,000.00 | | | $ | 1,019.49 | | | $ | 5.42 | | |
@ Expenses are equal to the Portfolio's annualized expense ratios of 0.83% and 1.08% for Class X and Class Y shares, respectively, multiplied by the average account value over the period, multiplied by 182/366 (to reflect the one-half year period).
European Equity
| | | Beginning
Account Value | | Ending
Account Value | | Expenses Paid
During Period@ | |
| | | 01/01/12 | | 06/30/12 | | 01/01/12 –
06/30/12 | |
| Class X | |
| Actual (3.04% return) | | $ | 1,000.00 | | | $ | 1,030.40 | | | $ | 5.05 | | |
| Hypothetical (5% annual return before expenses) | | $ | 1,000.00 | | | $ | 1,019.89 | | | $ | 5.02 | | |
| Class Y | |
| Actual (2.90% return) | | $ | 1,000.00 | | | $ | 1,029.00 | | | $ | 6.31 | | |
| Hypothetical (5% annual return before expenses) | | $ | 1,000.00 | | | $ | 1,018.65 | | | $ | 6.27 | | |
@ Expenses are equal to the Portfolio's annualized expense ratios of 1.00% and 1.25% for Class X and Class Y shares, respectively, multiplied by the average account value over the period, multiplied by 182/366 (to reflect the one-half year period). If the Portfolio had borne all of its expenses, the annualized expense ratios would have been 1.20% and 1.45% for Class X and Class Y shares, respectively.
Multi Cap Growth
| | | Beginning
Account Value | | Ending
Account Value | | Expenses Paid
During Period@ | |
| | | 01/01/12 | | 06/30/12 | | 01/01/12 –
06/30/12 | |
| Class X | |
| Actual (9.85% return) | | $ | 1,000.00 | | | $ | 1,098.50 | | | $ | 2.97 | | |
| Hypothetical (5% annual return before expenses) | | $ | 1,000.00 | | | $ | 1,022.03 | | | $ | 2.87 | | |
| Class Y | |
| Actual (9.72% return) | | $ | 1,000.00 | | | $ | 1,097.20 | | | $ | 4.28 | | |
| Hypothetical (5% annual return before expenses) | | $ | 1,000.00 | | | $ | 1,020.79 | | | $ | 4.12 | | |
@ Expenses are equal to the Portfolio's annualized expense ratios of 0.57% and 0.82% for Class X and Class Y shares, respectively, multiplied by the average account value over the period, multiplied by 182/366 (to reflect the one-half year period).
19
Morgan Stanley Variable Investment Series
Expense Examples n June 30, 2012 (unaudited) continued
Aggressive Equity
| | | Beginning
Account Value | | Ending
Account Value | | Expenses Paid
During Period@ | |
| | | 01/01/12 | | 06/30/12 | | 01/01/12 –
06/30/12 | |
| Class X | |
| Actual (9.80% return) | | $ | 1,000.00 | | | $ | 1,098.00 | | | $ | 5.63 | | |
| Hypothetical (5% annual return before expenses) | | $ | 1,000.00 | | | $ | 1,019.49 | | | $ | 5.42 | | |
| Class Y | |
| Actual (9.70% return) | | $ | 1,000.00 | | | $ | 1,097.00 | | | $ | 6.93 | | |
| Hypothetical (5% annual return before expenses) | | $ | 1,000.00 | | | $ | 1,018.25 | | | $ | 6.67 | | |
@ Expenses are equal to the Portfolio's annualized expense ratios of 1.08% and 1.33% for Class X and Class Y shares, respectively, multiplied by the average account value over the period, multiplied by 182/366 (to reflect the one-half year period). If the Portfolio had borne all of its expenses, the annualized expense ratios would have been 1.09% and 1.34% for Class X and Class Y shares, respectively.
Strategist
| | | Beginning
Account Value | | Ending
Account Value | | Expenses Paid
During Period@ | |
| | | 01/01/12 | | 06/30/12 | | 01/01/12 –
06/30/12 | |
| Class X | |
| Actual (4.41% return) | | $ | 1,000.00 | | | $ | 1,044.10 | | | $ | 3.05 | | |
| Hypothetical (5% annual return before expenses) | | $ | 1,000.00 | | | $ | 1,021.88 | | | $ | 3.02 | | |
| Class Y | |
| Actual (4.28% return) | | $ | 1,000.00 | | | $ | 1,042.80 | | | $ | 4.32 | | |
| Hypothetical (5% annual return before expenses) | | $ | 1,000.00 | | | $ | 1,020.64 | | | $ | 4.27 | | |
@ Expenses are equal to the Portfolio's annualized expense ratios of 0.60% and 0.85% for Class X and Class Y shares, respectively, multiplied by the average account value over the period, multiplied by 182/366 (to reflect the one-half year period). If the Portfolio had borne all of its expenses, the annualized expense ratios would have been 0.63% and 0.88% for Class X and Class Y shares, respectively.
20
Morgan Stanley Variable Investment Series
Investment Advisory Agreement Approval n June 30, 2012 (unaudited)
Nature, Extent and Quality of Services
The Board reviewed and considered the nature and extent of the investment advisory services provided by the Investment Adviser (as defined herein) under the advisory agreement, including portfolio management, investment research and equity and fixed income securities trading. The Board reviewed similar information and factors regarding the Sub-Advisers (as defined herein), to the extent applicable. The Board also reviewed and considered the nature and extent of the non-advisory, administrative services provided by the Administrator (as defined herein) under the administration agreement, including accounting, clerical, bookkeeping, compliance, business management and planning, and the provision of supplies, office space and utilities at the Investment Adviser's expense. (The Investment Adviser, Sub-Advisers and Administrator together are referred to as the "Adviser" and the advisory, sub-advisory and administration agreements together are referred to as the "Management Agreement.") The Board also compared the nature of the services provided by the Adviser with similar services provided by non-affiliated advisers as reported to the Board by Lipper, Inc. ("Lipper").
The Board reviewed and considered the qualifications of the portfolio managers, the senior administrative managers and other key personnel of the Adviser who provide the administrative and advisory services to the Portfolios. The Board determined that the Adviser's portfolio managers and key personnel are well qualified by education and/or training and experience to perform the services in an efficient and professional manner. The Board concluded that the nature and extent of the advisory and administrative services provided were necessary and appropriate for the conduct of the business and investment activities of the Portfolios and supported its decision to approve the Management Agreement.
Performance, Fees and Expenses of the Portfolios
The Board reviewed the performance, fees and expenses of the Portfolios compared to their peers, as determined by Lipper, and to appropriate benchmarks where applicable. The Board discussed with the Adviser the performance goals and the actual results achieved in managing the Portfolios. When considering a fund's performance, the Board and the Adviser place emphasis on trends and longer-term returns (focusing on one-year, three-year and five-year performance, as of December 31, 2011, or since inception, as applicable). When a fund underperforms its benchmark and/or its peer group average, they discuss the causes of such underperformance and, where necessary, they discuss specific changes to investment strategy or investment personnel.
Performance
The Board noted that the performance of the Strategist Portfolio was below its peer group averages for the one-, three- and five-year periods.
21
Morgan Stanley Variable Investment Series
Investment Advisory Agreement Approval n June 30, 2012 (unaudited) continued
The Board noted that the performance of the Money Market and Limited Duration Portfolios was better than the peer group averages for the one-year period but below the peer group averages for the three- and five-year periods.
The Board noted that the performance of the Income Plus, Multi Cap Growth and Aggressive Equity Portfolios was better than the peer group averages for the three- and five-year periods but below the peer group averages for the one-year period.
The Board noted that the performance of the Global Infrastructure and European Equity Portfolios was better than the peer group averages for the one- and five-year periods but below the peer group averages for the three-year period.
Performance Conclusions
With respect to the Money Market, Limited Duration and Strategist Portfolios, after discussion, the Board concluded that performance was acceptable.
With respect to the Income Plus, Multi Cap Growth, Global Infrastructure, Aggressive Equity and European Equity Portfolios, after discussion, the Board concluded that performance was competitive with the peer group averages.
Fees and Expenses
The Board members discussed with the Adviser the level of the advisory and administration fees (together, the "management fee") for the Portfolios relative to comparable funds and/or other accounts advised by the Adviser and/or compared to their peers as determined by Lipper. In addition to the management fee, the Board also reviewed the Portfolios' total expense ratios. When a fund's management fee and/or its expense ratio are higher than comparable funds or peers, the Board and the Adviser discuss the reasons for this and, where appropriate, they discuss possible waivers and/or caps.
The Board noted that the management fees and total expense ratios for the Money Market, Limited Duration, Income Plus, Multi Cap Growth, Global Infrastructure, European Equity and Strategist Portfolios were lower than the peer group averages.
The Board noted for the Aggressive Equity Portfolio that the management fee and the total expense ratio was higher but close to its peer group average.
Fee and Expense Conclusions
With respect to the Money Market, Limited Duration, Income Plus, Multi Cap Growth, Global Infrastructure, Aggressive Equity, European Equity and Strategist Portfolios, after discussion, the Board concluded that the management fees and total expense ratios were competitive with the peer group averages.
22
Morgan Stanley Variable Investment Series
Investment Advisory Agreement Approval n June 30, 2012 (unaudited) continued
Economies of Scale
The Board considered the size and growth prospects of the Portfolios and how that relates to the Portfolios' total expense ratios and particularly the Portfolios' management fee rates (which, for all the Portfolios except Limited Duration, include one or more breakpoints). In conjunction with its review of the Adviser's profitability, the Board discussed with the Adviser how a change in assets can affect the efficiency or effectiveness of managing the Portfolios and whether the management fee level is appropriate relative to current and projected asset levels and/or whether the management fee structure reflects economies of scale as asset levels change. The Board has determined that its review of the actual and potential economies of scale of each Portfolio supports its decision to approve the Management Agreement.
Profitability of the Adviser and Affiliates
The Board considered information concerning the costs incurred and profits realized by the Adviser and its affiliates during the last year from their relationship with the Portfolios and during the last two years from their relationship with the Morgan Stanley Fund Complex and reviewed with the Adviser the cost allocation methodology used to determine the profitability of the Adviser and affiliates. The Board has determined that its review of the analysis of the Adviser's expenses and profitability supports its decision to approve the Management Agreement.
Other Benefits of the Relationship
The Board considered other benefits to the Adviser and its affiliates derived from their relationship with the Portfolios and other funds advised by the Adviser. These benefits may include, among other things, "float" benefits derived from handling of checks for purchases and sales, research received by the Adviser generated from commission dollars spent on funds' portfolio trading and fees for distribution and/or shareholder servicing. The Board reviewed with the Adviser each of these arrangements and the reasonableness of the Adviser's costs relative to the services performed. The Board has determined that its review of the other benefits received by the Adviser or its affiliates supports its decision to approve the Management Agreement.
Resources of the Adviser and Historical Relationship Between the Portfolios and the Adviser
The Board considered whether the Adviser is financially sound and has the resources necessary to perform its obligations under the Management Agreement. The Board also reviewed and considered the historical relationship between the Portfolios and the Adviser, including the organizational structure of the Adviser, the policies and procedures formulated and adopted by the Adviser for managing the Portfolios' operations and the Board's confidence in the competence and integrity of the senior managers and key personnel of the Adviser. The Board concluded that the Adviser has the financial resources necessary to fulfill its obligations under the Management Agreement and that it is beneficial for the Portfolios to continue their relationship with the Adviser.
23
Morgan Stanley Variable Investment Series
Investment Advisory Agreement Approval n June 30, 2012 (unaudited) continued
Other Factors and Current Trends
The Board considered the controls and procedures adopted and implemented by the Adviser and monitored by the Fund's Chief Compliance Officer and concluded that the conduct of business by the Adviser indicates a good faith effort on its part to adhere to high ethical standards in the conduct of the Fund's business.
General Conclusion
After considering and weighing all of the above factors, the Board concluded that it would be in the best interest of each Portfolio and its shareholders to approve renewal of the Management Agreement for another year. In reaching this conclusion the Board did not give particular weight to any single factor referenced above. The Board considered these factors over the course of numerous meetings, some of which were in executive session with only the independent Board members and their counsel present. It is possible that individual Board members may have weighed these factors differently in reaching their individual decisions to approve the Management Agreement.
24
Morgan Stanley Variable Investment Series - Money Market
Portfolio of Investments n June 30, 2012 (unaudited)
PRINCIPAL
AMOUNT
(000) | |
| | ANNUALIZED
YIELD
ON DATE OF
PURCHASE | | MATURITY
DATE | | VALUE | |
| | | Repurchase Agreements (54.7%) | |
| $ | 5,000 | | | ABN Amro Securities (USA) LLC,
(dated 06/29/12; proceeds $5,000,067;
fully collateralized by a U.S. Government
Obligation; U.S. Treasury Note 2.63%
due 12/31/14; valued at $5,100,040) | | | 0.16 | % | | 07/02/12 | | $ | 5,000,000 | | |
| | 2,000 | | | Bank of Montreal, (dated 06/19/12; proceeds
$2,000,198; fully collateralized by U.S.
Government Agencies; Federal National
Mortgage Association 4.00% due 08/01/22 -
12/01/40; valued at $2,067,723) | | | 0.17 | | | 07/10/12 | | | 2,000,000 | | |
| | 10,000 | | | Bank of Nova Scotia, (dated 06/29/12;
proceeds $10,000,125; fully collateralized
by a U.S. Government Obligation;
U.S. Treasury Note 0.63% due 07/15/14;
valued at $10,228,820) | | | 0.15 | | | 07/02/12 | | | 10,000,000 | | |
| | 11,208 | | | BNP Paribas Securities Corp., (dated 06/29/12;
proceeds $11,208,177; fully collateralized by
a U.S. Government Agency; Federal National
Mortgage Association 3.40% due 11/01/41;
valued at $11,528,888) | | | 0.19 | | | 07/02/12 | | | 11,208,000 | | |
| | 20,000 | | | Credit Agricole CIB, (dated 06/29/12; proceeds
$20,000,250; fully collateralized by a U.S.
Government Obligation; U.S. Treasury Strip
Zero Coupon due 04/04/13; valued
at $20,400,000) | | | 0.15 | | | 07/02/12 | | | 20,000,000 | | |
| | 5,000 | | | TD Securities (USA) LLC, (dated 06/28/12;
proceeds $5,000,136; fully collateralized
by a U.S. Government Obligation;
U.S. Treasury Bond 4.50% due 05/15/38;
valued at $5,100,011) | | | 0.14 | | | 07/05/12 | | | 5,000,000 | | |
| | | Total Repurchase Agreements
(Cost $53,208,000) | | | 53,208,000 | | |
| | | Commercial Paper (16.9%) | |
| | | International Banks | |
| | 1,000 | | | BNZ International Funding Ltd. (a) | | | 0.55 | | | 08/16/12 | | | 999,295 | | |
| | 1,000 | | | ING US Funding LLC | | | 0.42 | | | 07/06/12 | | | 999,931 | | |
| | 3,000 | | | National Australia Funding Corp. (a) | | | 0.13 | | | 07/05/12 | | | 2,999,946 | | |
| | 2,000 | | | NRW Bank (a) | | | 0.25 | | | 07/02/12 | | | 1,999,972 | | |
| | 500 | | | Oversea Chinese Banking | | | 0.48 | | | 01/02/13 | | | 498,786 | | |
See Notes to Financial Statements
25
Morgan Stanley Variable Investment Series - Money Market
Portfolio of Investments n June 30, 2012 (unaudited) continued
PRINCIPAL
AMOUNT
(000) | |
| | ANNUALIZED
YIELD
ON DATE OF
PURCHASE | | MATURITY
DATE | | VALUE | |
| $ | 4,500 | | | Rabobank USA Financial Corp. | | | 0.54 - 0.67 | % | | 07/30/12 - 10/02/12 | | $ | 4,496,676 | | |
| | 1,000 | | | Sumitomo Mitsui Banking Corp. (a) | | | 0.39 | | | 07/06/12 | | | 999,937 | | |
| | 1,000 | | | Toyota Motor Credit Corp. | | | 0.13 | | | 07/10/12 | | | 999,964 | | |
| | 2,500 | | | Westpac Banking Corp. (a) | | | 0.48 | | | 09/14/12 | | | 2,497,467 | | |
| | | Total Commercial Paper
(Cost $16,491,974) | | | 16,491,974 | | |
| | | Certificates of Deposit (13.4%) | |
| | | International Banks | |
| | 3,000 | | | Bank of Montreal | | | 0.16 | | | 07/06/12 | | | 3,000,000 | | |
| | 1,000 | | | Deutsche Bank AG | | | 0.52 | | | 10/18/12 | | | 1,000,000 | | |
| | 3,000 | | | Skandin Ens Banken | | | 0.44 - 0.49 | | | 08/15/12 - 09/07/12 | | | 2,999,990 | | |
| | 3,000 | | | Sumitomo Mitsui Banking Corp. | | | 0.36 - 0.38 | | | 07/06/12 - 08/01/12 | | | 3,000,000 | | |
| | 1,000 | | | Svenska Handelsbanken AB | | | 0.60 | | | 08/02/12 | | | 1,000,000 | | |
| | 2,000 | | | Toronto Dominion Bank | | | 0.17 | | | 07/19/12 - 07/20/12 | | | 2,000,000 | | |
| | | Total Certificates of Deposit
(Cost $12,999,990) | | | 12,999,990 | | |
| |
| | COUPON
RATE(b) | | DEMAND
DATE(c) | |
| |
| |
| | | Floating Rate Notes (12.9%) | |
| | | International Banks | |
| | 3,000 | | | Bank of Nova Scotia | | | 0.47 - 0.51 | % | | 07/26/12 - 10/02/12 | | 04/26/13 - 07/02/13 | | | 2,999,836 | | |
| | 4,000 | | | Barclays Bank PLC | | | 0.92 | | | 08/06/12 | | 11/05/12 | | | 4,000,000 | | |
| | 1,600 | | | Commonwealth Bank of
Australia (a) | | | 0.63 | | | 08/23/12 | | 11/16/12 | | | 1,600,883 | | |
| | 3,000 | | | Deutsche Bank AG | | | 0.67 | | | 09/17/12 | | 03/15/13 | | | 3,000,000 | | |
| | 1,000 | | | Westpac Banking Corp. | | | 0.48 | | | 07/05/12 | | 07/05/12 | | | 1,000,000 | | |
| | | | | Total Floating Rate Notes
(Cost $12,600,719) | | | | | | | | | 12,600,719 | | |
See Notes to Financial Statements
26
Morgan Stanley Variable Investment Series - Money Market
Portfolio of Investments n June 30, 2012 (unaudited) continued
PRINCIPAL
AMOUNT
(000) | |
| | COUPON
RATE(b) | | DEMAND
DATE(c) | | MATURITY
DATE | |
VALUE | |
| | | Tax-Exempt Instruments (3.1%) | |
| | | Weekly Variable Rate Bonds | |
| $ | 3,000 | | | Miami-Dade County, FL,
Professional Sports
Franchise Facilities
Tax Ser 2009 E
(Cost $3,000,000) | | | 0.18 | % | | 07/06/12 | | 10/01/48 | | $ | 3,000,000 | | |
| | | | | Total Investments
(Cost $98,300,683) | | | 101.0 | % | | | 98,300,683 | | |
| | | | | Liabilities in Excess of Other Assets | | | | | (1.0 | ) | | | (1,004,857 | ) | |
| | | Net Assets | | | | | 100.0 | % | | $ | 97,295,826 | | |
(a) 144A security — Certain conditions for public sale may exist. Unless otherwise noted, these securities are deemed to be liquid.
(b) Rate shown is the rate in effect at June 30, 2012.
(c) Date of next interest rate reset.
MATURITY SCHEDULE†
| 1 - 30 Days | | | 75 | % | |
| 31 - 60 Days | | | 14 | | |
| 61 - 90 Days | | | 7 | | |
| 91 - 120 Days | | | 3 | | |
| 121 + Days | | | 1 | | |
| | | | 100 | % | |
† As a percentage of total investments.
See Notes to Financial Statements
27
Morgan Stanley Variable Investment Series - Limited Duration
Portfolio of Investments n June 30, 2012 (unaudited)
PRINCIPAL
AMOUNT
(000) | |
| | COUPON
RATE | | MATURITY
DATE | | VALUE | |
| | | Corporate Bonds (54.9%) | |
| | | Basic Materials (2.9%) | |
| $ | 350 | | | Anglo American Capital PLC (United Kingdom) (a) | | | 9.375 | % | | 04/08/14 | | $ | 393,767 | | |
| | 190 | | | ArcelorMittal (Luxembourg) | | | 9.00 | | | 02/15/15 | | | 213,657 | | |
| | 230 | | | Barrick Gold Corp. (Canada) | | | 1.75 | | | 05/30/14 | | | 232,933 | | |
| | 115 | | | Ecolab, Inc. | | | 3.00 | | | 12/08/16 | | | 121,366 | | |
| | 260 | | | Kinross Gold Corp. (Canada) | | | 3.625 | | | 09/01/16 | | | 262,281 | | |
| | 350 | | | Potash Corp. of Saskatchewan, Inc. (Canada) | | | 5.25 | | | 05/15/14 | | | 376,353 | | |
| | | | | | 1,600,357 | | |
| | | Communications (5.3%) | |
| | 375 | | | AT&T, Inc. | | | 2.50 | | | 08/15/15 | | | 390,672 | | |
| | 300 | | | Comcast Corp. | | | 6.50 | | | 01/15/15 | | | 338,595 | | |
| | 215 | | | COX Communications, Inc. | | | 4.625 | | | 06/01/13 | | | 222,595 | | |
| | 220 | | | DirecTV Holdings LLC/DirecTV Financing Co., Inc. | | | 4.75 | | | 10/01/14 | | | 236,280 | | |
| | 290 | | | NBC Universal Media LLC | | | 2.10 | | | 04/01/14 | | | 295,277 | | |
| | 145 | | | News America, Inc. | | | 5.30 | | | 12/15/14 | | | 159,016 | | |
| | 200 | | | Time Warner Cable, Inc. | | | 8.25 | | | 02/14/14 | | | 222,762 | | |
| | 250 | | | Verizon Communications, Inc. | | | 1.25 | | | 11/03/14 | | | 253,221 | | |
| | 350 | | | Viacom, Inc. | | | 4.375 | | | 09/15/14 | | | 374,851 | | |
| | 340 | | | Vodafone Group PLC (United Kingdom) | | | 5.00 | | | 12/16/13 | | | 360,551 | | |
| | | | | | 2,853,820 | | |
| | | Consumer, Cyclical (2.6%) | |
| | 305 | | | Best Buy Co., Inc. | | | 3.75 | | | 03/15/16 | | | 298,029 | | |
| | 280 | | | Daimler Finance North America LLC (a) | | | 1.875 | | | 09/15/14 | | | 281,645 | | |
| | 220 | | | Home Depot, Inc. | | | 5.40 | | | 03/01/16 | | | 253,835 | | |
| | 430 | | | Volkswagen International Finance N.V.
(Germany) (a) | | | 1.625 | | | 03/22/15 | | | 431,775 | | |
| | 135 | | | Wesfarmers Ltd. (Australia) (a) | | | 2.983 | | | 05/18/16 | | | 139,101 | | |
| | | | | | 1,404,385 | | |
| | | Consumer, Non-Cyclical (8.1%) | |
| | 250 | | | Altria Group, Inc. | | | 4.125 | | | 09/11/15 | | | 271,549 | | |
| | 165 | | | Anheuser-Busch InBev Worldwide, Inc. (Belgium) | | | 4.125 | | | 01/15/15 | | | 177,929 | | |
| | 205 | | | Anheuser-Busch InBev Worldwide, Inc. (Belgium) | | | 5.375 | | | 11/15/14 | | | 226,123 | | |
| | 265 | | | Bacardi Ltd. (Bermuda) (a) | | | 7.45 | | | 04/01/14 | | | 292,680 | | |
| | 260 | | | Bunge Ltd. Finance Corp. | | | 5.35 | | | 04/15/14 | | | 274,469 | | |
| | 430 | | | Coca-Cola Co. (The) | | | 0.75 | | | 03/13/15 | | | 431,155 | | |
| | 330 | | | Delhaize Group SA (Belgium) | | | 5.875 | | | 02/01/14 | | | 347,630 | | |
| | 275 | | | Diageo Capital PLC (United Kingdom) | | | 1.50 | | | 05/11/17 | | | 276,335 | | |
| | 15 | | | Express Scripts Holding Co. (a) | | | 2.65 | | | 02/15/17 | | | 15,277 | | |
| | 200 | | | Express Scripts Holding Co. (a) | | | 2.75 | | | 11/21/14 | | | 204,396 | | |
See Notes to Financial Statements
28
Morgan Stanley Variable Investment Series - Limited Duration
Portfolio of Investments n June 30, 2012 (unaudited) continued
PRINCIPAL
AMOUNT
(000) | |
| | COUPON
RATE | | MATURITY
DATE | | VALUE | |
| $ | 350 | | | Gilead Sciences, Inc. | | | 3.05 | % | | 12/01/16 | | $ | 369,879 | | |
| | 120 | | | GlaxoSmithKline Capital PLC (United Kingdom) | | | 0.75 | | | 05/08/15 | | | 120,071 | | |
| | 300 | | | Kraft Foods, Inc. | | | 6.75 | | | 02/19/14 | | | 328,755 | | |
| | 225 | | | Kroger Co. (The) | | | 7.50 | | | 01/15/14 | | | 246,752 | | |
| | 370 | | | McKesson Corp. | | | 3.25 | | | 03/01/16 | | | 397,513 | | |
| | 175 | | | PepsiCo, Inc. | | | 0.75 | | | 03/05/15 | | | 174,636 | | |
| | 250 | | | Stryker Corp. | | | 2.00 | | | 09/30/16 | | | 256,396 | | |
| | | | | | 4,411,545 | | |
| | | Energy (3.1%) | |
| | 225 | | | Enterprise Products Operating LLC, Series O | | | 9.75 | | | 01/31/14 | | | 253,942 | | |
| | 380 | | | Marathon Petroleum Corp. | | | 3.50 | | | 03/01/16 | | | 398,673 | | |
| | 275 | | | Phillips 66 (a) | | | 1.95 | | | 03/05/15 | | | 277,149 | | |
| | 320 | | | Plains All American Pipeline L.P./PAA Finance Corp. | | | 4.25 | | | 09/01/12 | | | 321,471 | | |
| | 305 | | | Spectra Energy Capital LLC | | | 5.90 | | | 09/15/13 | | | 320,517 | | |
| | 100 | | | TransCanada PipeLines Ltd. (Canada) | | | 0.875 | | | 03/02/15 | | | 99,885 | | |
| | | | | | 1,671,637 | | |
| | | Finance (25.0%) | |
| | 265 | | | ABB Treasury Center USA, Inc. (Switzerland) (a) | | | 2.50 | | | 06/15/16 | | | 274,329 | | |
| | 255 | | | Abbey National Treasury Services PLC
(United Kingdom) | | | 2.875 | | | 04/25/14 | | | 248,782 | | |
| | 110 | | | Aflac, Inc. | | | 3.45 | | | 08/15/15 | | | 117,156 | | |
| | 475 | | | American Express Co. | | | 7.25 | | | 05/20/14 | | | 526,976 | | |
| | 260 | | | American International Group, Inc. | | | 3.65 | | | 01/15/14 | | | 265,699 | | |
| | 620 | | | Bank of America Corp., Series 1 | | | 3.75 | | | 07/12/16 | | | 625,622 | | |
| | 300 | | | Barclays Bank PLC (United Kingdom) | | | 5.20 | | | 07/10/14 | | | 316,229 | | |
| | 330 | | | BBVA Bancomer SA (Mexico) (a) | | | 4.50 | | | 03/10/16 | | | 333,300 | | |
| | 320 | | | BNP Paribas SA (France) | | | 3.60 | | | 02/23/16 | | | 323,954 | | |
| | 205 | | | BP Capital Markets PLC (United Kingdom) | | | 3.875 | | | 03/10/15 | | | 219,820 | | |
| | 390 | | | Canadian Imperial Bank of Commerce (Canada) | | | 1.45 | | | 09/13/13 | | | 393,962 | | |
| | 300 | | | Capital One Financial Corp. | | | 7.375 | | | 05/23/14 | | | 329,702 | | |
| | 405 | | | Citigroup, Inc. (See Note 6) | | | 4.45 | | | 01/10/17 | | | 424,972 | | |
| | 250 | | | Commonwealth Bank of Australia (Australia) | | | 1.95 | | | 03/16/15 | | | 251,777 | | |
| | 115 | | | Cooperatieve Centrale Raiffeisen-Boerenleenbank
BA (Netherlands) | | | 3.375 | | | 01/19/17 | | | 118,481 | | |
| | 340 | | | Credit Suisse (Switzerland) | | | 5.50 | | | 05/01/14 | | | 360,607 | | |
| | 355 | | | Deutsche Bank AG (Germany) | | | 2.375 | | | 01/11/13 | | | 357,185 | | |
| | 205 | | | DNB Bank ASA (Norway) (a) | | | 3.20 | | | 04/03/17 | | | 207,568 | | |
| | 975 | | | General Electric Capital Corp. | | | 2.95 | | | 05/09/16 | | | 1,007,046 | | |
| | 300 | | | Genworth Life Institutional Funding Trust (a) | | | 5.875 | | | 05/03/13 | | | 305,110 | | |
| | 425 | | | Goldman Sachs Group, Inc. (The) | | | 3.625 | | | 02/07/16 | | | 425,402 | | |
| | 250 | | | Harley-Davidson Funding Corp. (a) | | | 5.25 | | | 12/15/12 | | | 254,144 | | |
See Notes to Financial Statements
29
Morgan Stanley Variable Investment Series - Limited Duration
Portfolio of Investments n June 30, 2012 (unaudited) continued
PRINCIPAL
AMOUNT
(000) | |
| | COUPON
RATE | | MATURITY
DATE | | VALUE | |
| $ | 200 | | | HCP, Inc. | | | 2.70 | % | | 02/01/14 | | $ | 203,273 | | |
| | 350 | | | HSBC Finance Corp. | | | 5.25 | | | 04/15/15 | | | 374,793 | | |
| | 200 | | | ING Bank (Netherlands) (a) | | | 3.75 | | | 03/07/17 | | | 199,273 | | |
| | 425 | | | JPMorgan Chase & Co. | | | 1.875 | | | 03/20/15 | | | 424,951 | | |
| | 135 | | | JPMorgan Chase & Co. | | | 3.15 | | | 07/05/16 | | | 138,965 | | |
| | 200 | | | LVMH Moet Hennessy Louis Vuitton SA (France) (a) | | | 1.625 | | | 06/29/17 | | | 200,181 | | |
| | 230 | | | Macquarie Group Ltd. (Australia) (a) | | | 7.30 | | | 08/01/14 | | | 244,983 | | |
| | 200 | | | Metropolitan Life Global Funding I (See Note 6) (a) | | | 1.70 | | | 06/29/15 | | | 200,296 | | |
| | 325 | | | Metropolitan Life Global Funding I (See Note 6) (a) | | | 2.00 | | | 01/10/14 | | | 328,443 | | |
| | 350 | | | Monumental Global Funding III (a) | | | 5.25 | | | 01/15/14 | | | 371,443 | | |
| | 250 | | | National Australia Bank (Australia) | | | 2.00 | | | 03/09/15 | | | 250,797 | | |
| | 270 | | | Nationwide Building Society (United Kingdom) (a) | | | 4.65 | | | 02/25/15 | | | 279,706 | | |
| | 30 | | | Nissan Motor Acceptance Corp. (Japan) (a) | | | 3.25 | | | 01/30/13 | | | 30,294 | | |
| | 200 | | | Nordea Bank AB (Sweden) (a) | | | 2.25 | | | 03/20/15 | | | 200,853 | | |
| | 270 | | | Principal Financial Group, Inc. | | | 7.875 | | | 05/15/14 | | | 300,826 | | |
| | 320 | | | Prudential Financial, Inc., MTN | | | 4.75 | | | 09/17/15 | | | 344,773 | | |
| | 300 | | | Standard Chartered PLC (United Kingdom) (a) | | | 3.85 | | | 04/27/15 | | | 314,026 | | |
| | 250 | | | Svenska Handelsbanken AB (Sweden) | | | 2.875 | | | 04/04/17 | | | 253,713 | | |
| | 365 | | | UBS AG (Switzerland) | | | 3.875 | | | 01/15/15 | | | 377,408 | | |
| | 330 | | | US Bancorp | | | 2.20 | | | 11/15/16 | | | 340,695 | | |
| | 470 | | | Wells Fargo & Co. | | | 3.676 | | | 06/15/16 | | | 500,728 | | |
| | | | | | 13,568,243 | | |
| | | Industrials (3.7%) | |
| | 385 | | | Agilent Technologies, Inc. | | | 4.45 | | | 09/14/12 | | | 387,650 | | |
| | 200 | | | BAA Funding Ltd. (United Kingdom) (a) | | | 2.50 | | | 06/25/15 | | | 201,263 | | |
| | 200 | | | BAT International Finance PLC (United Kingdom) (a) | | | 1.40 | | | 06/05/15 | | | 200,119 | | |
| | 125 | | | Cardinal Health, Inc. | | | 1.90 | | | 06/15/17 | | | 126,084 | | |
| | 100 | | | Covidien International Finance SA | | | 1.35 | | | 05/29/15 | | | 100,201 | | |
| | 90 | | | Danaher Corp. | | | 1.30 | | | 06/23/14 | | | 90,980 | | |
| | 210 | | | Experian Finance PLC (United Kingdom) (a)(b) | | | 2.375 | | | 06/15/17 | | | 210,479 | | |
| | 75 | | | Kellogg Co. | | | 1.125 | | | 05/15/15 | | | 75,414 | | |
| | 150 | | | Kraft Foods Group, Inc. (a) | | | 1.625 | | | 06/04/15 | | | 151,695 | | |
| | 75 | | | McDonald's Corp. | | | 0.75 | | | 05/29/15 | | | 75,045 | | |
| | 60 | | | Tyco Electronics Group SA (Luxembourg) | | | 1.60 | | | 02/03/15 | | | 60,289 | | |
| | 45 | | | United Technologies Corp. | | | 1.20 | | | 06/01/15 | | | 45,556 | | |
| | 250 | | | Waste Management, Inc. | | | 2.60 | | | 09/01/16 | | | 256,796 | | |
| | | | | | 1,981,571 | | |
See Notes to Financial Statements
30
Morgan Stanley Variable Investment Series - Limited Duration
Portfolio of Investments n June 30, 2012 (unaudited) continued
PRINCIPAL
AMOUNT
(000) | |
| | COUPON
RATE | | MATURITY
DATE | | VALUE | |
| | | Technology (1.5%) | | | |
| $ | 160 | | | Applied Materials, Inc. | | | 2.65 | % | | 06/15/16 | | $ | 167,673 | | |
| | 285 | | | Hewlett-Packard Co. | | | 3.30 | | | 12/09/16 | | | 298,204 | | |
| | 330 | | | Texas Instruments, Inc. | | | 1.375 | | | 05/15/14 | | | 333,798 | | |
| | | | | | 799,675 | | |
| | | Utilities (2.7%) | | | |
| | 300 | | | Commonwealth Edison Co. | | | 1.625 | | | 01/15/14 | | | 304,159 | | |
| | 350 | | | Enel Finance International N.V. (Italy) (a) | | | 3.875 | | | 10/07/14 | | | 344,292 | | |
| | 215 | | | FirstEnergy Solutions Corp. | | | 4.80 | | | 02/15/15 | | | 228,378 | | |
| | 265 | | | NextEra Energy Capital Holdings, Inc. | | | 5.35 | | | 06/15/13 | | | 276,071 | | |
| | 320 | | | Sempra Energy | | | 2.00 | | | 03/15/14 | | | 325,139 | | |
| | | | | | 1,478,039 | | |
| | | | | Total Corporate Bonds
(Cost $29,649,561) | | | | | | | 29,769,272 | | |
| | | U.S. Treasury Securities (17.0%) | | | |
| | | U.S. Treasury Notes | | | |
| | 1,650 | | | | | | | | 0.75 | | | 06/15/14 | | | 1,663,923 | | |
| | 730 | | | | | | | | 0.875 | | | 12/31/16 | | | 736,673 | | |
| | 3,253 | | | | | | | | 1.25 | | | 10/31/15 | | | 3,334,579 | | |
| | 3,275 | | | | | | | | 2.25 | | | 03/31/16 | | | 3,483,270 | | |
| | | | | Total U.S. Treasury Securities
(Cost $9,217,033) | | | | | | | 9,218,445 | | |
| | | Asset-Backed Securities (16.1%) | | | |
| | | Ally Master Owner Trust | | | |
| | 100 | | | (a) | | | 1.992 | (c) | | 01/15/15 | | | 100,816 | | |
| | 200 | | | | | | | | 2.15 | | | 01/15/16 | | | 203,703 | | |
| | 225 | | | (a) | | | 2.88 | | | 04/15/15 | | | 228,047 | | |
| | 800 | | | American Express Credit Account Master Trust | | | 1.492 | (c) | | 03/15/17 | | | 820,391 | | |
| | 37 | | | ARI Fleet Lease Trust (a) | | | 1.692 | (c) | | 08/15/18 | | | 37,236 | | |
| | 807 | | | Capital One Multi-Asset Execution Trust | | | 0.322 | (c) | | 09/15/15 | | | 806,834 | | |
| | 225 | | | CarMax Auto Owner Trust | | | 1.29 | | | 09/15/15 | | | 226,314 | | |
| | 37 | | | Chesapeake Funding LLC (a) | | | 2.242 | (c) | | 12/15/20 | | | 37,376 | | |
| | 600 | | | Citibank Credit Card Issuance Trust (See Note 6) | | | 2.25 | | | 12/23/14 | | | 605,406 | | |
| | | CNH Equipment Trust | | | |
| | 421 | | | | | | | | 1.17 | | | 05/15/15 | | | 422,575 | | |
| | 40 | | | | | | | | 1.54 | | | 07/15/14 | | | 40,187 | | |
| | | Ford Credit Floorplan Master Owner Trust | | | |
| | 775 | | | | | | | | 1.792 | (c) | | 09/15/14 | | | 777,537 | | |
| | 375 | | | (a) | | | 4.20 | | | 02/15/17 | | | 405,063 | | |
See Notes to Financial Statements
31
Morgan Stanley Variable Investment Series - Limited Duration
Portfolio of Investments n June 30, 2012 (unaudited) continued
PRINCIPAL
AMOUNT
(000) | |
| | COUPON
RATE | | MATURITY
DATE | | VALUE | |
| $ | 330 | | | GE Dealer Floorplan Master Note Trust | | | 0.844 | (c)% | | 07/20/16 | | $ | 331,520 | | |
| | 214 | | | GE Equipment Midticket LLC (a) | | | 0.94 | | | 07/14/14 | | | 214,533 | | |
| | 555 | | | Harley-Davidson Motorcycle Trust | | | 1.16 | | | 02/15/15 | | | 556,110 | | |
| | 310 | | | Hyundai Auto Lease Securitization Trust 2011-A (a) | | | 1.02 | | | 08/15/14 | | | 311,072 | | |
| | 326 | | | Hyundai Auto Receivables Trust | | | 1.50 | | | 10/15/14 | | | 327,182 | | |
| | 294 | | | Macquarie Equipment Funding Trust (a) | | | 1.21 | | | 09/20/13 | | | 294,422 | | |
| | 118 | | | MMAF Equipment Finance LLC (a) | | | 2.37 | | | 11/15/13 | | | 118,123 | | |
| | | MMCA Automobile Trust | | | |
| | 225 | | | (a) | | | 1.22 | | | 01/15/15 | | | 225,786 | | |
| | 148 | | | (a) | | | 1.39 | | | 01/15/14 | | | 148,002 | | |
| | 531 | | | Nissan Auto Lease Trust | | | 1.12 | | | 12/15/13 | | | 532,265 | | |
| | 200 | | | Nissan Master Owner Trust Receivables (a) | | | 1.392 | (c) | | 01/15/15 | | | 201,149 | | |
| | | North Carolina State Education Assistance Authority | | | |
| | 216 | | | | | | 0.916 | (c) | | 01/25/21 | | | 216,133 | | |
| | 225 | | | | | | 1.266 | (c) | | 07/25/25 | | | 224,435 | | |
| | 100 | | | Panhandle-Plains Higher Education Authority, Inc. | | | 1.411 | (c) | | 07/01/24 | | | 100,356 | | |
| | 125 | | | Toyota Auto Receivables Owner Trust | | | 1.27 | | | 12/16/13 | | | 125,228 | | |
| | 32 | | | Wheels SPV LLC (a) | | | 1.792 | (c) | | 03/15/18 | | | 31,995 | | |
| | 60 | | | World Omni Automobile Lease Securitization Trust | | | 0.93 | | | 11/16/15 | | | 60,087 | | |
| | | | | Total Asset-Backed Securities
(Cost $8,637,600) | | | | | | | 8,729,883 | | |
| | | Non-U.S. Government - Guaranteed (4.5%) | | | |
| | 900 | | | Commonwealth Bank of Australia (Australia) (a) | | | 2.50 | | | 12/10/12 | | | 907,594 | | |
| | 1,545 | | | Swedbank AB (Sweden) (a) | | | 2.90 | | | 01/14/13 | | | 1,564,535 | | |
| | | | | Total Non-U.S. Government - Guaranteed
(Cost $1,880,889) | | | | | | | 2,472,129 | | |
| | | Agency Adjustable Rate Mortgages (3.6%) | | | |
| | 77 | | | Federal Home Loan Mortgage Corporation,
Conventional Pool | | | 5.433 | | | 01/01/38 | | | 83,212 | | |
| | | Federal National Mortgage Association,
Conventional Pools: | | | |
| | 386 | | | | | | 2.306 | | | 02/01/36 | | | 409,762 | | |
| | 250 | | | | | | 2.332 | | | 05/01/35 | | | 265,660 | | |
| | 644 | | | | | | 2.587 | | | 09/01/37 | | | 687,779 | | |
| | 465 | | | | | | 3.137 | | | 04/01/38 | | | 498,635 | | |
| | | | | Total Agency Adjustable Rate Mortgages
(Cost $1,936,597) | | | | | | | 1,945,048 | | |
See Notes to Financial Statements
32
Morgan Stanley Variable Investment Series - Limited Duration
Portfolio of Investments n June 30, 2012 (unaudited) continued
PRINCIPAL
AMOUNT
(000) | |
| | COUPON
RATE | | MATURITY
DATE | | VALUE | |
| | | Agency Fixed Rate Mortgages (0.7%) | |
| | | Federal National Mortgage Association,
Conventional Pools: | |
| $ | 191 | | | | | | | | 6.50 | % | | 01/01/32 - 11/01/33 | | $ | 219,530 | | |
| | 115 | | | | | | | | 7.00 | | | 08/01/29 - 06/01/32 | | | 136,674 | | |
| | | Total Agency Fixed Rate Mortgages
(Cost $320,393) | | | | | | | 356,204 | | |
| | | Collateralized Mortgage Obligation - Agency Collateral Series (0.6%) | |
| | 282 | | | Federal Home Loan Mortgage Corporation, REMIC
(Cost $301,340) | | | 7.50 | | | 09/15/29 | | | 332,012 | | |
| | | Municipal Bond (0.5%) | |
| | 300 | | | New Jersey Economic Development Authority
(Cost $300,000) | | | 1.468 | (c) | | 06/15/13 | | | 301,158 | | |
| | | Sovereign (0.4%) | |
| | 200 | | | Qatar Government International Bond (Qatar)
(Cost $211,500) (a) | | | 4.00 | | | 01/20/15 | | | 211,200 | | |
| | | Short-Term Investments (1.1%) | |
| | | U.S. Treasury Security (0.7%) | |
| | 385 | | | U.S. Treasury Bill
(Cost $384,914) (d)(e) | | | 0.136 | | | 08/30/12 | | | 384,970 | | |
NUMBER OF
SHARES (000)
| |
| |
| |
| |
| |
| | | Investment Company (0.4%) | |
| | 231 | | | Morgan Stanley Institutional Liquidity Funds - Money
Market Portfolio - Institutional Class (See Note 6)
(Cost $231,019) | | | 231,019 | | |
| | | Total Short-Term Investments
(Cost $615,933) | | | | | | | 615,989 | | |
| | | Total Investments
(Cost $53,070,846) (f) | | | | | 99.4 | % | | | 53,951,340 | | |
| | | Other Assets in Excess of Liabilities | | | | | 0.6 | | | | 312,584 | | |
| | | Net Assets | | | | | 100.0 | % | | $ | 54,263,924 | | |
See Notes to Financial Statements
33
Morgan Stanley Variable Investment Series - Limited Duration
Portfolio of Investments n June 30, 2012 (unaudited) continued
MTN Medium Term Note.
REMIC Real Estate Mortgage Investment Conduit.
(a) 144A security — Certain conditions for public sale may exist. Unless otherwise noted, these securities are deemed to be liquid.
(b) When-issued security.
(c) Variable/Floating Rate Security — Interest rate changes on these instruments are based on changes in a designated base rate. The rates shown are those in effect on June 30, 2012.
(d) Rate shown is the yield to maturity at June 30, 2012.
(e) A portion of this security has been physically segregated in connection with open futures contracts.
(f) Securities are available for collateral in connection with purchase of when-issued securities and futures contracts.
FUTURES CONTRACTS OPEN AT JUNE 30, 2012:
NUMBER OF
CONTRACTS | | LONG/SHORT | | DESCRIPTION, DELIVERY
MONTH AND YEAR | | UNDERLYING FACE
AMOUNT AT VALUE | | UNREALIZED
APPRECIATION
(DEPRECIATION) | |
| | 23 | | | Long | | U.S. Treasury 2 yr. Note,
Sep-12 | | $ | 5,064,313 | | | $ | (2,139 | ) | |
| | 40 | | | Long | | U.S. Treasury 5 yr. Note,
Sep-12 | | | 4,958,750 | | | | 7,844 | | |
| Net Unrealized Appreciation | | $ | 5,705 | | |
| LONG TERM CREDIT ANALYSIS++ | |
| AAA | | | 21.6 | % | |
| AA | | | 33.1 | | |
| A | | | 28.5 | | |
| BBB | | | 16.5 | | |
| Not Rated | | | 0.3 | | |
| | | | 100.0 | %+ | |
+ Does not include open long futures contracts with an underlying face amount of $10,023,063 with net unrealized appreciation of $5,705.
++ The ratings shown are based on the Portfolio's security ratings as determined by Standard & Poor's, Moody's or Fitch, each a Nationally Recognized Statistical Ratings Organization ("NRSRO").
See Notes to Financial Statements
34
Morgan Stanley Variable Investment Series - Income Plus
Portfolio of Investments n June 30, 2012 (unaudited)
PRINCIPAL
AMOUNT
(000) | |
| | COUPON
RATE | | MATURITY
DATE | | VALUE | |
| | | Corporate Bonds (96.3%) | |
| | | Basic Materials (6.0%) | |
| $ | 820 | | | ArcelorMittal (Luxembourg) | | | 9.85 | % | | 06/01/19 | | $ | 977,094 | | |
| EUR | 811 | | | ArcelorMittal, Series MT (Luxembourg) | | | 7.25 | | | 04/01/14 | | | 225,208 | | |
| $ | 540 | | | Barrick Gold Corp. (Canada) | | | 3.85 | | | 04/01/22 | | | 560,210 | | |
| | 1,570 | | | CF Industries, Inc. | | | 6.875 | | | 05/01/18 | | | 1,866,338 | | |
| | 575 | | | Eastman Chemical Co. | | | 3.60 | | | 08/15/22 | | | 587,674 | | |
| | 540 | | | FMG Resources August 2006 Pty Ltd.
(Australia) (a) | | | 6.375 | | | 02/01/16 | | | 549,450 | | |
| | 205 | | | FMG Resources August 2006 Pty Ltd.
(Australia) (a) | | | 6.875 | | | 02/01/18 | | | 207,819 | | |
| | 595 | | | Georgia-Pacific LLC | | | 8.875 | | | 05/15/31 | | | 841,060 | | |
| | 203 | | | Goldcorp, Inc. (Canada) | | | 2.00 | | | 08/01/14 | | | 229,644 | | |
| | 535 | | | Incitec Pivot Ltd. (Australia) (a) | | | 4.00 | | | 12/07/15 | | | 550,878 | | |
| | 600 | | | Inversiones CMPC SA (Chile) (a) | | | 4.50 | | | 04/25/22 | | | 596,871 | | |
| | 580 | | | Kinross Gold Corp. (Canada) | | | 5.125 | | | 09/01/21 | | | 587,855 | | |
| | 545 | | | Lubrizol Corp. | | | 8.875 | | | 02/01/19 | | | 745,027 | | |
| | 675 | | | LyondellBasell Industries N.V. (a) | | | 5.00 | | | 04/15/19 | | | 711,281 | | |
| | 1,000 | | | MeadWestvaco Corp. | | | 7.375 | | | 09/01/19 | | | 1,192,016 | | |
| | 290 | | | Syngenta Finance N.V. (Switzerland) | | | 4.375 | | | 03/28/42 | | | 313,460 | | |
| | 280 | | | Teck Resources Ltd. (Canada) | | | 6.25 | | | 07/15/41 | | | 314,593 | | |
| | 195 | | | Vale Overseas Ltd. (Brazil) | | | 6.875 | | | 11/21/36 | | | 227,166 | | |
| | 210 | | | Vale Overseas Ltd. (Brazil) | | | 6.875 | | | 11/10/39 | | | 246,409 | | |
| | | | | | 11,530,053 | | |
| | | Communications (11.4%) | |
| | 1,700 | | | AT&T, Inc. | | | 5.35 | | | 09/01/40 | | | 1,958,557 | | |
| | 875 | | | AT&T, Inc. | | | 6.30 | | | 01/15/38 | | | 1,093,707 | | |
| | 310 | | | Cablevision Systems Corp. | | | 7.75 | | | 04/15/18 | | | 331,700 | | |
| | 470 | | | CenturyLink, Inc. | | | 5.80 | | | 03/15/22 | | | 468,746 | | |
| | 655 | | | CenturyLink, Inc. | | | 6.45 | | | 06/15/21 | | | 682,734 | | |
| | 325 | | | CenturyLink, Inc., Series Q | | | 6.15 | | | 09/15/19 | | | 335,725 | | |
| | 920 | | | Comcast Corp. | | | 6.40 | | | 05/15/38 | | | 1,125,374 | | |
| | 625 | | | Corning, Inc. | | | 4.75 | | | 03/15/42 | | | 657,588 | | |
| | 195 | | | CSC Holdings LLC (a) | | | 6.75 | | | 11/15/21 | | | 208,650 | | |
| | 315 | | | Deutsche Telekom International Finance BV
(Germany) | | | 6.75 | | | 08/20/18 | | | 379,731 | | |
| | 300 | | | Deutsche Telekom International Finance BV
(Germany) | | | 8.75 | | | 06/15/30 | | | 417,491 | | |
| | 1,425 | | | DirecTV Holdings LLC/DirecTV
Financing Co., Inc. | | | 3.80 | | | 03/15/22 | | | 1,444,001 | | |
| | 510 | | | DISH DBS Corp. | | | 7.125 | | | 02/01/16 | | | 562,275 | | |
See Notes to Financial Statements
35
Morgan Stanley Variable Investment Series - Income Plus
Portfolio of Investments n June 30, 2012 (unaudited) continued
PRINCIPAL
AMOUNT
(000) | |
| | COUPON
RATE | | MATURITY
DATE | | VALUE | |
| $ | 381 | | | Liberty Interactive LLC | | | 3.125 | % | | 03/30/23 | | $ | 467,201 | | |
| | 600 | | | Motorola Solutions, Inc. | | | 3.75 | | | 05/15/22 | | | 592,911 | | |
| | 1,045 | | | NBC Universal Media LLC | | | 4.375 | | | 04/01/21 | | | 1,151,738 | | |
| | 200 | | | News America, Inc. | | | 6.40 | | | 12/15/35 | | | 231,337 | | |
| | 575 | | | Omnicom Group, Inc. | | | 3.625 | | | 05/01/22 | | | 585,461 | | |
| | 263 | | | Priceline.com, Inc. (a) | | | 1.00 | | | 03/15/18 | | | 278,451 | | |
| | 260 | | | Qwest Corp. | | | 6.875 | | | 09/15/33 | | | 260,000 | | |
| | 213 | | | Sable International Finance Ltd.
(United Kingdom) (a) | | | 7.75 | | | 02/15/17 | | | 221,520 | | |
| | 351 | | | SBA Communications Corp. | | | 1.875 | | | 05/01/13 | | | 487,890 | | |
| | 198 | | | SBA Telecommunications, Inc. | | | 8.25 | | | 08/15/19 | | | 217,800 | | |
| | 350 | | | Symantec Corp., Series B | | | 1.00 | | | 06/15/13 | | | 360,063 | | |
| | 655 | | | Telecom Italia Capital SA (Italy) | | | 7.175 | | | 06/18/19 | | | 655,000 | | |
| | 375 | | | Telefonaktiebolaget LM Ericsson (Sweden) | | | 4.125 | | | 05/15/22 | | | 376,794 | | |
| | 580 | | | Telefonica Europe BV (Spain) | | | 8.25 | | | 09/15/30 | | | 562,307 | | |
| | 1,200 | | | Time Warner Cable, Inc. | | | 6.75 | | | 07/01/18 | | | 1,463,671 | | |
| | 610 | | | Time Warner, Inc. | | | 6.50 | | | 11/15/36 | | | 724,282 | | |
| | 1,295 | | | Time Warner, Inc. | | | 7.70 | | | 05/01/32 | | | 1,695,863 | | |
| | 150 | | | Verizon Communications, Inc. | | | 6.40 | | | 02/15/38 | | | 195,475 | | |
| | 715 | | | Verizon Communications, Inc. | | | 8.95 | | | 03/01/39 | | | 1,181,617 | | |
| | 335 | | | Vivendi SA (France) (a) | | | 6.625 | | | 04/04/18 | | | 370,741 | | |
| | | | | | 21,746,401 | | |
| | | Consumer, Cyclical (4.9%) | |
| | 1,105 | | | Chrysler Group LLC/CG Co-Issuer, Inc. | | | 8.00 | | | 06/15/19 | | | 1,140,913 | | |
| | 395 | | | Daimler Finance North America LLC
(Germany) | | | 8.50 | | | 01/18/31 | | | 605,996 | | |
| | 925 | | | Gap, Inc. (The) | | | 5.95 | | | 04/12/21 | | | 960,404 | | |
| | 105 | | | Ingram Micro, Inc. | | | 5.25 | | | 09/01/17 | | | 112,692 | | |
| | 208 | | | International Game Technology | | | 3.25 | | | 05/01/14 | | | 230,620 | | |
| | 285 | | | Levi Strauss & Co. | | | 7.625 | | | 05/15/20 | | | 304,238 | | |
| | 350 | | | Macy's Retail Holdings, Inc. | | | 3.875 | | | 01/15/22 | | | 368,699 | | |
| | 1,450 | | | McDonald's Corp. | | | 2.625 | | | 01/15/22 | | | 1,479,497 | | |
| | 620 | | | QVC, Inc. (a) | | | 7.125 | | | 04/15/17 | | | 658,748 | | |
| | 565 | | | Volkswagen International Finance N.V.
(Germany) (a) | | | 2.375 | | | 03/22/17 | | | 574,580 | | |
| | 780 | | | Wyndham Worldwide Corp. | | | 4.25 | | | 03/01/22 | | | 786,927 | | |
| | 500 | | | Wynn Las Vegas LLC/Wynn Las Vegas
Capital Corp. (a) | | | 5.375 | | | 03/15/22 | | | 503,750 | | |
| | 265 | | | Wynn Las Vegas LLC/Wynn Las Vegas
Capital Corp. | | | 7.75 | | | 08/15/20 | | | 294,813 | | |
| | 1,040 | | | Yum! Brands, Inc. | | | 6.875 | | | 11/15/37 | | | 1,382,073 | | |
| | | | | | 9,403,950 | | |
See Notes to Financial Statements
36
Morgan Stanley Variable Investment Series - Income Plus
Portfolio of Investments n June 30, 2012 (unaudited) continued
PRINCIPAL
AMOUNT
(000) | |
| | COUPON
RATE | | MATURITY
DATE | | VALUE | |
| | | Consumer, Non-Cyclical (8.6%) | |
| $ | 245 | | | Amgen, Inc. | | | 3.875 | % | | 11/15/21 | | $ | 259,194 | | |
| | 950 | | | BAT International Finance PLC
(United Kingdom) (a) | | | 2.125 | | | 06/07/17 | | | 949,853 | | |
| | 795 | | | Boston Scientific Corp. | | | 6.00 | | | 01/15/20 | | | 949,609 | | |
| | 720 | | | Cigna Corp. | | | 5.375 | | | 02/15/42 | | | 768,973 | | |
| | 220 | | | Covidien International Finance SA | | | 3.20 | | | 06/15/22 | | | 227,296 | | |
| | 1,185 | | | Delhaize Group SA (Belgium) | | | 5.70 | | | 10/01/40 | | | 998,602 | | |
| | 475 | | | Diageo Investment Corp. (United Kingdom) | | | 2.875 | | | 05/11/22 | | | 488,990 | | |
| | 690 | | | Express Scripts Holding Co. (a) | | | 2.65 | | | 02/15/17 | | | 702,744 | | |
| | 370 | | | Express Scripts Holding Co. (a) | | | 3.90 | | | 02/15/22 | | | 384,278 | | |
| | 420 | | | Gilead Sciences, Inc. | | | 1.00 | | | 05/01/14 | | | 523,950 | | |
| | 320 | | | Gilead Sciences, Inc. | | | 5.65 | | | 12/01/41 | | | 374,437 | | |
| | 490 | | | Grupo Bimbo SAB de CV (Mexico) (a) | | | 4.875 | | | 06/30/20 | | | 545,074 | | |
| | 700 | | | Kraft Foods, Inc. | | | 6.875 | | | 02/01/38 | | | 918,596 | | |
| | 400 | | | Kraft Foods, Inc. | | | 6.875 | | | 01/26/39 | | | 521,518 | | |
| | 415 | | | Life Technologies Corp. | | | 6.00 | | | 03/01/20 | | | 487,628 | | |
| | 835 | | | Lorillard Tobacco Co. | | | 8.125 | | | 06/23/19 | | | 1,037,726 | | |
| | 875 | | | PepsiCo, Inc. | | | 2.75 | | | 03/05/22 | | | 885,015 | | |
| | 600 | | | Philip Morris International, Inc. | | | 4.50 | | | 03/20/42 | | | 640,758 | | |
| | 550 | | | SABMiller Holdings, Inc. (a) | | | 3.75 | | | 01/15/22 | | | 586,075 | | |
| | 305 | | | SABMiller Holdings, Inc. (a) | | | 4.95 | | | 01/15/42 | | | 338,959 | | |
| | 800 | | | Sigma Alimentos SA de CV (Mexico) (a) | | | 5.625 | | | 04/14/18 | | | 866,000 | | |
| | 260 | | | Smithfield Foods, Inc. | | | 4.00 | | | 06/30/13 | | | 290,550 | | |
| | 665 | | | Teva Pharmaceutical Finance IV BV (Israel) | | | 3.65 | | | 11/10/21 | | | 700,820 | | |
| | 520 | | | TreeHouse Foods, Inc. | | | 7.75 | | | 03/01/18 | | | 564,850 | | |
| | 630 | | | Verisk Analytics, Inc. | | | 5.80 | | | 05/01/21 | | | 704,371 | | |
| | 280 | | | Vertex Pharmaceuticals, Inc. | | | 3.35 | | | 10/01/15 | | | 367,150 | | |
| | 235 | | | Viropharma, Inc. | | | 2.00 | | | 03/15/17 | | | 334,288 | | |
| | | | | | 16,417,304 | | |
| | | Energy (8.3%) | |
| | 356 | | | Alpha Natural Resources, Inc. | | | 2.375 | | | 04/15/15 | | | 303,045 | | |
| | 85 | | | Alpha Natural Resources, Inc. | | | 6.00 | | | 06/01/19 | | | 72,888 | | |
| | 370 | | | Alpha Natural Resources, Inc. | | | 6.25 | | | 06/01/21 | | | 314,500 | | |
| | 1,075 | | | BP Capital Markets PLC (United Kingdom) | | | 3.245 | | | 05/06/22 | | | 1,115,387 | | |
| | 450 | | | Canadian Natural Resources Ltd. (Canada) | | | 6.25 | | | 03/15/38 | | | 553,228 | | |
| | 225 | | | Canadian Oil Sands Ltd. (Canada) (a) | | | 6.00 | | | 04/01/42 | | | 239,569 | | |
| | 550 | | | Canadian Oil Sands Ltd. (Canada) (a) | | | 7.75 | | | 05/15/19 | | | 675,056 | | |
| | 394 | | | Chesapeake Energy Corp. | | | 2.75 | | | 11/15/35 | | | 361,987 | | |
| | 300 | | | Chesapeake Energy Corp. | | | 6.775 | | | 03/15/19 | | | 292,875 | | |
| | 150 | | | Concho Resources, Inc. | | | 7.00 | | | 01/15/21 | | | 161,250 | | |
See Notes to Financial Statements
37
Morgan Stanley Variable Investment Series - Income Plus
Portfolio of Investments n June 30, 2012 (unaudited) continued
PRINCIPAL
AMOUNT
(000) | |
| | COUPON
RATE | | MATURITY
DATE | | VALUE | |
| $ | 745 | | | Continental Resources, Inc. | | | 7.125 | % | | 04/01/21 | | $ | 834,400 | | |
| | 275 | | | Enterprise Products Operating LLC | | | 5.25 | | | 01/31/20 | | | 315,512 | | |
| | 850 | | | Enterprise Products Operating LLC | | | 5.95 | | | 02/01/41 | | | 964,731 | | |
| | 490 | | | EQT Corp. | | | 4.875 | | | 11/15/21 | | | 501,440 | | |
| | 500 | | | Halliburton Co. | | | 4.50 | | | 11/15/41 | | | 526,482 | | |
| | 325 | | | Marathon Petroleum Corp. | | | 5.125 | | | 03/01/21 | | | 364,516 | | |
| | 775 | | | Marathon Petroleum Corp. | | | 6.50 | | | 03/01/41 | | | 883,790 | | |
| | 325 | | | MarkWest Energy Partners LP/MarkWest
Energy Finance Corp. | | | 6.25 | | | 06/15/22 | | | 336,375 | | |
| | 820 | | | Murphy Oil Corp. | | | 4.00 | | | 06/01/22 | | | 836,798 | | |
| | 925 | | | Phillips 66 (a) | | | 4.30 | | | 04/01/22 | | | 975,010 | | |
| | 1,095 | | | Plains All American Pipeline LP/PAA
Finance Corp. | | | 6.70 | | | 05/15/36 | | | 1,284,260 | | |
| | 675 | | | Plains All American Pipeline LP/PAA
Finance Corp. | | | 8.75 | | | 05/01/19 | | | 891,489 | | |
| | 355 | | | Sinopec Group Overseas Development 2012
Ltd. (China) (a)(b) | | | 2.75 | | | 05/17/17 | | | 361,901 | | |
| | 225 | | | Spectra Energy Capital LLC | | | 8.00 | | | 10/01/19 | | | 288,652 | | |
| | 900 | | | Total Capital International SA (France) | | | 2.875 | | | 02/17/22 | | | 914,393 | | |
| | 700 | | | Valero Energy Corp. | | | 6.125 | | | 02/01/20 | | | 809,439 | | |
| | 550 | | | Weatherford International Ltd. | | | 4.50 | | | 04/15/22 | | | 564,786 | | |
| | | | | | 15,743,759 | | |
| | | Finance (38.8%) | |
| EUR | 200 | | | Aabar Investments PJSC (United Arab Emirates) | | | 4.00 | | | 05/27/16 | | | 241,331 | | |
| $ | 630 | | | ABN Amro Bank N.V. (Netherlands) (a) | | | 4.25 | | | 02/02/17 | | | 643,009 | | |
| | 1,125 | | | Aegon N.V. (Netherlands) | | | 4.625 | | | 12/01/15 | | | 1,201,455 | | |
| | 264 | | | Affiliated Managers Group, Inc. | | | 3.95 | | | 08/15/38 | | | 286,110 | | |
| | 475 | | | Alexandria Real Estate Equities, Inc. | | | 4.60 | | | 04/01/22 | | | 487,283 | | |
| | 1,285 | | | American Financial Group, Inc. | | | 9.875 | | | 06/15/19 | | | 1,615,911 | | |
| | 1,000 | | | American Honda Finance Corp. (a) | | | 2.125 | | | 02/28/17 | | | 1,012,807 | | |
| | 720 | | | American International Group, Inc. | | | 6.40 | | | 12/15/20 | | | 816,015 | | |
| | 1,415 | | | Amgen, Inc. | | | 2.125 | | | 05/15/17 | | | 1,433,261 | | |
| | 432 | | | Ares Capital Corp. (a) | | | 5.75 | | | 02/01/16 | | | 441,720 | | |
| | 1,150 | | | Banco de Credito del Peru (Peru) (a) | | | 4.75 | | | 03/16/16 | | | 1,187,375 | | |
| | 990 | | | Banco Votorantim SA (Brazil) (a) | | | 5.25 | | | 02/11/16 | | | 1,017,225 | | |
| | 780 | | | Barclays Bank PLC (United Kingdom) (a) | | | 6.05 | | | 12/04/17 | | | 791,757 | | |
| | 1,135 | | | BBVA Bancomer SA (Mexico) (a) | | | 4.50 | | | 03/10/16 | | | 1,146,350 | | |
| | 610 | | | Bear Stearns Cos. LLC (The) | | | 5.55 | | | 01/22/17 | | | 659,047 | | |
| | 300 | | | Billion Express Investments Ltd. (China) (b) | | | 0.75 | | | 10/18/15 | | | 297,375 | | |
| | 540 | | | BNP Paribas SA (France) | | | 5.00 | | | 01/15/21 | | | 555,279 | | |
| | 490 | | | Brookfield Asset Management, Inc. (Canada) | | | 5.80 | | | 04/25/17 | | | 533,857 | | |
See Notes to Financial Statements
38
Morgan Stanley Variable Investment Series - Income Plus
Portfolio of Investments n June 30, 2012 (unaudited) continued
PRINCIPAL
AMOUNT
(000) | |
| | COUPON
RATE | | MATURITY
DATE | | VALUE | |
| $ | 780 | | | Capital One Bank, USA NA | | | 8.80 | % | | 07/15/19 | | $ | 983,638 | | |
| | 800 | | | Capital One Capital VI | | | 8.875 | | | 05/15/40 | | | 817,000 | | |
| | 970 | | | CIT Group, Inc. | | | 5.00 | | | 05/15/17 | | | 999,706 | | |
| | 1,735 | | | Citigroup, Inc. (See Note 6) | | | 5.875 | | | 05/29/37 | | | 1,896,870 | | |
| | 1,230 | | | Citigroup, Inc. (See Note 6) | | | 8.50 | | | 05/22/19 | | | 1,521,142 | | |
| | 700 | | | CNA Financial Corp. | | | 7.35 | | | 11/15/19 | | | 829,321 | | |
| | 680 | | | Cooperatieve Centrale Raiffeisen-Boerenleenbank
BA (Netherlands) | | | 3.875 | | | 02/08/22 | | | 693,099 | | |
| | 260 | | | Cooperatieve Centrale Raiffeisen-Boerenleenbank
BA (Netherlands) (a) | | | 11.00 | (c) | | 06/30/19(d) | | | 328,783 | | |
| | 600 | | | Credit Agricole SA (France) (a) | | | 8.375 | (c) | | 10/13/19(d) | | | 499,500 | | |
| | 765 | | | Credit Suisse (Switzerland) | | | 5.40 | | | 01/14/20 | | | 796,880 | | |
| | 280 | | | Credit Suisse (Switzerland) | | | 6.00 | | | 02/15/18 | | | 299,948 | | |
| | 800 | | | Dexus Diversified Trust/Dexus Office Trust
(Australia) (a) | | | 5.60 | | | 03/15/21 | | | 830,304 | | |
| | 425 | | | Discover Bank | | | 7.00 | | | 04/15/20 | | | 495,404 | | |
| | 715 | | | Discover Bank | | | 8.70 | | | 11/18/19 | | | 889,574 | | |
| | 990 | | | DNB Bank ASA (Norway) (a) | | | 3.20 | | | 04/03/17 | | | 1,002,401 | | |
| | 270 | | | ERP Operating LP | | | 4.625 | | | 12/15/21 | | | 293,820 | | |
| | 750 | | | Farmers Insurance Exchange (a) | | | 8.625 | | | 05/01/24 | | | 975,820 | | |
| | 1,060 | | | Ford Motor Credit Co., LLC (a) | | | 4.207 | | | 04/15/16 | | | 1,101,641 | | |
| | 600 | | | Ford Motor Credit Co., LLC | | | 5.00 | | | 05/15/18 | | | 638,629 | | |
| | 400 | | | Ford Motor Credit Co., LLC | | | 5.875 | | | 08/02/21 | | | 445,797 | | |
| | 545 | | | General Electric Capital Corp. | | | 5.30 | | | 02/11/21 | | | 612,769 | | |
| | 1,550 | | | General Electric Capital Corp., MTN | | | 5.875 | | | 01/14/38 | | | 1,785,642 | | |
| | 1,650 | | | General Electric Capital Corp., Series G | | | 6.00 | | | 08/07/19 | | | 1,933,472 | | |
| | 1,195 | | | Genworth Financial, Inc. | | | 7.70 | | | 06/15/20 | | | 1,182,388 | | |
| | 565 | | | Goldman Sachs Group, Inc. (The) | | | 5.75 | | | 01/24/22 | | | 597,515 | | |
| | 815 | | | Goldman Sachs Group, Inc. (The) | | | 6.15 | | | 04/01/18 | | | 884,598 | | |
| | 1,565 | | | Goldman Sachs Group, Inc. (The) | | | 6.75 | | | 10/01/37 | | | 1,538,364 | | |
| | 950 | | | Goodman Funding Pty Ltd. (Australia) (a) | | | 6.375 | | | 04/15/21 | | | 991,372 | | |
| | 550 | | | Harley-Davidson Funding Corp. (a) | | | 6.80 | | | 06/15/18 | | | 656,528 | | |
| | 600 | | | Hartford Financial Services Group, Inc. | | | 5.50 | | | 03/30/20 | | | 627,419 | | |
| | 1,675 | | | HBOS PLC, Series G (United Kingdom) (a) | | | 6.75 | | | 05/21/18 | | | 1,582,156 | | |
| | 185 | | | HCP, Inc. | | | 5.625 | | | 05/01/17 | | | 204,490 | | |
| | 300 | | | Health Care REIT, Inc. | | | 4.75 | | | 07/15/27 | | | 353,250 | | |
| | 485 | | | HSBC Finance Corp. | | | 6.676 | | | 01/15/21 | | | 525,976 | | |
| | 1,890 | | | HSBC Holdings PLC (United Kingdom) | | | 4.00 | | | 03/30/22 | | | 1,966,528 | | |
| | 705 | | | HSBC Holdings PLC (United Kingdom) | | | 6.50 | | | 05/02/36 | | | 779,709 | | |
| | 595 | | | Huntington Bancshares, Inc. | | | 7.00 | | | 12/15/20 | | | 697,840 | | |
| | 575 | | | ING Bank (Netherlands) (a) | | | 3.75 | | | 03/07/17 | | | 572,911 | | |
See Notes to Financial Statements
39
Morgan Stanley Variable Investment Series - Income Plus
Portfolio of Investments n June 30, 2012 (unaudited) continued
PRINCIPAL
AMOUNT
(000) | |
| | COUPON
RATE | | MATURITY
DATE | | VALUE | |
| $ | 945 | | | International Lease Finance Corp. | | | 6.25 | % | | 05/15/19 | | $ | 962,955 | | |
| | 1,325 | | | JPMorgan Chase & Co. | | | 4.50 | | | 01/24/22 | | | 1,430,103 | | |
| | 660 | | | JPMorgan Chase Capital XXVII | | | 7.00 | | | 11/01/39 | | | 661,650 | | |
| | 260 | | | Lloyds TSB Bank PLC (United Kingdom) | | | 6.375 | | | 01/21/21 | | | 295,147 | | |
| | 500 | | | Mack-Cali Realty LP | | | 4.50 | | | 04/18/22 | | | 514,033 | | |
| | 710 | | | Macquarie Bank Ltd. (Australia) (a) | | | 6.625 | | | 04/07/21 | | | 713,071 | | |
| | 705 | | | Macquarie Group Ltd. (Australia) (a) | | | 6.00 | | | 01/14/20 | | | 702,402 | | |
| | 930 | | | Merrill Lynch & Co., Inc. | | | 7.75 | | | 05/14/38 | | | 1,063,989 | | |
| | 3,625 | | | Merrill Lynch & Co., Inc., MTN | | | 6.875 | | | 04/25/18 | | | 4,061,051 | | |
| | 600 | | | Metlife Capital Trust IV (See Note 6) (a) | | | 7.875 | | | 12/15/37 | | | 669,000 | | |
| | 840 | | | Mizuho Corporate Bank Ltd. (Japan) (a) | | | 2.55 | | | 03/17/17 | | | 853,196 | | |
| | 1,315 | | | Nationwide Building Society
(United Kingdom) (a) | | | 6.25 | | | 02/25/20 | | | 1,420,698 | | |
| | 525 | | | Nationwide Financial Services (a) | | | 5.375 | | | 03/25/21 | | | 543,995 | | |
| | 1,100 | | | Nordea Bank AB (Sweden) (a) | | | 4.875 | | | 05/13/21 | | | 1,073,673 | | |
| | 370 | | | Platinum Underwriters Finance, Inc., Series B | | | 7.50 | | | 06/01/17 | | | 405,635 | | |
| | 1,025 | | | Principal Financial Group, Inc. | | | 8.875 | | | 05/15/19 | | | 1,330,382 | | |
| | 925 | | | Protective Life Corp. | | | 7.375 | | | 10/15/19 | | | 1,070,684 | | |
| | 635 | | | Prudential Financial, Inc., MTN | | | 6.625 | | | 12/01/37 | | | 720,546 | | |
| | 775 | | | QBE Capital Funding III Ltd. (Australia) (a) | | | 7.25 | (c) | | 05/24/41 | | | 700,479 | | |
| | 785 | | | Royal Bank of Scotland PLC (The)
(United Kingdom) | | | 4.875 | | | 03/16/15 | | | 812,789 | | |
| | 360 | | | Santander Holdings USA, Inc. (Spain) | | | 4.625 | | | 04/19/16 | | | 348,185 | | |
| | 700 | | | Santander US Debt SAU (Spain) (a) | | | 3.724 | | | 01/20/15 | | | 651,466 | | |
| | 1,060 | | | SLM Corp., MTN | | | 6.25 | | | 01/25/16 | | | 1,118,300 | | |
| | 495 | | | SLM Corp., MTN | | | 8.00 | | | 03/25/20 | | | 544,500 | | |
| | 885 | | | Standard Chartered Bank (United Kingdom) (a) | | | 6.40 | | | 09/26/17 | | | 987,625 | | |
| | 900 | | | Svenska Handelsbanken AB (Sweden) | | | 2.875 | | | 04/04/17 | | | 913,366 | | |
| | 250 | | | Wachovia Bank NA | | | 6.60 | | | 01/15/38 | | | 316,594 | | |
| | 900 | | | Wells Operating Partnership II LP | | | 5.875 | | | 04/01/18 | | | 936,877 | | |
| | | | | | 74,021,762 | | |
| | | Industrials (10.7%) | |
| | 415 | | | ABB Finance USA, Inc. (Switzerland) | | | 2.875 | | | 05/08/22 | | | 420,692 | | |
| | 522 | | | Anixter, Inc. | | | 5.625 | | | 05/01/19 | | | 541,575 | | |
| | 1,060 | | | BAA Funding Ltd. (United Kingdom) (a) | | | 4.875 | | | 07/15/21 | | | 1,120,633 | | |
| | 540 | | | Ball Corp. | | | 7.375 | | | 09/01/19 | | | 599,400 | | |
| | 500 | | | Bemis Co., Inc. | | | 4.50 | | | 10/15/21 | | | 540,624 | | |
| | 255 | | | Bombardier, Inc. (Canada) (a) | | | 7.50 | | | 03/15/18 | | | 280,819 | | |
| | 505 | | | Bombardier, Inc. (Canada) (a) | | | 7.75 | | | 03/15/20 | | | 564,338 | | |
| | 675 | | | Boston Properties LP | | | 3.85 | | | 02/01/23 | | | 682,784 | | |
| | 1,000 | | | Burlington Northern Santa Fe LLC | | | 3.05 | | | 03/15/22 | | | 1,011,064 | | |
See Notes to Financial Statements
40
Morgan Stanley Variable Investment Series - Income Plus
Portfolio of Investments n June 30, 2012 (unaudited) continued
PRINCIPAL
AMOUNT
(000) | |
| | COUPON
RATE | | MATURITY
DATE | | VALUE | |
| $ | 885 | | | Cardinal Health, Inc. | | | 1.90 | % | | 06/15/17 | | $ | 892,676 | | |
| | 300 | | | Comcast Corp. (e) | | | 4.65 | | | 07/15/42 | | | 301,349 | | |
| | 820 | | | CRH America, Inc. | | | 6.00 | | | 09/30/16 | | | 898,452 | | |
| | 480 | | | CRH America, Inc. | | | 8.125 | | | 07/15/18 | | | 572,471 | | |
| | 585 | | | Crown Americas LLC/Crown Americas
Capital Corp. III | | | 6.25 | | | 02/01/21 | | | 642,037 | | |
| | 630 | | | Deere & Co. | | | 3.90 | | | 06/09/42 | | | 628,658 | | |
| | 450 | | | Discovery Communications LLC | | | 3.30 | | | 05/15/22 | | | 455,101 | | |
| | 645 | | | Experian Finance PLC (United Kingdom) (a)(e) | | | 2.375 | | | 06/15/17 | | | 646,472 | | |
| | 248 | | | General Cable Corp. | | | 4.50 | | | 11/15/29 | | | 242,730 | | |
| | 545 | | | Holcim US Finance Sarl & Cie SCS
(Switzerland) (a) | | | 6.00 | | | 12/30/19 | | | 572,264 | | |
| | 975 | | | International Business Machines Corp. | | | 1.875 | | | 05/15/19 | | | 986,947 | | |
| | 950 | | | Koninklijke Philips Electronics N.V.
(Netherlands) | | | 3.75 | | | 03/15/22 | | | 987,988 | | |
| | 915 | | | L-3 Communications Corp. | | | 4.95 | | | 02/15/21 | | | 991,278 | | |
| | 670 | | | Lafarge SA (France) (a) | | | 6.20 | | | 07/09/15 | | | 717,282 | | |
| | 750 | | | Odebrecht Finance Ltd. (Brazil) (a) | | | 6.00 | | | 04/05/23 | | | 793,725 | | |
| | 374 | | | Owens-Brockway Glass Container, Inc. (a) | | | 3.00 | | | 06/01/15 | | | 359,040 | | |
| | 675 | | | Pioneer Natural Resources Co. | | | 3.95 | | | 07/15/22 | | | 677,996 | | |
| | 950 | | | Republic Services, Inc. | | | 3.55 | | | 06/01/22 | | | 962,264 | | |
| | 135 | | | Sonoco Products Co. | | | 4.375 | | | 11/01/21 | | | 142,660 | | |
| | 470 | | | Sonoco Products Co. | | | 5.75 | | | 11/01/40 | | | 534,574 | | |
| | 525 | | | United Technologies Corp. | | | 4.50 | | | 06/01/42 | | | 579,122 | | |
| | 975 | | | URS Corp. (a) | | | 3.85 | | | 04/01/17 | | | 963,873 | | |
| | | | | | 20,310,888 | | |
| | | Technology (1.8%) | |
| | 703 | | | Fidelity National Information Services, Inc. (a) | | | 5.00 | | | 03/15/22 | | | 718,817 | | |
| | 235 | | | Hewlett-Packard Co. | | | 2.60 | | | 09/15/17 | | | 236,179 | | |
| | 845 | | | Hewlett-Packard Co. | | | 4.65 | | | 12/09/21 | | | 887,424 | | |
| | 234 | | | Intel Corp. | | | 2.95 | | | 12/15/35 | | | 265,883 | | |
| | 255 | | | Lam Research Corp. | | | 1.25 | | | 05/15/18 | | | 252,769 | | |
| | 434 | | | Microsoft Corp. (a) | | | 0.00 | | | 06/15/13 | | | 462,752 | | |
| | 284 | | | Rovi Corp. | | | 2.625 | | | 02/15/40 | | | 274,770 | | |
| | 276 | | | SanDisk Corp. | | | 1.50 | | | 08/15/17 | | | 285,315 | | |
| | | | | | 3,383,909 | | |
| | | Utilities (5.8%) | |
| | 1,110 | | | AES Corp. (The) | | | 8.00 | | | 06/01/20 | | | 1,279,275 | | |
| | 775 | | | Boston Gas Co. (a) | | | 4.487 | | | 02/15/42 | | | 821,720 | | |
| | 495 | | | CMS Energy Corp. | | | 5.05 | | | 03/15/22 | | | 515,908 | | |
| | 280 | | | CMS Energy Corp. | | | 6.25 | | | 02/01/20 | | | 312,348 | | |
See Notes to Financial Statements
41
Morgan Stanley Variable Investment Series - Income Plus
Portfolio of Investments n June 30, 2012 (unaudited) continued
PRINCIPAL
AMOUNT
(000) | |
| | COUPON
RATE | | MATURITY
DATE | | VALUE | |
| $ | 750 | | | EDP Finance BV (Portugal) (a) | | | 4.90 | % | | 10/01/19 | | $ | 604,888 | | |
| | 675 | | | Enel Finance International N.V. (Italy) (a) | | | 5.125 | | | 10/07/19 | | | 645,762 | | |
| | 2,100 | | | Exelon Generation Co., LLC | | | 4.00 | | | 10/01/20 | | | 2,116,788 | | |
| | 975 | | | FirstEnergy Solutions Corp. | | | 6.05 | | | 08/15/21 | | | 1,072,724 | | |
| | 975 | | | FirstEnergy Solutions Corp. | | | 6.80 | | | 08/15/39 | | | 1,027,140 | | |
| | 575 | | | Iberdrola Finance Ireland Ltd. (Spain) (a) | | | 5.00 | | | 09/11/19 | | | 531,819 | | |
| | 900 | | | PPL WEM Holdings PLC (a) | | | 3.90 | | | 05/01/16 | | | 944,091 | | |
| | 1,150 | | | Puget Energy, Inc. | | | 6.50 | | | 12/15/20 | | | 1,254,805 | | |
| | | | | | 11,127,268 | | |
| | | Total Corporate Bonds
(Cost $171,443,789) | | | 183,685,294 | | |
| | | Asset-Backed Securities (0.9%) | |
| | | CVS Pass-Through Trust | |
| | 1,435 | | | | | | | | 6.036 | | | 12/10/28 | | | 1,622,978 | | |
| | 114 | | | (a) | | | 8.353 | | | 07/10/31 | | | 149,080 | | |
| | | Total Asset-Backed Securities
(Cost $1,554,468) | | | 1,772,058 | | |
| | | Municipal Bond (0.4%) | |
| | 600 | | | State of California, General Obligation Bonds
(Cost $603,036) | | | 5.95 | | | 04/01/16 | | | 685,080 | | |
| | | Sovereign (0.2%) | |
| | 395 | | | Korea Development Bank (The)
(Korea, Republic of)
(Cost $393,218) | | | 3.875 | | | 05/04/17 | | | 420,935 | | |
| | | Agency Fixed Rate Mortgage (0.0%) | |
| | 1 | | | Federal Home Loan Mortgage Corporation,
Gold Pool
(Cost $1,417) | | | 6.50 | | | 12/01/28 | | | 1,561 | | |
NUMBER OF
SHARES | | | |
| |
| |
| |
| | | Convertible Preferred Stocks (0.3%) | |
| | | Diversified Financial Services (0.2%) | |
| | 350 | | | Bank of America Corp., Series L | | | 341,250 | | |
| | | Electric Utilities (0.1%) | |
| | 4,430 | | | PPL Corp. | | | 234,347 | | |
| | | Total Convertible Preferred Stocks
(Cost $585,890) | | | 575,597 | | |
See Notes to Financial Statements
42
Morgan Stanley Variable Investment Series - Income Plus
Portfolio of Investments n June 30, 2012 (unaudited) continued
PRINCIPAL
AMOUNT
(000) | |
| | COUPON
RATE | | MATURITY
DATE | | VALUE | |
| | | Short-Term Investments (1.4%) | |
| | | U.S. Treasury Securities (0.1%) | |
| | | U.S. Treasury Bills | |
| $ | 25 | | | (f)(g) | | | 0.101 | % | | 08/30/12 | | $ | 24,997 | | |
| | 175 | | | (f)(g) | | | 0.136 | | | 08/30/12 | | | 174,987 | | |
| | | Total U.S. Treasury Securities
(Cost $199,957) | | | 199,984 | | |
NUMBER OF
SHARES (000)
| |
| |
| |
| |
| |
| | | Investment Company (1.3%) | |
| | 2,384 | | | Morgan Stanley Institutional Liquidity Funds - Money
Market Portfolio - Institutional Class (See Note 6)
(Cost $2,384,162) | | | 2,384,162 | | |
| | | Total Short-Term Investments
(Cost $2,584,119) | | | 2,584,146 | | |
| | | Total Investments
(Cost $177,165,937) (h) | | | | | 99.5 | % | | | 189,724,671 | | |
| | | Other Assets in Excess of Liabilities | | | | | 0.5 | | | | 996,664 | | |
| | | Net Assets | | | | | 100.0 | % | | $ | 190,721,335 | | |
MTN Medium Term Note.
REIT Real Estate Investment Trust.
(a) 144A security — Certain conditions for public sale may exist. Unless otherwise noted, these securities are deemed to be liquid.
(b) Security trades on the Hong Kong exchange.
(c) Variable/Floating Rate Security — Interest rate changes on these instruments are based on changes in a designated base rate. The rates shown are those in effect on June 30, 2012.
(d) Perpetual — Security does not have a predetermined maturity date. Rate for this security is fixed for a period of time then reverts to a floating rate. The interest shown is the rate in effect at June 30, 2012.
(e) When-issued security.
(f) Rate shown is the yield to maturity at June 30, 2012.
(g) A portion of this security has been physically segregated in connection with open futures contracts.
(h) Securities are available for collateral in connection with purchase of when-issued securities, open foreign currency exchange contracts, futures contracts and swap agreements.
See Notes to Financial Statements
43
Morgan Stanley Variable Investment Series - Income Plus
Portfolio of Investments n June 30, 2012 (unaudited) continued
FOREIGN CURRENCY EXCHANGE CONTRACTS OPEN AT JUNE 30, 2012:
| COUNTERPARTY | | CONTRACTS
TO DELIVER | | IN EXCHANGE
FOR | | DELIVERY
DATE | | UNREALIZED
DEPRECIATION | |
| Goldman Sachs International | | EUR | 396,597 | | | $ | 491,290 | | | 07/13/12 | | $ | (10,642 | ) | |
FUTURES CONTRACTS OPEN AT JUNE 30, 2012:
NUMBER OF
CONTRACTS | | LONG/SHORT | | DESCRIPTION, DELIVERY
MONTH AND YEAR | | UNDERLYING FACE
AMOUNT AT VALUE | | UNREALIZED
APPRECIATION
(DEPRECIATION) | |
| | 135 | | | Long | | U.S. Treasury 2 yr. Note,
Sep-12 | | $ | 29,725,312 | | | $ | (12,553 | ) | |
| | 48 | | | Long | | U.S. Treasury Ultra Long Bond,
Sep-12 | | | 8,008,500 | | | | 14,815 | | |
| | 37 | | | Long | | U.S. Treasury 5 yr. Note,
Sep-12 | | | 4,586,844 | | | | 8,094 | | |
| | 19 | | | Short | | U.S. Treasury 30 yr. Bond,
Sep-12 | | | (2,811,406 | ) | | | (94 | ) | |
| | 284 | | | Short | | U.S. Treasury 10 yr. Note,
Sep-12 | | | (37,878,500 | ) | | | (93,657 | ) | |
| Net Unrealized Depreciation | | $ | (83,395 | ) | |
INTEREST RATE SWAP AGREEMENTS OPEN AT JUNE 30, 2012:
| SWAP COUNTERPARTY | | NOTIONAL
AMOUNT
(000) | | FLOATING
RATE INDEX | | PAY/RECEIVE
FLOATING RATE | | FIXED RATE | | TERMINATION
DATE | | UNREALIZED
DEPRECIATION | |
Goldman Sachs
International | | $ | 2,200 | | | 3 Month LIBOR | | Receive | | | 2.42 | % | | 03/22/22 | | $ | (149,688 | ) | |
| JPMorgan Chase Bank | | | 1,069 | | | 3 Month LIBOR | | Receive | | | 2.43 | | | 03/22/22 | | | (74,176 | ) | |
| Total Unrealized Depreciation | | | | $(223,864) | |
LIBOR London Interbank Offered Rate.
Currency Abbreviations:
EUR Euro.
See Notes to Financial Statements
44
Morgan Stanley Variable Investment Series - Income Plus
Summary of Investments n June 30, 2012 (unaudited) continued
| LONG TERM CREDIT ANALYSIS++ | |
| AA | | | 6.5 | % | |
| A | | | 30.9 | | |
| BBB | | | 49.5 | | |
| BB | | | 9.4 | | |
| B or Below | | | 1.3 | | |
| Not Rated | | | 2.4 | | |
| | | | 100.0 | %+ | |
+ Does not include open foreign currency exchange contracts with total unrealized depreciation of $10,642. Does not include open long/short futures contracts with an underlying face amount of $83,010,562 with net unrealized depreciation of $83,395. Also does not include open swap agreements with total unrealized depreciation of $223,864.
++ The ratings shown are based on the Portfolio's security ratings as determined by Standard & Poor's, Moody's or Fitch, each a Nationally Recognized Statistical Ratings Organization ("NRSRO").
See Notes to Financial Statements
45
Morgan Stanley Variable Investment Series - Global Infrastructure
Portfolio of Investments n June 30, 2012 (unaudited)
NUMBER OF
SHARES | |
| | VALUE | |
| | | Common Stocks (97.5%) | |
| | | Australia (5.3%) | |
| | | Airports | |
| | 39,313 | | | Australian Infrastructure Fund
(Stapled Securities) (a)(b) | | $ | 97,050 | | |
| | 266,364 | | | Sydney Airport (Stapled
Securities) (a) | | | 793,618 | | |
| | | | 890,668 | | |
| | | Diversified | |
| | 271,480 | | | DUET Group (Stapled
Securities) (a)(b) | | | 512,343 | | |
| | | Oil & Gas Storage &
Transportation | |
| | 122,600 | | | APA Group (Stapled
Securities) (a)(b) | | | 628,243 | | |
| | | Toll Roads | |
| | 75,579 | | | Macquarie Atlas Roads Group
(Stapled Securities) (a)(c) | | | 116,676 | | |
| | 235,415 | | | Transurban Group (Stapled
Securities) (a) | | | 1,372,614 | | |
| | | | 1,489,290 | | |
| | | Transmission & Distribution | |
| | 224,049 | | | Spark Infrastructure Group | | | 350,276 | | |
| | | | | Total Australia | | | 3,870,820 | | |
| | | Brazil (0.8%) | |
| | | Water | |
| | 7,800 | | | Cia de Saneamento Basico do
Estado de Sao Paulo ADR | | | 591,708 | | |
| | | Canada (11.3%) | |
| | | Oil & Gas Storage &
Transportation | |
| | 81,240 | | | Enbridge, Inc. | | | 3,244,493 | | |
| | 4,398 | | | Keyera Corp. | | | 183,074 | | |
| | 113,500 | | | TransCanada Corp. | | | 4,756,944 | | |
| | | | | Total Canada | | | 8,184,511 | | |
NUMBER OF
SHARES | |
| | VALUE | |
| | | China (14.7%) | |
| | | Oil & Gas Storage &
Transportation | |
| | 755,000 | | | Beijing Enterprises
Holdings Ltd. (d) | | $ | 4,557,072 | | |
| | 5,936,000 | | | China Gas Holdings Ltd. (d) | | | 2,966,181 | | |
| | 246,000 | | | ENN Energy Holdings Ltd. (d) | | | 865,013 | | |
| | 1,610,000 | | | Sichuan Expressway Co., Ltd.,
H Shares (d) | | | 546,119 | | |
| | | | 8,934,385 | | |
| | | Ports | |
| | 223,529 | | | China Merchants Holdings
International Co., Ltd. (d) | | | 683,686 | | |
| | | Toll Roads | |
| | 1,078,000 | | | Jiangsu Expressway Co., Ltd.,
H Shares (d) | | | 1,011,401 | | |
| | | | | Total China | | | 10,629,472 | | |
| | | France (3.8%) | |
| | | Communications | |
| | 20,991 | | | Eutelsat Communications SA | | | 645,406 | | |
| | 89,415 | | | SES SA | | | 2,114,426 | | |
| | | | | Total France | | | 2,759,832 | | |
| | | Germany (0.4%) | |
| | | Airports | |
| | 4,775 | | | Fraport AG Frankfurt Airport
Services Worldwide | | | 257,093 | | |
| | | Italy (5.2%) | |
| | | Oil & Gas Storage &
Transportation | |
| | 232,796 | | | Snam SpA | | | 1,037,805 | | |
| | | Toll Roads | |
| | 53,044 | | | Atlantia SpA | | | 677,487 | | |
| | 179,235 | | | Societa Iniziative Autostradali
e Servizi SpA | | | 1,264,469 | | |
| | | | 1,941,956 | | |
See Notes to Financial Statements
46
Morgan Stanley Variable Investment Series - Global Infrastructure
Portfolio of Investments n June 30, 2012 (unaudited) continued
NUMBER OF
SHARES | |
| | VALUE | |
| | | Transmission & Distribution | |
| | 214,100 | | | Terna Rete Elettrica
Nazionale SpA | | $ | 771,425 | | |
| | | | | Total Italy | | | 3,751,186 | | |
| | | Japan (1.1%) | |
| | | Oil & Gas Storage &
Transportation | |
| | 152,000 | | | Tokyo Gas Co., Ltd. | | | 776,274 | | |
| | | Netherlands (0.8%) | |
| | | Oil & Gas Storage &
Transportation | |
| | 9,106 | | | Koninklijke Vopak N.V. | | | 583,935 | | |
| | | Spain (1.4%) | |
| | | Diversified | |
| | 31,263 | | | Ferrovial SA | | | 352,494 | | |
| | | Oil & Gas Storage &
Transportation | |
| | 15,256 | | | Enagas SA | | | 278,393 | | |
| | | Toll Roads | |
| | 29,223 | | | Abertis Infraestructuras SA | | | 395,676 | | |
| | | | | Total Spain | | | 1,026,563 | | |
| | | Switzerland (1.2%) | |
| | | Airports | |
| | 2,517 | | | Flughafen Zuerich AG
(Registered) | | | 883,875 | | |
| | | United Kingdom (11.0%) | |
| | | Transmission & Distribution | |
| | 571,500 | | | National Grid PLC | | | 6,049,115 | | |
| | | Water | |
| | 31,700 | | | Severn Trent PLC | | | 821,037 | | |
| | 102,700 | | | United Utilities Group PLC | | | 1,086,625 | | |
| | | | 1,907,662 | | |
| | | | | Total United Kingdom | | | 7,956,777 | | |
NUMBER OF
SHARES | |
| | VALUE | |
| | | United States (40.5%) | |
| | | Communications | |
| | 49,490 | | | American Tower Corp.,
Class A | | $ | 3,459,846 | | |
| | 35,610 | | | Crown Castle International
Corp. (c) | | | 2,088,883 | | |
| | 44,600 | | | SBA Communications Corp.,
Class A (c) | | | 2,544,430 | | |
| | | | 8,093,159 | | |
| | | Diversified | |
| | 48,770 | | | CenterPoint Energy, Inc. | | | 1,008,076 | | |
| | | Oil & Gas Storage &
Transportation | |
| | 9,660 | | | AGL Resources, Inc. | | | 374,325 | | |
| | 5,070 | | | Atmos Energy Corp. | | | 177,805 | | |
| | 56,413 | | | Enbridge Energy
Management LLC (c) | | | 1,803,524 | | |
| | 10,037 | | | Kinder Morgan
Management LLC (c) | | | 736,917 | | |
| | 13,170 | | | Kinder Morgan, Inc. | | | 424,337 | | |
| | 13,900 | | | New Jersey Resources Corp. | | | 606,179 | | |
| | 39,390 | | | NiSource, Inc. | | | 974,902 | | |
| | 26,940 | | | Oneok, Inc. | | | 1,139,831 | | |
| | 41,120 | | | PG&E Corp. | | | 1,861,502 | | |
| | 38,790 | | | Sempra Energy | | | 2,671,855 | | |
| | 91,546 | | | Spectra Energy Corp. | | | 2,660,327 | | |
| | 8,480 | | | WGL Holdings, Inc. | | | 337,080 | | |
| | 53,140 | | | Williams Cos., Inc. (The) | | | 1,531,495 | | |
| | | | 15,300,079 | | |
| | | Transmission & Distribution | |
| | 21,290 | | | ITC Holdings Corp. | | | 1,467,094 | | |
| | 67,178 | | | Northeast Utilities | | | 2,607,178 | | |
| | 12,860 | | | Pepco Holdings, Inc. | | | 251,670 | | |
| | | | 4,325,942 | | |
| | | Water | |
| | 15,810 | | | American Water
Works Co., Inc. | | | 541,967 | | |
| | | | | Total United States | | | 29,269,223 | | |
| | | | | Total Common Stocks
(Cost $57,439,296) | | | 70,541,269 | | |
See Notes to Financial Statements
47
Morgan Stanley Variable Investment Series - Global Infrastructure
Portfolio of Investments n June 30, 2012 (unaudited) continued
NUMBER OF
SHARES (000) | |
| | VALUE | |
| | | Short-Term Investment (1.5%) | | | |
| | | Investment Company | | | |
| | 1,093 | | | Morgan Stanley Institutional
Liquidity Fund - Treasury
Portfolio - Institutional Class
(See Note 6)
(Cost $1,092,962) | | $ | 1,092,962 | | |
Total Investments
(Cost $58,532,258) (e) | | | 99.0 | % | | | 71,634,231 | | |
Other Assets in Excess of
Liabilities | | | 1.0 | | | | 709,555 | | |
| Net Assets | | | 100.0 | % | | $ | 72,343,786 | | |
ADR American Depositary Receipt.
(a) Comprised of securities in separate entities that are traded as a single stapled security.
(b) Consists of one or more classes of securities traded together as a unit; stocks with attached warrants.
(c) Non-income producing security.
(d) Security trades on the Hong Kong exchange.
(e) The fair value and percentage of net assets, $32,495,827 and 44.9%, respectively, represent the securities that have been fair valued under the fair valuation policy for international investments as described in Note 1A within the Notes to the Financial Statements.
SUMMARY OF INVESTMENTS
INDUSTRY | | VALUE | | PERCENT OF
TOTAL
INVESTMENTS | |
Oil & Gas Storage &
Transportation | | $ | 35,723,625 | | | | 49.9 | % | |
Transmission &
Distribution | | | 11,496,758 | | | | 16.0 | | |
| Communications | | | 10,852,991 | | | | 15.2 | | |
| Toll Roads | | | 4,838,323 | | | | 6.8 | | |
| Water | | | 3,041,337 | | | | 4.2 | | |
| Airports | | | 2,031,636 | | | | 2.8 | | |
| Diversified | | | 1,872,913 | | | | 2.6 | | |
| Investment Company | | | 1,092,962 | | | | 1.5 | | |
| Ports | | | 683,686 | | | | 1.0 | | |
| | | $ | 71,634,231 | | | | 100.0 | % | |
See Notes to Financial Statements
48
Morgan Stanley Variable Investment Series - European Equity
Portfolio of Investments n June 30, 2012 (unaudited)
NUMBER OF
SHARES | |
| | VALUE | |
| | | Common Stocks (97.2%) | |
| | | Belgium (1.7%) | |
| | | Chemicals | |
| | 18,541 | | | Umicore SA | | $ | 857,106 | | |
| | | Finland (1.8%) | |
| | | Machinery | |
| | 14,617 | | | Kone Oyj, Class B | | | 885,138 | | |
| | | France (8.1%) | |
| | | Commercial Banks | |
| | 24,034 | | | BNP Paribas SA | | | 927,803 | | |
| | 29,204 | | | Societe Generale SA (a) | | | 688,546 | | |
| | | | 1,616,349 | | |
| | | Electrical Equipment | |
| | 16,608 | | | Schneider Electric SA | | | 925,376 | | |
| | | Hotels, Restaurants & Leisure | |
| | 21,699 | | | Accor SA | | | 683,187 | | |
| | | Media | |
| | 32,319 | | | SES SA | | | 764,258 | | |
| | | | | Total France | | | 3,989,170 | | |
| | | Germany (12.9%) | |
| | | Automobiles | |
| | 23,494 | | | Daimler AG (Registered) | | | 1,056,617 | | |
| | | Health Care Providers &
Services | |
| | 11,062 | | | Fresenius SE & Co., KGaA | | | 1,147,076 | | |
| | | Industrial Conglomerates | |
| | 15,742 | | | Siemens AG (Registered) | | | 1,323,236 | | |
| | | Insurance | |
| | 6,529 | | | Muenchener
Rueckversicherungs AG
(Registered) | | | 921,175 | | |
| | | Machinery | |
| | 6,654 | | | MAN SE | | | 680,051 | | |
| | | Pharmaceuticals | |
| | 17,083 | | | Bayer AG (Registered) | | | 1,231,832 | | |
| | | | | Total Germany | | | 6,359,987 | | |
NUMBER OF
SHARES | |
| | VALUE | |
| | | Netherlands (3.2%) | |
| | | Media | |
| | 81,718 | | | Reed Elsevier N.V. | | $ | 934,798 | | |
| | | Metals & Mining | |
| | 42,802 | | | ArcelorMittal | | | 661,208 | | |
| | | | | Total Netherlands | | | 1,596,006 | | |
| | | Portugal (1.3%) | |
| | | Oil, Gas & Consumable Fuels | |
| | 48,284 | | | Galp Energia SGPS SA,
Class B | | | 612,405 | | |
| | | Spain (4.0%) | |
| | | Commercial Banks | |
| | 133,152 | | | Banco Bilbao Vizcaya
Argentaria SA | | | 959,673 | | |
| | | Information Technology
Services | |
| | 48,175 | | | Amadeus IT Holding SA,
Class A | | | 1,020,207 | | |
| | | | | Total Spain | | | 1,979,880 | | |
| | | Sweden (1.4%) | |
| | | Wireless Telecommunication
Services | |
| | 7,177 | | | Millicom International
Cellular SA SDR | | | 677,134 | | |
| | | Switzerland (14.6%) | |
| | | Food Products | |
| | 44,160 | | | Nestle SA (Registered) | | | 2,634,207 | | |
| | | Insurance | |
| | 4,822 | | | Zurich Insurance
Group AG (a) | | | 1,087,938 | | |
| | | Pharmaceuticals | |
| | 32,909 | | | Novartis AG (Registered) | | | 1,835,662 | | |
| | 9,732 | | | Roche Holding AG
(Genusschein) | | | 1,680,010 | | |
| | | | 3,515,672 | | |
| | | | | Total Switzerland | | | 7,237,817 | | |
See Notes to Financial Statements
49
Morgan Stanley Variable Investment Series - European Equity
Portfolio of Investments n June 30, 2012 (unaudited) continued
NUMBER OF
SHARES | |
| | VALUE | |
| | | United Kingdom (48.2%) | |
| | | Aerospace & Defense | |
| | 105,505 | | | Rolls-Royce Holdings PLC (a) | | $ | 1,423,358 | | |
| | | Commercial Banks | |
| | 307,796 | | | Barclays PLC | | | 787,894 | | |
| | 247,419 | | | HSBC Holdings PLC | | | 2,181,604 | | |
| | | | 2,969,498 | | |
| | | Food & Staples Retailing | |
| | 185,635 | | | WM Morrison
Supermarkets PLC | | | 774,749 | | |
| | | Household Products | |
| | 22,307 | | | Reckitt Benckiser Group PLC | | | 1,176,510 | | |
| | | Insurance | |
| | 99,602 | | | Prudential PLC | | | 1,154,027 | | |
| | | Metals & Mining | |
| | 32,607 | | | Anglo American PLC | | | 1,069,836 | | |
| | 66,097 | | | Xstrata PLC | | | 834,278 | | |
| | | | 1,904,114 | | |
| | | Oil, Gas & Consumable Fuels | |
| | 79,325 | | | BG Group PLC | | | 1,623,611 | | |
| | 264,535 | | | BP PLC | | | 1,772,428 | | |
| | 61,421 | | | Royal Dutch Shell PLC,
Class A | | | 2,069,044 | | |
| | 40,852 | | | Tullow Oil PLC | | | 943,038 | | |
| | | | 6,408,121 | | |
| | | Pharmaceuticals | |
| | 76,342 | | | GlaxoSmithKline PLC | | | 1,731,120 | | |
| | | Professional Services | |
| | 68,476 | | | Experian PLC | | | 967,304 | | |
| | | Tobacco | |
| | 36,516 | | | British American
Tobacco PLC | | | 1,858,603 | | |
| | 36,173 | | | Imperial Tobacco
Group PLC | | | 1,391,831 | | |
| | | | 3,250,434 | | |
NUMBER OF
SHARES | |
| | VALUE | |
| | | Wireless Telecommunication
Services | | | |
| | 735,393 | | | Vodafone Group PLC | | $ | 2,066,187 | | |
| | | Total United Kingdom | | | 23,825,422 | | |
| | | Total Common Stocks
(Cost $42,865,159) | | | 48,020,065 | | |
NUMBER OF
SHARES (000) | | | | | |
| | | Short-Term Investment (2.3%) | | | |
| | | Investment Company | | | |
| | 1,158 | | | Morgan Stanley Institutional
Liquidity Funds - Money Market
Portfolio - Institutional Class
(See Note 6)
(Cost $1,158,271) | | | 1,158,271 | | |
Total Investments
(Cost $44,023,430) (b)(c) | | | 99.5 | % | | | 49,178,336 | | |
Other Assets in Excess of
Liabilities | | | 0.5 | | | | 266,921 | | |
| Net Assets | | | 100.0 | % | | $ | 49,445,257 | | |
SDR Swedish Depositary Receipt.
(a) Non-income producing security.
(b) Securities are available for collateral in connection with open foreign currency exchange contracts.
(c) The fair value and percentage of net assets, $48,020,065 and 97.1%, respectively, represent the securities that have been fair valued under the fair valuation policy for international investments as described in Note 1A within the Notes to the Financial Statements.
See Notes to Financial Statements
50
Morgan Stanley Variable Investment Series - European Equity
Portfolio of Investments n June 30, 2012 (unaudited) continued
FOREIGN CURRENCY EXCHANGE CONTRACTS OPEN AT JUNE 30, 2012:
| COUNTERPARTY | | CONTRACTS
TO DELIVER | | IN EXCHANGE
FOR | | DELIVERY
DATE | | UNREALIZED
DEPRECIATION | |
| State Street Bank London | | GBP | 3,055,000 | | | EUR | 3,773,646 | | | 07/13/2012 | | $ | (8,551 | ) | |
Currency Abbreviations:
EUR Euro.
GBP British Pound.
SUMMARY OF INVESTMENTS
INDUSTRY | | VALUE | | PERCENT OF
TOTAL
INVESTMENTS | |
Oil, Gas &
Consumable Fuels | | $ | 7,020,526 | | | | 14.3 | % | |
| Pharmaceuticals | | | 6,478,624 | | | | 13.2 | | |
| Commercial Banks | | | 5,545,520 | | | | 11.3 | | |
| Tobacco | | | 3,250,434 | | | | 6.6 | | |
| Insurance | | | 3,163,140 | | | | 6.4 | | |
Wireless Telecommunication
Services | | | 2,743,321 | | | | 5.6 | | |
| Food Products | | | 2,634,207 | | | | 5.4 | | |
| Metals & Mining | | | 2,565,322 | | | | 5.2 | | |
| Media | | | 1,699,056 | | | | 3.4 | | |
| Machinery | | | 1,565,189 | | | | 3.2 | | |
| Aerospace & Defense | | | 1,423,358 | | | | 2.9 | | |
| Industrial Conglomerates | | | 1,323,236 | | | | 2.7 | | |
| Household Products | | | 1,176,510 | | | | 2.4 | | |
| Investment Company | | | 1,158,271 | | | | 2.3 | | |
| INDUSTRY | | VALUE | | PERCENT OF
TOTAL
INVESTMENTS | |
Health Care Providers &
Services | | $ | 1,147,076 | | | | 2.3 | % | |
| Automobiles | | | 1,056,617 | | | | 2.1 | | |
Information Technology
Services | | | 1,020,207 | | | | 2.1 | | |
| Professional Services | | | 967,304 | | | | 2.0 | | |
| Electrical Equipment | | | 925,376 | | | | 1.9 | | |
| Chemicals | | | 857,106 | | | | 1.7 | | |
| Food & Staples Retailing | | | 774,749 | | | | 1.6 | | |
Hotels, Restaurants &
Leisure | | | 683,187 | | | | 1.4 | | |
| | | $ | 49,178,336 | + | | | 100.0 | % | |
+ Does not include open foreign currency exchange contracts with total unrealized depreciation of $8,551.
See Notes to Financial Statements
51
Morgan Stanley Variable Investment Series - Multi Cap Growth
Portfolio of Investments n June 30, 2012 (unaudited)
| NUMBER OF SHARES | |
| | VALUE | |
| | | Common Stocks (95.8%) | |
| | | Air Transport (1.6%) | |
| | 92,758 | | | Expeditors International of
Washington, Inc. | | $ | 3,594,373 | | |
| | | Alternative Energy (3.6%) | |
| | 77,286 | | | Range Resources Corp. | | | 4,781,685 | | |
| | 138,458 | | | Ultra Petroleum Corp. (a) | | | 3,194,226 | | |
| | | | 7,975,911 | | |
| | | Beverage: Brewers &
Distillers (1.3%) | |
| | 260,410 | | | DE Master Blenders 1753 N.V.
(Netherlands) (a) | | | 2,936,279 | | |
| | | Biotechnology (2.3%) | |
| | 128,513 | | | Illumina, Inc. (a) | | | 5,190,640 | | |
| | | Chemicals: Diversified (3.0%) | |
| | 81,976 | | | Monsanto Co. | | | 6,785,973 | | |
| | | Commercial Finance &
Mortgage Companies (1.5%) | |
| | 630,526 | | | BM&F Bovespa SA (Brazil) | | | 3,217,770 | | |
| | | Commercial Services (4.5%) | |
| | 133,491 | | | Intertek Group PLC
(United Kingdom) | | | 5,610,298 | | |
| | 87,537 | | | Weight Watchers
International, Inc. (a) | | | 4,513,408 | | |
| | | | 10,123,706 | | |
| | | Communications
Technology (3.4%) | |
| | 156,909 | | | Motorola Solutions, Inc. | | | 7,548,892 | | |
| | | Computer Services,
Software & Systems (19.8%) | |
| | 61,290 | | | Baidu, Inc. ADR (China) (a) | | | 7,047,124 | | |
| | 167,392 | | | Facebook, Inc. (a) | | | 5,209,239 | | |
| | 327,898 | | | Facebook, Inc.,
Class B (a)(b)(c) | | | 9,354,930 | | |
| | 16,821 | | | Google, Inc., Class A (a) | | | 9,757,358 | | |
| | 53,696 | | | LinkedIn Corp., Class A (a) | | | 5,706,274 | | |
| | 39,990 | | | Salesforce.com, Inc. (a) | | | 5,529,017 | | |
| | 287,079 | | | Zynga, Inc., Class A (a) | | | 1,561,710 | | |
| | | | 44,165,652 | | |
| NUMBER OF SHARES | |
| | VALUE | |
| | | Computer Technology (10.8%) | |
| | 34,242 | | | Apple, Inc. (a) | | $ | 19,997,328 | | |
| | 215,324 | | | Yandex N.V., Class A
(Russia) (a) | | | 4,101,922 | | |
| | | | 24,099,250 | | |
| | | Consumer Lending (3.0%) | |
| | 7,810 | | | Mastercard, Inc., Class A | | | 3,359,159 | | |
| | 27,387 | | | Visa, Inc., Class A | | | 3,385,855 | | |
| | | | 6,745,014 | | |
| | | Diversified Retail (14.7%) | |
| | 87,805 | | | Amazon.com, Inc. (a) | | | 20,050,272 | | |
| | 491,036 | | | Groupon, Inc. (a) | | | 5,219,712 | | |
| | 11,336 | | | Priceline.com, Inc. (a) | | | 7,532,999 | | |
| | | | 32,802,983 | | |
| | | Financial Data &
Systems (5.3%) | |
| | 159,792 | | | MSCI, Inc., Class A (a) | | | 5,436,124 | | |
| | 128,781 | | | Verisk Analytics, Inc.,
Class A (a) | | | 6,343,752 | | |
| | | | 11,779,876 | | |
| | | Foods (0.7%) | |
| | 52,082 | | | Hillshire Brands Co. | | | 1,509,857 | | |
| | | Health Care Services (4.3%) | |
| | 121,773 | | | athenahealth, Inc. (a) | | | 9,640,768 | | |
| | | Insurance:
Property-Casualty (1.8%) | |
| | 197,260 | | | Progressive Corp. (The) | | | 4,108,926 | | |
| | | Medical Equipment (3.5%) | |
| | 13,934 | | | Intuitive Surgical, Inc. (a) | | | 7,716,510 | | |
| | | Metals & Minerals:
Diversified (1.9%) | |
| | 2,494,075 | | | Lynas Corp., Ltd.
(Australia) (a) | | | 2,205,188 | | |
| | 94,351 | | | Molycorp, Inc. (a) | | | 2,033,264 | | |
| | | | 4,238,452 | | |
See Notes to Financial Statements
52
Morgan Stanley Variable Investment Series - Multi Cap Growth
Portfolio of Investments n June 30, 2012 (unaudited) continued
| NUMBER OF SHARES | |
| | VALUE | |
| | | Real Estate Investment
Trusts (REIT) (3.6%) | | | |
| | 244,421 | | | Brookfield Asset Management,
Inc., Class A (Canada) | | $ | 8,090,335 | | |
| | | Recreational Vehicles &
Boats (3.4%) | | | |
| | 262,869 | | | Edenred (France) | | | 7,459,093 | | |
| | | Wholesale & International
Trade (1.8%) | | | |
| | 2,044,000 | | | Li & Fung Ltd. (d) | | | 3,966,277 | | |
| | | Total Common Stocks
(Cost $164,869,334) | | | 213,696,537 | | |
| | | Convertible Preferred
Stocks (1.0%) | | | |
| | | Alternative Energy (0.9%) | | | |
| | 586,326 | | | Better Place, Inc. (a)(b)(c) | | | 1,940,739 | | |
| | | Computer Services,
Software & Systems (0.1%) | | | |
| | 28,236 | | | Workday, Inc. (a)(b)(c) | | | 374,409 | | |
| | | Total Convertible
Preferred Stocks
(Cost $1,840,224) | | | 2,315,148 | | |
NUMBER OF
SHARES (000) | | | | | |
| | | Short-Term Investment (3.0%) | | | |
| | | Investment Company | | | |
| | 6,674 | | | Morgan Stanley Institutional
Liquidity Funds - Money
Market Portfolio - Institutional
Class (See Note 6)
(Cost $6,673,526) | | | 6,673,526 | | |
Total Investments
(Cost $173,383,084) (e) | | | 99.8 | % | | | 222,685,211 | | |
Other Assets in Excess of
Liabilities | | | 0.2 | | | | 469,019 | | |
| Net Assets | | | 100.0 | % | | $ | 223,154,230 | | |
ADR American Depositary Receipt.
(a) Non-income producing security.
(b) Illiquid security. Resale is restricted to qualified institutional investors.
(c) At June 30, 2012, the Portfolio held fair valued securities valued at $11,670,078, representing 5.2% of net assets. These securities have been fair valued as determined in good faith under procedures established by and under the general supervision of the Fund's Trustees.
(d) Security trades on the Hong Kong exchange.
(e) The fair value and percentage of net assets, $19,240,856 and 8.6%, respectively, represent the securities that have been fair valued under the fair valuation policy for international investments as described in Note 1A within the Notes to the Financial Statements.
See Notes to Financial Statements
53
Morgan Stanley Variable Investment Series - Multi Cap Growth
Summary of Investments n June 30, 2012 (unaudited)
| INDUSTRY | | VALUE | | PERCENT OF
TOTAL
INVESTMENTS | |
Computer Services,
Software & Systems | | $ | 44,540,061 | | | | 20.0 | % | |
| Diversified Retail | | | 32,802,983 | | | | 14.7 | | |
| Computer Technology | | | 24,099,250 | | | | 10.8 | | |
| Financial Data & Systems | | | 11,779,876 | | | | 5.3 | | |
| Commercial Services | | | 10,123,706 | | | | 4.6 | | |
| Alternative Energy | | | 9,916,650 | | | | 4.5 | | |
| Health Care Services | | | 9,640,768 | | | | 4.3 | | |
Real Estate Investment
Trusts (REIT) | | | 8,090,335 | | | | 3.6 | | |
| Medical Equipment | | | 7,716,510 | | | | 3.5 | | |
Communications
Technology | | | 7,548,892 | | | | 3.4 | | |
Recreational Vehicles &
Boats | | | 7,459,093 | | | | 3.4 | | |
| Chemicals: Diversified | | | 6,785,973 | | | | 3.1 | | |
| Consumer Lending | | | 6,745,014 | | | | 3.0 | | |
| INDUSTRY | | VALUE | | PERCENT OF
TOTAL
INVESTMENTS | |
| Investment Companies | | $ | 6,673,526 | | | | 3.0 | % | |
| Biotechnology | | | 5,190,640 | | | | 2.3 | | |
Metals & Minerals:
Diversified | | | 4,238,452 | | | | 1.9 | | |
Insurance:
Property-Casualty | | | 4,108,926 | | | | 1.8 | | |
Wholesale & International
Trade | | | 3,966,277 | | | | 1.8 | | |
| Air Transport | | | 3,594,373 | | | | 1.6 | | |
Commercial Finance &
Mortgage Companies | | | 3,217,770 | | | | 1.4 | | |
Beverage: Brewers &
Distillers | | | 2,936,279 | | | | 1.3 | | |
| Foods | | | 1,509,857 | | | | 0.7 | | |
| | | $ | 222,685,211 | | | | 100.0 | % | |
See Notes to Financial Statements
54
Morgan Stanley Variable Investment Series - Aggressive Equity
Portfolio of Investments n June 30, 2012 (unaudited)
NUMBER OF
SHARES | |
| | VALUE | |
| | | Common Stocks (95.6%) | |
| | | Air Transport (1.6%) | |
| | 11,735 | | | Expeditors International of
Washington, Inc. | | $ | 454,731 | | |
| | | Alternative Energy (3.6%) | |
| | 9,777 | | | Range Resources Corp. | | | 604,903 | | |
| | 17,516 | | | Ultra Petroleum Corp. (a) | | | 404,094 | | |
| | | | 1,008,997 | | |
| | | Beverage: Brewers &
Distillers (1.3%) | |
| | 32,945 | | | DE Master Blenders 1753 N.V.
(Netherlands) (a) | | | 371,475 | | |
| | | Biotechnology (2.3%) | |
| | 16,258 | | | Illumina, Inc. (a) | | | 656,661 | | |
| | | Chemicals: Diversified (3.0%) | |
| | 10,371 | | | Monsanto Co. | | | 858,511 | | |
| | | Commercial Finance &
Mortgage Companies (1.4%) | |
| | 79,769 | | | BM&F Bovespa SA (Brazil) | | | 407,086 | | |
| | | Commercial Services (4.5%) | |
| | 16,882 | | | Intertek Group PLC
(United Kingdom) | | | 709,509 | | |
| | 11,074 | | | Weight Watchers
International, Inc. (a) | | | 570,975 | | |
| | | | 1,280,484 | | |
| | | Communications
Technology (3.4%) | |
| | 19,851 | | | Motorola Solutions, Inc. | | | 955,032 | | |
| | | Computer Services,
Software & Systems (19.8%) | |
| | 7,754 | | | Baidu, Inc. ADR (China) (a) | | | 891,555 | | |
| | 23,370 | | | Facebook, Inc. (a) | | | 727,275 | | |
| | 39,222 | | | Facebook, Inc.,
Class B (a)(b)(c) | | | 1,119,004 | | |
| | 2,126 | | | Google, Inc., Class A (a) | | | 1,233,229 | | |
| | 6,793 | | | LinkedIn Corp., Class A (a) | | | 721,892 | | |
| | 5,059 | | | Salesforce.com, Inc. (a) | | | 699,457 | | |
| | 36,319 | | | Zynga, Inc., Class A (a) | | | 197,575 | | |
| | | | 5,589,987 | | |
NUMBER OF
SHARES | |
| | VALUE | |
| | | Computer Technology (10.8%) | |
| | 4,328 | | | Apple, Inc. (a) | | $ | 2,527,552 | | |
| | 27,241 | | | Yandex N.V., Class A
(Russia) (a) | | | 518,941 | | |
| | | | 3,046,493 | | |
| | | Consumer Lending (3.0%) | |
| | 988 | | | Mastercard, Inc., Class A | | | 424,949 | | |
| | 3,465 | | | Visa, Inc., Class A | | | 428,378 | | |
| | | | 853,327 | | |
| | | Diversified Retail (14.7%) | |
| | 11,108 | | | Amazon.com, Inc. (a) | | | 2,536,512 | | |
| | 62,071 | | | Groupon, Inc. (a) | | | 659,815 | | |
| | 1,434 | | | Priceline.com, Inc. (a) | | | 952,921 | | |
| | | | 4,149,248 | | |
| | | Financial Data &
Systems (5.3%) | |
| | 20,215 | | | MSCI, Inc., Class A (a) | | | 687,714 | | |
| | 16,292 | | | Verisk Analytics, Inc.,
Class A (a) | | | 802,544 | | |
| | | | 1,490,258 | | |
| | | Foods (0.7%) | |
| | 6,589 | | | Hillshire Brands Co. | | | 191,015 | | |
| | | Health Care Services (4.3%) | |
| | 15,406 | | | athenahealth, Inc. (a) | | | 1,219,693 | | |
| | | Insurance:
Property-Casualty (1.8%) | |
| | 24,866 | | | Progressive Corp. (The) | | | 517,959 | | |
| | | Medical Equipment (3.5%) | |
| | 1,763 | | | Intuitive Surgical, Inc. (a) | | | 976,332 | | |
| | | Metals & Minerals:
Diversified (1.9%) | |
| | 315,528 | | | Lynas Corp., Ltd.
(Australia) (a) | | | 278,980 | | |
| | 11,936 | | | Molycorp, Inc. (a) | | | 257,221 | | |
| | | | 536,201 | | |
See Notes to Financial Statements
55
Morgan Stanley Variable Investment Series - Aggressive Equity
Portfolio of Investments n June 30, 2012 (unaudited) continued
NUMBER OF
SHARES | |
| | VALUE | |
| | | Real Estate Investment Trusts
(REIT) (3.6%) | | | |
| | 30,922 | | | Brookfield Asset Management,
Inc., Class A (Canada) | | $ | 1,023,518 | | |
| | | Recreational Vehicles &
Boats (3.3%) | | | |
| | 33,256 | | | Edenred (France) | | | 943,662 | | |
| | | Wholesale & International
Trade (1.8%) | | | |
| | 258,000 | | | Li & Fung Ltd. (d) | | | 500,636 | | |
| | | | | Total Common Stocks
(Cost $21,343,236) | | | 27,031,306 | | |
| | | Convertible Preferred
Stocks (1.0%) | | | |
| | | Alternative Energy (0.8%) | | | |
| | 70,908 | | | Better Place, Inc. (a)(b)(c) | | | 234,705 | | |
| | | Computer Services,
Software & Systems (0.2%) | | | |
| | 3,313 | | | Workday, Inc. (a)(b)(c) | | | 43,930 | | |
| | | | | Total Convertible
Preferred Stocks
(Cost $221,200) | | | 278,635 | | |
NUMBER OF
SHARES (000) | | | | | |
| | | Short-Term Investment (3.7%) | | | |
| | | Investment Company | | | |
| | 1,038 | | | Morgan Stanley Institutional
Liquidity Funds - Money
Market Portfolio - Institutional
Class (See Note 6)
(Cost $1,038,390) | | | 1,038,390 | | |
Total Investments
(Cost $22,602,826) (e) | | | 100.3 | % | | | 28,348,331 | | |
Liabilities in Excess of
Other Assets | | | (0.3 | ) | | | (82,065 | ) | |
| Net Assets | | | 100.0 | % | | $ | 28,266,266 | | |
ADR American Depositary Receipt.
(a) Non-income producing security.
(b) At June 30, 2012, the Portfolio held fair valued securities valued at $1,397,639, representing 4.9% of net assets. These securities have been fair valued as determined in good faith under procedures established by and under the general supervision of the Fund's Trustees.
(c) Illiquid security. Resale is restricted to qualified institutional investors.
(d) Security trades on the Hong Kong exchange.
(e) The fair value and percentage of net assets, $2,432,787 and 8.6%, respectively, represent the securities that have been fair valued under the fair valuation policy for international investments as described in Note 1A within the Notes to the Financial Statements.
See Notes to Financial Statements
56
Morgan Stanley Variable Investment Series - Aggressive Equity
Summary of Investments n June 30, 2012 (unaudited)
| INDUSTRY | | VALUE | | PERCENT OF
TOTAL
INVESTMENTS | |
Computer Services,
Software & Systems | | $ | 5,633,917 | | | | 19.9 | % | |
| Diversified Retail | | | 4,149,248 | | | | 14.6 | | |
| Computer Technology | | | 3,046,493 | | | | 10.8 | | |
| Financial Data & Systems | | | 1,490,258 | | | | 5.3 | | |
| Commercial Services | | | 1,280,484 | | | | 4.5 | | |
| Alternative Energy | | | 1,243,702 | | | | 4.4 | | |
| Health Care Services | | | 1,219,693 | | | | 4.3 | | |
| Investment Company | | | 1,038,390 | | | | 3.7 | | |
Real Estate Investment
Trusts (REIT) | | | 1,023,518 | | | | 3.6 | | |
| Medical Equipment | | | 976,332 | | | | 3.4 | | |
Communications
Technology | | | 955,032 | | | | 3.4 | | |
Recreational Vehicles &
Boats | | | 943,662 | | | | 3.3 | | |
| Chemicals: Diversified | | | 858,511 | | | | 3.0 | | |
| INDUSTRY | | VALUE | | PERCENT OF
TOTAL
INVESTMENTS | |
| Consumer Lending | | $ | 853,327 | | | | 3.0 | % | |
| Biotechnology | | | 656,661 | | | | 2.3 | | |
Metals & Minerals:
Diversified | | | 536,201 | | | | 1.9 | | |
Insurance:
Property-Casualty | | | 517,959 | | | | 1.8 | | |
Wholesale & International
Trade | | | 500,636 | | | | 1.8 | | |
| Air Transport | | | 454,731 | | | | 1.6 | | |
Commercial Finance &
Mortgage Companies | | | 407,086 | | | | 1.4 | | |
Beverage: Brewers &
Distillers | | | 371,475 | | | | 1.3 | | |
| Foods | | | 191,015 | | | | 0.7 | | |
| | | $ | 28,348,331 | | | | 100.0 | % | |
See Notes to Financial Statements
57
Morgan Stanley Variable Investment Series - Strategist
Portfolio of Investments n June 30, 2012 (unaudited)
NUMBER OF
SHARES | |
| | VALUE | |
| | | Common Stocks (61.5%) | |
| | | Aerospace & Defense (2.3%) | |
| | 52,230 | | | Raytheon Co. | | $ | 2,955,696 | | |
| | | Auto Components (1.0%) | |
| | 45,180 | | | Johnson Controls, Inc. | | | 1,251,938 | | |
| | | Chemicals (1.9%) | |
| | 47,270 | | | EI du Pont de Nemours & Co. | | | 2,390,444 | | |
| | | Commercial Services & Supplies (0.1%) | |
| | 15,724 | | | ACCO Brands Corp. (a) | | | 162,586 | | |
| | | Computers & Peripherals (0.6%) | |
| | 40,115 | | | Hewlett-Packard Co. | | | 806,713 | | |
| | | Diversified Financial Services (2.0%) | |
| | 71,445 | | | JPMorgan Chase & Co. | | | 2,552,730 | | |
| | | Diversified Telecommunication Services (3.6%) | |
| | 38,980 | | | CenturyLink, Inc. | | | 1,539,320 | | |
| | 69,870 | | | Verizon Communications, Inc. | | | 3,105,023 | | |
| | | | 4,644,343 | | |
| | | Food & Staples Retailing (1.1%) | |
| | 77,350 | | | Safeway, Inc. | | | 1,403,902 | | |
| | | Food Products (1.9%) | |
| | 94,270 | | | ConAgra Foods, Inc. | | | 2,444,421 | | |
| | | Hotels, Restaurants & Leisure (5.1%) | |
| | 29,050 | | | McDonald's Corp. | | | 2,571,796 | | |
| | 63,080 | | | Yum! Brands, Inc. | | | 4,063,614 | | |
| | | | 6,635,410 | | |
| | | Industrial Conglomerates (4.5%) | |
| | 134,870 | | | General Electric Co. | | | 2,810,691 | | |
| | 57,090 | | | Tyco International Ltd. | | | 3,017,206 | | |
| | | | 5,827,897 | | |
| | | Information Technology Services (2.0%) | |
| | 13,300 | | | International Business Machines Corp. | | | 2,601,214 | | |
| | | Insurance (2.5%) | |
| | 45,050 | | | Chubb Corp. (The) | | | 3,280,541 | | |
| | | Machinery (1.8%) | |
| | 42,525 | | | Illinois Tool Works, Inc. | | | 2,249,147 | | |
| | | Media (2.2%) | |
| | 74,380 | | | Time Warner, Inc. | | | 2,863,630 | | |
See Notes to Financial Statements
58
Morgan Stanley Variable Investment Series - Strategist
Portfolio of Investments n June 30, 2012 (unaudited) continued
NUMBER OF
SHARES | |
| | VALUE | |
| | | Multi-Utilities (1.9%) | |
| | 43,680 | | | Integrys Energy Group, Inc. | | $ | 2,484,082 | | |
| | | Oil, Gas & Consumable Fuels (6.4%) | |
| | 26,550 | | | Chevron Corp. | | | 2,801,025 | | |
| | 39,035 | | | ConocoPhillips | | | 2,181,276 | | |
| | 30,900 | | | Exxon Mobil Corp. | | | 2,644,113 | | |
| | 19,517 | | | Phillips 66 (a) | | | 648,745 | | |
| | | | 8,275,159 | | |
| | | Paper & Forest Products (1.1%) | |
| | 47,670 | | | MeadWestvaco Corp. | | | 1,370,513 | | |
| | | Pharmaceuticals (5.9%) | |
| | 55,675 | | | Abbott Laboratories | | | 3,589,367 | | |
| | 113,640 | | | Bristol-Myers Squibb Co. | | | 4,085,358 | | |
| | | | 7,674,725 | | |
| | | Road & Rail (1.8%) | |
| | 32,410 | | | Norfolk Southern Corp. | | | 2,326,066 | | |
| | | Semiconductors & Semiconductor Equipment (1.7%) | |
| | 83,805 | | | Intel Corp. | | | 2,233,403 | | |
| | | Software (2.4%) | |
| | 99,060 | | | Microsoft Corp. | | | 3,030,245 | | |
| | | Specialty Retail (2.9%) | |
| | 71,305 | | | Home Depot, Inc. | | | 3,778,452 | | |
| | | Textiles, Apparel & Luxury Goods (1.7%) | |
| | 16,710 | | | VF Corp. | | | 2,229,949 | | |
| | | Tobacco (3.1%) | |
| | 28,700 | | | Philip Morris International, Inc. | | | 2,504,362 | | |
| | 34,280 | | | Reynolds American, Inc. | | | 1,538,144 | | |
| | | | 4,042,506 | | |
| | | | | Total Common Stocks
(Cost $73,384,491) | | | 79,515,712 | | |
PRINCIPAL
AMOUNT
(000) | |
| |
COUPON
RATE | |
MATURITY
DATE | |
| |
| | | Corporate Bonds (7.4%) | |
| | | Basic Materials (0.5%) | |
| $ | 105 | | | Air Products & Chemicals, Inc | | | 2.00 | % | | 08/02/16 | | | 108,348 | | |
| | 15 | | | ArcelorMittal (Luxembourg) | | | 7.00 | | | 10/15/39 | | | 14,603 | | |
| | 50 | | | ArcelorMittal (Luxembourg) | | | 9.85 | | | 06/01/19 | | | 59,579 | | |
See Notes to Financial Statements
59
Morgan Stanley Variable Investment Series - Strategist
Portfolio of Investments n June 30, 2012 (unaudited) continued
PRINCIPAL
AMOUNT
(000) | |
| |
COUPON
RATE | |
MATURITY
DATE | |
VALUE | |
| $ | 60 | | | Barrick Gold Corp. (Canada) | | | 3.85 | % | | 04/01/22 | | $ | 62,245 | | |
| | 55 | | | Barrick North America Finance LLC | | | 4.40 | | | 05/30/21 | | | 59,390 | | |
| | 50 | | | Eastman Chemical Co. | | | 3.60 | | | 08/15/22 | | | 51,102 | | |
| | 50 | | | Georgia-Pacific LLC | | | 8.875 | | | 05/15/31 | | | 70,677 | | |
| | 75 | | | Kinross Gold Corp. (Canada) | | | 5.125 | | | 09/01/21 | | | 76,016 | | |
| | 75 | | | Syngenta Finance (Switzerland) | | | 3.125 | | | 03/28/22 | | | 76,276 | | |
| | 60 | | | Vale Overseas Ltd. (Brazil) | | | 5.625 | | | 09/15/19 | | | 66,814 | | |
| | | | 645,050 | | |
| | | Communications (0.7%) | |
| | 25 | | | AT&T, Inc. | | | 5.35 | | | 09/01/40 | | | 28,802 | | |
| | 85 | | | AT&T, Inc. | | | 6.30 | | | 01/15/38 | | | 106,246 | | |
| | 45 | | | CenturyLink, Inc. | | | 6.45 | | | 06/15/21 | | | 46,905 | | |
| | 50 | | | Comcast Corp. | | | 5.15 | | | 03/01/20 | | | 58,138 | | |
| | 45 | | | Comcast Corp. | | | 5.70 | | | 05/15/18 | | | 53,137 | | |
| | 25 | | | Comcast Corp. | | | 6.40 | | | 05/15/38 | | | 30,581 | | |
| | 45 | | | Deutsche Telekom International Finance BV (Germany) | | | 8.75 | | | 06/15/30 | | | 62,624 | | |
| | 50 | | | Motorola Solutions, Inc. | | | 3.75 | | | 05/15/22 | | | 49,409 | | |
| | 40 | | | NBC Universal Media LLC | | | 4.375 | | | 04/01/21 | | | 44,086 | | |
| | 25 | | | NBC Universal Media LLC | | | 5.95 | | | 04/01/41 | | | 29,622 | | |
| | 55 | | | Omnicom Group, Inc. | | | 3.625 | | | 05/01/22 | | | 56,001 | | |
| | 40 | | | Qwest Corp. | | | 6.875 | | | 09/15/33 | | | 40,000 | | |
| | 25 | | | Time Warner, Inc. | | | 7.70 | | | 05/01/32 | | | 32,739 | | |
| | 35 | | | Verizon Communications, Inc. | | | 4.60 | | | 04/01/21 | | | 40,189 | | |
| | 55 | | | Verizon Communications, Inc. | | | 8.95 | | | 03/01/39 | | | 90,893 | | |
| | 45 | | | Vivendi SA (France) (b) | | | 6.625 | | | 04/04/18 | | | 49,801 | | |
| | 100 | | | WPP Finance UK (United Kingdom) | | | 8.00 | | | 09/15/14 | | | 112,835 | | |
| | | | 932,008 | | |
| | | Consumer, Cyclical (0.4%) | |
| | 90 | | | Best Buy Co., Inc. | | | 3.75 | | | 03/15/16 | | | 87,943 | | |
| | 65 | | | Gap, Inc. (The) | | | 5.95 | | | 04/12/21 | | | 67,488 | | |
| | 20 | | | Ingram Micro, Inc. | | | 5.25 | | | 09/01/17 | | | 21,465 | | |
| | 30 | | | Macy's Retail Holdings, Inc. | | | 3.875 | | | 01/15/22 | | | 31,603 | | |
| | 70 | | | VF Corp. | | | 3.50 | | | 09/01/21 | | | 74,778 | | |
| | 100 | | | Volkswagen International Finance N.V. (Germany) (b) | | | 2.375 | | | 03/22/17 | | | 101,696 | | |
| | 40 | | | Wal-Mart Stores, Inc. | | | 5.25 | | | 09/01/35 | | | 48,584 | | |
| | 45 | | | Wesfarmers Ltd. (Australia) (b) | | | 2.983 | | | 05/18/16 | | | 46,367 | | |
| | 5 | | | Yum! Brands, Inc. | | | 6.875 | | | 11/15/37 | | | 6,644 | | |
| | | | 486,568 | | |
| | | Consumer, Non-Cyclical (1.0%) | |
| | 50 | | | Altria Group, Inc. | | | 4.125 | | | 09/11/15 | | | 54,310 | | |
| | 60 | | | Altria Group, Inc. | | | 9.25 | | | 08/06/19 | | | 83,473 | | |
See Notes to Financial Statements
60
Morgan Stanley Variable Investment Series - Strategist
Portfolio of Investments n June 30, 2012 (unaudited) continued
PRINCIPAL
AMOUNT
(000) | |
| |
COUPON
RATE | |
MATURITY
DATE | |
VALUE | |
| $ | 60 | | | Boston Scientific Corp. | | | 6.00 | % | | 01/15/20 | | $ | 71,669 | | |
| | 90 | | | Cigna Corp. | | | 2.75 | | | 11/15/16 | | | 92,820 | | |
| | 65 | | | Coventry Health Care, Inc. | | | 5.45 | | | 06/15/21 | | | 73,198 | | |
| | 25 | | | Covidien International Finance SA | | | 3.20 | | | 06/15/22 | | | 25,829 | | |
| | 96 | | | Delhaize Group SA (Belgium) | | | 5.70 | | | 10/01/40 | | | 80,899 | | |
| | 65 | | | Gilead Sciences, Inc. | | | 4.50 | | | 04/01/21 | | | 72,364 | | |
| | 5 | | | Gilead Sciences, Inc. | | | 5.65 | | | 12/01/41 | | | 5,851 | | |
| | 100 | | | Grupo Bimbo SAB de CV (Mexico) (b) | | | 4.875 | | | 06/30/20 | | | 111,240 | | |
| | 50 | | | Kraft Foods, Inc. | | | 6.50 | | | 02/09/40 | | | 64,462 | | |
| | 70 | | | Life Technologies Corp. | | | 6.00 | | | 03/01/20 | | | 82,250 | | |
| | 75 | | | Sanofi (France) | | | 4.00 | | | 03/29/21 | | | 83,806 | | |
| | 120 | | | Teva Pharmaceutical Finance IV BV (Israel) | | | 3.65 | | | 11/10/21 | | | 126,464 | | |
| | 65 | | | UnitedHealth Group, Inc. | | | 6.625 | | | 11/15/37 | | | 87,306 | | |
| | 55 | | | Verisk Analytics, Inc. | | | 5.80 | | | 05/01/21 | | | 61,493 | | |
| | 65 | | | Woolworths Ltd. (Australia) (b) | | | 4.00 | | | 09/22/20 | | | 69,528 | | |
| | | | 1,246,962 | | |
| | | Energy (0.6%) | |
| | 75 | | | BP Capital Markets PLC (United Kingdom) | | | 3.245 | | | 05/06/22 | | | 77,818 | | |
| | 35 | | | Enterprise Products Operating LLC | | | 5.25 | | | 01/31/20 | | | 40,156 | | |
| | 90 | | | Enterprise Products Operating LLC, Series N | | | 6.50 | | | 01/31/19 | | | 108,624 | | |
| | 40 | | | EQT Corp. | | | 4.875 | | | 11/15/21 | | | 40,934 | | |
| | 50 | | | Kinder Morgan Energy Partners LP | | | 5.95 | | | 02/15/18 | | | 58,051 | | |
| | 35 | | | Marathon Petroleum Corp. | | | 5.125 | | | 03/01/21 | | | 39,256 | | |
| | 50 | | | Murphy Oil Corp. | | | 4.00 | | | 06/01/22 | | | 51,024 | | |
| | 50 | | | Phillips 66 (b) | | | 4.30 | | | 04/01/22 | | | 52,703 | | |
| | 60 | | | Plains All American Pipeline LP/PAA Finance Corp. | | | 6.70 | | | 05/15/36 | | | 70,370 | | |
| | 60 | | | Plains All American Pipeline LP/PAA Finance Corp. | | | 8.75 | | | 05/01/19 | | | 79,243 | | |
| | 50 | | | Spectra Energy Capital LLC | | | 7.50 | | | 09/15/38 | | | 66,328 | | |
| | 55 | | | Texas Eastern Transmission LP | | | 7.00 | | | 07/15/32 | | | 71,452 | | |
| | | | 755,959 | | |
| | | Finance (3.0%) | |
| | 100 | | | ABB Treasury Center USA, Inc. (Switzerland) (b) | | | 2.50 | | | 06/15/16 | | | 103,521 | | |
| | 100 | | | Abbey National Treasury Services PLC
(United Kingdom) (b) | | | 3.875 | | | 11/10/14 | | | 98,572 | | |
| | 75 | | | Aegon N.V. (Netherlands) | | | 4.625 | | | 12/01/15 | | | 80,097 | | |
| | 100 | | | Australia & New Zealand Banking Group Ltd.
(Australia) (b) | | | 4.875 | | | 01/12/21 | | | 109,810 | | |
| | 130 | | | Berkshire Hathaway, Inc. | | | 3.75 | | | 08/15/21 | | | 138,950 | | |
| | 75 | | | BNP Paribas SA (France) | | | 5.00 | | | 01/15/21 | | | 77,122 | | |
| | 45 | | | Brookfield Asset Management, Inc. (Canada) | | | 5.80 | | | 04/25/17 | | | 49,028 | | |
| | 35 | | | Citigroup, Inc. (See Note 6) | | | 5.875 | | | 05/29/37 | | | 38,265 | | |
See Notes to Financial Statements
61
Morgan Stanley Variable Investment Series - Strategist
Portfolio of Investments n June 30, 2012 (unaudited) continued
PRINCIPAL
AMOUNT
(000) | |
| |
COUPON
RATE | |
MATURITY
DATE | |
VALUE | |
| $ | 70 | | | Citigroup, Inc. (See Note 6) | | | 6.125 | % | | 05/15/18 | | $ | 78,257 | | |
| | 95 | | | CNA Financial Corp. | | | 5.75 | | | 08/15/21 | | | 104,574 | | |
| | 50 | | | Cooperatieve Centrale Raiffeisen-Boerenleenbank BA
(Netherlands) | | | 3.875 | | | 02/08/22 | | | 50,963 | | |
| | 240 | | | Credit Suisse (Switzerland) | | | 5.40 | | | 01/14/20 | | | 250,002 | | |
| | 25 | | | Credit Suisse (Switzerland) | | | 6.00 | | | 02/15/18 | | | 26,781 | | |
| | 60 | | | Dexus Diversified Trust/Dexus Office Trust
(Australia) (b) | | | 5.60 | | | 03/15/21 | | | 62,273 | | |
| | 25 | | | ERP Operating LP | | | 4.625 | | | 12/15/21 | | | 27,206 | | |
| | 140 | | | Farmers Exchange Capital (b) | | | 7.05 | | | 07/15/28 | | | 161,090 | | |
| | 200 | | | Ford Motor Credit Co., LLC (b) | | | 4.207 | | | 04/15/16 | | | 207,857 | | |
| | 60 | | | General Electric Capital Corp. | | | 5.30 | | | 02/11/21 | | | 67,461 | | |
| | 145 | | | General Electric Capital Corp., Series G | | | 6.00 | | | 08/07/19 | | | 169,911 | | |
| | 75 | | | Genworth Financial, Inc. | | | 7.20 | | | 02/15/21 | | | 71,549 | | |
| | 45 | | | Harley-Davidson Funding Corp. (b) | | | 6.80 | | | 06/15/18 | | | 53,716 | | |
| | 60 | | | Hartford Financial Services Group, Inc. | | | 5.50 | | | 03/30/20 | | | 62,742 | | |
| | 70 | | | HSBC Holdings PLC (United Kingdom) | | | 4.00 | | | 03/30/22 | | | 72,834 | | |
| | 60 | | | JPMorgan Chase & Co. | | | 4.25 | | | 10/15/20 | | | 63,141 | | |
| | 140 | | | JPMorgan Chase & Co. | | | 4.625 | | | 05/10/21 | | | 150,071 | | |
| | 70 | | | Lloyds TSB Bank PLC (United Kingdom) | | | 6.375 | | | 01/21/21 | | | 79,463 | | |
| | 50 | | | Macquarie Bank Ltd. (Australia) (b) | | | 6.625 | | | 04/07/21 | | | 50,216 | | |
| | 55 | | | Macquarie Group Ltd. (Australia) (b) | | | 6.00 | | | 01/14/20 | | | 54,797 | | |
| | 225 | | | Merrill Lynch & Co., Inc., MTN | | | 6.875 | | | 04/25/18 | | | 252,065 | | |
| | 35 | | | MetLife, Inc. (See Note 6) | | | 7.717 | | | 02/15/19 | | | 44,387 | | |
| | 170 | | | Nationwide Building Society (United Kingdom) (b) | | | 6.25 | | | 02/25/20 | | | 183,664 | | |
| | 50 | | | Nationwide Financial Services (b) | | | 5.375 | | | 03/25/21 | | | 51,809 | | |
| | 75 | | | Pacific LifeCorp (b) | | | 6.00 | | | 02/10/20 | | | 81,991 | | |
| | 60 | | | Platinum Underwriters Finance, Inc., Series B | | | 7.50 | | | 06/01/17 | | | 65,779 | | |
| | 50 | | | Principal Financial Group, Inc. | | | 8.875 | | | 05/15/19 | | | 64,897 | | |
| | 40 | | | Prudential Financial, Inc., MTN | | | 6.625 | | | 12/01/37 | | | 45,389 | | |
| | 25 | | | Santander Holdings USA, Inc. (Spain) | | | 4.625 | | | 04/19/16 | | | 24,180 | | |
| | 70 | | | SLM Corp., MTN | | | 6.25 | | | 01/25/16 | | | 73,850 | | |
| | 100 | | | Standard Chartered Bank (United Kingdom) (b) | | | 6.40 | | | 09/26/17 | | | 111,596 | | |
| | 60 | | | Wachovia Corp. | | | 5.625 | | | 10/15/16 | | | 67,700 | | |
| | 95 | | | Wells Fargo & Co. | | | 5.625 | | | 12/11/17 | | | 111,066 | | |
| | 80 | | | Wells Operating Partnership II LP | | | 5.875 | | | 04/01/18 | | | 83,278 | | |
| | | | 3,821,920 | | |
| | | Industrials (0.8%) | |
| | 50 | | | ABB Finance USA, Inc. (Switzerland) | | | 2.875 | | | 05/08/22 | | | 50,686 | | |
| | 100 | | | BAA Funding Ltd. (United Kingdom) (b) | | | 4.875 | | | 07/15/21 | | | 105,720 | | |
| | 65 | | | Bemis Co., Inc. | | | 4.50 | | | 10/15/21 | | | 70,281 | | |
See Notes to Financial Statements
62
Morgan Stanley Variable Investment Series - Strategist
Portfolio of Investments n June 30, 2012 (unaudited) continued
PRINCIPAL
AMOUNT
(000) | |
| |
COUPON
RATE | |
MATURITY
DATE | |
VALUE | |
| $ | 75 | | | Boston Properties LP | | | 3.85 | % | | 02/01/23 | | $ | 75,865 | | |
| | 90 | | | Cooper US, Inc. | | | 5.25 | | | 11/15/12 | | | 91,493 | | |
| | 75 | | | CRH America, Inc. | | | 6.00 | | | 09/30/16 | | | 82,176 | | |
| | 30 | | | Holcim US Finance Sarl & Cie SCS (Switzerland) (b) | | | 6.00 | | | 12/30/19 | | | 31,501 | | |
| | 75 | | | L-3 Communications Corp. | | | 4.95 | | | 02/15/21 | | | 81,252 | | |
| | 75 | | | LVMH Moet Hennessy Louis Vuitton SA (France) (b) | | | 1.625 | | | 06/29/17 | | | 75,068 | | |
| | 10 | | | Norfolk Southern Corp. | | | 4.837 | | | 10/01/41 | | | 11,081 | | |
| | 50 | | | Norfolk Southern Corp. | | | 7.25 | | | 02/15/31 | | | 69,458 | | |
| | 75 | | | Republic Services, Inc. | | | 3.55 | | | 06/01/22 | | | 75,968 | | |
| | 70 | | | Sonoco Products Co. | | | 5.75 | | | 11/01/40 | | | 79,617 | | |
| | 40 | | | Union Pacific Corp. | | | 6.125 | | | 02/15/20 | | | 49,476 | | |
| | 45 | | | United Technologies Corp. | | | 4.50 | | | 06/01/42 | | | 49,639 | | |
| | 80 | | | Waste Management, Inc. | | | 6.125 | | | 11/30/39 | | | 99,296 | | |
| | | | 1,098,577 | | |
| | | Technology (0.2%) | |
| | 50 | | | Fiserv, Inc. | | | 3.125 | | | 06/15/16 | | | 51,592 | | |
| | 125 | | | Hewlett-Packard Co. | | | 4.65 | | | 12/09/21 | | | 131,276 | | |
| | 100 | | | International Business Machines Corp. | | | 7.625 | | | 10/15/18 | | | 133,403 | | |
| | | | 316,271 | | |
| | | Utilities (0.2%) | |
| | 75 | | | Ohio Power Co., Series M | | | 5.375 | | | 10/01/21 | | | 88,712 | | |
| | 80 | | | Oncor Electric Delivery Co., LLC | | | 6.80 | | | 09/01/18 | | | 95,744 | | |
| | 75 | | | PPL WEM Holdings PLC (b) | | | 3.90 | | | 05/01/16 | | | 78,674 | | |
| | | | 263,130 | | |
| | | | | Total Corporate Bonds
(Cost $8,643,655) | | | | | | | 9,566,445 | | |
| | | Sovereign (0.4%) | |
| | 100 | | | Banco Nacional de Desenvolvimento, Economico e
Social (Brazil) (b) | | | 5.50 | | | 07/12/20 | | | 114,125 | | |
| | 150 | | | Brazilian Government International Bond (Brazil) | | | 4.875 | | | 01/22/21 | | | 174,225 | | |
| | 80 | | | Mexico Government International Bond (Mexico) | | | 3.625 | | | 03/15/22 | | | 85,120 | | |
| | 150 | | | Petroleos Mexicanos (Mexico) (b) | | | 4.875 | | | 01/24/22 | | | 162,375 | | |
| | | | | Total Sovereign
(Cost $528,980) | | | | | | | 535,845 | | |
| | | Municipal Bonds (0.5%) | |
| | 75 | | | Chicago, IL, Transit Authority | | | 6.20 | | | 12/01/40 | | | 82,846 | | |
| | 30 | | | City of Chicago, IL, O'Hare International Airport
Revenue | | | 6.395 | | | 01/01/40 | | | 38,579 | | |
| | 70 | | | City of New York, NY, Series G-1 | | | 5.968 | | | 03/01/36 | | | 87,314 | | |
See Notes to Financial Statements
63
Morgan Stanley Variable Investment Series - Strategist
Portfolio of Investments n June 30, 2012 (unaudited) continued
PRINCIPAL
AMOUNT
(000) | |
| |
COUPON
RATE | |
MATURITY
DATE | |
VALUE | |
| $ | 85 | | | Illinois State Toll Highway Authority, Highway
Revenue, Build America Bonds | | | 6.184 | % | | 01/01/34 | | $ | 105,538 | | |
| | 95 | | | Municipal Electric Authority of Georgia | | | 6.655 | | | 04/01/57 | | | 109,966 | | |
| | 65 | | | New York City, NY, Transitional Finance Authority
Future Tax Secured Revenue | | | 5.267 | | | 05/01/27 | | | 75,095 | | |
| | | State of California,
General Obligation Bonds | | | |
| | 45 | | | | | | | | 5.95 | | | 04/01/16 | | | 51,381 | | |
| | 30 | | | | | | | | 6.65 | | | 03/01/22 | | | 36,947 | | |
| | | | | Total Municipal Bonds
(Cost $496,205) | | | | | | | 587,666 | | |
| | | Agency Fixed Rate Mortgages (0.0%) | | | |
| | 2 | | | Federal Home Loan Mortgage Corporation,
Gold Pools | | | 6.50 | | | 05/01/29 - 12/01/31 | | | 2,772 | | |
| | 1 | | | Federal National Mortgage Association,
Conventional Pool | | | 6.50 | | | 11/01/29 | | | 641 | | |
| | | | | Total Agency Fixed Rate Mortgages
(Cost $3,102) | | | | | | | 3,413 | | |
| | | Asset-Backed Securities (0.8%) | | | |
| | 100 | | | Ally Master Owner Trust | | | 1.112 | (c) | | 01/15/16 | | | 100,692 | | |
| | 29 | | | Brazos Student Finance Corp. | | | 1.368 | (c) | | 06/25/35 | | | 29,402 | | |
| | 141 | | | CVS Pass-Through Trust | | | 6.036 | | | 12/10/28 | | | 159,876 | | |
| | 100 | | | GE Dealer Floorplan Master Note Trust (b) | | | 1.792 | (c) | | 10/20/14 | | | 100,464 | | |
| | 175 | | | Louisiana Public Facilities Authority | | | 1.366 | (c) | | 04/26/27 | | | 175,616 | | |
| | 150 | | | Nissan Auto Receivables Owner Trust | | | 1.18 | | | 02/16/15 | | | 151,017 | | |
| | 180 | | | PFS Financing Corp. (b) | | | 1.742 | (c) | | 10/17/16 | | | 181,530 | | |
| | 125 | | | World Omni Automobile Lease Securitization Trust | | | 1.49 | | | 10/15/14 | | | 125,776 | | |
| | | | | Total Asset-Backed Securities
(Cost $998,649) | | | | | | | 1,024,373 | | |
| | | U.S. Treasury Securities (13.8%) | | | |
| | | | | U.S. Treasury Bonds | | | | | | | | | | | | | |
| | 1,620 | | | | | | | | 3.50 | | | 02/15/39 | | | 1,874,897 | | |
| | 610 | | | | | | | | 3.875 | | | 08/15/40 | | | 751,063 | | |
| | 200 | | | | | | | | 5.25 | | | 11/15/28 | | | 281,500 | | |
| | 255 | | | | | | | | 5.375 | | | 02/15/31 | | | 371,623 | | |
| | | | | U.S. Treasury Notes | | | | | | | | | | | | | |
| | 210 | | | | | | | | 0.50 | | | 10/15/13 | | | 210,607 | | |
| | 1,710 | | | | | | | | 1.00 | | | 09/30/16 | | | 1,736,852 | | |
| | 452 | | | | | | | | 1.25 | | | 10/31/15 | | | 463,335 | | |
See Notes to Financial Statements
64
Morgan Stanley Variable Investment Series - Strategist
Portfolio of Investments n June 30, 2012 (unaudited) continued
PRINCIPAL
AMOUNT
(000) | |
| |
COUPON
RATE | |
MATURITY
DATE | |
VALUE | |
| $ | 3,180 | | | | | | 1.75 | % | | 01/31/14 - 07/31/15 | | $ | 3,275,588 | | |
| | | | 1,000 | | | | 1.875 | | | 09/30/17 | | | 1,055,078 | | |
| | | | 2,145 | | | | 2.25 | | | 01/31/15 - 03/31/16 | | | 2,260,393 | | |
| | | | 5,300 | | | | 2.375 | | | 08/31/14 - 06/30/18 | | | 5,592,462 | | |
| | | Total U.S. Treasury Securities
(Cost $17,372,100) | | | | | | | 17,873,398 | | |
| | | U.S. Agency Securities (1.6%) | | | |
| | | Federal Home Loan Mortgage Corporation | | | |
| | | | 150 | | | | 3.75 | | | 03/27/19 | | | 173,516 | | |
| | | | 45 | | | | 6.75 | | | 03/15/31 | | | 69,264 | | |
| | | Federal National Mortgage Association | | | |
| | | | 500 | | | | 1.25 | | | 09/28/16 | | | 509,256 | | |
| | | | 700 | | | | 4.375 | | | 10/15/15 | | | 786,307 | | |
| | | | 450 | | | | 5.375 | | | 06/12/17 | | | 545,820 | | |
| | | Total U.S. Agency Securities
(Cost $1,993,375) | | | | | | | 2,084,163 | | |
| | | Short-Term Investments (13.8%) | | | |
| | | U.S. Treasury Security (0.1%) | | | |
| | 100 | | | U.S. Treasury Bill
(Cost $99,978) (d) | | | 0.136 | | | 08/30/12 | | | 99,992 | | |
NUMBER OF
SHARES (000) | |
| |
| |
| |
| |
| | | Investment Company (13.7%) | | | |
| | | 17,767Morgan Stanley Institutional Liquidity Funds - Money
Market Portfolio - Institutional Class (See Note 6)
(Cost $17,766,564) | | | 17,766,564 | | |
| | | Total Short-Term Investments
(Cost $17,866,542) | | | | | | | 17,866,556 | | |
| | | Total Investments
(Cost $121,287,099) (e) | | | | | 99.8 | % | | | 129,057,571 | | |
| | | Other Assets in Excess of Liabilities | | | | | 0.2 | | | | 245,328 | | |
| | | Net Assets | | | | | 100.0 | % | | $ | 129,302,899 | | |
See Notes to Financial Statements
65
Morgan Stanley Variable Investment Series - Strategist
Portfolio of Investments n June 30, 2012 (unaudited) continued
MTN Medium Term Note.
(a) Non-income producing security.
(b) 144A security — Certain conditions for public sale may exist. Unless otherwise noted, these securities are deemed to be liquid.
(c) Variable/Floating Rate Security — Interest rate changes on these instruments are based on changes in a designated base rate. The rates shown are those in effect on June 30, 2012.
(d) Rate shown is the yield to maturity at June 30, 2012.
(e) Securities are available for collateral in connection with open futures contracts and swap agreements.
FUTURES CONTRACTS OPEN AT JUNE 30, 2012:
NUMBER OF
CONTRACTS | | LONG/SHORT | | DESCRIPTION, DELIVERY
MONTH AND YEAR | | UNDERLYING FACE
AMOUNT AT VALUE | | UNREALIZED
DEPRECIATION | |
| | 1 | | | Long | | U.S. Treasury 5 yr. Note,
Sep-12 | | $ | 123,969 | | | $ | (8 | ) | |
| | 10 | | | Short | | U.S. Treasury 10 yr. Note,
Sep-12 | | | (1,333,750 | ) | | | (2,522 | ) | |
| Total Unrealized Depreciation | | $ | (2,530 | ) | |
INTEREST RATE SWAP AGREEMENTS OPEN AT JUNE 30, 2012:
SWAP
COUNTERPARTY | | NOTIONAL
AMOUNT
(000) | | FLOATING
RATE INDEX | | PAY/RECEIVE
FLOATING RATE | | FIXED RATE | | TERMINATION
DATE | | UNREALIZED
APPRECIATION
(DEPRECIATION) | |
| Bank of America | | EUR | 1,720 | | | 6 Month EURIBOR | | Pay | | | 4.26 | % | | 08/18/26 | | $ | 111,313 | | |
| Bank of America | | $ | 2,305 | | | 3 Month LIBOR | | Receive | | | 4.35 | | | 08/18/26 | | | (104,732 | ) | |
| Bank of America | | | 2,860 | | | 3 Month LIBOR | | Pay | | | 4.15 | | | 08/18/31 | | | 102,319 | | |
| Bank of America | | EUR | 2,175 | | | 6 Month EURIBOR | | Receive | | | 3.61 | | | 08/18/31 | | | (116,564 | ) | |
| Net Unrealized Depreciation | | $ | (7,664 | ) | |
EURIBOR Euro Interbank Offered Rate.
LIBOR London Interbank Offered Rate.
Currency Abbreviation:
EUR Euro.
See Notes to Financial Statements
66
Morgan Stanley Variable Investment Series - Strategist
Summary of Investments n June 30, 2012 (unaudited)
| PORTFOLIO COMPOSITION | | VALUE | | PERCENT OF
TOTAL
INVESTMENTS | |
| Common Stocks | | $ | 79,515,712 | | | | 61.6 | % | |
| U.S. Treasury Securities | | | 17,973,390 | | | | 13.9 | | |
| Investment Company | | | 17,766,564 | | | | 13.8 | | |
| Corporate Bonds | | | 9,566,445 | | | | 7.4 | | |
| U.S. Agency Securities | | | 2,084,163 | | | | 1.6 | | |
| Asset-Backed Securities | | | 1,024,373 | | | | 0.8 | | |
| Municipal Bonds | | | 587,666 | | | | 0.5 | | |
| Sovereign | | | 535,845 | | | | 0.4 | | |
| Agency Fixed Rate Mortgages | | | 3,413 | | | | 0.0 | + | |
| | | $ | 129,057,571 | ++ | | | 100.0 | % | |
+ Amount is less than 0.05%.
++ Does not include open long/short futures contracts with an underlying face amount of $1,457,719 with total unrealized depreciation of $2,530 and open swap agreements with net unrealized depreciation of $7,664.
See Notes to Financial Statements
67
Morgan Stanley Variable Investment Series
Financial Statements
Statements of Assets and Liabilities
June 30, 2012 (unaudited)
| | | Money
Market | | Limited
Duration | | Income
Plus | | Global
Infrastructure | |
| Assets: | |
| Investments in securities, at value* | | $ | 98,300,683 | (1) | | $ | 52,161,204 | | | $ | 183,253,497 | | | $ | 70,541,269 | | |
| Investment in affiliates, at value** | | | — | | | | 1,790,136 | | | | 6,471,174 | | | | 1,092,962 | | |
| Total investments in securities, at value | | | 98,300,683 | | | | 53,951,340 | | | | 189,724,671 | | | | 71,634,231 | | |
| Unrealized appreciation on open swap agreements | | | — | | | | — | | | | — | | | | — | | |
| Cash | | | 9,269 | | | | — | | | | 5,063 | (2) | | | 147,960 | (2) | |
| Receivable for: | |
| Interest | | | 18,051 | | | | 354,748 | | | | 2,240,158 | | | | — | | |
| Dividends | | | — | | | | — | | | | 11,604 | | | | 652,243 | | |
| Investments sold | | | — | | | | 324,229 | | | | 192,533 | | | | 254,559 | | |
| Foreign withholding taxes reclaimed | | | — | | | | 148 | | | | 6,107 | | | | 32,201 | | |
| Variation margin | | | — | | | | — | | | | 43,916 | | | | — | | |
| Shares of beneficial interest sold | | | 54,929 | | | | — | | | | — | | | | — | | |
| Interest and dividends from affiliates | | | — | | | | 11,973 | | | | 22,075 | | | | 47 | | |
| Prepaid expenses and other assets | | | 4,830 | | | | 2,302 | | | | 6,561 | | | | 4,083 | | |
| Total Assets | | | 98,387,762 | | | | 54,644,740 | | | | 192,252,688 | | | | 72,725,324 | | |
| Liabilities: | |
| Unrealized depreciation on open swap agreements | | | — | | | | — | | | | 223,864 | | | | — | | |
| Unrealized depreciation on open foreign currency exchange contracts | | | — | | | | — | | | | 10,642 | | | | — | | |
| Payable for: | |
| Investments purchased | | | 1,000,000 | | | | 209,057 | | | | 941,858 | | | | 197,506 | | |
| Shares of beneficial interest redeemed | | | 25,642 | | | | 93,456 | | | | 193,303 | | | | 97,013 | | |
| Advisory fee | | | 9,540 | | | | 13,389 | | | | 65,571 | | | | 32,647 | | |
| Distribution fee (Class Y) | | | — | | | | 8,799 | | | | 20,996 | | | | 2,900 | | |
| Administration fee | | | 3,897 | | | | 3,593 | | | | 12,532 | | | | 4,590 | | |
| Variation margin | | | — | | | | 8,352 | | | | — | | | | — | | |
| Transfer agent fee | | | 251 | | | | 217 | | | | 257 | | | | 258 | | |
| Accrued expenses and other payables | | | 52,606 | | | | 43,953 | | | | 62,330 | | | | 46,624 | | |
| Total Liabilities | | | 1,091,936 | | | | 380,816 | | | | 1,531,353 | | | | 381,538 | | |
| Net Assets | | $ | 97,295,826 | | | $ | 54,263,924 | | | $ | 190,721,335 | | | $ | 72,343,786 | | |
| Composition of Net Assets: | |
| Paid-in-capital | | $ | 97,297,773 | | | $ | 88,256,023 | | | $ | 190,595,982 | | | $ | 55,826,367 | | |
| Net unrealized appreciation (depreciation) | | | — | | | | 886,199 | | | | 12,240,951 | | | | 13,106,001 | | |
| Accumulated undistributed net investment income (net investment loss) | | | 61 | | | | 406,163 | | | | 4,193,887 | | | | 1,039,819 | | |
| Accumulated net realized gain (loss) | | | (2,008 | ) | | | (35,284,461 | ) | | | (16,309,485 | ) | | | 2,371,599 | | |
| Net Assets | | $ | 97,295,826 | | | $ | 54,263,924 | | | $ | 190,721,335 | | | $ | 72,343,786 | | |
| * Cost | | $ | 98,300,683 | | | $ | 51,286,079 | | | $ | 171,209,949 | | | $ | 57,439,296 | | |
| ** Affiliated Cost | | $ | — | | | $ | 1,784,767 | | | $ | 5,955,988 | | | $ | 1,092,962 | | |
| Class X Shares: | |
| Net Assets | | $ | 46,494,505 | | | $ | 11,593,169 | | | $ | 88,523,257 | | | $ | 57,680,075 | | |
| Shares Outstanding (unlimited shares authorized, $0.01 par value) | | | 46,495,365 | | | | 1,525,556 | | | | 7,920,029 | | | | 6,956,170 | | |
| Net Asset Value Per Share | | $ | 1.00 | | | $ | 7.60 | | | $ | 11.18 | | | $ | 8.29 | | |
| Class Y Shares: | |
| Net Assets | | $ | 50,801,321 | | | $ | 42,670,755 | | | $ | 102,198,078 | | | $ | 14,663,711 | | |
| Shares Outstanding (unlimited shares authorized, $0.01 par value) | | | 50,802,414 | | | | 5,624,114 | | | | 9,164,757 | | | | 1,772,720 | | |
| Net Asset Value Per Share | | $ | 1.00 | | | $ | 7.59 | | | $ | 11.15 | | | $ | 8.27 | | |
(1) Including repurchase agreements of $53,208,000.
(2) Including foreign currency valued at $5,063, $147,960, and $111,874, respectively with a cost of $4,955, $147,505, and $111,183, respectively.
See Notes to Financial Statements
68
| | | European
Equity | | Multi Cap
Growth | | Aggressive
Equity | | Strategist | |
| Assets: | |
| Investments in securities, at value* | | $ | 48,020,065 | | | $ | 216,011,685 | | | $ | 27,309,941 | | | $ | 111,130,098 | | |
| Investment in affiliates, at value** | | | 1,158,271 | | | | 6,673,526 | | | | 1,038,390 | | | | 17,927,473 | | |
| Total investments in securities, at value | | | 49,178,336 | | | | 222,685,211 | | | | 28,348,331 | | | | 129,057,571 | | |
| Unrealized appreciation on open swap agreements | | | — | | | | — | | | | — | | | | 213,632 | | |
| Cash | | | 111,874 | (2) | | | 781,230 | | | | — | | | | — | | |
| Receivable for: | |
| Interest | | | — | | | | — | | | | — | | | | 281,990 | | |
| Dividends | | | 132,802 | | | | 90,429 | | | | 11,237 | | | | 125,995 | | |
| Investments sold | | | 17,783 | | | | — | | | | — | | | | — | | |
| Foreign withholding taxes reclaimed | | | 116,521 | | | | — | | | | — | | | | 140 | | |
| Variation margin | | | — | | | | — | | | | — | | | | 23,075 | | |
| Shares of beneficial interest sold | | | — | | | | — | | | | — | | | | — | | |
| Interest and dividends from affiliates | | | 126 | | | | 1,533 | | | | 206 | | | | 4,497 | | |
| Prepaid expenses and other assets | | | 5,423 | | | | 10,146 | | | | 3,982 | | | | 5,889 | | |
| Total Assets | | | 49,562,865 | | | | 223,568,549 | | | | 28,363,756 | | | | 129,712,789 | | |
| Liabilities: | |
| Unrealized depreciation on open swap agreements | | | — | | | | — | | | | — | | | | 221,296 | | |
| Unrealized depreciation on open foreign currency exchange contracts | | | 8,551 | | | | — | | | | — | | | | — | | |
| Payable for: | |
| Investments purchased | | | — | | | | 209,392 | | | | 26,621 | | | | — | | |
| Shares of beneficial interest redeemed | | | 22,642 | | | | 40,558 | | | | 18,841 | | | | 72,502 | | |
| Advisory fee | | | 26,091 | | | | 74,070 | | | | 15,026 | | | | 41,945 | | |
| Distribution fee (Class Y) | | | 2,210 | | | | 9,704 | | | | 3,205 | | | | 7,473 | | |
| Administration fee | | | 3,132 | | | | 14,318 | | | | 1,812 | | | | 8,377 | | |
| Variation margin | | | — | | | | — | | | | — | | | | — | | |
| Transfer agent fee | | | 260 | | | | 297 | | | | 216 | | | | 260 | | |
| Accrued expenses and other payables | | | 54,722 | | | | 65,980 | | | | 31,769 | | | | 58,037 | | |
| Total Liabilities | | | 117,608 | | | | 414,319 | | | | 97,490 | | | | 409,890 | | |
| Net Assets | | $ | 49,445,257 | | | $ | 223,154,230 | | | $ | 28,266,266 | | | $ | 129,302,899 | | |
| Composition of Net Assets: | |
| Paid-in-capital | | $ | 58,452,257 | | | $ | 164,611,612 | | | $ | 21,186,003 | | | $ | 125,565,408 | | |
| Net unrealized appreciation (depreciation) | | | 5,139,400 | | | | 49,301,897 | | | | 5,745,475 | | | | 7,760,278 | | |
| Accumulated undistributed net investment income (net investment loss) | | | 1,738,381 | | | | 599,171 | | | | (15,096 | ) | | | 1,240,192 | | |
| Accumulated net realized gain (loss) | | | (15,884,781 | ) | | | 8,641,550 | | | | 1,349,884 | | | | (5,262,979 | ) | |
| Net Assets | | $ | 49,445,257 | | | $ | 223,154,230 | | | $ | 28,266,266 | | | $ | 129,302,899 | | |
| * Cost | | $ | 42,865,159 | | | $ | 166,709,558 | | | $ | 21,564,436 | | | $ | 103,377,763 | | |
| ** Affiliated Cost | | $ | 1,158,271 | | | $ | 6,673,526 | | | $ | 1,038,390 | | | $ | 17,909,336 | | |
| Class X Shares: | |
| Net Assets | | $ | 38,275,654 | | | $ | 174,814,313 | | | $ | 12,254,377 | | | $ | 92,405,250 | | |
| Shares Outstanding (unlimited shares authorized, $0.01 par value) | | | 2,697,665 | | | | 4,360,608 | | | | 673,229 | | | | 8,818,445 | | |
| Net Asset Value Per Share | | $ | 14.19 | | | $ | 40.09 | | | $ | 18.20 | | | $ | 10.48 | | |
| Class Y Shares: | |
| Net Assets | | $ | 11,169,603 | | | $ | 48,339,917 | | | $ | 16,011,889 | | | $ | 36,897,649 | | |
| Shares Outstanding (unlimited shares authorized, $0.01 par value) | | | 788,971 | | | | 1,217,711 | | | | 904,280 | | | | 3,528,209 | | |
| Net Asset Value Per Share | | $ | 14.16 | | | $ | 39.70 | | | $ | 17.71 | | | $ | 10.46 | | |
69
Morgan Stanley Variable Investment Series
Financial Statements continued
Statements of Operations
For the six months ended June 30, 2012 (unaudited)
| | | Money
Market | | Limited
Duration | | Income
Plus | | Global
Infrastructure | |
| Net Investment Income: | |
| Income | |
| Dividends† | | | — | | | | — | | | $ | 34,749 | | | $ | 1,419,426 | | |
| Interest† | | $ | 135,514 | | | $ | 605,879 | | | | 4,723,447 | | | | 28 | | |
| Interest and dividends from affiliates (Note 6) | | | — | | | | 20,296 | | | | 135,213 | | | | 636 | | |
| Income from securities loaned - net | | | — | | | | — | | | | — | | | | — | | |
| Total Income | | | 135,514 | | | | 626,175 | | | | 4,893,409 | | | | 1,420,090 | | |
| †Net of foreign withholding taxes | | | — | | | | 295 | | | | — | | | | 78,878 | | |
| Expenses | |
| Advisory fee (Note 4) | | | 229,892 | | | | 83,425 | | | | 406,022 | | | | 206,207 | | |
| Distribution fee (Class Y shares) (Note 5) | | | 67,140 | | | | 54,369 | | | | 128,994 | | | | 18,053 | | |
| Professional fees | | | 26,189 | | | | 25,500 | | | | 29,379 | | | | 28,614 | | |
| Administration fee (Note 4) | | | 25,544 | | | | 22,247 | | | | 77,338 | | | | 28,941 | | |
| Shareholder reports and notices | | | 15,951 | | | | 9,451 | | | | 18,986 | | | | 8,459 | | |
| Custodian fees | | | 11,076 | | | | 6,284 | | | | 10,558 | | | | 17,443 | | |
| Trustees' fees and expenses | | | 3,188 | | | | 1,441 | | | | 3,614 | | | | 1,697 | | |
| Transfer agent fees and expenses | | | 1,508 | | | | 1,259 | | | | 1,507 | | | | 1,508 | | |
| Other | | | 4,557 | | | | 12,930 | | | | 21,415 | | | | 8,396 | | |
| Total Expenses | | | 385,045 | | | | 216,906 | | | | 697,813 | | | | 319,318 | | |
| Less: amounts waived (Note 5) | | | (254,657 | ) | | | — | | | | — | | | | — | | |
| Less: rebate from Morgan Stanley affiliated cash sweep (Note 6) | | | — | | | | (783 | ) | | | (3,823 | ) | | | (639 | ) | |
| Net Expenses | | | 130,388 | | | | 216,123 | | | | 693,990 | | | | 318,679 | | |
| Net Investment Income | | | 5,126 | | | | 410,052 | | | | 4,199,419 | | | | 1,101,411 | | |
| Realized and Unrealized Gain (Loss): | |
| Realized Gain (Loss) on: | |
| Investments | | | 3 | | | | 116,834 | | | | 3,855,068 | | | | 2,630,126 | | |
| Investments in affiliates (Note 6) | | | — | | | | 13,129 | | | | 333,108 | | | | — | | |
| Futures contracts | | | — | | | | 66,926 | | | | (490,301 | ) | | | — | | |
| Swap agreements | | | — | | | | (279,311 | ) | | | (90,725 | ) | | | — | | |
| Foreign currency exchange contracts | | | — | | | | — | | | | 41,819 | | | | — | | |
| Foreign currency translation | | | — | | | | — | | | | 610 | | | | 8,065 | | |
| Net Realized Gain (Loss) | | | 3 | | | | (82,422 | ) | | | 3,649,579 | | | | 2,638,191 | | |
| Change in Unrealized Appreciation/Depreciation on: | |
| Investments | | | — | | | | 359,706 | | | | 4,423,208 | | | | 1,203,538 | | |
| Investments in affiliates (Note 6) | | | — | | | | 8,570 | | | | (47,785 | ) | | | — | | |
| Futures contracts | | | — | | | | (21,893 | ) | | | 125,403 | | | | — | | |
| Swap agreements | | | — | | | | 270,993 | | | | (212,964 | ) | | | — | | |
| Foreign currency exchange contracts | | | — | | | | — | | | | (10,642 | ) | | | — | | |
| Foreign currency translation | | | — | | | | — | | | | 118 | | | | 5,120 | | |
| Net Change in Unrealized Appreciation/Depreciation | | | — | | | | 617,376 | | | | 4,277,338 | | | | 1,208,658 | | |
| Net Gain | | | 3 | | | | 534,954 | | | | 7,926,917 | | | | 3,846,849 | | |
| Net Increase | | $ | 5,129 | | | $ | 945,006 | | | $ | 12,126,336 | | | $ | 4,948,260 | | |
See Notes to Financial Statements
70
| | | European
Equity | | Multi Cap
Growth | | Aggressive
Equity | | Strategist | |
| Net Investment Income: | |
| Income | |
| Dividends† | | $ | 1,827,134 | | | $ | 1,570,002 | | | $ | 197,829 | | | $ | 1,205,449 | | |
| Interest† | | | — | | | | — | | | | — | | | | 465,442 | | |
| Interest and dividends from affiliates (Note 6) | | | 424 | | | | 5,044 | | | | 716 | | | | 27,943 | | |
| Income from securities loaned - net | | | 45,411 | | | | — | | | | — | | | | — | | |
| Total Income | | | 1,872,969 | | | | 1,575,046 | | | | 198,545 | | | | 1,698,834 | | |
| †Net of foreign withholding taxes | | | 135,341 | | | | 45,414 | | | | 5,769 | | | | — | | |
| Expenses | |
| Advisory fee (Note 4) | | | 229,449 | | | | 495,788 | | | | 99,047 | | | | 279,816 | | |
| Distribution fee (Class Y shares) (Note 5) | | | 14,783 | | | | 65,218 | | | | 20,888 | | | | 48,159 | | |
| Professional fees | | | 33,462 | | | | 31,696 | | | | 27,614 | | | | 32,717 | | |
| Administration fee (Note 4) | | | 21,099 | | | | 94,436 | | | | 11,827 | | | | 53,298 | | |
| Shareholder reports and notices | | | 11,811 | | | | 28,819 | | | | 7,023 | | | | 19,420 | | |
| Custodian fees | | | 9,389 | | | | 9,226 | | | | 4,309 | | | | 11,951 | | |
| Trustees' fees and expenses | | | 1,447 | | | | 4,255 | | | | 1,244 | | | | 2,717 | | |
| Transfer agent fees and expenses | | | 1,510 | | | | 1,755 | | | | 1,257 | | | | 1,510 | | |
| Other | | | 8,529 | | | | 9,364 | | | | 8,202 | | | | 20,985 | | |
| Total Expenses | | | 331,479 | | | | 740,557 | | | | 181,411 | | | | 470,573 | | |
| Less: amounts waived (Note 5) | | | (52,961 | ) | | | — | | | | — | | | | — | | |
| Less: rebate from Morgan Stanley affiliated cash sweep (Note 6) | | | (405 | ) | | | (5,174 | ) | | | (798 | ) | | | (18,042 | ) | |
| Net Expenses | | | 278,113 | | | | 735,383 | | | | 180,613 | | | | 452,531 | | |
| Net Investment Income | | | 1,594,856 | | | | 839,663 | | | | 17,932 | | | | 1,246,303 | | |
| Realized and Unrealized Gain (Loss): | |
| Realized Gain (Loss) on: | |
| Investments | | | (979,612 | ) | | | 9,305,031 | | | | 1,350,122 | | | | (3,702,220 | ) | |
| Investments in affiliates (Note 6) | | | — | | | | — | | | | — | | | | (907,033 | ) | |
| Futures contracts | | | — | | | | — | | | | — | | | | 33,536 | | |
| Swap agreements | | | — | | | | — | | | | — | | | | (100,127 | ) | |
| Foreign currency exchange contracts | | | (63,191 | ) | | | — | | | | — | | | | 4,044 | | |
| Foreign currency translation | | | (261,530 | ) | | | (1,145 | ) | | | (104 | ) | | | (594 | ) | |
| Net Realized Gain (Loss) | | | (1,304,333 | ) | | | 9,303,886 | | | | 1,350,018 | | | | (4,672,394 | ) | |
| Change in Unrealized Appreciation/Depreciation on: | |
| Investments | | | 1,336,740 | | | | 12,333,203 | | | | 1,381,489 | | | | 8,143,446 | | |
| Investments in affiliates (Note 6) | | | — | | | | — | | | | — | | | | 998,890 | | |
| Futures contracts | | | — | | | | — | | | | — | | | | 493 | | |
| Swap agreements | | | — | | | | — | | | | — | | | | 41,792 | | |
| Foreign currency exchange contracts | | | 138,593 | | | | — | | | | — | | | | 4,074 | | |
| Foreign currency translation | | | (647 | ) | | | 3,220 | | | | 244 | | | | 3,175 | | |
| Net Change in Unrealized Appreciation/Depreciation | | | 1,474,686 | | | | 12,336,423 | | | | 1,381,733 | | | | 9,191,870 | | |
| Net Gain | | | 170,353 | | | | 21,640,309 | | | | 2,731,751 | | | | 4,519,476 | | |
| Net Increase | | $ | 1,765,209 | | | $ | 22,479,972 | | | $ | 2,749,683 | | | $ | 5,765,779 | | |
71
Morgan Stanley Variable Investment Series
Financial Statements continued
Statements of Changes in Net Assets
| | | Money Market | | Limited Duration | | Income Plus | |
| | | For The Six
Months Ended
June 30, 2012 | | For The Year
Ended
December 31, 2011 | | For The Six
Months Ended
June 30, 2012 | | For The Year
Ended
December 31, 2011 | | For The Six
Months Ended
June 30, 2012 | | For The Year
Ended
December 31, 2011 | |
| | | (unaudited) | | | | (unaudited) | | | | (unaudited) | | | |
| Increase (Decrease) in Net Assets: | |
| Operations: | |
| Net investment income | | $ | 5,126 | | | $ | 12,040 | | | $ | 410,052 | | | $ | 1,217,838 | | | $ | 4,199,419 | | | $ | 10,385,354 | | |
| Net realized gain (loss) | | | 3 | | | | (2,034 | ) | | | (82,422 | ) | | | 340,336 | | | | 3,649,579 | | | | 5,672,980 | | |
| Net change in unrealized appreciation/depreciation | | | — | | | | — | | | | 617,376 | | | | 74,923 | | | | 4,277,338 | | | | (5,677,427 | ) | |
| Net Increase (Decrease) | | | 5,129 | | | | 10,006 | | | | 945,006 | | | | 1,633,097 | | | | 12,126,336 | | | | 10,380,907 | | |
| Dividends and Distributions to Shareholders from: | |
| Net investment income | |
| Class X Shares | | | (2,430 | ) | | | (5,521 | ) | | | (347,237 | ) | | | (456,806 | ) | | | (5,085,206 | ) | | | (5,809,741 | ) | |
| Class Y Shares | | | (2,693 | ) | | | (6,188 | ) | | | (1,155,973 | ) | | | (1,462,462 | ) | | | (5,615,046 | ) | | | (6,427,424 | ) | |
| Net realized gain | |
| Class X Shares | | | — | | | | — | | | | — | | | | — | | | | — | | | | — | | |
| Class Y Shares | | | — | | | | — | | | | — | | | | — | | | | — | | | | — | | |
| Total Dividends and Distributions | | | (5,123 | ) | | | (11,709 | ) | | | (1,503,210 | ) | | | (1,919,268 | ) | | | (10,700,252 | ) | | | (12,237,165 | ) | |
Net increase (decrease) from transactions in shares of
beneficial interest | | | (9,984,288 | ) | | | (19,788,308 | ) | | | (1,955,320 | ) | | | (11,618,059 | ) | | | (4,528,699 | ) | | | (35,004,480 | ) | |
| Net Decrease | | | (9,984,282 | ) | | | (19,790,011 | ) | | | (2,513,524 | ) | | | (11,904,230 | ) | | | (3,102,615 | ) | | | (36,860,738 | ) | |
| Net Assets: | |
| Beginning of period | | | 107,280,108 | | | | 127,070,119 | | | | 56,777,448 | | | | 68,681,678 | | | | 193,823,950 | | | | 230,684,688 | | |
| End of Period | | $ | 97,295,826 | | | $ | 107,280,108 | | | $ | 54,263,924 | | | $ | 56,777,448 | | | $ | 190,721,335 | | | $ | 193,823,950 | | |
Accumulated Undistributed Net Investment
Income | | $ | 61 | | | $ | 58 | | | $ | 406,163 | | | $ | 1,499,321 | | | $ | 4,193,887 | | | $ | 10,694,720 | | |
See Notes to Financial Statements
72
| | | Global Infrastructure | | European Equity | |
| | | For The Six
Months Ended
June 30, 2012 | | For The Year
Ended
December 31, 2011 | | For The Six
Months Ended
June 30, 2012 | | For The Year
Ended
December 31, 2011 | |
| | | (unaudited) | | | | (unaudited) | | | |
| Increase (Decrease) in Net Assets: | |
| Operations: | |
| Net investment income | | $ | 1,101,411 | | | $ | 1,821,472 | | | $ | 1,594,856 | | | $ | 1,640,380 | | |
| Net realized gain (loss) | | | 2,638,191 | | | | 6,272,022 | | | | (1,304,333 | ) | | | 1,393,180 | | |
| Net change in unrealized appreciation/depreciation | | | 1,208,658 | | | | 3,163,169 | | | | 1,474,686 | | | | (8,877,969 | ) | |
| Net Increase (Decrease) | | | 4,948,260 | | | | 11,256,663 | | | | 1,765,209 | | | | (5,844,409 | ) | |
| Dividends and Distributions to Shareholders from: | |
| Net investment income | |
| Class X Shares | | | (1,393,488 | ) | | | (1,548,002 | ) | | | (1,129,845 | ) | | | (1,159,573 | ) | |
| Class Y Shares | | | (317,994 | ) | | | (341,922 | ) | | | (291,780 | ) | | | (329,209 | ) | |
| Net realized gain | |
| Class X Shares | | | (5,078,266 | ) | | | (3,167,474 | ) | | | — | | | | — | | |
| Class Y Shares | | | (1,294,994 | ) | | | (781,261 | ) | | | — | | | | — | | |
| Total Dividends and Distributions | | | (8,084,742 | ) | | | (5,838,659 | ) | | | (1,421,625 | ) | | | (1,488,782 | ) | |
Net increase (decrease) from transactions in shares of
beneficial interest | | | 2,009,444 | | | | (9,143,834 | ) | | | (3,747,985 | ) | | | (12,462,693 | ) | |
| Net Decrease | | | (1,127,038 | ) | | | (3,725,830 | ) | | | (3,404,401 | ) | | | (19,795,884 | ) | |
| Net Assets: | |
| Beginning of period | | | 73,470,824 | | | | 77,196,654 | | | | 52,849,658 | | | | 72,645,542 | | |
| End of Period | | $ | 72,343,786 | | | $ | 73,470,824 | | | $ | 49,445,257 | | | $ | 52,849,658 | | |
Accumulated Undistributed Net Investment
Income | | $ | 1,039,819 | | | $ | 1,649,890 | | | $ | 1,738,381 | | | $ | 1,565,150 | | |
73
Morgan Stanley Variable Investment Series
Financial Statements continued
Statements of Changes in Net Assets continued
| | | Multi Cap Growth | | Aggressive Equity | |
| | | For The Six
Months Ended
June 30, 2012 | | For The Year
Ended
December 31, 2011 | | For The Six
Months Ended
June 30, 2012 | | For The Year
Ended
December 31, 2011 | |
| | | (unaudited) | | | | (unaudited) | | | |
| Increase (Decrease) in Net Assets: | |
| Operations: | |
| Net investment income (loss) | | $ | 839,663 | | | $ | (64,872 | ) | | $ | 17,932 | | | $ | (188,722 | ) | |
| Net realized gain (loss) | | | 9,303,886 | | | | 32,645,551 | | | | 1,350,018 | | | | 4,222,056 | | |
| Net change in unrealized appreciation/depreciation | | | 12,336,423 | | | | (48,028,545 | ) | | | 1,381,733 | | | | (6,086,619 | ) | |
| Net Increase (Decrease) | | | 22,479,972 | | | | (15,447,866 | ) | | | 2,749,683 | | | | (2,053,285 | ) | |
| Dividends and Distributions to Shareholders from: | |
| Net investment income | |
| Class X Shares | | | — | | | | (327,521 | ) | | | — | | | | — | | |
| Class Y Shares | | | — | | | | — | | | | — | | | | — | | |
| Net realized gain | |
| Class X Shares | | | (3,819,990 | ) | | | — | | | | (939,227 | ) | | | — | | |
| Class Y Shares | | | (1,066,481 | ) | | | — | | | | (1,257,234 | ) | | | — | | |
| Total Dividends and Distributions | | | (4,886,471 | ) | | | (327,521 | ) | | | (2,196,461 | ) | | | — | | |
| Net decrease from transactions in shares of beneficial interest | | | (17,401,532 | ) | | | (49,118,412 | ) | | | (185,334 | ) | | | (4,238,872 | ) | |
| Net Increase (Decrease) | | | 191,969 | | | | (64,893,799 | ) | | | 367,888 | | | | (6,292,157 | ) | |
| Net Assets: | |
| Beginning of period | | | 222,962,261 | | | | 287,856,060 | | | | 27,898,378 | | | | 34,190,535 | | |
| End of Period | | $ | 223,154,230 | | | $ | 222,962,261 | | | $ | 28,266,266 | | | $ | 27,898,378 | | |
| Accumulated Undistributed Net Investment Income (Loss) | | $ | 599,171 | | | $ | (240,492 | ) | | $ | (15,096 | ) | | $ | (33,028 | ) | |
See Notes to Financial Statements
74
| | | Strategist | |
| | | For The Six
Months Ended
June 30, 2012 | | For The Year
Ended
December 31, 2011 | |
| | | (unaudited) | | | |
| Increase (Decrease) in Net Assets: | |
| Operations: | |
| Net investment income (loss) | | $ | 1,246,303 | | | $ | 2,351,102 | | |
| Net realized gain (loss) | | | (4,672,394 | ) | | | 1,769,803 | | |
| Net change in unrealized appreciation/depreciation | | | 9,191,870 | | | | (16,475,705 | ) | |
| Net Increase (Decrease) | | | 5,765,779 | | | | (12,354,800 | ) | |
| Dividends and Distributions to Shareholders from: | |
| Net investment income | |
| Class X Shares | | | (1,835,044 | ) | | | (2,406,851 | ) | |
| Class Y Shares | | | (615,244 | ) | | | (860,346 | ) | |
| Net realized gain | |
| Class X Shares | | | (1,393,988 | ) | | | (12,604,023 | ) | |
| Class Y Shares | | | (559,117 | ) | | | (5,258,076 | ) | |
| Total Dividends and Distributions | | | (4,403,393 | ) | | | (21,129,296 | ) | |
| Net decrease from transactions in shares of beneficial interest | | | (9,071,816 | ) | | | (14,118,840 | ) | |
| Net Increase (Decrease) | | | (7,709,430 | ) | | | (47,602,936 | ) | |
| Net Assets: | |
| Beginning of period | | | 137,012,329 | | | | 184,615,265 | | |
| End of Period | | $ | 129,302,899 | | | $ | 137,012,329 | | |
| Accumulated Undistributed Net Investment Income (Loss) | | $ | 1,240,192 | | | $ | 2,444,177 | | |
75
Morgan Stanley Variable Investment Series
Financial Statements continued
Statements of Changes in Net Assets continued
Summary of Transactions in Shares of Beneficial Interest
| | | Money Market | | Limited Duration | | Income Plus | |
| | | For The Six
Months Ended
June 30, 2012 | | For The Year
Ended
December 31, 2011 | | For The Six
Months Ended
June 30, 2012 | | For The Year
Ended
December 31, 2011 | | For The Six
Months Ended
June 30, 2012 | | For The Year
Ended
December 31, 2011 | |
| | | (unaudited) | | | | (unaudited) | | | | (unaudited) | | | |
| Class X Shares | |
| Shares | |
| Sold | | | 4,456,358 | | | | 9,528,528 | | | | 22,478 | | | | 37,891 | | | | 64,655 | | | | 120,523 | | |
| Reinvestment of dividends and distributions | | | 2,430 | | | | 5,521 | | | | 45,689 | | | | 59,870 | | | | 454,849 | | | | 529,120 | | |
| Redeemed | | | (9,395,451 | ) | | | (18,033,730 | ) | | | (192,120 | ) | | | (375,310 | ) | | | (761,033 | ) | | | (1,931,499 | ) | |
| Net Increase (Decrease) - Class X | | | (4,936,663 | ) | | | (8,499,681 | ) | | | (123,953 | ) | | | (277,549 | ) | | | (241,529 | ) | | | (1,281,856 | ) | |
| Amount | |
| Sold | | $ | 4,456,358 | | | $ | 9,528,528 | | | $ | 175,465 | | | $ | 292,242 | | | $ | 741,686 | | | $ | 1,351,724 | | |
| Reinvestment of dividends and distributions | | | 2,430 | | | | 5,521 | | | | 347,237 | | | | 456,806 | | | | 5,085,206 | | | | 5,809,741 | | |
| Redeemed | | | (9,395,451 | ) | | | (18,033,730 | ) | | | (1,495,343 | ) | | | (2,907,547 | ) | | | (8,823,934 | ) | | | (21,828,131 | ) | |
| Net Increase (Decrease) - Class X | | $ | (4,936,663 | ) | | $ | (8,499,681 | ) | | $ | (972,641 | ) | | $ | (2,158,499 | ) | | $ | (2,997,042 | ) | | $ | (14,666,666 | ) | |
| Class Y Shares | |
| Shares | |
| Sold | | | 3,821,547 | | | | 14,834,425 | | | | 123,068 | | | | 159,097 | | | | 157,677 | | | | 238,653 | | |
| Reinvestment of dividends and distributions | | | 2,693 | | | | 6,188 | | | | 152,302 | | | | 191,924 | | | | 503,592 | | | | 586,444 | | |
| Redeemed | | | (8,871,865 | ) | | | (26,129,240 | ) | | | (398,590 | ) | | | (1,571,630 | ) | | | (776,545 | ) | | | (2,627,052 | ) | |
| Net Increase (Decrease) - Class Y | | | (5,047,625 | ) | | | (11,288,627 | ) | | | (123,220 | ) | | | (1,220,609 | ) | | | (115,276 | ) | | | (1,801,955 | ) | |
| Amount | |
| Sold | | $ | 3,821,547 | | | $ | 14,834,425 | | | $ | 955,368 | | | $ | 1,222,848 | | | $ | 1,823,289 | | | $ | 2,668,015 | | |
| Reinvestment of dividends and distributions | | | 2,693 | | | | 6,188 | | | | 1,155,973 | | | | 1,462,462 | | | | 5,615,046 | | | | 6,427,424 | | |
| Redeemed | | | (8,871,865 | ) | | | (26,129,240 | ) | | | (3,094,020 | ) | | | (12,144,870 | ) | | | (8,969,992 | ) | | | (29,433,253 | ) | |
| Net Increase (Decrease) - Class Y | | $ | (5,047,625 | ) | | $ | (11,288,627 | ) | | $ | (982,679 | ) | | $ | (9,459,560 | ) | | $ | (1,531,657 | ) | | $ | (20,337,814 | ) | |
See Notes to Financial Statements
76
| | | Global Infrastructure | | European Equity | |
| | | For The Six
Months Ended
June 30, 2012 | | For The Year
Ended
December 31, 2011 | | For The Six
Months Ended
June 30, 2012 | | For The Year
Ended
December 31, 2011 | |
| | | (unaudited) | | | | (unaudited) | | | |
| Class X Shares | |
| Shares | |
| Sold | | | 11,124 | | | | 41,008 | | | | 4,912 | | | | 10,124 | | |
| Reinvestment of dividends and distributions | | | 780,670 | | | | 560,033 | | | | 79,623 | | | | 68,170 | | |
| Redeemed | | | (598,153 | ) | | | (1,394,386 | ) | | | (289,814 | ) | | | (590,445 | ) | |
| Net Increase (Decrease) - Class X | | | 193,641 | | | | (793,345 | ) | | | (205,279 | ) | | | (512,151 | ) | |
| Amount | |
| Sold | | $ | 100,023 | | | $ | 350,997 | | | $ | 72,607 | | | $ | 152,977 | | |
| Reinvestment of dividends and distributions | | | 6,471,754 | | | | 4,715,476 | | | | 1,129,845 | | | | 1,159,573 | | |
| Redeemed | | | (5,395,256 | ) | | | (11,775,763 | ) | | | (4,371,015 | ) | | | (9,410,517 | ) | |
| Net Increase (Decrease) - Class X | | $ | 1,176,521 | | | $ | (6,709,290 | ) | | $ | (3,168,563 | ) | | $ | (8,097,967 | ) | |
| Class Y Shares | |
| Shares | |
| Sold | | | 31,775 | | | | 37,827 | | | | 1,179 | | | | 4,450 | | |
| Reinvestment of dividends and distributions | | | 195,041 | | | | 133,712 | | | | 20,606 | | | | 19,411 | | |
| Redeemed | | | (118,680 | ) | | | (456,268 | ) | | | (59,000 | ) | | | (312,722 | ) | |
| Net Increase (Decrease) - Class Y | | | 108,136 | | | | (284,729 | ) | | | (37,215 | ) | | | (288,861 | ) | |
| Amount | |
| Sold | | $ | 283,079 | | | $ | 315,142 | | | $ | 17,254 | | | $ | 67,572 | | |
| Reinvestment of dividends and distributions | | | 1,612,988 | | | | 1,123,183 | | | | 291,780 | | | | 329,209 | | |
| Redeemed | | | (1,063,144 | ) | | | (3,872,869 | ) | | | (888,456 | ) | | | (4,761,507 | ) | |
| Net Increase (Decrease) - Class Y | | $ | 832,923 | | | $ | (2,434,544 | ) | | $ | (579,422 | ) | | $ | (4,364,726 | ) | |
77
Morgan Stanley Variable Investment Series
Financial Statements continued
Statements of Changes in Net Assets continued
Summary of Transactions in Shares of Beneficial Interest
| | | Multi Cap Growth | | Aggressive Equity | |
| | | For The Six
Months Ended
June 30, 2012 | | For The Year
Ended
December 31, 2011 | | For The Six
Months Ended
June 30, 2012 | | For The Year
Ended
December 31, 2011 | |
| | | (unaudited) | | | | (unaudited) | | | |
| Class X Shares | |
| Shares | |
| Sold | | | 10,168 | | | | 23,630 | | | | 4,494 | | | | 22,589 | | |
| Reinvestment of dividends and distributions | | | 95,285 | | | | 7,793 | | | | 51,606 | | | | — | | |
| Redeemed | | | (389,233 | ) | | | (891,278 | ) | | | (55,568 | ) | | | (145,437 | ) | |
| Net Increase (Decrease) - Class X | | | (283,780 | ) | | | (859,855 | ) | | | 532 | | | | (122,848 | ) | |
| Amount | |
| Sold | | $ | 420,331 | | | $ | 952,101 | | | $ | 87,778 | | | $ | 434,357 | | |
| Reinvestment of dividends and distributions | | | 3,819,990 | | | | 327,521 | | | | 939,227 | | | | — | | |
| Redeemed | | | (16,364,688 | ) | | | (36,256,926 | ) | | | (1,108,749 | ) | | | (2,852,868 | ) | |
| Net Decrease - Class X | | $ | (12,124,367 | ) | | $ | (34,977,304 | ) | | $ | (81,744 | ) | | $ | (2,418,511 | ) | |
| Class Y Shares | |
| Shares | |
| Sold | | | 7,496 | | | �� | 44,490 | | | | 3,750 | | | | 154,196 | | |
| Reinvestment of dividends and distributions | | | 26,864 | | | | — | | | | 70,990 | | | | — | | |
| Redeemed | | | (159,331 | ) | | | (394,005 | ) | | | (73,256 | ) | | | (241,830 | ) | |
| Net Increase (Decrease) - Class Y | | | (124,971 | ) | | | (349,515 | ) | | | 1,484 | | | | (87,634 | ) | |
| Amount | |
| Sold | | $ | 291,021 | | | $ | 1,698,262 | | | $ | 73,607 | | | $ | 2,809,245 | | |
| Reinvestment of dividends and distributions | | | 1,066,481 | | | | — | | | | 1,257,234 | | | | — | | |
| Redeemed | | | (6,634,667 | ) | | | (15,839,370 | ) | | | (1,434,431 | ) | | | (4,629,606 | ) | |
| Net Decrease - Class Y | | $ | (5,277,165 | ) | | $ | (14,141,108 | ) | | $ | (103,590 | ) | | $ | (1,820,361 | ) | |
See Notes to Financial Statements
78
| | | Strategist | |
| | | For The Six
Months Ended
June 30, 2012 | | For The Year
Ended
December 31, 2011 | |
| | | (unaudited) | | | |
| Class X Shares | |
| Shares | |
| Sold | | | 38,329 | | | | 33,714 | | |
| Reinvestment of dividends and distributions | | | 308,114 | | | | 1,314,437 | | |
| Redeemed | | | (869,160 | ) | | | (1,905,781 | ) | |
| Net Increase (Decrease) - Class X | | | (522,717 | ) | | | (557,630 | ) | |
| Amount | |
| Sold | | $ | 409,253 | | | $ | 381,164 | | |
| Reinvestment of dividends and distributions | | | 3,229,032 | | | | 15,010,874 | | |
| Redeemed | | | (9,297,974 | ) | | | (22,742,640 | ) | |
| Net Decrease - Class X | | $ | (5,659,689 | ) | | $ | (7,350,602 | ) | |
| Class Y Shares | |
| Shares | |
| Sold | | | 22,295 | | | | 11,243 | | |
| Reinvestment of dividends and distributions | | | 112,272 | | | | 537,175 | | |
| Redeemed | | | (451,758 | ) | | | (1,070,631 | ) | |
| Net Increase (Decrease) - Class Y | | | (317,191 | ) | | | (522,213 | ) | |
| Amount | |
| Sold | | $ | 237,038 | | | $ | 130,345 | | |
| Reinvestment of dividends and distributions | | | 1,174,361 | | | | 6,118,422 | | |
| Redeemed | | | (4,823,526 | ) | | | (13,017,005 | ) | |
| Net Decrease - Class Y | | $ | (3,412,127 | ) | | $ | (6,768,238 | ) | |
79
Morgan Stanley Variable Investment Series
Notes to Financial Statements n June 30, 2012 (unaudited)
1. Organization and Accounting Policies
Morgan Stanley Variable Investment Series (the "Fund") is registered under the Investment Company Act of 1940, as amended (the "Act"), as a diversified, open-end management investment company. The Fund is offered exclusively to life insurance companies in connection with particular life insurance and/or annuity contracts they offer.
The Fund, organized on February 25, 1983 as a Massachusetts business trust, consists of eight Portfolios
("Portfolios") which commenced operations as follows:
| PORTFOLIO | | COMMENCEMENT OF
OPERATIONS | | PORTFOLIO | | COMMENCEMENT OF
OPERATIONS | |
| Money Market | | March 9, 1984 | | European Equity | | March 1, 1991 | |
|
| Limited Duration | | May 4, 1999 | | Multi Cap Growth | | March 9, 1984 | |
|
| Income Plus | | March 1, 1987 | | Aggressive Equity | | May 4, 1999 | |
|
| Global Infrastructure | | March 1, 1990 | | Strategist | | March 1, 1987 | |
|
On June 5, 2000, the Fund commenced offering one additional class of shares (Class Y shares). The two classes are identical except that Class Y shares incur distribution expenses. Class X shares are generally available to holders of contracts offered before May 1, 2000. Class Y shares are available to holders of contracts offered on or after June 5, 2000.
The investment objectives of each Portfolio are as follows:
| Money Market | | Seeks high current income, preservation of capital and liquidity. | |
|
| Limited Duration | | Seeks to provide a high level of current income, consistent with the preservation of capital. | |
|
| Income Plus | | Seeks, as its primary objective, to provide a high level of current income and, as a secondary objective, capital appreciation, but only when consistent with its primary objective. | |
|
| Global Infrastructure | | Seeks both capital appreciation and current income. | |
|
| European Equity | | Seeks to maximize the capital appreciation of its investments. | |
|
| Multi Cap Growth | | Seeks, as its primary objective, growth of capital and, as a secondary objective, income, but only when consistent with its primary objective. | |
|
| Aggressive Equity | | Seeks long-term capital growth. | |
|
| Strategist | | Seeks high total investment return. | |
|
80
Morgan Stanley Variable Investment Series
Notes to Financial Statements n June 30, 2012 (unaudited) continued
The following is a summary of significant policies:
A. Valuation of Investments — Money Market: Portfolio securities are valued at amortized cost, which approximates fair value, in accordance with Rule 2a-7 under the Act. All remaining Portfolios: (1) an equity portfolio security listed or traded on the New York Stock Exchange ("NYSE") or American Stock Exchange or other domestic exchange is valued at its latest sales price (or at the exchange official closing price if such exchange reports an official closing price) prior to the time when assets are valued; if there were no sales that day, the security is valued at the mean between the last reported bid and asked price; (2) an equity portfolio security listed or traded on the Nasdaq is valued at the Nasdaq Official Closing Price; if there were no sales that day, the security is valued at the mean between the last reported bid and asked price; (3) all other domestic securities for which over-the-counter market quotations are readily available are valued at the mean between the last reported bid and asked prices. In cases where a security is traded on more than one domestic exchange, the security is valued on the exchange designated as the primary market; (4) swaps are marked-to-market daily based upon quotations from market makers; (5) for equity securities traded on foreign exchanges, the latest reported sales price (or at the exchange official closing price if such exchange reports an official closing price) or the mean between the last reported bid and asked prices may be used if there were no sales on a particular day or the latest bid price may be used if only bid prices are available; (6) futures are valued at the latest price published by the commodities exchange on which they trade; (7) when market quotations are not readily available, including circumstances under which Morgan Stanley Investment Management Inc. (the "Adviser") or Morgan Stanley Investment Management Limited or Morgan Stanley Investment Management Company (each, a "Sub-Adviser"), each a wholly owned subsidiary of Morgan Stanley, determines that the latest sale price, the bid price or the mean between the last reported bid and ask price do not reflect a security's fair value, portfolio securities are valued at their fair value as determined in good faith under procedures established by and under the general supervision of the Fund's Board of Trustees (the "Trustees"). Occasionally, developments affecting the closing prices of securities and other assets may occur between the times at which valuations of such securities are determined (that is, close of the foreign market on which the securities trade) and the close of business on the NYSE. If developments occur during such periods that are expected to materially affect the value of such securities, such valuations may be adjusted to reflect the estimated fair value of such securities as of the close of the NYSE, as determined in good faith by the Trustees or by the Adviser using a pricing service and/or procedures approved by the Trustees; (8) certain portfolio securities may be valued by an outside pricing service approved by the Trustees. The prices provided by a pricing service take into account broker-dealer market price quotations for trading in similar groups of securities, security quality, maturity, coupon and
81
Morgan Stanley Variable Investment Series
Notes to Financial Statements n June 30, 2012 (unaudited) continued
other security characteristics as well as any developments related to the specific securities; (9) investments in mutual funds, including the Morgan Stanley Institutional Liquidity Funds, are valued at the net asset value as of the close of each business day; and (10) short-term debt securities having a maturity date of more than sixty days at time of purchase are valued on a mark-to-market basis until sixty days prior to maturity and thereafter at amortized cost based on their value on the 61st day. Short-term debt securities having a maturity date of sixty days or less at the time of purchase are valued at amortized cost, which approximates fair value.
Under procedures approved by the Trustees, the Fund's Adviser has formed a Valuation Committee. The Valuation Committee provides administration and oversight of the Fund's valuation policies and procedures, which are reviewed at least annually by the Trustees. Among other things, these procedures allow the Fund to utilize independent pricing services, quotations from securities and financial instrument dealers, and other market sources to determine fair value.
The Fund has procedures to determine the fair value of securities and other financial instruments for which market prices are not readily available. Under these procedures, the Valuation Committee convenes on a regular and adhoc basis to review such securities and considers a number of factors, including valuation methodologies and significant unobservable valuation inputs, when arriving at fair value. The Valuation Committee may employ a market-based approach which may use related or comparable assets or liabilities, recent transactions, market multiples, book values, and other relevant information for the investment to determine the fair value of the investment. An income-based valuation approach may also be used in which the anticipated future cash flows of the investment are discounted to calculate fair value. Discounts may also be applied due to the nature or duration of any restrictions on the disposition of the investments. Due to the inherent uncertainty of valuations of such investments, the fair values may differ significantly from the values that would have been used had an active market existed. The Valuation Committee employs various methods for calibrating these valuation approaches including a regular review of valuation methodologies, key inputs and assumptions, transactional back-testing or disposition analysis, and reviews of any related market activity.
B. Accounting for Investments — Security transactions are accounted for on the trade date (date the order to buy or sell is executed). Realized gains and losses on security transactions are determined by the identified cost method. Dividend income and other distributions are recorded on the ex-dividend date except for certain dividends on foreign securities which are recorded as soon as the Fund is informed after the ex-dividend date. Interest income is accrued daily as earned except where collection is not expected.
82
Morgan Stanley Variable Investment Series
Notes to Financial Statements n June 30, 2012 (unaudited) continued
Discounts are accreted and premiums are amortized over the life of the respective securities and are included in interest income.
C. Repurchase Agreements — The Fund invests directly with institutions in repurchase agreements. The Fund's custodian receives the collateral, which is marked-to-market daily to determine that the value of the collateral does not decrease below the repurchase price plus accrued interest as earned. If such a decrease occurs, additional collateral will be requested and, when received, will be added to the account to maintain full collateralization.
D. Multiple Class Allocations — Investment income, expenses (other than distribution fees), and realized and unrealized gains and losses are allocated to each class of shares based upon the relative net asset value on the date such items are recognized. Distribution fees are charged directly to the respective class.
E. Foreign Currency Translation — The books and records of the Fund are maintained in U.S. dollars as follows: (1) the foreign currency market value of investment securities, other assets and liabilities and foreign currency exchange contracts are translated at the exchange rates prevailing at the end of the period; and (2) purchases, sales, income and expenses are translated at the exchange rates prevailing on the respective dates of such transactions. The resultant exchange gains and losses are recorded as realized and unrealized gains/losses on foreign currency exchange contracts and foreign currency translations. Pursuant to U.S. federal income tax regulations, certain foreign exchange gains/losses included in realized and unrealized gains/losses are included in or are a reduction of ordinary income for federal income tax purposes. The Fund does not isolate that portion of the results of operations arising as a result of changes in the foreign exchange rates from the changes in the market prices of the securities held.
F. Dividends and Distributions to Shareholders — The Fund records dividends and distributions to its shareholders on the ex-dividend date.
G. Expenses — Direct expenses are charged to the respective Portfolio and general Fund expenses are allocated on the basis of relative net assets or equally among the Portfolios.
H. Use of Estimates — The preparation of financial statements in accordance with generally accepted accounting principles in the United States ("GAAP") requires management to make estimates and assumptions that affect the reported amounts and disclosures. Actual results could differ from those estimates.
83
Morgan Stanley Variable Investment Series
Notes to Financial Statements n June 30, 2012 (unaudited) continued
I. Indemnifications — The Fund enters into contracts that contain a variety of indemnifications. The Fund's maximum exposure under these arrangements is unknown. However, the Fund has not had prior claims or losses pursuant to these contracts and expects the risk of loss to be remote.
2. Fair Valuation Measurements
Financial Accounting Standards Board ("FASB") Accounting Standards Codification ("ASC") 820, Fair Value Measurements and Disclosures ("ASC 820"), defines fair value as the value that the Fund would receive to sell an investment or pay to transfer a liability in a timely transaction with an independent buyer in the principal market, or in the absence of a principal market the most advantageous market for the investment or liability. ASC 820 establishes a three-tier hierarchy to distinguish between (1) inputs that reflect the assumptions market participants would use in valuing an asset or liability developed based on market data obtained from sources independent of the reporting entity (observable inputs); and (2) inputs that reflect the reporting entity's own assumptions about the assumptions market participants would use in valuing an asset or liability developed based on the best information available in the circumstances (unobservable inputs) and to establish classification of fair value measurements for disclosure purposes. Various inputs are used in determining the value of the Fund's investments. The inputs are summarized in the three broad levels listed below.
• Level 1 — unadjusted quoted prices in active markets for identical investments
• Level 2 — other significant observable inputs (including quoted prices for similar investments, interest rates, prepayment speeds, credit risk, etc.)
• Level 3 — significant unobservable inputs including the Fund's own assumptions in determining the fair value of investments. Factors considered in making this determination may include, but are not limited to, information obtained by contacting the issuer, analysts, or the appropriate stock exchange (for exchange-traded securities), analysis of the issuer's financial statements or other available documents and, if necessary, available information concerning other securities in similar circumstances
The inputs or methodology used for valuing securities are not necessarily an indication of the risk associated with investing in those securities and the determination of the significance of a particular input to the fair value measurement in its entirety requires judgment and considers factors specific to each security.
84
Morgan Stanley Variable Investment Series
Notes to Financial Statements n June 30, 2012 (unaudited) continued
The following is a summary of the inputs used to value each Portfolio's investments as of June 30, 2012.
| Investment Type | | Level 1
Unadjusted
Quoted Prices | | Level 2
Other
Significant
Observable
Inputs | | Level 3
Significant
Unobservable
Inputs | | Total | |
| Money Market | |
| Assets: | |
| Repurchase Agreements | | $ | — | | | $ | 53,208,000 | | | $ | — | | | $ | 53,208,000 | | |
| Commercial Paper | | | — | | | | 16,491,974 | | | | — | | | | 16,491,974 | | |
| Certificates of Deposit | | | — | | | | 12,999,990 | | | | — | | | | 12,999,990 | | |
| Floating Rate Notes | | | — | | | | 12,600,719 | | | | — | | | | 12,600,719 | | |
| Tax-Exempt Instruments | | | — | | | | 3,000,000 | | | | — | | | | 3,000,000 | | |
| Total Assets | | $ | — | | | $ | 98,300,683 | | | $ | — | | | $ | 98,300,683 | | |
| Limited Duration | |
| Assets: | |
| Fixed Income Securities | |
| Corporate Bonds | | $ | — | | | $ | 29,769,272 | | | $ | — | | | $ | 29,769,272 | | |
| U.S. Treasury Securities | | | — | | | | 9,218,445 | | | | — | | | | 9,218,445 | | |
| Asset-Backed Securities | | | — | | | | 8,729,883 | | | | — | | | | 8,729,883 | | |
| Non-U.S. Government — Guaranteed | | | — | | | | 2,472,129 | | | | — | | | | 2,472,129 | | |
| Agency Adjustable Rate Mortgages | | | — | | | | 1,945,048 | | | | — | | | | 1,945,048 | | |
| Agency Fixed Rate Mortgages | | | — | | | | 356,204 | | | | — | | | | 356,204 | | |
Collateralized Mortgage Obligation — Agency
Collateral Series | | | — | | | | 332,012 | | | | — | | | | 332,012 | | |
| Municipal Bond | | | — | | | | 301,158 | | | | — | | | | 301,158 | | |
| Sovereign | | | — | | | | 211,200 | | | | — | | | | 211,200 | | |
| Total Fixed Income Securities | | | — | | | | 53,335,351 | | | | — | | | | 53,335,351 | | |
| Short-Term Investments | |
| U.S. Treasury Security | | | — | | | | 384,970 | | | | — | | | | 384,970 | | |
| Investment Company | | | 231,019 | | | | — | | | | — | | | | 231,019 | | |
| Total Short-Term Investments | | | 231,019 | | | | 384,970 | | | | — | | | | 615,989 | | |
| Futures Contracts | | | 7,844 | | | | — | | | | — | | | | 7,844 | | |
| Total Assets | | $ | 238,863 | | | $ | 53,720,321 | | | $ | — | | | $ | 53,959,184 | | |
85
Morgan Stanley Variable Investment Series
Notes to Financial Statements n June 30, 2012 (unaudited) continued
| Investment Type | | Level 1
Unadjusted
Quoted Prices | | Level 2
Other
Significant
Observable
Inputs | | Level 3
Significant
Unobservable
Inputs | | Total | |
| Liabilities: | |
| Futures Contracts | | $ | (2,139 | ) | | $ | — | | | $ | — | | | $ | (2,139 | ) | |
| Total | | $ | 236,724 | | | $ | 53,720,321 | | | $ | — | | | $ | 53,957,045 | | |
| Income Plus | |
| Assets: | |
| Corporate Bonds | | $ | — | | | $ | 183,685,294 | | | $ | — | | | $ | 183,685,294 | | |
| Asset-Backed Securities | | | — | | | | 1,772,058 | | | | — | | | | 1,772,058 | | |
| Municipal Bond | | | — | | | | 685,080 | | | | — | | | | 685,080 | | |
| Sovereign | | | — | | | | 420,935 | | | | — | | | | 420,935 | | |
| Agency Fixed Rate Mortgage | | | — | | | | 1,561 | | | | — | | | | 1,561 | | |
| Total Fixed Income Securities | | | — | | | | 186,564,928 | | | | — | | | | 186,564,928 | | |
| Convertible Preferred Stocks | | | 575,597 | | | | — | | | | — | | | | 575,597 | | |
| Short-Term Investments | |
| U.S. Treasury Securities | | | — | | | | 199,984 | | | | — | | | | 199,984 | | |
| Investment Company | | | 2,384,162 | | | | — | | | | — | | | | 2,384,162 | | |
| Total Short-Term Investments | | | 2,384,162 | | | | 199,984 | | | | — | | | | 2,584,146 | | |
| Futures | | | 22,909 | | | | — | | | | — | | | | 22,909 | | |
| Total Assets | | | 2,982,668 | | | | 186,764,912 | | | | — | | | | 189,747,580 | | |
| Liabilities: | |
| Foreign Currency Exchange Contracts | | | — | | | | (10,642 | ) | | | — | | | | (10,642 | ) | |
| Futures | | | (106,304 | ) | | | — | | | | — | | | | (106,304 | ) | |
| Interest Rate Swap Agreements | | | — | | | | (223,864 | ) | | | — | | | | (223,864 | ) | |
| Total Liabilities | | | (106,304 | ) | | | (234,506 | ) | | | — | | | | (340,810 | ) | |
| Total | | $ | 2,876,364 | | | $ | 186,530,406 | | | $ | — | | | $ | 189,406,770 | | |
| Global Infrastructure | |
| Assets: | |
| Common Stocks | |
| Airports | | $ | — | | | $ | 2,031,636 | | | $ | — | | | $ | 2,031,636 | | |
| Communications | | | 8,093,159 | | | | 2,759,832 | | | | — | | | | 10,852,991 | | |
| Diversified | | | 1,008,076 | | | | 864,837 | | | | — | | | | 1,872,913 | | |
| Oil & Gas Storage & Transportation | | | 23,484,590 | | | | 12,239,035 | | | | — | | | | 35,723,625 | | |
| Ports | | | — | | | | 683,686 | | | | — | | | | 683,686 | | |
| Toll Roads | | | — | | | | 4,838,323 | | | | — | | | | 4,838,323 | | |
| Transmission & Distribution | | | 4,325,942 | | | | 7,170,816 | | | | — | | | | 11,496,758 | | |
86
Morgan Stanley Variable Investment Series
Notes to Financial Statements n June 30, 2012 (unaudited) continued
| Investment Type | | Level 1
Unadjusted
Quoted Prices | | Level 2
Other
Significant
Observable
Inputs | | Level 3
Significant
Unobservable
Inputs | | Total | |
| Water | | $ | 1,133,675 | | | $ | 1,907,662 | | | $ | — | | | $ | 3,041,337 | | |
| Total Common Stocks | | | 38,045,442 | | | | 32,495,827 | | | | — | | | | 70,541,269 | | |
| Short-Term Investment — Investment Company | | | 1,092,962 | | | | — | | | | — | | | | 1,092,962 | | |
| Total Assets | | $ | 39,138,404 | | | $ | 32,495,827 | | | $ | — | | | $ | 71,634,231 | | |
| European Equity | |
| Assets: | |
| Common Stocks | |
| Aerospace & Defense | | $ | — | | | $ | 1,423,358 | | | $ | — | | | $ | 1,423,358 | | |
| Automobiles | | | — | | | | 1,056,617 | | | | — | | | | 1,056,617 | | |
| Chemicals | | | — | | | | 857,106 | | | | — | | | | 857,106 | | |
| Commercial Banks | | | — | | | | 5,545,520 | | | | — | | | | 5,545,520 | | |
| Electrical Equipment | | | — | | | | 925,376 | | | | — | | | | 925,376 | | |
| Food & Staples Retailing | | | — | | | | 774,749 | | | | — | | | | 774,749 | | |
| Food Products | | | — | | | | 2,634,207 | | | | — | | | | 2,634,207 | | |
| Health Care Providers & Services | | | — | | | | 1,147,076 | | | | — | | | | 1,147,076 | | |
| Hotels, Restaurants & Leisure | | | — | | | | 683,187 | | | | — | | | | 683,187 | | |
| Household Products | | | — | | | | 1,176,510 | | | | — | | | | 1,176,510 | | |
| Industrial Conglomerates | | | — | | | | 1,323,236 | | | | — | | | | 1,323,236 | | |
| Information Technology Services | | | — | | | | 1,020,207 | | | | — | | | | 1,020,207 | | |
| Insurance | | | — | | | | 3,163,140 | | | | — | | | | 3,163,140 | | |
| Machinery | | | — | | | | 1,565,189 | | | | — | | | | 1,565,189 | | |
| Media | | | — | | | | 1,699,056 | | | | — | | | | 1,699,056 | | |
| Metals & Mining | | | — | | | | 2,565,322 | | | | — | | | | 2,565,322 | | |
| Oil, Gas & Consumable Fuels | | | — | | | | 7,020,526 | | | | — | | | | 7,020,526 | | |
| Pharmaceuticals | | | — | | | | 6,478,624 | | | | — | | | | 6,478,624 | | |
| Professional Services | | | — | | | | 967,304 | | | | — | | | | 967,304 | | |
| Tobacco | | | — | | | | 3,250,434 | | | | — | | | | 3,250,434 | | |
| Wireless Telecommunication Services | | | — | | | | 2,743,321 | | | | — | | | | 2,743,321 | | |
| Total Common Stocks | | | — | | | | 48,020,065 | | | | — | | | | 48,020,065 | | |
| Short-Term Investment — Investment Company | | | 1,158,271 | | | | — | | | | — | | | | 1,158,271 | | |
| Total Assets | | | 1,158,271 | | | | 48,020,065 | | | | — | | | | 49,178,336 | | |
| Liabilities: | |
| Foreign Currency Exchange Contracts | | | — | | | | (8,551 | ) | | | — | | | | (8,551 | ) | |
| Total | | $ | 1,158,271 | | | $ | 48,011,514 | | | $ | — | | | $ | 49,169,785 | | |
87
Morgan Stanley Variable Investment Series
Notes to Financial Statements n June 30, 2012 (unaudited) continued
| Investment Type | | Level 1
Unadjusted
Quoted Prices | | Level 2
Other
Significant
Observable
Inputs | | Level 3
Significant
Unobservable
Inputs | | Total | |
| Multi Cap Growth | |
| Assets: | |
| Common Stocks | |
| Air Transport | | $ | 3,594,373 | | | $ | — | | | $ | — | | | $ | 3,594,373 | | |
| Alternative Energy | | | 7,975,911 | | | | — | | | | — | | | | 7,975,911 | | |
| Beverage: Brewers & Distillers | | | 2,936,279 | | | | — | | | | — | | | | 2,936,279 | | |
| Biotechnology | | | 5,190,640 | | | | — | | | | — | | | | 5,190,640 | | |
| Chemicals: Diversified | | | 6,785,973 | | | | — | | | | — | | | | 6,785,973 | | |
| Commercial Finance & Mortgage Companies | | | 3,217,770 | | | | — | | | | — | | | | 3,217,770 | | |
| Commercial Services | | | 4,513,408 | | | | 5,610,298 | | | | — | | | | 10,123,706 | | |
| Communications Technology | | | 7,548,892 | | | | — | | | | — | | | | 7,548,892 | | |
| Computer Services, Software & Systems | | | 34,810,722 | | | | — | | | | 9,354,930 | | | | 44,165,652 | | |
| Computer Technology | | | 24,099,250 | | | | — | | | | — | | | | 24,099,250 | | |
| Consumer Lending | | | 6,745,014 | | | | — | | | | — | | | | 6,745,014 | | |
| Diversified Retail | | | 32,802,983 | | | | — | | | | — | | | | 32,802,983 | | |
| Financial Data & Systems | | | 11,779,876 | | | | — | | | | — | | | | 11,779,876 | | |
| Foods | | | 1,509,857 | | | | — | | | | — | | | | 1,509,857 | | |
| Health Care Services | | | 9,640,768 | | | | — | | | | — | | | | 9,640,768 | | |
| Insurance: Property-Casualty | | | 4,108,926 | | | | — | | | | — | | | | 4,108,926 | | |
| Medical Equipment | | | 7,716,510 | | | | — | | | | — | | | | 7,716,510 | | |
| Metals & Minerals: Diversified | | | 2,033,264 | | | | 2,205,188 | | | | — | | | | 4,238,452 | | |
| Real Estate Investment Trusts (REIT) | | | 8,090,335 | | | | — | | | | — | | | | 8,090,335 | | |
| Recreational Vehicles & Boats | | | — | | | | 7,459,093 | | | | — | | | | 7,459,093 | | |
| Wholesale & International Trade | | | — | | | | 3,966,277 | | | | — | | | | 3,966,277 | | |
| Total Common Stocks | | | 185,100,751 | | | | 19,240,856 | | | | 9,354,930 | | | | 213,696,537 | | |
| Convertible Preferred Stocks | | | — | | | | — | | | | 2,315,148 | | | | 2,315,148 | | |
| Short-Term Investment — Investment Company | | | 6,673,526 | | | | — | | | | — | | | | 6,673,526 | | |
| Total Assets | | $ | 191,774,277 | | | $ | 19,240,856 | | | $ | 11,670,078 | | | $ | 222,685,211 | | |
88
Morgan Stanley Variable Investment Series
Notes to Financial Statements n June 30, 2012 (unaudited) continued
Multi Cap Growth
The following table presents additional information about valuation techniques and inputs used for investments that are measured at fair value and categorized within Level 3 as of June 30, 2012.
| | | Fair Value at
June 30, 2012 | | Valuation Technique(s) | | Unobservable Input | | Range | | Weighted
Average | | Impact
to
Valuation
from an
Increase
in Input | |
| Common Stocks | |
Computer Services,
Software & Systems | | $ | 9,354,930 | | | Adjusted Stock Price | | Discount for
Illiquidity | | | 8.3 | % | | | 8.3 | % | | | 8.3 | % | | Decrease | |
Convertible Preferred
Stocks | |
| Alternative Energy | | $ | 1,940,739 | | | Market Transaction | | Purchase Price of | | | | | | | |
| |
| | | | | | | Preferred | | | — | | | | — | | | | — | | | | — | | |
| | | | | Discounted cash flow | | Weighted average
cost of capital | | | 22.5 | % | | | 27.5 | % | | | 24.2 | % | | Decrease | |
| | | | | | | Perpetual growth
rate | | | 2.5 | % | | | 3.5 | % | | | 3.0 | % | | Increase | |
| | | | | Market Comparable
Companies | | Enterprise Value /
Revenue | | | 2.6 | x | | | 3.4 | x | | | 3.1 | x | | Increase | |
| | | | | | | Discount for lack
of marketability | | | 15 | % | | | 15 | % | | | 15 | % | | Decrease | |
Computer Services,
| |
| Software & Systems | | $ | 374,409 | | | Market Transaction | | Purchase Price of | | | | | | | |
| |
| | | | | | | Preferred | | | — | | | | — | | | | — | | | | — | | |
| | | | | Discounted cash flow | | Weighted average
cost of capital | | | 13 | % | | | 18 | % | | | 15 | % | | Decrease | |
| | | | | | | Perpetual growth
rate | | | 2.0 | % | | | 3.0 | % | | | 2.5 | % | | |
Increase | | |
| | | | | Market Comparable
Companies | | Enterprise Value /
Revenue | | | 6.7 | x | | | 15.7 | x | | | 9.6 | x | | Increase | |
| | | | | | | Discount for lack
of marketability | | | N/A | | | | N/A | | | | N/A | | | Decrease | |
| | | | | Merger & Acquisition
Transactions | | Enterprise Value /
Revenue | | | 8.7 | x | | | 10.8 | x | | | 9.4 | x | | Increase | |
| | | | | | | Discount for lack
of control | | | 25 | % | | | 25 | % | | | 25 | % | | Decrease | |
89
Morgan Stanley Variable Investment Series
Notes to Financial Statements n June 30, 2012 (unaudited) continued
| Investment Type | | Level 1
Unadjusted
Quoted Prices | | Level 2
Other
Significant
Observable
Inputs | | Level 3
Significant
Unobservable
Inputs | | Total | |
| Aggressive Equity | |
| Assets: | |
| Common Stocks | |
| Air Transport | | $ | 454,731 | | | $ | — | | | $ | — | | | $ | 454,731 | | |
| Alternative Energy | | | 1,008,997 | | | | — | | | | — | | | | 1,008,997 | | |
| Beverage: Brewers & Distillers | | | 371,475 | | | | — | | | | — | | | | 371,475 | | |
| Biotechnology | | | 656,661 | | | | — | | | | — | | | | 656,661 | | |
| Chemicals: Diversified | | | 858,511 | | | | — | | | | — | | | | 858,511 | | |
| Commercial Finance & Mortgage Companies | | | 407,086 | | | | — | | | | — | | | | 407,086 | | |
| Commercial Services | | | 570,975 | | | | 709,509 | | | | — | | | | 1,280,484 | | |
| Communications Technology | | | 955,032 | | | | — | | | | — | | | | 955,032 | | |
| Computer Services, Software & Systems | | | 4,470,983 | | | | — | | | | 1,119,004 | | | | 5,589,987 | | |
| Computer Technology | | | 3,046,493 | | | | — | | | | — | | | | 3,046,493 | | |
| Consumer Lending | | | 853,327 | | | | — | | | | — | | | | 853,327 | | |
| Diversified Retail | | | 4,149,248 | | | | — | | | | — | | | | 4,149,248 | | |
| Financial Data & Systems | | | 1,490,258 | | | | — | | | | — | | | | 1,490,258 | | |
| Foods | | | 191,015 | | | | — | | | | — | | | | 191,015 | | |
| Health Care Services | | | 1,219,693 | | | | — | | | | — | | | | 1,219,693 | | |
| Insurance: Property-Casualty | | | 517,959 | | | | — | | | | — | | | | 517,959 | | |
| Medical Equipment | | | 976,332 | | | | — | | | | — | | | | 976,332 | | |
| Metals & Minerals: Diversified | | | 257,221 | | | | 278,980 | | | | — | | | | 536,201 | | |
| Real Estate Investment Trusts (REIT) | | | 1,023,518 | | | | — | | | | — | | | | 1,023,518 | | |
| Recreational Vehicles & Boats | | | — | | | | 943,662 | | | | — | | | | 943,662 | | |
| Wholesale & International Trade | | | — | | | | 500,636 | | | | — | | | | 500,636 | | |
| Total Common Stocks | | | 23,479,515 | | | | 2,432,787 | | | | 1,119,004 | | | | 27,031,306 | | |
| Convertible Preferred Stocks | | | — | | | | — | | | | 278,635 | | | | 278,635 | | |
| Short-Term Investment — Investment Company | | | 1,038,390 | | | | — | | | | — | | | | 1,038,390 | | |
| Total Assets | | $ | 24,517,905 | | | $ | 2,432,787 | | | $ | 1,397,639 | | | $ | 28,348,331 | | |
90
Morgan Stanley Variable Investment Series
Notes to Financial Statements n June 30, 2012 (unaudited) continued
Aggressive Equity
The following table presents additional information about valuation techniques and inputs used for investments that are measured at fair value and categorized within Level 3 as of June 30, 2012.
| | | Fair Value at
June 30, 2012 | | Valuation Technique(s) | | Unobservable Input | | Range | | Weighted
Average | | Impact
to
Valuation
from an
Increase
in Input | |
| Common Stocks | |
Computer Services,
Software & Systems | | $ | 1,119,004 | | | Adjusted Stock Price | | Discount for
Illiquidity | | | 8.3 | % | | | 8.3 | % | | | 8.3 | % | | Decrease | |
Convertible Preferred
Stocks | |
| Alternative Energy | | $ | 234,705 | | | Market Transaction | | Purchase Price of | | | | | | | |
| |
| | | | | | | Preferred | | | — | | | | — | | | | — | | | | — | | |
| | | | | Discounted cash flow | | Weighted average
cost of capital | | | 22.5 | % | | | 27.5 | % | | | 24.2 | % | | Decrease | |
| | | | | | | Perpetual growth
rate | | | 2.5 | % | | | 3.5 | % | | | 3.0 | % | | Increase | |
| | | | | Market Comparable
Companies | | Enterprise Value /
Revenue | | | 2.6 | x | | | 3.4 | x | | | 3.1 | x | | Increase | |
| | | | | | | Discount for lack
of marketability | | | 15 | % | | | 15 | % | | | 15 | % | | Decrease | |
Computer Services,
| |
| Software & Systems | | $ | 43,930 | | | Market Transaction | | Purchase Price of | | | | | | | |
| |
| | | | | | | Preferred | | | — | | | | — | | | | — | | | | — | | |
| | | | | Discounted cash flow | | Weighted average
cost of capital | | | 13 | % | | | 18 | % | | | 15 | % | | Decrease | |
| | | | | | | Perpetual growth
rate | | | 2.0 | % | | | 3.0 | % | | | 2.5 | % | | Increase | |
| | | | | Market Comparable
Companies | | Enterprise Value/
Revenue | | | 6.7 | x | | | 15.7 | x | | | 9.6 | x | | Increase | |
| | | | | | | Discount for lack
of marketability | | | N/A | | | | N/A | | | | N/A | | | Decrease | |
| | | | | Merger & Acquisition
Transactions | | Enterprise Value/
Revenue | | | 8.7 | x | | | 10.8 | x | | | 9.4 | x | | Increase | |
| | | | | | | Discount for lack
of control | | | 25 | % | | | 25 | % | | | 25 | % | | Decrease | |
91
Morgan Stanley Variable Investment Series
Notes to Financial Statements n June 30, 2012 (unaudited) continued
| Investment Type | | Level 1
Unadjusted
Quoted Prices | | Level 2
Other
Significant
Observable
Inputs | | Level 3
Significant
Unobservable
Inputs | | Total | |
| Strategist | |
| Assets: | |
| Common Stocks | |
| Aerospace & Defense | | $ | 2,955,696 | | | $ | — | | | $ | — | | | $ | 2,955,696 | | |
| Auto Components | | | 1,251,938 | | | | — | | | | — | | | | 1,251,938 | | |
| Chemicals | | | 2,390,444 | | | | — | | | | — | | | | 2,390,444 | | |
| Commercial Services & Supplies | | | 162,586 | | | | — | | | | — | | | | 162,586 | | |
| Computers & Peripherals | | | 806,713 | | | | — | | | | — | | | | 806,713 | | |
| Diversified Financial Services | | | 2,552,730 | | | | — | | | | — | | | | 2,552,730 | | |
| Diversified Telecommunication Services | | | 4,644,343 | | | | — | | | | — | | | | 4,644,343 | | |
| Food & Staples Retailing | | | 1,403,902 | | | | — | | | | — | | | | 1,403,902 | | |
| Food Products | | | 2,444,421 | | | | — | | | | — | | | | 2,444,421 | | |
| Hotels, Restaurants & Leisure | | | 6,635,410 | | | | — | | | | — | | | | 6,635,410 | | |
| Industrial Conglomerates | | | 5,827,897 | | | | — | | | | — | | | | 5,827,897 | | |
| Information Technology Services | | | 2,601,214 | | | | — | | | | — | | | | 2,601,214 | | |
| Insurance | | | 3,280,541 | | | | — | | | | — | | | | 3,280,541 | | |
| Machinery | | | 2,249,147 | | | | — | | | | — | | | | 2,249,147 | | |
| Media | | | 2,863,630 | | | | — | | | | — | | | | 2,863,630 | | |
| Multi-Utilities | | | 2,484,082 | | | | — | | | | — | | | | 2,484,082 | | |
| Oil, Gas & Consumable Fuels | | | 8,275,159 | | | | — | | | | — | | | | 8,275,159 | | |
| Paper & Forest Products | | | 1,370,513 | | | | — | | | | — | | | | 1,370,513 | | |
| Pharmaceuticals | | | 7,674,725 | | | | — | | | | — | | | | 7,674,725 | | |
| Road & Rail | | | 2,326,066 | | | | — | | | | — | | | | 2,326,066 | | |
| Semiconductors & Semiconductor Equipment | | | 2,233,403 | | | | — | | | | — | | | | 2,233,403 | | |
| Software | | | 3,030,245 | | | | — | | | | — | | | | 3,030,245 | | |
| Specialty Retail | | | 3,778,452 | | | | — | | | | — | | | | 3,778,452 | | |
| Textiles, Apparel & Luxury Goods | | | 2,229,949 | | | | — | | | | — | | | | 2,229,949 | | |
| Tobacco | | | 4,042,506 | | | | — | | | | — | | | | 4,042,506 | | |
| Total Common Stocks | | | 79,515,712 | | | | — | | | | — | | | | 79,515,712 | | |
| Fixed Income Securities | |
| Corporate Bonds | | | — | | | | 9,566,445 | | | | — | | | | 9,566,445 | | |
| Sovereign | | | — | | | | 535,845 | | | | — | | | | 535,845 | | |
| Municipal Bonds | | | — | | | | 587,666 | | | | — | | | | 587,666 | | |
| Agency Fixed Rate Mortgages | | | — | | | | 3,413 | | | | — | | | | 3,413 | | |
| Asset-Backed Securities | | | — | | | | 1,024,373 | | | | — | | | | 1,024,373 | | |
| U.S. Treasury Securities | | | — | | | | 17,873,398 | | | | — | | | | 17,873,398 | | |
| U.S. Agency Securities | | | — | | | | 2,084,163 | | | | — | | | | 2,084,163 | | |
| Total Fixed Income Securities | | $ | | — | | $ | 31,675,303 | | | $ | — | | | $ | 31,675,303 | | |
92
Morgan Stanley Variable Investment Series
Notes to Financial Statements n June 30, 2012 (unaudited) continued
| Investment Type | | Level 1
Unadjusted
Quoted Prices | | Level 2
Other
Significant
Observable
Inputs | | Level 3
Significant
Unobservable
Inputs | | Total | |
| Short-Term Investments | |
| U.S. Treasury Security | | $ | — | | | $ | 99,992 | | | $ | — | | | $ | 99,992 | | |
| Investment Company | | | 17,766,564 | | | | — | | | | — | | | | 17,766,564 | | |
| Total Short-Term Investments | | | 17,766,564 | | | | 99,992 | | | | — | | | | 17,866,556 | | |
| Interest Rate Swap Agreements | | | — | | | | 213,632 | | | | — | | | | 213,632 | | |
| Total Assets | | | 97,282,276 | | | | 31,988,927 | | | | — | | | | 129,271,203 | | |
| Liabilities: | |
| Futures | | | (2,530 | ) | | | — | | | | — | | | | (2,530 | ) | |
| Interest Rate Swap Agreements | | | — | | | | (221,296 | ) | | | — | | | | (221,296 | ) | |
| Total Liabilities | | | (2,530 | ) | | | (221,296 | ) | | | — | | | | (223,826 | ) | |
| Total | | $ | 97,279,746 | | | $ | 31,767,631 | | | $ | — | | | $ | 129,047,377 | | |
Transfers between investment levels may occur as the markets fluctuate and/or the availability of data used in an investment's valuation changes. The Fund recognizes transfers between the levels as of the end of the period. As of June 30, 2012, the fair market value of certain securities were adjusted due to developments which occurred between the time of the close of the foreign markets on which they trade and the close of business on the NYSE which resulted in their Level 2 classification. The values of the transfers were as follows:
GLOBAL
INFRASTRUCTURE | | EUROPEAN
EQUITY | | MULTI CAP
GROWTH | | AGGRESSIVE
EQUITY | |
| $ | 32,495,827 | | | $ | 47,342,931 | | | $ | 13,630,558 | | | $ | 1,723,278 | | |
93
Morgan Stanley Variable Investment Series
Notes to Financial Statements n June 30, 2012 (unaudited) continued
Following is a reconciliation of investments in which significant unobservable inputs (Level 3) were used in determining fair value:
| | | Multi Cap Growth | | Aggressive Equity | |
| | | Common
Stock | | Convertible
Preferred Stocks | | Common
Stock | | Convertible
Preferred Stocks | |
| Beginning Balance | | $ | 8,853,246 | | | $ | 3,036,329 | | | $ | 1,058,994 | | | $ | 365,853 | | |
| Purchases | | | — | | | | — | | | | — | | | | — | | |
| Sales | | | — | | | | — | | | | — | | | | — | | |
| Amortization of discount | | | — | | | | — | | | | — | | | | — | | |
| Transfers in | | | — | | | | — | | | | — | | | | — | | |
| Transfers out | | | — | | | | — | | | | — | | | | — | | |
Change in unrealized appreciation
(depreciation) | | | 501,684 | | | | (721,181 | ) | | | 60,010 | | | | (87,218 | ) | |
| Realized gains (losses) | | | — | | | | — | | | | — | | | | — | | |
| Ending Balance | | $ | 9,354,930 | | | $ | 2,315,148 | | | $ | 1,119,004 | | | $ | 278,635 | | |
Net change in unrealized appreciation/
depreciation from investments still held
as of June 30, 2012. | | $ | 501,684 | | | $ | (721,181 | ) | | $ | 60,010 | | | $ | (87,218 | ) | |
3. Derivatives
Certain Portfolios may, but are not required to, use derivative instruments for a variety of purposes, including hedging, risk management, portfolio management or to earn income. Derivatives are financial instruments whose value is based on the value of an underlying asset, interest rate, index or financial instrument. A derivative instrument often has risks similar to its underlying asset and may have additional risks, including imperfect correlation between the value of the derivative and the underlying asset, risks of default by the counterparty to certain transactions, magnification of losses incurred due to changes in the market value of the securities, instruments, indices or interest rates to which they relate, and risks that the transactions may not be liquid. The use of derivatives involves risks that are different from, and possibly greater than, the risks associated with other portfolio investments. Derivatives may involve the use of highly specialized instruments that require investment techniques and risk analyses different from those associated with other portfolio investments. All of a Portfolio's holdings, including derivative instruments, are marked-to-market each day with the change in value reflected in unrealized appreciation (depreciation). Upon disposition, a realized gain or loss is recognized.
Certain derivative transactions may give rise to a form of leverage. Leverage magnifies the potential for gain and risk of loss. Leverage associated with derivative transactions may cause the Portfolios to liquidate
94
Morgan Stanley Variable Investment Series
Notes to Financial Statements n June 30, 2012 (unaudited) continued
portfolio positions when it may not be advantageous to do so to satisfy its obligations or to meet earmarking or segregation requirements, pursuant to applicable Securities and Exchange Commission rules and regulations, or may cause the Portfolios to be more volatile than if the Portfolios had not been leveraged. Although the Adviser and/or Sub-Advisers seek to use derivatives to further the Portfolio's investment objectives, there is no assurance that the use of derivatives will achieve this result.
Following is a description of the derivative instruments and techniques that the Portfolios used during the period and their associated risks:
Foreign Currency Exchange Contracts In connection with its investments in foreign securities, certain Portfolios entered into contracts with banks, brokers or dealers to purchase or sell foreign currencies at a future date. A foreign currency exchange contract ("currency contracts") is a negotiated agreement between two parties to exchange specified amounts of two or more currencies at a specified future time at a specified rate. The rate specified by the currency contract can be higher or lower than the spot rate between the currencies that are the subject of the currency contract. Currency contracts may be used to protect against uncertainty in the level of future foreign currency exchange rates or to gain or modify exposure to a particular currency. In addition, certain Portfolios may use cross currency hedging or proxy hedging with respect to currencies in which a Portfolio has or expects to have portfolio or currency exposure. Cross currency hedges involve the sale of one currency against the positive exposure to a different currency and may be used for hedging purposes or to establish an active exposure to the exchange rate between any two currencies. Hedging a Portfolio's currency risks involves the risk of mismatching a Portfolio's objectives under a currency contract with the value of securities denominated in a particular currency. Furthermore, such transactions reduce or preclude the opportunity for gain if the value of the currency should move in the direction opposite to the position taken. There is an additional risk to the effect that currency contracts create exposure to currencies in which a Portfolio's securities are not denominated. Unanticipated changes in currency prices may result in poorer overall performance for a Portfolio than if it had not entered into such currency contracts. The use of currency contracts involves the risk of loss from the insolvency or bankruptcy of the counterparty to the contract or the failure of the counterparty to make payments or otherwise comply with the term of the contract. A currency contract is marked-to-market daily and the change in market value is recorded by a Portfolio as unrealized gain or (loss). A Portfolio records realized gains (losses) when the currency contract is closed equal to the difference between the value of the currency contract at the time it was opened and the value at the time it was closed.
Futures A futures contract is a standardized agreement between two parties to buy or sell a specific quantity of an underlying instrument at a specific price at a specific future time. The value of a futures contract tends to increase and decrease in tandem with the value of the underlying instrument. Depending
95
Morgan Stanley Variable Investment Series
Notes to Financial Statements n June 30, 2012 (unaudited) continued
on the terms of the particular contract, futures contracts are settled through either physical delivery of the underlying instrument on the settlement date or by payment of a cash settlement amount on the settlement date. During the period the futures contract is open, payments are received from or made to the broker based upon changes in the value of the contract (the variation margin). A decision as to whether, when and how to use futures involves the exercise of skill and judgment and even a well-conceived futures transaction may be unsuccessful because of market behavior or unexpected events. In addition to the derivatives risks discussed above, the prices of futures can be highly volatile, using futures can lower total return, and the potential loss from futures can exceed a Portfolio's initial investment in such contracts.
Swaps An over-the-counter ("OTC") swap agreement is an agreement between two parties pursuant to which the parties exchange payments at specified dates on the basis of a specified notional amount, with the payments calculated by reference to specified securities, indexes, reference rates, currencies or other instruments. A small percentage of swap agreements are cleared through a central clearing house. Most swap agreements provide that when the period payment dates for both parties are the same, the payments are made on a net basis (i.e., the two payment streams are netted out, with only the net amount paid by one party to the other). A Portfolio's obligations or rights under a swap agreement entered into on a net basis will generally be equal only to the net amount to be paid or received under the agreement, based on the relative values of the positions held by each counterparty. Most swap agreements are not entered into or traded on exchanges and there is no central clearing or guaranty function for swaps. These OTC swaps are often subject to credit risk or the risk of default or non-performance by the counterparty. Swaps could result in losses if interest rate or foreign currency exchange rates or credit quality changes are not correctly anticipated by a Portfolio or if the reference index, security or investments do not perform as expected.
A Portfolio's use of swaps during the period included those based on the credit of an underlying security and commonly referred to as credit default swaps. Where a Portfolio is the buyer of a credit default swap agreement, it would be entitled to receive the par (or other agreed-upon) value of a referenced debt obligation from the counterparty to the agreement only in the event of a default by a third party on the debt obligation. If no default occurs, a Portfolio would have paid to the counterparty a periodic stream of payments over the term of the agreement and received no benefit from the agreement. When a Portfolio is the seller of a credit default swap agreement, it receives the stream of payments but is obligated to pay an amount equal to the par (or other agreed upon) value of a referenced debt obligation upon default of the referenced debt obligation. Alternatively, for credit default swaps on an index of credits, the quoted market prices and current values serve as an indicator of the current status of the payment/performance risk of the credit derivative. Generally, lower credit ratings and increasing market values, in absolute terms, represent a deterioration of the credit and a greater likelihood of an adverse credit event of the issuer.
96
Morgan Stanley Variable Investment Series
Notes to Financial Statements n June 30, 2012 (unaudited) continued
When a Portfolio has an unrealized loss on a swap agreement, the Portfolio has instructed the custodian to pledge cash or liquid securities as collateral with a value approximately equal to the amount of the unrealized loss. Collateral pledges are monitored and subsequently adjusted if and when the swap valuations fluctuate. If applicable, cash collateral is included with "Due from (to) Broker" in the Statements of Assets and Liabilities.
FASB ASC 815, Derivatives and Hedging: Overall ("ASC 815"), is intended to improve financial reporting about derivative instruments by requiring enhanced disclosures to enable investors to better understand how and why a Portfolio uses derivative instruments, how these derivative instruments are accounted for and their effects on a Portfolio's financial position and results of operations.
The following table sets forth the fair value of each Portfolio's derivative contracts by primary risk exposure as of June 30, 2012.
| PORTFOLIO | |
PRIMARY RISK
EXPOSURE | | ASSET DERIVATIVES
STATEMENTS OF
ASSETS AND
LIABILITIES LOCATION | |
FAIR VALUE | | LIABILITIES DERIVATIVES
STATEMENTS OF
ASSETS AND
LIABILITIES LOCATION | |
FAIR VALUE | |
| Limited Duration | | Interest Rate
Risk | | |
Variation margin | | | $ | 7,844 | † | | |
Variation margin | | | $ | (2,139 | )† | |
| Income Plus | | Interest Rate
Risk | | |
Variation margin | | | $ | 22,909 | † | | |
Variation margin | | | $ | (106,304 | )† | |
| | | | | | | Unrealized appreciation
on open swap agreements | | | — | | | Unrealized depreciation
on open swap agreements | | | (223,864 | ) | |
| | | Currency Risk | | Unrealized appreciation
on open foreign currency
exchange contracts | | | — | | | Unrealized depreciation
on open foreign currency
exchange contracts | | | (10,642 | ) | |
| | | | | Total | | $ | 22,909 | | | Total | | $ | (340,810 | ) | |
| European Equity | | Currency Risk | | Unrealized appreciation
on open foreign currency
exchange contracts | | $ | — | | | Unrealized depreciation
on open foreign currency
exchange contracts | | $ | (8,551 | ) | |
| Strategist | | Interest Rate
Risk | | |
Variation margin | | | $ | — | † | | |
Variation margin | | | $ | (2,530 | )† | |
| | | | | Unrealized appreciation
on open swap agreements | | | 213,632 | | | Unrealized depreciation
on open swap agreements | | | (221,296 | ) | |
| | | | | Total | | $ | 213,632 | | | Total | | $ | (223,826 | ) | |
† Includes cumulative appreciation/depreciation of futures contracts as reported in the Portfolio of Investments. Only current day's net variation margin is reported within the Statements of Assets and Liabilities.
97
Morgan Stanley Variable Investment Series
Notes to Financial Statements n June 30, 2012 (unaudited) continued
The following tables set forth by primary risk exposure each Portfolio's realized gains (losses) and change in unrealized appreciation (depreciation) by type of derivative contract for the six months ended June 30, 2012 in accordance with ASC 815.
AMOUNT OF REALIZED GAIN (LOSS) ON DERIVATIVE CONTRACTS
| PORTFOLIO | | PRIMARY RISK
EXPOSURE | | FUTURES | | SWAPS | | FOREIGN
CURRENCY
EXCHANGE | |
| Limited Duration | | Interest Rate Risk | | $ | 66,926 | | | $ | (279,311 | ) | | $ | — | | |
| Income Plus | | Interest Rate Risk | | $ | (490,301 | ) | | $ | (90,725 | ) | | $ | — | | |
| | | Currency Risk | | | — | | | | — | | | | 41,819 | | |
| | | Total | | $ | (490,301 | ) | | $ | (90,725 | ) | | $ | 41,819 | | |
| European Equity | | Currency Risk | | $ | — | | | $ | — | | | $ | (63,191 | ) | |
| Strategist | | Interest Rate Risk | | $ | 33,536 | | | $ | (100,127 | ) | | $ | — | | |
| | | Currency Risk | | | — | | | | — | | | | 4,044 | | |
| | | Total | | $ | 33,536 | | | $ | (100,127 | ) | | $ | 4,044 | | |
CHANGE IN UNREALIZED APPRECIATION (DEPRECIATION) ON DERIVATIVE CONTRACTS
| PORTFOLIO | | PRIMARY RISK
EXPOSURE | | FUTURES | | SWAPS | | FOREIGN
CURRENCY
EXCHANGE | |
| Limited Duration | | Interest Rate Risk | | $ | (21,893 | ) | | $ | 270,993 | | | $ | — | | |
| Income Plus | | Interest Rate Risk | | $ | 125,403 | | | $ | (212,964 | ) | | $ | — | | |
| | | Currency Risk | | | — | | | | — | | | | (10,642 | ) | |
| | | Total | | $ | 125,403 | | | $ | (212,964 | ) | | $ | (10,642 | ) | |
| European Equity | | Currency Risk | | $ | — | | | $ | — | | | $ | 138,593 | | |
| Strategist | | Interest Rate Risk | | $ | 493 | | | $ | 41,792 | | | $ | — | | |
| | | Currency Risk | | | — | | | | — | | | | 4,074 | | |
| | | Total | | $ | 493 | | | $ | 41,792 | | | $ | 4,074 | | |
For the six months ended June 30, 2012, Limited Duration Portfolios' average monthly original value of futures contracts was $12,818,513 and average monthly notional amount of swap agreements was $4,289,002. Income Plus and Strategist Portfolio's average monthly principal amount of foreign currency exchange contracts was $717,451 and $202,941, the average monthly original value of futures contracts was $68,444,542 and $1,910,121 and the average monthly notional amount of swap agreements was $2,886,167 and $20,916,446, respectively. European Equity Portfolio's average monthly principal amount of foreign currency exchange contracts was $5,377,388.
98
Morgan Stanley Variable Investment Series
Notes to Financial Statements n June 30, 2012 (unaudited) continued
4. Advisory/Administration and Sub-Advisory Agreements
Pursuant to an Investment Advisory Agreement with the Adviser and Sub-Advisers, the Fund pays an advisory fee, accrued daily and payable monthly, by applying the annual rates listed below to each Portfolio's net assets determined at the close of each business day.
Money Market — 0.45% to the portion of the daily net assets not exceeding $250 million; 0.375% to the portion of the daily net assets exceeding $250 million but not exceeding $750 million; 0.325% to the portion of the daily net assets exceeding $750 million but not exceeding $1.25 billion; 0.30% to the portion of the daily net assets exceeding $1.25 billion but not exceeding $1.5 billion; and 0.275% to the portion of the daily net assets in excess of $1.5 billion.
Limited Duration — 0.30%.
Income Plus — 0.42% to the portion of the daily net assets not exceeding $500 million; 0.35% to the portion of the daily net assets exceeding $500 million but not exceeding $1.25 billion; and 0.22% to the portion of the daily net assets in excess of $1.25 billion.
Global Infrastructure — 0.57% to the portion of the daily net assets not exceeding $500 million; 0.47% to the portion of the daily net assets exceeding $500 million but not exceeding $1 billion; 0.445% to the portion of the daily net assets exceeding $1 billion but not exceeding $1.5 billion; 0.42% to the portion of the daily net assets exceeding $1.5 billion but not exceeding $2.5 billion; 0.395% to the portion of the daily net assets exceeding $2.5 billion but not exceeding $3.5 billion; 0.37% to the portion of the daily net assets exceeding $3.5 billion but not exceeding $5 billion; and 0.345% to the portion of the daily net assets in excess of $5 billion.
European Equity — 0.87% to the portion of the daily net assets not exceeding $500 million; 0.82% to the portion of the daily net assets exceeding $500 million but not exceeding $2 billion; 0.77% to the portion of the daily net assets exceeding $2 billion but not exceeding $3 billion; and 0.745% to the portion of the daily net assets in excess of $3 billion.
Multi Cap Growth — 0.42% to the portion of the daily net assets not exceeding $1 billion; 0.395% to the portion of the daily net assets exceeding $1 billion but not exceeding $2 billion; and 0.37% to the portion of the daily net assets in excess of $2 billion.
Aggressive Equity — 0.67% to the portion of the daily net assets not exceeding $500 million; 0.645% to the portion of the daily net assets exceeding $500 million but not exceeding $2 billion; 0.62% to the portion of
99
Morgan Stanley Variable Investment Series
Notes to Financial Statements n June 30, 2012 (unaudited) continued
the daily net assets exceeding $2 billion but not exceeding $3 billion; and 0.595% to the portion of the daily net assets in excess of $3 billion.
Strategist — 0.42% to the portion of the daily net assets not exceeding $1.5 billion; and 0.395% to the portion of the daily net assets in excess of $1.5 billion.
Under the Sub-Advisory Agreement between the Adviser and the Sub-Advisers, the Sub-Advisers provide Global Infrastructure Portfolio, European Equity Portfolio and Money Market Portfolio (effective June 25th, 2012) with advisory services subject to the overall supervision of the Adviser and the Fund's Officers and Trustees. The Adviser pays the Sub-Advisers on a monthly basis a portion of the net advisory fees the Adviser receives from each Portfolio.
The Adviser has agreed to cap European Equity's operating expenses (except for brokerage and 12b-1 fees) by assuming the Portfolio's "other expenses" and/or waiving the Portfolio's advisory fees, and Morgan Stanley Services Company Inc. (the "Administrator") has agreed to waive the Portfolio's administrative fees, to the extent such operating expenses exceed 1.00% of the average daily net assets of the Portfolio on an annualized basis. These fee waivers and/or expense reimbursements will continue for at least one year or until such time as the Fund's Board of Trustees acts to discontinue such waivers and/or reimbursements when it deems that such action is appropriate.
Pursuant to an Administration Agreement with the Administrator, an affiliate of the Adviser and Sub-Advisers, each Portfolio pays an administration fee, accrued daily and payable monthly, by applying the annual rate of 0.08% (Money Market 0.05%) to the Portfolio's daily net assets.
Under a Sub-Administration agreement between the Administrator and State Street Bank and Trust Company ("State Street"), State Street provides certain administrative services to the Fund. For such services, the Administrator pays State Street a portion of the fee the Administrator receives from the Fund.
5. Plan of Distribution
Shares of the Fund are distributed by Morgan Stanley Distribution, Inc. (the "Distributor"), an affiliate of the Adviser, Administrator and Sub-Advisers. The Fund has adopted a Plan of Distribution (the "Plan") pursuant to Rule 12b-1 under the Act. Under the Plan, Class Y shares of each Portfolio bear a distribution fee which is accrued daily and paid monthly at the annual rate of 0.25% of the average daily net assets of the class.
The Distributor, Adviser and Administrator have agreed to waive and/or reimburse all or a portion of the Money Market Portfolio's distribution fee, advisory fee and administration fee, respectively, to the extent
100
Morgan Stanley Variable Investment Series
Notes to Financial Statements n June 30, 2012 (unaudited) continued
that total expenses exceed total income of the Money Market Portfolio on a daily basis. For the six months ended June 30, 2012, the Distributor waived $67,140 and the Adviser waived $187,517. These fee waivers and/or expense reimbursements will continue for at least one year or until such time that the Trustees acts to discontinue such waivers and/or expense reimbursements when it deems such action is appropriate.
6. Security Transactions and Transactions with Affiliates
For the six months ended June 30, 2012, purchases and sales of investment securities, excluding short-term investments, were as follows:
| | | U.S. GOVERNMENT SECURITIES | | OTHER | |
| PORTFOLIO | | PURCHASES | | SALES | | PURCHASES | | SALES | |
| Limited Duration | | $ | 11,190,589 | | | $ | 5,326,888 | | | $ | 6,421,572 | | | $ | 10,983,498 | | |
| Income Plus | | | — | | | | 22 | | | | 64,557,336 | | | | 74,824,392 | | |
| Global Infrastructure | | | — | | | | — | | | | 11,332,125 | | | | 15,855,755 | | |
| European Equity | | | — | | | | — | | | | 1,600,934 | | | | 6,055,304 | | |
| Multi Cap Growth | | | — | | | | — | | | | 66,549,684 | | | | 82,913,687 | | |
| Aggressive Equity | | | — | | | | — | | | | 8,460,034 | | | | 10,039,934 | | |
| Strategist | | | 9,522,315 | | | | 5,271,460 | | | | 27,812,277 | | | | 35,232,770 | | |
Each Portfolio (except Money Market) invests in the Institutional Class of the Morgan Stanley Institutional Liquidity Funds (the "Liquidity Funds"), an open-end management investment company managed by the Adviser, both directly, and as a portion of the securities held as collateral on loaned securities. Advisory fees paid by the Portfolios are reduced by an amount equal to its pro-rata share of advisory and administrative fees paid by the Portfolios due to its investment in the Liquidity Funds.
A summary of the Portfolio's transactions in shares of the Liquidity Funds during the six months ended June 30, 2012 is as follows:
| PORTFOLIO | | VALUE
DECEMBER 31, 2011 | | PURCHASES
AT COST | | SALES | | DIVIDEND
INCOME | | VALUE
JUNE 30, 2012 | |
| Limited Duration | | $ | 110,511 | | | $ | 15,544,261 | | | $ | 15,423,753 | | | $ | 1,005 | | | $ | 231,019 | | |
| Income Plus | | | 208,270 | | | | 40,760,825 | | | | 38,584,933 | | | | 5,153 | | | | 2,384,162 | | |
| Global Infrastructure | | | 1,993,348 | | | | 8,088,166 | | | | 8,988,552 | | | | 636 | | | | 1,092,962 | | |
| European Equity | | | 718,547 | | | | 5,438,706 | | | | 4,998,982 | | | | 424 | | | | 1,158,271 | | |
| Multi Cap Growth | | | 12,216,664 | | | | 39,716,828 | | | | 45,259,966 | | | | 5,044 | | | | 6,673,526 | | |
| Aggressive Equity | | | 1,790,916 | | | | 4,843,174 | | | | 5,595,700 | | | | 716 | | | | 1,038,390 | | |
| Strategist | | | 26,626,452 | | | | 17,676,355 | | | | 26,536,243 | | | | 19,524 | | | | 17,766,564 | | |
101
Morgan Stanley Variable Investment Series
Notes to Financial Statements n June 30, 2012 (unaudited) continued
In addition, the table also identifies the income distributions earned, if any, by each Portfolio for that Portfolio's investment in the Liquidity Funds.
Income distributions are included in "interest and dividends from affiliates" in the Statements of Operations.
| PORTFOLIO | | ADVISORY FEE
REDUCTION | |
| Limited Duration | | $ | 783 | | |
| Income Plus | | | 3,823 | | |
| Global Infrastructure | | | 639 | | |
| European Equity | | | 405 | | |
| Multi Cap Growth | | | 5,174 | | |
| Aggressive Equity | | | 798 | | |
| Strategist | | | 18,042 | | |
The following Portfolios had transactions with the following affiliates of the Fund:
| PORTFOLIO | | ISSUER | | VALUE
DECEMBER 31,
2011 | | PURCHASES
AT COST | | SALES | | NET
REALIZED
GAIN | | INTEREST
INCOME | | VALUE
JUNE 30,
2012 | |
Limited
Duration | | MetLife Global | | $ | 327,079 | | | $ | 199,842 | | | $ | — | | | $ | — | | | $ | 3,241 | | | $ | 528,739 | | |
| Income Plus | | MetLife Capital Trust IV | | | — | | | | 633,000 | | | | — | | | | — | | | | 21,262 | | | | 669,000 | | |
| | | MetLife, Inc. | | | 1,276,994 | | | | — | | | | 1,297,925 | | | | 333,108 | | | | 4,899 | | | | — | | |
| Strategist | | MetLife, Inc. | | | 43,951 | | | | — | | | | — | | | | — | | | | 1,343 | | | | 44,387 | | |
The following Portfolios had transactions with Citigroup, Inc., and its affiliated broker-dealers, which may be deemed to be affiliates of the Adviser, Sub-Advisers, Administrator and Distributor under Section 17 of the Act, for the six months ended June 30, 2012:
| PORTFOLIO | | VALUE
DECEMBER 31,
2011 | | PURCHASES
AT COST | | SALES | | NET
REALIZED
GAIN (LOSS) | | INTEREST
INCOME | | VALUE
JUNE 30,
2012 | |
| Limited Duration | | $ | 1,087,480 | | | $ | 427,870 | | | $ | 504,854 | | | $ | 13,129 | | | $ | 16,050 | | | $ | 1,030,378 | | |
| Income Plus | | | 3,188,387 | | | | — | | | | — | | | | — | | | | 103,899 | | | | 3,418,012 | | |
| Strategist | | | 2,483,400 | | | | — | | | | 2,458,471 | | | | (907,033 | ) | | | 7,076 | | | | 116,522 | | |
102
Morgan Stanley Variable Investment Series
Notes to Financial Statements n June 30, 2012 (unaudited) continued
For the six months ended June 30, 2012, the following Portfolios incurred brokerage commissions with Morgan Stanley & Co., LLC, an affiliate of the Adviser, Sub-Advisers, Administrator and Distributor, for portfolio transactions executed on behalf of each Portfolio:
| STRATEGIST | | EUROPEAN
EQUITY | |
| $ | 20,142 | | | $ | 153 | | |
For the six months ended June 30, 2012, the following Portfolios incurred brokerage commissions with Citigroup, Inc., and its affiliated broker-dealers, which may be deemed affiliates of the Adviser, Sub-Advisers, Administrator and Distributor under Section 17 of the Act, for portfolio transactions executed on behalf of each Portfolio:
GLOBAL
INFRASTRUCTURE | | EUROPEAN
EQUITY | | MULTI CAP
GROWTH | | AGGRESSIVE
EQUITY | |
| $ | 1,109 | | | $ | 941 | | | $ | 300 | | | $ | 38 | | |
Morgan Stanley Services Company Inc., an affiliate of the Adviser, Sub-Advisers and Distributor, is the Fund's transfer agent.
The Fund has an unfunded noncontributory defined benefit pension plan covering certain independent Trustees of the Fund who will have served as independent Trustees for at least five years at the time of retirement. Benefits under this plan are based on factors which include years of service and compensation. The Trustees voted to close the plan to new participants and eliminate the future benefits growth due to increases to compensation after July 31, 2003.
Aggregate pension costs for the six months ended June 30, 2012, included in "trustees' fees and expenses" in the Statements of Operations and the accrued pension liability included in "accrued expenses and other payables" in the Statements of Assets and Liabilities are as follows:
AGGREGATE PENSION COSTS
MONEY
MARKET | | LIMITED
DURATION | | INCOME
PLUS | | GLOBAL
INFRASTRUCTURE | | EUROPEAN
EQUITY | | MULTI CAP
GROWTH | | AGGRESSIVE
EQUITY | | STRATEGIST | |
| $ | 162 | | | $ | 89 | | | $ | 304 | | | $ | 122 | | | $ | 100 | | | $ | 382 | | | $ | 46 | | | $ | 251 | | |
AGGREGATE PENSION LIABILITY
MONEY
MARKET | | LIMITED
DURATION | | INCOME
PLUS | | GLOBAL
INFRASTRUCTURE | | EUROPEAN
EQUITY | | MULTI CAP
GROWTH | | AGGRESSIVE
EQUITY | | STRATEGIST | |
| $ | 5,288 | | | $ | 2,752 | | | $ | 9,128 | | | $ | 2,801 | | | $ | 2,523 | | | $ | 9,589 | | | $ | 1,137 | | | $ | 7,262 | | |
103
Morgan Stanley Variable Investment Series
Notes to Financial Statements n June 30, 2012 (unaudited) continued
The Fund has an unfunded Deferred Compensation Plan (the "Compensation Plan"), which allows each independent Trustee to defer payment of all, or a portion, of the fees he or she receives for serving on the Board of Trustees. Each eligible Trustee generally may elect to have the deferred amounts credited with a return equal to the total return on one or more of the Morgan Stanley funds that are offered as investment options under the Compensation Plan. Appreciation/depreciation and distributions received from these investments are recorded with an offsetting increase/decrease in the deferred compensation obligation and do not affect the net asset value of the Fund.
7. Federal Income Tax Status
It is the Portfolios' intention to continue to qualify as a regulated investment company and distribute all of its taxable and tax-exempt income. Accordingly, no provision for Federal income taxes is required in the financial statements.
Dividend income and distributions to shareholders are recorded on the ex-dividend date. Interest income is recognized on an accrual basis. Dividends from net investment income, if any, are declared and paid annually. Net realized capital gains, if any, are distributed at least annually.
A Portfolio may be subject to taxes imposed by countries in which it invests. Such taxes are generally based on income and/or capital gains earned or repatriated. Taxes are accrued based on net investment income, net realized gains and net unrealized appreciation as such income and/or gains are earned. Taxes may also be based on transactions in foreign currency and are accrued based on the value of investments denominated in such currency.
FASB ASC 740-10, Income Taxes — Overall, sets forth a minimum threshold for financial statement recognition of the benefit of a tax position taken or expected to be taken in a tax return. Management has concluded there are no significant uncertain tax positions that would require recognition in the financial statements. If applicable, the Portfolios recognize interest accrued related to unrecognized tax benefits in "interest expense" and penalties in "other expenses" in the Statements of Operations. The Portfolios file tax returns with the U.S. Internal Revenue Service, New York and various states. Each of the tax years in the four-year period ended December 31, 2011, remains subject to examination by taxing authorities.
104
Morgan Stanley Variable Investment Series
Notes to Financial Statements n June 30, 2012 (unaudited) continued
The tax character of distributions paid may differ from the character of distributions shown in the Statements of Changes in Net Assets due to short-term capital gains being treated as ordinary income for tax purposes. The tax character of distributions paid during fiscal 2011 and 2010 was as follows:
| | | 2011 DISTRIBUTIONS PAID FROM: | | 2010 DISTRIBUTIONS PAID FROM: | |
| PORTFOLIO | | ORDINARY
INCOME | | LONG-TERM
CAPTIAL GAIN | | ORDINARY
INCOME | | LONG-TERM
CAPTIAL GAIN | |
| Money Market | | $ | 11,709 | | | $ | — | | | $ | 14,474 | | | $ | 202 | | |
| Limited Duration | | | 1,919,268 | | | | — | | | | 2,459,575 | | | | — | | |
| Income Plus | | | 12,237,165 | | | | — | | | | 14,616,596 | | | | — | | |
| Global Infrastructure | | | 1,889,924 | | | | 3,948,735 | | | | 5,523,941 | | | | 3,205,294 | | |
| European Equity | | | 1,488,782 | | | | — | | | | 1,837,269 | | | | — | | |
| Multi Cap Growth | | | 327,516 | | | | 5 | | | | 333,905 | | | | — | | |
| Strategist | | | 5,463,608 | | | | 15,665,688 | | | | 2,865,187 | | | | 1,010,412 | | |
The amount and character of income and gains to be distributed are determined in accordance with income tax regulations which may differ from GAAP. These book/tax differences are either considered temporary or permanent in nature.
Temporary differences are primarily due to differing book and tax treatments in the timing of the recognition of gains (losses) on certain investment transactions and the timing of the deductibility of certain expenses.
Permanent differences, primarily due to differing treatments of gains (losses) related to foreign currency transactions, swap transactions, paydown adjustments, expiring capital losses, net operating losses, REIT adjustments, partnership basis adjustments, distribution redesignations, nondeductible expenses and certain equity securities designated as issued by passive foreign investment companies, resulted in the following reclassifications among the Portfolio's components of net assets at December 31, 2011:
| PORTFOLIO | | ACCUMULATED UNDISTRIBUTED
(DISTRIBUTIONS IN EXCESS OF)
NET INVESTMENT INCOME | | ACCUMULATED
NET REALIZED GAIN (LOSS) | | PAID-IN-CAPITAL | |
| Money Market | | $ | (107 | ) | | $ | 107 | | | $ | — | | |
| Limited Duration | | | 700,245 | | | | 603,087 | | | | (1,303,332 | ) | |
| Income Plus | | | 761,229 | | | | (761,229 | ) | | | — | | |
| Global Infrastructure | | | (118,528 | ) | | | 118,543 | | | | (15 | ) | |
| European Equity | | | 34,870 | | | | (34,877 | ) | | | 7 | | |
| Multi Cap Growth | | | 118,008 | | | | (40,804 | ) | | | (77,204 | ) | |
| Aggressive Equity | | | 189,189 | | | | (2,163 | ) | | | (187,026 | ) | |
| Strategist | | | 214,896 | | | | (214,894 | ) | | | (2 | ) | |
105
Morgan Stanley Variable Investment Series
Notes to Financial Statements n June 30, 2012 (unaudited) continued
At December 31, 2011, the components of distributable earnings on a tax basis were as follows:
| PORTFOLIO | | UNDISTRIBUTED
ORDINARY
INCOME | | UNDISTRIBUTED
LONG-TERM
CAPITAL GAIN | |
| Money Market | | $ | 7,605 | | | $ | — | | |
| Limited Duration | | | 1,503,207 | | | | — | | |
| Income Plus | | | 10,700,252 | | | | — | | |
| Global Infrastructure | | | 2,854,240 | | | | 5,230,378 | | |
| European Equity | | | 1,421,623 | | | | — | | |
| Multi Cap Growth | | | — | | | | 4,886,438 | | |
| Aggressive Equity | | | — | | | | 2,196,459 | | |
| Strategist | | | 2,450,279 | | | | 1,953,002 | | |
At June 30, 2012, the aggregate cost for federal income tax purposes approximates the aggregate cost for book purposes. The aggregate gross unrealized appreciation/(depreciation) and net unrealized appreciation/(depreciation) of the investments of each of the Portfolios were as follows:
| PORTFOLIO | | APPRECIATION | | DEPRECIATION | | NET APPRECIATION
(DEPRECIATION) | |
| Money Market | | $ | — | | | $ | — | | | $ | — | | |
| Limited Duration | | | 1,194,652 | | | | (314,158 | ) | | | 880,494 | | |
| Income Plus | | | 13,794,169 | | | | (1,235,435 | ) | | | 12,558,734 | | |
| Global Infrastructure | | | 14,237,935 | | | | (1,135,962 | ) | | | 13,101,973 | | |
| European Equity | | | 9,327,396 | | | | (4,172,490 | ) | | | 5,154,906 | | |
| Multi Cap Growth | | | 70,232,396 | | | | (20,930,269 | ) | | | 49,302,127 | | |
| Aggressive Equity | | | 8,452,517 | | | | (2,707,012 | ) | | | 5,745,505 | | |
| Strategist | | | 9,792,691 | | | | (2,022,219 | ) | | | 7,770,472 | | |
On December 22, 2010, the Regulated Investment Company Modernization Act of 2010 (the "Modernization Act") was signed into law. The Modernization Act modernizes several tax provisions related to Regulated Investment Companies ("RICs") and their shareholders. One key change made by the Modernization Act is that capital losses will generally retain their character as short-term or long-term and may be carried forward indefinitely to offset future gains. These losses are utilized before other capital loss carryforwards that expire. Generally, the Modernization Act is effective for taxable years beginning after December 22, 2010.
At December 31, 2011, the following Portfolio had available for Federal income tax purposes unused short-term capital losses that will not expire:
| PORTFOLIO | | SHORT-TERM LOSSES
(NO EXPIRATION) | |
| Money Market | | $ | 2,011 | | |
106
Morgan Stanley Variable Investment Series
Notes to Financial Statements n June 30, 2012 (unaudited) continued
In addition, at December 31, 2011, the following Portfolios had available capital loss carryforwards to offset future net capital gains, to the extent provided by regulations, on the indicated dates:
| | | AMOUNTS IN THOUSANDS AVAILABLE THROUGH DECEMBER 31, | |
| PORTFOLIO | | 2012 | | 2013 | | 2014 | | 2015 | | 2016 | | 2017 | | 2018 | | TOTAL | |
| Limited Duration | | $ | 4,026 | | | $ | 1,267 | | | $ | 2,233 | | | $ | 1,063 | | | $ | 17,119 | | | $ | 8,980 | | | $ | — | | | $ | 34,688 | | |
| Income Plus | | | — | | | | — | | | | — | | | | 344 | | | | 19,232 | | | | — | | | | — | | | | 19,576 | | |
| European Equity | | | — | | | | — | | | | — | | | | — | | | | — | | | | 10,552 | | | | 3,315 | | | | 13,867 | | |
During the year ended December 31, 2011, the following Portfolio expired capital loss carryforwards for U.S. Federal income tax purposes of:
| PORTFOLIO | | EXPIRED CAPITAL LOSS
CARRYFORWARDS | |
| Limited Duration | | $ | 1,303,332 | | |
To the extent that capital loss carryforwards are used to offset any future capital gains realized during the carryover period as provided by U.S. Federal income tax regulations, no capital gains tax liability will be incurred by a Portfolio for gains realized and not distributed. To the extent that capital gains are offset, such gains will not be distributed to the shareholders. During the year ended December 31, 2011, the following Portfolios utilized capital loss carryforwards for U.S. Federal income tax purposes of:
| PORTFOLIO | | UTILIZED CAPITAL LOSS
CARRYFORWARDS | |
| Limited Duration | | $ | 88,554 | | |
| Income Plus | | | 4,828,845 | | |
| European Equity | | | 1,331,481 | | |
| Multi Cap Growth | | | 27,708,593 | | |
| Aggressive Equity | | | 1,987,158 | | |
8. Purposes of and Risks Relating to Certain Financial Instruments
Certain Portfolios may lend securities to qualified financial institutions, such as broker-dealers, to earn additional income. Risks in securities lending transactions are that a borrower may not provide additional collateral when required or return the securities when due, and that the value of the short-term investments will be less than the amount of cash collateral plus any rebate that is required to be returned to the borrower.
Certain Portfolios may invest in mortgage securities, including securities issued by Federal National Mortgage Association ("FNMA") and Federal Home Loan Mortgage Corporation ("FHLMC"). These are fixed income securities that derive their value from or represent interests in a pool of mortgages or mortgage
107
Morgan Stanley Variable Investment Series
Notes to Financial Statements n June 30, 2012 (unaudited) continued
securities. An unexpectedly high rate of defaults on the mortgages held by a mortgage pool may adversely affect the value of a mortgage backed security and could result in losses to the Portfolio. The risk of such defaults is generally higher in the case of mortgage pools that include sub-prime mortgages. Sub-prime mortgages refer to loans made to borrowers with weakened credit histories or with a lower capacity to make timely payments on their mortgages. The securities issued by FNMA and FHLMC that are held by the Portfolios are not backed by sub-prime mortgages.
Additionally, securities issued by FNMA and FHLMC are not backed by or entitled to the full faith and credit of the United States; rather, they are supported by the right of the issuer to borrow from the U.S. Department of the Treasury.
The Federal Housing Finance Agency ("FHFA") serves as conservator of FNMA and FHLMC and the U.S. Department of the Treasury has agreed to provide capital as needed to ensure FNMA and FHLMC continue to provide liquidity to the housing and mortgage markets.
Certain Portfolios may enter into repurchase agreements under which a Portfolio lends excess cash and takes possession of securities with an agreement that the counterparty will repurchase such securities. In the event of default on the obligation to repurchase, the Portfolio has the right to liquidate the collateral and apply the proceeds in satisfaction of the obligation. In the event of default or bankruptcy by the counterparty to the agreement, realization of the collateral proceeds may be subject to certain costs and delays.
At June 30, 2012, European Equity Portfolio's investments in securities of issuers in the United Kingdom, Switzerland, Germany, and France represented 48.2%, 14.6%, 12.9% and 8.1%, respectively of the Portfolio's net assets. These investments, as well as other non-U.S. investments, which involve risks and considerations not present with respect to U.S. securities, may be affected by economic or political developments in these countries.
9. Expense Offset
The Fund has entered into an arrangement with State Street (the "Custodian"), whereby credits realized on uninvested cash balances were used to offset a portion of the Fund's expenses. If applicable, these custodian credits are shown as "expense offset" in the Statements of Operations.
108
Morgan Stanley Variable Investment Series
Notes to Financial Statements n June 30, 2012 (unaudited) continued
10. Accounting Pronouncement
In December 2011, FASB issued Accounting Standards Update ("ASU") 2011-11, Balance Sheet: Disclosures about Offsetting Assets and Liabilities. The pronouncement improves disclosures for recognized financial and derivative instruments that are either offset on the balance sheet in accordance with the offsetting guidance in ASC 210-20-45 or ASC 815-10-45 or are subject to an enforceable master netting agreements or similar. The Fund will be required to disclose information about rights to offset and related arrangements (such as collateral agreements) in order to enable financial statement users to understand the effect of those rights and arrangements on its financial position as well as disclose the following (1) gross amounts; (2) amounts offset in the statement of financial position; (3) any other amounts that can be offset in the event of bankruptcy, insolvency or default of any of the parties (including cash and noncash financial collateral); and (4) the Fund's net exposure. The requirements are effective for annual reporting periods beginning on or after January 1, 2013, and must be applied retrospectively. At this time, the Fund's management is evaluating the implications of ASU 2011-11 and its impact, if any, on the financial statements.
109
Morgan Stanley Variable Investment Series
Financial Highlights
| | | | | | | | | | | | | | | | |
FOR THE YEAR
ENDED
DECEMBER 31 | | NET ASSET
VALUE
BEGINNING
OF PERIOD | | NET
INVESTMENT
INCOME(a) | | NET REALIZED
AND
UNREALIZED
GAIN (LOSS) | | TOTAL FROM
INVESTMENT
OPERATIONS | | DIVIDENDS
TO
SHAREHOLDERS | | DISTRIBUTIONS
TO
SHAREHOLDERS | | TOTAL
DIVIDENDS
AND
DISTRIBUTIONS | |
MONEY MARKET
CLASS X SHARES | | | |
| 2007^ | | $ | 1.00 | | | $ | 0.050 | | | | — | | | $ | 0.050 | | | $ | (0.050 | ) | | | — | | | $ | (0.050 | ) | |
| 2008^ | | | 1.00 | | | | 0.020 | | | | — | | | | 0.020 | | | | (0.020 | ) | | | — | | | | (0.020 | ) | |
| 2009^ | | | 1.00 | | | | 0.000 | (e) | | | — | | | | 0.000 | (e) | | | (0.000 | )(e) | | | — | | | | (0.000 | )(e) | |
| 2010^ | | | 1.00 | | | | 0.000 | (e) | | | — | | | | 0.000 | (e) | | | (0.000 | )(e) | | | — | | | | (0.000 | )(e) | |
| 2011 | | | 1.00 | | | | 0.000 | (e) | | | (0.000 | )(e) | | | 0.000 | (e) | | | (0.000 | )(e) | | | — | | | | (0.000 | )(e) | |
| 2012^^ | | | 1.00 | | | | 0.000 | (e) | | | 0.000 | (e) | | | 0.000 | (e) | | | (0.000 | )(e) | | | — | | | | (0.000 | )(e) | |
| CLASS Y SHARES | | | |
| 2007^ | | | 1.00 | | | | 0.050 | | | | — | | | | 0.050 | | | | (0.050 | ) | | | — | | | | (0.050 | ) | |
| 2008^ | | | 1.00 | | | | 0.020 | | | | — | | | | 0.020 | | | | (0.020 | ) | | | — | | | | (0.020 | ) | |
| 2009^ | | | 1.00 | | | | 0.000 | (e) | | | — | | | | 0.000 | (e) | | | (0.000 | )(e) | | | — | | | | (0.000 | )(e) | |
| 2010^ | | | 1.00 | | | | 0.000 | (e) | | | — | | | | 0.000 | (e) | | | (0.000 | )(e) | | | — | | | | (0.000 | )(e) | |
| 2011 | | | 1.00 | | | | 0.000 | (e) | | | (0.000 | )(e) | | | 0.000 | (e) | | | (0.000 | )(e) | | | — | | | | (0.000 | )(e) | |
| 2012^^ | | | 1.00 | | | | 0.000 | (e) | | | 0.000 | (e) | | | 0.000 | (e) | | | (0.000 | )(e) | | | — | | | | (0.000 | )(e) | |
LIMITED DURATION
CLASS X SHARES | | | |
| 2007^ | | | 9.49 | | | | 0.47 | | | $ | (0.19 | ) | | | 0.28 | | | | (0.50 | ) | | | — | | | | (0.50 | ) | |
| 2008^ | | | 9.27 | | | | 0.36 | | | | (1.72 | ) | | | (1.36 | ) | | | (0.15 | ) | | | — | | | | (0.15 | ) | |
| 2009^ | | | 7.76 | | | | 0.20 | | | | 0.24 | | | | 0.44 | | | | (0.36 | ) | | | — | | | | (0.36 | ) | |
| 2010^ | | | 7.84 | | | | 0.18 | | | | 0.00 | | | | 0.18 | | | | (0.28 | ) | | | — | | | | (0.28 | ) | |
| 2011 | | | 7.74 | | | | 0.17 | | | | 0.04 | | | | 0.21 | | | | (0.26 | ) | | | — | | | | (0.26 | ) | |
| 2012^^ | | | 7.69 | | | | 0.06 | | | | 0.08 | | | | 0.14 | | | | (0.23 | ) | | | — | | | | (0.23 | ) | |
| CLASS Y SHARES | | | |
| 2007^ | | | 9.48 | | | | 0.44 | | | | (0.19 | ) | | | 0.25 | | | | (0.47 | ) | | | — | | | | (0.47 | ) | |
| 2008^ | | | 9.26 | | | | 0.34 | | | | (1.73 | ) | | | (1.39 | ) | | | (0.14 | ) | | | — | | | | (0.14 | ) | |
| 2009^ | | | 7.73 | | | | 0.18 | | | | 0.24 | | | | 0.42 | | | | (0.34 | ) | | | — | | | | (0.34 | ) | |
| 2010^ | | | 7.81 | | | | 0.16 | | | | 0.01 | | | | 0.17 | | | | (0.26 | ) | | | — | | | | (0.26 | ) | |
| 2011 | | | 7.72 | | | | 0.15 | | | | 0.04 | | | | 0.19 | | | | (0.24 | ) | | | — | | | | (0.24 | ) | |
| 2012^^ | | | 7.67 | | | | 0.05 | | | | 0.08 | | | | 0.13 | | | | (0.21 | ) | | | — | | | | (0.21 | ) | |
See Notes to Financial Statements
110
| | | | | | | | | RATIO TO AVERAGE
NET ASSETS(c) | | | | | |
FOR THE YEAR
ENDED
DECEMBER 31 | | NET ASSET
VALUE
END OF
PERIOD | | TOTAL
RETURN(b) | | NET ASSETS
END OF
PERIOD
(000'S) | | EXPENSES | | NET
INVESTMENT
INCOME | | REBATE FROM
MORGAN STANLEY
AFFILIATE | | PORTFOLIO
TURNOVER
RATE | |
MONEY MARKET
CLASS X SHARES | |
| 2007^ | | $ | 1.00 | | | | 4.93 | %(d) | | $ | 111,478 | | | | 0.55 | % | | | 4.79 | % | | | — | | | | N/A | | |
| 2008^ | | | 1.00 | | | | 2.45 | | | | 115,415 | | | | 0.57 | | | | 2.40 | | | | — | | | | N/A | | |
| 2009^ | | | 1.00 | | | | 0.03 | | | | 84,486 | | | | 0.40 | (f)(g) | | | 0.03 | (f)(g) | | | — | | | | N/A | | |
| 2010^ | | | 1.00 | | | | 0.01 | | | | 59,932 | | | | 0.29 | (g) | | | 0.00 | (g)(h) | | | — | | | | N/A | | |
| 2011 | | | 1.00 | | | | 0.01 | | | | 51,431 | | | | 0.22 | (g) | | | 0.01 | (g) | | | — | | | | N/A | | |
| 2012^^ | | | 1.00 | | | | 0.00 | (h)(l) | | | 46,495 | | | | 0.26 | (g)(m) | | | 0.01 | (g)(m) | | | — | | | | N/A | | |
| CLASS Y SHARES | |
| 2007^ | | | 1.00 | | | | 4.67 | (d) | | | 101,524 | | | | 0.80 | | | | 4.54 | | | | — | | | | N/A | | |
| 2008^ | | | 1.00 | | | | 2.19 | | | | 112,113 | | | | 0.82 | | | | 2.15 | | | | — | | | | N/A | | |
| 2009^ | | | 1.00 | | | | 0.01 | | | | 81,145 | | | | 0.41 | (f)(g) | | | 0.01 | (f)(g) | | | — | | | | N/A | | |
| 2010^ | | | 1.00 | | | | 0.01 | | | | 67,139 | | | | 0.29 | (g) | | | 0.00 | (g)(h) | | | — | | | | N/A | | |
| 2011 | | | 1.00 | | | | 0.01 | | | | 55,849 | | | | 0.22 | (g) | | | 0.01 | (g) | | | — | | | | N/A | | |
| 2012^^ | | | 1.00 | | | | 0.00 | (h)(l) | | | 50,801 | | | | 0.26 | (g)(m) | | | 0.01 | (g)(m) | | | — | | | | N/A | | |
LIMITED DURATION
CLASS X SHARES | |
| 2007^ | | | 9.27 | | | | 2.95 | | | | 26,214 | | | | 0.47 | | | | 4.95 | | | | — | | | | 49 | % | |
| 2008^ | | | 7.76 | | | | (14.91 | ) | | | 16,405 | | | | 0.48 | (i) | | | 4.27 | (i) | | | 0.01 | % | | | 54 | | |
| 2009^ | | | 7.84 | | | | 5.76 | | | | 16,889 | | | | 0.49 | (i) | | | 2.61 | (i) | | | 0.00 | (h) | | | 105 | | |
| 2010^ | | | 7.74 | | | | 2.35 | | | | 14,921 | | | | 0.55 | (i) | | | 2.25 | (i) | | | 0.00 | (h) | | | 88 | | |
| 2011 | | | 7.69 | | | | 2.75 | | | | 12,693 | | | | 0.60 | (i) | | | 2.15 | (i) | | | 0.00 | (h) | | | 45 | | |
| 2012^^ | | | 7.60 | | | | 1.86 | (l) | | | 11,593 | | | | 0.58 | (i)(m) | | | 1.67 | (i)(m) | | | 0.00 | (h)(m) | | | 30 | (l) | |
| CLASS Y SHARES | |
| 2007^ | | | 9.26 | | | | 2.80 | | | | 101,066 | | | | 0.72 | | | | 4.70 | | | | — | | | | 49 | | |
| 2008^ | | | 7.73 | | | | (15.22 | ) | | | 63,223 | | | | 0.73 | (i) | | | 4.02 | (i) | | | 0.01 | | | | 54 | | |
| 2009^ | | | 7.81 | | | | 5.56 | | | | 60,753 | | | | 0.74 | (i) | | | 2.36 | (i) | | | 0.00 | (h) | | | 105 | | |
| 2010^ | | | 7.72 | | | | 2.22 | | | | 53,760 | | | | 0.80 | (i) | | | 2.00 | (i) | | | 0.00 | (h) | | | 88 | | |
| 2011 | | | 7.67 | | | | 2.45 | | | | 44,085 | | | | 0.85 | (i) | | | 1.90 | (i) | | | 0.00 | (h) | | | 45 | | |
| 2012^^ | | | 7.59 | | | | 1.71 | (l) | | | 42,671 | | | | 0.83 | (i)(m) | | | 1.42 | (i)(m) | | | 0.00 | (h)(m) | | | 30 | (l) | |
111
Morgan Stanley Variable Investment Series
Financial Highlights continued
| | | | | | | | | | | | | | | | |
FOR THE YEAR
ENDED
DECEMBER 31 | | NET ASSET
VALUE
BEGINNING
OF PERIOD | | NET
INVESTMENT
INCOME(a) | | NET REALIZED
AND
UNREALIZED
GAIN (LOSS) | | TOTAL FROM
INVESTMENT
OPERATIONS | | DIVIDENDS
TO
SHAREHOLDERS | | DISTRIBUTIONS
TO
SHAREHOLDERS | | TOTAL
DIVIDENDS
AND
DISTRIBUTIONS | |
INCOME PLUS
CLASS X SHARES | | | |
| 2007^ | | $ | 10.51 | | | $ | 0.53 | | | $ | 0.08 | | | $ | 0.61 | | | $ | (0.56 | ) | | | — | | | $ | (0.56 | ) | |
| 2008^ | | | 10.56 | | | | 0.53 | | | | (1.46 | ) | | | (0.93 | ) | | | (0.18 | ) | | | — | | | | (0.18 | ) | |
| 2009^ | | | 9.45 | | | | 0.57 | | | | 1.50 | | | | 2.07 | | | | (0.53 | ) | | | — | | | | (0.53 | ) | |
| 2010^ | | | 10.99 | | | | 0.58 | | | | 0.39 | | | | 0.97 | | | | (0.70 | ) | | | — | | | | (0.70 | ) | |
| 2011 | | | 11.26 | | | | 0.57 | | | | (0.02 | ) | | | 0.55 | | | | (0.68 | ) | | | — | | | | (0.68 | ) | |
| 2012^^ | | | 11.13 | | | | 0.26 | | | | 0.47 | | | | 0.73 | | | | (0.68 | ) | | | — | | | | (0.68 | ) | |
| CLASS Y SHARES | | | |
| 2007^ | | | 10.49 | | | | 0.50 | | | | 0.08 | | | | 0.58 | | | | (0.53 | ) | | | — | | | | (0.53 | ) | |
| 2008^ | | | 10.54 | | | | 0.51 | | | | (1.45 | ) | | | (0.94 | ) | | | (0.18 | ) | | | — | | | | (0.18 | ) | |
| 2009^ | | | 9.42 | | | | 0.55 | | | | 1.49 | | | | 2.04 | | | | (0.51 | ) | | | — | | | | (0.51 | ) | |
| 2010^ | | | 10.95 | | | | 0.55 | | | | 0.39 | | | | 0.94 | | | | (0.67 | ) | | | — | | | | (0.67 | ) | |
| 2011 | | | 11.22 | | | | 0.54 | | | | (0.02 | ) | | | 0.52 | | | | (0.65 | ) | | | — | | | | (0.65 | ) | |
| 2012^^ | | | 11.09 | | | | 0.24 | | | | 0.47 | | | | 0.71 | | | | (0.65 | ) | | | — | | | | (0.65 | ) | |
GLOBAL INFRASTRUCTURE
CLASS X SHARES | | | |
| 2007^ | | | 19.44 | | | | 0.39 | | | | 3.38 | | | | 3.77 | | | | (0.39 | ) | | $ | (2.16 | ) | | | (2.55 | ) | |
| 2008^ | | | 20.66 | | | | 0.40 | | | | (6.21 | ) | | | (5.81 | ) | | | (0.11 | ) | | | (3.44 | ) | | | (3.55 | ) | |
| 2009^ | | | 11.30 | | | | 0.31 | | | | 1.16 | | | | 1.47 | | | | (0.38 | ) | | | (3.71 | ) | | | (4.09 | ) | |
| 2010^ | | | 8.68 | | | | 0.21 | | | | 0.18 | | | | 0.39 | | | | (0.25 | ) | | | (0.69 | ) | | | (0.94 | ) | |
| 2011 | | | 8.13 | | | | 0.21 | | | | 1.07 | | | | 1.28 | | | | (0.23 | ) | | | (0.46 | ) | | | (0.69 | ) | |
| 2012^^ | | | 8.72 | | | | 0.14 | | | | 0.48 | | | | 0.62 | | | | (0.23 | ) | | | (0.82 | ) | | | (1.05 | ) | |
| CLASS Y SHARES | | | |
| 2007^ | | | 19.43 | | | | 0.34 | | | | 3.38 | | | | 3.72 | | | | (0.34 | ) | | | (2.16 | ) | | | (2.50 | ) | |
| 2008^ | | | 20.65 | | | | 0.35 | | | | (6.20 | ) | | | (5.85 | ) | | | (0.09 | ) | | | (3.44 | ) | | | (3.53 | ) | |
| 2009^ | | | 11.27 | | | | 0.28 | | | | 1.15 | | | | 1.43 | | | | (0.35 | ) | | | (3.71 | ) | | | (4.06 | ) | |
| 2010^ | | | 8.64 | | | | 0.19 | | | | 0.19 | | | | 0.38 | | | | (0.23 | ) | | | (0.69 | ) | | | (0.92 | ) | |
| 2011 | | | 8.10 | | | | 0.19 | | | | 1.06 | | | | 1.25 | | | | (0.20 | ) | | | (0.46 | ) | | | (0.66 | ) | |
| 2012^^ | | | 8.69 | | | | 0.13 | | | | 0.47 | | | | 0.60 | | | | (0.20 | ) | | | (0.82 | ) | | | (1.02 | ) | |
See Notes to Financial Statements
112
| | | | | | | | | RATIO TO AVERAGE
NET ASSETS(c) | | | | | |
FOR THE YEAR
ENDED
DECEMBER 31 | | NET ASSET
VALUE
END OF
PERIOD | | TOTAL
RETURN(b) | | NET ASSETS
END OF
PERIOD
(000'S) | | EXPENSES | | NET
INVESTMENT
INCOME | | REBATE FROM
MORGAN STANLEY
AFFILIATE | | PORTFOLIO
TURNOVER
RATE | |
INCOME PLUS
CLASS X SHARES | |
| 2007^ | | $ | 10.56 | | | | 5.99 | % | | $ | 155,879 | | | | 0.55 | % | | | 5.02 | % | | | — | | | | 125 | % | |
| 2008^ | | | 9.45 | | | | (8.92 | ) | | | 109,833 | | | | 0.55 | (i) | | | 5.34 | (i) | | | 0.00 | %(h) | | | 55 | | |
| 2009^ | | | 10.99 | | | | 22.57 | | | | 114,488 | | | | 0.56 | (i) | | | 5.64 | (i) | | | 0.00 | (h) | | | 75 | | |
| 2010^ | | | 11.26 | | | | 9.28 | | | | 106,363 | | | | 0.59 | (i) | | | 5.23 | (i) | | | 0.00 | (h) | | | 53 | | |
| 2011 | | | 11.13 | | | | 5.01 | | | | 90,876 | | | | 0.59 | (i) | | | 5.01 | (i) | | | 0.00 | (h) | | | 43 | | |
| 2012^^ | | | 11.18 | | | | 6.56 | (l) | | | 88,523 | | | | 0.58 | (i)(m) | | | 4.48 | (i)(m) | | | 0.00 | (h)(m) | | | 35 | (l) | |
| CLASS Y SHARES | |
| 2007^ | | | 10.54 | | | | 5.73 | | | | 196,774 | | | | 0.80 | | | | 4.77 | | | | — | | | | 125 | | |
| 2008^ | | | 9.42 | | | | (9.11 | ) | | | 135,850 | | | | 0.80 | (i) | | | 5.09 | (i) | | | 0.00 | (h) | | | 55 | | |
| 2009^ | | | 10.95 | | | | 22.29 | | | | 148,108 | | | | 0.81 | (i) | | | 5.39 | (i) | | | 0.00 | (h) | | | 75 | | |
| 2010^ | | | 11.22 | | | | 9.01 | | | | 124,322 | | | | 0.84 | (i) | | | 4.98 | (i) | | | 0.00 | (h) | | | 53 | | |
| 2011 | | | 11.09 | | | | 4.71 | | | | 102,948 | | | | 0.84 | (i) | | | 4.76 | (i) | | | 0.00 | (h) | | | 43 | | |
| 2012^^ | | | 11.15 | | | | 6.38 | (l) | | | 102,198 | | | | 0.83 | (i)(m) | | | 4.23 | (i)(m) | | | 0.00 | (h)(m) | | | 35 | (l) | |
GLOBAL INFRASTRUCTURE
CLASS X SHARES | |
| 2007^ | | | 20.66 | | | | 20.34 | | | | 133,507 | | | | 0.70 | | | | 1.90 | | | | — | | | | 8 | | |
| 2008^ | | | 11.30 | | | | (33.27 | ) | | | 70,951 | | | | 0.74 | (i) | | | 2.46 | (i) | | | 0.00 | (h) | | | 76 | | |
| 2009^ | | | 8.68 | | | | 19.26 | | | | 68,748 | | | | 0.96 | (i) | | | 3.37 | (i) | | | 0.00 | (h) | | | 280 | | |
| 2010^ | | | 8.13 | | | | 6.93 | | | | 61,408 | | | | 0.87 | (i) | | | 2.71 | (i) | | | 0.00 | (h) | | | 148 | | |
| 2011 | | | 8.72 | | | | 16.07 | | | | 58,998 | | | | 0.86 | (i) | | | 2.48 | (i) | | | 0.00 | (h) | | | 36 | | |
| 2012^^ | | | 8.29 | | | | 7.06 | (l) | | | 57,680 | | | | 0.83 | (i)(m) | | | 3.09 | (i)(m) | | | 0.00 | (h)(m) | | | 16 | (l) | |
| CLASS Y SHARES | |
| 2007^ | | | 20.65 | | | | 20.04 | | | | 31,780 | | | | 0.95 | | | | 1.65 | | | | — | | | | 8 | | |
| 2008^ | | | 11.27 | | | | (33.45 | ) | | | 16,545 | | | | 0.99 | (i) | | | 2.21 | (i) | | | 0.00 | (h) | | | 76 | | |
| 2009^ | | | 8.64 | | | | 18.83 | | | | 17,818 | | | | 1.21 | (i) | | | 3.12 | (i) | | | 0.00 | (h) | | | 280 | | |
| 2010^ | | | 8.10 | | | | 6.74 | | | | 15,789 | | | | 1.12 | (i) | | | 2.46 | (i) | | | 0.00 | (h) | | | 148 | | |
| 2011 | | | 8.69 | | | | 15.82 | | | | 14,472 | | | | 1.11 | (i) | | | 2.23 | (i) | | | 0.00 | (h) | | | 36 | | |
| 2012^^ | | | 8.27 | | | | 6.93 | (l) | | | 14,664 | | | | 1.08 | (i)(m) | | | 2.84 | (i)(m) | | | 0.00 | (h)(m) | | | 16 | (l) | |
113
Morgan Stanley Variable Investment Series
Financial Highlights continued
| | | | | | | | | | | | | | | | |
FOR THE YEAR
ENDED
DECEMBER 31 | | NET ASSET
VALUE
BEGINNING
OF PERIOD | | NET
INVESTMENT
INCOME
(LOSS)(a) | | NET REALIZED
AND
UNREALIZED
GAIN (LOSS) | | TOTAL FROM
INVESTMENT
OPERATIONS | | DIVIDENDS
TO
SHAREHOLDERS | | DISTRIBUTIONS
TO
SHAREHOLDERS | | TOTAL
DIVIDENDS
AND
DISTRIBUTIONS | |
EUROPEAN EQUITY
CLASS X SHARES | | | |
| 2007^ | | $ | 25.34 | | | $ | 0.47 | | | $ | 3.48 | | | $ | 3.95 | | | $ | (0.46 | ) | | | — | | | $ | (0.46 | ) | |
| 2008^ | | | 28.83 | | | | 0.63 | | | | (11.31 | ) | | | (10.68 | ) | | | (0.61 | ) | | $ | (4.22 | ) | | | (4.83 | ) | |
| 2009^ | | | 13.32 | | | | 0.36 | | | | 3.01 | | | | 3.37 | | | | (0.56 | ) | | | (0.71 | ) | | | (1.27 | ) | |
| 2010^ | | | 15.42 | | | | 0.26 | | | | 0.76 | | | | 1.02 | | | | (0.39 | ) | | | — | | | | (0.39 | ) | |
| 2011 | | | 16.05 | | | | 0.41 | | | | (1.90 | ) | | | (1.49 | ) | | | (0.37 | ) | | | — | | | | (0.37 | ) | |
| 2012^^ | | | 14.19 | | | | 0.45 | | | | (0.02 | ) | | | 0.43 | | | | (0.43 | ) | | | — | | | | (0.43 | ) | |
| CLASS Y SHARES | | | |
| 2007^ | | | 25.19 | | | | 0.40 | | | | 3.46 | | | | 3.86 | | | | (0.40 | ) | | | — | | | | (0.40 | ) | |
| 2008^ | | | 28.65 | | | | 0.58 | | | | (11.25 | ) | | | (10.67 | ) | | | (0.52 | ) | | | (4.22 | ) | | | (4.74 | ) | |
| 2009^ | | | 13.24 | | | | 0.32 | | | | 3.00 | | | | 3.32 | | | | (0.50 | ) | | | (0.71 | ) | | | (1.21 | ) | |
| 2010^ | | | 15.35 | | | | 0.22 | | | | 0.76 | | | | 0.98 | | | | (0.35 | ) | | | — | | | | (0.35 | ) | |
| 2011 | | | 15.98 | | | | 0.37 | | | | (1.90 | ) | | | (1.53 | ) | | | (0.33 | ) | | | — | | | | (0.33 | ) | |
| 2012^^ | | | 14.12 | | | | 0.43 | | | | (0.01 | ) | | | 0.42 | | | | (0.38 | ) | | | — | | | | (0.38 | ) | |
MULTI CAP GROWTH
CLASS X SHARES | | | |
| 2007^ | | | 29.63 | | | | 0.21 | | | | 5.57 | | | | 5.78 | | | | (0.18 | ) | | | — | | | | (0.18 | ) | |
| 2008^ | | | 35.23 | | | | 0.03 | | | | (16.78 | ) | | | (16.75 | ) | | | (0.07 | ) | | | — | | | | (0.07 | ) | |
| 2009^ | | | 18.41 | | | | 0.11 | | | | 12.99 | | | | 13.10 | | | | (0.09 | ) | | | — | | | | (0.09 | ) | |
| 2010^ | | | 31.42 | | | | 0.06 | | | | 8.65 | | | | 8.71 | | | | (0.06 | ) | | | — | | | | (0.06 | ) | |
| 2011 | | | 40.07 | | | | 0.01 | | | | (2.70 | ) | | | (2.69 | ) | | | (0.07 | ) | | | — | | | | (0.07 | ) | |
| 2012^^ | | | 37.31 | | | | 0.16 | | | | 3.52 | | | | 3.68 | | | | — | | | | (0.90 | ) | | | (0.90 | ) | |
| CLASS Y SHARES | | | |
| 2007^ | | | 29.43 | | | | 0.13 | | | | 5.54 | | | | 5.67 | | | | (0.04 | ) | | | — | | | | (0.04 | ) | |
| 2008^ | | | 35.06 | | | | (0.05 | ) | | | (16.67 | ) | | | (16.72 | ) | | | (0.05 | ) | | | — | | | | (0.05 | ) | |
| 2009^ | | | 18.29 | | | | 0.05 | | | | 12.90 | | | | 12.95 | | | | (0.03 | ) | | | — | | | | (0.03 | ) | |
| 2010^ | | | 31.21 | | | | (0.02 | ) | | | 8.58 | | | | 8.56 | | | | — | | | | — | | | | — | | |
| 2011 | | | 39.77 | | | | (0.09 | ) | | | (2.68 | ) | | | (2.77 | ) | | | — | | | | — | | | | — | | |
| 2012^^ | | | 37.00 | | | | 0.11 | | | | 3.49 | | | | 3.60 | | | | — | | | | (0.90 | ) | | | (0.90 | ) | |
See Notes to Financial Statements
114
| | | | | | | | | RATIO TO AVERAGE
NET ASSETS(c) | | | | | |
FOR THE YEAR
ENDED
DECEMBER 31 | | NET ASSET
VALUE
END OF
PERIOD | | TOTAL
RETURN(b) | | NET ASSETS
END OF
PERIOD
(000'S) | | EXPENSES | | NET
INVESTMENT
INCOME (LOSS) | | REBATE FROM
MORGAN STANLEY
AFFILIATE | | PORTFOLIO
TURNOVER
RATE | |
EUROPEAN EQUITY
CLASS X SHARES | |
| 2007^ | | $ | 28.83 | | | | 15.59 | % | | $ | 127,071 | | | | 1.00 | %(j) | | | 1.73 | %(j) | | | — | | | | 41 | % | |
| 2008^ | | | 13.32 | | | | (42.70 | ) | | | 57,734 | | | | 1.00 | (i)(j) | | | 3.01 | (i)(j) | | | 0.00 | %(h) | | | 15 | | |
| 2009^ | | | 15.42 | | | | 27.73 | | | | 61,197 | | | | 1.00 | (i)(j) | | | 2.67 | (i)(j) | | | 0.00 | (h) | | | 26 | | |
| 2010^ | | | 16.05 | | | | 7.23 | (k) | | | 54,824 | | | | 1.00 | (i)(j) | | | 1.81 | (i)(j) | | | 0.00 | (h) | | | 22 | | |
| 2011 | | | 14.19 | | | | (9.64 | ) | | | 41,181 | | | | 1.00 | (i)(j) | | | 2.56 | (i)(j) | | | 0.00 | (h) | | | 11 | | |
| 2012^^ | | | 14.19 | | | | 3.04 | (l) | | | 38,276 | | | | 1.00 | (i)(j)(m) | | | 6.10 | (i)(j)(m) | | | 0.00 | (h)(m) | | | 3 | (l) | |
| CLASS Y SHARES | |
| 2007^ | | | 28.65 | | | | 15.34 | | | | 40,721 | | | | 1.25 | (j) | | | 1.48 | (j) | | | — | | | | 41 | | |
| 2008^ | | | 13.24 | | | | (42.84 | ) | | | 17,845 | | | | 1.25 | (i)(j) | | | 2.76 | (i)(j) | | | 0.00 | (h) | | | 15 | | |
| 2009^ | | | 15.35 | | | | 27.41 | | | | 19,323 | | | | 1.25 | (i)(j) | | | 2.42 | (i)(j) | | | 0.00 | (h) | | | 26 | | |
| 2010^ | | | 15.98 | | | | 6.96 | (k) | | | 17,821 | | | | 1.25 | (i)(j) | | | 1.56 | (i)(j) | | | 0.00 | (h) | | | 22 | | |
| 2011 | | | 14.12 | | | | (9.85 | ) | | | 11,668 | | | | 1.25 | (i)(j) | | | 2.31 | (i)(j) | | | 0.00 | (h) | | | 11 | | |
| 2012^^ | | | 14.16 | | | | 2.90 | (l) | | | 11,170 | | | | 1.25 | (i)(j)(m) | | | 5.85 | (i)(j)(m) | | | 0.00 | (h)(m) | | | 3 | (l) | |
MULTI CAP GROWTH
CLASS X SHARES | |
| 2007^ | | | 35.23 | | | | 19.54 | | | | 331,243 | | | | 0.54 | | | | 0.66 | | | | — | | | | 55 | | |
| 2008^ | | | 18.41 | | | | (47.62 | ) | | | 140,041 | | | | 0.55 | (i) | | | 0.08 | (i) | | | 0.01 | | | | 33 | | |
| 2009^ | | | 31.42 | | | | 71.32 | | | | 202,279 | | | | 0.55 | (i) | | | 0.44 | (i) | | | 0.00 | (h) | | | 23 | | |
| 2010^ | | | 40.07 | | | | 27.76 | | | | 220,553 | | | | 0.58 | (i) | | | 0.19 | (i) | | | 0.00 | (h) | | | 29 | | |
| 2011 | | | 37.31 | | | | (6.74 | ) | | | 173,284 | | | | 0.56 | (i) | | | 0.03 | (i) | | | 0.00 | (h) | | | 24 | | |
| 2012^^ | | | 40.09 | | | | 9.85 | (l) | | | 174,814 | | | | 0.57 | (i)(m) | | | 0.76 | (i)(m) | | | 0.00 | (h)(m) | | | 29 | (l) | |
| CLASS Y SHARES | |
| 2007^ | | | 35.06 | | | | 19.24 | | | | 107,710 | | | | 0.79 | | | | 0.41 | | | | — | | | | 55 | | |
| 2008^ | | | 18.29 | | | | (47.75 | ) | | | 45,671 | | | | 0.80 | (i) | | | (0.17 | )(i) | | | 0.01 | | | | 33 | | |
| 2009^ | | | 31.21 | | | | 70.85 | | | | 64,122 | | | | 0.80 | (i) | | | 0.19 | (i) | | | 0.00 | (h) | | | 23 | | |
| 2010^ | | | 39.77 | | | | 27.43 | | | | 67,303 | | | | 0.83 | (i) | | | (0.06 | )(i) | | | 0.00 | (h) | | | 29 | | |
| 2011 | | | 37.00 | | | | (6.97 | ) | | | 49,678 | | | | 0.81 | (i) | | | (0.22 | )(i) | | | 0.00 | (h) | | | 24 | | |
| 2012^^ | | | 39.70 | | | | 9.72 | (l) | | | 48,340 | | | | 0.82 | (i)(m) | | | 0.51 | (i)(m) | | | 0.00 | (h)(m) | | | 29 | (l) | |
115
Morgan Stanley Variable Investment Series
Financial Highlights continued
| | | | | | | | | | | | | | | | |
FOR THE YEAR
ENDED
DECEMBER 31 | | NET ASSET
VALUE
BEGINNING
OF PERIOD | | NET
INVESTMENT
INCOME
(LOSS)(a) | | NET REALIZED
AND
UNREALIZED
GAIN (LOSS) | | TOTAL FROM
INVESTMENT
OPERATIONS | | DIVIDENDS
TO
SHAREHOLDERS | | DISTRIBUTIONS
TO
SHAREHOLDERS | | TOTAL
DIVIDENDS
AND
DISTRIBUTIONS | |
AGGRESSIVE EQUITY
CLASS X SHARES | | | |
| 2007^ | | $ | 14.85 | | | $ | 0.06 | | | $ | 2.86 | | | $ | 2.92 | | | | — | | | | — | | | | — | | |
| 2008^ | | | 17.77 | | | | (0.04 | ) | | | (8.63 | ) | | | (8.67 | ) | | $ | (0.03 | ) | | | — | | | $ | (0.03 | ) | |
| 2009^ | | | 9.07 | | | | 0.00 | | | | 6.30 | | | | 6.30 | | | | — | | | | — | | | | — | | |
| 2010^ | | | 15.37 | | | | (0.05 | ) | | | 4.05 | | | | 4.00 | | | | — | | | | — | | | | — | | |
| 2011 | | | 19.37 | | | | (0.09 | ) | | | (1.33 | ) | | | (1.42 | ) | | | — | | | | — | | | | — | | |
| 2012^^ | | | 17.95 | | | | 0.03 | | | | 1.73 | | | | 1.76 | | | | — | | | $ | (1.51 | ) | | | (1.51 | ) | |
| CLASS Y SHARES | | | |
| 2007^ | | | 14.65 | | | | 0.02 | | | | 2.82 | | | | 2.84 | | | | — | | | | — | | | | — | | |
| 2008^ | | | 17.49 | | | | (0.08 | ) | | | (8.49 | ) | | | (8.57 | ) | | | — | | | | — | | | | — | | |
| 2009^ | | | 8.92 | | | | (0.03 | ) | | | 6.19 | | | | 6.16 | | | | — | | | | — | | | | — | | |
| 2010^ | | | 15.08 | | | | (0.09 | ) | | | 3.97 | | | | 3.88 | | | | — | | | | — | | | | — | | |
| 2011 | | | 18.96 | | | | (0.14 | ) | | | (1.30 | ) | | | (1.44 | ) | | | — | | | | — | | | | — | | |
| 2012^^ | | | 17.52 | | | | 0.00 | (e) | | | 1.70 | | | | 1.70 | | | | — | | | | (1.51 | ) | | | (1.51 | ) | |
STRATEGIST
CLASS X SHARES | | | |
| 2007^ | | | 16.53 | | | | 0.46 | | | | 0.92 | | | | 1.38 | | | | (0.46 | ) | | | (1.90 | ) | | | (2.36 | ) | |
| 2008^ | | | 15.55 | | | | 0.30 | | | | (3.76 | ) | | | (3.46 | ) | | | (0.10 | ) | | | (1.39 | ) | | | (1.49 | ) | |
| 2009^ | | | 10.60 | | | | 0.16 | | | | 1.90 | | | | 2.06 | | | | (0.26 | ) | | | — | | | | (0.26 | ) | |
| 2010^ | | | 12.40 | | | | 0.24 | | | | 0.59 | | | | 0.83 | | | | (0.20 | ) | | | (0.07 | ) | | | (0.27 | ) | |
| 2011 | | | 12.96 | | | | 0.18 | | | | (1.06 | ) | | | (0.88 | ) | | | (0.27 | ) | | | (1.41 | ) | | | (1.68 | ) | |
| 2012^^ | | | 10.40 | | | | 0.10 | | | | 0.36 | | | | 0.46 | | | | (0.22 | ) | | | (0.16 | ) | | | (0.38 | ) | |
| CLASS Y SHARES | | | |
| 2007^ | | | 16.51 | | | | 0.42 | | | | 0.92 | | | | 1.34 | | | | (0.42 | ) | | | (1.90 | ) | | | (2.32 | ) | |
| 2008^ | | | 15.53 | | | | 0.27 | | | | (3.76 | ) | | | (3.49 | ) | | | (0.09 | ) | | | (1.39 | ) | | | (1.48 | ) | |
| 2009^ | | | 10.56 | | | | 0.13 | | | | 1.89 | | | | 2.02 | | | | (0.23 | ) | | | — | | | | (0.23 | ) | |
| 2010^ | | | 12.35 | | | | 0.21 | | | | 0.58 | | | | 0.79 | | | | (0.17 | ) | | | (0.07 | ) | | | (0.24 | ) | |
| 2011 | | | 12.90 | | | | 0.15 | | | | (1.05 | ) | | | (0.90 | ) | | | (0.23 | ) | | | (1.41 | ) | | | (1.64 | ) | |
| 2012^^ | | | 10.36 | | | | 0.09 | | | | 0.35 | | | | 0.44 | | | | (0.18 | ) | | | (0.16 | ) | | | (0.34 | ) | |
See Notes to Financial Statements
116
| | | | | | | | | RATIO TO AVERAGE
NET ASSETS(c) | | | | | |
FOR THE YEAR
ENDED
DECEMBER 31 | | NET ASSET
VALUE
END OF
PERIOD | | TOTAL
RETURN(b) | | NET ASSETS
END OF
PERIOD
(000'S) | | EXPENSES | | NET
INVESTMENT
INCOME (LOSS) | | REBATE FROM
MORGAN STANLEY
AFFILIATE | | PORTFOLIO
TURNOVER
RATE | |
AGGRESSIVE EQUITY
CLASS X SHARES | |
| 2007^ | | $ | 17.77 | | | | 19.66 | % | | $ | 26,035 | | | | 0.87 | % | | | 0.34 | % | | | — | | | | 56 | % | |
| 2008^ | | | 9.07 | | | | (48.86 | ) | | | 10,289 | | | | 0.90 | (i) | | | (0.29 | )(i) | | | 0.00 | %(h) | | | 33 | | |
| 2009^ | | | 15.37 | | | | 69.46 | | | | 14,898 | | | | 1.01 | (i) | | | (0.02 | )(i) | | | 0.01 | | | | 23 | | |
| 2010^ | | | 19.37 | | | | 26.02 | | | | 15,413 | | | | 1.09 | (i) | | | (0.32 | )(i) | | | 0.00 | (h) | | | 27 | | |
| 2011 | | | 17.95 | | | | (7.33 | ) | | | 12,078 | | | | 1.06 | (i) | | | (0.47 | )(i) | | | 0.00 | (h) | | | 28 | | |
| 2012^^ | | | 18.20 | | | | 9.80 | (l) | | | 12,254 | | | | 1.08 | (i)(m) | | | 0.26 | (i)(m) | | | 0.01 | (m) | | | 30 | (l) | |
| CLASS Y SHARES | |
| 2007^ | | | 17.49 | | | | 19.39 | | | | 29,837 | | | | 1.12 | | | | 0.09 | | | | — | | | | 56 | | |
| 2008^ | | | 8.92 | | | | (49.00 | ) | | | 12,272 | | | | 1.15 | (i) | | | (0.54 | )(i) | | | 0.00 | (h) | | | 33 | | |
| 2009^ | | | 15.08 | | | | 69.06 | | | | 17,541 | | | | 1.26 | (i) | | | (0.27 | )(i) | | | 0.01 | | | | 23 | | |
| 2010^ | | | 18.96 | | | | 25.73 | | | | 18,777 | | | | 1.34 | (i) | | | (0.57 | )(i) | | | 0.00 | (h) | | | 27 | | |
| 2011 | | | 17.52 | | | | (7.59 | ) | | | 15,821 | | | | 1.31 | (i) | | | (0.72 | )(i) | | | 0.00 | (h) | | | 28 | | |
| 2012^^ | | | 17.71 | | | | 9.70 | (l) | | | 16,012 | | | | 1.33 | (i)(m) | | | 0.01 | (i)(m) | | | 0.01 | (m) | | | 30 | (l) | |
STRATEGIST
CLASS X SHARES | |
| 2007^ | | | 15.55 | | | | 8.63 | | | | 217,265 | | | | 0.54 | | | | 2.84 | | | | — | | | | 34 | | |
| 2008^ | | | 10.60 | | | | (23.98 | ) | | | 134,668 | | | | 0.54 | (i) | | | 2.28 | (i) | | | 0.02 | | | | 52 | | |
| 2009^ | | | 12.40 | | | | 19.74 | | | | 137,731 | | | | 0.55 | (i) | | | 1.41 | (i) | | | 0.03 | | | | 96 | | |
| 2010^ | | | 12.96 | | | | 6.81 | | | | 128,254 | | | | 0.59 | (i) | | | 1.89 | (i) | | | 0.02 | | | | 119 | | |
| 2011 | | | 10.40 | | | | (7.96 | ) | | | 97,169 | | | | 0.59 | (i) | | | 1.52 | (i) | | | 0.02 | | | | 121 | | |
| 2012^^ | | | 10.48 | | | | 4.41 | (l) | | | 92,405 | | | | 0.60 | (i)(m) | | | 1.95 | (i)(m) | | | 0.03 | (m) | | | 33 | (l) | |
| CLASS Y SHARES | |
| 2007^ | | | 15.53 | | | | 8.37 | | | | 88,651 | | | | 0.79 | | | | 2.59 | | | | — | | | | 34 | | |
| 2008^ | | | 10.56 | | | | (24.20 | ) | | | 53,046 | | | | 0.79 | (i) | | | 2.03 | (i) | | | 0.02 | | | | 52 | | |
| 2009^ | | | 12.35 | | | | 19.44 | | | | 59,737 | | | | 0.80 | (i) | | | 1.16 | (i) | | | 0.03 | | | | 96 | | |
| 2010^ | | | 12.90 | | | | 6.50 | | | | 56,361 | | | | 0.84 | (i) | | | 1.64 | (i) | | | 0.02 | | | | 119 | | |
| 2011 | | | 10.36 | | | | (8.13 | ) | | | 39,844 | | | | 0.84 | (i) | | | 1.27 | (i) | | | 0.02 | | | | 121 | | |
| 2012^^ | | | 10.46 | | | | 4.28 | (l) | | | 36,898 | | | | 0.85 | (i)(m) | | | 1.70 | (i)(m) | | | 0.03 | (m) | | | 33 | (l) | |
117
Morgan Stanley Variable Investment Series
Financial Highlights continued
^^ For the six months ended June 30, 2012 (unaudited).
^ Beginning with the year ended December 31, 2011, the Fund was audited by Ernst & Young LLP. The previous years were audited by another independent registered public accounting firm.
(a) The per share amounts were computed using an average number of shares outstanding during the period.
(b) Calculated based on the net asset value as of the last business day of the period. Performance shown does not reflect fees and expenses imposed by your insurance company. If performance information included the effect of these additional charges, the total returns would be lower.
(c) Reflects overall Portfolio ratios for investment income and non-class specific expenses.
(d) The Adviser fully reimbursed the Portfolio for losses incurred resulting from the disposal of an investment. Without this reimbursement, the total return was 4.79% and 4.52% for Class X and Y, respectively.
(e) Amount is less than $0.001.
(f) Reflects fees paid in connection with the U.S. Treasury Guarantee Program for Money Market Funds. This fee had an effect of 0.04% for the year ended 2009.
(g) If the Portfolio had borne all of its expenses that were reimbursed or waived by the Distributor, Adviser, and Administrator, the annualized expense and net investment loss ratios, would have been as follows:
| PERIOD ENDED | | EXPENSE
RATIO | | NET INVESTMENT LOSS
RATIO | |
| June 30, 2012 | | | | | | | | | |
| Class X | | | 0.63 | % | | | (0.36 | )% | |
| Class Y | | | 0.88 | | | | (0.61 | ) | |
| December 31, 2011 | | | | | | | | | |
| Class X | | | 0.60 | | | | (0.37 | ) | |
| Class Y | | | 0.85 | | | | (0.62 | ) | |
| December 31, 2010 | | | | | | | | | |
| Class X | | | 0.62 | | | | (0.33 | ) | |
| Class Y | | | 0.87 | | | | (0.58 | ) | |
| December 31, 2009 | | | | | | | | | |
| Class X | | | 0.59 | | | | (0.16 | ) | |
| Class Y | | | 0.84 | | | | (0.42 | ) | |
(h) Amount is less than 0.005%.
(i) The ratios reflect the rebate of certain Portfolio expenses in connection with investments in a Morgan Stanley affiliate during the period. The effect of the rebate on the ratios is disclosed in the above table as "Rebate from Morgan Stanley affiliate."
See Notes to Financial Statements
118
(j) If the Portfolio had borne all of its expenses that were reimbursed or waived by the Adviser and Administrator, the annualized expense and net investment income ratios, would have been as follows:
| PERIOD ENDED | | EXPENSE
RATIO | | NET INVESTMENT INCOME
RATIO | |
| June 30, 2012 | | | | | | | | | |
| Class X | | | 1.20 | % | | | 5.90 | % | |
| Class Y | | | 1.45 | | | | 5.65 | | |
| December 31, 2011 | | | | | | | | | |
| Class X | | | 1.17 | | | | 2.39 | | |
| Class Y | | | 1.42 | | | | 2.14 | | |
| December 31, 2010 | | | | | | | | | |
| Class X | | | 1.16 | | | | 1.65 | | |
| Class Y | | | 1.41 | | | | 1.40 | | |
| December 31, 2009 | | | | | | | | | |
| Class X | | | 1.12 | | | | 2.55 | | |
| Class Y | | | 1.37 | | | | 2.30 | | |
| December 31, 2008 | | | | | | | | | |
| Class X | | | 1.08 | | | | 2.93 | | |
| Class Y | | | 1.33 | | | | 2.68 | | |
| December 31, 2007 | | | | | | | | | |
| Class X | | | 1.04 | | | | 1.69 | | |
| Class Y | | | 1.29 | | | | 1.44 | | |
(k) During the year ended December 31, 2010, the Portfolio received a regulatory settlement from an unaffiliated third party which had an impact of approximately 0.14% and 0.14% for Class X and Y, respectively, on the total return. This was a one-time settlement, and as a result, the impact on the NAV and consequently the performance will not likely be repeated in the future. Had this settlement not occurred, the total return for Class X and Y shares would have been approximately 7.09% and 6.82%, respectively.
(l) Not annualized.
(m) Annualized.
119
(This page has been intentionally left blank.)
| Trustees | |
| Frank L. Bowman | | Joseph J. Kearns | |
|
| Michael Bozic | | Michael F. Klein | |
|
| Kathleen A. Dennis | | Michael E. Nugent | |
|
| James F. Higgins | | W. Allen Reed | |
|
| Dr. Manuel H. Johnson | | Fergus Reid | |
|
| Officers | |
Michael E. Nugent
Chairperson of the Board | |
|
Arthur Lev
President and Principal Executive Officer | |
|
Mary Ann Picciotto
Chief Compliance Officer | |
|
Stefanie V. Chang Yu
Vice President | |
|
Francis J. Smith
Treasurer and Principal Financial Officer | |
|
Mary E. Mullin
Secretary | |
|
| Transfer Agent | | Custodian | |
Morgan Stanley Services Company Inc.
P.O. Box 219886
Kansas City, Missouri 64121 | | State Street Bank and Trust Company
One Lincoln Street
Boston, Massachusetts 02111 | |
|
| Independent Registered Public Accounting Firm | | Legal Counsel | |
Ernst & Young LLP
200 Clarendon Street
Boston, Massachusetts 02116 | | Dechert LLP
1095 Avenue of the Americas
New York, New York 10036 | |
|
| Counsel to the Independent Trustees | | Adviser | |
Kramer Levin Naftalis & Frankel LLP
1177 Avenue of the Americas
New York, New York 10036 | | Morgan Stanley Investment Management Inc.
522 Fifth Avenue
New York, New York 10036 | |
|
| Sub-Advisers | |
Morgan Stanley Investment Management Limited
25 Cabot Square, Canary Wharf
London, E14 4QA, England | |
|
Morgan Stanley Investment Management Company
23 Church Street
16-01 Capital Square 049481 Singapore | |
|
This report is submitted for the general information of shareholders of the Fund. For more detailed information about the Fund, its fees and expenses and other pertinent information, please read its Prospectus. The Fund's Statement of Additional Information contains additional information about the Fund, including its trustees. It is available without charge, by calling (800) 869-NEWS.
This report is not authorized for distribution to prospective investors in the Fund unless preceded or accompanied by an effective Prospectus. Read the Prospectus carefully before investing.
Morgan Stanley Distribution, Inc., member FINRA.
#40113A
VARINSAN
IU12-01691P-Y06/12
THE UNIVERSAL INSTITUTIONAL FUNDS, INC.
GLOBAL TACTICAL ASSET ALLOCATION PORTFOLIO
PART B
STATEMENT OF ADDITIONAL INFORMATION
This Statement of Additional Information (the “SAI”) relates to the shares of common stock (“shares”) of the Global Tactical Asset Allocation Portfolio (the “Acquiring Fund”), a portfolio of The Universal Institutional Funds, Inc. (the “Company”), to be issued pursuant to an Agreement and Plan of Reorganization, dated September 28, 2012, between the Company, on behalf of the Acquiring Fund, and Morgan Stanley Variable Investment Series (the “Trust”), on behalf of the Strategist Portfolio (the “Acquired Fund”), in connection with the acquisition by the Acquiring Fund of substantially all of the assets and the liabilities of the Acquired Fund (the “Reorganization”).
This SAI does not constitute a prospectus. This SAI does not include all information that a shareholder should consider before voting on the proposals contained in the Proxy Statement and Prospectus, and, therefore, should be read in conjunction with the related Proxy Statement and Prospectus, dated January 18, 2013. A copy of the Proxy Statement and Prospectus may be obtained upon request and without charge by calling (800) 548-7786 (toll-free). Please retain this document for future reference.
The date of this SAI is January 18, 2013.
Table of Contents
| Page |
| |
Introduction | B-1 |
| |
Additional Information About the Acquiring Fund | B-1 |
| |
Financial Statements | B-3 |
INTRODUCTION
This SAI is intended to supplement the information provided in the Proxy Statement and Prospectus dated January 18, 2013 (the “Proxy Statement and Prospectus”). The Proxy Statement and Prospectus has been sent to the Acquired Fund’s Shareholders in connection with the solicitation of proxies by the Board of Trustees of the Acquired Fund to be voted at the Special Meeting of Shareholders of the Acquired Fund to be held on February 21, 2013. The Company’s Statement of Additional Information, dated April 30, 2012, as it may be amended and supplemented from time to time (the “Company’s Statement of Additional Information”) and the Trust’s Statement of Additional Information, dated April 30, 2012, as it may be amended from time to time, accompany, and are incorporated by reference in, this SAI.
ADDITIONAL INFORMATION ABOUT THE ACQUIRING FUND
Fund History
For additional information about the Acquiring Fund’s history, see “General Information—Fund History” in the Company’s Statement of Additional Information relating to the Acquiring Fund.
Investment Objectives and Policies
For additional information about the Acquiring Fund’s investment objectives and policies, see “Investment Policies and Strategies” in the Company’s Statement of Additional Information relating to the Acquiring Fund.
B-1
Fund Holdings
For additional information about the Acquiring Fund’s policies and procedures with respect to the disclosure of its portfolio securities to any person, see “Disclosure of Portfolio Holdings” in the Company’s Statement of Additional Information relating to the Acquiring Fund.
Management
For additional information about the Board of Directors, officers and management personnel of the Acquiring Fund, see “Management of the Fund” and “Investment Advisory, Sub-Advisory, Distribution and Administrative Agreements” in the Company’s Statement of Additional Information relating to the Acquiring Fund.
Investment Advisory and Other Services
For additional information about the Acquiring Fund’s investment adviser, the Acquiring Fund’s independent registered public accounting firm and other services provided to the Acquiring Fund, see “Investment Advisory, Sub-Advisory, Distribution and Administrative Agreements” in the Company’s Statement of Additional Information relating to the Acquiring Fund.
Codes of Ethics
For additional information about the Codes of Ethics adopted by the Acquiring Fund, the Acquiring Fund’s investment adviser and the Acquiring Fund’s distributor, see “Management of the Fund—G. Code of Ethics” in the Company’s Statement of Additional Information relating to the Acquiring Fund.
Proxy Voting Policies
For additional information about the voting of proxies held by the Acquiring Fund, see “Investment Advisory, Sub-Advisory, Distribution and Administrative Agreements—Proxy Voting Policies and Procedures and Proxy Voting Record” in the Company’s Statement of Additional Information relating to the Acquiring Fund.
Fund Managers
For additional information about the portfolio managers primarily responsible for the day-to-day management of the Acquiring Fund, their compensation structure and their holdings in the Acquiring Fund, see “Portfolio Managers” in the Company’s Statement of Additional Information relating to the Acquiring Fund.
Fund Transactions and Brokerage
For additional information about brokerage allocation practices, see “Portfolio Transactions” in the Company’s Statement of Additional Information relating to the Acquiring Fund.
Description of Fund Shares
For additional information about the voting rights and other characteristics of the shares of the Acquiring Fund, see “General Information—Description of Shares and Voting Rights” in the Company’s Statement of Additional Information relating to the Acquiring Fund.
Purchase, Redemption and Pricing of Shares
For additional information about the purchase and redemption of the Acquiring Fund’s shares and the determination of net asset value (“NAV”), see “Purchase of Shares” and “Redemption of Shares” in the Company’s Statement of Additional Information relating to the Acquiring Fund.
Dividends, Distributions and Tax Status
For additional information about the Acquiring Fund’s policies regarding dividends and distributions and tax matters affecting the Acquiring Fund and its shareholders, see “General Information—Dividends and Capital Gains Distributions” and “Taxes” in the Company’s Statement of Additional Information relating to the Acquiring Fund.
Distribution of Shares
For additional information about the Acquiring Fund’s distributor and the distribution agreement between the Acquiring Fund and its distributor, see “Investment Advisory, Sub-Advisory, Distribution and Administrative Agreements” in the Company’s Statement of Additional Information relating to the Acquiring Fund.
B-2
Performance Data
The following table shows the average annual total return numbers for the one-year, five-year and ten-year periods ended December 31, 2012 and since inception through December 31, 2012 for the Class I shares of the Acquiring Fund.
Name of Portfolio | | Inception
Date | | Average Annual
Total Return for
One Year Ended
12/31/12 | | Average Annual
Total Return for
Five Years Ended
12/31/12 | | Average Annual
Total Return for
Ten Years Ended
12/31/12 | | Average Annual
Total Return
Since Inception
through 12/31/12 | |
Global Tactical Asset Allocation | | 01/02/97 | | 13.84 | % | -3.19 | % | 7.32 | % | 3.54 | % |
The following table shows the average annual total return numbers for the one-year and five-year periods ended December 31, 2012 and since inception through December 31, 2012 for the Class II shares of the Acquiring Fund.
Name of Portfolio | | Inception Date | | Average Annual Total
Return for One Year
Ended 12/31/12 | | Average Annual Total
Return for Five Years
Ended 12/31/12 | | Average Annual Total
Return Since Inception
through 12/31/12 | |
Global Tactical Asset Allocation | | 03/15/11 | | 13.70 | % | N/A | | 4.99 | % |
N/A = Not Applicable.
The current yield for the Acquiring Fund’s Class I shares for the 30-day period ended December 31, 2012 was as follows:
Portfolio Name | | 30-Day Yield | |
Global Tactical Asset Allocation | | 1.36 | % |
The current yield for the Acquiring Fund’s Class II shares for the 30-day period ended December 31, 2012 was as follows:
Portfolio Name | | 30-Day Yield | |
Global Tactical Asset Allocation | | 1.24 | % |
FINANCIAL STATEMENTS
1. The most recent audited financial statements of the Acquiring Fund and Acquired Fund, each for the fiscal year ended December 31, 2011, have been audited by Ernst & Young LLP, an independent registered public accounting firm (except that the financial information for the Acquired Fund for the fiscal years ended prior to 2011 was audited by the Acquired Fund’s previous independent registered public accounting firm). Ernst & Young LLP’s reports, along with the Funds’ audited financial statements, are included in each respective Fund’s Annual Report to Shareholders for the most recently completed fiscal year. Each Fund’s most recent financial statements (unaudited) are set forth in each respective Fund’s Semi-Annual Report for the six-month period ended June 30, 2012. A copy of each report accompanies and is incorporated by reference in this SAI. In addition, copies of the Company’s Annual Report for the fiscal year ended December 31, 2011 and Semi-Annual Report for the six-month period ended June 30, 2012 accompany the Proxy Statement and Prospectus.
2. Shown below are Financial Statements for the Acquired Fund and Acquiring Fund and Pro Forma Financial Statements for the Combined Fund as of June 30, 2012, as though the reorganization occurred as of that date. These financial statements set forth the unaudited pro forma condensed Statement of Assets and Liabilities as of June 30, 2012, the unaudited pro forma condensed Statement of Operations for the twelve-month period ended June 30, 2012 and the unaudited pro forma condensed Portfolio of Investments as of June 30, 2012. These statements have been derived from the books and records utilized in calculating the daily net asset value for each Fund.
B-3
Portfolio of Investments
As of June 30, 2012 (unaudited)
| | Morgan Stanley
Variable Investment
Series - Strategist | | The Univerisal
Institutional Funds,
Inc. - Global Tactical
Asset Allocation | | Pro-Forma | | Morgan Stanley
Variable Investment
Series - Strategist | | The Univerisal
Institutional Funds,
Inc. - Global Tactical
Asset Allocation | | Adjustments | | The Univerisal
Institutional Funds,
Inc. - Global Tactical
Asset Allocation
Pro-Forma | |
| | Face Amount (000) | | Face Amount (000) | | Face Amount (000) | | Value (000) | | Value (000) | | Value (000) | | Value (000) | |
Fixed Income Securities (29.4%) | | | | | | | | | | | | | | | |
Agency Fixed Rate Mortgages (1.6%) | | | | | | | | | | | | | | | |
United States (1.6%) | | | | | | | | | | | | | | | |
Federal Home Loan Mortgage Corporation,
Gold Pools: | | | | | | | | | | | | | | | |
4.00%, 12/1/41 | | $ | — | | $ | 126 | | $ | 126 | | $ | — | | $ | 134 | | $ | — | | $ | 134 | |
6.50%, 5/1/29 - 12/1/31 | | 2 | | — | | 2 | | 3 | | — | | — | | 3 | |
July TBA: | | | | | | | | | | | | | | | |
3.00%, 7/25/27 (a) | | — | | 75 | | 75 | | — | | 78 | | — | | 78 | |
3.50%, 7/25/42 (a) | | — | | 275 | | 275 | | — | | 289 | | — | | 289 | |
Federal National Mortgage Association,
Conventional Pools: | | | | | | | | | | | | | | | |
4.00%, 11/1/41 - 12/1/41 | | — | | 640 | | 640 | | — | | 682 | | — | | 682 | |
5.00%, 1/1/41 - 3/1/41 | | — | | 332 | | 332 | | — | | 365 | | — | | 365 | |
5.50%, 2/1/38 | | — | | 152 | | 152 | | — | | 167 | | — | | 167 | |
6.00%, 1/1/38 | | — | | 221 | | 221 | | — | | 244 | | — | | 244 | |
6.50%, 11/1/29 - 8/1/38 | | 1 | | 51 | | 52 | | 1 | | 57 | | — | | 58 | |
July TBA: | | | | | | | | | | | | | | | |
5.00%, 7/25/42 (a) | | — | | 200 | | 200 | | — | | 216 | | — | | 216 | |
Government National Mortgage Association,
July TBA: | | | | | | | | | | | | | | | |
4.00%, 7/25/42 (a) | | — | | 590 | | 590 | | — | | 644 | | — | | 644 | |
Various Pool
4.50%, 8/15/39 | | — | | 94 | | 94 | | — | | 103 | | — | | 103 | |
Total Agency Fixed Rate Mortgages (Cost $2,946) | | | | | | | | 4 | | 2,979 | | — | | 2,983 | |
| | | | | | | | | | | | | | | |
Asset-Backed Securities (0.8%) | | | | | | | | | | | | | | | |
United States (0.8%) | | | | | | | | | | | | | | | |
Ally Auto Receivables Trust,
0.97%, 8/17/15 | | — | | 125 | | 125 | | — | | 125 | | — | | 125 | |
Ally Master Owner Trust,
1.11%, 1/15/16 (b) | | 100 | | — | | 100 | | 101 | | — | | — | | 101 | |
Brazos Student Finance Corp.,
1.37%, 6/25/35 (b) | | 29 | | — | | 29 | | 29 | | — | | — | | 29 | |
CNH Equipment Trust,
1.20%, 5/16/16 | | — | | 125 | | 125 | | — | | 126 | | — | | 126 | |
CVS Pass-Through Trust,
6.04%, 12/10/28 | | 141 | | 64 | | 205 | | 160 | | 73 | | — | | 233 | |
GE Dealer Floorplan Master Note Trust,
1.79%, 10/20/14 (b)(c) | | 100 | | — | | 100 | | 100 | | — | | — | | 100 | |
Louisiana Public Facilities Authority,
1.37%, 4/26/27 (b) | | 175 | | — | | 175 | | 176 | | — | | — | | 176 | |
Nissan Auto Receivables Owner Trust,
1.18%, 2/16/15 | | 150 | | — | | 150 | | 151 | | — | | — | | 151 | |
North Carolina State Education Assistance Authority,
1.27%, 7/25/25 (b) | | — | | 100 | | 100 | | — | | 100 | | — | | 100 | |
PFS Financing Corp.,
1.74%, 10/17/16 (b) | | 180 | | — | | 180 | | 181 | | — | | — | | 181 | |
World Omni Automobile Lease Securitization Trust,
1.49%, 10/15/14 | | 125 | | — | | 125 | | 126 | | — | | — | | 126 | |
Total Asset-Backed Securities (Cost $1,412) | | | | | | | | 1,024 | | 424 | | — | | 1,448 | |
| | | | | | | | | | | | | | | | | | | | | | |
Limited Access
1
Commercial Mortgage Backed Securities (0.1%) | | | | | | | | | | | | | | | |
United States (0.1%) | | | | | | | | | | | | | | | |
JP Morgan Chase Commercial Mortgage Securities Corp.,
4.17%, 8/15/46 | | — | | 105 | | 105 | | — | | 115 | | — | | 115 | |
UBS-Barclays Commercial Mortgage Trust,
3.53%, 5/10/63 | | — | | 40 | | 40 | | — | | 41 | | — | | 41 | |
Total Commercial Mortgage Backed Securities (Cost $147) | | | | | | | | — | | 156 | | — | | 156 | |
| | | | | | | | | | | | | | | |
Corporate Bonds (8.1%) | | | | | | | | | | | | | | | |
Australia (0.5%) | | | | | | | | | | | | | | | |
Australia & New Zealand Banking Group Ltd.,
4.88%, 1/12/21 (c) | | 100 | | — | | 100 | | 110 | | — | | — | | 110 | |
5.13%, 9/10/19 | | EUR | — | | EUR | 100 | | EUR | 100 | | — | | 134 | | — | | 134 | |
Commonwealth Bank of Australia,
5.00%, 10/15/19 (c)(d) | | $ | — | | $ | 125 | | $ | 125 | | — | | 138 | | — | | 138 | |
Dexus Diversified Trust/Dexus Office Trust,
5.60%, 3/15/21 (c) | | 60 | | — | | 60 | | 62 | | — | | — | | 62 | |
Macquarie Bank Ltd.,
6.63%, 4/7/21 (c) | | 50 | | 35 | | 85 | | 50 | | 35 | | — | | 85 | |
Macquarie Group Ltd.,
6.00%, 1/14/20 (c)(d) | | 55 | | 50 | | 105 | | 55 | | 50 | | — | | 105 | |
National Australia Bank Ltd.,
3.50%, 1/23/15 | | EUR | — | | EUR | 50 | | EUR | 50 | | — | | 66 | | — | | 66 | |
Wesfarmers Ltd.,
2.98%, 5/18/16 (c) | | $ | 45 | | $ | 30 | | $ | 75 | | 46 | | 31 | | — | | 77 | |
Westpac Banking Corp.,
3.00%, 12/9/15 | | — | | 50 | | 50 | | — | | 52 | | — | | 52 | |
Woolworths Ltd.,
4.00%, 9/22/20 (c) | | 65 | | — | | 65 | | 70 | | — | | — | | 70 | |
| | | | | | | | 393 | | 506 | | — | | 899 | |
Belgium (0.1%) | | | | | | | | | | | | | | | |
Anheuser-Busch InBev Worldwide, Inc.,
5.00%, 4/15/20 | | — | | 50 | | 50 | | — | | 59 | | — | | 59 | |
Delhaize Group SA,
5.70%, 10/1/40 | | 96 | | — | | 96 | | 81 | | — | | — | | 81 | |
| | | | | | | | 81 | | 59 | | — | | 140 | |
Brazil (0.1%) | | | | | | | | | | | | | | — | |
Petrobras International Finance Co.,
5.75%, 1/20/20 | | — | | 50 | | 50 | | — | | 55 | | — | | 55 | |
Vale Overseas Ltd.,
5.63%, 9/15/19 | | 60 | | 85 | | 145 | | 67 | | 94 | | — | | 161 | |
| | | | | | | | 67 | | 149 | | — | | 216 | |
Canada (0.1%) | | | | | | | | | | | | | | | |
Barrick Gold Corp.,
3.85%, 4/1/22 | | 60 | | — | | 60 | | 62 | | — | | — | | 62 | |
Brookfield Asset Management, Inc.,
5.80%, 4/25/17 | | 45 | | — | | 45 | | 49 | | — | | — | | 49 | |
Kinross Gold Corp.,
5.13%, 9/1/21 | | 75 | | — | | 75 | | 76 | | — | | — | | 76 | |
| | | | — | | | | 187 | | — | | — | | 187 | |
| | | | | | | | | | | | | | | | | | | | | |
2
France (0.3%) | | | | | | | | | | | | | | | |
Banque Federative du Credit Mutuel SA,
3.00%, 10/29/15 | | EUR | — | | EUR | 50 | | EUR | 50 | | — | | 65 | | — | | 65 | |
BNP Paribas SA,
5.00%, 1/15/21 (d) | | $ | 75 | | $ | 60 | | $ | 135 | | 77 | | 61 | | — | | 138 | |
Credit Agricole SA,
3.90%, 4/19/21 | | EUR | — | | EUR | 50 | | EUR | 50 | | — | | 51 | | — | | 51 | |
5.88%, 6/11/19 | | — | | 50 | | 50 | | — | | 61 | | — | | 61 | |
LVMH Moet Hennessy Louis Vuitton SA,
1.63%, 6/29/17 (c) | | $ | 75 | | $ | — | | $ | 75 | | 75 | | — | | — | | 75 | |
Sanofi,
4.00%, 3/29/21 | | 75 | | — | | 75 | | 84 | | — | | — | | 84 | |
Veolia Environnement SA,
6.75%, 4/24/19 | | EUR | — | | EUR | 50 | | EUR | 50 | | — | | 77 | | — | | 77 | |
Vivendi SA,
6.63%, 4/4/18 (c) | | $ | 45 | | $ | — | | $ | 45 | | 50 | | — | | — | | 50 | |
| | | | — | | | | 286 | | 315 | | — | | 601 | |
Germany (0.2%) | | | | — | | | | | | | | | | | |
Daimler Finance North America LLC,
8.50%, 1/18/31 | | — | | 75 | | 75 | | — | | 115 | | — | | 115 | |
Deutsche Bank AG,
5.00%, 6/24/20 | | EUR | — | | EUR | 50 | | EUR | 50 | | — | | 64 | | — | | 64 | |
Deutsche Telekom International Finance BV,
8.75%, 6/15/30 | | $ | 45 | | $ | — | | $ | 45 | | 63 | | — | | — | | 63 | |
Volkswagen International Finance N.V.,
2.38%, 3/22/17 (c) | | 100 | | — | | 100 | | 102 | | — | | — | | 102 | |
| | | | — | | | | 165 | | 179 | | — | | 344 | |
Israel (0.1%) | | | | — | | | | | | | | | | | |
Teva Pharmaceutical Finance IV BV,
3.65%, 11/10/21 (d) | | 120 | | 50 | | 170 | | 126 | | 53 | | — | | 179 | |
| | | | | | | | | | | | | | | |
Italy (0.2%) | | | | | | | | | | | | | | | |
Enel Finance International N.V.,
5.13%, 10/7/19 (c)(d) | | — | | 100 | | 100 | | — | | 96 | | — | | 96 | |
Finmeccanica Finance SA,
8.13%, 12/3/13 | | EUR | — | | EUR | 100 | | EUR | 100 | | — | | 134 | | — | | 134 | |
Telecom Italia Finance SA,
7.75%, 1/24/33 | | — | | 30 | | 30 | | — | | 38 | | — | | 38 | |
UniCredit SpA,
4.38%, 2/10/14 | | — | | 50 | | 50 | | — | | 63 | | — | | 63 | |
5.75%, 9/26/17 | | — | | 50 | | 50 | | — | | 59 | | — | | 59 | |
| | | | | | | | — | | 390 | | — | | 390 | |
Luxembourg (0.2%) | | | | | | | | | | | | | | | |
ArcelorMittal,
7.00%, 10/15/39 | | $ | 15 | | $ | — | | $ | 15 | | 15 | | — | | — | | 15 | |
9.38%, 6/3/16 | | EUR | — | | EUR | 50 | | EUR | 50 | | — | | 74 | | — | | 74 | |
9.85%, 6/1/19 | | $ | 50 | | $ | 75 | | $ | 125 | | 60 | | 89 | | — | | 149 | |
ITW Finance Europe SA,
5.25%, 10/1/14 | | EUR | — | | EUR | 50 | | EUR | 50 | | — | | 69 | | — | | 69 | |
| | | | | | | | 75 | | 232 | | — | | 307 | |
Mexico (0.1%) | | | | | | | | | | | | | | | |
Grupo Bimbo SAB de CV,
4.88%, 6/30/20 (c) | | $ | 100 | | $ | — | | $ | 100 | | 111 | | — | | — | | 111 | |
| | | | | | | | | | | | | | | | | | | | | |
3
Netherlands (0.2%) | | | | | | | | | | | | | | | |
ABN Amro Bank N.V.,
3.63%, 10/6/17 | | EUR | — | | EUR | 50 | | EUR | 50 | | — | | 66 | | — | | 66 | |
Aegon N.V.,
4.63%, 12/1/15 (d) | | $ | 75 | | $ | 50 | | $ | 125 | | 80 | | 53 | | — | | 133 | |
Cooperatieve Centrale Raiffeisen-Boerenleenbank BA,
3.75%, 11/9/20 | | EUR | — | | EUR | 50 | | EUR | 50 | | — | | 61 | | — | | 61 | |
3.88%, 2/8/22 | | $ | 50 | | $ | — | | $ | 50 | | 51 | | — | | — | | 51 | |
| | | | | | | | 131 | | 180 | | — | | 311 | |
Spain (0.1%) | | | | | | | | | | | | | | | |
Gas Natural Capital Markets SA,
4.13%, 1/26/18 | | EUR | — | | EUR | 50 | | EUR | 50 | | — | | 55 | | — | | 55 | |
Santander Holdings USA, Inc.,
4.63%, 4/19/16 | | $ | 25 | | $ | 20 | | $ | 45 | | 24 | | 19 | | — | | 43 | |
| | | | | | | | 24 | | 74 | | — | | 98 | |
Sweden (0.0%) | | | | | | | | | | | | | | | |
Nordea Bank AB,
4.00%, 3/29/21 | | EUR | — | | EUR | 70 | | EUR | 70 | | — | | 83 | | — | | 83 | |
| | | | | | | | | | | | | | | |
Switzerland (0.3%) | | | | | | | | | | | | | | | |
ABB Finance USA, Inc.,
2.88%, 5/8/22 | | $ | 50 | | $ | — | | $ | 50 | | 51 | | — | | — | | 51 | |
ABB Treasury Center USA, Inc.,
2.50%, 6/15/16 (c)(d) | | 100 | | 25 | | 125 | | 104 | | 26 | | — | | 130 | |
Credit Suisse AG,
4.75%, 8/5/19 | | EUR | — | | EUR | 75 | | EUR | 75 | | — | | 106 | | — | | 106 | |
Credit Suisse,
5.40%, 1/14/20 | | $ | 240 | | $ | — | | $ | 240 | | 250 | | — | | — | | 250 | |
6.00%, 2/15/18 | | 25 | | — | | 25 | | 27 | | — | | — | | 27 | |
Holcim US Finance Sarl & Cie SCS,
6.00%, 12/30/19 (c) | | 30 | | — | | 30 | | 32 | | — | | — | | 32 | |
Syngenta Finance,
3.13%, 3/28/22 | | 75 | | — | | 75 | | 76 | | — | | — | | 76 | |
| | | | | | | | 540 | | 132 | | — | | 672 | |
| | | | | | | | | | | | | | | | | | | | | |
4
United Kingdom (1.0%) | | | | | | | | | | | | | | | |
Abbey National Treasury Services PLC,
3.63%, 10/14/16 | | EUR | — | | EUR | 100 | | EUR | 100 | | — | | 134 | | — | | 134 | |
3.88%, 11/10/14 (c) | | $ | 100 | | $ | — | | $ | 100 | | 99 | | — | | — | | 99 | |
BAA Funding Ltd.,
4.60%, 2/15/18 | | EUR | — | | EUR | 50 | | EUR | 50 | | — | | 68 | | — | | 68 | |
4.88%, 7/15/21 (c) | | $ | 100 | | $ | — | | $ | 100 | | 106 | | — | | — | | 106 | |
Barclays Bank PLC,
6.00%, 1/23/18 - 1/14/21 | | EUR | — | | EUR | 100 | | EUR | 100 | | — | | 121 | | — | | 121 | |
BAT International Finance PLC,
5.38%, 6/29/17 | | — | | 50 | | 50 | | — | | 73 | | — | | 73 | |
BP Capital Markets PLC,
3.25%, 5/6/22 | | $ | 75 | | $ | — | | $ | 75 | | 78 | | — | | — | | 78 | |
Diageo Capital PLC,
1.50%, 5/11/17 (d) | | — | | 25 | | 25 | | — | | 25 | | — | | 25 | |
Diageo Investment Corp.,
2.88%, 5/11/22 (d) | | — | | 25 | | 25 | | — | | 26 | | — | | 26 | |
HSBC Holdings PLC,
4.00%, 3/30/22 | | 70 | | — | | 70 | | 73 | | — | | — | | 73 | |
4.50%, 4/30/14 | | EUR | — | | EUR | 50 | | EUR | 50 | | — | | 67 | | — | | 67 | |
6.25%, 3/19/18 | | — | | 50 | | 50 | | — | | 69 | | — | | 69 | |
Imperial Tobacco Finance PLC,
8.38%, 2/17/16 | | — | | 50 | | 50 | | — | | 76 | | — | | 76 | |
Lloyds TSB Bank PLC,
6.38%, 6/17/16 - 1/21/21 | | $ | 70 | | $ | 120 | | $ | 190 | | 79 | | 154 | | — | | 233 | |
National Grid Gas PLC,
5.13%, 5/14/13 | | EUR | — | | EUR | 50 | | EUR | 50 | | — | | 66 | | — | | 66 | |
Nationwide Building Society,
6.25%, 2/25/20 (c) | | $ | 170 | | $ | 100 | | $ | 270 | | 184 | | 108 | | — | | 292 | |
Royal Bank of Scotland PLC (The),
4.88%, 1/20/17 | | EUR | — | | EUR | 75 | | EUR | 75 | | — | | 101 | | — | | 101 | |
Standard Chartered PLC,
5.75%, 4/30/14 | | — | | 50 | | 50 | | — | | 68 | | — | | 68 | |
Standard Chartered Bank,
6.40%, 9/26/17 (c) | | $ | 100 | | $ | — | | $ | 100 | | 112 | | — | | — | | 112 | |
WPP Finance UK,
8.00%, 9/15/14 | | 100 | | — | | 100 | | 113 | | — | | — | | 113 | |
| | | | | | | | 844 | | 1,156 | | — | | 2,000 | |
| | | | | | | | | | | | | | | | | | | | | |
5
United States (4.6%) | | | | | | | | | | | | | | | |
Agilent Technologies, Inc.,
5.50%, 9/14/15 | | — | | 30 | | 30 | | — | | 34 | | — | | 34 | |
Air Products & Chemicals, Inc.,
2.00%, 8/2/16 | | 105 | | — | | 105 | | 108 | | — | | — | | 108 | |
Altria Group, Inc.,
4.13%, 9/11/15 | | 50 | | — | | 50 | | 54 | | — | | — | | 54 | |
9.25%, 8/6/19 | | 60 | | 75 | | 135 | | 83 | | 104 | | — | | 187 | |
AT&T, Inc.,
5.35%, 9/1/40 | | 25 | | — | | 25 | | 29 | | — | | — | | 29 | |
6.30%, 1/15/38 | | 85 | | 40 | | 125 | | 106 | | 50 | | — | | 156 | |
Bank of America Corp.,
5.65%, 5/1/18 | | — | | 115 | | 115 | | — | | 123 | | — | | 123 | |
Barrick North America Finance LLC,
4.40%, 5/30/21 | | 55 | | — | | 55 | | 59 | | — | | — | | 59 | |
Bemis Co., Inc.,
4.50%, 10/15/21 | | 65 | | — | | 65 | | 70 | | — | | — | | 70 | |
Berkshire Hathaway, Inc.,
3.75%, 8/15/21 | | 130 | | — | | 130 | | 139 | | — | | — | | 139 | |
Best Buy Co., Inc.,
3.75%, 3/15/16 | | 90 | | — | | 90 | | 88 | | — | | — | | 88 | |
BNP Paribas/BNP Paribas,
US Medium-Term Note Program LLC
5.13%, 1/15/15 (c) | | — | | 25 | | 25 | | — | | 25 | | — | | 25 | |
Boston Properties LP,
3.85%, 2/1/23 | | 75 | | — | | 75 | | 76 | | — | | — | | 76 | |
Boston Scientific Corp.,
6.00%, 1/15/20 | | 60 | | 45 | | 105 | | 72 | | 54 | | — | | 126 | |
CBS Corp.,
5.75%, 4/15/20 (d) | | — | | 35 | | 35 | | — | | 41 | | — | | 41 | |
CenturyLink, Inc.,
6.45%, 6/15/21 | | 45 | | 15 | | 60 | | 47 | | 16 | | — | | 63 | |
Cigna Corp.,
2.75%, 11/15/16 | | 90 | | — | | 90 | | 93 | | — | | — | | 93 | |
Citigroup, Inc.,
5.88%, 5/29/37 (n) | | 35 | | — | | 35 | | 38 | | — | | — | | 38 | |
6.13%, 5/15/18 (n) | | 70 | | — | | 70 | | 78 | | — | | — | | 78 | |
8.50%, 5/22/19 (n) | | — | | 150 | | 150 | | — | | 185 | | — | | 185 | |
CNA Financial Corp.,
5.75%, 8/15/21 | | 95 | | — | | 95 | | 105 | | — | | — | | 105 | |
Comcast Corp.,
5.15%, 3/1/20 | | 50 | | — | | 50 | | 58 | | — | | — | | 58 | |
5.70%, 5/15/18 | | 45 | | — | | 45 | | 53 | | — | | — | | 53 | |
6.40%, 5/15/38 | | 25 | | — | | 25 | | 31 | | — | | — | | 31 | |
Cooper US, Inc.,
5.25%, 11/15/12 | | 90 | | — | | 90 | | 91 | | — | | — | | 91 | |
Coventry Health Care, Inc.,
5.45%, 6/15/21 | | 65 | | — | | 65 | | 73 | | — | | — | | 73 | |
Covidien International Finance SA,
3.20%, 6/15/22 | | 25 | | — | | 25 | | 26 | | — | | — | | 26 | |
CRH America, Inc.,
6.00%, 9/30/16 | | 75 | | 55 | | 130 | | 82 | | 60 | | — | | 142 | |
DirecTV Holdings LLC/DirecTV Financing Co., Inc.,
4.60%, 2/15/21 | | — | | 60 | | 60 | | — | | 64 | | — | | 64 | |
Eastman Chemical Co.,
3.60%, 8/15/22 | | 50 | | — | | 50 | | 51 | | — | | — | | 51 | |
Enterprise Products Operating LLC,
5.25%, 1/31/20 | | 35 | | — | | 35 | | 40 | | — | | — | | 40 | |
Series N 6.50%, 1/31/19 | | 90 | | — | | 90 | | 109 | | — | | — | | 109 | |
EQT Corp.,
4.88%, 11/15/21 | | 40 | | — | | 40 | | 41 | | — | | — | | 41 | |
ERP Operating LP,
4.63%, 12/15/21 | | 25 | | — | | 25 | | 27 | | — | | — | | 27 | |
6
Farmers Exchange Capital,
7.05%, 7/15/28 (c) | | 140 | | — | | 140 | | 161 | | — | | — | | 161 | |
Fiserv, Inc.,
3.13%, 6/15/16 | | 50 | | — | | 50 | | 52 | | — | | — | | 52 | |
Ford Motor Credit Co., LLC,
4.21%, 4/15/16 (c) | | 200 | | — | | 200 | | 208 | | — | | — | | 208 | |
Gap, Inc. (The),
5.95%, 4/12/21 | | 65 | | — | | 65 | | 67 | | — | | — | | 67 | |
General Electric Capital Corp.,
5.30%, 2/11/21 | | 60 | | 40 | | 100 | | 67 | | 45 | | — | | 112 | |
Series G 6.00%, 8/7/19 | | 145 | | 125 | | 270 | | 170 | | 146 | | — | | 316 | |
Genworth Financial, Inc.,
7.20%, 2/15/21 | | 75 | | 50 | | 125 | | 72 | | 48 | | — | | 120 | |
Georgia-Pacific LLC,
8.88%, 5/15/31 | | 50 | | 40 | | 90 | | 71 | | 57 | | — | | 128 | |
Gilead Sciences, Inc.,
4.50%, 4/1/21 | | 65 | | 50 | | 115 | | 72 | | 56 | | — | | 128 | |
5.65%, 12/1/41 | | 5 | | — | | 5 | | 6 | | — | | — | | 6 | |
Goldman Sachs Group, Inc. (The),
4.38%, 3/16/17 | | EUR | — | | EUR | 50 | | EUR | 50 | | — | | 65 | | — | | 65 | |
6.75%, 10/1/37 | | $ | — | | $ | 100 | | $ | 100 | | — | | 98 | | — | | 98 | |
Harley-Davidson Funding Corp.,
6.80%, 6/15/18 (c) | | 45 | | — | | 45 | | 54 | | — | | — | | 54 | |
Hartford Financial Services Group, Inc.,
5.50%, 3/30/20 | | 60 | | — | | 60 | | 63 | | — | | — | | 63 | |
Hewlett-Packard Co.,
4.65%, 12/9/21 | | 125 | | 60 | | 185 | | 131 | | 63 | | — | | 194 | |
Home Depot, Inc.,
5.40%, 9/15/40 | | — | | 100 | | 100 | | — | | 123 | | — | | 123 | |
Ingram Micro, Inc.,
5.25%, 9/1/17 | | 20 | | — | | 20 | | 21 | | — | | — | | 21 | |
International Business Machines Corp.,
7.63%, 10/15/18 | | 100 | | — | | 100 | | 133 | | — | | — | | 133 | |
JPMorgan Chase & Co.,
4.25%, 10/15/20 | | 60 | | 100 | | 160 | | 63 | | 105 | | — | | 168 | |
4.63%, 5/10/21 | | 140 | | — | | 140 | | 150 | | — | | — | | 150 | |
Kinder Morgan Energy Partners LP,
5.95%, 2/15/18 | | 50 | | — | | 50 | | 58 | | — | | — | | 58 | |
Kraft Foods, Inc.,
6.50%, 2/9/40 | | 50 | | — | | 50 | | 64 | | — | | — | | 64 | |
L-3 Communications Corp.,
4.75%, 7/15/20 | | — | | 80 | | 80 | | — | | 85 | | — | | 85 | |
4.95%, 2/15/21 | | 75 | | — | | 75 | | 81 | | — | | — | | 81 | |
Life Technologies Corp.,
6.00%, 3/1/20 | | 70 | | — | | 70 | | 82 | | — | | — | | 82 | |
Macy’s Retail Holdings, Inc.,
3.88%, 1/15/22 | | 30 | | — | | 30 | | 32 | | — | | — | | 32 | |
Marathon Petroleum Corp.,
5.13%, 3/1/21 | | 35 | | 35 | | 70 | | 39 | | 39 | | — | | 78 | |
Merrill Lynch & Co., Inc.,
6.75%, 5/21/13 | | EUR | — | | EUR | 50 | | EUR | 50 | | — | | 66 | | — | | 66 | |
MTN 6.88%, 4/25/18 | | $ | 225 | | $ | — | | $ | 225 | | 252 | | — | | — | | 252 | |
MetLife, Inc.,
7.72%, 2/15/19 | | 35 | | — | | 35 | | 44 | | — | | — | | 44 | |
Motorola Solutions, Inc.,
3.75%, 5/15/22 | | 50 | | — | | 50 | | 49 | | — | | — | | 49 | |
Murphy Oil Corp.,
4.00%, 6/1/22 | | 50 | | — | | 50 | | 51 | | — | | — | | 51 | |
Nationwide Financial Services,
5.38%, 3/25/21 (c) | | 50 | | — | | 50 | | 52 | | — | | — | | 52 | |
NBC Universal Media LLC,
4.38%, 4/1/21 | | 40 | | 90 | | 130 | | 44 | | 99 | | — | | 143 | |
5.95%, 4/1/41 | | 25 | | — | | 25 | | 30 | | — | | — | | 30 | |
| | | | | | | | | | | | | | | | | | | | | |
7
Norfolk Southern Corp.,
4.84%, 10/1/41 | | 10 | | — | | 10 | | 11 | | — | | — | | 11 | |
7.25%, 2/15/31 | | 50 | | — | | 50 | | 69 | | — | | — | | 69 | |
Ohio Power Co.,
Series M
5.38%, 10/1/21 | | 75 | | — | | 75 | | 89 | | — | | — | | 89 | |
Omnicom Group, Inc.,
3.63%, 5/1/22 | | 55 | | 50 | | 105 | | 56 | | 51 | | — | | 107 | |
Oncor Electric Delivery Co., LLC,
6.80%, 9/1/18 | | 80 | | — | | 80 | | 96 | | — | | — | | 96 | |
Pacific LifeCorp,
6.00%, 2/10/20 (c) | | 75 | | — | | 75 | | 82 | | — | | — | | 82 | |
Phillips 66,
4.30%, 4/1/22 (c) | | 50 | | — | | 50 | | 53 | | — | | — | | 53 | |
Plains All American Pipeline LP/PAA Finance Corp.,
6.70%, 5/15/36 | | 60 | | — | | 60 | | 70 | | — | | — | | 70 | |
8.75%, 5/1/19 | | 60 | | 50 | | 110 | | 79 | | 66 | | — | | 145 | |
Platinum Underwriters Finance, Inc.,
Series B
7.50%, 6/1/17 | | 60 | | — | | 60 | | 66 | | — | | — | | 66 | |
PPL WEM Holdings PLC,
3.90%, 5/1/16 (c) | | 75 | | 60 | | 135 | | 79 | | 63 | | — | | 142 | |
Principal Financial Group, Inc.,
8.88%, 5/15/19 | | 50 | | — | | 50 | | 65 | | — | | — | | 65 | |
Prudential Financial, Inc.,
7.38%, 6/15/19 (d) | | — | | 50 | | 50 | | — | | 61 | | — | | 61 | |
MTN
6.63%, 12/1/37 | | 40 | | — | | 40 | | 45 | | — | | — | | 45 | |
Qwest Corp.,
6.88%, 9/15/33 | | 40 | | — | | 40 | | 40 | | — | | — | | 40 | |
Republic Services, Inc.,
3.55%, 6/1/22 | | 75 | | — | | 75 | | 76 | | — | | — | | 76 | |
SLM Corp.,
6.25%, 1/25/16 | | 70 | | 65 | | 135 | | 74 | | 69 | | — | | 143 | |
Sonoco Products Co.,
5.75%, 11/1/40 | | 70 | | — | | 70 | | 80 | | — | | — | | 80 | |
Spectra Energy Capital LLC,
7.50%, 9/15/38 | | 50 | | — | | 50 | | 66 | | — | | — | | 66 | |
Texas Eastern Transmission LP,
7.00%, 7/15/32 | | 55 | | — | | 55 | | 71 | | — | | — | | 71 | |
Time Warner, Inc.,
7.70%, 5/1/32 | | 25 | | — | | 25 | | 33 | | — | | — | | 33 | |
Union Pacific Corp.,
6.13%, 2/15/20 | | 40 | | — | | 40 | | 49 | | — | | — | | 49 | |
United Technologies Corp.,
4.50%, 6/1/42 | | 45 | | 45 | | 90 | | 50 | | 50 | | — | | 100 | |
UnitedHealth Group, Inc.,
3.38%, 11/15/21 (d) | | — | | 30 | | 30 | | — | | 32 | | — | | 32 | |
4.63%, 11/15/41 | | — | | 30 | | 30 | | — | | 32 | | — | | 32 | |
6.63%, 11/15/37 | | 65 | | — | | 65 | | 87 | | — | | — | | 87 | |
Verisk Analytics, Inc.,
5.80%, 5/1/21 | | 55 | | — | | 55 | | 61 | | — | | — | | 61 | |
Verizon Communications, Inc.,
4.60%, 4/1/21 | | 35 | | — | | 35 | | 40 | | — | | — | | 40 | |
7.35%, 4/1/39 | | — | | 35 | | 35 | | — | | 50 | | — | | 50 | |
8.95%, 3/1/39 | | 55 | | — | | 55 | | 91 | | — | | — | | 91 | |
VF Corp.,
3.50%, 9/1/21 | | 70 | | — | | 70 | | 75 | | — | | — | | 75 | |
Wachovia Corp.,
5.63%, 10/15/16 | | 60 | | — | | 60 | | 68 | | — | | — | | 68 | |
Wal-Mart Stores, Inc.,
5.25%, 9/1/35 | | 40 | | — | | 40 | | 49 | | — | | — | | 49 | |
Waste Management, Inc.,
6.13%, 11/30/39 | | 80 | | — | | 80 | | 99 | | — | | — | | 99 | |
8
Wells Fargo & Co.,
5.63%, 12/11/17 | | 95 | | — | | 95 | | 111 | | — | | — | | 111 | |
Wells Fargo Bank NA,
6.00%, 5/23/13 | | EUR | — | | EUR | 50 | | EUR | 50 | | — | | 66 | | — | | 66 | |
Wells Operating Partnership II LP,
5.88%, 4/1/18 | | $ | 80 | | $ | — | | $ | 80 | | 83 | | — | | — | | 83 | |
Yum! Brands, Inc.,
6.88%, 11/15/37 | | 5 | | — | | 5 | | 7 | | — | | — | | 7 | |
| | | | | | | | 6,536 | | 2,391 | | — | | 8,927 | |
Total Corporate Bonds (Cost $14,675) | | | | | | | | 9,566 | | 5,899 | | — | | 15,465 | |
| | | | | | | | | | | | | | | |
Municipal Bonds (0.3%) | | | | | | | | | | | | | | | |
Chicago, IL, Transit Authority,
6.20%, 12/1/40 | | 75 | | — | | 75 | | 83 | | — | | — | | 83 | |
City of Chicago, IL,
O’Hare International Airport Revenue,
6.40%, 1/1/40 | | 30 | | — | | 30 | | 39 | | — | | — | | 39 | |
City of New York, NY,
Series G-1,
5.97%, 3/1/36 | | 70 | | — | | 70 | | 87 | | — | | — | | 87 | |
Illinois State Toll Highway Authority,
Highway Revenue, Build America Bonds,
6.18%, 1/1/34 | | 85 | | — | | 85 | | 106 | | — | | — | | 106 | |
Municipal Electric Authority of Georgia,
6.66%, 4/1/57 | | 95 | | — | | 95 | | 110 | | — | | — | | 110 | |
New York City, NY,
Transitional Finance Authority Future Tax Secured Revenue,
5.27%, 5/1/27 | 65 | | — | | 65 | | 75 | | — | | — | | 75 | |
State of California,
General Obligation Bonds,
5.95%, 4/1/16 | | 45 | | — | | 45 | | 51 | | — | | — | | 51 | |
6.65%, 3/1/22 | | 30 | | — | | 30 | | 37 | | — | | — | | 37 | |
Total Municipal Bonds (Cost $496) | | | | | | | | 588 | | — | | — | | 588 | |
| | | | | | | | | | | | | | | |
Sovereign (6.2%) | | | | | | | | | | | | | | | |
Australia (0.3%) | | | | | | | | | | | | | | | |
Australia Government Bond,
5.25%, 3/15/19 | | AUD | — | | AUD | 125 | | AUD | 125 | | — | | 147 | | — | | 147 | |
Treasury Corp. of Victoria,
5.75%, 11/15/16 | | — | | 300 | | 300 | | — | | 336 | | — | | 336 | |
| | | | | | | | — | | 483 | | — | | 483 | |
| | | | | | | | | | | | | | | | | | | | | |
9
Brazil (0.2%) | | | | | | | | | | | | | | | |
Banco Nacional de Desenvolvimento, Economico e Social,
5.50%, 7/12/20 | | $ | 100 | | $ | 100 | | $ | 200 | | 114 | | 114 | | — | | 228 | |
Brazilian Government International Bond,
4.88%, 1/22/21 | | 150 | | — | | 150 | | 174 | | — | | — | | 174 | |
| | | | | | | | 288 | | 114 | | — | | 402 | |
Canada (0.5%) | | | | | | | | | | | | | | | |
Canadian Government Bond,
4.25%, 6/1/18 | | CAD | — | | CAD | 670 | | CAD | 670 | | — | | 765 | | — | | 765 | |
Province of Ontario Canada,
4.00%, 12/3/19 | | EUR | — | | EUR | 85 | | EUR | 85 | | — | | 124 | | — | | 124 | |
| | | | | | | | | | | — | | 889 | | — | | 889 | |
Chile (0.1%) | | | | | | | | | | | | | | | | | | |
Chile Government International Bond,
5.50%, 8/5/20 | | CLP | — | | CLP | 130,000 | | CLP | 130,000 | | — | | 278 | | — | | 278 | |
| | | | | | | | | | | | | | | | | | |
Denmark (0.1%) | | | | | | | | | | | | | | | | | | |
Denmark Government Bond,
4.00%, 11/15/19 | | DKK | — | | DKK | 485 | | DKK | 485 | | — | | 100 | | — | | 100 | |
| | | | | | | | | | | | | | | | | | |
France (0.5%) | | | | | | | | | | | | | | | | | | |
France Government Bond OAT,
5.50%, 4/25/29 | | EUR | — | | EUR | 135 | | EUR | 135 | | — | | 218 | | — | | 218 | |
French Treasury Note BTAN,
3.00%, 7/12/14 | | — | | 600 | | 600 | | — | | 798 | | — | | 798 | |
| | | | | | | | — | | 1,016 | | — | | 1,016 | |
Germany (0.8%) | | | | | | | | | | | | | | | |
Bundesrepublik Deutschland,
1.75%, 7/4/22 | | — | | 130 | | 130 | | — | | 167 | | — | | 167 | |
3.25%, 7/4/15 | | — | | 300 | | 300 | | — | | 414 | | — | | 414 | |
4.25%, 7/4/17 - 7/4/39 | | — | | 255 | | 255 | | — | | 414 | | — | | 414 | |
4.75%, 7/4/34 | | — | | 315 | | 315 | | — | | 564 | | — | | 564 | |
| | | | | | | | — | | 1,559 | | — | | 1,559 | |
Italy (0.4%) | | | | | | | | | | | | | | | |
Italy Buoni Poliennali Del Tesoro,
3.00%, 6/15/15 | | — | | 200 | | 200 | | — | | 245 | | — | | 245 | |
4.00%, 9/1/20 | | — | | 400 | | 400 | | — | | 460 | | — | | 460 | |
| | | | | | | | — | | 705 | | — | | 705 | |
Japan (1.4%) | | | | | | | | | | | | | | | |
Japan Government Ten Year Bond,
1.30%, 12/20/13 | | JPY | — | | JPY | 45,000 | | JPY | 45,000 | | — | | 573 | | — | | 573 | |
1.40%, 9/20/15 | | — | | 58,000 | | 58,000 | | — | | 756 | | — | | 756 | |
1.70%, 6/20/18 | | — | | 10,000 | | 10,000 | | — | | 135 | | — | | 135 | |
1.90%, 6/20/16 | | — | | 5,000 | | 5,000 | | — | | 67 | | — | | 67 | |
Japan Government Thirty Year Bond,
1.70%, 6/20/33 | | — | | 87,000 | | 87,000 | | — | | 1,088 | | — | | 1,088 | |
| | | | | | | | — | | 2,619 | | — | | 2,619 | |
Mexico (0.3%) | | | | | | | | | | | | | | | |
Mexican Bonos,
10.00%, 12/5/24 | | MXN | — | | MXN | 3,600 | | MXN | 3,600 | | — | | 379 | | — | | 379 | |
Mexico Government International Bond,
3.63%, 3/15/22 | | $ | 80 | | $ | — | | $ | 80 | | 85 | | — | | — | | 85 | |
Petroleos Mexicanos,
4.88%, 1/24/22 (c) | | 150 | | — | | 150 | | 163 | | — | | — | | 163 | |
| | | | | | | | 248 | | 379 | | — | | 627 | |
Netherlands (0.2%) | | | | | | | | | | | | | | | |
Netherlands Government Bond,
4.00%, 7/15/19 | | EUR | — | | EUR | 275 | | EUR | 275 | | — | | 401 | | — | | 401 | |
| | | | | | | | | | | | | | | | | | | | | |
10
Poland (0.1%) | | | | | | | | | | | | | | | |
Poland Government Bond,
5.25%, 10/25/17 | | PLN | — | | PLN | 875 | | PLN | 875 | | — | | 268 | | — | | 268 | |
| | | | | | | | | | | | | | | |
Qatar (0.1%) | | | | | | | | | | | | | | | |
Qatar Government International Bond,
4.00%, 1/20/15 (c) | | $ | — | | $ | 150 | | $ | 150 | | — | | 158 | | — | | 158 | |
| | | | | | | | | | | | | | | |
Russia (0.1%) | | | | | | | | | | | | | | | |
Russian Foreign Bond - Eurobond,
3.25%, 4/4/17 (c) | | — | | 200 | | 200 | | — | | 202 | | — | | 202 | |
| | | | | | | | | | | | | | | |
South Africa (0.1%) | | | | | | | | | | | | | | | |
South Africa Government Bond,
7.25%, 1/15/20 | | ZAR | — | | ZAR | 900 | | ZAR | 900 | | — | | 111 | | — | | 111 | |
| | | | | | | | | | | | | | | |
Supernational (0.1%) | | | | | | | | | | | | | | | |
European Union,
2.75%, 6/3/16 | | EUR | — | | EUR | 200 | | EUR | 200 | | — | | 270 | | — | | 270 | |
| | | | | | | | | | | | | | | |
Sweden (0.1%) | | | | | | | | | | | | | | | |
Sweden Government Bond,
4.25%, 3/12/19 | | SEK | — | | SEK | 1,300 | | SEK | 1,300 | | — | | 223 | | — | | 223 | |
| | | | | | | | | | | | | | | |
United Kingdom (0.8%) | | | | | | | | | | | | | | | |
United Kingdom Gilt,
2.75%, 1/22/15 | | GBP | — | | GBP | 25 | | GBP | 25 | | — | | 41 | | — | | 41 | |
3.75%, 9/7/20 | | — | | 50 | | 50 | | — | | 92 | | — | | 92 | |
4.00%, 3/7/22 | | — | | 35 | | 35 | | — | | 66 | | — | | 66 | |
4.25%, 6/7/32 - 9/7/39 | | — | | 525 | | 525 | | — | | 1,015 | | — | | 1,015 | |
5.00%, 3/7/18 | | — | | 180 | | 180 | | — | | 345 | | — | | 345 | |
| | | | | | | | — | | 1,559 | | — | | 1,559 | |
Total Sovereign (Cost $11,784) | | | | | | | | 536 | | 11,334 | | — | | 11,870 | |
| | | | | | | | | | | | | | | |
U.S. Agency Securities (1.1%) | | | | | | | | | | | | | | | |
Federal Home Loan Mortgage Corporation,
3.75%, 3/27/19 | | 150 | | — | | 150 | | 174 | | — | | — | | 174 | |
6.75%, 3/15/31 | | 45 | | — | | 45 | | 69 | | — | | — | | 69 | |
Federal National Mortgage Association,
1.25%, 9/28/16 | | 500 | | — | | 500 | | 509 | | — | | — | | 509 | |
4.38%, 10/15/15 | | 700 | | — | | 700 | | 786 | | — | | — | | 786 | |
5.38%, 6/12/17 | | 450 | | — | | 450 | | 546 | | — | | — | | 546 | |
Total U.S. Agency Securities (Cost $1,993) | | | | | | | | 2,084 | | — | | — | | 2,084 | |
| | | | | | | | | | | | | | | |
U.S. Treasury Securities (11.4%) | | | | | | | | | | | | | | | |
United States (11.4%) | | | | | | | | | | | | | | | |
U.S. Treasury Bonds,
3.50%, 2/15/39 (d) | | $ | 1,620 | | $ | 930 | | $ | 2,550 | | 1,875 | | 1,076 | | — | | 2,951 | |
3.88%, 8/15/40 | | 610 | | — | | 610 | | 751 | | — | | — | | 751 | |
5.25%, 11/15/28 | | 200 | | — | | 200 | | 282 | | — | | — | | 282 | |
5.38%, 2/15/31 | | 255 | | — | | 255 | | 372 | | — | | — | | 372 | |
U.S. Treasury Notes,
0.25%, 2/15/15 | | — | | 400 | | 400 | | — | | 399 | | — | | 399 | |
0.50%, 10/15/13 | | 210 | | — | | 210 | | 211 | | — | | — | | 211 | |
0.88%, 2/28/17 (d) | | — | | 430 | | 430 | | — | | 434 | | — | | 434 | |
1.00%, 9/30/16 | | 1,710 | | — | | 1,710 | | 1,737 | | — | | — | | 1,737 | |
1.25%, 10/31/15 | | 452 | | — | | 452 | | 463 | | — | | — | | 463 | |
1.50%, 6/30/16 | | — | | 100 | | 100 | | — | | 104 | | — | | 104 | |
1.75%, 1/31/14 - 7/31/15 | | 3,180 | | — | | 3,180 | | 3,276 | | — | | — | | 3,276 | |
1.88%, 9/30/17 | | 1,000 | | — | | 1,000 | | 1,055 | | — | | — | | 1,055 | |
2.25%, 1/31/15 - 3/31/16 | | 2,145 | | — | | 2,145 | | 2,260 | | — | | — | | 2,260 | |
2.38%, 8/31/14 - 6/30/18 | | 5,300 | | 730 | | 6,030 | | 5,592 | | 764 | | — | | 6,356 | |
2.75%, 2/28/18 | | — | | 900 | | 900 | | — | | 993 | | — | | 993 | |
3.63%, 2/15/21 | | — | | 210 | | 210 | | — | | 248 | | — | | 248 | |
Total U.S. Treasury Securities (Cost $21,173) | | | | | | | | 17,874 | | 4,018 | | — | | 21,892 | |
Total Fixed Income Securities (Cost $54,626) | | | | | | | | 31,676 | | 24,810 | | — | | 56,486 | |
| | | | | | | | | | | | | | | | | | | | | |
11
| | Shares | | Shares | | Shares | | Value (000) | | Value (000) | | Value (000) | | Value (000) | |
Common Stocks (55.2%) | | | | | | | | | | | | | | | |
Australia (0.8%) | | | | | | | | | | | | | | | |
AGL Energy Ltd. | | — | | 922 | | 922 | | — | | 14 | | — | | 14 | |
Alumina Ltd. (d) | | — | | 9,345 | | 9,345 | | — | | 8 | | — | | 8 | |
Amcor Ltd. | | — | | 2,905 | | 2,905 | | — | | 21 | | — | | 21 | |
AMP Ltd. | | — | | 7,531 | | 7,531 | | — | | 30 | | — | | 30 | |
ASX Ltd. | | — | | 521 | | 521 | | — | | 16 | | — | | 16 | |
Australia & New Zealand Banking Group Ltd. | | — | | 5,259 | | 5,259 | | — | | 119 | | — | | 119 | |
BHP Billiton Ltd. | | — | | 6,142 | | 6,142 | | — | | 200 | | — | | 200 | |
Brambles Ltd. | | — | | 3,179 | | 3,179 | | — | | 20 | | — | | 20 | |
Coca-Cola Amatil Ltd. | | — | | 560 | | 560 | | — | | 8 | | — | | 8 | |
Commonwealth Bank of Australia (d) | | — | | 2,661 | | 2,661 | | — | | 146 | | — | | 146 | |
CSL Ltd. | | — | | 1,047 | | 1,047 | | — | | 42 | | — | | 42 | |
Echo Entertainment Group Ltd. | | — | | 378 | | 378 | | — | | 2 | | — | | 2 | |
Fortescue Metals Group Ltd. (d) | | — | | 3,024 | | 3,024 | | — | | 15 | | — | | 15 | |
GPT Group REIT (Stapled Securities) (e) | | — | | 7,895 | | 7,895 | | — | | 27 | | — | | 27 | |
Incitec Pivot Ltd. | | — | | 4,364 | | 4,364 | | — | | 13 | | — | | 13 | |
Insurance Australia Group Ltd. | | — | | 5,277 | | 5,277 | | — | | 19 | | — | | 19 | |
Leighton Holdings Ltd. (d) | | — | | 433 | | 433 | | — | | 7 | | — | | 7 | |
Macquarie Group Ltd. | | — | | 781 | | 781 | | — | | 21 | | — | | 21 | |
National Australia Bank Ltd. (d) | | — | | 3,819 | | 3,819 | | — | | 93 | | — | | 93 | |
Newcrest Mining Ltd. | | — | | 1,373 | | 1,373 | | — | | 32 | | — | | 32 | |
Orica Ltd. | | — | | 1,136 | | 1,136 | | — | | 29 | | — | | 29 | |
Origin Energy Ltd. | | — | | 2,512 | | 2,512 | | — | | 32 | | — | | 32 | |
QBE Insurance Group Ltd. | | — | | 3,324 | | 3,324 | | — | | 46 | | — | | 46 | |
Rio Tinto Ltd. | | — | | 827 | | 827 | | — | | 49 | | — | | 49 | |
Santos Ltd. | | — | | 1,904 | | 1,904 | | — | | 21 | | — | | 21 | |
Stockland REIT (Stapled Securities) (e)(f) | | — | | 8,454 | | 8,454 | | — | | 27 | | — | | 27 | |
Suncorp Group Ltd. | | — | | 3,090 | | 3,090 | | — | | 26 | | — | | 26 | |
TABCORP Holdings Ltd. | | — | | 379 | | 379 | | — | | 1 | | — | | 1 | |
Telstra Corp, Ltd. | | — | | 7,625 | | 7,625 | | — | | 29 | | — | | 29 | |
Transurban Group (Stapled Securities) (e) | | — | | 3,556 | | 3,556 | | — | | 21 | | — | | 21 | |
Treasury Wine Estates Ltd. | | — | | 1,702 | | 1,702 | | — | | 8 | | — | | 8 | |
Wesfarmers Ltd. | | — | | 1,835 | | 1,835 | | — | | 56 | | — | | 56 | |
Wesfarmers Ltd. (PPS) | | — | | 285 | | 285 | | — | | 9 | | — | | 9 | |
Westfield Group REIT (Stapled Securities) (e)(f) | | — | | 4,870 | | 4,870 | | — | | 47 | | — | | 47 | |
Westfield Retail Trust REIT | | — | | 4,870 | | 4,870 | | — | | 14 | | — | | 14 | |
Westpac Banking Corp. (d) | | — | | 5,241 | | 5,241 | | — | | 114 | | — | | 114 | |
Woodside Petroleum Ltd. | | — | | 1,157 | | 1,157 | | — | | 37 | | — | | 37 | |
Woolworths Ltd. | | — | | 2,227 | | 2,227 | | — | | 61 | | — | | 61 | |
| | | | | | | | — | | 1,480 | | — | | 1,480 | |
Austria (0.0%) | | | | | | | | | | | | | | | |
Erste Group Bank AG (g) | | — | | 537 | | 537 | | — | | 10 | | — | | 10 | |
Immofinanz AG (g) | | — | | 955 | | 955 | | — | | 3 | | — | | 3 | |
Verbund AG, Class A | | — | | 128 | | 128 | | — | | 3 | | — | | 3 | |
Voestalpine AG (d) | | — | | 270 | | 270 | | — | | 7 | | — | | 7 | |
| | | | | | | | — | | 23 | | — | | 23 | |
Belgium (0.1%) | | | | | | | | | | | | | | | |
Ageas | | — | | 3,749 | | 3,749 | | — | | 7 | | — | | 7 | |
Anheuser-Busch InBev N.V. | | — | | 975 | | 975 | | — | | 76 | | — | | 76 | |
Colruyt SA | | — | | 121 | | 121 | | — | | 5 | | — | | 5 | |
Groupe Bruxelles Lambert SA | | — | | 202 | | 202 | | — | | 14 | | — | | 14 | |
KBC Groep N.V. (d) | | — | | 151 | | 151 | | — | | 3 | | — | | 3 | |
Solvay SA, Class A | | — | | 98 | | 98 | | — | | 10 | | — | | 10 | |
Umicore SA | | — | | 216 | | 216 | | — | | 10 | | — | | 10 | |
| | | | | | | | — | | 125 | | — | | 125 | |
12
Canada (1.0%) | | | | | | | | | | | | | | | |
Agnico-Eagle Mines Ltd. (d) | | — | | 400 | | 400 | | — | | 16 | | — | | 16 | |
Agrium, Inc. (d) | | — | | 400 | | 400 | | — | | 35 | | — | | 35 | |
Bank of Montreal | | — | | 1,100 | | 1,100 | | — | | 61 | | — | | 61 | |
Bank of Nova Scotia (d) | | — | | 1,600 | | 1,600 | | — | | 83 | | — | | 83 | |
Barrick Gold Corp. (d) | | — | | 2,100 | | 2,100 | | — | | 79 | | — | | 79 | |
BCE, Inc. | | — | | 2,000 | | 2,000 | | — | | 83 | | — | | 83 | |
Brookfield Asset Management, Inc., Class A | | — | | 1,400 | | 1,400 | | — | | 46 | | — | | 46 | |
Cameco Corp. (d) | | — | | 1,000 | | 1,000 | | — | | 22 | | — | | 22 | |
Canadian Imperial Bank of Commerce (d) | | — | | 900 | | 900 | | — | | 63 | | — | | 63 | |
Canadian National Railway Co. (d) | | — | | 1,000 | | 1,000 | | — | | 85 | | — | | 85 | |
Canadian Natural Resources Ltd. | | — | | 2,000 | | 2,000 | | — | | 54 | | — | | 54 | |
Canadian Pacific Railway Ltd. | | — | | 400 | | 400 | | — | | 29 | | — | | 29 | |
Cenovus Energy, Inc. | | — | | 1,600 | | 1,600 | | — | | 51 | | — | | 51 | |
Crescent Point Energy Corp. (d) | | — | | 600 | | 600 | | — | | 22 | | — | | 22 | |
Eldorado Gold Corp. | | — | | 1,200 | | 1,200 | | — | | 15 | | — | | 15 | |
Enbridge, Inc. (d) | | — | | 1,800 | | 1,800 | | — | | 72 | | — | | 72 | |
Encana Corp. (d) | | — | | 1,800 | | 1,800 | | — | | 38 | | — | | 38 | |
Goldcorp, Inc. | | — | | 1,600 | | 1,600 | | — | | 60 | | — | | 60 | |
Imperial Oil Ltd. | | — | | 200 | | 200 | | — | | 8 | | — | | 8 | |
Kinross Gold Corp. | | — | | 2,400 | | 2,400 | | — | | 20 | | — | | 20 | |
Magna International, Inc. (d) | | — | | 600 | | 600 | | — | | 24 | | — | | 24 | |
Manulife Financial Corp. | | — | | 5,800 | | 5,800 | | — | | 63 | | — | | 63 | |
National Bank of Canada (d) | | — | | 300 | | 300 | | — | | 21 | | — | | 21 | |
Nexen, Inc. | | — | | 1,500 | | 1,500 | | — | | 25 | | — | | 25 | |
Penn West Petroleum Ltd. (d) | | — | | 900 | | 900 | | — | | 12 | | — | | 12 | |
Potash Corp. of Saskatchewan, Inc. | | — | | 1,800 | | 1,800 | | — | | 79 | | — | | 79 | |
Power Corp. of Canada | | — | | 1,300 | | 1,300 | | — | | 31 | | — | | 31 | |
Research In Motion Ltd. (d)(g) | | — | | 1,000 | | 1,000 | | — | | 7 | | — | | 7 | |
Rogers Communications, Inc. (d) | | — | | 700 | | 700 | | — | | 25 | | — | | 25 | |
Royal Bank of Canada (d) | | — | | 2,300 | | 2,300 | | — | | 118 | | — | | 118 | |
Shoppers Drug Mart Corp. (d) | | — | | 1,000 | | 1,000 | | — | | 40 | | — | | 40 | |
Silver Wheaton Corp. (d) | | — | | 700 | | 700 | | — | | 19 | | — | | 19 | |
Sun Life Financial, Inc. | | — | | 1,600 | | 1,600 | | — | | 35 | | — | | 35 | |
Suncor Energy, Inc. | | — | | 3,100 | | 3,100 | | — | | 90 | | — | | 90 | |
Talisman Energy, Inc. | | — | | 2,000 | | 2,000 | | — | | 23 | | — | | 23 | |
Teck Resources Ltd. | | — | | 1,000 | | 1,000 | | — | | 31 | | — | | 31 | |
Thomson Reuters Corp. (d) | | — | | 900 | | 900 | | — | | 26 | | — | | 26 | |
Toronto-Dominion Bank (The) (d) | | — | | 1,800 | | 1,800 | | — | | 141 | | — | | 141 | |
TransCanada Corp. (d) | | — | | 1,200 | | 1,200 | | — | | 50 | | — | | 50 | |
Yamana Gold, Inc. | | — | | 1,700 | | 1,700 | | — | | 26 | | — | | 26 | |
| | | | | | | | — | | 1,828 | | — | | 1,828 | |
Chile (0.0%) | | | | | | | | | | | | | | | |
Antofagasta PLC | | — | | 742 | | 742 | | — | | 13 | | — | | 13 | |
13
China (0.5%) | | | | | | | | | | | | | | | |
Agile Property Holdings Ltd. (d)(h) | | — | | 32,550 | | 32,550 | | — | | 42 | | — | | 42 | |
China Overseas Land & Investment Ltd. (d)(h) | | — | | 78,499 | | 78,499 | | — | | 184 | | — | | 184 | |
China Resources Land Ltd. (d)(h) | | — | | 56,310 | | 56,310 | | — | | 116 | | — | | 116 | |
Country Garden Holdings Co., Ltd. (h) | | — | | 166,998 | | 166,998 | | — | | 66 | | — | | 66 | |
Evergrande Real Estate Group Ltd. (d)(h) | | — | | 144,483 | | 144,483 | | — | | 75 | | — | | 75 | |
Franshion Properties China Ltd. (d)(h) | | — | | 86,877 | | 86,877 | | — | | 26 | | — | | 26 | |
Greentown China Holdings Ltd. (h) | | — | | 15,374 | | 15,374 | | — | | 16 | | — | | 16 | |
Guangzhou R&F Properties Co., Ltd., H Shares (h) | | — | | 31,365 | | 31,365 | | — | | 42 | | — | | 42 | |
KWG Property Holding Ltd. (h) | | — | | 29,744 | | 29,744 | | — | | 19 | | — | | 19 | |
Longfor Properties Co., Ltd. (h) | | — | | 50,074 | | 50,074 | | — | | 79 | | — | | 79 | |
Poly Hong Kong Investments Ltd. (g)(h) | | — | | 34,761 | | 34,761 | | — | | 19 | | — | | 19 | |
Renhe Commercial Holdings Co., Ltd. (d)(g)(h) | | — | | 217,993 | | 217,993 | | — | | 9 | | — | | 9 | |
Shimao Property Holdings Ltd. (h) | | — | | 33,694 | | 33,694 | | — | | 52 | | — | | 52 | |
Shui On Land Ltd. (h) | | — | | 56,082 | | 56,082 | | — | | 23 | | — | | 23 | |
Sino-Ocean Land Holdings Ltd. (h) | | — | | 54,947 | | 54,947 | | — | | 27 | | — | | 27 | |
Soho China Ltd. (h) | | — | | 50,429 | | 50,429 | | — | | 39 | | — | | 39 | |
Wynn Macau Ltd. (d)(h) | | — | | 5,600 | | 5,600 | | — | | 13 | | — | | 13 | |
Yuexiu Property Co., Ltd. (h) | | — | | 89,366 | | 89,366 | | — | | 22 | | — | | 22 | |
| | | | | | | | — | | 869 | | — | | 869 | |
Denmark (0.1%) | | | | | | | | | | | | | | | |
AP Moller - Maersk A/S | | — | | 1 | | 1 | | — | | 6 | | — | | 6 | |
AP Moller - Maersk A/S, Series B | | — | | 2 | | 2 | | — | | 13 | | — | | 13 | |
Danske Bank A/S (g) | | — | | 684 | | 684 | | — | | 10 | | — | | 10 | |
DSV A/S | | — | | 376 | | 376 | | — | | 7 | | — | | 7 | |
Novo Nordisk A/S, Series B | | — | | 888 | | 888 | | — | | 129 | | — | | 129 | |
Novozymes A/S, Series B | | — | | 330 | | 330 | | — | | 9 | | — | | 9 | |
Vestas Wind Systems A/S (g) | | — | | 387 | | 387 | | — | | 2 | | — | | 2 | |
| | | | | | | | — | | 176 | | — | | 176 | |
Finland (0.1%) | | | | | | | | | | | | | | | |
Elisa Oyj | | — | | 277 | | 277 | | — | | 6 | | — | | 6 | |
Fortum Oyj | | — | | 651 | | 651 | | — | | 12 | | — | | 12 | |
Kone Oyj, Class B | | — | | 292 | | 292 | | — | | 18 | | — | | 18 | |
Metso Oyj | | — | | 204 | | 204 | | — | | 7 | | — | | 7 | |
Nokia Oyj | | — | | 5,675 | | 5,675 | | — | | 12 | | — | | 12 | |
Nokian Renkaat Oyj | | — | | 240 | | 240 | | — | | 9 | | — | | 9 | |
Sampo Oyj, Class A | | — | | 605 | | 605 | | — | | 16 | | — | | 16 | |
Stora Enso Oyj, Class R | | — | | 1,002 | | 1,002 | | — | | 6 | | — | | 6 | |
UPM-Kymmene Oyj (d) | | — | | 554 | | 554 | | — | | 6 | | — | | 6 | |
Wartsila Oyj | | — | | 291 | | 291 | | — | | 9 | | — | | 9 | |
| | | | | | | | — | | 101 | | — | | 101 | |
14
France (0.6%) | | | | | | | | | | | | | | | |
Aeroports de Paris (ADP) (d) | | — | | 55 | | 55 | | — | | 4 | | — | | 4 | |
Air Liquide SA | | — | | 470 | | 470 | | — | | 54 | | — | | 54 | |
Alcatel-Lucent (d)(g) | | — | | 6,226 | | 6,226 | | — | | 10 | | — | | 10 | |
Alstom SA (d) | | — | | 406 | | 406 | | — | | 13 | | — | | 13 | |
AXA SA | | — | | 3,059 | | 3,059 | | — | | 41 | | — | | 41 | |
BNP Paribas SA | | — | | 2,156 | | 2,156 | | — | | 83 | | — | | 83 | |
Bouygues SA | | — | | 355 | | 355 | | — | | 10 | | — | | 10 | |
Cap Gemini SA | | — | | 333 | | 333 | | — | | 12 | | — | | 12 | |
Carrefour SA (d) | | — | | 744 | | 744 | | — | | 14 | | — | | 14 | |
Christian Dior SA | | — | | 127 | | 127 | | — | | 17 | | — | | 17 | |
Cie de St-Gobain | | — | | 696 | | 696 | | — | | 26 | | — | | 26 | |
Cie Generale d’Optique Essilor International SA | | — | | 303 | | 303 | | — | | 28 | | — | | 28 | |
Cie Generale de Geophysique-Veritas (g) | | — | | 256 | | 256 | | — | | 7 | | — | | 7 | |
Cie Generale des Etablissements Michelin, Series B | | — | | 364 | | 364 | | — | | 24 | | — | | 24 | |
Credit Agricole SA (g) | | — | | 2,594 | | 2,594 | | — | | 11 | | — | | 11 | |
Danone SA | | — | | 736 | | 736 | | — | | 46 | | — | | 46 | |
Electricite de France SA (d) | | — | | 431 | | 431 | | — | | 10 | | — | | 10 | |
European Aeronautic Defense and Space Co., N.V. | | — | | 675 | | 675 | | — | | 24 | | — | | 24 | |
Fonciere Des Regions REIT | | — | | 53 | | 53 | | — | | 4 | | — | | 4 | |
France Telecom SA | | — | | 2,874 | | 2,874 | | — | | 38 | | — | | 38 | |
GDF Suez | | — | | 1,973 | | 1,973 | | — | | 47 | | — | | 47 | |
Gecina SA REIT (d) | | — | | 37 | | 37 | | — | | 3 | | — | | 3 | |
Groupe Eurotunnel SA | | — | | 949 | | 949 | | — | | 8 | | — | | 8 | |
Klepierre REIT | | — | | 187 | | 187 | | — | | 6 | | — | | 6 | |
L’Oreal SA | | — | | 420 | | 420 | | — | | 49 | | — | | 49 | |
Lafarge SA (d) | | — | | 345 | | 345 | | — | | 15 | | — | | 15 | |
Legrand SA | | — | | 195 | | 195 | | — | | 7 | | — | | 7 | |
LVMH Moet Hennessy Louis Vuitton SA | | — | | 315 | | 315 | | — | | 48 | | — | | 48 | |
Pernod-Ricard SA (d) | | — | | 351 | | 351 | | — | | 38 | | — | | 38 | |
Peugeot SA (d)(g) | | — | | 386 | | 386 | | — | | 4 | | — | | 4 | |
Publicis Groupe SA (d) | | — | | 312 | | 312 | | — | | 14 | | — | | 14 | |
Renault SA | | — | | 330 | | 330 | | — | | 13 | | — | | 13 | |
Safran SA | | — | | 251 | | 251 | | — | | 9 | | — | | 9 | |
Sanofi | | — | | 845 | | 845 | | — | | 64 | | — | | 64 | |
Schneider Electric SA | | — | | 782 | | 782 | | — | | 44 | | — | | 44 | |
SES SA | | — | | 614 | | 614 | | — | | 15 | | — | | 15 | |
Societe Generale SA (g) | | — | | 1,480 | | 1,480 | | — | | 35 | | — | | 35 | |
Sodexo | | — | | 272 | | 272 | | — | | 21 | | — | | 21 | |
Technip SA | | — | | 158 | | 158 | | — | | 16 | | — | | 16 | |
Thales SA (d) | | — | | 156 | | 156 | | — | | 5 | | — | | 5 | |
Total SA (d) | | — | | 2,424 | | 2,424 | | — | | 109 | | — | | 109 | |
Unibail-Rodamco SE REIT | | — | | 89 | | 89 | | — | | 16 | | — | | 16 | |
Vallourec SA | | — | | 167 | | 167 | | — | | 7 | | — | | 7 | |
Veolia Environnement SA | | — | | 586 | | 586 | | — | | 7 | | — | | 7 | |
Vinci SA | | — | | 830 | | 830 | | — | | 39 | | — | | 39 | |
Vivendi SA | | — | | 1,756 | | 1,756 | | — | | 33 | | — | | 33 | |
| | | | | | | | — | | 1,148 | | — | | 1,148 | |
15
Germany (0.6%) | | | | | | | | | | | | | | | |
Adidas AG | | — | | 339 | | 339 | | — | | 24 | | — | | 24 | |
Allianz SE (Registered) | | — | | 832 | | 832 | | — | | 84 | | — | | 84 | |
BASF SE | | — | | 1,220 | | 1,220 | | — | | 85 | | — | | 85 | |
Bayer AG (Registered) | | — | | 1,377 | | 1,377 | | — | | 99 | | — | | 99 | |
Bayerische Motoren Werke AG | | — | | 683 | | 683 | | — | | 49 | | — | | 49 | |
Commerzbank AG (g) | | — | | 871 | | 871 | | — | | 1 | | — | | 1 | |
Continental AG | | — | | 162 | | 162 | | — | | 13 | | — | | 13 | |
Daimler AG (Registered) | | — | | 1,424 | | 1,424 | | — | | 64 | | — | | 64 | |
Deutsche Bank AG | | — | | 1,321 | | 1,321 | | — | | 48 | | — | | 48 | |
Deutsche Boerse AG | | — | | 295 | | 295 | | — | | 16 | | — | | 16 | |
Deutsche Lufthansa AG, (Registered) | | — | | 480 | | 480 | | — | | 6 | | — | | 6 | |
Deutsche Post AG, (Registered) | | — | | 1,164 | | 1,164 | | — | | 21 | | — | | 21 | |
Deutsche Telekom AG, (Registered) | | — | | 4,124 | | 4,124 | | — | | 45 | | — | | 45 | |
E.ON AG | | — | | 3,099 | | 3,099 | | — | | 67 | | — | | 67 | |
Esprit Holdings Ltd. (d)(h) | | — | | 3,594 | | 3,594 | | — | | 5 | | — | | 5 | |
Fraport AG Frankfurt Airport Services Worldwide | | — | | 40 | | 40 | | — | | 2 | | — | | 2 | |
Fresenius Medical Care AG & Co., KGaA | | — | | 357 | | 357 | | — | | 25 | | — | | 25 | |
Fresenius SE & Co., KGaA | | — | | 260 | | 260 | | — | | 27 | | — | | 27 | |
HeidelbergCement AG | | — | | 163 | | 163 | | — | | 8 | | — | | 8 | |
Henkel AG & Co., KGaA | | — | | 306 | | 306 | | — | | 17 | | — | | 17 | |
Henkel AG & Co., KGaA (Preference) | | — | | 360 | | 360 | | — | | 24 | | — | | 24 | |
Infineon Technologies AG | | — | | 2,448 | | 2,448 | | — | | 17 | | — | | 17 | |
K&S AG (Registered) | | — | | 236 | | 236 | | — | | 11 | | — | | 11 | |
Lanxess AG | | — | | 139 | | 139 | | — | | 9 | | — | | 9 | |
Linde AG | | — | | 293 | | 293 | | — | | 46 | | — | | 46 | |
Merck KGaA | | — | | 187 | | 187 | | — | | 19 | | — | | 19 | |
Metro AG | | — | | 199 | | 199 | | — | | 6 | | — | | 6 | |
Muenchener Rueckversicherungs AG (Registered) | | — | | 392 | | 392 | | — | | 55 | | — | | 55 | |
Porsche Automobil Holding SE (Preference) (d) | | — | | 504 | | 504 | | — | | 25 | | — | | 25 | |
QIAGEN N.V. (g) | | — | | 899 | | 899 | | — | | 15 | | — | | 15 | |
RWE AG | | — | | 930 | | 930 | | — | | 38 | | — | | 38 | |
Salzgitter AG | | — | | 82 | | 82 | | — | | 3 | | — | | 3 | |
SAP AG | | — | | 1,649 | | 1,649 | | — | | 97 | | — | | 97 | |
Siemens AG (Registered) | | — | | 1,196 | | 1,196 | | — | | 101 | | — | | 101 | |
ThyssenKrupp AG | | — | | 542 | | 542 | | — | | 9 | | — | | 9 | |
Volkswagen AG | | — | | 41 | | 41 | | — | | 6 | | — | | 6 | |
Volkswagen AG (Preference) | | — | | 287 | | 287 | | — | | 45 | | — | | 45 | |
| | | | | | | | — | | 1,232 | | — | | 1,232 | |
Greece (0.0%) | | | | | | | | | | | | | | | |
National Bank of Greece SA (g) | | — | | 1,384 | | 1,384 | | — | | 3 | | — | | 3 | |
16
Hong Kong (0.4%) | | | | | | | | | | | | | | | |
Bank of East Asia Ltd. (d) | | — | | 5,881 | | 5,881 | | — | | 21 | | — | | 21 | |
BOC Hong Kong Holdings Ltd. | | — | | 13,000 | | 13,000 | | — | | 40 | | — | | 40 | |
Cheung Kong Holdings Ltd. | | — | | 5,000 | | 5,000 | | — | | 62 | | — | | 62 | |
CLP Holdings Ltd. | | — | | 7,500 | | 7,500 | | — | | 64 | | — | | 64 | |
Hang Lung Group Ltd. | | — | | 3,000 | | 3,000 | | — | | 19 | | — | | 19 | |
Hang Lung Properties Ltd. | | — | | 7,000 | | 7,000 | | — | | 24 | | — | | 24 | |
Hang Seng Bank Ltd. | | — | | 4,700 | | 4,700 | | — | | 64 | | — | | 64 | |
Henderson Land Development Co., Ltd. | | — | | 5,103 | | 5,103 | | — | | 28 | | — | | 28 | |
Hong Kong & China Gas Co., Ltd. | | — | | 13,310 | | 13,310 | | — | | 28 | | — | | 28 | |
Hong Kong Exchanges and Clearing Ltd. (d) | | — | | 3,761 | | 3,761 | | — | | 54 | | — | | 54 | |
Hutchison Whampoa Ltd. | | — | | 7,000 | | 7,000 | | — | | 61 | | — | | 61 | |
Kerry Properties Ltd. | | — | | 2,500 | | 2,500 | | — | | 11 | | — | | 11 | |
Link REIT (The) | | — | | 7,472 | | 7,472 | | — | | 31 | | — | | 31 | |
MTR Corp. | | — | | 5,588 | | 5,588 | | — | | 19 | | — | | 19 | |
New World Development Co., Ltd. (d) | | — | | 9,740 | | 9,740 | | — | | 12 | | — | | 12 | |
Power Assets Holdings Ltd. | | — | | 5,500 | | 5,500 | | — | | 41 | | — | | 41 | |
Sands China Ltd. | | — | | 8,800 | | 8,800 | | — | | 28 | | — | | 28 | |
Sino Land Co., Ltd. | | — | | 9,192 | | 9,192 | | — | | 14 | | — | | 14 | |
Sun Hung Kai Properties Ltd. | | — | | 5,166 | | 5,166 | | — | | 61 | | — | | 61 | |
Swire Pacific Ltd. Class A | | — | | 2,500 | | 2,500 | | — | | 29 | | — | | 29 | |
Swire Properties Ltd. | | — | | 1,750 | | 1,750 | | — | | 5 | | — | | 5 | |
Wharf Holdings Ltd. | | — | | 4,400 | | 4,400 | | — | | 24 | | — | | 24 | |
| | | | | | | | — | | 740 | | — | | 740 | |
India (0.0%) | | | | | | | | | | | | | | | |
Cairn Energy PLC (g) | | — | | 946 | | 946 | | — | | 4 | | — | | 4 | |
| | | | | | | | | | | | | | | |
Ireland (0.0%) | | | | | | | | | | | | | | | |
CRH PLC | | — | | 832 | | 832 | | — | | 16 | | — | | 16 | |
| | | | | | | | | | | | | | | |
Italy (0.1%) | | | | | | | | | | | | | | | |
Assicurazioni Generali SpA (d) | | — | | 2,726 | | 2,726 | | — | | 37 | | — | | 37 | |
Atlantia SpA | | — | | 556 | | 556 | | — | | 7 | | — | | 7 | |
Banco Popolare SC (g) | | — | | 4,013 | | 4,013 | | — | | 5 | | — | | 5 | |
Enel Green Power SpA | | — | | 2,893 | | 2,893 | | — | | 5 | | — | | 5 | |
Enel SpA | | — | | 13,052 | | 13,052 | | — | | 42 | | — | | 42 | |
Eni SpA | | — | | 2,877 | | 2,877 | | — | | 62 | | — | | 62 | |
Exor SpA (d) | | — | | 94 | | 94 | | — | | 2 | | — | | 2 | |
Fiat Industrial SpA | | — | | 998 | | 998 | | — | | 10 | | — | | 10 | |
Fiat SpA (g) | | — | | 786 | | 786 | | — | | 4 | | — | | 4 | |
Finmeccanica SpA (d)(g) | | — | | 598 | | 598 | | — | | 3 | | — | | 3 | |
Intesa Sanpaolo SpA | | — | | 23,263 | | 23,263 | | — | | 33 | | — | | 33 | |
Luxottica Group SpA | | — | | 179 | | 179 | | — | | 6 | | — | | 6 | |
Mediobanca SpA | | — | | 766 | | 766 | | — | | 3 | | — | | 3 | |
Saipem SpA | | — | | 424 | | 424 | | — | | 19 | | — | | 19 | |
Snam SpA | | — | | 2,878 | | 2,878 | | — | | 13 | | — | | 13 | |
Telecom Italia SpA | | — | | 13,589 | | 13,589 | | — | | 13 | | — | | 13 | |
Terna Rete Elettrica Nazionale SpA | | — | | 2,573 | | 2,573 | | — | | 9 | | — | | 9 | |
UniCredit SpA (g) | | — | | 2,864 | | 2,864 | | — | | 11 | | — | | 11 | |
Unione di Banche Italiane SCPA | | — | | 1,110 | | 1,110 | | — | | 4 | | — | | 4 | |
| | | | | | | | — | | 288 | | — | | 288 | |
17
Japan (1.7%) | | | | | | | | | | | | | | | |
Aeon Co., Ltd. (d) | | — | | 1,900 | | 1,900 | | — | | 24 | | — | | 24 | |
Aisin Seiki Co., Ltd. | | — | | 400 | | 400 | | — | | 13 | | — | | 13 | |
Ajinomoto Co., Inc. | | — | | 2,000 | | 2,000 | | — | | 28 | | — | | 28 | |
Asahi Glass Co., Ltd. (d) | | — | | 2,000 | | 2,000 | | — | | 13 | | — | | 13 | |
Asahi Group Holdings Ltd. | | — | | 900 | | 900 | | — | | 19 | | — | | 19 | |
Asahi Kasei Corp. | | — | | 4,000 | | 4,000 | | — | | 22 | | — | | 22 | |
Astellas Pharma, Inc. | | — | | 700 | | 700 | | — | | 31 | | — | | 31 | |
Bank of Yokohama Ltd. (The) | | — | | 6,000 | | 6,000 | | — | | 28 | | — | | 28 | |
Bridgestone Corp. (d) | | — | | 1,500 | | 1,500 | | — | | 34 | | — | | 34 | |
Canon, Inc. (d) | | — | | 1,700 | | 1,700 | | — | | 68 | | — | | 68 | |
Central Japan Railway Co. | | — | | 3 | | 3 | | — | | 24 | | — | | 24 | |
Chubu Electric Power Co., Inc. | | — | | 1,100 | | 1,100 | | — | | 18 | | — | | 18 | |
Chugoku Electric Power Co., Inc. (The) | | — | | 700 | | 700 | | — | | 12 | | — | | 12 | |
Dai Nippon Printing Co., Ltd. | | — | | 1,000 | | 1,000 | | — | | 8 | | — | | 8 | |
Dai-ichi Life Insurance Co., Ltd. (The) | | — | | 22 | | 22 | | — | | 26 | | — | | 26 | |
Daiichi Sankyo Co., Ltd. | | — | | 1,000 | | 1,000 | | — | | 17 | | — | | 17 | |
Daikin Industries Ltd. | | — | | 400 | | 400 | | — | | 11 | | — | | 11 | |
Daiwa House Industry Co., Ltd. | | — | | 2,000 | | 2,000 | | — | | 28 | | — | | 28 | |
Daiwa Securities Group, Inc. | | — | | 6,000 | | 6,000 | | — | | 23 | | — | | 23 | |
Denso Corp. | | — | | 700 | | 700 | | — | | 24 | | — | | 24 | |
East Japan Railway Co. | | — | | 700 | | 700 | | — | | 44 | | — | | 44 | |
Eisai Co., Ltd. | | — | | 600 | | 600 | | — | | 26 | | — | | 26 | |
FANUC Corp. | | — | | 300 | | 300 | | — | | 49 | | — | | 49 | |
Fast Retailing Co., Ltd. | | — | | 100 | | 100 | | — | | 20 | | — | | 20 | |
FUJIFILM Holdings Corp. | | — | | 1,000 | | 1,000 | | — | | 19 | | — | | 19 | |
Fujitsu Ltd. | | — | | 4,000 | | 4,000 | | — | | 19 | | — | | 19 | |
Hankyu Hanshin Holdings, Inc. | | — | | 6,000 | | 6,000 | | — | | 30 | | — | | 30 | |
Hitachi Ltd. | | — | | 7,000 | | 7,000 | | — | | 43 | | — | | 43 | |
Honda Motor Co., Ltd. (d) | | — | | 2,500 | | 2,500 | | — | | 87 | | — | | 87 | |
Hoya Corp. | | — | | 900 | | 900 | | — | | 20 | | — | | 20 | |
Inpex Corp. | | — | | 4 | | 4 | | — | | 22 | | — | | 22 | |
ITOCHU Corp. | | — | | 2,800 | | 2,800 | | — | | 29 | | — | | 29 | |
Japan Tobacco, Inc. | | — | | 1,600 | | 1,600 | | — | | 47 | | — | | 47 | |
JFE Holdings, Inc. | | — | | 900 | | 900 | | — | | 15 | | — | | 15 | |
JS Group Corp. | | — | | 1,100 | | 1,100 | | — | | 23 | | — | | 23 | |
JX Holdings, Inc. | | — | | 5,500 | | 5,500 | | — | | 28 | | — | | 28 | |
Kansai Electric Power Co., Inc. (The) | | — | | 1,200 | | 1,200 | | — | | 14 | | — | | 14 | |
Kao Corp. | | — | | 700 | | 700 | | — | | 19 | | — | | 19 | |
KDDI Corp. | | — | | 4 | | 4 | | — | | 26 | | — | | 26 | |
Keyence Corp. (d) | | — | | 200 | | 200 | | — | | 49 | | — | | 49 | |
Kintetsu Corp. (d) | | — | | 6,000 | | 6,000 | | — | | 24 | | — | | 24 | |
Kirin Holdings Co., Ltd. (d) | | — | | 2,000 | | 2,000 | | — | | 24 | | — | | 24 | |
Kobe Steel Ltd. | | — | | 8,000 | | 8,000 | | — | | 10 | | — | | 10 | |
Komatsu Ltd. | | — | | 2,100 | | 2,100 | | — | | 50 | | — | | 50 | |
Konica Minolta Holdings, Inc. | | — | | 1,500 | | 1,500 | | — | | 12 | | — | | 12 | |
Kubota Corp. | | — | | 3,000 | | 3,000 | | — | | 28 | | — | | 28 | |
Kuraray Co., Ltd. | | — | | 1,000 | | 1,000 | | — | | 13 | | — | | 13 | |
Kyocera Corp. | | — | | 300 | | 300 | | — | | 26 | | — | | 26 | |
Kyushu Electric Power Co., Inc. | | — | | 800 | | 800 | | — | | 10 | | — | | 10 | |
Marubeni Corp. | | — | | 4,000 | | 4,000 | | — | | 27 | | — | | 27 | |
Mitsubishi Chemical Holdings Corp. | | — | | 3,500 | | 3,500 | | — | | 15 | | — | | 15 | |
Mitsubishi Corp. | | — | | 2,300 | | 2,300 | | — | | 46 | | — | | 46 | |
Mitsubishi Electric Corp. | | — | | 4,000 | | 4,000 | | — | | 33 | | — | | 33 | |
Mitsubishi Estate Co., Ltd. | | — | | 2,000 | | 2,000 | | — | | 36 | | — | | 36 | |
Mitsubishi Heavy Industries Ltd. | | — | | 9,000 | | 9,000 | | — | | 37 | | — | | 37 | |
Mitsui & Co., Ltd. | | — | | 2,800 | | 2,800 | | — | | 42 | | — | | 42 | |
Mitsui Fudosan Co., Ltd. | | — | | 2,000 | | 2,000 | | — | | 39 | | — | | 39 | |
Mitsui OSK Lines Ltd. | | — | | 3,000 | | 3,000 | | — | | 11 | | — | | 11 | |
Mizuho Financial Group, Inc. | | — | | 37,100 | | 37,100 | | — | | 63 | | — | | 63 | |
MS&AD Insurance Group Holdings | | — | | 1,100 | | 1,100 | | — | | 19 | | — | | 19 | |
Murata Manufacturing Co., Ltd. | | — | | 400 | | 400 | | — | | 21 | | — | | 21 | |
NEC Corp. (d)(g) | | — | | 8,000 | | 8,000 | | — | | 12 | | — | | 12 | |
NGK Insulators Ltd. | | — | | 1,000 | | 1,000 | | — | | 11 | | — | | 11 | |
18
Nidec Corp. (d) | | — | | 200 | | 200 | | — | | 15 | | — | | 15 | |
Nikon Corp. | | — | | 800 | | 800 | | — | | 24 | | — | | 24 | |
Nintendo Co., Ltd. | | — | | 100 | | 100 | | — | | 12 | | — | | 12 | |
Nippon Building Fund, Inc. REIT (d) | | — | | 2 | | 2 | | — | | 19 | | — | | 19 | |
Nippon Steel Corp. | | — | | 9,000 | | 9,000 | | — | | 20 | | — | | 20 | |
Nippon Telegraph & Telephone Corp. | | — | | 900 | | 900 | | — | | 42 | | — | | 42 | |
Nippon Yusen KK | | — | | 3,000 | | 3,000 | | — | | 8 | | — | | 8 | |
Nissan Motor Co., Ltd. | | — | | 3,800 | | 3,800 | | — | | 36 | | — | | 36 | |
Nitto Denko Corp. | | — | | 400 | | 400 | | — | | 17 | | — | | 17 | |
NKSJ Holdings, Inc. | | — | | 1,000 | | 1,000 | | — | | 21 | | — | | 21 | |
Nomura Holdings, Inc. | | — | | 6,800 | | 6,800 | | — | | 25 | | — | | 25 | |
NTT DoCoMo, Inc. | | — | | 27 | | 27 | | — | | 45 | | — | | 45 | |
Odakyu Electric Railway Co., Ltd. (d) | | — | | 3,000 | | 3,000 | | — | | 30 | | — | | 30 | |
Olympus Corp. (d)(g) | | — | | 500 | | 500 | | — | | 8 | | — | | 8 | |
Omron Corp. | | — | | 700 | | 700 | | — | | 15 | | — | | 15 | |
Oriental Land Co., Ltd. | | — | | 200 | | 200 | | — | | 23 | | — | | 23 | |
ORIX Corp. (d) | | — | | 220 | | 220 | | — | | 21 | | — | | 21 | |
Osaka Gas Co., Ltd. | | — | | 5,000 | | 5,000 | | — | | 21 | | — | | 21 | |
Panasonic Corp. | | — | | 2,800 | | 2,800 | | — | | 23 | | — | | 23 | |
Rakuten, Inc. (d) | | — | | 2,000 | | 2,000 | | — | | 21 | | — | | 21 | |
Ricoh Co., Ltd. (d) | | — | | 2,000 | | 2,000 | | — | | 17 | | — | | 17 | |
Rohm Co., Ltd. | | — | | 300 | | 300 | | — | | 12 | | — | | 12 | |
Secom Co., Ltd. | | — | | 700 | | 700 | | — | | 32 | | — | | 32 | |
Sekisui House Ltd. | | — | | 2,000 | | 2,000 | | — | | 19 | | — | | 19 | |
Seven & I Holdings Co., Ltd. | | — | | 1,500 | | 1,500 | | — | | 45 | | — | | 45 | |
Sharp Corp. (d) | | — | | 2,000 | | 2,000 | | — | | 10 | | — | | 10 | |
Shikoku Electric Power Co., Inc. | | — | | 500 | | 500 | | — | | 11 | | — | | 11 | |
Shin-Etsu Chemical Co., Ltd. | | — | | 700 | | 700 | | — | | 39 | | — | | 39 | |
Shionogi & Co., Ltd. | | — | | 1,200 | | 1,200 | | — | | 16 | | — | | 16 | |
Shiseido Co., Ltd. | | — | | 800 | | 800 | | — | | 13 | | — | | 13 | |
Shizuoka Bank Ltd. (The) (d) | | — | | 3,000 | | 3,000 | | — | | 31 | | — | | 31 | |
SMC Corp. | | — | | 200 | | 200 | | — | | 35 | | — | | 35 | |
Softbank Corp. | | — | | 1,400 | | 1,400 | | — | | 52 | | — | | 52 | |
Sony Corp. | | — | | 1,700 | | 1,700 | | — | | 24 | | — | | 24 | |
Sumitomo Chemical Co., Ltd. | | — | | 3,000 | | 3,000 | | — | | 9 | | — | | 9 | |
Sumitomo Corp. | | — | | 1,900 | | 1,900 | | — | | 27 | | — | | 27 | |
Sumitomo Electric Industries Ltd. | | — | | 1,200 | | 1,200 | | — | | 15 | | — | | 15 | |
Sumitomo Metal Industries Ltd. | | — | | 6,000 | | 6,000 | | — | | 10 | | — | | 10 | |
Sumitomo Metal Mining Co., Ltd. | | — | | 1,000 | | 1,000 | | — | | 11 | | — | | 11 | |
Sumitomo Mitsui Financial Group, Inc. | | — | | 2,400 | | 2,400 | | — | | 79 | | — | | 79 | |
Sumitomo Mitsui Trust Holdings, Inc. | | — | | 6,000 | | 6,000 | | — | | 18 | | — | | 18 | |
Sumitomo Realty & Development Co., Ltd. | | — | | 1,000 | | 1,000 | | — | | 25 | | — | | 25 | |
Suzuki Motor Corp. | | — | | 700 | | 700 | | — | | 14 | | — | | 14 | |
T&D Holdings, Inc. | | — | | 1,700 | | 1,700 | | — | | 18 | | — | | 18 | |
Takeda Pharmaceutical Co., Ltd. | | — | | 1,100 | | 1,100 | | — | | 50 | | — | | 50 | |
TDK Corp. | | — | | 400 | | 400 | | — | | 16 | | — | | 16 | |
Terumo Corp. | | — | | 500 | | 500 | | — | | 21 | | — | | 21 | |
Tohoku Electric Power Co., Inc. (d)(g) | | — | | 1,000 | | 1,000 | | — | | 10 | | — | | 10 | |
Tokio Marine Holdings, Inc. | | — | | 1,400 | | 1,400 | | — | | 35 | | — | | 35 | |
Tokyo Electric Power Co., Inc. (The) (g) | | — | | 3,400 | | 3,400 | | — | | 7 | | — | | 7 | |
Tokyo Electron Ltd. | | — | | 500 | | 500 | | — | | 23 | | — | | 23 | |
Tokyo Gas Co., Ltd. | | — | | 5,000 | | 5,000 | | — | | 26 | | — | | 26 | |
Tokyu Corp. | | — | | 4,000 | | 4,000 | | — | | 19 | | — | | 19 | |
Toray Industries, Inc. | | — | | 4,000 | | 4,000 | | — | | 27 | | — | | 27 | |
Toshiba Corp. | | — | | 7,000 | | 7,000 | | — | | 27 | | — | | 27 | |
Toyota Industries Corp. | | — | | 800 | | 800 | | — | | 23 | | — | | 23 | |
Toyota Motor Corp. | | — | | 4,400 | | 4,400 | | — | | 177 | | — | | 177 | |
West Japan Railway Co. | | — | | 400 | | 400 | | — | | 16 | | — | | 16 | |
Yahoo! Japan Corp. | | — | | 47 | | 47 | | — | | 15 | | — | | 15 | |
Yamada Denki Co., Ltd. (d) | | — | | 250 | | 250 | | — | | 13 | | — | | 13 | |
Yamato Holdings Co., Ltd. (d) | | — | | 400 | | 400 | | — | | 6 | | — | | 6 | |
| | | | | | | | — | | 3,248 | | — | | 3,248 | |
Kazakhstan (0.0%) | | | | | | | | | | | | | | | |
Kazakhmys PLC | | — | | 553 | | 553 | | — | | 6 | | — | | 6 | |
19
Netherlands (0.2%) | | | | | | | | | | | | | | | |
Akzo Nobel N.V. | | — | | 388 | | 388 | | — | | 18 | | — | | 18 | |
ArcelorMittal | | — | | 1,340 | | 1,340 | | — | | 21 | | — | | 21 | |
ASML Holding N.V. | | — | | 662 | | 662 | | — | | 34 | | — | | 34 | |
Corio N.V. REIT | | — | | 116 | | 116 | | — | | 5 | | — | | 5 | |
Fugro N.V. CVA | | — | | 96 | | 96 | | — | | 6 | | — | | 6 | |
Heineken N.V. (d) | | — | | 613 | | 613 | | — | | 32 | | — | | 32 | |
ING Groep N.V. CVA (g) | | — | | 5,653 | | 5,653 | | — | | 38 | | — | | 38 | |
Koninklijke Ahold N.V. | | — | | 1,733 | | 1,733 | | — | | 22 | | — | | 22 | |
Koninklijke KPN N.V. (d) | | — | | 1,823 | | 1,823 | | — | | 17 | | — | | 17 | |
Koninklijke Philips Electronics N.V. | | — | | 1,872 | | 1,872 | | — | | 37 | | — | | 37 | |
Koninklijke Vopak N.V. | | — | | 116 | | 116 | | — | | 7 | | — | | 7 | |
PostNL N.V. | | — | | 618 | | 618 | | — | | 3 | | — | | 3 | |
TNT Express N.V. | | — | | 586 | | 586 | | — | | 7 | | — | | 7 | |
Unilever N.V. CVA | | — | | 2,128 | | 2,128 | | — | | 71 | | — | | 71 | |
| | | | | | | | — | | 318 | | — | | 318 | |
Norway (0.1%) | | | | | | | | | | | | | | | |
Aker Solutions ASA | | — | | 246 | | 246 | | — | | 4 | | — | | 4 | |
DnB ASA | | — | | 2,312 | | 2,312 | | — | | 23 | | — | | 23 | |
Kvaerner ASA | | — | | 246 | | 246 | | — | | 1 | | — | | 1 | |
Norsk Hydro ASA (d) | | — | | 1,778 | | 1,778 | | — | | 8 | | — | | 8 | |
Orkla ASA | | — | | 1,208 | | 1,208 | | — | | 9 | | — | | 9 | |
Renewable Energy Corp., ASA (d)(g) | | — | | 1,171 | | 1,171 | | — | | — | @ | — | | — | @ |
Statoil ASA | | — | | 2,488 | | 2,488 | | — | | 59 | | — | | 59 | |
Subsea 7 SA | | — | | 420 | | 420 | | — | | 8 | | — | | 8 | |
Telenor ASA | | — | | 995 | | 995 | | — | | 17 | | — | | 17 | |
Veripos, Inc. (g)(i) | | — | | 42 | | 42 | | — | | — | @ | — | | — | @ |
Yara International ASA | | — | | 352 | | 352 | | — | | 15 | | — | | 15 | |
| | | | | | | | — | | 144 | | — | | 144 | |
Poland (0.0%) | | | | | | | | | | | | | | | |
Jeronimo Martins SGPS SA | | — | | 411 | | 411 | | — | | 7 | | — | | 7 | |
| | | | | | | | | | | | | | | |
Portugal (0.0%) | | | | | | | | | | | | | | | |
EDP - Energias de Portugal SA | | — | | 4,041 | | 4,041 | | — | | 9 | | — | | 9 | |
Galp Energia SGPS SA | | — | | 421 | | 421 | | — | | 5 | | — | | 5 | |
Portugal Telecom SGPS SA (Registered) (d) | | — | | 1,039 | | 1,039 | | — | | 5 | | — | | 5 | |
| | | | | | | | — | | 19 | | — | | 19 | |
South Africa (0.0%) | | | | | | | | | | | | | | | |
SABMiller PLC | | — | | 1,566 | | 1,566 | | — | | 63 | | — | | 63 | |
20
Spain (0.2%) | | | | | | | | | | | | | | | |
Abertis Infraestructuras SA | | — | | 502 | | 502 | | — | | 7 | | — | | 7 | |
ACS Actividades de Construccion y Servicios SA (d) | | — | | 323 | | 323 | | — | | 7 | | — | | 7 | |
Banco Bilbao Vizcaya Argentaria SA | | — | | 9,091 | | 9,091 | | — | | 66 | | — | | 66 | |
Banco de Sabadell SA (d) | | — | | 2,358 | | 2,358 | | — | | 5 | | — | | 5 | |
Banco Popular Espanol SA (d) | | — | | 1,762 | | 1,762 | | — | | 4 | | — | | 4 | |
Banco Santander SA | | — | | 16,671 | | 16,671 | | — | | 111 | | — | | 111 | |
CaixaBank (d) | | — | | 1,494 | | 1,494 | | — | | 5 | | — | | 5 | |
Distribuidora Internacional de Alimentacion SA (g) | | — | | 744 | | 744 | | — | | 3 | | — | | 3 | |
Enagas SA | | — | | 316 | | 316 | | — | | 6 | | — | | 6 | |
Ferrovial SA | | — | | 872 | | 872 | | — | | 10 | | — | | 10 | |
Iberdrola SA | | — | | 7,045 | | 7,045 | | — | | 33 | | — | | 33 | |
Inditex SA | | — | | 505 | | 505 | | — | | 52 | | — | | 52 | |
International Consolidated Airlines Group SA (g) | | — | | 1,797 | | 1,797 | | — | | 4 | | — | | 4 | |
Red Electrica Corp., SA (d) | | — | | 227 | | 227 | | — | | 10 | | — | | 10 | |
Repsol YPF SA (d) | | — | | 3,176 | | 3,176 | | — | | 51 | | — | | 51 | |
Telefonica SA | | — | | 4,708 | | 4,708 | | — | | 62 | | — | | 62 | |
| | | | | | | | — | | 436 | | — | | 436 | |
Sweden (0.3%) | | | | | | | | | | | | | | | |
Alfa Laval AB | | — | | 719 | | 719 | | — | | 12 | | — | | 12 | |
Assa Abloy AB, Class B | | — | | 568 | | 568 | | — | | 16 | | — | | 16 | |
Atlas Copco AB, Class A | | — | | 1,379 | | 1,379 | | — | | 30 | | — | | 30 | |
Atlas Copco AB, Class B | | — | | 701 | | 701 | | — | | 13 | | — | | 13 | |
Boliden AB | | — | | 453 | | 453 | | — | | 6 | | — | | 6 | |
Electrolux AB, Class B | | — | | 323 | | 323 | | — | | 6 | | — | | 6 | |
Hennes & Mauritz AB, Class B | | — | | 1,670 | | 1,670 | | — | | 60 | | — | | 60 | |
Hexagon AB, Class B | | — | | 400 | | 400 | | — | | 7 | | — | | 7 | |
Husqvarna AB, Class B | | — | | 622 | | 622 | | — | | 3 | | — | | 3 | |
Investment AB Kinnevik | | — | | 188 | | 188 | | — | | 4 | | — | | 4 | |
Investor AB, Class B | | — | | 738 | | 738 | | — | | 14 | | — | | 14 | |
Millicom International Cellular SA SDR | | — | | 134 | | 134 | | — | | 13 | | — | | 13 | |
Nordea Bank AB | | — | | 5,219 | | 5,219 | | — | | 45 | | — | | 45 | |
Ratos AB, Class B (d) | | — | | 310 | | 310 | | — | | 3 | | — | | 3 | |
Sandvik AB | | — | | 2,004 | | 2,004 | | — | | 26 | | — | | 26 | |
Scania AB, Class B | | — | | 537 | | 537 | | — | | 9 | | — | | 9 | |
Skandinaviska Enskilda Banken AB | | — | | 3,850 | | 3,850 | | — | | 25 | | — | | 25 | |
Skanska AB, Class B | | — | | 408 | | 408 | | — | | 6 | | — | | 6 | |
SKF AB, Class B | | — | | 610 | | 610 | | — | | 12 | | — | | 12 | |
Svenska Cellulosa AB, Class B | | — | | 978 | | 978 | | — | | 15 | | — | | 15 | |
Svenska Handelsbanken AB, Class A | | — | | 1,267 | | 1,267 | | — | | 42 | | — | | 42 | |
Swedbank AB, Class A | | — | | 878 | | 878 | | — | | 14 | | — | | 14 | |
Swedish Match AB | | — | | 725 | | 725 | | — | | 29 | | — | | 29 | |
Tele2 AB, Class B | | — | | 560 | | 560 | | — | | 9 | | — | | 9 | |
Telefonaktiebolaget LM Ericsson, Class B | | — | | 5,064 | | 5,064 | | — | | 46 | | — | | 46 | |
TeliaSonera AB | | — | | 7,441 | | 7,441 | | — | | 48 | | — | | 48 | |
Volvo AB, Class B | | — | | 2,789 | | 2,789 | | — | | 32 | | — | | 32 | |
| | | | | | | | — | | 545 | | — | | 545 | |
21
Switzerland (0.6%) | | | | | | | | | | | | | | | |
ABB Ltd., (Registered) (g) | | — | | 3,378 | | 3,378 | | — | | 55 | | — | | 55 | |
Actelion Ltd., (Registered) (g) | | — | | 305 | | 305 | | — | | 13 | | — | | 13 | |
Adecco SA, (Registered) (g) | | — | | 317 | | 317 | | — | | 14 | | — | | 14 | |
Baloise Holding AG, (Registered) | | — | | 121 | | 121 | | — | | 8 | | — | | 8 | |
Cie Financiere Richemont SA | | — | | 644 | | 644 | | — | | 35 | | — | | 35 | |
Credit Suisse Group AG, (Registered) (g) | | — | | 1,645 | | 1,645 | | — | | 30 | | — | | 30 | |
GAM Holding AG, (g) | | — | | 420 | | 420 | | — | | 5 | | — | | 5 | |
Geberit AG, (Registered) (g) | | — | | 101 | | 101 | | — | | 20 | | — | | 20 | |
Givaudan SA, (Registered) (g) | | — | | 16 | | 16 | | — | | 16 | | — | | 16 | |
Holcim Ltd., (Registered) (g) | | — | | 297 | | 297 | | — | | 16 | | — | | 16 | |
Julius Baer Group Ltd., (g) | | — | | 322 | | 322 | | — | | 12 | | — | | 12 | |
Kuehne & Nagel International AG, (Registered) | | — | | 95 | | 95 | | — | | 10 | | — | | 10 | |
Lonza Group AG, (Registered) (g) | | — | | 151 | | 151 | | — | | 6 | | — | | 6 | |
Nestle SA, (Registered) | | — | | 4,211 | | 4,211 | | — | | 251 | | — | | 251 | |
Novartis AG, (Registered) | | — | | 1,619 | | 1,619 | | — | | 90 | | — | | 90 | |
Roche Holding AG (Genusschein) | | — | | 1,507 | | 1,507 | | — | | 260 | | — | | 260 | |
Schindler Holding AG | | — | | 108 | | 108 | | — | | 12 | | — | | 12 | |
SGS SA, (Registered) | | — | | 15 | | 15 | | — | | 28 | | — | | 28 | |
Sonova Holding AG, (Registered) (g) | | — | | 159 | | 159 | | — | | 15 | | — | | 15 | |
Swatch Group AG (The), | | — | | 43 | | 43 | | — | | 17 | | — | | 17 | |
Swiss Life Holding AG, (Registered) (g) | | — | | 49 | | 49 | | — | | 5 | | — | | 5 | |
Swiss Re AG, (g) | | — | | 187 | | 187 | | — | | 12 | | — | | 12 | |
Syngenta AG, (Registered) | | — | | 170 | | 170 | | — | | 58 | | — | | 58 | |
UBS AG, (Registered) (g) | | — | | 5,035 | | 5,035 | | — | | 59 | | — | | 59 | |
Zurich Insurance Group AG (g) | | — | | 273 | | 273 | | — | | 62 | | — | | 62 | |
| | | | | | | | — | | 1,109 | | — | | 1,109 | |
United Kingdom (1.5%) | | | | | | | | | | | | | | | |
3i Group PLC | | — | | 1,738 | | 1,738 | | — | | 5 | | — | | 5 | |
Admiral Group PLC | | — | | 480 | | 480 | | — | | 9 | | — | | 9 | |
AMEC PLC | | — | | 582 | | 582 | | — | | 9 | | — | | 9 | |
Anglo American PLC | | — | | 1,690 | | 1,690 | | — | | 55 | | — | | 55 | |
ARM Holdings PLC | | — | | 3,157 | | 3,157 | | — | | 25 | | — | | 25 | |
AstraZeneca PLC | | — | | 1,076 | | 1,076 | | — | | 48 | | — | | 48 | |
Aviva PLC | | — | | 5,013 | | 5,013 | | — | | 22 | | — | | 22 | |
BAE Systems PLC | | — | | 6,470 | | 6,470 | | — | | 29 | | — | | 29 | |
Barclays PLC | | — | | 25,136 | | 25,136 | | — | | 64 | | — | | 64 | |
BG Group PLC | | — | | 4,215 | | 4,215 | | — | | 86 | | — | | 86 | |
BHP Billiton PLC | | — | | 3,050 | | 3,050 | | — | | 87 | | — | | 87 | |
BP PLC | | — | | 16,271 | | 16,271 | | — | | 109 | | — | | 109 | |
British American Tobacco PLC | | — | | 2,537 | | 2,537 | | — | | 129 | | — | | 129 | |
British Land Co. PLC REIT | | — | | 1,752 | | 1,752 | | — | | 14 | | — | | 14 | |
British Sky Broadcasting Group PLC | | — | | 2,612 | | 2,612 | | — | | 29 | | — | | 29 | |
BT Group PLC | | — | | 17,422 | | 17,422 | | — | | 58 | | — | | 58 | |
Burberry Group PLC | | — | | 568 | | 568 | | — | | 12 | | — | | 12 | |
Capita PLC | | — | | 1,466 | | 1,466 | | — | | 15 | | — | | 15 | |
Capital Shopping Centres Group PLC REIT | | — | | 1,090 | | 1,090 | | — | | 6 | | — | | 6 | |
Centrica PLC | | — | | 8,109 | | 8,109 | | — | | 40 | | — | | 40 | |
Compass Group PLC | | — | | 3,720 | | 3,720 | | — | | 39 | | — | | 39 | |
Diageo PLC | | — | | 3,376 | | 3,376 | | — | | 87 | | — | | 87 | |
Experian PLC | | — | | 2,008 | | 2,008 | | — | | 28 | | — | | 28 | |
G4S PLC | | — | | 4,668 | | 4,668 | | — | | 20 | | — | | 20 | |
GlaxoSmithKline PLC | | — | | 3,788 | | 3,788 | | — | | 86 | | — | | 86 | |
Hammerson PLC REIT | | — | | 1,386 | | 1,386 | | — | | 10 | | — | | 10 | |
HSBC Holdings PLC | | — | | 11,047 | | 11,047 | | — | | 97 | | — | | 97 | |
ICAP PLC | | — | | 838 | | 838 | | — | | 4 | | — | | 4 | |
Imperial Tobacco Group PLC | | — | | 1,426 | | 1,426 | | — | | 55 | | — | | 55 | |
Inmarsat PLC | | — | | 301 | | 301 | | — | | 2 | | — | | 2 | |
International Power PLC | | — | | 2,772 | | 2,772 | | — | | 18 | | — | | 18 | |
Investec PLC | | — | | 1,018 | | 1,018 | | — | | 6 | | — | | 6 | |
Johnson Matthey PLC | | — | | 352 | | 352 | | — | | 12 | | — | | 12 | |
Land Securities Group PLC REIT | | — | | 1,495 | | 1,495 | | — | | 17 | | — | | 17 | |
Legal & General Group PLC | | — | | 8,309 | | 8,309 | | — | | 17 | | — | | 17 | |
Lloyds Banking Group PLC (g) | | — | | 34,284 | | 34,284 | | — | | 17 | | — | | 17 | |
22
Man Group PLC | | — | | 2,954 | | 2,954 | | — | | 4 | | — | | 4 | |
Marks & Spencer Group PLC | | — | | 1,874 | | 1,874 | | — | | 10 | | — | | 10 | |
National Grid PLC | | — | | 4,893 | | 4,893 | | — | | 52 | | — | | 52 | |
Next PLC | | — | | 430 | | 430 | | — | | 22 | | — | | 22 | |
Old Mutual PLC | | — | | 6,806 | | 6,806 | | — | | 16 | | — | | 16 | |
Petrofac Ltd. | | — | | 509 | | 509 | | — | | 11 | | — | | 11 | |
Prudential PLC | | — | | 4,785 | | 4,785 | | — | | 55 | | — | | 55 | |
Randgold Resources Ltd. | | — | | 113 | | 113 | | — | | 10 | | — | | 10 | |
Reckitt Benckiser Group PLC | | — | | 1,043 | | 1,043 | | — | | 55 | | — | | 55 | |
Reed Elsevier PLC | | — | | 2,457 | | 2,457 | | — | | 20 | | — | | 20 | |
Resolution Ltd. | | — | | 2,787 | | 2,787 | | — | | 9 | | — | | 9 | |
Rexam PLC | | — | | 1,501 | | 1,501 | | — | | 10 | | — | | 10 | |
Rio Tinto PLC | | — | | 1,931 | | 1,931 | | — | | 92 | | — | | 92 | |
Rolls-Royce Holdings PLC (g) | | — | | 4,685 | | 4,685 | | — | | 63 | | — | | 63 | |
Royal Bank of Scotland Group PLC (g) | | — | | 4,230 | | 4,230 | | — | | 14 | | — | | 14 | |
Royal Dutch Shell PLC, Class A | | — | | 4,232 | | 4,232 | | — | | 143 | | — | | 143 | |
Royal Dutch Shell PLC, Class B | | — | | 3,390 | | 3,390 | | — | | 118 | | — | | 118 | |
RSA Insurance Group PLC | | — | | 6,889 | | 6,889 | | — | | 12 | | — | | 12 | |
Schroders PLC | | — | | 174 | | 174 | | — | | 4 | | — | | 4 | |
Segro PLC REIT | | — | | 1,460 | | 1,460 | | — | | 5 | | — | | 5 | |
Severn Trent PLC | | — | | 378 | | 378 | | — | | 10 | | — | | 10 | |
Shire PLC | | — | | 1,488 | | 1,488 | | — | | 43 | | — | | 43 | |
Smith & Nephew PLC | | — | | 2,021 | | 2,021 | | — | | 20 | | — | | 20 | |
Smiths Group PLC | | — | | 786 | | 786 | | — | | 13 | | — | | 13 | |
SSE PLC | | — | | 1,494 | | 1,494 | | — | | 33 | | — | | 33 | |
Standard Chartered PLC | | — | | 1,916 | | 1,916 | | — | | 42 | | — | | 42 | |
Standard Life PLC | | — | | 3,659 | | 3,659 | | — | | 13 | | — | | 13 | |
Tesco PLC | | — | | 9,275 | | 9,275 | | — | | 45 | | — | | 45 | |
Tullow Oil PLC | | — | | 1,414 | | 1,414 | | — | | 33 | | — | | 33 | |
Unilever PLC | | — | | 1,769 | | 1,769 | | — | | 59 | | — | | 59 | |
United Utilities Group PLC | | — | | 1,153 | | 1,153 | | — | | 12 | | — | | 12 | |
Vodafone Group PLC | | — | | 89,770 | | 89,770 | | — | | 252 | | — | | 252 | |
Weir Group PLC (The) | | — | | 345 | | 345 | | — | | 8 | | — | | 8 | |
WM Morrison Supermarkets PLC | | — | | 3,846 | | 3,846 | | — | | 16 | | — | | 16 | |
Wolseley PLC | | — | | 454 | | 454 | | — | | 17 | | — | | 17 | |
WPP PLC | | — | | 4,667 | | 4,667 | | — | | 57 | | — | | 57 | |
Xstrata PLC | | — | | 3,372 | | 3,372 | | — | | 43 | | — | | 43 | |
| | | | | | | | — | | 2,807 | | — | | 2,807 | |
23
United States (46.3%) | | | | | | | | | | | | | | | |
3M Co. | | — | | 17 | | 17 | | — | | 2 | | — | | 2 | |
Abbott Laboratories, (d) | | 55,675 | | 1,701 | | 57,376 | | 3,589 | | 110 | | — | | 3,699 | |
Accenture PLC, Class A (d) | | — | | 383 | | 383 | | — | | 23 | | — | | 23 | |
ACCO Brands Corp. (d)(g) | | 15,724 | | 559 | | 16,283 | | 163 | | 6 | | — | | 169 | |
Adobe Systems, Inc. (g) | | — | | 458 | | 458 | | — | | 15 | | — | | 15 | |
AES Corp. (The) (d) | | — | | 320 | | 320 | | — | | 4 | | — | | 4 | |
Aetna, Inc. | | — | | 133 | | 133 | | — | | 5 | | — | | 5 | |
Agilent Technologies, Inc. (d) | | — | | 201 | | 201 | | — | | 8 | | — | | 8 | |
Alexion Pharmaceuticals, Inc. (d)(g) | | — | | 110 | | 110 | | — | | 11 | | — | | 11 | |
Allergan, Inc. (d) | | — | | 577 | | 577 | | — | | 53 | | — | | 53 | |
Alpha Natural Resources, Inc. (g) | | — | | 123 | | 123 | | — | | 1 | | — | | 1 | |
Altera Corp. (d) | | — | | 1,240 | | 1,240 | | — | | 42 | | — | | 42 | |
Altria Group, Inc. | | — | | 340 | | 340 | | — | | 12 | | — | | 12 | |
Amazon.com, Inc. (g) | | — | | 132 | | 132 | | — | | 30 | | — | | 30 | |
Ameren Corp. | | — | | 194 | | 194 | | — | | 6 | | — | | 6 | |
American Electric Power Co., Inc. (d) | | — | | 366 | | 366 | | — | | 15 | | — | | 15 | |
American Express Co. | | — | | 617 | | 617 | | — | | 36 | | — | | 36 | |
American Tower Corp. REIT (d) | | — | | 419 | | 419 | | — | | 29 | | — | | 29 | |
Ameriprise Financial, Inc. | | — | | 200 | | 200 | | — | | 10 | | — | | 10 | |
AmerisourceBergen Corp. (d) | | — | | 167 | | 167 | | — | | 7 | | — | | 7 | |
Amgen, Inc. | | — | | 957 | | 957 | | — | | 70 | | — | | 70 | |
Amphenol Corp., Class A (d) | | — | | 282 | | 282 | | — | | 15 | | — | | 15 | |
Anadarko Petroleum Corp. | | — | | 445 | | 445 | | — | | 29 | | — | | 29 | |
Analog Devices, Inc. (d) | | — | | 1,147 | | 1,147 | | — | | 43 | | — | | 43 | |
Annaly Capital Management, Inc. REIT (d) | | — | | 618 | | 618 | | — | | 10 | | — | | 10 | |
Apache Corp. | | — | | 114 | | 114 | | — | | 10 | | — | | 10 | |
Apple, Inc. (g) | | — | | 420 | | 420 | | — | | 245 | | — | | 245 | |
Applied Materials, Inc. | | — | | 4,066 | | 4,066 | | — | | 47 | | — | | 47 | |
AT&T, Inc. (d) | | — | | 1,746 | | 1,746 | | — | | 62 | | — | | 62 | |
Automatic Data Processing, Inc. (d) | | — | | 146 | | 146 | | — | | 8 | | — | | 8 | |
Avago Technologies Ltd. (d) | | — | | 790 | | 790 | | — | | 28 | | — | | 28 | |
Avery Dennison Corp. (d) | | — | | 126 | | 126 | | — | | 3 | | — | | 3 | |
Baker Hughes, Inc. (d) | | — | | 510 | | 510 | | — | | 21 | | — | | 21 | |
Bank of America Corp. | | — | | 6,132 | | 6,132 | | — | | 50 | | — | | 50 | |
Bank of New York Mellon Corp. (The) (d) | | — | | 863 | | 863 | | — | | 19 | | — | | 19 | |
Baxter International, Inc. (d) | | — | | 179 | | 179 | | — | | 9 | | — | | 9 | |
BB&T Corp. (d) | | — | | 846 | | 846 | | — | | 26 | | — | | 26 | |
Becton Dickinson and Co. (d) | | — | | 122 | | 122 | | — | | 9 | | — | | 9 | |
Bed Bath & Beyond, Inc. (g) | | — | | 136 | | 136 | | — | | 8 | | — | | 8 | |
Biogen Idec, Inc. (d)(g) | | — | | 265 | | 265 | | — | | 38 | | — | | 38 | |
BlackRock, Inc. | | — | | 74 | | 74 | | — | | 13 | | — | | 13 | |
Boeing Co. (The) | | — | | 18 | | 18 | | — | | 1 | | — | | 1 | |
Boston Properties, Inc., REIT (d) | | — | | 79 | | 79 | | — | | 9 | | — | | 9 | |
Boston Scientific Corp. (g) | | — | | 780 | | 780 | | — | | 4 | | — | | 4 | |
Bristol-Myers Squibb Co. (d) | | 113,640 | | 3,516 | | 117,156 | | 4,085 | | 126 | | — | | 4,211 | |
Broadcom Corp., Class A (g) | | — | | 1,757 | | 1,757 | | — | | 59 | | — | | 59 | |
C.H. Robinson Worldwide, Inc. (d) | | — | | 104 | | 104 | | — | | 6 | | — | | 6 | |
Cablevision Systems Corp. (d) | | — | | 334 | | 334 | | — | | 4 | | — | | 4 | |
Cameron International Corp. (g) | | — | | 206 | | 206 | | — | | 9 | | — | | 9 | |
Capital One Financial Corp. (d) | | — | | 200 | | 200 | | — | | 11 | | — | | 11 | |
Cardinal Health, Inc. (d) | | — | | 182 | | 182 | | — | | 8 | | — | | 8 | |
CareFusion Corp. (g) | | — | | 238 | | 238 | | — | | 6 | | — | | 6 | |
Carnival Corp. (d) | | — | | 1 | | 1 | | — | | — | @ | — | | — | @ |
Caterpillar, Inc. | | — | | 19 | | 19 | | — | | 2 | | — | | 2 | |
CBS Corp., Class B | | — | | 586 | | 586 | | — | | 19 | | — | | 19 | |
Celgene Corp. (g) | | — | | 251 | | 251 | | — | | 16 | | — | | 16 | |
CenterPoint Energy, Inc. | | — | | 193 | | 193 | | — | | 4 | | — | | 4 | |
CenturyLink, Inc. (d) | | 38,980 | | 1,611 | | 40,591 | | 1,539 | | 64 | | — | | 1,603 | |
Cerner Corp. (d)(g) | | — | | 133 | | 133 | | — | | 11 | | — | | 11 | |
CF Industries Holdings, Inc. (d) | | — | | 4 | | 4 | | — | | 1 | | — | | 1 | |
Charles Schwab Corp. (The) (d) | | — | | 1,306 | | 1,306 | | — | | 17 | | — | | 17 | |
Chesapeake Energy Corp. (d) | | — | | 290 | | 290 | | — | | 5 | | — | | 5 | |
Chevron Corp. | | 26,550 | | 1,158 | | 27,708 | | 2,801 | | 122 | | — | | 2,923 | |
24
Chipotle Mexican Grill, Inc. (d)(g) | | — | | 20 | | 20 | | — | | 8 | | — | | 8 | |
Chubb Corp. (The) | | 45,050 | | 1,276 | | 46,326 | | 3,281 | | 93 | | — | | 3,374 | |
Cigna Corp. (d) | | — | | 137 | | 137 | | — | | 6 | | — | | 6 | |
Cintas Corp. (d) | | — | | 184 | | 184 | | — | | 7 | | — | | 7 | |
Cisco Systems, Inc. | | — | | 2,478 | | 2,478 | | — | | 43 | | — | | 43 | |
CIT Group, Inc. (g) | | — | | 162 | | 162 | | — | | 6 | | — | | 6 | |
Citigroup, Inc. (n) | | — | | 1,761 | | 1,761 | | — | | 49 | | — | | 49 | |
Citrix Systems, Inc. (g) | | — | | 107 | | 107 | | — | | 8 | | — | | 8 | |
Cliffs Natural Resources, Inc. (d) | | — | | 9 | | 9 | | — | | — | @ | — | | — | @ |
CME Group, Inc. | | — | | 39 | | 39 | | — | | 10 | | — | | 10 | |
Coach, Inc. (d) | | — | | 151 | | 151 | | — | | 9 | | — | | 9 | |
Coca-Cola Co. (The) (d) | | — | | 633 | | 633 | | — | | 49 | | — | | 49 | |
Coca-Cola Enterprises, Inc. | | — | | 219 | | 219 | | — | | 6 | | — | | 6 | |
Cognizant Technology Solutions Corp., Class A (g) | | — | | 222 | | 222 | | — | | 13 | | — | | 13 | |
Colgate-Palmolive Co. (d) | | — | | 806 | | 806 | | — | | 84 | | — | | 84 | |
Comcast Corp. Class A | | — | | 474 | | 474 | | — | | 15 | | — | | 15 | |
Comcast Corp., Special Class A (d) | | — | | 442 | | 442 | | — | | 14 | | — | | 14 | |
Comerica, Inc. | | — | | 100 | | 100 | | — | | 3 | | — | | 3 | |
ConAgra Foods, Inc. | | 94,270 | | 2,700 | | 96,970 | | 2,444 | | 70 | | — | | 2,514 | |
Concho Resources, Inc. (d)(g) | | — | | 54 | | 54 | | — | | 5 | | — | | 5 | |
ConocoPhillips (d) | | 39,035 | | 1,418 | | 40,453 | | 2,181 | | 79 | | — | | 2,260 | |
CONSOL Energy, Inc. (d) | | — | | 147 | | 147 | | — | | 4 | | — | | 4 | |
Consolidated Edison, Inc. (d) | | — | | 148 | | 148 | | — | | 9 | | — | | 9 | |
Costco Wholesale Corp. (d) | | — | | 444 | | 444 | | — | | 42 | | — | | 42 | |
Covidien PLC | | — | | 206 | | 206 | | — | | 11 | | — | | 11 | |
CR Bard, Inc. (d) | | — | | 55 | | 55 | | — | | 6 | | — | | 6 | |
Crown Castle International Corp. (g) | | — | | 557 | | 557 | | — | | 33 | | — | | 33 | |
CSX Corp. (d) | | — | | 455 | | 455 | | — | | 10 | | — | | 10 | |
Cummins, Inc. | | — | | 5 | | 5 | | — | | — | @ | — | | — | @ |
CVS Caremark Corp. | | — | | 323 | | 323 | | — | | 15 | | — | | 15 | |
D.R. Horton, Inc. (d) | | — | | 8,900 | | 8,900 | | — | | 164 | | — | | 164 | |
Danaher Corp. (d) | | — | | 19 | | 19 | | — | | 1 | | — | | 1 | |
DaVita, Inc. (g) | | — | | 95 | | 95 | | — | | 9 | | — | | 9 | |
Deere & Co. (d) | | — | | 13 | | 13 | | — | | 1 | | — | | 1 | |
Dell, Inc. (d)(g) | | — | | 769 | | 769 | | — | | 10 | | — | | 10 | |
Deltic Timber Corp. (d) | | — | | 100 | | 100 | | — | | 6 | | — | | 6 | |
Devon Energy Corp. (d) | | — | | 168 | | 168 | | — | | 10 | | — | | 10 | |
DIRECTV, Class A (d)(g) | | — | | 546 | | 546 | | — | | 27 | | — | | 27 | |
Discover Financial Services | | — | | 342 | | 342 | | — | | 12 | | — | | 12 | |
Discovery Communications, Inc. (d)(g) | | — | | 342 | | 342 | | — | | 18 | | — | | 18 | |
Discovery Communications, Inc., Class C (d)(g) | | — | | 342 | | 342 | | — | | 17 | | — | | 17 | |
Dominion Resources, Inc. | | — | | 167 | | 167 | | — | | 9 | | — | | 9 | |
DTE Energy Co. (d) | | — | | 122 | | 122 | | — | | 7 | | — | | 7 | |
Duke Energy Corp. (d) | | — | | 346 | | 346 | | — | | 8 | | — | | 8 | |
Dun & Bradstreet Corp. (The) (d) | | — | | 72 | | 72 | | — | | 5 | | — | | 5 | |
Eagle Materials, Inc. (d) | | — | | 400 | | 400 | | — | | 15 | | — | | 15 | |
Eaton Corp. | | — | | 16 | | 16 | | — | | 1 | | — | | 1 | |
eBay, Inc., (d)(g) | | — | | 560 | | 560 | | — | | 24 | | — | | 24 | |
Ecolab, Inc. (d) | | — | | 17 | | 17 | | — | | 1 | | — | | 1 | |
Edison International (d) | | — | | 264 | | 264 | | — | | 12 | | — | | 12 | |
Edwards Lifesciences Corp. (d)(g) | | — | | 73 | | 73 | | — | | 8 | | — | | 8 | |
EI du Pont de Nemours & Co. (d) | | 47,270 | | 1,375 | | 48,645 | | 2,390 | | 70 | | — | | 2,460 | |
Eli Lilly & Co. | | — | | 356 | | 356 | | — | | 15 | | — | | 15 | |
EMC Corp. (d)(g) | | — | | 1,059 | | 1,059 | | — | | 27 | | — | | 27 | |
Emerson Electric Co. | | — | | 20 | | 20 | | — | | 1 | | — | | 1 | |
Entergy Corp. (d) | | — | | 123 | | 123 | | — | | 8 | | — | | 8 | |
EOG Resources, Inc. | | — | | 292 | | 292 | | — | | 26 | | — | | 26 | |
Equity Residential REIT (d) | | — | | 159 | | 159 | | — | | 10 | | — | | 10 | |
Estee Lauder Cos., Inc. (The), Class A | | — | | 274 | | 274 | | — | | 15 | | — | | 15 | |
Exelon Corp. | | — | | 380 | | 380 | | — | | 14 | | — | | 14 | |
Express Scripts Holding Co. (g) | | — | | 270 | | 270 | | — | | 15 | | — | | 15 | |
Exxon Mobil Corp. | | 30,900 | | 1,992 | | 32,892 | | 2,644 | | 170 | | — | | 2,814 | |
Fastenal Co. | | — | | 8 | | 8 | | — | | — | @ | — | | — | @ |
FedEx Corp. (d) | | — | | 150 | | 150 | | — | | 14 | | — | | 14 | |
25
Fifth Third Bancorp (d) | | — | | 1,002 | | 1,002 | | — | | 13 | | — | | 13 | |
FirstEnergy Corp. | | — | | 236 | | 236 | | — | | 12 | | — | | 12 | |
Fluor Corp. | | — | | 24 | | 24 | | — | | 1 | | — | | 1 | |
FMC Technologies, Inc. (d)(g) | | — | | 211 | | 211 | | — | | 8 | | — | | 8 | |
Ford Motor Co. (d) | | — | | 1,157 | | 1,157 | | — | | 11 | | — | | 11 | |
Forest Laboratories, Inc. (g) | | — | | 702 | | 702 | | — | | 25 | | — | | 25 | |
Franklin Resources, Inc. (d) | | — | | 83 | | 83 | | — | | 9 | | — | | 9 | |
Frontier Communications Corp. (d) | | — | | 743 | | 743 | | — | | 3 | | — | | 3 | |
General Dynamics Corp. (d) | | — | | 39 | | 39 | | — | | 3 | | — | | 3 | |
General Electric Co. | | 134,870 | | 4,225 | | 139,095 | | 2,811 | | 88 | | — | | 2,899 | |
General Growth Properties, Inc. REIT (d) | | — | | 702 | | 702 | | — | | 13 | | — | | 13 | |
General Mills, Inc. (d) | | — | | 603 | | 603 | | — | | 23 | | — | | 23 | |
Georgia Gulf Corp. (d) | | — | | 300 | | 300 | | — | | 8 | | — | | 8 | |
Gilead Sciences, Inc. (d)(g) | | — | | 512 | | 512 | | — | | 26 | | — | | 26 | |
Goldman Sachs Group, Inc. (The) | | — | | 302 | | 302 | | — | | 29 | | — | | 29 | |
Goodrich Corp. | | — | | 3 | | 3 | | — | | — | @ | — | | — | @ |
Google, Inc., Class A (g) | | — | | 179 | | 179 | | — | | 104 | | — | | 104 | |
H.J. Heinz Co. (d) | | — | | 139 | | 139 | | — | | 8 | | — | | 8 | |
Halliburton Co. | | — | | 895 | | 895 | | — | | 25 | | — | | 25 | |
HCP, Inc. REIT | | — | | 219 | | 219 | | — | | 10 | | — | | 10 | |
Health Care, Inc. REIT | | — | | 159 | | 159 | | — | | 9 | | — | | 9 | |
Henry Schein, Inc. (d)(g) | | — | | 74 | | 74 | | — | | 6 | | — | | 6 | |
Hershey Co. (The) (d) | | — | | 74 | | 74 | | — | | 5 | | — | | 5 | |
Hess Corp. (d) | | — | | 104 | | 104 | | — | | 5 | | — | | 5 | |
Hewlett-Packard Co. (d) | | 40,115 | | 1,809 | | 41,924 | | 807 | | 36 | | — | | 843 | |
Home Depot, Inc. (d) | | 71,305 | | 2,069 | | 73,374 | | 3,778 | | 110 | | — | | 3,888 | |
Honeywell International, Inc. | | — | | 24 | | 24 | | — | | 1 | | — | | 1 | |
Hospira, Inc. (d)(g) | | — | | 350 | | 350 | | — | | 12 | | — | | 12 | |
Hudson City Bancorp, Inc. (d) | | — | | 200 | | 200 | | — | | 1 | | — | | 1 | |
Human Genome Sciences, Inc. (d)(g) | | — | | 641 | | 641 | | — | | 8 | | — | | 8 | |
Humana, Inc. (d) | | — | | 59 | | 59 | | — | | 5 | | — | | 5 | |
Illinois Tool Works, Inc. (d) | | 42,525 | | 1,268 | | 43,793 | | 2,249 | | 67 | | — | | 2,316 | |
Integrys Energy Group, Inc. (d) | | 43,680 | | 1,243 | | 44,923 | | 2,484 | | 71 | | — | | 2,555 | |
Intel Corp. | | 83,805 | | 18,311 | | 102,116 | | 2,233 | | 488 | | — | | 2,721 | |
IntercontinentalExchange, Inc. (d)(g) | | — | | 57 | | 57 | | — | | 8 | | — | | 8 | |
International Business Machines Corp. | | 13,300 | | 939 | | 14,239 | | 2,601 | | 184 | | — | | 2,785 | |
Interpublic Group of Cos., Inc. (The) | | — | | 759 | | 759 | | — | | 8 | | — | | 8 | |
Intuit, Inc. (d) | | — | | 243 | | 243 | | — | | 14 | | — | | 14 | |
Intuitive Surgical, Inc. (d)(g) | | — | | 21 | | 21 | | — | | 12 | | — | | 12 | |
Invesco Ltd. | | — | | 415 | | 415 | | — | | 9 | | — | | 9 | |
Iron Mountain, Inc. (d) | | — | | 257 | | 257 | | — | | 8 | | — | | 8 | |
Johnson & Johnson (d) | | — | | 490 | | 490 | | — | | 33 | | — | | 33 | |
Johnson Controls, Inc. (d) | | 45,180 | | 2,224 | | 47,404 | | 1,252 | | 62 | | — | | 1,314 | |
Joy Global, Inc. | | — | | 24 | | 24 | | — | | 1 | | — | | 1 | |
JPMorgan Chase & Co. | | 71,445 | | 4,198 | | 75,643 | | 2,553 | | 150 | | — | | 2,703 | |
Juniper Networks, Inc. (g) | | — | | 620 | | 620 | | — | | 10 | | — | | 10 | |
KB Home (d) | | — | | 2,200 | | 2,200 | | — | | 22 | | — | | 22 | |
Kellogg Co. (d) | | — | | 341 | | 341 | | — | | 17 | | — | | 17 | |
KeyCorp (d) | | — | | 669 | | 669 | | — | | 5 | | — | | 5 | |
Kimco Realty Corp. REIT (d) | | — | | 402 | | 402 | | — | | 8 | | — | | 8 | |
KLA-Tencor Corp. | | — | | 444 | | 444 | | — | | 22 | | — | | 22 | |
Kohl’s Corp. (d) | | — | | 131 | | 131 | | — | | 6 | | — | | 6 | |
Kraft Foods, Inc., Class A (d) | | — | | 252 | | 252 | | — | | 10 | | — | | 10 | |
Kroger Co. (The) (d) | | — | | 610 | | 610 | | — | | 14 | | — | | 14 | |
Laboratory Corp. of America Holdings (d)(g) | | — | | 77 | | 77 | | — | | 7 | | — | | 7 | |
Lam Research Corp. (g) | | — | | 633 | | 633 | | — | | 24 | | — | | 24 | |
Las Vegas Sands Corp. | | — | | 173 | | 173 | | — | | 8 | | — | | 8 | |
Lennar Corp., Class A (d) | | — | | 5,000 | | 5,000 | | — | | 155 | | — | | 155 | |
Li & Fung Ltd., (h) | | — | | 16,000 | | 16,000 | | — | | 31 | | — | | 31 | |
Liberty Global, Inc., Series A (d)(g) | | — | | 217 | | 217 | | — | | 11 | | — | | 11 | |
Liberty Global, Inc., Series C (d)(g) | | — | | 242 | | 242 | | — | | 12 | | — | | 12 | |
Liberty Property Trust, REIT (d) | | — | | 261 | | 261 | | — | | 10 | | — | | 10 | |
Life Technologies Corp. (d)(g) | | — | | 158 | | 158 | | — | | 7 | | — | | 7 | |
Linear Technology Corp. (d) | | — | | 691 | | 691 | | — | | 22 | | — | | 22 | |
26
Lockheed Martin Corp. (d) | | — | | 8 | | 8 | | — | | 1 | | — | | 1 | |
Louisiana-Pacific Corp. (d)(g) | | — | | 1,200 | | 1,200 | | — | | 13 | | — | | 13 | |
Lowe’s Cos., Inc. (d) | | — | | 501 | | 501 | | — | | 14 | | — | | 14 | |
LSI Corp. (d)(g) | | — | | 2,585 | | 2,585 | | — | | 16 | | — | | 16 | |
Ltd. Brands, Inc. (d) | | — | | 165 | | 165 | | — | | 7 | | — | | 7 | |
M&T Bank Corp. (d) | | — | | 90 | | 90 | | — | | 7 | | — | | 7 | |
M/I Homes, Inc. (d)(g) | | — | | 500 | | 500 | | — | | 9 | | — | | 9 | |
Macerich Co. (The) REIT (d) | | — | | 159 | | 159 | | — | | 9 | | — | | 9 | |
Manpower, Inc. (d) | | — | | 117 | | 117 | | — | | 4 | | — | | 4 | |
Marathon Oil Corp. | | — | | 283 | | 283 | | — | | 7 | | — | | 7 | |
Marathon Petroleum Corp. | | — | | 250 | | 250 | | — | | 11 | | — | | 11 | |
Marriott International, Inc., Class A (d) | | — | | 1 | | 1 | | — | | — | @ | — | | — | @ |
Marvell Technology Group Ltd. | | — | | 1,493 | | 1,493 | | — | | 17 | | — | | 17 | |
Masco Corp. (d) | | — | | 3,000 | | 3,000 | | — | | 42 | | — | | 42 | |
Mastercard, Inc., Class A (d) | | — | | 136 | | 136 | | — | | 58 | | — | | 58 | |
Maxim Integrated Products, Inc. | | — | | 944 | | 944 | | — | | 24 | | — | | 24 | |
McDonald’s Corp. | | 29,050 | | 1,148 | | 30,198 | | 2,572 | | 102 | | — | | 2,674 | |
McGraw-Hill Cos., Inc. (The) (d) | | — | | 288 | | 288 | | — | | 13 | | — | | 13 | |
McKesson Corp. | | — | | 131 | | 131 | | — | | 12 | | — | | 12 | |
MDC Holdings, Inc. | | — | | 1,300 | | 1,300 | | — | | 42 | | — | | 42 | |
Mead Johnson Nutrition Co. (d) | | — | | 217 | | 217 | | — | | 17 | | — | | 17 | |
MeadWestvaco Corp. (d) | | 47,670 | | 1,697 | | 49,367 | | 1,371 | | 49 | | — | | 1,420 | |
Medtronic, Inc. | | — | | 312 | | 312 | | — | | 12 | | — | | 12 | |
Merck & Co., Inc. | | — | | 251 | | 251 | | — | | 10 | | — | | 10 | |
Meritage Homes Corp. (d)(g) | | — | | 900 | | 900 | | — | | 31 | | — | | 31 | |
Microchip Technology, Inc. (d) | | — | | 629 | | 629 | | — | | 21 | | — | | 21 | |
Micron Technology, Inc. (g) | | — | | 2,947 | | 2,947 | | — | | 19 | | — | | 19 | |
Microsoft Corp. | | 99,060 | | 5,150 | | 104,210 | | 3,030 | | 158 | | — | | 3,188 | |
Mohawk Industries, Inc. (d)(g) | | — | | 600 | | 600 | | — | | 42 | | — | | 42 | |
Monsanto Co. | | — | | 28 | | 28 | | — | | 2 | | — | | 2 | |
Mosaic Co. (The) | | — | | 15 | | 15 | | — | | 1 | | — | | 1 | |
Murphy Oil Corp. (d) | | — | | 148 | | 148 | | — | | 7 | | — | | 7 | |
NASDAQ OMX Group, Inc. (The) | | — | | 200 | | 200 | | — | | 5 | | — | | 5 | |
National Oilwell Varco, Inc. | | — | | 338 | | 338 | | — | | 22 | | — | | 22 | |
NetApp, Inc. (d)(g) | | — | | 478 | | 478 | | — | | 15 | | — | | 15 | |
New York Community Bancorp, Inc. (d) | | — | | 200 | | 200 | | — | | 2 | | — | | 2 | |
Newfield Exploration Co. (g) | | — | | 157 | | 157 | | — | | 5 | | — | | 5 | |
Newmont Mining Corp. | | — | | 26 | | 26 | | — | | 1 | | — | | 1 | |
News Corp., Class A (d) | | — | | 926 | | 926 | | — | | 21 | | — | | 21 | |
News Corp., Class B | | — | | 551 | | 551 | | — | | 12 | | — | | 12 | |
NextEra Energy, Inc. | | — | | 140 | | 140 | | — | | 10 | | — | | 10 | |
NII Holdings, Inc. (d)(g) | | — | | 112 | | 112 | | — | | 1 | | — | | 1 | |
NIKE, Inc., Class B | | — | | 200 | | 200 | | — | | 18 | | — | | 18 | |
Noble Corp. (g) | | — | | 200 | | 200 | | — | | 6 | | — | | 6 | |
Noble Energy, Inc. | | — | | 89 | | 89 | | — | | 8 | | — | | 8 | |
Nordstrom, Inc. (d) | �� | — | | 62 | | 62 | | — | | 3 | | — | | 3 | |
Norfolk Southern Corp. | | 32,410 | | 1,375 | | 33,785 | | 2,326 | | 99 | | — | | 2,425 | |
Northrop Grumman Corp. (d) | | — | | 10 | | 10 | | — | | 1 | | — | | 1 | |
NVIDIA Corp. (d)(g) | | — | | 1,732 | | 1,732 | | — | | 24 | | — | | 24 | |
NVR, Inc. (d)(g) | | — | | 100 | | 100 | | — | | 85 | | — | | 85 | |
O’Reilly Automotive, Inc. (d)(g) | | — | | 114 | | 114 | | — | | 10 | | — | | 10 | |
Occidental Petroleum Corp. | | — | | 750 | | 750 | | — | | 64 | | — | | 64 | |
Omnicom Group, Inc. (d) | | — | | 220 | | 220 | | — | | 11 | | — | | 11 | |
Oneok, Inc. (d) | | — | | 244 | | 244 | | — | | 10 | | — | | 10 | |
Oracle Corp. | | — | | 1,754 | | 1,754 | | — | | 52 | | — | | 52 | |
Owens Corning (d)(g) | | — | | 1,000 | | 1,000 | | — | | 29 | | — | | 29 | |
PACCAR, Inc. (d) | | — | | 12 | | 12 | | — | | — | @ | — | | — | @ |
Peabody Energy Corp. | | — | | 341 | | 341 | | — | | 8 | | — | | 8 | |
People’s United Financial, Inc. (d) | | — | | 100 | | 100 | | — | | 1 | | — | | 1 | |
PepsiCo, Inc. | | — | | 677 | | 677 | | — | | 48 | | — | | 48 | |
Pfizer, Inc. | | — | | 966 | | 966 | | — | | 22 | | — | | 22 | |
PG&E Corp. (d) | | — | | 262 | | 262 | | — | | 12 | | — | | 12 | |
Philip Morris International, Inc. | | 28,700 | | 1,718 | | 30,418 | | 2,504 | | 150 | | — | | 2,654 | |
Phillips 66 (g) | | 19,517 | | 709 | | 20,226 | | 649 | | 24 | | — | | 673 | |
27
Pioneer Natural Resources Co. | | — | | 131 | | 131 | | — | | 12 | | — | | 12 | |
Pitney Bowes, Inc. (d) | | — | | 267 | | 267 | | — | | 4 | | — | | 4 | |
Plum Creek Timber Co., Inc., REIT (d) | | — | | 261 | | 261 | | — | | 10 | | — | | 10 | |
PNC Financial Services Group, Inc. | | — | | 354 | | 354 | | — | | 22 | | — | | 22 | |
PPL Corp. (d) | | — | | 276 | | 276 | | — | | 8 | | — | | 8 | |
Praxair, Inc. (d) | | — | | 15 | | 15 | | — | | 2 | | — | | 2 | |
Precision Castparts Corp. | | — | | 3 | | 3 | | — | | — | @ | — | | — | @ |
Priceline.com, Inc. (d)(g) | | — | | 24 | | 24 | | — | | 16 | | — | | 16 | |
Procter & Gamble Co. (The) | | — | | 2,512 | | 2,512 | | — | | 154 | | — | | 154 | |
Progress Energy, Inc. (d) | | — | | 72 | | 72 | | — | | 4 | | — | | 4 | |
ProLogis, Inc., REIT (d) | | — | | 118 | | 118 | | — | | 4 | | — | | 4 | |
Public Service Enterprise Group, Inc. (d) | | — | | 325 | | 325 | | — | | 11 | | — | | 11 | |
Public Storage, REIT (d) | | — | | 75 | | 75 | | — | | 11 | | — | | 11 | |
Pulte Group, Inc. (d)(g) | | — | | 10,700 | | 10,700 | | — | | 114 | | — | | 114 | |
Qualcomm, Inc. | | — | | 818 | | 818 | | — | | 46 | | — | | 46 | |
Quest Diagnostics, Inc. (d) | | — | | 115 | | 115 | | — | | 7 | | — | | 7 | |
Range Resources Corp. (d) | | — | | 65 | | 65 | | — | | 4 | | — | | 4 | |
Rayonier, Inc., REIT (d) | | — | | 270 | | 270 | | — | | 12 | | — | | 12 | |
Raytheon Co. (d) | | 52,230 | | 1,517 | | 53,747 | | 2,956 | | 86 | | — | | 3,042 | |
Regions Financial Corp. (d) | | — | | 913 | | 913 | | — | | 6 | | — | | 6 | |
Republic Services, Inc. (d) | | — | | 288 | | 288 | | — | | 8 | | — | | 8 | |
Reynolds American, Inc. (d) | | 34,280 | | 1,491 | | 35,771 | | 1,538 | | 67 | | — | | 1,605 | |
Robert Half International, Inc. (d) | | — | | 200 | | 200 | | — | | 6 | | — | | 6 | |
Rockwell Automation, Inc. (d) | | — | | 5 | | 5 | | — | | — | @ | — | | — | @ |
Ross Stores, Inc. | | — | | 148 | | 148 | | — | | 9 | | — | | 9 | |
Rouse Properties, Inc. REIT (d)(g) | | — | | 26 | | 26 | | — | | — | @ | — | | — | @ |
Royal Caribbean Cruises Ltd. | | — | | 1 | | 1 | | — | | — | @ | — | | — | @ |
Ryland Group, Inc. (The) (d) | | — | | 1,200 | | 1,200 | | — | | 31 | | — | | 31 | |
Safeway, Inc. (d) | | 77,350 | | 2,252 | | 79,602 | | 1,404 | | 41 | | — | | 1,445 | |
Salesforce.com, Inc. (d)(g) | | — | | 56 | | 56 | | — | | 8 | | — | | 8 | |
SanDisk Corp. (d)(g) | | — | | 231 | | 231 | | — | | 8 | | — | | 8 | |
Schlumberger Ltd. | | — | | 889 | | 889 | | — | | 58 | | — | | 58 | |
Scripps Networks Interactive, Inc., Class A | | — | | 171 | | 171 | | — | | 10 | | — | | 10 | |
Sempra Energy (d) | | — | | 156 | | 156 | | — | | 11 | | — | | 11 | |
Simon Property Group, Inc. REIT (d) | | — | | 214 | | 214 | | — | | 33 | | — | | 33 | |
Southern Co. (The) (d) | | — | | 323 | | 323 | | — | | 15 | | — | | 15 | |
Southwestern Energy Co. (d)(g) | | — | | 326 | | 326 | | — | | 10 | | — | | 10 | |
Spectra Energy Corp. (d) | | — | | 383 | | 383 | | — | | 11 | | — | | 11 | |
Sprint Nextel Corp. (d)(g) | | — | | 1,847 | | 1,847 | | — | | 6 | | — | | 6 | |
St. Jude Medical, Inc. (d) | | — | | 162 | | 162 | | — | | 6 | | — | | 6 | |
Standard Pacific Corp. (d)(g) | | — | | 9,700 | | 9,700 | | — | | 60 | | — | | 60 | |
Staples, Inc. (d) | | — | | 350 | | 350 | | — | | 5 | | — | | 5 | |
Starbucks Corp. | | — | | 239 | | 239 | | — | | 13 | | — | | 13 | |
State Street Corp. (d) | | — | | 315 | | 315 | | — | | 14 | | — | | 14 | |
Stericycle, Inc. (d)(g) | | — | | 117 | | 117 | | — | | 11 | | — | | 11 | |
Stryker Corp. (d) | | — | | 143 | | 143 | | — | | 8 | | — | | 8 | |
SunTrust Banks, Inc. | | — | | 305 | | 305 | | — | | 7 | | — | | 7 | |
Symantec Corp. (g) | | — | | 340 | | 340 | | — | | 5 | | — | | 5 | |
Sysco Corp. (d) | | — | | 558 | | 558 | | — | | 17 | | — | | 17 | |
T. Rowe Price Group, Inc. (d) | | — | | 221 | | 221 | | — | | 14 | | — | | 14 | |
Target Corp. | | — | | 173 | | 173 | | — | | 10 | | — | | 10 | |
TE Connectivity Ltd. (d) | | — | | 183 | | 183 | | — | | 6 | | — | | 6 | |
Tenaris SA (d) | | — | | 830 | | 830 | | — | | 14 | | — | | 14 | |
Texas Instruments, Inc. | | — | | 3,892 | | 3,892 | | — | | 112 | | — | | 112 | |
Thermo Fisher Scientific, Inc. | | — | | 583 | | 583 | | — | | 30 | | — | | 30 | |
Time Warner Cable, Inc. | | — | | 164 | | 164 | | — | | 13 | | — | | 13 | |
Time Warner, Inc. | | 74,380 | | 2,407 | | 76,787 | | 2,864 | | 93 | | — | | 2,957 | |
TJX Cos., Inc. | | — | | 374 | | 374 | | — | | 16 | | — | | 16 | |
Toll Brothers, Inc. (d)(g) | | — | | 4,500 | | 4,500 | | — | | 134 | | — | | 134 | |
Tyco International Ltd. | | 57,090 | | 1,658 | | 58,748 | | 3,017 | | 88 | | — | | 3,105 | |
Ultra Petroleum Corp. (d)(g) | | — | | 135 | | 135 | | — | | 3 | | — | | 3 | |
Union Pacific Corp. | | — | | 218 | | 218 | | — | | 26 | | — | | 26 | |
United Parcel Service, Inc., Class B (d) | | — | | 225 | | 225 | | — | | 18 | | — | | 18 | |
United Technologies Corp. (d) | | — | | 26 | | 26 | | — | | 2 | | — | | 2 | |
28
UnitedHealth Group, Inc. | | — | | 136 | | 136 | | — | | 8 | | — | | 8 | |
Universal Forest Products, Inc. (d) | | — | | 200 | | 200 | | — | | 8 | | — | | 8 | |
US Bancorp (d) | | — | | 809 | | 809 | | — | | 26 | | — | | 26 | |
Valero Energy Corp. | | — | | 363 | | 363 | | — | | 9 | | — | | 9 | |
Varian Medical Systems, Inc. (d)(g) | | — | | 119 | | 119 | | — | | 7 | | — | | 7 | |
Ventas, Inc., REIT (d) | | — | | 159 | | 159 | | — | | 10 | | — | | 10 | |
Verisk Analytics, Inc., Class A (g) | | — | | 176 | | 176 | | — | | 9 | | — | | 9 | |
Verizon Communications, Inc. | | 69,870 | | 2,916 | | 72,786 | | 3,105 | | 130 | | — | | 3,235 | |
Vertex Pharmaceuticals, Inc. (g) | | — | | 300 | | 300 | | — | | 17 | | — | | 17 | |
VF Corp. (d) | | 16,710 | | 554 | | 17,264 | | 2,230 | | 74 | | — | | 2,304 | |
Viacom, Inc., Class B | | — | | 227 | | 227 | | — | | 11 | | — | | 11 | |
Virgin Media, Inc. (d) | | — | | 242 | | 242 | | — | | 6 | | — | | 6 | |
Visa, Inc., Class A (d) | | — | | 237 | | 237 | | — | | 29 | | — | | 29 | |
Vornado Realty Trust REIT | | — | | 59 | | 59 | | — | | 5 | | — | | 5 | |
Wal-Mart Stores, Inc. | | — | | 1,234 | | 1,234 | | — | | 86 | | — | | 86 | |
Walgreen Co. (d) | | — | | 741 | | 741 | | — | | 22 | | — | | 22 | |
Walt Disney Co. (The) | | — | | 281 | | 281 | | — | | 14 | | — | | 14 | |
Waste Management, Inc. (d) | | — | | 295 | | 295 | | — | | 10 | | — | | 10 | |
Watsco, Inc. (d) | | — | | 300 | | 300 | | — | | 22 | | — | | 22 | |
Watson Pharmaceuticals, Inc. (g) | | — | | 264 | | 264 | | — | | 20 | | — | | 20 | |
Weatherford International Ltd. (d)(g) | | — | | 937 | | 937 | | — | | 12 | | — | | 12 | |
WellPoint, Inc. | | — | | 151 | | 151 | | — | | 10 | | — | | 10 | |
Wells Fargo & Co. | | — | | 3,025 | | 3,025 | | — | | 101 | | — | | 101 | |
Western Union Co. (The) (d) | | — | | 206 | | 206 | | — | | 3 | | — | | 3 | |
Weyerhaeuser Co. REIT (d) | | — | | 378 | | 378 | | — | | 8 | | — | | 8 | |
Whole Foods Market, Inc. (d) | | — | | 252 | | 252 | | — | | 24 | | — | | 24 | |
Williams Cos., Inc. (The) | | — | | 961 | | 961 | | — | | 28 | | — | | 28 | |
Wisconsin Energy Corp. (d) | | — | | 199 | | 199 | | — | | 8 | | — | | 8 | |
WPX Energy, Inc. (d)(g) | | — | | 320 | | 320 | | — | | 5 | | — | | 5 | |
WW Grainger, Inc. (d) | | — | | 2 | | 2 | | — | | — | @ | — | | — | @ |
Wynn Resorts Ltd. (d) | | — | | 51 | | 51 | | — | | 5 | | — | | 5 | |
Xcel Energy, Inc. (d) | | — | | 228 | | 228 | | — | | 6 | | — | | 6 | |
Xerox Corp. (d) | | — | | 976 | | 976 | | — | | 8 | | — | | 8 | |
Xilinx, Inc. (d) | | — | | 853 | | 853 | | — | | 29 | | — | | 29 | |
Xylem, Inc. (d) | | — | | 71 | | 71 | | — | | 2 | | — | | 2 | |
Yahoo!, Inc. (d)(g) | | — | | 624 | | 624 | | — | | 10 | | — | | 10 | |
Yum! Brands, Inc. (d) | | 63,080 | | 1,474 | | 64,554 | | 4,064 | | 95 | | — | | 4,159 | |
Zimmer Holdings, Inc. (d) | | — | | 117 | | 117 | | — | | 8 | | — | | 8 | |
| | | | | | | | 79,515 | | 9,313 | | — | | 88,828 | |
Total Common Stocks (Cost $100,513) | | | | | | | | 79,515 | | 26,061 | | — | | 105,576 | |
| | | | | | | | | | | | | | | |
Commodity Linked Security (0.8%) | | | | | | | | | | | | | | | |
United States (0.8%) | | | | | | | | | | | | | | | |
Deutsche Bank AG,
Zero Coupon, 12/3/12 (c)(j) (Cost $1,552) | | — | | 1,552,000 | | 1,552,000 | | — | | 1,484 | | — | | 1,484 | |
| | | | | | | | | | | | | | | |
| | No. of Rights | | No. of Rights | | No. of Rights | | Value (000) | | Value (000) | | Value (000) | | Value (000) | |
Rights (0.0%) | | | | | | | | | | | | | | | |
Austrailia (0.0%) | | | | | | | | | | | | | | | |
Echo Entertainment Group Ltd. (g) (Cost $-) | | — | | 75 | | 75 | | — | | — | @ | — | | — | @ |
| | | | | | | | | | | | | | | |
| | Shares | | Shares | | Shares | | Value (000) | | Value (000) | | Value (000) | | Value (000) | |
Investment Companies (1.6%) | | | | | | | | | | | | | | | |
United States (1.6%) | | | | | | | | | | | | | | | |
iShares MSCI Emerging Markets Index Fund | | — | | 7,100 | | 7,100 | | — | | 278 | | — | | 278 | |
Morgan Stanley Institutional Fund, Inc. - Emerging Markets Portfolio (n) | | — | | 105,470 | | 105,470 | | — | | 2,430 | | — | | 2,430 | |
Technology Select Sector SPDR Fund, (d) | | — | | 12,200 | | 12,200 | | — | | 351 | | — | | 351 | |
Total Investment Companies (Cost $3,444) | | | | | | | | — | | 3,059 | | — | | 3,059 | |
| | | | | | | | | | | | | | | |
| | Shares | | Shares | | Shares | | Value (000) | | Value (000) | | Value (000) | | Value (000) | |
Short-Term Investments (16.8%) | | | | | | | | | | | | | | | |
Securities held as Collateral on Loaned Securities (4.3%) | | | | | | | | | | | | | | | |
Investment Company (4.2%) | | | | | | | | | | | | | | | |
Morgan Stanley Institutional Liquidity Funds - Money Market Portfolio - Institutional Class (n) | | — | | 8,147,131 | | 8,147,131 | | — | | 8,147 | | — | | 8,147 | |
29
| | Face Amount (000) | | Face Amount (000) | | Face Amount (000) | | Value (000) | | Value (000) | | Value (000) | | Value (000) | |
Repurchase Agreements (0.1%) | | | | | | | | | | | | | | | |
Barclays Capital, Inc.,
(0.15%, dated 6/29/12, due 7/2/12; proceeds $98; fully collateralized by a U.S. Government Obligation; U.S. Treasury Bond 3.13% due 2/15/42; valued at $100) | | — | | 98 | | 98 | | — | | 98 | | — | | 98 | |
Merrill Lynch & Co., Inc.,
(0.18%, dated 6/29/12, due 7/2/12; proceeds $127; fully collateralized by a U.S. Government Agency; Federal Home Loan Mortgage Corporation 3.75% due 3/27/19; valued at $130) | | — | | 127 | | 127 | | — | | 127 | | — | | 127 | |
| | | | | | | | — | | 225 | | — | | 225 | |
Total Securities held as Collateral on Loaned Securities (Cost $8,372) | | | | | | | | — | | 8,372 | | — | | 8,372 | |
| | | | | | | | | | | | | | | |
| | Shares | | Shares | | Shares | | Value (000) | | Value (000) | | Value (000) | | Value (000) | |
Investment Company (11.2%) | | | | | | | | | | | | | | | |
Morgan Stanley Institutional Liquidity Funds - Money Market Portfolio - Institutional Class (n) (Cost $21,573) | | 17,766,564 | | 3,805,864 | | 21,572,428 | | 17,767 | | 3,806 | | — | | 21,573 | |
| | | | | | | | | | | | | | | |
| | Face Amount (000) | | Face Amount (000) | | Face Amount (000) | | Value (000) | | Value (000) | | Value (000) | | Value (000) | |
U.S. Treasury Securities (1.3%) | | | | | | | | | | | | | | | |
U.S. Treasury Bills,
0.08%, 8/2/12 (d)(k) | | — | | 585 | | 585 | | — | | 585 | | — | | 585 | |
0.11%, 10/4/12 (k) | | — | | 700 | | 700 | | — | | 700 | | — | | 700 | |
0.14%, 8/30/12 - 11/29/12 (k) | | 100 | | 1,200 | | 1,300 | | 100 | | 1,199 | | — | | 1,299 | |
Total U.S. Treasury Securities (Cost $2,584) | | | | | | | | 100 | | 2,484 | | — | | 2,584 | |
Total Short-Term Investments (Cost $32,529) | | | | | | | | 17,867 | | 14,662 | | — | | 32,529 | |
Total Investments (103.8%) (Cost $192,664) Including $9,515 of Securities Loaned (l)(m) | | | | | | | | 129,058 | | 70,076 | | — | | 199,134 | |
Liabilities in Excess of Other Assets (-3.8%) | | | | | | | | 245 | | (7,208 | ) | (117 | )(o) | (7,080 | ) |
Net Assets (100.0%) | | | | | | | | $ | 129,303 | | $ | 62,868 | | $ | (117 | ) | $ | 192,054 | |
| | | | | | | | | | | | | | | | | | | |
| (a) | Security is subject to delayed delivery. |
| (b) | Variable/Floating Rate Security — Interest rate changes on these instruments are based on changes in a designated base rate. The rates shown are those in effect on June 30, 2012. |
| (c) | 144A security — Certain conditions for public sale may exist. Unless otherwise noted, these securities are deemed to be liquid. |
| (d) | All or a portion of this security was on loan at June 30, 2012. |
| (e) | Comprised of securities in separate entities that are traded as a single stapled security. |
| (f) | Consists of one or more classes of securities traded together as a unit; stocks with attached warrants. |
| (g) | Non-income producing security. |
| (h) | Security trades on the Hong Kong exchange. |
| (i) | At June 30, 2012, the Portfolio held fair valued securities valued at less than $500, representing less than 0.05% of net assets. These securities have been fair valued as determined in good faith under procedures established by and under the general supervision of the Fund’s Directors. |
| (j) | Security is linked to the Dow Jones UBS Commodities Index Total Return. The index is currently comprised of futures contracts on nineteen physical commodities traded on U.S. exchanges, with the exception of aluminum, nickel, and zinc, which trade on the London Metal Exchange. |
| (k) | Rate shown is the yield to maturity at June 30, 2012. |
| (l) | Securities are available for collateral in connection with purchase of when-issued securities, securities purchased on a forward commitment basis, open foreign currency exchange contracts, futures contracts and swap agreements. |
| (m) | The approximate fair value and percentage of net assets, $14,965,000 and 7.8%, respectively, represent the securities that have been fair valued under the fair valuation policy for international investments as described in Valuation of Investments Note within the Notes to the Financial Statements. |
| (n) | Affiliated Security. |
| (o) | Reorganization Expenses. |
| @ | Value is less than $500. |
| BTAN | Bons du Trésor à Intérets Annuels (Treasury Bill Annual Interest). |
| CVA | Certificaten Van Aandelen. |
| MTN | Medium Term Note. |
| OAT | Obligations Assimilables du Trésor (French Treasury Obligation). |
| PPS | Price Protected Shares. |
| REIT | Real Estate Investment Trust. |
| SDR | Swedish Depositary Receipt. |
| SPDR | Standard & Poor’s Depository Receipt. |
| TBA | To Be Announced. |
30
Futures Contracts
The Portfolio had the following futures contracts open at period end:
| | Variable | | UIF Global | | Variable | | UIF Global | | | | | | Variable Investment | | UIF Global
Tactical Asset
Allocation | | UIF Global
Tactical Asset
Allocation
Combined Pro
Forma | |
| | Investment Series - | | Tactical Asset | | Investment | | Tactical | | | | | | Series - Strategist | | Unrealized | | Unrealized | |
| | Strategist | | Allocation | | Series - | | Asset | | Combined Pro | | | | Unrealized | | Appreciation | | Appreciation | |
| | Number of | | Number of | | Strategist | | Allocation | | Forma | | Expiration | | Appreciation | | (Depreciation) | | (Depreciation) | |
| | Contracts | | Contracts | | Value (000) | | Value (000) | | Value (000) | | Date | | (Depreciation) (000) | | (000) | | (000) | |
Long: | | | | | | | | | | | | | | | | | | | |
10 yr. Japan Government Bond (Japan) | | — | | 1 | | $ | — | | $ | 1,801 | | $ | 1,801 | | Sep-12 | | $ | — | | $ | 3 | | $ | 3 | |
CAC 40 Index (France) | | — | | 58 | | — | | 2,342 | | 2,342 | | Jul-12 | | — | | 108 | | 108 | |
DAX Index (Germany) | | — | | 4 | | — | | 811 | | 811 | | Sep-12 | | — | | 27 | | 27 | |
Euro Stoxx 50 Index (Germany) | | — | | 5 | | — | | 143 | | 143 | | Sep-12 | | — | | (1 | ) | (1 | ) |
FTSE 100 Index (United Kingdom) | | — | | 7 | | — | | 606 | | 606 | | Sep-12 | | — | | 10 | | 10 | |
MSCI Emerging Market E MINI (United States) | | — | | 47 | | — | | 2,220 | | 2,220 | | Sep-12 | | — | | 55 | | 55 | |
NIKKEI 225 Index (United States) | | — | | 10 | | — | | 570 | | 570 | | Sep-12 | | — | | 40 | | 40 | |
S&P 500 E MINI Index (United States) | | — | | 104 | | — | | 7,053 | | 7,053 | | Sep-12 | | — | | 247 | | 247 | |
S&P Mid Cap 400 E MINI Index (United States) | | — | | 8 | | — | | 752 | | 752 | | Sep-12 | | — | | 17 | | 17 | |
SGX MSCI Singapore Index (Singapore) | | — | | 5 | | — | | 262 | | 262 | | Jul-12 | | — | | 6 | | 6 | |
TOPIX Index (Japan) | | — | | 1 | | — | | 96 | | 96 | | Sep-12 | | — | | 6 | | 6 | |
U.S. Treasury 5 yr. Note (United States) | | 1 | | 1 | | 124 | | 124 | | 248 | | Sep-12 | | — | @ | — | @ | — | @ |
U.S. Treasury 30 yr. Bond (United States) | | — | | 8 | | — | | 1,184 | | 1,184 | | Sep-12 | | — | | 8 | | 8 | |
| | | | | | | | | | | | | | | | | | | |
Short: | | | | | | | | | | | | | | | | | | | |
ASX Spi 200 Index (Australia) | | — | | 2 | | — | | (207 | ) | (207 | ) | Sep-12 | | — | | 2 | | 2 | |
German Euro BOBL (Germany) | | — | | 3 | | — | | (478 | ) | (478 | ) | Sep-12 | | — | | 6 | | 6 | |
German Euro Bund (Germany) | | — | | 27 | | — | | (4,813 | ) | (4,813 | ) | Sep-12 | | — | | 95 | | 95 | |
Hang Seng Index (Hong Kong) | | — | | 3 | | — | | (376 | ) | (376 | ) | Jul-12 | | — | | (5 | ) | (5 | ) |
S&P TSE 60 Index (Canada) | | — | | 1 | | — | | (130 | ) | (130 | ) | Sep-12 | | — | | (2 | ) | (2 | ) |
U.S. Treasury 5 yr. Note (United States) | | — | | 54 | | — | | (6,694 | ) | (6,694 | ) | Sep-12 | | — | | (14 | ) | (14 | ) |
U.S. Treasury 10 yr. Note (United States) | | 10 | | 32 | | (1,334 | ) | (4,268 | ) | (5,602 | ) | Sep-12 | | (3 | ) | 3 | | — | @ |
U.S. Treasury 30 yr. Bond (United States) | | — | | 4 | | — | | (592 | ) | (592 | ) | Sep-12 | | — | | (3 | ) | (3 | ) |
| | | | | | | | | | | | | | $ | (3 | ) | $ | 608 | | $ | 605 | |
| | | | | | | | | | | | | | | | | | | | | | | | | |
Foreign Currency Exchange Contracts Information:
The Portfolio had the following foreign currency exchange contracts open at period end:
| | Variable Investment Series -
Strategist | | UIF Global Tactical Asset
Allocation | | Combined Pro Forma | | Variable Investment Series -
Strategist | | UIF Global Tactical Asset
Allocation | | UIF Global Tactical Asset
Allocation
Combined Pro
Forma | | | | Variable Investment
Series - Strategist | |
Counterparty | | Currency to Deliver
(000) | | Currency to Deliver
(000) | | Currency to Deliver
(000) | | Value
(000) | | Value
(000) | | Value
(000) | | Settlement Date | | In Exchange For
(000) | |
Goldman Sachs International | | | | EUR | 576 | | EUR | 576 | | $ | — | | $ | 729 | | $ | 729 | | 7/13/12 | | | |
Goldman Sachs International | | | | MXN | 1,550 | | MXN | 1,550 | | — | | 116 | | 116 | | 7/13/12 | | | |
Goldman Sachs International | | | | USD | 42 | | USD | 42 | | — | | 42 | | 42 | | 7/13/12 | | | |
Goldman Sachs International | | | | USD | 64 | | USD | 64 | | — | | 64 | | 64 | | 7/13/12 | | | |
Goldman Sachs International | | | | ZAR | 514 | | ZAR | 514 | | — | | 63 | | 63 | | 7/13/12 | | | |
JPMorgan Chase Bank | | | | PLN | 708 | | PLN | 708 | | — | | 212 | | 212 | | 7/13/12 | | | |
JPMorgan Chase Bank | | | | USD | 281 | | USD | 281 | | — | | 281 | | 281 | | 7/13/12 | | | |
UBS AG | | | | CLP | 69,660 | | CLP | 69,660 | | — | | 139 | | 139 | | 7/13/12 | | | |
UBS AG | | | | USD | 69 | | USD | 69 | | — | | 69 | | 69 | | 7/13/12 | | | |
Wells Fargo Bank | | | | AUD | 252 | | AUD | 252 | | — | | 258 | | 258 | | 7/13/12 | | | |
Wells Fargo Bank | | | | SEK | 370 | | SEK | 370 | | — | | 54 | | 54 | | 7/13/12 | | | |
Wells Fargo Bank | | | | USD | 389 | | USD | 389 | | — | | 389 | | 389 | | 7/13/12 | | | |
Wells Fargo Bank | | | | USD | 3,236 | | USD | 3,236 | | — | | 3,236 | | 3,236 | | 7/13/12 | | | |
Bank of America NA | | | | MYR | 411 | | MYR | 411 | | — | | 129 | | 129 | | 7/19/12 | | | |
Deutsche Bank AG | | | | AUD | 497 | | AUD | 497 | | — | | 508 | | 508 | | 7/19/12 | | | |
Deutsche Bank AG | | | | USD | 210 | | USD | 210 | | — | | 210 | | 210 | | 7/19/12 | | | |
Goldman Sachs International | | | | BRL | 339 | | BRL | 339 | | — | | 168 | | 168 | | 7/19/12 | | | |
Goldman Sachs International | | | | CAD | 197 | | CAD | 197 | | — | | 193 | | 193 | | 7/19/12 | | | |
Goldman Sachs International | | | | EUR | 133 | | EUR | 133 | | — | | 168 | | 168 | | 7/19/12 | | | |
Goldman Sachs International | | | | JPY | 6,787 | | JPY | 6,787 | | — | | 85 | | 85 | | 7/19/12 | | | |
Goldman Sachs International | | | | JPY | 32,617 | | JPY | 32,617 | | — | | 409 | | 409 | | 7/19/12 | | | |
Goldman Sachs International | | | | USD | 88 | | USD | 88 | | — | | 88 | | 88 | | 7/19/12 | | | |
JPMorgan Chase Bank | | | | NOK | 331 | | NOK | 331 | | — | | 56 | | 56 | | 7/19/12 | | | |
Royal Bank of Scotland | | | | CAD | 541 | | CAD | 541 | | — | | 531 | | 531 | | 7/19/12 | | | |
Royal Bank of Scotland | | | | MXN | 1,098 | | MXN | 1,098 | | — | | 82 | | 82 | | 7/19/12 | | | |
Royal Bank of Scotland | | | | USD | 139 | | USD | 139 | | — | | 139 | | 139 | | 7/19/12 | | | |
State Street Bank and Trust Co. | | | | CLP | 59,605 | | CLP | 59,605 | | — | | 119 | | 119 | | 7/19/12 | | | |
State Street Bank and Trust Co. | | | | USD | 248 | | USD | 248 | | — | | 248 | | 248 | | 7/19/12 | | | |
UBS AG | | | | CAD | 266 | | CAD | 266 | | — | | 261 | | 261 | | 7/19/12 | | | |
UBS AG | | | | DKK | 279 | | DKK | 279 | | — | | 48 | | 48 | | 7/19/12 | | | |
UBS AG | | | | EUR | 900 | | EUR | 900 | | — | | 1,139 | | 1,139 | | 7/19/12 | | | |
UBS AG | | | | GBP | 317 | | GBP | 317 | | — | | 496 | | 496 | | 7/19/12 | | | |
UBS AG | | | | HKD | 1,957 | | HKD | 1,957 | | — | | 252 | | 252 | | 7/19/12 | | | |
UBS AG | | | | JPY | 144,788 | | JPY | 144,788 | | — | | 1,812 | | 1,812 | | 7/19/12 | | | |
UBS AG | | | | USD | 636 | | USD | 636 | | — | | 636 | | 636 | | 7/19/12 | | | |
UBS AG | | | | USD | 420 | | USD | 420 | | — | | 420 | | 420 | | 7/19/12 | | | |
UBS AG | | | | USD | 188 | | USD | 188 | | — | | 188 | | 188 | | 7/19/12 | | | |
UBS AG | | | | USD | 278 | | USD | 278 | | — | | 278 | | 278 | | 7/19/12 | | | |
UBS AG | | | | USD | 352 | | USD | 352 | | — | | 352 | | 352 | | 7/19/12 | | | |
UBS AG | | | | USD | 195 | | USD | 195 | | — | | 195 | | 195 | | 7/19/12 | | | |
UBS AG | | | | USD | 205 | | USD | 205 | | — | | 205 | | 205 | | 7/19/12 | | | |
| | | | | | | | | | $ | — | | $ | 15,067 | | $ | 15,067 | | | | | |
| | | | | | | | | | | | | | | | UIF Global | |
| | | | | | | | | | | | Variable | | | | Tactical Asset | |
| | | | | | | | | | | | Investment | | UIF Global | | Allocation | |
| | | | | | Variable | | | | | | Series - | | Tactical Asset | | Combined Pro | |
| | | | | | Investment | | UIF Global | | | | Strategist | | Allocation | | Forma | |
| | UIF Global Tactical | | | | Series - | | Tactical Asset | | Combined | | Unrealized | | Unrealized | | Unrealized | |
| | Asset Allocation | | Combined Proforma | | Strategist | | Allocation | | Pro Forma | | Appreciation / | | Appreciation / | | Appreciation / | |
| | In Exchange For | | In Exchange For | | Value | | Value | | Value | | (Depreciation) | | (Depreciation) | | (Depreciation) | |
Counterparty | | (000) | | (000) | | (000) | | (000) | | (000) | | (000) | | (000) | | (000) | |
Goldman Sachs International | | USD | 713 | | USD | 713 | | $ | — | | $ | 713 | | $ | 713 | | $ | — | | $ | (16 | ) | $ | (16 | ) |
Goldman Sachs International | | USD | 109 | | USD | 109 | | — | | 109 | | 109 | | — | | (7 | ) | (7 | ) |
Goldman Sachs International | | NOK | 255 | | NOK | 255 | | — | | 43 | | 43 | | — | | 1 | | 1 | |
Goldman Sachs International | | THB | 2,050 | | THB | 2,050 | | — | | 64 | | 64 | | — | | — | @ | — | @ |
Goldman Sachs International | | USD | 60 | | USD | 60 | | — | | 60 | | 60 | | — | | (3 | ) | (3 | ) |
JPMorgan Chase Bank | | USD | 199 | | USD | 199 | | — | | 199 | | 199 | | — | | (13 | ) | (13 | ) |
JPMorgan Chase Bank | | SGD | 362 | | SGD | 362 | | — | | 286 | | 286 | | — | | 5 | | 5 | |
UBS AG | | USD | 134 | | USD | 134 | | — | | 134 | | 134 | | — | | (5 | ) | (5 | ) |
UBS AG | | GBP | 45 | | GBP | 45 | | — | | 70 | | 70 | | — | | 1 | | 1 | |
Wells Fargo Bank | | USD | 244 | | USD | 244 | | — | | 244 | | 244 | | — | | (14 | ) | (14 | ) |
Wells Fargo Bank | | USD | 51 | | USD | 51 | | — | | 51 | | 51 | | — | | (3 | ) | (3 | ) |
Wells Fargo Bank | | CAD | 401 | | CAD | 401 | | — | | 394 | | 394 | | — | | 5 | | 5 | |
Wells Fargo Bank | | JPY | 253,517 | | JPY | 253,517 | | — | | 3,172 | | 3,172 | | — | | (64 | ) | (64 | ) |
Bank of America NA | | USD | 130 | | USD | 130 | | — | | 130 | | 130 | | — | | 1 | | 1 | |
Deutsche Bank AG | | USD | 499 | | USD | 499 | | — | | 499 | | 499 | | — | | (9 | ) | (9 | ) |
Deutsche Bank AG | | AUD | 207 | | AUD | 207 | | — | | 211 | | 211 | | — | | 1 | | 1 | |
Goldman Sachs International | | USD | 168 | | USD | 168 | | — | | 168 | | 168 | | — | | (— | )@ | (— | )@ |
Goldman Sachs International | | USD | 193 | | USD | 193 | | — | | 193 | | 193 | | — | | — | @ | — | @ |
Goldman Sachs International | | USD | 167 | | USD | 167 | | — | | 167 | | 167 | | — | | (1 | ) | (1 | ) |
Goldman Sachs International | | USD | 85 | | USD | 85 | | — | | 85 | | 85 | | — | | (— | )@ | (— | )@ |
Goldman Sachs International | | USD | 409 | | USD | 409 | | — | | 409 | | 409 | | — | | — | @ | — | @ |
Goldman Sachs International | | CAD | 91 | | CAD | 91 | | — | | 89 | | 89 | | — | | 1 | | 1 | |
JPMorgan Chase Bank | | USD | 56 | | USD | 56 | | — | | 56 | | 56 | | — | | — | @ | — | @ |
Royal Bank of Scotland | | USD | 531 | | USD | 531 | | — | | 531 | | 531 | | — | | (— | )@ | (— | )@ |
Royal Bank of Scotland | | USD | 80 | | USD | 80 | | — | | 80 | | 80 | | — | | (2 | ) | (2 | ) |
Royal Bank of Scotland | | ILS | 536 | | ILS | 536 | | — | | 137 | | 137 | | — | | (2 | ) | (2 | ) |
State Street Bank and Trust Co. | | USD | 119 | | USD | 119 | | — | | 119 | | 119 | | — | | (— | )@ | (— | )@ |
State Street Bank and Trust Co. | | TWD | 7,399 | | TWD | 7,399 | | — | | 248 | | 248 | | — | | — | @ | — | @ |
UBS AG | | USD | 261 | | USD | 261 | | — | | 261 | | 261 | | — | | (— | )@ | (— | )@ |
UBS AG | | USD | 48 | | USD | 48 | | — | | 48 | | 48 | | — | | — | @ | — | @ |
UBS AG | | USD | 1,141 | | USD | 1,141 | | — | | 1,141 | | 1,141 | | — | | 2 | | 2 | |
UBS AG | | USD | 494 | | USD | 494 | | — | | 494 | | 494 | | — | | (2 | ) | (2 | ) |
UBS AG | | USD | 252 | | USD | 252 | | — | | 252 | | 252 | | — | | (— | )@ | (— | )@ |
UBS AG | | USD | 1,833 | | USD | 1,833 | | — | | 1,833 | | 1,833 | | — | | 21 | | 21 | |
UBS AG | | BRL | 1,306 | | BRL | 1,306 | | — | | 648 | | 648 | | — | | 12 | | 12 | |
UBS AG | | CHF | 397 | | CHF | 397 | | — | | 419 | | 419 | | — | | (1 | ) | (1 | ) |
UBS AG | | GBP | 120 | | GBP | 120 | | — | | 187 | | 187 | | — | | (1 | ) | (1 | ) |
UBS AG | | KRW | 324,672 | | KRW | 324,672 | | — | | 283 | | 283 | | — | | 5 | | 5 | |
UBS AG | | RUB | 11,514 | | RUB | 11,514 | | — | | 354 | | 354 | | — | | 2 | | 2 | |
UBS AG | | SGD | 247 | | SGD | 247 | | — | | 195 | | 195 | | — | | (— | )@ | (— | )@ |
UBS AG | | ZAR | 1,690 | | ZAR | 1,690 | | — | | 207 | | 207 | | — | | 2 | | 2 | |
| | | | | | | | $ | — | | $ | 14,983 | | $ | 14,983 | | $ | — | | $ | (84 | ) | $ | (84 | ) |
Interest Rate Swap Agreements
The Portfolio had the following interest rate swap agreements open at period end:
| | | | | | | | | | | | | | | | | | UIF Global | |
| | | | | | | | | | | | | | Variable | | | | Tactical Asset | |
| | | | | | | | | | | | | | Investment | | UIF Global | | Allocation | |
| | | | | | | | | | Variable | | UIF Global | | Series - | | Tactical Asset | | Combined Pro | |
| | | | | | | | | | Investment | | Tactical | | Strategist | | Allocation | | Forma | |
| | | | | | | | | | Series - | | Asset | | Unrealized | | Unrealized | | Unrealized | |
| | | | | | | | | | Strategist | | Allocation | | Appreciation | | Appreciation | | Appreciation | |
| | Floating Rate | | Pay/Receive | | | | Termination | | Notional | | Notional | | (Depreciation) | | (Depreciation) | | (Depreciation) | |
Swap Counterparty | | Index | | Floating Rate | | Fixed Rate | | Date | | Amount (000) | | Amount (000) | | (000) | | (000) | | (000) | |
Bank of America | | 6 Month EURIBOR | | Pay | | 4.26 | | 8/18/2026 | | EUR | 1,720 | | EUR | 1,400 | | $ | | 111 | | $ | | 91 | | $ | | 202 | |
Bank of America | | 3 Month LIBOR | | Receive | | 4.35 | | 8/18/2026 | | $ | 2,305 | | $ | 1,875 | | (105 | ) | (85 | ) | (190 | ) |
Bank of America | | 6 Month EURIBOR | | Receive | | 3.61 | | 8/18/2031 | | EUR | 2,175 | | EUR | 1,770 | | (116 | ) | (95 | ) | (211 | ) |
Bank of America | | 3 Month LIBOR | | Pay | | 4.15 | | 8/18/2031 | | $ | 2,860 | | $ | 2,325 | | 102 | | 83 | | 185 | |
| | | | | | | | | | | | | | $ | | (8 | ) | $ | | (6 | ) | $ | | (14 | ) |
| | | | | | | | | | | | | | | | | | | | | | | | | | | | | |
Total Return Swap Agreements
The Portfolio had the following total return swap agreements open at period end:
| | Variable
Investment
Series - Strategist | | UIF Global
Tactical Asset Allocation | | Variable
Investment
Series - Strategist | | UIF Global
Tactical Asset
Allocation | | Variable
Investment
Series - Strategist | | UIF Global
Tactical Asset
Allocation | | Variable
Investment Series -
Strategist | | UIF Global
Tactical Asset
Allocation | | | | Variable
Investment Series -
Strategist | | UIF Global
Tactical Asset
Allocation | | UIF Global
Tactical Asset
Allocation
Combined
Pro Forma | |
Counterparty | | Index | | Index | | Notional
Amount (000) | | Notional
Amount (000) | | Floating Rate | | Floating Rate | | Pay/Receive
Total Return of
Referenced Index | | Pay/Receive
Total Return of
Referenced Index | | Maturity Date | | Unrealized
Appreciation
(Depreciation) (000) | | Unrealized
Appreciation
(Depreciation) (000) | | Unrealized
Appreciation
(Depreciation) (000) | |
Goldman Sachs | | N/A | | Goldman Sachs China Retail Custom Basket Index | | N/A | | $ | 6,758 | | N/A | | 3-Month HKD-HIBOR-minus 1.24% | | N/A | | Pay | | 6/21/2013 | | $ | — | | $ | (21 | ) | $ | (21 | ) |
Goldman Sachs | | N/A | | Goldman Sachs South Africa Consumer Discretionary Custom Basket Index | | N/A | | 920 | | N/A | | 3-Month USD-LIBOR-minus 0.55% | | N/A | | Pay | | 6/21/2013 | | — | | 17 | | 17 | |
Bank of America | | N/A | | Merrill Lynch Custom Luxury Basket Index | | N/A | | 629 | | N/A | | 3-Month USD-LIBOR-minus 0.15% | | N/A | | Pay | | 5/29/2013 | | — | | (3 | ) | (3 | ) |
Bank of America | | N/A | | Merrill Lynch Custom Luxury Basket Index | | N/A | | 630 | | N/A | | 3-Month USD-LIBOR-minus 0.15% | | N/A | | Pay | | 5/29/2013 | | — | | (14 | ) | (14 | ) |
Bank of America | | N/A | | Merrill Lynch Custom Test Index | | N/A | | 120 | | N/A | | 3-Month USD-LIBOR-minus 1.02% | | N/A | | Pay | | 5/13/2013 | | — | | 11 | | 11 | |
Bank of America | | N/A | | Merrill Lynch Custom Test Index | | N/A | | 120 | | N/A | | 3-Month USD-LIBOR-minus 1.02% | | N/A | | Pay | | 5/13/2013 | | — | | 8 | | 8 | |
Bank of America | | N/A | | Merrill Lynch Custom Test Index | | N/A | | 441 | | N/A | | 3-Month USD-LIBOR-minus 1.02% | | N/A | | Pay | | 5/13/2013 | | — | | 39 | | 39 | |
| | | | | | | | | | | | | | | | | | | | $ | — | | $ | 37 | | $ | 37 | |
| | | | | | | | | | | | | | | | | | | | | | | | | | | | | |
@ | Value is less than $500 |
EURIBOR | Euro Interbank Offered Rate. |
HIBOR | Hong Kong Interbank Offered Rate. |
LIBOR | London Interbank Offered Rate. |
AUD - Australian Dollar
BRL - Brazilian Real
CAD - Canadian Dollar
CHF - Swiss Franc
CLP - Chilean Peso
DKK - Danish Krone
EUR - Euro
GBP - British Pound
HKD - Hong Kong Dollar
ILS - Israeli Shekel
JPY - Japanese Yen
KRW - South Korean Won
MXN - Mexican New Peso
MYR - Malaysian Ringgit
NOK - Norwegian Krone
PLN - Polish Zloty
RUB - Russian Ruble
SEK - Swedish Krona
SGD - Singapore Dollar
THB - Thai Baht
TWD - Taiwan Dollar
USD - United States Dollar
ZAR - South African Rand
As of June 30, 2012, the gross unrealized appreciation (depreciation) of investments based on the aggregate cost of investments for federal income tax purposes was as follows:
| | Variable Investment
Series - Strategist | | UIF Global Tactical Asset
Allocation | | UIF Global Tactical Asset
Allocation
Combined Pro Forma | |
Aggregate gross unrealized appreciation | | $ | 9,792,000 | | $ | 3,010,000 | | $ | 12,802,000 | |
Aggregate gross unrealized depreciation | | (2,022,000 | ) | (4,311,000 | ) | (6,333,000 | ) |
Net unrealized appreciation (depreciation) | | $ | 7,770,000 | | $ | (1,301,000 | ) | $ | 6,469,000 | |
| | | | | | | |
Federal income tax cost of investments | | $ | 121,287,000 | | $ | 71,377,000 | | $ | 192,664,000 | |
Fair Valuation Measurements
Financial Accounting Standards Board (“FASB”) Accounting Standards Codification (“ASC”) 820, Fair Value Measurements and Disclosures (“ASC 820”), defines fair value as the value that the Fund would receive to sell an investment or pay to transfer a liability in a timely transaction with an independent buyer in the principal market, or in the absence of a principal market the most advantageous market for the investment or liability. ASC 820 establishes a three-tier hierarchy to distinguish between (1) inputs that reflect the assumptions market participants would use in valuing an asset or liability developed based on market data obtained from sources independent of the reporting entity (observable inputs); and (2) inputs that reflect the reporting entity’s own assumptions about the assumptions market participants would use in valuing an asset or liability developed based on the best information available in the circumstances (unobservable inputs) and to establish classification of fair value measurements for disclosure purposes. Various inputs are used in determining the value of the Fund’s investments. The inputs are summarized in the three broad levels listed below.
· Level 1 — unadjusted quoted prices in active markets for identical investments
· Level 2 — other significant observable inputs (including quoted prices for similar investments, interest rates, prepayment speeds, credit risk, etc.)
· Level 3 — significant unobservable inputs including the Fund’s own assumptions in determining the fair value of investments. Factors considered in making this determination may include, but are not limited to, information obtained by contacting the issuer, analysts, or the appropriate stock exchange (for exchange-traded securities), analysis of the issuer’s financial statements or other available documents and, if necessary, available information concerning other securities in similar circumstances
The inputs or methodology used for valuing securities are not necessarily an indication of the risk associated with investing in those securities and the determination of the significance of a particular input to the fair value measurement in its entirety requires judgment and considers factors specific to each security.
The following is a summary of the inputs used to value each Portfolio’s investments as of June 30, 2012.
Portfolios | | Variable Investment Series -
Strategist | | UIF Global Tactical Asset
Allocation | | UIF Global Tactical Asset
Allocation
Combined Pro Forma | |
Investments in Securities (Level 1) (000) | | $ | 97,282 | | $ | 26,108 | | $ | 123,390 | |
Investments in Securities (Level 2) (000) | | 31,776 | | 43,968 | | 75,744 | |
Investments in Securities (Level 3) (000) | | — | | — | @ | — | @ |
Total for Investments in Securities | | 129,058 | | 70,076 | | 199,134 | |
Other Financial Instruments* (Level 1) (000) | | (2 | ) | 608 | | 606 | |
Other Financial Instruments* (Level 2) (000) | | (8 | ) | (53 | ) | (61 | ) |
Other Financial Instruments* (Level 3) (000) | | — | | — | | — | |
Total for Other Financial Instruments | | $ | (10 | ) | $ | 555 | | $ | 545 | |
* Other financial instruments include futures, forwards and swaps.
Transfers between investment levels may occur as the markets fluctuate and/or the availability of data used in an investment’s valuation changes. The Fund recognizes transfers between the levels as of the end of the period. As of June 30, 2012, the fair market value of certain securities were adjusted due to developments which occurred between the time of the close of the foreign markets on which they trade and the close of business on the NYSE which resulted in their Level 2 classification. The approximate values of the transfers were as follows:
| | Variable Investment Series - Strategist | | UIF Global Tactical Asset Allocation | | | |
| | — | | $ | 14,054,000 | | | |
| | | | | | | | |
At June 30, 2012, there were no Level 3 investments in Variable Investment Series Strategist for which significant unobservable inputs were used to determine fair value. The following is a reconciliation of UIF Global Tactical Asset Allocation investments in which significant unobservable inputs (Level 3) were used in determining fair value.
| | Common Stock (000) | |
| | | |
Beginning Balance | | $ | — | |
Purchases | | — | @ |
Sales | | — | |
Amortization of discount | | — | |
Transfers in | | — | |
Transfers out | | — | |
Change in unrealized appreciation (depreciation) | | (— | )@ |
Realized gains (losses) | | — | |
Ending Balance | | $ | — | @ |
| | | |
Net change in unrealized appreciation/depreciation from investments still held as of June 30, 2012 | | $ | (— | )@ |
Security Valuation: Securities listed on a foreign exchange are valued at their closing price except as noted below. Unlisted securities and listed securities not traded on the valuation date for which market quotations are readily available are valued at the mean between the last reported bid and ask prices. Equity securities listed on a U.S. exchange are valued at the latest quoted sales price on the valuation date. Equity securities listed or traded on NASDAQ, for which market quotations are available, are valued at the NASDAQ Official Closing Price. Bonds and other fixed income securities may be valued according to the broadest and most representative market. In addition, bonds and other fixed income securities may be valued on the basis of prices provided by a pricing service. The prices provided by a pricing service take into account broker-dealer market price quotations for institutional size trading in similar groups of securities, security quality, maturity, coupon and other security characteristics as well as any developments related to the specific securities. Short-term debt securities purchased with remaining maturities of 60 days or less are valued at amortized cost, unless the Fund’s Board of Directors (the “Directors”) determines such valuation does not reflect the securities’ fair value, in which case these securities will be valued at their fair value as determined in good faith under procedures adopted by the Directors.
Under procedures approved by the Directors, the Fund’s Adviser has formed a Valuation Committee. The Valuation Committee provides administration and oversight of the Fund’s valuation policies and procedures, which are reviewed at least annually by the Directors. Among other things, these procedures allow the Fund to utilize independent pricing services, quotations from securities and financial instrument dealers, and other market sources to determine fair value.
The Fund has procedures to determine the fair value of securities and other financial instruments for which market prices are not readily available. Under these procedures, the Valuation Committee convenes on a regular and adhoc basis to review such securities and considers a number of factors, including valuation methodologies and significant unobservable valuation inputs, when arriving at fair value. The Valuation Committee may employ a market-based approach which may use related or comparable assets or liabilities, recent transactions, market multiples, book values, and other relevant information for the investment to determine the fair value of the investment. An income-based valuation approach may also be used in which the anticipated future cash flows of the investment are discounted to calculate fair value. Discounts may also be applied due to the nature or duration of any restrictions on the disposition of the investments. Due to the inherent uncertainty of valuations of such investments, the fair values may differ significantly from the values that would have been used had an active market existed. The Valuation Committee employs various methods for calibrating these valuation approaches including a regular review of valuation methodologies, key inputs and assumptions, transactional back-testing or disposition analysis, and reviews of any related market activity.
Most foreign markets close before the New York Stock Exchange (“NYSE”). Occasionally, developments that could affect the closing prices of securities and other assets may occur between the times at which valuations of such securities are determined (that is, close of the foreign market on which the securities trade) and the close of business on the NYSE. If these developments are expected to materially affect the value of the securities, the valuations may be adjusted to reflect the estimated fair value as of the close of the NYSE, as determined in good faith under procedures established by the Directors.
Derivatives: The Portfolio may, but is not required to, use derivative instruments for a variety of purposes, including hedging, risk management, portfolio management or to earn income. Derivatives are financial instruments whose value is based on the value of an underlying asset, interest rate, index or financial instrument. A derivative instrument often has risks similar to its underlying asset and may have additional risks, including imperfect correlation between the value of the derivative and the underlying asset, risks of default by the counterparty to certain transactions, magnification of losses incurred due to changes in the market value of the securities, instruments, indices or interest rates to which they relate, and risks that the transactions may not be liquid. The use of derivatives involves risks that are different from, and possibly greater than, the risks associated with other portfolio investments. Derivatives may involve the use of highly specialized instruments that require investment techniques and risk analyses different from those associated with other portfolio investments. All of the Portfolio’s holdings, including derivative instruments, marked-to-market each day with the change in value reflected in unrealized appreciation (depreciation). Upon disposition, a realized gain or loss is recognized.
Certain derivative transactions may give rise to a form of leverage. Leverage magnifies the potential for gain and risk for loss. Leverage associated with derivative transactions may cause the Portfolio to liquidate portfolio positions when it may not be advantageous to do so to satisfy its obligations or to meet earmarking or segregation requirements, pursuant to applicable Securities and Exchange Commission rules and regulations, or may cause the Portfolio to be more volatile than if the Portfolio had not been leveraged. Although the Adviser seeks to use derivatives to further the Portfolio’s investment objectives, there is no assurance that the use of derivatives will achieve this result.
Following is a description of the derivative instruments and techniques that the Portfolio used during the period and their associated risks:
Foreign Currency Exchange Contracts: In connection with its investments in foreign securities, the Portfolio also entered into contracts with banks, brokers or dealers to purchase or sell securities or foreign currencies at a future date. A foreign currency exchange contract (“currency contracts”) is a negotiated agreement between two parties to exchange specified amounts of two or more currencies at a specified future time at a specified rate. The rate specified by the currency contract can be higher or lower than the spot rate between the currencies that are the subject of the contract. Currency contracts may be used to protect against uncertainty in the level of future foreign currency exchange rates or to gain or modify exposure to a particular currency. Hedging the Portfolio’s currency risks involves the risk of mismatching the Portfolio’s objectives under a currency contract with the value of securities denominated in a particular currency.
Furthermore, such transactions reduce or preclude the opportunity for gain if the value of the currency should move in the direction opposite to the position taken. There is an additional risk to the effect that currency contracts create exposure to currencies in which the Portfolio’s securities are not denominated. Unanticipated changes in currency prices may result in poorer overall performance for the Portfolio than if it had not entered into such currency contracts. The use of currency contracts involves the risk of loss from the insolvency or bankruptcy of the counterparty to the contract or the failure of the counterparty to make payments or otherwise comply with the terms of the contract. A currency contract is marked-to-market daily and the change in market value is recorded by the Portfolio as unrealized gain or (loss). The Portfolio records realized gains (losses) when the currency contract is closed equal to the difference between the value of the currency contract at the time it was opened and the value at the time it was closed.
Futures: A futures contract is a standardized agreement between two parties to buy or sell a specific quantity of an underlying instrument at a specific price at a specific future time. The value of a futures contract tends to increase and decrease in tandem with the value of the underlying instrument. Depending on the terms of the particular contract, futures contracts are settled through either physical delivery of the underlying instrument on the settlement date or by payment of a cash settlement amount on the settlement date. During the period the futures contract is open, payments are
received from or made to the broker based upon changes in the value of the contract (the variation margin). A decision as to whether, when and how to use futures involves the exercise of skill and judgment and even a well conceived futures transaction may be unsuccessful because of market behavior or unexpected events. In addition to the derivatives risks discussed above, the prices of futures can be highly volatile, using futures can lower total return, and the potential loss from futures can exceed the Portfolio’s initial investment in such contracts.
Swaps: An over-the-counter (“OTC”) swap agreement is an agreement between two parties pursuant to which the parties exchange payments at specified dates on the basis of a specified notional amount, with the payments calculated by reference to specified securities, indexes, reference rates, currencies or other instruments. A small percentage of swap agreements are cleared through a central clearing house. Most swap agreements provide that when the period payment dates for both parties are the same, the payments are made on a net basis (i.e., the two payment streams are netted out, with only the net amount paid by one party to the other). The Portfolio’s obligations or rights under a swap agreement entered into on a net basis will generally be equal only to the net amount to be paid or received under the agreement, based on the relative values of the positions held by each counterparty. Most swap agreements are not entered into or traded on exchanges and there is no central clearing or guaranty function for swaps. These OTC swaps are often subject to credit risk or the risk of default or non-performance by the counterparty. Swaps could result in losses if interest rate or foreign currency exchange rates or credit quality changes are not correctly anticipated by the Portfolio or if the reference index, security or investments do not perform as expected.
When the Portfolio has an unrealized loss on a swap agreement, the Portfolio has instructed the custodian to pledge cash or liquid securities as collateral with a value approximately equal to the amount of the unrealized loss. Collateral pledges are monitored and subsequently adjusted if and when the swap valuations fluctuate. Cash collateral is included with “Due from (to) Broker” in the Statement of Assets and Liabilities. Cash collateral has been offset against open swap agreements under the provisions of FASB ASC “Balance Sheet” (ASC 210). Offsetting of Amounts Related to Certain Contracts, an interpretation of ASC 210-20, are included within “Unrealized Appreciation/Depreciation on Swap Agreements” in the Statement of Assets and Liabilities. For cash collateral received, the Portfolio pay a monthly fee to the counterparty based on the effective rate for Federal Funds. This fee, when paid, is included within realized gain (loss) on swap agreements in the Statement of Operations.
Upfront payments received or paid by a Portfolio will be reflected as an asset or liability in the Statement of Assets and Liabilities.
FASB ASC 815, “Derivatives and Hedging: Overall” (“ASC 815”), is intended to improve financial reporting about derivative instruments by requiring enhanced disclosures to enable investors to better understand how and why the Portfolio uses derivative instruments, how these derivative instruments are accounted for and their effects on the Portfolio’s financial position and results of operations.
The following table sets forth the fair value of the Portfolio’s derivative contracts by primary risk exposure as of June 30, 2012.
| | | | Variable Investment
Series - Strategist | | UIF Global Tactical
Asset Allocation | | Combined Pro
Forma | | Variable Investment
Series - Strategist | | UIF Global Tactical
Asset Allocation | | Combined Pro Forma | | Variable Investment
Series - Strategist
Foreign Currency | | UIF Global Tactical Asset
Allocation
Foreign Currency | | UIF Global Tactical Asset
Allocation
Combined Pro Forma
Foreign Currency | |
Primary Risk Exposure | | Statement of Assets
and Liabilities | | Futures Contracts
(000)(a) | | Futures Contracts
(000)(a) | | Futures Contracts
(000)(a) | | Swap Agreements
(000) | | Swap Agreements
(000) | | Swap Agreements
(000) | | Exchange Contracts
(000) | | Exchange Contracts
(000) | | Exchange Contracts
(000) | |
Assets: | | | | | | | | | | | | | | | | | | | | | |
Foreign Currency Risk | | Receivables | | $ | — | | $ | — | | $ | — | | $ | — | | $ | — | | $ | — | | $ | — | | $ | 59 | | $ | 59 | |
Equity Risk | | Receivables | | — | | 518 | | 518 | | — | | 75 | | 75 | | — | | — | | — | |
Interest Rate Risk | | Receivables | | — | | 115 | | 115 | | 213 | | 174 | | 387 | | — | | — | | — | |
Total Receivables | | | | $ | — | | $ | 633 | | $ | 633 | | $ | 213 | | $ | 249 | | $ | 462 | | $ | — | | $ | 59 | | $ | 59 | |
Liabilities: | | | | | | | | | | | | | | | | | | | | | |
Foreign Currency Risk | | Payables | | $ | — | | $ | — | | $ | — | | $ | — | | $ | — | | $ | — | | $ | — | | $ | (143 | ) | $ | (143 | ) |
Equity Risk | | Payables | | — | | (8 | ) | (8 | ) | — | | (38 | ) | (38 | ) | — | | — | | — | |
Interest Rate Risk | | Payables | | (3 | ) | (17 | ) | (20 | ) | (221 | ) | (180 | ) | (401 | ) | — | | — | | — | |
Total Payables | | | | $ | (3 | ) | $ | (25 | ) | $ | (28 | ) | $ | (221 | ) | $ | (218 | ) | $ | (439 | ) | $ | — | | $ | (143 | ) | $ | (143 | ) |
(a) This amount represents the cumulative appreciation (depreciation) of futures contracts as reported in the Portfolio of Investements. The Statement of Assets and Liabilities only reflect the current day net variation margin.
The following tables set forth by primary risk exposure the Portfolio’s realized gains (losses) and change in unrealized appreciation (depreciation) by type of derivative contract for the six months ended June 30, 2012 in accordance with ASC 815.
Realized Gain (Loss)
| | | | Variable Investment
Series - Strategist | | UIF Global Tactical
Asset Allocation | | UIF Global Tactical
Asset Allocation
Combined Pro
Forma | |
Primary Risk Exposure | | Derivative Type | | Value
(000) | | Value
(000) | | Value
(000) | |
Foreign Currency Risk | | Foreign Currency Exchange Contracts | | $ | (3 | ) | $ | 601 | | $ | 598 | |
Interest Rate Risk | | Futures Contracts | | (168 | ) | (523 | ) | (691 | ) |
Equity Risk | | Swap Agreements | | — | | 13 | | 13 | |
Interest Rate Risk | | Swap Agreements | | (594 | ) | (386 | ) | (980 | ) |
Total | | | | $ | (765 | ) | $ | (295 | ) | $ | (1,060 | ) |
Change in Unrealized Appreciation (Depreciation)
| | | | Variable Investment
Series - Strategist | | UIF Global Tactical
Asset Allocation | | Combined Pro
Forma | |
Primary Risk Exposure | | Derivative Type | | Value
(000) | | Value
(000) | | Value
(000) | |
Foreign Currency Risk | | Foreign Currency Exchange Contracts | | $ | 4 | | $ | (146 | ) | $ | (142 | ) |
Equity Risk | | Futures Contracts | | — | | 254 | | 254 | |
Interest Rate Risk | | Futures Contracts | | (13 | ) | 325 | | 312 | |
Interest Rate Risk | | Swap Agreements | | 383 | | 31 | | 414 | |
Total | | | | $ | 374 | | $ | 464 | | $ | 838 | |
PRO FORMA COMBINING CONDENSED STATEMENT OF OPERATIONS
FOR THE TWELVE MONTH PERIOD ENDED June 30, 2012 (Unaudited)
| | Morgan Stanley
Variable Investment
Series - Strategist
(000) | | Universal
Institutional Funds,
Inc. Global Tactical
Asset Allocation
(000) | | Adjustments
(000) | | Universal
Institutional Funds,
Inc. Global Tactical
Asset Allocation
Pro Forma Combined
Portfolio
(000) | |
| | | | | | | | | |
Investment Income: | | | | | | | | | |
Dividends from Securities of Unaffiliated Issuers + | | $ | 1,911 | | $ | 879 | | $ | — | | $ | 2,790 | |
Income from Securities Loaned — Net | | — | | 69 | | — | | 69 | |
Dividends from Security of Affiliated Issuer | | 69 | | 22 | | — | | 91 | |
Interest from Security of Affiliated Issuers | | — | | 10 | | — | | 10 | |
Interest from Securities of Unaffiliated Issuers | | 1,065 | | 700 | | — | | 1,765 | |
Total Investment Income | | 3,045 | | 1,680 | | — | | 4,725 | |
+ Net of Foreign Taxes Withheld | | — | | 51 | | | | 51 | |
Expenses: | | | | | | | | | |
Advisory Fees | | 588 | | 507 | | 380 | (a) | 1,475 | |
Custodian Fees | | 26 | | 182 | | — | | 208 | |
Distribution Fees | | 102 | | — | @ | 28 | (b) | 130 | |
Administration Fees | | 112 | | 169 | | 214 | (a) | 495 | |
Professional Fees | | 73 | | 159 | | (132 | )(c) | 100 | |
Shareholder Reporting Fees | | 31 | | 84 | | — | | 115 | |
Pricing Fees | | — | | 108 | | — | | 108 | |
Directors’ Fees and Expenses | | 6 | | 4 | | — | | 10 | |
Other Expenses | | 50 | | 14 | | (48 | )(d) | 16 | |
Expenses Before Non-Operating Expenses | | 988 | | 1,227 | | 442 | | 2,657 | |
Interest Expenses | | — | | — | @ | — | | — | @ |
Total Expenses | | 988 | | 1,227 | | 442 | | 2,657 | |
Distribution Fees - Class II Waived | | — | | — | @ | (93 | )(b) | (93 | ) |
Waiver of Advisory Fees | | | | (549 | ) | (859 | ) | (1,408 | ) |
Rebate from Morgan Stanley Affiliates | | (42 | ) | (42 | ) | — | | (84 | ) |
Net Expenses | | 946 | | 636 | | (510 | ) | 1,072 | |
Net Investment Income | | 2,099 | | 1,044 | | 510 | | 3,653 | |
| | | | | | | | | |
Realized Gain (Loss): | | | | | | | | | |
Investment Sold | | (15,976 | ) | (123 | ) | — | | (16,099 | ) |
Investments in Affiliates | | (2,135 | ) | (115 | ) | — | | (2,250 | ) |
Foreign Currency Exchange Contracts | | (3 | ) | 601 | | — | | 598 | |
Foreign Currency Transactions | | — | | (12 | ) | — | | (12 | ) |
Futures Contracts | | (168 | ) | (523 | ) | — | | (691 | ) |
Swap Agreements | | (594 | ) | (373 | ) | — | | (967 | ) |
Net Realized Gain (Loss) | | (18,876 | ) | (545 | ) | — | | (19,421 | ) |
Change in Unrealized Appreciation (Depreciation): | | | | | | | | | |
Investments | | 6,640 | | (3,182 | ) | — | | 3,458 | |
Investments in Affiliates | | 805 | | (383 | ) | — | | 422 | |
Foreign Currency Exchange Contracts | | 4 | | (146 | ) | — | | (142 | ) |
Foreign Currency Transactions | | — | | (31 | ) | — | | (31 | ) |
Futures Contracts | | (13 | ) | 579 | | — | | 566 | |
Swap Agreements | | 383 | | 31 | | — | | 414 | |
Net Change in Unrealized Appreciation (Depreciation) | | 7,819 | | (3,132 | ) | — | | 4,687 | |
Net Realized Gain (Loss)and Change in Unrealized | | | | | | | | | |
Appreciation (Depreciation) | | (11,057 | ) | (3,677 | ) | — | | (14,734 | ) |
| | | | | | | | | |
Net Increase (Decrease) in Net Assets Resulting from Operations | | $ | (8,958 | ) | $ | (2,633 | ) | $ | 510 | | $ | (11,081 | ) |
(a) — Reflects increase due to higher contractual rates on UIF Global Tactical Asset Allocation.
(b) — Reflects increase due to higher contractual rates on UIF Global Tactical Asset Allocation, but UIF Global Tactical also has a Distribution Fee Waiver on Class II which is applied.
(c) — Reflects elimination of audit and tax fees for VIS - Strategist, as well Legal Fee reductions.
(d) — Reflects elimination of approximately $48,000 for miscellaneous invoices for Pricing, NASDAQ, ITG, Insurance and Lipper for VIS - Strategists.
Pro Forma Combined Condensed Statement of Assets and Liabilities
As Of June 30, 2012 (Unaudited)
| | Morgan Stanley
Variable Investment
Series - Strategist
(000) | | Universal
Institutional Funds,
Inc. Global Tactical
Asset Allocation
(000) | | Adjustments
(000) | | Universal
Institutional Funds,
Inc. Global Tactical
Asset Allocation
Pro Forma
Combined
Portfolio
(000) | |
| | | | | | | | | |
Assets: | | | | | | | | | |
Investments in Securites of Unaffiliated Issuers, at cost | | $ | 103,378 | | $ | 56,400 | | $ | — | | $ | 159,778 | |
Investment in Securities of Affiliated Issuers, at cost | | 17,909 | | 14,977 | | — | | 32,886 | |
Total investments in securities, at cost | | 121,287 | | 71,377 | | — | | 192,664 | |
Investments in Securities of Unaffiliated Issuers, at Value (1) | | 111,131 | | 55,459 | | — | | 166,590 | |
Investments in Securities of Affiliated Issuers, at Value | | 17,927 | | 14,617 | | — | | 32,544 | |
Total Investments in Securities, at Value | | 129,058 | | 70,076 | | — | | 199,134 | |
Foreign Currency, at cost | | — | | 978 | | — | | 978 | |
Foreign Currency, at value | | — | | 980 | | — | | 980 | |
Cash | | — | | — | @ | — | | — | @ |
Receivable for Variation Margin | | 23 | | 1,625 | | — | | 1,648 | |
Interest Receivable | | 282 | | 276 | | — | | 558 | |
Receivable for Investments Sold | | — | | 263 | | — | | 263 | |
Unrealized Appreciation on Swap Agreements | | 213 | | 249 | | — | | 462 | |
Unrealized Appreciation on Foreign Currency Exchange Contracts | | — | | 59 | | — | | 59 | |
Divendends Receivable | | 126 | | 55 | | — | | 181 | |
Tax Reclaim Receivable | | — | @ | 33 | | — | | 33 | |
Receivable for Portfolio Shares Sold | | — | | 5 | | — | | 5 | |
Receivable from Affiliate | | 4 | | 2 | | — | | 6 | |
Other Assets | | 6 | | 8 | | — | | 14 | |
Total Assets | | 129,712 | | 73,631 | | — | | 203,343 | |
| | | | | | | | | |
Liabilities: | | | | | | | | | |
Collateral on Securities Loaned, at Value | | — | | 8,373 | | — | | 8,373 | |
Payable for Investments Purchased | | — | | 1,523 | | — | | 1,523 | |
Due to Broker | | — | | 260 | | — | | 260 | |
Unrealized Depreciation on Swap Agreements | | 221 | | 218 | | — | | 439 | |
Unrealized Depreciation on Foreign Currency Exchange Contracts | | — | | 143 | | — | | 143 | |
Payable for Reorganization Expense | | — | | — | | 117 | (a) | 117 | |
Payable for Professional Fees | | — | | 64 | | — | | 64 | |
Payable for Portfolio Shares Redeemed | | 73 | | 61 | | — | | 134 | |
Payable for Custodian Fees | | — | | 19 | | — | | 19 | |
Payable for Advisory Fees | | 42 | | 16 | | — | | 58 | |
Payable for Administration Fees | | 8 | | 13 | | — | | 21 | |
Payable for Directors’ Fees and Expenses | | — | | 1 | | — | | 1 | |
Distribution Fees - Class II Shares | | — | | — | @ | 7 | (b) | 7 | |
Distribution Fees - Class Y Shares | | 7 | | — | | (7 | )(c) | — | |
Other Liabilities | | 58 | | 72 | | — | | 130 | |
Total Liabilities | | 409 | | 10,763 | | 117 | | 11,289 | |
Net Assets | | $ | 129,303 | | $ | 62,868 | | $ | (117 | ) | $ | 192,054 | |
| | | | | | | | | |
Net Assets Consist Of: | | | | | | | | | |
Paid-in-Capital | | $ | 125,565 | | $ | 81,250 | | $ | — | | $ | 206,815 | |
Undistributed Net Investment Income | | 1,240 | | 1,962 | | (117 | )(a) | 3,085 | |
Accumulated Net Realized Loss | | (5,262 | ) | (19,590 | ) | — | | (24,852 | ) |
Net Unrealized Appreciation (Depreciation) | | 7,760 | | (754 | ) | | | 7,006 | |
Net Assets | | $ | 129,303 | | $ | 62,868 | | $ | (117 | ) | $ | 192,054 | |
| | | | | | | | | |
| |
Including: | | | | | | | | | |
(1) Securities on loan, at value | | $ | — | | $ | 9,515 | | $ | — | | $ | 9,515 | |
| | | | | | | | | |
Class I | | | | | | | | | |
Net Assets | | $ | — | | $ | 62,720 | | $ | 92,321 | (d) | $ | 155,041 | |
Shares Outstanding | | — | | 6,963,978 | | 10,246,504 | (e) | 17,210,482 | |
Net Assets Value, Offering and Redemption Price Per Share | | $ | — | | $ | 9.01 | | $ | — | | $ | 9.01 | |
| | | | | | | | | |
Class II: | | | | | | | | | |
Net Assets | | $ | — | | $ | 148 | | $ | 36,865 | (d) | $ | 37,013 | |
Shares Outstanding | | — | | 16,500 | | 4,096,111 | (e) | 4,110,611 | |
Net Assets Value, Offering and Redemption Price Per Share | | $ | — | | $ | 9.00 | | $ | — | | $ | 9.00 | |
| | | | | | | | | |
Class X | | | | | | | | | |
Net Assets | | $ | 92,405 | | $ | — | | $ | (92,405 | )(d) | $ | — | |
Shares Outstanding | | 8,818,445 | | — | | (8,818,445 | )(e) | — | |
Net Assets Value, Offering and Redemption Price Per Share | | $ | 10.48 | | $ | — | | $ | — | | $ | — | |
| | | | | | | | | |
Class Y | | | | | | | | | |
Net Assets | | $ | 36,898 | | $ | — | | $ | (36,898 | )(d) | $ | — | |
Shares Outstanding | | 3,528,209 | | — | | (3,528,209 | )(e) | — | |
Net Assets Value, Offering and Redemption Price Per Share | | $ | 10.46 | | $ | — | | $ | — | | $ | — | |
@ Amount is less than $500.
(a) Reorganization expense.
(b) Elimination of Acquired Fund’s Distribution fees.
(c) Addition of Acquiring Fund’s Distribution fees.
(d) Reflects the adjustment to net assets due to the merger.
(e) Reflects the adjustment to the shares outstanding due to the merger.
Notes to Pro Forma Combining Financial Statements
The pro forma statements of investments, assets and liabilities and operations should be read in conjunction with the historical financial statements of the Funds included or incorporated by reference in the Statement of Additional Information of which the pro forma combined financial statements form a part. The preparation of financial statements in conformity with generally accepted accounting principles requires management to make estimates and assumptions that affect the reported amounts of assets and liabilities and disclosure of contingent assets and liabilities, if any, at the date of the financial statements and the reported amounts of increases and decreases in net assets from operations during the reporting period. Actual results could differ from those estimates. Following the Reorganization, Universal Institutional Funds Global Tactical Asset Allocation will be the accounting survivor.
Universal Institutional Funds Global Tactical Asset Allocation has elected to be taxed as a “regulated investment company” under the Internal Revenue Code. After the Reorganization, Universal Institutional Funds Global Tactical Asset Allocation intends to continue to qualify as a regulated investment company, if such qualification is in the best interests of its shareholders, by complying with the provisions available to certain investment companies, as defined in applicable sections of the Internal Revenue Code, and to make distributions of taxable income sufficient to relieve it from all, or substantially all, Federal income taxes, if it is in the best interests of its shareholders.
Statement of Additional Information Supplement
October 1, 2012
The Universal Institutional Funds, Inc.
Supplement dated October 1, 2012 to The Universal Institutional Funds, Inc. Statement of Additional Information dated April 30, 2012
The information in the table under the section of the Fund's Statement of Additional Information ("SAI") entitled "Investment Policies and Strategies" which summarizes permissible strategies and investments is hereby deleted and replaced with the following:
U.S. FIXED INCOME PORTFOLIOS:
| | | Core Plus Fixed Income | |
| Equity Securities: | |
|
| Common Stocks | | | |
|
| Convertible Securities | | a | |
|
| Depositary Receipts | |
|
| Investment Company Securities | | a | |
|
| IPOs | |
|
| Limited Partnerships | |
|
| Preferred Stocks | | a | |
|
| Private Investments in Public Equity | |
|
| Real Estate Investing | |
|
| —REITs | |
|
| —Specialized Ownership Vehicles | |
|
| Rights | | a | |
|
| Warrants | |
|
| Fixed Income Securities: | |
|
| Agencies | | a | |
|
| Asset-Backed Securities | | a | |
|
| Cash Equivalents | | a | |
|
| Commercial Paper | | a | |
|
| Corporates | | a | |
|
U.S. FIXED INCOME PORTFOLIOS:
| | | Core Plus Fixed Income | |
| Floaters | | a | |
|
| High Yield Securities | | a | |
|
| Inverse Floaters | | a | |
|
| Investment Grade Securities | | a | |
|
| Lease Obligations | |
|
| Loan Participations and Assignments | | a | |
|
| Money Market Instruments | | a | |
|
| Mortgage Related Securities | | a | |
|
| MBS | | a | |
|
| CMOs | | a | |
|
| SMBS | | a | |
|
| CMBS | | a | |
|
| Municipals | | a | |
|
| Repurchase Agreements | | a | |
|
| Temporary Investments | | a | |
|
| U.S. Treasury Securities | | a | |
|
| Yankee Dollar Obligations | | a | |
|
| Zero Coupons, Pay-In-Kind Securities or Deferred Payment Securities | | a | |
|
| Foreign Investment: | |
|
| Brady Bonds | | a | |
|
| Emerging Market Securities | | a | |
|
| Eurodollar Obligations | | a | |
|
| Foreign Fixed Income Securities | | a | |
|
U.S. FIXED INCOME PORTFOLIOS:
| | | Core Plus Fixed Income | |
| Foreign Currency Transactions | | a | |
|
| Foreign Equity Securities | | | |
|
| Investment Funds | | | |
|
| Other Securities and Investment Techniques: | |
|
| Borrowing for Investment Purposes | |
|
| Loans of Portfolio Securities | | a | |
|
| Non-Publicly Traded Securities, Private Placements and Restricted Securities | | a | |
|
| Public Bank Loans | | a | |
|
| Reverse Repurchase Agreements | | a | |
|
| Short Sales | | a | |
|
| Temporary Borrowing | | a | |
|
| When-Issued and Delayed Delivery Securities | | a | |
|
| Derivatives: | |
|
| Contracts for Difference ("CFDs") | |
|
| Options | | a | |
|
| Futures Contracts | | a | |
|
| Swaps | | a | |
|
| Structured Investments | | a | |
|
U.S. EQUITY PORTFOLIOS:
| | | Growth | | Mid Cap Growth | | Small Company Growth | | U.S. Real Estate | |
| Equity Securities: | | | |
|
| Common Stocks | | a | | a | | a | | a | |
|
| Convertible Securities | | a | | a | | a | | a | |
|
| Depositary Receipts | | a | | a | | a | | a | |
|
| Investment Company Securities | | a | | a | | a | | a | |
|
| IPOs | | a | | a | | a | | a | |
|
| Limited Partnerships | | a | | a | | a | | a | |
|
| Preferred Stocks | | a | | a | | a | | a | |
|
| Private Investments in Public Equity | | a | | a | | a | | a | |
|
| Real Estate Investing | |
|
| —REITs | | a | | a | | a | | a | |
|
| —Foreign Real Estate Companies | | a | | a | | a | | a | |
|
| —Specialized Ownership Vehicles | | a | | | | | | a | |
|
| Rights | | a | | a | | a | | a | |
|
| Warrants | | a | | a | | a | | a | |
|
| Fixed Income Securities: | | | |
|
| Agencies | | a | | a | | a | | a | |
|
| Asset-Backed Securities | |
|
| Cash Equivalents | | a | | a | | a | | a | |
|
| Commercial Paper | | a | | a | | a | | a | |
|
| Corporates | | a | | a | | a | | a | |
|
| Floaters | |
|
U.S. EQUITY PORTFOLIOS:
| | | Growth | | Mid Cap Growth | | Small Company Growth | | U.S. Real Estate | |
| High Yield Securities | |
|
| Inverse Floaters | |
|
| Investment Grade Securities | | a | | a | | a | | a | |
|
| Lease Obligations | |
|
| Loan Participations and Assignments | |
|
| Money Market Instruments | | a | | a | | a | | a | |
|
| Mortgage Related Securities | |
|
| MBS | |
|
| CMOs | |
|
| SMBS | |
|
| CMBS | |
|
| Municipals | |
|
| Repurchase Agreements | | a | | a | | a | | a | |
|
| Temporary Investments | | a | | a | | a | | a | |
|
| U.S. Treasury Securities | | a | | a | | a | | a | |
|
| Yankee Dollar Obligations | | a | | | | | | | |
|
| Zero Coupons, Pay-In-Kind Securities or Deferred Payment Securities | | a | | a | | a | | a | |
|
| Foreign Investment: | |
|
| Brady Bonds | |
|
| Emerging Market Securities | | a | | a | | a | | a | |
|
| Eurodollar Obligations | |
|
| Foreign Fixed Income Securities | | | | | | | | a | |
|
| Foreign Currency Transactions | | a | | a | | a | | a | |
|
U.S. EQUITY PORTFOLIOS:
| | | Growth | | Mid Cap Growth | | Small Company Growth | | U.S. Real Estate | |
| Foreign Equity Securities | | a | | a | | a | | a | |
|
| Investment Funds | | a | | | | | | a | |
|
| Other Securities and Investment Techniques: | |
|
| Borrowing for Investment Purposes | |
|
| Loans of Portfolio Securities | | a | | a | | a | | a | |
|
| Non-Publicly Traded Securities, Private Placements and Restricted Securities | | a | | a | | a | | a | |
|
| Public Bank Loans | |
|
| Reverse Repurchase Agreements | | | | a | | a | | | |
|
| Short Sales | | | | a | | a | | | |
|
| Temporary Borrowing | | a | | a | | a | | a | |
|
| When-Issued and Delayed Delivery Securities | | a | | a | | a | | a | |
|
| Derivatives: | |
|
| Contracts for Difference ("CFDs") | | a | | a | | a | | | |
|
| Options | | a | | a | | a | | a | |
|
| Futures Contracts | | a | | a | | a | | a | |
|
| Swaps | | a | | a | | a | | a | |
|
| Structured Investments | | a | | a | | a | | a | |
|
GLOBAL PORTFOLIOS:
| | | Emerging Markets Debt | | Emerging Markets Equity | | Global Franchise | | Global Real Estate | | Global Tactical Asset Allocation | |
| Equity Securities: | | | |
|
| Common Stocks | | | | a | | a | | a | | a | |
|
| Convertible Securities | | a | | a | | a | | a | | a | |
|
| Depositary Receipts | | a | | a | | a | | a | | a | |
|
| Investment Company Securities | | a | | a | | a | | a | | a | |
|
| IPOs | | | | a | | a | | a | | a | |
|
| Limited Partnerships | | | | a | | a | | a | | a | |
|
| Preferred Stocks | | a | | a | | a | | a | | a | |
|
| Private Investments in Public Equity | | | | a | | a | | a | | a | |
|
| Real Estate Investing | |
|
| —REITs | | | | | | a | | a | | a | |
|
| —Foreign Real Estate Companies | | a | | a | | a | | a | | a | |
|
| —Specialized Ownership Vehicles | | | | a | | a | | a | | a | |
|
| Rights | | a | | a | | a | | a | | a | |
|
| Warrants | | a | | a | | a | | a | | a | |
|
| Fixed Income Securities: | | | |
|
| Agencies | | a | | a | | * | | a | | a | |
|
| Asset-Backed Securities | | a | | | | | | | | a | |
|
| Cash Equivalents | | a | | a | | a | | a | | a | |
|
| Commercial Paper | | a | | a | | a | | a | | a | |
|
| Corporates | | a | | a | | * | | a | | a | |
|
| Floaters | | a | | | | | | a | | | |
|
GLOBAL PORTFOLIOS:
| | | Emerging Markets Debt | | Emerging Markets Equity | | Global Franchise | | Global Real Estate | | Global Tactical Asset Allocation | |
| High Yield Securities | | a | | a | | | | | | | |
|
| Inverse Floaters | | a | | | | | | a | | | |
|
| Investment Grade Securities | | a | | a | | a | | a | | a | |
|
| Lease Obligations | |
|
| Loan Participations and Assignments | | a | | a | | | | | | | |
|
| Money Market Instruments | | a | | a | | a | | a | | a | |
|
| Mortgage Related Securities | | a | | | | | | a | | | |
|
| MBS | | a | | | | | | a | | | |
|
| CMOs | | a | | | | | | a | | | |
|
| SMBS | | a | | | | | | a | | | |
|
| CMBS | | | | | | | | | | | |
|
| Municipals | | a | |
|
| Repurchase Agreements | | a | | a | | a | | a | | a | |
|
| Temporary Investments | | a | | a | | a | | a | | a | |
|
| U.S. Treasury Securities | | a | | a | | * | | a | | a | |
|
| Yankee Dollar Obligations | | a | | | | | | a | | a | |
|
| Zero Coupons, Pay-In-Kind Securities or Deferred Payment Securities | | a | | a | | | | a | | a | |
|
| Foreign Investment: | |
|
| Brady Fixed Income Securities | | a | | a | | | | a | | a | |
|
| Emerging Market Securities | | a | | a | | a | | a | | a | |
|
| Eurodollar Obligations | | a | | a | | a | | a | | a | |
|
| Foreign Bonds | | a | | a | | a | | a | | a | |
|
| Foreign Currency Transactions | | a | | a | | a | | a | | a | |
|
| Foreign Equity Securities | | a | | a | | a | | a | | a | |
|
GLOBAL PORTFOLIOS:
| | | Emerging Markets Debt | | Emerging Markets Equity | | Global Franchise | | Global Real Estate | | Global Tactical Asset Allocation | |
| Foreign Real Estate Companies | | | | a | | | | a | | | |
|
| Investment Funds | | a | | a | | a | | a | | a | |
|
| Other Securities and Investment Techniques: | |
|
| Borrowing for Investment Purposes | | a | | | | | | a | | | |
|
| Loans of Portfolio Securities | | a | | a | | a | | a | | a | |
|
Non-Publicly Traded Securities, Private Placements and Restricted
Securities | | a | | a | | a | | a | | a | |
|
| Public Bank Loans | | a | | | | | | | | | |
|
| Reverse Repurchase Agreements | | a | | | | a | | | | | |
|
| Short Sales | | a | | | | a | | a | | | |
|
| Temporary Borrowing | | a | | a | | a | | a | | a | |
|
| When-Issued and Delayed Delivery Securities | | a | | a | | a | | a | | a | |
|
| Derivatives: | |
|
| Contracts for Difference ("CFDs") | | | | a | | | | | | a | |
|
| Options | | a | | | | | | a | | a | |
|
| Futures Contracts | | a | | a | | | | a | | a | |
|
| Swaps | | a | | a | | | | a | | a | |
|
| Structured Investments | | a | | | | | | a | | a | |
|
The first paragraph under the section of the Fund's SAI entitled "Net Asset Value" is hereby deleted and replaced with the following:
The NAV per share of each Portfolio is determined by dividing the total market value of the Portfolio's investments and other assets, less the total market value of all liabilities attributable to such class, by the total number of outstanding shares of the Portfolio. NAV for Class I and Class II shares will differ due to class specific expenses paid by each class, and the 12b-1 fee charged to Class II shares. The NAV per share of each Portfolio is determined as of the close of the NYSE (normally 4:00 p.m. Eastern Time) on each day that the NYSE is open for business.
Price information on listed securities is taken from the exchange where the security is primarily traded. Portfolio securities generally are valued at their market value. In the calculation of a Portfolio's net asset value: (1) an equity portfolio security listed or traded on an exchange is valued at its latest reported sales price (or at the exchange official closing price if such exchange reports an official closing price), if there were no sales on a given day, the security is valued at the mean between the last reported bid and asked prices; and (2) all other equity portfolio securities for which over-the-counter market quotations are readily available are valued at the mean between the last reported bid and asked prices. In cases where a security is traded on more than one exchange, the security is valued on the exchange designated as the primary market. When market quotations are not readily available, including circumstances under which it is determined by the Adviser or Sub-Advisers that the closing price, last sale price or the mean between the last reported bid and asked prices are not reflective of a security's market value, portfolio securities are valued at their fair value as determined in good faith under procedures established by and under the general supervision of the Fund's Board. For valuation purposes, quotations of foreign portfolio securities, other assets and liabilities and forward contracts stated in foreign currency are translated into U.S. dollar equivalents at the prevailing market rates prior to the close of the NYSE.
***
The last two sentences of the second paragraph under the section of the Fund's SAI entitled "Net Asset Value" are hereby deleted and replaced with the following:
Short-term debt securities with remaining maturities of 60 days or less at the time of purchase may be valued at amortized cost, unless the Adviser determines such valuation does not reflect the securities' market value, in which case these securities will be valued at their fair market value as determined by the Adviser.
***
The third paragraph under the section of the Fund's SAI entitled "Net Asset Value" is hereby deleted and replaced with the following:
Certain of a Portfolio's securities may be valued by an outside pricing service approved by the Board. The pricing service may utilize a matrix system or other model incorporating attributes such as security quality, maturity and coupon as the evaluation model parameters, and/or research evaluations by its staff, including review of broker-dealer market price quotations in determining what it believes is the fair valuation of the portfolio securities valued by such pricing service.
***
The following is hereby added as the fourth paragraph under the section of the Fund's SAI entitled "Net Asset Value:"
Listed options are valued at the last reported sales price on the exchange on which they are listed (or at the exchange official closing price if such exchange reports an official closing price). If an official closing price or last reported sale price is unavailable, the listed option should be fair valued at the mean between its latest bid and ask prices. If an exchange closing price or bid
and asked prices are not available from the exchange, then the quotes from one or more brokers or dealers may be used. Unlisted options and swaps are valued by an outside pricing service approved by the Board or quotes from a broker or dealer. Unlisted options and swaps cleared on a clearinghouse or exchange may be valued using the closing price provided by the clearinghouse or exchange. Futures are valued at the settlement price on the exchange on which they trade or, if a settlement price is unavailable, then at the last sale price on the exchange.
The following is hereby added as the fifth paragraph under the section of the Fund's SAI entitled "Net Asset Value:"
If the Adviser or Sub-Advisers determine that the valuation received from the outside pricing service or broker or dealer is not reflective of the security's market value, such security is valued at its fair value as determined in good faith under procedures established by and under the general supervision of the Board.
***
The last two sentences of the last paragraph under the section of the Fund's SAI entitled "Net Asset Value" are hereby deleted and replaced with the following:
Occasionally, events which may affect the values of such securities and such exchange rates may occur between the times at which they are determined and the close of the NYSE. If events that may affect the value of such securities occur during such period, then these securities may be valued at their fair value as determined in good faith under procedures established by and under the supervision of the Board.
Please retain this supplement for future reference.
Statement of Additional Information Supplement
August 17, 2012
The Universal Institutional Funds, Inc.
Supplement dated August 17, 2012 to The Universal Institutional Funds, Inc. Statement of Additional Information dated April 30, 2012
Effective December 31, 2012, Walter B. Riddell will retire from his position as portfolio manager of the Global Franchise Portfolio. As a result, effective December 31, 2012, all references to Mr. Riddell are hereby deleted from the Statement of Additional Information.
Please retain this supplement for future reference.
Statement of Additional Information Supplement
May 17, 2012
The Universal Institutional Funds, Inc.
Supplement dated May 17, 2012 to The Universal Institutional Funds, Inc. Statement of Additional Information dated April 30, 2012
Effective immediately, Munib Madni and Samuel Rhee have been added to the team primarily responsible for the day-to-day management of each of the Emerging Markets Equity Portfolio. Accordingly, effective immediately, the Statement of Additional Information is revised as follows:
The section of the Statement of Additional Information entitled "Portfolio Managers—Other Accounts Managed by the Portfolio Managers at December 31, 2011 (unless otherwise indicated)—Emerging Markets Equity" is hereby deleted and replaced with the following:
| | | Registered Investment
Companies | | Other Pooled
Investment Vehicles | | Other Accounts | |
| Portfolio Managers | | Number of
Accounts | | Total Assets
in the Accounts | | Number of
Accounts | | Total Assets
in the Accounts | | Number of
Accounts | | Total Assets
in the Accounts | |
| Eric Carlson | | | 7 | | | $2.7 billion | | | 5 | | | $2.6 billion | | | 19 | (3) | | $4.7 billion(3) | |
| James Cheng | | | 12 | | | $4.2 billion | | | 7 | | | $2.6 billion | | | 26 | (3) | | $10.9 billion(3) | |
| Munib Madni * | | | 2 | | | $335.6 million | | | 5 | | | $2.6 billion | | | 25 | (9) | | $11.4 billion(9) | |
Ana Cristina
Piedrahita | | | 7 | | | $2.9 billion | | | 6 | | | $3.2 billion | | | 21 | (4) | | $6.7 billion(4) | |
| Paul C. Psaila | | | 8 | | | $3.0 billion | | | 5 | | | $2.6 billion | | | 19 | (3) | | $4.7 billion(3) | |
| Samuel Rhee * | | | 0 | | | $0 | | | 2 | | | $129.3 million | | | 7 | | | $7.0 billion | |
| Ruchir Sharma | | | 10 | | | $3.5 billion | | | 7 | | | $3.6 billion | | | 19 | (3) | | $4.7 billion(3) | |
* As of March 31, 2012
(3) Of these other accounts, three accounts with a total of approximately $1.5 billion in assets, had performance-based fees.
(4) Of these other accounts, four accounts with a total of approximately $3.5 billion in assets, had performance-based fees.
(9) Of these other accounts, two accounts with a total of approximately $913.4 million in assets, had performance-based fees.
| Portfolio and Portfolio Managers | | Portfolio Holdings | |
| Eric Carlson | | | None* | | |
| James Cheng | | | None* | | |
| Munib Madni ** | | | None* | | |
| Ana Cristina Piedrahita | | | None* | | |
| Paul C. Psaila | | | None* | | |
| Samuel Rhee ** | | | None* | | |
| Ruchir Sharma | | | None* | | |
* Not included in the table above, the portfolio manager has made investments in one or more other mutual funds managed by the same portfolio management team pursuant to a similar strategy.
** As of March 31, 2012.
***
Effective December 31, 2012, James Cheng will retire from his position as portfolio manager of the Emerging Markets Equity Portfolio. As a result, effective December 31, 2012, all references to Mr. Cheng are hereby deleted from the Statement of Additional Information.
Please retain this supplement for future reference.
THE UNIVERSAL INSTITUTIONAL FUNDS, INC.
522 Fifth Avenue, New York, NY 10036
STATEMENT OF ADDITIONAL INFORMATION
April 30, 2012
The Universal Institutional Funds, Inc. (the "Fund") is a no-load, open-end management investment company with diversified and non-diversified series (each a "Portfolio" and together the "Portfolios"). The Fund currently consists of 10 Portfolios offering a broad range of investment choices. Each Portfolio (with the exception of the Global Franchise, Global Real Estate and Small Company Growth Portfolios) offers Class I shares. In addition, all Portfolios offer Class II shares. Shares of each Portfolio are offered with no sales charge or exchange or redemption fee. Following is a list of the Portfolios:
| | | Share Class and Ticker Symbol | |
| | | CLASS I | | CLASS II | |
Core Plus Fixed Income | | UFIPX | | UCFIX | |
Emerging Markets Debt | | UEMDX | | UEDBX | |
Emerging Markets Equity | | UEMEX | | UEMBX | |
Global Franchise | | — | | UGIIX | |
Global Real Estate | | — | | UGETX | |
Global Tactical Asset Allocation | | UIMPX | | UGTPX | |
Growth | | UEGIX | | UEGTX | |
Mid Cap Growth* | | UMGPX | | UMGTX | |
Small Company Growth* | | — | | USIIX | |
U.S. Real Estate | | UUSRX | | USRBX | |
* Portfolio is currently closed to new investors.
This Statement of Additional Information ("SAI") dated April 30, 2012 relates to the Fund's Class I Prospectuses: Core Plus Fixed Income, Emerging Markets Debt, Emerging Markets Equity, Global Tactical Asset Allocation, Growth, Mid Cap Growth and U.S. Real Estate, each dated April 30, 2012; and Class II Prospectuses: Core Plus Fixed Income, Emerging Markets Debt, Emerging Markets Equity, Global Franchise, Global Real Estate, Global Tactical Asset Allocation, Growth, Mid Cap Growth, Small Company Growth and U.S. Real Estate Portfolios, each dated April 30, 2012.
Shares of each Portfolio may be purchased only by insurance companies for the purpose of funding variable annuity contracts and variable life insurance policies and by certain tax qualified investors. The variable annuity contract and variable life insurance policyholders incur fees and expenses separate from the fees and expenses charged by the Portfolios. This SAI addresses Fund information applicable to each of the 10 Portfolios.
The Fund was incorporated under the laws of the State of Maryland on March 26, 1996. The Fund filed a registration statement with the United States Securities and Exchange Commission (the "SEC") registering itself as an open-end management investment company under the Investment Company Act of 1940, as amended (the "1940 Act"), and its shares under the Securities Act of 1933, as amended (the "1933 Act").
The Portfolios are managed by Morgan Stanley Investment Management Inc. (the "Adviser").
This SAI is not a prospectus, but should be read in conjunction with the prospectuses for the Fund's Portfolios, each dated April 30, 2012 (each a "Prospectus" and together the "Prospectuses"). This SAI is incorporated by reference into the Prospectuses in its entirety. To obtain a Prospectus, please contact the Fund or your insurance company.
The Emerging Markets Debt, Global Franchise and U.S. Real Estate Portfolios are each "non-diversified" and, as such, such Portfolios' investments are not required to meet certain diversification requirements under federal securities law. Compared with "diversified" funds or portfolios, each such Portfolio may invest a greater
percentage of its assets in the securities of an individual corporation or governmental entity. Thus, the Portfolio's assets may be concentrated in fewer securities than other funds. A decline in the value of those investments would cause the Portfolio's overall value to decline to a greater degree.
TABLE OF CONTENTS
| | | Page | |
INVESTMENT POLICIES AND STRATEGIES | | | 4 | | |
TAXES | | | 46 | | |
PURCHASE OF SHARES | | | 49 | | |
REDEMPTION OF SHARES | | | 49 | | |
INVESTMENT LIMITATIONS | | | 50 | | |
MANAGEMENT OF THE FUND | | | 52 | | |
COMPENSATION | | | 65 | | |
INVESTMENT ADVISORY, SUB-ADVISORY, DISTRIBUTION AND ADMINISTRATIVE
AGREEMENTS | | | 66 | | |
DISTRIBUTION OF SHARES (APPLICABLE TO CLASS II SHARES ONLY) | | | 70 | | |
PORTFOLIO MANAGERS | | | 72 | | |
CONTROL PERSONS AND PRINCIPAL HOLDERS OF SECURITIES | | | 76 | | |
NET ASSET VALUE | | | 82 | | |
PORTFOLIO TRANSACTIONS | | | 83 | | |
BROKERAGE FEES | | | 85 | | |
PERFORMANCE INFORMATION | | | 88 | | |
DISCLOSURE OF PORTFOLIO HOLDINGS | | | 89 | | |
GENERAL INFORMATION | | | 93 | | |
FINANCIAL STATEMENTS | | | 94 | | |
APPENDIX A MORGAN STANLEY INVESTMENT MANAGEMENT PROXY VOTING
POLICY AND PROCEDURES | | A-1 | |
APPENDIX B DESCRIPTION OF RATINGS | | B-1 | |
i
INVESTMENT POLICIES AND STRATEGIES
This SAI provides additional information about the investment policies and operations of the Fund and each of its Portfolios. Under the supervision of the Adviser, Morgan Stanley Investment Management Limited ("MSIM Limited") serves as investment sub-adviser to the Emerging Markets Equity, Global Franchise and Global Real Estate Portfolios; Morgan Stanley Investment Management Company ("MSIM Company") serves as investment sub-adviser to the Emerging Markets Equity, Global Franchise and Global Real Estate Portfolios (MSIM Limited and MSIM Company are each referred to individually as the "Sub-Adviser" and collectively as the "Sub-Advisers"). References to the Adviser, when used in connection with its activities as investment adviser, include any Sub-Adviser acting under the Adviser's supervision.
The following tables summarize the permissible investments for each Portfolio. These tables should be used in conjunction with the investment summaries for each Portfolio contained in the Prospectus in order to provide a complete description of such Portfolio's investment policies.
U.S. FIXED INCOME PORTFOLIOS:
| | | Core Plus Fixed Income | |
Equity Securities: | |
Common Stocks | | | |
Convertible Securities | | a | |
Depositary Receipts | | | |
Investment Company Securities | | a | |
IPOs | | | |
Limited Partnerships | | | |
Preferred Stocks | | a | |
Private Investments in Public Equity | | | |
Real Estate Investing | | | |
–REITs | | | |
| – Specialized Ownership Vehicles | | | |
Rights | | a | |
Warrants | | | |
4
U.S. FIXED INCOME PORTFOLIOS:
| | | Core Plus Fixed Income | |
Fixed Income Securities: | |
Agencies | | a | |
Asset-Backed Securities | | a | |
Cash Equivalents | | a | |
Commercial Paper | | a | |
Corporates | | a | |
Floaters | | a | |
High Yield Securities | | a | |
Inverse Floaters | | a | |
Investment Grade Securities | | a | |
Lease Obligations | | | |
Loan Participations and Assignments | | a | |
Money Market Instruments | | a | |
Mortgage Related Securities | | a | |
MBS | | a | |
CMOs | | a | |
SMBS | | a | |
CMBS | | a | |
Municipals | | a | |
Repurchase Agreements | | a | |
Temporary Investments | | a | |
U.S. Treasury Securities | | a | |
Yankee Dollar Obligations | | a | |
Zero Coupons, Pay-In-Kind Securities or Deferred Payment Securities | | a | |
5
U.S. FIXED INCOME PORTFOLIOS:
| | | Core Plus Fixed Income | |
Foreign Investment: | |
Brady Bonds | | a | |
Emerging Market Securities | | a | |
Eurodollar Obligations | | a | |
Foreign Fixed Income Securities | | a | |
Foreign Currency Transactions | | a | |
Foreign Equity Securities | | | |
Investment Funds | | | |
Other Securities And Investment Techniques: | |
Borrowing for Investment Purposes | | | |
Loans of Portfolio Securities | | a | |
Non-Publicly Traded Securities, Private Placements and Restricted Securities | | a | |
Public Bank Loans | | a | |
Reverse Repurchase Agreements | | a | |
Short Sales | | a | |
Temporary Borrowing | | a | |
When-Issued and Delayed Delivery Securities | | a | |
Derivatives: | |
Contracts for Difference ("CFDs") | | | |
Options | | a | |
Futures Contracts | | a | |
Swaps | | a | |
Structured Investments | | a | |
6
U.S. EQUITY PORTFOLIOS:
| | | Growth | | Mid Cap Growth | | Small Company Growth | | U.S. Real Estate | |
Equity Securities: | |
Common Stocks | | a | | a | | a | | a | |
Convertible Securities | | a | | a | | a | | a | |
Depositary Receipts | | a | | a | | a | | a | |
Investment Company Securities | | a | | a | | a | | a | |
IPOs | | a | | a | | a | | a | |
Limited Partnerships | | a | | a | | a | | a | |
Preferred Stocks | | a | | a | | a | | a | |
Private Investments in Public Equity | | a | | a | | a | | a | |
Real Estate Investing | | | | | | | | | |
| – REITs | | a | | a | | a | | a | |
| – Specialized Ownership Vehicles | | a | | | | | | a | |
Rights | | a | | a | | a | | a | |
Warrants | | a | | a | | a | | a | |
Fixed Income Securities: | |
Agencies | | a | | a | | a | | a | |
Asset-Backed Securities | | | | | | | | | |
Cash Equivalents | | a | | a | | a | | a | |
Commercial Paper | | a | | a | | a | | a | |
Corporates | | a | | a | | a | | a | |
Floaters | | | | | | | | | |
7
U.S. EQUITY PORTFOLIOS:
| | | Growth | | Mid Cap Growth | | Small Company Growth | | U.S. Real Estate | |
High Yield Securities | | | | | | | | | |
Inverse Floaters | | | | | | | | | |
Investment Grade Securities | | a | | a | | a | | a | |
Lease Obligations | | | | | | | | | |
Loan Participations and Assignments | | | | | | | | | |
Money Market Instruments | | a | | a | | a | | a | |
Mortgage Related Securities | | | | | | | |
MBS | | | | | | | | | |
CMOs | | | | | | | | | |
SMBS | | | | | | | | | |
CMBS | | | | | | | | | |
Municipals | | | | | | | | | |
Repurchase Agreements | | a | | a | | a | | a | |
Temporary Investments | | a | | a | | a | | a | |
U.S. Treasury Securities | | a | | a | | a | | a | |
Yankee Dollar Obligations | | a | | | | | | | |
Zero Coupons, Pay-In-Kind Securities or
Deferred Payment Securities | | a | | a | | a | | a | |
Foreign Investment: | |
Brady Bonds | | | | | | | | | |
Emerging Market Securities | | a | | a | | a | | a | |
Eurodollar Obligations | | | | | | | | | |
Foreign Fixed Income Securities | | | | | | | | a | |
8
U.S. EQUITY PORTFOLIOS:
| | | Growth | | Mid Cap Growth | | Small Company Growth | | U.S. Real Estate | |
Foreign Currency Transactions | | a | | a | | a | | a | |
Foreign Equity Securities | | a | | a | | a | | a | |
Investment Funds | | a | | | | | | a | |
Other Securities and Investment Techniques: | |
Borrowing for Investment Purposes | | | | | | | | | |
Loans of Portfolio Securities | | a | | a | | a | | a | |
Non-Publicly Traded Securities, Private
Placements and Restricted Securities | | a | | a | | a | | a | |
Public Bank Loans | | | | | | | | | |
Reverse Repurchase Agreements | | | | a | | a | | | |
Short Sales | | | | a | | a | | | |
Temporary Borrowing | | a | | a | | a | | a | |
When-Issued and Delayed Delivery Securities | | a | | a | | a | | a | |
Derivatives: | |
Contracts for Difference ("CFDs") | | a | | a | | a | | | |
Options | | a | | a | | a | | a | |
Futures Contracts | | a | | a | | a | | a | |
Swaps | | a | | a | | a | | a | |
Structured Investments | | a | | a | | a | | a | |
9
GLOBAL PORTFOLIOS:
| | | Emerging Markets Debt | | Emerging Markets Equity | | Global Franchise | | Global Real Estate | | Global Tactical Asset Allocation | |
Equity Securities: | |
Common Stocks | | | | a | | a | | a | | a | |
Convertible Securities | | a | | a | | a | | a | | a | |
Depositary Receipts | | a | | a | | a | | a | | a | |
Investment Company Securities | | a | | a | | a | | a | | a | |
IPOs | | | | a | | a | | a | | a | |
Limited Partnerships | | | | a | | a | | a | | a | |
Preferred Stocks | | a | | a | | a | | a | | a | |
Private Investments in Public Equity | | | | a | | a | | a | | a | |
Real Estate Investing | | | | | | | | | | | |
| – REITs | | | | | | a | | a | | a | |
| – Foreign Real Estate Companies | | a | | a | | | | a | | | |
| – Specialized Ownership Vehicles | | | | a | | a | | a | | a | |
Rights | | a | | a | | a | | a | | a | |
Warrants | | a | | a | | a | | a | | a | |
Fixed Income Securities: | |
Agencies | | a | | a | | * | | a | | a | |
Asset-Backed Securities | | a | | | | | | | | a | |
Cash Equivalents | | a | | a | | a | | a | | a | |
Commercial Paper | | a | | a | | a | | a | | a | |
Corporates | | a | | a | | * | | a | | a | |
Floaters | | a | | | | | | a | | | |
High Yield Securities | | a | | a | | | | | | | |
10
GLOBAL PORTFOLIOS:
| | | Emerging Markets Debt | | Emerging Markets Equity | | Global Franchise | | Global Real Estate | | Global Tactical Asset Allocation | |
Inverse Floaters | | a | | | | | | a | | | |
Investment Grade Securities | | a | | a | | a | | a | | a | |
Lease Obligations | | | | | | | | | | | |
Loan Participations and Assignments | | a | | a | | | | | | | |
Money Market Instruments | | a | | a | | a | | a | | a | |
Mortgage Related Securities | | a | | | | | | a | | | |
MBS | | a | | | | | | a | | | |
CMOs | | a | | | | | | a | | | |
SMBS | | a | | | | | | a | | | |
CMBS | | | | | | | | | | | |
Municipals | | a | | | | | | a | | | |
Repurchase Agreements | | a | | a | | a | | a | | a | |
Temporary Investments | | a | | a | | a | | a | | a | |
U.S. Treasury Securities | | a | | a | | * | | a | | a | |
Yankee Dollar Obligations | | a | | | | | | a | | a | |
Zero Coupons, Pay-In-Kind Securities or
Deferred Payment Securities | | a | | a | | | | a | | a | |
Foreign Investment: | |
Brady Fixed Income Securities | | a | | a | | | | a | | a | |
Emerging Market Securities | | a | | a | | a | | a | | a | |
Eurodollar Obligations | | a | | a | | a | | a | | a | |
Foreign Bonds | | a | | a | | a | | a | | a | |
Foreign Currency Transactions | | a | | a | | a | | a | | a | |
Foreign Equity Securities | | a | | a | | a | | a | | a | |
11
GLOBAL PORTFOLIOS:
| | | Emerging Markets Debt | | Emerging Markets Equity | | Global Franchise | | Global Real Estate | | Global Tactical Asset Allocation | |
Foreign Real Estate Companies | | | | a | | | | a | | | |
Investment Funds | | a | | a | | a | | a | | a | |
Other Securities and Investment Techniques: | |
Borrowing for Investment Purposes | | a | | | | | | a | | | |
Loans of Portfolio Securities | | a | | a | | a | | a | | a | |
Non-Publicly Traded Securities, Private
Placements and Restricted Securities | | a | | a | | a | | a | | a | |
Public Bank Loans | | a | | | | | | | | | |
Reverse Repurchase Agreements | | a | | | | a | | | | | |
Short Sales | | a | | | | a | | a | | | |
Temporary Borrowing | | a | | a | | a | | a | | a | |
When-Issued and Delayed Delivery Securities | | a | | a | | a | | a | | a | |
Derivatives: | |
Contracts for Difference ("CFDs") | | | | a | | | | | | a | |
Options | | a | | | | | | a | | a | |
Futures Contracts | | a | | a | | | | a | | a | |
Swaps | | a | | a | | | | a | | a | |
Structured Investments | | a | | | | | | a | | a | |
* This Portfolio may invest in certain U.S. Government Securities, Agencies and Corporates as described under Money Market Instruments and Temporary Investments.
12
EQUITY SECURITIES
In general, prices of equity securities are more volatile than those of fixed income securities. The prices of equity securities will rise and fall in response to a number of different factors. In particular, prices of equity securities will respond to events that affect entire financial markets or industries (changes in inflation or consumer demand, for example) and to events that affect particular issuers (news about the success or failure of a new product, for example).
Common Stocks: Common Stocks are equity securities representing an ownership interest in a corporation, entitling the stockholder to voting rights and receipt of dividends paid based on proportionate ownership.
Convertible Securities: A convertible security is a bond, debenture, note, preferred stock, right, warrant or other security that may be converted into or exchanged for a prescribed amount of common stock or other security of the same or a different issuer or into cash within a particular period of time at a specified price or formula. A convertible security generally entitles the holder to receive interest paid or accrued on debt securities or the dividend paid on preferred stock until the convertible security matures or is redeemed, converted or exchanged. Before conversion, convertible securities generally have characteristics similar to both debt and equity securities. The value of convertible securities tends to decline as interest rates rise and, because of the conversion feature, tends to vary with fluctuations in the market value of the underlying securities. Convertible securities ordinarily provide a stream of income with generally higher yields than those of common stock of the same or similar issuers. Convertible securities generally rank senior to common stock in a corporation's capital structure but are usually subordinated to comparable nonconvertible securities. Convertible securities generally do not participate directly in any dividend increases or decreases of the underlying securities although the market prices of convertible securities may be affected by any dividend changes or other changes in the underlying securities.
Depositary Receipts: Depositary Receipts represent an ownership interest in securities of foreign companies (an "underlying issuer") that are deposited with a depositary. Depositary Receipts are not necessarily denominated in the same currency as the underlying securities. Depositary Receipts include American Depositary Receipts ("ADRs"), Global Depositary Receipts ("GDRs") and other types of Depositary Receipts (which, together with ADRs and GDRs, are hereinafter collectively referred to as "Depositary Receipts"). ADRs are dollar-denominated Depositary Receipts typically issued by a U.S. financial institution which evidence an ownership interest in a security or pool of securities issued by a foreign issuer. ADRs are listed and traded in the United States. GDRs and other types of Depositary Receipts are typically issued by foreign banks or trust companies, although they also may be issued by U.S. financial institutions and evidence ownership interests in a security or pool of securities issued by either a foreign or a U.S. corporation. Generally, Depositary Receipts in registered form are designed for use in the U.S. securities market and Depositary Receipts in bearer form are designed for use in securities markets outside the United States.
Depositary Receipts may be "sponsored" or "unsponsored." Sponsored Depositary Receipts are established jointly by a depositary and the underlying issuer, whereas unsponsored Depositary Receipts may be established by a depositary without participation by the underlying issuer. Holders of unsponsored Depositary Receipts generally bear all the costs associated with establishing unsponsored Depositary Receipts. In addition, the issuers of the securities underlying unsponsored Depository Receipts are not obligated to disclose material information in the United States and, therefore, there may be less information available regarding such issuers and there may not be a correlation between such information and the market value of the Depositary Receipts. For purposes of a Portfolio's investment policies, the Portfolio's investments in Depositary Receipts will be deemed to be an investment in the underlying securities, except that ADRs may be deemed to be issued by a U.S. issuer.
Investment Company Securities: Investment Company Securities are securities of other open-end, closed-end or unregistered investment companies, including foreign investment companies and exchange-traded funds.
13
A Portfolio may invest in investment company securities as may be permitted by (i) the 1940 Act; (ii) the rules and regulations promulgated by the SEC under the 1940 Act; or (iii) an exemption or other relief applicable to a Portfolio from provisions of the 1940 Act. The 1940 Act generally prohibits an underlying fund from acquiring more than 3% of the outstanding voting shares of an investment company and limits such investments to no more than 5% of the Portfolio's total assets in any one investment company, and no more than 10% in any combination of investment companies. A Portfolio may invest in investment company securities of investment companies managed by the Adviser or its affiliates to the extent permitted under the 1940 Act or as otherwise authorized by the SEC. To the extent a Portfolio invests a portion of its assets in investment company securities, those assets will be subject to the risks of the purchased investment company's portfolio securities, and a shareholder in a Portfolio will bear not only his proportionate share of the expenses of a Portfolio, but also, indirectly the expenses of the purchased investment company.
To the extent permitted by applicable law, a Portfolio may invest all or some of its short term cash investments in any money market fund advised or managed by the Adviser or its affiliates. In connection with any such investments, the Portfolio, to the extent permitted by the 1940 Act, will pay its share of all expenses (other than advisory and administrative fees) of a money market fund in which it invests which may result in the Portfolio bearing some additional expenses.
Exchange-Traded Funds ("ETFs"): Certain Portfolios may invest in shares of various ETFs, including exchange-traded index and bond funds. Exchange-traded index funds seek to track the performance of various securities indices. Shares of ETFs have many of the same risks as direct investments in common stocks or bonds. In addition, their market value is expected to rise and fall as the value of the underlying index or bond rises and falls. The market value of their shares may differ from the net asset value ("NAV") of the particular fund. As a shareholder in an ETF (as with other investment companies), the Portfolio would bear its ratable share of that entity's expenses. At the same time, the Portfolio would continue to pay its own investment management fees and other expenses. As a result, the Portfolio and its shareholders, in effect, will be absorbing duplicate levels of fees with respect to investments in ETFs. Further, certain Portfolios may invest in leveraged ETFs. The more a Portfolio invests in such leveraged ETFs, the more this leverage will magnify any losses on those investments.
IPOs: Equity Portfolios of the Fund may purchase shares issued as part of, or a short period after, companies' initial public offerings ("IPOs") and may at times dispose of those shares shortly after their acquisition. A Portfolio's purchase of those shares issued in IPOs exposes it to the risks associated with companies that have little operating history as public companies, as well as to the risks inherent in those sectors of the market where these new issuers operate. The market for IPO issuers has been volatile and share prices of newly-priced companies have fluctuated in significant amounts over short periods of time.
Limited Partnerships: A limited partnership interest entitles a Portfolio to participate in the investment return of the partnership's assets as defined by the agreement among the partners. As a limited partner, a Portfolio generally is not permitted to participate in the management of the partnership. However, unlike a general partner whose liability is not limited, a limited partner's liability generally is limited to the amount of its commitment to the partnership. A Portfolio that invests in limited partnership interests may invest to the same extent in limited liability company interests. Limited liability company interests have similar characteristics as limited partnership interests.
Preferred Stocks: Preferred Stocks are securities that evidence ownership in a corporation and pay a fixed or variable stream of dividends. Preferred Stocks have a preference over Common Stocks in the event of the liquidation of an issuer and usually do not carry voting rights. Because Preferred Stocks pay a fixed or variable stream of dividends they have many of the characteristics of both equity securities and fixed income securities. Therefore, the Fund's equity and fixed income Portfolios may all purchase preferred stocks.
14
Private Investments in Public Equity. A Portfolio may purchase equity securities in a private placement that are issued by issuers who have outstanding, publicly-traded equity securities of the same class ("private investments in public equity" or "PIPES"). Shares in PIPES generally are not registered with the SEC until after a certain time period from the date the private sale is completed. This restricted period can last many months. Until the public registration process is completed, PIPES are restricted as to resale and the Portfolio cannot freely trade the securities. Generally, such restrictions cause the PIPES to be illiquid during this time. PIPES may contain provisions that the issuer will pay specified financial penalties to the holder if the issuer does not publicly register the restricted equity securities within a specified period of time, but there is no assurance that the restricted equity securities will be publicly registered, or that the registration will remain in effect.
Real Estate Investing: Investments in securities of issuers engaged in the real estate industry entail special risks and considerations. In particular, securities of such issuers may be subject to risks associated with the direct ownership of real estate. These risks include: the cyclical nature of real estate values, risks related to general and local economic conditions, overbuilding and increased competition, increases in property taxes and operating expenses, demographic trends and variations in rental income, changes in zoning laws, casualty or condemnation losses, environmental risks, regulatory limitations on rents, changes in neighborhood values, changes in the appeal of properties to tenants, increases in interest rates and other real estate capital market influences. Generally, increases in interest rates will increase the costs of obtaining financing, which could directly and indirectly decrease the value of the Portfolios' investments.
REITs and Foreign Real Estate Companies: Certain Portfolios may invest in REITs and foreign real estate companies, which are similar to entities organized and operated as REITs in the United States. REITs and foreign real estate companies pool investors' funds for investment primarily in real estate properties or real estate-related loans. REITs and foreign real estate companies generally derive their income from rents on the underlying properties or interest on the underlying loans, and their value is impacted by changes in the value of the underlying property or changes in interest rates affecting the underlying loans owned by the REITs and/or foreign real estate companies. REITs and foreign real estate companies are more susceptible to risks associated with the ownership of real estate and the real estate industry in general. These risks can include fluctuations in the value of underlying properties; defaults by borrowers or tenants; market saturation; changes in general and local economic conditions; decreases in market rates for rents; increases in competition, property taxes, capital expenditures or operating expenses; and other economic, political or regulatory occurrences affecting the real estate industry. In addition, REITs and foreign real estate companies depend upon specialized management skills, may not be diversified (which may increase the volatility of a REIT's and/or foreign real estate company's value), may have less trading volume and may be subject to more abrupt or erratic price movements than the overall securities market. Foreign real estate companies may be subject to laws, rules and regulations governing those entities and their failure to comply with those laws, rules and regulations could negatively impact the performance of those entities. Operating REITs and foreign real estate companies requires specialized management skills and a Portfolio indirectly bears REIT and foreign real estate company management expenses along with the direct expenses of the Portfolio. REITs are not taxed on income distributed to shareholders provided they comply with several requirements of the Internal Revenue Code of 1986, as amended (the "Code"). REITs are subject to the risk of failing to qualify for tax-free pass-through of income under the Code.
Rights: Rights represent the right, but not the obligation, for a fixed period of time to purchase additional shares of an issuer's Common Stock at the time of a new issuance, usually at a price below the initial offering price of the Common Stock and before the Common Stock is offered to the general public. Rights are usually freely transferable. The risk of investing in a Right is that the Right may expire prior to the market value of the Common Stock exceeding the price fixed by the Right.
Specialized Ownership Vehicles: Specialized ownership vehicles pool investors' funds for investment primarily in income-producing real estate or real estate related loans or interests. Such specialized ownership vehicles in which the Portfolios may invest include property unit trusts, foreign real estate companies, REITs
15
and other similar specialized investment vehicles. Investments in such specialized ownership vehicles may have favorable or unfavorable legal, regulatory or tax implications for a Portfolio and, to the extent such vehicles are structured similarly to investment funds, may cause the Portfolios' shareholders to indirectly bear certain additional operating expenses.
Warrants: Warrants give holders the right, but not the obligation, to buy Common Stock of an issuer at a given price, usually higher than the market price at the time of issuance, during a specified period. Warrants are usually freely transferable. The risk of investing in a Warrant is that the Warrant may expire prior to the market value of the Common Stock exceeding the price fixed by the Warrant.
FIXED INCOME SECURITIES
Fixed Income Securities generally represent an issuer's obligation to repay to the investor (or lender) the amount borrowed plus interest over a specified time period. A typical Fixed Income Security specifies a fixed date when the amount borrowed (principal) is due in full, known as the maturity date and specifies dates when periodic interest (coupon) payments will be made over the life of the Security.
Fixed Income Securities come in many varieties and may differ in the way that interest is calculated, the amount and frequency of payments, the type of collateral, if any, and the presence of special features (e.g., conversion rights). Prices of Fixed Income Securities fluctuate and, in particular, are subject to several key risks including, but not limited to, interest-rate risk, credit risk, prepayment risk and spread risk.
Interest-rate risk arises due to general changes in the level of market rates after the purchase of a Fixed Income Security. Generally, the values of Fixed Income Securities vary inversely with changes in interest rates. During periods of falling interest rates, the values of most outstanding Fixed Income Securities generally rise and during periods of rising interest rates, the values of most Fixed Income Securities generally decline. While Fixed Income Securities with longer final maturities often have higher yields than those with shorter maturities, they usually possess greater price sensitivity to changes in interest rates and other factors. Traditionally, the remaining term to maturity has been used as a barometer of a Fixed Income Security's sensitivity to interest rate changes. This measure, however, considers only the time until the final principal payment and takes no account of the pattern or amount of principal or interest payments prior to maturity. Duration combines consideration of yield, coupon, interest and principal payments, final maturity and call (prepayment) features. Duration measures the likely percentage change in a Fixed Income Security's price for a small parallel shift in the general level of interest rates; it is also an estimate of the weighted average life of the remaining cash flows of a Security. In almost all cases, the duration of a Fixed Income Security is shorter than its term to maturity.
Credit risk, also known as default risk, represents the possibility that an issuer may be unable to meet scheduled interest and principal payment obligations. It is most often associated with corporate bonds, although it can be present in other Fixed Income Securities, as well (note that the market generally assumes that obligations of the U.S. Treasury are free from credit risk). Credit ratings and quantitative models attempt to measure the degree of credit risk in Fixed Income Securities and provide insight as to whether prevailing yield spreads afford sufficient compensation for such risk. Other things being equal, Fixed Income Securities with high degrees of credit risk should trade in the market at lower prices (and higher yields) than Fixed Income Securities with low degrees of credit risk.
Prepayment risk, also known as call risk, arises due to the issuer's ability to prepay all or most of the Fixed Income Security prior to the stated final maturity date. Prepayments generally rise in response to a decline in interest rates as debtors take advantage of the opportunity to refinance their obligations. This risk is often associated with mortgage securities where the underlying mortgage loans can be refinanced, although it can also be present in corporate or other types of bonds with call provisions. When a prepayment occurs, a Portfolio may be forced to reinvest in lower yielding Fixed Income Securities. Quantitative models help assess the degree
16
of prepayment risk and provide insight as to whether prevailing yield spreads afford sufficient compensation for such risk.
Spread risk is the potential for the value of a Portfolio's assets to fall due to the widening of spreads. Fixed Income Securities generally compensate for greater credit risk by paying interest at a higher rate. The difference (or "spread") between the yield of a security and the yield of a benchmark, such as a U.S. Treasury security with a comparable maturity, measures the additional interest paid for credit risk. As the spread on a security widens (or increases), the price (or value) of the security falls. Spread widening may occur, among other reasons, as a result of market concerns over the stability of the market, excess supply, general credit concerns in other markets, security- or market-specific credit concerns or general reductions in risk tolerance.
Economic, political and other events also may affect the prices of broad fixed income markets, although the risks associated with such events are transmitted to the market via changes in the prevailing levels of interest rates, credit risk, prepayment risk, or spread risk.
Agencies: Agencies are Fixed Income Securities issued or guaranteed by federal agencies and U.S. Government sponsored instrumentalities. They may or may not be backed by the full faith and credit of the U.S. Government. If they are not backed by the full faith and credit of the United States, the investor must look principally to the agency or instrumentality issuing or guaranteeing the obligation for ultimate repayment and may not be able to assert a claim against the United States itself in the event the agency or instrumentality does not meet its commitment. Agencies that are backed by the full faith and credit of the United States include the Export-Import Bank of the United States, Farmers Home Administration, Federal Financing Bank, Federal Housing Administration, Maritime Administration, Small Business Administration and the Tennessee Valley Authority, among others. Certain debt issued by Resolution Funding Corporation has both its principal and interest backed by the full faith and credit of the U.S. Treasury in that its principal is defeased by U.S. Treasury zero coupon issues, while the U.S. Treasury is explicitly required to advance funds sufficient to pay interest on it, if needed. Certain agencies and instrumentalities, such as the Government National Mortgage Association ("Ginnie Mae"), are, in effect, backed by the full faith and credit of the United States through provisions in their charters that they may make "indefinite and unlimited" drawings on the Treasury, if needed to service its debt. Debt from certain other agencies and instrumentalities, including the Federal Home Loan Bank, the Federal National Mortgage Association ("Fannie Mae"), and the Federal Home Loan Mortgage Corporation ("Freddie Mac"), are not guaranteed by the United States, but those institutions are protected by the discretionary authority of the U.S. Treasury to purchase certain amounts of their securities to assist them in meeting their debt obligations.
In September 2008, the U.S. Treasury Department announced that the government would be taking over Fannie Mae and Freddie Mac and placing the companies into a conservatorship. In addition, the U.S. Treasury Department announced additional steps that it intended to take with respect to the debt and mortgage-backed securities issued by Fannie Mae and Freddie Mac in order to support the conservatorship. No assurance can be given that these initiatives will be successful. The maximum potential liability of the issuers of some U.S. government securities held by a Portfolio may greatly exceed their current resources, including their legal right to support from the U.S. Treasury. It is possible that these issuers will not have the funds to meet their payment obligations in the future.
An instrumentality of the U.S. Government is a government agency organized under federal charter with government supervision. Instrumentalities issuing or guaranteeing securities include, among others, Federal Home Loan Bank, the Federal Land Bank, Central Bank for Cooperatives, Federal Intermediate Credit Bank and Fannie Mae.
Asset-Backed Securities: Certain Portfolios may invest in asset-backed securities. Asset-backed securities utilize the securitization techniques used to develop mortgage-backed securities. These techniques are also
17
applied to a broad range of other assets. Various types of assets, primarily automobile and credit card receivables and home equity loans, are being securitized in pass-through structures similar to the mortgage pass-through structures. These types of securities are known as asset-backed securities. A Portfolio may invest in any type of asset-backed security. Asset-backed securities have risk characteristics similar to mortgage-backed securities. Like mortgage-backed securities, they generally decrease in value as a result of interest rate increases, but may benefit less than other fixed income securities from declining interest rates, principally because of prepayments. Also, as in the case of mortgage-backed securities, prepayments generally increase during a period of declining interest rates although other factors, such as changes in credit use and payment patterns, may also influence prepayment rates. Asset-backed securities also involve the risk that various federal and state consumer laws and other legal, regulatory and economic factors may result in the collateral backing the securities being insufficient to support payment on the securities.
Cash Equivalents: Cash equivalents are short-term Fixed Income Securities comprising:
(1) Time deposits, certificates of deposit (including marketable variable rate certificates of deposit) and bankers' acceptances issued by a commercial bank or savings and loan association. Time deposits are non-negotiable deposits maintained in a banking institution for a specified period of time at a stated interest rate. Certificates of deposit are negotiable short-term obligations issued by commercial banks or savings and loan associations against funds deposited in the issuing institution. Variable rate certificates of deposit are certificates of deposit on which the interest rate is periodically adjusted prior to their stated maturity based upon a specified market rate. A bankers' acceptance is a time draft drawn on a commercial bank by a borrower usually in connection with an international commercial transaction (to finance the import, export, transfer or storage of goods).
A Portfolio may invest in obligations of U.S. banks, of foreign branches of U.S. banks (Eurodollars) and of U.S. branches of foreign banks (Yankee dollars). Euro and Yankee dollar investments will involve some of the same risks of investing in international securities that are discussed in the foreign investing section of the Prospectus.
A Portfolio will not invest in any security issued by a commercial bank unless (i) the bank has total assets of at least $1 billion, or the equivalent in other currencies, or, in the case of domestic banks which do not have total assets of at least $1 billion, the aggregate investment made in any one such bank is limited to $250,000 principal amount per certificate (a temporary increase from $100,000, which is due to expire on December 31, 2013) and the principal amount of such investment is insured in full by the Federal Deposit Insurance Corporation ("FDIC"), (ii) in the case of U.S. banks, it is a member of the FDIC, and (iii) in the case of foreign branches of U.S. banks, the security is deemed by the Adviser to be of an investment quality comparable with other fixed income securities which the Portfolio may purchase.
(2) Commercial Paper rated at time of purchase by one or more Nationally Recognized Statistical Rating Organizations ("NRSRO") in one of their two highest categories, (e.g., A-l or A-2 by Standard & Poor's Rating Group, a division of The McGraw-Hill Companies Inc. ("S&P") or Prime 1 or Prime 2 by Moody's Investors Services, Inc. ("Moody's")), or, if not rated, issued by a corporation having an outstanding unsecured debt issue rated high-grade by an NRSRO (e.g., A or better by Moody's, S&P or Fitch, Inc. ("Fitch"));
(3) Short-term corporate obligations rated high-grade at the time of purchase by an NRSRO (e.g., A or better by Moody's, S&P or Fitch);
(4) U.S. Government obligations including bills, notes, bonds and other debt securities issued by the U.S. Treasury. These are direct obligations of the U.S. Government and differ mainly in interest rates, maturities and dates of issue;
(5) Government Agency securities issued or guaranteed by U.S. Government sponsored instrumentalities and Federal agencies. These include securities issued by the Federal Home Loan Banks, Federal Land Bank,
18
Farmers Home Administration, Farm Credit Banks, Federal Intermediate Credit Bank, Fannie Mae, Federal Financing Bank, the Tennessee Valley Authority and others; and
(6) Repurchase Agreements collateralized by securities listed above.
Commercial Paper: Commercial Paper refers to short-term Fixed Income Securities with maturities ranging from two to 270 days. They are primarily issued by corporations needing to finance large amounts of receivables, but may be issued by banks and other borrowers. Commercial Paper is issued either directly or through broker-dealers and may be discounted or interest-bearing. Commercial Paper is unsecured, but is almost always backed by bank lines of credit. Virtually all commercial paper is rated by Moody's or S&P.
Commercial paper rated A-1 by S&P has the following characteristics: (1) liquidity ratios are adequate to meet cash requirements; (2) long-term senior debt is rated "A" or better; (3) the issuer has access to at least two additional channels of borrowing; (4) basic earnings and cash flow have an upward trend with allowance made for unusual circumstances; (5) typically, the issuer's industry is well established and the issuer has a strong position within the industry; and (6) the reliability and quality of management are unquestioned. Relative strength or weakness of the above factors determine whether the issuer's commercial paper is A-1, A-2, or A-3.
The rating Prime-1 is the highest commercial paper rating assigned by Moody's. Among the factors considered by Moody's in assigning ratings are the following: (1) evaluation of the management of the issuer; (2) economic evaluation of the issuer's industry or industries and the appraisal of speculative-type risks which may be inherent in certain areas; (3) evaluation of the issuer's products in relation to competition and customer acceptance; (4) liquidity; (5) amount and quality of long-term debt; (6) trend of earnings over a period of ten years; (7) financial strength of a parent company and the relationships that exist with the issuer; and (8) recognition by the management of obligations which may be present or may arise as a result of public interest questions and preparations to meet such obligations.
Corporates: Corporates are Fixed Income Securities issued by private corporations. Holders, as creditors, have a prior legal claim over holders of Equity Securities of the issuer as to both income and assets for the principal and interest due the holder.
Floaters: Floaters are Fixed Income Securities with a rate of interest that varies with changes in specified market rates or indices, such as the prime rate, or at specified intervals. Certain Floaters may carry a demand feature that permits the holder to tender them back to the issuer of the underlying instrument, or to a third party, at par value prior to maturity. When the demand feature of certain Floaters represents an obligation of a foreign entity, the demand feature will be subject to certain risks discussed under "Foreign Investment."
High Yield Securities: High Yield Securities are generally considered to include Fixed Income Securities rated below the four highest rating categories at the time of purchase (e.g., Ba through C by Moody's or BB through D by S&P or Fitch) and unrated Fixed Income Securities considered to be of equivalent quality. High Yield Securities are not considered investment grade and are commonly referred to as "junk bonds" or high yield, high risk securities. Investment grade securities that a Portfolio holds may be downgraded to below investment grade by the rating agencies. If a Portfolio holds a security that is downgraded, the Portfolio may choose to retain the security.
While High Yield Securities offer higher yields, they also normally carry a high degree of credit risk and are considered speculative by the major credit rating agencies. High Yield Securities may be issued as a consequence of corporate restructuring or similar events. High Yield Securities are often issued by smaller, less creditworthy issuers, or by highly leveraged (indebted) issuers that are generally less able than more established or less leveraged issuers to make scheduled payments of interest and principal. In comparison to Investment Grade Securities, the price movement of these securities is influenced less by changes in interest rates and more by the financial and business position of the issuer. The values of High Yield Securities are more volatile and may react with greater sensitivity to market changes.
19
Inverse Floaters: Inverse floating rate obligations ("Inverse Floaters") are obligations which pay interest at rates that vary inversely with changes in market rates of interest. Because the interest rate paid to holders of such obligations is generally determined by subtracting a variable or floating rate from a predetermined amount, the interest rate paid to holders of such obligations will decrease as such variable or floating rate increases and increase as such variable or floating rate decreases.
Like most other Fixed Income Securities, the value of Inverse Floaters will decrease as interest rates increase. They are more volatile, however, than most other Fixed Income Securities because the coupon rate on an Inverse Floater typically changes at a multiple of the change in the relevant index rate. Thus, any rise in the index rate (as a consequence of an increase in interest rates) causes a correspondingly greater drop in the coupon rate of an Inverse Floater while a drop in the index rate causes a correspondingly greater increase in the coupon of an Inverse Floater. Some Inverse Floaters may also increase or decrease substantially because of changes in the rate of prepayments.
Investment Grade Securities: Investment Grade Securities are Fixed Income Securities rated by one or more of the rating agencies in one of the four highest rating categories at the time of purchase (e.g., AAA, AA, A or BBB by S&P or Fitch, or Aaa, Aa, A or Baa by Moody's) or determined to be of equivalent quality by the Adviser. Securities rated BBB or Baa represent the lowest of four levels of Investment Grade Securities and are regarded as borderline between definitely sound obligations and those in which the speculative element begins to predominate. Ratings assigned to Fixed Income Securities represent only the opinion of the rating agency assigning the rating and are not dispositive of the credit risk associated with the purchase of a particular Fixed Income Security. Moreover, market risk also will affect the prices of even the highest rated Fixed Income Securities so that their prices may rise or fall even if the issuer's capacity to repay its obligations remains unchanged.
Lease Obligations. Included within the revenue bonds category, as noted above, are participations in lease obligations or installment purchase contracts (hereinafter collectively called "lease obligations") of municipalities, State and local governments, agencies or authorities issued in order to acquire equipment and facilities. Lease obligations may have risks not normally associated with general obligations or other revenue bonds. Leases, and installment purchase or conditional sale contracts (which may provide for title to the leased asset to pass eventually to the issuer), have developed as a means for governmental issuers to acquire property and equipment without the necessity of complying with the constitutional and statutory requirements generally applicable for the issuance of debt. Certain lease obligations contain "non-appropriation" clauses that provide that the governmental issuer has no obligation to make future payments under the lease or contract unless money is appropriated for such purpose by the appropriate legislative body on an annual or other periodic basis. Consequently, continued lease payments on those lease obligations containing "non-appropriation" clauses are dependent on future legislative actions. If such legislative actions do not occur, the holders of the lease obligation may experience difficulty in exercising their rights, including disposition of the property.
In addition, lease obligations represent a relatively new type of financing that has not yet developed the depth of marketability associated with more conventional municipal obligations, and, as a result, certain of such lease obligations may be considered illiquid securities. To determine whether or not a Portfolio will consider such securities to be illiquid (and subject to each Portfolio's limitation on investing in illiquid securities), the Board has established guidelines to be utilized by the Portfolios in determining the liquidity of a lease obligation. The factors to be considered in making the determination include 1) the frequency of trades and quoted prices for the obligation; 2) the number of dealers willing to purchase or sell the security and the number of other potential purchasers; 3) the willingness of dealers to undertake to make a market in the security; and 4) the nature of the marketplace trades, including the time needed to dispose of the security, the method of soliciting offers, and the mechanics of the transfer.
20
Loan Participations and Assignments: Loan Participations are interests in loans or other direct debt instruments ("Loans") relating to amounts owed by a corporate, governmental or other borrower to another party. Loans may represent amounts owed to lenders or lending syndicates, to suppliers of goods or services (trade claims or other receivables), or to other parties ("Lenders") and may be fixed rate or floating rate. Loans also may be arranged through private negotiations between an issuer of sovereign debt obligations and Lenders.
A Portfolio's investments in Loans may be in the form of a participation in Loans ("Participations") and assignments of all or a portion of Loans ("Assignments") from third parties. In the case of a Participation, a Portfolio will have the right to receive payments of principal, interest and any fees to which it is entitled only from the Lender selling the Participation and only upon receipt by the Lender of the payments from the borrower. In the event of an insolvency of the Lender selling a Participation, a Portfolio may be treated as a general creditor of the Lender and may not benefit from any set-off between the Lender and the borrower. Certain Participations may be structured in a manner designed to avoid purchasers of Participations being subject to the credit risk of the Lender with respect to the Participation. Even under such a structure, in the event of a Lender's insolvency, the Lender's servicing of the Participation may be delayed and the assignability of the Participation may be impaired. A Portfolio will acquire Participations only if the Lender interpositioned between a Portfolio and the borrower is determined by the Adviser to be creditworthy.
When a Portfolio purchases Assignments from Lenders it will acquire direct rights against the borrower on the Loan. However, because Assignments are arranged through private negotiations between potential assignees and potential assignors, the rights and obligations acquired by a Portfolio as the purchaser of an Assignment may differ from, and be more limited than, those held by the assigning Lender. Because there is no liquid market for such securities, it is likely that such securities could be sold only to a limited number of institutional investors. The lack of a liquid secondary market may have an adverse impact on the value of such securities and a Portfolio's ability to dispose of particular Assignments or Participations when necessary to meet a Portfolio's liquidity needs or in response to a specific economic event, such as a deterioration in the creditworthiness of the borrower. The lack of a liquid secondary market for Assignments and Participations also may make it more difficult for a Portfolio to assign a value to these securities for purposes of valuing a Portfolio's securities and calculating its NAV.
Loan Participations and Assignments involve a risk of loss in case of default or insolvency of the borrower. In addition, they may offer less legal protection to a Portfolio in the event of fraud or misrepresentation and may involve a risk of insolvency of the Lender. Certain Loan Participations and Assignments may also include standby financing commitments that obligate the investing Portfolio to supply additional cash to the borrower on demand. Participations involving emerging market issuers may relate to Loans as to which there has been or currently exists an event of default or other failure to make payment when due and may represent amounts owed to Lenders that are themselves subject to political and economic risks, including the risk of currency devaluation, expropriation, or failure. Such Loan Participations and Assignments present additional risk of default or loss.
Money Market Instruments: Money Market Instruments are high quality short-term Fixed Income Securities. Money Market Instruments may include obligations of governments, government agencies, banks, corporations and special purpose entities and Repurchase Agreements relating to these obligations. Certain Money Market Instruments may be denominated in a foreign currency.
Mortgage Related Securities: Mortgage related securities are securities that, directly or indirectly, represent a participation in, or are secured by and payable from, mortgage loans on real property. Mortgage related securities include collateralized mortgage obligations and mortgage-backed securities issued or guaranteed by agencies or instrumentalities of the U.S. Government or by private sector entities.
21
Mortgage Backed Securities ("MBS"). Certain Portfolios may invest in mortgage pass-through securities. These securities represent a participation interest in a pool of residential mortgage loans originated by U.S. governmental or private lenders such as banks. They differ from conventional debt securities, which provide for periodic payment of interest in fixed amounts and principal payments at maturity or on specified call dates. Mortgage pass-through securities provide for monthly payments that are a "pass-through" of the monthly interest and principal payments made by the individual borrowers on the pooled mortgage loans. Mortgage pass-through securities may be collateralized by mortgages with fixed rates of interest or adjustable rates. A Portfolio may invest in mortgage pass-through securities that are issued or guaranteed by the U.S. Government. These securities are either direct obligations of the U.S. Government or the issuing agency or instrumentality has the right to borrow from the U.S. Treasury to meet its obligations although the U.S. Treasury is not legally required to extend credit to the agency or instrumentality. Certain of the U.S. government securities purchased by a Portfolio, such as those issued by the Federal National Mortgage Association ("Fannie Mae") and Federal Home Loan Mortgage Corporation ("Freddie Mac"), are not backed by the full faith and credit of the United States and there is a risk that the U.S. Government will not provide financial support to these agencies if it is not obligated to do so by law. In September 2008, the U.S. Treasury Department announced that the U.S. Government would be taking over Freddie Mac and Fannie Mae and placing the companies into a conservatorship. In addition, the U.S. Treasury announced additional steps that it intended to take with respect to the debt and mortgage-backed securities issued by Fannie Mae and Freddie Mac in order to support the conservatorship. No assurance can be given that these initiatives will be successful. The maximum potential liability of the issuers of some U.S. government securities held by a Portfolio may greatly exceed their current resources, including their legal right to support from the U.S. Treasury. It is possible that these issuers will not have the funds to meet their payment obligations in the future.
To the extent a Portfolio invests in mortgage pass through securities offered by non-governmental issuers, such as commercial banks, savings and loan institutions, private mortgage insurance companies, mortgage bankers and other secondary market issuers, a Portfolio may be subject to additional risks. Timely payment of interest and principal of non-governmental issuers are supported by various forms of private insurance or guarantees, including individual loan, title, pool and hazard insurance purchased by the issuer. There can be no assurance that the private insurers can meet their obligations under the policies. An unexpectedly high rate of defaults on the mortgages held by a mortgage pool may adversely affect the value of a mortgage backed security and could result in losses to a Portfolio. The risk of such defaults is generally higher in the case of mortgage pools that include subprime mortgages. Subprime mortgages refer to loans made to borrowers with weakened credit histories or with a lower capacity to make timely payments on their mortgages.
There are two methods of trading MBS. A specified pool transaction is a trade in which the pool number of the security to be delivered on the settlement date is known at the time the trade is made. This is in contrast with the typical MBS transaction, called a TBA ("To Be Announced") transaction, in which the type of MBS to be delivered is specified at the time of trade but the actual pool numbers of the securities that will be delivered are not known at the time of the trade. The pool numbers of the pools to be delivered at settlement are announced shortly before settlement takes place. The terms of the TBA trade may be made more specific if desired. Generally, agency pass-through MBS are traded on a TBA basis.
Collateralized Mortgage Obligations: Certain Portfolios may invest in collateralized mortgage obligations ("CMOs"), which are mortgage-backed securities that are collateralized by mortgage loans or mortgage pass-through securities, and multi-class pass-through securities, which are equity interests in a trust composed of mortgage loans or other mortgage backed securities. Unless the context indicates otherwise, the discussion of CMOs below also applies to multi-class pass through securities.
CMOs may be issued by governmental or government-related entities or by private entities, such as banks, savings and loan institutions, private mortgage insurance companies, mortgage bankers and other secondary market traders. CMOs are issued in multiple classes, often referred to as "tranches," with each tranche having
22
a specific fixed or floating coupon rate and stated maturity or final distribution date. Under the traditional CMO structure, the cash flows generated by the mortgages or mortgage pass-through securities in the collateral pool are used to first pay interest and then pay principal to the holders of the CMOs. Subject to the various provisions of individual CMO issues, the cash flow generated by the underlying collateral (to the extent it exceeds the amount required to pay the stated interest) is used to retire the bonds.
The principal and interest on the underlying collateral may be allocated among the several tranches of a CMO in innumerable ways. In a common CMO structure, the tranches are retired sequentially in the order of their respective stated maturities or final distribution dates (as opposed to the pro-rata return of principal found in traditional pass-through obligations). The fastest-pay tranches would initially receive all principal payments. When those tranches are retired, the next tranches in the sequence receive all of the principal payments until they are retired. The sequential retirement of bond groups continues until the last tranche is retired. Accordingly, the CMO structure allows the issuer to use cash flows of long maturity, monthly-pay collateral to formulate securities with short, intermediate, and long final maturities and expected average lives and risk characteristics.
The primary risk of CMOs is the uncertainty of the timing of cash flows that results from the rate of prepayments on the underlying mortgages serving as collateral and from the structure of the particular CMO transaction (that is, the priority of the individual tranches). An increase or decrease in prepayment rates (resulting from a decrease or increase in mortgage interest rates) may cause the CMOs to be retired substantially earlier than their stated maturities or final distribution dates and will affect the yield and price of CMOs. In addition, the collateral securing CMOs or any third-party guarantees are insufficient to make payments, a Portfolio could sustain a loss. The prices of certain CMOs, depending on their structure and the rate of prepayments, can be volatile. Some CMOs may also not be as liquid as other types of mortgage securities. As a result, it may be difficult or impossible to sell the securities at an advantageous time or price.
New types of CMO tranches have evolved. These include floating rate CMOs, planned amortization classes, accrual bonds and CMO residuals. These newer structures affect the amount and timing of principal and interest received by each tranche from the underlying collateral. Under certain of these newer structures, given classes of CMOs have priority over others with respect to the receipt of prepayments on the mortgages. Therefore, depending on the type of CMOs in which a Portfolio invests, the investment may be subject to a greater or lesser risk of prepayment than other types of mortgage-backed securities.
CMOs may include real estate investment conduits ("REMICs"). REMICs, which were authorized under the Tax Reform Act of 1986, are private entities formed for the purpose of holding a fixed pool of mortgages secured by an interest in real property. A REMIC is a CMO that qualifies for special tax treatment under the Internal Revenue Code and invests in certain mortgages principally secured by interests in real property.
A Portfolio may invest in, among others, parallel pay CMOs and Planned Amortization Class CMOs ("PAC Bonds"). Parallel pay CMOs are structured to provide payments of principal on each payment date to more than one tranche. These simultaneous payments are taken into account in calculating the stated maturity date or final distribution date of each tranche which, as with other CMO structures, must be retired by its stated maturity date or final distribution date but may be retired earlier. PAC Bonds are a form of parallel pay CMO, with the required principal payment on such securities having the highest priority after interest has been paid to all classes. PAC Bonds generally require payments of a specified amount of principal on each payment date.
Stripped Mortgage-Backed Securities: Certain Portfolios may invest in stripped mortgage-backed securities ("SMBS"). An SMBS is a derivative multi-class mortgage security. SMBS usually are structured with two classes that receive different proportions of the interest and principal distribution on a pool of mortgage assets. In the most extreme case, one class will receive all of the interest (the interest-only or "IO" class), while the other class will receive all of the principal (the principal-only or "PO" class). The yield to maturity on an IO class is extremely sensitive to the rate of principal payments (including prepayments) on the related underlying
23
mortgage assets, and a rapid rate of principal payments may have a material adverse effect on such security's yield to maturity. If the underlying mortgage assets experience greater than anticipated prepayments of principal, a Portfolio may fail to fully recoup its initial investment in these securities. Conversely, if the underlying mortgage assets experience less than anticipated prepayments of principal, the yield of POs could be materially adversely affected. The market values of IOs and POs are subject to greater risk of fluctuation in response to changes in market rates of interest than many other types of government securities. To the extent a Portfolio invests in IOs and POs, this increases the risk of fluctuations in the NAV of a Portfolio.
Commercial Mortgage-Backed Securities ("CMBS"): Certain Portfolios may invest in CMBS. CMBS are generally multi-class or pass-through securities issued by special purpose entities that represent an undivided interest in a portfolio of mortgage loans backed by commercial properties, including, but not limited to, industrial and warehouse properties, office buildings, retail space and shopping malls, hotels, healthcare facilities, multifamily properties and cooperative apartments. Private lenders, such as banks or insurance companies, originate these loans and then sell the loans directly into a CMBS trust or other entity. The commercial mortgage loans that underlie CMBS are generally not amortizing or not fully amortizing. That is, at their maturity date, repayment of the remaining principal balance or "balloon" is due and is repaid through the attainment of an additional loan or sale of this property. An extension of the final payment on commercial mortgages will increase the average life of the CMBS, generally resulting in a lower yield for discount bonds and a higher yield for premium bonds.
CMBS are subject to credit risk and prepayment risk. Although prepayment risk is present, it is of a lesser degree in the CMBS than in the residential mortgage market; commercial real estate property loans often contain provisions which substantially reduce the likelihood that such securities will be prepaid (e.g., significant prepayment penalties on loans and, in some cases, prohibition on principal payments for several years following origination).
Municipals: Municipal securities are Fixed Income Securities issued by local, state and regional governments that provide interest income which is exempt from federal income taxes. Municipals include both municipal bonds (those securities with maturities of five years or more) and municipal notes (those with maturities of less than five years). Municipal bonds are issued for a wide variety of reasons: to construct public facilities, such as airports, highways, bridges, schools, hospitals, mass transportation, streets, water and sewer works; to obtain funds for operating expenses; to refund outstanding municipal obligations; and to loan funds to various public institutions and facilities. Certain industrial development bonds are also considered municipal bonds if their interest is exempt from federal income tax. Industrial development bonds are issued by, or on behalf of, public authorities to obtain funds for various privately-operated manufacturing facilities, housing, sports arenas, convention centers, airports, mass transportation systems and water, gas or sewage works. Industrial development bonds are ordinarily dependent on the credit quality of a private user, not the public issuer.
The two principal classifications of municipal bonds are "general obligation" and "revenue" or "special tax" bonds. General obligation bonds are secured by the issuer's pledge of its full faith, credit and taxing power for the payment of principal and interest. Revenue or special tax bonds are payable only from the revenues derived from a particular facility or class of facilities or, in some cases, from the proceeds of a special excise or other tax, but not from general tax revenues.
Industrial revenue bonds in most cases are revenue bonds and generally do not have the pledge of the credit of the issuer. The payment of the principal and interest on such industrial revenue bonds is dependent solely on the ability of the user of the facilities financed by the bonds to meet its financial obligations and the pledge, if any, of real and personal property so financed as security for such payment. Short-term municipal obligations issued by states, cities, municipalities or municipal agencies, include tax anticipation notes, revenue anticipation notes, bond anticipation notes, construction loan notes and short-term discount notes.
24
Municipal notes are issued to meet the short-term funding requirements of local, regional and state governments. Municipal notes include bond anticipation notes, revenue anticipation notes and tax and revenue anticipation notes. These are short-term debt obligations issued by state and local governments to aid cash flows while waiting for taxes or revenue to be collected, at which time the debt is retired. Other types of municipal notes in which the Portfolio may invest are construction loan notes, short-term discount notes, tax-exempt commercial paper, demand notes and similar instruments.
Municipal bonds generally include debt obligations issued by states and their political subdivisions and duly constituted authorities and corporations, to obtain funds to construct, repair or improve various public facilities such as airports, bridges, highways, hospitals, housing, schools, streets and water and sewer works. Municipal bonds may also be issued to refinance outstanding obligations as well as to obtain funds for general operating expenses and for loans to other public institutions and facilities.
Note obligations with demand or put options may have a stated maturity in excess of one year, but permit any holder to demand payment of principal plus accrued interest upon a specified number of days' notice. Frequently, such obligations are secured by letters of credit or other credit support arrangements provided by banks. The issuer of such notes normally has a corresponding right, after a given period, to repay at its discretion the outstanding principal of the note plus accrued interest upon a specific number of days' notice to the bondholders. The interest rate on a demand note may be based upon a known lending rate, such as the prime lending rate and be adjusted when such rate changes, or the interest rate on a demand note may be a market rate that is adjusted at specified intervals. Each note purchased by the Portfolios will meet the quality criteria set out in the prospectus for the Portfolios.
The yields of municipal bonds depend on, among other things, general money market conditions, conditions in the municipal bond market, the size of a particular offering, the maturity of the obligation and the rating of the issue. The ratings of Moody's and S&P represent their opinions of the quality of the municipal bonds rated by them. It should be emphasized that such ratings are general and are not absolute standards of quality. Consequently, municipal bonds with the same maturity, coupon and rating may have different yields, while municipal bonds of the same maturity and coupon, but with different ratings may have the same yield. It will be the responsibility of the investment management staff to appraise independently the fundamental quality of the bonds held by the Portfolios.
Municipal bonds are sometimes purchased on a "when-issued" basis, meaning the Portfolio has committed to purchase certain specified securities at an agreed upon price when they are issued. The period between commitment date and issuance date can be a month or more. It is possible that the securities will never be issued and the commitment canceled.
From time to time proposals have been introduced before Congress to restrict or eliminate the federal income tax exemption for interest on municipal bonds. Similar proposals may be introduced in the future. If any such proposal were enacted, it might restrict or eliminate the ability of the Portfolios to achieve their investment objectives. In that event, the Fund's Directors and officers would reevaluate investment objectives and policies and consider recommending to shareholders changes in such objectives and policies.
Similarly, from time to time proposals have been introduced before state and local legislatures to restrict or eliminate the state and local income tax exemption for interest on municipal bonds. Similar proposals may be introduced in the future. If any such proposal were enacted, it might restrict or eliminate the ability of a Portfolio to achieve its investment objective. In that event, the Fund's Directors and officers would reevaluate investment objectives and policies and consider recommending to shareholders changes in such objectives and policies.
25
The Portfolios eligible to purchase municipal bonds may also purchase bonds the income on which is subject to the alternative minimum tax ("AMT bonds"). AMT bonds are tax-exempt private activity bonds issued after August 7, 1986, the proceeds of which are directed, at least in part, to private, for-profit organizations. While the income from AMT bonds is exempt from regular federal income tax, it is a tax preference item in the calculation of the alternative minimum tax. The alternative minimum tax is a special separate tax that applies to some taxpayers who have certain adjustments to income or tax preference items.
Build America Bonds are taxable municipal securities on which the issuer receives federal support of the interest paid. Assuming certain specified conditions are satisfied, issuers of Build America Bonds may either (i) receive reimbursement from the U.S. Treasury with respect to a portion of its interest payments on the bonds ("direct pay" Build America Bonds) or (ii) provide tax credits to investors in the bonds ("tax credit" Build America Bonds). Unlike most other municipal securities, interest received on Build America Bonds is subject to federal and state income tax. Issuance of Build America Bonds ceased on December 31, 2010. The number of Build America Bonds available in the market will be limited, which may negatively affect the value of the Build America Bonds.
Repurchase Agreements: Repurchase Agreements are transactions in which a Portfolio purchases a security or basket of securities and simultaneously commits to resell that security or basket to the seller (a bank, broker or dealer) at a mutually agreed upon date and price. The resale price reflects the purchase price plus an agreed upon market rate of interest which is unrelated to the coupon rate or date of maturity of the purchased security. The term of these agreements is usually from overnight to one week and never exceeds one year. Repurchase Agreements with a term of over seven days are considered illiquid.
In these transactions, the Portfolio receives securities that have a market value at least equal to the purchase price (including accrued interest) of the Repurchase Agreement and this value is maintained during the term of the agreement. These securities are held by the Portfolio's Custodian or an approved third party for the benefit of the Portfolio until repurchased. Repurchase Agreements permit a Portfolio to remain fully invested while retaining overnight flexibility to pursue investments of a longer-term nature. If the seller defaults and the value of the repurchased securities declines, the Portfolio might incur a loss. If bankruptcy proceedings are commenced with respect to the seller, the Portfolio's realization upon the collateral may be delayed.
Pursuant to an order issued by the SEC, the Portfolios managed by the Adviser may pool their daily uninvested cash balances in order to invest in Repurchase Agreements on a joint basis with other investment companies advised by that Adviser. By entering into Repurchase Agreements on a joint basis, the Portfolios expect to incur lower transaction costs and potentially obtain higher rates of interest on such Repurchase Agreements. Each Portfolio's participation in the income from jointly purchased Repurchase Agreements will be based on that Portfolio's percentage share in the total Repurchase Agreement.
Temporary Investments: When the Adviser believes that changes in economic, financial or political conditions make it advisable, each Portfolio may invest up to 100% of its assets in cash and certain short- and medium-term Fixed Income Securities for temporary defensive purposes that may be inconsistent with the Portfolio's investment strategies. These Temporary Investments may consist of obligations of the U.S. or foreign governments, their agencies or instrumentalities; Money Market Instruments; and instruments issued by international development agencies.
U.S. Treasury Securities: The U.S. Treasury securities that certain Portfolios may purchase include U.S. Treasury bills, notes and bonds issued by the U.S. Treasury. These instruments are direct obligations of the U.S. Government and, as a result, are backed by the full faith and credit of the United States. They differ primarily in their interest rates, the lengths of their maturities and the dates of their issuances.
26
Yankee Dollar Obligations: Yankee dollar obligations are Fixed Income Securities. Yankee bank obligations, which include time deposits and certificates of deposit, are U.S. dollar-denominated obligations issued in the U.S. capital markets by foreign banks. The Portfolios may consider Yankee dollar obligations to be domestic securities for purposes of their investment policies.
Yankee dollar obligations are subject to the same risks that pertain to domestic issues, notably credit risk, market risk and liquidity risk. However, to a limited extent, Yankee dollar obligations also are subject to certain sovereign risks. One such risk is the possibility that a sovereign country might prevent capital from flowing across its borders. Other risks include: adverse political and economic developments; the extent and quality of government regulation of financial markets and institutions; the imposition of foreign withholding taxes and the expropriation or nationalization of foreign issuers.
Zero Coupons: Zero Coupons are fixed income securities that do not make regular interest payments. Instead, Zero Coupons are sold at a discount from their face value. The difference between a Zero Coupon's issue or purchase price and its face value represents the imputed interest an investor will earn if the obligation is held until maturity. For tax purposes, a portion of this imputed interest is deemed as income received by zero coupon bondholders each year. Each Portfolio intends to pass along such interest as a component of the Portfolio's distributions of net investment income.
Zero Coupons may offer investors the opportunity to earn a higher yield than that available on ordinary interest- paying obligations of similar credit quality and maturity. However, zero coupon prices may also exhibit greater price volatility than ordinary fixed income securities because of the manner in which their principal and interest are returned to the investor.
FOREIGN INVESTMENT
Investing in foreign securities involves certain special considerations which are not typically associated with investments in the securities of U.S. issuers. Foreign issuers are not generally subject to uniform accounting, auditing and financial reporting standards and may have policies that are not comparable to those of domestic issuers. As a result, there may be less information available about foreign issuers than about domestic issuers. Securities of some foreign issuers may be less liquid and more volatile than securities of comparable domestic issuers. There is generally less government supervision and regulation of stock exchanges, brokers and listed issuers than in the United States. In addition, with respect to certain foreign countries, there is a possibility of expropriation or confiscatory taxation, political and social instability, or diplomatic development which could affect U.S. investments in those countries. The costs of investing in foreign countries frequently are higher than the costs of investing in the United States. Although the Adviser endeavors to achieve the most favorable execution costs in portfolio transactions, fixed commissions on many foreign stock exchanges are generally higher than negotiated commissions on U.S. exchanges.
Investments in securities of foreign issuers may be denominated in foreign currencies. Accordingly, the value of a Portfolio's assets, as measured in U.S. dollars, may be affected favorably or unfavorably by changes in currency exchange rates and in exchange control regulations. A Portfolio may incur costs in connection with conversions between various currencies.
Certain foreign governments levy withholding or other taxes on dividend and interest income. Although in some countries a portion of these taxes are recoverable, the non-recovered portion of foreign withholding taxes will reduce the income received from investments in such countries. The Portfolios may be able to claim a credit for U.S. tax purposes with respect to any such foreign taxes.
The Adviser may consider an issuer to be from a particular country (including the United States) or geographic region if (i) its principal securities trading market is in that country or geographic region; (ii) alone or on a consolidated basis it derives 50% or more of its annual revenue from goods produced, sales made or
27
services performed in that country or geographic region; or (iii) it is organized under the laws of, or has a principal office in, that country or geographic region. By applying these tests, it is possible that a particular issuer could be deemed to be from more than one country or geographic region.
Brady Bonds: Brady Bonds are both emerging market securities and foreign fixed income securities. They are created through the exchange of existing commercial bank loans to foreign entities for new obligations in connection with debt restructuring under a plan introduced by Nicholas F. Brady when he was the U.S. Secretary of the Treasury. They may be collateralized or uncollateralized and issued in various currencies (although most are U.S. dollar-denominated) and they are actively traded in the over-the-counter ("OTC") secondary market. A Portfolio will invest in Brady Bonds only if they are consistent with the Portfolio's quality specifications.
Dollar-denominated, collateralized Brady Bonds may be fixed rate par bonds or floating rate discount bonds. Interest payments on Brady Bonds generally are collateralized by cash or securities in an amount that, in the case of fixed rate bonds, is equal to at least one year of rolling interest payments or, in the case of floating rate bonds, initially is equal to at least one year's rolling interest payments based on the applicable interest rate at that time and is adjusted at regular intervals thereafter. Certain Brady Bonds are entitled to "value recovery payments" in certain circumstances, which in effect constitute supplemental interest payments but generally are not collateralized.
Brady Bonds are often viewed as having three or four valuation components: (i) the collateralized repayment of principal at final maturity; (ii) the collateralized interest payments; (iii) the uncollateralized interest payments; and (iv) any uncollateralized repayment of principal at maturity (these uncollateralized amounts constitute the "residual risk"). In the event of a default with respect to collateralized Brady Bonds as a result of which the payment obligations of the issuer are accelerated, the U.S. Treasury zero coupon obligations held as collateral for the payment of principal will not be distributed to investors, nor will such obligations be sold and the proceeds distributed. The collateral will be held by the collateral agent to the scheduled maturity of the defaulted Brady Bonds, which will continue to be outstanding, at which time the face amount of the collateral will equal the principal payments due on the Brady Bonds in the normal course.
Emerging Market Securities: An emerging market security is one issued by a foreign government or private issuer that has one or more of the following characteristics: (i) its principal securities trading market is in an emerging market or developing country, (ii) alone or on a consolidated basis it derives 50% or more of its annual revenue from goods produced, sales made or services performed in emerging markets or (iii) it is organized under the laws of, or has a principal office in, an emerging market or developing country. Based on these criteria it is possible for a security to be considered issued by an issuer in more than one country. Therefore, it is possible for the securities of any issuer that has one or more of these characteristics in connection with any emerging market or developing country not to be considered an emerging market security if it has one or more of these characteristics in connection with a developed country.
Emerging market describes any country which is generally considered to be an emerging or developing country by major organizations in the international financial community, such as the International Bank for Reconstruction and Development (more commonly known as the World Bank) and the International Finance Corporation. Emerging markets can include every nation in the world except the United States, Canada, Japan, Australia, New Zealand and most nations located in Western Europe.
The economies of individual emerging market or developing countries may differ favorably or unfavorably from the U.S. economy in such respects as growth of gross domestic product, rate of inflation, currency depreciation, capital reinvestment, resource self-sufficiency and balance of payments position. Further, the economies of developing countries generally are heavily dependent upon international trade and, accordingly, have been, and may continue to be, adversely affected by trade barriers, exchange controls, managed adjustments
28
in relative currency values and other protectionist measures. These economies also have been, and may continue to be, adversely effected by economic conditions in the countries with which they trade.
Prior governmental approval for foreign investments may be required under certain circumstances in some emerging market or developing countries, and the extent of foreign investment in certain fixed income securities and domestic companies may be subject to limitation in other emerging market or developing countries. Foreign ownership limitations also may be imposed by the charters of individual companies in emerging market or developing countries to prevent, among other concerns, violation of foreign investment limitations. Repatriation of investment income, capital and the proceeds of sales by foreign investors may require governmental registration and/or approval in some emerging countries. A Portfolio could be adversely affected by delays in, or a refusal to grant, any required governmental registration or approval for such repatriation. Any investment subject to such repatriation controls will be considered illiquid if it appears reasonably likely that this process will take more than seven days.
Investment in emerging market or developing countries may entail purchasing securities issued by or on behalf of entities that are insolvent, bankrupt, in default or otherwise engaged in an attempt to reorganize or reschedule their obligations and in entities that have little or no proven credit rating or credit history. In any such case, the issuer's poor or deteriorating financial condition may increase the likelihood that the investing Portfolio will experience losses or diminution in available gains due to bankruptcy, insolvency or fraud. Emerging market or developing countries also pose the risk of nationalization, expropriation or confiscatory taxation, political changes, government regulation, social instability or diplomatic development (including war) that could affect adversely the economies of such countries or the value of a Portfolio's investments in those countries. In addition, it may be difficult to obtain and enforce a judgment in a court outside the United States.
Portfolios that invest in emerging market or developing countries may also be exposed to an extra degree of custodial and/or market risk, especially where the securities purchased are not traded on an official exchange or where ownership records regarding the securities are maintained by an unregulated entity (or even the issuer itself).
Eurodollar Obligations: Eurodollar obligations may include bonds issued and denominated in euros. Eurodollar obligations may be issued by government and corporate issuers in Europe. Eurodollar bank obligations, which include time deposits and certificates of deposit, are U.S. dollar-denominated obligations issued outside the U.S. capital markets by foreign branches of U.S. banks and by foreign banks.
Eurodollar obligations are subject to the same risks that pertain to domestic issues, notably credit risk, market risk and liquidity risk. However, Eurodollar obligations also are subject to certain sovereign risks. One such risk is the possibility that a sovereign country might prevent capital from flowing across its borders. Other risks include: adverse political and economic developments; the extent and quality of government regulation of financial markets and institutions; the imposition of foreign withholding taxes and the expropriation or nationalization of foreign issuers.
Foreign Fixed Income Securities: Foreign fixed income securities are Fixed Income Securities that may be denominated in foreign currency and traded primarily outside of the United States, which include: (1) obligations issued or guaranteed by foreign national governments, their agencies, instrumentalities, or political subdivisions ("sovereign debt"); (2) debt securities issued, guaranteed or sponsored by supranational organizations established or supported by several national governments, including the World Bank, the European Community, the Asian Development Bank and others; (3) non-government foreign corporate debt securities; and (4) foreign mortgage securities and various other mortgages and asset-backed securities.
Certain emerging market countries are among the largest debtors to commercial banks and foreign governments. The issuer or governmental authority that controls the repayment of sovereign debt may not be
29
willing or able to repay the principal and/or pay interest when due in accordance with the terms of such obligations.
A governmental entity's willingness or ability to repay principal and pay interest due in a timely manner may be affected by, among other factors, its cash flow situations, the extent of its foreign reserves, the availability of sufficient foreign exchange on the date a payment is due, the relative size of the debt service burden to the economy as a whole, the government's dependence on expected disbursements from third parties, the government's policy toward the International Monetary Fund and the political constraints to which a government may be subject. Governmental entities may also be dependent on expected disbursements from foreign governments, multilateral agencies and others abroad to reduce principal and interest arrearages on their debt. The commitment on the part of these governments, agencies and others to make such disbursements may be conditioned on a debtor's implementation of economic reforms or economic performance and the timely service of such debtor's obligations. Failure to implement such reforms, achieve such levels of economic performance or repay principal or interest when due may result in the cancellation of such third parties' commitments to lend funds to the government debtor, which may further impair such debtor's ability or willingness to timely service its debts. Holders of sovereign debt may be requested to participate in the rescheduling of such debt and to extend further loans to governmental entities. In addition, no assurance can be given that the holders of commercial bank debt will not contest payments to the holders of other foreign government debt obligations in the event of default under their commercial bank loan agreements. The issuers of the government debt securities in which a Portfolio may invest have in the past experienced substantial difficulties in servicing their external debt obligations, which led to defaults on certain obligations and the restructuring of certain indebtedness. Restructuring arrangements have included, among other things, reducing and rescheduling interest and principal payments by negotiating new or amended credit agreements or converting outstanding principal and unpaid interest to Brady Bonds, and obtaining new credit to finance interest payments. There can be no assurance that the Brady Bonds and other foreign governmental debt securities in which the Portfolio may invest will not be subject to similar restructuring arrangements or to requests for new credit, which may adversely affect the Portfolio's holdings. (See "Brady Bonds" above.) Furthermore, certain participants in the secondary market for such debt may be directly involved in negotiating the terms of these arrangements and may therefore have access to information not available to other market participants.
Foreign Currency Transactions: The U.S. dollar value of the assets of the Portfolios, to the extent they invest in securities denominated in foreign currencies, may be affected favorably or unfavorably by changes in foreign currency exchange rates and exchange control regulations, and the Portfolios may incur costs in connection with conversions between various currencies. The Portfolios may conduct their foreign currency exchange transactions on a spot (i.e., cash) basis at the spot rate prevailing in the foreign currency exchange market. The Portfolios also may manage their foreign currency transactions by entering into foreign currency forward contracts to purchase or sell foreign currencies or by using other instruments and techniques described under "Derivatives," below.
Foreign Equity Securities: Foreign Equity Securities are Equity Securities of an issuer in a country other than the United States.
Investment Funds: Some emerging market countries have laws and regulations that currently preclude direct investment or make it undesirable to invest directly in the securities of their companies. However, indirect investment in the securities of companies listed and traded on the stock exchanges in these countries is permitted by certain emerging market countries through Investment Funds that have been specifically authorized. A Portfolio may invest in these Investment Funds subject to the provisions of the 1940 Act, as applicable, and other applicable laws.
30
OTHER SECURITIES AND INVESTMENT TECHNIQUES
Borrowing for Investment Purposes: Borrowing for investment purposes creates leverage which is a speculative characteristic. Portfolios authorized to borrow will do so only when the Adviser believes that borrowing will benefit the Portfolio after taking into account considerations such as the costs of borrowing and the likely investment returns on securities purchased with borrowed funds. Borrowing by a Portfolio will create the opportunity for increased net income but, at the same time, will involve special risk considerations. Leverage that results from borrowing will magnify declines as well as increases in a Portfolio's NAV per share and net yield. Each Portfolio that engages in borrowing expects that all of its borrowing will be made on a secured basis. The Portfolio will either segregate the assets securing the borrowing for the benefit of the lenders or arrangements will be made with a suitable sub-custodian. If assets used to secure the borrowing decrease in value, a Portfolio may be required to pledge additional collateral to the lender in the form of cash or securities to avoid liquidation of those assets.
Loans of Portfolio Securities: Each Portfolio may lend its investment securities to qualified institutional investors that need to borrow securities in order to complete certain transactions, such as covering short sales, avoiding failures to deliver securities or completing arbitrage operations. By lending its investment securities, a Portfolio attempts to increase its net investment income through the receipt of interest of the loan. Any gain or loss in the market price of the securities loaned that might occur during the term of the loan would be for the account of the Portfolio. Each Portfolio may lend its investment securities to qualified brokers, dealers, domestic and foreign banks or other financial institutions, so long as the terms, structure and the aggregate amount of such loans are not inconsistent with the 1940 Act or the Rules and Regulations or interpretations of the SEC thereunder, which currently require that (i) the borrower pledge and maintain with the Portfolio collateral consisting of liquid, unencumbered assets having a value at all times not less than 100% of the value of the securities loaned; (ii) the borrower add to such collateral whenever the price of the securities loaned rises (i.e., the borrower "marks to market" on a daily basis); (iii) the loan be made subject to termination by the Portfolio at any time; and (iv) the Portfolio receive reasonable interest on the loan (which may include the Portfolio investing any cash collateral in interest bearing short-term investments), any distributions on the loaned securities and any increase in their market value. In addition, voting rights may pass with the loaned securities, but the Portfolio will retain the right to call any security in anticipation of a vote that the Adviser deems material to the Security on loan. There may be risks of delay in recovery of the securities or even loss of rights in the collateral should the borrower of the securities fail financially. However, loans will be made only to borrowers deemed by the Adviser to be of good standing and when, in the judgment of the Adviser, the consideration which can be earned currently from such securities loans justifies the attendant risk. All relevant facts and circumstances, including the creditworthiness of the broker, dealer or institution, will be considered in making decisions with respect to the lending of securities, subject to review by the Board of Directors. Each Portfolio loaning securities also bears the risk that the reinvestment of collateral will result in a principal loss. Finally, there is the risk that the price of the securities will increase while they are on loan and the collateral will not be adequate to cover their value.
Non-Publicly Traded Securities, Private Placements and Restricted Securities: The Portfolios may invest in securities that are neither listed on a stock exchange nor traded over-the-counter, including privately placed and restricted securities. Such unlisted securities may involve a higher degree of business and financial risk that can result in substantial losses. As a result of the absence of a public trading market for these securities, they may be less liquid than publicly traded securities. To the extent these securities may be resold in privately negotiated transactions, the prices realized from these sales could be less than those originally paid by the Portfolio or less than what may be considered the fair value of such securities. Furthermore, companies whose securities are not publicly traded may not be subject to the disclosure and other investor protection requirements which might be applicable if their securities were publicly traded. The illiquidity of the market, as well as the lack of publicly available information regarding these securities, may also adversely affect the ability of the Fund's Portfolios to arrive at a fair value for certain securities at certain times and could make it difficult for
31
the Portfolios to sell certain securities. If such securities are required to be registered under the securities laws of one or more jurisdictions before being sold, the Portfolio may be required to bear the expenses of registration.
As a general matter, a Portfolio may not invest more than 15% of its net assets in illiquid securities, such as securities for which there is not a readily available secondary market or securities that are restricted from sale to the public without registration. However, certain Restricted Securities can be offered and sold to qualified institutional buyers under Rule 144A under the 1933 Act ("Rule 144A Securities") and may be deemed to be liquid under guidelines adopted by the Fund's Board of Directors. The Portfolios may invest without limit in liquid Rule 144A Securities. Rule 144A Securities may become illiquid if qualified institutional buyers are not interested in acquiring the securities.
Public Bank Loans: Certain Portfolios may invest in public loans made by banks or other financial institutions, which may be rated investment grade (Baa or higher by Moody's Investors Service, Inc. ("Moody's") BBB or higher by Standard & Poor's Rating Group, a division of The McGraw-Hill Companies, Inc. ("S&P")) or below investment grade (below Baa by Moody's or below BBB by S&P). Public bank loans are privately negotiated loans for which information about the issuer has been made publicly available. However, public bank loans are not registered under the 1933 Act and are not publicly traded. They usually are second lien loans normally lower in priority of payment to senior loans, but have seniority in a company's capital structure to other claims, such as subordinated corporate bonds or publicly-issued equity so that in the event of bankruptcy or liquidation, the company is required to pay down these second lien loans prior to such other lower-ranked claims on their assets. Bank loans normally pay floating rates that reset frequently, and as a result, protect investors from increases in interest rates.
Bank loans generally are negotiated between a borrower and several financial institutional lenders represented by one or more lenders acting as agent of all the lenders. The agent is responsible for negotiating the loan agreement that establishes the terms and conditions of the loan and the rights of the borrower and the lenders, monitoring any collateral, and collecting principal and interest on the loan. By investing in a loan, the Portfolio becomes a member of a syndicate of lenders. Certain bank loans are illiquid, meaning the Portfolio may not be able to sell them quickly at a fair price. Illiquid securities are also difficult to value. To the extent a bank loan has been deemed illiquid, it will be subject to a Portfolio's restrictions on investment in illiquid securities. The secondary market for bank loans may be subject to irregular trading activity, wide bid/ask spreads and extended trade settlement periods.
Bank loans are subject to the risk of default. Default in the payment of interest or principal on a loan will result in a reduction of income to the Portfolio, a reduction in the value of the loan, and a potential decrease in the Portfolio's NAV. The risk of default will increase in the event of an economic downturn or a substantial increase in interest rates. Bank loans are subject to the risk that the cash flow of the borrower and property securing the loan or debt, if any, may be insufficient to meet scheduled payments. As discussed above, however, because bank loans reside higher in the capital structure than high yield bonds, default losses have been historically lower in the bank loan market. Bank loans that are rated below investment grade share the same risks of other High Yield Securities.
Reverse Repurchase Agreements: Under a Reverse Repurchase Agreement, a Portfolio sells a security and promises to repurchase that security at an agreed upon future date and price. The price paid to repurchase the security reflects interest accrued during the term of the agreement. The Portfolio will earmark cash or liquid assets or establish a segregated account holding cash and other liquid assets in an amount not less than the purchase obligations of the agreement. Reverse Repurchase Agreements may be viewed as a speculative form of borrowing called leveraging. A Portfolio may invest in reverse repurchase agreements if (i) interest earned from leveraging exceeds the interest expense of the original reverse repurchase transaction and (ii) proceeds from the transaction are not invested for longer than the term of the Reverse Repurchase Agreement.
32
The use of leverage may cause a Portfolio to liquidate portfolio positions when it may not be advantageous to do so to satisfy its obligations or to meet earmarking requirements. Leverage, including borrowing, may cause a Portfolio to be more volatile than if the Portfolio had not been leveraged. This is because leverage tends to exaggerate the effect of any increase or decrease in the value of the Portfolio's portfolio securities.
Short Sales: A short sale is a transaction in which the Portfolio sells securities it owns or has the right to acquire at no added cost (i.e., "against the box") or does not own (but has borrowed) in anticipation of a decline in the market price of the securities. To deliver the securities to the buyer, the Portfolio arranges through a broker to borrow the securities and, in so doing, the Portfolio becomes obligated to replace the securities borrowed at their market price at the time of replacement. When selling short, the Portfolio intends to replace the securities at a lower price and therefore, profit from the difference between the cost to replace the securities and the proceeds received from the sale of the securities. When the Portfolio makes a short sale, the proceeds it receives from the sale will be held on behalf of a broker until the Portfolio replaces the borrowed securities. The Portfolio may have to pay a premium to borrow the securities and must pay any dividends or interest payable on the securities until they are replaced.
The Portfolio's obligation to replace the securities borrowed in connection with a short sale will be secured by collateral deposited with the broker that consists of cash or other liquid assets. In addition, the Portfolio will earmark cash or liquid assets or place in a segregated account an amount of cash or other liquid assets equal to the difference, if any, between (i) the market value of the securities sold at the time they were sold short and (ii) any cash or other liquid securities deposited as collateral with the broker in connection with the short sale. Short sales by the Portfolio involve certain risks and special considerations. This amount will be adjusted daily to reflect changes in the value of the securities sold short. A Portfolio also can cover its obligations by owning another security (such as a call option) giving it the right to obtain the same kind and amount of the security it sold short. If the Adviser incorrectly predicts that the price of the borrowed security will decline, the Portfolio will have to replace the securities with securities with a greater value than the amount received from the sale. As a result, losses from short sales differ from losses that could be incurred from a purchase of a security, because losses from short sales may be unlimited, whereas losses from purchases can equal only the total amount invested.
Temporary Borrowing: Each Portfolio is permitted to borrow from banks for extraordinary or emergency purposes. For example, the Portfolios may borrow for temporary defensive purposes or to meet shareholder redemptions when the Adviser believes that it would not be in the best interests of a Portfolio to liquidate portfolio holdings. Except in the case of the Emerging Markets Debt Portfolio, a Portfolio will not purchase additional securities while temporary borrowings exceed 5% of its total assets.
The Board of Directors of the Fund has approved procedures whereby the Portfolios together with other investment companies advised by the Adviser or its affiliates may enter into a joint line of credit arrangement with a bank. Each Portfolio would be liable only for its own temporary borrowings under the joint line of credit arrangements.
When-Issued and Delayed Delivery Securities: When-Issued and Delayed Delivery Securities are securities purchased with payment and delivery taking place in the future in order to secure what is considered to be an advantageous yield or price at the time of the transaction. Delivery of and payment for these securities may take as long as a month or more after the date of the purchase commitment, but will take place no more than 120 days after the trade date. The payment obligation and the interest rates that will be received are each fixed at the time a Portfolio enters into the commitment and no interest accrues to the Portfolio until settlement. Thus, it is possible that the market value at the time of settlement could be higher or lower than the purchase price if the general level of interest rates has changed. An increase in the percentage of the Portfolio's assets committed to the purchase of securities on a When-Issued or Delayed Delivery basis may increase the volatility of its NAV. When a Portfolio agrees to purchase When-Issued or Delayed Delivery Securities, it will segregate
33
or earmark cash or liquid securities in an amount equal to the Portfolio's commitment to purchase these securities.
DERIVATIVES
Certain Portfolios may, but are not required to, use various derivatives and related investment strategies as described below. Derivatives may be used for a variety of purposes including hedging, risk management, portfolio management or to earn income. Any or all of the investment techniques described herein may be used at any time and there is no particular strategy that dictates the use of one technique rather than another, as the use of any derivative by a Portfolio is a function of numerous variables, including market conditions. A Portfolio complies with applicable regulatory requirements when using derivatives, including the segregation or earmarking of cash or liquid assets when mandated by the SEC rules or SEC staff positions. Although the Adviser seeks to use derivatives to further a Portfolio's investment objective, no assurance can be given that the use of derivatives will achieve this result.
General Risks of Derivatives. Derivatives utilized by a Portfolio may involve the purchase and sale of derivative instruments. A derivative is a financial instrument the value of which depends upon (or derives from) the value of another asset, security, interest rate or index. Derivatives may relate to a wide variety of underlying instruments, including equity and debt securities, indexes, interest rates, currencies and other assets. Certain derivative instruments which a Portfolio may use and the risks of those instruments are described in further detail below. A Portfolio may in the future also utilize derivatives techniques, instruments and strategies that may be newly developed or permitted as a result of regulatory changes, consistent with a Portfolio's investment objective and policies. Such newly developed techniques, instruments and strategies may involve risks different than or in addition to those described herein. No assurance can be given that any derivatives strategy employed by a Portfolio will be successful.
The risks associated with the use of derivatives are different from, and possibly greater than, the risks associated with investing directly in the instruments underlying such derivatives. Derivatives are highly specialized instruments that require investment techniques and risk analyses different from other portfolio investments. The use of derivative instruments requires an understanding not only of the underlying instrument but also of the derivative itself. Certain risk factors generally applicable to derivative transactions are described below.
• Derivatives are subject to the risk that the market value of the derivative itself or the market value of underlying instruments will change in a way adverse to a Portfolio's interests. A Portfolio bears the risk that the Adviser and/or Sub-Adviser(s) may incorrectly forecast future market trends and other financial or economic factors or the value of the underlying security, index, interest rate or currency when establishing a derivatives position for a Portfolio.
• Derivatives may be subject to pricing risk, which exists when a derivative becomes extraordinarily expensive (or inexpensive) relative to historical prices or corresponding instruments. Under such market conditions, it may not be economically feasible to initiate a transaction or liquidate a position at an advantageous time or price.
• Many derivatives are complex and often valued subjectively. Improper valuations can result in increased payment requirements to counterparties or a loss of value to a Portfolio.
• Using derivatives as a hedge against a portfolio investment subjects a Portfolio to the risk that the derivative will have imperfect correlation with the portfolio investment, which could result in a Portfolio incurring substantial losses. This correlation risk may be greater in the case of derivatives based on an index or other basket of securities, as the portfolio securities being hedged may not duplicate the components of the underlying index or the basket may not be of exactly the same type
34
of obligation as those underlying the derivative. The use of derivatives for "cross hedging" purposes (using a derivative based on one instrument as a hedge for a different instrument) may also involve greater correlation risks.
• While using derivatives for hedging purposes can reduce a Portfolio's risk of loss, it may also limit a Portfolio's opportunity for gains or result in losses by offsetting or limiting a Portfolio's ability to participate in favorable price movements in portfolio investments.
• Derivatives transactions for non-hedging purposes involve greater risks and may result in losses which would not be offset by increases in the value of portfolio securities or declines in the cost of securities to be acquired. In the event that a Portfolio enters into a derivatives transaction as an alternative to purchasing or selling the underlying instrument or in order to obtain desired exposure to an index or market, a Portfolio will be exposed to the same risks as are incurred in purchasing or selling the underlying instruments directly.
• The use of certain derivatives transactions involves the risk of loss resulting from the insolvency or bankruptcy of the counterparty to the contract or the failure by the counterparty to make required payments or otherwise comply with the terms of the contract. In the event of default by a counterparty, a Portfolio may have contractual remedies pursuant to the agreements related to the transaction.
• Liquidity risk exists when a particular derivative is difficult to purchase or sell. If a derivative transaction is particularly large or if the relevant market is illiquid, a Portfolio may be unable to initiate a transaction or liquidate a position at an advantageous time or price.
• Certain derivatives transactions are not entered into or traded on exchanges or in markets regulated by the U.S. Commodity Futures Trading Commission ("CFTC") or the SEC. Instead, such OTC derivatives are entered into directly by a Portfolio and a counterparty and may be traded only through financial institutions acting as market makers. OTC derivatives transactions can only be entered into with a willing counterparty that is approved by the Adviser and/or Sub-Adviser(s) in accordance with guidelines established by the Board. Where no such counterparty is available, a Portfolio will be unable to enter into a desired OTC transaction. There also may be greater risk that no liquid secondary market in the trading of OTC derivatives will exist, in which case a Portfolio may be required to hold such instruments until exercise, expiration or maturity. Many of the protections afforded to exchange participants are not available to participants in OTC derivatives transactions. OTC derivatives transactions are not subject to the guarantee of an exchange or clearinghouse, and as a result a Portfolio would bear greater risk of default by the counterparties to such transactions.
• A Portfolio may be required to make physical delivery of portfolio securities underlying a derivative in order to close out a derivatives position or to sell portfolio securities at a time or price at which it may be disadvantageous to do so in order to obtain cash to close out or to maintain a derivatives position.
• As a result of the structure of certain derivatives, adverse changes in the value of the underlying instrument can result in losses substantially greater than the amount invested in the derivative itself. Certain derivatives have the potential for unlimited loss, regardless of the size of the initial investment.
• Certain derivatives may be considered illiquid and therefore subject to a Portfolio's limitation on investments in illiquid securities.
• Derivatives transactions conducted outside the United States may not be conducted in the same manner as those entered into on U.S. exchanges, and may be subject to different margin, exercise, settlement or expiration procedures. Brokerage commissions, clearing costs and other transaction costs may be
35
higher on foreign exchanges. Many of the risks of OTC derivatives transactions are also applicable to derivatives transactions conducted outside the United States. Derivatives transactions conducted outside the United States are subject to the risk of governmental action affecting the trading in, or the prices of, foreign securities, currencies and other instruments. The value of such positions could be adversely affected by foreign political and economic factors; lesser availability of data on which to make trading decisions; delays on a Portfolio's ability to act upon economic events occurring in foreign markets; and less liquidity than U.S. markets.
• Currency derivatives are subject to additional risks. Currency derivatives transactions may be negatively affected by government exchange controls, blockages, and manipulations. Currency exchange rates may be influenced by factors extrinsic to a country's economy. There is no systematic reporting of last sale information with respect to foreign currencies. As a result, the available information on which trading in currency derivatives will be based may not be as complete as comparable data for other transactions. Events could occur in the foreign currency market which will not be reflected in currency derivatives until the following day, making it more difficult for a Portfolio to respond to such events in a timely manner.
Contracts for Difference ("CFDs"). Certain Portfolios may invest in CFDs. A CFD is a privately negotiated contract between two parties, buyer and seller, stipulating that the seller will pay to or receive from the buyer the difference between the nominal value of the underlying instrument at the opening of the contract and that instrument's value at the end of the contract. The underlying instrument may be a single security, stock basket or index. A CFD can be set up to take either a short or long position on the underlying instrument. The buyer and seller are typically both required to post margin, which is adjusted daily. The buyer will also pay to the seller a financing rate on the notional amount of the capital employed by the seller less the margin deposit. A CFD is usually terminated at the buyer's initiative. The seller of the CFD will simply match the exposure of the underlying instrument in the open market and the parties will exchange whatever payment is due.
As is the case with owning any financial instrument, there is the risk of loss associated with buying a CFD. For example, if a Portfolio buys a long CFD and the underlying security is worth less at the end of the contract, the Portfolio would be required to make a payment to the seller and would suffer a loss. Also, there may be liquidity risk if the underlying instrument is illiquid because the liquidity of a CFD is based on the liquidity of the underlying instrument. A further risk is that adverse movements in the underlying security will require the buyer to post additional margin. CFDs also carry counterparty risk, i.e., the risk that the counterparty to the CFD transaction may be unable or unwilling to make payments or to otherwise honor its financial obligations under the terms of the contract. If the counterparty were to do so, the value of the contract, and of a Portfolio's shares, may be reduced.
To the extent that there is an imperfect correlation between the return on a Portfolio's obligation to its counterparty under the CFDs and the return on related assets in its portfolio, the CFD transaction may increase the Portfolio's financial risk. A Portfolio will not enter into a CFD transaction that is inconsistent with its investment objective, policies and strategies.
Options. An option is a contract that gives the holder of the option the right, but not the obligation, to buy from (in the case of a call option) or sell to (in the case of a put option) the seller of the option (the "option writer") the underlying security at a specified fixed price (the "exercise price") on or prior to a specified date (the "expiration date"). The buyer of the option pays to the option writer the option premium, which is the purchase price of the option.
Exchange-traded options are issued by a regulated intermediary such as the Options Clearing Corporation ("OCC"), which guarantees the performance of the obligations of the parties to such options. OTC options are purchased from or sold to counterparties through direct bilateral agreements between the Fund and its
36
counterparties. Certain options, such as options on individual securities, may be settled through physical delivery of the underlying security, whereas other options, such as index options, are settled in cash in an amount based on the value of the underlying instrument multiplied by a specified multiplier.
Writing Options. Certain Portfolios may write call and put options. As the writer of a call option, a Portfolio receives the premium from the purchaser of the option and has the obligation, upon exercise of the option, to deliver the underlying security upon payment of the exercise price. If the option expires without being exercised a Portfolio is not required to deliver the underlying security but retains the premium received.
Certain Portfolios may only write call options that are "covered." A call option on a security is covered if (a) a Portfolio owns the security underlying the call or has an absolute and immediate right to acquire that security without additional cash consideration (or, if additional cash consideration is required, such amount is maintained by a Portfolio in segregated or earmarked cash or liquid assets) upon conversion or exchange of other securities held by a Portfolio; or (b) a Portfolio has purchased a call on the underlying security, the exercise price of which is (i) equal to or less than the exercise price of the call written, or (ii) greater than the exercise price of the call written, provided the difference is maintained by a Portfolio in segregated or earmarked cash or liquid assets.
Selling call options involves the risk that a Portfolio may be required to sell the underlying security at a disadvantageous price, below the market price of such security, at the time the option is exercised. As the writer of a covered call option, a Portfolio forgoes, during the option's life, the opportunity to profit from increases in the market value of the underlying security covering the option above the sum of the premium and the exercise price but retains the risk of loss should the price of the underlying security decline.
Certain Portfolios may write put options. As the writer of a put option, a Portfolio receives the premium from the purchaser of the option and has the obligation, upon exercise of the option, to pay the exercise price and receive delivery of the underlying security. If the option expires without being exercised, a Portfolio is not required to receive the underlying security in exchange for the exercise price but retains the option premium.
A Portfolio may only write put options that are "covered." A put option on a security is covered if (a) a Portfolio segregates or earmarks cash or liquid assets equal to the exercise price; or (b) a Portfolio has purchased a put on the same security as the put written, the exercise price of which is (i) equal to or greater than the exercise price of the put written, or (ii) less than the exercise price of the put written, provided the difference is maintained by a Portfolio in segregated or earmarked cash or liquid assets.
Selling put options involves the risk that a Portfolio may be required to buy the underlying security at a disadvantageous price, above the market price of such security, at the time the option is exercised. While a Portfolio's potential gain in writing a covered put option is limited to the premium received plus the interest earned on the liquid assets covering the put option, a Portfolio's risks of loss is equal to the entire value of the underlying security, offset only by the amount of the premium received.
A Portfolio may close out an options position which it has written through a closing purchase transaction. A Portfolio would execute a closing purchase transaction with respect to a call option written by purchasing a call option on the same underlying security and having the same exercise price and expiration date as the call option written by a Portfolio. A Portfolio would execute a closing purchase transaction with respect to a put option written by purchasing a put option on the same underlying security and having the same exercise price and expiration date as the put option written by a Portfolio. A closing purchase transaction may or may not result in a profit to a Portfolio. A Portfolio could close out its position as an option writer only if a liquid market exists for options on the same underlying security and having the same exercise date as the option written by the Fund. There is no assurance that such a market will exist with respect to any particular option.
37
The writer of an option generally has no control over the time when the option is exercised, and the option writer is required to deliver or acquire the underlying security. Once an option writer has received an exercise notice, it cannot effect a closing purchase transaction in order to terminate its obligation under the option. Thus, the use of options may require a Portfolio to buy or sell portfolio securities at inopportune times or for prices other than the current market values of such securities, may limit the amount of appreciation a Portfolio can realize on an investment, or may cause a Portfolio to hold a security that it might otherwise sell.
Purchasing Options. Certain Portfolios may purchase call and put options. As the buyer of a call option, a Portfolio pays the premium to the option writer and has the right to purchase the underlying security from the option writer at the exercise price. If the market price of the underlying security rises above the exercise price, a Portfolio could exercise the option and acquire the underlying security at a below market price, which could result in a gain to a Portfolio, minus the premium paid. As the buyer of a put option, a Portfolio pays the premium to the option writer and has the right to sell the underlying security to the option writer at the exercise price. If the market price of the underlying security declines below the exercise price, a Portfolio could exercise the option and sell the underlying security at an above market price, which could result in a gain to a Portfolio, minus the premium paid. A Portfolio may buy call and put options whether or not it holds the underlying securities.
As a buyer of a call or put option, a Portfolio may sell put or call options that it has purchased at any time prior to such option's expiration date through a closing sale transaction. The principal factors affecting the market value of a put or a call option include supply and demand, interest rates, the current market price of the underlying security in relation to the exercise price of the option, the volatility of the underlying security, the underlying security's dividend policy, and the time remaining until the expiration date. A closing sale transaction may or may not result in a profit to a Portfolio. A Portfolio's ability to initiate a closing sale transaction is dependent upon the liquidity of the options market and there is no assurance that such a market will exist with respect to any particular option. If a Portfolio does not exercise or sell an option prior to its expiration date, the option expires and becomes worthless.
OTC Options. Unlike exchange-traded options, which are standardized with respect to the underlying instrument, expiration date, contract size and strike price, the terms of OTC options generally are established through negotiation between the parties to the options contract. This type of arrangement allows the purchaser and writer greater flexibility to tailor the option to their needs. OTC options are available for a greater variety of securities or other assets, and in a wider range of expiration dates and exercise prices, than exchange traded options. However, unlike exchange traded options, which are issued and guaranteed by a regulated intermediary, such as the OCC, OTC options are entered into directly with the counterparty. Unless the counterparties provide for it, there is no central clearing or guaranty function for an OTC option. Therefore, OTC options are subject to the risk of default or non-performance by the counterparty. Accordingly, the Adviser must assess the creditworthiness of the counterparty to determine the likelihood that the terms of the option will be satisfied. There can be no assurance that a continuous liquid secondary market will exist for any particular OTC option at any specific time. As a result, a Portfolio may be unable to enter into closing sale transactions with respect to OTC options.
Index Options. Call and put options on indices operate similarly to options on securities. Rather than the right to buy or sell a single security at a specified price, options on an index give the holder the right to receive, upon exercise of the option, an amount of cash determined by reference to the value of the underlying index. The underlying index may be a broad-based index or a narrower market index. Unlike many options on securities, all settlements are in cash. The settlement amount, which the writer of an index option must pay to the holder of the option upon exercise, is generally equal to the difference between the fixed exercise price of the option and the value of the underlying index, multiplied by a specified multiplier. The multiplier determines the size of the investment position the option represents. Gain or loss to a Portfolio on index options transactions will depend, in part, on price movements of the underlying index generally or in a particular segment of the index rather than price movements of individual components of the index. As with other options, a Portfolio
38
may close out its position in index options through closing purchase transactions and closing sale transactions provided that a liquid secondary market exists for such options.
Index options written by a Portfolio will generally be covered in a manner similar to the covering of other types of options, by holding an offsetting financial position and/or segregating or earmarking cash or liquid assets. A Portfolio may cover call options written on an index by owning securities or other assets whose price changes, in the opinion of the Adviser, are expected to correlate to those of the underlying index.
Foreign Currency Options. Options on foreign currencies operate similarly to options on securities. Rather than the right to buy or sell a single security at a specified price, options on foreign currencies give the holder the right to buy or sell foreign currency for a fixed amount in U.S. dollars or other base currencies. Options on foreign currencies are traded primarily in the OTC market, but may also be traded on U.S. and foreign exchanges. The value of a foreign currency option is dependent upon the value of the underlying foreign currency relative to the U.S. dollar or other base currency. The price of the option may vary with changes in, among other things, the value of either or both currencies and has no relationship to the investment merits of a foreign security. Options on foreign currencies are affected by all of those factors which influence foreign exchange rates and foreign investment generally. As with other options, a Portfolio may close out its position in foreign currency options through closing purchase transactions and closing sale transactions provided that a liquid market exists for such options.
Foreign currency options written by a Portfolio will generally be covered in a manner similar to the covering of other types of options, by holding an offsetting financial position and/or segregating or earmarking cash or liquid assets.
Additional Risks of Options Transactions. The risks associated with options transactions are different from, and possibly greater than, the risks associated with investing directly in the underlying instruments. Options are highly specialized instruments that require investment techniques and risk analyses different from those associated with other portfolio investments. The use of options requires an understanding not only of the underlying instrument but also of the option itself. Options may be subject to the risk factors generally applicable to derivatives transactions described herein, and may also be subject to certain additional risk factors, including:
• The exercise of options written or purchased by a Portfolio could cause a Portfolio to sell portfolio securities, thus increasing a Portfolio's portfolio turnover.
• A Portfolio pays brokerage commissions each time it writes or purchases an option or buys or sells an underlying security in connection with the exercise of an option. Such brokerage commissions could be higher relative to the commissions for direct purchases of sales of the underlying securities.
• A Portfolio's options transactions may be limited by limitations on options positions established by the SEC, the CFTC or the exchanges on which such options are traded.
• The hours of trading for exchange-listed options may not coincide with the hours during which the underlying securities are traded. To the extent that the options markets close before the markets for the underlying securities, significant price and rate movements can take place in the underlying securities that cannot be reflected in the options markets.
• Index options based upon a narrow index of securities or other assets may present greater risks than options based on broad market indexes, as narrower indexes are more susceptible to rapid and extreme fluctuations as a result of changes in the values of a smaller number of securities or other assets.
39
• A Portfolio is subject to the risk of market movements between the time that an option is exercised and the time of performance thereunder, which could increase the extent of any losses suffered by a Portfolio in connection with options transactions.
Futures Contracts. A futures contract is a standardized, exchange-traded agreement to buy or sell a specific quantity of a commodity at a specific price at a specific future time (the "settlement date"). Futures contracts may be based on, among other things, a specified equity security (securities futures), a specified debt security or reference rate (interest rate futures), the value of a specified securities index (index futures) or the value of a foreign currency (forward contracts and currency futures). The value of a futures contract tends to increase and decrease in tandem with the value of the underlying instrument. The buyer of a futures contract agrees to purchase the underlying instrument on the settlement date and is said to be "long" the contract. The seller of a futures contract agrees to sell the underlying instrument on the settlement date and is said to be "short" the contract. Futures contracts call for settlement only on the expiration date and cannot be "exercised" at any other time during their term.
Depending on the terms of the particular contract, futures contracts are settled through either physical delivery of the underlying instrument on the settlement date (such as in the case of securities futures based on a specified debt security) or by payment of a cash settlement amount on the settlement date (such as in the case of futures contracts relating to interest rates, foreign currencies and broad-based securities indexes). In the case of cash-settled futures contracts, the settlement amount is equal to the difference between the reference instrument's price on the last trading day of the contract and the reference instrument's price at the time the contract was entered into. Most futures contracts, particularly futures contracts requiring physical delivery, are not held until the settlement date, but instead are offset before the settlement date through the establishment of an opposite and equal futures position (buying a contract that had been sold, or selling a contract that had been purchased). All futures transactions are effected through a clearinghouse associated with the exchange on which the futures are traded.
The buyer and seller of a futures contract are not required to deliver or pay for the underlying commodity unless the contract is held until the settlement date. However, both the buyer and seller are required to deposit "initial margin" with a futures commodities merchant when the futures contract is entered into. Initial margin deposits are typically calculated as a percentage of the contract's market value. If the value of either party's position declines, the party will be required to make additional "variation margin" payments to settle the change in value on a daily basis. The process is known as "marking-to-market." Upon the closing of a futures position through the establishment of an offsetting position, a final determination of variation margin will be made and additional cash will be paid by or released to a Portfolio.
In addition, a Portfolio may be required to maintain segregated cash or liquid assets in order to cover futures transactions. A Portfolio will segregate or earmark cash or liquid assets in an amount equal to the difference between the market value of a futures contract entered into by a Portfolio and the aggregate value of the initial and variation margin payments made by a Portfolio with respect to such contract or as otherwise permitted by SEC rules or SEC staff positions. See "Regulatory Matters" below.
Currency Forward Contracts and Currency Futures. A foreign currency forward exchange contract is a negotiated agreement between two parties to exchange specified amounts of two or more currencies at a specified future time at a specified rate. The rate specified by the foreign currency forward exchange contract can be higher or lower than the spot rate between the currencies that are the subject of the contract. Currency futures are similar to foreign currency forward exchange contracts, except that they are traded on an exchange and standardized as to contract size and delivery date. Most currency futures call for payment or delivery in U.S. dollars. Unanticipated changes in currency prices may result in losses to a Portfolio and poorer overall performance for a Portfolio than if it had not entered into foreign currency forward exchange contracts. Certain Portfolios may enter into foreign currency forward exchange contracts under various circumstances. The typical
40
use of a foreign currency forward exchange contract is to "lock in" the price of a security in U.S. dollars or some other foreign currency, which a Portfolio is holding in its portfolio. By entering into a foreign currency forward exchange contract for the purchase or sale, for a fixed amount of dollars or other currency, of the amount of foreign currency involved in the underlying security transactions, a Portfolio may be able to protect itself against a possible loss resulting from an adverse change in the relationship between the U.S. dollar or other currency which is being used for the security purchase and the foreign currency in which the security is denominated during the period between the date on which the security is purchased or sold and the date on which payment is made or received. The Adviser also may from time to time utilize foreign currency forward exchange contracts for other purposes. For example, they may be used to hedge a foreign security held in the portfolio or a security which pays out principal tied to an exchange rate between the U.S. dollar and a foreign currency, against a decline in value of the applicable foreign currency. They also may be used to lock in the current exchange rate of the currency in which those securities anticipated to be purchased are denominated. At times, a Portfolio may enter into "cross-currency" hedging transactions involving currencies other than those in which securities are held or proposed to be purchased are denominated.
A Portfolio will not enter into foreign currency forward exchange contracts or maintain a net exposure to these contracts where the consummation of the contracts would obligate a Portfolio to deliver an amount of foreign currency in excess of the value of a Portfolio's portfolio securities.
When required by law, a Portfolio will segregate or earmark cash, U.S. government securities or other appropriate liquid portfolio securities in an amount equal to the value of a Portfolio's total assets committed to the consummation of foreign currency forward exchange contracts entered into under the circumstances set forth above. If the value of the securities so earmarked declines, additional cash or securities will be segregated or earmarked on a daily basis so that the value of such securities will equal the amount of a Portfolio's commitments with respect to such contracts.
A Portfolio may be limited in its ability to enter into hedging transactions involving foreign currency forward exchange contracts by the Code requirements relating to qualification as a regulated investment company.
Foreign currency forward exchange contracts may limit gains on portfolio securities that could otherwise be realized had they not been utilized and could result in losses. The contracts also may increase a Portfolio's volatility and may involve a significant amount of risk relative to the investment of cash.
Options on Futures Contracts. Options on futures contracts are similar to options on securities except that options on futures contracts give the purchasers the right, in return for the premium paid, to assume a position in a futures contract (a long position in the case of a call option and a short position in the case of a put option) at a specified exercise price at any time prior to the expiration of the option. Upon exercise of the option, the parties will be subject to all of the risks associated with futures transactions and subject to margin requirements. As the writer of options on futures contracts, a Portfolio would also be subject to initial and variation margin requirements on the option position.
Options on futures contracts written by a Portfolio will generally be covered in a manner similar to the covering of other types of options, by holding an offsetting financial position and/or segregating or earmarking cash or liquid assets. A Portfolio may cover an option on a futures contract by purchasing or selling the underlying futures contract. In such instances the exercise of the option will serve to close out a Portfolio's futures position.
Additional Risks of Futures Transactions. The risks associated with futures contract transactions are different from, and possibly greater than, the risks associated with investing directly in the underlying instruments. Futures are highly specialized instruments that require investment techniques and risk analyses different from those
41
associated with other portfolio investments. The use of futures requires an understanding not only of the underlying instrument but also of the futures contract itself. Futures may be subject to the risk factors generally applicable to derivatives transactions described herein, and may also be subject to certain additional risk factors, including:
• The risk of loss in buying and selling futures contracts can be substantial. Small price movements in the commodity underlying a futures position may result in immediate and substantial loss (or gain) to a Portfolio.
• Buying and selling futures contracts may result in losses in excess of the amount invested in the position in the form of initial margin. In the event of adverse price movements in the underlying commodity, security, index, currency or instrument, a Portfolio would be required to make daily cash payments to maintain its required margin. A Portfolio may be required to sell portfolio securities, or make or take delivery of the underlying securities in order to meet daily margin requirements at a time when it may be disadvantageous to do so. A Portfolio could lose margin payments deposited with a futures commission merchant if the futures commission merchant breaches its agreement with a Portfolio, becomes insolvent or declares bankruptcy.
• Most exchanges limit the amount of fluctuation permitted in futures contract prices during any single trading day. Once the daily limit has been reached in a particular futures contract, no trades may be made on that day at prices beyond that limit. If futures contract prices were to move to the daily limit for several trading days with little or no trading, a Portfolio could be prevented from prompt liquidation of a futures position and subject to substantial losses. The daily limit governs only price movements during a single trading day and therefore does not limit a Portfolio's potential losses.
• Index futures based upon a narrower index of securities may present greater risks than futures based on broad market indexes, as narrower indexes are more susceptible to rapid and extreme fluctuations as a result of changes in value of a small number of securities.
Swaps. An OTC swap contract is an agreement between two parties pursuant to which the parties exchange payments at specified dates on the basis of a specified notional amount, with the payments calculated by reference to specified securities, indexes, reference rates, currencies or other instruments. A small percentage of swap contracts are cleared through a central clearinghouse. Most swap agreements provide that when the period payment dates for both parties are the same, the payments are made on a net basis (i.e., the two payment streams are netted out, with only the net amount paid by one party to the other). A Portfolio's obligations or rights under a swap contract entered into on a net basis will generally be equal only to the net amount to be paid or received under the agreement, based on the relative values of the positions held by each counterparty. Most swap agreements are generally not entered into or traded on exchanges and often there is no central clearing or guaranty function for swaps. These OTC swaps are generally subject to the risk of default or non-performance by the counterparty. Accordingly, the Adviser must assess the creditworthiness of the counterparty to determine the likelihood that the terms of the swap will be satisfied.
Swap agreements allow for a wide variety of transactions. For example, fixed rate payments may be exchanged for floating rate payments, U.S. dollar denominated payments may be exchanged for payments denominated in foreign currencies, and payments tied to the price of one security, index, reference rate, currency or other instrument may be exchanged for payments tied to the price of a different security, index, reference rate, currency or other instrument. Swap contracts are typically individually negotiated and structured to provide exposure to a variety of particular types of investments or market factors. Swap contracts can take many different forms and are known by a variety of names. To the extent consistent with a Portfolio's investment objectives and policies, a Portfolio is not limited to any particular form or variety of swap contract. A Portfolio may utilize swaps to increase or decrease its exposure to the underlying instrument, reference rate, foreign currency, market
42
index or other asset. Certain Portfolios may also enter into related derivative instruments including caps, floors and collars.
A Portfolio may be required to cover swap transactions. Obligations under swap agreements entered into on a net basis are generally accrued daily and any accrued but unpaid amounts owed by a Portfolio to the swap counterparty will be covered by segregating or earmarking cash or liquid assets. If a Portfolio enters into a swap agreement on other than a net basis, a Portfolio will segregate or earmark cash or liquid assets with a value equal to the full amount of a Portfolio's accrued obligations under the agreement.
Interest Rate Swaps, Caps, Floors and Collars. Interest rate swaps consist of an agreement between two parties to exchange their respective commitments to pay or receive interest (e.g., an exchange of floating rate payments for fixed rate payments). Interest rate swaps are generally entered into on a net basis. Interest rate swaps do not involve the delivery of securities, other underlying assets, or principal. Accordingly, the risk of loss with respect to interest rate and total rate of return swaps is limited to the net amount of interest payments that a Portfolio is contractually obligated to make.
Certain Portfolios may also buy or sell interest rate caps, floors and collars. The purchase of an interest rate cap entitles the purchaser, to the extent that a specified index exceeds a predetermined interest rate, to receive payments of interest on a specified notional amount from the party selling the interest rate cap. The purchase of an interest rate floor entitles the purchaser, to the extent that a specified index falls below a predetermined interest rate, to receive payments of interest on a specified notional amount from the party selling the interest rate floor. A collar is a combination of a cap and a floor that preserves a certain return within a predetermined range of interest rate of values. Caps, floors and collars may be less liquid than other types of swaps. If a Portfolio sells caps, floors and collars, it will segregate liquid assets with a value equal to the full amount, accrued daily, of a Portfolio's net obligations with respect to the caps, floors or collars.
Index Swaps. An index swap consists of an agreement between two parties in which a party exchanges a cash flow based on a notional amount of a reference index for a cash flow based on a different index or on another specified instrument or reference rate. Index swaps are generally entered into on a net basis.
Inflation Swaps. Inflation swap agreements are contracts in which one party agrees to pay the cumulative percentage increase in a price index, such as the Consumer Price Index, over the term of the swap (with some lag on the referenced inflation index), and the other party pays a compounded fixed rate. Inflation swap agreements may be used to protect the NAV of a Portfolio against an unexpected change in the rate of inflation measured by an inflation index. The value of inflation swap agreements is expected to change in response to changes in real interest rates. Real interest rates are tied to the relationship between nominal interest rates and the rate of inflation.
Currency Swaps. A currency swap consists of an agreement between two parties to exchange cash flows on a notional amount of two or more currencies based on the relative value differential among them, such as exchanging a right to receive a payment in a foreign currency for the right to receive U.S. dollars. Currency swap agreements may be entered into on a net basis or may involve the delivery of the entire principal value of one designated currency in exchange for the entire principal value of another designated currency. In such cases, the entire principal value of a currency swap is subject to the risk that the counterparty will default on its contractual delivery obligations.
Credit Default Swaps. A credit default swap consists of an agreement between two parties in which the "buyer" agrees to pay to the "seller" a periodic stream of payments over the term of the contract and the seller agrees to pay the buyer the par (or other agreed-upon) value of a referenced debt obligation upon the occurrence of a credit event with respect to the issuer of that referenced debt obligation. Generally, a credit event means a bankruptcy, failure to pay, or a restructuring. A Portfolio may be either the buyer or seller in a credit default
43
swap. As the buyer in a credit default swap, a Portfolio would pay to the counterparty the periodic stream of payments. If no default occurs, a Portfolio would receive no benefit from the contract. As the seller in a credit default swap, a Portfolio would receive the stream of payments but would be subject to exposure on the notional amount of the swap, which it would be required to pay in the event of default. A Portfolio will generally segregate or earmark cash or liquid assets to cover any potential obligation under a credit default swap sold by a Portfolio. The use of credit default swaps could result in losses to a Portfolio if the Adviser and/or Sub-Adviser(s) fails to correctly evaluate the creditworthiness of the issuer of the referenced debt obligation.
Swaptions. An option on a swap agreement, also called a "swaption," is an option that gives the buyer the right, but not the obligation, to enter into a swap on a future date in exchange for paying a market based "premium." A receiver swaption gives the owner the right to receive the total return of a specified asset, reference rate, or index. A payer swaption gives the owner the right to pay the total return of a specified asset, reference rate, or index. Swaptions also include options that allow an existing swap to be terminated or extended by one of the counterparties.
General Risks of Swaps. The risks associated with swap transactions are different from, and possibly greater than, the risks associated with investing directly in the underlying instruments. Swaps are highly specialized instruments that require investment techniques and risk analyses different from those associated with other portfolio investments. The use of swaps requires an understanding not only of the underlying instrument but also of the swap contract itself. Swap transactions may be subject to the risk factors generally applicable to derivatives transactions described above, and may also be subject to certain additional risk factors, including:
• Many swap agreements are not traded on exchanges and not subject to a similar level of government regulation like exchange traded derivatives. As a result, parties to a swap agreement are not protected by such government regulations to the same extent participants in transactions in derivatives traded on organized exchanges.
• In addition to the risk of default by the counterparty, if the creditworthiness of a counterparty to a swap agreement declines, the value of the swap agreement would be likely to decline, potentially resulting in losses.
The swaps market is a relatively new market and currently is largely unregulated. It is possible that further developments in the swaps market, including future governmental regulation, could adversely affect a Portfolio's ability to utilize swaps, terminate existing swap agreements or realize amounts to be received under such agreements.
Structured Investments. Certain Portfolios also may invest a portion of their assets in structured investments. A structured investment is a derivative security designed to offer a return linked to a particular underlying security, currency, commodity or market for which the amount of principal repayment and/or interest payments is based on the change and value of such underlying security, currency, commodity or market, including, among others, currency exchange rates, interest rates (such as the prime lending rate or LIBOR), referenced bonds and stock indices or other financial reference. Structured investments may come in various forms, including notes, warrants and options to purchase securities and may be listed and traded on an exchange or otherwise traded in the OTC market.
A Portfolio will typically use structured investments to gain exposure to a permitted underlying security, currency, commodity or market when direct access to such security, currency, commodity or market is limited or inefficient from a tax, cost or regulatory standpoint. Investments in structured investments involve risks including issuer risk, counterparty risk and market risk. Holders of structured investments bear risks of the underlying investment and are subject to issuer or counterparty risk because the Portfolio is relying on the creditworthiness of such issuer or counterparty and has no rights with respect to the issuer of the underlying
44
investment. Certain structured investments may be thinly traded or have a limited trading market and may have the effect of increasing the Portfolio's illiquidity to the extent that the Portfolio, at a particular point in time, may be unable to find qualified buyers for these investments.
A structured investment may be linked either positively or negatively to its underlying security, currency, commodity or market and a change in interest rate, principal amount or other factor, depending on the structured investment's design, may be a multiple of the factor's movement. Application of a multiplier is comparable to the use of financial leverage, a speculative technique. Leverage magnifies the potential for gain and the risk of loss. As a result, a relatively small decline in the value of the referenced factor could result in a relatively large loss in the value of a structured investment.
Other types of structured investments include interests in entities organized and operated for the purpose of restructuring the investment characteristics of underlying investment interests or securities. This type of securitization or restructuring usually involves the deposit or purchase of an underlying security by a U.S. or foreign entity, such as a corporation or trust of specified instruments, and the issuance by that entity of one or more classes of securities backed by, or representing an interest in, the underlying instruments. The cash flow or rate of return on the underlying investments may be apportioned among the newly issued securities to create different investment characteristics, such as varying maturities, credit quality, payment priorities and interest rate provisions. Structured investments which are subordinated, for example, in payment priority often offer higher returns, but may result in increased risks compared to other investments.
Combined Transactions. Combined transactions involve entering into multiple derivatives transactions (such as multiple options transactions, including purchasing and writing options in combination with each other; multiple futures transactions; and combinations of options, futures, forward and swap transactions) instead of a single derivatives transaction in order to customize the risk and return characteristics of the overall position. Combined transactions typically contain elements of risk that are present in each of the component transactions. A Portfolio may enter into a combined transaction instead of a single derivatives transaction when, in the opinion of the Adviser, it is in the best interest of the Portfolio to do so. Because combined transactions involve multiple transactions, they may result in higher transaction costs and may be more difficult to close out.
Regulatory Matters. As described herein, a Portfolio may be required to cover its potential economic exposure to certain derivatives transactions by holding an offsetting financial position and/or segregating or earmarking cash or liquid assets equal in value to a Portfolio's potential economic exposure under the transaction. A Portfolio will cover such transactions as described herein or in such other manner in accordance with applicable laws and regulations. Assets used to cover derivatives transactions cannot be sold while the derivatives position is open, unless they are replaced by other appropriate assets. Segregated or earmarked cash or liquid assets and assets held in margin accounts are not otherwise available to a Portfolio for investment purposes. If a large portion of a Portfolio's assets are used to cover derivatives transactions or are otherwise segregated or earmarked, it could affect portfolio management or a Portfolio's ability to meet redemption requests or other current obligations. With respect to derivatives which are cash settled (i.e., have no physical delivery requirement), a Portfolio is permitted to set aside liquid assets in an amount equal to a Portfolio's daily marked-to-market net obligations (i.e., a Portfolio's daily net liability) under the derivative, if any, rather than the derivative's full notional value or the market value of the instrument underlying the derivative, as applicable. By setting aside assets equal to only its net obligations under cash-settled derivatives, a Portfolio will have the ability to employ leverage to a greater extent than if a Portfolio were required to segregate assets equal to the full notional amount of the derivative or the market value of the underlying instrument, as applicable.
Regulatory developments affecting the exchange-traded and OTC derivatives markets may impair a Portfolio's ability to manage or hedge its investment portfolio through the use of derivatives. The Dodd-Frank Wall Street Reform and Consumer Protection Act (the "Dodd-Frank Act") and the rules promulgated thereunder may limit the ability of a Portfolio to enter into one or more exchange-traded or OTC derivatives transactions.
45
In particular, pursuant to authority granted under the Dodd-Frank Act, the CFTC in October 2011 promulgated final rules that impose new federal position limits on listed futures and options contracts on, and economically equivalent OTC derivatives referencing, 28 individual agricultural, metal and energy commodities. A Portfolio's futures and options positions in these 28 contracts will be aggregated with its positions, if any, in economically equivalent OTC derivatives referencing these contracts. These new position limits, which will be imposed on a Portfolio and its counterparties, may impact a Portfolio's ability to invest in futures, options and swaps in a manner that efficiently meets its investment objective. Derivatives positions of all investment companies advised by the Adviser are combined for purposes of these limits. An exchange may order the liquidation of positions found to be in excess of these limits and may impose certain other sanctions or restrictions.
A Portfolio's use of derivatives may be limited by the requirements of the Code for qualification as a regulated investment company for U.S. federal income tax purposes.
In February 2012, the CFTC adopted certain regulatory changes that may impact the Fund by subjecting the Adviser to registration with the CFTC as the commodity pool operator ("CPO") of the Fund, unless the Fund is able to comply with certain trading and marketing limitations on its investments in futures and certain other instruments. If the Adviser becomes subject to CFTC registration as a CPO, the disclosure and operations of the Fund would need to comply with all applicable CFTC regulations. Compliance with these additional registration and regulatory requirements would increase Fund expenses.
TAXES
The following is only a summary of certain additional federal income and excise tax considerations generally affecting the Portfolios and their shareholders that are not described in the Portfolios' prospectuses. No attempt is made to present a detailed explanation of the tax treatment of the Portfolios or their shareholders, and the discussion here and in the Portfolios' prospectuses is not intended as a substitute for careful tax planning. Shareholders are urged to consult their tax advisors with specific reference to their own tax situations, including their state and local tax liabilities.
The following general discussion of certain federal income and excise tax consequences is based on the Code, and the regulations issued thereunder as in effect on the date of this SAI. New legislation, as well as administrative changes or court decisions, may significantly change the conclusions expressed herein, and may have a retroactive effect with respect to the transactions contemplated herein.
Each Portfolio within the Fund is generally treated as a separate corporation for federal income tax purposes, and thus the provisions of the Code generally will be applied to each Portfolio separately, rather than to the Fund as a whole.
Federal Income Tax Treatment of Shareholders
Shares of the Portfolios will be purchased by life insurance companies for their separate accounts under variable annuity contracts and variable life insurance policies and by other entities under qualified pension and retirement plans. Under the provisions of the Code currently in effect, net income and net realized capital gains of Portfolios of the Fund are not currently taxable when distributed to and left to accumulate within a variable annuity contract or variable life insurance policy or under a qualified pension or retirement plan.
Section 817(h) of the Code provides that the investments of a separate account underlying a variable insurance contract (or the investments of a mutual fund, the shares of which are owned by the variable separate account) must be "adequately diversified" in order for the contract to be treated as an annuity or as life insurance for federal income tax purposes. The Treasury Department has issued regulations explaining these diversification requirements. Each Portfolio intends to continue to comply with such requirements.
46
For information on federal income taxation of a life insurance company with respect to its receipt of distributions from the Fund and federal income taxation of owners of the company's variable annuity contracts or variable life insurance policies, refer to the life insurance company's variable annuity contract or variable life insurance policy prospectus.
Qualification as a Regulated Investment Company
The Fund intends that each of its Portfolios qualify and elect to be treated for each taxable year as a regulated investment company ("RIC") under Subchapter M of the Code. Qualification as a regulated investment company requires, among other things, that (a) at least 90% of the Fund's gross income be derived from interest, dividends, payments with respect to securities loans, gains from the sale or other disposition of securities or options thereon or foreign currencies; and (b) the Fund diversify its holdings so that, at the end of each quarter of the taxable year, (i) at least 50% of the market value of the Fund's assets is represented by cash, U.S. Government securities, securities of other regulated investment companies and other securities limited, in respect of any one issuer to an amount not greater than 5% of the Fund's total assets and not more than 10% of the outstanding voting securities of such issuer, and (ii) not more than 25% of the value of the Fund's total assets is invested in the securities of any one issuer (other than Government securities or securities of other RICs) in two or more issuers that are controlled by the Fund and that are engaged in the same or similar trades or businesses or related trades or businesses. It is anticipated that any net gain realized from the closing out of futures contracts will be considered gain from the sale of securities and therefore be qualified income for purposes of the 90% gross income requirement described above. Net income derived from an interest in a "qualified publicly traded partnership," as defined in the Code, will be treated as qualified income for purposes of the 90% gross income requirement. For the purposes of the diversification requirements in clause (ii) above, the outstanding voting securities of any issuer includes the equity securities of a qualified publicly traded partnership. In addition, no more than 25% of the value of a regulated investment company's total assets may be invested in the securities of one or more qualified traded partnerships.
For purposes of the 90% of gross income requirement described above, the Code expressly provides the U.S. Treasury with authority to issue regulations that would exclude foreign currency gains from qualifying income if such gains are not directly related to a Portfolio's business of investing in stock or securities. While to date the U.S. Treasury has not exercised this regulatory authority, there can be no assurance that it will not issue regulations in the future (possibly with retroactive application) that would treat some or all of a Portfolio's foreign currency gains as non-qualifying income. For purposes of the diversification requirement described above, a Portfolio will not be treated as in violation of such requirement as a result of a discrepancy between the value of its various investments and the diversification percentages described above, unless such discrepancy exists immediately following the acquisition of any security or other property and is wholly or partly the result of such acquisition. Moreover, even in the event of noncompliance with the diversification requirement as of the end of any given quarter, a Portfolio is permitted to cure the violation by eliminating the discrepancy causing such noncompliance within a period of 30 days from the close of the relevant quarter.
In addition to the requirements described above, in order to qualify as a RIC, each Portfolio must distribute at least 90% of the Portfolio's net investment company taxable income (that generally includes dividends, taxable interest, currency gains, and the excess of net short-term capital gains over net long-term capital losses less operating expenses) and at least 90% of its net tax-exempt interest income, if any, to shareholders (the "Distribution Requirement"). If a Portfolio meets all of the RIC requirements, it will not be subject to federal income tax on any of its net investment income or net realized capital gains that it distributes to shareholders.
Although each Portfolio intends to distribute all or substantially all of its net investment income and may distribute its net realized capital gains for any taxable year, a Portfolio will be subject to federal income taxation to the extent any such income or gains are not distributed.
47
Some of the Portfolios may make investments that cause the Portfolios to recognize income or gain prior to receiving cash with respect to such investments. For example, in the event that the Portfolios invest in securities (such as STRIPS) that bear "original issue discount" or "acquisition discount" (collectively, "OID Securities") they will be deemed to have received interest income even though no cash payments have been received. Accordingly, such investments may not produce sufficient current cash receipts to match the amount of net investment income a Portfolio must distribute to satisfy the Distribution Requirement. In some cases, a Portfolio may have to borrow money or dispose of other investments in order to make sufficient cash distributions to satisfy the Distribution Requirement.
If a Portfolio fails to qualify for any taxable year as a RIC, all of its taxable income will be subject to tax at regular corporate income tax rates without any deduction for distributions to shareholders.
Positions held by a Portfolio in certain regulated futures contracts and foreign currency contracts ("Section 1256 Contracts") will generally be marked-to-market (i.e., treated as though sold for fair market value) on the last business day of the Portfolio's taxable year and all gain or loss associated with such transactions (except certain currency gains covered by Section 988 of the Code) will generally be treated as 60% long-term capital gain or loss and 40% short-term capital gain or loss. The effect of the Section 1256 mark-to-market rules may be to accelerate income or to convert what otherwise would have been long-term capital gain into short-term capital gain or short-term capital losses into long-term capital losses within a Portfolio. The acceleration of income on Section 1256 Contracts may require a Portfolio to accrue taxable income without a corresponding receipt of cash. In order to generate enough cash to satisfy the Distribution Requirement, a Portfolio may be required to dispose of portfolio securities that it otherwise would have continued to hold or to use cash flows from other sources. Any or all of these rules may, therefore, affect the amount, character or timing of income earned and, in turn, affect the application of the Distribution Requirement to a particular Portfolio.
Short sales engaged in by a Portfolio may reduce the holding period of property held by a Portfolio which is substantially identical to the property sold short. This rule may have the effect of converting capital gains recognized by the Portfolio from long-term to short-term as well as converting capital losses recognized by the Portfolio from short-term to long-term.
Federal Excise Tax
No Portfolio will be subject to the 4% excise tax normally imposed on RICs that do not distribute substantially all of their income and gains each calendar year, because that tax does not apply to a RIC whose only shareholders are segregated asset accounts of life insurance companies held in connection with variable annuity accounts and/or variable life insurance policies and certain trusts under qualified pension and retirement plans.
Certain Tax Information Reporting Considerations
Because of the nature of the rules governing how REITs report their income and the timing of REIT's issuing year-end tax information, a Portfolio that invests in REITs may need to estimate the character of distributions paid to its shareholders from REIT distributions. In addition, after the calendar year-end, REITs may recharacterize the nature of the distributions paid during that year, with the result that distributions previously identified as ordinary income are recharacterized as return of capital and/or capital gain. As a result, the composition of a Portfolio's distributions as reported initially may differ from the final composition determined after calendar year-end and reported to a Portfolio's shareholders on their year-end tax information statements.
48
Foreign Income Taxes
Each Portfolio that invests in foreign securities may be subject to foreign withholding taxes with respect to its dividend and interest income from foreign countries, thus reducing the net amount available for distribution to a Portfolio's shareholders. The United States has entered into tax treaties with many foreign countries that may entitle a Portfolio to a reduced rate of, or exemption from, taxes on such income. It is impossible to determine the effective rate of foreign tax in advance because the amount of a Portfolio's assets to be invested within various countries is not known.
State and Local Tax Considerations
Rules of U.S. state and local taxation of dividend and capital gains distributions from regulated investment companies often differ from the rules for U.S. federal income taxation described above. Shareholders are urged to consult their tax advisers as to the consequences of these and other U.S. state and local tax rules regarding an investment in a Portfolio.
PURCHASE OF SHARES
The purchase price of each Portfolio of the Fund is the NAV next determined after the order is received by the Fund or its designee. NAV for Class I and Class II shares will differ due to class specific expenses paid by each class, if any, and the 12b-1 fee charged to Class II shares. For each Portfolio of the Fund, an order received prior to the close of the New York Stock Exchange (the "NYSE") (normally 4:00 p.m. Eastern Time) will be executed at the price computed on the date of receipt; and an order received after the close of the NYSE will be executed at the price computed on the next day the NYSE is open as long as the Fund's transfer agent receives payment by check or in Federal Funds. Shares of each Portfolio may be purchased on any day the NYSE is open.
Shares may, in the Fund's discretion, be purchased with investment securities (in lieu of or in conjunction with cash) acceptable to the Fund. The securities would be acceptable by the Fund at their market value in return for Portfolio Shares of equal value.
The Fund may accept orders from participating insurance companies after the close of the NYSE. In these cases, all orders received by a participating insurance company on a business day are aggregated and the insurance company places a net purchase or redemption order for shares of one or more Portfolios later that day or the morning of the next business day. These orders are normally executed at the NAV that was computed at the close of the day on which the insurance company received the order.
Each Portfolio reserves the right in its sole discretion to suspend the offering of its shares and to reject purchase orders when in the judgment of management such rejection is in the best interest of the Portfolio.
REDEMPTION OF SHARES
Redemptions: The Fund normally makes payment for all shares redeemed within one business day of receipt of the request, and in no event more than seven days after receipt of a redemption request in good order. Each Portfolio may suspend redemption privileges or postpone the date of payment (i) during any period that the NYSE is closed, or trading on the NYSE is restricted as determined by the SEC, (ii) during any period when an emergency exists as defined by the rules of the SEC as a result of which it is not reasonably practicable for a Portfolio to dispose of securities owned by it, or fairly to determine the value of its assets and (iii) for such other periods as the SEC may permit.
49
Distributions In Kind: If the Adviser determines that it is in the best interest of the Fund or a Portfolio not to pay redemption proceeds in cash, and subject to applicable agreements with life insurance companies and other qualified investors, the Fund may distribute to you securities held by the Portfolio from which you are redeeming. If requested, the Portfolio will pay a portion of your redemption(s) in cash (during any 90 day period) up to the lesser of $250,000 or 1% of the net assets of the Portfolio at the beginning of such period. Such in-kind securities may be illiquid and difficult or impossible for a shareholder to sell at a time and at a price that a shareholder would like. In addition, you may incur brokerage costs and a further gain or loss for income tax purposes when you ultimately sell the securities.
INVESTMENT LIMITATIONS
Fundamental Limitations
Each current Portfolio has adopted the following restrictions, which are fundamental policies and may not be changed without the approval of the lesser of: (1) at least 67% of the voting securities of the Portfolio present at a meeting if the holders of more than 50% of the outstanding voting securities of the Portfolio are present or represented by proxy, or (2) more than 50% of the outstanding voting securities of the Portfolio. Each Portfolio of the Fund may not:
(1) purchase or sell physical commodities unless acquired as a result of ownership of securities or other instruments; provided that this restriction shall not prohibit the Portfolio from purchasing or selling options, futures contracts and related options thereon, forward contracts, swaps, caps, floors, collars and any other financial instruments or from investing in securities or other instruments backed by physical commodities or as otherwise permitted by (i) the 1940 Act, (ii) the rules and regulations promulgated by the SEC under the 1940 Act, or (iii) an exemption or other relief applicable to the Portfolio from the provisions of the 1940 Act;
(2) purchase or sell real estate, although it may purchase and sell securities of companies that deal in real estate and may purchase and sell securities that are secured by interests in real estate;
(3) make loans of money or property to any person, except (a) to the extent that securities or interests in which the Portfolio may invest are considered to be loans, (b) through the loan of portfolio securities, (c) by engaging in repurchase agreements, or (d) as may otherwise be permitted by (i) the 1940 Act, (ii) the rules and regulations promulgated by the SEC under the 1940 Act, or (iii) an exemption or other relief applicable to the Fund from the provision of the 1940 Act;
(4) except with respect to the Emerging Markets Debt, Global Franchise and U.S. Real Estate Portfolios, invest in a manner inconsistent with its classification as a "diversified company" as provided by (i) the 1940 Act, (ii) the rules and regulations promulgated by the SEC under the 1940 Act, or (iii) an exemption or other relief applicable to the Portfolio from the provisions of the 1940 Act;
(5) borrow money, except the Portfolio may borrow money to the extent permitted by (i) the 1940 Act, (ii) the rules and regulations promulgated by the SEC under the 1940 Act, or (iii) an exemption or other relief applicable to the Fund from the provisions of the 1940 Act;
(6) issue senior securities, except the Portfolio may issue senior securities to the extent permitted by (i) the 1940 Act, (ii) the rules and regulations promulgated by the SEC under the 1940 Act, or (iii) an exemption or other relief applicable to the Portfolio from the provisions of the 1940 Act;
(7) underwrite securities issued by others, except to the extent that the Portfolio may be considered an underwriter within the meaning of the 1933 Act in the disposition of restricted securities; and
50
(8) acquire any securities of companies within one industry if, as a result of such acquisition, more than 25% of the value of the Portfolio's total assets would be invested in securities of companies within such industry; provided, that (i) there shall be no limitation on the purchase of obligations issued or guaranteed by the U.S. Government, its agencies or instrumentalities or instruments issued by U.S. banks; (ii) utility companies will be divided according to their services, for example, gas, gas transmission, electric and telephone will each be considered a separate industry; (iii) financial service companies will be classified according to the end users of their services, for example, automobile finance, bank finance and diversified finance will each be considered a separate industry; and (iv) asset-backed securities will be classified according to the underlying assets securing such securities; and provided further that the Global Real Estate Portfolio may invest more than 25% of its total assets in the real estate industry; and the U.S. Real Estate Portfolio may invest more than 25% of its total assets in the U.S. real estate industry.
Non-Fundamental Limitations
In addition, each current Portfolio of the Fund has adopted the following non-fundamental investment limitations, which may be changed by the Board without shareholder approval. Each current Portfolio of the Fund will not:
(1) sell short (other than "against the box") unless the Portfolio's obligation is covered by unencumbered liquid assets in a segregated account and by collateral held by the lending broker; provided that transactions in futures contracts and options are not deemed to constitute selling securities short;
(2) invest its assets in securities of any investment company except as may be permitted by the 1940 Act;
(3) invest more than an aggregate of 15% of the net assets of the Portfolio, determined at the time of investment, in illiquid securities;
(4) make loans except (i) by purchasing bonds, debentures or similar obligations (including repurchase agreements, subject to the limitations as described in the prospectus) that are publicly distributed and (ii) by lending its portfolio securities to banks, brokers, dealers and other financial institutions, so long as such loans are not inconsistent with the 1940 Act or the Rules and Regulations or interpretations of the SEC thereunder;
(5) purchase on margin, except for use of short-term credit as may be necessary for the clearance of purchases and sales of securities, but it may make margin deposits in connection with transactions in options, futures and options on futures; and
(6) except in the case of the Emerging Markets Debt Portfolio, borrow money, other than temporarily or for extraordinary or emergency purposes or purchase additional securities when borrowings exceed 5% of total (gross) assets.
Whether diversified or non-diversified, each Portfolio will diversify its holdings so that, at the close of each quarter of its taxable year or within 30 days thereafter, (i) at least 50% of the market value of the Portfolio's total assets is represented by cash (including cash items and receivables), U.S. Government securities and other securities, with such other securities limited, in respect of any one issuer, for purposes of this calculation to an amount not greater than 5% of the value of the Portfolio's total assets and 10% of the outstanding voting securities of such issuer and (ii) not more than 25% of the value of its total assets is invested in the securities of any one issuer (other than U.S. Government securities). Prior to the close of each quarter (or within 30 days thereafter), the Portfolio's holdings may be less diversified and are not required to satisfy any diversification test.
The percentage limitations contained in these restrictions apply at the time of purchase of securities. Future Portfolios of the Fund may adopt different limitations.
51
The investments of life insurance company separate accounts made under variable annuity contracts and variable life insurance policies are subject to state insurance laws and regulations. The Fund and its Portfolios will, when required, comply with investment restrictions imposed under such laws and regulations on life insurance company separate accounts investing in the Portfolios.
In addition, Section 817(h) of the Code requires that the assets of each Portfolio be adequately diversified so that insurance companies, and not variable contract owners, are considered the owners for federal income tax purposes of the assets held in the separate accounts. To meet the diversification requirements of regulations issued under Section 817(h), each Portfolio will meet the following test: no more than 55% of the assets will be invested in any one investment; no more than 70% of the assets will be invested in any two investments; no more than 80% of the assets will be invested in any three investments; and no more than 90% will be invested in any four investments. Each Portfolio must meet the above diversification requirements within 30 days of the end of each calendar quarter.
MANAGEMENT OF THE FUND
General. The Directors supervise the Fund's affairs under the laws governing corporations in the State of Maryland. The Directors have approved contracts under which certain companies provide essential management, administrative and shareholder services to the Fund.
Officers and Directors. The Board of the Fund consists of 10 Directors. These same individuals also serve as directors or trustees for certain of the funds advised by the Adviser and Morgan Stanley AIP GP LP. Nine Directors have no affiliation or business connection with the Adviser or any of its affiliated persons and do not own any stock or other securities issued by the Adviser's parent company, Morgan Stanley. These Directors are the "non-interested" or "Independent" Directors. The other Director (the "Interested Director") is affiliated with the Adviser.
Board Structure and Oversight Function. The Board's leadership structure features an Independent Director serving as Chairperson and the Board Committees described below. The Chairperson participates in the preparation of the agenda for meetings of the Board and the preparation of information to be presented to the Board with respect to matters to be acted upon by the Board. The Chairperson also presides at all meetings of the Board and is involved in discussions regarding matters pertaining to the oversight of the management of the Fund between meetings.
The Board of Directors operates using a system of committees to facilitate the timely and efficient consideration of all matters of importance to the Directors, the Fund and Fund shareholders, and to facilitate compliance with legal and regulatory requirements and oversight of the Fund's activities and associated risks. The Board of Directors has established four standing committees: (1) Audit Committee, (2) Governance Committee, (3) Compliance and Insurance Committee, and (4) Investment Committee. The Audit Committee and the Governance Committee are comprised exclusively of Independent Directors. Each committee charter governs the scope of the committee's responsibilities with respect to the oversight of the Fund. The responsibilities of each committee, including their oversight responsibilities, are described further under the caption "Independent Directors and the Committees."
The Fund is subject to a number of risks, including investment, compliance, operational and valuation risk, among others. The Board of Directors oversees these risks as part of its broader oversight of the Fund's affairs through various Board and committee activities. The Board has adopted, and periodically reviews, policies and procedures designed to address various risks to the Fund. In addition, appropriate personnel, including but not limited to the Fund's Chief Compliance Officer, members of the Fund's administration and accounting teams, representatives from the Fund's independent registered public accounting firm, the Fund's Treasurer, portfolio
52
management personnel and independent valuation and brokerage evaluation service provider, make regular reports regarding the Fund's activities and related risks to the Board of Directors and the committees, as appropriate. These reports include, among others, quarterly performance reports, quarterly derivatives activity and risk reports and discussions with members of the risk teams relating to each asset class. The Board's committee structure allows separate committees to focus on different aspects of risk and the potential impact of these risks on some or all of the funds in the complex and then report back to the full Board. In between regular meetings, Fund officers also communicate with the Directors regarding material exceptions and items relevant to the Board's risk oversight function. The Board recognizes that it is not possible to identify all of the risks that may affect the Fund, and that it is not possible to develop processes and controls to eliminate all of the risks that may affect the Fund. Moreover, the Board recognizes that it may be necessary for the Fund to bear certain risks (such as investment risk) to achieve its investment objective.
As needed between meetings of the Board, the Board or a specific committee receives and reviews reports relating to the Fund and engages in discussions with appropriate parties relating to the Fund's operations and related risks.
Independent Directors. The Fund seeks as Directors individuals of distinction and experience in business and finance, government service or academia. In determining that a particular Director was and continues to be qualified to serve as Director, the Board has considered a variety of criteria, none of which, in isolation, was controlling. Based on a review of the experience, qualifications, attributes or skills of each Director, including those enumerated in the table below, the Board has determined that each of the Directors is qualified to serve as a Director of the Fund. In addition, the Board believes that, collectively, the Directors have balanced and diverse experience, qualifications, attributes and skills that allow the Board to operate effectively in governing the Fund and protecting the interests of shareholders. Information about the Fund's Governance Committee and Board of Directors nomination process is provided below under the caption "Independent Directors and the Committees."
53
The Independent Directors of the Fund, their age, address, term of office and length of time served, their principal business occupations during the past five years, the number of portfolios in the Fund Complex (defined herein) overseen by each Independent Director (as of December 31, 2011) and other directorships, if any, held by the Directors, are shown below. The Fund Complex includes all open-end and closed-end funds (including all of their portfolios) advised by the Adviser and any funds that have an adviser that is an affiliate of the Adviser (including, but not limited to, Morgan Stanley AIP GP LP) (the "Morgan Stanley Funds").
Independent Directors:
Name, Age and Address of
Independent Director | | Position(s)
Held with
Registrant | | Length of
Time
Served(1) | | Principal Occupation(s)
During Past 5 Years | | Number of
Portfolios in
Fund Complex
Overseen by
Independent
Director | | Other Directorships
Held by
Independent Director(2) | |
Frank L. Bowman (67) c/o Kramer Levin Naftalis & Frankel LLP Counsel to the Independent Directors
1177 Avenue of the Americas
New York, NY 10036 | | Director | | Since August 2006 | | President, Strategic Decisions, LLC (consulting) (since February 2009); Director or Trustee of various Morgan Stanley Funds (since August 2006); Chairperson of the Insurance Sub-Committee of the Compliance and Insurance Committee (since February 2007); served as President and Chief Executive Officer of the Nuclear Energy Institute (policy organization) (February 2005-November 2008); retired as Admiral, U.S. Navy after serving over 38 years on active duty including 8 years as Director of the Naval Nuclear Propulsion Program in the Department of the Navy and U.S. Department of Energy (1996-2004); served as Chief of Naval Personnel (July 1994-September 1996) and on the Joint Staff as Directory of Political Military Affairs (June 1992-July 1994); Knighted as Honorary Knight Commander of the Most Excellent Order of the British Empire; Awarded the Officer de I'Orde National du Mérite by the French Government; elected to the National Academy of Engineering (2009). | | | 102 | | | Director of BP plc.; Director of Naval and Nuclear Technologies LLP; Director of the Armed Services YMCA of the USA and the Naval Submarine League; Director of the American Shipbuilding Suppliers Association; Member of the National Security Advisory Council of the Center for U.S. Global Engagement and a member of the CNA Military Advisory Board; Member of the American Lung Association's President's Council. | |
(1) Each Director serves an indefinite term, until his or her successor is elected.
(2) This includes any directorships at public companies and registered investment companies held by the Directors at any time during the past five years.
54
Name, Age and Address of
Independent Director | | Position(s)
Held with
Registrant | | Length of
Time
Served(1) | | Principal Occupation(s)
During Past 5 Years | | Number of
Portfolios in
Fund Complex
Overseen by
Independent
Director | | Other Directorships
Held by
Independent Director(2) | |
Michael Bozic (71) c/o Kramer Levin Naftalis & Frankel LLP Counsel to the Independent Directors
1177 Avenue of the Americas New York, NY 10036 | | Director | | Since April 1994 | | Private investor; Chairperson of the Compliance and Insurance Committee (since October 2006); Director or Trustee of various Morgan Stanley Funds (since April 1994); formerly, Chairperson of the Insurance Committee (July 2006-September 2006); Vice Chairman of Kmart Corporation (December 1998-October 2000); Chairman and Chief Executive Officer of Levitz Furniture Corporation (November 1995-November 1998) and President and Chief Executive Officer of Hills Department Stores (May 1991-July 1995); variously Chairman, Chief Executive Officer, President and Chief Operating Officer (1987-1991) of the Sears Merchandise Group of Sears, Roebuck & Co. | | | 104 | | | Director of various business organizations. | |
Kathleen A. Dennis (58) c/o Kramer Levin Naftalis & Frankel LLP Counsel to the Independent Directors
1177 Avenue of the Americas New York, NY 10036 | | Director | | Since August 2006 | | President, Cedarwood Associates (mutual fund and investment management consulting) (since July 2006); Chairperson of the Money Market and Alternatives Sub-Committee of the Investment Committee (since October 2006) and Director or Trustee of various Morgan Stanley Funds (since August 2006); formerly, Senior Managing Director of Victory Capital Management (1993-2006). | | | 102 | | | Director of various non-profit organizations. | |
(1) Each Director serves an indefinite term, until his or her successor is elected.
(2) This includes any directorships at public companies and registered investment companies held by the Directors at any time during the past five years.
55
Name, Age and Address of
Independent Director | | Position(s)
Held with
Registrant | | Length of
Time
Served(1) | | Principal Occupation(s)
During Past 5 Years | | Number of
Portfolios in
Fund Complex
Overseen by
Independent
Director | | Other Directorships
Held by
Independent Director(2) | |
Dr. Manuel H. Johnson (63)
c/o Johnson Smick
Group, Inc.
888 16th Street, N.W.
Suite 740
Washington, D.C. 20006 | | Director | | Since July 1991 | | Senior Partner, Johnson Smick International, Inc. (consulting firm); Chairperson of the Investment Committee (since October 2006) and Director or Trustee of various Morgan Stanley Funds (since July 1991); Co-Chairman and a founder of the Group of Seven Council (G7C) (international economic commission;) formerly, Chairperson of the Audit Committee (July 1991-September 2006); Vice Chairman of the Board of Governors of the Federal Reserve System and Assistant Secretary of the U.S. Treasury. | | | 104 | | | Director of NVR, Inc. (home construction). | |
Joseph J. Kearns (69)
c/o Kearns & Associates LLC
PMB754
22631 Pacific Coast Highway
Malibu, CA 90265 | | Director | | Since August 1994 | | President, Kearns & Associates LLC (investment consulting); Chairperson of the Audit Committee (since October 2006) and Director or Trustee of various Morgan Stanley Funds (since August 1994); formerly, Deputy Chairperson of the Audit Committee (July 2003-September 2006) and Chairperson of the Audit Committee of various Morgan Stanley Funds (since August 1994); CFO of the J. Paul Getty Trust. | | | 105 | | | Director of Electro Rent Corporation (equipment leasing) and The Ford Family Foundation. | |
(1) Each Director serves an indefinite term, until his or her successor is elected.
(2) This includes any directorships at public companies and registered investment companies held by the Directors at any time during the past five years.
56
Name, Age and Address of
Independent Director | | Position(s)
Held with
Registrant | | Length of
Time
Served(1) | | Principal Occupation(s)
During Past 5 Years | | Number of
Portfolios in
Fund Complex
Overseen by
Independent
Director | | Other Directorships
Held by
Independent Director(2) | |
Michael F. Klein (53)
c/o Kramer Levin Naftalis & Frankel LLP
Counsel to the Independent Directors
1177 Avenue of the Americas
New York, NY 10036 | | Director | | Since August 2006 | | Managing Director, Aetos Capital, LLC (since March 2000) and Co-President, Aetos Alternatives Management, LLC (since January 2004); Chairperson of the Fixed-Income Sub-Committee of the Investment Committee (since October 2006) and Director or Trustee of various Morgan Stanley Funds (since August 2006); formerly, Managing Director, Morgan Stanley & Co. Inc. and Morgan Stanley Dean Witter Investment Management, President, various Morgan Stanley Funds (June 1998-March 2000) and Principal, Morgan Stanley & Co. Inc. and Morgan Stanley Dean Witter Investment Management (August 1997-December 1999). | | | 102 | | | Director of certain investment funds managed or sponsored by Aetos Capital, LLC.; Director of Sanitized AG and Sanitized Marketing AG (specialty chemicals). | |
Michael E. Nugent (75)
c/o Triumph Capital, L.P.
445 Park Avenue
New York, NY 10022 | | Chairperson of the Board and Director | | Chairperson of the Boards since July 2006 and Director since July 2001 | | General Partner, Triumph Capital, L.P. (private investment partnership); Chairperson of the Boards of various Morgan Stanley Funds (since July 2006); Director or Trustee of various Morgan Stanley Funds (since July 1991); formerly, Chairperson of the Insurance Committee (until July 2006). | | | 104 | | | | None. | | |
(1) Each Director serves an indefinite term, until his or her successor is elected.
(2) This includes any directorships at public companies and registered investment companies held by the Directors at any time during the past five years.
57
Name, Age and Address of
Independent Director | | Position(s)
Held with
Registrant | | Length of
Time
Served(1) | | Principal Occupation(s)
During Past 5 Years | | Number of
Portfolios in
Fund Complex
Overseen by
Independent
Director | | Other Directorships
Held by
Independent Director(2) | |
W. Allen Reed (64)
c/o Kramer Levin Naftalis & Frankel LLP
Counsel to the Independent Directors
1177 Avenue of the Americas
New York, NY 10036 | | Director | | Since August 2006 | | Chairperson of the Equity Sub-Committee of the Investment Committee (since October 2006) and Director or Trustee of various Morgan Stanley Funds (since August 2006); formerly, President and CEO of General Motors Asset Management; Chairman and Chief Executive Officer of the GM Trust Bank and Corporate Vice President of General Motors Corporation (August 1994-December 2005). | | | 102 | | | Director of Temple-Inland Industries (packaging and forest products), Director of Legg Mason, Inc. and Director of the Auburn University Foundation. | |
Fergus Reid (79)
c/o Joe Pietryka, Inc.
85 Charles Colman Blvd.
Pawling, NY 12564 | | Director | | Since June 1992 | | Chairman, Joe Pietryka, Inc.; Chairperson of the Governance Committee and Director or Trustee of various Morgan Stanley Funds (since June 1992). | | | 105 | | | Trustee and Director of certain investment companies in the JPMorgan Funds complex managed by JP Morgan Investment Management Inc. | |
(1) Each Director serves an indefinite term, until his or her successor is elected.
(2) This includes any directorships at public companies and registered investment companies held by the Directors at any time during the past five years.
The Interested Director of the Fund who is affiliated with the Adviser or affiliates of the Adviser (as set forth below), his age, address, term of office and length of time served, his principal business occupations during the past five years, the number of portfolios in the Fund Complex overseen by the Interested Director (as of December 31, 2011) and the other directorships, if any, held by the Interested Director, are shown below.
Interested Director:
Name, Age and Address of
Interested Director | | Position(s)
Held with
Registrant | | Length of
Time
Served(1) | | Principal Occupation(s)
During Past 5 Years | | Number of
Portfolios in
Fund Complex
Overseen by
Interested
Director | | Other Directorships
Held by
Interested Director(2) | |
James F. Higgins (64) c/o Morgan Stanley
Services Company Inc.
Harborside Financial Center
201 Plaza Two
Jersey City, NJ 07311 | | Director | | Since June 2000 | | Director or Trustee of various Morgan Stanley Funds (since June 2000); Senior Advisor of Morgan Stanley (since August 2000). | | | 103 | | | Director of AXA Financial, Inc. and The Equitable Life Assurance Society of the United States (financial services). | |
(1) Each Director serves an indefinite term, until his or her successor is elected.
(2) This includes any directorships at public companies and registered investment companies held by the Directors at any time during the past five years.
58
The executive officers of the Fund, their age, address, position held, term of office and length of time served, and their principal business occupations during the past five years are shown below.
Executive Officers:
Name, Age and Address of
Executive Officer | | Position(s)
Held with
Registrant | | Length of
Time
Served(1) | | Principal Occupation(s) During Past 5 Years | |
Arthur Lev (50)
522 Fifth Avenue
New York, NY 10036 | | President and Principal Executive
Officer — Equity and Fixed Income Funds | | Since June 2011 | | President and Principal Executive Officer (since June 2011) of the Equity and Fixed Income Funds in the Fund Complex; Head of the Long Only Business of Morgan Stanley Investment Management (since February 2011); Managing Director of the Adviser and various entities affiliated with the Adviser (since December 2006). Formerly, Chief Strategy Officer of Morgan Stanley Investment Management's Traditional Asset Management business (November 2010-February 2011); General Counsel of Morgan Stanley Investment Management (December 2006-October 2010); Partner and General Counsel of FrontPoint Partners LLC (July 2002-December 2006); Managing Director and General Counsel of Morgan Stanley Investment Management (May 2000-June 2002). | |
Mary Ann Picciotto (39)
c/o Morgan Stanley Services Company Inc.
Harborside Financial Center 201 Plaza Two
Jersey City, NJ 07311 | | Chief Compliance Officer | | Since May 2010 | | Managing Director of the Adviser and various entities affiliated with the Adviser; Chief Compliance Officer of various Morgan Stanley Funds (since May 2010); Chief Compliance Officer of the Adviser (since April 2007). | |
Stefanie V. Chang Yu (45) 522 Fifth Avenue
New York, NY 10036 | | Vice President | | Since December 1997 | | Managing Director of the Adviser and various entities affiliated with the Adviser; Vice President of various Morgan Stanley Funds (since December 1997). | |
Francis J. Smith (46)
c/o Morgan Stanley Services Company Inc.
Harborside Financial Center 201 Plaza Two
Jersey City, NJ 07311 | | Treasurer and Principal Financial Officer | | Treasurer since July 2003 and Principal Financial Officer since September 2002 | | Executive Director of the Adviser and various entities affiliated with the Adviser; Treasurer and Principal Financial Officer of various Morgan Stanley Funds (since July 2003). | |
Mary E. Mullin (45)
522 Fifth Avenue
New York, NY 10036 | | Secretary | | Since June 1999 | | Executive Director of the Adviser and various entities affiliated with the Adviser; Secretary of various Morgan Stanley Funds (since June 1999). | |
(1) Each Officer serves an indefinite term, until his or her successor is elected.
In addition, the following individuals who are officers of the Adviser or its affiliates serve as assistant secretaries of the Fund: Joanne Antico, Joseph C. Benedetti, Daniel E. Burton, Tara A. Farrelly and Edward J. Meehan.
59
For each Director, the dollar range of equity securities beneficially owned by the Director in the Fund and in the Family of Investment Companies (Family of Investment Companies includes all of the registered investment companies advised by the Adviser and Morgan Stanley AIP GP LP) for the calendar year ended December 31, 2011, is set forth in the table below.
Name of Director | | Dollar Range of
Equity Securities
in the Fund
(As of December 31, 2011) | | Aggregate Dollar Range of
Equity Securities
in All Registered
Investment Companies
Overseen by Director in
Family of Investment
Companies (As of
December 31, 2011) | |
Independent: | |
Frank L. Bowman(1) | | | none | | | over $100,000 | |
Michael Bozic | | | none | | | over $100,000 | |
Kathleen A. Dennis | | | none | | | over $100,000 | |
Manuel H. Johnson | | | none | | | over $100,000 | |
Joseph J. Kearns(1) | | | none | | | over $100,000 | |
Michael F. Klein | | | none | | | over $100,000 | |
Michael E. Nugent | | | none | | | over $100,000 | |
W. Allen Reed(1) | | | none | | | over $100,000 | |
Fergus Reid(1) | | | none | | | over $100,000 | |
Interested: | |
James F. Higgins | | | none | | | over $100,000 | |
(1) Includes the total amount of compensation deferred by the Director at his election pursuant to a deferred compensation plan. Such deferred compensation is placed in a deferral account and deemed to be invested in one or more of the Morgan Stanley Funds (or portfolio thereof) that are offered as investment options under the plan.
As to each Independent Director and his or her immediate family members, no person owned beneficially or of record securities in an investment adviser or principal underwriter of the Fund, or a person (other than a registered investment company) directly or indirectly controlling, controlled by or under common control with an investment adviser or principal underwriter of the Fund.
As of April 1, 2012, the Directors and officers of the Fund, as a group, owned less than 1% of the outstanding common stock of each Portfolio of the Fund.
Independent Directors and the Committees
Law and regulation establish both general guidelines and specific duties for the Independent Directors. The Board has four committees: (1) Audit Committee, (2) Governance Committee, (3) Compliance and Insurance Committee and (4) Investment Committee. Three of the Independent Directors serve as members of the Audit Committee, three Independent Directors serve as members of the Governance Committee, four Directors, including three Independent Directors, serve as members of the Compliance and Insurance Committee and all of the Directors serve as members of the Investment Committee.
The Independent Directors are charged with recommending to the full Board approval of management, advisory and administration contracts, Rule 12b-1 plans and distribution and underwriting agreements; continually reviewing fund performance; checking on the pricing of portfolio securities, brokerage commissions, transfer agent costs and performance and trading among funds in the same complex; and approving fidelity bond and related insurance coverage and allocations, as well as other matters that arise from time to time. The Independent Directors are required to select and nominate individuals to fill any Independent Director vacancy on the board of any fund that has a Rule 12b-1 plan of distribution.
The Board of Directors has a separately-designated standing Audit Committee established in accordance with Section 3(a)(58)(A) of the Securities Exchange Act of 1934, as amended. The Audit Committee is charged with recommending to the full Board the engagement or discharge of the Fund's independent registered public
60
accounting firm; directing investigations into matters within the scope of the independent registered public accounting firm's duties, including the power to retain outside specialists; reviewing with the independent registered public accounting firm the audit plan and results of the auditing engagement; approving professional services provided by the independent registered public accounting firm and other accounting firms prior to the performance of the services; reviewing the independence of the independent registered public accounting firm; considering the range of audit and non-audit fees; reviewing the adequacy of the Fund's system of internal controls; and reviewing the valuation process. The Fund has adopted a formal, written Audit Committee Charter.
The members of the Audit Committee of the Fund are Joseph J. Kearns, Michael E. Nugent and W. Allen Reed. None of the members of the Fund's Audit Committee is an "interested person," as defined under the 1940 Act, of the Fund (with such disinterested Directors being "Independent Directors" or individually, "Independent Director"). Each Independent Director is also "independent" from the Fund under the listing standards of the NYSE. The Chairperson of the Audit Committee of the Fund is Joseph J. Kearns.
The Board of Directors of the Fund also has a Governance Committee. The Governance Committee identifies individuals qualified to serve as Independent Directors on the Fund's Board and on committees of such Board and recommends such qualified individuals for nomination by the Fund's Independent Directors as candidates for election as Independent Directors, advises the Fund's Board with respect to Board composition, procedures and committees, develops and recommends to the Fund's Board a set of corporate governance principles applicable to the Fund, monitors and makes recommendations on corporate governance matters and policies and procedures of the Fund's Board of Directors and any Board committees and oversees periodic evaluations of the Fund's Board and its committees. The members of the Governance Committee of the Fund are Kathleen A. Dennis, Michael F. Klein and Fergus Reid, each of whom is an Independent Director. The Chairperson of the Governance Committee is Fergus Reid.
The Fund does not have a separate nominating committee. While the Fund's Governance Committee recommends qualified candidates for nominations as Independent Directors, the Board of Directors of the Fund believes that the task of nominating prospective Independent Directors is important enough to require the participation of all current Independent Directors, rather than a separate committee consisting of only certain Independent Directors. Accordingly, each Independent Director (Frank L. Bowman, Michael Bozic, Kathleen A. Dennis, Manuel H. Johnson, Joseph J. Kearns, Michael F. Klein, Michael E. Nugent, W. Allen Reed and Fergus Reid) participates in the election and nomination of candidates for election as Independent Directors for the Fund. Persons recommended by the Fund's Governance Committee as candidates for nomination as Independent Directors shall possess such experience, qualifications, attributes, skills and diversity so as to enhance the Board's ability to manage and direct the affairs and business of the Fund, including, when applicable, to enhance the ability of committees of the Board to fulfill their duties and/or to satisfy any independence requirements imposed by law, regulation or any listing requirements of the NYSE. While the Independent Directors of the Fund expect to be able to continue to identify from their own resources an ample number of qualified candidates for the Fund's Board as they deem appropriate, they will consider nominations from shareholders to the Board. Nominations from shareholders should be in writing and sent to the Independent Directors as described below under the caption "Shareholder Communications."
The Board formed the Compliance and Insurance Committee to address insurance coverage and oversee the compliance function for the Fund and the Board. The Compliance and Insurance Committee consists of Frank L. Bowman, Michael Bozic, James F. Higgins and Manuel H. Johnson. Frank L. Bowman, Michael Bozic and Manuel H. Johnson are Independent Directors. The Chairperson of the Compliance and Insurance Committee is Michael Bozic. The Compliance and Insurance Committee has an Insurance Sub-Committee to review and monitor the insurance coverage maintained by the Fund. The Chairperson of the Insurance Sub-Committee is Frank L. Bowman.
61
The Investment Committee oversees the portfolio investment process for and reviews the performance of the Fund. The Investment Committee also recommends to the Board to approve or renew the Fund's Investment Advisory, Sub-Advisory and Administration Agreements. The members of the Investment Committee are Frank L. Bowman, Michael Bozic, Kathleen A. Dennis, James F. Higgins, Manuel H. Johnson, Joseph J. Kearns, Michael F. Klein, Michael E. Nugent, W. Allen Reed and Fergus Reid. The Chairperson of the Investment Committee is Manuel H. Johnson.
The Investment Committee has three Sub-Committees, each with its own Chairperson. Each Sub-Committee focuses on the portfolios' primary areas of investment, namely equities, fixed income and alternatives. The Sub-Committees and their members are as follows:
(1) Equity — W. Allen Reed (Chairperson), Frank L. Bowman and Michael E. Nugent.
(2) Fixed Income — Michael F. Klein (Chairperson), Michael Bozic and Fergus Reid.
(3) Money Market and Alternatives — Kathleen A. Dennis (Chairperson), James F. Higgins and Joseph J. Kearns.
During the fiscal year ended December 31, 2011, the Board of Directors held the following meetings:
Board of Directors | | | 8 | | |
Committee/Sub-Committee: | | Number of meetings: | |
Audit Committee | | | 4 | | |
Governance Committee | | | 4 | | |
Compliance and Insurance Committee | | | 4 | | |
Insurance Sub-Committee | | | 1 | | |
Investment Committee | | | 5 | | |
Equity Sub-Committee | | | 5 | | |
Fixed Income Sub-Committee | | | 5 | | |
Money Market and Alternatives Sub-Committee | | | 5 | | |
Experience, Qualifications and Attributes
The Board has concluded, based on each Director's experience, qualifications and attributes that each Board member should serve as a Director. Following is a brief summary of the information that led to this conclusion.
Mr. Bowman has experience in a variety of business and financial matters through his prior service as a Director or Trustee for various other funds in the Fund Complex, where he serves as Chairperson of the Insurance Sub-Committee of the Compliance and Insurance Committee, and as a Director of B.P. p.l.c. and Naval and Nuclear Technologies LLP. Mr. Bowman also serves as a Director for the Armed Services YMCA of the USA, the Naval Submarine League and the American Shipbuilding Suppliers Association. Mr. Bowman is also a member of the National Securities Advisory Council of the Center U.S. Global Engagement and a member of the CNA Military Advisory Board. Mr. Bowman retired as an Admiral in the U.S. Navy after serving over 38 years on active duty including 8 years as Director of the Naval Nuclear Propulsion Program in the Department of the Navy and the U.S. Department of Energy (1996-2004). Additionally, Mr. Bowman served as the U.S. Navy's Chief of Naval Personnel where he was responsible for the planning and programming of all manpower, personnel, training and education resources for the U.S. Navy, and on the Joint Staff as Director of Political Military Affairs (1992-1994). In addition, Mr. Bowman served as President and Chief Executive Officer of the Nuclear Energy Institute. Mr. Bowman has received such distinctions as a knighthood as Honorary Knight Commander of the Most Excellent Order of the British Empire and the Officer de l'Orde National du Mérite from the French Government and was elected to the National Academy of Engineering (2009). He is President of the consulting firm Strategic Decisions, LLC.
62
With over 20 years of experience on the boards and in senior management of such companies as Kmart Corporation, Levitz Furniture Corporation, Hills Department Stores and Sears Merchandise Group of Sears, Roebuck & Co., where Mr. Bozic also served as Chief Financial Officer of the Merchandise Group, and with over 15 years of experience as a Director or Trustee of certain other funds in the Fund Complex, Mr. Bozic has experience with a variety of financial, management, regulatory and operational issues as well as experience with marketing and distribution. Mr. Bozic has served as the Chairperson of the Compliance and Insurance Committee since 2006.
Ms. Dennis has over 25 years of business experience in the financial services industry and related fields including serving as a Director or Trustee of various other funds in the Fund Complex, where she serves as Chairperson of the Money Market and Alternatives Sub-Committee of the Investment Committee. Ms. Dennis possesses a strong understanding of the regulatory framework under which investment companies must operate based on her years of service to this Board and her position as Senior Managing Director of Victory Capital Management.
In addition to his tenure as a Director or Trustee of various other funds in the Fund Complex, where he formerly served as Chairperson of the Audit Committee, Dr. Johnson has also served as an officer or a board member of numerous companies for nearly 20 years. These positions included Co-Chairman and a founder of the Group of Seven Council, Director of NVR, Inc., Director of Evergreen Energy and Director of Greenwich Capital Holdings. He also has served as Vice Chairman of the Board of Governors of the Federal Reserve System and Assistant Secretary of the U.S. Treasury. In addition, Dr. Johnson also served as Chairman of the Financial Accounting Foundation, which oversees the Financial Accounting Standards Board, for seven years.
Mr. Kearns gained extensive experience regarding accounting through his experience on the Audit Committees of the boards of other funds in the Funds Complex, including serving as either Chairperson or Deputy Chairperson of the Audit Committee for fourteen years, and through his position as Chief Financial Officer of the J. Paul Getty Trust. He also has experience in financial, accounting, investment and regulatory matters through his position as President and founder of Kearns & Associates LLC, a financial consulting company. Mr. Kearns also serves as a Director of Electro Rent Corporation and The Ford Family Foundation. The Board has determined that Mr. Kearns is an "audit committee financial expert" as defined by the SEC.
Through his prior positions as Managing Director of Morgan Stanley & Co. Inc. and Morgan Stanley Dean Witter Investment Management and as President of Morgan Stanley Institutional Funds, Mr. Klein has experience in the management and operation of registered investment companies, enabling him to provide management input and investment guidance to the Board. Mr. Klein also has extensive experience in the investment management industry based on his current positions as Managing Director of Aetos Capital, LLC and as Director of certain investment funds managed or sponsored by Aetos Capital, LLC. In addition, he also has experience as a member of the board of other funds in the Fund Complex.
Mr. Nugent has extensive experience with financial, accounting, investment and regulatory matters through his almost 20 years of service on the boards of various funds in the Fund Complex, including time as the Chairperson of the Insurance Committee and Chairman of the Morgan Stanley Funds. Mr. Nugent also has experience as a General Partner in Triumph Capital, L.P.
Mr. Reed has experience on investment company boards and is experienced with financial, accounting, investment and regulatory matters through his prior service as a Director of iShares, Inc. and his service as Trustee and Director of other funds in the Fund Complex. Mr. Reed also gained substantial experience in the financial services industry through his position as Director of Legg Mason, Inc. and prior position as President and CEO of General Motors Asset Management.
63
Mr. Reid has served on a number of mutual fund boards, including as a Trustee and Director of certain investment companies in the JPMorgan Funds complex and as a Director or Trustee of other funds in the Fund Complex. Therefore, Mr. Reid is experienced with financial, accounting, investment and regulatory matters, enabling him to provide management input and investment guidance to the Board.
Mr. Higgins has over 30 years of experience in the financial services industry. Mr. Higgins has substantial mutual fund experience and is experienced with financial, accounting, investment and regulatory matters due to his experience on the boards of other funds in the Fund Complex. Mr. Higgins also serves on the boards of other companies in the financial services industry, including AXA Financial, Inc. and The Equitable Life Assurance Society of the United States.
The Directors' principal occupations during the past five years or more are shown in the above tables.
Advantages of Having the Same Individuals as Independent Directors for the Morgan Stanley Funds
The Independent Directors and the Fund's management believe that having the same Independent Directors for each of the Morgan Stanley Funds avoids the duplication of effort that would arise from having different groups of individuals serving as Independent Directors for each of the funds or even of sub-groups of funds. They believe that having the same individuals serve as Independent Directors of all the Morgan Stanley Funds tends to increase their knowledge and expertise regarding matters which affect the Fund Complex generally and enhances their ability to negotiate on behalf of each fund with the fund's service providers. This arrangement also precludes the possibility of separate groups of Independent Directors arriving at conflicting decisions regarding operations and management of the funds and avoids the cost and confusion that would likely ensue. Finally, having the same Independent Directors serve on all fund boards enhances the ability of each fund to obtain, at modest cost to each separate fund, the services of Independent Directors of the caliber, experience and business acumen of the individuals who serve as Independent Directors of the Morgan Stanley Funds.
Shareholder Communications
Shareholders may send communications to the Fund's Board of Directors. Shareholders should send communications intended for the Fund's Board by addressing the communications directly to the Board (or individual Board members) and/or otherwise clearly indicating in the salutation that the communication is for the Board (or individual Board members) and by sending the communication to either the Fund's office or directly to such Board member(s) at the address specified for each Director previously noted. Other shareholder communications received by the Fund not directly addressed and sent to the Board will be reviewed and generally responded to by management, and will be forwarded to the Board only at management's discretion based on the matters contained therein.
Compensation of Directors and Officers
Each Director (except for the Chairperson of the Boards) receives an annual retainer fee of $210,000 for serving as a Director of the Morgan Stanley Funds.
The Chairperson of the Audit Committee receives an additional annual retainer fee of $78,750 and the Investment Committee Chairperson receives an additional annual retainer fee of $63,000. Other Committee and, effective January 1, 2012, Sub-Committee Chairpersons receive an additional annual retainer fee of $31,500. Prior to January 1, 2012, each Sub-Committee Chairpersons received an additional annual retainer fee of $15,750. The aggregate compensation paid to each Director is paid by the Morgan Stanley Funds, and is allocated on a pro rata basis among each of the operational funds/ portfolios of the Morgan Stanley Funds based on the relative net assets of each of the funds/ portfolios. Michael E. Nugent receives a total annual
64
retainer fee of $420,000 for his services as Chairperson of the Boards of the Morgan Stanley Funds and for administrative services provided to each Board.
The Fund also reimburses such Directors for travel and other out-of-pocket expenses incurred by them in connection with attending such meetings. Directors of the Fund who are employed by the Adviser receive no compensation or expense reimbursement from the Fund for their services as Director.
Effective April 1, 2004, the Fund began a Deferred Compensation Plan (the "DC Plan"), which allows each Director to defer payment of all, or a portion, of the fees he or she receives for serving on the Board of Directors throughout the year. Each eligible Director generally may elect to have the deferred amounts credited with a return equal to the total return on one or more of the Morgan Stanley Funds (or portfolios thereof) that are offered as investment options under the DC Plan. At the Director's election, distributions are either in one lump sum payment, or in the form of equal annual installments over a period of five years. The rights of an eligible Director and the beneficiaries to the amounts held under the DC Plan are unsecured and such amounts are subject to the claims of the creditors of the Fund.
Prior to April 1, 2004, certain Morgan Stanley Funds maintained a similar Deferred Compensation Plan (the "Prior DC Plan"), which also allowed each Independent Director to defer payment of all, or a portion, of the fees he or she received for serving on the Board of Directors throughout the year. Generally, the DC Plan amends and supersedes the Prior DC Plan and all amounts payable under the Prior DC Plan are now subject to the terms of the DC Plan (except for amounts paid during the calendar year 2004, which remain subject to the terms of the Prior DC Plan).
The following table shows aggregate compensation payable to each of the Fund's Directors from the Fund for the fiscal year ended December 31, 2011 and the aggregate compensation payable to each of the Fund's Directors by the Fund Complex (which includes all of the Morgan Stanley Funds) for the calendar year ended December 31, 2011.
COMPENSATION(1)
Name of Independent Director: | | Aggregate Compensation
from the Fund(2) | | Total Compensation
from Fund and Fund
Complex Paid to Director(3) | |
Frank L. Bowman | | $ | 6,652 | | | $ | 225,750 | | |
Michael Bozic | | $ | 7,015 | | | $ | 241,500 | | |
Kathleen A. Dennis | | $ | 6,652 | | | $ | 225,750 | | |
Dr. Manuel H. Johnson | | $ | 7,930 | | | $ | 273,000 | | |
Joseph J. Kearns | | $ | 8,386 | | | $ | 306,750 | | |
Michael F. Klein | | $ | 6,652 | | | $ | 225,750 | | |
Michael Nugent | | $ | 12,198 | | | $ | 420,000 | | |
W. Allen Reed(2) | | $ | 6,651 | | | $ | 225,750 | | |
Fergus Reid | | $ | 7,015 | | | $ | 259,500 | | |
Name of Interested Director: | |
James F. Higgins | | $ | 6,104 | | | $ | 210,000 | | |
(1) Includes all amounts paid for serving as director/trustee of the funds, as well as serving as Chairperson of the Boards or a Chairperson of a Committee or Sub-Committee.
(2) The amounts shown in this column represent the aggregate compensation before deferral with respect to the Fund's fiscal year. The following Directors deferred compensation from the Fund during the fiscal year ended December 31, 2011: Mr. Kearns, $3,103, Mr. Reed, $6,651.
(3) The amounts shown in this column represent the aggregate compensation paid by all of the funds in the Fund Complex as of December 31, 2011 before deferral by the Directors under the DC Plan. As of December 31, 2011, the value (including interest) of the deferral accounts across the Fund Complex for Messrs. Kearns, Reed and Reid pursuant to the deferred compensation plan was $532,157, $674,903 and $523,935, respectively. Because the funds in the Fund Complex have different fiscal year ends, the amounts shown in this column are presented on a calendar year basis.
65
Prior to December 31, 2003, 49 of the Morgan Stanley Funds (the "Adopting Funds"), not including the Fund, had adopted a retirement program under which an Independent Director who retired after serving for at least five years as an Independent Director of any such fund (an "Eligible Director") would have been entitled to retirement payments, based on factors such as length of service, upon reaching the eligible retirement age. On December 31, 2003, the amount of accrued retirement benefits for each Eligible Director was frozen, and will be payable, together with a return of 8% per annum, at or following each such Eligible Director's retirement as shown in the table below.
The following table illustrates the retirement benefits accrued to the Fund's Independent Directors by the Adopting Funds for the calendar year ended December 31, 2011, and the estimated retirement benefits for the Independent Directors from the Adopting Funds for each calendar year following retirement. Only the Directors listed below participated in the retirement program.
Name of Independent Director: | | Retirement Benefits
Accrued as Fund Expenses
By All Adopting Funds | | Estimated Annual
Benefits Upon Retirement(1)
From All Adopting Funds | |
Michael Bozic | | $ | 42,107 | | | $ | 43,940 | | |
Manuel H. Johnson | | $ | 30,210 | | | $ | 64,338 | | |
Michael E. Nugent | | $ | 6,805 | | | $ | 57,539 | | |
(1) Total compensation accrued under the retirement plan, together with a return of 8% per annum, will be paid annually commencing upon retirement and continuing for the remainder of the Director's life.
Code of Ethics
Pursuant to Rule 17j-1 under the 1940 Act, the Board of Directors has adopted a Code of Ethics for the Fund and approved Codes of Ethics adopted by the Adviser, the Sub-Advisers and Morgan Stanley Distribution, Inc. ("Morgan Stanley Distribution" or the "Distributor") (collectively the "Codes"). The Codes are intended to ensure that the interests of shareholders and other clients are placed ahead of any personal interest, that no undue personal benefit is obtained from the person's employment activities and that actual and potential conflicts of interest are avoided.
The Codes are designed to detect and prevent improper personal trading. The Codes permit personnel subject to the Codes to invest in securities, including securities that may be purchased, sold or held by the Fund, subject to a number of restrictions and controls, including prohibitions against purchases of securities in an initial public offering and a pre-clearance requirement with respect to personal securities transactions.
INVESTMENT ADVISORY, SUB-ADVISORY,
DISTRIBUTION AND ADMINISTRATIVE AGREEMENTS
The Adviser is a wholly owned subsidiary of Morgan Stanley. The principal offices of Morgan Stanley are located at 1585 Broadway, New York, NY 10036 and the principal offices of the Adviser are located at 522 Fifth Avenue, New York, NY 10036.
Pursuant to an investment advisory agreement, the Adviser receives compensation for providing investment advisory services in the amounts described below. In managing the Portfolios, the Adviser may use the services of associated investment personnel employed by its affiliated institutional asset management companies.
Advisory Fees
The Adviser is entitled to receive an advisory fee at an annual percentage of a Portfolio's average daily net assets. The Adviser has agreed to a reduction in the fees payable to them and/or to reimburse the Portfolios, if necessary, if such fees would cause the total annual operating expenses of each Portfolio to exceed the percentage of average daily net assets set forth in each Portfolio's prospectus. In determining the actual amount of fee
66
waiver and/or expense reimbursement for a Portfolio, if any, the Adviser excludes from annual operating expenses certain investment related expenses, such as foreign country tax expense and interest expense on amounts borrowed. The fee waivers and/or expense reimbursements will continue for at least one year or until such time as the Fund's Board of Directors acts to discontinue all or a portion of such waivers and/or reimbursements when it deems such action is appropriate. The following table shows (i) the contractual advisory fee as a percentage of average daily net assets at certain levels of average daily net assets; and (ii) each Portfolio's expense cap for the fiscal year ended December 31, 2011 (unless otherwise noted).
Portfolio | | Contractual Advisory Fee | | Expense Cap
Class I | | Expense Cap
Class II | |
Core Plus Fixed Income | | 0.375% of the portion of the daily net assets not exceeding $1 billion; and 0.30% of the portion of the daily net assets exceeding $1 billion. | | | 0.70 | % | | | 0.95 | % | |
Emerging Markets Debt | | 0.75% of the portion of the daily net assets not exceeding $500 million; 0.70% of the portion of the daily net assets exceeding $500 million but not exceeding $1 billion; and 0.65% of the portion of the daily net assets exceeding $1 billion. | | | 1.30 | % | | | 1.35 | % | |
Emerging Markets Equity | | 1.25% of the portion of the daily net assets not exceeding $500 million; 1.20% of the portion of the daily net assets exceeding $500 million but not exceeding $1 billion; 1.15% of the portion of the daily net assets exceeding $1 billion but not exceeding $2.5 billion; and 1.00% of the daily net assets exceeding $2.5 billion. | | | 1.42 | %* | | | 1.47 | %* | |
Global Franchise | | 0.80% of the portion of the daily net assets not exceeding $500 million; 0.75% of the portion of the daily net assets exceeding $500 million but not exceeding $1 billion; and 0.70% of the portion of the daily net assets exceeding $1 billion. | | | N/A | | | | 1.20 | % | |
Global Real Estate | | 0.85% of the daily net assets. | | | N/A | | | | 1.40 | % | |
Global Tactical Asset Allocation | | 0.75% of the portion of the daily net assets not exceeding $500 million; 0.70% of the portion of the daily net assets exceeding $500 million but not exceeding $1 billion; and 0.65% of the portion of the daily net assets exceeding $1 billion. | | | 1.00 | % | | | 1.10 | % | |
67
Portfolio | | Contractual Advisory Fee | | Expense Cap
Class I | | Expense Cap
Class II | |
Growth | | 0.50% of the portion of the daily net assets not exceeding $1 billion; 0.45% of the portion of the daily net assets exceeding $1 billion but not exceeding $2 billion; 0.40% of the portion of the daily net assets exceeding $2 billion but not exceeding $3 billion; and 0.35% of the daily net assets exceeding $3 billion. | | | 0.85 | % | | | 1.10 | % | |
Mid Cap Growth | | 0.75% of the portion of the daily net assets not exceeding $500 million; 0.70% of the portion of the daily net assets exceeding $500 million but not exceeding $1 billion; and 0.65% of the portion of the daily net assets exceeding $1 billion. | | | 1.05 | % | | | 1.15 | % | |
Small Company Growth | | 0.92% of the portion of the daily net assets not exceeding $1 billion; 0.85% of the portion of the daily net assets exceeding $1 billion but not exceeding $1.5 billion; and 0.80% of the portion of the daily net assets exceeding $1.5 billion. | | | N/A | | | | 1.25 | % | |
U.S. Real Estate | | 0.80% of the portion of the daily net assets not exceeding $500 million; 0.75% of the portion of the daily net assets exceeding $500 million but not exceeding $1 billion; and 0.70% of the portion of the daily net assets exceeding $1 billion. | | | 1.10 | % | | | 1.35 | % | |
N/A = Not Applicable
* As of December 31, 2011, the expense caps for the Emerging Markets Equity Portfolio were 1.55% and 1.60% for Class I and Class II shares, respectively. These caps were reduced to 1.42% and 1.47% for Class I and Class II shares, respectively, effective March 1, 2012.
The following table reflects for each Portfolio (i) the advisory fee paid; and (ii) the advisory fee waived and/or rebated from affiliated transactions for each of the past three fiscal years ended December 31, 2009, 2010 and 2011.
| | | Advisory Fees Paid
(After Fee Waivers
and/or Rebate from
Affiliated Transactions) | | Advisory Fees Waived | | Rebate from
Affiliated Transactions | |
Portfolio | | 2009
(000) | | 2010
(000) | | 2011
(000) | | 2009
(000) | | 2010
(000) | | 2011
(000) | | 2009
(000) | | 2010
(000) | | 2011
(000) | |
Core Plus Fixed
Income Portfolio | | $ | 1,179 | | | $ | 660 | | | $ | 708 | | | $ | 88 | | | $ | 127 | | | | n/a | | | $ | 22 | | | $ | 11 | | | $ | 10 | | |
Emerging Markets
Debt Portfolio | | | 1,052 | | | | 1,532 | | | | 1,968 | | | | n/a | | | | n/a | | | | n/a | | | | 6 | | | | 14 | | | | 27 | | |
Emerging Markets
Equity Portfolio | | | 8,945 | | | | 12,373 | | | | 11,853 | | | | 127 | | | | 84 | | | $ | 362 | | | | 65 | | | | 89 | | | | 82 | | |
68
| | | Advisory Fees Paid
(After Fee Waivers
and/or Rebate from
Affiliated Transactions) | | Advisory Fees Waived | | Rebate from
Affiliated Transactions | |
Portfolio | | 2009
(000) | | 2010
(000) | | 2011
(000) | | 2009
(000) | | 2010
(000) | | 2011
(000) | | 2009
(000) | | 2010
(000) | | 2011
(000) | |
Global Franchise
Portfolio | | $ | 781 | | | $ | 812 | | | $ | 711 | | | | n/a | | | $ | 4 | | | $ | 35 | | | $ | 4 | | | $ | 3 | | | $ | 3 | | |
Global Real Estate
Portfolio | | | 2,516 | | | | 1,367 | | | | 604 | | | $ | 193 | | | | 257 | | | | 156 | | | | 14 | | | | 7 | | | | 2 | | |
Global Tactical Asset
Allocation Portfolio | | | 546 | | | | 338 | | | | 0 | | | | 143 | | | | 358 | | | | 553 | | | | 4 | | | | 17 | | | | 46 | | |
Growth Portfolio | | | 323 | | | | 427 | | | | 431 | | | | 43 | | | | 18 | | | | 27 | | | | 3 | | | | 2 | | | | 4 | | |
Mid Cap Growth
Portfolio | | | 1,405 | | | | 1,867 | | | | 2,240 | | | | 43 | | | | 35 | | | | 15 | | | | 13 | | | | 7 | | | | 6 | | |
Small Company
Growth Portfolio | | | 220 | | | | 190 | | | | 140 | | | | 44 | | | | 74 | | | | 96 | | | | 1 | | | | 1 | | | | 1 | | |
U.S. Real Estate
Portfolio | | | 4,019 | | | | 3,891 | | | | 3,840 | | | | 63 | | | | 74 | | | | n/a | | | | 17 | | | | 15 | | | | 12 | | |
Investment Sub-Advisers
The Adviser has entered into Sub-Advisory Agreements with Morgan Stanley Investment Management Limited ("MSIM Limited"), located at 25 Cabot Square, Canary Wharf, London, E14 4QA, England, and Morgan Stanley Investment Management Company ("MSIM Company"), located at 23 Church Street, 16-01 Capital Square, Singapore 049481. MSIM Limited and MSIM Company (each a "Sub-Adviser" and collectively, the "Sub-Advisers") are wholly owned subsidiaries of Morgan Stanley and provide the Portfolios listed below with investment advisory services subject to the overall supervision of the Adviser and the Portfolios' Officers and Directors.
The Adviser pays each Sub-Adviser on a monthly basis a portion of the net advisory fees the Adviser receives from the Portfolios. The chart below identifies the Portfolio(s) for which each Sub-Adviser provides investment advisory services.
Sub-Adviser | | Portfolio(s) | |
MSIM Limited | | Emerging Markets Equity, Global Franchise and Global Real Estate | |
MSIM Company | | Emerging Markets Equity, Global Franchise and Global Real Estate | |
Proxy Voting Policies and Procedures and Proxy Voting Record
The Board of Directors believes that the voting of proxies on securities held by the Fund is an important element of the overall investment process. As such, the Board has delegated the responsibility to vote such proxies to Morgan Stanley Investment Management and its advisory affiliates ("MSIM").
A copy of MSIM's Proxy Voting Policy ("Proxy Policy") is attached hereto as Appendix A. In addition, a copy of the Proxy Policy, as well as the Fund's most recent proxy voting record for the 12-month period ended June 30 as filed with the SEC, are available without charge on our web site at www.morganstanley.com. The Fund's proxy voting record is also available without charge on the SEC's web site at www.sec.gov.
69
Administration Fees
The Adviser also serves as Administrator to the Fund pursuant to an Amended and Restated Administration Agreement dated as of September 9, 1996 (the "Administration Agreement"). Under the Administration Agreement, the Adviser receives an annual fee, accrued daily and payable monthly, of 0.25% of the Fund's average daily net assets, and is responsible for all fees payable under any sub-administration agreements.
For the fiscal years ended December 31, 2009, 2010 and 2011, the Fund paid the following administrative fees (no administrative fees were waived):
| | | Administration Fees Paid | |
Portfolio | | 2009
(000) | | 2010
(000) | | 2011
(000) | |
Core Plus Fixed Income | | $ | 861 | | | $ | 532 | | | $ | 478 | | |
Emerging Markets Debt | | | 354 | | | | 515 | | | | 665 | | |
Emerging Markets Equity | | | 1,854 | | | | 2,565 | | | | 2,516 | | |
Global Franchise | | | 246 | | | | 256 | | | | 234 | | |
Global Real Estate | | | 803 | | | | 479 | | | | 224 | | |
Global Tactical Asset Allocation | | | 217 | | | | 222 | | | | 188 | | |
Growth | | | 185 | | | | 223 | | | | 231 | | |
Mid Cap Growth | | | 489 | | | | 636 | | | | 754 | | |
Small Company Growth | | | 73 | | | | 72 | | | | 64 | | |
U.S. Real Estate | | | 1,284 | | | | 1,246 | | | | 1,205 | | |
Sub-Administrator. Under an agreement between the Administrator and State Street Bank and Trust Company ("State Street"), State Street provides certain administrative services to the Fund. For such services, the Administrator pays State Street a portion of the administrative fee the Administrator receives from the Fund. The Administrator supervises and monitors the administrative and accounting services provided by State Street. Their services are also subject to the supervision of the officers and Board of Directors of the Fund. State Street's business address is One Lincoln Street, Boston, Massachusetts 02111-2101.
Distributor
Morgan Stanley Distribution, Inc. (which has the same address as the Adviser) is an indirect wholly owned subsidiary of Morgan Stanley and serves as the Fund's distributor pursuant to a distribution agreement.
DISTRIBUTION OF SHARES (APPLICABLE TO CLASS II SHARES ONLY)
The Fund has adopted a Distribution Plan (the "Plan") in accordance with the provisions of Rule 12b-1 under the 1940 Act, which regulates circumstances under which an investment company may directly or indirectly bear expenses relating to the distribution of its shares. The Plan authorizes the Class II shares of each Portfolio to pay Morgan Stanley Distribution a monthly 12b-1 fee at a rate of 0.35% of the Portfolio's average daily net assets attributable to Class II shares. Such amount shall be paid to compensate Morgan Stanley Distribution for remittance to insurance companies which offer the Fund as an investment option. These payments are intended to compensate insurance companies for distribution and/or administrative related expenses incurred or paid in connection with the distribution of Class II shares of the Portfolio. Morgan Stanley
70
Distribution may retain any portion of the fees it does not expend in meeting its obligations to the Fund. The Distributor has agreed to waive the following amounts of the 0.35% 12b-1 fees that it is entitled to receive:
Class II Portfolio | | Waiver | |
Core Plus Fixed Income | | | 0.10 | % | |
Emerging Markets Debt | | | 0.30 | % | |
Emerging Markets Equity | | | 0.30 | % | |
Global Franchise | | | 0.30 | % | |
Global Real Estate | | | 0.10 | % | |
Global Tactical Asset Allocation | | | 0.25 | % | |
Growth | | | 0.10 | % | |
Mid Cap Growth | | | 0.25 | % | |
Small Company Growth | | | 0.30 | % | |
U.S. Real Estate | | | 0.10 | % | |
These waivers will continue for at least one year or until such time as the Fund's Board of Directors acts to discontinue all or a portion of such waivers when it deems such action is appropriate.
Since the 12b-1 fees associated with the Plan are paid out of the Portfolio's assets on an on-going basis, over time these fees will increase the cost of your investment and may cost you more than paying other types of sales charges.
The following table describes the 12b-1 fees paid pursuant to the Plan (net of any waivers) by each active Class II Portfolio to various insurance companies for whose separate accounts the Portfolios are underlying investments for the fiscal year ended December 31, 2011.
Portfolio | | Total Distribution (12b-1)
Fees Paid by Portfolio
(Net of Waivers) | | Amount Waived | |
Core Plus Fixed Income | | $ | 121,893 | | | $ | 48,757 | | |
Emerging Markets Debt | | | 15,603 | | | | 93,617 | | |
Emerging Markets Equity | | | 216,115 | | | | 1,296,690 | | |
Global Franchise | | | 46,786 | | | | 280,715 | | |
Global Real Estate | | | 223,980 | | | | 89,592 | | |
Global Tactical Asset Allocation | | | 38 | | | | 95 | | |
Growth | | | 79,378 | | | | 31,751 | | |
Mid Cap Growth | | | 228,183 | | | | 570,458 | | |
Small Company Growth | | | 12,856 | | | | 77,137 | | |
U.S. Real Estate | | | 479,528 | | | | 191,811 | | |
Continuance of the Plan must be approved annually by a majority of the Directors of the Fund, including a majority of the Independent Directors. All material amendments of the Plan will require approval by a majority of the Directors of the Fund, including a majority of the Independent Directors. The Plan was approved by the Fund's Board of Directors, including the Independent Directors, none of whom has a direct or indirect financial interest in the operation of a Plan or in any agreements related thereto.
Revenue Sharing
The Adviser and/or the Distributor may pay compensation, out of their own funds and not as an additional charge to the Portfolios, to certain insurance companies or their affiliates, broker-dealers and/or other financial intermediaries ("Intermediaries") in connection with the sale, distribution, marketing and retention of shares of the Portfolios and/or shareholder servicing. For example, the Adviser or the Distributor may pay additional
71
compensation to Intermediaries for, among other things, promoting the sale and distribution of Portfolio shares, furnishing marketing support, maintaining share balances and/or for sub-accounting, recordkeeping, administrative, shareholder or transaction processing services. Such payments are in addition to any distribution or shareholder servicing fees that may be payable by the Distributor. The additional payments may be based on various factors, including amount of assets invested by the Intermediary's customers, a Portfolio's advisory fees, some other agreed upon amount, or other measures as determined from time to time by the Adviser or Distributor (e.g. gross sales or number of accounts). The amount of these payments may be different for different Intermediaries.
The additional payments currently made to certain Intermediaries, which are made in accordance with the applicable compensation structure for each Intermediary, include an ongoing annual fee in an amount up to 0.45% of the total average daily NAV of shares of the Portfolios held in such Intermediaries' applicable accounts.
The prospect of receiving, or the receipt of, additional compensation, as described above, by Intermediaries may provide Intermediaries and/or their financial advisors or other salespersons with an incentive to favor sales of shares of the Portfolios over other investment options with respect to which an Intermediary does not receive additional compensation (or receives lower levels of additional compensation) or be a factor in an insurance company's decision to include the Portfolio as an underlying investment option in its variable insurance products. These payment arrangements, however, will not change the price that an investor pays for shares of a Portfolio or the amount that a Portfolio receives to invest on behalf of an investor. Investors may wish to take such payment arrangements into account when considering and evaluating any recommendations relating to Portfolio shares and should review carefully any disclosure provided by an Intermediary as to its compensation.
PORTFOLIO MANAGERS
Other Accounts Managed by the Portfolio Managers. Because the portfolio managers manage assets for other investment companies, pooled investment vehicles, and/or other accounts (including institutional clients, pension plans and certain high net worth individuals), there may be an incentive to favor one client over another resulting in conflicts of interest. For instance, the Adviser and/or Sub-Advisers may receive fees from certain accounts that are higher than the fee it receives from the Fund, or it may receive a performance-based fee on certain accounts. In those instances, the portfolio managers may have an incentive to favor the higher and/or performance-based fee accounts over the Fund. In addition, a conflict of interest could exist to the extent the Adviser and/or Sub-Advisers have proprietary investments in certain accounts, where portfolio managers have personal investments in certain accounts or when certain accounts are investment options in the Adviser's and/or Sub-Advisers' employee benefits and/or deferred compensation plans. The portfolio manager may have an incentive to favor these accounts over others. If the Adviser and/or Sub-Advisers manage accounts that engage in short sales of securities of the type in which the Fund invests, the Adviser and/or Sub-Advisers could be seen as harming the performance of the Fund for the benefit of the accounts engaging in short sales if the short sales cause the market value of the securities to fall. The Adviser and/or Sub-Advisers have adopted trade allocation and other policies and procedures that it believes are reasonably designed to address these and other conflicts of interest.
Portfolio Manager Compensation Structure
Portfolio managers receive a combination of base compensation and discretionary compensation, comprising a cash bonus and several deferred compensation programs described below. The methodology used to determine portfolio manager compensation is applied across all funds/accounts managed by the portfolio manager.
Base salary compensation. Generally, portfolio managers receive base salary compensation based on the level of their position with the Adviser and/or Sub-Advisers.
72
Discretionary compensation. In addition to base compensation, portfolio managers may receive discretionary compensation. Discretionary compensation can include:
• Cash Bonus.
• Morgan Stanley's Long Term Incentive Compensation awards — a mandatory program that defers a portion of discretionary year-end compensation into restricted stock units or other awards based on Morgan Stanley common stock or other plans that are subject to vesting and other conditions. All long-term incentive compensation awards are subject to clawback provisions where awards can be cancelled if an employee takes any action, or omits to take any action, which causes a restatement of Morgan Stanley's consolidated financial results, or constitutes a violation of Morgan Stanley's risk policies and standards.
• Investment Management Alignment Plan (IMAP) awards — a mandatory program that defers a portion of discretionary year-end compensation and notionally invests it in designated funds advised by the Adviser and/or Sub Advisers or their affiliates. The award is subject to vesting and other conditions. Portfolio managers must notionally invest a minimum of 25% to a maximum of 100% of their IMAP deferral account into a combination of the designated funds they manage that are included in the IMAP fund menu, which may or may not include the Fund. In addition to the clawbacks listed above for long term incentive compensation awards, the provision on IMAP awards is further strengthened such that it may also be triggered if an employee's actions cause substantial financial loss on a trading strategy, investment, commitment or other holding provided that previous gains on those positions were relevant to the employees' prior year compensation decisions.
• Voluntary Deferred Compensation Plans — voluntary programs that permit certain employees to elect to defer a portion of their discretionary year-end compensation and notionally invest the deferred amount across a range of designated investment funds, which may include funds advised by the Adviser and/or Sub-Advisers or their affiliates.
Several factors determine discretionary compensation, which can vary by portfolio management team and circumstances. These factors may include:
• Revenues generated by the investment companies, pooled investment vehicles and other accounts managed by the portfolio manager.
• The investment performance of the funds/accounts managed by the portfolio manager.
• Contribution to the business objectives of the Adviser and/or Sub-Advisers.
• The dollar amount of assets managed by the portfolio manager.
• Market compensation survey research by independent third parties.
• Other qualitative factors, such as contributions to client objectives.
• Performance of Morgan Stanley and Morgan Stanley Investment Management, and the overall performance of the investment team(s) of which the portfolio manager is a member.
73
Other Accounts Managed by Portfolio Managers at December 31, 2011 (unless otherwise indicated):
| | | Registered Investment
Companies | | Other Pooled Investment
Vehicles | | Other Accounts | |
Portfolio and Portfolio Managers | | Number
of
Accounts | | Total Assets
in the
Accounts | | Number
of
Accounts | | Total Assets
in the
Accounts | | Number
of
Accounts | | Total Assets
in the
Accounts | |
Growth, Mid Cap Growth,
Small Company Growth | |
Sam G. Chainani | | | 35 | | | $17.3 billion | | | 4 | | | $3.8 billion | | | 13 | | | $1.2 billion | |
David S. Cohen | | | 35 | | | 17.3 billion | | | 4 | | | 3.8 billion | | | 13 | | | 1.2 billion | |
Dennis P. Lynch | | | 35 | | | 17.3 billion | | | 4 | | | 3.8 billion | | | 13 | | | 1.2 billion | |
Armistead B. Nash | | | 35 | | | 17.3 billion | | | 4 | | | 3.8 billion | | | 13 | | | 1.2 billion | |
Alexander T. Norton | | | 35 | | | 17.3 billion | | | 4 | | | 3.8 billion | | | 13 | | | 1.2 billion | |
Jason C. Yeung | | | 35 | | | 17.3 billion | | | 4 | | | 3.8 billion | | | 13 | | | 1.2 billion | |
Core Plus Fixed Income | |
Jaidip Singh | | | 8 | | | $1.8 billion | | | 0 | | | $0 | | | 19 | (1) | | $6.5 billion(1) | |
Neil Stone | | | 7 | | | 785.8 million | | | 0 | | | 0 | | | 61 | (1) | | 12.5 billion(1) | |
Emerging Markets Debt | |
Eric J. Baurmeister | | | 6 | | | $2.4 billion | | | 13 | | | $1.7 billion | | | 13 | (2) | | $4.4 billion(2) | |
Federico L. Kaune | | | 6 | | | 2.4 billion | | | 13 | | | 1.7 billion | | | 13 | (2) | | 4.4 billion(2) | |
Emerging Markets Equity | |
Eric Carlson | | | 7 | | | $2.7 billion | | | 5 | | | $2.6 billion | | | 19 | (3) | | $4.7 billion(3) | |
James Cheng | | | 12 | | | 4.2 billion | | | 7 | | | 2.6 billion | | | 26 | (3) | | 10.9 billion(3) | |
Ana Cristina Piedrahita | | | 7 | | | 2.9 billion | | | 6 | | | 3.2 billion | | | 21 | (4) | | 6.7 billion(4) | |
Paul C. Psaila | | | 8 | | | 3.0 billion | | | 5 | | | 2.6 billion | | | 19 | (3) | | 4.7 billion(3) | |
Ruchir Sharma | | | 10 | | | 3.5 billion | | | 7 | | | 3.6 billion | | | 19 | (3) | | 4.7 billion(3) | |
Global Franchise | |
Vladimir A. Demine | | | 5 | | | $4.8 billion | | | 7 | | | $9.5 billion | | | 47 | (5) | | $11.9 billion(5) | |
Christian Derold | | | 5 | | | 4.8 billion | | | 7 | | | 9.5 billion | | | 47 | (5) | | 11.9 billion(5) | |
John S. Goodacre | | | 5 | | | 4.8 billion | | | 7 | | | 9.5 billion | | | 47 | (5) | | 11.9 billion(5) | |
William D. Lock | | | 5 | | | 4.8 billion | | | 7 | | | 9.5 billion | | | 47 | (5) | | 11.9 billion(5) | |
Bruno Paulson | | | 5 | | | 4.8 billion | | | 7 | | | 9.5 billion | | | 47 | (5) | | 11.9 billion(5) | |
Walter B. Riddell | | | 5 | | | 4.8 billion | | | 7 | | | 9.5 billion | | | 47 | (5) | | 11.9 billion(5) | |
Peter J. Wright | | | 5 | | | 4.8 billion | | | 7 | | | 9.5 billion | | | 47 | (5) | | 11.9 billion(5) | |
Global Real Estate | |
Theodore R. Bigman | | | 14 | | | $5.1 billion | | | 12 | | | $6.8 billion | | | 65 | (6) | | $6.4 billion(6) | |
Angeline Ho | | | 5 | | | 2.3 billion | | | 10 | | | 6.7 billion | | | 45 | (7) | | 3.6 billion(7) | |
Michiel te Paske | | | 5 | | | 2.3 billion | | | 10 | | | 6.5 billion | | | 47 | (7) | | 3.8 billion(7) | |
Sven van Kemenade | | | 5 | | | 2.3 billion | | | 10 | | | 6.5 billion | | | 47 | (7) | | 3.8 billion(7) | |
Global Tactical Asset Allocation | |
Mark Bavoso | | | 5 | | | $778.0 million | | | 2 | | | $602.7 million | | | 9 | (8) | | $4.1 billion(8) | |
Cyril Moullé-Berteaux | | | 4 | | | 640.8 million | | | 2 | | | 602.7 million | | | 9 | (8) | | 4.1 billion(8) | |
U.S. Real Estate | |
Theodore R. Bigman | | | 14 | | | $5.1 billion | | | 12 | | | $6.8 billion | | | 65 | (6) | | $6.4 billion(6) | |
(1) Of these other accounts, one account with a total of approximately $734.2 million in assets, had performance-based fees.
(2) Of these other accounts, one account with a total of approximately $174.9 million in assets, had performance-based fees.
(3) Of these other accounts, three accounts with a total of approximately $1.5 billion in assets, had performance-based fees.
(4) Of these other accounts, four accounts with a total of approximately $3.5 billion in assets, had performance-based fees.
(5) Of these other accounts, two accounts with a total of approximately $677.0 million in assets, had performance-based fees.
(6) Of these other accounts, 15 accounts with a total of approximately $766.1 million in assets, had performance-based fees.
(7) Of these other accounts, seven accounts with a total of approximately $138.1 million in assets, had performance-based fees.
(8) Of these other accounts, three accounts with a total of approximately $1.6 billion in assets, had performance-based fees.
74
Portfolio and Portfolio Managers | | Portfolio Holdings | |
Core Plus Fixed Income | |
Jaidip Singh | | | None* | | |
Neil Stone | | | None* | | |
Emerging Markets Debt | |
Eric Baurmeister | | | None* | | |
Federico Kaune | | | None* | | |
Emerging Markets Equity | |
Eric Carlson | | | None* | | |
James Cheng | | | None* | | |
Ana Cristina Piedrahita | | | None* | | |
Paul C. Psaila | | | None* | | |
Ruchir Sharma | | | None* | | |
Global Franchise | |
Vladimir A. Demine | | | None* | | |
Christian Derold | | | None* | | |
John S. Goodcare | | | None* | | |
William D. Lock | | | None* | | |
Bruno Paulson | | | None* | | |
Walter B. Riddell | | | None* | | |
Peter J. Wright | | | None* | | |
Global Real Estate | |
Theodore R. Bigman | | | None* | | |
Angeline Ho | | | None | | |
Michiel te Paske | | | None | | |
Sven van Kemenade | | | None | | |
Global Tactical Asset Allocation | |
Mark Bavoso | | | None* | | |
Cyril Moullé-Berteaux | | | None | | |
Growth | |
Sam G. Chainani | | | None* | | |
David S. Cohen | | | None* | | |
Dennis P. Lynch | | | None* | | |
Armistead B. Nash | | | None* | | |
Alexander T. Norton | | | None* | | |
Jason C. Yeung | | | None* | | |
Mid Cap Growth | |
Sam G. Chainani | | | None* | | |
David S. Cohen | | | None* | | |
Dennis P. Lynch | | | None* | | |
Armistead B. Nash | | | None* | | |
Alexander T. Norton | | | None* | | |
Jason C. Yeung | | | None* | | |
Small Company | |
Sam G. Chainani | | | None* | | |
David S. Cohen | | | None* | | |
Dennis P. Lynch | | | None* | | |
Armistead B. Nash | | | None* | | |
Alexander T. Norton | | | None* | | |
Jason C. Yeung | | | None* | | |
U.S. Real Estate | |
Theodore R. Bigman | | | None* | | |
* Not included in the table above, the portfolio manager has made investments in one or more other mutual funds managed by the same portfolio management team pursuant to a similar strategy.
75
CONTROL PERSONS AND PRINCIPAL HOLDERS OF SECURITIES
Control Persons
As currently required under law, the insurance companies vote their shares of the Portfolios in accordance with instructions received from their variable annuity contract and variable life insurance policy owners. Morgan Stanley will vote the shares of each Portfolio that it owns in the same proportions as shares of the Portfolio are voted by the insurance companies. Accordingly, neither Morgan Stanley nor the insurance companies are deemed to control the Portfolios.
Principal Holders of Securities
As of March 30, 2012, the following persons were beneficial owners of 5% or more of the outstanding shares of the following Portfolios (Class I and Class II shares):
Portfolio | | Name of Beneficial Owner | | Percent of Outstanding Shares | |
Core Plus Fixed Income Portfolio (Class I) | | Hartford Life & Annuity Insurance Co. Separate Account
Attn: UIT Operations
P.O. Box 2999
Hartford, CT 06104 | | | 56.87 | % | |
| | United of Omaha Life Insurance Co. Attn: Product Accounting & Reporting Mutual of Omaha Plaza
11th Floor
Omaha, NE 68175 | | | 7.95 | % | |
| | Annuity Investors Life Insurance Co.
P.O. Box 5423
Cincinnati, OH 45201 | | | 9.45 | % | |
Emerging Markets Debt Portfolio (Class I) | | Fidelity Investments Life Insurance Co.
82 Devonshire St. R27A
Boston, MA 02109 | | | 66.46 | % | |
| | Nationwide Life Insurance Co.
NWVA-9
C/O IPO Portfolio Accounting
P.O. Box 182029
Columbus, OH 43218 | | | 12.90 | % | |
| | Empire Fidelity Investments Life Insurance Co.
One Financial Center
200 Liberty St.
New York, NY | | | 6.31 | % | |
Emerging Markets Equity Portfolio (Class I) | | Fidelity Investments Life Insurance Co.
82 Devonshire St. R27A
Boston, MA 02109 | | | 37.43 | % | |
| | MetLife Life & Annuity Co. of Connecticut
P.O. Box 990027
Hartford, CT 06199 | | | 6.96 | % | |
76
Portfolio | | Name of Beneficial Owner | | Percent of Outstanding Shares | |
| | Allstate Life Insurance Co. - NB
544 Lakeview Parkway, Suite L3G
Vernon Hills, IL 60061 | | | 8.67 | % | |
| | Ameritas Life Insurance Corp.
Variable Separate Account VA2
Attn: Variable Processing
5900 O St.
Lincoln, NE 68501 | | | 14.00 | % | |
Global Tactical Asset Allocation Portfolio (Class I) | | Ameritas Life Insurance Corp.
Variable Separate Account VA2
Attn: Variable Processing
5900 O St.
Lincoln, NE 68501 | | | 5.37 | % | |
| | Fidelity Investments Life Insurance Co.
82 Devonshire St. R27A
Boston, MA 02109 | | | 54.09 | % | |
| | Allstate Life Insurance Co. - NB
544 Lakeview Parkway, Suite L3G
Vernon Hills, IL 60061 | | | 19.47 | % | |
Growth Portfolio (Class I) | | Allstate Life Insurance Co. - NB
544 Lakeview Parkway, Suite L3G
Vernon Hills, IL 60061 | | | 45.72 | % | |
| | Allstate Life Insurance Co.
Attn: Accounting COE
544 Lakeview Parkway Suite L3G
Vernon Hills, IL 60061 | | | 17.20 | % | |
| | MetLife Life & Annuity Co. of Connecticut
P.O. Box 990027
Hartford, CT 06199 | | | 13.93 | % | |
| | American General Life Insurance Company
Attn Variable Products
PO BOX 1591
Houston, TX 77251-1591 | | | 5.09 | % | |
Mid Cap Growth Portfolio (Class I) | | Allstate Life Insurance Co. - NB
544 Lakeview Parkway, Suite L3G
Vernon Hills, IL 60061 | | | 27.16 | % | |
| | Nationwide Life Insurance Co. NWVLI-4
C/O IPO Portfolio Accounting
P.O. Box 182029
Columbus, OH 43218 | | | 18.06 | % | |
77
Portfolio | | Name of Beneficial Owner | | Percent of Outstanding Shares | |
| | Nationwide Life Insurance Co.
NWPP
C/O IPO Portfolio Accounting
P.O. Box 182029
Columbus, OH 43218 | | | 32.84 | % | |
| | Sun Life Financial
Separate Account G
One Sun Life Executive Park
Wellesley Hills, MA 02481 | | | 7.41 | % | |
U.S. Real Estate Portfolio (Class I) | | Ohio National Life Insurance Co.
1 Financial Way
Cincinnati, OH 45242 | | | 5.31 | % | |
| | NYLIAC
Attn: Ashesh Upadhyay
Nylim Center
169 Lackawanna Ave
Parsippany, NJ 07054 | | | 7.51 | % | |
| | Ameritas Life Insurance Corp.
Variable Separate Account VA2
Attn: Variable Processing
5900 O St.
Lincoln, NE 68501 | | | 6.17 | % | |
| | Annuity Investors Life Insurance Co.
P.O. Box 5423
Cincinnati, OH 45201 | | | 5.37 | % | |
| | Nationwide Life Insurance Co. NWVLI-4
C/O IPO Portfolio Accounting
P.O. Box 182029
Columbus, OH 43218 | | | 8.34 | % | |
| | Allstate Life Insurance Co. - NB
544 Lakeview Parkway, Suite L3G
Vernon Hills, IL 60061 | | | 7.45 | % | |
| | MetLife Life Insurance Co. of Connecticut
P.O. Box 990027
Hartford, CT | | | 5.34 | % | |
| | MetLife Investors USA Insurance Co.
501 Boylston St.
Boston, MA 02116 | | | 28.18 | % | |
Core Plus Fixed Income (Class II) | | Nationwide Life Insurance Co.
NWVA-II
C/O IPO Portfolio Accounting
P.O. Box 182029
Columbus, OH 43218 | | | 39.63 | % | |
78
Portfolio | | Name of Beneficial Owner | | Percent of Outstanding Shares | |
| | Ohio National Life Insurance Co.
1 Financial Way
Cincinnati, OH 45242 | | | 56.83 | % | |
Emerging Markets Debt Portfolio (Class II) | | Allstate Life Insurance Co.
Attn: Financial Control
3100 Sanders Rd.
North Brook, IL 60062 | | | 61.14 | % | |
| | Allstate Life Insurance Co. of
New York
Attn: Financial Control Unit
544 Lakeview Parkway
Vernon Hills, IL 60061 | | | 13.26 | % | |
| | Integrity Life Insurance Co.
400 Broadway Street
Cincinnati, OH 45202 | | | 10.51 | % | |
| | National Integrity Life Insurance Co.
400 Broadway Street
Cincinnati, OH 45202 | | | 8.07 | % | |
Emerging Markets Equity Portfolio (Class II) | | Allstate Life Insurance Co.
Attn: Financial Control
3100 Sanders Rd.
North Brook, IL 60062 | | | 9.83 | % | |
| | Hartford Life & Annuity Insurance Co.
Separate Account
Attn: UIT Operations
P.O. Box 2999
Hartford, CT 06104 | | | 43.33 | % | |
| | Hartford Life Insurance Co.
Separate Account
Attn: UIT Operations
P.O. Box 2999
Hartford, CT 06104 | | | 17.35 | % | |
| | Minnesota Life Insurance Company
ATTN A6-4105
400 Robert Street North
Saint Paul, MN 55101-2037 | | | 6.70 | % | |
| | National Integrity Life Insurance Co.
400 Broadway Street
Cincinnati, OH 45202 | | | 5.98 | % | |
| | Security Benefit Life Ins. Co.
FBO Unbundled
Attn: C/O Variable Annuity Dept.
One Security Benefit Place
Topeka, KS 66636-1000 | | | 9.10 | % | |
79
Portfolio | | Name of Beneficial Owner | | Percent of Outstanding Shares | |
Global Franchise Portfolio (Class II) | | Allstate Life Insurance Co.
Attn: Financial Control
3100 Sanders Rd.
North Brook, IL 60062 | | | 66.68 | % | |
| | Hartford Life & Annuity Insurance Co.
Separate Account
Attn: UIT Operations
P.O. Box 2999
Hartford, CT 06104 | | | 21.82 | % | |
| | Allstate Life Insurance Co. of
New York
Attn: Financial Control Unit
544 Lakeview Parkway
Vernon Hills, IL 60061 | | | 6.67 | % | |
Global Real Estate Portfolio
(Class II) | | IDS Life Insurance Co.
222 AMPF Financial Center
Minneapolis, MN 55474 | | | 82.30 | % | |
| | Protective Life Insurance Co.
Variable Annuity Separate Account
Attn: Tom Barrett
PO Box 10648
Birmingham, AL 35202-0648 | | | 10.36 | % | |
Global Tactical Asset Allocation Portfolio (Class II) | | Nationwide Life Insurance Co.
NWVA-9
C/O IPO Portfolio Accounting
P.O. Box 182029
Columbus, OH 43218 | | | 91.27 | % | |
| | Morgan Stanley Investment Management
Attn: Lawrence Markey
100 Front Street
One Tower Bridge
West Conshohocken, PA 19428-2800 | | | 8.73 | % | |
Growth Portfolio (Class II) | | Ohio National Life Insurance Co.
1 Financial Way
Cincinnati, OH 45242 | | | 62.40 | % | |
| | Allstate Life Insurance Co.
Attn: Financial Control
3100 Sanders Rd.
North Brook, IL 60062 | | | 22.49 | % | |
| | Allstate Life Insurance Co.
Attn: Accounting COE
544 Lakeview Parkway
Vernon Hills, IL 60061 | | | 5.80 | % | |
80
Portfolio | | Name of Beneficial Owner | | Percent of Outstanding Shares | |
Mid Cap Growth Portfolio (Class II) | | Hartford Life Insurance Co.
Separate Account
Attn: UIT Operations
P.O. Box 2999
Hartford, CT 06104 | | | 7.42 | % | |
| | IDS Life Insurance Co.
222 AMPF Financial Center
Minneapolis, MN 55474 | | | 34.10 | % | |
| | Allstate Life Insurance Co.
Attn: Financial Control
3100 Sanders Rd.
North Brook, IL 60062 | | | 12.80 | % | |
| | Hartford Life & Annuity Insurance Co.
Separate Account
Attn: UIT Operations
P.O. Box 2999
Hartford, CT 06104 | | | 34.50 | % | |
| | Sun Life Financial
One Sun Life Executive Park
Wellesley Hills, MA 02481 | | | 7.41 | % | |
Small Company Growth Portfolio (Class II) | | Allstate Life Insurance Co.
Attn: Financial Control
3100 Sanders Rd.
North Brook, IL 60062 | | | 51.51 | % | |
| | Allstate Life Insurance Co. of
New York
Attn: Financial Control Unit
544 Lakeview Parkway
Vernon Hills, IL 60061 | | | 7.16 | % | |
| | Hartford Life & Annuity Insurance Co. Separate Account
Attn: UIT Operations
P.O. Box 2999
Hartford, CT 06104 | | | 40.20 | % | |
U.S. Real Estate Portfolio (Class II) | | Ohio National Life Insurance Co.
1 Financial Way
Cincinnati, OH 45242 | | | 54.44 | % | |
| | Allstate Life Insurance Co.
Attn: Financial Control
3100 Sanders Rd.
North Brook, IL 60062 | | | 25.31 | % | |
| | Allstate Life Insurance Co.
Attn: Accounting COE
544 Lakeview Parkway
Vernon Hills, IL 60061 | | | 9.16 | % | |
Shares of the Portfolio are sold to insurance companies for their variable annuity contracts and variable life insurance policies.
81
NET ASSET VALUE
The NAV per share of each Portfolio is determined by dividing the total market value of the Portfolio's investments and other assets, less all liabilities, by the total number of outstanding shares of such Portfolio. NAV for Class I and Class II shares will differ due to class specific expenses paid by each class, and the 12b-1 fee charged to Class II shares. The NAV per share of each Portfolio is determined as of the close of the NYSE (normally 4:00 p.m. Eastern Time) on each day that the NYSE is open for business. Price information on listed securities is taken from the exchange where the security is primarily traded. Portfolio securities generally are valued at their market value. Securities listed on a U.S. securities exchange for which market quotations are available generally are valued at the last quoted sale price on the day the valuation is made, or if there has been no sale that day, or for all other portfolio securities for which the over-counter market quotations are readily available, at the mean between the last reported bid and asked price. Equity securities listed or traded on NASDAQ for which market quotations are available are valued at the NASDAQ Official Closing Price, or if there has been no sale that day, at the mean between the last reported bid and asked price. In cases where a security is traded on more than one exchange, the security is valued on the exchange designated as the primary market pursuant to procedures adopted by the Board of Directors. For equity securities traded on foreign exchanges, the last reported closing price or the latest bid price may be used if there were no sales on a particular day. The current bid and asked prices are determined based on the average of the bid and asked prices quoted on such valuation date by reputable brokers.
Bonds and other fixed income securities are valued according to the broadest and most representative market, which will ordinarily be the over-the-counter market. NAV includes interest on fixed income securities, which is accrued daily unless collection is in doubt. In addition, bonds and other fixed income securities may be valued on the basis of prices provided by a pricing service when such prices are believed to reflect the fair market value of such securities. The prices provided by a pricing service are determined without regard to bid or last sale prices, but take into account institutional-size trading in similar groups of securities and any developments related to the specific securities. Securities not priced in this manner are valued based on the mean of bid and ask prices (or a yield equivalent thereof), obtained from market makers or brokers or, when securities exchange valuations are used, at the latest quoted sale price on the day of valuation. If there is no such reported sale, the latest quoted bid price will be used. Securities purchased with remaining maturities of 60 days or less are valued at amortized cost, if it approximates market value. In the event that amortized cost does not approximate market value, market prices as determined above will be used.
The value of other assets and securities for which quotations are not readily available or may be unreliable (including certain restricted and unlisted securities), and those securities for which it is inappropriate to determine prices in accordance with the above-stated procedures, are determined in good faith at fair value using methods determined by the Board of Directors. For purposes of calculating NAV per share, all assets and liabilities initially expressed in foreign currencies generally will be converted into U.S. dollars at the mean of the bid and asked price of such currencies against the U.S. dollar as quoted by a major bank.
Generally, trading in foreign securities, as well as corporate bonds, U.S. Government securities and money market instruments, is substantially completed each day at various times prior to the close of the NYSE. The values of such securities used in computing the NAV of the Fund's shares are determined as of such times. Foreign currency exchange rates are also generally determined prior to the close of the NYSE. Events which may affect the values of such securities and such exchange rates may occur between the times at which they are determined and the close of the NYSE and will therefore not be reflected in the computation of the Fund's NAV. If events that may affect the value of such securities occur during such period, then these securities may be valued at their fair value as determined in good faith under procedures established by and under the supervision of the Directors.
82
PORTFOLIO TRANSACTIONS
The Adviser and/or Sub-Advisers are responsible for decisions to buy and sell securities for each Portfolio, for broker-dealer selection and for negotiation of commission rates. The Adviser and/or Sub-Advisers are prohibited from directing brokerage transactions on the basis of the referral of clients or the sale of shares of advised investment companies. Purchases and sales of securities on a stock exchange are effected through brokers who charge a commission for their services. In the over-the-counter market, securities may be traded as agency transactions through broker dealers or traded on a "net" basis with dealers acting as principal for their own accounts without a stated commission, although the price of the security usually includes profit to the dealer. In underwritten offerings, securities are purchased at a fixed price which includes an amount of compensation to the underwriter, generally referred to as the underwriter's concession or discount. When securities are purchased or sold directly from or to an issuer, no commissions or discounts are paid.
On occasion, a Portfolio may purchase certain money market instruments directly from an issuer without payment of a commission or concession. Money market instruments are generally traded on a "net" basis with dealers acting as principal for their own accounts without a stated commission, although the price of the security usually includes a profit to the dealer.
The Fund anticipates that certain of its transactions involving foreign securities will be effected on securities exchanges. Fixed commissions on such transactions are generally higher than negotiated commissions on domestic transactions. There is also generally less government supervision and regulation of foreign securities exchanges and brokers than in the United States.
The Adviser and/or Sub-Advisers serve as investment adviser to a number of clients, including other investment companies. The Adviser and/or Sub-Advisers attempt to equitably allocate purchase and sale transactions among the Portfolios of the Fund and other client accounts. To that end, the Adviser and/or Sub-Advisers consider various factors, including respective investment objectives, relative size of portfolio holdings of the same or comparable securities, availability of cash for investment, size of investment commitments generally held and the opinions of the persons responsible for managing the Portfolios of the Fund and other client accounts.
The Adviser and/or Sub-Advisers select the brokers or dealers that will execute the purchases and sales of investment securities for each Portfolio. The Adviser and/or Sub-Advisers effect transactions with those broker-dealers that they believe provide prompt execution of orders in an effective manner at the most favorable prices. A Portfolio may pay higher commission rates than the lowest available when the Adviser and/or Sub-Advisers believes it is reasonable to do so in light of the value of the research, statistical, and pricing services provided by the broker effecting the transaction. The Adviser and/or Sub-Advisers may place portfolio transactions with those brokers and dealers who also furnish research and other services to the Fund, the Adviser and/or Sub-Advisers. Services provided may include certain research services (as described below), as well as effecting securities transactions and performing functions thereto (such as clearance, settlement and custody).
The Adviser and its affiliated investment advisers have established commission sharing arrangements under a commission management program (the "Commission Management Program" or "CMP"), pursuant to which execution and research costs or a portion of those costs are decoupled in accordance with applicable laws, rules and regulations. Under the CMP, the Adviser and its affiliated investment advisers select approved equity brokers (which include the Adviser's affiliates) for execution services and after accumulation of commissions at such brokers, the Adviser and/or its affiliates instruct these approved equity brokers to pay for eligible research provided by executing brokers or third-party research providers, which are selected independently by a Research Services Committee of the Adviser and its affiliated investment advisers. Generally, the Adviser and its affiliated investment advisers will direct the approved equity broker to record research credits based upon a previously agreed-upon allocation and will periodically instruct the approved equity broker to direct specified dollar amounts from that pool to pay for eligible research services provided by third-party research providers and
83
executing brokers. The research credits are pooled among the Adviser and its affiliated investment advisers and allocated on behalf of both the Adviser and its affiliated investment advisers. Likewise, the research services obtained under the CMP are shared among the Adviser and its affiliated investment advisers.
Selection of approved equity brokers for execution is based on three main criteria: access to liquidity, provision of capital and quality of execution. Under the CMP, each approved equity broker is responsible for the payment of fees for research services and obtains the research services pursuant to written agreements between the approved equity broker and the third-party research provider.
For those costs not decoupled, but retained by broker-dealers, the Adviser also effects transactions with brokers which directly pay for research services provided by third parties in accordance with Section 28(e) of the 1934 Act. Such transactions include equity transactions and may include fixed-income transactions effected on an agency basis.
Transactions involving client accounts managed by two or more affiliated investment advisers may be aggregated and executed using the services of broker-dealers that provide third party benefits/research so long as: (i) all client accounts involved in the transaction benefit from one or more of the services offered by such broker-dealer; and (ii) each affiliated investment adviser has approved the use of such broker-dealer and the services provided thereby.
The research services received include those of the nature described above and other services which aid the Adviser in fulfilling its investment decision-making responsibilities, including (a) furnishing advice as to the value of securities, the advisability of investing in, purchasing or selling securities, and the availability of securities or purchasers or sellers of securities; and (b) furnishing analyses and reports concerning issuers, industries, securities, economic factors and trends, portfolio strategy, and the performance of accounts. Where a particular item (such as proxy services) has both research and non-research related uses, the Adviser will make a reasonable allocation of the cost of the item between research and non-research uses and will only pay for the portion of the cost allocated to research uses with client brokerage transactions. Research services furnished or paid for by brokers through whom the Adviser effects transactions for a particular account may be used by the Adviser or its affiliated investment advisers in servicing their other accounts, and not all such services may be used for the benefit of the client which pays the brokerage commission that results in the receipt of such research services. Commissions paid to brokers providing research services may be higher than those charged by brokers not providing such services.
The Adviser and its affiliated investment advisers make a good faith determination of the value of research services in accordance with Section 28(e) of the 1934 Act, UK Financial Services Authority Rules and other relevant regulatory requirements.
Certain investment professionals and other employees of the Adviser are also officers of affiliated investment advisers and may provide investment advisory services to clients of such affiliated investment advisers. The Adviser's personnel also provide research and trading support to personnel of certain affiliated investment advisers. Research related costs may be shared by affiliated investment advisers and may benefit the clients of such affiliated investment advisers. Research services that benefit the Adviser may be received in connection with commissions generated by clients of its affiliated investment advisers. Similarly, research services received in connection with commissions generated by the Adviser's clients may benefit affiliated investment advisers and their clients. Moreover, research services provided by broker-dealers through which the Adviser effects transactions for a particular account may be used by the Adviser and/or an affiliated investment adviser in servicing its other accounts and not all such research services may be used for the benefit of the particular client, which pays the brokerage commission giving rise to the receipt of such research services.
The Adviser and certain of its affiliates currently serve as investment adviser to a number of clients, including other investment companies, and may in the future act as investment adviser to others. It is the practice
84
of the Adviser and its affiliates to cause purchase and sale transactions to be allocated among clients whose assets they manage (including the Fund) in such manner they deem equitable. In making such allocations among the Fund and other client accounts, various factors may be considered, including the respective investment objectives, the relative size of portfolio holdings of the same or comparable securities, the availability of cash for investment, the size of investment commitments generally held and the opinions of the persons responsible for managing the Portfolios and other client accounts. The Adviser and its affiliates may operate one or more order placement facilities and each facility will implement order allocation in accordance with the procedures described above. From time to time, each facility may transact in a security at the same time as other facilities are trading in that security.
As a wholly-owned subsidiary of Morgan Stanley, the Adviser is affiliated with certain U.S.-registered broker-dealers and foreign broker-dealers (collectively, the "Affiliated Brokers"). The Adviser may, in the exercise of its discretion under the Agreement, effect transactions in securities or other instruments for the Fund through the Affiliated Brokers.
Affiliated Brokers
Subject to the overriding objective of obtaining the best execution of orders, a Fund may use broker-dealer affiliates of the Adviser to effect Portfolio brokerage transactions, including transactions in futures contracts and options on futures contracts, under procedures adopted by the Fund's Board of Directors. In order to use such affiliates, the commission rates and other remuneration paid to the affiliates must be fair and reasonable in comparison to those of other broker-dealers for comparable transactions involving similar securities being purchased or sold during a comparable time period. This standard would allow the affiliated broker or dealer to receive no more than the remuneration which would be expected to be received by an unaffiliated broker.
Pursuant to an order issued by the SEC, the Fund is permitted to engage in principal transactions involving money market instruments, subject to certain conditions, with Morgan Stanley & Co. LLC, a broker-dealer affiliated with the Fund's Adviser.
During the fiscal years ended December 31, 2009, 2010 and 2011, the Fund did not effect any principal transactions with Morgan Stanley & Co. LLC.
BROKERAGE FEES
During the fiscal years ended December 31, 2009, 2010 and 2011, the Portfolios paid total brokerage commissions as follows:
Name of Portfolio | | Brokerage Commissions Paid
for Fiscal Year Ended
12/31/09 | | Brokerage Commissions Paid
for Fiscal Year Ended
12/31/10 | | Brokerage Commissions Paid
for Fiscal Year Ended
12/31/11 | |
Core Plus Fixed Income | | $ | 61,399 | | | $ | 21,993 | | | $ | 12,898 | | |
Emerging Markets Debt | | | 705 | | | | 2,927 | | | | 1,865 | | |
Emerging Markets Equity | | | 2,018,171 | | | | 2,716,222 | | | | 2,437,101 | | |
Global Franchise | | | 50,767 | | | | 82,526 | | �� | | 50,416 | | |
Global Real Estate | | | 606,078 | | | | 275,712 | | | | 62,419 | | |
Global Tactical Asset Allocation | | | 73,312 | | | | 158,725 | | | | 56,597 | | |
Growth | | | 27,700 | | | | 57,818 | | | | 31,812 | | |
Mid Cap Growth | | | 165,752 | | | | 208,022 | | | | 139,378 | | |
Small Company Growth | | | 22,618 | | | | 23,609 | | | | 18,698 | | |
U.S. Real Estate | | | 611,666 | | | | 366,726 | | | | 211,654 | | |
85
During the fiscal year ended December 31, 2009 and 2010, the Portfolios paid brokerage commissions to Morgan Stanley & Co. LLC and/or its affiliated broker-dealers as follows:
Name of Portfolio | | Brokerage Commissions Paid
to Morgan Stanley & Co. LLC
and/or its Affiliated Broker-
Dealers for Fiscal Year Ended
12/31/09 | | Brokerage Commissions Paid
to Morgan Stanley & Co. LLC
and/or its Affiliated Broker-
Dealers for Fiscal Year Ended
12/31/10 | |
Core Plus Fixed Income | | | — | | | | — | | |
Emerging Markets Debt | | | — | | | | — | | |
Emerging Markets Equity | | $ | 45,843 | | | $ | 55,366 | | |
Global Franchise | | | — | | | | 403 | | |
Global Real Estate | | | 4,311 | | | | — | | |
Global Tactical Asset Allocation | | | 1,679 | | | | — | | |
Growth | | | — | | | | 101 | | |
Mid Cap Growth | | | 4,616 | | | | — | | |
Small Company Growth | | | — | | | | — | | |
U.S. Real Estate | | | 51,246 | | | | 1,620 | | |
For the fiscal year ended December 31, 2011, the Portfolios paid brokerage commissions to Morgan Stanley & Co. LLC and/or its affiliated broker-dealers, as follows:
Name of Portfolio | | Brokerage
Commissions Paid to
Morgan Stanley & Co. LLC.
and/or its
Affiliated Broker-Dealers
for Fiscal Year Ended
12/31/11 | | Percentage of Aggregate
Brokerage Commissions for
Fiscal Year Ended 12/31/11 | |
Percentage of Aggregate Dollar
Amount of Executed
Trades on Which
Brokerage Commissions
Were Paid for Fiscal Year
Ended 12/31/11 | |
Core Plus Fixed Income | | | — | | | | — | | | | — | | |
Emerging Markets Debt | | | — | | | | — | | | | — | | |
Emerging Markets Equity | | $ | 30,106 | | | | 1.24 | % | | | 1.21 | % | |
Global Franchise | | | 166 | | | | 0.33 | % | | | 0.21 | % | |
Global Real Estate | | | 209 | | | | 0.33 | % | | | 0.87 | % | |
Global Tactical Asset Allocation | | | — | | | | — | | | | — | | |
Growth | | | — | | | | — | | | | — | | |
Mid Cap Growth | | | 1,142 | | | | 0.82 | % | | | 1.07 | % | |
Small Company Growth | | | 65 | | | | 0.35 | % | | | 0.38 | % | |
U.S. Real Estate | | | 798 | | | | 0.38 | % | | | 1.20 | % | |
No brokerage commissions were paid to Citigroup, Inc. and/or its affiliated broker-dealers by any Portfolio during the period from June 1, 2009 to December 31, 2009. For the fiscal year ended December 31, 2010, the Portfolios paid brokerage commissions to Citigroup, Inc. and/or its affiliated broker-dealers, as follows:
Name of Portfolio | | Brokerage Commissions Paid
to Citigroup, Inc. and/or
its Affiliated Broker-Dealers
for Fiscal Year Ended
12/31/10 | |
Core Plus Fixed Income | | | — | | |
Emerging Markets Debt | | | — | | |
Emerging Markets Equity | | $ | 120,702 | | |
Global Franchise | | | 3,293 | | |
Global Real Estate | | | 490 | | |
Global Tactical Asset Allocation | | | 2,086 | | |
Growth | | | 495 | | |
Mid Cap Growth | | | 3,177 | | |
Small Company Growth | | | 98 | | |
U.S. Real Estate | | | 847 | | |
86
For the fiscal year ended December 31, 2011, the Portfolios paid brokerage commissions to Citigroup, Inc. and/or its affiliated broker-dealers, as follows:
Name of Portfolio | | Brokerage Commissions Paid
to Citigroup, Inc. and/or
its Affiliated Broker-Dealers
for Fiscal Year Ended
12/31/11 | | Percentage of Aggregate
Brokerage Commissions for
Fiscal Year Ended 12/31/11 | | Percentage of Aggregate Dollar
Amount of Executed
Trades on Which
Brokerage Commissions
Were Paid for Fiscal Year
Ended 12/31/11 | |
Core Plus Fixed Income | | | — | | | | — | | | | — | | |
Emerging Markets Debt | | | — | | | | — | | | | — | | |
Emerging Markets Equity | | $ | 135,616 | | | | 5.56 | % | | | 4.83 | % | |
Global Franchise | | | 1,162 | | | | 2.30 | % | | | 1.29 | % | |
Global Real Estate | | | 1,473 | | | | 2.36 | % | | | 1.91 | % | |
Global Tactical Asset Allocation | | | — | | | | — | | | | — | | |
Growth | | | 137 | | | | 0.43 | % | | | 0.16 | % | |
Mid Cap Growth | | | 294 | | | | 0.21 | % | | | 0.14 | % | |
Small Company Growth | | | 141 | | | | 0.76 | % | | | 0.98 | % | |
U.S. Real Estate | | | 1,905 | | | | 0.90 | % | | | 1.96 | % | |
Regular Broker-Dealers: The Fund's regular broker-dealers are (i) the ten broker-dealers that received the greatest dollar amount of brokerage commission from the Fund; (ii) the ten broker-dealers that engaged as principal in the largest dollar amount of portfolio transactions; and (iii) the ten broker-dealers that sold the largest dollar amount of Portfolio shares. During the fiscal year ended December 31, 2011, the following Portfolios purchased securities issued by the Fund's regular broker-dealers:
Portfolio | | Regular Broker-Dealer | | Approximate Value of Portfolio
Holdings as of 12/31/11 | |
Core Plus Fixed Income Portfolio | | Barclays Capital Group | | $ | 552,000 | | |
| | | JP Morgan Securities LLC | | | 7,949,000 | | |
| | | BNP Paribas SA | | | 376,000 | | |
| | | Citibank NA | | | 2,385,000 | | |
| | | Bank of America Securities LLC | | | 2,907,000 | | |
Emerging Markets Debt Portfolio | | Banco Santander SA | | $ | 1,681,000 | | |
Global Tactical Asset Allocation Portfolio | | State Street Bank | | $ | 13,000 | | |
| | | Barclays Capital Group | | | 181,000 | | |
| | | Deutsche Bank Financial LLC | | | 3,173,000 | | |
| | | Bank of America Securities LLC | | | 120,000 | | |
| | | JP Morgan Securities LLC | | | 523,000 | | |
| | | Goldman Sachs & Co. | | | 181,000 | | |
| | | UBS Financial Services Inc. | | | 0 | | |
Growth Portfolio | | Goldman Sachs & Co. | | $ | 190,000 | | |
Portfolio Turnover
The Portfolios generally do not invest for short-term trading purposes; however, when circumstances warrant, each Portfolio may sell investment securities without regard to the length of time they have been held. Market conditions in a given year could result in a higher or lower portfolio turnover rate than expected and the Portfolios will not consider portfolio turnover rate a limiting factor in making investment decisions consistent with their investment objectives and policies. A high portfolio turnover rate (100% or more) increases a Portfolio's transaction costs (including brokerage commissions or dealer costs), which would adversely impact a Portfolio's performance. Higher portfolio turnover may result in the realization of more short-term capital gains than if a Portfolio had lower portfolio turnover.
87
PERFORMANCE INFORMATION
The following table shows the average annual total return numbers for the one-year, five-year and ten-year periods ended December 31, 2011 and since inception through December 31, 2011 for the Class I shares of each of the Portfolios.
Name of Portfolio | | Inception
Date | | Average Annual
Total Return for
One Year Ended
12/31/11 | | Average Annual
Total Return for
Five Years Ended
12/31/11 | | Average Annual
Total Return for
Ten Years Ended
12/31/11 | | Average Annual
Total Return
Since Inception
through 12/31/11 | |
Core Plus Fixed Income | | 01/02/97 | | | 5.65 | % | | | 3.28 | % | | | 4.06 | % | | | 5.11 | % | |
Emerging Markets Debt | | 06/16/97 | | | 7.03 | % | | | 6.74 | % | | | 10.23 | % | | | 7.93 | % | |
Emerging Markets Equity | | 10/01/96 | | | –18.22 | % | | | 0.14 | % | | | 11.99 | % | | | 6.39 | % | |
Global Tactical Asset Allocation | | 01/02/97 | | | –3.68 | % | | | –3.06 | % | | | 4.00 | % | | | 2.88 | % | |
Growth | | 01/02/97 | | | –2.80 | % | | | 4.14 | % | | | 3.66 | % | | | 5.94 | % | |
Mid Cap Growth | | 10/18/99 | | | –7.12 | % | | | 4.82 | % | | | 6.79 | % | | | 4.69 | % | |
U.S. Real Estate | | 03/03/97 | | | 5.92 | % | | | –1.87 | % | | | 10.59 | % | | | 9.85 | % | |
The following table shows the average annual total return numbers for the one-year and five-year periods ended December 31, 2011 and since inception through December 31, 2011 for the Class II shares of each of the Portfolios.
Name of Portfolio | | Inception Date | | Average Annual Total
Return for One Year
Ended 12/31/11 | | Average Annual Total
Return for Five Years
Ended 12/31/11 | | Average Annual Total
Return Since Inception
through 12/31/11 | |
Core Plus Fixed Income | | 05/01/03 | | | 5.40 | % | | | 3.03 | % | | | 3.33 | % | |
Emerging Markets Debt | | 12/19/02 | | | 6.88 | % | | | 6.66 | % | | | 10.24 | % | |
Emerging Markets Equity | | 01/10/03 | | | –18.24 | % | | | 0.10 | % | | | 14.22 | % | |
Global Franchise | | 04/30/03 | | | 9.05 | % | | | 4.68 | % | | | 10.53 | % | |
Global Real Estate | | 04/28/06 | | | –10.15 | % | | | –4.57 | % | | | –0.45 | % | |
Global Tactical Asset Allocation* | | 03/15/11 | | | N/A | | | | N/A | | | | N/A | | |
Growth | | 05/05/03 | | | –3.04 | % | | | 3.88 | % | | | 7.16 | % | |
Mid Cap Growth | | 05/05/03 | | | –7.17 | % | | | 4.73 | % | | | 11.31 | % | |
Small Company Growth | | 04/30/03 | | | –8.71 | % | | | 0.77 | % | | | 9.09 | % | |
U.S. Real Estate | | 11/05/02 | | | 5.66 | % | | | –2.06 | % | | | 11.82 | % | |
N/A = Not Applicable.
* Performance information for the Class II shares of Global Tactical Asset Allocation Portfolio will be provided once the Class II shares have completed a full calendar year of operations.
The respective current yields for certain of the Fund's Class I Portfolios for the 30-day period ended December 31, 2011 were as follows:
Portfolio Name | | 30-Day Yield | |
Core Plus Fixed Income | | | 4.91 | % | |
Emerging Markets Debt | | | 4.29 | % | |
Global Tactical Asset Allocation | | | 1.70 | % | |
The respective current yields for certain of the Fund's Class II Portfolios for the 30-day period ended December 31, 2011 were as follows:
Portfolio Name | | 30-Day Yield | |
Core Plus Fixed Income | | | 4.67 | % | |
Emerging Markets Debt | | | 4.24 | % | |
Global Tactical Asset Allocation | | | 1.62 | % | |
88
DISCLOSURE OF PORTFOLIO HOLDINGS
The Fund's Board of Directors, the Adviser and the Sub-Advisers have adopted policies and procedures regarding disclosure of portfolio holdings (the "Policy"). Pursuant to the Policy, the Adviser and the Sub-Advisers may disclose information concerning Fund portfolio holdings only if such disclosure is consistent with the antifraud provisions of the federal securities laws and the Fund's, the Adviser's and the Sub-Advisers' fiduciary duties to Fund shareholders. In no instance may the Adviser and the Sub-Advisers or the Fund receive compensation or any other consideration in connection with the disclosure of information about the portfolio securities of the Fund. Consideration includes any agreement to maintain assets in the Fund or in other investment companies or accounts managed by the Adviser, the Sub-Advisers or by any affiliated person of the Adviser or the Sub-Advisers. Non-public information concerning portfolio holdings may be divulged to third parties only when the Fund has a legitimate business purpose for doing so and the recipients of the information are subject to a duty of confidentiality. Under no circumstances shall current or prospective Fund shareholders receive non-public portfolio holdings information, except as described below.
The Fund makes available on its public website the following portfolio holdings information:
• complete portfolio holdings information monthly, at least 15 calendar days after the end of each month (except with respect to Global Franchise Portfolio); and
• top 10 holdings monthly, at least 15 calendar days after the end of each month.
With respect to the Global Franchise Portfolio, complete holdings will be available on a quarterly basis 15 calendar days after the quarter-end to current shareholders who call (800) 548-7786.
The Fund provides a complete schedule of portfolio holdings for the second and fourth fiscal quarters in its semiannual and annual reports, and for the first and third fiscal quarters in its filings with the SEC on Form N-Q.
All other portfolio holdings information that has not been disseminated in a manner making it available to investors generally as described above is non-public information for purposes of the Policy.
The Fund may make selective disclosure of non-public portfolio holdings information pursuant to certain exemptions set forth in the Policy. Third parties eligible for exemptions under the Policy and therefore eligible to receive such disclosures currently include fund rating agencies, information exchange subscribers, consultants and analysts, portfolio analytics providers and service providers, provided that the third party expressly agrees to maintain the disclosed information in confidence and not to trade portfolio securities or related derivative securities based on the non-public information. Non-public portfolio holdings information may not be disclosed to a third party pursuant to an exemption unless and until the third party recipient has entered into a non-disclosure agreement with the Fund and the arrangement has been reviewed and approved, as set forth in the Policy and discussed below. In addition, persons who owe a duty of trust or confidence to the Fund or the Adviser may receive non-public portfolio holdings information without entering into a non-disclosure agreement. Currently, these persons include (i) the Fund's independent registered public accounting firm (as of the Fund's fiscal year-end and on an as needed basis), (ii) counsel to the Fund (on an as needed basis), (iii) counsel to the independent Directors (on an as needed basis) and (iv) members of the Board of Directors (on an as needed basis). Subject to the terms and conditions of any agreement between the Adviser or the Fund and the third party recipient, if these conditions for disclosure are satisfied, there shall be no restriction on the frequency with which Fund non-public portfolio holdings information is released, and no lag period shall apply (unless otherwise indicated below).
The Adviser and the Sub-Advisers may provide interest lists to broker-dealers who execute securities transactions for the Fund without entering into a non-disclosure agreement with the broker-dealers, provided that the interest list satisfies all of the following criteria: (1) the interest list must contain only the CUSIP numbers and/or ticker symbols of securities held in all registered management investment companies advised
89
by the Adviser, the Sub-Advisers or any affiliate of the Adviser or the Sub-Advisers (the "MSIM Funds") on an aggregate, rather than a fund-by-fund basis; (2) the interest list must not contain information about the number or value of shares owned by a specified MSIM Fund; (3) the interest list may identify the investment strategy, but not the particular MSIM Funds, to which the list relates; and (4) the interest list may not identify the portfolio manager or team members responsible for managing the MSIM Funds.
Fund shareholders may elect in some circumstances to redeem their shares of the Fund in exchange for their pro rata share of the securities held by the Fund. Under such circumstances, Fund shareholders may receive a complete listing of the holdings of the Fund up to seven calendar days prior to making the redemption request provided that they represent in writing that they agree not to disclose or trade on the basis of the portfolio holdings information.
The Fund may discuss or otherwise disclose performance attribution analyses (i.e., mention the effect of having a particular security in the portfolio(s)) where such discussion is not contemporaneously made public, provided that the particular holding has been disclosed publicly. Additionally, any discussion of the analyses may not be more current than the date the holding was disclosed publicly.
The Fund may disclose portfolio holdings to transition managers, provided that the Fund has entered into a non-disclosure or confidentiality agreement with the party requesting that the information be provided to the transition manager and the party to the non-disclosure agreement has, in turn, entered into a non-disclosure or confidentiality agreement with the transition manager.
The Adviser and/or the Fund currently have entered into ongoing arrangements with the following parties:
Name | | Information Disclosed | | Frequency(1) | | Lag Time | |
Service Providers | |
RiskMetrics Group (proxy voting agent)(*) | | Complete portfolio holdings | | Daily basis | | (2) | |
FT Interactive Data Pricing Service Provider(*) | | Complete portfolio holdings | | As needed | | (2) | |
State Street Bank and Trust Company(*) | | Complete portfolio holdings | | As needed | | (2) | |
Fund Rating Agencies | |
Lipper(*) | | Top ten and complete portfolio holdings | | Quarterly basis | | Approximately 15 days after quarter end and approximately 30 days after quarter end | |
Morningstar(**) | | Top ten and complete portfolio holdings | | Quarterly basis | | Approximately 15 days after quarter end and approximately 30 days after quarter end | |
Standard & Poor's(*) | | Complete portfolio holdings | | Quarterly basis | | Approximately 15 day lag | |
Investment Company Institute(**) | | Top ten portfolio holdings | | Quarterly basis | | Approximately 15 days after quarter end | |
Consultants and Analysts | |
Arnerich Massena & Associates, Inc.(*) | | Top ten and complete portfolio holdings | | Quarterly basis(5) | | Approximately 10-12 days after quarter end | |
Bloomberg(**) | | Complete portfolio holdings | | Quarterly basis | | Approximately 30 days after quarter end | |
Callan Associates(*) | | Top ten and complete portfolio holdings | | Monthly and quarterly basis, respectively(5) | | Approximately 10-12 days after month/ quarter end | |
Cambridge Associates(*) | | Top ten and complete portfolio holdings | | Quarterly basis(5) | | Approximately 10-12 days after quarter end | |
Citigroup(*) | | Complete portfolio | | Quarterly basis(5) | | At least one day after quarter end | |
Credit Suisse First Boston(*) | | Top ten and complete portfolio holdings | | Monthly and quarterly basis, respectively | | Approximately 10-12 days after month/ quarter end | |
90
Name | | Information Disclosed | | Frequency(1) | | Lag Time | |
CTC Consulting, Inc.(**) | | Top ten and complete portfolio holdings | | Quarterly basis | | Approximately 15 days after quarter end and approximately 30 days quarter end, respectively | |
Evaluation Associates(*) | | Top ten and complete portfolio holdings | | Monthly and quarterly basis, respectively(5) | | Approximately 10-12 days after month/ quarter end | |
Fund Evaluation Group(**) | | Top ten portfolio holdings(3) | | Quarterly basis | | At least 15 days after quarter end | |
Jeffrey Slocum & Associates(*) | | Complete portfolio holdings(4) | | Quarterly basis(5) | | Approximately 10-12 days after quarter end | |
Hammond Associates(**) | | Complete portfolio holdings(4) | | Quarterly basis | | At least 30 days after quarter end | |
Hartland & Co.(**) | | Complete portfolio holdings(4) | | Quarterly basis | | At least 30 days after quarter end | |
Hewitt EnnisKnupp(*) | | Top ten and complete portfolio holdings | | Monthly and quarterly basis, respectively(5) | | Approximately 10-12 days after month/ quarter end | |
Mercer Investment Consulting(*) | | Complete portfolio holdings | | As needed | | (2) | |
Merrill Lynch(*) | | Top ten and complete portfolio holdings | | Monthly and quarterly basis, respectively(5) | | Approximately 10-12 days after month/ quarter end | |
Mobius(**) | | Top ten portfolio holdings(3) | | Monthly basis | | At least 15 days after month end | |
Nelsons(**) | | Top ten portfolio holdings(3) | | Quarterly basis | | At least 15 days after quarter end | |
Prime, Buchholz & Associates, Inc.(**) | | Complete portfolio holdings(4) | | Quarterly basis | | At least 30 days after quarter end | |
PSN(**) | | Top ten portfolio holdings(3) | | Quarterly basis | | At least 15 days after quarter end | |
PFM Asset Management LLC(*) | | Top ten and complete portfolio holdings | | Quarterly basis(5) | | Approximately 10-12 days after quarter end | |
Russell Investment Group/Russell/
Mellon Analytical Services, Inc.(**) | | Top ten and complete portfolio holdings | | Monthly and quarterly basis | | At least 15 days after month end and at least 30 days after quarter end, respectively | |
Stratford Advisory Group, Inc.(*) | | Top ten portfolio holdings(6) | | Quarterly basis(5) | | Approximately 10-12 days after quarter end | |
Thompson Financial(**) | | Complete portfolio holdings(4) | | Quarterly basis | | At least 30 days after quarter end | |
Watershed Investment Consultants, Inc.(*) | | Top ten and complete portfolio holdings | | Quarterly basis(5) | | Approximately 10-12 days after quarter end | |
Yanni Partners(**) | | Top ten portfolio holdings(3) | | Quarterly basis | | At least 15 days after quarter end | |
Portfolio Analytics Providers | |
Factset Research Systems, Inc.(*) | | Complete portfolio holdings | | Daily basis | | One day | |
Investor | |
Gavi Alliance(**) | | Top ten and complete portfolio holdings | | Monthly and quarterly basis | | At least 15 days after month end and quarter end, respectively | |
(*) This entity has agreed to maintain Fund non-public portfolio holdings information in confidence and not to trade portfolio securities based on the non-public portfolio holdings information.
(**) The Fund does not currently have a non-disclosure agreement in place with this entity and therefore the entity can only receive publicly available information.
(1) Dissemination of portfolio holdings information to entities listed above may occur less frequently than indicated (or not at all). Information will typically be provided on a real time basis or as soon thereafter as possible.
(2) Information will typically be provided on a real time basis or as soon thereafter as possible.
(3) Complete portfolio holdings will also be provided upon request from time to time on a quarterly basis, with at least a 30 day lag.
91
(4) Top ten portfolio holdings will also be provided upon request from time to time, with at least a 15 day lag. This information will also be provided upon request from time to time.
(5) This information will also be provided upon request from time to time.
(6) Complete portfolio holdings will also be provided upon request from time to time.
In addition, the following insurance companies, which are deemed service providers to the Fund, receive Top Ten portfolio holdings information, on a quarterly basis, approximately 15 days after quarter end: AIG Life Insurance Company — Private Placement, AIG Life Insurance Company, American International Life Assurance Company of New York, Allmerica Financial Insurance & Annuity Company, Allstate Life Insurance Company, Allstate Life Insurance Company of New York, American Enterprise Life Insurance Company/American Centurion Life Assurance Company/IDS Life Insurance Company, American General — Private Placement, American General Life Insurance Company, American General Life Insurance Company of New York, Inviva, Inc., Ameritas Variable Life Insurance Company, Annuity Investors Life Insurance Company, Columbus Life Insurance Company, Companion Life Insurance Company, Connecticut General Life Insurance Company, Continental Assurance Company, CUNA Mutual Insurance Society, Empire Fidelity Investments Life Insurance Company, The Equitable Life Assurance Society of the Unites States, Fidelity Investment Life Insurance Company, Fidelity Security Life Insurance Company, First Allmerica Financial Life Insurance Company, First Ameritas Life Insurance Corp. of New York, First Great-West Life & Annuity Insurance Company and Great-West Life & Annuity Insurance Company, First MetLife Investment Insurance Company, General American Life Insurance Company, Great American Life Insurance Company of New York, Integrity Life Insurance Company, Kemper Investors Life Insurance Company, Lincoln Benefit Life Company, London Pacific Life and Annuity Company, MetLife Insurance Company of Connecticut, MetLife Life and Annuity Company of Connecticut, Metropolitan Life Insurance Company, MetLife Investors USA Insurance Company, Midland National Life Insurance Company, MONY Life Insurance Company, Nationwide Life Insurance Co., Nationwide Life & Annuity Insurance Co., National Integrity Life Insurance Company, National Life Insurance Company, New York Life Insurance & Annuity Corporation, New York Life Insurance Company & New York Life Sec. Inc., The Ohio National Life Insurance Company, OM Financial Life Insurance Company, The Penn Insurance & Annuity Company, The Penn Mutual Life Insurance Company, Peoples Benefit Life Insurance Company, PFL Life Insurance Company, Phoenix Home Life Mutual Insurance Company, Protective Life Insurance Company, Sage Life Assurance of America, Inc., Security Benefit Life Insurance and First Security Benefit Life Insurance Company, Standard Insurance Company, Sun Life Assurance Company of Canada (U.S.), Transamerica Life Insurance Company, Transamerica Life Insurance & Annuity Company, Transamerica Life Insurance Company of New York, Transamerica Occidental Life Insurance Company, The Union Central Life Insurance Company, United Life & Annuity Insurance Company, United of Omaha Life Insurance Company, United States Life Insurance Company in the City of New York, Valley Forge Life Insurance Company and Western Reserve Life Assurance Company of Ohio. The Fund does not currently have non-disclosure agreements in place with these entities and therefore, these entities can only receive publicly available information.
All disclosures of non-public portfolio holdings information made to third parties pursuant to the exemptions set forth in the Policy must be reviewed by Morgan Stanley Investment Management's ("MSIM") Legal and Compliance Division and approved by the Head of the Long-Only Business of MSIM. Disclosures made to third parties in connection with (i) broker-dealer interest lists; (ii) shareholder in-kind distributions; (iii) attribution analyses; or (iv) transition managers are pre-approved for purposes of the Policy. In addition, the following categories of third parties that may receive non-public portfolio holdings information are also pre-approved provided that they enter into non-disclosure agreements (as discussed above): (i) fund rating agencies; (ii) information exchange subscribers; (iii) consultants and analysts (including defined benefit and defined contribution plan sponsors, and variable annuity providers); (iv) portfolio analytics providers; and (v) service providers.
92
The Adviser and the Sub-Advisers shall report quarterly to the Board of Directors (or a designated committee thereof) at the next regularly scheduled meeting (i) any material information concerning all parties receiving non-public portfolio holdings information pursuant to an exemption; and (ii) any new non-disclosure agreements entered into during the reporting period. Procedures to monitor the use of such non-public portfolio holdings information include requiring annual certifications that the recipients have utilized such information only pursuant to the terms of the agreement between the recipient and the Adviser and, for those recipients receiving information electronically, acceptance of the information will constitute reaffirmation that the third party expressly agrees to maintain the disclosed information in confidence and not to trade portfolio securities based on the nonpublic information.
GENERAL INFORMATION
Fund History
The Fund was incorporated pursuant to the laws of the State of Maryland on March 26, 1996 under the name Morgan Stanley Universal Funds, Inc. The Fund filed a registration statement with the SEC registering itself as an open-end management investment company offering diversified and non-diversified series under the 1940 Act and its shares under the 1933 Act and commenced operations on September 16, 1996. On December 1, 1998, the Fund changed its name to Morgan Stanley Dean Witter Universal Funds, Inc. Effective May 1, 2000, the Fund changed its name to The Universal Institutional Funds, Inc.
Description of Shares and Voting Rights
The Fund's Articles of Incorporation, as amended, permit the Directors to issue 10.5 billion shares of common stock, par value $.001 per share, from an unlimited number of classes ("Portfolios") of shares. Currently the Fund consists of shares of 10 Portfolios. Each Portfolio (with the exception of the Global Franchise, Global Real Estate and Small Company Growth Portfolios) offers Class I shares. In addition, all Portfolios offer Class II shares.
The shares of each Portfolio of the Fund, upon issuance, are fully paid and nonassessable, and have no preference as to conversion, exchange, dividends, retirement or other features. The shares of each Portfolio of the Fund have no pre-emptive rights. The shares of the Fund have non-cumulative voting rights, which means that the holders of more than 50% of the shares voting for the election of Directors can elect 100% of the Directors if they choose to do so. A shareholder is entitled to one vote for each full share held (and a fractional vote for each fractional share held), then standing in his name on the books of the Fund.
Shares of each Portfolio will be voted by the insurance company or qualified plans investing in such Portfolio based on instructions received from the contract holders having a voting interest in the underlying account. Shares for which timely instructions are not received generally will be voted by the insurance company or qualified plans in the same proportion as shares for which instructions have been timely received. Therefore, as a result of this proportional voting, the vote of a small number of contract holders could determine the outcome of a proposal subject to a shareholder vote.
Dividends and Capital Gains Distributions
The Fund's policy is to distribute at least annually substantially all of each Portfolio's net investment income, if any. The Fund may also distribute any net realized capital gains in the amount and at the times that are intended to eliminate income (including taxable gains) taxes imposed on the distributing Portfolio (see discussion under "Taxes" in this SAI). However, the Fund may also choose to retain net realized capital gains and pay taxes on such gains. The amounts of any income dividends or capital gains distributions cannot be
93
predicted. Any dividend or distribution paid shortly after the purchase of shares of a Portfolio by an investor may have the effect of reducing the per share NAV of that Portfolio by the per share amount of the dividend or distribution.
Custody Arrangements
State Street, located at One Lincoln Street, Boston, Massachusetts 02111-2101, acts as the Fund's custodian. State Street is not an affiliate of the Adviser or the Distributor. In maintaining custody of foreign assets held outside the United States, State Street employs sub-custodians approved by the Board of Directors of the respective Funds in accordance with regulations of the SEC for the purpose of providing custodial services for such assets.
In the selection of foreign sub-custodians, the Directors or their delegates consider a number of factors, including, but not limited to, the reliability and financial stability of the institution, the ability of the institution to provide efficiently the custodial services required for the Funds, and the reputation of the institution in the particular country or region.
Independent Registered Public Accounting Firm
Ernst & Young LLP, located at 200 Clarendon Street, Boston, Massachusetts 02116-5072 serves as independent registered public accounting firm for the Fund and audits the annual financial statements of each Portfolio.
Legal Matters
Dechert LLP, located at 1095 Avenue of the Americas, New York, NY 10036-6797, acts as the Fund's legal counsel.
FINANCIAL STATEMENTS
The Fund's audited financial statements for the fiscal year ended December 31, 2011, including the notes thereto, and the reports of Ernst & Young, LLP, an independent registered public accounting firm, are herein incorporated by reference to the Fund's Annual Reports to Shareholders. A copy of the Fund's Annual Reports must accompany the delivery of this SAI.
94
APPENDIX A
MORGAN STANLEY INVESTMENT MANAGEMENT
PROXY VOTING POLICY AND PROCEDURES
I. POLICY STATEMENT
Morgan Stanley Investment Management's ("MSIM") policy and procedures for voting proxies ("Policy") with respect to securities held in the accounts of clients applies to those MSIM entities that provide discretionary investment management services and for which an MSIM entity has authority to vote proxies. This Policy is reviewed and updated as necessary to address new and evolving proxy voting issues and standards.
The MSIM entities covered by this Policy currently include the following: Morgan Stanley AIP GP LP, Morgan Stanley Investment Management Inc., Morgan Stanley Investment Management Limited, Morgan Stanley Investment Management Company, Morgan Stanley Asset & Investment Trust Management Co., Limited, Morgan Stanley Investment Management Private Limited and Private Investment Partners Inc. (each an "MSIM Affiliate" and collectively referred to as the "MSIM Affiliates" or as "we" below).
Each MSIM Affiliate will use its best efforts to vote proxies as part of its authority to manage, acquire and dispose of account assets. With respect to the MSIM registered management investment companies (the "MSIM Funds"), each MSIM Affiliate will vote proxies under this Policy pursuant to authority granted under its applicable investment advisory agreement or, in the absence of such authority, as authorized by the Board of Directors/Trustees of the MSIM Funds. A MSIM Affiliate will not vote proxies unless the investment management or investment advisory agreement explicitly authorizes the MSIM Affiliate to vote proxies. MSIM Affiliates will vote proxies in a prudent and diligent manner and in the best interests of clients, including beneficiaries of and participants in a client's benefit plan(s) for which the MSIM Affiliates manage assets, consistent with the objective of maximizing long-term investment returns ("Client Proxy Standard"). In certain situations, a client or its fiduciary may provide an MSIM Affiliate with a proxy voting policy. In these situations, the MSIM Affiliate will comply with the client's policy.
Proxy Research Services—ISS Governance Services ("ISS") and Glass Lewis (together with other proxy research providers as we may retain from time to time, the "Research Providers") are independent advisers that specialize in providing a variety of fiduciary-level proxy-related services to institutional investment managers, plan sponsors, custodians, consultants, and other institutional investors. The services provided include in-depth research, global issuer analysis, and voting recommendations. While we may review and utilize the recommendations of one or more Research Providers in making proxy voting decisions, we are in no way obligated to follow such recommendations. In addition to research, ISS provides vote execution, reporting, and recordkeeping services.
Voting Proxies for Certain Non-U.S. Companies—Voting proxies of companies located in some jurisdictions may involve several problems that can restrict or prevent the ability to vote such proxies or entail significant costs. These problems include, but are not limited to: (i) proxy statements and ballots being written in a language other than English; (ii) untimely and/or inadequate notice of shareholder meetings; (iii) restrictions on the ability of holders outside the issuer's jurisdiction of organization to exercise votes; (iv) requirements to vote proxies in person; (v) the imposition of restrictions on the sale of the securities for a period of time in proximity to the shareholder meeting; and (vi) requirements to provide local agents with power of attorney to facilitate our voting instructions. As a result, we vote clients' non-U.S. proxies on a best efforts basis only, after weighing the costs and benefits of voting such proxies, consistent with the Client Proxy Standard. ISS has been retained to provide assistance in connection with voting non-U.S. proxies.
II. GENERAL PROXY VOTING GUIDELINES
To promote consistency in voting proxies on behalf of its clients, we follow this Policy (subject to any exception set forth herein). The Policy addresses a broad range of issues, and provides general voting parameters on proposals that arise most frequently. However, details of specific proposals vary, and those details affect particular voting decisions, as do factors specific to a given company. Pursuant to the procedures set forth herein, we may vote in a manner that is not in accordance with the following general guidelines, provided the vote is approved by the Proxy Review Committee (see Section III for description) and is consistent with the Client Proxy Standard. Morgan Stanley AIP GP LP will follow the procedures as described in Appendix A.
A-1
We endeavor to integrate governance and proxy voting policy with investment goals, using the vote to encourage portfolio companies to enhance long-term shareholder value and to provide a high standard of transparency such that equity markets can value corporate assets appropriately.
We seek to follow the Client Proxy Standard for each client. At times, this may result in split votes, for example when different clients have varying economic interests in the outcome of a particular voting matter (such as a case in which varied ownership interests in two companies involved in a merger result in different stakes in the outcome). We also may split votes at times based on differing views of portfolio managers.
We may abstain on matters for which disclosure is inadequate.
A. Routine Matters.
We generally support routine management proposals. The following are examples of routine management proposals:
• Approval of financial statements and auditor reports if delivered with an unqualified auditor's opinion.
• General updating/corrective amendments to the charter, articles of association or bylaws, unless we believe that such amendments would diminish shareholder rights.
• Most proposals related to the conduct of the annual meeting, with the following exceptions. We generally oppose proposals that relate to "the transaction of such other business which may come before the meeting," and open-ended requests for adjournment. However, where management specifically states the reason for requesting an adjournment and the requested adjournment would facilitate passage of a proposal that would otherwise be supported under this Policy (i.e. an uncontested corporate transaction), the adjournment request will be supported.
We generally support shareholder proposals advocating confidential voting procedures and independent tabulation of voting results.
B. Board of Directors.
1. Election of directors: Votes on board nominees can involve balancing a variety of considerations. In vote decisions, we may take into consideration whether the company has a majority voting policy in place that we believe makes the director vote more meaningful. In the absence of a proxy contest, we generally support the board's nominees for director except as follows:
a. We consider withholding support from or voting against a nominee if we believe a direct conflict exists between the interests of the nominee and the public shareholders, including failure to meet fiduciary standards of care and/or loyalty. We may oppose directors where we conclude that actions of directors are unlawful, unethical or negligent. We consider opposing individual board members or an entire slate if we believe the board is entrenched and/or dealing inadequately with performance problems; if we believe the board is acting with insufficient independence between the board and management; or if we believe the board has not been sufficiently forthcoming with information on key governance or other material matters.
b. We consider withholding support from or voting against interested directors if the company's board does not meet market standards for director independence, or if otherwise we believe board independence is insufficient. We refer to prevalent market standards as promulgated by a stock exchange or other authority within a given market (e.g., New York Stock Exchange or Nasdaq rules for most U.S. companies, and The Combined Code on Corporate Governance in the United Kingdom). Thus, for an NYSE company with no controlling shareholder, we would expect that at a minimum a majority of directors should be independent as defined by NYSE. Where we view market standards as inadequate, we may withhold votes based on stronger independence standards. Market standards notwithstanding, we generally do not view long board tenure alone as a basis to classify a director as non-independent.
i. At a company with a shareholder or group that controls the company by virtue of a majority economic interest in the company, we have a reduced expectation for board independence, although we believe the presence of independent directors can be helpful, particularly in staffing the audit committee, and at times we may withhold support from or vote against a nominee on the view the
A-2
board or its committees are not sufficiently independent. In markets where board independence is not the norm (e.g. Japan), however, we consider factors including whether a board of a controlled company includes independent members who can be expected to look out for interests of minority holders.
ii. We consider withholding support from or voting against a nominee if he or she is affiliated with a major shareholder that has representation on a board disproportionate to its economic interest.
c. Depending on market standards, we consider withholding support from or voting against a nominee who is interested and who is standing for election as a member of the company's compensation/remuneration, nominating/governance or audit committee.
d. We consider withholding support or voting against nominees if the term for which they are nominated is excessive. We consider this issue on a market-specific basis.
e. We consider withholding support from or voting against nominees if, in our view, there has been insufficient board renewal (turnover), particularly in the context of extended poor company performance.
f. We consider withholding support from or voting against a nominee standing for election if the board has not taken action to implement generally accepted governance practices for which there is a "bright line" test. For example, in the context of the U.S. market, failure to eliminate a dead hand or slow hand poison pill would be seen as a basis for opposing one or more incumbent nominees.
g. In markets that encourage designated audit committee financial experts, we consider voting against members of an audit committee if no members are designated as such. We also may not support the audit committee members if the company has faced financial reporting issues and/or does not put the auditor up for ratification by shareholders.
h. We believe investors should have the ability to vote on individual nominees, and may abstain or vote against a slate of nominees where we are not given the opportunity to vote on individual nominees.
i. We consider withholding support from or voting against a nominee who has failed to attend at least 75% of the nominee's board and board committee meetings within a given year without a reasonable excuse. We also consider opposing nominees if the company does not meet market standards for disclosure on attendance.
j. We consider withholding support from or voting against a nominee who appears overcommitted, particularly through service on an excessive number of boards. Market expectations are incorporated into this analysis; for U.S. boards, we generally oppose election of a nominee who serves on more than six public company boards (excluding investment companies), although we may reference National Association of Corporate Directors guidance suggesting that public company CEOs, for example, should serve no more than two outside boards given the level of time commitment required in their primary job.
2. Discharge of directors' duties: In markets where an annual discharge of directors' responsibility is a routine agenda item, we generally support such discharge. However, we may vote against discharge or abstain from voting where there are serious findings of fraud or other unethical behavior for which the individual bears responsibility. The annual discharge of responsibility represents shareholder approval of disclosed actions taken by the board during the year and may make future shareholder action against the board difficult to pursue.
3. Board independence: We generally support U.S. shareholder proposals requiring that a certain percentage (up to 66 2/3%) of the company's board members be independent directors, and promoting all-independent audit, compensation and nominating/governance committees.
4. Board diversity: We consider on a case-by-case basis shareholder proposals urging diversity of board membership with respect to social, religious or ethnic group.
5. Majority voting: We generally support proposals requesting or requiring majority voting policies in election of directors, so long as there is a carve-out for plurality voting in the case of contested elections.
A-3
6. Proxy access: We consider on a case-by-case basis shareholder proposals on particular procedures for inclusion of shareholder nominees in company proxy statements.
7. Reimbursement for dissident nominees: We generally support well-crafted U.S. shareholder proposals that would provide for reimbursement of dissident nominees elected to a board, as the cost to shareholders in electing such nominees can be factored into the voting decision on those nominees.
8. Proposals to elect directors more frequently: In the U.S. public company context, we usually support shareholder and management proposals to elect all directors annually (to "declassify" the board), although we make an exception to this policy where we believe that long-term shareholder value may be harmed by this change given particular circumstances at the company at the time of the vote on such proposal. As indicated above, outside the U.S., we generally support greater accountability to shareholders that comes through more frequent director elections, but recognize that many markets embrace longer term lengths, sometimes for valid reasons given other aspects of the legal context in electing boards.
9. Cumulative voting: We generally support proposals to eliminate cumulative voting in the U.S. market context. (Cumulative voting provides that shareholders may concentrate their votes for one or a handful of candidates, a system that can enable a minority bloc to place representation on a board.) U.S. proposals to establish cumulative voting in the election of directors generally will not be supported.
10. Separation of Chairman and CEO positions: We vote on shareholder proposals to separate the Chairman and CEO positions and/or to appoint an independent Chairman based in part on prevailing practice in particular markets, since the context for such a practice varies. In many non-U.S. markets, we view separation of the roles as a market standard practice, and support division of the roles in that context. In the U.S., we consider such proposals on a case-by-case basis, considering, among other things, the existing board leadership structure, company performance, and any other evidence of entrenchment or perceived risk that power is overly concentrated in a single individual.
11. Director retirement age and term limits: Proposals setting or recommending director retirement ages or director term limits are voted on a case-by-case basis that includes consideration of company performance, the rate of board renewal, evidence of effective individual director evaluation processes, and any indications of entrenchment...
12. Proposals to limit directors' liability and/or broaden indemnification of officers and directors. Generally, we will support such proposals provided that an individual is eligible only if he or she has not acted in bad faith, with gross negligence or with reckless disregard of their duties.
C. Statutory auditor boards
The statutory auditor board, which is separate from the main board of directors, plays a role in corporate governance in several markets. These boards are elected by shareholders to provide assurance on compliance with legal and accounting standards and the company's articles of association. We generally vote for statutory auditor nominees if they meet independence standards. In markets that require disclosure on attendance by internal statutory auditors, however, we consider voting against nominees for these positions who failed to attend at least 75% of meetings in the previous year. We also consider opposing nominees if the company does not meet market standards for disclosure on attendance.
D. Corporate transactions and proxy fights.
We examine proposals relating to mergers, acquisitions and other special corporate transactions (i.e., takeovers, spin-offs, sales of assets, reorganizations, restructurings and recapitalizations) on a case-by-case basis in the interests of each fund or other account. Proposals for mergers or other significant transactions that are friendly and approved by the Research Providers usually are supported if there is no portfolio manager objection. We also analyze proxy contests on a case-by-case basis.
E. Changes in capital structure.
1. We generally support the following:
• Management and shareholder proposals aimed at eliminating unequal voting rights, assuming fair economic treatment of classes of shares we hold.
A-4
• U.S. management proposals to increase the authorization of existing classes of common stock (or securities convertible into common stock) if: (i) a clear business purpose is stated that we can support and the number of shares requested is reasonable in relation to the purpose for which authorization is requested; and/or (ii) the authorization does not exceed 100% of shares currently authorized and at least 30% of the total new authorization will be outstanding. (We consider proposals that do not meet these criteria on a case-by-case basis.)
• U.S. management proposals to create a new class of preferred stock or for issuances of preferred stock up to 50% of issued capital, unless we have concerns about use of the authority for anti-takeover purposes.
• Proposals in non-U.S. markets that in our view appropriately limit potential dilution of existing shareholders. A major consideration is whether existing shareholders would have preemptive rights for any issuance under a proposal for standing share issuance authority. We generally consider market-specific guidance in making these decisions; for example, in the U.K. market, we usually follow Association of British Insurers' ("ABI") guidance, although company-specific factors may be considered and for example, may sometimes lead us to voting against share authorization proposals even if they meet ABI guidance.
• Management proposals to authorize share repurchase plans, except in some cases in which we believe there are insufficient protections against use of an authorization for anti-takeover purposes.
• Management proposals to reduce the number of authorized shares of common or preferred stock, or to eliminate classes of preferred stock.
• Management proposals to effect stock splits.
• Management proposals to effect reverse stock splits if management proportionately reduces the authorized share amount set forth in the corporate charter. Reverse stock splits that do not adjust proportionately to the authorized share amount generally will be approved if the resulting increase in authorized shares coincides with the proxy guidelines set forth above for common stock increases.
• Management dividend payout proposals, except where we perceive company payouts to shareholders as inadequate.
2. We generally oppose the following (notwithstanding management support):
• Proposals to add classes of stock that would substantially dilute the voting interests of existing shareholders.
• Proposals to increase the authorized or issued number of shares of existing classes of stock that are unreasonably dilutive, particularly if there are no preemptive rights for existing shareholders. However, depending on market practices, we consider voting for proposals giving general authorization for issuance of shares not subject to pre-emptive rights if the authority is limited.
• Proposals that authorize share issuance at a discount to market rates, except where authority for such issuance is de minimis, or if there is a special situation that we believe justifies such authorization (as may be the case, for example, at a company under severe stress and risk of bankruptcy).
• Proposals relating to changes in capitalization by 100% or more.
We consider on a case-by-case basis shareholder proposals to increase dividend payout ratios, in light of market practice and perceived market weaknesses, as well as individual company payout history and current circumstances. For example, currently we perceive low payouts to shareholders as a concern at some Japanese companies, but may deem a low payout ratio as appropriate for a growth company making good use of its cash, notwithstanding the broader market concern.
F. Takeover Defenses and Shareholder Rights.
1. Shareholder rights plans: We generally support proposals to require shareholder approval or ratification of shareholder rights plans (poison pills). In voting on rights plans or similar takeover defenses, we consider on a case-by-case basis whether the company has demonstrated a need for the defense in the context of promoting long-term share value; whether provisions of the defense are in line with generally accepted governance principles in the market (and specifically the presence of an adequate qualified offer provision that would
A-5
exempt offers meeting certain conditions from the pill); and the specific context if the proposal is made in the midst of a takeover bid or contest for control.
2. Supermajority voting requirements: We generally oppose requirements for supermajority votes to amend the charter or bylaws, unless the provisions protect minority shareholders where there is a large shareholder. In line with this view, in the absence of a large shareholder we support reasonable shareholder proposals to limit such supermajority voting requirements.
3. Shareholder rights to call meetings: We consider proposals to enhance shareholder rights to call meetings on a case-by-case basis. At large-cap U.S. companies, we generally support efforts to establish the rights of holders of 10% or more of shares to call special meetings, unless the board or state law has a set policy or law establishing such rights at a threshold that we believe to be acceptable.
4. Written consent rights: In the U.S. context, we examine proposals for shareholder written consent rights on a case-by-case basis.
5. Reincorporation: We consider management and shareholder proposals to reincorporate to a different jurisdiction on a case-by-case basis. We oppose such proposals if we believe the main purpose is to take advantage of laws or judicial precedents that reduce shareholder rights.
6. Anti-greenmail provisions: Proposals relating to the adoption of anti-greenmail provisions will be supported, provided that the proposal: (i) defines greenmail; (ii) prohibits buyback offers to large block holders (holders of at least 1% of the outstanding shares and in certain cases, a greater amount) not made to all shareholders or not approved by disinterested shareholders; and (iii) contains no anti-takeover measures or other provisions restricting the rights of shareholders.
7. Bundled proposals: We may consider opposing or abstaining on proposals if disparate issues are "bundled" and presented for a single vote.
G. Auditors.
We generally support management proposals for selection or ratification of independent auditors. However, we may consider opposing such proposals with reference to incumbent audit firms if the company has suffered from serious accounting irregularities and we believe rotation of the audit firm is appropriate, or if fees paid to the auditor for non-audit-related services are excessive. Generally, to determine if non-audit fees are excessive, a 50% test will be applied (i.e., non-audit-related fees should be less than 50% of the total fees paid to the auditor). We generally vote against proposals to indemnify auditors.
H. Executive and Director Remuneration.
1. We generally support the following:
• Proposals for employee equity compensation plans and other employee ownership plans, provided that our research does not indicate that approval of the plan would be against shareholder interest. Such approval may be against shareholder interest if it authorizes excessive dilution and shareholder cost, particularly in the context of high usage ("run rate") of equity compensation in the recent past; or if there are objectionable plan design and provision.
• Proposals relating to fees to outside directors, provided the amounts are not excessive relative to other companies in the country or industry, and provided that the structure is appropriate within the market context. While stock-based compensation to outside directors is positive if moderate and appropriately structured, we are wary of significant stock option awards or other performance-based awards for outside directors, as well as provisions that could result in significant forfeiture of value on a director's decision to resign from a board (such forfeiture can undercut director independence).
• Proposals for employee stock purchase plans that permit discounts, but only for grants that are part of a broad-based employee plan, including all non-executive employees, and only if the discounts are limited to a reasonable market standard or less.
• Proposals for the establishment of employee retirement and severance plans, provided that our research does not indicate that approval of the plan would be against shareholder interest.
A-6
2. We generally oppose retirement plans and bonuses for non-executive directors and independent statutory auditors.
3. In the U.S. context, shareholder proposals requiring shareholder approval of all severance agreements will not be supported, but proposals that require shareholder approval for agreements in excess of three times the annual compensation (salary and bonus) generally will be supported. We generally oppose shareholder proposals that would establish arbitrary caps on pay. We consider on a case-by-case basis shareholder proposals that seek to limit Supplemental Executive Retirement Plans (SERPs), but support such proposals where we consider SERPs to be excessive.
4. Shareholder proposals advocating stronger and/or particular pay-for-performance models will be evaluated on a case-by-case basis, with consideration of the merits of the individual proposal within the context of the particular company and its labor markets, and the company's current and past practices. While we generally support emphasis on long-term components of senior executive pay and strong linkage of pay to performance, we consider factors including whether a proposal may be overly prescriptive, and the impact of the proposal, if implemented as written, on recruitment and retention.
5. We generally support proposals advocating reasonable senior executive and director stock ownership guidelines and holding requirements for shares gained in executive equity compensation programs
6. We generally support shareholder proposals for reasonable "claw-back" provisions that provide for company recovery of senior executive bonuses to the extent they were based on achieving financial benchmarks that were not actually met in light of subsequent restatements.
7. Management proposals effectively to re-price stock options are considered on a case-by-case basis. Considerations include the company's reasons and justifications for a re-pricing, the company's competitive position, whether senior executives and outside directors are excluded, potential cost to shareholders, whether the re-pricing or share exchange is on a value-for-value basis, and whether vesting requirements are extended.
8. Say-on-Pay: We consider proposals relating to an advisory vote on remuneration on a case-by-case basis. Considerations include a review of the relationship between executive remuneration and performance based on operating trends and total shareholder return over multiple performance periods. In addition, we review remuneration structures and potential poor pay practices, including relative magnitude of pay, discretionary bonus awards, tax gross ups, change-in-control features, internal pay equity and peer group construction. As long-term investors, we support remuneration policies that align with long-term shareholder returns.
I. Social, Political and Environmental Issues.
Shareholders in the U.S. and certain other markets submit proposals encouraging changes in company disclosure and practices related to particular corporate, social, political and environmental matters. We consider how to vote on the proposals on a case-by-case basis to determine likely impacts on shareholder value. We seek to balance concerns on reputational and other risks that lie behind a proposal against costs of implementation, while considering appropriate shareholder and management prerogatives. We may abstain from voting on proposals that do not have a readily determinable financial impact on shareholder value. We support proposals that, if implemented, would enhance useful disclosure, but we generally vote against proposals requesting reports that we believe are duplicative, related to matters not material to the business, or that would impose unnecessary or excessive costs. We believe that certain social and environmental shareholder proposals may intrude excessively on management prerogatives, which can lead us to oppose them.
J. Fund of Funds.
Certain Funds advised by an MSIM Affiliate invest only in other MSIM Funds. If an underlying fund has a shareholder meeting, in order to avoid any potential conflict of interest, such proposals will be voted in the same proportion as the votes of the other shareholders of the underlying fund, unless otherwise determined by the Proxy Review Committee.
III. ADMINISTRATION OF POLICY
The MSIM Proxy Review Committee (the "Committee") has overall responsibility for the Policy. The Committee, which is appointed by MSIM's Long-Only Executive Committee, consists of investment professionals who represent the different investment disciplines and geographic locations of the firm, and is chaired by the director
A-7
of the Corporate Governance Team ("CGT"). Because proxy voting is an investment responsibility and impacts shareholder value, and because of their knowledge of companies and markets, portfolio managers and other members of investment staff play a key role in proxy voting, although the Committee has final authority over proxy votes.
The CGT Director is responsible for identifying issues that require Committee deliberation or ratification. The CGT, working with advice of investment teams and the Committee, is responsible for voting on routine items and on matters that can be addressed in line with these Policy guidelines. The CGT has responsibility for voting case-by-case where guidelines and precedent provide adequate guidance.
The Committee will periodically review and have the authority to amend, as necessary, the Policy and establish and direct voting positions consistent with the Client Proxy Standard.
CGT and members of the Committee may take into account Research Providers' recommendations and research as well as any other relevant information they may request or receive, including portfolio manager and/or analyst comments and research, as applicable. Generally, proxies related to securities held in accounts that are managed pursuant to quantitative, index or index-like strategies ("Index Strategies") will be voted in the same manner as those held in actively managed accounts, unless economic interests of the accounts differ. Because accounts managed using Index Strategies are passively managed accounts, research from portfolio managers and/or analysts related to securities held in these accounts may not be available. If the affected securities are held only in accounts that are managed pursuant to Index Strategies, and the proxy relates to a matter that is not described in this Policy, the CGT will consider all available information from the Research Providers, and to the extent that the holdings are significant, from the portfolio managers and/or analysts.
A. Committee Procedures
The Committee meets at least quarterly and reviews and considers changes to the Policy at least annually. Through meetings and/or written communications, the Committee is responsible for monitoring and ratifying "split votes" (i.e., allowing certain shares of the same issuer that are the subject of the same proxy solicitation and held by one or more MSIM portfolios to be voted differently than other shares) and/or "override voting" (i.e., voting all MSIM portfolio shares in a manner contrary to the Policy). The Committee will review developing issues and approve upcoming votes, as appropriate, for matters as requested by CGT.
The Committee reserves the right to review voting decisions at any time and to make voting decisions as necessary to ensure the independence and integrity of the votes.
B. Material Conflicts of Interest
In addition to the procedures discussed above, if the CGT Director determines that an issue raises a material conflict of interest, the CGT Director may request a special committee to review, and recommend a course of action with respect to, the conflict(s) in question ("Special Committee").
A potential material conflict of interest could exist in the following situations, among others:
1. The issuer soliciting the vote is a client of MSIM or an affiliate of MSIM and the vote is on a matter that materially affects the issuer.
2. The proxy relates to Morgan Stanley common stock or any other security issued by Morgan Stanley or its affiliates except if echo voting is used, as with MSIM Funds, as described herein.
3. Morgan Stanley has a material pecuniary interest in the matter submitted for a vote (e.g., acting as a financial advisor to a party to a merger or acquisition for which Morgan Stanley will be paid a success fee if completed).
If the CGT Director determines that an issue raises a potential material conflict of interest, depending on the facts and circumstances, the issue will be addressed as follows:
1. If the matter relates to a topic that is discussed in this Policy, the proposal will be voted as per the Policy.
2. If the matter is not discussed in this Policy or the Policy indicates that the issue is to be decided case-by-case, the proposal will be voted in a manner consistent with the Research Providers, provided that all the Research Providers consulted have the same recommendation, no portfolio manager objects to that vote, and the vote is consistent with MSIM's Client Proxy Standard.
A-8
3. If the Research Providers' recommendations differ, the CGT Director will refer the matter to a Special Committee to vote on the proposal, as appropriate.
Any Special Committee shall be comprised of the CGT Director and at least two portfolio managers (preferably members of the Committee) as approved by the Committee. The CGT Director may request non-voting participation by MSIM's General Counsel or his/her designee and the Chief Compliance Officer or his/her designee. In addition to the research provided by Research Providers, the Special Committee may request analysis from MSIM Affiliate investment professionals and outside sources to the extent it deems appropriate.
C. Proxy Voting Reporting
The CGT will document in writing all Committee and Special Committee decisions and actions, which documentation will be maintained by the CGT for a period of at least six years. To the extent these decisions relate to a security held by an MSIM Fund, the CGT will report the decisions to each applicable Board of Trustees/Directors of those Funds at each Board's next regularly scheduled Board meeting. The report will contain information concerning decisions made during the most recently ended calendar quarter immediately preceding the Board meeting.
MSIM will promptly provide a copy of this Policy to any client requesting it. MSIM will also, upon client request, promptly provide a report indicating how each proxy was voted with respect to securities held in that client's account.
MSIM's Legal Department is responsible for filing an annual Form N-PX on behalf of each MSIM Fund for which such filing is required, indicating how all proxies were voted with respect to such Fund's holdings.
A-9
APPENDIX A
The following procedures apply to accounts managed by Morgan Stanley AIP GP LP and Private Investment Partners Inc. ("AIP").
Generally, AIP will follow the guidelines set forth in Section II of MSIM's Proxy Voting Policy and Procedures. To the extent that such guidelines do not provide specific direction, or AIP determines that consistent with the Client Proxy Standard, the guidelines should not be followed, the Proxy Review Committee has delegated the voting authority to vote securities held by accounts managed by AIP to the Fund of Hedge Funds investment team, the Private Equity Fund of Funds investment team or the Private Equity Real Estate Fund of Funds investment team of AIP. A summary of decisions made by the investment teams will be made available to the Proxy Review Committee for its information at the next scheduled meeting of the Proxy Review Committee.
In certain cases, AIP may determine to abstain from determining (or recommending) how a proxy should be voted (and therefore abstain from voting such proxy or recommending how such proxy should be voted), such as where the expected cost of giving due consideration to the proxy does not justify the potential benefits to the affected account(s) that might result from adopting or rejecting (as the case may be) the measure in question.
Waiver of Voting Rights
For regulatory reasons, AIP may either 1) invest in a class of securities of an underlying fund (the "Fund") that does not provide for voting rights; or 2) waive 100% of its voting rights with respect to the following:
1. Any rights with respect to the removal or replacement of a director, general partner, managing member or other person acting in a similar capacity for or on behalf of the Fund (each individually a "Designated Person," and collectively, the "Designated Persons"), which may include, but are not limited to, voting on the election or removal of a Designated Person in the event of such Designated Person's death, disability, insolvency, bankruptcy, incapacity, or other event requiring a vote of interest holders of the Fund to remove or replace a Designated Person; and
2. Any rights in connection with a determination to renew, dissolve, liquidate, or otherwise terminate or continue the Fund, which may include, but are not limited to, voting on the renewal, dissolution, liquidation, termination or continuance of the Fund upon the occurrence of an event described in the Fund's organizational documents; provided, however, that, if the Fund's organizational documents require the consent of the Fund's general partner or manager, as the case may be, for any such termination or continuation of the Fund to be effective, then AIP may exercise its voting rights with respect to such matter.
Approved by Morgan Stanley Funds Board on September 27-28, 2011
A-10
APPENDIX B — DESCRIPTION OF RATINGS
I. Excerpts from Moody's Investors Service, Inc.'s Corporate Bond Ratings:
Aaa: Judged to be of the best quality; carry the smallest degree of invest risk;
Aa: judged to be of high quality by all standards;
A: possess many favorable investment attributes and are to be considered upper medium grade obligations;
Baa: considered as medium grade obligations; i.e., they are neither highly protected nor poorly secured;
Ba: judged to have speculative elements; their future cannot be considered well-assured;
B: assurance of interest and principal payments or of maintenance of other terms of the contract over any long period of time may be small.
Caa: Bonds which are rated Caa are of poor standing. Such issues may be in default or there may be present elements of danger with respect to principal or interest.
Ca: Bonds which are rated Ca represent obligations which are speculative in a high degree. Such issues are often in default or have other marked shortcomings.
C: Bonds which are rated C are lowest rated class of bonds and issues so rated can be regarded as having extremely poor prospects of ever attaining any real investment standing.
Note: Moody's applies numerical modifiers, 1, 2 and 3 in each generic rating classification from Aa through Caa in its corporate bond rating system. The modifier 1 indicates that the obligation ranks in the higher end of its generic rating category; the modifier 2 indicates a mid-range ranking; and the modifier 3 indicates that the issue ranks in the lower end of its generic rating category.
II. Excerpts from Standard & Poor's Rating Group's Corporate Bond Ratings:
AAA: Highest rating assigned for an obligation; obligor has extremely strong capacity to meet its financial commitments;
AA: obligation differs from the highest-rated obligations only in small degree; obligor's capacity to meet its financial commitment on the obligation is very strong;
A: obligation is somewhat more susceptible to the adverse effects of changes in circumstances and economic conditions than obligations in higher-rated categories; obligor's capacity to meet its financial commitment on the obligation is still strong;
BBB: obligation exhibits adequate protection parameters; adverse economic conditions or changing circumstances are more likely to lead to a weakened capacity of the obligor to meet its financial commitment on the obligation.
BB, B, CCC, CC, C: Obligations rated BB, B, CCC, and CC are regarded as having significant speculative characteristics. BB indicates the least degree of speculation and CC the highest. While such obligations will likely have some quality and protective characteristics, these may be outweighed by large uncertainties or major exposures to adverse conditions. The C rating may be used to cover a situation where a bankruptcy petition has been filed or similar action has been taken, but payments on this obligation are being continued.
D: An obligation rated D is in payment default. The D rating category is used when payments on an obligation are not made on the date due even if the applicable grace period has not expired, unless Standard & Poor's believes that such payments will be made during such grace period. The D rating also will be used upon the filing of a bankruptcy petition or the taking of a similar action if payments on an obligation are jeopardized.
Plus (+) or minus (-): The ratings from AA to CCC may be modified by the addition of a plus or minus sign to show relative standing within the major rating categories.
B-1
III. Excerpts from Fitch, Inc.'s Corporate Bond Ratings:
AAA: Highest credit quality; denotes the lowest expectation of credit risk; assigned only in case of exceptionally strong capacity for payment of financial commitments. This capacity is highly unlikely to be adversely affected by foreseeable events.
AA: Very high credit quality; denote expectations of very low credit risk; indicate very strong capacity for payment of financial commitments. This capacity is not significantly vulnerable to foreseeable events.
A: High credit quality; denote expectations of low credit risk. The capacity for payment of financial commitments is considered strong. This capacity may, nevertheless, be more vulnerable to changes in circumstances or in economic conditions than is the case for higher ratings.
BBB: Good credit quality; indicate that there is currently expectations of low credit risk. The capacity for payment of financial commitments is considered adequate but adverse changes in circumstances and economic conditions are more likely to impair this capacity. This is the lowest investment grade category.
BB: Speculative; indicate that there is a possibility of credit risk developing, particularly as the result of adverse economic change over time; however, business or financial alternatives may be available to allow financial commitments to be met. Securities rated in this category are not investment grade.
B: Highly speculative; indicate that significant credit risk is present, but a limited margin of safety remains. Financial commitments are currently being met; however, capacity for continued payment is contingent upon a sustained, favorable business and economic environment.
CCC: Default is a real possibility. Capacity for meeting financial commitments is solely reliant upon sustained, favorable business or economic conditions.
CC: Default of some kind appears probable.
C: Default is imminent.
RD: Indicates an entity that has failed to make due payments (within the applicable grace period) on some but not all material financial obligations, but continues to honor other classes of obligations.
D: Default. Default is determined by reference to the terms of the obligations' documentation. Fitch will assign default ratings where it has reasonably determined that payment has not been made on a material obligation in accordance with the requirements of the obligation's documentation, or where it believes that default ratings consistent with Fitch's published definition of default are the most appropriate ratings to assign.
The modifiers "+" or "-" may be appended to a rating to denote relative status within major rating categories. Such suffixes are not added to the AAA Long-term rating category or to categories below CCC.
IV. Excerpts from Moody's Investors Service, Inc.'s Preferred Stock Ratings:
aaa: An issue which is rated aaa is considered to be a top-quality preferred stock. This rating indicates good asset protection and the least risk of dividend impairment within the universe of preferred stocks.
aa: An issue which is rated aa is considered a high-grade preferred stock. This rating indicates that there is reasonable assurance that earnings and asset protection will remain relatively well maintained in the foreseeable future.
a: An issue which is rated a is considered to be an upper medium grade preferred stock. While risks are judged to be somewhat greater than in the aaa and aa classifications, earnings and asset protection are, nevertheless expected to be maintained at adequate levels.
baa: An issue which is rated baa is considered to be medium grade, neither highly protected nor poorly secured. Earnings and asset protection appear adequate at present but may be questionable over any great length of time.
B-2
ba: an issue which is rated ba is considered to have speculative elements and its future cannot be considered well assured. Earnings and asset protection may be very moderate and not well safeguarded during adverse periods. Uncertainty of position characterizes preferred stocks in this class.
b: An issue which is rated b generally lacks the characteristics of a desirable investment. Assurance of dividend payments and maintenance of other terms of the issue over any long period of time may be small.
caa: An issue which is rated caa is likely to be in arrears on dividend payments. This rating designation does not purport to indicate the future status of payment.
ca: An issue which is rated ca is speculative in a high degree and is likely to be in arrears on dividends with little likelihood of eventual payment.
c: This is the lowest rated class of preferred of preference stock. Issues so rated can be regarded as having extremely poor prospects of ever attaining any real investment standing.
Note: Moody's may apply numerical modifiers 1, 2 and 3 in each rating classification from "aa" through "b" in its preferred stock rating system. The modifier 1 indicated that the security ranks in the higher end of its generic rating category; the modifier 2 indicates a mid-range ranking; and the modifier 3 indicates that the issue ranks in the lower end of its generic rating category.
V. Excerpts from Standard & Poor's Rating Group's Preferred Stock Ratings:
AAA: This is the highest rating that may be assigned by S&P's to a preferred stock issue and indicates an extremely strong capacity to pay the preferred stock obligations.
AA: A preferred stock issue rated AA also qualifies as a high quality fixed income security. The capacity to pay preferred stock obligations is very strong, although not as overwhelming as for issues rated AAA.
A: An issue rated A is backed by a sound capacity to pay the preferred stock obligations, although it is somewhat more susceptible to the adverse effect of the changes in circumstances and economic conditions.
BBB: An issue rated BBB is regarded as backed by an adequate capacity to pay the preferred stock obligations. Whereas it normally exhibits adequate protection parameter, adverse economic conditions or changing circumstances are more likely to lead to a weakened capacity to make payments for a preferred stock in this category than for issues in the A category.
BB, B, CCC: Preferred stock rated BB, B, and CCC are regarded, on balance, as predominantly speculative with respect to the issuer's capacity to pay preferred stock obligations. Bb indicates the lowest degree of speculation and CCC the highest degree of speculation. While such issues will likely have some quality and protective characteristics, these are outweighed by large uncertainties of major risk exposures to adverse conditions.
CC: The rating CC is reserved for a preferred stock in arrears on dividends or sinking fund payments but that is currently paying.
C: A preferred stock rated C is a non-paying issue.
D: A preferred stock rated D is a non-paying issue with the issuer in default on debt instruments.
Plus (+) or Minus (-): The ratings from AA for CCC may be modified by the addition of a plus or minus sign to show relative standing within the major rating categories.
VI. Excerpts from Fitch, Inc's Preferred Stock Ratings:
AAA: These preferred stocks are considered to be investment grade and of the highest credit quality. The obligor has an exceptionally strong ability to pay, which is unlikely to be affected by reasonably foreseeable events.
B-3
AA: These preferred stocks are considered to be investment grade and of very high credit quality. The obligor's ability to pay is very strong, although not quite as strong as preferred stocks rated "AAA".
A: These preferred stocks are considered to be investment grade and of high credit quality. The obligor's ability to pay is considered to be strong, but may be more vulnerable to adverse changes in economic conditions and circumstances than preferred stocks with higher ratings.
BBB: These preferred stocks are considered to be investment grade and of satisfactory credit quality. The obligor's ability to pay interest and repay principal is considered to be adequate. Adverse changes in economic conditions and circumstances, however, are more likely to have adverse impact on these preferred stocks, and therefore, impair timely payment. The likelihood that the ratings of these preferred stocks will fall below investment grade is higher than for preferred stocks with higher ratings.
BB: These preferred stocks are considered speculative. The obligor's ability to pay may be affected over time by adverse economic changes. However, business and financial alternatives can be identified that could assist the obligor in satisfying its dividend payment requirements.
B: These preferred stocks are considered highly speculative. While preferred in this class are currently meeting dividend payment requirements, the probability of continued timely payment reflects the obligor's limited margin of safety and the need for reasonable business and economic activity throughout the life of the issue.
CCC: These preferred stocks have certain identifiable characteristics which, if not remedied, may lead to non-payment. The ability to meet obligations requires an advantageous business and economic environment.
CC: These preferred stocks are minimally protected. Non-payment seems probable over time.
C: These preferred stocks are in imminent non-payment.
DDD, DD AND D: These preferred stocks are in non-payment. Such preferred stocks are extremely speculative and should be valued on the basis of their ultimate recovery value in liquidation or reorganization of the obligor. DDD represents the highest potential for recovery and D represents the lowest potential for recovery.
PLUS (+) OR MINUS (-): The ratings from AA to C may be modified by the addition of a plus or minus sign to indicate the relative position of a credit within the rating category.
B-4

January 16, 2013
Supplement
SUPPLEMENT DATED JANUARY 16, 2013 TO THE
STATEMENT OF ADDITIONAL INFORMATION OF
MORGAN STANLEY VARIABLE INVESTMENT SERIES
(the "Fund")
Dated April 30, 2012
Jaidip Singh no longer manages the Limited Duration or Strategist Portfolios (collectively, the "Portfolios"). As a result, all references to Mr. Singh are hereby deleted from the Statement of Additional Information ("SAI"). Effective immediately, Divya Chhibba has been added to the teams primarily responsible for the day-to-day management of the Portfolios. Accordingly, effective immediately, the SAI is revised as follows:
With respect to the Limited Duration Portfolio, the section of the SAI entitled "V. Investment Advisory and Other Services—F. Fund Management—Other Accounts Managed by the Portfolio Managers at December 31, 2011 (unless otherwise indicated)" is hereby deleted and replaced with the following:
| | | Registered Investment
Companies | | Other Pooled Investment
Vehicles | | Other Accounts | |
Portfolio and
Portfolio Managers | | Number
of
Accounts | | Total Assets
in the
Accounts | | Number
of
Accounts | | Total Assets
in the
Accounts | | Number
of
Accounts | | Total Assets
in the
Accounts | |
Limited Duration | |
Joseph Mehlman | | | 6 | | | $661.9 million | | | 0 | | | | 0 | | | | 53 | | | $13.0 billion | |
Divya Chhibba* | | | 2 | | | $1.2 billion | | | 0 | | | | 0 | | | | 1 | | | $313.2 million | |
Neil Stone | | | 7 | | | $785.8 million | | | 0 | | | | 0 | | | | 61 | (3) | | $12.5 billion(3) | |
* As of November 30, 2012.
(3) Of these other accounts, one account with total assets of approximately $734.2 million had performance-based fees.
***
With respect to the Strategist Portfolio, the section of the SAI entitled "V. Investment Advisory and Other Services—F. Fund Management—Other Accounts Managed by the Portfolio Managers at December 31, 2011 (unless otherwise indicated)" is hereby deleted and replaced with the following:
| | | Registered Investment
Companies | | Other Pooled Investment
Vehicles | | Other Accounts | |
Portfolio and
Portfolio Managers | | Number
of
Accounts | | Total Assets
in the
Accounts | | Number
of
Accounts | | Total Assets
in the
Accounts | | Number
of
Accounts | | Total Assets
in the
Accounts | |
Strategist | |
Mark A. Bavoso | | | 5 | | | $778.0 million | | | 2 | | | $602.7 million | | | 9 | (4) | | $4.1 billion(4) | |
Divya Chhibba* | | | 2 | | | $1.2 billion | | | 0 | | | 0 | | | 1 | | | $313.2 million | |
Neil Stone | | | 7 | | | $785.8 million | | | 0 | | | 0 | | | 61 | (3) | | $12.5 billion(3) | |
* As of November 30, 2012.
(3) Of these other accounts, one account with total assets of approximately $734.2 million had performance-based fees.
(4) Of these other accounts, three accounts with total assets of approximately $1.6 billion had performance-based fees.
***
With respect to the Limited Duration Portfolio, the section of the SAI entitled "V. Investment Advisory and Other Services—F. Fund Management—Securities Ownership of Portfolio Managers" is hereby deleted and replaced with the following:
Limited Duration | |
Divya Chhibba | | | none† | | |
Joseph Mehlman | | | none* | | |
Neil Stone | | | none | | |
* Not included in the table above, the portfolio manager has made investments in one or more other mutual funds managed by the same portfolio management team pursuant to a similar strategy.
† As of November 30, 2012.
***
With respect to the Strategist Portfolio, the section of the SAI entitled "V. Investment Advisory and Other Services—F. Fund Management—Securities Ownership of Portfolio Managers" is hereby deleted and replaced with the following:
Strategist | |
Mark A. Bavoso | | | none* | | |
Divya Chhibba | | | none† | | |
Neil Stone | | | none | | |
* Not included in the table above, the portfolio manager has made investments in one or more other mutual funds managed by the same portfolio management team pursuant to a similar strategy.
† As of November 30, 2012.
PLEASE RETAIN THIS SUPPLEMENT FOR FUTURE REFERENCE.

December 13, 2012
Supplement
SUPPLEMENT DATED DECEMBER 13, 2012 TO THE STATEMENT OF ADDITIONAL INFORMATION OF
MORGAN STANLEY VARIABLE INVESTMENT SERIES
(the "Fund")
Dated April 30, 2012
Effective December 13, 2012, the Board of Trustees of the Fund, on behalf of the Money Market Portfolio (the "Portfolio"), has approved investments by the Portfolio in municipal securities eligible under Rule 2a-7 of the Investment Company Act of 1940, as amended, as a principal investment strategy. Further, effective December 13, 2012, Morgan Stanley Investment Management Inc. terminated the advisory agreement with Morgan Stanley Investment Management Limited with respect to the Portfolio. Accordingly, all references to Morgan Stanley Investment Management Limited as sub-adviser to the Portfolio will be deleted. In addition, the following changes to the Fund's Statement of Additional Information ("SAI") are required:
The following is hereby added as the last paragraph of the section of the Fund's SAI entitled "II. Description of the Fund and Its Investments and Risks—C. Investment Strategies and Risks":
Municipal Obligations. Municipal obligations are securities issued by state and local governments and their agencies. These securities typically are "general obligation" or "revenue" bonds, notes or commercial paper, including participations in lease obligations and installment purchase contracts of municipalities. These obligations may have fixed, variable or floating rates. To the extent the Money Market Portfolio invests in municipal obligations issued by state and local governments and their agencies, the Portfolio may be susceptible to political, economic, regulatory or other factors affecting issuers of these municipal obligations.
***
The fourth paragraph of the section of the Fund's SAI entitled "V. Investment Advisory and Other Services—A. Adviser, Sub-Adviser and Administrator" is hereby deleted in its entirety.
***
The fourth paragraph of the section of the Fund's SAI entitled "V. Investment Advisory and Other Services—C. Services Provided by the Adviser, Sub-Advisers and Administrator" is hereby deleted in its entirety.
PLEASE RETAIN THIS SUPPLEMENT FOR FUTURE REFERENCE.

OCTOBER 1, 2012
Supplement
SUPPLEMENT DATED OCTOBER 1, 2012 TO THE STATEMENT OF ADDITIONAL INFORMATION OF
MORGAN STANLEY SELECT DIMENSIONS INVESTMENT SERIES, dated April 30, 2012
MORGAN STANLEY VARIABLE INVESTMENT SERIES, dated April 30, 2012
(collectively, the "Funds")
The second sentence of the first paragraph under the section of each Fund's Statement of Additional Information ("SAI") entitled "VIII. Purchase, Redemption and Pricing of Shares—B. Offering Price" is hereby deleted and replaced with the following:
Net asset value per share of each of Class X and Class Y shares is calculated by dividing the value of the portion of each Portfolio's securities and other assets attributable to each Class, respectively, less the total market value of the liabilities attributable to each Class, respectively, by the number of shares of the Class outstanding.
***
The fourteenth, fifteenth, sixteenth and seventeenth paragraphs under the section of each Fund's SAI entitled "VIII. Purchase, Redemption and Pricing of Shares—B. Offering Price" are hereby deleted and replaced with the following:
In the calculation of a Portfolio's net asset value (other than the Money Market Portfolio): (1) an equity portfolio security listed or traded on an exchange is valued at its latest reported sales price (or at the exchange official closing price if such exchange reports an official closing price), if there were no sales on a given day, the securities is valued at the mean between the last reported bid and asked prices; and (2) all other equity portfolio securities for which over-the-counter market quotations are readily available are valued at the mean between the last reported bid and asked prices. In cases where a security is traded on more than one exchange, the security is valued on the exchange designated as the primary market. When market quotations are not readily available, including circumstances under which it is determined by the Adviser (or if applicable, the Sub-Advisers) that the closing price, last sale price or the mean between the last reported bid and asked prices are not reflective of a security's market value, portfolio securities are valued at their fair value as determined in good faith under procedures established by and under the general supervision of the Fund's Board. For valuation purposes, quotations of foreign portfolio securities, other assets and liabilities and forward contracts stated in foreign currency are translated into U.S. dollar equivalents at the prevailing market rates prior to the close of the NYSE.
Short-term debt securities with remaining maturities of 60 days or less at the time of purchase may be valued at amortized cost, unless the Adviser determines such valuation does not reflect the securities' market value, in which case these securities will be valued at their fair market value as determined by the Adviser.
Certain of the Portfolios' securities (other than securities of the Money Market Portfolio) may be valued by an outside pricing service approved by the Fund's Board. The pricing service may utilize a matrix system or other model incorporating attributes such as security quality, maturity and coupon as the evaluation model parameters, and/or research evaluations by its staff, including review of broker-dealer market price quotations in determining what it believes is the fair valuation of the portfolio securities valued by such pricing service.
Listed options are valued at the last reported sales price on the exchange on which they are listed (or at the exchange official closing price if such exchange reports an official closing price). If an official closing price or last reported sale price is unavailable, the listed option should be fair valued at the mean between its latest bid and ask prices. If an exchange closing price or bid and asked prices are not available from the exchange, then the quotes from one or more brokers or dealers may be used. Unlisted options and swaps are valued by an outside pricing service approved by the Board or quotes from a broker or dealer. Unlisted options and swaps cleared on a clearinghouse or exchange may be valued using the closing price provided by the clearinghouse or exchange. Futures are valued at the settlement price on the exchange on which they trade or, if a settlement price is unavailable, then at the last sale price on the exchange.
***
The following is hereby added as the eighteenth paragraph under the section of each Fund's SAI entitled "VIII. Purchase, Redemption and Pricing of Shares—B. Offering Price:"
If the Adviser (or if applicable, Sub-Advisers) determine that the valuation received from the outside pricing service or broker or dealer is not reflective of the security's market value, such security is valued at its fair value as determined in good faith under procedures established by and under the general supervision of the Board.
***
The last two sentences of the last paragraph under the section of each Fund's SAI entitled "VIII. Purchase, Redemption and Pricing of Shares—B. Offering Price" are hereby deleted and replaced with the following:
Occasionally, events which may affect the values of such securities and such exchange rates may occur between the times at which they are determined and the close of the NYSE. If events that may affect the value of such securities occur during such period, then these securities may be valued at their fair value as determined in good faith under procedures established by and under the supervision of the Board.
PLEASE RETAIN THIS SUPPLEMENT FOR FUTURE REFERENCE.

June 26, 2012
Supplement
SUPPLEMENT DATED JUNE 26, 2012 TO THE STATEMENT OF ADDITIONAL INFORMATION OF
MORGAN STANLEY VARIABLE INVESTMENT SERIES
THE MONEY MARKET PORTFOLIO
CLASS X and CLASS Y
Dated April 30, 2012
Effective June 25, 2012, Morgan Stanley Investment Management Inc. entered into a Sub-Advisory Agreement with Morgan Stanley Investment Management Limited with respect to the Money Market Portfolio of Morgan Stanley Variable Investment Series (the "Portfolio"). As a result, the following changes to the Statement of Additional Information ("SAI") are required:
The following is hereby added as the fourth paragraph of the section of the Portfolio's SAI entitled "V. Investment Advisory and Other Services — A. Adviser, Sub-Adviser and Administrator":
With respect to the Money Market Portfolio, the Sub-Adviser is Morgan Stanley Investment Management Limited, a wholly-owned subsidiary of Morgan Stanley, whose address is 25 Cabot Square, Canary Wharf, London, E14 4QA, England. The Sub-Advisor is a wholly owned subsidiary of Morgan Stanley.
***
The first sentence of the seventh paragraph of the section of the Portfolio's SAI entitled "V. Investment Advisory and Other Services — A. Adviser, Sub-Adviser and Administrator" is hereby deleted and replaced with the following:
Pursuant to the sub-advisory agreements (each, a "Sub-Advisory Agreement") between the Adviser and each of the Sub-Advisers with respect to the European Equity Portfolio, the Global Infrastructure Portfolio and the Money Market Portfolio, the Sub-Advisers have been retained, subject to the overall supervision of the Adviser and the Trustees of the applicable Portfolios, to, together with the Adviser, continuously furnish investment advice concerning individual security selections, asset allocations and economic trends and management of the applicable Portfolios.
***
The first sentence of the first paragraph of the section of the Portfolio's SAI entitled "V. Investment Advisory and Other Services — C. Services Provided by the Adviser, Sub-Advisers and Administrator" is hereby deleted and replaced with the following:
The Adviser manages the Investment of each Portfolio's assets (other than the European Equity Portfolio, the Global Infrastructure Portfolio and the Money Market Portfolio), including the placing of orders for the purchase and sale of portfolio securities.
***
The following is hereby added as the fourth paragraph of the section of the Portfolio's SAI entitled "V. Investment Advisory and Other Services — C. Services Provided by the Adviser, Sub-Advisers and Administrator":
With respect to the Money Market Portfolio, the Sub-Adviser has been retained, subject to the overall supervision of the Adviser, to continuously furnish investment advice concerning individual security selections, asset allocations and overall economic trends and to assist with the management of the Portfolio's portfolio.
***
The first sentence of the fourth paragraph of the section of the Portfolio's SAI entitled "V. Investment Advisory and Other Services — C. Services Provided by the Adviser, Sub-Advisers and Administrator" is hereby deleted and replaced with:
Expenses not expressly assumed by the Adviser under the Investment Advisory Agreement or by the Administrator under the Administration Agreement or by the Sub-Advisers for the European Equity Portfolio, the Global Infrastructure Portfolio and the Money Market Portfolio under the Sub-Advisory Agreements or by the Distributor, will be paid by the Portfolios.
PLEASE RETAIN THIS SUPPLEMENT FOR FUTURE REFERENCE.
STATEMENT OF ADDITIONAL INFORMATION
Morgan Stanley
Variable Investment Series
April 30, 2012
Portfolios
Money Market Portfolio
Limited Duration Portfolio
Income Plus Portfolio
Global Infrastructure Portfolio
European Equity Portfolio
Multi Cap Growth Portfolio
Aggressive Equity Portfolio
Strategist Portfolio
This Statement of Additional Information ("SAI") for Morgan Stanley Variable Investment Series (the "Fund") is not a prospectus. The Fund's Class X Prospectus and the Class Y Prospectus (each dated April 30, 2012) for each portfolio listed above provide the basic information you should know before allocating your investment under your variable annuity contract or your variable life contract. Prospectuses may be obtained without charge from the Fund at its address or telephone number listed below.
The Fund's audited financial statements for the fiscal year ended December 31, 2011, including notes thereto, and the report of Ernst & Young LLP, are herein incorporated by reference from the Fund's Annual Report to Shareholders. A copy of the Fund's Annual Report to Shareholders must accompany the delivery of this SAI.
Morgan Stanley
Variable Investment Series
522 Fifth Avenue
New York, NY 10036
(800) 869-NEWS
TABLE OF CONTENTS
I. | | Fund History | | | 4 | | |
II. | | Description of the Fund and Its Investments and Risks | | | 4 | | |
| | | | A. Classification | | | 4 | | |
| | | | B. Eligible Purchasers | | | 4 | | |
| | | | C. Investment Strategies and Risks | | | 4 | | |
| | | | D. Fund Policies/Investment Restrictions | | | 28 | | |
| | | | E. Disclosure of Portfolio Holdings | | | 30 | | |
III. | | Management of the Fund | | | 33 | | |
| | | | A. Board of Trustees | | | 33 | | |
| | | | B. Management Information | | | 34 | | |
| | | | C. Compensation | | | 43 | | |
IV. | | Control Persons and Principal Holders of Securities | | | 45 | | |
V. | | Investment Advisory and Other Services | | | 45 | | |
| | | | A. Adviser, Sub-Advisers and Administrator | | | 45 | | |
| | | | B. Principal Underwriter | | | 48 | | |
| | | | C. Services Provided by the Adviser, Sub-Advisers and Administrator | | | 48 | | |
| | | | D. Rule 12b-1 Plan | | | 49 | | |
| | | | E. Other Service Providers | | | 50 | | |
| | | | F. Fund Management | | | 51 | | |
| | | | G. Codes of Ethics | | | 53 | | |
| | | | H. Proxy Voting Policy and Proxy Voting Record | | | 53 | | |
| | | | I. Revenue Sharing | | | 54 | | |
VI. | | Brokerage Allocation and Other Practices | | | 54 | | |
| | | | A. Brokerage Transactions | | | 54 | | |
| | | | B. Commissions | | | 55 | | |
| | | | C. Brokerage Selection | | | 56 | | |
| | | | D. Regular Broker-Dealers | | | 58 | | |
VII. | | Capital Stock and Other Securities | | | 59 | | |
VIII. | | Purchase, Redemption and Pricing of Shares | | | 60 | | |
| | | | A. Purchase/Redemption of Shares | | | 60 | | |
| | | | B. Offering Price | | | 60 | | |
IX. | | Taxation of the Portfolios and Shareholders | | | 63 | | |
X. | | Underwriters | | | 66 | | |
XI. | | Performance Data | | | 66 | | |
XII. | | Financial Statements | | | 67 | | |
XIII. | | Fund Counsel | | | 68 | | |
| | Appendix A — Morgan Stanley Investment Management Proxy Voting Policy and Procedures | | | A-1 | | |
| | Appendix B — Description of Ratings | | | B-1 | | |
2
Glossary of Selected Defined Terms
The terms defined in this glossary are frequently used in this SAI (other terms used occasionally are defined in the text of the document).
"Administrator" or "Morgan Stanley Services" — Morgan Stanley Services Company Inc., a wholly-owned fund services subsidiary of the Adviser.
"Adviser" — Morgan Stanley Investment Management Inc., a wholly-owned investment adviser subsidiary of Morgan Stanley.
"Contract" — Variable annuity contract and/or variable life insurance contract issued by the insurance company.
"Contract Owners" — Owners of a Contract.
"Custodian" — State Street Bank and Trust Company.
"Distributor" — Morgan Stanley Distribution, Inc., a wholly-owned broker-dealer subsidiary of Morgan Stanley.
"Financial Advisors" — Morgan Stanley authorized financial services representatives.
"Fund" — Morgan Stanley Variable Investment Series, a registered open-end series investment company currently consisting of eight Portfolios.
"Independent Trustees" — Trustees who are not "interested persons" (as defined in the Investment Company Act of 1940, as amended ("Investment Company Act")) of the Fund.
"Morgan Stanley & Co." — Morgan Stanley & Co. LLC, a wholly-owned broker-dealer subsidiary of Morgan Stanley.
"Morgan Stanley Funds" — Registered investment companies for which the Adviser serves as the investment adviser and that hold themselves out to investors as related companies for investment and investor services.
"Morgan Stanley Investment Management" — Morgan Stanley Investment Management Inc., a wholly-owned investment adviser subsidiary of Morgan Stanley.
"Morgan Stanley Smith Barney" — Morgan Stanley Smith Barney LLC, a majority-owned broker-dealer subsidiary of Morgan Stanley.
"Portfolio(s)" — The separate investment portfolio(s) of the Fund.
"Sub-Advisers" — Morgan Stanley Investment Management Limited (only applicable to the European Equity Portfolio and the Global Infrastructure Portfolio) and Morgan Stanley Investment Management Company (only applicable to the Global Infrastructure Portfolio), each a wholly-owned subsidiary of Morgan Stanley.
"Transfer Agent" — Morgan Stanley Services Company Inc., a wholly-owned transfer agent subsidiary of Morgan Stanley.
"Trustees" — The Board of Trustees of the Fund.
3
I. FUND HISTORY
The Fund was organized as a Massachusetts business trust, under a Declaration of Trust, on February 25, 1983 under the name Dean Witter Variable Annuity Investment Series. Effective February 23, 1988, the Fund's name was changed to Dean Witter Variable Investment Series. On September 1, 1995, the name of the Managed Assets Portfolio was changed to the Strategist Portfolio. Effective June 22, 1998, the Fund's name was changed to Morgan Stanley Dean Witter Variable Investment Series. Effective June 18, 2001, the Fund's name was changed to Morgan Stanley Variable Investment Series. Effective May 1, 2002, the name of the Short-Term Bond Portfolio was changed to the Limited Duration Portfolio. Effective July 30, 2002, the name of the Competitive Edge "Best Ideas" Portfolio was changed to the Global Advantage Portfolio. Effective December 30, 2004, the name of the European Growth Portfolio was changed to the European Equity Portfolio. Effective April 29, 2005, the name of the Quality Income Plus Portfolio was changed to the Income Plus Portfolio. Effective May 1, 2008, the name of the Equity Portfolio was changed to the Capital Opportunities Portfolio. Effective November 3, 2008, the name of the Utilities Portfolio was changed to the Global Infrastructure Portfolio. Effective April 29, 2011, the name of the Capital Opportunities Portfolio was changed to the Multi Cap Growth Portfolio.
II. DESCRIPTION OF THE FUND AND ITS INVESTMENTS AND RISKS
A. Classification
The Fund is an open-end management investment company which currently offers shares of eight separate portfolios (each a "Portfolio" and, collectively, the "Portfolios"). Each Portfolio is "diversified" as defined in the Investment Company Act.
B. Eligible Purchasers
As discussed in each of the Class X and Class Y Prospectuses, shares of the Portfolios are sold only to particular insurance companies in connection with variable annuity and/or variable life insurance contracts they issue. It is conceivable that in the future it may become disadvantageous for both variable life insurance and variable annuity contract separate accounts to invest in the same underlying funds. Although neither the various insurance companies nor the Fund currently foresee any such disadvantage, the Trustees intend to monitor events in order to identify any material irreconcilable conflict between the interest of variable annuity contract owners and variable life insurance contract owners and to determine what action, if any, should be taken in response thereto.
C. Investment Strategies and Risks
The following discussion of each Portfolio's investment strategies and risks should be read with the sections of the Class X and Class Y Prospectuses titled "Principal Investment Strategies," "Principal Risks" and "Additional Information about the Portfolio's Investment Objective(s), Strategies and Risks." For purposes of this section, references to the Adviser, when used in connection with its activities as adviser to the sub-advised Portfolios, include any Sub-Advisers acting under the Adviser's supervision, as applicable.
Convertible Securities. Each Portfolio, other than the Money Market Portfolio, may invest in securities which are convertible into common stock or other securities of the same or a different issuer or into cash within a particular period of time at a specified price or formula ("convertible securities"). Convertible securities are generally fixed-income securities (but may include preferred stock) and generally rank senior to the common stocks in a corporation's capital structure and, therefore, entail less risk than the corporation's common stock. The value of a convertible security is a function of its "investment value" (its value as if it did not have a conversion privilege), and its "conversion value" (the security's worth if it were to be exchanged for the underlying security, at market value, pursuant to its conversion privilege).
To the extent that a convertible security's investment value is greater than its conversion value, its price will be primarily a reflection of such investment value and its price will be likely to increase when interest rates fall and decrease when interest rates rise, as with a fixed-income security (the credit standing of the issuer and other factors may also have an effect on the convertible security's value). If the conversion value exceeds the investment value, the price of the convertible security will rise above its investment value and, in addition, will sell at some premium over its conversion value. (This premium represents the price investors are willing to pay for the privilege of purchasing a fixed-income security with a possibility of capital appreciation due to the conversion privilege.) At such times the price of the convertible security will tend to fluctuate directly with the price of the underlying equity security. Convertible securities may be purchased by a Portfolio at varying price levels above their investment values and/or their conversion values in keeping with the Portfolio's investment objective(s).
4
With respect to each Portfolio other than the Money Market Portfolio, the Limited Duration Portfolio, the Income Plus Portfolio and the Strategist Portfolio, up to 5% of the Portfolio's net assets may be invested in convertible securities that are below investment grade. Debt securities rated below investment grade are commonly known as "junk bonds." Although the Portfolio selects these securities primarily on the basis of their equity characteristics, investors should be aware that convertible securities rated in these categories are considered high risk securities; the rating agencies consider them speculative with respect to the issuer's continuing ability to make timely payments of interest and principal. Thus, to the extent that such convertible securities are acquired by the Portfolio, there is a greater risk as to the timely repayment of the principal of, and timely payment of interest or dividends on, such securities than in the case of higher-rated convertible securities.
Limited Partnerships. Each Portfolio, other than the Money Market Portfolio, the Limited Duration Portfolio and the Income Plus Portfolio, may purchase limited partnerships. A limited partnership interest entitles a Portfolio to participate in the investment return of the partnership's assets as defined by the agreement among the partners. As a limited partner, a Portfolio generally is not permitted to participate in the management of the partnership. However, unlike a general partner whose liability is not limited, a limited partner's liability generally is limited to the amount of its commitment to the partnership. A Portfolio that invests in limited partnership interests may invest to the same extent in limited liability company interests. Limited liability company interests have similar characteristics as limited partnership interests.
Derivatives. Certain Portfolios may, but are not required to, use various derivatives and related investment strategies as described below. Derivatives may be used for a variety of purposes including hedging, risk management, portfolio management or to earn income. Any or all of the investment techniques described herein may be used at any time and there is no particular strategy that dictates the use of one technique rather than another, as the use of any derivative by a Portfolio is a function of numerous variables, including market conditions. The Portfolios comply with applicable regulatory requirements when using derivatives, including the segregation or earmarking of cash or liquid assets when mandated by U.S. Securities and Exchange Commission ("SEC") rules or SEC staff positions. Although the Adviser and/or Sub-Advisers seek to use derivatives to further a Portfolio's investment objective(s), no assurance can be given that the use of derivatives will achieve this result.
General Risks of Derivatives.
Derivatives utilized by the Portfolios may involve the purchase and sale of derivative instruments. A derivative is a financial instrument the value of which depends upon (or derives from) the value of another asset, security, interest rate or index. Derivatives may relate to a wide variety of underlying instruments, including equity and debt securities, indexes, interest rates, currencies and other assets. Certain derivative instruments which the Portfolios may use and the risks of those instruments are described in further detail below. A Portfolio may in the future also utilize derivatives techniques, instruments and strategies that may be newly developed or permitted as a result of regulatory changes, consistent with the Portfolio's investment objective(s) and policies. Such newly developed techniques, instruments and strategies may involve risks different than or in addition to those described herein. No assurance can be given that any derivatives strategy employed by a Portfolio will be successful.
The risks associated with the use of derivatives are different from, and possibly greater than, the risks associated with investing directly in the instruments underlying such derivatives. Derivatives are highly specialized instruments that require investment techniques and risk analyses different from other portfolio investments. The use of derivative instruments requires an understanding not only of the underlying instrument but also of the derivative itself. Certain risk factors generally applicable to derivative transactions are described below.
• Derivatives are subject to the risk that the market value of the derivative itself or the market value of underlying instruments will change in a way adverse to a Portfolio's interests. The Portfolio bears the risk that the Adviser and/or Sub-Advisers may incorrectly forecast future market trends and other financial or economic factors or the value of the underlying security, index, interest rate or currency when establishing a derivatives position for the Portfolio.
• Derivatives may be subject to pricing risk, which exists when a derivative becomes extraordinarily expensive (or inexpensive) relative to historical prices or corresponding instruments. Under such market conditions, it may not be economically feasible to initiate a transaction or liquidate a position at an advantageous time or price.
• Many derivatives are complex and often valued subjectively. Improper valuations can result in increased payment requirements to counterparties or a loss of value to the Portfolio.
5
• Using derivatives as a hedge against a portfolio investment subjects the Portfolio to the risk that the derivative will have imperfect correlation with the portfolio investment, which could result in the Portfolio incurring substantial losses. This correlation risk may be greater in the case of derivatives based on an index or other basket of securities, as the portfolio securities being hedged may not duplicate the components of the underlying index or the basket may not be of exactly the same type of obligation as those underlying the derivative. The use of derivatives for "cross hedging" purposes (using a derivative based on one instrument as a hedge for a different instrument) may also involve greater correlation risks.
• While using derivatives for hedging purposes can reduce the Portfolio's risk of loss, it may also limit the Portfolio's opportunity for gains or result in losses by offsetting or limiting the Portfolio's ability to participate in favorable price movements in portfolio investments.
• Derivatives transactions for non-hedging purposes involve greater risks and may result in losses which would not be offset by increases in the value of portfolio securities or declines in the cost of securities to be acquired. In the event that the Portfolio enters into a derivatives transaction as an alternative to purchasing or selling the underlying instrument or in order to obtain desired exposure to an index or market, the Portfolio will be exposed to the same risks as are incurred in purchasing or selling the underlying instruments directly.
• The use of certain derivatives transactions involves the risk of loss resulting from the insolvency or bankruptcy of the counterparty to the contract or the failure by the counterparty to make required payments or otherwise comply with the terms of the contract. In the event of default by a counterparty, the Portfolio may have contractual remedies pursuant to the agreements related to the transaction.
• Liquidity risk exists when a particular derivative is difficult to purchase or sell. If a derivative transaction is particularly large or if the relevant market is illiquid, the Portfolio may be unable to initiate a transaction or liquidate a position at an advantageous time or price.
• Certain derivatives transactions are not entered into or traded on exchanges or in markets regulated by the U.S. Commodity Futures Trading Commission ("CFTC") or the SEC. Instead, such over-the-counter ("OTC") derivatives are entered into directly by a Portfolio and a counterparty and may be traded only through financial institutions acting as market makers. OTC derivatives transactions can only be entered into with a willing counterparty that is approved by the Adviser and/or Sub-Advisers in accordance with guidelines established by the Board. Where no such counterparty is available, the Portfolio will be unable to enter into a desired OTC transaction. There also may be greater risk that no liquid secondary market in the trading of OTC derivatives will exist, in which case the Portfolio may be required to hold such instruments until exercise, expiration or maturity. Many of the protections afforded to exchange participants are not available to participants in OTC derivatives transactions. OTC derivatives transactions are not subject to the guarantee of an exchange or clearinghouse and, as a result, the Portfolio would bear greater risk of default by the counterparties to such transactions.
• The Portfolio may be required to make physical delivery of portfolio securities underlying a derivative in order to close out a derivatives position or to sell portfolio securities at a time or price at which it may be disadvantageous to do so in order to obtain cash to close out or to maintain a derivatives position.
• As a result of the structure of certain derivatives, adverse changes in the value of the underlying instrument can result in losses substantially greater than the amount invested in the derivative itself. Certain derivatives have the potential for unlimited loss, regardless of the size of the initial investment.
• Certain derivatives may be considered illiquid and therefore subject to the Portfolio's limitation on investments in illiquid securities.
• Derivatives transactions conducted outside the United States may not be conducted in the same manner as those entered into on U.S. exchanges, and may be subject to different margin, exercise, settlement or expiration procedures. Brokerage commissions, clearing costs and other transaction costs may be higher on foreign exchanges. Many of the risks of OTC derivatives transactions are also applicable to derivatives transactions conducted outside the United States. Derivatives transactions conducted outside the United States are subject to the risk of governmental action affecting the trading in, or the prices of, foreign securities, currencies and other
6
instruments. The value of such positions could be adversely affected by foreign political and economic factors; lesser availability of data on which to make trading decisions; delays on the Portfolio's ability to act upon economic events occurring in foreign markets; and less liquidity than U.S. markets.
• Currency derivatives are subject to additional risks. Currency derivatives transactions may be negatively affected by government exchange controls, blockages and manipulations. Currency exchange rates may be influenced by factors extrinsic to a country's economy. There is no systematic reporting of last sale information with respect to foreign currencies. As a result, the available information on which trading in currency derivatives will be based may not be as complete as comparable data for other transactions. Events could occur in the foreign currency market which will not be reflected in currency derivatives until the following day, making it more difficult for the Portfolio to respond to such events in a timely manner.
Options
An option is a contract that gives the holder of the option the right, but not the obligation, to buy from (in the case of a call option) or sell to (in the case of a put option) the seller of the option (the "option writer") the underlying security at a specified fixed price (the "exercise price") on or prior to a specified date (the "expiration date"). The buyer of the option pays to the option writer the option premium, which is the purchase price of the option.
Exchange-traded options are issued by a regulated intermediary such as the Options Clearing Corporation ("OCC"), which guarantees the performance of the obligations of the parties to such options. OTC options are purchased from or sold to counterparties through direct bilateral agreements between a Portfolio and its counterparties. Certain options, such as options on individual securities, may be settled through physical delivery of the underlying security, whereas other options, such as index options, are settled in cash in an amount based on the value of the underlying instrument multiplied by a specified multiplier.
Writing Options. Certain Portfolios may write call and put options. As the writer of a call option, the Portfolio receives the premium from the purchaser of the option and has the obligation, upon exercise of the option, to deliver the underlying security upon payment of the exercise price. If the option expires without being exercised the Portfolio is not required to deliver the underlying security but retains the premium received.
The Portfolios may only write call options that are "covered." A call option on a security is covered if (a) the Portfolio owns the security underlying the call or has an absolute and immediate right to acquire that security without additional cash consideration (or, if additional cash consideration is required, such amount is maintained by the Portfolio in segregated or earmarked cash or liquid assets) upon conversion or exchange of other securities held by the Portfolio; or (b) the Portfolio has purchased a call on the underlying security, the exercise price of which is (i) equal to or less than the exercise price of the call written, or (ii) greater than the exercise price of the call written, provided the difference is maintained by the Portfolio in segregated or earmarked cash or liquid assets.
Selling call options involves the risk that the Portfolio may be required to sell the underlying security at a disadvantageous price, below the market price of such security, at the time the option is exercised. As the writer of a covered call option, the Portfolio forgoes, during the option's life, the opportunity to profit from increases in the market value of the underlying security covering the option above the sum of the premium and the exercise price but retains the risk of loss should the price of the underlying security decline.
Certain Portfolios may write put options. As the writer of a put option, the Portfolio receives the premium from the purchaser of the option and has the obligation, upon exercise of the option, to pay the exercise price and receive delivery of the underlying security. If the option expires without being exercised, the Portfolio is not required to receive the underlying security in exchange for the exercise price but retains the option premium.
The Portfolios may only write put options that are "covered." A put option on a security is covered if (a) the Portfolio segregates or earmarks cash or liquid assets equal to the exercise price; or (b) the Portfolio has purchased a put on the same security as the put written, the exercise price of which is
7
(i) equal to or greater than the exercise price of the put written, or (ii) less than the exercise price of the put written, provided the difference is maintained by the Portfolio in segregated or earmarked cash or liquid assets.
Selling put options involves the risk that the Portfolio may be required to buy the underlying security at a disadvantageous price, above the market price of such security, at the time the option is exercised. While the Portfolio's potential gain in writing a covered put option is limited to the premium received plus the interest earned on the liquid assets covering the put option, the Portfolio's risks of loss is equal to the entire value of the underlying security, offset only by the amount of the premium received.
The Portfolios may close out an options position which it has written through a closing purchase transaction. The Portfolio would execute a closing purchase transaction with respect to a call option written by purchasing a call option on the same underlying security and having the same exercise price and expiration date as the call option written by the Portfolio. The Portfolio would execute a closing purchase transaction with respect to a put option written by purchasing a put option on the same underlying security and having the same exercise price and expiration date as the put option written by the Portfolio. A closing purchase transaction may or may not result in a profit to a Portfolio. The Portfolio could close out its position as an option writer only if a liquid market exists for options on the same underlying security and having the same exercise date as the option written by the Portfolio. There is no assurance that such a market will exist with respect to any particular option.
The writer of an option generally has no control over the time when the option is exercised and the option writer is required to deliver or acquire the underlying security. Once an option writer has received an exercise notice, it cannot effect a closing purchase transaction in order to terminate its obligation under the option. Thus, the use of options may require the Portfolio to buy or sell portfolio securities at inopportune times or for prices other than the current market values of such securities, may limit the amount of appreciation the Portfolio can realize on an investment, or may cause the Portfolio to hold a security that it might otherwise sell.
Purchasing Options. Certain Portfolios may purchase call and put options. As the buyer of a call option, the Portfolio pays the premium to the option writer and has the right to purchase the underlying security from the option writer at the exercise price. If the market price of the underlying security rises above the exercise price, the Portfolio could exercise the option and acquire the underlying security at a below-market price, which could result in a gain to the Portfolio, minus the premium paid. As the buyer of a put option, the Portfolio pays the premium to the option writer and has the right to sell the underlying security to the option writer at the exercise price. If the market price of the underlying security declines below the exercise price, the Portfolio could exercise the option and sell the underlying security at an above-market price, which could result in a gain to the Portfolio, minus the premium paid. The Portfolio may buy call and put options whether or not it holds the underlying securities.
As a buyer of a call or put option, the Portfolio may sell put or call options that it has purchased at any time prior to such option's expiration date through a closing sale transaction. The principal factors affecting the market value of a put or a call option include supply and demand, interest rates, the current market price of the underlying security in relation to the exercise price of the option, the volatility of the underlying security, the underlying security's dividend policy, and the time remaining until the expiration date. A closing sale transaction may or may not result in a profit to the Portfolio. The Portfolio's ability to initiate a closing sale transaction is dependent upon the liquidity of the options market and there is no assurance that such a market will exist with respect to any particular option. If the Portfolio does not exercise or sell an option prior to its expiration date, the option expires and becomes worthless.
OTC Options. Unlike exchange-traded options, which are standardized with respect to the underlying instrument, expiration date, contract size and strike price, the terms of OTC options generally are established through negotiation between the parties to the options contract. This type of arrangement allows the purchaser and writer greater flexibility to tailor the option to their needs. OTC options are available for a greater variety of securities or other assets, and in a wider range of expiration dates and exercise prices, than exchange-traded options. However, unlike exchange-traded options, which are issued and guaranteed by a regulated intermediary, such as the OCC, OTC options are entered into directly with the counterparty. Unless the counterparties provide for it, there is no central clearing or guaranty function for an OTC option. Therefore, OTC options are subject to the risk of default or non-performance by the counterparty. Accordingly, the Adviser and/or Sub-Advisers must assess the
8
creditworthiness of the counterparty to determine the likelihood that the terms of the option will be satisfied. There can be no assurance that a continuous liquid secondary market will exist for any particular OTC option at any specific time. As a result, the Portfolio may be unable to enter into closing sale transactions with respect to OTC options.
Index Options. Call and put options on indices operate similarly to options on securities. Rather than the right to buy or sell a single security at a specified price, options on an index give the holder the right to receive, upon exercise of the option, an amount of cash determined by reference to the value of the underlying index. The underlying index may be a broad-based index or a narrower market index. Unlike many options on securities, all settlements are in cash. The settlement amount, which the writer of an index option must pay to the holder of the option upon exercise, is generally equal to the difference between the fixed exercise price of the option and the value of the underlying index, multiplied by a specified multiplier. The multiplier determines the size of the investment position the option represents. Gain or loss to the Portfolio on index options transactions will depend on price movements of the underlying index generally or in a particular segment of the index, in part, rather than price movements of individual components of the index. As with other options, the Portfolio may close out its position in index options through closing purchase transactions and closing sale transactions provided that a liquid secondary market exists for such options.
Index options written by a Portfolio will generally be covered in a manner similar to the covering of other types of options, by holding an offsetting financial position and/or segregating or earmarking cash or liquid assets. The Portfolio may cover call options written on an index by owning securities or other assets whose price changes, in the opinion of the Adviser and/or Sub-Advisers, are expected to correlate to those of the underlying index.
Foreign Currency Options. Options on foreign currencies operate similarly to options on securities. Rather than the right to buy or sell a single security at a specified price, options on foreign currencies give the holder the right to buy or sell foreign currency for a fixed amount in U.S. dollars or other base currencies. Options on foreign currencies are traded primarily in the OTC market, but may also be traded on U.S. and foreign exchanges. The value of a foreign currency option is dependent upon the value of the underlying foreign currency relative to the U.S. dollar or other base currency. The price of the option may vary with changes in, among other things, the value of either or both currencies and has no relationship to the investment merits of a foreign security. Options on foreign currencies are affected by all of those factors which influence foreign exchange rates and foreign investment generally. As with other options, the Portfolio may close out its position in foreign currency options through closing purchase transactions and closing sale transactions provided that a liquid market exists for such options.
Foreign currency options written by a Portfolio will generally be covered in a manner similar to the covering of other types of options, by holding an offsetting financial position and/or segregating or earmarking cash or liquid assets.
Additional Risks of Options Transactions. The risks associated with options transactions are different from, and possibly greater than, the risks associated with investing directly in the underlying instruments. Options are highly specialized instruments that require investment techniques and risk analyses different from those associated with other portfolio investments. The use of options requires an understanding not only of the underlying instrument but also of the option itself. Options may be subject to the risk factors generally applicable to derivatives transactions described herein, and may also be subject to certain additional risk factors, including:
• The exercise of options written or purchased by a Portfolio could cause the Portfolio to sell portfolio securities, thus increasing the Portfolio's portfolio turnover.
• A Portfolio pays brokerage commissions each time it writes or purchases an option or buys or sells an underlying security in connection with the exercise of an option. Such brokerage commissions could be higher relative to the commissions for direct purchases of sales of the underlying securities.
• The Portfolio's options transactions may be limited by limitations on options positions established by the SEC, the CFTC or the exchanges on which such options are traded.
• The hours of trading for exchange listed options may not coincide with the hours during which the underlying securities are traded. To the extent that the options markets close before the markets
9
for the underlying securities, significant price and rate movements can take place in the underlying securities that cannot be reflected in the options markets.
• Index options based upon a narrow index of securities or other assets may present greater risks than options based on broad market indexes, as narrower indexes are more susceptible to rapid and extreme fluctuations as a result of changes in the values of a smaller number of securities or other assets.
• The Portfolio is subject to the risk of market movements between the time that an option is exercised and the time of performance thereunder, which could increase the extent of any losses suffered by the Portfolio in connection with options transactions.
Futures Contracts
A futures contract is a standardized, exchange-traded agreement to buy or sell a specific quantity of a commodity at a specific price at a specific future time (the "settlement date"). Futures contracts may be based on, among other things, a specified equity security (securities futures), a specified debt security or reference rate (interest rate futures), the value of a specified securities index (index futures) or the value of a foreign currency (forward contracts and currency futures). The value of a futures contract tends to increase and decrease in tandem with the value of the underlying instrument. The buyer of a futures contract agrees to purchase the underlying instrument on the settlement date and is said to be "long" the contract. The seller of a futures contract agrees to sell the underlying instrument on the settlement date and is said to be "short" the contract. Futures contracts call for settlement only on the expiration date and cannot be "exercised" at any other time during their term.
Depending on the terms of the particular contract, futures contracts are settled through either physical delivery of the underlying instrument on the settlement date (such as in the case of securities futures based on a specified debt security) or by payment of a cash settlement amount on the settlement date (such as in the case of futures contracts relating to interest rates, foreign currencies and broad-based securities indexes). In the case of cash settled futures contracts, the settlement amount is equal to the difference between the reference instrument's price on the last trading day of the contract and the reference instrument's price at the time the contract was entered into. Most futures contracts, particularly futures contracts requiring physical delivery, are not held until the settlement date, but instead are offset before the settlement date through the establishment of an opposite and equal futures position (buying a contract that had been sold, or selling a contract that had been purchased). All futures transactions are effected through a clearinghouse associated with the exchange on which the futures are traded.
The buyer and seller of a futures contract are not required to deliver or pay for the underlying commodity unless the contract is held until the settlement date. However, both the buyer and seller are required to deposit "initial margin" with a futures commission merchant when the futures contract is entered into. Initial margin deposits are typically calculated as a percentage of the contract's market value. If the value of either party's position declines, the party will be required to make additional "variation margin" payments to settle the change in value on a daily basis. The process is known as "marking-to-market." Upon the closing of a futures position through the establishment of an offsetting position, a final determination of variation margin will be made and additional cash will be paid by or released to the Portfolio.
In addition, the Portfolio may be required to maintain segregated cash or liquid assets in order to cover futures transactions. The Portfolio will segregate or earmark cash or liquid assets in an amount equal to the difference between the market value of a futures contract entered into by the Portfolio and the aggregate value of the initial and variation margin payments made by the Portfolio with respect to such contract or as otherwise permitted by SEC rules or SEC staff positions. See "Regulatory Matters" below.
Currency Forward Contracts and Currency Futures. A foreign currency forward exchange contract is a negotiated agreement between two parties to exchange specified amounts of two or more currencies at a specified future time at a specified rate. The rate specified by the foreign currency forward exchange contract can be higher or lower than the spot rate between the currencies that are the subject of the contract. Currency futures are similar to foreign currency forward exchange contracts, except that they are traded on an exchange and standardized as to contract size and delivery date. Most currency futures call for payment or delivery in U.S. dollars. Unanticipated changes in currency prices may result in losses to the Portfolio and poorer overall performance for the Portfolio than if it had not entered into foreign currency forward exchange or futures contracts. Certain Portfolios may enter into foreign currency
10
forward exchange or futures contracts under various circumstances. The typical use of a foreign currency forward exchange or futures contract is to "lock in" the price of a security in U.S. dollars or some other foreign currency, which the Portfolio is holding in its portfolio. By entering into a foreign currency forward exchange or futures contract for the purchase or sale, for a fixed amount of dollars or other currency, of the amount of foreign currency involved in the underlying security transactions, the Portfolio may be able to protect itself against a possible loss resulting from an adverse change in the relationship between the U.S. dollar or other currency which is being used for the security purchase and the foreign currency in which the security is denominated during the period between the date on which the security is purchased or sold and the date on which payment is made or received. The Adviser and/or Sub-Advisers also may from time to time utilize foreign currency forward exchange or futures contracts for other purposes. For example, they may be used to hedge a foreign security held in the portfolio or a security which pays out principal tied to an exchange rate between the U.S. dollar and a foreign currency, against a decline in value of the applicable foreign currency. They also may be used to lock in the current exchange rate of the currency in which those securities anticipated to be purchased are denominated. At times, the Portfolio may enter into "cross-currency" hedging transactions involving currencies other than those in which securities are held or proposed to be purchased are denominated.
The Portfolios will not enter into foreign currency forward exchange or futures contracts or maintain a net exposure to these contracts where the consummation of the contracts would obligate the Portfolio to deliver an amount of foreign currency in excess of the value of the Portfolio's portfolio securities.
When required by law, a Portfolio will segregate or earmark cash, U.S. government securities or other appropriate liquid portfolio securities in an amount equal to the value of the Portfolio's total assets committed to the consummation of foreign currency forward exchange or futures contracts entered into under the circumstances set forth above. If the value of the securities so earmarked declines, additional cash or securities will be segregated or earmarked on a daily basis so that the value of such securities will equal the amount of the Portfolio's commitments with respect to such contracts.
The Portfolio may be limited in its ability to enter into hedging transactions involving foreign currency forward exchange or futures contracts by the Internal Revenue Code of 1986, as amended (the "Code"), requirements relating to qualification as a regulated investment company.
Foreign currency forward exchange and futures contracts may limit gains on portfolio securities that could otherwise be realized had they not been utilized and could result in losses. The contracts also may increase the Portfolio's volatility and may involve a significant amount of risk relative to the investment of cash.
Options on Futures Contracts. Options on futures contracts are similar to options on securities except that options on futures contracts give the purchasers the right, in return for the premium paid, to assume a position in a futures contract (a long position in the case of a call option and a short position in the case of a put option) at a specified exercise price at any time prior to the expiration of the option. Upon exercise of the option, the parties will be subject to all of the risks associated with futures transactions and subject to margin requirements. As the writer of options on futures contracts, a Portfolio would also be subject to initial and variation margin requirements on the option position.
Options on futures contracts written by the Portfolio will generally be covered in a manner similar to the covering of other types of options, by holding an offsetting financial position and/or segregating or earmarking cash or liquid assets. The Portfolio may cover an option on a futures contract by purchasing or selling the underlying futures contract. In such instances the exercise of the option will serve to close out the Portfolio's futures position.
Additional Risks of Futures Transactions. The risks associated with futures contract transactions are different from, and possibly greater than, the risks associated with investing directly in the underlying instruments. Futures are highly specialized instruments that require investment techniques and risk analyses different from those associated with other portfolio investments. The use of futures requires an understanding not only of the underlying instrument but also of the futures contract itself. Futures may be subject to the risk factors generally applicable to derivatives transactions described herein, and may also be subject to certain additional risk factors, including:
• The risk of loss in buying and selling futures contracts can be substantial. Small price movements in the commodity underlying a futures position may result in immediate and substantial loss (or gain) to a Portfolio.
11
• Buying and selling futures contracts may result in losses in excess of the amount invested in the position in the form of initial margin. In the event of adverse price movements in the underlying commodity, security, index, currency or instrument, the Portfolio would be required to make daily cash payments to maintain its required margin. The Portfolio may be required to sell portfolio securities, or make or take delivery of the underlying securities in order to meet daily margin requirements at a time when it may be disadvantageous to do so. The Portfolio could lose margin payments deposited with a futures commission merchant if the futures commission merchant breaches its agreement with the Portfolio, becomes insolvent or declares bankruptcy.
• Most exchanges limit the amount of fluctuation permitted in futures contract prices during any single trading day. Once the daily limit has been reached in a particular futures contract, no trades may be made on that day at prices beyond that limit. If futures contract prices were to move to the daily limit for several trading days with little or no trading, the Portfolio could be prevented from prompt liquidation of a futures position and subject to substantial losses. The daily limit governs only price movements during a single trading day and therefore does not limit the Portfolio's potential losses.
• Index futures based upon a narrower index of securities may present greater risks than futures based on broad market indexes, as narrower indexes are more susceptible to rapid and extreme fluctuations as a result of changes in value of a small number of securities.
Swap Contracts and Related Derivative Instruments
An OTC swap contract is an agreement between two parties pursuant to which the parties exchange payments at specified dates on the basis of a specified notional amount, with the payments calculated by reference to specified securities, indexes, reference rates, currencies or other instruments. A small percentage of swap contracts are cleared through a central clearinghouse. Most swap agreements provide that when the period payment dates for both parties are the same, the payments are made on a net basis (i.e., the two payment streams are netted out, with only the net amount paid by one party to the other). A Portfolio's obligations or rights under a swap contract entered into on a net basis will generally be equal only to the net amount to be paid or received under the agreement, based on the relative values of the positions held by each counterparty. Most swap agreements are generally not entered into or traded on exchanges and often there is no central clearing or guaranty function for swaps. Therefore, these OTC swaps are generally subject to the risk of default or non-performance by the counterparty. Accordingly, the Adviser and/or Sub-Advisers must assess the creditworthiness of the counterparty to determine the likelihood that the terms of the swap will be satisfied.
Swap agreements allow for a wide variety of transactions. For example, fixed rate payments may be exchanged for floating rate payments, U.S. dollar denominated payments may be exchanged for payments denominated in foreign currencies, and payments tied to the price of one security, index, reference rate, currency or other instrument may be exchanged for payments tied to the price of a different security, index, reference rate, currency or other instrument. Swap contracts are typically individually negotiated and structured to provide exposure to a variety of particular types of investments or market factors. Swap contracts can take many different forms and are known by a variety of names. To the extent consistent with a Portfolio's investment objectives and policies, the Portfolio is not limited to any particular form or variety of swap contract. the Portfolio may utilize swaps to increase or decrease its exposure to the underlying instrument, reference rate, foreign currency, market index or other asset. The Portfolio may also enter into related derivative instruments including caps, floors and collars.
A Portfolio may be required to cover swap transactions. Obligations under swap agreements entered into on a net basis are generally accrued daily and any accrued but unpaid amounts owed by the Portfolio to the swap counterparty will be covered by segregating or earmarking cash or liquid assets. If the Portfolio enters into a swap agreement on other than a net basis, the Portfolio will segregate or earmark cash or liquid assets with a value equal to the full amount of the Portfolio's accrued obligations under the agreement.
Interest Rate Swaps, Caps, Floors and Collars. Interest rate swaps consist of an agreement between two parties to exchange their respective commitments to pay or receive interest (e.g., an exchange of floating rate payments for fixed rate payments). Interest rate swaps are generally entered into on a net basis. Interest rate swaps do not involve the delivery of securities, other underlying assets, or principal. Accordingly, the risk of loss with respect to interest rate and total rate of return swaps is limited to the net amount of interest payments that a Portfolio is contractually obligated to make.
12
Certain Portfolios may also buy or sell interest rate caps, floors and collars. The purchase of an interest rate cap entitles the purchaser, to the extent that a specified index exceeds a predetermined interest rate, to receive payments of interest on a specified notional amount from the party selling the interest rate cap. The purchase of an interest rate floor entitles the purchaser, to the extent that a specified index falls below a predetermined interest rate, to receive payments of interest on a specified notional amount from the party selling the interest rate floor. A collar is a combination of a cap and a floor that preserves a certain return within a predetermined range of interest rate of values. Caps, floors and collars may be less liquid than other types of swaps. If a Portfolio sells caps, floors and collars, it will segregate liquid assets with a value equal to the full amount, accrued daily, of the Portfolio's net obligations with respect to the caps, floors or collars.
Index Swaps. An index swap consists of an agreement between two parties in which a party exchanges a cash flow based on a notional amount of a reference index for a cash flow based on a different index or on another specified instrument or reference rate. Index swaps are generally entered into on a net basis.
Inflation Swaps. Inflation swap agreements are contracts in which one party agrees to pay the cumulative percentage increase in a price index, such as the Consumer Price Index, over the term of the swap (with some lag on the referenced inflation index), and the other party pays a compounded fixed rate. Inflation swap agreements may be used to protect the net asset value of a Portfolio against an unexpected change in the rate of inflation measured by an inflation index. The value of inflation swap agreements is expected to change in response to changes in real interest rates. Real interest rates are tied to the relationship between nominal interest rates and the rate of inflation.
Currency Swaps. A currency swap consists of an agreement between two parties to exchange cash flows on a notional amount of two or more currencies based on the relative value differential among them, such as exchanging a right to receive a payment in a foreign currency for the right to receive U.S. dollars. Currency swap agreements may be entered into on a net basis or may involve the delivery of the entire principal value of one designated currency in exchange for the entire principal value of another designated currency. In such cases, the entire principal value of a currency swap is subject to the risk that the counterparty will default on its contractual delivery obligations.
Credit Default Swaps. A credit default swap consists of an agreement between two parties in which the "buyer" agrees to pay to the "seller" a periodic stream of payments over the term of the contract and the seller agrees to pay the buyer the par (or other agreed-upon) value of a referenced debt obligation upon the occurrence of a credit event with respect to the issuer of that referenced debt obligation. Generally, a credit event means a bankruptcy, failure to pay or a restructuring. A Portfolio may be either the buyer or seller in a credit default swap. As the buyer in a credit default swap, the Portfolio would pay to the counterparty the periodic stream of payments. If no default occurs, the Portfolio would receive no benefit from the contract. As the seller in a credit default swap, the Portfolio would receive the stream of payments but would be subject to exposure on the notional amount of the swap, which it would be required to pay in the event of default. The Portfolio will generally earmark or segregate cash or liquid assets to cover any potential obligation under a credit default swap sold by the Portfolio. The use of credit default swaps could result in losses to the Portfolio if the Adviser and/or Sub-Advisers fail to correctly evaluate the creditworthiness of the issuer of the referenced debt obligation.
Swaptions. An option on a swap agreement, also called a "swaption," is an option that gives the buyer the right, but not the obligation, to enter into a swap on a future date in exchange for paying a market based "premium." A receiver swaption gives the owner the right to receive the total return of a specified asset, reference rate, or index. A payer swaption gives the owner the right to pay the total return of a specified asset, reference rate, or index. Swaptions also include options that allow an existing swap to be terminated or extended by one of the counterparties.
General Risks of Swaps. The risks associated with swap transactions are different from, and possibly greater than, the risks associated with investing directly in the underlying instruments. Swaps are highly specialized instruments that require investment techniques and risk analyses different from those associated with other portfolio investments. The use of swaps requires an understanding not only of the underlying instrument but also of the swap contract itself. Swap transactions may be subject to the risk
13
factors generally applicable to derivatives transactions described above, and may also be subject to certain additional risk factors, including:
• Many swap agreements are not traded on exchanges and not subject to a similar level of government regulation like exchange-traded derivatives. As a result, parties to a swap agreement are not protected by such government regulations to the same extent as participants in transactions in derivatives traded on organized exchanges.
• In addition to the risk of default by the counterparty, if the creditworthiness of a counterparty to a swap agreement declines, the value of the swap agreement would be likely to decline, potentially resulting in losses.
• The swaps market is a relatively new market and currently is largely unregulated. It is possible that further developments in the swaps market, including future governmental regulation, could adversely affect the Portfolio's ability to utilize swaps, terminate existing swap agreements or realize amounts to be received under such agreements.
Structured Investments
Certain Portfolios also may invest a portion of its assets in structured investments. A structured investment is a derivative security designed to offer a return linked to a particular underlying security, currency, commodity or market, for which the amount of principal repayment and/or interest payments is based on the change in value of such underlying security, currency, commodity or market, including, among others, currency exchange rates, interest rates (such as the prime lending rate or LIBOR), referenced bonds and stock indices or other financial reference. Structured investments may come in various forms, including notes, warrants and options to purchase securities and may be listed and traded on an exchange or otherwise traded in the OTC market.
A Portfolio will typically use structured investments to gain exposure to a permitted underlying security, currency, commodity or market when direct access to such security, currency, commodity or market is limited or inefficient from a tax, cost or regulatory standpoint. Investments in structured investments involve risks including counterparty risk and market risk. Holders of structured investments bear risks of the underlying investment and are subject to counterparty risk because the Portfolio is relying on the creditworthiness of such counterparty and has no rights with respect to the issuer of the underlying investment. Certain structured investments may be thinly traded or have a limited trading market and may have the effect of increasing the Portfolio's illiquidity to the extent that the Portfolio, at a particular point in time, may be unable to find qualified buyers for these investments.
A structured investment may be linked either positively or negatively to its underlying security, currency, commodity or market and a change in interest rate, principal amount or other factor, depending on the structured investment's design, may be a multiple of the factor's movement. Application of a multiplier is comparable to the use of financial leverage, a speculative technique. Leverage magnifies the potential for gain and the risk of loss. As a result, a relatively small decline in the value of the referenced factor could result in a relatively large loss in the value of a structured investment.
Other types of structured investments include interests in entities organized and operated for the purpose of restructuring the investment characteristics of underlying investment interests or securities. This type of securitization or restructuring usually involves the deposit or purchase of an underlying security by a U.S. or foreign entity, such as a corporation or trust of specified instruments, and the issuance by that entity of one or more classes of securities backed by, or representing an interest in, the underlying instruments.
The cash flow or rate of return on the underlying investments may be apportioned among the newly issued securities to create different investment characteristics, such as varying maturities, credit quality, payment priorities and interest rate provisions. Structured investments which are subordinated, for example, in payment priority often offer higher returns, but may result in increased risks compared to other investments.
Combined Transactions
Combined transactions involve entering into multiple derivatives transactions (such as multiple options transactions, including purchasing and writing options in combination with each other; multiple futures transactions; and combinations of options, futures, forward and swap transactions) instead of a single
14
derivatives transaction in order to customize the risk and return characteristics of the overall position. Combined transactions typically contain elements of risk that are present in each of the component transactions. Certain Portfolios may enter into a combined transaction instead of a single derivatives transaction when, in the opinion of the Adviser and/or Sub-Advisers, it is in the best interest of the Portfolio to do so. Because combined transactions involve multiple transactions, they may result in higher transaction costs and may be more difficult to close out.
Regulatory Matters
As described herein, a Portfolio may be required to cover its potential economic exposure to certain derivatives transactions by holding an offsetting financial position and/or segregating or earmarking cash or liquid assets equal in value to the Portfolio's potential economic exposure under the transaction. The Portfolio will cover such transactions as described herein or in such other manner in accordance with applicable laws and regulations. Assets used to cover derivatives transactions cannot be sold while the derivatives position is open, unless they are replaced by other appropriate assets. Segregated or earmarked cash or liquid assets and assets held in margin accounts are not otherwise available to the Portfolio for investment purposes. If a large portion of the Portfolio's assets are used to cover derivatives transactions or are otherwise segregated or earmarked, it could affect portfolio management or the Portfolio's ability to meet redemption requests or other current obligations. With respect to derivatives which are cash-settled (i.e., have no physical delivery requirement), the Portfolio is permitted to earmark cash or set aside liquid assets in an amount equal to the Portfolio's daily marked-to-market net obligations (i.e., the Portfolio's daily net liability) under the derivative, if any, rather than the derivative's full notional value or the market value of the instrument underlying the derivative, as applicable. By earmarking cash or setting aside assets equal to only its net obligations under cash-settled derivatives, the Portfolio will have the ability to employ leverage to a greater extent than if the Portfolio were required to earmark cash or segregate assets equal to the full notional amount of the derivative or the market value of the underlying instrument, as applicable.
Regulatory developments affecting the exchange-traded and OTC derivatives markets may impair the Portfolios' ability to manage or hedge their investment portfolio through the use of derivatives. The Dodd-Frank Wall Street Reform and Consumer Protection Act (the "Dodd-Frank Act") and the rules promulgated thereunder may limit the ability of the Portfolios to enter into one or more exchange-traded or OTC derivatives transactions. In particular, pursuant to authority granted under the Dodd-Frank Act, the CFTC in October 2011 promulgated final rules that impose new federal position limits on listed futures and options contracts on, and economically equivalent OTC derivatives referencing, 28 individual agricultural, metal and energy commodities. A Portfolio's futures and options positions in these 28 contracts will be aggregated with its positions, if any, in economically equivalent OTC derivatives referencing these contracts. These new position limits, which will be imposed on the Portfolios and their counterparties, may impact the Portfolios' ability to invest in futures, options and swaps in a manner that efficiently meets their investment objective(s). Derivative positions of all investment companies advised by the Adviser and/or Sub-Advisers are combined for purposes of these limits. An exchange may order the liquidation of positions found to be in excess of these limits and may impose certain other sanctions or restrictions.
The Portfolios' use of derivatives may be limited by the requirements of the Code for qualification as a regulated investment company for U.S. federal income tax purposes.
In February 2012, the CFTC adopted certain regulatory changes that may impact the Fund by subjecting the Adviser to registration with the CFTC as the commodity pool operator ("CPO") of a Portfolio, unless the Portfolio is able to comply with certain trading and marketing limitations on its investments in futures and certain other instruments. If the Adviser becomes subject to CFTC registration as a CPO, the disclosure and operations of the Portfolio would need to comply with all applicable CFTC regulations. Compliance with these additional registration and regulatory requirements would increase Portfolio expenses.
Mortgage-Backed Securities ("MBSs"). Certain Portfolios may invest in mortgage pass-through securities. These securities represent a participation interest in a pool of residential mortgage loans originated by U.S. governmental or private lenders such as banks. They differ from conventional debt securities, which provide for periodic payment of interest in fixed amounts and principal payments at maturity or on specified call dates. Mortgage pass-through securities provide for monthly payments that are a "pass-through" of the monthly interest and principal payments made by the individual borrowers on
15
the pooled mortgage loans. Mortgage pass-through securities may be collateralized by mortgages with fixed rates of interest or adjustable rates. The Portfolios may invest in mortgage pass-through securities that are issued or guaranteed by the U.S. Government. These securities are either direct obligations of the U.S. Government or the issuing agency or instrumentality has the right to borrow from the U.S. Treasury to meet its obligations although the U.S. Treasury is not legally required to extend credit to the agency or instrumentality. Certain of the U.S. government securities purchased by the Portfolios, such as those issued by the Federal National Mortgage Association ("Fannie Mae") and Federal Home Loan Mortgage Corporation ("Freddie Mac"), are not backed by the full faith and credit of the United States and there is a risk that the U.S. Government will not provide financial support to these agencies if it is not obligated to do so by law. In September 2008, the U.S. Treasury Department announced that the U.S. Government would be taking over Freddie Mac and Fannie Mae and placing the companies into a conservatorship. In addition, the U.S. Treasury announced additional steps that it intended to take with respect to the debt and mortgage-backed securities issued by Fannie Mae and Freddie Mac in order to support the conservatorship. No assurance can be given that these initiatives will be successful. The maximum potential liability of the issuers of some U.S. government securities held by the Portfolios may greatly exceed their current resources, including their legal right to support from the U.S. Treasury. It is possible that these issuers will not have the funds to meet their payment obligations in the future.
To the extent the Portfolios invest in mortgage pass-through securities offered by non-governmental issuers, such as commercial banks, savings and loan institutions, private mortgage insurance companies, mortgage bankers and other secondary market issuers, the Portfolios may be subject to additional risks. Timely payment of interest and principal of non-governmental issuers are supported by various forms of private insurance or guarantees, including individual loan, title, pool and hazard insurance purchased by the issuer. There can be no assurance that the private insurers can meet their obligations under the policies. An unexpectedly high rate of defaults on the mortgages held by a mortgage pool may adversely affect the value of a MBS and could result in losses to the Portfolios. The risk of such defaults is generally higher in the case of mortgage pools that include subprime mortgages. Subprime mortgages refer to loans made to borrowers with weakened credit histories or with a lower capacity to make timely payments on their mortgages.
Collateralized Mortgage Obligations ("CMOs"). Certain Portfolios may invest in collateralized mortgage obligations ("CMOs"), which are mortgage-backed securities that are collateralized by mortgage loans or mortgage pass-through securities, and multi-class pass-through securities, which are equity interests in a trust composed of mortgage loans or other mortgage-backed securities. Unless the context indicates otherwise, the discussion of CMOs below also applies to multi-class pass through securities.
CMOs may be issued by governmental or government-related entities or by private entities, such as banks, savings and loan institutions, private mortgage insurance companies, mortgage bankers and other secondary market traders. CMOs are issued in multiple classes, often referred to as "tranches," with each tranche having a specific fixed or floating coupon rate and stated maturity or final distribution date. Under the traditional CMO structure, the cash flows generated by the mortgages or mortgage pass-through securities in the collateral pool are used to first pay interest and then pay principal to the holders of the CMOs. Subject to the various provisions of individual CMO issues, the cash flow generated by the underlying collateral (to the extent it exceeds the amount required to pay the stated interest) is used to retire the bonds.
The principal and interest on the underlying collateral may be allocated among the several tranches of a CMO in innumerable ways. In a common CMO structure, the tranches are retired sequentially in the order of their respective stated maturities or final distribution dates (as opposed to the pro-rata return of principal found in traditional pass-through obligations). The fastest-pay tranches would initially receive all principal payments. When those tranches are retired, the next tranches in the sequence receive all of the principal payments until they are retired. The sequential retirement of bond groups continues until the last tranche is retired. Accordingly, the CMO structure allows the issuer to use cash flows of long maturity, monthly-pay collateral to formulate securities with short, intermediate, and long final maturities and expected average lives and risk characteristics.
The primary risk of CMOs is the uncertainty of the timing of cash flows that results from the rate of prepayments on the underlying mortgages serving as collateral and from the structure of the particular CMO transaction (that is, the priority of the individual tranches). An increase or decrease in prepayment
16
rates (resulting from a decrease or increase in mortgage interest rates) may cause the CMOs to be retired substantially earlier than their stated maturities or final distribution dates and will affect the yield and price of CMOs. In addition, the collateral securing CMOs or any third party guarantees are insufficient to make payments, the Portfolio could sustain a loss. The prices of certain CMOs, depending on their structure and the rate of prepayments, can be volatile. Some CMOs may also not be as liquid as other types of mortgage securities. As a result, it may be difficult or impossible to sell the securities at an advantageous time or price.
New types of CMO tranches have evolved. These include floating rate CMOs, planned amortization classes, accrual bonds and CMO residuals. These newer structures affect the amount and timing of principal and interest received by each tranche from the underlying collateral. Under certain of these newer structures, given classes of CMOs have priority over others with respect to the receipt of prepayments on the mortgages. Therefore, depending on the type of CMOs in which a Portfolio invests, the investment may be subject to a greater or lesser risk of prepayment than other types of mortgage-backed securities.
CMOs may include real estate investment conduits ("REMICs"). REMICs, which were authorized under the Tax Reform Act of 1986, are private entities formed for the purpose of holding a fixed pool of mortgages secured by an interest in real property. A REMIC is a CMO that qualifies for special tax treatment under the Code and invests in certain mortgages principally secured by interests in real property.
The Portfolios may invest in, among others, parallel pay CMOs and Planned Amortization Class CMOs ("PAC Bonds"). Parallel pay CMOs are structured to provide payments of principal on each payment date to more than one tranche. These simultaneous payments are taken into account in calculating the stated maturity date or final distribution date of each tranche which, as with other CMO structures, must be retired by its stated maturity date or final distribution date but may be retired earlier. PAC Bonds are a form of parallel pay CMO, with the required principal payment on such securities having the highest priority after interest has been paid to all classes. PAC Bonds generally require payments of a specified amount of principal on each payment date.
Stripped Mortgage-Backed Securities. Certain Portfolios may invest in stripped mortgage-backed securities ("SMBS"). An SMBS is a derivative multi-class mortgage security. SMBS usually are structured with two classes that receive different proportions of the interest and principal distribution on a pool of mortgage assets. In the most extreme case, one class will receive all of the interest (the interest-only or "IO" class), while the other class will receive all of the principal (the principal-only or "PO" class). The yield to maturity on an IO class is extremely sensitive to the rate of principal payments (including prepayments) on the related underlying mortgage assets, and a rapid rate of principal payments may have a material adverse effect on such security's yield to maturity. If the underlying mortgage assets experience greater than anticipated prepayments of principal, the Portfolio may fail to fully recoup its initial investment in these securities. Conversely, if the underlying mortgage assets experience less than anticipated prepayments of principal, the yield of POs could be materially adversely affected. The market values of IOs and POs are subject to greater risk of fluctuation in response to changes in market rates of interest than many other types of government securities. To the extent the Portfolio invests in IOs and POs, this increases the risk of fluctuations in the net asset value of the Portfolio.
Inverse Floaters. Certain Portfolios may invest in inverse floaters. Inverse floating rate obligations are obligations which pay interest at rates that vary inversely with changes in market rates of interest. Because the interest rate paid to holders of such obligations is generally determined by subtracting a variable or floating rate from a predetermined amount, the interest rate paid to holders of such obligations will decrease as such variable or floating rate increases and increase as such variable or floating rate decreases. Like most other fixed-income securities, the value of inverse floaters will decrease as interest rates increase. They are more volatile, however, than most other fixed-income securities because the coupon rate on an inverse floater typically changes at a multiple of the change in the relevant index rate. Thus, any rise in the index rate (as a consequence of an increase in interest rates) causes a correspondingly greater drop in the coupon rate of an inverse floater, while a drop in the index rate causes a correspondingly greater increase in the coupon of an inverse floater. Some inverse floaters may also increase or decrease substantially because of changes in the rate of prepayments.
Asset-Backed Securities. Certain Portfolios may invest in asset-backed securities. Asset-backed securities utilize the securitization techniques used to develop mortgage-backed securities. These techniques are also applied to a broad range of other assets. Various types of assets, primarily automobile
17
and credit card receivables and home equity loans, are being securitized in pass-through structures similar to the mortgage pass-through structures. These types of securities are known as asset-backed securities. The Portfolio may invest in any type of asset-backed security. Asset-backed securities have risk characteristics similar to mortgage-backed securities. Like mortgage-backed securities, they generally decrease in value as a result of interest rate increases, but may benefit less than other fixed-income securities from declining interest rates, principally because of prepayments. Also, as in the case of mortgage-backed securities, prepayments generally increase during a period of declining interest rates although other factors, such as changes in credit use and payment patterns, may also influence prepayment rates. Asset-backed securities also involve the risk that various federal and state consumer laws and other legal, regulatory and economic factors may result in the collateral backing the securities being insufficient to support payment on the securities.
Commercial Mortgage-Backed Securities ("CMBS"). Certain Portfolios may invest in CMBS. CMBS are generally multi-class or pass-through securities issued by special purpose entities that represent an undivided interest in a portfolio of mortgage loans backed by commercial properties, including, but not limited to, industrial and warehouse properties, office buildings, retail space and shopping malls, hotels, healthcare facilities, multifamily properties and cooperative apartments. Private lenders, such as banks or insurance companies, originate these loans and then sell the loans directly into a CMBS trust or other entity. The commercial mortgage loans that underlie CMBS are generally not amortizing or not fully amortizing. That is, at their maturity date, repayment of the remaining principal balance or "balloon" is due and is repaid through the attainment of an additional loan or sale of this property. An extension of the final payment on commercial mortgages will increase the average life of the CMBS, generally resulting in a lower yield for discount bonds and a higher yield for premium bonds.
CMBS are subject to credit risk and prepayment risk. Although prepayment risk is present, it is of a lesser degree in the CMBS than in the residential mortgage market; commercial real estate property loans often contain provisions which substantially reduce the likelihood that such securities will be prepaid (e.g. significant prepayment penalties on loans and, in some cases, prohibition on principal payments for several years following origination).
Money Market Securities. In addition to the short-term fixed-income securities in which the Portfolios may otherwise invest, the Portfolios may invest in various money market securities for cash management purposes or when assuming a temporary defensive position, which among others may include commercial paper, bankers' acceptances, bank obligations, corporate debt securities, certificates of deposit, U.S. government securities, obligations of savings institutions and repurchase agreements. (This section does not apply to the Money Market Portfolio (other than with respect to European certificates of deposit and repurchase agreements), whose money market instruments are described in its Prospectus.) Such securities are limited to:
U.S. Government Securities. Obligations issued or guaranteed as to principal and interest by the United States or its agencies (such as the Export-Import Bank of the United States, Federal Housing Administration and Government National Mortgage Association) or its instrumentalities (such as the Federal Home Loan Bank), including Treasury bills, notes and bonds;
Bank Obligations. Obligations (including certificates of deposit, time deposits and bankers' acceptances) of banks subject to regulation by the U.S. Government and having total assets of $1 billion or more, and instruments secured by such obligations, not including obligations of foreign branches of domestic banks except to the extent below;
Eurodollar Certificates of Deposit. Eurodollar certificates of deposit issued by foreign branches of domestic banks having total assets of $1 billion or more;
Obligations of Savings Institutions. Certificates of deposit of savings banks and savings and loan associations, having total assets of $1 billion or more;
Fully Insured Certificates of Deposit. Certificates of deposit of banks and savings institutions, having total assets of less than $1 billion, if the principal amount of the obligation is federally insured by the Bank Insurance Fund or the Savings Association Insurance Fund (each of which is administered by the FDIC), limited to $250,000 principal amount per certificate (a temporary increase from $100,000, which is due to expire on December 31, 2013), and to 10% or less of each Portfolio's (other than the Money Market Portfolio's) total assets in all such obligations and in all illiquid assets, in the aggregate, and to 5%
18
or less of the Money Market Portfolio's total assets in all such obligations and in all illiquid assets, in the aggregate;
Commercial Paper. Commercial paper rated within the two highest grades by Standard & Poor's Ratings Services, a division of The McGraw-Hill Companies, Inc. ("S&P"), or by Moody's Investors Service, Inc. ("Moody's") or, if not rated, issued by a company having an outstanding debt issue rated at least AA by S&P or Aa by Moody's; and
Repurchase Agreements. The Portfolios may invest in repurchase agreements. For certain Portfolios when cash may be available for only a few days, it may be invested by the Portfolios in repurchase agreements until such time as it may otherwise be invested or used for payments of obligations of the Portfolios. These agreements typically involve the acquisition by the Portfolios of debt securities from a selling financial institution such as a bank, savings and loan association or broker-dealer. The agreement provides that the Portfolio will sell back to the institution, and that the institution will repurchase, the underlying securities serving as collateral, at a specified price and at a fixed time in the future, usually not more than seven days from the date of purchase. The collateral will be marked-to-market daily to determine that the value of the collateral, as specified in the agreement, does not decrease below the purchase price plus accrued interest. If such decrease occurs, additional collateral will be requested and, when received, added to the account to maintain full collateralization. The Portfolios will accrue interest from the institution until the time when the repurchase is to occur. Although this date is deemed by the Portfolios to be the maturity date of a repurchase agreement, the maturities of securities subject to repurchase agreements are not subject to any limits.
While repurchase agreements involve certain risks not associated with direct investments in debt securities, the Portfolios follow procedures approved by the Trustees that are designed to minimize such risks. These procedures include effecting repurchase transactions only with large, well-capitalized and well-established financial institutions whose financial condition will be continually monitored by the Adviser and/or Sub-Advisers. In addition, as described above, the value of the collateral underlying the repurchase agreement will be at least equal to the repurchase price including any accrued interest earned on the repurchase agreement or the daily amortization of the difference between the acquisition price and the resale price specified in the repurchase agreement. In the event of a default or bankruptcy by a selling financial institution, the Portfolios will seek to liquidate such collateral. However, the exercising of the Portfolios' right to liquidate such collateral could involve certain costs or delays and, to the extent that proceeds from any sale upon a default of the obligation to repurchase were less than the repurchase price, the Portfolios could suffer a loss. The Money Market Portfolio may invest in repurchase agreements backed by non-governmental collateral. Such collateral will be, at the time the repurchase agreement is entered into, rated investment grade. A Portfolio will not invest in repurchase agreements that do not mature within seven days if any such investment, together with any other illiquid assets held by that Portfolio, amounts to more than 5% of its net assets in the case of the Money Market Portfolio, and 15% of its net assets in the case of each of the other Portfolios. The Portfolios' investments in repurchase agreements may at times be substantial when, in the view of the Portfolios' Adviser and/or Sub-Advisers, liquidity or other conditions warrant.
Zero Coupon Securities. A portion of the fixed-income securities purchased by the Portfolios may be "zero coupon" securities. Such securities are purchased at a discount from their face amount, giving the purchaser the right to receive their full value at maturity. The interest earned on such securities is, implicitly, automatically compounded and paid out at maturity. While such compounding at a constant rate eliminates the risk of receiving lower yields upon reinvestment of interest if prevailing interest rates decline, the owner of a zero coupon security will be unable to participate in higher yields upon reinvestment of interest received if prevailing interest rates rise.
A zero coupon security pays no interest to its holder during its life. Therefore, to the extent the Portfolios invest in zero coupon securities, they will not receive current cash available for distribution to shareholders.
In addition, zero coupon securities are subject to substantially greater market price fluctuations during periods of changing prevailing interest rates than are comparable debt securities which make current distributions of interest. Current federal tax law requires that a holder (such as a Portfolio) of a zero coupon security accrue a portion of the discount at which the security was purchased as income each year even though the Portfolio receives no interest payments in cash on the security during the year.
19
Reverse Repurchase Agreements and Dollar Rolls. Each of the Limited Duration Portfolio, the Income Plus Portfolio and the European Equity Portfolio may use reverse repurchase agreements for purposes of meeting redemptions or as part of its investment strategy. The Limited Duration Portfolio may also use dollar rolls as part of its investment strategy.
Reverse repurchase agreements involve sales by a Portfolio of assets concurrently with an agreement by the Portfolio to repurchase the same assets at a later date at a fixed price. Reverse repurchase agreements involve the risk that the market value of the securities a Portfolio is obligated to purchase under the agreement may decline below the repurchase price. In the event the buyer of securities under a reverse repurchase agreement files for bankruptcy or becomes insolvent, a Portfolio's use of the proceeds of the agreement may be restricted pending a determination by the other party, or its trustee or receiver, whether to enforce the Portfolio's obligation to repurchase the securities.
Dollar rolls involve a Portfolio selling securities for delivery in the current month and simultaneously contracting to repurchase substantially similar (same type and coupon) securities on a specified future date. During the roll period, a Portfolio will forgo principal and interest paid on the securities. A Portfolio is compensated by the difference between the current sales price and the lower forward price for the future purchase (often referred to as the "drop") as well as by the interest earned on the cash proceeds of the initial sale.
Reverse repurchase agreements and dollar rolls are speculative techniques involving leverage and are considered borrowings by a Portfolio. With respect to each of the Income Plus Portfolio and the European Equity Portfolio, reverse repurchase agreements may not exceed 10% of those Portfolio's total assets.
Real Estate Investment Trusts ("REITs") and Foreign Real Estate Companies. Certain Portfolios may invest in REITs and foreign real estate companies, which are similar to entities organized and operated as REITs in the United States. REITs and foreign real estate companies pool investors' funds for investment primarily in real estate properties or real estate-related loans. REITs and foreign real estate companies generally derive their income from rents on the underlying properties or interest on the underlying loans, and their value is impacted by changes in the value of the underlying property or changes in interest rates affecting the underlying loans owned by the REITs and/or foreign real estate companies. REITs and foreign real estate companies are more susceptible to risks associated with the ownership of real estate and the real estate industry in general. These risks can include fluctuations in the value of underlying properties; defaults by borrowers or tenants; market saturation; changes in general and local economic conditions; decreases in market rates for rents; increases in competition, property taxes, capital expenditures or operating expenses; and other economic, political or regulatory occurrences affecting the real estate industry. In addition, REITs and foreign real estate companies depend upon specialized management skills, may not be diversified (which may increase the volatility of a REIT's and/or a foreign real estate company's value), may have less trading volume and may be subject to more abrupt or erratic price movements than the overall securities market. Foreign real estate companies may be subject to laws, rules and regulations governing those entities and their failure to comply with those laws, rules and regulations could negatively impact the performance of those entities. Operating REITs and foreign real estate companies requires specialized management skills and a Portfolio indirectly bears REIT and foreign real estate company management expenses along with the direct expenses of the Portfolio. REITs are not taxed on income distributed to shareholders provided they comply with several requirements of the Code. REITs are subject to the risk of failing to qualify for tax-free pass-through of income under the Code.
Loans of Portfolio Securities. Each Portfolio may lend its portfolio securities to brokers, dealers, banks and other institutional investors. By lending its portfolio securities, the Portfolio attempts to increase its net investment income through the receipt of interest on the cash collateral with respect to the loan or fees received from the borrower in connection with the loan. Any gain or loss in the market price of the securities loaned that might occur during the term of the loan would be for the account of a Portfolio. The Portfolios employ an agent to implement the securities lending program and the agent receives a fee from the Portfolio for its services. No Portfolio will lend more than 331/3% of the value of its total assets.
Each Portfolio may lend its portfolio securities so long as the terms, structure and the aggregate amount of such loans are not inconsistent with the Investment Company Act or the rules and regulations or interpretations of the SEC thereunder, which currently require that (i) the borrower pledge and maintain with the Portfolio collateral consisting of liquid, unencumbered assets having a value at all times not less than 100% of the value of the securities loaned; (ii) the borrower add to such collateral whenever the price of the
20
securities loaned rises (i.e., the borrower "marks-to-market" on a daily basis); (iii) the loan be made subject to termination by the Portfolio at any time; and (iv) the Portfolio receives a reasonable return on the loan (which may include the Portfolio investing any cash collateral in interest bearing short-term investments), any distributions on the loaned securities and any increase in their market value. In addition, voting rights may pass with the loaned securities, but a Portfolio will retain the right to call any security in anticipation of a vote that its Adviser and/or Sub-Advisers deem material to the security on loan.
There may be risks of delay and costs involved in recovery of securities or even loss of rights in the collateral should the borrower of the securities fail financially. These delays and costs could be greater for foreign securities. However, loans will be made only to borrowers deemed by the Adviser or Sub-Advisers to be creditworthy and when, in the judgment of the Adviser and/or Sub-Advisers, the income which can be earned from such securities loans justifies the attendant risk. All relevant facts and circumstances, including the creditworthiness of the broker, dealer, bank or institution, will be considered in making decisions with respect to the lending of securities, subject to review by the Fund's Board of Trustees. A Portfolio also bears the risk that the reinvestment of collateral will result in a principal loss. Finally, there is the risk that the price of the securities will increase while they are on loan and the collateral will not be adequate to cover their value.
When-Issued and Delayed Delivery Securities and Forward Commitments. From time to time, each Portfolio may purchase securities on a when-issued or delayed delivery basis or may purchase or sell securities on a forward commitment basis. When these transactions are negotiated, the price is fixed at the time of the commitment, but delivery and payment may take place a month or more after the date of commitment. While a Portfolio will only purchase securities on a when-issued, delayed delivery or forward commitment basis with the intention of acquiring the securities, the Portfolio may sell the securities before the settlement date, if it is deemed advisable. The securities so purchased or sold are subject to market fluctuation and no interest or dividends accrue to the purchaser prior to the settlement date.
At the time a Portfolio makes the commitment to purchase or sell securities on a when-issued, delayed delivery or forward commitment basis, it will record the transaction and thereafter reflect the value, each day, of such security purchased, or if a sale, the proceeds to be received, in determining its net asset value. At the time of delivery of the securities, their value may be more or less than the purchase or sale price. An increase in the percentage of a Portfolio's assets committed to the purchase of securities on a when-issued, delayed delivery or forward commitment basis may increase the volatility of its net asset value. A Portfolio will also earmark cash or liquid assets or establish a segregated account on the Portfolio's books in which it will continually maintain cash or cash equivalents or other liquid portfolio securities equal in value to commitments to purchase securities on a when-issued, delayed delivery or forward commitment basis.
When, As and If Issued Securities. Each Portfolio, other than the Money Market Portfolio, may purchase securities on a "when, as and if issued" basis, under which the issuance of the security depends upon the occurrence of a subsequent event, such as approval of a merger, corporate reorganization or debt restructuring. The commitment for the purchase of any such security will not be recognized in a Portfolio until the Adviser and/or Sub-Advisers determine that issuance of the security is probable. At that time, the Portfolio will record the transaction and, in determining its net asset value, will reflect the value of the security daily. At that time, the Portfolio will also earmark cash or liquid assets or establish a segregated account on the Portfolio's books in which it will maintain cash, cash equivalents or other liquid portfolio securities equal in value to recognized commitments for such securities.
An increase in the percentage of the Portfolio assets committed to the purchase of securities on a "when, as and if issued" basis may increase the volatility of its net asset value. A Portfolio may also sell securities on a "when, as and if issued" basis, provided that the issuance of the security will result automatically from the exchange or conversion of a security owned by the Portfolio at the time of sale.
Private Placements and Restricted Securities. The Money Market Portfolio may invest up to 5% of its net assets in securities which are subject to restrictions on resale because they have not been registered under the Securities Act of 1933, as amended (the "Securities Act"), or which are otherwise not readily marketable; each of the Income Plus Portfolio, the Multi Cap Growth Portfolio, the European Equity Portfolio, the Strategist Portfolio, the Global Infrastructure Portfolio, the Limited Duration Portfolio and the Aggressive Equity Portfolio may invest up to 15% of its net assets in such restricted securities. (With respect to these Portfolios, securities eligible for resale pursuant to Rule 144A under the Securities Act, and determined to be liquid pursuant to the procedures discussed in the following paragraph, are not
21
subject to the foregoing restriction.) These securities are generally referred to as private placements or restricted securities. Such securities may involve a higher degree of business and financial risk that can result in substantial losses. As a result of the absence of a public trading market for these securities, they may be less liquid than publicly traded securities. To the extent these securities may be resold in privately negotiated transactions, the prices realized from these sales could be less than those originally paid by the Portfolios or less than what may be considered the fair value of such securities. Furthermore, companies whose securities are not publicly traded may not be subject to the disclosure and other investor protection requirements which might be applicable if their securities were publicly traded. The illiquidity of the market, as well as the lack of publicly available information regarding these securities, may also adversely affect the ability to arrive at a fair value for certain securities at certain times and could make it difficult for the Fund to sell certain securities. If such securities are required to be registered under the securities laws of one or more jurisdictions before being sold, the Portfolios may be required to bear the expenses of registration.
Rule 144A permits the above-listed Portfolios to sell restricted securities to qualified institutional buyers without limitation. The Adviser and/or Sub-Advisers, pursuant to procedures adopted by the Trustees, will make a determination as to the liquidity of each restricted security purchased by a Portfolio. If a restricted security is determined to be "liquid," the security will not be included within the category "illiquid securities," which may not exceed, as to the Money Market Portfolio, 5% of the Portfolio's net assets and, as to each of the other Portfolios listed above, 15% of the Portfolio's net assets, as more fully described under "Fund Policies/Investment Restrictions" below. However, investing in Rule 144A securities could have the effect of increasing the level of Portfolio illiquidity to the extent a Portfolio, at a particular point in time, may be unable to find qualified institutional buyers interested in purchasing such securities.
Private Investments in Public Equity. Each Portfolio, other than the Money Market Portfolio, the Limited Duration Portfolio and the Income Plus Portfolio, may purchase equity securities in a private placement that are issued by issuers who have outstanding, publicly-traded equity securities of the same class ("private investments in public equity" or "PIPES"). Shares in PIPES generally are not registered with the SEC until after a certain time period from the date the private sale is completed. This restricted period can last many months. Until the public registration process is completed, PIPES are restricted as to resale and a Portfolio cannot freely trade the securities. Generally such restrictions cause the PIPES to be illiquid during this time. PIPES may contain provisions that the issuer will pay specified financial penalties to the holder if the issuer does not publicly register the restricted equity securities within a specified period of time, but there is no assurance that the restricted equity securities will be publicly registered, or that the registration will remain in effect.
Warrants and Subscription Rights. Each Portfolio, other than the Money Market Portfolio and the Income Plus Portfolio, may acquire warrants and subscription rights attached to other securities. In addition, each of the European Equity Portfolio, the Multi Cap Growth Portfolio and the Strategist Portfolio may invest up to 5% of its assets in warrants not attached to other securities, with a limit of up to 2% of its total assets in warrants that are not listed on the New York Stock Exchange, Inc. ("NYSE") or other exchange. A warrant is, in effect, an option to purchase equity securities at a specific price, generally valid for a specific period of time, and has no voting rights, pays no dividends and has no rights with respect to the corporation issuing it.
A subscription right is a privilege granted to existing shareholders of a corporation to subscribe to shares of a new issue of common stock before it is offered to the public. A subscription right normally has a life of two to four weeks and a subscription price lower than the current market value of the common stock.
Public Bank Loans. The Income Plus Portfolio may invest in public loans made by banks or other financial institutions, which may be rated investment grade (Baa or higher by Moody's, or BBB or higher by S&P) or below investment grade (below Baa by Moody's or below BBB by S&P). Public bank loans are privately negotiated loans for which information about the issuer has been made publicly available. However, public bank loans are not registered under the Securities Act and are not publicly traded. They usually are second lien loans normally lower in priority of payment to senior loans, but have seniority in a company's capital structure to other claims, such as subordinated corporate bonds or publicly-issued equity so that in the event of bankruptcy or liquidation, the company is required to pay down these second lien loans prior to such other lower-ranked claims on their assets. Bank loans normally pay floating rates that reset frequently, and as a result, protect investors from increases in interest rates.
Bank loans generally are negotiated between a borrower and several financial institutional lenders represented by one or more lenders acting as agent of all the lenders. The agent is responsible for
22
negotiating the loan agreement that establishes the terms and conditions of the loan and the rights of the borrower and the lenders, monitoring any collateral, and collecting principal and interest on the loan. By investing in a loan, the Portfolio becomes a member of a syndicate of lenders. Certain bank loans are illiquid, meaning that the Portfolio may not be able to sell them quickly at a fair price. Illiquid securities are also difficult to value. To the extent a bank loan has been deemed illiquid, it will be subject to the Portfolio's restriction on investments in illiquid securities. The secondary market for bank loans may be subject to irregular trading activity, wide bid/ask spreads and extended trade settlement periods.
Bank loans are subject to the risk of default. Default in the payment of interest or principal on a loan will result in a reduction of income to the Portfolio, a reduction in the value of the loan, and a potential decrease in the Portfolio's net asset value. The risk of default will increase in the event of an economic downturn or a substantial increase in interest rates. Bank loans are subject to the risk that the cash flow of the borrower and property securing the loan or debt, if any, may be insufficient to meet scheduled payments. As discussed above, however, because bank loans reside higher in the capital structure than high yield bonds, default losses have been historically lower in the bank loan market. Bank loans that are rated below investment grade share the same risks of other below investment grade securities.
Foreign Investment. The Portfolios may invest in foreign securities. Investing in foreign securities involves certain special considerations which are not typically associated with investments in the securities of U.S. issuers. Foreign issuers are not generally subject to uniform accounting, auditing and financial reporting standards and may have policies that are not comparable to those of domestic issuers. As a result, there may be less information available about foreign issuers than about domestic issuers. Securities of some foreign issuers may be less liquid and more volatile than securities of comparable domestic issuers. There is generally less government supervision and regulation of stock exchanges, brokers and listed issuers than in the United States. In addition, with respect to certain foreign countries, there is a possibility of expropriation or confiscatory taxation, political and social instability, or diplomatic development which could affect U.S. investments in those countries. The costs of investing in foreign countries frequently are higher than the costs of investing in the United States. Although the Adviser and Sub-Advisers endeavor to achieve the most favorable execution costs in portfolio transactions, fixed commissions on many foreign stock exchanges are generally higher than negotiated commissions on U.S. exchanges. In addition, investments in certain foreign markets which have historically been considered stable may become more volatile and subject to increased risk due to ongoing developments and changing conditions in such markets. Moreover, the growing interconnectivity of global economies and financial markets has increased probability that adverse developments and conditions in one country or region will affect the stability of economies and financial markets in other countries or regions.
Investments in securities of foreign issuers may be denominated in foreign currencies. Accordingly, the value of each Portfolio's assets, as measured in U.S. dollars, may be affected favorably or unfavorably by changes in currency exchange rates and in exchange control regulations. A Portfolio may incur costs in connection with conversions between various currencies.
Certain foreign governments levy withholding or other taxes on dividend and interest income. Although in some countries a portion of these taxes are recoverable, the non-recovered portion of foreign withholding taxes will reduce the income received from investments in such countries.
The Adviser and/or Sub-Advisers may consider an issuer to be from a particular country (including the United States) or geographic region if (i) its principal securities trading market is in that country or geographic region; (ii) alone or on a consolidated basis it derives 50% or more of its annual revenue from goods produced, sales made or services performed in that country or geographic region; or (iii) it is organized under the laws of, or has a principal office in that country or geographic region. By applying these tests, it is possible that a particular issuer could be deemed to be from more than one country or geographic region.
Emerging Market Securities. Each Portfolio, except the Money Market Portfolio, may invest in emerging market securities. An emerging market security is one issued by a foreign government or private issuer that has one or more of the following characteristics: (i) its principal securities trading market is in an emerging market or developing country, (ii) alone or on a consolidated basis it derives 50% or more of its annual revenue from goods produced, sales made or services performed in emerging markets, or (iii) it is organized under the laws of, or has a principal office in, an emerging market or developing country. Based on these criteria it is possible for a security to be considered issued by an issuer in more than one country. Therefore, it is possible for the securities of any issuer that has one or more of these characteristics in connection with any emerging market or developing country not to be considered an emerging market security if it has one or more of these characteristics in connection with a developed country.
23
Emerging market describes any country which is generally considered to be an emerging or developing country by major organizations in the international financial community, such as the International Bank for Reconstruction and Development (more commonly known as the World Bank) and the International Finance Corporation. Emerging markets can include every nation in the world except the United States, Canada, Japan, Australia, New Zealand and most nations located in Western Europe.
The economies of individual emerging market or developing countries may differ favorably or unfavorably from the U.S. economy in such respects as growth of gross domestic product, rate of inflation or deflation, currency depreciation, capital reinvestment, resource self-sufficiency and balance of payments position. Further, the economies of developing countries generally are heavily dependent upon international trade and, accordingly, have been, and may continue to be, adversely affected by trade barriers, exchange controls, managed adjustments in relative currency values and other protectionist measures. These economies also have been, and may continue to be, adversely effected by economic conditions in the countries with which they trade.
Prior governmental approval for foreign investments may be required under certain circumstances in some emerging market or developing countries, and the extent of foreign investment in certain fixed-income securities and domestic companies may be subject to limitation in other emerging market or developing countries. Foreign ownership limitations also may be imposed by the charters of individual companies in emerging market or developing countries to prevent, among other concerns, violation of foreign investment limitations. Repatriation of investment income, capital and the proceeds of sales by foreign investors may require governmental registration and/or approval in some emerging market or developing countries. A Portfolio could be adversely affected by delays in, or a refusal to grant, any required governmental registration or approval for such repatriation. Any investment subject to such repatriation controls will be considered illiquid if it appears reasonably likely that this process will take more than seven days.
Investment in emerging market or developing countries may entail purchasing securities issued by or on behalf of entities that are insolvent, bankrupt, in default or otherwise engaged in an attempt to reorganize or reschedule their obligations and in entities that have little or no proven credit rating or credit history. In any such case, the issuer's poor or deteriorating financial condition may increase the likelihood that a Portfolio will experience losses or diminution in available gains due to bankruptcy, insolvency or fraud. Emerging market or developing countries also pose the risk of nationalization, expropriation or confiscatory taxation, political changes, government regulation, social instability or diplomatic development (including war) that could affect adversely the economies of such countries or the value of a Portfolio's investments in those countries. In addition, it may be difficult to obtain and enforce a judgment in a court outside the United States.
Investments in emerging markets may also be exposed to an extra degree of custodial and/or market risk, especially where the securities purchased are not traded on an official exchange or where ownership records regarding the securities are maintained by an unregulated entity (or even the issuer itself).
European Investments. A principal risk factor associated with investment in the European Equity Portfolio relates to the Portfolio's investments in Europe. In particular, adverse political, social or economic developments in Europe, or in a particular European country, could cause a substantial decline in the value of the Portfolio. European countries include both developed and emerging markets and these risks are heightened with respect to the Portfolio's investments in less developed European markets. In addition, because the Portfolio's investments are concentrated in Europe, the Portfolio's performance may be more volatile than if the Portfolio held a more geographically diversified set of investments.
The economies of European countries have become increasingly interconnected due to, among other things, the membership of many European countries in the European Union ("EU") and/or the European Economic and Monetary Union ("EMU"). The EU and EMU have worked to establish a single European market with a common trade policy and a single currency. Many member states have adopted the euro as their single currency and no longer control their own monetary policy. As a result, governments of such countries have less flexibility in the face of economic downturns in their local economies. In addition, the Portfolio's investments could be adversely affected in the event that one or more countries were to abandon the euro, which could cause a decline in the value of the euro and investments tied to those countries.
These concerns have increased in light of the recent global economic crisis that resulted in severe recessions in many European countries and pushed several smaller European economies toward bankruptcy. While certain of the larger European countries have shown signs of recovery, significant risks to
24
growth continue to threaten a potential recovery. These factors include high levels of government debt and deficits, over-regulation and aging populations. Many countries in Europe have adopted measures and are working on regulatory initiatives aimed at increasing the liquidity and stability of financial markets. There is no guarantee that such initiatives will be successful and additional regulation will likely result in increased costs for European market participants.
Brady Bonds. Brady Bonds are both emerging market securities and foreign fixed-income securities. They are created by exchanging existing commercial bank loans to foreign entities for new obligations for the purpose of restructuring the issuers' debts under a plan introduced by former U.S. Secretary of the Treasury, Nicholas F. Brady (the Brady Plan). They may be collateralized or uncollateralized and issued in various currencies (although most are dollar-denominated). They are actively traded in the over-the-counter secondary market. The Portfolio will only invest in Brady Bonds consistent with quality specifications.
Dollar-denominated, collateralized Brady Bonds may be fixed rate par bonds or floating rate discount bonds. These Brady Bonds are generally collateralized in full as to principal due at maturity by U.S. Treasury Zero Coupon Obligations having the same maturity as the Brady Bonds. Interest payments on these Brady Bonds generally are collateralized by cash or securities in an amount that, in the case of fixed rate bonds, is equal to at least one year of rolling interest payments or, in the case of floating rate bonds, initially is equal to at least one year's rolling interest payments based on the applicable interest rate at that time and is adjusted at regular intervals thereafter. Certain Brady Bonds are entitled to "value recovery payments" in certain circumstances, which in effect constitute supplemental interest payments but generally are not collateralized.
Brady Bonds are often viewed as having three or four valuation components: (i) the collateralized repayment of principal at final maturity; (ii) the collateralized interest payments; (iii) the uncollateralized interest payments; and (iv) any uncollateralized repayment of principal at maturity (these uncollateralized amounts constitute the "residual risk"). In the event of a default with respect to collateralized Brady Bonds as a result of which the payment obligations of the issuer are accelerated, the U.S. Treasury Zero Coupon Obligations held as collateral for the payment of principal will not be distributed to investors, nor will such obligations be sold and the proceeds distributed. The collateral will be held by the collateral agent to the scheduled maturity of the defaulted Brady Bonds, which will continue to be outstanding, at which time the face amount of the collateral will equal the principal payments due on the Brady Bonds in the normal course.
Floating and Variable Rate Obligations. Certain Portfolios may purchase floating and variable rate obligations, including floating and variable rate municipal obligations. The value of these obligations is generally more stable than that of a fixed rate obligation in response to changes in interest rate levels. Subject to the conditions for using amortized cost valuation under the Investment Company Act, a Portfolio may consider the maturity of a variable or floating rate obligation to be shorter than its ultimate stated maturity if the obligation is a U.S. Treasury Obligation or U.S. Government Security, if the obligation has a remaining maturity of 397 calendar days or less, or if the obligation has a demand feature that permits the Portfolio to receive payment at any time or at specified intervals not exceeding 397 calendar days. The issuers or financial intermediaries providing demand features may support their ability to purchase the obligations by obtaining credit with liquidity supports. These may include lines of credit, which are conditional commitments to lend, and letters of credit, which will ordinarily be irrevocable, both of which may be issued by domestic banks or foreign banks which have a branch, agency or subsidiary in the United States. A Portfolio may purchase variable or floating rate obligations from the issuers or may purchase certificates of participation, a type of floating or variable rate obligation, which are interests in a pool of debt obligations held by a bank or other financial institution. Certain of these obligations may be in the form of preferred shares of registered closed-end investment companies.
Sovereign Debt. Debt obligations known as "sovereign debt" are obligations of governmental issuers in emerging market countries and industrialized countries. Certain emerging market or developing countries are among the largest debtors to commercial banks and foreign governments. The issuer or governmental authority that controls the repayment of sovereign debt may not be willing or able to repay the principal and/or pay interest when due in accordance with the terms of such obligations.
A governmental entity's willingness or ability to repay principal and pay interest due in a timely manner may be affected by, among other factors, its cash flow situation, the extent of its foreign reserves, the availability of sufficient foreign exchange on the date a payment is due, the relative size of the debt service burden to the economy as a whole, the government's dependence on expected disbursements from third parties, the government's policy toward the International Monetary Fund and the political
25
constraints to which a government may be subject. Governmental entities may also be dependent on expected disbursements from foreign governments, multilateral agencies and others abroad to reduce principal and interest arrearages on their debt. The commitment on the part of these governments, agencies and others to make such disbursements may be conditioned on a debtor's implementation of economic reforms or economic performance and the timely service of such debtor's obligations. Failure to implement such reforms, achieve such levels of economic performance or repay principal or interest when due may result in the cancellation of such third parties' commitments to lend funds to the government debtor, which may further impair such debtor's ability or willingness to timely service its debts. Holders of sovereign debt may be requested to participate in the rescheduling of such debt and to extend further loans to governmental entities. In addition, no assurance can be given that the holders of commercial bank debt will not contest payments to the holders of other foreign government debt obligations in the event of default under their commercial bank loan agreements. The issuers of the government debt securities in which a Portfolio may invest have in the past experienced substantial difficulties in servicing their external debt obligations, which led to defaults on certain obligations and the restructuring of certain indebtedness. Restructuring arrangements have included, among other things, reducing and rescheduling interest and principal payments by negotiating new or amended credit agreements or converting outstanding principal and unpaid interest to Brady Bonds, and obtaining new credit to finance interest payments. There can be no assurance that the Brady Bonds and other foreign government debt securities in which a Portfolio may invest will not be subject to similar restructuring arrangements or to requests for new credit, which may adversely affect the Portfolio's holdings. Furthermore, certain participants in the secondary market for such debt may be directly involved in negotiating the terms of these arrangements and may therefore have access to information not available to other market participants.
Depositary Receipts. Each Portfolio, except the Money Market Portfolio, may invest in depositary receipts. Depositary receipts represent an ownership interest in securities of foreign companies (an "underlying issuer") that are deposited with a depositary. Depositary receipts are not necessarily denominated in the same currency as the underlying securities. Depositary receipts include American Depositary Receipts ("ADRs"), Global Depositary Receipts ("GDRs") and other types of Depositary Receipts (which, together with ADRs and GDRs, are hereinafter collectively referred to as "Depositary Receipts"). ADRs are dollar-denominated Depositary Receipts typically issued by a U.S. financial institution which evidence an ownership interest in a security or pool of securities issued by a foreign issuer. ADRs are listed and traded in the United States. GDRs and other types of Depositary Receipts are typically issued by foreign banks or trust companies, although they also may be issued by U.S. financial institutions, and evidence ownership interests in a security or pool of securities issued by either a foreign or a U.S. corporation. Generally, Depositary Receipts in registered form are designed for use in the U.S. securities market and Depositary Receipts in bearer form are designed for use in securities markets outside the United States.
Depositary Receipts may be "sponsored" or "unsponsored." Sponsored Depositary Receipts are established jointly by a depositary and the underlying issuer, whereas unsponsored Depositary Receipts may be established by a depositary without participation by the underlying issuer. Holders of unsponsored Depositary Receipts generally bear all the costs associated with establishing unsponsored Depositary Receipts. In addition, the issuers of the securities underlying unsponsored Depositary Receipts are not obligated to disclose material information in the United States and, therefore, there may be less information available regarding such issuers and there may not be a correlation between such information and the market value of the Depositary Receipts. For purposes of a Portfolio's investment policies, the Portfolio's investments in Depositary Receipts will be deemed to be an investment in the underlying securities, except that ADRs may be deemed to be issued by a U.S. issuer.
Investment Company Securities. Investment company securities are securities of other open-end, closed-end and unregistered investment companies, including foreign investment companies and exchange-traded funds. Each Portfolio may invest in investment company securities as may be permitted by (i) the Investment Company Act; (ii) the rules and regulations promulgated by the SEC under the Investment Company Act; or (iii) an exemption or other relief applicable to the Portfolio from provisions of the Investment Company Act. The Investment Company Act generally prohibits an investment company from acquiring more than 3% of the outstanding voting shares of an investment company and limits such investments to no more than 5% of a Portfolio's total assets in any one investment company, and no more than 10% in any combination of investment companies. Each Portfolio may invest in investment company securities of investment companies managed by the Adviser or its affiliates to the extent permitted under the Investment Company Act or as otherwise authorized by the SEC. To the extent a Portfolio invests a portion of its assets in investment company securities, those assets will be subject to the risks of the
26
purchased investment company's portfolio securities, and a shareholder in the Portfolio will bear not only his proportionate share of the expenses of the Portfolio, but also, indirectly the expenses of the purchased investment company.
To the extent permitted by applicable law, the Portfolios may invest all or some of its short term cash investments in any money market fund advised or managed by the Adviser or its affiliates. In connection with any such investments, a Portfolio, to the extent permitted by the Investment Company Act, will pay its share of all expenses (other than advisory and administrative fees) of a money market fund in which it invests which may result in the Portfolio bearing some additional expenses.
Exchange Traded Funds ("ETFs"). Each Portfolio may invest in shares of various ETFs, including exchange-traded index and bond funds. Shares of ETFs have many of the same risks as direct investments in common stocks or bonds. In addition, their market value is expected to rise and fall as the value of the underlying index or bond rises and falls. The market value of their shares may differ from the net asset value of the particular fund. As a shareholder in an ETF (as with other investment companies), each Portfolio would bear its ratable share of that entity's expenses. At the same time, each Portfolio would continue to pay its own investment management fees and other expenses. As a result, each Portfolio and its shareholders, in effect, will be absorbing duplicate levels of fees with respect to investments in ETFs. Further, certain of the ETFs in which the Strategist Portfolio may invest are leveraged. The more the Portfolio invests in such leveraged ETFs, the more this leverage will magnify any losses on those investments.
Borrowing. In seeking to increase income, the Income Plus Portfolio may borrow to purchase securities. Such borrowing may not exceed 25% of the Portfolio's assets. Each Portfolio, except the Income Plus Portfolio, has an operating policy, which may be changed by the Fund's Board of Trustees, not to borrow except from a bank for temporary or emergency purposes in amounts not exceeding 5% (taken at the lower of cost or current value) of its total assets (not including the amount borrowed). Should the Board of Trustees remove this operating policy, the Portfolios would be permitted to borrow money from banks in accordance with the Investment Company Act or the rules and regulations promulgated by the SEC thereunder. Currently, the Investment Company Act permits a fund to borrow money from banks in an amount up to 331/3% of its total assets (including the amount borrowed) less its liabilities (not including any borrowings but including the fair market value at the time of computation of any other senior securities then outstanding). The Portfolios may also borrow an additional 5% of their total assets without regard to the foregoing limitation for temporary purposes such as clearance of portfolio transactions. The Portfolios will only borrow when the Adviser and/or Sub-Advisers believe that such borrowings will benefit the Portfolios after taking into account considerations such as interest income and possible gains or losses upon liquidation. The Portfolios will maintain asset coverage in accordance with the Investment Company Act.
Borrowing by a Portfolio creates an opportunity for increased net income but, at the same time, creates special risks. For example, leveraging may exaggerate changes in and increase the volatility of the net asset value of Portfolio shares. This is because leverage tends to exaggerate the effect of any increase or decrease in the value of a Portfolio's portfolio securities. The use of leverage also may cause a Portfolio to liquidate portfolio positions when it may not be advantageous to do so to satisfy its obligations or to maintain asset coverage.
In general, a Portfolio may not issue any class of senior security, except that the Portfolio may (i) borrow from banks, provided that immediately following any such borrowing there is an asset coverage of at least 300% for all Portfolio borrowings and in the event such asset coverage falls below 300% the Portfolio will within three days or such longer period as the SEC may prescribe by rules and regulations, reduce the amount of its borrowings to an extent that the asset coverage of such borrowings shall be at least 300%, and (ii) engage in trading practices which could be deemed to involve the issuance of a senior security, including but not limited to options, futures, forward contracts and reverse repurchase agreements, provided that the Portfolio earmarks or segregates liquid assets in accordance with applicable SEC regulations and interpretations.
Contracts for Difference ("CFDs"). Certain Portfolios may purchase CFDs. A CFD is a privately negotiated contract between two parties, buyer and seller, stipulating that the seller will pay to or receive from the buyer the difference between the nominal value of the underlying instrument at the opening of the contract and that instrument's value at the end of the contract. The underlying instrument may be a single security, stock basket or index. A CFD can be set up to take either a short or long position on the underlying instrument. The buyer and seller are both required to post margin, which is adjusted daily. The buyer will also pay to the seller a financing rate on the notional amount of the capital employed by the seller less the
27
margin deposit. A CFD is usually terminated at the buyer's initiative. The seller of the CFD will simply match the exposure of the underlying instrument in the open market and the parties will exchange whatever payment is due.
As is the case with owning any financial instrument, there is the risk of loss associated with buying a CFD. For example, if the Portfolio buys a long CFD and the underlying security is worth less at the end of the contract, the Portfolio would be required to make a payment to the seller and would suffer a loss. Also, there may be liquidity risk if the underlying instrument is illiquid because the liquidity of a CFD is based on the liquidity of the underlying instrument. A further risk is that adverse movements in the underlying security will require the buyer to post additional margin. CFDs also carry counterparty risk, i.e., the risk that the counterparty to the CFD transaction may be unable or unwilling to make payments or to otherwise honor its financial obligations under the terms of the contract. If the counterparty were to do so, the value of the contract, and of the Portfolio's shares, may be reduced.
To the extent that there is an imperfect correlation between the return on the Portfolio's obligation to its counterparty under the CFDs and the return on related assets in its portfolio, the CFD transaction may increase the Portfolio's financial risk. The Portfolio will not enter into a CFD transaction that is inconsistent with its investment objective, policies and strategies.
Additional Information Concerning the Limited Duration Portfolio. The Limited Duration Portfolio's investments in preferred stocks are limited to those rated in one of the four highest categories by a nationally recognized statistical rating organization ("NRSRO"), including Moody's, S&P and Fitch Ratings. Investments in securities rated within the four highest rating categories by a NRSRO are considered "investment grade." However, such securities rated within the fourth highest rating category by a NRSRO may have speculative characteristics and, therefore, changes in economic conditions or other circumstances are more likely to weaken their capacity to make principal and interest payments than would be the case with investments in securities with higher credit ratings.
D. Fund Policies/Investment Restrictions
The investment objectives, policies and restrictions listed below have been adopted by the Fund as fundamental policies of the Portfolios except as otherwise indicated. Under the Investment Company Act, a fundamental policy of a Portfolio may not be changed without the vote of a majority of the outstanding voting securities of the Portfolio. The Investment Company Act defines a majority as the lesser of (a) 67% or more of the shares of a Portfolio present at a meeting of Portfolio shareholders, if the holders of 50% of the outstanding shares of the Portfolio are present or represented by proxy; or (b) more than 50% of the outstanding shares of the Portfolio. For purposes of the following restrictions: (i) all percentage limitations apply immediately after a purchase or initial investment, and (ii) any subsequent change in any applicable percentage resulting from market fluctuations or other changes in total or net assets does not require elimination of any security from a portfolio, except in the case of borrowing and investments in illiquid securities.
Investment Objectives
The investment objective of each Portfolio is a fundamental policy which may not be changed without the approval of the shareholders of that Portfolio.
Restrictions Applicable to All Portfolios
Each Portfolio will not:
1. Invest in a manner inconsistent with its classification as a "diversified company" as provided by (i) the Investment Company Act, as amended from time to time, (ii) the rules and regulations promulgated by the SEC under the Investment Company Act, as amended from time to time, or (iii) an exemption or other relief applicable to the Portfolio from the provisions of the Investment Company Act, as amended from time to time.
2. Concentrate its investments in any particular industry, but if deemed appropriate for attainment of its investment objective, a Portfolio may invest up to 25% of its total assets (valued at the time of investment) in any one industry classification used by that Portfolio for investment purposes. The restriction does not apply to obligations issued or guaranteed by the United States Government or its agencies or instrumentalities, or, in the case of the Money Market Portfolio, to domestic bank obligations (not including obligations issued by foreign branches of such banks). This restriction does not apply, in the case of the Global Infrastructure Portfolio, to the utilities industry in which industry the Portfolio will concentrate.
28
3. Purchase or sell physical commodities unless acquired as a result of ownership of securities or other instruments; provided that this restriction shall not prohibit the Portfolio from purchasing or selling options, futures contracts and related options thereon, forward contracts, swaps, caps, floors, collars and any other financial instruments or from investing in securities or other instruments backed by physical commodities or as otherwise permitted by (i) the Investment Company Act, as amended from time to time, (ii) the rules and regulations promulgated by the SEC under the Investment Company Act, as amended from time to time, or (iii) an exemption or other relief applicable to the Portfolio from the provisions of the Investment Company Act, as amended from time to time.
4. Borrow money, except the Portfolio may borrow money to the extent permitted by (i) the Investment Company Act, as amended from time to time, (ii) the rules and regulations promulgated by the SEC under the Investment Company Act, as amended from time to time, or (iii) an exemption or other relief applicable to the Portfolio from the provisions of the Investment Company Act, as amended from time to time.
5. Make loans of money or property to any person, except (a) to the extent that securities or interests in which the Portfolio may invest are considered to be loans, (b) through the loan of portfolio securities, (c) by engaging in repurchase agreements or (d) as may otherwise be permitted by (i) the Investment Company Act, as amended from time to time, (ii) the rules and regulations promulgated by the SEC under the Investment Company Act, as amended from time to time, or (iii) an exemption or other relief applicable to the Portfolio from the provision of the Investment Company Act, as amended from time to time.
6. Purchase or sell real estate; however, the Portfolio may purchase marketable securities of issuers which engage in real estate operations or which invest in real estate or interests therein, including real estate investment trusts and securities which are secured by real estate or interests therein.
7. Engage in the underwriting of securities, except insofar as the Portfolio may be deemed an underwriter under the Securities Act in disposing of a portfolio security.
8. Issue senior securities, except a Portfolio may issue senior securities to the extent permitted by (i) the Investment Company Act, as amended from time to time, (ii) the rules and regulations promulgated by the SEC under the Investment Company Act, as amended from time to time, or (iii) an exemption or other relief applicable to the Portfolio from the provisions of the Investment Company Act, as amended from time to time.
Restrictions Applicable to the Multi Cap Growth Portfolio Only
The Multi Cap Growth Portfolio will not:
1. Purchase non-convertible corporate bonds unless rated at the time of purchase Aa or better by Moody's or AA or better by S&P, or purchase commercial paper unless issued by a U.S. corporation and rated at the time of purchase Prime-1 by Moody's or A-1 by S&P, although it may continue to hold a security if its quality rating is reduced by a rating service below those specified.
Non-Fundamental Restrictions
In addition, as non-fundamental policies, which can be changed with Board approval and without a shareholder vote:
1. Each Portfolio may not invest its assets in the securities of any investment company except as may be permitted by (i) the Investment Company Act, as amended from time to time; (ii) the rules and regulations promulgated by the SEC under the Investment Company Act, as amended from time to time; or (iii) an exemption or other relief applicable to the Portfolio from provisions of the Investment Company Act, as amended from time to time.
2. Each of the Multi Cap Growth Portfolio, the European Equity Portfolio, the Income Plus Portfolio, the Strategist Portfolio and the Global Infrastructure Portfolio may not invest more than 15% (5% with respect to the Money Market Portfolio) of its net assets or such other amount as may be permitted by SEC guidelines in illiquid securities, including restricted securities that have been deemed illiquid.
3. Each of the Multi Cap Growth Portfolio and the Money Market Portfolio may not write, purchase or sell puts, calls or combinations, thereof.
Each Portfolio, except the Income Plus Portfolio, has an operating policy, which may be changed by the Fund's Board of Trustees, not to borrow except from a bank for temporary or emergency purposes in amounts not exceeding 5% (taken at the lower of cost or current value) of its total assets (not including the amount borrowed).
29
E. Disclosure of Portfolio Holdings
The Fund's Board of Trustees, the Adviser and the Sub-Advisers have adopted policies and procedures regarding disclosure of portfolio holdings (the "Policy"). Pursuant to the Policy, the Adviser and the Sub-Advisers may disclose information concerning Fund portfolio holdings only if such disclosure is consistent with the antifraud provisions of the federal securities laws and the Fund's, the Adviser's and the Sub-Advisers' fiduciary duties to Fund shareholders. In no instance may the Adviser, Sub-Advisers or the Fund receive compensation or any other consideration in connection with the disclosure of information about the portfolio securities of the Fund. Consideration includes any agreement to maintain assets in the Fund or in other investment companies or accounts managed by the Adviser, Sub-Advisers or by any affiliated person of the Adviser or Sub-Advisers. Non-public information concerning portfolio holdings may be divulged to third parties only when the Fund has a legitimate business purpose for doing so and the recipients of the information are subject to a duty of confidentiality. Under no circumstances shall current or prospective Fund shareholders receive non-public portfolio holdings information, except as described below.
The Fund makes available on its public website the following portfolio holdings information:
• complete portfolio holdings information monthly, at least 15 calendar days after the end of each month (except the Money Market Portfolio); and
• top 10 holdings monthly, at least 15 calendar days after the end of each month (except the Money Market Portfolio).
In order to comply with amendments to Rule 2a-7, information concerning the Money Market Portfolio's portfolio holdings, as well as its daily weighted average portfolio maturity and weighted average life, is posted on its public website within five business days after the end of each month. Also, the Money Market Portfolio provides more detailed portfolio holdings information to the SEC on Form N-MFP within five business days after the end of each month. The SEC makes Form N-MFP filings publicly available on its website two months after the filing and a link to the SEC filing is posted on the Fund's website.
The Fund provides a complete schedule of portfolio holdings for the second and fourth fiscal quarters in its semiannual and annual reports, and for the first and third fiscal quarters in its filings with the SEC on Form N-Q.
All other portfolio holdings information that has not been disseminated in a manner making it available to investors generally as described above is non-public information for purposes of the Policy.
The Fund may make selective disclosure of non-public portfolio holdings pursuant to certain exemptions set forth in the Policy. Third parties eligible for exemptions under the Policy and therefore eligible to receive such disclosures currently include fund rating agencies, information exchange subscribers, consultants and analysts, portfolio analytics providers and service providers, provided that the third party expressly agrees to maintain the disclosed information in confidence and not to trade portfolio securities or related derivative securities based on the non-public information. Non-public portfolio holdings information may not be disclosed to a third party pursuant to an exemption unless and until the third party recipient has entered into a non-disclosure agreement with the Fund and the arrangement has been reviewed and approved, as set forth in the Policy and discussed below. In addition, persons who owe a duty of trust or confidence to the Fund, the Adviser or the Sub-Advisers may receive non-public portfolio holdings information without entering into a non-disclosure agreement. Currently, these persons include (i) the Fund's independent registered public accounting firm (as of the Fund's fiscal year-end and on an as needed basis), (ii) counsel to the Fund (on an as needed basis), (iii) counsel to the independent Trustees (on an as needed basis) and (iv) members of the Board of Trustees (on an as needed basis). Subject to the terms and conditions of any agreement between the Adviser, the Sub-Advisers or the Fund and the third party recipient, if these conditions for disclosure are satisfied, there shall be no restriction on the frequency with which Fund non-public portfolio holdings information is released, and no lag period shall apply (unless otherwise indicated below).
The Adviser and Sub-Advisers may provide interest lists to broker-dealers who execute securities transactions for the Fund without entering into a non-disclosure agreement with the broker-dealers, provided that the interest list satisfies all of the following criteria: (1) the interest list must contain only the CUSIP numbers and/or ticker symbols of securities held in all registered management investment companies advised by the Adviser and Sub-Advisers or any affiliate of the Adviser or Sub-Advisers (the "MSIM Funds") on an aggregate, rather than a fund-by-fund basis; (2) the interest list must not contain information about the number or value of shares owned by a specified MSIM Fund; (3) the interest list may identify
30
the investment strategy, but not the particular MSIM Funds, to which the list relates; and (4) the interest list may not identify the portfolio manager or team members responsible for managing the MSIM Funds.
Fund shareholders may elect in some circumstances to redeem their shares of the Fund in exchange for their pro rata share of the securities held by the Fund. Under such circumstances, Fund shareholders may receive a complete listing of the holdings of the Fund up to seven calendar days prior to making the redemption request provided that they represent in writing that they agree not to disclose or trade on the basis of the portfolio holdings information.
The Fund may discuss or otherwise disclose performance attribution analyses (i.e., mention the effects of having a particular security in the portfolio(s)) where such discussion is not contemporaneously made public, provided that the particular holding has been disclosed publicly. Additionally, any discussion of the analyses may not be more current than the date the holding was disclosed publicly.
The Fund may disclose portfolio holdings to transition managers, provided that the Fund has entered into a non-disclosure or confidentiality agreement with the party requesting that the information be provided to the transition manager and the party to the non-disclosure agreement has, in turn, entered into a non-disclosure or confidentiality agreement with the transition manager.
The Adviser and/or the Fund currently have entered into ongoing arrangements with the following parties:
Name | | Information Disclosed | | Frequency(1) | | Lag Time | |
Service Providers | |
RiskMetrics Group
(proxy voting agent)(*) | | Complete portfolio holdings | | Daily basis | | | (2) | | |
FT Interactive Data Pricing Service
Provider(*) | | Complete portfolio holdings | | As needed | | | (2) | | |
| State Street Bank and Trust Company(*) | | Complete portfolio holdings | | As needed | | | (2) | | |
Fund Rating Agencies | |
| Lipper(*) | | Top ten and complete portfolio holdings | | Quarterly basis | | Approximately 15 days after quarter end and approximately 30 days after quarter end | |
| Morningstar(**) | | Top ten and complete portfolio holdings | | Quarterly basis | | Approximately 15 days after quarter end and approximately 30 days after quarter end | |
| Standard & Poor's(*) | | Complete portfolio holdings | | Quarterly basis | | Approximately 15 day lag | |
| Investment Company Institute(**) | | Top ten portfolio holdings | | Quarterly basis | | Approximately 15 days after quarter end | |
Consultants and Analysts | |
| Americh Massena & Associates, Inc.(*) | | Top ten and complete portfolio holdings | | Quarterly basis(5) | | Approximately 10-12 days after quarter end | |
| Bloomberg(**) | | Complete portfolio holdings | | Quarterly basis | | Approximately 30 days after quarter end | |
| Callan Associates(*) | | Top ten and complete portfolio holdings | | Monthly and quarterly basis, respectively(5) | | Approximately 10-12 days after month/quarter end | |
| Cambridge Associates(*) | | Top ten and complete portfolio holdings | | Quarterly basis(5) | | Approximately 10-12 days after quarter end | |
| Citigroup(*) | | Complete portfolio holdings | | Quarterly basis(5) | | At least one day after quarter end | |
| Credit Suisse First Boston(*) | | Top ten and complete portfolio holdings | | Monthly and quarterly basis, respectively | | Approximately 10-12 days after month/quarter end | |
31
Name | | Information Disclosed | | Frequency(1) | | Lag Time | |
| CTC Consulting, Inc.(**) | | Top ten and complete portfolio holdings | | Quarterly basis | | Approximately 15 days after quarter end and approximately 30 days after quarter end, respectively | |
| Evaluation Associates(*) | | Top ten and complete portfolio holdings | | Monthly and quarterly basis, respectively(5) | | Approximately 10-12 days after month/quarter end | |
| Fund Evaluation Group(**) | | Top ten portfolio holdings(3) | | Quarterly basis | | At least 15 days after quarter end | |
| Jeffrey Slocum & Associates(*) | | Complete portfolio holdings(4) | | Quarterly basis(5) | | Approximately 10-12 days after quarter end | |
| Hammond Associates(**) | | Complete portfolio holdings(4) | | Quarterly basis | | At least 30 days after quarter end | |
| Hartland & Co.(**) | | Complete portfolio holdings(4) | | Quarterly basis | | At least 30 days after quarter end | |
| Hartford Life and Annuity Insurance Company and Hartford Life Insurance Company(*) | | Top ten portfolio holdings(6) | | Quarterly basis(5) | | Approximately 12 business days after quarter end | |
| Hewitt EnnisKnupp(*) | | Top ten and complete portfolio holdings | | Monthly and quarterly basis, respectively(5) | | Approximately 10-12 days after month/quarter end | |
| Merrill Lynch(*) | | Top ten and complete portfolio holdings | | Monthly and quarterly basis, respectively(5) | | Approximately 10-12 days after month/quarter end | |
| Mobius(**) | | Top ten portfolio holdings(3) | | Monthly basis | | At least 15 days after month end | |
| Nelsons(**) | | Top ten portfolio holdings(3) | | Quarterly basis | | At least 15 days after quarter end | |
| Prime, Buchholz & Associates, Inc.(**) | | Complete portfolio holdings(4) | | Quarterly basis | | At least 30 days after quarter end | |
| PSN(**) | | Top ten portfolio holdings(3) | | Quarterly basis | | At least 15 days after quarter end | |
| PFM Asset Management LLC(*) | | Top ten and complete portfolio holdings | | Quarterly basis(5) | | Approximately 10-12 days after quarter end | |
Russell Investment Group/Russell/
Mellon Analytical Services, Inc.(**) | | Top ten and complete portfolio holdings | | Monthly and quarterly basis | | At least 15 days after month end and at least 30 days after quarter end, respectively | |
| Stratford Advisory Group, Inc.(*) | | Top ten portfolio holdings(6) | | Quarterly basis(5) | | Approximately 10-12 days after quarter end | |
| Thompson Financial(**) | | Complete portfolio holdings(4) | | Quarterly basis | | At least 30 days after quarter end | |
Watershed Investment Consultants,
Inc.(*) | | Top ten and complete portfolio holdings | | Quarterly basis(5) | | Approximately 10-12 days after quarter end | |
| Yanni Partners(**) | | Top ten portfolio holdings(3) | | Quarterly basis | | At least 15 days after quarter end | |
Portfolio Analystics Providers | |
| FactSet Research Systems, Inc.(*) | | Complete portfolio holdings | | Daily basis | | One day | |
(*) This entity has agreed to maintain Fund non-public portfolio holdings information in confidence and not to trade portfolio securities based on the non-public portfolio holdings information.
(**) The Fund does not currently have a non-disclosure agreement in place with this entity and therefore the entity can only receive publicly available information.
(1) Dissemination of portfolio holdings information to entities listed above may occur less frequently than indicated (or not at all).
(2) Information will typically be provided on a real time basis or as soon thereafter as possible.
(3) Complete portfolio holdings will also be provided upon request from time to time on a quarterly basis, with at least a 30 day lag.
(4) Top ten portfolio holdings will also be provided upon request from time to time, with at least a 15 day lag.
(5) This information will also be provided upon request from time to time.
(6) Complete portfolio holdings will also be provided upon request from time to time.
32
In addition, the following insurance companies, which are deemed service providers to the Fund, receive top ten portfolio holdings information, on a quarterly basis, approximately 15 days after quarter end: Allstate Life Insurance Company, Allstate Life Insurance Company of New York, MetLife Life and Annuity Company of Connecticut, Metropolitan Life Insurance Company and Metropolitan Life Insurance Company of Connecticut. The Fund does not currently have non-disclosure agreements in place with these entities and therefore, these entities can only receive publicly available information.
All disclosures of non-public portfolio holdings information made to third parties pursuant to the exemptions set forth in the Policy must be reviewed by Morgan Stanley Investment Management's ("MSIM") Legal and Compliance Division and approved by the Head of the Long-Only Business of MSIM. Disclosures made to third parties in connection with (i) broker-dealer interest lists; (ii) shareholder in-kind distributions; (iii) attribution analyses; or (iv) transition managers are pre-approved for purposes of the Policy. In addition, the following categories of third parties that may receive non-public portfolio holdings information are also pre-approved provided that they enter into non-disclosure agreements (as discussed above) (i) fund rating agencies; (ii) information exchange subscribers; (iii) consultants and analysts (including defined benefit and defined contribution plan sponsors, and variable annuity providers); (iv) portfolio analytics providers; and (v) service providers.
The Adviser and the Sub-Advisers shall report quarterly to the Board of Trustees (or a designated committee thereof) at the next regularly scheduled meeting: (i) any material information concerning all parties receiving non-public portfolio holdings information pursuant to an exemption; and (ii) any new non-disclosure agreements entered into during the reporting period. Procedures to monitor the use of such non-public portfolio holdings information may include requiring annual certifications that the recipients have utilized such information only pursuant to the terms of the agreement between the recipient and the Adviser and, for those recipients receiving information electronically, acceptance of the information will constitute reaffirmation that the third party expressly agrees to maintain the disclosed information in confidence and not to trade portfolio securities based on the non-public information.
III. MANAGEMENT OF THE FUND
A. Board of Trustees
General. The Board of Trustees of the Fund oversees the management of the Portfolios, but does not itself manage each Portfolio. The Trustees review various services provided by or under the direction of the Adviser to ensure that each Portfolio's general investment policies and programs are properly carried out. The Trustees also conduct their review to ensure that administrative services are provided to each Portfolio in a satisfactory manner.
Under state law, the duties of the Trustees are generally characterized as a duty of loyalty and a duty of care. The duty of loyalty requires a Trustee to exercise his or her powers in the interest of the Fund and each Portfolio and not the Trustee's own interest or the interest of another person or organization. A Trustee satisfies his or her duty of care by acting in good faith with the care of an ordinarily prudent person and in a manner the Trustee reasonably believes to be in the best interest of the Fund and each Portfolio and its shareholders.
Trustees and Officers. The Board of the Fund consists of 10 Trustees. These same individuals also serve as directors or trustees for certain of the funds advised by the Adviser and Morgan Stanley AIP GP LP. Nine Trustees have no affiliation or business connection with the Adviser or any of its affiliated persons and do not own any stock or other securities issued by the Adviser's parent company, Morgan Stanley. These are the "non-interested" or "Independent" Trustees. The other Trustee (the "Interested Trustee") is affiliated with the Adviser.
Board Structure and Oversight Function. The Board's leadership structure features an Independent Trustee serving as Chairperson and the Board Committees described below. The Chairperson participates in the preparation of the agenda for meetings of the Board and the preparation of information to be presented to the Board with respect to matters to be acted upon by the Board. The Chairperson also presides at all meetings of the Board and is involved in discussions regarding matters pertaining to the oversight of the management of the Fund between meetings.
33
The Board of Trustees operates using a system of committees to facilitate the timely and efficient consideration of all matters of importance to the Trustees, the Fund and Fund shareholders, and to facilitate compliance with legal and regulatory requirements and oversight of the Fund's activities and associated risks. The Board of Trustees has established four standing committees: (1) Audit Committee, (2) Governance Committee, (3) Compliance and Insurance Committee, and (4) Investment Committee. The Audit Committee and the Governance Committee are comprised exclusively of Independent Trustees. Each committee charter governs the scope of the committee's responsibilities with respect to the oversight of the Fund. The responsibilities of each committee, including their oversight responsibilities, are described further under the caption "Independent Trustees and the Committees."
The Fund is subject to a number of risks, including investment, compliance, operational and valuation risk, among others. The Board of Trustees oversees these risks as part of its broader oversight of the Fund's affairs through various Board and committee activities. The Board has adopted, and periodically reviews, policies and procedures designed to address various risks to the Fund. In addition, appropriate personnel, including but not limited to the Fund's Chief Compliance Officer, members of the Fund's administration and accounting teams, representatives from the Fund's independent registered public accounting firm, the Fund's Treasurer, portfolio management personnel and independent valuation and brokerage evaluation service providers, make regular reports regarding the Fund's activities and related risks to the Board of Trustees and the committees, as appropriate. These reports include, among others, quarterly performance reports, quarterly derivatives activity and risk reports and discussions with members of the risk teams relating to each asset class. The Board's committee structure allows separate committees to focus on different aspects of risk and the potential impact it has on some or all of the funds in the complex and then report back to the full Board. In between regular meetings, Fund officers also communicate with the Trustees regarding material exceptions and items relevant to the Board's risk oversight function. The Board recognizes that it is not possible to identify all of the risks that may affect the Fund, and that it is not possible to develop processes and controls to eliminate all of the risks that may affect the Fund. Moreover, the Board recognizes that it may be necessary for the Fund to bear certain risks (such as investment risks) to achieve its investment objective.
As needed between meetings of the Board, the Board or a specific committee receives and reviews reports relating to the Fund and engages in discussions with appropriate parties relating to the Fund's operations and related risks.
B. Management Information
Independent Trustees. The Fund seeks as Trustees individuals of distinction and experience in business and finance, government service or academia. In determining that a particular Trustee was and continues to be qualified to serve as Trustee, the Board has considered a variety of criteria, none of which, in isolation, was controlling. Based on a review of the experience, qualifications, attributes or skills of each Trustee, including those enumerated in the table below, the Board has determined that each of the Trustees is qualified to serve as a Trustee of the Fund. In addition, the Board believes that, collectively, the Trustees have balanced and diverse experience, qualifications, attributes and skills that allow the Board to operate effectively in governing the Fund and protecting the interests of shareholders. Information about the Fund's Governance Committee and Board of Trustees nomination process is provided below under the caption "Independent Trustees and the Committees."
The Independent Trustees of the Fund, their age, address, term of office and length of time served, their principal business occupations during the past five years, the number of portfolios in the Fund Complex (defined below) overseen by each Independent Trustee (as of December 31, 2011) and other directorships, if any, held by the Trustees, are shown below. The Fund Complex includes all open-end and closed-end funds (including all of their portfolios) advised by the Adviser and any funds that have an adviser that is an affiliate of the Adviser (including, but not limited to, Morgan Stanley AIP GP LP) (the "Morgan Stanley Funds").
34
Independent Trustee:
Name, Age and Address of
Independent Trustee | | Position(s)
Held with
Registrant | | Length of
Time
Served* | | Principal Occupation(s)
During Past 5 Years | | Number of
Portfolios
in Fund
Complex
Overseen by
Independent
Trustee | | Other Directorships Held
by Independent Trustee** | |
Frank L. Bowman (67)
c/o Kramer Levin Naftalis & Frankel LLP
Counsel to the Independent Trustees
1177 Avenue of the Americas
New York, NY 10036 | | Trustee | | Since August 2006 | | President, Strategic Decisions, LLC (consulting) (since February 2009); Director or Trustee of various Morgan Stanley Funds (since August 2006); Chairperson of the Insurance Sub-Committee of the Compliance and Insurance Committee (since February 2007); served as President and Chief Executive Officer of the Nuclear Energy Institute (policy organization) (February 2005-November 2008); retired as Admiral, U.S. Navy after serving over 38 years on active duty including 8 years as Director of the Naval Nuclear Propulsion Program in the Department of the Navy and the U.S. Department of Energy (1996-2004); served as Chief of Naval Personnel (July 1994-September 1996); and on the Joint Staff as Director of Political Military Affairs (June 1992-July 1994); Knighted as Honorary Knight Commander of the Most Excellent Order of the British Empire; Awarded the Officer de I'Orde National du Mérite by the French Government; elected to the National Academy of Engineering (2009). | | | 102 | | | Director of BP p.l.c.; Director of Naval and Nuclear Technologies LLP; Director of the Armed Services YMCA of the USA and the Naval Submarine League; Director of the American Shipbuilding Suppliers Association; Member of the National Security Advisory Council of the Center for U.S. Global Engagement and a member of the CNA Military Advisory Board; Member of the American Lung Association's President's Council. | |
Michael Bozic (71)
c/o Kramer Levin Naftalis & Frankel LLP
Counsel to the Independent Trustees
1177 Avenue of the Americas
New York, NY 10036 | | Trustee | | Since April 1994 | | Private investor; Chairperson of the Compliance and Insurance Committee (since October 2006); Director or Trustee of various Morgan Stanley Funds (since April 1994); formerly, Chairperson of the Insurance Committee (July 2006-September 2006); Vice Chairman of Kmart Corporation (December 1998-October 2000), Chairman and Chief Executive Officer of Levitz Furniture Corporation (November 1995-November 1998) and President and Chief Executive Officer of Hills Department Stores (May 1991-July 1995); variously Chairman, Chief Executive Officer, President and Chief Operating Officer (1987-1991) of the Sears Merchandise Group of Sears, Roebuck & Co. | | | 104 | | | Director of various business organizations. | |
* Each Trustee serves an indefinite term, until his or her successor is elected.
** This includes any directorships at public companies and registered investment companies held by the Trustee at any time during the past five years.
35
Name, Age and Address of
Independent Trustee | | Position(s)
Held with
Registrant | | Length of
Time
Served* | | Principal Occupation(s)
During Past 5 Years | | Number of
Portfolios
in Fund
Complex
Overseen by
Independent
Trustee | | Other Directorships Held
by Independent Trustee** | |
Kathleen A. Dennis (58)
c/o Kramer Levin Naftalis & Frankel LLP
Counsel to the Independent Trustees
1177 Avenue of the Americas
New York, NY 10036 | | Trustee | | Since August 2006 | | President, Cedarwood Associates (mutual fund and investment management consulting) (since July 2006); Chairperson of the Money Market and Alternatives Sub-Committee of the Investment Committee (since October 2006) and Director or Trustee of various Morgan Stanley Funds (since August 2006); formerly, Senior Managing Director of Victory Capital Management (1993-2006). | | | 102 | | | Director of various
non-profit organizations. | |
Dr. Manuel H. Johnson (63)
c/o Johnson Smick Group, Inc.
888 16th Street, N.W. Suite 740
Washington, D.C. 20006 | | Trustee | | Since July 1991 | | Senior Partner, Johnson Smick International, Inc. (consulting firm); Chairperson of the Investment Committee (since October 2006) and Director or Trustee of various Morgan Stanley Funds (since July 1991); Co-Chairman and a founder of the Group of Seven Council (G7C) (international economic commission); formerly, Chairperson of the Audit Committee (July 1991-September 2006); Vice Chairman of the Board of Governors of the Federal Reserve System and Assistant Secretary of the U.S. Treasury. | | | 104 | | | Director of NVR, Inc. (home construction). | |
Joseph J. Kearns (69)
c/o Kearns & Associates LLC
PMB754
22631 Pacific Coast Highway
Malibu, CA 90265 | | Trustee | | Since August 1994 | | President, Kearns & Associates LLC (investment consulting); Chairperson of the Audit Committee (since October 2006) and Director or Trustee of various Morgan Stanley Funds (since August 1994); formerly, Deputy Chairperson of the Audit Committee (July 2003-September 2006) and Chairperson of the Audit Committee of various Morgan Stanley Funds (since August 1994); CFO of the J. Paul Getty Trust. | | | 105 | | | Director of Electro Rent Corporation (equipment leasing) and The Ford Family Foundation. | |
* Each Trustee serves an indefinite term, until his or her successor is elected.
** This includes any directorships at public companies and registered investment companies held by the Trustee at any time during the past five years.
36
Name, Age and Address of
Independent Trustee | | Position(s)
Held with
Registrant | | Length of
Time
Served* | | Principal Occupation(s)
During Past 5 Years | | Number of
Portfolios
in Fund
Complex
Overseen by
Independent
Trustee | | Other Directorships Held
by Independent Trustee** | |
Michael F. Klein (53)
c/o Kramer Levin Naftalis &
Frankel LLP
Counsel to the Independent Trustees
1177 Avenue of the Americas
New York, NY 10036 | | Trustee | | Since August 2006 | | Managing Director, Aetos Capital, LLC (since March 2000) and Co-President, Aetos Alternatives Management, LLC (since January 2004); Chairperson of the Fixed Income Sub-Committee of the Investment Committee (since October 2006) and Director or Trustee of various Morgan Stanley Funds (since August 2006); formerly, Managing Director, Morgan Stanley & Co. Inc. and Morgan Stanley Dean Witter Investment Management, President, various Morgan Stanley Funds (June 1998-March 2000) and Principal, Morgan Stanley & Co. Inc. and Morgan Stanley Dean Witter Investment Management (August 1997-December 1999). | | | 102 | | | Director of certain investment funds managed or sponsored by Aetos Capital, LLC.; Director of Sanitized AG and Sanitized Marketing AG (specialty chemicals). | |
Michael E. Nugent (75)
c/o Triumph Capital, L.P.
445 Park Avenue
New York, NY 10022 | | Chair-person of the Board and Trustee | | Chair-person of the Boards since July 2006 and Trustee since July 1991 | | General Partner, Triumph Capital, L.P., (private investment partnership); Chairperson of the Boards of various Morgan Stanley Funds (since July 2006); Director or Trustee of various Morgan Stanley Funds (since July 1991); formerly, Chairperson of the Insurance Committee (until July 2006). | | | 104 | | | None. | |
W. Allen Reed (65)
c/o Kramer Levin Naftalis & Frankel LLP
Counsel to the Independent Trustees
1177 Avenue of the Americas
New York, NY 10036 | | Trustee | | Since August 2006 | | Chairperson of the Equity Sub-Committee of the Investment Committee (since October 2006) and Director or Trustee of various Morgan Stanley Funds (since August 2006); formerly, President and CEO of General Motors Asset Management; Chairman and Chief Executive Officer of the GM Trust Bank and Corporate Vice President of General Motors Corporation (August 1994-December 2005). | | | 102 | | | Director of Temple-Inland Industries (packaging and forest products), Director of Legg Mason, Inc. and Director of the Auburn University Foundation. | |
Fergus Reid (79)
c/o Joe Pietryka, Inc.
85 Charles Colman Blvd.
Pawling, NY 12564 | | Trustee | | Since June 1992 | | Chairman, Joe Pietryka, Inc.; Chairperson of the Governance Committee and Director or Trustee of various Morgan Stanley Funds (since June 1992). | | | 105 | | | Trustee and Director of certain investment companies in the JPMorgan Funds complex managed by JP Morgan Investment Management Inc. | |
* Each Trustee serves an indefinite term, until his or her successor is elected.
** This includes any directorships at public companies and registered investment companies held by the Trustee at any time during the past five years.
37
The Trustee who is affiliated with the Adviser or affiliates of the Adviser (as set forth below) and executive officers of the Fund, their age, address, term of office and length of time served, their principal business occupations during the past five years, the number of portfolios in the Fund Complex overseen by the Interested Trustee (as of December 31, 2011) and the other directorships, if any, held by the Interested Trustee, are shown below.
Interested Trustee:
Name, Age and Address of
Interested Trustee | | Position(s)
Held with
Registrant | | Length of
Time
Served* | | Principal Occupation(s)
During Past 5 Years | | Number of
Portfolios
in Fund
Complex
Overseen by
Interested
Trustee | | Other Directorships Held
by Interested Trustee** | |
James F. Higgins (64)
c/o Morgan Stanley Trust Harborside Financial Center
201 Plaza Two
Jersey City, NJ 07311 | | Trustee | | Since June 2000 | | Director or Trustee of various Morgan Stanley Funds (since June 2000); Senior Advisor of Morgan Stanley (since August 2000). | | | 103 | | | Director of AXA Financial, Inc. and The Equitable Life Assurance Society of the United States (financial services). | |
* Each Trustee serves an indefinite term, until his or her successor is elected.
** This includes any directorships at public companies and registered investment companies held by the Trustee at any time during the past five years.
The executive officers of the Fund, their age, address, position held, term of office and length of time served, and their principal business occupations during the past five years are shown below.
Executive Officers:
Name, Age and Address of
Executive Officer | | Position(s)
Held with
Registrant | | Length of
Time
Served* | | Principal Occupation(s)
During Past 5 Years | |
Arthur Lev (50)
522 Fifth Avenue
New York, NY 10036 | | President and Principal Executive Officer — Equity and Fixed Income Funds | | Since June 2011 | | President and Principal Executive Officer (since June 2011) of the Equity and Fixed Income Funds in the Fund Complex; Head of the Long-Only Business of Morgan Stanley Investment Management (since February 2011); Managing Director of the Adviser and various entities affiliated with the Adviser (since December 2006). Formerly, Chief Strategy Officer of Morgan Stanley Investment Management's Traditional Asset Management business (November 2010-February 2011); General Counsel of Morgan Stanley Investment Management (December 2006-October 2010); Partner and General Counsel of FrontPoint Partners LLC (July 2002-December 2006); Managing Director and General Counsel of Morgan Stanley Investment Management (May 2000-June 2002). | |
Mary Ann Picciotto (39)
c/o Morgan Stanley
Services Company Inc. Harborside Financial Center
201 Plaza Two
Jersey City, NJ 07311 | | Chief Compliance Officer | | Since May 2010 | | Managing Director of the Adviser and various entities affiliated with the Adviser; Chief Compliance Officer of various Morgan Stanley Funds (since May 2010); Chief Compliance Officer of the Adviser (since April 2007). | |
Stefanie V. Chang Yu (45)
522 Fifth Avenue
New York, NY 10036 | | Vice President | | Since December 1997 | | Managing Director of the Adviser and various entities affiliated with the Adviser; Vice President of various Morgan Stanley Funds (since December 1997). | |
Francis J. Smith (46)
c/o Morgan Stanley
Services Company Inc.
Harborside Financial Center
201 Plaza Two
Jersey City, NJ 07311 | | Treasurer and Principal Financial Officer | | Treasurer since July 2003 and Principal Financial Officer since September 2002 | | Executive Director of the Adviser and various entities affiliated with the Adviser; Treasurer and Principal Financial Officer of various Morgan Stanley Funds (since July 2003). | |
Mary E. Mullin (45)
522 Fifth Avenue
New York, NY 10036 | | Secretary | | Since June 1999 | | Executive Director of the Adviser and various entities affiliated with the Adviser; Secretary of various Morgan Stanley Funds (since June 1999). | |
* Each Officer serves an indefinite term, until his or her successor is elected.
38
In addition, the following individuals who are officers of the Adviser or its affiliates serve as assistant secretaries of the Fund: Joanne Antico, Joseph C. Benedetti, Daniel E. Burton, Tara A. Farrelly and Edward J. Meehan.
For each Trustee, the dollar range of equity securities beneficially owned by the Trustee in the Fund and in the Family of Investment Companies (Family of Investment Companies includes all of the registered investment companies advised by the Adviser and Morgan Stanley AIP GP LP) for the calendar year ended December 31, 2011, is set forth in the table below.
Name of Trustee | | Dollar Range of Equity Securities in the Fund
(As of December 31, 2011) | | Aggregate Dollar Range of Equity Securities in
All Registered Investment Companies Overseen
by Trustee in Family of Investment Companies
(As of December 31, 2011) | |
Independent: | | | | | | | |
| Frank L. Bowman(1) | | | None | | | over $100,000 | |
Michael Bozic | | | None | | | over $100,000 | |
Kathleen A. Dennis | | | None | | | over $100,000 | |
Manuel H. Johnson | | | None | | | over $100,000 | |
| Joseph J. Kearns(1) | | | None | | | over $100,000 | |
Michael F. Klein | | | None | | | over $100,000 | |
Michael E. Nugent | | | None | | | over $100,000 | |
| W. Allen Reed(1) | | | None | | | over $100,000 | |
| Fergus Reid(1) | | | None | | | over $100,000 | |
Interested: | | | | | | | |
James F. Higgins | | | None | | | over $100,000 | |
(1) Includes the total amount of compensation deferred by the Trustee at his election pursuant to a deferred compensation plan. Such deferred compensation is placed in a deferral account and deemed to be invested in one or more of the Morgan Stanley Funds (or portfolio thereof) that are offered as investment options under the plan.
As to each Independent Trustee and his or her immediate family members, no person owned beneficially or of record securities in an investment adviser or principal underwriter of the Fund, or a person (other than a registered investment company) directly or indirectly controlling, controlled by or under common control with an investment adviser or principal underwriter of the Fund.
Independent Trustees and the Committees. Law and regulation establish both general guidelines and specific duties for the Independent Trustees. The Board has four committees: (1) Audit Committee, (2) Governance Committee, (3) Compliance and Insurance Committee and (4) Investment Committee. Three of the Independent Trustees serve as members of the Audit Committee, three Independent Trustees serve as members of the Governance Committee, four Trustees, including three Independent Trustees, serve as members of the Compliance and Insurance Committee and all of the Trustees serve as members of the Investment Committee.
The Independent Trustees are charged with recommending to the full Board approval of management, advisory and administration contracts, Rule 12b-1 plans and distribution and underwriting agreements; continually reviewing fund performance; checking on the pricing of portfolio securities, brokerage commissions, transfer agent costs and performance and trading among funds in the same complex; and approving fidelity bond and related insurance coverage and allocations, as well as other matters that arise from time to time. The Independent Trustees are required to select and nominate individuals to fill any Independent Trustee vacancy on the board of any fund that has a Rule 12b-1 plan of distribution.
The Board of Trustees has a separately-designated standing Audit Committee established in accordance with Section 3(a)(58)(A) of the Securities Exchange Act of 1934, as amended (the "Exchange Act"). The Audit Committee is charged with recommending to the full Board the engagement or discharge of the Fund's independent registered public accounting firm; directing investigations into matters within the scope of the independent registered public accounting firm's duties, including the power to retain outside specialists; reviewing with the independent registered public accounting firm the audit plan and results of the auditing engagement; approving professional services provided by the independent registered public
39
accounting firm and other accounting firms prior to the performance of the services; reviewing the independence of the independent registered public accounting firm; considering the range of audit and non-audit fees; reviewing the adequacy of the Fund's system of internal controls; and reviewing the valuation process. The Fund has adopted a formal, written Audit Committee Charter.
The members of the Audit Committee of the Fund are Joseph J. Kearns, Michael E. Nugent and W. Allen Reed. None of the members of the Fund's Audit Committee is an "interested person," as defined under the Investment Company Act, of the Fund (with such disinterested Trustees being "Independent Trustees" or individually, an "Independent Trustee"). Each Independent Trustee is also "independent" from the Fund under the listing standards of the NYSE. The Chairperson of the Audit Committee of the Fund is Joseph J. Kearns.
The Board of Trustees of the Fund also has a Governance Committee. The Governance Committee identifies individuals qualified to serve as Independent Trustees on the Fund's Board and on committees of such Board and recommends such qualified individuals for nomination by the Fund's Independent Trustees as candidates for election as Independent Trustees, advises the Fund's Board with respect to Board composition, procedures and committees, develops and recommends to the Fund's Board a set of corporate governance principles applicable to the Fund, monitors and makes recommendations on corporate governance matters and policies and procedures of the Fund's Board of Trustees and any Board committees and oversees periodic evaluations of the Fund's Board and its committees. The members of the Governance Committee of the Fund are Kathleen A. Dennis, Michael F. Klein and Fergus Reid, each of whom is an Independent Trustee. The Chairperson of the Governance Committee is Fergus Reid.
The Fund does not have a separate nominating committee. While the Fund's Governance Committee recommends qualified candidates for nominations as Independent Trustees, the Board of Trustees of the Fund believes that the task of nominating prospective Independent Trustees is important enough to require the participation of all current Independent Trustees, rather than a separate committee consisting of only certain Independent Trustees. Accordingly, each Independent Trustee (Frank L. Bowman, Michael Bozic, Kathleen A. Dennis, Manuel H. Johnson, Joseph J. Kearns, Michael F. Klein, Michael E. Nugent, W. Allen Reed and Fergus Reid) participates in the election and nomination of candidates for election as Independent Trustees for the Fund. Persons recommended by the Fund's Governance Committee as candidates for nomination as Independent Trustees shall possess such experience, qualifications, attributes, skills and diversity so as to enhance the Board's ability to manage and direct the affairs and business of the Fund, including, when applicable, to enhance the ability of committees of the Board to fulfill their duties and/or to satisfy any independence requirements imposed by law, regulation or any listing requirements of the NYSE. While the Independent Trustees of the Fund expect to be able to continue to identify from their own resources an ample number of qualified candidates for the Fund's Board as they deem appropriate, they will consider nominations from shareholders to the Board. Nominations from shareholders should be in writing and sent to the Independent Trustees as described below under the caption "Shareholder Communications."
The Board formed the Compliance and Insurance Committee to address insurance coverage and oversee the compliance function for the Fund and the Board. The Compliance and Insurance Committee consists of Frank L. Bowman, Michael Bozic, James F. Higgins and Manuel H. Johnson. Frank L. Bowman, Michael Bozic and Manuel H. Johnson are Independent Trustees. The Chairperson of the Compliance and Insurance Committee is Michael Bozic. The Compliance and Insurance Committee has an Insurance Sub-Committee to review and monitor the insurance coverage maintained by the Fund. The Chairperson of the Insurance Sub-Committee is Frank L. Bowman.
The Investment Committee oversees the portfolio investment process for and reviews the performance of the Fund. The Investment Committee also recommends to the Board to approve or renew the Fund's Investment Advisory, Sub-Advisory and Administration Agreements. The members of the Investment Committee are Frank L. Bowman, Michael Bozic, Kathleen A. Dennis, James F. Higgins, Manuel H. Johnson, Joseph J. Kearns, Michael F. Klein, Michael E. Nugent, W. Allen Reed and Fergus Reid. The Chairperson of the Investment Committee is Manuel H. Johnson.
40
The Investment Committee has three Sub-Committees, each with its own Chairperson. Each Sub-Committee focuses on the funds' primary areas of investment, namely equities, fixed income and alternatives. The Sub-Committees and their members are as follows:
(1) Equity — W. Allen Reed (Chairperson), Frank L. Bowman and Michael E. Nugent.
(2) Fixed Income — Michael F. Klein (Chairperson), Michael Bozic and Fergus Reid.
(3) Money Market and Alternatives — Kathleen A. Dennis (Chairperson), James F. Higgins and Joseph J. Kearns.
During the Fund's fiscal year ended December 31, 2011, the Board of Trustees held the following meetings:
Board of Trustees | | | 8 | | |
Committee/Sub-Committee: | | Number of meetings: | |
Audit Committee | | | 4 | | |
Governance Committee | | | 4 | | |
Compliance and Insurance Committee | | | 4 | | |
Insurance Sub-Committee | | | 1 | | |
Investment Committee | | | 5 | | |
Equity Sub-Committee | | | 5 | | |
Fixed Income Sub-Committee | | | 5 | | |
Money Market and Alternatives Sub-Committee | | | 6 | | |
Experience, Qualifications and Attributes. The Board has concluded, based on each Trustee's experience, qualifications and attributes that each Board member should serve as a Trustee. Following is a brief summary of the information that led to and/or supports this conclusion.
Mr. Bowman has experience in a variety of business and financial matters through his prior service as a Director or Trustee for various other funds in the Fund Complex, where he serves as Chairperson of the Insurance Sub-Committee of the Compliance and Insurance Committee, and as a Director of B.P. p.l.c. and Naval and Nuclear Technologies LLP. Mr. Bowman also serves as a Director for the Armed Services YMCA of the USA, the Naval Submarine League and the American Shipbuilding Suppliers Association. Mr. Bowman is also a member of the National Securities Advisory Council of the Center for U.S. Global Engagement and a member of the CNA Military Advisory Board. Mr. Bowman retired as an Admiral in the U.S. Navy after serving over 38 years on active duty including 8 years as Director of the Naval Nuclear Propulsion Program in the Department of the Navy and the U.S. Department of Energy (1996-2004). Additionally, Mr. Bowman served as the U.S. Navy's Chief of Naval Personnel where he was responsible for the planning and programming of all manpower, personnel, training and education resources for the U.S. Navy, and on the Joint Staff as Director of Political Military Affairs (1992-1994). In addition, Mr. Bowman served as President and Chief Executive Officer of the Nuclear Energy Institute. Mr. Bowman has received such distinctions as a knighthood as Honorary Knight Commander of the Most Excellent Order of the British Empire and the Officer de l'Orde National du Mérite from the French Government and was elected to the National Academy of Engineering (2009). He is President of the consulting firm Strategic Decisions, LLC.
With over 20 years of experience on the boards and in senior management of such companies as Kmart Corporation, Levitz Furniture Corporation, Hills Department Stores and Sears Merchandise Group of Sears, Roebuck & Co., where Mr. Bozic also served as Chief Financial Officer of the Merchandise Group, and with over 15 years of experience as a Director or Trustee of certain other funds in the Fund Complex, Mr. Bozic has experience with a variety of financial, management, regulatory and operational issues as well as experience with marketing and distribution. Mr. Bozic has served as the Chairperson of the Compliance and Insurance Committee since 2006.
Ms. Dennis has over 25 years of business experience in the financial services industry and related fields including serving as a Director or Trustee of various other funds in the Fund Complex, where she serves as Chairperson of the Money Market and Alternatives Sub-Committee of the Investment Committee.
41
Ms. Dennis possesses a strong understanding of the regulatory framework under which investment companies must operate based on her years of service to this Board and her position as Senior Managing Trustee of Victory Capital Management.
In addition to his tenure as a Director or Trustee of various other funds in the Fund Complex, where he formerly served as Chairperson of the Audit Committee, Dr. Johnson has also served as an officer or a board member of numerous companies for nearly 20 years. These positions included Co-Chairman and a founder of the Group of Seven Council, Director of NVR, Inc., Director of Evergreen Energy and Director of Greenwich Capital Holdings. He also has served as Vice Chairman of the Board of Governors of the Federal Reserve System and Assistant Secretary of the U.S. Treasury. In addition, Dr. Johnson also served as Chairman of the Financial Accounting Foundation, which oversees the Financial Accounting Standards Board, for seven years.
Mr. Kearns gained extensive experience regarding accounting through his experience on the Audit Committees of the boards of other funds in the Funds Complex, including serving as either Chairperson or Deputy Chairperson of the Audit Committee for fourteen years, and through his position as Chief Financial Officer of the J. Paul Getty Trust. He also has experience in financial, accounting, investment and regulatory matters through his position as President and founder of Kearns & Associates LLC, a financial consulting company. Mr. Kearns also serves as a Director of Electro Rent Corporation and The Ford Family Foundation. The Board has determined that Mr. Kearns is an "audit committee financial expert" as defined by the SEC.
Through his prior positions as Managing Director of Morgan Stanley & Co. Inc. and Morgan Stanley Dean Witter Investment Management and as President of Morgan Stanley Institutional Funds, Mr. Klein has experience in the management and operation of registered investment companies, enabling him to provide management input and investment guidance to the Board. Mr. Klein also has extensive experience in the investment management industry based on his current positions as Managing Director of Aetos Capital, LLC and as Director of certain investment funds managed or sponsored by Aetos Capital, LLC. In addition, he also has experience as a member of the board of other funds in the Fund Complex.
Mr. Nugent has extensive experience with financial, accounting, investment and regulatory matters through his almost 20 years of service on the boards of various funds in the Fund Complex, including time as the Chairperson of the Insurance Committee and Chairman of the Morgan Stanley Funds. Mr. Nugent also has experience as a General Partner in Triumph Capital, L.P.
Mr. Reed has experience on investment company boards and is experienced with financial, accounting, investment and regulatory matters through his prior service as a Director of iShares, Inc. and his service as Trustee and Director of other funds in the Fund Complex. Mr. Reed also gained substantial experience in the financial services industry through his position as Director of Legg Mason, Inc. and prior position as President and CEO of General Motors Asset Management.
Mr. Reid has served on a number of mutual fund boards, including as a Director and Trustee of certain investment companies in the JPMorgan Funds complex and as a Director or Trustee of other funds in the Fund Complex. Therefore, Mr. Reid is experienced with financial, accounting, investment and regulatory matters, enabling him to provide management input and investment guidance to the Board.
Mr. Higgins has over 30 years of experience in the financial services industry. Mr. Higgins has substantial mutual fund experience and is experienced with financial, accounting, investment and regulatory matters due to his experience on the boards of other funds in the Fund Complex. Mr. Higgins also serves on the boards of other companies in the financial services industry, including AXA Financial, Inc. and The Equitable Life Assurance Society of the United States.
The Trustees' principal occupations during the past five years or more are shown in the above tables.
Advantages of Having Same Individuals as Trustees for the Morgan Stanley Funds. The Independent Trustees and the Fund's management believe that having the same Independent Trustees for each of the Morgan Stanley Funds avoids the duplication of effort that would arise from having different groups of individuals serving as Independent Trustees for each of the funds or even of sub-groups of funds. They believe that having the same individuals serve as Independent Trustees of all the Morgan Stanley Funds tends to increase their knowledge and expertise regarding matters which affect the Fund Complex generally and enhances their ability to negotiate on behalf of each fund with the fund's service
42
providers. This arrangement also precludes the possibility of separate groups of Independent Trustees arriving at conflicting decisions regarding operations and management of the funds and avoids the cost and confusion that would likely ensue. Finally, having the same Independent Trustees serve on all fund boards enhances the ability of each fund to obtain, at modest cost to each separate fund, the services of Independent Trustees of the caliber, experience and business acumen of the individuals who serve as Independent Trustees of the Morgan Stanley Funds.
Trustee and Officer Indemnification. The Fund's Declaration of Trust provides that no Trustee, Officer, employee or agent of the Fund is liable to the Fund or to a shareholder, nor is any Trustee, Officer, employee or agent liable to any third persons in connection with the affairs of the Fund, except as such liability may arise from his/her or its own bad faith, willful misfeasance, gross negligence or reckless disregard of his/her or its duties. It also provides that all third persons shall look solely to Fund property for satisfaction of claims arising in connection with the affairs of the Fund. With the exceptions stated, the Declaration of Trust provides that a Trustee, Officer, employee or agent is entitled to be indemnified against all liability in connection with the affairs of the Fund.
Shareholder Communications. Shareholders may send communications to the Fund's Board of Trustees. Shareholders should send communications intended for the Fund's Board by addressing the communications directly to the Board (or individual Board members) and/or otherwise clearly indicating in the salutation that the communication is for the Board (or individual Board members) and by sending the communication to either the Fund's office or directly to such Board member(s) at the address specified for each Trustee previously noted. Other shareholder communications received by the Fund not directly addressed and sent to the Board will be reviewed and generally responded to by management, and will be forwarded to the Board only at management's discretion based on the matters contained therein.
C. Compensation
Each Trustee (except for the Chairperson of the Boards) receives an annual retainer fee of $210,000 for serving as a Trustee of the Morgan Stanley Funds.
The Chairperson of the Audit Committee receives an additional annual retainer fee of $78,750 and the Investment Committee Chairperson receives an additional annual retainer fee of $63,000. Other Committee and, effective January 1, 2012, Sub-Committee Chairpersons receive an additional annual retainer fee of $31,500. Prior to January 1, 2012, each Sub-Committee Chairperson received an annual retainer of $15,750. The aggregate compensation paid to each Trustee is paid by the Morgan Stanley Funds, and is allocated on a pro rata basis among each of the operational funds/portfolios of the Morgan Stanley Funds based on the relative net assets of each of the funds/portfolios. Michael E. Nugent receives a total annual retainer fee of $420,000 for his services as Chairperson of the Boards of the Morgan Stanley Funds and for administrative services provided to each Board.
The Fund also reimburses such Trustees for travel and other out-of-pocket expenses incurred by them in connection with attending such meetings. Trustees of the Fund who are employed by the Adviser receive no compensation or expense reimbursement from the Fund for their services as Trustee.
Effective April 1, 2004, the Fund began a Deferred Compensation Plan (the "DC Plan"), which allows each Trustee to defer payment of all, or a portion, of the fees he or she receives for serving on the Board of Trustees throughout the year. Each eligible Trustee generally may elect to have the deferred amounts credited with a return equal to the total return on one or more of the Morgan Stanley Funds (or portfolios thereof) that are offered as investment options under the DC Plan. At the Trustee's election, distributions are either in one lump sum payment, or in the form of equal annual installments over a period of five years. The rights of an eligible Trustee and the beneficiaries to the amounts held under the DC Plan are unsecured and such amounts are subject to the claims of the creditors of the Fund.
Prior to April 1, 2004, certain Morgan Stanley Funds maintained a similar Deferred Compensation Plan (the "Prior DC Plan"), which also allowed each Independent Trustee to defer payment of all, or a portion, of the fees he or she received for serving on the Board of Trustees throughout the year. Generally, the DC Plan amends and supersedes the Prior DC Plan and all amounts payable under the Prior DC Plan are now subject to the terms of the DC Plan (except for amounts paid during the calendar year 2004, which remain subject to the terms of the Prior DC Plan).
43
The following table shows aggregate compensation payable to each of the Fund's Trustees from the Fund for the fiscal year ended December 31, 2011 and the aggregate compensation payable to each of the funds' Trustees by the Fund Complex (which includes all of the Morgan Stanley Funds) for the calendar year ended December 31, 2011.
Compensation(1)
Name of Independent Trustee: | | Aggregate
compensation
from the Fund(2) | | Total
Compensation
from Fund and
Fund Complex
Paid to Trustee(3) | |
Frank L. Bowman | | $ | 2,549 | | | $ | 225,750 | | |
Michael Bozic | | | 2,688 | | | | 241,500 | | |
Kathleen A. Dennis | | | 2,549 | | | | 225,750 | | |
Manuel H. Johnson | | | 3,038 | | | | 273,000 | | |
Joseph J. Kearns(2) | | | 3,214 | | | | 306,750 | | |
Michael F. Klein | | | 2,549 | | | | 225,750 | | |
Michael E. Nugent | | | 4,674 | | | | 420,000 | | |
W. Allen Reed(2) | | | 2,549 | | | | 225,750 | | |
Fergus Reid | | | 2,688 | | | | 259,500 | | |
Name of Interested Trustee: | |
James F. Higgins | | | 2,339 | | | | 210,000 | | |
(1) Includes all amounts paid for serving as director/trustee of the funds, as well as serving as Chairperson of the Boards or a Chairperson of a Committee or Sub-Committee.
(2) The amounts shown in this column represent the aggregate compensation before deferral with respect to the Fund's fiscal year. The following Trustees deferred compensation from the Fund during the fiscal year ended December 31, 2011: Mr. Kearns, $1,189; Mr. Reed, $2,549.
(3) The amounts shown in this column represent the aggregate compensation paid by all of the funds in the Fund Complex as of December 31, 2011 before deferral by the Trustees under the DC Plan. As of December 31, 2011, the value (including interest) of the deferral accounts across the Fund Complex for Messrs. Kearns, Reed and Reid pursuant to the deferred compensation plan was $532,157, $674,903 and $523,935, respectively. Because the funds in the Fund Complex have different fiscal year ends, the amounts shown in this column are presented on a calendar year basis.
Prior to December 31, 2003, 49 of the Morgan Stanley Funds (the "Adopting Funds"), including the Fund, had adopted a retirement program under which an Independent Trustee who retired after serving for at least five years as an Independent Trustee of any such fund (an "Eligible Trustee") would have been entitled to retirement payments, based on factors such as length of service, upon reaching the eligible retirement age. On December 31, 2003, the amount of accrued retirement benefits for each Eligible Trustee was frozen, and will be payable, together with a return of 8% per annum, at or following each such Eligible Trustee's retirement as shown in the table below.
The following table illustrates the retirement benefits accrued to the Fund's Independent Trustees by the Fund for the fiscal year ended December 31, 2011 and by the Adopting Funds for the calendar year ended December 31, 2011, and the estimated retirement benefits for the Independent Trustees from the Fund for the fiscal year ended December 31, 2011 and from the Adopting Funds for each calendar year following retirement. Only the Trustees listed below participated in the retirement program.
Name of Independent Trustee: | | Retirement Benefits Accrued as
Fund Expenses | | Estimated Annual Benefits Upon
Retirement(1) | |
| | | By the
Fund | | By All Adopting
Funds | | From the
Fund | | From All Adopting
Funds | |
Michael Bozic | | $ | 929 | | | $ | 42,107 | | | $ | 967 | | | $ | 43,940 | | |
Manuel H. Johnson | | | 658 | | | | 30,210 | | | | 1,420 | | | | 64,338 | | |
Michael E. Nugent | | | 148 | | | | 6,805 | | | | 1,269 | | | | 57,539 | | |
(1) Total compensation accrued under the retirement plan, together with a return of 8% per annum, will be paid annually commencing upon retirement and continuing for the remainder of the Trustee's life.
44
IV. CONTROL PERSONS AND PRINCIPAL HOLDERS OF SECURITIES
As of the date of this SAI, Allstate Life Insurance Company ("Allstate") and Allstate Life Insurance Company of New York ("Allstate NY") owned 5% or more of the Class of each Portfolio of the Fund listed below for allocation to their respective separate accounts ("Accounts"), none of the Fund's Trustees was a Contract Owner under the Accounts, and the aggregate number of shares of each Portfolio of the Fund allocated to Contracts owned by the Fund's officers as a group was less than one percent of each Portfolio's outstanding Class X or Class Y shares.
The address of Allstate is 3100 Sanders Road, Northbrook, IL 60062. The address of Allstate NY is 100 Motor Parkway, Suite 132, Hauppauge, NY 11788-5107.
Allstate and/or Allstate NY owned 5% or more of the shares of each Class of each Portfolio of the Fund as of March 30, 2012:
Class/Portfolio | | Allstate | | Allstate NY | |
Class X: Money Market Portfolio | | | 92.59 | % | | | — | | |
Class Y: Money Market Portfolio | | | 96.26 | % | | | — | | |
Class X: Limited Duration Portfolio | | | 92.57 | % | | | — | | |
Class Y: Limited Duration Portfolio | | | 96.71 | % | | | — | | |
Class X: Income Plus Portfolio | | | 91.56 | % | | | 6.24 | % | |
Class Y: Income Plus Portfolio | | | 97.62 | % | | | — | | |
Class X: Global Infrastructure Portfolio | | | 92.01 | % | | | 6.83 | % | |
Class Y: Global Infrastructure Portfolio | | | 97.79 | % | | | — | | |
Class X: European Equity Portfolio | | | 91.66 | % | | | 6.20 | % | |
Class Y: European Equity Portfolio | | | 96.65 | % | | | — | | |
Class X: Multi Cap Growth Portfolio | | | 94.33 | % | | | — | | |
Class Y: Multi Cap Growth Portfolio | | | 95.86 | % | | | — | | |
Class X: Aggressive Equity Portfolio | | | 93.47 | % | | | — | | |
Class Y: Aggressive Equity Portfolio | | | 93.37 | % | | | 6.63 | % | |
Class X: Strategist Portfolio | | | 93.08 | % | | | 5.23 | % | |
Class Y: Strategist Portfolio | | | 97.17 | % | | | — | | |
V. INVESTMENT ADVISORY AND OTHER SERVICES
A. Adviser, Sub-Advisers and Administrator
The Adviser to each Portfolio is Morgan Stanley Investment Management Inc., a Delaware corporation, whose address is 522 Fifth Avenue, New York, NY 10036. The Adviser is a wholly-owned subsidiary of Morgan Stanley, a Delaware corporation. Morgan Stanley is a preeminent global financial services firm engaged in securities trading and brokerage activities, as well as providing investment banking, research and analysis, financing and financial advisory services.
With respect to the Global Infrastructure Portfolio, the Sub-Advisers are Morgan Stanley Investment Management Limited, located at 25 Cabot Square, Canary Wharf, London, E14 4QA, England and Morgan Stanley Investment Management Company, located at 23 Church Street, 16-01 Capital Square, Singapore 049481. Each is a wholly-owned subsidiary of Morgan Stanley.
With respect to the European Equity Portfolio, the Sub-Adviser is Morgan Stanley Investment Management Limited, located at 25 Cabot Square, Canary Wharf, London, E14 4QA, England. The Sub-Adviser is a wholly-owned subsidiary of Morgan Stanley.
Pursuant to an Amended and Restated Investment Advisory Agreement (the "Investment Advisory Agreement") with the Adviser, the Fund has retained the Adviser to manage and/or oversee the investment of the Fund's assets, including the placing of orders for the purchase and sale of portfolio securities. The Fund pays the Adviser monthly compensation calculated daily by applying the following annual rates to the net assets of each Portfolio determined as of the close of each business day. The investment advisory
45
fee is allocated among the Classes of each Portfolio pro rata based on the net assets of the Portfolio attributable to each Class.
Name of Portfolio | | Investment Advisory Fee Rates | |
Money Market
| | 0.45% of the portion of daily net assets not
exceeding $250 million; 0.375% of the portion of
daily net assets exceeding $250 million but not
exceeding $750 million; 0.325% of the portion of
daily net assets exceeding $750 million but not
exceeding $1.25 billion; 0.30% of the portion of
daily net assets exceeding $1.25 billion but not
exceeding $1.5 billion; and 0.275% of the portion
of daily net assets exceeding $1.5 billion. | |
| | The Portfolio's Distributor, Adviser and Administrator
have agreed to waive and/or reimburse all or a portion
of the Portfolio's distribution fee, advisory fee and
administration fee, respectively, to the extent that
total expenses exceed total income on a daily
basis. These fee waivers and/or expense
reimbursements will continue for at least one year
or until such time as the Fund's Board of Trustees
acts to discontinue all or a portion of such waivers
and/or reimbursements when it deems such
action is appropriate. | |
Limited Duration | | 0.30% of the daily net assets | |
Income Plus | | 0.42% of the portion of the daily net assets not
exceeding $500 million; 0.35% of the portion of
the daily net assets exceeding $500 million but not
exceeding $1.25 billion; and 0.22% of the portion
of the daily net assets exceeding $1.25 billion. | |
Global Infrastructure | | 0.57% of the portion of daily net assets not
exceeding $500 million; 0.47% of the portion of
daily net assets exceeding $500 million but not
exceeding $1 billion; 0.445% of the portion of
daily net assets exceeding $1 billion but not
exceeding $1.5 billion; 0.42% of the portion of
daily net assets exceeding $1.5 billion but not
exceeding $2.5 billion; 0.395% of the portion of
daily net assets exceeding $2.5 billion but not
exceeding $3.5 billion; 0.37% of the portion of
daily net assets exceeding $3.5 billion but not
exceeding $5 billion; and 0.345% of the portion of
daily net assets exceeding $5 billion. | |
European Equity | | 0.87% of the portion of daily net assets not
exceeding $500 million; 0.82% of the portion of
daily net assets exceeding $500 million but not
exceeding $2 billion; 0.77% of the portion of daily
net assets exceeding $2 billion but not exceeding
$3 billion; and 0.745% of the portion of daily net
assets exceeding $3 billion. | |
| | The Portfolio's Adviser and Administrator have
agreed to reduce its advisory fee, its administration
fee and/or reimburse the Portfolio so that Total
Annual Portfolio Operating Expenses, excluding
brokerage fees and 12b-1 fees, will not exceed
1.00%. The fee waivers and/or expense
reimbursements will continue for at least one year
or until such time as the Fund's Board of Trustees
acts to discontinue all or a portion of such waivers
and/or reimbursements when it deems such
action is appropriate. | |
46
Name of Portfolio | | Investment Advisory Fee Rates | |
Multi Cap Growth | | 0.42% of the portion of the daily net assets not
exceeding $1 billion; 0.395% of the portion of the
daily net assets exceeding $1 billion but not
exceeding $2 billion; and 0.37% of the portion of
the daily net assets exceeding $2 billion. | |
Aggressive Equity | | 0.67% of the portion of daily net assets not
exceeding $500 million; 0.645% of the portion of
daily net assets exceeding $500 million but not
exceeding $2 billion; 0.62% of the portion of daily
net assets exceeding $2 billion but not exceeding
$3 billion; and 0.595% of the portion of daily net
assets exceeding $3 billion. | |
Strategist | | 0.42% of the portion of the daily net assets not
exceeding $1.5 billion; and 0.395% of the portion
of the daily net assets exceeding $1.5 billion. | |
Administration services are provided to the Fund by Morgan Stanley Services Company Inc. ("Administrator"), a wholly-owned subsidiary of the Adviser, pursuant to a separate administration agreement ("Administration Agreement") entered into by the Fund with the Administrator. The Fund pays the Administrator monthly compensation of 0.08% of daily net assets (0.05% with respect to the Money Market Portfolio).
The following table reflects (i) the advisory fee paid; and (ii) the advisory fee waived and/or rebated from affiliated transactions for each of the past three fiscal years ended December 31, 2009, 2010 and 2011.
| | | Advisory Fees Paid
(After Fee Waivers and/or
Rebate from Affiliated
Transactions) | | Advisory Fees Waived | | Rebate from Affiliated
Transactions | |
Name of Portfolio | | 2009 | | 2010 | | 2011 | | 2009 | | 2010 | | 2011 | | 2009 | | 2010 | | 2011 | |
Money Market | | $ | 500,844 | | | $ | 169,394 | | | $ | 90,371 | | | $ | 385,514 | | | $ | 468,863 | | | $ | 434,703 | | | $ | 0 | | | $ | 0 | | | $ | 0 | | |
Limited Duration | | | 230,908 | | | | 218,203 | | | | 186,121 | | | | 0 | | | | 0 | | | | 0 | | | | 2,429 | | | | 2,541 | | | | 1,009 | | |
Income Plus | | | 1,049,962 | | | | 1,017,890 | | | | 891,861 | | | | 0 | | | | 0 | | | | 0 | | | | 4,828 | | | | 5,649 | | | | 1,719 | | |
Global Infrastructure | | | 457,820 | | | | 441,973 | | | | 425,321 | | | | 0 | | | | 0 | | | | 0 | | | | 888 | | | | 1,951 | | | | 1,419 | | |
European Equity | | | 540,334 | | | | 503,811 | | | | 456,178 | | | | 84,388 | | | | 115,288 | | | | 112,937 | | | | 1,185 | | | | 1,506 | | | | 1,140 | | |
Multi Cap Growth | | | 933,899 | | | | 1,082,731 | | | | 1,093,594 | | | | 0 | | | | 0 | | | | 0 | | | | 8,241 | | | | 7,364 | | | | 11,007 | | |
Aggressive Equity | | | 181,581 | | | | 205,105 | | | | 208,490 | | | | 0 | | | | 0 | | | | 0 | | | | 1,357 | | | | 1,141 | | | | 1,351 | | |
Strategist | | | 738,853 | | | | 760,586 | | | | 651,962 | | | | 0 | | | | 0 | | | | 0 | | | | 47,722 | | | | 31,502 | | | | 31,209 | | |
Pursuant to sub-advisory agreements (each, a "Sub-Advisory Agreement") between the Adviser and each of the Sub-Advisers with respect to the Global Infrastructure Portfolio and the European Equity Portfolio, the Sub-Advisers have been retained, subject to the overall supervision of the Adviser and the Trustees of the applicable Portfolios, to, together with the Adviser, continuously furnish investment advice concerning individual security selections, asset allocations and economic trends and management of the applicable Portfolios. The Adviser pays the Sub-Advisers on a monthly basis a portion of the net advisory fees the Adviser receives from the applicable Portfolios.
For the fiscal years ended December 31, 2009, 2010 and 2011, the Fund paid compensation under the Administration Agreement as follows:
| | | Compensation Paid for the Fiscal Year
Ended December 31, | |
Name of Portfolio | | 2009 | | 2010 | | 2011 | |
Money Market | | $ | 98,484 | | | $ | 70,918 | | | $ | 51,730 | (1) | |
Limited Duration | | | 62,223 | | | | 58,865 | | | | 49,901 | | |
Income Plus | | | 200,912 | | | | 194,960 | | | | 170,205 | | |
Global Infrastructure | | | 64,380 | | | | 62,305 | | | | 59,893 | | |
European Equity | | | 57,555 | | | | 57,067 | | | | 52,437 | | |
Multi Cap Growth | | | 179,455 | | | | 207,637 | | | | 210,400 | | |
Aggressive Equity | | | 21,843 | | | | 24,626 | | | | 25,056 | | |
Strategist | | | 149,824 | | | | 150,874 | | | | 130,128 | | |
(1) The administration fee paid reflects a waiver of $6,612.
47
Under a Sub-Administration Agreement between the Administrator and State Street Bank and Trust Company ("State Street"), State Street provides certain administrative services to the Fund. For such services, the Administrator pays State Street a portion of the fee the Administrator receives from the Fund.
B. Principal Underwriter
The Fund's principal underwriter is the Distributor (which has the same address as the Adviser). In this capacity, each Portfolio's shares are distributed by the Distributor. The Distributor has entered into a selected dealer agreement with Morgan Stanley Smith Barney and Morgan Stanley & Co., which through their own sales organizations sell shares of the Fund. In addition, the Distributor may enter into similar agreements with other selected broker-dealers. The Distributor, a Delaware corporation, is a wholly-owned subsidiary of Morgan Stanley.
The Fund and the Distributor have agreed to indemnify each other against certain liabilities, including liabilities under the Securities Act. Under the Distribution Agreement, the Distributor uses its best efforts in rendering services to the Fund, but in the absence of willful misfeasance, bad faith, gross negligence or reckless disregard of its obligations, the Distributor is not liable to the Fund or any of its shareholders for any error of judgment or mistake of law or for any act or omission or for any losses sustained by the Portfolios or their shareholders.
C. Services Provided by the Adviser, Sub-Advisers and Administrator
The Adviser manages the investment of each Portfolio's assets (other than the European Equity Portfolio and the Global Infrastructure Portfolio), including the placing of orders for the purchase and sale of portfolio securities. The Adviser obtains and evaluates the information and advice relating to the economy, securities markets and specific securities as it considers necessary or useful to continuously manage the assets of each Portfolio in a manner consistent with its investment objective.
Under the terms of the Administration Agreement, the Administrator maintains certain of the Fund's books and records and furnishes, at its own expense, the office space, facilities, equipment, clerical help and bookkeeping as the Fund may reasonably require in the conduct of its business. The Administrator also assists in the preparation of prospectuses, proxy statements and reports required to be filed with federal and state securities commissions (except insofar as the participation or assistance of the independent registered public accounting firm and attorneys is, in the opinion of the Administrator, necessary or desirable). The Administrator also bears the cost of telephone service, heat, light, power and other utilities provided to the Fund.
With respect to the European Equity Portfolio and the Global Infrastructure Portfolio, the Sub-Advisers have been retained, subject to the overall supervision of the Adviser, to continuously furnish investment advice concerning individual security selections, asset allocations, overall economic trends and to manage the Portfolios' portfolios.
Expenses not expressly assumed by the Adviser under the Investment Advisory Agreement or by the Administrator under the Administration Agreement or by the Sub-Advisers for the European Equity Portfolio and the Global Infrastructure Portfolio under the Sub-Advisory Agreements or by the Distributor, will be paid by the Portfolios. Each Portfolio pays all expenses incurred in its operation and a portion of the Fund's general administration expenses allocated based on the asset sizes of the Portfolios. The Portfolios' direct expenses include, but are not limited to: expenses of the Plan of Distribution pursuant to Rule 12b-1; charges and expenses of any registrar, custodian, transfer and dividend disbursing agent; brokerage commissions; certain taxes; registration costs of the Fund under federal and state securities laws; shareholder servicing costs, charges and expenses of any outside service used for pricing of the Portfolios' shares; fees and expenses of legal counsel, including counsel to the Trustees who are not interested persons of the Fund or of the Adviser (or the Sub-Advisers) (not including compensation or expenses of attorneys who are employees of the Adviser (or the Sub-Advisers)); fees and expenses of the Fund's independent registered public accounting firm; interest on Portfolio borrowings; and all other expenses attributable to a particular Portfolio. The 12b-1 fees relating to Class Y will be allocated directly to Class Y. In addition, other expenses associated with a particular Class (except advisory or custodial fees) may be allocated directly to that Class, provided that such expenses are reasonably identified as specifically attributable to that Class and the direct allocation to that Class is approved by the Trustees.
48
Expenses which are allocated on the basis of size of the respective Portfolios include the costs and expenses of printing, including typesetting, and distributing prospectuses and statements of additional information of the Fund and supplements thereto to the Fund's shareholders; all expenses of shareholders' and Trustees' meetings and of preparing, printing and mailing proxy statements and reports to shareholders; fees and travel expenses of Trustees or members of any advisory board or committee who are not employees of the Adviser (or the Sub-Advisers) or any corporate affiliate of the Adviser (or the Sub-Advisers); state franchise taxes; SEC fees; membership dues of industry associations; postage; insurance premiums on property or personnel (including officers and Trustees) of the Fund which inure to its benefit; and all other costs of the Fund's operations properly payable by the Fund and allocable on the basis of size to the respective Portfolios. Depending on the nature of a legal claim, liability or lawsuit, litigation costs, payment of legal claims or liabilities and any indemnification relating thereto may be directly applicable to the Portfolio or allocated on the basis of the size of the respective Portfolios. The Trustees have determined that this is an appropriate method of allocation of expenses.
Each of the Investment Advisory Agreement and the Sub-Advisory Agreements provides that in the absence of willful misfeasance, bad faith, gross negligence or reckless disregard of their obligations thereunder, the Adviser and the Sub-Advisers, respectively, are not liable to the Fund or any of its investors (and, in the case of the Sub-Advisory Agreements, to the Adviser) for any act or omission by the Adviser or for any losses sustained by the Fund or its investors.
Each of the Investment Advisory Agreement and the Sub-Advisory Agreements will remain in effect from year to year provided continuance of the applicable Agreement is approved at least annually by the vote of the holders of a majority, as defined in the Investment Company Act, of the outstanding shares of each affected Portfolio, or by the Trustees; provided that in either event such continuance is approved annually by the vote of a majority of the Independent Trustees.
The Administration Agreement provides that in the absence of willful misfeasance, bad faith, gross negligence or reckless disregard of its obligations thereunder, the Administrator is not liable to the Fund or any of its investors for any act or omission by the Administrator or for any losses sustained by the Fund or its investors. The Administration Agreement will continue unless terminated by either party by written notice delivered to the other party within 30 days.
D. Rule 12b-1 Plan
The Fund has adopted a Plan of Distribution, effective July 31, 2011, pursuant to Rule 12b-1 under the Investment Company Act (the "Plan"). Under the Plan, Class Y shares of each Portfolio bear a distribution fee paid to the Distributor which is accrued daily and payable monthly at the annual rate of 0.25% of the average daily net assets of the Class.
Prior to July 31, 2011, in accordance with Rule 12b-1 under the Investment Company Act, the Fund had adopted a Plan of Distribution with respect to the Class Y shares between the Fund and Morgan Stanley Distributors Inc. (the "Prior Distributor"), pursuant to which the Prior Distributor provided certain services in connection with the promotion and sale of the Fund's Class Y shares (the "Prior Plan").
The Plan provides that each Portfolio's distribution fee shall compensate the Distributor, Morgan Stanley Smith Barney and its affiliates, and other selected broker-dealers for expenses they incur in connection with the distribution of the Portfolio's Class Y shares. These expenses may include: (i) cost incurred in providing personal services to shareholders; (ii) overhead and other branch office distribution-related expenses including, but not limited to, expenses of operating the Distributor's or other broker-dealers' offices used for selling Portfolio shares (e.g., lease and utility costs, salaries and employee benefits of operations and sales support personnel, costs related to client sales seminars and telephone expenses); (iii) printing and mailing costs relating to prospectuses and reports (for new shareholders); and (iv) costs incurred in connection with advertising materials and sales literature. In addition, payments to the Distributor may be used by the Distributor to compensate insurance companies for shareholder services, which include, but are not limited to, education of agents concerning the Portfolios, compensation of agents and servicing contract owners.
Under the Plan and as required by Rule 12b-1, the Distributor provides the Fund, for review by the Trustees, and the Trustees review promptly after the end of each calendar quarter, a written report regarding the distribution expenses incurred under the Plan on behalf of each Portfolio during such calendar quarter, which report includes (1) an itemization of the types of expenses and the purposes therefor; (2) the amounts of such expenses; and (3) a description of the benefits derived by the Fund.
49
For the fiscal year ended December 31, 2011, Class Y shares of the following Portfolios made payments under the Plan and the Prior Plan as follows:
Name of Portfolio: | | Compensation paid for
the fiscal year ended
December 31, 2011 | |
Money Market | | $ | 0 | (1) | |
Limited Duration | | | 121,663 | | |
Income Plus | | | 284,274 | | |
Global Infrastructure | | | 37,356 | | |
European Equity | | | 39,636 | | |
Multi Cap Growth | | | 148,411 | | |
Aggressive Equity | | | 42,962 | | |
Strategist | | | 120,780 | | |
(1) The distribution fee of $154,136 was fully waived.
On an annual basis, the Trustees, including a majority of the Independent Trustees, consider whether the Plan should be continued. Prior to approving the last continuation of the Plan, the Trustees requested and received from the Distributor and reviewed all the information which they deemed necessary to arrive at an informed determination. In making their determination to continue the Plan, the Trustees considered: (1) the Portfolios' experience under the Plan and whether such experience indicates that the Plan is operating as anticipated; (2) the benefits each Portfolio had obtained, was obtaining and would be likely to obtain under the Plan, including that (a) the Plan is essential in order to give Portfolio investors a choice of alternatives for payment of distribution and service charges and to enable each Portfolio to continue to grow and avoid a pattern of net redemptions which, in turn, are essential for effective investment management; and (b) without the compensation to individual brokers and the reimbursement of distribution and account maintenance expenses of Morgan Stanley Smith Barney branch offices made possible by the 12b-1 fees, Morgan Stanley Smith Barney could not establish and maintain an effective system for distribution, servicing of Contract Owners and maintenance of their accounts; and (3) what services had been and were continuing to be provided under the Plan to each Portfolio and its respective Contract Owners. Based upon their review, the Trustees, including each of the Independent Trustees, determined that continuation of the Plan would be in the best interests of each Portfolio and would have a reasonable likelihood of continuing to benefit each Portfolio and its respective Contract Owners.
The Plan may not be amended to increase materially the amount to be spent for the services described therein without approval by the Class Y shareholders of each affected Portfolio, and all material amendments to the Plan must also be approved by the Trustees. The Plan may be terminated as to a Portfolio at any time, without payment of any penalty, by vote of a majority of the Independent Trustees or by a vote of a majority of the outstanding voting securities of the Portfolio (as defined in the Investment Company Act) on not more than 30 days' written notice to any other party to the Plan. So long as the Plan is in effect, the election and nomination of Independent Trustees shall be committed to the discretion of the Independent Trustees.
No interested person of the Fund nor any Independent Trustee has any direct financial interest in the operation of the Plan, except to the extent that the Distributor, the Adviser, the Sub-Advisers, Morgan Stanley, Morgan Stanley Smith Barney, Morgan Stanley Services or certain of their employees may be deemed to have such an interest as a result of benefits derived from the successful operation of the Plan or as a result of receiving a portion of the amounts expended thereunder by the Portfolios.
E. Other Service Providers
(1) Transfer Agent/Dividend Disbursing Agent
Morgan Stanley Services Company Inc., P.O. Box 219886, Kansas City, MO 64121-9886, is the Transfer Agent for each Portfolio's shares and the Dividend Disbursing Agent for payment of dividends and distributions on Portfolio shares.
(2) Custodian and Independent Registered Public Accounting Firm
State Street Bank and Trust Company, One Lincoln Street, Boston, MA 02111, is the Custodian of each Portfolio's assets. Any Portfolio's cash balances with the Custodian in excess of $250,000 (a temporary
50
increase from $100,000, which is due to expire on December 31, 2013), are unprotected by federal deposit insurance. These balances may, at times, be substantial.
As of June 7, 2011, Ernst & Young LLP, located at 200 Clarendon Street, Boston, MA 02116-5072, is the independent registered public accounting firm of the Fund. Prior to June 7, 2011, Deloitte & Touche LLP, located at Two World Financial Center, New York, NY 10281, was the independent registered public accounting firm of the Fund. The Fund's independent registered public accounting firm is responsible for auditing the annual financial statements.
(3) Affiliated Persons
The Transfer Agent is an affiliate of the Adviser, the Sub-Advisers and the Distributor. As Transfer Agent and Dividend Disbursing Agent, the Transfer Agent's responsibilities include maintaining shareholder accounts, reinvesting dividends, processing account registration changes, handling purchase and redemption transactions, tabulating proxies and maintaining shareholder records and lists. For these services, the Transfer Agent receives a per shareholder account fee from each Portfolio and is reimbursed for its out-of-pocket expenses in connection with such services.
F. Fund Management
Other Accounts Managed by Portfolio Managers at December 31, 2011 (unless otherwise indicated):
| | | Registered
Investment Companies | | Other Pooled
Investment Vehicles | | Other Accounts | |
Portfolio and
Portfolio Managers | | Number of
Accounts | | Total Assets
in the Accounts | | Number of
Accounts | | Total Assets
in the Accounts | | Number of
Accounts | | Total Assets
in the Accounts | |
Aggressive Equity and
Multi Cap Growth | |
Sam G. Chainani | | | 35 | | | $17.3 billion | | | 4 | | | | $3.8 billion | | | | 13 | | | $1.2 billion | |
David S. Cohen | | | 35 | | | 17.3 billion | | | 4 | | | | 3.8 billion | | | | 13 | | | 1.2 billion | |
Dennis P. Lynch | | | 35 | | | 17.3 billion | | | 4 | | | | 3.8 billion | | | | 13 | | | 1.2 billion | |
Armistead B. Nash | | | 35 | | | 17.3 billion | | | 4 | | | | 3.8 billion | | | | 13 | | | 1.2 billion | |
Alexander T. Norton | | | 35 | | | 17.3 billion | | | 4 | | | | 3.8 billion | | | | 13 | | | 1.2 billion | |
Jason C. Yeung | | | 35 | | | 17.3 billion | | | 4 | | | | 3.8 billion | | | | 13 | | | 1.2 billion | |
European Equity | |
Riccardo Bindi | | | 2 | | | $229.1 million | | | 3 | | | | $635.0 million | | | | 2 | | | $103.6 million | |
Jonathan Day | | | 2 | | | 229.1 million | | | 3 | | | | 635.0 million | | | | 2 | | | 103.6 million | |
Matthew Leeman | | | 2 | | | 229.1 million | | | 3 | | | | 635.0 million | | | | 2 | | | 103.6 million | |
Jaymeen Patel | | | 2 | | | 229.1 million | | | 3 | | | | 635.0 million | | | | 2 | | | 103.6 million | |
Global Infrastructure | |
Theodore R. Bigman | | | 14 | | | $5.1 billion | | | 12 | | | | $6.8 billion | | | | 65 | (1) | | $6.4 billion(1) | |
Matthew King | | | 4 | | | 466.6 million | | | 1 | | | | 105.0 million | | | | 0 | | | | 0 | | |
Income Plus | |
Joseph Mehlman | | | 6 | | | $661.9 million | | | 0 | | | $ | 0 | | | | 53 | | | $13.0 billion | |
Christian G. Roth | | | 7 | | | 749.8 million | | | 13 | | | | 6.2 billion | | | | 37 | (2) | | 14.8 billion(2) | |
Karen Toll | | | 5 | | | 638.2 million | | | 0 | | | | 0 | | | | 44 | | | 8.5 billion | |
Limited Duration | |
Joseph Mehlman | | | 6 | | | $661.9 million | | | 0 | | | | 0 | | | | 53 | | | $13.0 billion | |
Jaidip Singh | | | 8 | | | 1.8 billion | | | 0 | | | | 0 | | | | 19 | (3) | | 6.5 billion(3) | |
Neil Stone | | | 7 | | | 785.8 million | | | 0 | | | | 0 | | | | 61 | (3) | | 12.5 billion(3) | |
Strategist | |
Mark A. Bavoso | | | 5 | | | $778.0 million | | | 2 | | | | $602.7 million | | | | 9 | (4) | | | $4.1 billion(4) | | |
Jaidip Singh | | | 8 | | | 1.8 billion | | | 0 | | | | 0 | | | | 19 | (3) | | 6.5 billion(3) | |
Neil Stone | | | 7 | | | 785.8 million | | | 0 | | | | 0 | | | | 61 | (3) | | 12.5 billion(3) | |
(1) Of these other accounts, 15 accounts with total assets of approximately $766.1 million had performance-based fees.
(2) Of these other accounts, four accounts with total assets of approximately $2.0 billion had performance-based fees.
(3) Of these other accounts, one account with total assets of approximately $734.2 million had performance-based fees.
(4) Of these other accounts, three accounts with total assets of approximately $1.6 billion had performance-based fees.
Because the portfolio managers may manage assets for other investment companies, pooled investment vehicles, and/or other accounts (including institutional clients, pension plans and certain high net worth individuals), there may be an incentive to favor one client over another resulting in conflicts of interest. For instance, the Adviser and/or Sub-Advisers may receive fees from certain accounts that are higher than the fee it receives from the Portfolios, or it may receive a performance-based fee on certain accounts. In those instances, the portfolio managers may have an incentive to favor the higher and/or performance-based fee accounts over the Portfolios. In addition, a conflict of interest could exist to the extent the Adviser and/or Sub-Advisers have proprietary investments in certain accounts, where portfolio
51
managers have personal investments in certain accounts or when certain accounts are investment options in the Adviser's and/or Sub-Advisers' employee benefits and/or deferred compensation plans. The portfolio manager may have an incentive to favor these accounts over others. If the Adviser and/or Sub-Advisers manage accounts that engage in short sales of securities of the type in which the Portfolios invest, the Adviser and/or Sub-Advisers could be seen as harming the performance of the Portfolios for the benefit of the accounts engaging in short sales if the short sales cause the market value of the securities to fall. The Adviser and/or Sub-Advisers have adopted trade allocation and other policies and procedures that it believes are reasonably designed to address these and other conflicts of interest.
Portfolio Manager Compensation Structure
Portfolio managers receive a combination of base compensation and discretionary compensation, comprising a cash bonus and several deferred compensation programs described below. The methodology used to determine portfolio manager compensation is applied across all funds/accounts managed by the portfolio managers.
Base salary compensation. Generally, portfolio managers receive base salary compensation based on the level of their position with the Adviser and/or Sub-Advisers.
Discretionary compensation. In addition to base compensation, portfolio managers may receive discretionary compensation.
Discretionary compensation can include:
• Cash Bonus.
• Morgan Stanley's Long Term Incentive Compensation awards—a mandatory program that defers a portion of discretionary year-end compensation into restricted stock units or other awards based on Morgan Stanley common stock or other plans that are subject to vesting and other conditions. All long-term incentive compensation awards are subject to clawback provisions where awards can be cancelled if an employee takes any action, or omits to take any action, which causes a restatement of Morgan Stanley's consolidated financial results, or constitutes a violation of Morgan Stanley's risk policies and standards.
• Investment Management Alignment Plan (IMAP) awards—a mandatory program that defers a portion of discretionary year-end compensation and notionally invests it in designated funds advised by the Adviser and/or Sub-Advisers or their affiliates. The award is subject to vesting and other conditions. Portfolio managers must notionally invest a minimum of 25% to a maximum of 100% of their IMAP deferral account into a combination of the designated funds they manage that are included in the IMAP fund menu, which may or may not include the Portfolios. In addition to the clawbacks listed above for long-term incentive compensation awards, the provision on IMAP awards is further strengthened such that it may also be triggered if an employee's actions cause substantial financial loss on a trading strategy, investment, commitment or other holding provided that previous gains on those positions were relevant to the employees' prior year compensation decisions.
• Voluntary Deferred Compensation Plans—voluntary programs that permit certain employees to elect to defer a portion of their discretionary year-end compensation and notionally invest the deferred amount across a range of designated investment funds, which may include funds advised by the Adviser and/or Sub-Advisers or their affiliates.
Several factors determine discretionary compensation, which can vary by portfolio management team and circumstances. In order of relative importance, these factors may include:
• Revenues generated by the investment companies, pooled investment vehicles and other accounts managed by the portfolio manager.
• The investment performance of the funds/accounts managed by the portfolio manager.
• Contribution to the business objectives of the Adviser and/or Sub-Advisers.
• The dollar amount of assets managed by the portfolio manager.
• Market compensation survey research by independent third parties.
• Other qualitative factors, such as contributions to client objectives.
52
• Performance of Morgan Stanley and Morgan Stanley Investment Management, and the overall performance of the investment team(s) of which the portfolio manager is a member.
Securities Ownership of Portfolio Managers
As of December 31, 2011 (unless otherwise noted), the dollar range of securities beneficially owned by each portfolio manager in the Portfolio is shown below:
Aggressive Equity
Sam G. Chainani | | | none* | | |
David S. Cohen | | | none* | | |
Dennis P. Lynch | | | none* | | |
Armistead B. Nash | | | none* | | |
Alexander T. Norton | | | none* | | |
Jason C. Yeung | | | none* | | |
Multi Cap Growth
Sam G. Chainani | | | none* | | |
David S. Cohen | | | none* | | |
Dennis P. Lynch | | | none* | | |
Armistead B. Nash | | | none* | | |
Alexander T. Norton | | | none* | | |
Jason C. Yeung | | | none* | | |
European Equity
Riccardo Bindi | | | none* | | |
Jonathan Day | | | none* | | |
Matthew Leeman | | | none* | | |
Jaymeen Patel | | | none* | | |
Global Infrastructure
Theodore R. Bigman | | | none* | | |
Matthew King | | | none* | | |
Income Plus
Joseph Mehlman | | | none | | |
Christian G. Roth | | | none | | |
Karen Toll | | | none | | |
Limited Duration
Joseph Mehlman | | | none* | | |
Jaidip Singh | | | none* | | |
Neil Stone | | | none | | |
Strategist
Mark A. Bavoso | | | none* | | |
Jaidip Singh | | | none | | |
Neil Stone | | | none | | |
* Not included in the table above, the portfolio manager has made investments in one or more other mutual funds managed by the same portfolio management team pursuant to a similar strategy.
G. Codes of Ethics
The Fund, the Adviser, the Sub-Advisers and the Distributor have each adopted a Code of Ethics pursuant to Rule 17j-1 under the Investment Company Act. The Codes of Ethics are designed to detect and prevent improper personal trading. The Codes of Ethics permit personnel subject to the Codes to invest in securities, including securities that may be purchased, sold or held by the Fund, subject to a number of restrictions and controls, including prohibitions against purchases of securities in an initial public offering and a preclearance requirement with respect to personal securities transactions.
H. Proxy Voting Policy and Proxy Voting Record
The Board of Trustees believes that the voting of proxies on securities held by the Fund is an important element of the overall investment process. As such, the Trustees have delegated the responsibility to vote such proxies to MSIM.
53
A copy of MSIM's Proxy Voting Policy ("Proxy Policy") is attached hereto as Appendix A. In addition, a copy of the Proxy Policy, as well as the Fund's most recent proxy voting record for the 12-month period ended June 30, as filed with the SEC, are available without charge on our web site at www.morganstanley.com/im. The Fund's proxy voting record is also available without charge on the SEC's web site at www.sec.gov.
I. Revenue Sharing
The Adviser and/or Distributor may pay compensation, out of their own funds and not as an expense of the Portfolios, to insurance companies or their affiliates, broker-dealers and/or other financial intermediaries ("Intermediaries"), in connection with the sale, distribution, marketing and retention of Portfolio shares and/or shareholder servicing of shares of the Portfolios. For example, the Adviser or the Distributor may pay additional compensation to Intermediaries for, among other things, promoting the sale and distribution of Portfolio shares, furnishing marketing support, maintaining share balances, and/or for sub-accounting, administrative, shareholder or transaction processing services. Such payments are in addition to any distribution fees or shareholder service fees that may be payable by the Distributor. The additional payments may be based on various factors, including net sales or some specified minimum sales or some other similar criteria related to sales of a Portfolio, amount of assets invested by the Intermediary's customers, a Portfolio's advisory fees, some other agreed upon amount, or other measures as determined from time to time by the Adviser and/or Distributor. The amount of these payments may be different for different Intermediaries.
Currently, these payments, which are made in accordance with the applicable compensation structure for each Intermediary, include an ongoing annual fee in an amount up to 0.10% of the average daily NAV of shares of each Portfolio held in the applicable accounts.
The prospect of receiving, or the receipt of, additional compensation, as described above, by Intermediaries may provide Intermediaries and/or their financial advisers or other salespersons with an incentive to favor sales of shares of the Portfolios over other investment options with respect to which the Intermediary does not receive additional compensation (or receives lower levels of additional compensation). These payment arrangements, however, will not change the price that an investor pays for shares of a Portfolio or the amount that a Portfolio receives to invest on behalf of an investor. Investors may wish to take such payment arrangements into account when considering and evaluating any recommendations relating to Portfolio shares and should review carefully any disclosure provided by an Intermediary as to its compensation.
VI. BROKERAGE ALLOCATION AND OTHER PRACTICES
A. Brokerage Transactions
Subject to the general supervision of the Trustees, the Adviser and for the European Equity Portfolio and Global Infrastructure Portfolio, the Sub-Advisers, are responsible for decisions to buy and sell securities for each Portfolio, the selection of brokers and dealers to effect the transactions and the negotiation of brokerage commissions, if any. Purchases and sales of securities on a stock exchange are effected through brokers who charge a commission for their services. In the OTC market, securities are generally traded on a "net" basis with dealers acting as principal for their own accounts without a stated commission, although the price of the security usually includes a profit to the dealer. The Fund also expects that securities will be purchased at times in underwritten offerings where the price includes a fixed amount of compensation, generally referred to as the underwriter's concession or discount. Options and futures transactions will usually be effected through a broker and a commission will be charged. Certain securities (e.g., certain money market instruments) are purchased directly from an issuer, in which case no commissions or discounts are paid.
54
During the fiscal years ended December 31, 2009, 2010 and 2011, the following Portfolios paid brokerage commissions as follows:
Name of Portfolio: | | Brokerage
commissions paid
for fiscal year
ended 12/31/09 | | Brokerage
commissions paid
for fiscal year
ended 12/31/10 | | Brokerage
commissions paid
for fiscal year
ended 12/31/11 | |
Money Market | | $ | 0 | | | $ | 0 | | | $ | 0 | | |
Limited Duration | | | 8,736 | | | | 5,930 | | | | 2,419 | | |
Income Plus | | | 26,381 | | | | 23,024 | | | | 17,923 | | |
Global Infrastructure | | | 331,801 | | | | 213,759 | | | | 71,838 | | |
European Equity | | | 46,907 | | | | 49,936 | | | | 23,083 | | |
Multi Cap Growth | | | 123,066 | | | | 130,896 | | | | 124,298 | | |
Aggressive Equity | | | 13,421 | | | | 15,422 | | | | 14,985 | | |
Strategist | | | 277,684 | | | | 292,411 | | | | 407,300 | | |
B. Commissions
Pursuant to an order issued by the SEC, the Fund is permitted to engage in principal transactions involving money market instruments, subject to certain conditions, with Morgan Stanley & Co., a broker-dealer affiliated with the Fund's Adviser.
During the fiscal years ended December 31, 2009 and December 31, 2010, the Money Market Portfolio effected principal transactions with Morgan Stanley & Co. During the fiscal year ended December 31, 2011, the Fund did not effect any principal transactions with Morgan Stanley & Co.
Brokerage transactions in securities listed on exchanges or admitted to unlisted trading privileges may be effected through Morgan Stanley & Co., Citigroup, Inc. and other affiliated brokers and dealers. In order for an affiliated broker or dealer to effect any portfolio transactions on an exchange for the Portfolios, the commissions, fees or other remuneration received by the affiliated broker or dealer must be reasonable and fair compared to the commissions, fees or other remuneration paid to other brokers in connection with comparable transactions involving similar securities being purchased or sold on an exchange during a comparable period of time. This standard would allow the affiliated broker or dealer to receive no more than the remuneration which would be expected to be received by an unaffiliated broker in a commensurate arm's-length transaction. Furthermore, the Trustees, including the Independent Trustees, have adopted procedures which are reasonably designed to provide that any commissions, fees or other remuneration paid to an affiliated broker or dealer are consistent with the foregoing standard. The Fund does not reduce the management fee it pays to the Adviser by any amount of the brokerage commissions it may pay to an affiliated broker or dealer.
During the fiscal years ended December 31, 2009 and 2010, the following Portfolios paid brokerage commissions to Morgan Stanley & Co. and/or its affiliated broker-dealers as follows:
| | | Brokerage commissions
paid to Morgan Stanley & Co.
and/or its affiliated
broker-dealers for fiscal
year ended | |
Name of Portfolio: | | 12/31/09 | | 12/31/10 | |
Money Market | | $ | 0 | | | $ | 0 | | |
Limited Duration | | | 0 | | | | 0 | | |
Income Plus | | | 0 | | | | 0 | | |
Global Infrastructure | | | 8,733 | | | | 344 | | |
European Equity | | | 0 | | | | 433 | | |
Multi Cap Growth | | | 16,169 | | | | 2,876 | | |
Aggressive Equity | | | 1,587 | | | | 339 | | |
Strategist | | | 43,321 | | | | 34,827 | | |
55
During the fiscal year ended December 31, 2011, the following Portfolios paid brokerage commissions to Morgan Stanley & Co. and/or its affiliated broker-dealers as follows:
Name of Portfolio: | |
Brokerage commissions
paid to Morgan
Stanley & Co.
and/or its affiliated
broker-dealers for fiscal
year ended 12/31/11 | |
Percentage of
aggregate brokerage
commissions for
fiscal year ended
12/31/11 | | Percentage of
aggregate dollar
amount of executed
trades on which
brokerage
commissions were
paid for fiscal year
ended 12/31/11 | |
Money Market | | $ | 0 | | | | 0 | % | | | 0 | % | |
Limited Duration | | | 0 | | | | 0 | % | | | 0 | % | |
Income Plus | | | 0 | | | | 0 | % | | | 0 | % | |
Global Infrastructure | | | 246 | | | | 0.34 | % | | | 0.23 | % | |
European Equity | | | 0 | | | | 0 | % | | | 0 | % | |
Multi Cap Growth | | | 5,619 | | | | 4.52 | % | | | 3.53 | % | |
Aggressive Equity | | | 579 | | | | 3.86 | % | | | 3.06 | % | |
Strategist | | | 245,802 | | | | 60.35 | % | | | 50.23 | % | |
During the period June 1, 2009 to December 31, 2009 and the fiscal year ended December 31, 2010, the following Portfolios paid brokerage commissions to Citigroup, Inc. and/or its affiliated broker-dealers as follows:
| | | Brokerage commissions
paid to Citigroup, Inc.
and/or its affiliated broker-dealers | |
Name of Portfolio: | | for the period
06/01/09 to 12/31/09 | | for the year ended
12/31/10 | |
Money Market | | $ | 0 | | | $ | 0 | | |
Limited Duration | | | 0 | | | | 0 | | |
Income Plus | | | 0 | | | | 0 | | |
Global Infrastructure | | | 58 | | | | 65 | | |
European Equity | | | 372 | | | | 846 | | |
Multi Cap Growth | | | 0 | | | | 1,098 | | |
Aggressive Equity | | | 0 | | | | 132 | | |
Strategist | | | 5,140 | | | | 717 | | |
During the fiscal year ended December 31, 2011, the following Portfolios paid brokerage commissions to Citigroup, Inc. and/or its affiliated broker-dealers as follows:
Name of Portfolio: | |
Brokerage commissions
paid to Citigroup, Inc.
and/or its affiliated
broker-dealers
for the year ended
12/31/11 | |
Percentage of
aggregate brokerage
commissions for
the year ended
12/31/11 | | Percentage of
aggregate dollar
amount of executed
trades on which
brokerage
commissions were
paid for the year
ended 12/31/11 | |
Money Market | | $ | 0 | | | | 0 | % | | | 0 | % | |
Limited Duration | | | 0 | | | | 0 | % | | | 0 | % | |
Income Plus | | | 0 | | | | 0 | % | | | 0 | % | |
Global Infrastructure | | | 9,358 | | | | 13.03 | % | | | 7.49 | % | |
European Equity | | | 721 | | | | 3.12 | % | | | 5.40 | % | |
Multi Cap Growth | | | 365 | | | | 0.29 | % | | | 0.14 | % | |
Aggressive Equity | | | 14 | | | | 0.09 | % | | | 0.04 | % | |
Strategist | | | 0 | | | | 0 | % | | | 0 | % | |
C. Brokerage Selection
The policy of the Fund regarding purchases and sales of securities for the Portfolios is that primary consideration will be given to obtaining the most favorable prices and efficient executions of transactions. The Adviser (and, if applicable, the Sub-Advisers) are prohibited from directing brokerage transactions on the basis of the referral of clients or the sale of shares of investment companies for which it acts as investment adviser (and, if applicable, Sub-Advisers). Consistent with this policy, when securities transactions are effected on a stock exchange, the Fund's policy is to pay commissions which are considered fair and reasonable without necessarily determining that the lowest possible commissions are paid in all circumstances. The Fund believes that a requirement always to seek the lowest possible commission cost could impede effective portfolio management and preclude the Fund and the Investment (or, if applicable, the
56
Sub-Advisers) from obtaining a high quality of brokerage and research services. The Fund anticipates that certain of its transactions involving foreign securities will be effected on foreign securities exchanges. Fixed commissions on such transactions are generally higher than negotiated commissions on domestic transactions. There is also generally less government supervision and regulation of foreign securities exchanges and brokers than in the United States.
In seeking to implement each Portfolio's policies, the Adviser and/or Sub-Advisers effect transactions with those broker-dealers that the Adviser and/or Sub-Advisers believe provide prompt execution of orders in an effective manner at the most favorable prices. The Adviser and/or Sub-Advisers may place portfolio transactions with those broker-dealers that also furnish research and other services to the Fund or the Adviser and/or Sub-Advisers. Services provided may include certain research services (as described below) as well as effecting securities transactions and performing functions incidental thereto (such as clearance, settlement and custody).
The Adviser and its affiliated investment advisers have established commission sharing arrangements under a commission management program (the "Commission Management Program" or "CMP"), pursuant to which execution and research costs or a portion of those costs are decoupled in accordance with applicable laws, rules and regulations. Under the CMP, the Adviser and its affiliated investment advisers select approved equity brokers (which include the Adviser's affiliates) for execution services, and after accumulation of commissions at such brokers, the Adviser and/or its affiliates instruct these approved equity brokers to pay for eligible research provided by executing brokers or third-party research providers, which are selected independently by a Research Services Committee of the Adviser and its affiliated investment advisers. Generally, the Adviser and its affiliated investment advisers will direct the approved equity broker to record research credits based upon a previously agreed-upon allocation and will periodically instruct the approved equity broker to direct specified dollar amounts from that pool to pay for eligible research services provided by third-party research providers and executing brokers. The research credits are pooled among the Adviser and its affiliated investment advisers and allocated on behalf of both the Adviser and its affiliated investment advisers. Likewise, the research services obtained under the CMP are shared among the Adviser and its affiliated investment advisers.
Selection of approved equity brokers for execution is based on three main criteria: access to liquidity, provision of capital and quality of execution. Under the CMP, each approved equity broker is responsible for the payment of fees for research services and obtains the research services pursuant to written agreements between the approved equity broker and the third-party research provider.
For those costs not decoupled, but retained by broker-dealers, the Adviser also effects transactions with brokers which directly pay for research services provided by those brokers in accordance with Section 28(e) of the Exchange Act. Such transactions include equity transactions and may include fixed-income transactions effected on an agency basis.
Transactions involving client accounts managed by two or more affiliated investment advisers may be aggregated and executed using the services of broker-dealers that provide third party benefits/research so long as: (i) all client accounts involved in the transaction benefit from one or more of the services offered by such broker-dealer; and (ii) each affiliated investment adviser has approved the use of such broker-dealer and the services provided thereby.
The research services received include those of the nature described above and other services which aid the Adviser in fulfilling its investment decision making responsibilities, including (a) furnishing advice as to the value of securities, the advisability of investing in, purchasing or selling securities, and the availability of securities or purchasers or sellers of securities; and (b) furnishing analyses and reports concerning issuers, industries, securities, economic factors and trends, portfolio strategy and the performance of accounts. Where a particular item has both research and non-research related uses (such as proxy services where both research services and services relating to the administration of the proxy itself are provided), the Adviser will make a reasonable allocation of the cost of the item between research and non-research uses and will only pay for the portion of the cost allocated to research uses with client brokerage transactions. Research services furnished or paid for by brokers through whom the Adviser effects transactions for a particular account may be used by the Adviser or its affiliated investment advisers in servicing their other accounts, and not all such services may be used for the benefit of the client which pays the brokerage commission that results in the receipt of
57
such research services. Commissions paid to brokers providing research services may be higher than those charged by brokers not providing such services.
The Adviser and its affiliated investment advisers make a good faith determination of the value of research services in accordance with Section 28(e) of the Exchange Act, UK Financial Services Authority Rules and other relevant regulatory requirements.
Certain investment professionals and other employees of the Adviser are also officers of affiliated investment advisers and may provide investment advisory services to clients of such affiliated investment advisers. The Adviser's personnel also provide research and trading support to personnel of certain affiliated investment advisers. Research related costs may be shared by affiliated investment advisers and may benefit the clients of such affiliated investment advisers. Research services that benefit the Adviser may be received in connection with commissions generated by clients of its affiliated investment advisers. Similarly, research services received in connection with commissions generated by the Adviser's clients may benefit affiliated investment advisers and their clients. Moreover, research services provided by broker-dealers through which the Adviser effects transactions for a particular account may be used by the Adviser and/or an affiliated investment adviser in servicing its other accounts and not all such research services may be used for the benefit of the particular client, which pays the brokerage commission giving rise to the receipt of such research services.
The Adviser, the Sub-Advisers and certain of their affiliates currently serve as investment advisers to a number of clients, including other investment companies, and may in the future act as investment advisers to others. It is the practice of the Adviser, the Sub-Advisers (if applicable) and their affiliates to cause purchase and sale transactions (including transactions in certain initial and secondary public offerings) to be allocated among the Portfolios and clients whose assets they manage in such manner as they deem equitable. In making such allocations among the Portfolios and other client accounts, various factors may be considered, including the respective investment objectives, the relative size of portfolio holdings of the same or comparable securities, the availability of cash for investment, the size of investment commitments generally held and the opinions of the persons responsible for managing the Portfolios and other client accounts. The Adviser, the Sub-Advisers and their affiliates may operate one or more order placement facilities, and each facility will implement order allocation in accordance with the procedures described above. From time to time, each facility may transact in a security at the same time as other facilities are trading in that security.
D. Regular Broker-Dealers
During the fiscal year ended December 31, 2011, the Portfolios purchased securities issued by the following issuers, which issuers were among the ten brokers or ten dealers that executed transactions for or with the Fund or the Portfolio in the largest dollar amounts during the period:
Name of Portfolio: | | Issuer | |
Money Market | | Bank of Nova Scotia
Barclays Capital Group
BNP Paribas SA
Credit Agricole Securities
Credit Suisse Group AG
ING Financial Markets LLC
JP Morgan Securities LLC
Merrill Lynch & Co.
TD Securities Inc. | |
Limited Duration | | Goldman Sachs & Co.
Bank of America Securities LLC
JP Morgan Securities LLC
BNP Paribas SA
Wells Fargo & Company | |
Income Plus | | Barclays Capital Group
BNP Paribas SA | |
Global Infrastructure | | None | |
European Equity | | HSBC Holdings PLC | |
58
Name of Portfolio: | | Issuer | |
Multi Cap Growth | | None | |
Aggressive Equity | | None | |
Strategist | | Bank of America Securities LLC
Barclays Capital Group
Goldman Sachs & Co.
Credit Suisse Group AG
Merrill Lynch & Co.
UBS Financial Services, Inc. | |
At December 31, 2011, the Portfolios held securities issued by such brokers or dealers with the following market values:
Name of Portfolio: | | Issuer | | Market Value
at 12/31/11 | |
Money Market | | Barclays Capital Group | | $ | 4,000,000 | | |
| | | ING Financial Markets LLC | | | 4,999,896 | | |
Limited Duration | | Goldman Sachs & Co. | | $ | 411,030 | | |
| | | Bank of America Securities LLC | | | 574,654 | | |
| | | JP Morgan Securities LLC | | | 135,773 | | |
| | | BNP Paribas SA | | | 300,435 | | |
| | | Wells Fargo & Company | | | 491,652 | | |
Income Plus | | Barclays Capital Group | | $ | 1,485,903 | | |
| | | BNP Paribas SA | | | 520,676 | | |
European Equity | | HSBC Holdings PLC | | $ | 2,004,023 | | |
Strategist | | Bank of America Securities LLC | | $ | 157,159 | | |
| | | Barclays Capital Group | | | 194,294 | | |
| | | Goldman Sachs & Co. | | | 337,366 | | |
| | | Credit Suisse Group AG | | | 251,407 | | |
| | | Merrill Lynch & Co. | | | 222,116 | | |
| | | UBS Financial Services, Inc. | | | 103,744 | | |
VII. CAPITAL STOCK AND OTHER SECURITIES
The shareholders of each Portfolio are entitled to a full vote for each full share of beneficial interest held. The Fund is authorized to issue an unlimited number of shares of beneficial interest. The Fund's shares of beneficial interest are divided currently into eight Portfolios. All shares of beneficial interest of the Fund are of $0.01 par value and are equal as to earnings, assets and voting privileges except that each Class will have exclusive voting privileges with respect to matters relating to distribution expenses borne solely by such Class (if any) or any other matter in which the interests of one Class differ from the interests of the other Class.
The Fund's Declaration of Trust permits the Trustees to authorize the creation of additional Portfolios (the proceeds of which would be invested in separate, independently managed portfolios) and additional Classes of shares within any Portfolio. The Trustees have not presently authorized any such additional series or Classes of shares other than as set forth in the Prospectus for each Portfolio.
The Fund is not required to hold annual meetings of shareholders and in ordinary circumstances the Fund does not intend to hold such meetings. The Trustees may call special meetings of shareholders for action by shareholder vote as may be required by the Investment Company Act or the Declaration of Trust. Under certain circumstances, the Trustees may be removed by the actions of the Trustees. In addition, under certain circumstances, the shareholders may call a meeting to remove the Trustees and the Fund is required to provide assistance in communication with shareholders about such a meeting. The voting rights of shareholders are not cumulative, so that holders of more than 50% of the shares voting can, if they choose, elect all Trustees being selected, while the holders of the remaining shares would be unable to elect any Trustees.
59
Under Massachusetts law, shareholders of a business trust may, under certain limited circumstances, be held personally liable as partners for the obligations of the Fund. However, the Declaration of Trust contains an express disclaimer of shareholder liability for acts or obligations of the Fund, requires that notice of such Fund obligations include such disclaimer, and provides for indemnification out of the Fund's property for any shareholder held personally liable for the obligations of the Fund. Thus, the risk of a shareholder incurring financial loss on account of shareholder liability is limited to circumstances in which the Fund itself would be unable to meet its obligations. Given the above limitations on shareholder personal liability, and the nature of the Fund's assets and operations, the possibility of the Fund being unable to meet its obligations is remote and thus, in the opinion of Massachusetts counsel to the Fund, the risk to Fund shareholders of personal liability is remote.
Shareholders have the right to vote on the election of Trustees of the Fund and on any and all matters on which by law or the provisions of the Fund's By-Laws they may be entitled to vote. To the extent required by law, insurance companies, which are the only shareholders of the Fund, will vote the shares of the Fund held in each Account established to fund the benefits under either a flexible premium deferred variable annuity Contract or a flexible premium variable life insurance Contract in accordance with instructions from the owners of such Contracts. Shares of each Portfolio will be voted by the insurance company investing in such Portfolio based on instructions received from the contract holders having a voting interest in the underlying account. Shares for which timely instructions are not received generally will be voted by the insurance company in the same proportion as shares for which instructions have been timely received. Therefore, as a result of this proportional voting, the vote of a small number of contract holders could determine the outcome of a proposal subject to a shareholder vote.
The Trustees themselves have the power to alter the number and the terms of office of the Trustees (as provided for in the Declaration of Trust), and they may at any time lengthen or shorten their own terms or make their terms of unlimited duration and appoint their own successors, provided that always at least a majority of the Trustees has been elected by the shareholders of the Fund.
Shareholders of all Portfolios vote for a single set of Trustees. On any matters affecting only one Portfolio, only the shareholders of that Portfolio are entitled to vote. On matters relating to all the Portfolios, but affecting the Portfolios differently, separate votes by each Portfolio are required. Approval of an Investment Advisory Agreement and a change in fundamental policy would be regarded as matters requiring separate voting by each Portfolio.
With respect to the submission to shareholder vote of a matter requiring separate voting by each Portfolio, the matter shall have been effectively acted upon with respect to any Portfolio if a majority of the outstanding voting securities of that Portfolio votes for the approval of the matter, notwithstanding that: (1) the matter has not been approved by a majority of the outstanding voting securities of any other Portfolio; or (2) the matter has not been approved by a majority of the outstanding voting securities of the Fund.
VIII. PURCHASE, REDEMPTION AND PRICING OF SHARES
A. Purchase/Redemption of Shares
Information concerning how Portfolio shares are offered (and how they are redeemed) is provided in each of the Fund's Class X and Class Y Prospectuses.
B. Offering Price
The price of each Portfolio share, called "net asset value," is based on the value of the Portfolio's securities. Net asset value per share of each of Class X and Class Y shares is calculated by dividing the value of the portion of each Portfolio's securities and other assets attributable to each Class, respectively, less the liabilities attributable to each Class, respectively, by the number of shares of the Class outstanding. The assets of each Class of shares are invested in a single portfolio. The net asset value of each Class, however, will differ because the Classes have different ongoing fees.
The Money Market Portfolio, however, utilizes the amortized cost method in valuing its portfolio securities for purposes of determining the net asset value of its shares. The Money Market Portfolio utilizes this method in valuing its portfolio securities even though the portfolio securities may increase or decrease in market value, generally in connection with changes in interest rates. The amortized cost method of valuation involves valuing a security at its cost at the time of purchase adjusted by a constant
60
amortization to maturity of any discount or premium, regardless of the impact of fluctuating interest rates on the market value of the instrument. While this method provides certainty in valuation, it may result in periods during which value, as determined by amortized cost, is higher or lower than the price the Money Market Portfolio would receive if it sold the investment. During such periods, the yield to investors in the Money Market Portfolio may differ somewhat from that obtained in a similar company which uses mark-to-market values for all of its portfolio securities. For example, if the use of amortized cost resulted in a lower (higher) aggregate portfolio value on a particular day, a prospective investor in the Money Market Portfolio would be able to obtain a somewhat higher (lower) yield than would result from investment in such a similar company and existing investors would receive less (more) investment income. The purpose of this method of calculation is to facilitate the maintenance of a constant net asset value per share of $1.00.
The use of the amortized cost method to value the portfolio securities of the Money Market Portfolio and the maintenance of the per share net asset value of $1.00 is permitted pursuant to Rule 2a-7 of the Investment Company Act (the "Rule") and is conditioned on its compliance with various conditions contained in the Rule including: (a) the Trustees are obligated, as a particular responsibility within the overall duty of care owed to the Portfolio's shareholders, to establish procedures reasonably designed, taking into account current market conditions and the Portfolio's investment objectives, to stabilize the net asset value per share as computed for the purpose of distribution and redemption at $1.00 per share; (b) the procedures include (i) calculation, at such intervals as the Trustees determine are appropriate and as are reasonable in light of current market conditions, of the deviation, if any, between net asset value per share using amortized cost to value portfolio securities and net asset value per share based upon available market quotations with respect to such portfolio securities; (ii) periodic review by the Trustees of the amount of deviation as well as methods used to calculate it; and (iii) maintenance of written records of the procedures, and the Trustees' considerations made pursuant to them and any actions taken upon such consideration; (c) the Trustees should consider what steps should be taken, if any, in the event of a difference of more than 1/2 of 1% between the two methods of valuation; and (d) the Trustees should take such action as they deem appropriate (such as shortening the average portfolio maturity, realizing gains or losses, withholding dividends or, as provided by the Declaration of Trust, reducing the number of outstanding shares of the Money Market Portfolio) to eliminate or reduce to the extent reasonably practicable material dilution or other unfair results to investors or existing shareholders which might arise from differences between the two methods of valuation. Any reduction of outstanding shares will be effected by having each shareholder proportionately contribute to the Money Market Portfolio's capital the necessary shares that represent the amount of excess upon such determination. Each Contract Owner will be deemed to have agreed to such contribution in these circumstances by allocating investment under his or her Contract to the Money Market Portfolio.
Generally, for purposes of the procedures adopted under the Rule, the maturity of a portfolio security is deemed to be the period remaining (calculated from the trade date or such other date on which the Money Market Portfolio's interest in the instrument is subject to market action) until the date on which in accordance with the terms of the security, the principal amount must unconditionally be paid, or in the case of a security called for redemption, the date on which the redemption payment must be made.
A variable rate security that is subject to a demand feature is deemed to have a maturity equal to the period remaining until the principal amount can be recovered through demand. A floating rate security that is subject to a demand feature is deemed to have a maturity equal to the period remaining until the principal amount can be recovered through demand.
An "NRSRO" is a nationally recognized statistical rating organization. At the time the Money Market Portfolio acquires its investments, they will be rated (or issued by an issuer that is rated with respect to a comparable class of short-term debt obligations) (i) in one of the two highest rating categories for short-term debt obligations assigned by at least two NRSROs; or (ii) if only one NRSRO has issued a rating with respect to such security or issuer at the time a fund purchases or rolls over the security, that NRSRO (the "Requisite NRSROs").
An Eligible Security is generally defined in the Rule to mean (i) a security with a remaining maturity of 397 calendar days or less that has received a short-term rating (or that has been issued by an issuer that has received a short-term rating with respect to a class of debt obligations, or any debt obligation within that class, that is comparable in priority and security with the security) by the Requisite NRSROs in one of the two highest short-term rating categories (within which there may be sub-categories or gradations indicating relative standing); or (ii) a security: (a) that at the time of issuance had a remaining maturity of more than 397 calendar days but that has a remaining maturity of 397 calendar days or less;
61
and (b) whose issuer has received from the Requisite NRSROs a rating with respect to a class of debt obligations (or any debt obligations within that class) that is now comparable in priority and security with the security, in one of the two highest short-term rating categories (within which there may be subcategories or gradations indicating relative standing); or (iii) an unrated security that is of comparable quality to a security meeting the requirements of (i) or (ii) above, as determined by the Trustees. The Money Market Portfolio will limit its investments to securities that meet the requirements for Eligible Securities.
As permitted by the Rule, the Board has delegated to the Fund's Adviser, subject to the Board's oversight pursuant to guidelines and procedures adopted by the Board, the authority to determine which securities present minimal credit risks and which unrated securities are comparable in quality to rated securities.
Also, as required by the Rule, the Money Market Portfolio will limit its investments in securities, other than Government securities, so that, at the time of purchase: (a) except as further limited in (b) below with regard to certain securities, no more than 5% of its total assets will be invested in the securities of any one issuer; and (b) with respect to Eligible Securities that have received a rating in less than the highest category by an NRSRO, or that have been determined to be of comparable quality: (i) no more than 3% in the aggregate of the Money Market Portfolio's total assets in all such securities, (ii) no more than 0.5% of total assets in the securities of any one issuer, and (iii) the remaining maturity of any such securities must be 45 days or less.
The presence of a line of credit or other credit facility offered by a bank or other financial institution, which guarantees the payment obligation of the issuer, in the event of a default in the payment of principal or interest of an obligation, may be taken into account in determining whether an investment is an Eligible Security, provided that the guarantee itself is an Eligible Security.
The Rule further requires that the Money Market Portfolio limit its investments to U.S. dollar-denominated instruments which the Trustees determine present minimal credit risks and which are Eligible Securities. The Rule also requires the Money Market Portfolio to maintain a dollar-weighted average portfolio maturity (not more than 60 days) appropriate to its objective of maintaining a stable net asset value of $1.00 per share and precludes the purchase of any instrument with a remaining maturity of more than 397 days. Should the disposition of a portfolio security result in a dollar-weighted average portfolio maturity of more than 60 days, the Portfolio will invest its available cash in such a manner as to reduce such maturity to 60 days or less as soon as is reasonably practicable.
In the unlikely event that the Fund's Board of Trustees are to determine pursuant to Rule 2a-7 that the extent of the deviation between the Money Market Portfolio's amortized cost per share and its market-based net asset value per share may result in material dilution or other unfair results to shareholders, the Board will cause the Portfolio to take such action as it deems appropriate to eliminate or reduce to the extent practicable such dilution or unfair results, including, but not limited to, considering suspending redemption of shares and liquidating the Portfolio under Rule 22e-3 under the Investment Company Act.
If the Trustees determine that it is no longer in the best interests of the Money Market Portfolio and its shareholders to maintain a stable price of $1.00 per share or if the Trustees believe that maintaining such price no longer reflects a market-based net asset value per share, the Board has the right to change from an amortized cost basis of valuation to valuation based on market quotations. The Fund will notify shareholders of the Portfolio of any such change.
In the calculation of a Portfolio's net asset value (other than the Money Market Portfolio): (1) an equity portfolio security listed or traded on the NYSE or other exchange is valued at its latest sale price, prior to the time when assets are valued; if there were no sales that day, the security is valued at the mean between the last reported bid and asked price; (2) an equity portfolio security listed or traded on the Nasdaq is valued at the Nasdaq Official Closing Price; if there were no sales that day, the security is valued at the mean between the last reported bid and asked price; and (3) all other portfolio securities for which OTC market quotations are readily available are valued at the mean between the last reported bid and asked price. In cases where a security is traded on more than one exchange, the security is valued on the exchange designated as the primary market. For equity securities traded on foreign exchanges, the closing price or the latest bid price may be used if there were no sales on a particular day. When market quotations are not readily available, including circumstances under which it is determined by the Adviser (or if applicable, the Sub-Advisers) that the sale price, the bid price or the mean
62
between the last reported bid and asked price are not reflective of a security's market value, portfolio securities are valued at their fair value as determined in good faith under procedures established by and under the general supervision of the Fund's Trustees. For valuation purposes, quotations of foreign portfolio securities, other assets and liabilities and forward contracts stated in foreign currency are translated into U.S. dollar equivalents at the prevailing market rates prior to the close of the NYSE.
Short-term debt securities with remaining maturities of 60 days or less at the time of purchase are valued at amortized cost, unless the Trustees determine such price does not reflect the securities' market value, in which case these securities will be valued at their fair value as determined by the Trustees.
Certain of the Portfolios' securities (other than securities of the Money Market Portfolio) may be valued by an outside pricing service approved by the Fund's Trustees. The pricing service may utilize a matrix system incorporating security quality, maturity and coupon as the evaluation model parameters, and/or research evaluations by its staff, including review of broker-dealer market price quotations in determining what it believes is the fair valuation of the portfolio securities valued by such pricing service.
Listed options on debt securities are valued at the latest sale price on the exchange on which they are listed unless no sales of such options have taken place that day, in which case they will be valued at the mean between their latest bid and asked prices. Unlisted options on debt securities and all options on equity securities are valued at the mean between their latest bid and asked prices. Futures are valued at the latest price published by the commodities exchange on which they trade unless it is determined that such price does not reflect their market value, in which case they will be valued at their fair value as determined in good faith under procedures established by and under the supervision of the Trustees.
Generally, trading in foreign securities, as well as corporate bonds, U.S. government securities and money market instruments, is substantially completed each day at various times prior to the close of the NYSE. The values of such securities used in computing the net asset value of a Portfolio's shares are determined as of such times. Foreign currency exchange rates are also generally determined prior to the close of the NYSE. Occasionally, events which may affect the values of such securities and such exchange rates may occur between the times at which they are determined and the close of the NYSE and will therefore not be reflected in the computation of a Portfolio's net asset value. If events that may affect the value of such securities occur during such period, then these securities may be valued at their fair value as determined in good faith under procedures established by and under the supervision of the Trustees.
IX. TAXATION OF THE PORTFOLIOS AND SHAREHOLDERS
The following is only a summary of certain federal income and excise tax considerations generally affecting the Portfolios and their shareholders. No attempt is made to present a detailed explanation of the tax treatment of the Portfolios or their shareholders, and the discussion here is not intended as a substitute for careful tax planning. Shareholders are urged to consult their tax advisors with specific reference to their own tax situations, including their state and local tax liabilities.
The following general discussion of certain federal income and excise tax consequences is based on the Code, and the regulations issued thereunder as in effect on the date of this SAI. New legislation, as well as administrative changes or court decisions, may significantly change the conclusions expressed herein, and may have a retroactive effect with respect to the transactions contemplated herein.
Each Portfolio within the Fund is generally treated as a separate corporation for federal income tax purposes, and thus the provisions of the Code generally will be applied to each Portfolio separately, rather than to the Fund as a whole.
Federal Income Tax Treatment of Shareholders
Shares of the Portfolios will be purchased by life insurance companies for their separate accounts under variable annuity contracts and variable life insurance policies and by other entities under qualified pension and retirement plans. Under the provisions of the Code currently in effect, net income and net realized capital gains of Portfolios of the Fund are not currently taxable when distributed to and left to accumulate within a variable annuity contract or variable life insurance policy or under a qualified pension or retirement plan.
63
Section 817(h) of the Code provides that the investments of a separate account underlying a variable insurance contract (or the investments of a mutual fund, the shares of which are owned by the variable separate account) must be "adequately diversified" in order for the contract to be treated as an annuity or as life insurance for federal income tax purposes. The Treasury Department has issued regulations explaining these diversification requirements. Each Portfolio intends to continue to comply with such requirements.
For information on federal income taxation of a life insurance company with respect to its receipt of distributions from the Fund and federal income taxation of owners of the company's variable annuity contracts or variable life insurance policies, refer to the life insurance company's variable annuity contract or variable life insurance policy prospectus.
Qualification as a Regulated Investment Company
The Fund intends that each of its Portfolios qualify and elect to be treated for each taxable year as a regulated investment company ("RIC") under Subchapter M of the Code. Qualification as a regulated investment company requires, among other things, that (a) at least 90% of the Fund's annual gross income be derived from interest, dividends, payments with respect to certain securities loans, gains from the sale or other disposition of securities or options thereon or foreign currencies, or other income derived with respect to its business of investing in such securities or currencies; and (b) the Fund diversify its holdings so that, at the end of each quarter of the taxable year (i) at least 50% of the value of the Fund's assets is represented by cash, U.S. government securities, securities of other regulated investment companies and other securities limited in respect of any one issuer to an amount not greater than 5% of the value of the Fund's assets and not more than 10% of the outstanding voting securities of such issuer, and (ii) not more than 25% of the value of the Fund's assets is invested in the securities of any one issuer (other than U.S. government securities and securities of other regulated investment companies), in two or more issuers that are controlled by the Fund and that are engaged in the same or similar trades or business or related trades or businesses. It is anticipated that any net gain realized from the closing out of futures contracts will be considered gain from the sale of securities and therefore be qualifying income for purposes of the 90% gross income requirement described above. Net income derived from an interest in a "qualified publicly traded partnership," as defined in the Code, will be treated as qualifying income for purposes of the 90% gross income requirement. For the purposes of the diversification requirements in clause (ii) above, the outstanding voting securities of any issuer includes the equity securities of a qualified publicly traded partnership. In addition, no more than 25% of the value of a regulated investment company's total assets may be invested in the securities of one or more qualified publicly traded partnerships.
For purposes of the 90% of gross income requirement described above, the Code expressly provides the U.S. Treasury with authority to issue regulations that would exclude foreign currency gains from qualifying income if such gains are not directly related to a Portfolio's business of investing in stock or securities. While to date the U.S. Treasury has not exercised this regulatory authority, there can be no assurance that it will not issue regulations in the future (possibly with retroactive application) that would treat some or all of a Portfolio's foreign currency gains as non-qualifying income. For purposes of the diversification requirement described above, a Portfolio will not be treated as in violation of such requirement as a result of a discrepancy between the value of its various investments and the diversification percentages described above, unless such discrepancy exists immediately following the acquisition of any security or other property and is wholly or partly the result of such acquisition. Moreover, even in the event of noncompliance with the diversification requirement as of the end of any given quarter, a Portfolio is permitted to cure the violation by eliminating the discrepancy causing such noncompliance within a period of 30 days from the close of the relevant quarter.
In addition to the requirements described above, in order to qualify as a RIC, each Portfolio must distribute at least 90% of each Portfolio's net investment company taxable income (that generally includes dividends, taxable interest, currency gains, and the excess of net short-term capital gains over net long-term capital losses less operating expenses) and at least 90% of its net tax-exempt interest income, if any, to shareholders (the "Distribution Requirement"). If a Portfolio meets all of the RIC requirements, it will not be subject to federal income tax on any of its net investment income or net realized capital gains that it distributes to shareholders.
64
Although each Portfolio intends to distribute all or substantially all of its net investment income and may distribute its net realized capital gains for any taxable year, a Portfolio will be subject to federal income taxation to the extent any such income or gains are not distributed.
Some of the Portfolios may make investments that cause the Portfolios to recognize income or gain prior to receiving cash with respect to such investments. For example, in the event that the Portfolios invest in securities (such as STRIPS) that bear "original issue discount" or "acquisition discount" (collectively, "OID Securities"), they will be deemed to have received interest income even though no cash payments have been received. Accordingly, such investments may not produce sufficient current cash receipts to match the amount of net investment income a Portfolio must distribute to satisfy the Distribution Requirement. In some cases, a Portfolio may have to borrow money or dispose of other investments in order to make sufficient cash distributions to satisfy the Distribution Requirement.
If a Portfolio fails to qualify for any taxable year as a RIC, all of its taxable income will be subject to tax at regular corporate income tax rates without any deduction for distributions to shareholders.
Positions held by a Portfolio in certain regulated futures contracts and foreign currency contracts ("Section 1256 Contracts") will generally be marked-to-market (i.e., treated as though sold for fair market value) on the last business day of the Portfolio's taxable year and all gain or loss associated with such transactions (except certain currency gains covered by Section 988 of the Code) will generally be treated as 60% long-term capital gain or loss and 40% short-term capital gain or loss. The effect of the Section 1256 mark-to-market rules may be to accelerate income or to convert what otherwise would have been long-term capital gain into short-term capital gain or short-term capital losses into long-term capital losses within a Portfolio. The acceleration of income on Section 1256 Contracts may require a Portfolio to accrue taxable income without a corresponding receipt of cash. In order to generate enough cash to satisfy the Distribution Requirement, a Portfolio may be required to dispose of portfolio securities that it otherwise would have continued to hold or to use cash flows from other sources. Any or all of these rules may, therefore, affect the amount, character or timing of income earned and, in turn, affect the application of the Distribution Requirement to a particular Portfolio.
Short sales engaged in by a Portfolio may reduce the holding period of property held by a Portfolio which is substantially identical to the property sold short. This rule may have the effect of converting capital gains recognized by the Portfolio from long-term to short-term as well as converting capital losses recognized by the Portfolio from short-term to long-term.
Federal Excise Tax
No Portfolio will be subject to the 4% excise tax normally imposed on RICs that do not distribute substantially all of their income and gains each calendar year, because that tax does not apply to a RIC whose only shareholders are segregated asset accounts of life insurance companies held in connection with variable annuity accounts and/or variable life insurance policies and certain trusts under qualified pension and retirement plans.
Certain Tax Information Reporting Considerations
Because of the nature of the rules governing how REITs report their income and the timing of REITs' issuing year-end tax information, a Portfolio that invests in REITs may need to estimate the character of distributions paid to its shareholders from REIT distributions. In addition, after the calendar year-end, REITs may recharacterize the nature of the distributions paid during that year, with the result that distributions previously identified as ordinary income are recharacterized as return of capital and/or capital gain. As a result, the composition of a Portfolio's distributions as reported initially may differ from the final composition determined after calendar year-end and reported to a Portfolio's shareholders on their year-end tax information statements.
Foreign Income Taxes
Each Portfolio that invests in foreign securities may be subject to foreign withholding taxes with respect to its dividend and interest income from foreign countries, thus reducing the net amount available for distribution to a Portfolio's shareholders. The United States has entered into tax treaties with many foreign countries that may entitle a Portfolio to a reduced rate of, or exemption from, taxes on such income.
65
It is impossible to determine the effective rate of foreign tax in advance because the amount of a Portfolio's assets to be invested within various countries is not known.
State and Local Tax Considerations
Rules of U.S. state and local taxation of dividend and capital gains distributions from regulated investment companies often differ from the rules for U.S. federal income taxation described above. Shareholders are urged to consult their tax advisers as to the consequences of these and other U.S. state and local tax rules regarding an investment in a Portfolio.
X. UNDERWRITERS
The Portfolios' shares are offered on a continuous basis. The Distributor, as the principal underwriter of the shares, has certain obligations under the Distribution Agreement concerning the distribution of the shares. These obligations and the compensation the Distributor receives are described above in the sections titled "Principal Underwriter" and "Rule 12b-1 Plan."
XI. PERFORMANCE DATA
The current yield of the Money Market Portfolio for the seven days ended December 31, 2011 was 0.01% for Class X shares and 0.01% for Class Y shares. The seven day effective yield on December 31, 2011 was 0.01% for Class X shares and 0.01% for Class Y shares, assuming daily compounding.
For the 30-day period ended December 31, 2011, the yield of the Limited Duration Portfolio was 1.32% for Class X shares and 1.07% for Class Y shares; and the yield of the Income Plus Portfolio was 4.91% for Class X shares and 4.66% for Class Y shares.
The average annual total returns of the Class X and Class Y shares of each Portfolio for the one year, five year and ten year periods ended December 31, 2011 and/or for the period from the date of commencement of the Portfolio's operations or from the date the shares of the Class were first offered through December 31, 2011, if shorter or longer than any of the foregoing were as follows:
Class X Shares
Name of Portfolio: | | Date of Inception | | Total Return for
Fiscal Year Ended
December 31, 2011 | | Average Annual
Total Return for
Five Years Ended
December 31, 2011 | | Average Annual
Total Return for
Ten Years Ended
December 31, 2011 | | Average Annual
Total Return for
Period from
Commencement
of Operations
through
December 31, 2011 | |
Money Market | | 03/09/84 | | | 0.01 | % | | | 1.47 | % | | | 1.76 | % | | | 4.35 | % | |
Limited Duration | | 05/04/99 | | | 2.75 | % | | | –0.52 | % | | | 1.11 | % | | | 1.98 | % | |
Income Plus | | 03/01/87 | | | 5.01 | % | | | 6.31 | % | | | 5.97 | % | | | 7.26 | % | |
Global Infrastructure | | 03/01/90 | | | 16.07 | % | | | 3.51 | % | | | 5.99 | % | | | 7.72 | % | |
European Equity | | 03/01/91 | | | –9.64 | % | | | –3.90 | % | �� | | 2.87 | % | | | 8.11 | % | |
Multi Cap Growth | | 03/09/84 | | | –6.74 | % | | | 5.03 | % | | | 5.40 | % | | | 10.71 | % | |
Aggressive Equity | | 05/04/99 | | | –7.33 | % | | | 3.90 | % | | | 5.87 | % | | | 4.83 | % | |
Strategist | | 03/01/87 | | | –7.96 | % | | | –0.56 | % | | | 4.28 | % | | | 7.46 | % | |
66
Class Y Shares
Name of Portfolio: | | Date of Inception
or First Offering
of Shares
of the Class | | Total Return for
Fiscal Year Ended
December 31, 2011 | | Average Annual
Total Return for
Five Years Ended
December 31, 2011 | | Average Annual
Total Return for
Ten Years Ended
December 31, 2011 | | Average Annual
Total Return for
Period from First
Offering of
Class Y Shares
through
December 31, 2011 | |
Money Market | | 06/05/00 | | | 0.01 | % | | | 1.36 | % | | | 1.58 | % | | | 1.97 | % | |
Limited Duration | | 06/05/00 | | | 2.45 | % | | | –0.74 | % | | | 0.86 | % | | | 1.62 | % | |
Income Plus | | 06/05/00 | | | 4.71 | % | | | 6.05 | % | | | 5.70 | % | | | 6.45 | % | |
Global Infrastructure | | 06/05/00 | | | 15.82 | % | | | 3.25 | % | | | 5.73 | % | | | 2.42 | % | |
European Equity | | 06/05/00 | | | –9.85 | % | | | –4.13 | % | | | 2.62 | % | | | –0.14 | % | |
Multi Cap Growth | | 06/05/00 | | | –6.97 | % | | | 4.76 | % | | | 5.14 | % | | | 1.26 | % | |
Aggressive Equity | | 06/05/00 | | | –7.59 | % | | | 3.64 | % | | | 5.60 | % | | | 1.59 | % | |
Strategist | | 06/05/00 | | | –8.13 | % | | | –0.81 | % | | | 4.02 | % | | | 2.49 | % | |
The total returns of the Class X and Class Y shares of each Portfolio for the one year, five year and ten year periods ended December 31, 2011 and/or for the period from the date of commencement of the Portfolio's operations or from the date the shares of the Class were first offered through December 31, 2011, if shorter or longer than any of the foregoing were as follows:
Class X Shares
Name of Portfolio: | | Date of Inception | | Total Return for
Fiscal Year Ended
December 31, 2011 | | Total Return for
Five Years Ended
December 31, 2011 | | Total Return for
Ten Years Ended
December 31, 2011 | | Total Return for
Period from
Commencement
of Operations
through
December 31, 2011 | |
Money Market | | 03/09/84 | | | 0.01 | % | | | 7.55 | % | | | 19.01 | % | | | 226.44 | % | |
Limited Duration | | 05/04/99 | | | 2.75 | % | | | –2.56 | % | | | 11.67 | % | | | 28.10 | % | |
Income Plus | | 03/01/87 | | | 5.01 | % | | | 35.77 | % | | | 78.53 | % | | | 470.35 | % | |
Global Infrastructure | | 03/01/90 | | | 16.07 | % | | | 18.85 | % | | | 79.00 | % | | | 407.4 | % | |
European Equity | | 03/01/91 | | | –9.64 | % | | | –18.03 | % | | | 32.71 | % | | | 407.58 | % | |
Multi Cap Growth | | 03/09/84 | | | –6.74 | % | | | 27.80 | % | | | 69.17 | % | | | 1,596.43 | % | |
Aggressive Equity | | 05/04/99 | | | –7.33 | % | | | 21.11 | % | | | 76.91 | % | | | 81.65 | % | |
Strategist | | 03/01/87 | | | –7.96 | % | | | –2.79 | % | | | 52.07 | % | | | 497.42 | % | |
Class Y Shares
Name of Portfolio: | | Date of Inception
or First Offering
of Shares
of the Class | | Total Return for
Fiscal Year Ended
December 31, 2011 | | Total Return for
Five Years Ended
December 31, 2011 | | Total Return for
Ten Years Ended
December 31, 2011 | | Total Return for
Period from First
Offering of
Class Y Shares
through
December 31, 2011 | |
Money Market | | 06/05/00 | | | 0.01 | % | | | 7.00 | % | | | 16.93 | % | | | 25.31 | % | |
Limited Duration | | 06/05/00 | | | 2.45 | % | | | –3.65 | % | | | 8.96 | % | | | 20.47 | % | |
Income Plus | | 06/05/00 | | | 4.71 | % | | | 34.15 | % | | | 74.13 | % | | | 106.19 | % | |
Global Infrastructure | | 06/05/00 | | | 15.82 | % | | | 17.37 | % | | | 74.64 | % | | | 31.94 | % | |
European Equity | | 06/05/00 | | | –9.85 | % | | | –19.01 | % | | | 29.48 | % | | | –1.57 | % | |
Multi Cap Growth | | 06/05/00 | | | –6.97 | % | | | 26.20 | % | | | 65.00 | % | | | 15.54 | % | |
Aggressive Equity | | 06/05/00 | | | –7.59 | % | | | 19.59 | % | | | 72.44 | % | | | 20.04 | % | |
Strategist | | 06/05/00 | | | –8.13 | % | | | –4.00 | % | | | 48.31 | % | | | 32.86 | % | |
XII. FINANCIAL STATEMENTS
The Fund's audited financial statements for the fiscal year ended December 31, 2011, including notes thereto, and the report of Ernst & Young LLP, an independent registered public accounting firm, are herein incorporated by reference to the Fund's Annual Report to Shareholders. A copy of the Fund's Annual Report to Shareholders must accompany the delivery of this SAI.
67
On June 7, 2011, Deloitte & Touche LLP was dismissed as the independent registered public accounting firm of the Fund. The Fund, with the approval of its Board of Trustees and its Audit Committee, engaged Ernst & Young LLP as its new independent registered public accounting firm as of June 7, 2011.
XIII. FUND COUNSEL
Dechert LLP, located at 1095 Avenue of the Americas, New York, NY 10036, acts as the Fund's legal counsel.
*****
This SAI and each of the Class X and Class Y Prospectuses do not contain all of the information set forth in the Registration Statement the Fund has filed with the SEC. The complete Registration Statement may be obtained from the SEC.
68
Appendix A
MORGAN STANLEY INVESTMENT MANAGEMENT
PROXY VOTING POLICY AND PROCEDURES
I. POLICY STATEMENT
Morgan Stanley Investment Management's ("MSIM") policy and procedures for voting proxies ("Policy") with respect to securities held in the accounts of clients applies to those MSIM entities that provide discretionary investment management services and for which an MSIM entity has authority to vote proxies. This Policy is reviewed and updated as necessary to address new and evolving proxy voting issues and standards.
The MSIM entities covered by this Policy currently include the following: Morgan Stanley AIP GP LP, Morgan Stanley Investment Management Inc., Morgan Stanley Investment Management Limited, Morgan Stanley Investment Management Company, Morgan Stanley Asset & Investment Trust Management Co., Limited, Morgan Stanley Investment Management Private Limited and Private Investment Partners Inc. (each an "MSIM Affiliate" and collectively referred to as the "MSIM Affiliates" or as "we" below).
Each MSIM Affiliate will use its best efforts to vote proxies as part of its authority to manage, acquire and dispose of account assets. With respect to the MSIM registered management investment companies (the "MSIM Funds"), each MSIM Affiliate will vote proxies under this Policy pursuant to authority granted under its applicable investment advisory agreement or, in the absence of such authority, as authorized by the Board of Directors/Trustees of the MSIM Funds. A MSIM Affiliate will not vote proxies unless the investment management or investment advisory agreement explicitly authorizes the MSIM Affiliate to vote proxies. MSIM Affiliates will vote proxies in a prudent and diligent manner and in the best interests of clients, including beneficiaries of and participants in a client's benefit plan(s) for which the MSIM Affiliates manage assets, consistent with the objective of maximizing long-term investment returns ("Client Proxy Standard"). In certain situations, a client or its fiduciary may provide an MSIM Affiliate with a proxy voting policy. In these situations, the MSIM Affiliate will comply with the client's policy.
Proxy Research Services — ISS Governance Services ("ISS") and Glass Lewis (together with other proxy research providers as we may retain from time to time, the "Research Providers") are independent advisers that specialize in providing a variety of fiduciary-level proxy-related services to institutional investment managers, plan sponsors, custodians, consultants, and other institutional investors. The services provided include in-depth research, global issuer analysis, and voting recommendations. While we may review and utilize the recommendations of one or more Research Providers in making proxy voting decisions, we are in no way obligated to follow such recommendations. In addition to research, ISS provides vote execution, reporting, and recordkeeping services.
Voting Proxies for Certain Non-U.S. Companies — Voting proxies of companies located in some jurisdictions may involve several problems that can restrict or prevent the ability to vote such proxies or entail significant costs. These problems include, but are not limited to: (i) proxy statements and ballots being written in a language other than English; (ii) untimely and/or inadequate notice of shareholder meetings; (iii) restrictions on the ability of holders outside the issuer's jurisdiction of organization to exercise votes; (iv) requirements to vote proxies in person; (v) the imposition of restrictions on the sale of the securities for a period of time in proximity to the shareholder meeting; and (vi) requirements to provide local agents with power of attorney to facilitate our voting instructions. As a result, we vote clients' non-U.S. proxies on a best efforts basis only, after weighing the costs and benefits of voting such proxies, consistent with the Client Proxy Standard. ISS has been retained to provide assistance in connection with voting non-U.S. proxies.
II. GENERAL PROXY VOTING GUIDELINES
To promote consistency in voting proxies on behalf of its clients, we follow this Policy (subject to any exception set forth herein). The Policy addresses a broad range of issues, and provides general voting parameters on proposals that arise most frequently. However, details of specific proposals vary, and those details affect particular voting decisions, as do factors specific to a given company. Pursuant to the
A-1
procedures set forth herein, we may vote in a manner that is not in accordance with the following general guidelines, provided the vote is approved by the Proxy Review Committee (see Section III for description) and is consistent with the Client Proxy Standard. Morgan Stanley AIP GP LP will follow the procedures as described in Appendix A.
We endeavor to integrate governance and proxy voting policy with investment goals, using the vote to encourage portfolio companies to enhance long-term shareholder value and to provide a high standard of transparency such that equity markets can value corporate assets appropriately.
We seek to follow the Client Proxy Standard for each client. At times, this may result in split votes, for example when different clients have varying economic interests in the outcome of a particular voting matter (such as a case in which varied ownership interests in two companies involved in a merger result in different stakes in the outcome). We also may split votes at times based on differing views of portfolio managers.
We may abstain on matters for which disclosure is inadequate.
A. Routine Matters.
We generally support routine management proposals. The following are examples of routine management proposals:
• Approval of financial statements and auditor reports if delivered with an unqualified auditor's opinion.
• General updating/corrective amendments to the charter, articles of association or bylaws, unless we believe that such amendments would diminish shareholder rights.
• Most proposals related to the conduct of the annual meeting, with the following exceptions. We generally oppose proposals that relate to "the transaction of such other business which may come before the meeting," and open-ended requests for adjournment. However, where management specifically states the reason for requesting an adjournment and the requested adjournment would facilitate passage of a proposal that would otherwise be supported under this Policy (i.e. an uncontested corporate transaction), the adjournment request will be supported.
We generally support shareholder proposals advocating confidential voting procedures and independent tabulation of voting results.
B. Board of Directors.
1. Election of directors: Votes on board nominees can involve balancing a variety of considerations. In vote decisions, we may take into consideration whether the company has a majority voting policy in place that we believe makes the director vote more meaningful. In the absence of a proxy contest, we generally support the board's nominees for director except as follows:
a. We consider withholding support from or voting against a nominee if we believe a direct conflict exists between the interests of the nominee and the public shareholders, including failure to meet fiduciary standards of care and/or loyalty. We may oppose directors where we conclude that actions of directors are unlawful, unethical or negligent. We consider opposing individual board members or an entire slate if we believe the board is entrenched and/or dealing inadequately with performance problems; if we believe the board is acting with insufficient independence between the board and management; or if we believe the board has not been sufficiently forthcoming with information on key governance or other material matters.
b. We consider withholding support from or voting against interested directors if the company's board does not meet market standards for director independence, or if otherwise we believe board independence is insufficient. We refer to prevalent market standards as promulgated by a stock exchange or other authority within a given market (e.g., New York Stock Exchange or Nasdaq rules for most U.S. companies, and The Combined Code on Corporate Governance in the United Kingdom). Thus, for an NYSE company with no controlling shareholder, we would expect that at a minimum a majority of directors should be independent as defined by NYSE. Where we view market standards as inadequate, we may withhold votes based on
A-2
stronger independence standards. Market standards notwithstanding, we generally do not view long board tenure alone as a basis to classify a director as non-independent.
i. At a company with a shareholder or group that controls the company by virtue of a majority economic interest in the company, we have a reduced expectation for board independence, although we believe the presence of independent directors can be helpful, particularly in staffing the audit committee, and at times we may withhold support from or vote against a nominee on the view the board or its committees are not sufficiently independent. In markets where board independence is not the norm (e.g. Japan), however, we consider factors including whether a board of a controlled company includes independent members who can be expected to look out for interests of minority holders.
ii. We consider withholding support from or voting against a nominee if he or she is affiliated with a major shareholder that has representation on a board disproportionate to its economic interest.
c. Depending on market standards, we consider withholding support from or voting against a nominee who is interested and who is standing for election as a member of the company's compensation/remuneration, nominating/governance or audit committee.
d. We consider withholding support or voting against nominees if the term for which they are nominated is excessive. We consider this issue on a market-specific basis.
e. We consider withholding support from or voting against nominees if, in our view, there has been insufficient board renewal (turnover), particularly in the context of extended poor company performance.
f. We consider withholding support from or voting against a nominee standing for election if the board has not taken action to implement generally accepted governance practices for which there is a "bright line" test. For example, in the context of the U.S. market, failure to eliminate a dead hand or slow hand poison pill would be seen as a basis for opposing one or more incumbent nominees.
g. In markets that encourage designated audit committee financial experts, we consider voting against members of an audit committee if no members are designated as such. We also may not support the audit committee members if the company has faced financial reporting issues and/or does not put the auditor up for ratification by shareholders.
h. We believe investors should have the ability to vote on individual nominees, and may abstain or vote against a slate of nominees where we are not given the opportunity to vote on individual nominees.
i. We consider withholding support from or voting against a nominee who has failed to attend at least 75% of the nominee's board and board committee meetings within a given year without a reasonable excuse. We also consider opposing nominees if the company does not meet market standards for disclosure on attendance.
j. We consider withholding support from or voting against a nominee who appears overcommitted, particularly through service on an excessive number of boards. Market expectations are incorporated into this analysis; for U.S. boards, we generally oppose election of a nominee who serves on more than six public company boards (excluding investment companies), although we may reference National Association of Corporate Directors guidance suggesting that public company CEOs, for example, should serve no more than two outside boards given the level of time commitment required in their primary job.
2. Discharge of directors' duties: In markets where an annual discharge of directors' responsibility is a routine agenda item, we generally support such discharge. However, we may vote against discharge or abstain from voting where there are serious findings of fraud or other unethical behavior for which the individual bears responsibility. The annual discharge of responsibility
A-3
represents shareholder approval of disclosed actions taken by the board during the year and may make future shareholder action against the board difficult to pursue.
3. Board independence: We generally support U.S. shareholder proposals requiring that a certain percentage (up to 66 2/3%) of the company's board members be independent directors, and promoting all-independent audit, compensation and nominating/governance committees.
4. Board diversity: We consider on a case-by-case basis shareholder proposals urging diversity of board membership with respect to social, religious or ethnic group.
5. Majority voting: We generally support proposals requesting or requiring majority voting policies in election of directors, so long as there is a carve-out for plurality voting in the case of contested elections.
6. Proxy access: We consider on a case-by-case basis shareholder proposals on particular procedures for inclusion of shareholder nominees in company proxy statements.
7. Reimbursement for dissident nominees: We generally support well-crafted U.S. shareholder proposals that would provide for reimbursement of dissident nominees elected to a board, as the cost to shareholders in electing such nominees can be factored into the voting decision on those nominees.
8. Proposals to elect directors more frequently: In the U.S. public company context, we usually support shareholder and management proposals to elect all directors annually (to "declassify" the board), although we make an exception to this policy where we believe that long-term shareholder value may be harmed by this change given particular circumstances at the company at the time of the vote on such proposal. As indicated above, outside the U.S., we generally support greater accountability to shareholders that comes through more frequent director elections, but recognize that many markets embrace longer term lengths, sometimes for valid reasons given other aspects of the legal context in electing boards.
9. Cumulative voting: We generally support proposals to eliminate cumulative voting in the U.S. market context. (Cumulative voting provides that shareholders may concentrate their votes for one or a handful of candidates, a system that can enable a minority bloc to place representation on a board.) U.S. proposals to establish cumulative voting in the election of directors generally will not be supported.
10. Separation of Chairman and CEO positions: We vote on shareholder proposals to separate the Chairman and CEO positions and/or to appoint an independent Chairman based in part on prevailing practice in particular markets, since the context for such a practice varies. In many non-U.S. markets, we view separation of the roles as a market standard practice, and support division of the roles in that context. In the U.S., we consider such proposals on a case-by-case basis, considering, among other things, the existing board leadership structure, company performance, and any other evidence of entrenchment or perceived risk that power is overly concentrated in a single individual.
11. Director retirement age and term limits: Proposals setting or recommending director retirement ages or director term limits are voted on a case-by-case basis that includes consideration of company performance, the rate of board renewal, evidence of effective individual director evaluation processes, and any indications of entrenchment.
12. Proposals to limit directors' liability and/or broaden indemnification of officers and directors. Generally, we will support such proposals provided that an individual is eligible only if he or she has not acted in bad faith, with gross negligence or with reckless disregard of their duties.
C. Statutory auditor boards.
The statutory auditor board, which is separate from the main board of directors, plays a role in corporate governance in several markets. These boards are elected by shareholders to provide assurance on compliance with legal and accounting standards and the company's articles of association. We generally vote for statutory auditor nominees if they meet independence standards. In markets that require
A-4
disclosure on attendance by internal statutory auditors, however, we consider voting against nominees for these positions who failed to attend at least 75% of meetings in the previous year. We also consider opposing nominees if the company does not meet market standards for disclosure on attendance.
D. Corporate transactions and proxy fights.
We examine proposals relating to mergers, acquisitions and other special corporate transactions (i.e., takeovers, spin-offs, sales of assets, reorganizations, restructurings and recapitalizations) on a case-by-case basis in the interests of each fund or other account. Proposals for mergers or other significant transactions that are friendly and approved by the Research Providers usually are supported if there is no portfolio manager objection. We also analyze proxy contests on a case-by-case basis.
E. Changes in capital structure.
1. We generally support the following:
• Management and shareholder proposals aimed at eliminating unequal voting rights, assuming fair economic treatment of classes of shares we hold.
• U.S. management proposals to increase the authorization of existing classes of common stock (or securities convertible into common stock) if: (i) a clear business purpose is stated that we can support and the number of shares requested is reasonable in relation to the purpose for which authorization is requested; and/or (ii) the authorization does not exceed 100% of shares currently authorized and at least 30% of the total new authorization will be outstanding. (We consider proposals that do not meet these criteria on a case-by-case basis.)
• U.S. management proposals to create a new class of preferred stock or for issuances of preferred stock up to 50% of issued capital, unless we have concerns about use of the authority for anti-takeover purposes.
• Proposals in non-U.S. markets that in our view appropriately limit potential dilution of existing shareholders. A major consideration is whether existing shareholders would have preemptive rights for any issuance under a proposal for standing share issuance authority. We generally consider market-specific guidance in making these decisions; for example, in the U.K. market, we usually follow Association of British Insurers' ("ABI") guidance, although company-specific factors may be considered and for example, may sometimes lead us to voting against share authorization proposals even if they meet ABI guidance.
• Management proposals to authorize share repurchase plans, except in some cases in which we believe there are insufficient protections against use of an authorization for anti-takeover purposes.
• Management proposals to reduce the number of authorized shares of common or preferred stock, or to eliminate classes of preferred stock.
• Management proposals to effect stock splits.
• Management proposals to effect reverse stock splits if management proportionately reduces the authorized share amount set forth in the corporate charter. Reverse stock splits that do not adjust proportionately to the authorized share amount generally will be approved if the resulting increase in authorized shares coincides with the proxy guidelines set forth above for common stock increases.
• Management dividend payout proposals, except where we perceive company payouts to shareholders as inadequate.
2. We generally oppose the following (notwithstanding management support):
• Proposals to add classes of stock that would substantially dilute the voting interests of existing shareholders.
• Proposals to increase the authorized or issued number of shares of existing classes of stock that are unreasonably dilutive, particularly if there are no preemptive rights for existing shareholders.
A-5
However, depending on market practices, we consider voting for proposals giving general authorization for issuance of shares not subject to pre-emptive rights if the authority is limited.
• Proposals that authorize share issuance at a discount to market rates, except where authority for such issuance is de minimis, or if there is a special situation that we believe justifies such authorization (as may be the case, for example, at a company under severe stress and risk of bankruptcy).
• Proposals relating to changes in capitalization by 100% or more.
We consider on a case-by-case basis shareholder proposals to increase dividend payout ratios, in light of market practice and perceived market weaknesses, as well as individual company payout history and current circumstances. For example, currently we perceive low payouts to shareholders as a concern at some Japanese companies, but may deem a low payout ratio as appropriate for a growth company making good use of its cash, notwithstanding the broader market concern.
F. Takeover Defenses and Shareholder Rights.
1. Shareholder rights plans: We generally support proposals to require shareholder approval or ratification of shareholder rights plans (poison pills). In voting on rights plans or similar takeover defenses, we consider on a case-by-case basis whether the company has demonstrated a need for the defense in the context of promoting long-term share value; whether provisions of the defense are in line with generally accepted governance principles in the market (and specifically the presence of an adequate qualified offer provision that would exempt offers meeting certain conditions from the pill); and the specific context if the proposal is made in the midst of a takeover bid or contest for control.
2. Supermajority voting requirements: We generally oppose requirements for supermajority votes to amend the charter or bylaws, unless the provisions protect minority shareholders where there is a large shareholder. In line with this view, in the absence of a large shareholder we support reasonable shareholder proposals to limit such supermajority voting requirements.
3. Shareholder rights to call meetings: We consider proposals to enhance shareholder rights to call meetings on a case-by-case basis. At large-cap U.S. companies, we generally support efforts to establish the rights of holders of 10% or more of shares to call special meetings, unless the board or state law has a set policy or law establishing such rights at a threshold that we believe to be acceptable.
4. Written consent rights: In the U.S. context, we examine proposals for shareholder written consent rights on a case-by-case basis.
5. Reincorporation: We consider management and shareholder proposals to reincorporate to a different jurisdiction on a case-by-case basis. We oppose such proposals if we believe the main purpose is to take advantage of laws or judicial precedents that reduce shareholder rights.
6. Anti-greenmail provisions: Proposals relating to the adoption of anti-greenmail provisions will be supported, provided that the proposal: (i) defines greenmail; (ii) prohibits buyback offers to large block holders (holders of at least 1% of the outstanding shares and in certain cases, a greater amount) not made to all shareholders or not approved by disinterested shareholders; and (iii) contains no anti-takeover measures or other provisions restricting the rights of shareholders.
7. Bundled proposals: We may consider opposing or abstaining on proposals if disparate issues are "bundled" and presented for a single vote.
G. Auditors.
We generally support management proposals for selection or ratification of independent auditors. However, we may consider opposing such proposals with reference to incumbent audit firms if the company has suffered from serious accounting irregularities and we believe rotation of the audit firm is appropriate, or if fees paid to the auditor for non-audit-related services are excessive. Generally, to determine if non-audit fees are excessive, a 50% test will be applied (i.e., non-audit-related fees should be less than 50% of the total fees paid to the auditor). We generally vote against proposals to indemnify auditors.
A-6
H. Executive and Director Remuneration.
1. We generally support the following:
• Proposals for employee equity compensation plans and other employee ownership plans, provided that our research does not indicate that approval of the plan would be against shareholder interest. Such approval may be against shareholder interest if it authorizes excessive dilution and shareholder cost, particularly in the context of high usage ("run rate") of equity compensation in the recent past; or if there are objectionable plan design and provision.
• Proposals relating to fees to outside directors, provided the amounts are not excessive relative to other companies in the country or industry, and provided that the structure is appropriate within the market context. While stock-based compensation to outside directors is positive if moderate and appropriately structured, we are wary of significant stock option awards or other performance-based awards for outside directors, as well as provisions that could result in significant forfeiture of value on a director's decision to resign from a board (such forfeiture can undercut director independence).
• Proposals for employee stock purchase plans that permit discounts, but only for grants that are part of a broad-based employee plan, including all non-executive employees, and only if the discounts are limited to a reasonable market standard or less.
• Proposals for the establishment of employee retirement and severance plans, provided that our research does not indicate that approval of the plan would be against shareholder interest.
2. We generally oppose retirement plans and bonuses for non-executive directors and independent statutory auditors.
3. In the U.S. context, shareholder proposals requiring shareholder approval of all severance agreements will not be supported, but proposals that require shareholder approval for agreements in excess of three times the annual compensation (salary and bonus) generally will be supported. We generally oppose shareholder proposals that would establish arbitrary caps on pay. We consider on a case-by-case basis shareholder proposals that seek to limit Supplemental Executive Retirement Plans (SERPs), but support such proposals where we consider SERPs to be excessive.
4. Shareholder proposals advocating stronger and/or particular pay-for-performance models will be evaluated on a case-by-case basis, with consideration of the merits of the individual proposal within the context of the particular company and its labor markets, and the company's current and past practices. While we generally support emphasis on long-term components of senior executive pay and strong linkage of pay to performance, we consider factors including whether a proposal may be overly prescriptive, and the impact of the proposal, if implemented as written, on recruitment and retention.
5. We generally support proposals advocating reasonable senior executive and director stock ownership guidelines and holding requirements for shares gained in executive equity compensation programs
6. We generally support shareholder proposals for reasonable "claw-back" provisions that provide for company recovery of senior executive bonuses to the extent they were based on achieving financial benchmarks that were not actually met in light of subsequent restatements.
7. Management proposals effectively to re-price stock options are considered on a case-by-case basis. Considerations include the company's reasons and justifications for a re-pricing, the company's competitive position, whether senior executives and outside directors are excluded, potential cost to shareholders, whether the re-pricing or share exchange is on a value-for-value basis, and whether vesting requirements are extended.
8. Say-on-Pay: We consider proposals relating to an advisory vote on remuneration on a case-by-case basis. Considerations include a review of the relationship between executive remuneration and performance based on operating trends and total shareholder return over multiple performance periods. In addition, we review remuneration structures and potential poor pay practices, including
A-7
relative magnitude of pay, discretionary bonus awards, tax gross ups, change-in-control features, internal pay equity and peer group construction. As long-term investors, we support remuneration policies that align with long-term shareholder returns.
I. Social, Political and Environmental Issues.
Shareholders in the U.S. and certain other markets submit proposals encouraging changes in company disclosure and practices related to particular corporate, social, political and environmental matters. We consider how to vote on the proposals on a case-by-case basis to determine likely impacts on shareholder value. We seek to balance concerns on reputational and other risks that lie behind a proposal against costs of implementation, while considering appropriate shareholder and management prerogatives. We may abstain from voting on proposals that do not have a readily determinable financial impact on shareholder value. We support proposals that, if implemented, would enhance useful disclosure, but we generally vote against proposals requesting reports that we believe are duplicative, related to matters not material to the business, or that would impose unnecessary or excessive costs. We believe that certain social and environmental shareholder proposals may intrude excessively on management prerogatives, which can lead us to oppose them.
J. Fund of Funds.
Certain Funds advised by an MSIM Affiliate invest only in other MSIM Funds. If an underlying fund has a shareholder meeting, in order to avoid any potential conflict of interest, such proposals will be voted in the same proportion as the votes of the other shareholders of the underlying fund, unless otherwise determined by the Proxy Review Committee.
III. ADMINISTRATION OF POLICY
The MSIM Proxy Review Committee (the "Committee") has overall responsibility for the Policy. The Committee, which is appointed by MSIM's Long-Only Executive Committee, consists of investment professionals who represent the different investment disciplines and geographic locations of the firm, and is chaired by the director of the Corporate Governance Team ("CGT"). Because proxy voting is an investment responsibility and impacts shareholder value, and because of their knowledge of companies and markets, portfolio managers and other members of investment staff play a key role in proxy voting, although the Committee has final authority over proxy votes.
The CGT Director is responsible for identifying issues that require Committee deliberation or ratification. The CGT, working with advice of investment teams and the Committee, is responsible for voting on routine items and on matters that can be addressed in line with these Policy guidelines. The CGT has responsibility for voting case-by-case where guidelines and precedent provide adequate guidance.
The Committee will periodically review and have the authority to amend, as necessary, the Policy and establish and direct voting positions consistent with the Client Proxy Standard.
CGT and members of the Committee may take into account Research Providers' recommendations and research as well as any other relevant information they may request or receive, including portfolio manager and/or analyst comments and research, as applicable. Generally, proxies related to securities held in accounts that are managed pursuant to quantitative, index or index-like strategies ("Index Strategies") will be voted in the same manner as those held in actively managed accounts, unless economic interests of the accounts differ. Because accounts managed using Index Strategies are passively managed accounts, research from portfolio managers and/or analysts related to securities held in these accounts may not be available. If the affected securities are held only in accounts that are managed pursuant to Index Strategies, and the proxy relates to a matter that is not described in this Policy, the CGT will consider all available information from the Research Providers, and to the extent that the holdings are significant, from the portfolio managers and/or analysts.
A. Committee Procedures
The Committee meets at least quarterly and reviews and considers changes to the Policy at least annually. Through meetings and/or written communications, the Committee is responsible for monitoring and ratifying "split votes" (i.e., allowing certain shares of the same issuer that are the subject of the same
A-8
proxy solicitation and held by one or more MSIM portfolios to be voted differently than other shares) and/or "override voting" (i.e., voting all MSIM portfolio shares in a manner contrary to the Policy). The Committee will review developing issues and approve upcoming votes, as appropriate, for matters as requested by CGT.
The Committee reserves the right to review voting decisions at any time and to make voting decisions as necessary to ensure the independence and integrity of the votes.
B. Material Conflicts of Interest
In addition to the procedures discussed above, if the CGT Director determines that an issue raises a material conflict of interest, the CGT Director may request a special committee to review, and recommend a course of action with respect to, the conflict(s) in question ("Special Committee").
A potential material conflict of interest could exist in the following situations, among others:
1. The issuer soliciting the vote is a client of MSIM or an affiliate of MSIM and the vote is on a matter that materially affects the issuer.
2. The proxy relates to Morgan Stanley common stock or any other security issued by Morgan Stanley or its affiliates except if echo voting is used, as with MSIM Funds, as described herein.
3. Morgan Stanley has a material pecuniary interest in the matter submitted for a vote (e.g., acting as a financial advisor to a party to a merger or acquisition for which Morgan Stanley will be paid a success fee if completed).
If the CGT Director determines that an issue raises a potential material conflict of interest, depending on the facts and circumstances, the issue will be addressed as follows:
1. If the matter relates to a topic that is discussed in this Policy, the proposal will be voted as per the Policy.
2. If the matter is not discussed in this Policy or the Policy indicates that the issue is to be decided case-by-case, the proposal will be voted in a manner consistent with the Research Providers, provided that all the Research Providers consulted have the same recommendation, no portfolio manager objects to that vote, and the vote is consistent with MSIM's Client Proxy Standard.
3. If the Research Providers' recommendations differ, the CGT Director will refer the matter to a Special Committee to vote on the proposal, as appropriate.
Any Special Committee shall be comprised of the CGT Director and at least two portfolio managers (preferably members of the Committee) as approved by the Committee. The CGT Director may request non-voting participation by MSIM's General Counsel or his/her designee and the Chief Compliance Officer or his/her designee. In addition to the research provided by Research Providers, the Special Committee may request analysis from MSIM Affiliate investment professionals and outside sources to the extent it deems appropriate.
C. Proxy Voting Reporting
The CGT will document in writing all Committee and Special Committee decisions and actions, which documentation will be maintained by the CGT for a period of at least six years. To the extent these decisions relate to a security held by an MSIM Fund, the CGT will report the decisions to each applicable Board of Trustees/Directors of those Funds at each Board's next regularly scheduled Board meeting. The report will contain information concerning decisions made during the most recently ended calendar quarter immediately preceding the Board meeting.
MSIM will promptly provide a copy of this Policy to any client requesting it. MSIM will also, upon client request, promptly provide a report indicating how each proxy was voted with respect to securities held in that client's account.
MSIM's Legal Department is responsible for filing an annual Form N-PX on behalf of each MSIM Fund for which such filing is required, indicating how all proxies were voted with respect to such Fund's holdings.
A-9
APPENDIX A
The following procedures apply to accounts managed by Morgan Stanley AIP GP LP and Private Investment Partners Inc. ("AIP").
Generally, AIP will follow the guidelines set forth in Section II of MSIM's Proxy Voting Policy and Procedures. To the extent that such guidelines do not provide specific direction, or AIP determines that consistent with the Client Proxy Standard, the guidelines should not be followed, the Proxy Review Committee has delegated the voting authority to vote securities held by accounts managed by AIP to the Fund of Hedge Funds investment team, the Private Equity Fund of Funds investment team or the Private Equity Real Estate Fund of Funds investment team of AIP. A summary of decisions made by the investment teams will be made available to the Proxy Review Committee for its information at the next scheduled meeting of the Proxy Review Committee.
In certain cases, AIP may determine to abstain from determining (or recommending) how a proxy should be voted (and therefore abstain from voting such proxy or recommending how such proxy should be voted), such as where the expected cost of giving due consideration to the proxy does not justify the potential benefits to the affected account(s) that might result from adopting or rejecting (as the case may be) the measure in question.
Waiver of Voting Rights
For regulatory reasons, AIP may either 1) invest in a class of securities of an underlying fund (the "Fund") that does not provide for voting rights; or 2) waive 100% of its voting rights with respect to the following:
1. Any rights with respect to the removal or replacement of a director, general partner, managing member or other person acting in a similar capacity for or on behalf of the Fund (each individually a "Designated Person," and collectively, the "Designated Persons"), which may include, but are not limited to, voting on the election or removal of a Designated Person in the event of such Designated Person's death, disability, insolvency, bankruptcy, incapacity, or other event requiring a vote of interest holders of the Fund to remove or replace a Designated Person; and
2. Any rights in connection with a determination to renew, dissolve, liquidate, or otherwise terminate or continue the Fund, which may include, but are not limited to, voting on the renewal, dissolution, liquidation, termination or continuance of the Fund upon the occurrence of an event described in the Fund's organizational documents; provided, however, that, if the Fund's organizational documents require the consent of the Fund's general partner or manager, as the case may be, for any such termination or continuation of the Fund to be effective, then AIP may exercise its voting rights with respect to such matter.
Approved by Morgan Stanley Funds Board on September 27-28, 2011
A-10
APPENDIX B — DESCRIPTION OF RATINGS
I. Excerpts from Moody's Investors Service, Inc.'s Corporate Bond Ratings:
Aaa: Judged to be of the best quality; carry the smallest degree of invest risk;
Aa: judged to be of high quality by all standards;
A: possess many favorable investment attributes and are to be considered upper medium grade obligations;
Baa: considered as medium grade obligations; i.e., they are neither highly protected nor poorly secured;
Ba: judged to have speculative elements; their future cannot be considered well-assured;
B: assurance of interest and principal payments or of maintenance of other terms of the contract over any long period of time may be small.
Caa: Bonds which are rated Caa are of poor standing. Such issues may be in default or there may be present elements of danger with respect to principal or interest.
Ca: Bonds which are rated Ca represent obligations which are speculative in a high degree. Such issues are often in default or have other marked shortcomings.
C: Bonds which are rated C are lowest rated class of bonds and issues so rated can be regarded as having extremely poor prospects of ever attaining any real investment standing.
Note: Moody's applies numerical modifiers, 1, 2 and 3 in each generic rating classification from Aa through Caa in its corporate bond rating system. The modifier 1 indicates that the obligation ranks in the higher end of its generic rating category; the modifier 2 indicates a mid-range ranking; and the modifier 3 indicates that the issue ranks in the lower end of its generic rating category.
II. Excerpts from Standard & Poor's Ratings Services' Corporate Bond Ratings:
AAA: Highest rating assigned for an obligation; obligor has extremely strong capacity to meet its financial commitments;
AA: obligation differs from the highest-rated obligations only in small degree; obligor's capacity to meet its financial commitment on the obligation is very strong;
A: obligation is somewhat more susceptible to the adverse effects of changes in circumstances and economic conditions than obligations in higher-rated categories; obligor's capacity to meet its financial commitment on the obligation is still strong;
BBB: obligation exhibits adequate protection parameters; adverse economic conditions or changing circumstances are more likely to lead to a weakened capacity of the obligor to meet its financial commitment on the obligation.
BB, B, CCC, CC, C: Obligations rated BB, B, CCC, and CC are regarded as having significant speculative characteristics. BB indicates the least degree of speculation and CC the highest. While such obligations will likely have some quality and protective characteristics, these may be outweighed by large uncertainties or major exposures to adverse conditions. The C rating may be used to cover a situation where a bankruptcy petition has been filed or similar action has been taken, but payments on this obligation are being continued.
D: An obligation rated D is in payment default. The D rating category is used when payments on an obligation are not made on the date due even if the applicable grace period has not expired, unless Standard & Poor's believes that such payments will be made during such grace period. The D rating also will be used upon the filing of a bankruptcy petition or the taking of a similar action if payments on an obligation are jeopardized.
Plus (+) or minus (-): The ratings from AA to CCC may be modified by the addition of a plus or minus sign to show relative standing within the major rating categories.
B-1
III. Excerpts from Fitch, Inc.'s Corporate Bond Ratings:
AAA: Highest credit quality; denotes the lowest expectation of credit risk; assigned only in case of exceptionally strong capacity for payment of financial commitments. This capacity is highly unlikely to be adversely affected by foreseeable events.
AA: Very high credit quality; denote expectations of very low credit risk; indicate very strong capacity for payment of financial commitments. This capacity is not significantly vulnerable to foreseeable events.
A: High credit quality; denote expectations of low credit risk. The capacity for payment of financial commitments is considered strong. This capacity may, nevertheless, be more vulnerable to changes in circumstances or in economic conditions than is the case for higher ratings.
BBB: Good credit quality; indicate that there is currently expectations of low credit risk. The capacity for payment of financial commitments is considered adequate but adverse changes in circumstances and economic conditions are more likely to impair this capacity. This is the lowest investment grade category.
BB: Speculative; indicate that there is a possibility of credit risk developing, particularly as the result of adverse economic change over time; however, business or financial alternatives may be available to allow financial commitments to be met. Securities rated in this category are not investment grade.
B: Highly speculative; indicate that significant credit risk is present, but a limited margin of safety remains. Financial commitments are currently being met; however, capacity for continued payment is contingent upon a sustained, favorable business and economic environment.
CCC: Default is a real possibility. Capacity for meeting financial commitments is solely reliant upon sustained, favorable business or economic conditions.
CC: Default of some kind appears probable.
C: Default is imminent.
RD: Indicates an entity that has failed to make due payments (within the applicable grace period) on some but not all material financial obligations, but continues to honor other classes of obligations.
D: Default. Default is determined by reference to the terms of the obligations' documentation. Fitch will assign default ratings where it has reasonably determined that payment has not been made on a material obligation in accordance with the requirements of the obligation's documentation, or where it believes that default ratings consistent with Fitch's published definition of default are the most appropriate ratings to assign.
The modifiers "+" or "-" may be appended to a rating to denote relative status within major rating categories. Such suffixes are not added to the AAA Long-term rating category or to categories below CCC.
IV. Excerpts from Moody's Investors Service, Inc.'s Preferred Stock Ratings:
aaa: An issue which is rated aaa is considered to be a top-quality preferred stock. This rating indicates good asset protection and the least risk of dividend impairment within the universe of preferred stocks.
aa: An issue which is rated aa is considered a high-grade preferred stock. This rating indicates that there is reasonable assurance that earnings and asset protection will remain relatively well maintained in the foreseeable future.
a: An issue which is rated a is considered to be an upper medium grade preferred stock. While risks are judged to be somewhat greater than in the aaa and aa classifications, earnings and asset protection are, nevertheless expected to be maintained at adequate levels.
baa: An issue which is rated baa is considered to be medium grade, neither highly protected nor poorly secured. Earnings and asset protection appear adequate at present but may be questionable over any great length of time.
ba: an issue which is rated ba is considered to have speculative elements and its future cannot be considered well assured. Earnings and asset protection may be very moderate and not well safeguarded during adverse periods. Uncertainty of position characterizes preferred stocks in this class.
B-2
b: An issue which is rated b generally lacks the characteristics of a desirable investment. Assurance of dividend payments and maintenance of other terms of the issue over any long period of time may be small.
caa: An issue which is rated caa is likely to be in arrears on dividend payments. This rating designation does not purport to indicate the future status of payment.
ca: An issue which is rated ca is speculative in a high degree and is likely to be in arrears on dividends with little likelihood of eventual payment.
c: This is the lowest rated class of preferred of preference stock. Issues so rated can be regarded as having extremely poor prospects of ever attaining any real investment standing.
Note: Moody's may apply numerical modifiers 1, 2 and 3 in each rating classification from "aa" through "b" in its preferred stock rating system. The modifier 1 indicated that the security ranks in the higher end of its generic rating category; the modifier 2 indicates a mid-range ranking; and the modifier 3 indicates that the issue ranks in the lower end of its generic rating category.
V. Excerpts from Standard & Poor's Ratings Services' Preferred Stock Ratings:
AAA: This is the highest rating that may be assigned by S&P's to a preferred stock issue and indicates an extremely strong capacity to pay the preferred stock obligations.
AA: A preferred stock issue rated AA also qualifies as a high quality fixed-income security. The capacity to pay preferred stock obligations is very strong, although not as overwhelming as for issues rated AAA.
A: An issue rated A is backed by a sound capacity to pay the preferred stock obligations, although it is somewhat more susceptible to the adverse effect of the changes in circumstances and economic conditions.
BBB: An issue rated BBB is regarded as backed by an adequate capacity to pay the preferred stock obligations. Whereas it normally exhibits adequate protection parameter, adverse economic conditions or changing circumstances are more likely to lead to a weakened capacity to make payments for a preferred stock in this category than for issues in the A category.
BB, B, CCC: Preferred stock rated BB, B, and CCC are regarded, on balance, as predominantly speculative with respect to the issuer's capacity to pay preferred stock obligations. Bb indicates the lowest degree of speculation and CCC the highest degree of speculation. While such issues will likely have some quality and protective characteristics, these are outweighed by large uncertainties of major risk exposures to adverse conditions.
CC: The rating CC is reserved for a preferred stock in arrears on dividends or sinking fund payments but that is currently paying.
C: A preferred stock rated C is a non-paying issue.
D: A preferred stock rated D is a non-paying issue with the issuer in default on debt instruments.
Plus (+) or Minus (-): The ratings from AA for CCC may be modified by the addition of a plus or minus sign to show relative standing within the major rating categories.
VI. Excerpts from Fitch, Inc's Preferred Stock Ratings:
AAA: These preferred stocks are considered to be investment grade and of the highest credit quality. The obligor has an exceptionally strong ability to pay, which is unlikely to be affected by reasonably foreseeable events.
AA: These preferred stocks are considered to be investment grade and of very high credit quality. The obligor's ability to pay is very strong, although not quite as strong as preferred stocks rated "AAA".
A: These preferred stocks are considered to be investment grade and of high credit quality. The obligor's ability to pay is considered to be strong, but may be more vulnerable to adverse changes in economic conditions and circumstances than preferred stocks with higher ratings.
BBB: These preferred stocks are considered to be investment grade and of satisfactory credit quality. The obligor's ability to pay interest and repay principal is considered to be adequate. Adverse changes in economic
B-3
conditions and circumstances, however, are more likely to have adverse impact on these preferred stocks, and therefore, impair timely payment. The likelihood that the ratings of these preferred stocks will fall below investment grade is higher than for preferred stocks with higher ratings.
BB: These preferred stocks are considered speculative. The obligor's ability to pay may be affected over time by adverse economic changes. However, business and financial alternatives can be identified that could assist the obligor in satisfying its dividend payment requirements.
B: These preferred stocks are considered highly speculative. While preferred in this class are currently meeting dividend payment requirements, the probability of continued timely payment reflects the obligor's limited margin of safety and the need for reasonable business and economic activity throughout the life of the issue.
CCC: These preferred stocks have certain identifiable characteristics which, if not remedied, may lead to non-payment. The ability to meet obligations requires an advantageous business and economic environment.
CC: These preferred stocks are minimally protected. Non-payment seems probable over time.
C: These preferred stocks are in imminent non-payment.
DDD, DD AND D: These preferred stocks are in non-payment. Such preferred stocks are extremely speculative and should be valued on the basis of their ultimate recovery value in liquidation or reorganization of the obligor. DDD represents the highest potential for recovery and D represents the lowest potential for recovery.
PLUS (+) OR MINUS (-): The ratings from AA to C may be modified by the addition of a plus or minus sign to indicate the relative position of a credit within the rating category.
B-4
EVERY SHAREHOLDER’S VOTE IS IMPORTANT
| EASY VOTING OPTIONS: |
| |
| 
| VOTE ON THE INTERNET Log on to: www.proxy-direct.com Follow the on-screen instructions available 24 hours |
| | |
| 
| VOTE BY TELEPHONE Call 1-866-298-8476 Follow the recorded instructions available 24 hours |
| | |
| 
| VOTE BY MAIL Vote, sign and date your Voting Instruction Card and return it in the postage-paid envelope |
YOU MAY RECEIVE MULTIPLE PROXY KITS IN SEPARATE ENVELOPES OR SEVERAL CARDS WITHIN ONE ENVELOPE. IT IS IMPORTANT THAT YOU RECORD A SEPARATE VOTE FOR EACH VOTING INSTRUCTION CARD.
Please detach at perforation before mailing.
VOTING INSTRUCTION CARD | MORGAN STANLEY VARIABLE INVESTMENT SERIES | VOTING INSTRUCTION CARD |
| STRATEGIST PORTFOLIO | |
| NOTICE OF SPECIAL MEETING OF SHAREHOLDERS | |
| TO BE HELD ON FEBRUARY 21, 2013 | |
[INSURANCE COMPANY NAME DROP-IN]
This Instruction Card is solicited by the above named insurance company seeking voting instructions with respect to shares of the Morgan Stanley Variable Investment Series—Strategist Portfolio (the “Acquired Fund”), for which it is the record or beneficial owner on your behalf.
The undersigned contract/policy owner hereby instructs that the votes attributable to the undersigned’s shares with respect to the Acquired Fund be cast as directed on the reverse side at the Special Meeting of Shareholders to be held at 522 Fifth Avenue, 3rd Floor, New York, New York 10036 in Conference Room A, on February 21, 2013 at 9:00 a.m., New York Time, and at any adjournment or postponement thereof (the “Meeting”). The undersigned, by completing this Instruction Card, does hereby authorize the above named insurance company to exercise its discretion in voting upon such other business as may properly come before the Meeting or any adjournment or postponement thereof.
The Voting Instruction Card, when properly executed, will be voted in the manner directed herein by the undersigned. If no direction is made, the votes attributable to this Voting Instruction Card will be voted FOR the proposal listed on the reverse side. Shares of the Acquired Fund for which no instructions are received will be voted by in the same proportion as votes for which instructions are received for the Acquired Fund.
| VOTE VIA THE INTERNET: www.proxy-direct.com |
| VOTE VIA THE TELEPHONE: 1-866-298-8476 |
| |
| | | |
| Note: Please sign exactly as your name appears on this voting instruction card. All joint owners should sign. When signing as executor, administrator, attorney, trustee or guardian or as custodian for a minor please sign full title as such. If a corporation, please sign in full corporate name and indicate the signer’s office or position held. If a partner, sign in the partnership name. |
| |
| Signature |
| |
| Signature (if held jointly) |
| |
| Date | STP_24139_VI_103112 |
| | | | |
EVERY SHAREHOLDER’S VOTE IS IMPORTANT
Important Notice Regarding the Availability of Proxy Materials for the
Shareholder Meeting to Be Held on February 21, 2013.
The Proxy Statement for this meeting is available at: https://www.proxy-direct.com/mor-24139
Please detach at perforation before mailing.
THE BOARD RECOMMENDS THAT YOU CAST YOUR VOTE “FOR” THE PROPOSAL AS DESCRIBED IN THE PROXY STATEMENT.
TO VOTE, MARK BLOCKS BELOW IN BLUE OR BLACK INK AS IN THIS EXAMPLE: | 
|
o To vote in accordance with the Board recommendations mark this box. No other vote is necessary. |
| | | | FOR | AGAINST | ABSTAIN |
| 1. | To consider and vote upon a proposal to approve the actions and transactions described in that certain Agreement and Plan of Reorganization, dated September 28, 2012, between Morgan Stanley Variable Investment Series, on behalf of the Strategist Portfolio (the “Acquired Fund”), and The Universal Institutional Funds, Inc., on behalf of the Global Tactical Asset Allocation Portfolio (the “Acquiring Fund”), pursuant to which substantially all of the assets and liabilities of the Acquired Fund will be transferred to the Acquiring Fund in exchange for shares of the corresponding class of the Acquiring Fund and pursuant to which the Acquired Fund will be liquidated and terminated. | | o | o | o |
| | | | |
| 2. | To act upon such other matters as may properly come before the Meeting. | | |
PLEASE VOTE, SIGN AND DATE THIS VOTING INSTRUCTION CARD AND RETURN IT PROMPTLY IN THE ENCLOSED ENVELOPE.
STP_24139_VI_103112
PART C. OTHER INFORMATION
ITEM 15. INDEMNIFICATION
The response to this item is incorporated herein by reference to Exhibits 1 and 2 under Item 16 below and by reference to Item 30 of the Company’s Post-Effective Amendment No. 48 to its Registration Statement on Form N-1A dated April 30, 2012 (File Nos. 333-03013; 811-07607).
ITEM 16. EXHIBITS
(1) (a) | | Articles of Restatement, dated February 20, 2007, are incorporated by reference to Exhibit (a) of Post-Effective Amendment No. 31 to the Registration Statement on Form N-1A, filed on April 13, 2007. |
| | |
(b) | | Articles Supplementary (terminating the Money Market Portfolio and the Technology Portfolio), dated April 10, 2008, are incorporated by reference to Exhibit (a)(2) to Post-Effective Amendment No. 32 to the Registration Statement on Form N-1A, filed on April 11, 2008. |
| | |
(c) | | Articles of Amendment (renaming the Fixed Income Portfolio), dated April 10, 2008, are incorporated by reference to Exhibit (a)(3) to Post-Effective Amendment No. 32 to the Registration Statement on Form N-1A, filed on April 11, 2008. |
| | |
(d) | | Articles of Amendment (renaming the Equity Growth Portfolio), dated April 10, 2008, are incorporated by reference to Exhibit (a)(4) to Post-Effective Amendment No. 32 to the Registration Statement on Form N-1A, filed on April 11, 2008. |
| | |
(e) | | Articles Supplementary (terminating the International Fixed Income Portfolio, Balanced Portfolio, Multi-Asset Class Portfolio, Core Equity Portfolio, Asian Equity Portfolio, Targeted Duration Portfolio and Investment Grade Fixed Income Portfolio), dated May 27, 2009, are incorporated by reference to Exhibit (a)(5) to Post-Effective Amendment No. 34 to the Registration Statement on Form N-1A, filed on February 5, 2010. |
| | |
(f) | | Certificate of Correction (correcting typographical errors, errors of transcription or other errors with respect to the Equity Growth Portfolio and Capital Growth Portfolio), dated July 28, 2010, is incorporated by reference to Exhibit (a)(6) to Post-Effective Amendment No. 41 to the Registration Statement on Form N-1A, filed on October 29, 2010. |
| | |
(g) | | Articles Supplementary (terminating the Equity and Income Portfolio, Global Value Equity Portfolio, High Yield Portfolio, International Growth Equity Portfolio, U.S. Mid Cap Value Portfolio and Value Portfolio), dated July 28, 2010, are incorporated by reference to Exhibit (a)(7) to Post-Effective Amendment No. 41 to the Registration Statement on Form N-1A, filed on October 29, 2010. |
| | |
(h) | | Articles of Amendment (renaming the International Magnum Portfolio), dated October 13, 2010, are incorporated by reference to Exhibit (a)(8) to Post-Effective Amendment No. 41 to the Registration Statement on Form N-1A, filed on October 29, 2010. |
| | |
(i) | | Articles of Amendment (renaming the Capital Growth Portfolio), dated April 5, 2011, are incorporated by reference to Exhibit (a)(9) to Post-Effective Amendment No. 46 to the Registration Statement on Form N-1A, filed on April 13, 2011. |
| | |
(2) | | Amended and Restated Investment Advisory Agreement between Registrant and Morgan Stanley Investment Management Inc., dated June 30, 2009, is incorporated by reference to Exhibit (d)(1) to Post-Effective Amendment No. 41 to the Registration Statement on Form N-1A, filed on October 29, 2010. |
| | |
(3) | | Not applicable. |
| | |
(4) | | Copy of Agreement and Plan of Reorganization (filed herewith as Exhibit A to the Proxy Statement and Prospectus). |
| | |
(5) | | Not applicable. |
| | |
(6) (a) | | Amended and Restated Investment Advisory Agreement between Registrant and Morgan Stanley Investment Management Inc., dated June 30, 2009, is incorporated by reference to Exhibit (d)(1) to Post-Effective Amendment |
| | No. 41 to the Registration Statement on Form N-1A, filed on October 29, 2010. |
| | |
(b) | | Amended and Restated Sub-Advisory Agreement between Morgan Stanley Investment Management Inc. and Morgan Stanley Investment Management Limited (relating to the Emerging Markets Equity Portfolio, Global Franchise Portfolio, Global Real Estate Portfolio and Global Tactical Asset Allocation Portfolio), dated as of June 30, 2009, is incorporated by reference to Exhibit (d)(2) to Post-Effective Amendment No. 41 to the Registration Statement on Form N-1A, filed on October 29, 2010. |
| | |
(c) | | Amended and Restated Sub-Advisory Agreement between Morgan Stanley Investment Management Inc. and Morgan Stanley Investment Management Company (relating to the Emerging Markets Equity Portfolio, Global Franchise Portfolio, Global Real Estate Portfolio and Global Tactical Asset Allocation Portfolio), dated as of June 30, 2009, is incorporated by reference to Exhibit (d)(3) to Post-Effective Amendment No. 41 to the Registration Statement on Form N-1A, filed on October 29, 2010. |
| | |
(7) (a) | | Distribution Agreement between Registrant and Morgan Stanley Distribution, Inc., dated as of April 29, 2005, is incorporated by reference to Exhibit (e) to Post-Effective Amendment No. 27 to the Registration Statement on Form N-1A, filed on December 16, 2005. |
| | |
(b) | | Form of Participation Agreement is incorporated by reference to Exhibit (e)(2) to Post-Effective Amendment No. 33 to the Registration Statement on Form N-1A, filed on April 7, 2009. |
| | |
(8) | | Not applicable. |
| | |
(9) | | Custody Agreement between Registrant and State Street Bank and Trust Company, is incorporated by reference to Exhibit (g) to Post-Effective Amendment No. 109 to the Registration Statement on Form N-1A of Morgan Stanley Institutional Fund, Inc. filed on June 26, 2012. |
| | |
(10) (a) | | Amended and Restated 12b-1 Distribution Plan with respect to “Class II” shares of each Portfolio, are incorporated by reference to Exhibit (m) to Post-Effective Amendment No. 27 to the Registration Statement on Form N-1A, filed on December 16, 2005. |
| | |
(b) | | 18f-3 Multi-Class Plan, is incorporated by reference to Exhibit (o) to Post-Effective Amendment No. 25 to the Registration Statement on Form N-1A, filed on February 17, 2005. |
| | |
(11) (a) | | Opinion and Consent of Dechert LLP, is filed herewith. |
| | |
(b) | | Opinion of Ballard Spahr LLP, is filed herewith. |
| | |
(12) | | Form of opinion of Dechert LLP (as to tax matters), is filed herewith. |
| | |
(13) (a) | | Administration Agreement between Registrant and Morgan Stanley Investment Management Inc. is incorporated by reference to Exhibit h(1) to Post-Effective Amendment No. 8 to the Registration Statement on Form N-1A, filed on April 1, 1999. |
| | |
(b) | | Schedule A to Administration Agreement between Registrant and Morgan Stanley Investment Management Inc., is incorporated by reference to Exhibit (h)(2) to Post-Effective Amendment No. 41 to the Registration Statement on Form N-1A, filed on October 29, 2010. |
| | |
(14) | | Consent of Ernst & Young LLP (with respect to Form N-14), is filed herewith. |
| | |
(15) | | Not applicable. |
(16) | | Powers of Attorney of Directors, dated October 25, 2012, are incorporated herein by reference to Exhibit (16) to the Registration Statement on Form N-14 filed on October 31, 2012. |
ITEM 17. UNDERTAKINGS
(1) The undersigned registrant agrees that prior to any public reoffering of the securities registered through the use of a prospectus which is a part of this registration statement on Form N-14 by any person or party who is deemed to be an underwriter within the meaning of Rule 145(c) of the Securities Act, the reoffering prospectus will contain the information called for by the applicable registration form for the reofferings by persons who may be deemed underwriters, in addition to the information called for by the other items of the applicable form.
(2) The undersigned registrant agrees that every prospectus that is filed under paragraph (1) above will be filed as a part of an amendment to this registration statement on Form N-14 and will not be used until the amendment is effective, and that, in determining any liability under the Securities Act, each post-effective amendment shall be deemed to be a new registration statement for the securities offered therein, and the offering of the securities at that time shall be deemed to be the initial bona fide offering of them.
(3) The undersigned registrant undertakes to file a post-effective amendment to this registration statement upon the closing of the Reorganizations described in this registration statement that contains opinions of counsel supporting the tax matters discussed in this registration statement.
SIGNATURES
As required by the Securities Act of 1933, this registration statement has been signed on behalf of the registrant, in the City of New York and State of New York on this 16th day of January, 2013.
| THE UNIVERSAL INSTITUTIONAL FUNDS, INC. |
| | |
| By: | /s/ Arthur Lev |
| | Arthur Lev |
| | President and Principal Executive Officer |
As required by the Securities Act of 1933, this registration statement has been signed below by the following persons in the capacities and on the dates indicated.
Signatures | | Title | | Date |
(1) Principal Executive Officer | | President and Principal Executive Officer | | |
| | | | |
By: | /s/ Arthur Lev | | | | January 16, 2013 |
| Arthur Lev | | | | |
| | | | |
(2) Principal Financial Officer | | Principal Financial Officer | | |
| | | | |
By: | /s/ Francis J. Smith | | | | January 16, 2013 |
| Francis J. Smith | | | | |
| | | | |
(3) Majority of the Directors | | | | |
| | | | |
INDEPENDENT DIRECTORS | | | | |
Frank L. Bowman | | Michael F. Klein | | |
Michael Bozic | | Michael E. Nugent | | |
Kathleen A. Dennis | | W. Allen Reed | | |
Dr. Manuel H. Johnson | | Fergus Reid | | |
Joseph J. Kearns | | | | |
| | | | |
By: | /s/ Carl Frischling | | | | January 16, 2013 |
| Carl Frischling | | | | |
| Attorney-in-Fact for the Independent Directors | | | | |
| | | | |
INTERESTED DIRECTOR | | | | |
James F. Higgins | | | | |
| | | | |
By: | /s/ Stefanie V. Chang Yu | | | | January 16, 2013 |
| Stefanie V. Chang Yu | | | | |
| Attorney-in-Fact for the Interested Director | | | | |
EXHIBIT INDEX
(11) | (a) Opinion and Consent of Dechert LLP. |
| (b) Opinion of Ballard Spahr LLP. |
(12) | Form of opinion of Dechert LLP (as to tax matters). |
(14) | Consent of Ernst & Young LLP (with respect to Form N-14). |