As filed with the Securities and Exchange Commission on January 14, 2014
Registration No. 333-192396
UNITED STATES
SECURITIES AND EXCHANGE COMMISSION
Washington, DC 20549
FORM N-14
| | REGISTRATION STATEMENT | | x |
| | UNDER THE SECURITIES ACT OF 1933 | | |
| | | | |
| | Pre-Effective Amendment No. 1 | | x |
| | | | |
| | Post-Effective Amendment No. | | o |
| | (Check appropriate box or boxes) | | |
The Universal Institutional Funds, Inc.
(Exact name of Registrant as Specified in its Charter)
522 Fifth Avenue
New York, New York 10036
(Address, Including Zip Code, and Telephone Number, Including Area Code, of Registrant’s Principal Executive Offices)
Joseph C. Benedetti, Esq.
Morgan Stanley Investment Management Inc.
522 Fifth Avenue
New York, New York 10036
(Name and Address of Agent for Service)
Copy to:
Carl Frischling, Esq.
Kramer Levin Naftalis & Frankel LLP
1177 Avenue of the Americas
New York, New York 10036 | | Stuart M. Strauss, Esq.
Dechert LLP
1095 Avenue of the Americas
New York, New York 10036 |
Approximate Date of Proposed Public Offering: As soon as practicable after the effective date of this Registration Statement.
No filing fee is required because an indefinite number of common shares of beneficial interest of The Universal Institutional Funds, Inc. have previously been registered pursuant to Section 24f-2 under the Investment Company Act of 1940.
The Registrant hereby amends this Registration Statement on such date or dates as may be necessary to delay its effective date until the Registrant shall file a further amendment which specifically states that this Registration Statement shall thereafter become effective in accordance with Section 8(a) of the Securities Act of 1933 or until this Registration Statement shall become effective on such date as the Commission, acting pursuant to said Section 8(a), may determine.
Morgan Stanley Select Dimensions Investment Series
Morgan Stanley Variable Investment Series
522 Fifth Avenue
New York, NY 10036
Dear Variable Life Insurance and Variable Annuity Contract Owners:
Morgan Stanley Select Dimensions Investment Series and Morgan Stanley Variable Investment Series (each, a "Trust" and, together, the "Trusts") will hold a joint special meeting of shareholders (the "Meeting") of the Morgan Stanley Select Dimensions Investment Series—Global Infrastructure Portfolio and the Morgan Stanley Variable Investment Series—Global Infrastructure Portfolio (each an "Acquired Fund" and, together, the "Acquired Funds") on March 17, 2014 at 9:00 a.m., New York time, at the offices of Morgan Stanley Investment Management Inc., Conference Room C, 3rd Floor, 522 Fifth Avenue, New York, NY 10036. At the meeting, shareholders of each Acquired Fund will be asked to consider and vote upon a proposal to approve the actions and transactions described in the applicable Agreement and Plan of Reorganization, each dated October 3, 2013 (each, a "Reorganization Agreement") between the respective Trust, on behalf of such Acquired Fund, as applicable, and The Universal Institutional Funds, Inc., on behalf of the Global Infrastructure Portfolio (the "Acquiring Fund"). Pursuant to each Reorganization Agreement, substantially all of the assets and the liabilities of the applicable Acquired Fund will be transferred to the Acquiring Fund in exchange for shares of the Acquiring Fund of the Class described in the accompanying Joint Proxy Statement and Prospectus and pursuant to which such Acquired Fund will be liquidated and terminated (the "Reorganizations"). The Reorganization of each Acquired Fund into the Acquiring Fund is not contingent upon the shareholders of the other Acquired Fund approving its Reorganization. A formal Notice of Joint Special Meeting of Shareholders appears on the next page, followed by the Joint Proxy Statement and Prospectus, which explains in more detail the proposals to be considered.
Like the Acquired Funds, the Acquiring Fund will be offered to certain life insurance companies in connection with particular variable life insurance and/or variable annuity contracts they issue (each an "Insurance Company" and, collectively, the "Insurance Companies"). The Acquiring Fund will also be offered to other entities under qualified pension and retirement plans. Please review the enclosed Joint Proxy Statement and Prospectus for a more detailed description of the Reorganizations and the specific reasons that the Reorganizations are being proposed.
If you are an owner of a variable life insurance and/or variable annuity contract issued by a separate account of an Insurance Company, you are not a shareholder of an Acquired Fund, but you have the right to instruct your Insurance Company on how to vote at the Meeting. You may give voting instructions for the number of shares of an Acquired Fund attributable to your variable life insurance policy or variable annuity contract as of the close of business on December 23, 2013.
The Board of Trustees of each Acquired Fund recommends that you give voting instructions in favor of the applicable Reorganization. In order for shares to be voted at the Meeting based on your instructions, we urge you to read the Joint Proxy Statement and Prospectus and then complete and mail your Voting Instruction Form in the enclosed postage-paid envelope. To give voting instructions by touch-tone telephone or via the Internet, follow the instructions on the Voting Instruction Form.
Please take a few moments to review the details of the proposals. If you have any questions regarding the Reorganizations, please feel free to call the contact number listed in the enclosed Joint Proxy Statement and Prospectus. We urge you to vote at your earliest convenience.
We appreciate your participation and prompt response in this matter and thank you for your continued support.
Very truly yours,
John H. Gernon
President and Principal Executive Officer
January [ ], 2014
MORGAN STANLEY SELECT DIMENSIONS INVESTMENT SERIES—GLOBAL INFRASTRUCTURE PORTFOLIO
MORGAN STANLEY VARIABLE INVESTMENT SERIES—GLOBAL INFRASTRUCTURE PORTFOLIO
522 Fifth Avenue
New York, NY 10036
(800) 548-7786
NOTICE OF JOINT SPECIAL MEETING OF SHAREHOLDERS
TO BE HELD MARCH 17, 2014
To the shareholders of the Morgan Stanley Select Dimensions Investment Series—Global Infrastructure Portfolio and the Morgan Stanley Variable Investment Series—Global Infrastructure Portfolio:
Notice is hereby given of a Joint Special Meeting of Shareholders (the "Meeting") of the Morgan Stanley Select Dimensions Investment Series—Global Infrastructure Portfolio ("SD Global Infrastructure") and the Morgan Stanley Variable Investment Series—Global Infrastructure Portfolio ("VIS Global Infrastructure") (each an "Acquired Fund" and, together, the "Acquired Funds"), existing series of Morgan Stanley Select Dimensions Investment Series ("Select Dimensions") and Morgan Stanley Variable Investment Series ("Variable Investment"), respectively (each, a "Trust" and, together, the "Trusts"), to be held in Conference Room C, 3rd Floor, 522 Fifth Avenue, New York, NY 10036, at 9:00 a.m., New York time, on March 17, 2014, and any adjournments or postponements thereof, for the following purposes:
1. With respect to shareholders of SD Global Infrastructure, to consider and vote upon a proposal to approve the actions and transactions described in that certain Agreement and Plan of Reorganization, dated October 3, 2013 (the "SD Reorganization Agreement"), between Select Dimensions, on behalf of SD Global Infrastructure, and The Universal Institutional Funds, Inc. (the "Company"), on behalf of the Global Infrastructure Portfolio ("UIF Global Infrastructure" or the "Acquiring Fund"), pursuant to which substantially all of the assets and liabilities of SD Global Infrastructure will be transferred to UIF Global Infrastructure in exchange for shares of UIF Global Infrastructure of the Class described in the accompanying Joint Proxy Statement and Prospectus and pursuant to which SD Global Infrastructure will be liquidated and terminated (the "SD Reorganization"). As a result of this transaction, shareholders of SD Global Infrastructure will become shareholders of UIF Global Infrastructure receiving shares of UIF Global Infrastructure with a value equal to the aggregate net asset value ("NAV") of their shares of SD Global Infrastructure held immediately prior to the SD Reorganization;
2. With respect to shareholders of VIS Global Infrastructure, to consider and vote upon a proposal to approve the actions and transactions described in that certain Agreement and Plan of Reorganization, dated October 3, 2013 (the "Variable Reorganization Agreement"), between Variable Investment, on behalf of VIS Global Infrastructure, and the Company, on behalf of UIF Global Infrastructure, pursuant to which substantially all of the assets and liabilities of VIS Global Infrastructure will be transferred to UIF Global Infrastructure in exchange for shares of UIF Global Infrastructure of the Class described in the accompanying Joint Proxy Statement and Prospectus and pursuant to which VIS Global Infrastructure will be liquidated and terminated (the "Variable Reorganization"). As a result of this transaction, shareholders of VIS Global Infrastructure will become shareholders of UIF Global Infrastructure receiving shares of UIF Global Infrastructure with a value equal to the aggregate NAV of their shares of VIS Global Infrastructure held immediately prior to the Variable Reorganization; and
3. To act upon other matters as may properly come before the Meeting.
The Acquired Funds, together with the Acquiring Fund, are referred to herein as the "Funds." The SD Reorganization Agreement and the Variable Reorganization Agreement are each referred to herein as a "Reorganization Agreement," and together as the "Reorganization Agreements." The SD Reorganization and the Variable Reorganization are each referred to herein as a "Reorganization," and together as the "Reorganizations."
The Reorganizations are more fully described in the accompanying Joint Proxy Statement and Prospectus and a form of each Reorganization Agreement is attached as Exhibits A-1 and A-2 thereto. Shareholders of record of the Acquired Funds as of the close of business on December 23, 2013 are entitled to notice of, and to vote at, the Meeting and any adjournments or postponements thereof. The Board of Trustees of each Acquired Fund recommends that shareholders of the applicable Acquired Fund vote in favor of the respective Reorganization.
By Order of the Board of Trustees,
Mary E. Mullin
Secretary
January [ ], 2014
THE UNIVERSAL INSTITUTIONAL FUNDS, INC.
GLOBAL INFRASTRUCTURE PORTFOLIO
522 Fifth Avenue
New York, NY 10036
(800) 548-7786
This Joint Proxy Statement and Prospectus is being furnished to shareholders ("Shareholders") of the Morgan Stanley Select Dimensions Investment Series—Global Infrastructure Portfolio ("SD Global Infrastructure") and Morgan Stanley Variable Investment Series—Global Infrastructure Portfolio ("VIS Global Infrastructure") (each, an "Acquired Fund" and, together, the "Acquired Funds"), existing series of Morgan Stanley Select Dimensions Investment Series ("Select Dimensions") and Morgan Stanley Variable Investment Series ("Variable Investment") (each, a "Trust" and, together, the "Trusts"), respectively, in connection with a Joint Special Meeting of Shareholders (the "Meeting") to be held in Conference Room C, 3rd Floor, 522 Fifth Avenue, New York, NY 10036, at 9:00 a.m., New York time, on March 17, 2014, and any adjournments or postponements thereof, for the following purposes:
1. With respect to Shareholders of SD Global Infrastructure, to consider and vote upon a proposal to approve the actions and transactions described in that certain Agreement and Plan of Reorganization, dated October 3, 2013 (the "SD Reorganization Agreement"), between Select Dimensions, on behalf of SD Global Infrastructure, and The Universal Institutional Funds, Inc. (the "Company"), on behalf of the Global Infrastructure Portfolio ("UIF Global Infrastructure" or the "Acquiring Fund"), pursuant to which substantially all of the assets and liabilities of SD Global Infrastructure will be transferred to UIF Global Infrastructure in exchange for shares of UIF Global Infrastructure of the Class described in this Joint Proxy Statement and Prospectus and pursuant to which SD Global Infrastructure will be liquidated and terminated (the "SD Reorganization"). As a result of this transaction, shareholders of SD Global Infrastructure will become shareholders of UIF Global Infrastructure receiving shares of UIF Global Infrastructure with a value equal to the aggregate net asset value ("NAV") of their shares of SD Global Infrastructure held immediately prior to the SD Reorganization;
2. With respect to Shareholders of VIS Global Infrastructure, to consider and vote upon a proposal to approve the actions and transactions described in that certain Agreement and Plan of Reorganization, dated October 3, 2013 (the "Variable Reorganization Agreement"), between Variable Investment, on behalf of VIS Global Infrastructure, and the Company, on behalf of UIF Global Infrastructure, pursuant to which substantially all of the assets and liabilities of VIS Global Infrastructure will be transferred to UIF Global Infrastructure in exchange for shares of UIF Global Infrastructure of the Class described in this Joint Proxy Statement and Prospectus and pursuant to which VIS Global Infrastructure will be liquidated and terminated (the "Variable Reorganization"). As a result of this transaction, Shareholders of VIS Global Infrastructure will become Shareholders of UIF Global Infrastructure receiving shares of UIF Global Infrastructure with a value equal to the aggregate NAV of their shares of VIS Global Infrastructure held immediately prior to the Variable Reorganization; and
3. To act upon such other matters as may properly come before the Meeting.
The Acquired Funds, together with the Acquiring Fund, are referred to herein as the "Funds." The SD Reorganization Agreement and the Variable Reorganization Agreement are each referred to herein as a "Reorganization Agreement," and together as the "Reorganization Agreements." The SD Reorganization and the Variable Reorganization are each referred to herein as a "Reorganization," and together as the "Reorganizations."
The terms and conditions of the transaction are more fully described in this Joint Proxy Statement and Prospectus and in the Form of Agreement and Plan of Reorganization for each Reorganization, copies of which are attached hereto as Exhibits A-1 and A-2. The address and telephone number of each Acquired Fund is the same as that of the Acquiring Fund set forth above. This Joint Proxy Statement also constitutes a Prospectus of the Acquiring Fund, filed by the Company with the Securities and Exchange Commission (the "Commission") as part of the Company's Registration Statement on Form N-14 (the "Registration Statement").
The Funds are each series of registered open-end management investment companies. The Acquiring Fund's investment objective of seeking to provide both capital appreciation and current income is the same as each Acquired Fund's investment objective. Shares of each Acquired Fund are offered only to certain life insurance companies in
connection with particular variable life insurance and/or variable annuity contracts they issue (each an "Insurance Company" and, collectively, the "Insurance Companies"). Each Insurance Company is the legal owner of shares of an Acquired Fund and has the right to vote those shares at the Meeting. Although being an owner of a variable life insurance or variable annuity contract (a "Contract") issued by separate accounts of the Insurance Companies does not make you a shareholder of an Acquired Fund, you have the right to instruct your Insurance Company on how to vote at the Meeting.
This Joint Proxy Statement and Prospectus sets forth concisely information about the Acquiring Fund that Shareholders of an Acquired Fund should know before voting on the applicable Reorganization Agreement. A copy of the Prospectuses for the Acquiring Fund, each dated December 18, 2013, as may be amended and supplemented from time to time, are attached as Exhibit B, which Prospectuses form a part of Post-Effective Amendment No. 53 to the Company's Registration Statement on Form N-1A (File Nos. 333-03013; 811-07607), and incorporated herein by reference. Also incorporated herein by reference are the Prospectuses of the Acquired Funds, each dated April 30, 2013, as may be amended and supplemented from time to time, which Prospectuses form a part of Post-Effective Amendment No. 34 to the Select Dimensions Registration Statement on Form N-1A (File Nos. 33-54047; 811-07185) and of Post-Effective Amendment No. 52 to the Variable Investment Registration Statement on Form N-1A (File Nos. 2-82510; 811-3692), as applicable.
In addition, also incorporated by reference are the Annual and Semi-Annual Reports of each Trust relating to the respective Acquired Fund for the fiscal year ended December 31, 2012 and the six-month period ended June 30, 2013 (File Nos. 811-07185 (Select Dimensions) and 811-3692 (Variable Investment)). A Statement of Additional Information relating to the Reorganizations, described in this Joint Proxy Statement and Prospectus, dated January [ ], 2014, has been filed with the Commission and is also incorporated herein by reference. Such documents are available upon request and without charge by calling (800) 548-7786 or by visiting the Commission's website at www.sec.gov.
Shareholders are advised to read and retain this Joint Proxy Statement and Prospectus for future reference.
The Securities and Exchange Commission has not approved or disapproved these securities or passed upon the adequacy of this Prospectus. Any representation to the contrary is a criminal offense.
This Joint Proxy Statement and Prospectus is dated January [ ], 2014.
TABLE OF CONTENTS
JOINT PROXY STATEMENT AND PROSPECTUS
| | | Page | |
Synopsis | | | 1 | | |
General | | | 1 | | |
The Reorganizations | | | 1 | | |
Fee Tables | | | 2 | | |
Annual Fund Operating Expenses | | | 5 | | |
Portfolio Turnover | | | 5 | | |
Tax Consequences of the Reorganizations | | | 5 | | |
Comparison of the Acquired Funds and Acquiring Fund | | | 5 | | |
Principal Risk Factors | | | 8 | | |
Voting Information | | | 10 | | |
General | | | 10 | | |
Record Date | | | 11 | | |
Solicitation of Proxies and Voting Instructions | | | 11 | | |
Voting Procedures | | | 11 | | |
Quorum | | | 11 | | |
Adjournments; Other Business | | | 12 | | |
Expenses of Solicitation | | | 12 | | |
Vote Required | | | 12 | | |
Performance Information | | | 12 | | |
The Reorganizations | | | 15 | | |
The Board's Considerations | | | 15 | | |
The Reorganization Agreements | | | 17 | | |
Tax Aspects of the Reorganizations | | | 18 | | |
Description of Shares | | | 20 | | |
Capitalization Tables (unaudited) | | | 20 | | |
Appraisal Rights | | | 20 | | |
Comparison of Investment Objectives, Principal Policies and Restrictions | | | 21 | | |
Investment Objectives and Policies | | | 21 | | |
Investment Strategy | | | 21 | | |
Investment Restrictions | | | 22 | | |
Additional Information about the Acquiring Fund and the Acquired Funds | | | 23 | | |
General | | | 23 | | |
Rights of Acquired Fund Shareholders and Acquiring Fund Shareholders | | | 23 | | |
Financial Information | | | 24 | | |
Shareholder Proposals | | | 24 | | |
Management | | | 25 | | |
Description of Shares and Shareholder Inquiries | | | 25 | | |
Dividends, Distributions and Taxes | | | 25 | | |
Purchases and Redemptions | | | 25 | | |
Share Information | | | 26 | | |
Financial Statements And Experts | | | 27 | | |
Legal Matters | | | 27 | | |
Available Information | | | 27 | | |
Other Business | | | 27 | | |
| Exhibit A-1 – Agreement and Plan of Reorganization (SD Global Infrastructure) | | | A-1-1 | | |
| Exhibit A-2 – Agreement and Plan of Reorganization (VIS Global Infrastructure) | | | A-2-1 | | |
Exhibit B – Prospectuses of the Acquiring Fund dated December 18, 2013, as they may be amended
and supplemented from time to time | | | B-1 | | |
SYNOPSIS
The following is a synopsis of certain information contained in or incorporated by reference in this Joint Proxy Statement and Prospectus. This synopsis is only a summary and is qualified in its entirety by the more detailed information contained or incorporated by reference in this Joint Proxy Statement and Prospectus and the Reorganization Agreements. Shareholders should carefully review this Joint Proxy Statement and Prospectus and the Reorganization Agreements in their entirety and, in particular, the Acquiring Fund's Prospectuses, which are attached to this Joint Proxy Statement and Prospectus as Exhibit B and incorporated herein by reference.
General
This Joint Proxy Statement and Prospectus is being furnished to Shareholders of each Acquired Fund, each a series of an open-end management investment company, in connection with the solicitation by each Trust's Board of Trustees (each, a "Board" or "Board of Trustees"), on behalf of the Acquired Funds, of proxies ("Proxies") to be used at the Meeting to consider the Reorganizations. It is expected that the first mailing of this Joint Proxy Statement and Prospectus will be made on or about January 31, 2014.
Shareholders of each Acquired Fund will vote separately on the Reorganization for that Acquired Fund. Each Reorganization is not dependent on the approval of the other. Pursuant to each Reorganization, Class X Shareholders of each Acquired Fund will receive Class I shares of the Acquiring Fund, and Class Y Shareholders of each Acquired Fund will receive Class II shares of the Acquiring Fund. The shares to be issued by the Acquiring Fund in connection with the Reorganizations (the "Acquiring Fund Shares") will be issued at NAV without any sales charges. Further information relating to the Acquiring Fund is set forth herein and in the Acquiring Fund's current Prospectuses, each dated December 18, 2013 (the "Acquiring Fund's Prospectuses"), attached to this Joint Proxy Statement and Prospectus as Exhibit B and incorporated herein by reference.
The Board of Directors of the Company, on behalf of the Acquiring Fund (the "Board of Directors"), has authorized the issuance of the Acquiring Fund Shares to Shareholders of the Acquired Funds in connection with each Reorganization.
The information concerning the Acquired Funds contained herein has been supplied by the applicable Trust. The information concerning the Acquiring Fund contained herein has been supplied by the Company.
The Reorganizations
Each Reorganization is being proposed because the applicable Board has determined that such Reorganization is in the best interests of the respective Acquired Fund and its Shareholders. Although the Board of each Trust recommends that Shareholders approve the Reorganization of the applicable Acquired Fund into the Acquiring Fund, the approval of the Reorganization of one Acquired Fund is not conditioned upon the approval of the Reorganization of the other Acquired Fund. Accordingly, if Shareholders of one Acquired Fund approve its Reorganization, but Shareholders of the other Acquired Fund do not approve that Acquired Fund's Reorganization, it is expected that the Reorganization of the first Acquired Fund will take place as described in this Joint Proxy Statement and Prospectus.
Each Reorganization will allow the Shareholders of the applicable Acquired Fund to be invested in a fund that is managed according to similar investment objectives, strategies and restrictions. In addition, with respect to SD Global Infrastructure, the Reorganization is expected to result in lower (if both Reorganizations are approved) or the same (if only the SD Reorganization is approved) total operating expenses for Shareholders of SD Global Infrastructure and, with respect to VIS Global Infrastructure, the Reorganization is expected to result in the same total operating expenses for Shareholders of VIS Global Infrastructure, each as a result of proposed fee waivers and/or expense reimbursements instituted by Morgan Stanley Investment Management Inc. ("MSIM"), the Acquiring Fund's and Acquired Funds' adviser, and Morgan Stanley Distribution, Inc. ("Distributor"), the Acquiring Fund's and Acquired Funds' distributor. The proposed fee waivers and/or expense reimbursements will continue for at least two years from the date of the Reorganization(s) or until such time as the Company's Board of Directors acts to discontinue all or a portion of such waivers and/or reimbursements when it deems such action is appropriate.
1
Moreover, the Reorganizations will allow Shareholders of the Acquired Funds to be invested in a fund with greater future sales and asset growth potential and a wider distribution through the intermediary insurance channel than the Acquired Funds. There is no assurance that the proposed advisory fee waivers and/or expense reimbursements will continue and therefore the total expense ratio of the Class I and Class II shares of the Acquiring Fund may be higher in the future. See "The Reorganizations—The Board's Considerations."
Each Reorganization Agreement provides for the transfer of substantially all the assets and the liabilities of the applicable Acquired Fund to the Acquiring Fund in exchange for Acquiring Fund Shares. The aggregate NAV of the Acquiring Fund Shares issued in the exchange will equal the aggregate value of the net assets of an Acquired Fund received by the Acquiring Fund. On or after the closing date scheduled for each Reorganization (the "Closing Date"), the applicable Acquired Fund will distribute the Acquiring Fund Shares received by such Acquired Fund to its Shareholders as of the Valuation Date (as defined below) in complete liquidation of such Acquired Fund and, without further notice, the outstanding shares of such Acquired Fund held by the Shareholders will then be redeemed and canceled as permitted by the organizational documents of such Acquired Fund and applicable law. Each Acquired Fund thereafter will be terminated as a series of the applicable Trust. As a result of each Reorganization, each Shareholder will receive that number of full and fractional Acquiring Fund Shares equal in value to such shareholder's pro rata interest in the net assets of the applicable Acquired Fund transferred to the Acquiring Fund. Pursuant to each Reorganization, Class X Shareholders of the applicable Acquired Fund will receive Class I shares of the Acquiring Fund and Class Y Shareholders of the applicable Acquired Fund will receive Class II shares of the Acquiring Fund. The Board has determined that the interests of the Shareholders will not be diluted as a result of the Reorganizations. The "Valuation Date" is the third business day following the receipt of the requisite approval of a Reorganization Agreement by the Shareholders of the applicable Acquired Fund or at such time on such earlier or later date after such approval as may be mutually agreed upon in writing.
For the reasons set forth below under "The Reorganizations—The Boards' Considerations," the respective Board, including the Trustees who are not "interested persons" of the Acquired Funds ("Independent Board Members"), as that term is defined in the Investment Company Act of 1940, as amended (the "1940 Act"), have concluded that the Reorganizations are advisable and in the best interests of the applicable Acquired Fund and their Shareholders and recommends approval of the applicable Reorganization.
Fee Tables
The following tables briefly describe the annual Fund operating expenses that Shareholders of the Funds may pay if they buy and hold shares of the Funds. Total Annual Fund Operating Expenses in the tables below do not reflect the impact of any charges by your insurance company. If they did, Total Annual Fund Operating Expenses would be higher. Each Fund pays expenses for management of its assets, distribution of its shares and other services, and those expenses are reflected in the NAV per share of each Fund. These expenses are deducted from each respective Fund's assets and are based on actual expenses incurred by the Acquired Funds for their fiscal years ended December 31, 2012. The tables also set forth pro forma fees for the surviving combined fund (UIF Global Infrastructure) (the "Combined Fund") reflecting what the fee schedule would have been on December 31, 2012, if (i) both Reorganizations, (ii) only the Variable Reorganization; or (iii) only the SD Reorganization had been consummated twelve (12) months prior to that date.
Annual Fund Operating Expenses
(expenses that are deducted from Fund assets)
SD Global Infrastructure (Acquired Fund) | | Class X | | Class Y | |
Advisory Fee | | | 0.57 | % | | | 0.57 | % | |
Distribution and/or Shareholder Service (12b-1) Fee | | | None | | | | 0.25 | % | |
Other Expenses | | | 0.54 | % | | | 0.54 | % | |
Total Annual Fund Operating Expenses | | | 1.11 | % | | | 1.36 | % | |
2
VIS Global Infrastructure (Acquired Fund) | | Class X | | Class Y | |
Advisory Fee | | | 0.57 | % | | | 0.57 | % | |
Distribution and/or Shareholder Service (12b-1) Fee | | | None | | | | 0.25 | % | |
Other Expenses | | | 0.30 | % | | | 0.30 | % | |
Total Annual Fund Operating Expenses | | | 0.87 | % | | | 1.12 | % | |
UIF Global Infrastructure (Acquiring Fund) | | Class I | | Class II | |
Advisory Fee | | | 0.85 | % | | | 0.85 | % | |
Distribution (12b-1) Fee | | | None | | | | 0.35 | % | |
Other Expenses* | | | 0.50 | % | | | 0.50 | % | |
Total Annual Fund Operating Expenses† | | | 1.35 | % | | | 1.70 | % | |
Fee Waiver and/or Expense Reimbursement† | | | 0.24 | % | | | 0.34 | % | |
Total Annual Fund Operating Expenses After Fee Waiver and/or
Expense Reimbursement† | | | 1.11 | % | | | 1.36 | % | |
Pro Forma Combined Fund
(UIF Global Infrastructure—with approval of both Reorganizations) | | Class I | | Class II | |
Advisory Fee | | | 0.85 | % | | | 0.85 | % | |
Distribution (12b-1) Fee | | | None | | | | 0.35 | % | |
Other Expenses* | | | 0.50 | % | | | 0.50 | % | |
Total Annual Fund Operating Expenses‡ | | | 1.35 | % | | | 1.70 | % | |
Fee Waiver and/or Expense Reimbursement‡ | | | 0.48 | % | | | 0.58 | % | |
Total Annual Fund Operating Expenses After Fee Waiver and/or
Expense Reimbursement‡ | | | 0.87 | % | | | 1.12 | % | |
Pro Forma Combined Fund
(UIF Global Infrastructure—with approval of only the Variable Reorganization) | | Class I | | Class II | |
Advisory Fee | | | 0.85 | % | | | 0.85 | % | |
Distribution (12b-1) Fee | | | None | | | | 0.35 | % | |
Other Expenses* | | | 0.58 | % | | | 0.58 | % | |
Total Annual Fund Operating Expenses‡ | | | 1.43 | % | | | 1.78 | % | |
Fee Waiver and/or Expense Reimbursement‡ | | | 0.56 | % | | | 0.66 | % | |
Total Annual Fund Operating Expenses After Fee Waiver and/or
Expense Reimbursement‡ | | | 0.87 | % | | | 1.12 | % | |
Pro Forma Combined Fund
(UIF Global Infrastructure—with approval of only the SD Reorganization) | | Class I | | Class II | |
Advisory Fee | | | 0.85 | % | | | 0.85 | % | |
Distribution (12b-1) Fee | | | None | | | | 0.35 | % | |
Other Expenses* | | | 1.04 | % | | | 1.04 | % | |
Total Annual Fund Operating Expenses‡‡ | | | 1.89 | % | | | 2.24 | % | |
Fee Waiver and/or Expense Reimbursement‡‡ | | | 0.78 | % | | | 0.88 | % | |
Total Annual Fund Operating Expenses After Fee Waiver and/or
Expense Reimbursement‡‡ | | | 1.11 | % | | | 1.36 | % | |
3
* Other expenses have been estimated for the current fiscal year.
† MSIM has agreed to reduce its advisory fee and/or reimburse the Acquiring Fund so that Total Annual Fund Operating Expenses, excluding certain investment related expenses, taxes, interest and other extraordinary expenses (including litigation), will not exceed 1.11% for Class I and 1.36% for Class II. In addition, the Distributor has agreed to waive 0.10% of the 0.35% 12b-1 fee that it may receive with respect to Class II shares. These fee waivers and/or expense reimbursements will continue for at least two years or until such time as the Company's Board of Directors acts to discontinue all or a portion of such waivers and/or reimbursements when it deems such action is appropriate.
‡ MSIM has agreed to reduce its advisory fee and/or reimburse the Combined Fund so that Total Annual Fund Operating Expenses, excluding certain investment related expenses, taxes, interest and other extraordinary expenses (including litigation), will not exceed 0.87% for Class I and 1.12% for Class II. In addition, the Distributor has agreed to waive 0.10% of the 0.35% 12b-1 fee that it may receive with respect to Class II shares. The fee waivers and/or expense reimbursements will continue for at least two years from the date of the Reorganization(s) or until such time as the Company's Board of Directors acts to discontinue all or a portion of such waivers and/or reimbursements when it deems such action is appropriate.
‡‡ MSIM has agreed to reduce its advisory fee and/or reimburse the Combined Fund so that Total Annual Fund Operating Expenses, excluding certain investment related expenses, taxes, interest and other extraordinary expenses (including litigation), will not exceed 1.11% for Class I and 1.36% for Class II. In addition, the Distributor has agreed to waive 0.10% of the 0.35% 12b-1 fee that it may receive with respect to Class II shares. The fee waivers and/or expense reimbursements will continue for at least two years from the date of the SD Reorganization or until such time as the Company's Board of Directors acts to discontinue all or a portion of such waivers and/or reimbursements when it deems such action is appropriate.
Example
The example is intended to help you compare the cost of investing in the Funds with the cost of investing in other mutual Funds.
To attempt to show the effect of annual Fund operating expenses on an investment over time, the hypothetical shown below has been created. The example assumes that an investor invests $10,000 in either the Acquiring Fund or each of the Acquired Funds for the time periods indicated and that an investor then redeems all of his or her shares at the end of those periods. The example also assumes that the investment has a 5% return each year and that the operating expenses for each Fund remains the same (as set forth in the chart above). Although a shareholder's actual costs may be higher or lower, the table below shows a shareholder's costs at the end of each period based on these assumptions.
SD Global Infrastructure (Acquired Fund) | | 1 Year | | 3 Years | | 5 Years | | 10 Years | |
Class X | | $ | 113 | | | $ | 353 | | | $ | 612 | | | $ | 1,352 | | |
Class Y | | $ | 138 | | | $ | 431 | | | $ | 745 | | | $ | 1,635 | | |
VIS Global Infrastructure (Acquired Fund) | |
Class X | | $ | 89 | | | $ | 278 | | | $ | 482 | | | $ | 1,073 | | |
Class Y | | $ | 114 | | | $ | 356 | | | $ | 617 | | | $ | 1,363 | | |
UIF Global Infrastructure (Acquiring Fund) | |
Class I | | $ | 113 | | | $ | 353 | | | $ | 612 | | | $ | 1,352 | | |
Class II | | $ | 138 | | | $ | 431 | | | $ | 745 | | | $ | 1,635 | | |
4
Pro Forma Combined Fund (UIF Global Infrastructure—
with approval of both Reorganizations) | | 1 Year | | 3 Years | | 5 Years | | 10 Years | |
Class I | | $ | 89 | | | $ | 278 | | | $ | 482 | | | $ | 1,073 | | |
Class II | | $ | 114 | | | $ | 356 | | | $ | 617 | | | $ | 1,363 | | |
Pro Forma Combined Fund (UIF Global Infrastructure—
with approval of only the Variable Reorganization) | |
Class I | | $ | 89 | | | $ | 278 | | | $ | 482 | | | $ | 1,073 | | |
Class II | | $ | 114 | | | $ | 356 | | | $ | 617 | | | $ | 1,363 | | |
Pro Forma Combined Fund (UIF Global Infrastructure—
with approval of only the SD Reorganization) | |
Class I | | $ | 113 | | | $ | 353 | | | $ | 612 | | | $ | 1,352 | | |
Class II | | $ | 138 | | | $ | 431 | | | $ | 745 | | | $ | 1,635 | | |
Annual Fund Operating Expenses
The purpose of the foregoing fee tables is to assist Shareholders in understanding the various costs and expenses that a shareholder in each Fund will bear directly or indirectly. For a more complete description of these costs and expenses, see "Comparison of Acquired Funds and Acquiring Fund—Investment Advisory Fees," "—Plan of Distribution Fees," "—Other Significant Fees" and "—Purchases and Redemptions" below.
Portfolio Turnover
Each Fund pays transaction costs, such as commissions, when it buys and sells securities (or "turns over" its portfolio). A higher portfolio turnover rate may result in higher transaction costs. These costs, which are not reflected in Total Annual Fund Operating Expenses or in the Example, affect Fund performance. During the most recent fiscal year, SD Global Infrastructure's and VIS Global Infrastructure's portfolio turnover rates were 28% and 28%, respectively, of the average value of their portfolios. The Acquiring Fund has not yet commenced operations and, accordingly, no information regarding portfolio turnover rate is available at this time.
Tax Consequences of the Reorganizations
As a condition to each Reorganization, each Acquired Fund has requested an opinion of Dechert LLP to the effect that, based upon certain facts, assumptions and representations, the applicable Reorganization will constitute a tax-free reorganization for federal income tax purposes, and no gain or loss will be recognized by the Acquired Funds, the Acquiring Fund or the Acquired Funds' Shareholders for federal income tax purposes as a result of the transactions included in the applicable Reorganization. Receipt of such opinion is a condition to each Reorganization. For further information about the tax consequences of the Reorganizations, see "The Reorganizations—Tax Aspects of the Reorganizations" below.
Comparison of Acquired Funds and Acquiring Fund
Investment Objectives. Each Acquired Fund's and the Acquiring Fund's investment objectives are to seek both capital appreciation and current income.
Principal Investment Policies. Each of the Acquired Funds is a diversified fund. The Acquiring Fund is a non-diversified fund.
Each Fund will normally invest at least 80% of its assets in equity securities issued by companies located throughout the world that are engaged in the infrastructure business. A company is considered to be in the infrastructure business if it derives at least 50% of its revenues or earnings from, or devotes at least 50% of its assets to, infrastructure-related activities. Infrastructure refers to the systems and networks of energy, transportation, communication and other services required for the normal function of society. Companies in the infrastructure business may be involved in a variety of areas, including, but not limited to, (i) the transmission, distribution, storage or transportation of electricity, oil and gas (and other bulk liquid products), water, and other natural resources
5
used to produce energy, (ii) the construction and operation of renewable power facilities, (iii) the development, ownership, lease, concession, or management of highways, toll roads, tunnels, bridges, pipelines, airports, marine ports, refueling and related facilities, (iv) the provision of communications, including the development, lease, concession, or management of telephone, broadcast and mobile towers, fiber optic/copper cable, and satellite networks, (v) waste-water management and water purification/desalination and (vi) the construction or operation of essential public structures.
Each Fund's equity investments may include convertible securities. Each Fund's investments may include securities of small and medium capitalization companies. Each Fund's may invest up to 100% of its net assets in foreign securities, which may include emerging market securities. Under normal market conditions, each Fund's invests at least 40% of its assets in the securities of issuers located outside of the United States.
Each Fund's Adviser and/or "Sub-Advisers," Morgan Stanley Investment Management Limited ("MSIM Limited") and Morgan Stanley Investment Management Company ("MSIM Company"), seek to allocate Fund assets between the different types of companies in the infrastructure business based on relative valuation, underlying company fundamentals, and demographic and macroeconomic considerations. Each Fund has a fundamental policy (i.e., one that cannot be changed without shareholder approval) of investing 25% or more of its assets in the infrastructure industry.
In selecting securities to buy, hold or sell for each Fund, the Adviser and/or Sub-Advisers actively manage each Fund using a combination of bottom-up and top-down methodologies. The value-driven approach to bottom-up security selection utilizes proprietary research models to identify infrastructure companies that offer the best value relative to their underlying assets and growth prospects. The top-down allocation provides diversified exposure to major economic infrastructure sectors and countries, with an overweighting to those sectors/countries that offer the best relative valuation. The Adviser and/or Sub-Advisers generally consider selling a portfolio holding when it determines that the holding no longer satisfies its investment criteria.
The principal differences between the principal investment policies of the Acquired Funds and the Acquiring Fund are more fully described under "Comparison of Investment Objectives, Principal Policies and Restrictions" below.
Fund Management. The Acquiring Fund and the Acquired Funds are managed within MSIM's Global Infrastructure Securities team, and, if the Reorganizations are approved, the Acquiring Fund is expected to continue to be managed within MSIM's Global Infrastructure Securities team. Current members of the team jointly and primarily responsible for the day-to-day management of the Acquiring Fund are Theodore R. Bigman and Matthew King.
Mr. Bigman has been associated with the Adviser in an investment management capacity since 1995. Mr. King has been associated with the Adviser in an investment management capacity since 2008.
Additional information about the portfolio managers' compensation structure, other accounts managed by the portfolio managers and the portfolio managers' ownership of securities in the Funds is provided in each of the Trust's and the Company's Statements of Additional Information.
Investment Advisory Fees. The Acquiring Fund and Acquired Funds currently obtain advisory services from MSIM. MSIM is a wholly-owned subsidiary of Morgan Stanley (NYSE: "MS") with its principal office located at 522 Fifth Avenue, New York, NY 10036. Morgan Stanley is a preeminent global financial services firm engaged in securities trading and brokerage activities, as well as providing investment banking, research and analysis, financing and financial advisory services.
The annual advisory fee (as a percentage of daily net assets) payable by the Funds is set forth below. The Acquired Funds pay their advisory fees on a monthly basis and the Acquiring Fund pays its advisory fee on a quarterly basis.
6
SD Global Infrastructure: | | 0.57% of the portion of daily net assets not exceeding $500 million; 0.47% of the portion of daily net assets exceeding $500 million but not exceeding $1 billion; 0.445% of the portion of daily net assets exceeding $1 billion but not exceeding $1.5 billion; 0.42% of the portion of daily net assets exceeding $1.5 billion but not exceeding $2.5 billion; 0.395% of the portion of daily net assets exceeding $2.5 billion but not exceeding $3.5 billion; 0.37% of the portion of daily net assets exceeding $3.5 billion but not exceeding $5 billion; and 0.345% of the portion of daily net assets exceeding $5 billion. | |
VIS Global Infrastructure: | | 0.57% of the portion of daily net assets not exceeding $500 million; 0.47% of the portion of daily net assets exceeding $500 million but not exceeding $1 billion; 0.445% of the portion of daily net assets exceeding $1 billion but not exceeding $1.5 billion; 0.42% of the portion of daily net assets exceeding $1.5 billion but not exceeding $2.5 billion; 0.395% of the portion of daily net assets exceeding $2.5 billion but not exceeding $3.5 billion; 0.37% of the portion of daily net assets exceeding $3.5 billion but not exceeding $5 billion; and 0.345% of the portion of daily net assets exceeding $5 billion. | |
UIF Global Infrastructure*: | | 0.85% of daily net assets. | |
* MSIM has agreed to reduce its advisory fee and/or reimburse the Acquiring Fund so that Total Annual Fund Operating Expenses, excluding certain investment related expenses, taxes, interest and other extraordinary expenses (including litigation), will not exceed 1.11% with respect to Class I shares and 1.36% with respect to Class II shares. The fee waivers and/or expense reimbursements will continue for at least two years or until such time as the Company's Board of Directors acts to discontinue all or a portion of such waivers and/or reimbursements when it deems such action is appropriate.
Comparison of Other Service Providers. The Acquired Funds and Acquiring Fund have the same transfer agent, custodian, distributor and independent registered public accounting firm. For each Fund, the transfer agent is Boston Financial Data Services, Inc., the custodian is State Street Bank and Trust Company, the distributor is Morgan Stanley Distribution, Inc. and the independent registered public accounting firm is Ernst & Young LLP. Each Acquired Fund's administrator is Morgan Stanley Services Company Inc. The Acquiring Fund's administrator is MSIM.
Plan of Distribution Fees. Each Trust has adopted a plan of distribution with respect to Class Y shares of each Acquired Fund, pursuant to Rule 12b-1 under the 1940 Act (the "Trust Plan"). The Company has adopted a plan of distribution with respect to Class II shares of the Acquiring Fund, pursuant to Rule 12b-1 under the 1940 Act (the "Company Plan" and together with the Trust Plan, the "Plans"). Under the Trust Plan, each Acquired Fund pays distribution fees in connection with the sale and distribution of Class Y shares of 0.25% of the average daily net assets of such class. Under the Company Plan, the Acquiring Fund pays distribution fees in connection with the sale and distribution of Class II shares at an annual rate of 0.35% of the Acquiring Fund's average daily net assets attributable to such class. Such amounts are paid to compensate each Fund's distributor for remittance to insurance companies, qualified pension plans or retirement plans (as applicable) which offer the applicable Fund as an investment option. These payments are intended to compensate insurance companies for distribution and/or administrative related expenses incurred or paid in connection with the distribution of the applicable shares of the Funds. The Acquiring Fund's Distributor has agreed to waive 0.10% of the 0.35% 12b-1 fee that it may receive. This waiver will continue for at least two years or until such time as the Company's Board of Directors acts to discontinue all or a portion of such waiver when it deems such action is appropriate. MSIM and/or the Acquiring Fund's Distributor may pay additional compensation (out of their own funds and not as an expense of the Acquiring Fund) to certain insurance companies and/or other financial intermediaries in connection with the sale, distribution, marketing and/or retention of shares of the Acquiring Fund and/or shareholder servicing. For a complete description of the arrangement with respect to each Acquired Fund, see the section of each Acquired Fund's prospectuses entitled "Plan of Distribution" and the section of the Acquired Funds' Statement of Additional Information entitled "V. Investment Advisory and Other Services—D. Rule 12b-1 Plan." For a complete description of the arrangement
7
with respect to the Acquiring Fund, see the section of the Acquiring Fund's Prospectuses (attached as Exhibit B) entitled "Distribution Plan" and the section of the Acquiring Fund's Statement of Additional Information entitled "Distribution of Shares (Applicable to Class II Shares Only)."
Other Significant Fees. The Acquiring Fund and Acquired Funds pay additional fees in connection with their operations, including legal, auditing, transfer agent and custodial fees. See "Synopsis—Fee Tables" above for the percentage of average net assets represented by such "Other Expenses."
Purchases and Redemptions. The Company's Board of Directors has authorized the issuance of the Acquiring Fund Shares in connection with the Reorganizations.
Acquired Funds. Shares of the Acquired Funds are offered on each day that the New York Stock Exchange ("NYSE") is open for business. Each Acquired Fund offers its shares only to insurance company separate accounts that insurance companies establish to fund variable life insurance and/or variable annuity contracts. An insurance company purchases or redeems shares of an Acquired Fund based on, among other things, the amount of net contract premiums or purchase payments allocated to a separate account investment division, transfers to or from a separate account investment division, contract loans and repayments, contract withdrawals and surrenders, and benefit payments. The contract prospectus describes how contract owners may allocate, transfer and withdraw amounts to and from separate accounts.
For further information on the purchase and sale of shares of each Acquired Fund, see the sections of each Acquired Fund's prospectuses entitled "Purchase and Sales of Portfolio Shares" and "Pricing Portfolio Shares," as well as the section of the Acquired Funds' Statement of Additional Information entitled "VIII. Purchase, Redemption and Pricing of Shares."
Acquiring Fund. Shares of the Acquiring Fund are offered on each day that the NYSE is open for business. The Acquiring Fund offers its shares only to insurance companies for separate accounts that insurance companies establish to fund variable life insurance and variable annuity contracts, and to other entities under qualified pension and retirement plans. An insurance company purchases or redeems shares of the Acquiring Fund based on, among other things, the amount of net contract premiums or purchase payments allocated to a separate account investment division, transfers to or from a separate account investment division, contract loans and repayments, contract withdrawals and surrenders, and benefit payments. The contract prospectus describes how contract owners may allocate, transfer and withdraw amounts to, and from, separate accounts.
For further information on the purchase and sale of shares of the Acquiring Fund, see the sections of the Acquiring Fund's Prospectuses (attached as Exhibit B) entitled "Purchasing and Selling Portfolio Shares" and "Pricing of Portfolio Shares," as well as the section of the Acquiring Fund's Statement of Additional Information entitled "Net Asset Value."
Dividends. Each Fund declares dividends separately for each of its classes. Each Fund pays dividends from net investment income and distributes net realized capital gains, if any, at least annually.
PRINCIPAL RISK FACTORS
The principal risks of investing in the Acquiring Fund are substantially similar to those of investing in an Acquired Fund. The value of an investment in each Fund is based on the market prices of the securities such Fund holds. These prices change daily due to economic and other events that affect markets generally, as well as those that affect particular regions, countries, industries, companies or governments.
Infrastructure Industry. Each Fund, by concentrating its investments in the infrastructure industry, has greater exposure to the potential adverse economic, regulatory, political and other changes affecting companies operating within such industry. Companies within the infrastructure industry are subject to a variety of factors that may adversely affect their business or operations, including high interest costs in connection with capital construction and improvement programs, high leverage, costs associated with compliance with and changes in environmental and other regulations, difficulty in raising capital in adequate amounts and on reasonable terms in periods of high inflation and unsettled capital markets or government budgetary constraints that impact publicly funded projects,
8
the effects of economic slowdown or recession and surplus capacity, increased competition from other providers of services, uncertainties concerning the availability of fuel at reasonable prices, the effects of energy conservation policies and other factors.
Other factors that may affect the operations of companies within the infrastructure industry include innovations in technology that could render the way in which a company delivers a product or service obsolete, significant changes to the number of ultimate end-users of a company's products, inexperience with and potential losses resulting from a developing deregulatory environment, increased susceptibility to terrorist attacks, risks of environmental damage due to a company's operations or an accident, and general changes in market sentiment towards infrastructure and utilities assets. Companies operating in the infrastructure industry face operating risks, including the risk of fire, explosions, leaks, mining and drilling accidents or other catastrophic events. In addition, natural risks, such as earthquakes, floods, lightning, hurricanes, tsunamis and wind, are inherent risks in infrastructure company operations.
Equity Securities. Each Fund invests in equity securities. Equity securities may include common and preferred stocks, convertible securities and equity-linked securities, rights and warrants to purchase common stocks, depositary receipts, limited partnership interests and other specialty securities having equity features. The prices of equity securities will rise and fall in response to a number of different factors. In particular, prices of equity securities fluctuate, and sometimes widely fluctuate, in response to activities specific to the issuer of the security as well as factors unrelated to the fundamental condition of the issuer, including general market, economic and political conditions.
The Funds may invest in equity securities that are publicly-traded on securities exchanges or over-the-counter ("OTC") or in equity securities that are not publicly traded. Securities that are not publicly traded may be more difficult to sell and their value may fluctuate more dramatically than other securities.
Depositary receipts involve many of the same risks as those associated with direct investment in foreign securities. In addition, the underlying issuers of certain depositary receipts, particularly unsponsored or unregistered depositary receipts, are under no obligation to distribute shareholder communications to the holders of such receipts, or to pass through to them any voting rights with respect to the deposited securities.
A convertible security is a bond, debenture, note, preferred stock, right, warrant or other security that may be converted into or exchanged for a prescribed amount of common stock or other security of the same or a different issuer or into cash within a particular period of time at a specified price or formula. A convertible security generally entitles the holder to receive interest paid or accrued on debt securities or the dividend paid on preferred stock until the convertible security matures or is redeemed, converted or exchanged. Before conversion, convertible securities generally have characteristics similar to both debt and equity securities. The value of convertible securities tends to decline as interest rates rise and, because of the conversion feature, tends to vary with fluctuations in the market value of the underlying securities. Convertible securities ordinarily provide a stream of income with generally higher yields than those of common stock of the same or similar issuers. Convertible securities generally rank senior to common stock in a corporation's capital structure but are usually subordinated to comparable nonconvertible securities. Convertible securities generally do not participate directly in any dividend increases or decreases of the underlying securities although the market prices of convertible securities may be affected by any dividend changes or other changes in the underlying securities.
Small and Medium Capitalization Companies. Each Fund may invest in securities of small and medium capitalization companies. Investments in small and medium capitalization companies may involve greater risks than investments in larger, more established companies. The securities issued by small and medium capitalization companies may be less liquid, and such companies may have more limited markets, financial resources and product lines, and may lack the depth of management of larger companies.
Foreign Securities. Each Fund may invest in foreign securities. Foreign issuers generally are subject to different accounting, auditing and financial reporting standards than U.S. issuers. There may be less information available to the public about foreign issuers. Securities of foreign issuers can be less liquid and experience greater price movements. In addition, the prices of such securities may be susceptible to influence by large traders, due to
9
the limited size of many foreign securities markets. In addition, investments in certain foreign markets, which have historically been considered stable, may become more volatile and subject to increased risk due to ongoing developments and changing conditions in such markets. Moreover, the growing interconnectivity of global economies and financial markets has increased the probability that adverse developments and conditions in one country or region will affect the stability of economies and financial markets in other countries or regions. In some foreign countries, there is also the risk of government expropriation, excessive taxation, political or social instability, the imposition of currency controls or diplomatic developments that could affect a Fund's investment. There also can be difficulty obtaining and enforcing judgments against issuers in foreign countries. Foreign stock exchanges, broker-dealers and listed issuers may be subject to less government regulation and oversight. The cost of investing in foreign securities, including brokerage commissions and custodial expenses, can be higher than in the United States.
In connection with their investments in foreign securities, the Funds also may enter into contracts with banks, brokers or dealers to purchase or sell securities or foreign currencies at a future date. A foreign currency forward exchange contract is a negotiated agreement between the contracting parties to exchange a specified amount of currency at a specified future time at a specified rate. The rate can be higher or lower than the spot rate between the currencies that are the subject of the contract. Foreign currency forward exchange contracts may be used to protect against uncertainty in the level of future foreign currency exchange rates or to gain or modify exposure to a particular currency. In addition, the Funds may use cross currency hedging or proxy hedging with respect to currencies in which the Funds have or expect to have portfolio or currency exposure. Cross currency hedges involve the sale of one currency against the positive exposure to a different currency and may be used for hedging purposes or to establish an active exposure to the exchange rate between any two currencies.
Emerging Market Risks. Each Fund may invest in emerging market or developing countries, which are countries that major international financial institutions, such as the World Bank, generally consider to be less economically mature than developed nations, such as the United States or most nations in Western Europe. Emerging market or developing countries may be more likely to experience political turmoil or rapid changes in economic conditions than more developed countries, and the financial condition of issuers in emerging market or developing countries may be more precarious than in other countries. In addition, emerging market securities generally are less liquid and subject to wider price and currency fluctuations than securities issued in more developed countries. These characteristics result in greater risk of price volatility in emerging market or developing countries, which may be heightened by currency fluctuations relative to the U.S. dollar.
Non-Diversification. The Acquiring Fund is a "non-diversified" mutual fund and, as such, its investments are not required to meet certain diversification requirements under federal law. Compared with "diversified" funds, such as the Acquired Funds, the Acquiring Fund may invest a greater percentage of its assets in the securities of an individual corporation or governmental entity. Thus, the Acquiring Fund's assets may be concentrated in fewer securities than other funds. A decline in the value of those investments would cause the Acquiring Fund's overall value to decline to a greater degree.
The foregoing discussion is a summary of the principal risk factors. For a more complete discussion of the risks of the Acquiring Fund, see "Details of the Portfolio—Global Infrastructure Portfolio—Risks" in the Acquiring Fund's Prospectuses attached hereto as Exhibit B. For a more complete discussion of the risks of the Acquired Funds, see "Portfolio Details—Additional Information About the Portfolio's Investment Objective, Strategies and Risks—Principal Risks" in each Acquired Fund's prospectuses, each incorporated herein by reference.
VOTING INFORMATION
General
The shares of the Acquired Funds are currently sold to the Insurance Companies as the record owners for allocation to certain of their separate accounts that are registered as investment companies under the 1940 Act.
10
Record Date
The Board has fixed the close of business on December 23, 2013 as the record date (the "Record Date") for the determination of Shareholders of each Acquired Fund entitled to notice of, and to vote at, the Meeting. As of the Record Date, there were 980,024.652 shares of SD Global Infrastructure and 7,551,857.808 shares of VIS Global Infrastructure issued and outstanding.
Solicitation of Proxies and Voting Instructions
The Board is soliciting proxies from the Shareholders of each Acquired Fund, including the Insurance Companies, which have the right to vote upon matters that may be voted upon at the Meeting. The Insurance Companies will furnish this Joint Proxy Statement and Prospectus to the owners of Contracts participating in their separate accounts that are registered with the Commission under the 1940 Act ("Registered Accounts") and that hold shares of the applicable Acquired Fund to be voted at the Meeting, and will solicit voting instructions from those Contract owners.
Each Insurance Company will vote shares of the applicable Acquired Fund held in its Registered Accounts: (i) for which timely voting instructions are received from Contract owners, in accordance with such instructions; and (ii) for which no voting instructions are timely received, in the same proportion as the instructions received from Contract owners participating in all its Registered Accounts. The Insurance Companies will vote all other shares of the applicable Acquired Fund held by them in the same proportion as the voting instructions timely received by all the Insurance Companies from Contract owners participating in all their Registered Accounts. The effect of proportional voting as described above is that a small number of Contract owners can determine the outcome of the voting. If you wish to give voting instructions, you may submit the enclosed Voting Instruction Form, provide voting instructions by telephone or via the Internet by following the instructions that appear on the Voting Instruction Form or attending the Meeting in person and provide your voting instructions to the relevant Insurance Company.
Voting Procedures
Proxies from Shareholders may be revoked at any time prior to the voting of the shares represented thereby by: (i) mailing written instructions addressed to the Secretary of Morgan Stanley Select Dimensions Investment Series or Morgan Stanley Variable Investment Series (as applicable), 522 Fifth Avenue, 4th Floor, New York, NY 10036; (ii) signing and returning a new proxy; or (iii) attending the Meeting and voting shares. Attendance at the Meeting will not in and of itself revoke a proxy. All valid proxies will be voted in accordance with specifications thereon, or in the absence of specifications, for approval of the applicable Reorganization. Instructions from Contract owners may be revoked by: (i) mailing written instructions addressed to the Secretary of the Trust, 522 Fifth Avenue, 4th Floor, New York, NY 10036; or (ii) signing and returning a new Voting Instruction Form. A Contract owner may also attend the Meeting in person to revoke previously provided voting instructions and to provide new voting instructions.
Quorum
Shareholders of record as of the close of business on the Record Date are entitled to one vote per share and a fractional vote for a fractional share on each matter submitted to a vote at the Meeting. Shareholders of each class of an Acquired Fund will vote together as a single class in connection with the applicable Reorganization Agreement. The holders of a majority of the shares issued and outstanding and entitled to vote of an Acquired Fund, represented in person or by proxy, will constitute a quorum for that Acquired Fund at the Meeting.
In the event that the necessary quorum to transact business or the vote required to approve or reject the Reorganization with respect to an Acquired Fund is not obtained at the Meeting, the persons named as proxies may propose one or more adjournments of the Meeting to permit further solicitation of proxies. Any such adjournment will require the affirmative vote of the holders of a majority of shares of the applicable Acquired Fund present in person or by proxy at the Meeting. Where an adjournment is proposed because the necessary quorum to transact business is not obtained at the Meeting, the persons named as proxies will vote in favor of such adjournment
11
provided that such persons named as proxies determine that such adjournment and additional solicitation is reasonable and in the interests of Shareholders based on all relevant factors, including the nature of the proposal, the percentage of Shareholders present, the nature of the proposed solicitation activities and the nature of the reasons for the further solicitation. Where an adjournment is proposed because the vote required to approve or reject a Reorganization with respect to an Acquired Fund is not obtained at the Meeting, the persons named as proxies will vote in favor of such adjournment those proxies which they are entitled to vote in favor of such Reorganization and will vote against any such adjournment those proxies required to be voted against such Reorganization. Abstentions will not be voted either for or against any such adjournment.
Adjournments; Other Business
The Meeting has been called to transact any business that properly comes before it. The only business that management of the Trusts intends to present or knows that others will present is the Reorganizations. If any other matters properly come before the Meeting, and on all matters incidental to the conduct of the Meeting, the persons named as proxies intend to vote the proxies in accordance with their judgment, unless the Secretary of the Trusts has previously received written contrary instructions from the shareholder entitled to vote the shares.
Expenses of Solicitation
Voting instructions will be solicited primarily by mailing this Joint Proxy Statement and Prospectus and its enclosures. In addition to the voting instructions by mail, employees of MSIM and its affiliates, without additional compensation, may solicit voting instructions in person or by telephone, facsimile or oral communication. The expenses of the Reorganizations, including the cost of printing, filing and voting instructions solicitation, and legal and accounting expenses, are expected to be approximately $67,109 with respect to SD Global Infrastructure (all of which will be borne by SD Global Infrastructure (unless only the SD Reorganization is approved by Shareholders, in which case all of the expenses will be borne by MSIM)) and approximately $69,307 with respect to VIS Global Infrastructure (all of which will be borne by MSIM (whether or not the Variable Reorganization is approved by Shareholders)).
Vote Required
Approval of each Reorganization by Shareholders requires the affirmative vote of the lesser of: (1) more than 50% of the outstanding shares of the Acquired Fund, or (2) 67% or more of the shares of the Acquired Fund represented at the Meeting if the holders of more than 50% of the outstanding shares of the Acquired Fund are present or represented by Proxy. Abstentions are not considered votes "FOR" a Reorganization at the Meeting. As a result, abstentions have the same effect as a vote against a Reorganization because approval of a Reorganization requires the affirmative vote of a percentage of the voting securities present or represented by proxy.
If a Reorganization is not approved by Shareholders of the applicable Acquired Fund, that Acquired Fund will continue in existence and the Board will consider alternative actions for such Acquired Fund.
PERFORMANCE INFORMATION
The Acquiring Fund is newly organized. As a result, the Acquiring Fund has no operating history or performance information to include.
The bar chart and table below provide some indication of the risks of investing in each Acquired Fund by showing changes in the performance of each Acquired Fund's Class X and Class Y shares from year to year and by showing how the average annual returns of each Acquired Fund's Class X and Class Y shares for the one, five and 10 year periods compare with those of a broad measure of market performance over time. This performance information does not include the impact of any charges deducted by your insurance company. If it did, returns would be lower. The Acquired Fund's past performance does not indicate how the Acquired Fund will perform in the future.
12
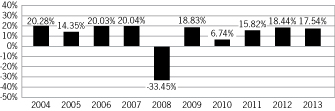
VIS Global Infrastructure
Annual Total Returns—Calendar Years (Class X)

High
Quarter | | 6/30/09: | | | 21.03 | % | |
Low Quarter | | 9/30/08: | | | -18.12 | % | |
Average Annual Total Returns for Periods Ended December 31, 2013 (Class X)
| | Past 1 Year | | Past 5 Years | | Past 10 Years | |
Global Infrastructure Portfolio | | | 17.91 | % | | | 15.68 | % | | | 10.72 | % | |
Dow Jones Brookfield Global
Infrastructure IndexSM
(reflects no deduction for fees, expenses, or taxes)1 | | | 15.89 | % | | | 18.22 | % | | | 13.16 | % | |
S&P Global BMI Index
(reflects no deduction for fees, expenses, or taxes)2 | | | 24.11 | % | | | 16.30 | % | | | 8.23 | % | |
(1) The Dow Jones Brookfield Global Infrastructure IndexSM is a float-adjusted market capitalization weighted index that measures the stock performance of companies that exhibit strong infrastructure characteristics. The Index intends to measure all sectors of the infrastructure market. The Index was first published in July 2008; however, back-tested hypothetical performance information is available for this Index since December 31, 2002. Returns are calculated using the return data of the S&P Global BMI Index through December 31, 2002 and the return data of the Dow Jones Brookfield Global Infrastructure Index for periods thereafter. It is not possible to invest directly in an index.
(2) The Standard & Poor's Global BMI Index (S&P Global BMI Index) is a broad market index designed to capture exposure to equities in all countries in the world that meet minimum size and liquidity requirements. As of the date of this Prospectus, there are approximately 11,000 index members representing 26 developed and 20 emerging market countries. It is not possible to invest directly in an index.
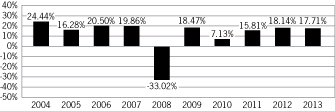
Annual Total Returns—Calendar Years (Class Y)
High
Quarter | | 6/30/09: | | | 21.02 | % | |
Low Quarter | | 9/30/08: | | | -18.14 | % | |
13
Average Annual Total Returns for Periods Ended December 31, 2013 (Class Y)
| | Past 1 Year | | Past 5 Years | | Past 10 Years | |
Global Infrastructure Portfolio | | | 17.54 | % | | | 15.39 | % | | | 10.43 | % | |
Dow Jones Brookfield Global
Infrastructure IndexSM
(reflects no deduction for fees, expenses, or taxes)1 | | | 15.89 | % | | | 18.22 | % | | | 13.16 | % | |
S&P Global BMI Index
(reflects no deduction for fees, expenses, or taxes)2 | | | 24.11 | % | | | 16.30 | % | | | 8.23 | % | |
(1) The Dow Jones Brookfield Global Infrastructure IndexSM is a float-adjusted market capitalization weighted index that measures the stock performance of companies that exhibit strong infrastructure characteristics. The Index intends to measure all sectors of the infrastructure market. The Index was first published in July 2008; however, back-tested hypothetical performance information is available for this Index since December 31, 2002. Returns are calculated using the return data of the S&P Global BMI Index through December 31, 2002 and the return data of the Dow Jones Brookfield Global Infrastructure Index for periods thereafter. It is not possible to invest directly in an index.
(2) The Standard & Poor's Global BMI Index (S&P Global BMI Index) is a broad market index designed to capture exposure to equities in all countries in the world that meet minimum size and liquidity requirements. As of the date of this Prospectus, there are approximately 11,000 index members representing 26 developed and 20 emerging market countries. It is not possible to invest directly in an index.
SD Global Infrastructure
Annual Total Returns—Calendar Years (Class X)
High
Quarter | | 6/30/09: | | | 20.93 | % | |
Low Quarter | | 9/30/08: | | | -18.12 | % | |
Average Annual Total Returns for Periods Ended December 31, 2013 (Class X)
| | Past 1 Year | | Past 5 Years | | Past 10 Years | |
Global Infrastructure Portfolio | | | 17.71 | % | | | 15.37 | % | | | 11.08 | % | |
Dow Jones Brookfield
Global Infrastructure IndexSM
(reflects no deduction for fees, expenses or taxes)1 | | | 15.89 | % | | | 18.22 | % | | | 13.16 | % | |
S&P Global BMI Index
(reflects no deduction for fees, expenses or taxes)2 | | | 24.11 | % | | | 16.30 | % | | | 8.23 | % | |
(1) The Dow Jones Brookfield Global Infrastructure IndexSM is a float-adjusted market capitalization weighted index that measures the stock performance of companies that exhibit strong infrastructure characteristics. The Index intends to measure all sectors of the infrastructure market. The Index was first published in July 2008; however, back-tested hypothetical performance information is available for this Index since December 31, 2002. Returns are calculated using the return data of the S&P Global BMI Index through
14
December 31, 2002 and the return data of the Dow Jones Brookfield Global Infrastructure Index for periods thereafter. It is not possible to invest directly in an index.
(2) The Standard & Poor's Global BMI Index (S&P Global BMI Index) is a broad market index designed to capture exposure to equities in all countries in the world that meet minimum size and liquidity requirements. As of the date of this Prospectus, there are approximately 11,000 index members representing 26 developed and 20 emerging market countries. It is not possible to invest directly in an index.
Annual Total Returns—Calendar Years (Class Y)

High
Quarter | | 6/30/09: | | | 20.83 | % | |
Low Quarter | | 9/30/08: | | | -18.18 | % | |
Average Annual Total Returns for Periods Ended December 31, 2013 (Class Y)
| | Past 1 Year | | Past 5 Years | | Past 10 Years | |
Global Infrastructure Portfolio | | | 17.40 | % | | | 15.07 | % | | | 10.80 | % | |
Dow Jones Brookfield
Global Infrastructure IndexSM
(reflects no deduction for fees, expenses or taxes)1 | | | 15.89 | % | | | 18.22 | % | | | 13.16 | % | |
S&P Global BMI Index
(reflects no deduction for fees, expenses or taxes)2 | | | 24.11 | % | | | 16.30 | % | | | 8.23 | % | |
(1) The Dow Jones Brookfield Global Infrastructure IndexSM is a float-adjusted market capitalization weighted index that measures the stock performance of companies that exhibit strong infrastructure characteristics. The Index intends to measure all sectors of the infrastructure market. The Index was first published in July 2008; however, back-tested hypothetical performance information is available for this Index since December 31, 2002. Returns are calculated using the return data of the S&P Global BMI Index through December 31, 2002 and the return data of the Dow Jones Brookfield Global Infrastructure Index for periods thereafter. It is not possible to invest directly in an index.
(2) The Standard & Poor's Global BMI Index (S&P Global BMI Index) is a broad market index designed to capture exposure to equities in all countries in the world that meet minimum size and liquidity requirements. As of the date of this Prospectus, there are approximately 11,000 index members representing 26 developed and 20 emerging market countries. It is not possible to invest directly in an index.
THE REORGANIZATIONS
The Board's Considerations
The respective Board, including the Independent Board Members, unanimously declared advisable and approved each Reorganization on behalf of the applicable Acquired Fund and determined to recommend that Shareholders of each Acquired Fund approve the applicable Reorganization. In connection with each Board's review of the applicable Reorganization, MSIM advised the Board about a variety of matters, including, but not limited to:
1. the similarity of the investment objectives, policies and risks of the Acquiring Fund as compared to each Acquired Fund;
15
2. the continuity of the portfolio management teams;
3. the potential asset base of the Acquiring Fund as compared to each Acquired Fund;
4. the sales and asset growth potential of the Acquiring Fund as compared to each Acquired Fund;
5. the anticipated wider distribution of the Acquiring Fund through the intermediary insurance channel as compared to each Acquired Fund;
6. with respect to SD Global Infrastructure, the Reorganization is expected to result in lower (if both Reorganizations are approved) or the same (if only the SD Reorganization is approved) total operating expenses for Shareholders of SD Global Infrastructure and, with respect to VIS Global Infrastructure, the Reorganization is expected to result in the same total operating expenses for Shareholders of VIS Global Infrastructure, each as a result of proposed fee waivers and/or expense reimbursements instituted by MSIM and the Distributor for at least two years from the date of the Reorganization(s) or until such time as the Company's Board of Directors acts to discontinue all or a portion of such waivers and/or reimbursements when it deems such action is appropriate.
7. the terms and conditions of each Reorganization, which would affect the price of shares to be issued in each Reorganization;
8. that there is not expected to be a significant amount of portfolio turnover as a result of each Reorganization;
9. the expenses of the Reorganizations, including the cost of printing, filing and voting instructions solicitation, and legal and accounting expenses, are expected to be approximately $67,109 with respect to SD Global Infrastructure (all of which will be borne by SD Global Infrastructure (unless only the SD Reorganization is approved by Shareholders, in which case all expenses of the Reorganization will be borne by MSIM)) and approximately $69,307 with respect to VIS Global Infrastructure (all of which will be borne by MSIM (whether or not the Variable Reorganization is approved by Shareholders));
10. the tax-free nature of each Reorganization; and
11. that any capital losses carryforwards would not be lost or subject to limitation as a result of either Reorganization.
The Board noted that the current investments of each Acquired Fund may be held by the Acquiring Fund in accordance with the investment guidelines of the Acquiring Fund. The Board and MSIM believe that the Acquiring Fund has greater potential for future sales and asset growth as compared to each Acquired Fund. In this regard, the parties discussed the wider distribution channel of the Acquiring Fund as compared to each Acquired Fund, which is no longer being utilized in new variable annuity contracts offered by the Insurance Companies.
With respect to the SD Reorganization, the Board noted that, after fee waivers and expenses caps, the total annual operating expenses of the Combined Fund are projected to be lower than the total annual operating expenses of SD Global Infrastructure if both Reorganizations are approved, and equal to the total annual operating expenses of SD Global Infrastructure if only the SD Reorganization is approved. The Board noted specifically that MSIM has agreed, (i) if both Reorganizations are approved, to reduce its advisory fee and/or reimburse the Combined Fund, so that total annual operating expenses, excluding certain investment related expenses, taxes, interest and other extraordinary expenses (including litigation), will not exceed 0.87% for Class I shares and 1.12% for Class II shares of the Combined Fund (these fee waivers and/or expense reimbursements will continue for at least two years from the date of the Reorganizations or until such time as the Company's Board of Directors acts to discontinue all or a portion of such waivers and/or reimbursements when it deems such action is appropriate); and (ii) if only the SD Reorganization is approved, to reduce its advisory fee and/or reimburse the Combined Fund, so that total annual operating expenses, excluding certain investment related expenses, taxes, interest and other extraordinary expenses (including litigation), will not exceed 1.11% for Class I shares and 1.36% for Class II shares of the Combined Fund (these fee waivers and/or expense reimbursements will continue for at least two years from the date of the SD Reorganization or until such time as the Company's Board of Directors acts to discontinue all or a portion of such waivers and/or reimbursements when it deems such action is appropriate). In addition, the Board noted that, in both
16
scenarios, the Distributor has agreed to waive 0.10% of the 0.35% 12b-1 fee that it may receive with respect to Class II shares for at least two years from the date of the Reorganization(s) or until such time as the Company's Board of Directors acts to discontinue all or a portion of such waiver when it deems such action is appropriate.
With respect to the Variable Reorganization, the Board noted that, after fee waivers and expenses caps, the total annual operating expenses of the Combined Fund are projected to be equal to the total annual operating expenses of VIS Global Infrastructure if only the Variable Reorganization is approved or if both Reorganizations are approved. The Board noted specifically that MSIM has agreed to reduce its advisory fee and/or reimburse the Combined Fund, so that total annual operating expenses, excluding certain investment related expenses, taxes, interest and other extraordinary expenses (including litigation), will not exceed 0.87% for Class I shares and 1.12% for Class II shares of the Combined Fund (these fee waivers and/or expense reimbursements will continue for at least two years from the date of the Reorganization(s) or until such time as the Company's Board of Directors acts to discontinue all or a portion of such waivers and/or reimbursements when it deems such action is appropriate). In addition, the Board noted that the Distributor has agreed to waive 0.10% of the 0.35% 12b-1 fee that it may receive with respect to Class II shares for at least two years from the date of the Reorganization(s) or until such time as the Company's Board of Directors acts to discontinue all or a portion of such waiver when it deems such action is appropriate.
The Board discussed with MSIM the foreseeable short- and long-term effects of the Reorganizations on the Acquired Funds and their Shareholders.
In its deliberations, the Board considered all information it received, as described above, as well as advice and analysis from its counsel. The Board considered each Reorganization and the impact of each Reorganization on the applicable Acquired Fund and its Shareholders. The Board concluded, based on all of the information presented, that each Reorganization is advisable and in the best interest of the applicable Acquired Fund's Shareholders and that Shareholders will not be diluted as a result thereof, and decided to recommend that each Acquired Fund's Shareholders approve the applicable Reorganization.
Each Reorganization is not dependent on the approval of the other. If Shareholders of an Acquired Fund do not approve the Reorganization, the Board of that Acquired Fund will consider other courses of action for such Acquired Fund.
The Reorganization Agreements
The terms and conditions under which each Reorganization would be consummated, as summarized below, are set forth in the applicable Reorganization Agreement. This summary is qualified in its entirety by reference to the Form of Agreement and Plan of Reorganization for each Reorganization, copies of which are attached as Exhibits A-1 and A-2 to this Joint Proxy Statement and Prospectus.
Each Reorganization Agreement provides that (i) an Acquired Fund will transfer substantially all of its assets, including portfolio securities, cash, cash equivalents and receivables, to the Acquiring Fund on the Closing Date in exchange for the assumption by the Acquiring Fund of all liabilities of the Acquired Fund, including all expenses, costs, charges and reserves, as reflected on an unaudited statement of assets and liabilities of the Acquired Fund prepared by the Treasurer of the Acquired Fund as of the Valuation Date (as defined below) in accordance with generally accepted accounting principles consistently applied from the prior audited period, and the delivery of the Acquiring Fund Shares; (ii) such Acquiring Fund Shares would be distributed to Shareholders on the Closing Date or as soon as practicable thereafter; (iii) the Acquired Fund would be liquidated and terminated; and (iv) the outstanding shares of the Acquired Fund would be canceled.
The number of Acquiring Fund Shares to be delivered to the applicable Acquired Fund will be determined by dividing the aggregate NAV of each class of shares of the Acquired Fund acquired by the Acquiring Fund by the NAV per share of the corresponding class of shares of the Acquiring Fund; these values will be calculated as of the close of business of the NYSE on the Valuation Date. As an illustration, assume that on the Valuation Date, Class X shares of an Acquired Fund had an aggregate NAV of $100,000. If the NAV per Class I share of the Acquiring Fund were $10 per share at the close of business on the Valuation Date, the number of Class I shares of the Acquiring Fund to be issued would be 10,000 ($100,000 ÷ $10). These 10,000 Class I shares of the Acquiring Fund would be
17
distributed to the former Class X Shareholders of the Acquired Fund. This example is given for illustration purposes only and does not bear any relationship to the dollar amounts or shares expected to be involved in the Reorganizations.
On the Closing Date or as soon as practicable thereafter, each Acquired Fund will distribute pro rata to its Shareholders of record as of the close of business on the Valuation Date, the Acquiring Fund Shares it receives. Each shareholder will receive the class of shares of the Acquiring Fund that corresponds to the class of shares of the Acquired Fund currently held by that shareholder. Accordingly, the Acquiring Fund Shares will be distributed as follows: each of the Class I shares of the Acquiring Fund will be distributed to holders of the Class X shares of an Acquired Fund and each of the Class II shares of the Acquiring Fund will be distributed to holders of Class Y shares of an Acquired Fund. The Acquiring Fund will cause its transfer agent to credit and confirm an appropriate number of the Acquiring Fund's Shares to each shareholder.
The consummation of each Reorganization is contingent upon the approval of each Reorganization by the Shareholders and the receipt of the other opinions and certificates set forth in Sections 6, 7 and 8 of the applicable Reorganization Agreement and the occurrence of the events described in those Sections, certain of which may be waived by a Fund. Each Reorganization Agreement may be amended in any mutually agreeable manner.
Each Reorganization Agreement may be terminated and the applicable Reorganization abandoned at any time, before or after approval by Shareholders, by mutual consent of the Company, on behalf of the Acquiring Fund, and the Trust, on behalf of the applicable Acquired Fund. In addition, either party may terminate a Reorganization Agreement upon the occurrence of a material breach of the Reorganization Agreement by the other party or if, by October 3, 2014, any condition set forth in the Reorganization Agreement has not been fulfilled or waived by the party entitled to its benefits.
Under each Reorganization Agreement, within one year after the Closing Date, the applicable Acquired Fund shall either pay or make provision for all of its liabilities to former Shareholders of the Acquired Fund that received Acquiring Fund Shares. Each Acquired Fund shall be liquidated and terminated following the distribution of the Acquiring Fund Shares to Shareholders of record of the Acquired Funds.
The effect of the Reorganizations is that Shareholders who vote their shares in favor of the Reorganization Agreement are electing to sell their shares of the applicable Acquired Fund and reinvest the proceeds in the Acquiring Fund Shares at NAV and without recognition of taxable gain or loss for federal income tax purposes. See "Tax Aspects of the Reorganizations" below. As noted in "Tax Aspects of the Reorganizations," if an Acquired Fund recognizes net gain from the sale of securities prior to the Closing Date, such gain, to the extent not offset by capital loss carry-forwards, will be distributed to Shareholders prior to the Closing Date and will be taxable to Shareholders as capital gains.
Shareholders will continue to be able to redeem their shares of the Acquired Funds at NAV next determined after receipt of the redemption request until the close of business on the business day next preceding the Closing Date. Redemption requests received by the Acquired Funds thereafter will be treated as requests for redemption of shares of the Acquiring Fund.
Tax Aspects of the Reorganizations
The following is a general summary of the material federal income tax consequences of the Reorganizations and is based upon the current provisions of the Code, the existing U.S. Treasury Regulations thereunder, current administrative rulings of the Internal Revenue Service ("IRS") and published judicial decisions, all of which are subject to change. This discussion is limited to U.S. persons who hold shares of an Acquired Fund as capital assets for federal income tax purposes. This summary does not address all of the U.S. federal income tax consequences that may be relevant to a particular shareholder or to Shareholders who may be subject to special treatment under federal income tax laws.
Tax Consequences of each Reorganization to Shareholders. Each Reorganization is intended to qualify for federal income tax purposes as a tax-free reorganization under Section 368(a)(1) of the Code.
18
As a condition to each Reorganization, each Acquired Fund and the Acquiring Fund have requested an opinion of Dechert LLP substantially to the effect that, based on certain assumptions, facts, the terms of the applicable Reorganization Agreement and representations set forth in the applicable Reorganization Agreement or otherwise provided by such Acquired Fund and the Acquiring Fund:
1. The transfer of substantially all of the assets of the Acquired Fund in exchange solely for the Acquiring Fund Shares and the assumption by the Acquiring Fund of the liabilities of the Acquired Fund followed by the distribution by the Acquired Fund of the Acquiring Fund Shares to Shareholders in exchange for their Acquired Fund shares pursuant to and in accordance with the terms of the Reorganization Agreement will constitute a "reorganization" within the meaning of Section 368(a)(1) of the Code;
2. No gain or loss will be recognized by the Acquiring Fund upon the receipt of the assets of the Acquired Fund solely in exchange for the Acquiring Fund Shares and the assumption by the Acquiring Fund of the liabilities of the Acquired Fund;
3. No gain or loss will be recognized by the Acquired Fund upon the transfer of substantially all of the assets of the Acquired Fund to the Acquiring Fund solely in exchange for the Acquiring Fund Shares and the assumption by the Acquiring Fund of the liabilities or upon the distribution of the Acquiring Fund Shares to Shareholders in exchange for their Acquired Fund Shares, except that the Acquired Fund may be required to recognize gain or loss with respect to contracts described in Section 1256(b) of the Code or stock in a passive foreign investment company, as defined in Section 1297(a) of the Code;
4. No gain or loss will be recognized by Shareholders upon the exchange of the shares of the Acquired Fund solely for the Acquiring Fund Shares;
5. The aggregate tax basis for the Acquiring Fund Shares received by each Shareholder pursuant to the Reorganization will be the same as the aggregate tax basis for the Acquired Fund shares surrendered by each such Shareholder in exchange therefor;
6. The holding period of the Acquiring Fund Shares to be received by each Shareholder will include the period during which the Acquired Fund shares surrendered in exchange therefor were held (provided such shares in the Acquired Fund were held as capital assets on the date of the Reorganization);
7. The tax basis of the assets of the Acquired Fund acquired by the Acquiring Fund will be the same as the tax basis of such assets of the Acquired Fund immediately prior to the Reorganization; and
8. The holding period of the assets of the Acquired Fund in the hands of the Acquiring Fund will include the period during which those assets were held by the Acquired Fund (except where the investment activities of the Acquiring Fund have the effect of reducing or eliminating such period with respect to an asset).
Prior to the closing of a Reorganization, each Acquired Fund will distribute to its Shareholders any undistributed income and gains to the extent required to avoid entity level tax or as otherwise deemed desirable. The advice of counsel is not binding on the IRS or the courts and neither the Acquired Funds nor the Acquiring Fund has sought a ruling with respect to the tax treatment of the Reorganizations. The opinion of counsel, if delivered, will be based on the Code, regulations issued by the Treasury Department under the Code, court decisions, and administrative pronouncements issued by the IRS with respect to all of the foregoing, all as in effect on the date of the opinion, and all of which may be repealed, revoked or modified thereafter, possibly on a retroactive basis.
After the applicable Reorganization, you will continue to be responsible for tracking the adjusted tax basis and holding period of your shares for federal income tax purposes.
Shareholders should consult their tax advisors regarding the effect, if any, of the proposed Reorganizations in light of their individual circumstances. Because the foregoing discussion only relates to the federal income tax consequences of the proposed Reorganizations, Shareholders should also consult their tax advisors as to state and local tax consequences, if any, of the proposed Reorganizations.
19
Description of Shares
The Acquiring Fund Shares to be issued pursuant to the Reorganization Agreements will, when issued in exchange for the consideration therefor, be fully paid and non-assessable by the Acquiring Fund and transferable without restrictions and will have no preemptive rights. For greater details regarding the Acquiring Fund Shares, see "Shareholder Information" in the Acquiring Fund's Prospectuses attached hereto as Exhibit B.
Capitalization Tables (unaudited)
The following tables set forth the capitalization of each Acquired Fund as of October 31, 2013 and the Acquiring Fund on a pro forma combined basis as if the Reorganizations had occurred on that date:
SD Global Infrastructure (Acquired Fund) | | Class X | | Class Y | | Total | |
Net Assets | | $ | 18,277,707 | | | $ | 7,218,238 | | | $ | 25,495,945 | | |
Pro Forma Adjustments† | | $ | (48,110 | ) | | $ | (18,999 | ) | | $ | (67,109 | ) | |
Net Assets minus Pro Forma Adjustments | | $ | 18,229,597 | | | $ | 7,199,239 | | | $ | 25,428,836 | | |
Shares Outstanding | | | 723,519 | | | | 286,071 | | | | 1,009,590 | | |
Net Asset Value Per Share | | $ | 25.20 | | | $ | 25.17 | | | | — | | |
VIS Global Infrastructure (Acquired Fund) | | Class X | | Class Y | | Total | |
Net Assets | | $ | 58,593,411 | | | $ | 14,445,658 | | | $ | 73,039,069 | | |
Shares Outstanding | | | 6,217,844 | | | | 1,538,410 | | | | 7,756,254 | | |
Net Asset Value Per Share | | $ | 9.42 | | | $ | 9.39 | | | | — | | |
Pro Forma Combined Fund
(UIF Global Infrastructure—with
approval of both Reorganizations) | | Class I | | Class II | | Total | |
Net Assets | | $ | 76,823,008 | | | $ | 21,644,897 | | | $ | 98,467,905 | | |
Shares Outstanding | | | 8,153,045 | | | | 2,305,102 | | | | 10,458,147 | | |
Net Asset Value Per Share | | $ | 9.42 | | | $ | 9.39 | | | | — | | |
Pro Forma Combined Fund
(UIF Global Infrastructure—with
approval of only the Variable Reorganization) | | Class I | | Class II | | Total | |
Net Assets | | $ | 58,593,411 | | | $ | 14,445,658 | | | $ | 73,039,069 | | |
Shares Outstanding | | | 6,217,844 | | | | 1,538,410 | | | | 7,756,254 | | |
Net Asset Value Per Share | | $ | 9.42 | | | $ | 9.39 | | | | — | | |
Pro Forma Combined Fund
(UIF Global Infrastructure—with
approval of only the SD Reorganization) | | Class I | | Class II | | Total | |
Net Assets | | $ | 18,277,707 | | | $ | 7,218,238 | | | $ | 25,495,945 | | |
Shares Outstanding | | | 723,519 | | | | 286,071 | | | | 1,009,590 | | |
Net Asset Value Per Share | | $ | 25.26 | | | $ | 25.23 | | | | — | | |
† Reflects the charge for estimated reorganization expenses of $48,110 and $18,999 by Class X shares and Class Y shares, respectively, of SD Global Infrastructure.
Appraisal Rights
Shareholders will have no appraisal rights in connection with the Reorganizations.
20
COMPARISON OF INVESTMENT OBJECTIVES, PRINCIPAL POLICIES AND RESTRICTIONS
Investment Objectives and Policies
The investment objectives and a description of the investment strategies of each Acquired Fund and the Acquiring Fund are set forth below:
| | | SD Global Infrastructure
(Acquired Fund) | | VIS Global Infrastructure
(Acquired Fund) | | UIF Global Infrastructure
(Acquiring Fund) | |
Investment Objective | | • seeks both capital appreciation and current income. | | • seeks both capital appreciation and current income. | | • seeks both capital appreciation and current income. | |
| | • SD Global Infrastructure's investment objective is a fundamental policy, which may not be changed without approval of Shareholders of SD Global Infrastructure's. | | • VIS Global Infrastructure's investment objective is a fundamental policy, which may not be changed without approval of Shareholders of VIS Global Infrastructure's. | | • UIF Global Infrastructure's investment objective is a non-fundamental policy, which may be changed without approval of Shareholders of UIF Global Infrastructure. | |
Investment Strategy
Each Fund normally invests at least 80% of its assets in equity securities issued by companies located throughout the world that are engaged in the infrastructure business. A company is considered to be in the infrastructure business if it derives at least 50% of its revenues or earnings from, or devotes at least 50% of its assets to, infrastructure-related activities. Infrastructure refers to the systems and networks of energy, transportation, communication and other services required for the normal function of society. Companies in the infrastructure business may be involved in a variety of areas, including, but not limited to, (i) the transmission, distribution, storage or transportation of electricity, oil and gas (and other bulk liquid products), water, and other natural resources used to produce energy, (ii) the construction and operation of renewable power facilities, (iii) the development, ownership, lease, concession, or management of highways, toll roads, tunnels, bridges, pipelines, airports, marine ports, refueling and related facilities, (iv) the provision of communications, including the development, lease, concession, or management of telephone, broadcast and mobile towers, fiber optic/copper cable, and satellite networks, (v) waste-water management and water purification/desalination and (vi) the construction or operation of essential public structures. Each Fund's equity investments may include convertible securities. Each Fund's investments may include securities of small and medium capitalization companies. Each Fund may invest up to 100% of its net assets in foreign securities, which may include emerging market securities. Under normal market conditions, each Fund invests at least 40% of its assets in the securities of issuers located outside of the United States.
The Adviser and/or Sub-Advisers allocate each Fund's assets between the different types of companies in the infrastructure business described above based on relative valuation, underlying company fundamentals, and demographic and macroeconomic considerations. Each Fund has a fundamental policy (i.e., one that cannot be changed without shareholder approval) of investing 25% or more of its assets in the infrastructure industry.
In selecting securities to buy, hold or sell for each Fund, the Adviser and/or Sub-Advisers actively manage each Fund using a combination of bottom-up and top-down methodologies. The value-driven approach to bottom-up security selection utilizes proprietary research models to identify infrastructure companies that offer the best value relative to their underlying assets and growth prospects. The top-down allocation provides exposure to major economic infrastructure sectors and countries, with an overweighting to those sectors/countries that offer the best relative valuation. The Adviser and/or Sub-Advisers generally consider selling a portfolio holding when it determines that the holding no longer satisfies its investment criteria.
The remaining 20% of each Fund's assets may be invested in fixed income securities, equity securities of companies not engaged in the infrastructure business, U.S. government securities issued, or guaranteed as to principal and interest, by the U.S. Government or its agencies or instrumentalities, and asset-backed securities. Each Fund
21
may also invest in real estate investment trusts (commonly known as "REITs") and convertible securities. Each Fund may invest up to 5% of its assets in fixed income securities and convertible securities rated below investment grade (commonly known as "junk bonds").
Investment Restrictions
The investment restrictions adopted by the Acquired Funds and Acquiring Fund as fundamental policies are substantially similar. The Acquiring Fund's investment restrictions are summarized under the caption "Investment Limitations" in the Company's Statement of Additional Information dated December 18, 2013, as it may be amended and supplemented from time to time. The Acquired Funds' investment restrictions are summarized under the caption "II. Description of the Fund and Its Investments and Risks—Fund Policies/Investment Restrictions" in each Trust's Statement of Additional Information dated April 30, 2013, as it may be amended and supplemented from time to time.
A fundamental investment restriction cannot be changed without the vote of the majority of the outstanding voting securities of a Fund, which is defined by the 1940 Act as the lesser of (i) at least 67% of the voting securities of a fund or portfolio present at a meeting if the holders of more than 50% of the outstanding voting securities of a fund or portfolio are present or represented by proxy; or (ii) more than 50% of the outstanding voting securities of a fund or portfolio.
The difference in the investment restrictions adopted by the Funds as fundamental policies is discussed below:
1. Each Acquired Fund may not invest in a manner inconsistent with its classification as a "diversified company" as provided by (i) the 1940 Act, as amended from time to time, (ii) the rules and regulations promulgated by the SEC under the 1940 Act, as amended from time to time or (iii) an exemption or other relief applicable to the Fund from the provisions of the 1940 Act, as amended from time to time. The Acquiring Fund is not subject to this investment restriction.
The differences in the investment restrictions adopted by the Funds as non-fundamental policies are set forth below:
1. SD Global Infrastructure has a non-fundamental policy to not make short sales of securities, except short sales against the box. VIS Global Infrastructure does not have a non-fundamental policy against making short sales of securities. UIF Global Infrastructure has a non-fundamental policy to not make short sales of securities, except short sales against the box, unless the Fund's obligation is covered by unencumbered liquid assets in a segregated account and by collateral held by the lending broker; provided that transactions in futures contracts and options are not deemed to constitute selling securities short.
2. SD Global Infrastructure has a non-fundamental policy to not invest more than 15% of its total assets in "illiquid securities" (securities for which market quotations are not readily available) and repurchase agreements which have a maturity of longer than seven days. For purposes of this policy, securities eligible for sale pursuant to Rule 144A under the Securities Act of 1933, as amended, are not considered illiquid if they are determined to be liquid under procedures adopted by the Trustees of Select Dimensions. VIS Global Infrastructure has a non-fundamental policy to not invest more than 15% of its net assets or such other amount as may be permitted by SEC guidelines in illiquid securities, including restricted securities that have been deemed illiquid. UIF Global Infrastructure has a non-fundamental policy to not invest more than an aggregate of 15% of its net assets, determined at the time of investment, in illiquid securities.
3. The Funds will not invest their assets in securities of any investment company except as may be permitted by the 1940 Act. SD Global Infrastructure may purchase securities of other investment companies in connection with a merger, consolidation, reorganization or acquisition of assets. SD Global Infrastructure does not deem mortgage-backed securities and asset-backed securities to be investment companies. Notwithstanding the forgoing, to the extent permitted by applicable law, SD Global Infrastructure may invest all or some of its short-term cash investments in any money market fund advised or managed by MSIM or its affiliates.
22
4. The Acquiring Fund has a non-fundamental policy to not borrow money, other than temporarily or for extraordinary or emergency purposes or purchase additional securities when borrowings exceed 5% of total (gross) assets. The Acquired Funds have a non-fundamental policy not to borrow except from a bank for temporary or emergency purposes in amounts not exceeding 5% (taken at the lower of cost or current value) of their total assets (not including the amount borrowed).
The following non-fundamental investment restrictions only apply to the Acquiring Fund:
1. The Acquiring Fund will not make loans except (i) by purchasing bonds, debentures or similar obligations (including repurchase agreements, subject to the limitations as described in the Acquiring Fund's prospectuses) that are publicly distributed and (ii) by lending its portfolio securities to banks, brokers, dealers and other financial institutions, so long as such loans are not inconsistent with the 1940 Act or the rules and regulations or interpretations of the Commission thereunder.
2. The Acquiring Fund will not purchase on margin, except for use of short-term credit as may be necessary for the clearance of purchases and sales of securities, but the Acquiring Fund may make margin deposits in connection with transactions in options, futures and options on futures.
ADDITIONAL INFORMATION ABOUT THE ACQUIRING FUND AND THE ACQUIRED FUNDS
General
For a discussion of the organization and operation of the Acquiring Fund, see "Portfolio Summary" and "Fund Management" in the Acquiring Fund's Prospectuses attached hereto as Exhibit B. For a discussion of the organization and operation of the Company, see "General Information—Fund History" in the Statement of Additional Information relating to the Acquiring Fund.
For a discussion of the organization and operation of each Acquired Fund, see "Portfolio Summary" and "Portfolio Details—Fund Management" in each Acquired Fund's prospectuses. For a discussion of the organization and operation of the Trust, see "Fund History" in the Statement of Additional Information relating to the Acquired Funds.
Rights of Acquired Fund Shareholders and Acquiring Fund Shareholders
The Acquiring Fund is organized as a separate portfolio of the Company, a Maryland corporation that is governed by its Charter, Amended and Restated By-Laws, as may be further amended from time to time, and Maryland law. Each Acquired Fund is organized as a separate series of the respective Trust, each of which is a Massachusetts business trust that is governed by its Declaration of Trust, as amended, Amended and Restated By-Laws, as may be amended, and Massachusetts law.
While Maryland corporate law contains many provisions specifically applicable to management investment companies and Massachusetts statutory trust law is specifically drafted to accommodate some of the unique corporate governance needs of management investment companies, certain statutory differences do exist and the Company's and Trusts' organizational documents contain certain differences summarized below. Each Fund is also subject to federal securities laws, including the 1940 Act and the rules and regulations promulgated by the Commission thereunder.
Consistent with Maryland law, the Company's Board of Directors, on behalf of the Acquiring Fund, has authorized the issuance of a specific number of shares of stock, although the organizational documents authorize such Board of Directors to increase or decrease, from time to time, as it considers necessary, the aggregate number of shares of stock or of any class of stock which the Company has the authority to issue. Consistent with Massachusetts law, each Acquired Fund is authorized to issue an unlimited number of shares. The Company's and each Trust's organizational documents allow the respective Boards to create one or more separate investment portfolios and to establish separate series or classes of shares for each portfolio, and, with respect to the Trusts, to further subdivide the shares of any series into one or more classes.
23
Neither the Charter nor the Amended and Restated By-Laws of the Company contain specific provisions regarding the personal liability of Shareholders. However, under the Maryland General Corporation Law, shareholders of a Maryland corporation generally will not be held personally liable for the acts or obligations of the corporation, except that a shareholder may be liable to the extent that (i) consideration for the shares has not been paid, (ii) the shareholder knowingly accepts a distribution in violation of the charter or Maryland law, or (iii) the shareholder receives assets of the corporation upon its liquidation and the corporation is unable to meet its debts and obligations, in which case the shareholder may be liable for such debts and obligations to the extent of the assets received in the distribution.
Under Massachusetts law, shareholders of a business trust may, under certain limited circumstances, be held personally liable as partners for the obligations of the Acquired Funds. However, each respective Declaration of Trust of the Acquired Funds contains an express disclaimer of shareholder liability for acts or obligations of the Acquired Funds, requires that notice of such Fund obligations include such disclaimer, and provides for indemnification out of the Fund's property for any shareholder held personally liable for the obligations of the Acquired Funds.
No Fund is required, and no Fund anticipates, holding annual meetings of its Shareholders. Each Fund has certain mechanics whereby Shareholders can call a special meeting of their Fund. Shareholders generally have the right to approve investment advisory agreements, elect trustees/directors, change fundamental investment policies, ratify the selection of independent auditors and vote on other matters required by law or the organizational documents of the Company or Trusts, as applicable, or deemed desirable by the Board of Directors or Board of Trustees, as applicable.
The business of the Acquiring Fund and the Acquired Funds is supervised by the respective Boards of the Company and the Trusts. The responsibilities, powers and fiduciary duties of directors under Maryland law are generally similar in certain respects to those for trustees under Massachusetts law, although significant differences do exist and Shareholders should refer to the provisions of the Company's and each Trust's applicable organizational documents and applicable law for a more thorough comparison. For the Acquiring Fund and the Acquired Funds, director/trustee vacancies generally may be filled by approval of a majority of the directors/trustees then in office subject to provisions of the 1940 Act. The term of a director/trustee lasts until the election of such person's successor, or until such person's earlier resignation, removal or death. In addition, each Acquired Fund's Declaration of Trust specifies that a Trustee's term will terminate in the event of death, resignation, removal, bankruptcy, adjudicated incompetence or other incapacity to perform the duties of the office of a Trustee. The Amended and Restated By-Laws of the Company provide that Directors of the Company may be removed with or without cause by vote of a majority of the shares present in person or by proxy at a meeting, provided a quorum is present. Trustees of each Acquired Funds may be removed with or without cause by the action of the Shareholders of record of not less than two-thirds of the shares outstanding or by the action of two-thirds of the remaining Trustees.
The foregoing is only a summary of certain differences between the Acquiring Fund and the Acquired Funds under applicable law and their organizational documents. It is not intended to be a complete list of differences and Shareholders should refer to the provisions of the Company's and the Trust's applicable organizational documents for a more thorough comparison. Such documents are filed as part of each Fund's registration statements with the Commission, and Shareholders may obtain copies of such documents as described herein.
Financial Information
The Acquiring Fund is a newly created series of the Company and has not yet commenced operations. As a result, the Acquiring Fund has no financial statements. For certain financial information about each Acquired Fund, see "Financial Highlights" with respect to such Fund in its Prospectuses.
Shareholder Proposals
The Funds are not required and do not intend to hold regular shareholder meetings unless shareholder action is required in accordance with the 1940 Act. Shareholders who would like to submit proposals for consideration at future shareholder meetings of an Acquired Fund (in the event the applicable Reorganization is not completed) or
24
the Acquiring Fund should send written proposals to Mary E. Mullin, Secretary, 522 Fifth Avenue, New York, NY 10036. To be considered for presentation at a Shareholders' meeting, rules promulgated by the Commission require that, among other things, a shareholder's proposal must be received at the offices of the applicable Fund within a reasonable time before a solicitation is made. Timely submission of a proposal does not necessarily mean that such proposal will be included.
Management
For information about the Board of Directors, MSIM and the Distributor of the Acquiring Fund, see "Fund Management" in the Acquiring Fund's Prospectuses attached hereto as Exhibit B and "Management of the Fund" in the Company's Statement of Additional Information.
For information about the Board of Trustees, MSIM and the Distributor of the Acquired Funds, see "Portfolio Details—Fund Management" in each Acquired Fund's prospectuses and "Management of the Fund" in each Trust's Statement of Additional Information.
Description of Shares and Shareholder Inquiries
For a description of the nature and most significant attributes of shares of the Acquiring Fund, and information regarding shareholder inquiries, see "General Information" in the Company's Statement of Additional Information as well as "Shareholder Information" and "Where to Find Additional Information" in the Acquiring Fund's Prospectuses attached hereto as Exhibit B.
For a description of the nature and most significant attributes of shares of the Acquired Funds, and information regarding shareholder inquiries, see "VII. Capital Stock and Other Securities" in each Trust's Statement of Additional Information and "Shareholder Information—Additional Information" in each Acquired Fund's prospectuses.
Dividends, Distributions and Taxes
For a discussion of the Acquiring Fund's policies with respect to dividends, distributions and taxes, see "Shareholder Information—Dividends and Distributions" and "Shareholder Information—Taxes" in the Acquiring Fund's Prospectuses, "Taxes" in the Company's Statement of Additional Information, and the discussions herein under "Synopsis—Comparison of the Acquired Funds and Acquiring Fund—Dividends," "Synopsis—Tax Consequences of the Reorganizations" and "The Reorganizations—Tax Aspects of the Reorganizations."
For a discussion of each Acquired Fund's policies with respect to dividends, distributions and taxes, see "Shareholder Information—Distributions" in each Acquired Fund's prospectuses, "IX. Taxation of the Portfolios and Shareholders" in the Trust's Statement of Additional Information, and the discussions herein under "Synopsis—Comparison of the Acquired Funds and Acquiring Fund—Dividends," "Synopsis—Tax Consequences of the Reorganizations" and "The Reorganizations—Tax Aspects of the Reorganizations."
Purchases and Redemptions
For a discussion of how the Acquiring Fund's shares may be purchased and redeemed, see "Shareholder Information—Purchasing and Selling Portfolio Shares" in the Acquiring Fund's Prospectuses, "Purchase of Shares" and "Redemption of Shares" in the Company's Statement of Additional Information, and the discussion herein under "Synopsis—Comparison of the Acquired Funds and Acquiring Fund—Purchases and Redemptions."
For a discussion of how each Acquired Fund's shares may be purchased and redeemed, see "Shareholder Information—Purchases and Sales of Portfolio Shares" in each Acquired Fund's prospectuses, "VIII. Purchase, Redemption and Pricing of Shares" in the Trust's Statement of Additional Information, and the discussion herein under "Synopsis—Comparison of the Acquired Funds and Acquiring Fund—Purchases and Redemptions."
For a discussion of the Acquiring Fund's policies with respect to frequent purchases and redemptions, see "Shareholder Information—Frequent Purchases and Redemptions of Shares" in the Acquiring Fund's Prospectuses.
25
For a discussion of each Acquired Fund's policies with respect to frequent purchases and redemptions, see "Shareholder Information—Frequent Purchases and Redemptions of Shares" in each Acquired Fund's prospectuses.
SHARE INFORMATION
The following persons were known to own of record or beneficially 5% or more of the outstanding shares of a class of each Acquired Fund as of the Record Date:
SD Global Infrastructure: | |
Shareholder | | Percentage of
Outstanding Shares | |
Class X | |
Hartford ITT Life & Annuity
P.O. Box 2999
Hartford, CT 06104-2999 | | | 90.62 | % | |
Hartford Life
P.O. Box 2999
Hartford, CT 06104-2999 | | | 8.54 | % | |
Class Y | |
Hartford ITT Life & Annuity
P.O. Box 2999
Hartford, CT 06104-2999 | | | 91.16 | % | |
Hartford Life
P.O. Box 2999
Hartford, CT 06104-2999 | | | 8.84 | % | |
VIS Global Infrastructure: | |
Shareholder | | Percentage of
Outstanding Shares | |
Class X | |
Allstate Life Insurance Co.
One Security Benefit Place
Topeka, KS 66636-1000 | | | 92.94 | % | |
Allstate Life Insurance Co of NY.
One Security Benefit Place
Topeka, KS 66636-1000 | | | 5.67 | % | |
Class Y | |
Allstate Life Insurance Co.
One Security Benefit Place
Topeka, KS 66636-1000 | | | 98.29 | % | |
The Acquiring Fund is a newly created series of the Company and had no outstanding shares as of the date of this Proxy Statement and Prospectus.
For regulatory reasons, shares of the Acquired Funds are only available to separate accounts of participating insurance companies, thus the Board members and officers of the Trusts and the Company do not own shares of the Acquired Funds.
26
FINANCIAL STATEMENTS AND EXPERTS
The Acquiring Fund is a newly created series of the Company and has not yet commenced operations. As a result, the Acquiring Fund has no financial statements.
The financial statements of the Acquired Funds, each for the fiscal year ended December 31, 2012, that are incorporated by reference in the Statement of Additional Information relating to the Registration Statement on Form N-14 of which this Joint Proxy Statement and Prospectus forms a part, have been audited by Ernst & Young LLP the Acquired Funds' independent registered public accounting firm (except that the financial information for the Acquired Fund for the fiscal years ended prior to 2011 was audited by the Acquired Fund's previous independent registered public accounting firm). The financial statements for the Acquired Funds, each for the six-month period ended June 30, 2013, have not been audited and are also incorporated by reference in the Statement of Additional Information relating to the Registration Statement on Form N-14 of which this Proxy Statement and Prospectus forms a part. Each set of audited financial statements is incorporated herein by reference in reliance upon such reports given upon the authority of said independent registered public accounting firms as experts in accounting and auditing.
LEGAL MATTERS
Certain legal matters concerning the issuance of the Acquiring Fund Shares will be passed upon by Dechert LLP, New York, NY. Such firm will rely on Maryland counsel as to certain matters of Maryland law.
AVAILABLE INFORMATION
Additional information about each Fund is available, as applicable, in the following documents which are incorporated herein by reference: (i) the Acquiring Fund's Prospectuses dated December 18, 2013, attached to this Joint Proxy Statement and Prospectus as Exhibit B, which Prospectuses form a part of Post-Effective Amendment No. 53 to the Company's Registration Statement on Form N-1A (File Nos. 333-03013; 811-07607); (ii) SD Global Infrastructure's prospectuses dated April 30, 2013, which Prospectuses form a part of Post-Effective Amendment No. 34 to Select Dimensions' Registration Statement on Form N-1A (File Nos. 33-54047; 811-07185); VIS Global Infrastructure's prospectuses dated April 30, 2013, which Prospectuses form a part of Post-Effective Amendment No. 52 to Variable Investment's Registration Statement on Form N-1A (File Nos. 2-82510; 811-03692); (iii) each Trust's Annual Report for its fiscal year ended December 31, 2012; and (iv) each Trust's Semi-Annual Report for the six-month period ended June 30, 2013.
Each Fund is subject to the informational requirements of the Securities Exchange Act of 1934, as amended, and in accordance therewith, files reports and other information with the Commission. Proxy materials, reports and other information about the Funds which are of public record can be viewed and copied at the Commission's Public Reference Room in Washington, D.C. Information about the Reference Room's operations may be obtained by calling the Commission at (202) 551-8090. Reports and other information about the Funds and the Trust are available on the EDGAR Database on the Commission's Internet site (www.sec.gov) and copies of this information may be obtained, after paying a duplicating fee, by electronic request at the following E-mail address: publicinfo@sec.gov, or by writing the Public Reference Branch, Office of Consumer Affairs and Information Services, Securities and Exchange Commission, Washington, D.C. 20549-1520.
OTHER BUSINESS
Management of the Acquired Funds knows of no business other than the matters specified above which will be presented at the Meeting. Since matters not known at the time of the solicitation may come before the Meeting, the Proxy as solicited confers discretionary authority with respect to such matters as properly come before the Meeting, including any adjournment or adjournments thereof, and it is the intention of the persons named as attorneys-in-fact in the Proxy to vote this Proxy in accordance with their judgment on such matters.
By Order of the Boards of Trustees,
Mary E. Mullin
Secretary
January [ ], 2014
27
Exhibit A-1
AGREEMENT AND PLAN OF REORGANIZATION
THIS AGREEMENT AND PLAN OF REORGANIZATION ("Agreement") is made as of October 3, 2013, by and between THE UNIVERSAL INSTITUTIONAL FUNDS, INC. (the "Company"), a Maryland corporation, on behalf of the GLOBAL INFRASTRUCTURE PORTFOLIO ("Acquiring Fund"), and MORGAN STANLEY SELECT DIMENSIONS INVESTMENT SERIES (the "Trust"), a Massachusetts business trust, on behalf of the GLOBAL INFRASTRUCTURE PORTFOLIO ("Acquired Fund").
This Agreement is intended to be and is adopted as a "plan of reorganization" within the meaning of Treas. Reg. 1.368-2(g), for a reorganization under Section 368(a)(1) of the Internal Revenue Code of 1986, as amended (the "Code"). The reorganization ("Reorganization") will consist of the transfer to Acquiring Fund of substantially all of the assets of Acquired Fund in exchange for the assumption by Acquiring Fund of all stated liabilities of Acquired Fund and the issuance by Acquiring Fund of shares of common stock, par value $0.001 per share (the "Acquiring Fund Shares"), to be distributed, after the Closing Date hereinafter referred to, to the shareholders of Acquired Fund in liquidation of Acquired Fund as provided herein, all upon the terms and conditions hereinafter set forth in this Agreement.
In consideration of the premises and of the covenants and agreements hereinafter set forth, the parties hereto covenant and agree as follows:
1. The Reorganization and Liquidation of Acquired Fund
1.1. Subject to the terms and conditions herein set forth and on the basis of the representations and warranties contained herein, the Trust, on behalf of Acquired Fund, agrees to transfer the Acquired Fund Assets (as defined in paragraph 1.2) to Acquiring Fund, and the Company, on behalf of Acquiring Fund, agrees in exchange therefor to assume all of Acquired Fund's stated liabilities on the Closing Date as set forth in paragraph 1.3 and to deliver to Acquired Fund the number of Acquiring Fund Shares, including fractional Acquiring Fund Shares, determined in the manner set forth in paragraph 2.3. Such transactions shall take place at the closing provided for in paragraph 3.1 ("Closing").
1.2. (a) The "Acquired Fund Assets" shall consist of all property, including without limitation, all cash, cash equivalents, securities and dividend and interest receivables owned by Acquired Fund, and any deferred or prepaid expenses shown as an asset on Acquired Fund's books on the Valuation Date.
(b) On or prior to the Valuation Date, the Trust, on behalf of Acquired Fund, will provide Acquiring Fund with a list of all of Acquired Fund's assets to be transferred to Acquiring Fund and a list of the stated liabilities to be assumed by Acquiring Fund pursuant to this Agreement. The Trust, on behalf of Acquired Fund, reserves the right to sell any of the securities on such list but will not, without the prior approval of the Company, on behalf of Acquiring Fund, acquire any additional securities other than securities of the type in which Acquiring Fund is permitted to invest and in amounts agreed to in writing by the Company, on behalf of Acquiring Fund. The Company, on behalf of Acquiring Fund, will, within a reasonable time prior to the Valuation Date, furnish Acquired Fund with a statement of Acquiring Fund's investment objective, policies and restrictions and a list of the securities, if any, on the list referred to in the first sentence of this paragraph that do not conform to Acquiring Fund's investment objective, policies and restrictions. In the event that Acquired Fund holds any investments that Acquiring Fund is not permitted to hold, Acquired Fund will dispose of such securities on or prior to the Valuation Date. In addition, if it is determined that the portfolios of Acquired Fund and Acquiring Fund, when aggregated, would contain investments exceeding certain percentage limitations imposed upon Acquiring Fund with respect to such investments, Acquired Fund if requested by the Company, on behalf of Acquiring Fund, will, on or prior to the Valuation Date, dispose of and/or reinvest a sufficient amount of such investments as may be necessary to avoid violating such limitations as of the Closing Date (as defined in paragraph 3.1).
1.3. The Trust, on behalf of Acquired Fund, will endeavor to discharge all of Acquired Fund's liabilities and obligations on or prior to the Valuation Date. The Company, on behalf of Acquiring Fund, will assume all stated
A-1-1
liabilities, which includes, without limitation, all expenses, costs, charges and reserves reflected on an unaudited Statement of Assets and Liabilities of Acquired Fund prepared by the Treasurer of Acquired Fund as of the Valuation Date in accordance with generally accepted accounting principles consistently applied from the prior audited period.
1.4. In order for the Acquired Fund to comply with Section 852(a)(1) of the Code and to avoid having any investment company taxable income or net capital gain (as defined in Sections 852(b)(2) and 1222(11) of the Code, respectively) in the short taxable year ending with its dissolution, the Trust, on behalf of Acquired Fund, will on or before the Valuation Date (a) declare a dividend in an amount large enough so that Acquired Fund will have declared dividends of substantially all of its investment company taxable income and net capital gain, if any, for such taxable year (determined without regard to any deduction for dividends paid) and (b) distribute such dividend.
1.5. On the Closing Date or as soon as practicable thereafter, the Trust, on behalf of Acquired Fund, will distribute Acquiring Fund Shares received by Acquired Fund pursuant to paragraph 1.1 pro rata to Acquired Fund's shareholders of record determined as of the close of business on the Valuation Date ("Acquired Fund Shareholders"). Each Acquired Fund Shareholder will receive the class of shares of Acquiring Fund that corresponds to the class of shares of Acquired Fund currently held by that Acquired Fund shareholder. Accordingly, the Acquiring Fund Shares will be distributed as follows: each of the Class I shares of Acquiring Fund will be distributed to holders of Class X shares of Acquired Fund and each of the Class II shares of Acquiring Fund will be distributed to holders of Class Y shares of Acquired Fund. Such distribution will be accomplished by an instruction, signed by Acquired Fund's Secretary, to transfer Acquiring Fund Shares then credited to Acquired Fund's account on the books of Acquiring Fund to open accounts on the books of Acquiring Fund in the names of the Acquired Fund shareholders and representing the respective pro rata number of Acquiring Fund Shares due such Acquired Fund shareholders. All issued and outstanding shares of Acquired Fund simultaneously will be canceled on Acquired Fund's books.
1.6. Ownership of Acquiring Fund Shares will be shown on the books of Acquiring Fund's transfer agent. Acquiring Fund Shares will be issued in the manner described in Acquiring Fund's current Prospectus, as supplemented, and the Company's Statement of Additional Information.
1.7. Any transfer taxes payable upon issuance of Acquiring Fund Shares in a name other than the registered holder of Acquiring Fund Shares on Acquired Fund's books as of the close of business on the Valuation Date shall, as a condition of such issuance and transfer, be paid by the person to whom Acquiring Fund Shares are to be issued and transferred.
1.8. Any reporting responsibility of Acquired Fund is and shall remain the responsibility of Acquired Fund up to and including the date on which Acquired Fund is dissolved and terminated pursuant to paragraph 1.9.
1.9. Within one year after the Closing Date, the Trust, on behalf of Acquired Fund, shall pay or make provision for the payment of all Acquired Fund's liabilities and taxes. If and to the extent that any trust, escrow account, or other similar entity continues after the close of such one-year period in connection either with making provision for payment of liabilities or taxes or with distributions to shareholders of Acquired Fund, such entity shall either (i) qualify as a liquidating trust under Section 7701 of the Code (and applicable Treasury Regulations thereunder) or other entity which does not constitute a continuation of Acquired Fund for federal income tax purposes, or (ii) be subject to a waiver under Section 368(a)(2)(G)(ii) of the complete distribution requirement of Section 368(a)(2)(G)(i) of the Code. Acquired Fund shall be terminated following the making of all distributions pursuant to paragraph 1.5.
1.10. Copies of all books and records maintained on behalf of Acquired Fund in connection with its obligations under the Investment Company Act of 1940, as amended (the "1940 Act"), the Code, state blue sky laws or otherwise in connection with this Agreement will promptly be delivered after the Closing to officers of Acquiring Fund or their designee, and Acquiring Fund or its designee shall comply with applicable record retention requirements to which Acquired Fund is subject under the 1940 Act.
A-1-2
2. Valuation
2.1. The value of the Acquired Fund Assets shall be the value of such assets computed as of 4:00 p.m. on the New York Stock Exchange on the third business day following the receipt of the requisite approval of this Agreement by shareholders of Acquired Fund or at such time on such earlier or later date after such approval as may be mutually agreed upon in writing (such time and date being hereinafter called the "Valuation Date"), using the valuation procedures set forth in Acquiring Fund's then current Prospectus, as supplemented, and the Company's Statement of Additional Information.
2.2. The net asset value of an Acquiring Fund Share shall be the net asset value per share computed on the Valuation Date, using the valuation procedures set forth in Acquiring Fund's then current Prospectus, as supplemented, and the Company's Statement of Additional Information.
2.3. The number of Acquiring Fund Shares (including fractional shares, if any) to be issued hereunder shall be determined, with respect to each class, by dividing the aggregate net asset value of each class of Acquired Fund shares (determined in accordance with paragraph 2.1) by the net asset value per share of the corresponding class of shares of Acquiring Fund (determined in accordance with paragraph 2.2).
2.4. All computations of value shall be made by Morgan Stanley Services Company Inc. ("Morgan Stanley Services") in accordance with its regular practice in pricing Acquiring Fund. The Company, on behalf of Acquiring Fund, shall cause Morgan Stanley Services to deliver a copy of Acquiring Fund's valuation report at the Closing.
3. Closing and Closing Date
3.1. The Closing shall take place on the Valuation Date or on the next business day following the Valuation Date (the "Closing Date"). The Closing shall be held as of 9:00 a.m. Eastern time, or at such other time as the parties may agree. The Closing shall be held in a location mutually agreeable to the parties hereto. All acts taking place at the Closing shall be deemed to take place simultaneously as of 9:00 a.m. Eastern time on the Closing Date unless otherwise provided.
3.2. Portfolio securities held by Acquired Fund and represented by a certificate or other written instrument shall be presented by it or on its behalf to State Street Bank and Trust Company (the "Custodian"), as custodian for Acquiring Fund, for examination no later than five business days preceding the Valuation Date. Such portfolio securities (together with any cash or other assets) shall be delivered by Acquired Fund to the Custodian for the account of Acquiring Fund on or before the Closing Date in conformity with applicable custody provisions under the 1940 Act and duly endorsed in proper form for transfer in such condition as to constitute good delivery thereof in accordance with the custom of brokers. The portfolio securities shall be accompanied by all necessary federal and state stock transfer stamps or a check for the appropriate purchase price of such stamps. Portfolio securities and instruments deposited with a securities depository (as defined in Rule 17f-4 under the 1940 Act) shall be delivered on or before the Closing Date by book-entry in accordance with customary practices of such depository and the Custodian. The cash delivered shall be in the form of a Federal Funds wire, payable to the order of "State Street Bank and Trust Company, Custodian for The Universal Institutional Funds, Inc."
3.3. In the event that on the Valuation Date, (a) the New York Stock Exchange shall be closed to trading or trading thereon shall be restricted or (b) trading or the reporting of trading on such Exchange or elsewhere shall be disrupted so that, in the judgment of both the Company, on behalf of Acquiring Fund, and the Trust, on behalf of Acquired Fund, accurate appraisal of the value of the net assets of Acquiring Fund or the Acquired Fund Assets is impracticable, the Valuation Date shall be postponed until the first business day after the day when trading shall have been fully resumed without restriction or disruption and reporting shall have been restored.
3.4. If requested, the Trust, on behalf of Acquired Fund, shall deliver to the Company, on behalf of Acquiring Fund, or its designee (a) at the Closing, a list, certified by the Trust's Secretary, of the names, addresses and taxpayer identification numbers of the Acquired Fund shareholders and the number and percentage ownership of outstanding Acquired Fund shares owned by each such Acquired Fund shareholder, all as of the Valuation Date, and (b) as soon as practicable after the Closing, all original documentation (including Internal Revenue Service forms, certificates,
A-1-3
certifications and correspondence) relating to the Acquired Fund shareholders' taxpayer identification numbers and their liability for or exemption from back-up withholding. The Company, on behalf of Acquiring Fund, shall issue and deliver to such Secretary a confirmation evidencing delivery of Acquiring Fund Shares to be credited on the Closing Date to Acquired Fund or provide evidence satisfactory to Acquired Fund that such Acquiring Fund Shares have been credited to Acquired Fund's account on the books of Acquiring Fund. At the Closing, each party shall deliver to the other such bills of sale, checks, assignments, share certificates, if any, receipts or other documents as such other party or its counsel may reasonably request.
4. Covenants of Acquiring Fund and Acquired Fund
4.1. Except as otherwise expressly provided herein, the Trust, on behalf of Acquired Fund, and the Company, on behalf of Acquiring Fund, will operate in the ordinary course between the date hereof and the Closing Date, it being understood that such ordinary course of business will include customary dividends and other distributions.
4.2. The Company will prepare and file with the Securities and Exchange Commission ("Commission") a registration statement on Form N-14 under the Securities Act of 1933, as amended ("1933 Act"), relating to Acquiring Fund Shares ("Registration Statement"). The Trust will provide the Proxy Materials as described in paragraph 4.3 below for inclusion in the Registration Statement. The Company, on behalf of Acquiring Fund, and the Trust, on behalf of Acquired Fund, agree that each of Acquired Fund and Acquiring Fund will further provide such other information and documents as are reasonably necessary for the preparation of the Registration Statement.
4.3. The Trust, on behalf of Acquired Fund, will call a meeting of Acquired Fund's shareholders to consider and act upon this Agreement and to take all other action necessary to obtain approval of the transactions contemplated herein. The Trust, on behalf of Acquired Fund, will prepare the notice of meeting, form of proxy and proxy statement (collectively, "Proxy Materials") to be used in connection with such meeting; provided that the Company, on behalf of Acquiring Fund, will furnish the Trust, on behalf of Acquired Fund, with its currently effective prospectus for inclusion in the Proxy Materials and with such other information relating to Acquiring Fund as is reasonably necessary for the preparation of the Proxy Materials.
4.4. The Trust, on behalf of Acquired Fund, will assist Acquiring Fund in obtaining such information as Acquiring Fund reasonably requests concerning the beneficial ownership of Acquired Fund shares.
4.5. Subject to the provisions of this Agreement, the Company, on behalf of Acquiring Fund, and the Trust, on behalf of Acquired Fund, agree that each respective Fund will take, or cause to be taken, all action, and do or cause to be done, all things reasonably necessary, proper or advisable to consummate and make effective the transactions contemplated by this Agreement.
4.6. The Trust, on behalf of Acquired Fund, shall furnish or cause to be furnished to Acquiring Fund within 30 days after the Closing Date a statement of Acquired Fund's assets and liabilities as of the Closing Date, which statement shall be certified by the Acquired Fund's Treasurer and shall be in accordance with generally accepted accounting principles consistently applied. As promptly as practicable, but in any case within 60 days after the Closing Date, Acquired Fund shall furnish Acquiring Fund, in such form as is reasonably satisfactory to Acquiring Fund, a statement certified by the Trust's Treasurer of Acquired Fund's earnings and profits for federal income tax purposes that will be carried over to Acquiring Fund pursuant to Section 381 of the Code.
4.7. As soon after the Closing Date as is reasonably practicable, the Company (a) shall prepare and file all federal and other tax returns and reports of Acquired Fund required by law to be filed with respect to all periods ending on or before the Closing Date but not theretofore filed and (b) shall pay all federal and other taxes shown as due thereon and/or all federal and other taxes that were unpaid as of the Closing Date, including without limitation, all taxes for which the provision for payment was made as of the Closing Date (as represented in paragraph 5.2(k)).
4.8. The Company agrees to use all reasonable efforts to obtain the approvals and authorizations required by the 1933 Act and the 1940 Act and to make such filings required by the state Blue Sky and securities laws as it may deem appropriate in order to continue the Acquiring Fund's operations after the Closing Date.
A-1-4
5. Representations and Warranties
5.1. The Company, on behalf of Acquiring Fund, represents and warrants to Acquired Fund, as follows:
(a) Acquiring Fund is a series of the Company, a validly existing Maryland corporation with full power to carry on its business as presently conducted;
(b) The Company is a duly registered, open-end management investment company which offers its shares only to insurance companies for accounts which they establish to fund variable life insurance and variable annuity contracts and to other entities under qualified pension and retirement plans, and its registration with the Commission as an investment company under the 1940 Act and the registration of its shares under the 1933 Act are in full force and effect;
(c) All of the issued and outstanding shares of Acquiring Fund have been offered and sold in compliance in all material respects with applicable registration requirements of the 1933 Act and state securities laws. Shares of Acquiring Fund are registered in all jurisdictions in which they are required to be registered under state securities laws and other laws, and said registrations, including any periodic reports or supplemental filings, are complete and current, all fees required to be paid have been paid, and Acquiring Fund is not subject to any stop order and is fully qualified to sell its shares in each state in which its shares have been registered;
(d) The current Prospectus of the Acquiring Fund and Statement of Additional Information of the Company conform in all material respects to the applicable requirements of the 1933 Act and the 1940 Act and the regulations thereunder and do not include any untrue statement of a material fact or omit to state any material fact required to be stated therein or necessary to make the statements therein, in light of the circumstances under which they were made, not misleading;
(e) The Company is not in, and the execution, delivery and performance of this Agreement will not result in a, material violation of any provision of its Articles of Incorporation or By-Laws, each as amended, or of any agreement, indenture, instrument, contract, lease or other undertaking to which Acquiring Fund is a party or by which it is bound;
(f) No litigation or administrative proceeding or investigation of or before any court or governmental body is presently pending or, to its knowledge, threatened against the Company, Acquiring Fund or any of their properties or assets which, if adversely determined, would materially and adversely affect Acquiring Fund's financial condition or the conduct of its business; and the Company knows of no facts that might form the basis for the institution of such proceedings and is not a party to or subject to the provisions of any order, decree or judgment of any court or governmental body which materially and adversely affects, or is reasonably likely to materially and adversely affect, its business or its ability to consummate the transactions herein contemplated;
(g) The Acquiring Fund is, and will be on the Closing Date, a newly created series of the Company, without assets (other than seed capital) or liabilities, formed for the purpose of receiving the Acquired Fund Assets in connection with the Reorganization and, accordingly, the Acquiring Fund has not prepared books of account and related records or financial statements or issued any shares except those issued in a private placement to Morgan Stanley Investment Management Inc. or its affiliate to secure any required initial shareholder approvals;
(h) All issued and outstanding Acquiring Fund Shares are, and at the Closing Date will be, duly and validly issued and outstanding, fully paid and non-assessable with no personal liability attaching to the ownership thereof. Acquiring Fund does not have outstanding any options, warrants or other rights to subscribe for or purchase any of its shares;
(i) The execution, delivery and performance of this Agreement have been duly authorized by all necessary action on the part of the Company, and this Agreement constitutes a valid and binding obligation of Acquiring Fund enforceable in accordance with its terms, subject as to enforcement, to bankruptcy, insolvency, reorganization, moratorium and other laws relating to or affecting creditors' rights and to general equity principles. No other consents, authorizations or approvals are necessary in connection with Acquiring Fund's performance of this Agreement;
A-1-5
(j) Acquiring Fund Shares to be issued and delivered to Acquired Fund, for the account of the Acquired Fund shareholders, pursuant to the terms of this Agreement will at the Closing Date have been duly authorized and, when so issued and delivered, will be duly and validly issued Acquiring Fund Shares, and will be fully paid and non-assessable with no personal liability attaching to the ownership thereof;
(k) All material federal and other tax returns and reports of Acquiring Fund required by law to be filed on or before the Closing Date have been filed and are correct, and all federal and other taxes shown as due or required to be shown as due on said returns and reports have been paid or provision has been made for the payment thereof, and to the best of the Company's knowledge, no such return is currently under audit and no assessment has been asserted with respect to any such return;
(l) For each taxable year since its inception, Acquiring Fund has met the requirements of Subchapter M of the Code for qualification and treatment as a "regulated investment company" and neither the execution or delivery of nor the performance of the Company's obligations with respect to Acquiring Fund under this Agreement will adversely affect, and no other events are reasonably likely to occur which will adversely affect, the ability of Acquiring Fund to continue to meet the requirements of Subchapter M of the Code;
(m) Since December 31, 2012, there has been no change by Acquiring Fund in accounting methods, principles, or practices, including those required by generally accepted accounting principles;
(n) The information furnished or to be furnished by the Company on behalf of Acquiring Fund for use in registration statements, proxy materials and other documents which may be necessary in connection with the transactions contemplated hereby shall be accurate and complete in all material respects and shall comply in all material respects with federal securities and other laws and regulations applicable thereto; and
(o) The Proxy Materials to be included in the Registration Statement (only insofar as they relate to Acquiring Fund) will, on the effective date of the Registration Statement and on the Closing Date, not contain any untrue statement of a material fact or omit to state a material fact required to be stated therein or necessary to make the statements therein, in light of the circumstances under which such statements were made, not materially misleading.
5.2. The Trust, on behalf of Acquired Fund, represents and warrants to the Company, on behalf of Acquiring Fund as follows:
(a) Acquired Fund is a series of the Trust, a validly existing Massachusetts business trust with full power to carry on its business as presently conducted;
(b) The Trust is a duly registered, open-end management investment company which offers its shares only to insurance companies for accounts which they establish to fund variable life insurance and variable annuity contracts and to other entities under qualified pension and retirement plans, and its registration with the Commission as an investment company under the 1940 Act and the registration of its shares under the 1933 Act are in full force and effect;
(c) All of the issued and outstanding shares of Acquired Fund have been offered and sold in compliance in all material respects with applicable requirements of the 1933 Act and state securities laws. Shares of Acquired Fund are registered in all jurisdictions in which they are required to be registered and said registrations, including any periodic reports or supplemental filings, are complete and current, all fees required to be paid have been paid, and Acquired Fund is not subject to any stop order and is fully qualified to sell its shares in each state in which its shares have been registered;
(d) The current Prospectus, as supplemented, of Acquired Fund and Statement of Additional Information of the Trust conform in all material respects to the applicable requirements of the 1933 Act and the 1940 Act and the regulations thereunder and do not include any untrue statement of a material fact or omit to state any material fact required to be stated therein or necessary to make the statements therein, in light of the circumstances under which they were made, not misleading;
A-1-6
(e) The Trust is not in, and the execution, delivery and performance of this Agreement will not result in a, material violation of any provision of its Declaration of Trust or By-Laws, as amended, or of any agreement, indenture, instrument, contract, lease or other undertaking to which Acquired Fund is a party or by which it is bound;
(f) No litigation or administrative proceeding or investigation of or before any court or governmental body is presently pending or, to its knowledge, threatened against the Trust or any of its properties or assets which, if adversely determined, would materially and adversely affect Acquired Fund's financial condition or the conduct of its business; and the Trust knows of no facts that might form the basis for the institution of such proceedings and is not a party to or subject to the provisions of any order, decree or judgment of any court or governmental body which materially and adversely affects, or is reasonably likely to materially and adversely affect, its business or its ability to consummate the transactions herein contemplated;
(g) The Statement of Assets and Liabilities, Statement of Operations, Statement of Changes in Net Assets and Financial Highlights of Acquired Fund for its last completed fiscal year, audited by Ernst & Young LLP (except that the financial information for the Acquired Fund for the fiscal year ended prior to 2011 was audited by the Acquired Fund's prior independent registered public accounting firm) (copies of which have been or will be furnished to Acquiring Fund) fairly present, in all material respects, Acquired Fund's financial condition as of such date, and its results of operations, changes in its net assets and financial highlights for such period in accordance with generally accepted accounting principles, and as of such date there were no known liabilities of Acquired Fund (contingent or otherwise) not disclosed therein that would be required in accordance with generally accepted accounting principles to be disclosed therein;
(h) Acquired Fund has no material contracts or other commitments (other than this Agreement) that will be terminated with liability to it prior to the Closing Date;
(i) All issued and outstanding shares of Acquired Fund are, and at the Closing Date will be, duly and validly issued and outstanding, fully paid and non-assessable with no personal liability attaching to the ownership thereof. Acquired Fund does not have outstanding any options, warrants or other rights to subscribe for or purchase any of its shares, nor is there outstanding any security convertible to any of its shares. All such shares will, at the time of Closing, be held by the persons and in the amounts set forth in the list of shareholders submitted to Acquiring Fund pursuant to paragraph 3.4;
(j) The execution, delivery and performance of this Agreement will have been duly authorized prior to the Closing Date by all necessary action on the part of the Trust, and subject to the approval of Acquired Fund's shareholders, this Agreement constitutes a valid and binding obligation of Acquired Fund, enforceable in accordance with its terms, subject as to enforcement to bankruptcy, insolvency, reorganization, moratorium and other laws relating to or affecting creditors' rights and to general equity principles. No other consents, authorizations or approvals are necessary in connection with Acquired Fund's performance of this Agreement;
(k) All material federal and other tax returns and reports of Acquired Fund required by law to be filed on or before the Closing Date shall have been filed and are correct and all federal and other taxes shown as due or required to be shown as due on said returns and reports have been paid or provision has been made for the payment thereof, and to the best of the Trust's knowledge, no such return is currently under audit and no assessment has been asserted with respect to any such return;
(l) For each taxable year since its inception, Acquired Fund has met all the requirements of Subchapter M of the Code for qualification and treatment as a "regulated investment company" and neither the execution or delivery of nor the performance of Acquired Fund's obligations under this Agreement will adversely affect, and no other events are reasonably likely to occur which will adversely affect, the ability of Acquired Fund to continue to meet the requirements of Subchapter M of the Code for its final taxable year ending on the Closing Date;
(m) At the Closing Date, Acquired Fund will have good and valid title to the Acquired Fund Assets, subject to no liens (other than the obligation, if any, to pay the purchase price of portfolio securities purchased by
A-1-7
Acquired Fund which have not settled prior to the Closing Date), security interests or other encumbrances, and full right, power and authority to transfer such assets hereunder, and upon delivery and payment for such assets, the Company, on behalf of Acquiring Fund, will acquire good and marketable title thereto, subject to no restrictions on the full transfer thereof, including any restrictions as might arise under the 1933 Act;
(n) On the effective date of the Registration Statement, at the time of the meeting of Acquired Fund's shareholders and on the Closing Date, the Proxy Materials (exclusive of the currently effective Acquiring Fund Prospectus contained therein) will (i) comply in all material respects with the provisions of the 1933 Act, the Securities Exchange Act of 1934, as amended ("1934 Act"), and the 1940 Act and the regulations thereunder and (ii) not contain any untrue statement of a material fact or omit to state a material fact required to be stated therein or necessary to make the statements therein not misleading. Any other information furnished by the Trust for use in the Registration Statement or in any other manner that may be necessary in connection with the transactions contemplated hereby shall be accurate and complete and shall comply in all material respects with applicable federal securities and other laws and regulations thereunder;
(o) The Trust, on behalf of Acquired Fund, will, on or prior to the Valuation Date, declare one or more dividends or other distributions to shareholders that, together with all previous dividends and other distributions to shareholders, shall have the effect of distributing to the shareholders all of its investment company taxable income and net capital gain, if any, through the Valuation Date (computed without regard to any deduction for dividends paid);
(p) The Trust, on behalf of Acquired Fund, has maintained or has caused to be maintained on its behalf all books and accounts as required of a registered investment company in compliance with the requirements of Section 31 of the 1940 Act and the rules thereunder; and
(q) Acquired Fund is not acquiring Acquiring Fund Shares to be issued hereunder for the purpose of making any distribution thereof other than in accordance with the terms of this Agreement.
6. Conditions Precedent to Obligations of Acquired Fund
The obligations of the Trust, on behalf of Acquired Fund, to consummate the transactions provided for herein shall be subject, at its election, to the performance by the Company, on behalf of Acquiring Fund, of all the obligations to be performed by it hereunder on or before the Closing Date and, in addition thereto, the following conditions:
6.1. All representations and warranties of the Company made on behalf of Acquiring Fund contained in this Agreement shall be true and correct in all material respects as of the date hereof and, except as they may be affected by the transactions contemplated by this Agreement, as of the Closing Date with the same force and effect as if made on and as of the Closing Date;
6.2. The Company, on behalf of Acquiring Fund, shall have delivered to Acquired Fund a certificate of the Company's President and Treasurer, in a form reasonably satisfactory to Acquired Fund and dated as of the Closing Date, to the effect that the representations and warranties of the Company, on behalf of Acquiring Fund, made in this Agreement are true and correct at and as of the Closing Date, except as they may be affected by the transactions contemplated by this Agreement, and as to such other matters as Acquired Fund, shall reasonably request;
6.3. Acquired Fund, shall have received a favorable opinion from Dechert LLP, counsel to Acquiring Fund, dated as of the Closing Date, to the effect that:
(a) The Company is validly existing as a corporation under the laws of the State of Maryland (Maryland counsel may be relied upon in delivering such opinion); (b) the Company has the requisite corporate power to own its properties and assets and to carry on its business as described in its charter (Maryland counsel may be relied upon in delivering such opinion); (c) the Company is a duly registered, open-end, management investment company, and its registration with the Commission as an investment company under the 1940 Act is in full force and effect; (d) this Agreement has been duly authorized, executed and delivered by the Company and, assuming that the Registration Statement complies with the 1933 Act, the 1934 Act and the 1940 Act and regulations thereunder and assuming due authorization, execution and delivery of this Agreement by the Trust, on behalf of the
A-1-8
Acquired Fund, is a valid and binding agreement of Acquiring Fund enforceable against Acquiring Fund in accordance with its terms; (e) the issuance of the Acquiring Fund Shares has been duly authorized by all necessary corporate action on the part of the Company, and when such Acquiring Fund Shares are issued and delivered by the Company as contemplated by the Registration Statement and this Agreement against payment of the consideration therein described, such Acquiring Fund Shares will be validly issued, fully paid and non-assessable, and the issuance of the Acquiring Fund Shares by the Company will not be subject to any preemptive or similar rights arising under the Company's charter or bylaws, or under the Maryland General Corporation Laws (Maryland counsel may be relied upon in delivering such opinion); (f) the execution and delivery of this Agreement did not, and the consummation of the transactions contemplated hereby will not, conflict with the Company's charter or bylaws, each as amended; and (g) to the knowledge of such counsel, no consent, approval, authorization or order of any court or governmental authority of the United States or the State of New York is required for the consummation by Acquiring Fund of the transactions contemplated herein, except such as have been obtained under the 1933 Act, the 1934 Act and the 1940 Act and such as may be required under state securities laws; and
6.4. As of the Closing Date, there shall have been no material change in the investment objective, policies and restrictions of Acquiring Fund or any increase in the investment management fees or annual fees pursuant to Acquiring Fund's shareholder services plan from those described in Acquiring Fund's Prospectus dated April 30, 2013, as may be supplemented, and the Company's Statement of Additional Information dated April 30, 2013, as may be supplemented.
7. Conditions Precedent to Obligations of Acquiring Fund
The obligations of the Company, on behalf of Acquiring Fund, to complete the transactions provided for herein shall be subject, at its election, to the performance by Acquired Fund, of all the obligations to be performed by it hereunder on or before the Closing Date and, in addition thereto, the following conditions:
7.1. All representations and warranties of the Trust made on behalf of Acquired Fund contained in this Agreement shall be true and correct in all material respects as of the date hereof and, except as they may be affected by the transactions contemplated by this Agreement, as of the Closing Date with the same force and effect as if made on and as of the Closing Date;
7.2. The Trust, on behalf of Acquired Fund, shall have delivered to Acquiring Fund at the Closing a certificate of the Trust's President and its Treasurer, in form and substance satisfactory to Acquiring Fund and dated as of the Closing Date, to the effect that the representations and warranties of the Trust, on behalf of Acquired Fund, made in this Agreement are true and correct at and as of the Closing Date, except as they may be affected by the transactions contemplated by this Agreement, and as to such other matters as the Company, on behalf of Acquiring Fund, shall reasonably request;
7.3. Acquired Fund shall have delivered to Acquiring Fund a statement of the Acquired Fund Assets and its liabilities, together with a list of Acquired Fund's portfolio securities and other assets showing the respective adjusted bases and holding periods thereof for income tax purposes, as of the Closing Date, certified by the Treasurer of the Acquired Fund;
7.4. The Company, on behalf of Acquiring Fund, shall have received at the Closing a favorable opinion from Dechert LLP, counsel to Acquired Fund, dated as of the Closing Date to the effect that:
(a) Acquired Fund is a series of the Trust, a validly existing Massachusetts business trust, and has the power to own all of its properties and assets and to carry on its business as presently conducted; (b) Acquired Fund is a duly registered, open-end, management investment company under the 1940 Act which offers its shares only to insurance companies for accounts which they establish to fund variable life insurance and variable annuity contracts and to other entities under qualified pension and retirement plans, and its registration with the Commission as an investment company under the 1940 Act is in full force and effect; (c) this Agreement has been duly authorized, executed and delivered by the Trust, and, assuming that the Registration Statement complies with the 1933 Act, the 1934 Act and the 1940 Act and the regulations thereunder and assuming due authorization, execution and delivery of this Agreement by the Company, on behalf of Acquiring Fund, is a valid and binding agreement of Acquired
A-1-9
Fund enforceable against Acquired Fund in accordance with its terms; (d) the execution and delivery of this Agreement did not, and the consummation of the transactions contemplated hereby will not, conflict with the Trust's Declaration of Trust or By-Laws, each as amended; and (e) to the knowledge of such counsel, no consent, approval, authorization or order of any court or governmental authority of the United States or the Commonwealth of Massachusetts or the State of New York is required for the consummation by Acquired Fund of the transactions contemplated herein, except such as have been obtained under the 1933 Act, the 1934 Act and the 1940 Act and such as may be required under state securities laws; and
7.5. On the Closing Date, the Acquired Fund Assets shall include no assets that the Acquiring Fund, by reason of limitations of the Trust's Declaration of Trust, as amended, or otherwise, may not properly acquire.
8. Further Conditions Precedent to Obligations of Acquiring Fund and Acquired Fund
The obligations of the Trust, on behalf of Acquired Fund, and the Company, on behalf of Acquiring Fund, hereunder are each subject to the further conditions that on or before the Closing Date:
8.1. This Agreement and the transactions contemplated herein shall have been approved by the requisite vote of the holders of the outstanding shares of Acquired Fund in accordance with the provisions of the Trust's Declaration of Trust, as amended, and certified copies of the resolutions evidencing such approval shall have been delivered to Acquiring Fund;
8.2. On the Closing Date, no action, suit or other proceeding shall be pending before any court or governmental agency in which it is sought to restrain or prohibit, or obtain damages or other relief in connection with, this Agreement or the transactions contemplated herein;
8.3. All consents of other parties and all other consents, orders and permits of federal, state and local regulatory authorities (including those of the Commission and of state Blue Sky and securities authorities, including "no-action" positions of and exemptive orders from such federal and state authorities) deemed necessary by the Company, on behalf of Acquiring Fund, or Acquired Fund to permit consummation, in all material respects, of the transactions contemplated herein shall have been obtained, except where failure to obtain any such consent, order or permit would not involve risk of a material adverse effect on the assets or properties of Acquiring Fund or Acquired Fund;
8.4. The Registration Statement shall have become effective under the 1933 Act, no stop orders suspending the effectiveness thereof shall have been issued and, to the best knowledge of the parties hereto, no investigation or proceeding for that purpose shall have been instituted or be pending, threatened or contemplated under the 1933 Act;
8.5. The Trust, on behalf of Acquired Fund, shall have declared and paid a dividend or dividends and/or other distribution or distributions that, together with all previous such dividends or distributions, shall have the effect of distributing to the Acquired Fund shareholders all of Acquired Fund's investment company taxable income (computed without regard to any deduction for dividends paid) and all of its net capital gain (after reduction for any capital loss carry-forward and computed without regard to any deduction for dividends paid) for all taxable years ending on or before the Closing Date; and
8.6. The parties shall have received the opinion of the law firm of Dechert LLP (based on certain facts, assumptions and representations), addressed to Acquiring Fund and Acquired Fund, which opinion may be relied upon by the shareholders of Acquired Fund, substantially to the effect that, for federal income tax purposes:
(a) The transfer of all of Acquired Fund's assets in exchange solely for Acquiring Fund Shares and the assumption by Acquiring Fund of certain stated liabilities of Acquired Fund followed by the distribution by Acquired Fund of Acquiring Fund Shares to the Acquired Fund shareholders in exchange for their Acquired Fund shares pursuant to and in accordance with the terms of the Reorganization Agreement will constitute a "reorganization" within the meaning of Section 368(a)(1) of the Code;
A-1-10
(b) No gain or loss will be recognized by Acquiring Fund upon the receipt of the assets of Acquired Fund solely in exchange for Acquiring Fund Shares and the assumption by Acquiring Fund of the stated liabilities of Acquired Fund;
(c) No gain or loss will be recognized by Acquired Fund upon the transfer of substantially all of the assets of Acquired Fund to Acquiring Fund in exchange solely for Acquiring Fund Shares and the assumption by Acquiring Fund of the stated liabilities or upon the distribution of Acquiring Fund Shares to the Acquired Fund shareholders in exchange for their Acquired Fund shares, except that Acquired Fund may be required to recognize gain or loss with respect to contracts described in Section 1256(b) of the Code or stock in a passive foreign investment company, as defined in Section 1297(a) of the Code;
(d) No gain or loss will be recognized by the Acquired Fund shareholders upon the exchange of the Acquired Fund shares for Acquiring Fund Shares;
(e) The aggregate tax basis for Acquiring Fund Shares received by each Acquired Fund shareholder pursuant to the reorganization will be the same as the aggregate tax basis of the Acquired Fund shares held by each such Acquired Fund shareholder immediately prior to the Reorganization;
(f) The holding period of Acquiring Fund Shares to be received by each Acquired Fund shareholder will include the period during which the Acquired Fund shares surrendered in exchange therefor were held (provided such Acquired Fund shares were held as capital assets on the date of the Reorganization);
(g) The tax basis of the assets of Acquired Fund acquired by Acquiring Fund will be the same as the tax basis of such assets to Acquired Fund in exchange therefor; and
(h) The holding period of the assets of Acquired Fund in the hands of Acquiring Fund will include the period during which those assets were held by Acquired Fund (except where the investment activities of Acquiring Fund have the effect of reducing or eliminating such periods with respect to an asset).
Notwithstanding anything herein to the contrary, neither the Company, on behalf of Acquiring Fund, nor the Trust, on behalf of Acquired Fund, may waive the conditions set forth in this paragraph 8.6.
9. Fees and Expenses
The Acquired Fund shall bear expenses incurred in connection with the entering into, and carrying out of, the provisions of this Agreement, including printing, filing and proxy solicitation expenses, legal, accounting, Commission registration fees and Blue Sky expenses (unless only the SD Reorganization is approved by Shareholders, in which case all of the expenses will be borne by Morgan Stanley Investment Management Inc., the Acquired Fund's investment adviser.)
10. Entire Agreement; Survival of Warranties
10.1. This Agreement constitutes the entire agreement between the parties.
10.2. The representations, warranties and covenants contained in this Agreement or in any document delivered pursuant hereto or in connection herewith shall survive the consummation of the transactions contemplated herein, except that the representations, warranties and covenants of the Trust, on behalf of Acquired Fund, hereunder shall not survive the dissolution and complete liquidation of Acquired Fund in accordance with paragraph 1.9.
11. Termination
11.1. This Agreement may be terminated and the transactions contemplated hereby may be abandoned at any time prior to the Closing:
(a) by the mutual written consent of the Trust, on behalf of Acquired Fund, and the Company, on behalf of Acquiring Fund;
(b) by either the Company, on behalf of Acquiring Fund, or the Trust, on behalf of Acquired Fund, by notice to the other, without liability to the terminating party on account of such termination (providing the
A-1-11
terminating party is not otherwise in material default or breach of this Agreement), if the Closing shall not have occurred on or before October 3, 2014; or
(c) by either the Company, on behalf of Acquiring Fund, or the Trust, on behalf of Acquired Fund, in writing without liability to the terminating party on account of such termination (provided the terminating party is not otherwise in material default or breach of this Agreement), if (i) the other party shall fail to perform in any material respect its agreements contained herein required to be performed on or prior to the Closing Date, (ii) the other party materially breaches any of its representations, warranties or covenants contained herein, (iii) the Acquired Fund shareholders fail to approve this Agreement at any meeting called for such purpose at which a quorum was present or (iv) any other condition herein expressed to be precedent to the obligations of the terminating party has not been met and it reasonably appears that it will not or cannot be met.
11.2. (a) Termination of this Agreement pursuant to paragraphs 11.1(a) or (b) shall terminate all obligations of the parties hereunder and there shall be no liability for damages on the part of the Company, Acquiring Fund, the Trust or Acquired Fund, or the directors or officers of the Company, on behalf of Acquiring Fund, or the trustees or officers of the Trust, on behalf of Acquired Fund, to any other party or its directors, trustees or officers.
(b) Termination of this Agreement pursuant to paragraph 11.1(c) shall terminate all obligations of the parties hereunder and there shall be no liability for damages on the part of the Company, Acquiring Fund, the Trust or Acquired Fund, or the directors or officers of the Company, on behalf of Acquiring Fund, or the trustees or officers of the Trust, on behalf of Acquired Fund, except that any party in breach of this Agreement shall, upon demand, reimburse the non-breaching party for all reasonable out-of-pocket fees and expenses incurred in connection with the transactions contemplated by this Agreement, including legal, accounting and filing fees.
12. Amendments
This Agreement may be amended, modified or supplemented in such manner as may be mutually agreed upon in writing by the parties.
13. Miscellaneous
13.1. The article and paragraph headings contained in this Agreement are for reference purposes only and shall not affect in any way the meaning or interpretation of this Agreement.
13.2. This Agreement may be executed in any number of counterparts, each of which shall be deemed an original.
13.3. This Agreement shall be governed by and construed in accordance with the laws of the State of New York.
13.4. This Agreement shall bind and inure to the benefit of the parties hereto and their respective successors and assigns, but no assignment or transfer hereof or of any rights or obligations hereunder shall be made by any party without the written consent of the other party. Nothing herein expressed or implied is intended or shall be construed to confer upon or give any person, firm or corporation, other than the parties hereto and their respective successors and assigns, any rights or remedies hereunder or by reason of this Agreement.
13.5. The obligations and liabilities of Acquiring Fund hereunder are solely those of Acquiring Fund. It is expressly agreed that no shareholder, nominee, director, officer, agent, or employee of Acquiring Fund, or the directors or officers of the Company, acting on behalf of Acquiring Fund, shall be personally liable hereunder. The execution and delivery of this Agreement have been authorized by the directors of Acquiring Fund and signed by authorized officers of the Company, acting on behalf of Acquiring Fund, and neither such authorization by such directors nor such execution and delivery by such officers shall be deemed to have been made by any of them individually or to impose any liability on any of them personally.
13.6. The obligations and liabilities of Acquired Fund hereunder are solely those of Acquired Fund. It is expressly agreed that no shareholder, nominee, trustee, officer, agent, or employee of Acquired Fund, or the trustees or officers of the Trust, acting on behalf of Acquired Fund, shall be personally liable hereunder. The execution and
A-1-12
delivery of this Agreement have been authorized by the trustees of the Acquired Fund and signed by authorized officers of the Trust, acting on behalf of Acquired Fund, and neither such authorization by such trustees nor such execution and delivery by such officers shall be deemed to have been made by any of them individually or to impose any liability on any of them personally.
IN WITNESS WHEREOF, each of the parties hereto has caused this Agreement to be executed by a duly authorized officer.
THE UNIVERSAL INSTITUTIONAL FUNDS, INC.,
on behalf of the Global Infrastructure Portfolio | |
By: /s/ John H. Gernon
Name: John H. Gernon
Title: President and Principal Executive Officer | |
MORGAN STANLEY SELECT DIMENSIONS INVESTMENT SERIES,
on behalf of the Global Infrastructure Portfolio | |
By: /s/ John H Gernon
Name: John H. Gernon
Title: President and Principal Executive Officer | |
A-1-13
Exhibit A-2
AGREEMENT AND PLAN OF REORGANIZATION
THIS AGREEMENT AND PLAN OF REORGANIZATION ("Agreement") is made as of October 3, 2013, by and between THE UNIVERSAL INSTITUTIONAL FUNDS, INC. (the "Company"), a Maryland corporation, on behalf of the GLOBAL INFRASTRUCTURE PORTFOLIO ("Acquiring Fund"), and MORGAN STANLEY VARIABLE INVESTMENT SERIES (the "Trust"), a Massachusetts business trust, on behalf of the GLOBAL INFRASTRUCTURE PORTFOLIO ("Acquired Fund").
This Agreement is intended to be and is adopted as a "plan of reorganization" within the meaning of Treas. Reg. 1.368-2(g), for a reorganization under Section 368(a)(1) of the Internal Revenue Code of 1986, as amended (the "Code"). The reorganization ("Reorganization") will consist of the transfer to Acquiring Fund of substantially all of the assets of Acquired Fund in exchange for the assumption by Acquiring Fund of all stated liabilities of Acquired Fund and the issuance by Acquiring Fund of shares of common stock, par value $0.001 per share (the "Acquiring Fund Shares"), to be distributed, after the Closing Date hereinafter referred to, to the shareholders of Acquired Fund in liquidation of Acquired Fund as provided herein, all upon the terms and conditions hereinafter set forth in this Agreement.
In consideration of the premises and of the covenants and agreements hereinafter set forth, the parties hereto covenant and agree as follows:
1. The Reorganization and Liquidation of Acquired Fund
1.1. Subject to the terms and conditions herein set forth and on the basis of the representations and warranties contained herein, the Trust, on behalf of Acquired Fund, agrees to transfer the Acquired Fund Assets (as defined in paragraph 1.2) to Acquiring Fund, and the Company, on behalf of Acquiring Fund, agrees in exchange therefor to assume all of Acquired Fund's stated liabilities on the Closing Date as set forth in paragraph 1.3 and to deliver to Acquired Fund the number of Acquiring Fund Shares, including fractional Acquiring Fund Shares, determined in the manner set forth in paragraph 2.3. Such transactions shall take place at the closing provided for in paragraph 3.1 ("Closing").
1.2. (a) The "Acquired Fund Assets" shall consist of all property, including without limitation, all cash, cash equivalents, securities and dividend and interest receivables owned by Acquired Fund, and any deferred or prepaid expenses shown as an asset on Acquired Fund's books on the Valuation Date.
(b) On or prior to the Valuation Date, the Trust, on behalf of Acquired Fund, will provide Acquiring Fund with a list of all of Acquired Fund's assets to be transferred to Acquiring Fund and a list of the stated liabilities to be assumed by Acquiring Fund pursuant to this Agreement. The Trust, on behalf of Acquired Fund, reserves the right to sell any of the securities on such list but will not, without the prior approval of the Company, on behalf of Acquiring Fund, acquire any additional securities other than securities of the type in which Acquiring Fund is permitted to invest and in amounts agreed to in writing by the Company, on behalf of Acquiring Fund. The Company, on behalf of Acquiring Fund, will, within a reasonable time prior to the Valuation Date, furnish Acquired Fund with a statement of Acquiring Fund's investment objective, policies and restrictions and a list of the securities, if any, on the list referred to in the first sentence of this paragraph that do not conform to Acquiring Fund's investment objective, policies and restrictions. In the event that Acquired Fund holds any investments that Acquiring Fund is not permitted to hold, Acquired Fund will dispose of such securities on or prior to the Valuation Date. In addition, if it is determined that the portfolios of Acquired Fund and Acquiring Fund, when aggregated, would contain investments exceeding certain percentage limitations imposed upon Acquiring Fund with respect to such investments, Acquired Fund if requested by the Company, on behalf of Acquiring Fund, will, on or prior to the Valuation Date, dispose of and/or reinvest a sufficient amount of such investments as may be necessary to avoid violating such limitations as of the Closing Date (as defined in paragraph 3.1).
1.3. The Trust, on behalf of Acquired Fund, will endeavor to discharge all of Acquired Fund's liabilities and obligations on or prior to the Valuation Date. The Company, on behalf of Acquiring Fund, will assume all stated
A-2-1
liabilities, which includes, without limitation, all expenses, costs, charges and reserves reflected on an unaudited Statement of Assets and Liabilities of Acquired Fund prepared by the Treasurer of Acquired Fund as of the Valuation Date in accordance with generally accepted accounting principles consistently applied from the prior audited period.
1.4. In order for the Acquired Fund to comply with Section 852(a)(1) of the Code and to avoid having any investment company taxable income or net capital gain (as defined in Sections 852(b)(2) and 1222(11) of the Code, respectively) in the short taxable year ending with its dissolution, the Trust, on behalf of Acquired Fund, will on or before the Valuation Date (a) declare a dividend in an amount large enough so that Acquired Fund will have declared dividends of substantially all of its investment company taxable income and net capital gain, if any, for such taxable year (determined without regard to any deduction for dividends paid) and (b) distribute such dividend.
1.5. On the Closing Date or as soon as practicable thereafter, the Trust, on behalf of Acquired Fund, will distribute Acquiring Fund Shares received by Acquired Fund pursuant to paragraph 1.1 pro rata to Acquired Fund's shareholders of record determined as of the close of business on the Valuation Date ("Acquired Fund Shareholders"). Each Acquired Fund Shareholder will receive the class of shares of Acquiring Fund that corresponds to the class of shares of Acquired Fund currently held by that Acquired Fund shareholder. Accordingly, the Acquiring Fund Shares will be distributed as follows: each of the Class I shares of Acquiring Fund will be distributed to holders of Class X shares of Acquired Fund and each of the Class II shares of Acquiring Fund will be distributed to holders of Class Y shares of Acquired Fund. Such distribution will be accomplished by an instruction, signed by Acquired Fund's Secretary, to transfer Acquiring Fund Shares then credited to Acquired Fund's account on the books of Acquiring Fund to open accounts on the books of Acquiring Fund in the names of the Acquired Fund shareholders and representing the respective pro rata number of Acquiring Fund Shares due such Acquired Fund shareholders. All issued and outstanding shares of Acquired Fund simultaneously will be canceled on Acquired Fund's books.
1.6. Ownership of Acquiring Fund Shares will be shown on the books of Acquiring Fund's transfer agent. Acquiring Fund Shares will be issued in the manner described in Acquiring Fund's current Prospectus, as supplemented, and the Company's Statement of Additional Information.
1.7. Any transfer taxes payable upon issuance of Acquiring Fund Shares in a name other than the registered holder of Acquiring Fund Shares on Acquired Fund's books as of the close of business on the Valuation Date shall, as a condition of such issuance and transfer, be paid by the person to whom Acquiring Fund Shares are to be issued and transferred.
1.8. Any reporting responsibility of Acquired Fund is and shall remain the responsibility of Acquired Fund up to and including the date on which Acquired Fund is dissolved and terminated pursuant to paragraph 1.9.
1.9. Within one year after the Closing Date, the Trust, on behalf of Acquired Fund, shall pay or make provision for the payment of all Acquired Fund's liabilities and taxes. If and to the extent that any trust, escrow account, or other similar entity continues after the close of such one-year period in connection either with making provision for payment of liabilities or taxes or with distributions to shareholders of Acquired Fund, such entity shall either (i) qualify as a liquidating trust under Section 7701 of the Code (and applicable Treasury Regulations thereunder) or other entity which does not constitute a continuation of Acquired Fund for federal income tax purposes, or (ii) be subject to a waiver under Section 368(a)(2)(G)(ii) of the complete distribution requirement of Section 368(a)(2)(G)(i) of the Code. Acquired Fund shall be terminated following the making of all distributions pursuant to paragraph 1.5.
1.10. Copies of all books and records maintained on behalf of Acquired Fund in connection with its obligations under the Investment Company Act of 1940, as amended (the "1940 Act"), the Code, state blue sky laws or otherwise in connection with this Agreement will promptly be delivered after the Closing to officers of Acquiring Fund or their designee, and Acquiring Fund or its designee shall comply with applicable record retention requirements to which Acquired Fund is subject under the 1940 Act.
A-2-2
2. Valuation
2.1. The value of the Acquired Fund Assets shall be the value of such assets computed as of 4:00 p.m. on the New York Stock Exchange on the third business day following the receipt of the requisite approval of this Agreement by shareholders of Acquired Fund or at such time on such earlier or later date after such approval as may be mutually agreed upon in writing (such time and date being hereinafter called the "Valuation Date"), using the valuation procedures set forth in Acquiring Fund's then current Prospectus, as supplemented, and the Company's Statement of Additional Information.
2.2. The net asset value of an Acquiring Fund Share shall be the net asset value per share computed on the Valuation Date, using the valuation procedures set forth in Acquiring Fund's then current Prospectus, as supplemented, and the Company's Statement of Additional Information.
2.3. The number of Acquiring Fund Shares (including fractional shares, if any) to be issued hereunder shall be determined, with respect to each class, by dividing the aggregate net asset value of each class of Acquired Fund shares (determined in accordance with paragraph 2.1) by the net asset value per share of the corresponding class of shares of Acquiring Fund (determined in accordance with paragraph 2.2).
2.4. All computations of value shall be made by Morgan Stanley Services Company Inc. ("Morgan Stanley Services") in accordance with its regular practice in pricing Acquiring Fund. The Company, on behalf of Acquiring Fund, shall cause Morgan Stanley Services to deliver a copy of Acquiring Fund's valuation report at the Closing.
3. Closing and Closing Date
3.1. The Closing shall take place on the Valuation Date or on the next business day following the Valuation Date (the "Closing Date"). The Closing shall be held as of 9:00 a.m. Eastern time, or at such other time as the parties may agree. The Closing shall be held in a location mutually agreeable to the parties hereto. All acts taking place at the Closing shall be deemed to take place simultaneously as of 9:00 a.m. Eastern time on the Closing Date unless otherwise provided.
3.2. Portfolio securities held by Acquired Fund and represented by a certificate or other written instrument shall be presented by it or on its behalf to State Street Bank and Trust Company (the "Custodian"), as custodian for Acquiring Fund, for examination no later than five business days preceding the Valuation Date. Such portfolio securities (together with any cash or other assets) shall be delivered by Acquired Fund to the Custodian for the account of Acquiring Fund on or before the Closing Date in conformity with applicable custody provisions under the 1940 Act and duly endorsed in proper form for transfer in such condition as to constitute good delivery thereof in accordance with the custom of brokers. The portfolio securities shall be accompanied by all necessary federal and state stock transfer stamps or a check for the appropriate purchase price of such stamps. Portfolio securities and instruments deposited with a securities depository (as defined in Rule 17f-4 under the 1940 Act) shall be delivered on or before the Closing Date by book-entry in accordance with customary practices of such depository and the Custodian. The cash delivered shall be in the form of a Federal Funds wire, payable to the order of "State Street Bank and Trust Company, Custodian for The Universal Institutional Funds, Inc."
3.3. In the event that on the Valuation Date, (a) the New York Stock Exchange shall be closed to trading or trading thereon shall be restricted or (b) trading or the reporting of trading on such Exchange or elsewhere shall be disrupted so that, in the judgment of both the Company, on behalf of Acquiring Fund, and the Trust, on behalf of Acquired Fund, accurate appraisal of the value of the net assets of Acquiring Fund or the Acquired Fund Assets is impracticable, the Valuation Date shall be postponed until the first business day after the day when trading shall have been fully resumed without restriction or disruption and reporting shall have been restored.
3.4. If requested, the Trust, on behalf of Acquired Fund, shall deliver to the Company, on behalf of Acquiring Fund, or its designee (a) at the Closing, a list, certified by the Trust's Secretary, of the names, addresses and taxpayer identification numbers of the Acquired Fund shareholders and the number and percentage ownership of outstanding Acquired Fund shares owned by each such Acquired Fund shareholder, all as of the Valuation Date, and (b) as soon as practicable after the Closing, all original documentation (including Internal Revenue Service forms, certificates,
A-2-3
certifications and correspondence) relating to the Acquired Fund shareholders' taxpayer identification numbers and their liability for or exemption from back-up withholding. The Company, on behalf of Acquiring Fund, shall issue and deliver to such Secretary a confirmation evidencing delivery of Acquiring Fund Shares to be credited on the Closing Date to Acquired Fund or provide evidence satisfactory to Acquired Fund that such Acquiring Fund Shares have been credited to Acquired Fund's account on the books of Acquiring Fund. At the Closing, each party shall deliver to the other such bills of sale, checks, assignments, share certificates, if any, receipts or other documents as such other party or its counsel may reasonably request.
4. Covenants of Acquiring Fund and Acquired Fund
4.1. Except as otherwise expressly provided herein, the Trust, on behalf of Acquired Fund, and the Company, on behalf of Acquiring Fund, will operate in the ordinary course between the date hereof and the Closing Date, it being understood that such ordinary course of business will include customary dividends and other distributions.
4.2. The Company will prepare and file with the Securities and Exchange Commission ("Commission") a registration statement on Form N-14 under the Securities Act of 1933, as amended ("1933 Act"), relating to Acquiring Fund Shares ("Registration Statement"). The Trust will provide the Proxy Materials as described in paragraph 4.3 below for inclusion in the Registration Statement. The Company, on behalf of Acquiring Fund, and the Trust, on behalf of Acquired Fund, agree that each of Acquired Fund and Acquiring Fund will further provide such other information and documents as are reasonably necessary for the preparation of the Registration Statement.
4.3. The Trust, on behalf of Acquired Fund, will call a meeting of Acquired Fund's shareholders to consider and act upon this Agreement and to take all other action necessary to obtain approval of the transactions contemplated herein. The Trust, on behalf of Acquired Fund, will prepare the notice of meeting, form of proxy and proxy statement (collectively, "Proxy Materials") to be used in connection with such meeting; provided that the Company, on behalf of Acquiring Fund, will furnish the Trust, on behalf of Acquired Fund, with its currently effective prospectus for inclusion in the Proxy Materials and with such other information relating to Acquiring Fund as is reasonably necessary for the preparation of the Proxy Materials.
4.4. The Trust, on behalf of Acquired Fund, will assist Acquiring Fund in obtaining such information as Acquiring Fund reasonably requests concerning the beneficial ownership of Acquired Fund shares.
4.5. Subject to the provisions of this Agreement, the Company, on behalf of Acquiring Fund, and the Trust, on behalf of Acquired Fund, agree that each respective Fund will take, or cause to be taken, all action, and do or cause to be done, all things reasonably necessary, proper or advisable to consummate and make effective the transactions contemplated by this Agreement.
4.6. The Trust, on behalf of Acquired Fund, shall furnish or cause to be furnished to Acquiring Fund within 30 days after the Closing Date a statement of Acquired Fund's assets and liabilities as of the Closing Date, which statement shall be certified by the Acquired Fund's Treasurer and shall be in accordance with generally accepted accounting principles consistently applied. As promptly as practicable, but in any case within 60 days after the Closing Date, Acquired Fund shall furnish Acquiring Fund, in such form as is reasonably satisfactory to Acquiring Fund, a statement certified by the Trust's Treasurer of Acquired Fund's earnings and profits for federal income tax purposes that will be carried over to Acquiring Fund pursuant to Section 381 of the Code.
4.7. As soon after the Closing Date as is reasonably practicable, the Company (a) shall prepare and file all federal and other tax returns and reports of Acquired Fund required by law to be filed with respect to all periods ending on or before the Closing Date but not theretofore filed and (b) shall pay all federal and other taxes shown as due thereon and/or all federal and other taxes that were unpaid as of the Closing Date, including without limitation, all taxes for which the provision for payment was made as of the Closing Date (as represented in paragraph 5.2(k)).
4.8. The Company agrees to use all reasonable efforts to obtain the approvals and authorizations required by the 1933 Act and the 1940 Act and to make such filings required by the state Blue Sky and securities laws as it may deem appropriate in order to continue the Acquiring Fund's operations after the Closing Date.
A-2-4
5. Representations and Warranties
5.1. The Company, on behalf of Acquiring Fund, represents and warrants to Acquired Fund, as follows:
(a) Acquiring Fund is a series of the Company, a validly existing Maryland corporation with full power to carry on its business as presently conducted;
(b) The Company is a duly registered, open-end management investment company which offers its shares only to insurance companies for accounts which they establish to fund variable life insurance and variable annuity contracts and to other entities under qualified pension and retirement plans, and its registration with the Commission as an investment company under the 1940 Act and the registration of its shares under the 1933 Act are in full force and effect;
(c) All of the issued and outstanding shares of Acquiring Fund have been offered and sold in compliance in all material respects with applicable registration requirements of the 1933 Act and state securities laws. Shares of Acquiring Fund are registered in all jurisdictions in which they are required to be registered under state securities laws and other laws, and said registrations, including any periodic reports or supplemental filings, are complete and current, all fees required to be paid have been paid, and Acquiring Fund is not subject to any stop order and is fully qualified to sell its shares in each state in which its shares have been registered;
(d) The current Prospectus of the Acquiring Fund and Statement of Additional Information of the Company conform in all material respects to the applicable requirements of the 1933 Act and the 1940 Act and the regulations thereunder and do not include any untrue statement of a material fact or omit to state any material fact required to be stated therein or necessary to make the statements therein, in light of the circumstances under which they were made, not misleading;
(e) The Company is not in, and the execution, delivery and performance of this Agreement will not result in a, material violation of any provision of its Articles of Incorporation or By-Laws, each as amended, or of any agreement, indenture, instrument, contract, lease or other undertaking to which Acquiring Fund is a party or by which it is bound;
(f) No litigation or administrative proceeding or investigation of or before any court or governmental body is presently pending or, to its knowledge, threatened against the Company, Acquiring Fund or any of their properties or assets which, if adversely determined, would materially and adversely affect Acquiring Fund's financial condition or the conduct of its business; and the Company knows of no facts that might form the basis for the institution of such proceedings and is not a party to or subject to the provisions of any order, decree or judgment of any court or governmental body which materially and adversely affects, or is reasonably likely to materially and adversely affect, its business or its ability to consummate the transactions herein contemplated;
(g) The Acquiring Fund is, and will be on the Closing Date, a newly created series of the Company, without assets (other than seed capital) or liabilities, formed for the purpose of receiving the Acquired Fund Assets in connection with the Reorganization and, accordingly, the Acquiring Fund has not prepared books of account and related records or financial statements or issued any shares except those issued in a private placement to Morgan Stanley Investment Management Inc. or its affiliate to secure any required initial shareholder approvals;
(h) All issued and outstanding Acquiring Fund Shares are, and at the Closing Date will be, duly and validly issued and outstanding, fully paid and non-assessable with no personal liability attaching to the ownership thereof. Acquiring Fund does not have outstanding any options, warrants or other rights to subscribe for or purchase any of its shares;
(i) The execution, delivery and performance of this Agreement have been duly authorized by all necessary action on the part of the Company, and this Agreement constitutes a valid and binding obligation of Acquiring Fund enforceable in accordance with its terms, subject as to enforcement, to bankruptcy, insolvency, reorganization, moratorium and other laws relating to or affecting creditors' rights and to general equity principles. No other consents, authorizations or approvals are necessary in connection with Acquiring Fund's performance of this Agreement;
A-2-5
(j) Acquiring Fund Shares to be issued and delivered to Acquired Fund, for the account of the Acquired Fund shareholders, pursuant to the terms of this Agreement will at the Closing Date have been duly authorized and, when so issued and delivered, will be duly and validly issued Acquiring Fund Shares, and will be fully paid and non-assessable with no personal liability attaching to the ownership thereof;
(k) All material federal and other tax returns and reports of Acquiring Fund required by law to be filed on or before the Closing Date have been filed and are correct, and all federal and other taxes shown as due or required to be shown as due on said returns and reports have been paid or provision has been made for the payment thereof, and to the best of the Company's knowledge, no such return is currently under audit and no assessment has been asserted with respect to any such return;
(l) For each taxable year since its inception, Acquiring Fund has met the requirements of Subchapter M of the Code for qualification and treatment as a "regulated investment company" and neither the execution or delivery of nor the performance of the Company's obligations with respect to Acquiring Fund under this Agreement will adversely affect, and no other events are reasonably likely to occur which will adversely affect, the ability of Acquiring Fund to continue to meet the requirements of Subchapter M of the Code;
(m) Since December 31, 2012, there has been no change by Acquiring Fund in accounting methods, principles, or practices, including those required by generally accepted accounting principles;
(n) The information furnished or to be furnished by the Company on behalf of Acquiring Fund for use in registration statements, proxy materials and other documents which may be necessary in connection with the transactions contemplated hereby shall be accurate and complete in all material respects and shall comply in all material respects with federal securities and other laws and regulations applicable thereto; and
(o) The Proxy Materials to be included in the Registration Statement (only insofar as they relate to Acquiring Fund) will, on the effective date of the Registration Statement and on the Closing Date, not contain any untrue statement of a material fact or omit to state a material fact required to be stated therein or necessary to make the statements therein, in light of the circumstances under which such statements were made, not materially misleading.
5.2. The Trust, on behalf of Acquired Fund, represents and warrants to the Company, on behalf of Acquiring Fund as follows:
(a) Acquired Fund is a series of the Trust, a validly existing Massachusetts business trust with full power to carry on its business as presently conducted;
(b) The Trust is a duly registered, open-end management investment company which offers its shares only to insurance companies for accounts which they establish to fund variable life insurance and variable annuity contracts and to other entities under qualified pension and retirement plans, and its registration with the Commission as an investment company under the 1940 Act and the registration of its shares under the 1933 Act are in full force and effect;
(c) All of the issued and outstanding shares of Acquired Fund have been offered and sold in compliance in all material respects with applicable requirements of the 1933 Act and state securities laws. Shares of Acquired Fund are registered in all jurisdictions in which they are required to be registered and said registrations, including any periodic reports or supplemental filings, are complete and current, all fees required to be paid have been paid, and Acquired Fund is not subject to any stop order and is fully qualified to sell its shares in each state in which its shares have been registered;
(d) The current Prospectus, as supplemented, of Acquired Fund and Statement of Additional Information of the Trust conform in all material respects to the applicable requirements of the 1933 Act and the 1940 Act and the regulations thereunder and do not include any untrue statement of a material fact or omit to state any material fact required to be stated therein or necessary to make the statements therein, in light of the circumstances under which they were made, not misleading;
A-2-6
(e) The Trust is not in, and the execution, delivery and performance of this Agreement will not result in a, material violation of any provision of its Declaration of Trust or By-Laws, as amended, or of any agreement, indenture, instrument, contract, lease or other undertaking to which Acquired Fund is a party or by which it is bound;
(f) No litigation or administrative proceeding or investigation of or before any court or governmental body is presently pending or, to its knowledge, threatened against the Trust or any of its properties or assets which, if adversely determined, would materially and adversely affect Acquired Fund's financial condition or the conduct of its business; and the Trust knows of no facts that might form the basis for the institution of such proceedings and is not a party to or subject to the provisions of any order, decree or judgment of any court or governmental body which materially and adversely affects, or is reasonably likely to materially and adversely affect, its business or its ability to consummate the transactions herein contemplated;
(g) The Statement of Assets and Liabilities, Statement of Operations, Statement of Changes in Net Assets and Financial Highlights of Acquired Fund for its last completed fiscal year, audited by Ernst & Young LLP (except that the financial information for the Acquired Fund for the fiscal year ended prior to 2011 was audited by the Acquired Fund's prior independent registered public accounting firm) (copies of which have been or will be furnished to Acquiring Fund) fairly present, in all material respects, Acquired Fund's financial condition as of such date, and its results of operations, changes in its net assets and financial highlights for such period in accordance with generally accepted accounting principles, and as of such date there were no known liabilities of Acquired Fund (contingent or otherwise) not disclosed therein that would be required in accordance with generally accepted accounting principles to be disclosed therein;
(h) Acquired Fund has no material contracts or other commitments (other than this Agreement) that will be terminated with liability to it prior to the Closing Date;
(i) All issued and outstanding shares of Acquired Fund are, and at the Closing Date will be, duly and validly issued and outstanding, fully paid and non-assessable with no personal liability attaching to the ownership thereof. Acquired Fund does not have outstanding any options, warrants or other rights to subscribe for or purchase any of its shares, nor is there outstanding any security convertible to any of its shares. All such shares will, at the time of Closing, be held by the persons and in the amounts set forth in the list of shareholders submitted to Acquiring Fund pursuant to paragraph 3.4;
(j) The execution, delivery and performance of this Agreement will have been duly authorized prior to the Closing Date by all necessary action on the part of the Trust, and subject to the approval of Acquired Fund's shareholders, this Agreement constitutes a valid and binding obligation of Acquired Fund, enforceable in accordance with its terms, subject as to enforcement to bankruptcy, insolvency, reorganization, moratorium and other laws relating to or affecting creditors' rights and to general equity principles. No other consents, authorizations or approvals are necessary in connection with Acquired Fund's performance of this Agreement;
(k) All material federal and other tax returns and reports of Acquired Fund required by law to be filed on or before the Closing Date shall have been filed and are correct and all federal and other taxes shown as due or required to be shown as due on said returns and reports have been paid or provision has been made for the payment thereof, and to the best of the Trust's knowledge, no such return is currently under audit and no assessment has been asserted with respect to any such return;
(l) For each taxable year since its inception, Acquired Fund has met all the requirements of Subchapter M of the Code for qualification and treatment as a "regulated investment company" and neither the execution or delivery of nor the performance of Acquired Fund's obligations under this Agreement will adversely affect, and no other events are reasonably likely to occur which will adversely affect, the ability of Acquired Fund to continue to meet the requirements of Subchapter M of the Code for its final taxable year ending on the Closing Date;
(m) At the Closing Date, Acquired Fund will have good and valid title to the Acquired Fund Assets, subject to no liens (other than the obligation, if any, to pay the purchase price of portfolio securities purchased by
A-2-7
Acquired Fund which have not settled prior to the Closing Date), security interests or other encumbrances, and full right, power and authority to transfer such assets hereunder, and upon delivery and payment for such assets, the Company, on behalf of Acquiring Fund, will acquire good and marketable title thereto, subject to no restrictions on the full transfer thereof, including any restrictions as might arise under the 1933 Act;
(n) On the effective date of the Registration Statement, at the time of the meeting of Acquired Fund's shareholders and on the Closing Date, the Proxy Materials (exclusive of the currently effective Acquiring Fund Prospectus contained therein) will (i) comply in all material respects with the provisions of the 1933 Act, the Securities Exchange Act of 1934, as amended ("1934 Act"), and the 1940 Act and the regulations thereunder and (ii) not contain any untrue statement of a material fact or omit to state a material fact required to be stated therein or necessary to make the statements therein not misleading. Any other information furnished by the Trust for use in the Registration Statement or in any other manner that may be necessary in connection with the transactions contemplated hereby shall be accurate and complete and shall comply in all material respects with applicable federal securities and other laws and regulations thereunder;
(o) The Trust, on behalf of Acquired Fund, will, on or prior to the Valuation Date, declare one or more dividends or other distributions to shareholders that, together with all previous dividends and other distributions to shareholders, shall have the effect of distributing to the shareholders all of its investment company taxable income and net capital gain, if any, through the Valuation Date (computed without regard to any deduction for dividends paid);
(p) The Trust, on behalf of Acquired Fund, has maintained or has caused to be maintained on its behalf all books and accounts as required of a registered investment company in compliance with the requirements of Section 31 of the 1940 Act and the rules thereunder; and
(q) Acquired Fund is not acquiring Acquiring Fund Shares to be issued hereunder for the purpose of making any distribution thereof other than in accordance with the terms of this Agreement.
6. Conditions Precedent to Obligations of Acquired Fund
The obligations of the Trust, on behalf of Acquired Fund, to consummate the transactions provided for herein shall be subject, at its election, to the performance by the Company, on behalf of Acquiring Fund, of all the obligations to be performed by it hereunder on or before the Closing Date and, in addition thereto, the following conditions:
6.1. All representations and warranties of the Company made on behalf of Acquiring Fund contained in this Agreement shall be true and correct in all material respects as of the date hereof and, except as they may be affected by the transactions contemplated by this Agreement, as of the Closing Date with the same force and effect as if made on and as of the Closing Date;
6.2. The Company, on behalf of Acquiring Fund, shall have delivered to Acquired Fund a certificate of the Company's President and Treasurer, in a form reasonably satisfactory to Acquired Fund and dated as of the Closing Date, to the effect that the representations and warranties of the Company, on behalf of Acquiring Fund, made in this Agreement are true and correct at and as of the Closing Date, except as they may be affected by the transactions contemplated by this Agreement, and as to such other matters as Acquired Fund, shall reasonably request;
6.3. Acquired Fund, shall have received a favorable opinion from Dechert LLP, counsel to Acquiring Fund, dated as of the Closing Date, to the effect that:
(a) The Company is validly existing as a corporation under the laws of the State of Maryland (Maryland counsel may be relied upon in delivering such opinion); (b) the Company has the requisite corporate power to own its properties and assets and to carry on its business as described in its charter (Maryland counsel may be relied upon in delivering such opinion); (c) the Company is a duly registered, open-end, management investment company, and its registration with the Commission as an investment company under the 1940 Act is in full force and effect; (d) this Agreement has been duly authorized, executed and delivered by the Company and, assuming that the Registration Statement complies with the 1933 Act, the 1934 Act and the 1940 Act and regulations thereunder and assuming due authorization, execution and delivery of this Agreement by the Trust, on behalf of the
A-2-8
Acquired Fund, is a valid and binding agreement of Acquiring Fund enforceable against Acquiring Fund in accordance with its terms; (e) the issuance of the Acquiring Fund Shares has been duly authorized by all necessary corporate action on the part of the Company, and when such Acquiring Fund Shares are issued and delivered by the Company as contemplated by the Registration Statement and this Agreement against payment of the consideration therein described, such Acquiring Fund Shares will be validly issued, fully paid and non-assessable, and the issuance of the Acquiring Fund Shares by the Company will not be subject to any preemptive or similar rights arising under the Company's charter or bylaws, or under the Maryland General Corporation Laws (Maryland counsel may be relied upon in delivering such opinion); (f) the execution and delivery of this Agreement did not, and the consummation of the transactions contemplated hereby will not, conflict with the Company's charter or bylaws, each as amended; and (g) to the knowledge of such counsel, no consent, approval, authorization or order of any court or governmental authority of the United States or the State of New York is required for the consummation by Acquiring Fund of the transactions contemplated herein, except such as have been obtained under the 1933 Act, the 1934 Act and the 1940 Act and such as may be required under state securities laws; and
6.4. As of the Closing Date, there shall have been no material change in the investment objective, policies and restrictions of Acquiring Fund or any increase in the investment management fees or annual fees pursuant to Acquiring Fund's shareholder services plan from those described in Acquiring Fund's Prospectus dated April 30, 2013, as may be supplemented, and the Company's Statement of Additional Information dated April 30, 2013, as may be supplemented.
7. Conditions Precedent to Obligations of Acquiring Fund
The obligations of the Company, on behalf of Acquiring Fund, to complete the transactions provided for herein shall be subject, at its election, to the performance by Acquired Fund, of all the obligations to be performed by it hereunder on or before the Closing Date and, in addition thereto, the following conditions:
7.1. All representations and warranties of the Trust made on behalf of Acquired Fund contained in this Agreement shall be true and correct in all material respects as of the date hereof and, except as they may be affected by the transactions contemplated by this Agreement, as of the Closing Date with the same force and effect as if made on and as of the Closing Date;
7.2. The Trust, on behalf of Acquired Fund, shall have delivered to Acquiring Fund at the Closing a certificate of the Trust's President and its Treasurer, in form and substance satisfactory to Acquiring Fund and dated as of the Closing Date, to the effect that the representations and warranties of the Trust, on behalf of Acquired Fund, made in this Agreement are true and correct at and as of the Closing Date, except as they may be affected by the transactions contemplated by this Agreement, and as to such other matters as the Company, on behalf of Acquiring Fund, shall reasonably request;
7.3. Acquired Fund shall have delivered to Acquiring Fund a statement of the Acquired Fund Assets and its liabilities, together with a list of Acquired Fund's portfolio securities and other assets showing the respective adjusted bases and holding periods thereof for income tax purposes, as of the Closing Date, certified by the Treasurer of the Acquired Fund;
7.4. The Company, on behalf of Acquiring Fund, shall have received at the Closing a favorable opinion from Dechert LLP, counsel to Acquired Fund, dated as of the Closing Date to the effect that:
(a) Acquired Fund is a series of the Trust, a validly existing Massachusetts business trust, and has the power to own all of its properties and assets and to carry on its business as presently conducted; (b) Acquired Fund is a duly registered, open-end, management investment company under the 1940 Act which offers its shares only to insurance companies for accounts which they establish to fund variable life insurance and variable annuity contracts and to other entities under qualified pension and retirement plans, and its registration with the Commission as an investment company under the 1940 Act is in full force and effect; (c) this Agreement has been duly authorized, executed and delivered by the Trust, and, assuming that the Registration Statement complies with the 1933 Act, the 1934 Act and the 1940 Act and the regulations thereunder and assuming due authorization, execution and delivery of this Agreement by the Company, on behalf of Acquiring Fund, is a valid and binding agreement of Acquired
A-2-9
Fund enforceable against Acquired Fund in accordance with its terms; (d) the execution and delivery of this Agreement did not, and the consummation of the transactions contemplated hereby will not, conflict with the Trust's Declaration of Trust or By-Laws, each as amended; and (e) to the knowledge of such counsel, no consent, approval, authorization or order of any court or governmental authority of the United States or the Commonwealth of Massachusetts or the State of New York is required for the consummation by Acquired Fund of the transactions contemplated herein, except such as have been obtained under the 1933 Act, the 1934 Act and the 1940 Act and such as may be required under state securities laws; and
7.5. On the Closing Date, the Acquired Fund Assets shall include no assets that the Acquiring Fund, by reason of limitations of the Trust's Declaration of Trust, as amended, or otherwise, may not properly acquire.
8. Further Conditions Precedent to Obligations of Acquiring Fund and Acquired Fund
The obligations of the Trust, on behalf of Acquired Fund, and the Company, on behalf of Acquiring Fund, hereunder are each subject to the further conditions that on or before the Closing Date:
8.1. This Agreement and the transactions contemplated herein shall have been approved by the requisite vote of the holders of the outstanding shares of Acquired Fund in accordance with the provisions of the Trust's Declaration of Trust, as amended, and certified copies of the resolutions evidencing such approval shall have been delivered to Acquiring Fund;
8.2. On the Closing Date, no action, suit or other proceeding shall be pending before any court or governmental agency in which it is sought to restrain or prohibit, or obtain damages or other relief in connection with, this Agreement or the transactions contemplated herein;
8.3. All consents of other parties and all other consents, orders and permits of federal, state and local regulatory authorities (including those of the Commission and of state Blue Sky and securities authorities, including "no-action" positions of and exemptive orders from such federal and state authorities) deemed necessary by the Company, on behalf of Acquiring Fund, or Acquired Fund to permit consummation, in all material respects, of the transactions contemplated herein shall have been obtained, except where failure to obtain any such consent, order or permit would not involve risk of a material adverse effect on the assets or properties of Acquiring Fund or Acquired Fund;
8.4. The Registration Statement shall have become effective under the 1933 Act, no stop orders suspending the effectiveness thereof shall have been issued and, to the best knowledge of the parties hereto, no investigation or proceeding for that purpose shall have been instituted or be pending, threatened or contemplated under the 1933 Act;
8.5. The Trust, on behalf of Acquired Fund, shall have declared and paid a dividend or dividends and/or other distribution or distributions that, together with all previous such dividends or distributions, shall have the effect of distributing to the Acquired Fund shareholders all of Acquired Fund's investment company taxable income (computed without regard to any deduction for dividends paid) and all of its net capital gain (after reduction for any capital loss carry-forward and computed without regard to any deduction for dividends paid) for all taxable years ending on or before the Closing Date; and
8.6. The parties shall have received the opinion of the law firm of Dechert LLP (based on certain facts, assumptions and representations), addressed to Acquiring Fund and Acquired Fund, which opinion may be relied upon by the shareholders of Acquired Fund, substantially to the effect that, for federal income tax purposes:
(a) The transfer of all of Acquired Fund's assets in exchange solely for Acquiring Fund Shares and the assumption by Acquiring Fund of certain stated liabilities of Acquired Fund followed by the distribution by Acquired Fund of Acquiring Fund Shares to the Acquired Fund shareholders in exchange for their Acquired Fund shares pursuant to and in accordance with the terms of the Reorganization Agreement will constitute a "reorganization" within the meaning of Section 368(a)(1) of the Code;
A-2-10
(b) No gain or loss will be recognized by Acquiring Fund upon the receipt of the assets of Acquired Fund solely in exchange for Acquiring Fund Shares and the assumption by Acquiring Fund of the stated liabilities of Acquired Fund;
(c) No gain or loss will be recognized by Acquired Fund upon the transfer of substantially all of the assets of Acquired Fund to Acquiring Fund in exchange solely for Acquiring Fund Shares and the assumption by Acquiring Fund of the stated liabilities or upon the distribution of Acquiring Fund Shares to the Acquired Fund shareholders in exchange for their Acquired Fund shares, except that Acquired Fund may be required to recognize gain or loss with respect to contracts described in Section 1256(b) of the Code or stock in a passive foreign investment company, as defined in Section 1297(a) of the Code;
(d) No gain or loss will be recognized by the Acquired Fund shareholders upon the exchange of the Acquired Fund shares for Acquiring Fund Shares;
(e) The aggregate tax basis for Acquiring Fund Shares received by each Acquired Fund shareholder pursuant to the reorganization will be the same as the aggregate tax basis of the Acquired Fund shares held by each such Acquired Fund shareholder immediately prior to the Reorganization;
(f) The holding period of Acquiring Fund Shares to be received by each Acquired Fund shareholder will include the period during which the Acquired Fund shares surrendered in exchange therefor were held (provided such Acquired Fund shares were held as capital assets on the date of the Reorganization);
(g) The tax basis of the assets of Acquired Fund acquired by Acquiring Fund will be the same as the tax basis of such assets to Acquired Fund in exchange therefor; and
(h) The holding period of the assets of Acquired Fund in the hands of Acquiring Fund will include the period during which those assets were held by Acquired Fund (except where the investment activities of Acquiring Fund have the effect of reducing or eliminating such periods with respect to an asset).
Notwithstanding anything herein to the contrary, neither the Company, on behalf of Acquiring Fund, nor the Trust, on behalf of Acquired Fund, may waive the conditions set forth in this paragraph 8.6.
9. Fees and Expenses
Morgan Stanley Investment Management Inc., the Acquired Fund's investment adviser shall bear expenses incurred in connection with the entering into, and carrying out of, the provisions of this Agreement, including printing, filing and proxy solicitation expenses, legal, accounting, Commission registration fees and Blue Sky expenses.
10. Entire Agreement; Survival of Warranties
10.1. This Agreement constitutes the entire agreement between the parties.
10.2. The representations, warranties and covenants contained in this Agreement or in any document delivered pursuant hereto or in connection herewith shall survive the consummation of the transactions contemplated herein, except that the representations, warranties and covenants of the Trust, on behalf of Acquired Fund, hereunder shall not survive the dissolution and complete liquidation of Acquired Fund in accordance with paragraph 1.9.
11. Termination
11.1. This Agreement may be terminated and the transactions contemplated hereby may be abandoned at any time prior to the Closing:
(a) by the mutual written consent of the Trust, on behalf of Acquired Fund, and the Company, on behalf of Acquiring Fund;
(b) by either the Company, on behalf of Acquiring Fund, or the Trust, on behalf of Acquired Fund, by notice to the other, without liability to the terminating party on account of such termination (providing the
A-2-11
terminating party is not otherwise in material default or breach of this Agreement), if the Closing shall not have occurred on or before October 3, 2014; or
(c) by either the Company, on behalf of Acquiring Fund, or the Trust, on behalf of Acquired Fund, in writing without liability to the terminating party on account of such termination (provided the terminating party is not otherwise in material default or breach of this Agreement), if (i) the other party shall fail to perform in any material respect its agreements contained herein required to be performed on or prior to the Closing Date, (ii) the other party materially breaches any of its representations, warranties or covenants contained herein, (iii) the Acquired Fund shareholders fail to approve this Agreement at any meeting called for such purpose at which a quorum was present or (iv) any other condition herein expressed to be precedent to the obligations of the terminating party has not been met and it reasonably appears that it will not or cannot be met.
11.2. (a) Termination of this Agreement pursuant to paragraphs 11.1(a) or (b) shall terminate all obligations of the parties hereunder and there shall be no liability for damages on the part of the Company, Acquiring Fund, the Trust or Acquired Fund, or the directors or officers of the Company, on behalf of Acquiring Fund, or the trustees or officers of the Trust, on behalf of Acquired Fund, to any other party or its directors, trustees or officers.
(b) Termination of this Agreement pursuant to paragraph 11.1(c) shall terminate all obligations of the parties hereunder and there shall be no liability for damages on the part of the Company, Acquiring Fund, the Trust or Acquired Fund, or the directors or officers of the Company, on behalf of Acquiring Fund, or the trustees or officers of the Trust, on behalf of Acquired Fund, except that any party in breach of this Agreement shall, upon demand, reimburse the non-breaching party for all reasonable out-of-pocket fees and expenses incurred in connection with the transactions contemplated by this Agreement, including legal, accounting and filing fees.
12. Amendments
This Agreement may be amended, modified or supplemented in such manner as may be mutually agreed upon in writing by the parties.
13. Miscellaneous
13.1. The article and paragraph headings contained in this Agreement are for reference purposes only and shall not affect in any way the meaning or interpretation of this Agreement.
13.2. This Agreement may be executed in any number of counterparts, each of which shall be deemed an original.
13.3. This Agreement shall be governed by and construed in accordance with the laws of the State of New York.
13.4. This Agreement shall bind and inure to the benefit of the parties hereto and their respective successors and assigns, but no assignment or transfer hereof or of any rights or obligations hereunder shall be made by any party without the written consent of the other party. Nothing herein expressed or implied is intended or shall be construed to confer upon or give any person, firm or corporation, other than the parties hereto and their respective successors and assigns, any rights or remedies hereunder or by reason of this Agreement.
13.5. The obligations and liabilities of Acquiring Fund hereunder are solely those of Acquiring Fund. It is expressly agreed that no shareholder, nominee, director, officer, agent, or employee of Acquiring Fund, or the directors or officers of the Company, acting on behalf of Acquiring Fund, shall be personally liable hereunder. The execution and delivery of this Agreement have been authorized by the directors of Acquiring Fund and signed by authorized officers of the Company, acting on behalf of Acquiring Fund, and neither such authorization by such directors nor such execution and delivery by such officers shall be deemed to have been made by any of them individually or to impose any liability on any of them personally.
13.6. The obligations and liabilities of Acquired Fund hereunder are solely those of Acquired Fund. It is expressly agreed that no shareholder, nominee, trustee, officer, agent, or employee of Acquired Fund, or the trustees or officers of the Trust, acting on behalf of Acquired Fund, shall be personally liable hereunder. The execution and
A-2-12
delivery of this Agreement have been authorized by the trustees of the Acquired Fund and signed by authorized officers of the Trust, acting on behalf of Acquired Fund, and neither such authorization by such trustees nor such execution and delivery by such officers shall be deemed to have been made by any of them individually or to impose any liability on any of them personally.
IN WITNESS WHEREOF, each of the parties hereto has caused this Agreement to be executed by a duly authorized officer.
THE UNIVERSAL INSTITUTIONAL FUNDS, INC.,
on behalf of the Global Infrastructure Portfolio | |
By: /s/ John H. Gernon
Name: John H. Gernon
Title: President and Principal Executive Officer | |
MORGAN STANLEY VARIABLE INVESTMENT SERIES,
on behalf of the Global Infrastructure Portfolio | |
By: /s/ John H. Gernon
Name: John H. Gernon
Title: President and Principal Executive Officer | |
A-2-13
Class I Prospectus
December 18, 2013
The Universal Institutional Funds, Inc.
Global Infrastructure Portfolio
Both capital appreciation and current income.
Adviser
Morgan Stanley Investment Management Inc.
The Universal Institutional Funds, Inc. (the "Fund") is a mutual fund that provides investment vehicles for variable annuity contracts and variable life insurance policies and for certain tax-qualified investors.
The Securities and Exchange Commission (the "SEC") has not approved or disapproved these securities or passed upon the adequacy of this Prospectus. Any representation to the contrary is a criminal offense.
Ticker Symbol: UPGIX
Portfolio Summary | | | 1 | | |
Details of the Portfolio | | | 4 | | |
Additional Risk Factors and Information | | | 7 | | |
Fund Management | | | 10 | | |
Shareholder Information | | | 11 | | |
Financial Highlights | | | 13 | | |
Class I Prospectus
Portfolio Summary
Portfolio Summary
Global Infrastructure Portfolio
Objective
The Portfolio seeks both capital appreciation and current income.
Fees and Expenses of the Portfolio (Class I)
The table below describes the fees and expenses that you may pay if you buy and hold the classes of shares that may be offered by the Portfolio. The Portfolio does not charge any sales loads or other fees when you purchase or redeem shares. The table and the example below do not reflect the impact of any charges by your insurance company. If they did, Total Annual Portfolio Operating Expenses would be higher.
Annual Portfolio Operating Expenses
(expenses that you pay each year as a percentage of the value of your investment)
Advisory Fee | | | 0.85 | % | |
Distribution (12b-1) Fee | | | None | | |
Other Expenses‡ | | | 0.50 | % | |
Total Annual Portfolio Operating Expenses* | | | 1.35 | % | |
Fee Waiver and/or Expense Reimbursement* | | | 0.24 | % | |
Total Annual Portfolio Operating Expenses
After Fee Waiver and/or Expense
Reimbursement* | | | 1.11 | % | |
‡ Other expenses have been estimated for the current fiscal year.
* The Portfolio's "Adviser," Morgan Stanley Investment Management Inc., has agreed to reduce its advisory fee and/or reimburse the Portfolio so that Total Annual Portfolio Operating Expenses, excluding certain investment related expenses, taxes, interest and other extraordinary expenses (including litigation), will not exceed 1.11%. The fee waivers and/or expense reimbursements will continue for at least two years or until such time as the Fund's Board of Directors acts to discontinue all or a portion of such waivers and/or reimbursements when it deems such action is appropriate.
Example
The example below is intended to help you compare the cost of investing in the Portfolio with the cost of investing in other mutual funds.
The example assumes that you invest $10,000 in the Portfolio, your investment has a 5% return each year and that the Portfolio's operating expenses remain the same. Although your actual costs may be higher or lower, based on these assumptions, your costs would be:
| | | 1 Year | | 3 Years | |
Global Infrastructure
Portfolio | | $ | 113 | | | $ | 353 | | |
Portfolio Turnover
The Portfolio pays transaction costs when it buys and sells securities (or "turns over" its portfolio). A higher portfolio turnover rate may indicate higher transaction costs. These costs, which are not reflected in Total Annual Portfolio Operating Expenses or in the Example, affect Portfolio performance.
Principal Investment Strategies
The Portfolio normally invests at least 80% of its assets in equity securities issued by companies located throughout the world that are engaged in the infrastructure business. A company is considered to be in the infrastructure business if it derives at least 50% of its revenues or earnings from, or devotes at least 50% of its assets to, infrastructure-related activities. Infrastructure refers to the systems and networks of energy, transportation, communication and other services required for the normal function of society. Companies in the infrastructure business may be involved in a variety of areas, including, but not limited to, (i) the transmission, distribution, storage or transportation of electricity, oil and gas (and other bulk liquid products), water, and other natural resources used to produce energy, (ii) the construction and operation of renewable power facilities, (iii) the development, ownership, lease, concession, or management of highways, toll roads, tunnels, bridges, pipelines, airports, marine ports, refueling and related facilities, (iv) the provision of communications, including the development, lease, concession, or management of telephone, broadcast and mobile towers, fiber optic/copper cable, and satellite networks, (v) waste-water management and water purification/desalination and (vi) the construction or operation of essential public structures. The Portfolio's equity investments may include convertible securities. The Portfolio's investments may include securities of small and medium capitalization companies. The Portfolio may invest up to 100% of its net assets in foreign securities, which may include emerging market securities. Under normal market conditions, the Portfolio invests at least 40% of its assets in the securities of issuers located outside of the United States.
The Portfolio's Adviser and/or "Sub-Advisers," Morgan Stanley Investment Management Limited ("MSIM Limited") and Morgan Stanley Investment Management Company ("MSIM Company"), allocate the Portfolio's assets between the different types of companies in the infrastructure business based on relative valuation, underlying company fundamentals, and
UIF Global Infrastructure Portfolio 1
Global Infrastructure Portfolio (Cont'd)
demographic and macroeconomic considerations. The Portfolio has a fundamental policy (i.e., one that cannot be changed without shareholder approval) of investing 25% or more of its assets in the infrastructure industry.
In selecting securities to buy, hold or sell for the Portfolio, the Adviser and/or Sub-Advisers actively manage the Portfolio using a combination of bottom-up and top-down methodologies. The value-driven approach to bottom-up security selection utilizes proprietary research models to identify infrastructure companies that offer the best value relative to their underlying assets and growth prospects. The top-down allocation provides diversified exposure to major economic infrastructure sectors and countries, with an overweighting to those sectors/countries that offer the best relative valuation.
Principal Risks
There is no assurance that the Portfolio will achieve its investment objective and you can lose money investing in this Portfolio. The principal risks of investing in the Portfolio include:
• Infrastructure Industry. By concentrating its investments in the infrastructure industry, the Portfolio has greater exposure to the potential adverse economic, regulatory, political and other changes affecting companies operating within such industry. Companies within the infrastructure industry are subject to a variety of factors that may adversely affect their business or operations, including high interest costs in connection with capital construction and improvement programs, high leverage, costs associated with compliance with and changes in environmental and other regulations, difficulty in raising capital in adequate amounts and on reasonable terms in periods of high inflation and unsettled capital markets or government budgetary constraints that impact publicly funded projects, the effects of economic slowdown or recession and surplus capacity, increased competition from other providers of services, uncertainties concerning the availability of fuel at reasonable prices, the effects of energy conservation policies and other factors.
Other factors that may affect the operations of companies within the infrastructure industry include innovations in technology that could render the way in which a company delivers a product or service obsolete, significant changes to the number of ultimate end-users of a company's products, inexperience with and potential losses resulting from a developing deregulatory environment, increased susceptibility to terrorist
attacks, risks of environmental damage due to a company's operations or an accident, and general changes in market sentiment towards infrastructure and utilities assets. Companies operating in the infrastructure industry face operating risks, including the risk of fire, explosions, leaks, mining and drilling accidents or other catastrophic events. In addition, natural risks, such as earthquakes, floods, lightning, hurricanes, tsunamis and wind, are inherent risks in infrastructure company operations.
• Equity Securities. In general, prices of equity securities are more volatile than those of fixed income securities. The prices of equity securities fluctuate, and sometimes widely fluctuate, in response to activities specific to the issuer of the security as well as factors unrelated to the fundamental condition of the issuer, including general market, economic and political conditions. To the extent that the Portfolio invests in a convertible security, and the convertible security's investment value is greater than its conversion value, its price will be likely to increase when interest rates fall and decrease when interest rates rise. If the conversion value exceeds the investment value, the price of the convertible security will tend to fluctuate directly with the price of the underlying equity security.
• Small and Medium Capitalization Companies. Investments in small and medium capitalization companies may involve greater risks than investments in larger, more established companies. The securities issued by small and medium capitalization companies may be less liquid and such companies may have more limited markets, financial resources and product lines, and may lack the depth of management of larger companies.
• Foreign and Emerging Market Securities. Investments in foreign markets entail special risks such as currency, political, economic and market risks. There also may be greater market volatility, less reliable financial information, higher transaction and custody costs, decreased market liquidity and less government and exchange regulation associated with investments in foreign markets. In addition, investments in certain foreign markets, which have historically been considered stable, may become more volatile and subject to increased risk due to ongoing developments and changing conditions in such markets. Moreover, the growing interconnectivity of global economies and financial markets has increased the probability that adverse developments and conditions in one country or region will affect the stability of economies and financial markets in other countries or regions. The risks of investing
2 UIF Global Infrastructure Portfolio
Class I Prospectus
Portfolio Summary
Global Infrastructure Portfolio (Cont'd)
in emerging market countries are greater than risks associated with investments in foreign developed countries. In addition, the Portfolio's investments may be denominated in foreign currencies and therefore, to the extent unhedged, the value of the investment will fluctuate with the U.S. dollar exchange rates.
• Non-Diversification. Because the Portfolio is non-diversified, it may be more susceptible to an adverse event affecting a portfolio investment than a diversified portfolio and a decline in the value of that instrument would cause the Portfolio's overall value to decline to a greater degree.
Shares of the Portfolio are not bank deposits and are not guaranteed or insured by the Federal Deposit Insurance Corporation or any other government agency.
Performance Information
As of the date hereof, the Portfolio has not yet completed a full calendar year of investment operations. Upon the completion of a full calendar year of investment operations by the Portfolio, this section will include charts that show annual total returns, highest and lowest quarterly returns and average annual total returns compared to a benchmark index selected for the Portfolio.
Fund Management
Adviser. Morgan Stanley Investment Management Inc.
Sub-Advisers. Morgan Stanley Investment Management Limited and Morgan Stanley Investment Management Company.
Portfolio Managers. The Portfolio is managed by members of the Global Infrastructure Securities team. Information about the members jointly and primarily responsible for the day-to-day management of the Portfolio is shown below:
Name | | Title with Adviser | | Date Began
Managing
Portfolio | |
Theodore R. Bigman | | Managing Director | | Since Inception | |
Matthew King | | Executive Director | | Since Inception | |
Purchase and Sale of Portfolio Shares
This Prospectus offers Class I shares of the Portfolio. The Fund also offers Class II shares of the Portfolio through a separate prospectus. Class II shares are subject to higher expenses due to the imposition of a 12b-1 fee. For eligibility information, contact your
insurance company or qualified pension or retirement plan.
Fund shares will be sold at the net asset value ("NAV") next determined after we receive the redemption request on your behalf.
The Portfolio offers its shares only to insurance companies for separate accounts that they establish to fund variable life insurance and variable annuity contracts, and to other entities under qualified pension and retirement plans. An insurance company purchases or redeems shares of the Portfolio based on, among other things, the amount of net contract premiums or purchase payments allocated to a separate account investment division, transfers to or from a separate account investment division, contract loans and repayments, contract withdrawals and surrenders, and benefit payments. The contract prospectus describes how contract owners may allocate, transfer and withdraw amounts to, and from, separate accounts.
For more information, please refer to the section of the Prospectus entitled "Shareholder Information—Purchasing and Selling Portfolio Shares."
Tax Information
Special tax rules apply to life insurance companies, variable annuity contracts and variable life insurance contracts. For information on federal income taxation of a life insurance company with respect to its receipt of distributions from the Portfolio and federal income taxation of owners of variable annuity or variable life insurance contracts, refer to the contract prospectus.
For more information, please refer to the section of the Prospectus entitled "Shareholder Information—Taxes."
Payments to Insurance Companies and Other Financial Intermediaries
The Adviser and/or the Portfolio's "Distributor," Morgan Stanley Distribution, Inc., may pay insurance companies or their affiliates and/or other financial intermediaries for the sale of Portfolio shares and related services. These payments, which may be significant in amount, may create a conflict of interest by influencing the intermediary and your salesperson to recommend one variable annuity contract over another or be a factor in an insurance company's decision to include the Portfolio as an underlying investment option in its variable insurance products. Ask your salesperson or visit your insurance company's or other intermediary's web site for more information.
UIF Global Infrastructure Portfolio 3
Details of the Portfolio
Global Infrastructure Portfolio
Objective
The Portfolio seeks both capital appreciation and current income.
The Portfolio's investment objective may be changed by the Fund's Board of Directors without shareholder approval, but no change is anticipated. If the Portfolio's investment objective changes, the Portfolio will notify shareholders and shareholders should consider whether the Portfolio remains an appropriate investment in light of the change.
Approach
The Adviser and/or Sub-Advisers seek both capital appreciation and current income by investing primarily in equity securities issued by companies located throughout the world that are engaged in the infrastructure business. Using internal proprietary research, the Adviser and/or Sub-Advisers seek to identify public infrastructure companies that are believed to offer the best value relative to their underlying assets and growth prospects.
Process
The Portfolio normally invests at least 80% of its assets in equity securities issued by companies located throughout the world that are engaged in the infrastructure business. A company is considered to be in the infrastructure business if it derives at least 50% of its revenues or earnings from, or devotes at least 50% of its assets to, infrastructure-related activities. Infrastructure refers to the systems and networks of energy, transportation, communication and other services required for the normal function of society. Companies in the infrastructure business may be involved in a variety of areas, including, but not limited to, (i) the transmission, distribution, storage or transportation of electricity, oil and gas (and other bulk liquid products), water, and other natural resources used to produce energy, (ii) the construction and operation of renewable power facilities, (iii) the development, ownership, lease, concession, or management of highways, toll roads, tunnels, bridges, pipelines, airports, marine ports, refueling and related facilities, (iv) the provision of communications, including the development, lease, concession, or management of telephone, broadcast and mobile towers, fiber optic/copper cable, and satellite networks, (v) waste-water management and water purification/desalination and (vi) the construction or operation of essential public structures. The Portfolio's equity investments may include convertible securities. The Portfolio's investments may
include securities of small and medium capitalization companies. The Portfolio may invest up to 100% of its net assets in foreign securities, which may include emerging market securities. Under normal market conditions, the Portfolio invests at least 40% of its assets in the securities of issuers located outside of the United States.
The Adviser and/or Sub-Advisers allocate the Portfolio's assets between the different types of companies in the infrastructure business based on relative valuation, underlying company fundamentals, and demographic and macroeconomic considerations. The Portfolio has a fundamental policy (i.e., one that cannot be changed without shareholder approval) of investing 25% or more of its assets in the infrastructure industry.
In selecting securities to buy, hold or sell for the Portfolio, the Adviser and/or Sub-Advisers actively manage the Portfolio using a combination of bottom-up and top-down methodologies. The value-driven approach to bottom-up security selection utilizes proprietary research models to identify infrastructure companies that offer the best value relative to their underlying assets and growth prospects. The top-down allocation provides exposure to major economic infrastructure sectors and countries, with an overweighting to those sectors/countries that offer the best relative valuation. The Adviser and/or Sub-Advisers generally consider selling a portfolio holding when it determines that the holding no longer satisfies its investment criteria.
The remaining 20% of the Portfolio's assets may be invested in fixed income securities, equity securities of companies not engaged in the infrastructure business, U.S. government securities issued or guaranteed as to principal and interest by the U.S. Government or its agencies or instrumentalities, and asset-backed securities. The Portfolio may also invest in real estate investment trusts ("REITs") and foreign real estate companies and convertible securities. The Portfolio may invest up to 5% of its assets in fixed income securities and convertible securities rated below investment grade (often referred to as "high yield securities" or "junk bonds").
Risks
There is no assurance that the Portfolio will achieve its investment objective.
4 UIF Global Infrastructure Portfolio
Class I Prospectus
Details of the Portfolio
Details of the Portfolio
Global Infrastructure Portfolio (Cont'd)
By concentrating its investments in the infrastructure industry, the Portfolio has greater exposure to the potential adverse economic, regulatory, political and other changes affecting companies operating within such industry. Companies within the infrastructure industry are subject to a variety of factors that may adversely affect their business or operations, including high interest costs in connection with capital construction and improvement programs, high leverage, costs associated with compliance with and changes in environmental and other regulations, difficulty in raising capital in adequate amounts and on reasonable terms in periods of high inflation and unsettled capital markets or government budgetary constraints that impact publicly funded projects, the effects of economic slowdown or recession and surplus capacity, increased competition from other providers of services, uncertainties concerning the availability of fuel at reasonable prices, the effects of energy conservation policies and other factors. Additionally, companies within the infrastructure industry may be subject to regulation by various government authorities and may also be affected by government regulation of rates charged to customers, service interruption or legal challenges due to environmental, operational or other mishaps and the imposition of special tariffs and changes in tax laws, regulatory policies and accounting standards; technological innovations that may render existing plants, equipment or products obsolete, unforeseen delays, accidents, and cost overruns in infrastructure projects. Any market price movements, regulatory or technological changes, or economic conditions affecting infrastructure-related companies may have a significant impact on the Portfolio's performance. Other factors that may affect the operations of companies within the infrastructure industry include innovations in technology that could render the way in which a company delivers a product or service obsolete, significant changes to the number of ultimate end-users of a company's products, inexperience with and potential losses resulting from a developing deregulatory environment, increased susceptibility to terrorist attacks, risks of environmental damage due to a company's operations or an accident, and general changes in market sentiment towards infrastructure and utilities assets.
Companies operating in the infrastructure industry face operating risks, including the risk of fire, explosions, leaks, mining and drilling accidents or other catastrophic events. If any of these operating risks occur, it
could cause substantial losses to the given infrastructure company. In addition, natural risks, such as earthquakes, floods, lightning, hurricanes, tsunamis and wind, are inherent risks in infrastructure company operations. For example, extreme weather patterns, such as Hurricane Ivan in 2004 and Hurricanes Katrina and Rita in 2005, the Tohuku earthquake and resulting tsunami in Japan in 2011, could result in substantial damage to the facilities of certain companies located in the affected areas and such extreme weather patterns, or the threat thereof, could adversely impact the prices of the securities in which the Portfolio invests. This volatility may create fluctuations in commodity prices and earnings of companies in the infrastructure industry.
Investing in the Portfolio may be appropriate for you if you are willing to accept the risks and uncertainties of investing in a portfolio of equity securities issued by companies located throughout the world that are engaged in the infrastructure business. In general, prices of equity securities are more volatile than those of fixed income securities. The prices of equity securities will rise and fall in response to a number of different factors. In particular, prices of equity securities fluctuate, and sometimes widely fluctuate, in response to activities specific to the issuer of the security as well as factors unrelated to the fundamental condition of the issuer, including general market, economic and political conditions.
To the extent that the Portfolio invests in a convertible security, and the convertible security's investment value is greater than its conversion value, its price will be likely to increase when interest rates fall and decrease when interest rates rise. If the conversion value exceeds the investment value, the price of the convertible security will tend to fluctuate directly with the price of the underlying equity security.
In addition, at times, small and medium capitalization equity securities may underperform relative to the overall market. Investments in small and medium capitalization companies may involve greater risk than investments in larger, more established companies. The securities issued by small and medium capitalization companies may be less liquid and their prices subject to more abrupt or erratic price movements. In addition, small and medium capitalization companies may have more limited markets, financial resources and product
UIF Global Infrastructure Portfolio 5
Details of the Portfolio
Global Infrastructure Portfolio (Cont'd)
lines, and may lack the depth of management of larger companies. The Adviser's and/or Sub-Advisers' perception that a stock is under- or over-valued may not be accurate or may not be realized.
Investing in the securities of foreign issuers, particularly those located in emerging market or developing countries, entails the risk that news and events unique to a country or region will affect those markets and their issuers. The value of the Portfolio's shares may vary widely in response to political and economic factors affecting companies in foreign countries. These same events will not necessarily have an effect on the U.S. economy or similar issuers located in the United States. In addition, investments in certain foreign markets, which have historically been considered stable, may become more volatile and subject to increased risk due to ongoing developments and changing conditions in such markets. Moreover, the growing interconnectivity of global economies and financial markets has increased probability that adverse developments and conditions
in one country or region will affect the stability of economies and financial markets in other countries or regions.
The Portfolio's investments may be denominated in foreign currencies and therefore, to the extent unhedged, the value of the investment will fluctuate with the U.S. dollar exchange rates.
The risks of investing in the Portfolio may be intensified because the Portfolio is non-diversified, which means that it may invest in securities of a limited number of issuers. As a result, the performance of a particular investment or a small group of investments may affect the Portfolio's performance more than if the Portfolio were diversified.
Please see "Additional Risk Factors and Information" for further information about these and other risks of investing in the Portfolio.
6 UIF Global Infrastructure Portfolio
Class I Prospectus
Additional Risk Factors and Information
Additional Risk Factors and Information
This section discusses additional risk factors and information relating to the Portfolio. The Portfolio's investment practices and limitations are described in more detail in the Statement of Additional Information ("SAI"), which is incorporated by reference and legally is a part of this Prospectus. For details on how to obtain a copy of the SAI and other reports and information, see the back cover of this Prospectus.
Price Volatility
The value of your investment in the Portfolio is based on the market prices of the securities the Portfolio holds. These prices change daily due to economic and other events that affect markets generally, as well as those that affect particular regions, countries, industries or companies. These price movements, sometimes called volatility, may be greater or less depending on the types of securities the Portfolio owns and the markets in which the securities trade. Over time, equity securities have generally shown gains superior to fixed income securities, although they have tended to be more volatile in the short term. As a result of price volatility, there is a risk that you may lose money by investing in the Portfolio.
Equity Securities
Equity securities may include common and preferred stocks, convertible securities and equity-linked securities, rights and warrants to purchase common stocks, depositary receipts, limited partnership interests and other specialty securities having equity features. The Portfolio may invest in equity securities that are publicly traded on securities exchanges or over-the-counter ("OTC") or in equity securities that are not publicly traded. Securities that are not publicly traded may be more difficult to sell and their value may fluctuate more dramatically than other securities.
Depositary receipts involve many of the same risks as those associated with direct investment in foreign securities. In addition, the underlying issuers of certain depositary receipts, particularly unsponsored or unregistered depositary receipts, are under no obligation to distribute shareholder communications to the holders of such receipts, or to pass through to them any voting rights with respect to the deposited securities.
A convertible security is a bond, debenture, note, preferred stock, right, warrant or other security that may be converted into or exchanged for a prescribed amount of common stock or other security of the same or a different issuer or into cash within a particular period of time at a specified price or formula. A convertible security generally entitles the holder to receive interest paid or accrued on debt securities or the dividend paid on preferred stock until the convertible security matures or is redeemed, converted or exchanged. Before conversion, convertible securities generally have characteristics similar to both debt and equity securities. The value of convertible securities tends to decline as interest rates rise and, because of the conversion feature, tends to vary with fluctuations in the market value of the underlying
securities. Convertible securities ordinarily provide a stream of income with generally higher yields than those of common stock of the same or similar issuers. Convertible securities generally rank senior to common stock in a corporation's capital structure but are usually subordinated to comparable nonconvertible securities. Convertible securities generally do not participate directly in any dividend increases or decreases of the underlying securities although the market prices of convertible securities may be affected by any dividend changes or other changes in the underlying securities.
Fixed Income Securities
The Portfolio may invest in fixed income securities. Fixed income securities are securities that pay a fixed or a variable rate of interest until a stated maturity date. Fixed income securities include U.S. government securities, securities issued by federal or federally sponsored agencies and instrumentalities, corporate bonds and notes, asset-backed securities, mortgage securities, securities rated below investment grade (commonly referred to as "junk bonds" or "high yield/high risk securities"), municipal bonds, loan participations and assignments, zero coupon bonds, convertible securities, Eurobonds, Brady Bonds, Yankee Bonds, repurchase agreements, commercial paper and cash equivalents.
Fixed income securities are subject to the risk of the issuer's inability to meet principal and interest payments on its obligations (i.e., credit risk) and are subject to price volatility resulting from, among other things, interest rate sensitivity, market perception of the creditworthiness of the issuer and general market liquidity (i.e., market risk). Securities with longer durations are likely to be more sensitive to changes in interest rates, generally making them more volatile than securities with shorter durations. Lower rated fixed income securities have greater volatility because there is less certainty that principal and interest payments will be made as scheduled. Fixed income securities may be called (i.e., redeemed by the issuer) prior to final maturity. If a callable security is called, the Portfolio may have to reinvest the proceeds at a lower rate of interest.
Foreign Securities
Foreign issuers generally are subject to different accounting, auditing and financial reporting standards than U.S. issuers. There may be less information available to the public about foreign issuers. Securities of foreign issuers can be less liquid and experience greater price movements. In addition, the prices of such securities may be susceptible to influence by large traders,
UIF Global Infrastructure Portfolio 7
Additional Risk Factors and Information (Cont'd)
due to the limited size of many foreign securities markets. Moreover, investments in certain foreign markets, which have historically been considered stable, may become more volatile and subject to increased risk due to ongoing developments and changing conditions in such markets. Also, the growing interconnectivity of global economies and financial markets has increased the probability that adverse developments and conditions in one country or region will affect the stability of economies and financial markets in other countries or regions. In some foreign countries, there is also the risk of government expropriation, excessive taxation, political or social instability, the imposition of currency controls, or diplomatic developments that could affect the Portfolio's investment. There also can be difficulty obtaining and enforcing judgments against issuers in foreign countries. Foreign stock exchanges, broker-dealers, and listed issuers may be subject to less government regulation and oversight. The cost of investing in foreign securities, including brokerage commissions and custodial expenses, can be higher than in the United States.
In connection with its investments in foreign securities, the Portfolio also may enter into contracts with banks, brokers or dealers to purchase or sell securities or foreign currencies at a future date. A foreign currency forward exchange contract is a negotiated agreement between the contracting parties to exchange a specified amount of currency at a specified future time at a specified rate. The rate can be higher or lower than the spot rate between the currencies that are the subject of the contract. Foreign currency forward exchange contracts may be used to protect against uncertainty in the level of future foreign currency exchange rates or to gain or modify exposure to a particular currency. In addition, the Portfolio may use cross currency hedging or proxy hedging with respect to currencies in which the Portfolio has or expects to have portfolio or currency exposure. Cross currency hedges involve the sale of one currency against the positive exposure to a different currency and may be used for hedging purposes or to establish an active exposure to the exchange rate between any two currencies.
Emerging Market Risks
The Portfolio may invest in emerging market or developing countries, which are countries that major international financial institutions, such as the World Bank, generally consider to be less economically mature than developed nations, such as the United States or most nations in Western Europe. Emerging market or
developing countries may be more likely to experience political turmoil or rapid changes in economic conditions than more developed countries, and the financial condition of issuers in emerging market or developing countries may be more precarious than in other countries. In addition, emerging market securities generally are less liquid and subject to wider price and currency fluctuations than securities issued in more developed countries. These characteristics result in greater risk of price volatility in emerging market or developing countries, which may be heightened by currency fluctuations relative to the U.S. dollar.
Foreign Currency
The Portfolio's investments in foreign securities may be denominated in foreign currencies. The value of foreign currencies may fluctuate relative to the value of the U.S. dollar. Since the Portfolio may invest in such non-U.S. dollar-denominated securities, and therefore may convert the value of such securities into U.S. dollars, changes in currency exchange rates can increase or decrease the U.S. dollar value of the Portfolio's assets. The Adviser and/or the Sub-Advisers may use derivatives to reduce this risk. The Adviser and/or the Sub-Advisers may in their discretion choose not to hedge against currency risk. In addition, certain market conditions may make it impossible or uneconomical to hedge against currency risk.
Asset-Backed Securities
Asset-backed securities apply the securitization techniques used to develop mortgage-backed securities to a broad range of other assets. Various types of assets, such as a pool of power generation assets or other infrastructure assets or infrastructure-related assets, are pooled and securitized in pass-through structures similar to pass-through structures developed with respect to mortgage securitizations. Asset-backed securities have risk characteristics similar to mortgage-backed securities. Like mortgage-backed securities, they generally decrease in value as a result of interest rate increases, but may benefit less than other fixed income securities from declining interest rates, principally because of prepayments. Also, as in the case of mortgage-backed securities, prepayments generally increase during a period of declining interest rates, although other factors, such as changes in credit use and payment patterns, may also influence prepayment rates. Asset-backed securities also involve the risk that various federal and state consumer laws and other legal and economic factors may result in the collateral backing the securities being insufficient to support payment on the securities.
8 UIF Global Infrastructure Portfolio
Class I Prospectus
Additional Risk Factors and Information
Additional Risk Factors and Information (Cont'd)
Real Estate Investment Trusts and Foreign Real Estate Companies
Investing in REITs and foreign real estate companies exposes investors to the risks of owning real estate directly, as well as to risks that relate specifically to the way in which REITs and foreign real estate companies are organized and operated. REITs and foreign real estate companies generally invest directly in real estate, in mortgages or in some combination of the two. Operating REITs and foreign real estate companies requires specialized management skills and the Portfolio may indirectly bear management expenses along with the direct expenses of the Portfolio. Individual REITs and foreign real estate companies may own a limited number of properties and may concentrate in a particular region or property type. REITs also must satisfy specific requirements of the Internal Revenue Code of 1986, as amended, in order to qualify for tax-free pass-through income. The failure of a company to qualify as a REIT could have adverse consequences for the Portfolio, including significantly reducing the return to the Portfolio on its investment in such company. Foreign real estate companies may be subject to laws, rules and regulations governing those entities and their failure to comply with those laws, rules and regulations could negatively impact the performance of those entities. In addition, REITs and foreign real estate companies, like mutual funds, have expenses, including management and administration fees, that are paid by their shareholders. As a result, shareholders will absorb their proportionate share of duplicate levels of fees when the Portfolio invests in REITs and foreign real estate companies.
Investment Discretion
In pursuing the Portfolio's investment objective, the Adviser and/or Sub-Advisers have considerable leeway in deciding which investments they buy, hold or sell on a day-to-day basis, and which trading strategies they use. For example, the Adviser and/or Sub-Advisers, in their discretion, may determine to use some permitted trading strategies while not using others. The success or failure of such decisions will affect the Portfolio's performance.
Temporary Defensive Investments
When the Adviser and/or Sub-Advisers believe that changes in market, economic, political or other conditions warrant, the Portfolio may invest without limit in cash, cash equivalents or other fixed income securities that may be inconsistent with its principal investment strategies for temporary defensive purposes. If the Adviser and/or Sub-Advisers incorrectly predict the effects of these changes, such defensive investments may adversely affect the Portfolio's performance and the Portfolio may not achieve its investment objective.
Portfolio Turnover
Consistent with its investment policies, the Portfolio will purchase and sell securities without regard to the effect on portfolio turnover. Higher portfolio turnover (e.g., over 100% per year) will cause the Portfolio to incur additional transaction costs. The Portfolio may engage in frequent trading of securities to achieve its investment objective.
UIF Global Infrastructure Portfolio 9
Class I Prospectus
Fund Management
Adviser
Morgan Stanley Investment Management Inc., with principal offices at 522 Fifth Avenue, New York, NY 10036, conducts a worldwide portfolio management business and provides a broad range of portfolio management services to customers in the United States and abroad. Morgan Stanley (NYSE: "MS") is the direct parent of the Adviser and the indirect parent of the Distributor. Morgan Stanley is a preeminent global financial services firm engaged in securities trading and brokerage activities, as well as providing investment banking, research and analysis, financing and financial advisory services. As of September 30, 2013, the Adviser, together with its affiliated asset management companies, had approximately $360 billion in assets under management or supervision.
Sub-Advisers
The Adviser has entered into Sub-Advisory Agreements with MSIM Limited, located at 25 Cabot Square, Canary Wharf, London, E14 4QA, England, and MSIM Company, located at 23 Church Street, 16-01 Capital Square, Singapore 049481. Both MSIM Limited and MSIM Company are wholly owned subsidiaries of Morgan Stanley. MSIM Limited and MSIM Company provide the Portfolio with investment advisory services subject to the overall supervision of the Adviser and the Fund's officers and Directors. The Adviser pays MSIM Limited and MSIM Company on a monthly basis a portion of the net advisory fees the Adviser receives from the Portfolio.
Advisory Fee
The Adviser receives a fee for advisory services equal to 0.85% of the Portfolio's average daily net assets.
The Adviser has agreed to reduce its advisory fee and/or reimburse the Portfolio, if necessary, if such fees would cause the total annual operating expenses of the Portfolio to exceed 1.11% of average daily net assets. In determining the actual amount of fee waiver and/or expense reimbursement for the Portfolio, if any, the Adviser excludes from total annual operating expenses certain investment related expenses, taxes, interest and other extraordinary expenses (including litigation). The fee waivers and/or expense reimbursements for the Portfolio will continue for at least two years or until such time as the Fund's Board of Directors acts to discontinue all or a portion of such waivers and/or reimbursements when it deems such action is appropriate.
A discussion regarding the Board of Directors' approval of the investment advisory agreement will be available in the Portfolio's Semi-Annual Report to Shareholders for the period ended June 30, 2014.
The Adviser and/or the Distributor may pay compensation (out of their own funds and not as an expense of the Portfolio) to certain affiliated or unaffiliated brokers, dealers and/or certain insurance companies or other financial intermediaries or service providers in connection with the sale, distribution, marketing and/or retention of shares of the Portfolio and/or shareholder servicing. Such compensation may be significant in amount and the prospect of receiving any such compensation may provide such affiliated or unaffiliated entities with an incentive to favor sales of the Portfolio's shares over other investment options. Any such payments will not change the NAV or the price of the Portfolio's shares. For more information, please see the Portfolio's SAI.
Portfolio Management
The Portfolio is managed by members of the Global Infrastructure Securities team. Current members of the team jointly and primarily responsible for the day-to-day management of the Portfolio are Theodore R. Bigman and Matthew King.
Mr. Bigman has been associated with the Adviser in an investment management capacity since 1995. Mr. King has been associated with the Adviser in an investment management capacity since 2008.
As lead portfolio manager, Mr. Bigman, together with co-portfolio manager Mr. King, determines the investment strategy, establishes asset-allocation frameworks and directs the implementation of investment strategy.
Additional Information
The Portfolio's SAI provides additional information about the portfolio managers' compensation structure, other accounts managed by the portfolio managers and the portfolio managers' ownership of securities in the Portfolio.
The composition of the team may change from time to time.
10 UIF Global Infrastructure Portfolio
Class I Prospectus
Shareholder Information
Share Class
This Prospectus offers Class I shares of the Portfolio. The Fund also offers Class II shares of the Portfolio through a separate prospectus. Class II shares are subject to higher expenses due to the imposition of a 12b-1 fee. For eligibility information, contact your insurance company or qualified pension or retirement plan.
Purchasing and Selling Portfolio Shares
Shares are offered on each day that the New York Stock Exchange (the "NYSE") is open for business.
The Portfolio offers its shares only to insurance companies for separate accounts that they establish to fund variable life insurance and variable annuity contracts, and to other entities under qualified pension and retirement plans. An insurance company purchases or redeems shares of the Portfolio based on, among other things, the amount of net contract premiums or purchase payments allocated to a separate account investment division, transfers to or from a separate account investment division, contract loans and repayments, contract withdrawals and surrenders, and benefit payments. The contract prospectus describes how contract owners may allocate, transfer and withdraw amounts to, and from, separate accounts.
There are no known disadvantages to variable product contract owners or qualified plan participants arising out of the fact that the Portfolio offers its shares to separate accounts of various insurance companies that offer variable annuity and variable life insurance products and various other entities under qualified pension and retirement plans. Nevertheless, the Board of Directors that oversees the Portfolio intends to monitor events to identify any material irreconcilable conflicts that may possibly arise due to these arrangements and to determine what action, if any, should be taken in response.
Pricing of Portfolio Shares
The price per share will be the NAV per share next determined after the Fund or the insurance company receives your purchase or redemption order. The NAV for one share is the value of that share's portion of all of the net assets in the Portfolio. The Fund determines the NAV per share for the Portfolio as of the close of the NYSE (normally 4:00 p.m. Eastern Time) on each day that the NYSE is open for business.
About Net Asset Value
The NAV per share of the Portfolio is determined by dividing the total of the value of the Portfolio's investments and other assets, less any liabilities, by the total number of outstanding shares of the Portfolio. In making this calculation, the Portfolio generally values securities at market price. If market prices are unavailable or may be unreliable because of events occurring after the close of trading, the value for those securities will be determined in good faith at fair value using methods approved by the Board of Directors. In addition, with respect to securities that primarily are listed on foreign exchanges, when an event occurs after the close of such exchanges that is likely to have changed the value of the securities (e.g., a percentage change in value of one or more U.S. securities indices in excess of specified thresholds), such securities will be valued at their fair value, as determined under procedures established by the Fund's Board of Directors. Securities also may be fair valued in the event of a significant development affecting a country or region or an issuer-specific development which is likely to have changed the value of the security. In these cases, the Portfolio's NAV will reflect certain portfolio securities' fair value rather than their market price. To the extent the Portfolio invests in open-end management companies that are registered under the Investment Company Act of 1940, as amended, the Portfolio's NAV is calculated based upon the NAV of such funds. The prospectuses for such funds explain the circumstances under which they will use fair value pricing and its effects.
Fair value pricing involves subjective judgments and it is possible that the fair value determined for a security is materially different than the value that could be realized upon the sale of that security. The Portfolio may hold securities that are listed on foreign exchanges. These securities may trade on weekends or other days when the Portfolio does not calculate its NAV. As a result, the value of these investments may change on days when you cannot purchase or sell shares.
The NAV of Class I shares will differ from that of Class II shares because of class-specific expenses that each class may pay.
Dividends and Distributions
The Portfolio distributes its net investment income, if any, at least annually as dividends and makes distributions of its net realized capital gains, if any, at least annually.
UIF Global Infrastructure Portfolio 11
Shareholder Information (Cont'd)
Taxes
The Portfolio expects that it will not have to pay federal income taxes if it distributes annually all of its net investment income and net realized capital gains. The Portfolio does not expect to be subject to federal excise taxes with respect to undistributed income.
Special tax rules apply to life insurance companies, variable annuity contracts and variable life insurance contracts. For information on federal income taxation of a life insurance company with respect to its receipt of distributions from the Portfolio and federal income taxation of owners of variable annuity or variable life insurance contracts, refer to the contract prospectus.
Because each investor's tax circumstances are unique and the tax laws may change, you should consult your tax adviser about the federal, state and local tax consequences applicable to your investment.
Frequent Purchases and Redemptions of Shares
Frequent purchases and redemptions of shares pursuant to the instructions of insurance company contract owners or qualified plan participants is referred to as "market-timing" or "short-term trading" and may present risks for other contract owners or participants with long-term interests in the Portfolio, which may include, among other things, dilution in the value of the Portfolio's shares indirectly held by contract owners or participants with long-term interests in the Portfolio, interference with the efficient management of the Portfolio, increased brokerage and administrative costs and forcing the Portfolio to hold excess levels of cash.
In addition, the Portfolio is subject to the risk that market-timers and/or short-term traders may take advantage of time zone differences between the foreign markets on which the Portfolio's securities trade and the time the Portfolio's NAV is calculated ("time-zone arbitrage"). For example, a market-timer may submit instructions for the purchase of shares of the Portfolio based on events occurring after foreign market closing prices are established, but before the Portfolio's NAV calculation that are likely to result in higher prices in foreign markets the following day. The market-timer would submit instructions to redeem the Portfolio's shares the next day when the Portfolio's share price would reflect the increased prices in foreign markets for a quick profit at the expense of contract owners or participants with long-term interests in the Portfolio.
Investments in other types of securities also may be susceptible to short-term trading strategies. These investments include securities that are, among other things, thinly traded, traded infrequently or relatively illiquid
which have the risk that the current market price for the securities may not accurately reflect current market values. A contract owner may seek to engage in short-term trading to take advantage of these pricing differences (referred to as "price-arbitrage"). The Portfolio's policies with respect to valuing portfolio securities are described above in "About Net Asset Value."
The Fund's Board of Directors has adopted policies and procedures to discourage frequent purchases and redemptions of Portfolio shares by Portfolio shareholders. Insurance companies or qualified plans generally do not provide specific contract owner or plan participant transaction instructions to the Portfolio on an ongoing basis. Therefore, to some extent, the Portfolio relies on the insurance companies and qualified plans to monitor frequent short-term trading by contract owners. However, the Portfolio has entered into agreements with insurance companies and qualified plans whereby the insurance companies and qualified plans are required to provide certain contract owner identification and transaction information upon the Portfolio's request. The Portfolio may use this information to help identify and prevent market-timing activity in the Portfolio. There can be no assurance that the Portfolio will be able to identify or prevent all market-timing activity.
If the Portfolio identifies suspected market-timing activity, the insurance company or qualified plan will be contacted and asked to take steps to prevent further market-timing activity (e.g., sending warning letters or blocking frequent trading by underlying contract owners or participants). Insurance companies may be prohibited by the terms of the underlying insurance contract from restricting short-term trading of mutual fund shares by contract owners, thereby limiting the ability of such insurance company to implement remedial steps to prevent market-timing activity in the Portfolio. If the insurance company or qualified plan is unwilling or unable to take remedial steps to discourage or prevent frequent trading, or does not take action promptly, certain contract owners or participants may be able to engage in frequent trading to the detriment of contract owners or participants with long-term interests in the Portfolio. If the insurance company or qualified plan refuses to take remedial action, or takes action that the Portfolio deems insufficient, a determination will be made whether it is appropriate to terminate the relationship with such insurance company or qualified plan.
Portfolio Holdings Information
A description of the Fund's policies and procedures with respect to the disclosure of the Portfolio's securities is available in the Portfolio's SAI.
12 UIF Global Infrastructure Portfolio
Class I Prospectus
Financial Highlights
No financial information is provided for the Portfolio because it had not commenced operations as of the date of this Prospectus.
UIF Global Infrastructure Portfolio 13
Where to Find Additional Information
Statement of Additional Information
In addition to this Prospectus, the Portfolio has a Statement of Additional Information, dated December 18, 2013, which contains additional, more detailed information about the Fund and the Portfolio. The Statement of Additional Information is incorporated by reference into this Prospectus and, therefore, legally forms a part of this Prospectus.
Shareholder Reports
The Portfolio publishes Annual and Semi-Annual Reports ("Shareholder Reports") containing financial statements. These reports contain additional information about the Portfolio's investments. In the Portfolio's Shareholder Reports, when available, you will find a discussion of the market conditions and the investment strategies that significantly affected the Portfolio's performance during that period. For additional Fund information, including information regarding the investments comprising the Portfolio, and to make shareholder inquiries, please call 1-800-548-7786 or contact your insurance company.
You may obtain the Statement of Additional Information and Shareholder Reports without charge by contacting the Fund at the toll-free number above or your insurance company or on our web site at www.morganstanley.com/im.
Information about the Fund (including the Statement of Additional Information and Shareholder Reports) can be reviewed and copied at the SEC's Public Reference Room in Washington, D.C. Information on the operation of the Public Reference Room may be obtained by calling the SEC at (202) 551-8090. Shareholder Reports and other information about the Fund are available on the EDGAR Database on the SEC's Internet site at http://www.sec.gov, and copies of this information may be obtained, after paying a duplicating fee, by electronic request at the following E-mail address: publicinfo@sec.gov, or by writing the SEC's Public Reference Section, Washington, D.C. 20549-1520.
To aid you in obtaining this information, the Fund's Investment Company Act registration number is 811-7607.
Class II Prospectus
December 18, 2013
The Universal Institutional Funds, Inc.
Global Infrastructure Portfolio
Both capital appreciation and current income.
Adviser
Morgan Stanley Investment Management Inc.
The Universal Institutional Funds, Inc. (the "Fund") is a mutual fund that provides investment vehicles for variable annuity contracts and variable life insurance policies and for certain tax-qualified investors.
The Securities and Exchange Commission (the "SEC") has not approved or disapproved these securities or passed upon the adequacy of this Prospectus. Any representation to the contrary is a criminal offense.
Ticker Symbol: UPIIX
Portfolio Summary | | | 1 | | |
Details of the Portfolio | | | 5 | | |
Additional Risk Factors and Information | | | 8 | | |
Fund Management | | | 11 | | |
Shareholder Information | | | 13 | | |
Financial Highlights | | | 15 | | |
Class II Prospectus
Portfolio Summary
Portfolio Summary
Global Infrastructure Portfolio
Objective
The Portfolio seeks both capital appreciation and current income.
Fees and Expenses of the Portfolio (Class II)
The table below describes the fees and expenses that you may pay if you buy and hold the classes of shares that may be offered by the Portfolio. The Portfolio does not charge any sales loads or other fees when you purchase or redeem shares. The table and the example below do not reflect the impact of any charges by your insurance company. If they did, Total Annual Portfolio Operating Expenses would be higher.
Annual Portfolio Operating Expenses
(expenses that you pay each year as a percentage of the value of your investment)
Advisory Fee | | | 0.85 | % | |
Distribution (12b-1) Fee | | | 0.35 | % | |
Other Expenses‡ | | | 0.50 | % | |
Total Annual Portfolio Operating Expenses* | | | 1.70 | % | |
Fee Waiver and/or Expense Reimbursement* | | | 0.34 | % | |
Total Annual Portfolio Operating Expenses
After Fee Waiver and/or Expense
Reimbursement* | | | 1.36 | % | |
‡ Other expenses have been estimated for the current fiscal year.
* The Portfolio's "Adviser," Morgan Stanley Investment Management, Inc., has agreed to reduce its advisory fee and/or reimburse the Portfolio so that Total Annual Portfolio Operating Expenses, excluding certain investment related expenses, taxes, interest and other extraordinary expenses (including litigation), will not exceed 1.36%. In addition, the Portfolio's "Distributor," Morgan Stanley Distribution, Inc., has agreed to waive 0.10% of the 0.35% 12b-1 fee that it may receive. These fee waivers and/or expense reimbursements will continue for at least two years or until such time as the Fund's Board of Directors acts to discontinue all or a portion of such waivers and/or reimbursements when it deems such action is appropriate.
Example
The example below is intended to help you compare the cost of investing in the Portfolio with the cost of investing in other mutual funds.
The example assumes that you invest $10,000 in the Portfolio, your investment has a 5% return each year and that the Portfolio's operating expenses remain the
same. Although your actual costs may be higher or lower, based on these assumptions, your costs would be:
| | | 1 Year | | 3 Years | |
Global Infrastructure
Portfolio | | $ | 138 | | | $ | 431 | | |
Portfolio Turnover
The Portfolio pays transaction costs when it buys and sells securities (or "turns over" its portfolio). A higher portfolio turnover rate may indicate higher transaction costs. These costs, which are not reflected in Total Annual Portfolio Operating Expenses or in the Example, affect Portfolio performance.
Principal Investment Strategies
The Portfolio normally invests at least 80% of its assets in equity securities issued by companies located throughout the world that are engaged in the infrastructure business. A company is considered to be in the infrastructure business if it derives at least 50% of its revenues or earnings from, or devotes at least 50% of its assets to, infrastructure-related activities. Infrastructure refers to the systems and networks of energy, transportation, communication and other services required for the normal function of society. Companies in the infrastructure business may be involved in a variety of areas, including, but not limited to, (i) the transmission, distribution, storage or transportation of electricity, oil and gas (and other bulk liquid products), water, and other natural resources used to produce energy, (ii) the construction and operation of renewable power facilities, (iii) the development, ownership, lease, concession, or management of highways, toll roads, tunnels, bridges, pipelines, airports, marine ports, refueling and related facilities, (iv) the provision of communications, including the development, lease, concession, or management of telephone, broadcast and mobile towers, fiber optic/copper cable, and satellite networks, (v) waste-water management and water purification/desalination and (vi) the construction or operation of essential public structures. The Portfolio's equity investments may include convertible securities. The Portfolio's investments may include securities of small and medium capitalization companies. The Portfolio may invest up to 100% of its net assets in foreign securities, which may include emerging market securities. Under normal market conditions, the Portfolio invests at least 40% of its assets in
UIF Global Infrastructure Portfolio 1
Global Infrastructure Portfolio (Cont'd)
the securities of issuers located outside of the United States.
The Portfolio's Adviser and/or "Sub-Advisers," Morgan Stanley Investment Management Limited ("MSIM Limited") and Morgan Stanley Investment Management Company ("MSIM Company"), allocate the Portfolio's assets between the different types of companies in the infrastructure business based on relative valuation, underlying company fundamentals, and demographic and macroeconomic considerations. The Portfolio has a fundamental policy (i.e., one that cannot be changed without shareholder approval) of investing 25% or more of its assets in the infrastructure industry.
In selecting securities to buy, hold or sell for the Portfolio, the Adviser and/or Sub-Advisers actively manage the Portfolio using a combination of bottom-up and top-down methodologies. The value-driven approach to bottom-up security selection utilizes proprietary research models to identify infrastructure companies that offer the best value relative to their underlying assets and growth prospects. The top-down allocation provides diversified exposure to major economic infrastructure sectors and countries, with an overweighting to those sectors/countries that offer the best relative valuation.
Principal Risks
There is no assurance that the Portfolio will achieve its investment objective and you can lose money investing in this Portfolio. The principal risks of investing in the Portfolio include:
• Infrastructure Industry. By concentrating its investments in the infrastructure industry, the Portfolio has greater exposure to the potential adverse economic, regulatory, political and other changes affecting companies operating within such industry. Companies within the infrastructure industry are subject to a variety of factors that may adversely affect their business or operations, including high interest costs in connection with capital construction and improvement programs, high leverage, costs associated with compliance with and changes in environmental and other regulations, difficulty in raising capital in adequate amounts and on reasonable terms in periods of high inflation and unsettled capital markets or government budgetary constraints that impact publicly funded projects, the effects of economic slowdown or recession and surplus capacity, increased competition from other providers of services, uncertainties concerning the availability of fuel at
reasonable prices, the effects of energy conservation policies and other factors.
Other factors that may affect the operations of companies within the infrastructure industry include innovations in technology that could render the way in which a company delivers a product or service obsolete, significant changes to the number of ultimate end-users of a company's products, inexperience with and potential losses resulting from a developing deregulatory environment, increased susceptibility to terrorist attacks, risks of environmental damage due to a company's operations or an accident, and general changes in market sentiment towards infrastructure and utilities assets. Companies operating in the infrastructure industry face operating risks, including the risk of fire, explosions, leaks, mining and drilling accidents or other catastrophic events. In addition, natural risks, such as earthquakes, floods, lightning, hurricanes, tsunamis and wind, are inherent risks in infrastructure company operations.
• Equity Securities. In general, prices of equity securities are more volatile than those of fixed income securities. The prices of equity securities fluctuate, and sometimes widely fluctuate, in response to activities specific to the issuer of the security as well as factors unrelated to the fundamental condition of the issuer, including general market, economic and political conditions. To the extent that the Portfolio invests in a convertible security, and the convertible security's investment value is greater than its conversion value, its price will be likely to increase when interest rates fall and decrease when interest rates rise. If the conversion value exceeds the investment value, the price of the convertible security will tend to fluctuate directly with the price of the underlying equity security.
• Small and Medium Capitalization Companies. Investments in small and medium capitalization companies may involve greater risks than investments in larger, more established companies. The securities issued by small and medium capitalization companies may be less liquid and such companies may have more limited markets, financial resources and product lines, and may lack the depth of management of larger companies.
• Foreign and Emerging Market Securities. Investments in foreign markets entail special risks such as currency, political, economic and market risks. There also may be greater market volatility, less
2 UIF Global Infrastructure Portfolio
Class II Prospectus
Portfolio Summary
Global Infrastructure Portfolio (Cont'd)
reliable financial information, higher transaction and custody costs, decreased market liquidity and less government and exchange regulation associated with investments in foreign markets. In addition, investments in certain foreign markets, which have historically been considered stable, may become more volatile and subject to increased risk due to ongoing developments and changing conditions in such markets. Moreover, the growing interconnectivity of global economies and financial markets has increased the probability that adverse developments and conditions in one country or region will affect the stability of economies and financial markets in other countries or regions. The risks of investing in emerging market countries are greater than risks associated with investments in foreign developed countries. In addition, the Portfolio's investments may be denominated in foreign currencies and therefore, to the extent unhedged, the value of the investment will fluctuate with the U.S. dollar exchange rates.
• Non-Diversification. Because the Portfolio is non-diversified, it may be more susceptible to an adverse event affecting a portfolio investment than a diversified portfolio and a decline in the value of that instrument would cause the Portfolio's overall value to decline to a greater degree.
Shares of the Portfolio are not bank deposits and are not guaranteed or insured by the Federal Deposit Insurance Corporation or any other government agency.
Performance Information
As of the date hereof, the Portfolio has not yet completed a full calendar year of investment operations. Upon the completion of a full calendar year of investment operations by the Portfolio, this section will include charts that show annual total returns, highest and lowest quarterly returns and average annual total returns compared to a benchmark index selected for the Portfolio.
Fund Management
Adviser. Morgan Stanley Investment Management Inc.
Sub-Advisers. Morgan Stanley Investment Management Limited and Morgan Stanley Investment Management Company.
Portfolio Managers. The Portfolio is managed by members of the Global Infrastructure Securities team.
Information about the members jointly and primarily responsible for the day-to-day management of the Portfolio is shown below:
Name | | Title with Adviser | | Date Began
Managing
Portfolio | |
Theodore R. Bigman | | Managing Director | | Since Inception | |
Matthew King | | Executive Director | | Since Inception | |
Purchase and Sale of Portfolio Shares
This Prospectus offers Class II shares of the Portfolio. The Fund also offers Class I shares of the Portfolio through a separate prospectus. Class I shares are subject to lower expenses, but may not be available through your insurance company, qualified pension plan or retirement plan. For eligibility information, contact your insurance company or qualified pension or retirement plan.
Fund shares will be sold at the net asset value ("NAV") next determined after we receive the redemption request on your behalf.
The Portfolio offers its shares only to insurance companies for separate accounts that they establish to fund variable life insurance and variable annuity contracts, and to other entities under qualified pension and retirement plans. An insurance company purchases or redeems shares of the Portfolio based on, among other things, the amount of net contract premiums or purchase payments allocated to a separate account investment division, transfers to or from a separate account investment division, contract loans and repayments, contract withdrawals and surrenders, and benefit payments. The contract prospectus describes how contract owners may allocate, transfer and withdraw amounts to, and from, separate accounts.
For more information, please refer to the section of the Prospectus entitled "Shareholder Information—Purchasing and Selling Portfolio Shares."
Tax Information
Special tax rules apply to life insurance companies, variable annuity contracts and variable life insurance contracts. For information on federal income taxation of a life insurance company with respect to its receipt of distributions from the Portfolio and federal income taxation of owners of variable annuity or variable life insurance contracts, refer to the contract prospectus.
UIF Global Infrastructure Portfolio 3
Global Infrastructure Portfolio (Cont'd)
For more information, please refer to the section of the Prospectus entitled "Shareholder Information—Taxes."
Payments to Insurance Companies and Other Financial Intermediaries
The Adviser and/or the Distributor may pay insurance companies or their affiliates and/or other financial intermediaries for the sale of Portfolio shares and related services. These payments, which may be
significant in amount, may create a conflict of interest by influencing the intermediary and your salesperson to recommend one variable annuity contract over another or be a factor in an insurance company's decision to include the Portfolio as an underlying investment option in its variable insurance products. Ask your salesperson or visit your insurance company's or other intermediary's web site for more information.
4 UIF Global Infrastructure Portfolio
Class II Prospectus
Details of the Portfolio
Details of the Portfolio
Global Infrastructure Portfolio
Objective
The Portfolio seeks both capital appreciation and current income.
The Portfolio's investment objective may be changed by the Fund's Board of Directors without shareholder approval, but no change is anticipated. If the Portfolio's investment objective changes, the Portfolio will notify shareholders and shareholders should consider whether the Portfolio remains an appropriate investment in light of the change.
Approach
The Adviser and/or Sub-Advisers seek both capital appreciation and current income by investing primarily in equity securities issued by companies located throughout the world that are engaged in the infrastructure business. Using internal proprietary research, the Adviser and/or Sub-Advisers seek to identify public infrastructure companies that are believed to offer the best value relative to their underlying assets and growth prospects.
Process
The Portfolio normally invests at least 80% of its assets in equity securities issued by companies located throughout the world that are engaged in the infrastructure business. A company is considered to be in the infrastructure business if it derives at least 50% of its revenues or earnings from, or devotes at least 50% of its assets to, infrastructure-related activities. Infrastructure refers to the systems and networks of energy, transportation, communication and other services required for the normal function of society. Companies in the infrastructure business may be involved in a variety of areas, including, but not limited to, (i) the transmission, distribution, storage or transportation of electricity, oil and gas (and other bulk liquid products), water, and other natural resources used to produce energy, (ii) the construction and operation of renewable power facilities, (iii) the development, ownership, lease, concession, or management of highways, toll roads, tunnels, bridges, pipelines, airports, marine ports, refueling and related facilities, (iv) the provision of communications, including the development, lease, concession, or management of telephone, broadcast and mobile towers, fiber optic/copper cable, and satellite networks, (v) waste-water management and water purification/desalination and (vi) the construction or operation of essential public structures. The Portfolio's equity investments may include convertible securities. The Portfolio's investments may
include securities of small and medium capitalization companies. The Portfolio may invest up to 100% of its net assets in foreign securities, which may include emerging market securities. Under normal market conditions, the Portfolio invests at least 40% of its assets in the securities of issuers located outside of the United States.
The Adviser and/or Sub-Advisers allocate the Portfolio's assets between the different types of companies in the infrastructure business based on relative valuation, underlying company fundamentals, and demographic and macroeconomic considerations. The Portfolio has a fundamental policy (i.e., one that cannot be changed without shareholder approval) of investing 25% or more of its assets in the infrastructure industry.
In selecting securities to buy, hold or sell for the Portfolio, the Adviser and/or Sub-Advisers actively manage the Portfolio using a combination of bottom-up and top-down methodologies. The value-driven approach to bottom-up security selection utilizes proprietary research models to identify infrastructure companies that offer the best value relative to their underlying assets and growth prospects. The top-down allocation provides exposure to major economic infrastructure sectors and countries, with an overweighting to those sectors/countries that offer the best relative valuation. The Adviser and/or Sub-Advisers generally consider selling a portfolio holding when it determines that the holding no longer satisfies its investment criteria.
The remaining 20% of the Portfolio's assets may be invested in fixed income securities, equity securities of companies not engaged in the infrastructure business, U.S. government securities issued or guaranteed as to principal and interest by the U.S. Government or its agencies or instrumentalities, and asset-backed securities. The Portfolio may also invest in real estate investment trusts ("REITs") and foreign real estate companies and convertible securities. The Portfolio may invest up to 5% of its assets in fixed income securities and convertible securities rated below investment grade (often referred to as "high yield securities" or "junk bonds").
Risks
There is no assurance that the Portfolio will achieve its investment objective.
By concentrating its investments in the infrastructure industry, the Portfolio has greater exposure to the
UIF Global Infrastructure Portfolio 5
Global Infrastructure Portfolio (Cont'd)
potential adverse economic, regulatory, political and other changes affecting companies operating within such industry. Companies within the infrastructure industry are subject to a variety of factors that may adversely affect their business or operations, including high interest costs in connection with capital construction and improvement programs, high leverage, costs associated with compliance with and changes in environmental and other regulations, difficulty in raising capital in adequate amounts and on reasonable terms in periods of high inflation and unsettled capital markets or government budgetary constraints that impact publicly funded projects, the effects of economic slowdown or recession and surplus capacity, increased competition from other providers of services, uncertainties concerning the availability of fuel at reasonable prices, the effects of energy conservation policies and other factors. Additionally, companies within the infrastructure industry may be subject to regulation by various government authorities and may also be affected by government regulation of rates charged to customers, service interruption or legal challenges due to environmental, operational or other mishaps and the imposition of special tariffs and changes in tax laws, regulatory policies and accounting standards; technological innovations that may render existing plants, equipment or products obsolete, unforeseen delays, accidents, and cost overruns in infrastructure projects. Any market price movements, regulatory or technological changes, or economic conditions affecting infrastructure-related companies may have a significant impact on the Portfolio's performance. Other factors that may affect the operations of companies within the infrastructure industry include innovations in technology that could render the way in which a company delivers a product or service obsolete, significant changes to the number of ultimate end-users of a company's products, inexperience with and potential losses resulting from a developing deregulatory environment, increased susceptibility to terrorist attacks, risks of environmental damage due to a company's operations or an accident, and general changes in market sentiment towards infrastructure and utilities assets.
Companies operating in the infrastructure industry face operating risks, including the risk of fire, explosions, leaks, mining and drilling accidents or other catastrophic events. If any of these operating risks occur, it could cause substantial losses to the given infrastructure company. In addition, natural risks, such as earthquakes, floods, lightning, hurricanes, tsunamis and
wind, are inherent risks in infrastructure company operations. For example, extreme weather patterns, such as Hurricane Ivan in 2004 and Hurricanes Katrina and Rita in 2005, the Tohuku earthquake and resulting tsunami in Japan in 2011, could result in substantial damage to the facilities of certain companies located in the affected areas and such extreme weather patterns, or the threat thereof, could adversely impact the prices of the securities in which the Portfolio invests. This volatility may create fluctuations in commodity prices and earnings of companies in the infrastructure industry.
Investing in the Portfolio may be appropriate for you if you are willing to accept the risks and uncertainties of investing in a portfolio of equity securities issued by companies located throughout the world that are engaged in the infrastructure business. In general, prices of equity securities are more volatile than those of fixed income securities. The prices of equity securities will rise and fall in response to a number of different factors. In particular, prices of equity securities fluctuate, and sometimes widely fluctuate, in response to activities specific to the issuer of the security as well as factors unrelated to the fundamental condition of the issuer, including general market, economic and political conditions.
To the extent that the Portfolio invests in a convertible security, and the convertible security's investment value is greater than its conversion value, its price will be likely to increase when interest rates fall and decrease when interest rates rise. If the conversion value exceeds the investment value, the price of the convertible security will tend to fluctuate directly with the price of the underlying equity security.
In addition, at times, small and medium capitalization equity securities may underperform relative to the overall market. Investments in small and medium capitalization companies may involve greater risk than investments in larger, more established companies. The securities issued by small and medium capitalization companies may be less liquid and their prices subject to more abrupt or erratic price movements. In addition, small and medium capitalization companies may have more limited markets, financial resources and product lines, and may lack the depth of management of larger companies. The Adviser's and/or Sub-Advisers' perception that a stock is under- or over-valued may not be accurate or may not be realized.
6 UIF Global Infrastructure Portfolio
Class II Prospectus
Details of the Portfolio
Global Infrastructure Portfolio (Cont'd)
Investing in the securities of foreign issuers, particularly those located in emerging market or developing countries, entails the risk that news and events unique to a country or region will affect those markets and their issuers. The value of the Portfolio's shares may vary widely in response to political and economic factors affecting companies in foreign countries. These same events will not necessarily have an effect on the U.S. economy or similar issuers located in the United States. In addition, investments in certain foreign markets, which have historically been considered stable, may become more volatile and subject to increased risk due to ongoing developments and changing conditions in such markets. Moreover, the growing interconnectivity of global economies and financial markets has increased probability that adverse developments and conditions in one country or region will affect the stability of economies and financial markets in other countries or regions.
The Portfolio's investments may be denominated in foreign currencies and therefore, to the extent unhedged, the value of the investment will fluctuate with the U.S. dollar exchange rates.
The risks of investing in the Portfolio may be intensified because the Portfolio is non-diversified, which means that it may invest in securities of a limited number of issuers. As a result, the performance of a particular investment or a small group of investments may affect the Portfolio's performance more than if the Portfolio were diversified.
Please see "Additional Risk Factors and Information" for further information about these and other risks of investing in the Portfolio.
UIF Global Infrastructure Portfolio 7
Additional Risk Factors and Information
This section discusses additional risk factors and information relating to the Portfolio. The Portfolio's investment practices and limitations are described in more detail in the Statement of Additional Information ("SAI"), which is incorporated by reference and legally is a part of this Prospectus. For details on how to obtain a copy of the SAI and other reports and information, see the back cover of this Prospectus.
Price Volatility
The value of your investment in the Portfolio is based on the market prices of the securities the Portfolio holds. These prices change daily due to economic and other events that affect markets generally, as well as those that affect particular regions, countries, industries or companies. These price movements, sometimes called volatility, may be greater or less depending on the types of securities the Portfolio owns and the markets in which the securities trade. Over time, equity securities have generally shown gains superior to fixed income securities, although they have tended to be more volatile in the short term. As a result of price volatility, there is a risk that you may lose money by investing in the Portfolio.
Equity Securities
Equity securities may include common and preferred stocks, convertible securities and equity-linked securities, rights and warrants to purchase common stocks, depositary receipts, limited partnership interests and other specialty securities having equity features. The Portfolio may invest in equity securities that are publicly traded on securities exchanges or over-the-counter ("OTC") or in equity securities that are not publicly traded. Securities that are not publicly traded may be more difficult to sell and their value may fluctuate more dramatically than other securities.
Depositary receipts involve many of the same risks as those associated with direct investment in foreign securities. In addition, the underlying issuers of certain depositary receipts, particularly unsponsored or unregistered depositary receipts, are under no obligation to distribute shareholder communications to the holders of such receipts, or to pass through to them any voting rights with respect to the deposited securities.
A convertible security is a bond, debenture, note, preferred stock, right, warrant or other security that may be converted into or exchanged for a prescribed amount of common stock or other security of the same or a different issuer or into cash within a particular period of time at a specified price or formula. A convertible security generally entitles the holder to receive interest paid or accrued on debt securities or the dividend paid on preferred stock until the convertible security matures or is redeemed, converted or exchanged. Before conversion, convertible securities generally have characteristics similar to both debt and equity securities. The value of convertible securities tends to decline as interest rates rise and, because of
the conversion feature, tends to vary with fluctuations in the market value of the underlying securities. Convertible securities ordinarily provide a stream of income with generally higher yields than those of common stock of the same or similar issuers. Convertible securities generally rank senior to common stock in a corporation's capital structure but are usually subordinated to comparable nonconvertible securities. Convertible securities generally do not participate directly in any dividend increases or decreases of the underlying securities although the market prices of convertible securities may be affected by any dividend changes or other changes in the underlying securities.
Fixed Income Securities
The Portfolio may invest in fixed income securities. Fixed income securities are securities that pay a fixed or a variable rate of interest until a stated maturity date. Fixed income securities include U.S. government securities, securities issued by federal or federally sponsored agencies and instrumentalities, corporate bonds and notes, asset-backed securities, mortgage securities, securities rated below investment grade (commonly referred to as "junk bonds" or "high yield/high risk securities"), municipal bonds, loan participations and assignments, zero coupon bonds, convertible securities, Eurobonds, Brady Bonds, Yankee Bonds, repurchase agreements, commercial paper and cash equivalents.
Fixed income securities are subject to the risk of the issuer's inability to meet principal and interest payments on its obligations (i.e., credit risk) and are subject to price volatility resulting from, among other things, interest rate sensitivity, market perception of the creditworthiness of the issuer and general market liquidity (i.e., market risk). Securities with longer durations are likely to be more sensitive to changes in interest rates, generally making them more volatile than securities with shorter durations. Lower rated fixed income securities have greater volatility because there is less certainty that principal and interest payments will be made as scheduled. Fixed income securities may be called (i.e., redeemed by the issuer) prior to final maturity. If a callable security is called, the Portfolio may have to reinvest the proceeds at a lower rate of interest.
Foreign Securities
Foreign issuers generally are subject to different accounting, auditing and financial reporting standards than U.S. issuers. There may be less information available to the public about foreign issuers.
8 UIF Global Infrastructure Portfolio
Class II Prospectus
Additional Risk Factors and Information
Additional Risk Factors and Information (Cont'd)
Securities of foreign issuers can be less liquid and experience greater price movements. In addition, the prices of such securities may be susceptible to influence by large traders, due to the limited size of many foreign securities markets. Moreover, investments in certain foreign markets, which have historically been considered stable, may become more volatile and subject to increased risk due to ongoing developments and changing conditions in such markets. Also, the growing interconnectivity of global economies and financial markets has increased the probability that adverse developments and conditions in one country or region will affect the stability of economies and financial markets in other countries or regions. In some foreign countries, there is also the risk of government expropriation, excessive taxation, political or social instability, the imposition of currency controls, or diplomatic developments that could affect the Portfolio's investment. There also can be difficulty obtaining and enforcing judgments against issuers in foreign countries. Foreign stock exchanges, broker-dealers, and listed issuers may be subject to less government regulation and oversight. The cost of investing in foreign securities, including brokerage commissions and custodial expenses, can be higher than in the United States.
In connection with its investments in foreign securities, the Portfolio also may enter into contracts with banks, brokers or dealers to purchase or sell securities or foreign currencies at a future date. A foreign currency forward exchange contract is a negotiated agreement between the contracting parties to exchange a specified amount of currency at a specified future time at a specified rate. The rate can be higher or lower than the spot rate between the currencies that are the subject of the contract. Foreign currency forward exchange contracts may be used to protect against uncertainty in the level of future foreign currency exchange rates or to gain or modify exposure to a particular currency. In addition, the Portfolio may use cross currency hedging or proxy hedging with respect to currencies in which the Portfolio has or expects to have portfolio or currency exposure. Cross currency hedges involve the sale of one currency against the positive exposure to a different currency and may be used for hedging purposes or to establish an active exposure to the exchange rate between any two currencies.
Emerging Market Risks
The Portfolio may invest in emerging market or developing countries, which are countries that major international financial institutions, such as the World Bank, generally consider to be less economically mature than developed nations, such as the United States or most nations in Western Europe. Emerging market or developing countries may be more likely to experience political turmoil or rapid changes in economic conditions than more developed countries, and the financial condition of issuers in emerging market or developing countries may be more precarious than in other countries. In addition, emerging market securities generally are less liquid and subject to wider price and currency fluctuations than securities issued in more developed countries. These characteristics result in greater risk of price volatility in emerging market or developing countries, which may be heightened by currency fluctuations relative to the U.S. dollar.
Foreign Currency
The Portfolio's investments in foreign securities may be denominated in foreign currencies. The value of foreign currencies may fluctuate relative to the value of the U.S. dollar. Since the Portfolio may invest in such non-U.S. dollar-denominated securities, and therefore may convert the value of such securities into U.S. dollars, changes in currency exchange rates can increase or decrease the U.S. dollar value of the Portfolio's assets. The Adviser and/or the Sub-Advisers may use derivatives to reduce this risk. The Adviser and/or the Sub-Advisers may in their discretion choose not to hedge against currency risk. In addition, certain market conditions may make it impossible or uneconomical to hedge against currency risk.
Asset-Backed Securities
Asset-backed securities apply the securitization techniques used to develop mortgage-backed securities to a broad range of other assets. Various types of assets, such as a pool of power generation assets or other infrastructure assets or infrastructure-related assets, are pooled and securitized in pass-through structures similar to pass-through structures developed with respect to mortgage securitizations. Asset-backed securities have risk characteristics similar to mortgage-backed securities. Like mortgage-backed securities, they generally decrease in value as a result of interest rate increases, but may benefit less than other fixed income securities
UIF Global Infrastructure Portfolio 9
Additional Risk Factors and Information (Cont'd)
from declining interest rates, principally because of prepayments. Also, as in the case of mortgage-backed securities, prepayments generally increase during a period of declining interest rates, although other factors, such as changes in credit use and payment patterns, may also influence prepayment rates. Asset-backed securities also involve the risk that various federal and state consumer laws and other legal and economic factors may result in the collateral backing the securities being insufficient to support payment on the securities.
Real Estate Investment Trusts and Foreign Real Estate Companies
Investing in REITs and foreign real estate companies exposes investors to the risks of owning real estate directly, as well as to risks that relate specifically to the way in which REITs and foreign real estate companies are organized and operated. REITs and foreign real estate companies generally invest directly in real estate, in mortgages or in some combination of the two. Operating REITs and foreign real estate companies requires specialized management skills and the Portfolio may indirectly bear management expenses along with the direct expenses of the Portfolio. Individual REITs and foreign real estate companies may own a limited number of properties and may concentrate in a particular region or property type. REITs also must satisfy specific requirements of the Internal Revenue Code of 1986, as amended Code, in order to qualify for tax-free pass-through income. The failure of a company to qualify as a REIT could have adverse consequences for the Portfolio, including significantly reducing the return to the Portfolio on its investment in such company. Foreign real estate companies may be subject to laws, rules and regulations governing those entities and their failure to comply with those laws, rules and regulations could negatively impact the performance of those entities. In addition,
REITs and foreign real estate companies, like mutual funds, have expenses, including management and administration fees, that are paid by their shareholders. As a result, shareholders will absorb their proportionate share of duplicate levels of fees when the Portfolio invests in REITs and foreign real estate companies.
Investment Discretion
In pursuing the Portfolio's investment objective, the Adviser and/or Sub-Advisers have considerable leeway in deciding which investments they buy, hold or sell on a day-to-day basis, and which trading strategies they use. For example, the Adviser and/or Sub-Advisers, in their discretion, may determine to use some permitted trading strategies while not using others. The success or failure of such decisions will affect the Portfolio's performance.
Temporary Defensive Investments
When the Adviser and/or Sub-Advisers believe that changes in market, economic, political or other conditions warrant, the Portfolio may invest without limit in cash, cash equivalents or other fixed income securities that may be inconsistent with its principal investment strategies for temporary defensive purposes. If the Adviser and/or Sub-Advisers incorrectly predict the effects of these changes, such defensive investments may adversely affect the Portfolio's performance and the Portfolio may not achieve its investment objective.
Portfolio Turnover
Consistent with its investment policies, the Portfolio will purchase and sell securities without regard to the effect on portfolio turnover. Higher portfolio turnover (e.g., over 100% per year) will cause the Portfolio to incur additional transaction costs. The Portfolio may engage in frequent trading of securities to achieve its investment objective.
10 UIF Global Infrastructure Portfolio
Class II Prospectus
Fund Management
Adviser
Morgan Stanley Investment Management Inc., with principal offices at 522 Fifth Avenue, New York, NY 10036, conducts a worldwide portfolio management business and provides a broad range of portfolio management services to customers in the United States and abroad. Morgan Stanley (NYSE: "MS") is the direct parent of the Adviser and the indirect parent of the Distributor. Morgan Stanley is a preeminent global financial services firm engaged in securities trading and brokerage activities, as well as providing investment banking, research and analysis, financing and financial advisory services. As of September 30, 2013, the Adviser, together with its affiliated asset management companies, had approximately $360 billion in assets under management or supervision.
Sub-Advisers
The Adviser has entered into Sub-Advisory Agreements with MSIM Limited, located at 25 Cabot Square, Canary Wharf, London, E14 4QA, England, and MSIM Company, located at 23 Church Street, 16-01 Capital Square, Singapore 049481. Both MSIM Limited and MSIM Company are wholly owned subsidiaries of Morgan Stanley. MSIM Limited and MSIM Company provide the Portfolio with investment advisory services subject to the overall supervision of the Adviser and the Fund's officers and Directors. The Adviser pays MSIM Limited and MSIM Company on a monthly basis a portion of the net advisory fees the Adviser receives from the Portfolio.
Advisory Fee
The Adviser receives a fee for advisory services equal to 0.85% of the Portfolio's average daily net assets.
The Adviser has agreed to reduce its advisory fee and/or reimburse the Portfolio, if necessary, if such fees would cause the total annual operating expenses of the Portfolio to exceed 1.36% of average daily net assets. In determining the actual amount of fee waiver and/or expense reimbursement for the Portfolio, if any, the Adviser excludes from total annual operating expenses certain investment related expenses, taxes, interest and other extraordinary expenses (including litigation) (but includes any 12b-1 fee paid to the Distributor). The fee waivers and/or expense reimbursements for the Portfolio will continue for at least two years or until such time as the Fund's Board of Directors acts to discontinue all or a portion of such
waivers and/or reimbursements when it deems such action is appropriate.
A discussion regarding the Board of Directors' approval of the investment advisory agreement will be available in the Portfolio's Semi-Annual Report to Shareholders for the period ended June 30, 2014.
Portfolio Management
The Portfolio is managed by members of the Global Infrastructure Securities team. Current members of the team jointly and primarily responsible for the day-to-day management of the Portfolio are Theodore R. Bigman and Matthew King.
Mr. Bigman has been associated with the Adviser in an investment management capacity since 1995. Mr. King has been associated with the Adviser in an investment management capacity since 2008.
As lead portfolio manager, Mr. Bigman, together with co-portfolio manager Mr. King, determines the investment strategy, establishes asset-allocation frameworks and directs the implementation of investment strategy.
Additional Information
The Portfolio's SAI provides additional information about the portfolio managers' compensation structure, other accounts managed by the portfolio managers and the portfolio managers' ownership of securities in the Portfolio.
The composition of the team may change from time to time.
Distribution Plan
The Fund has adopted a Plan of Distribution for the Portfolio's Class II shares pursuant to Rule 12b-1 under the Investment Company Act of 1940, as amended (the "Plan"). Under the Plan, the Portfolio is authorized to pay the Distributor a monthly 12b-1 fee at an annual rate of 0.35% of the Portfolio's average daily net assets attributable to Class II shares. Such amount shall be paid to compensate the Distributor for remittance to insurance companies which offer the Fund as an investment option. These payments are intended to compensate insurance companies for distribution and/or administrative related expenses incurred or paid in connection with the distribution of Class II shares of the Portfolio. The Distributor has
UIF Global Infrastructure Portfolio 11
agreed to waive 0.10% of the 0.35% 12b-1 fee that it may receive. This waiver will continue for at least two years or until such time as the Fund's Board of Directors acts to discontinue all or a portion of such waiver when it deems such action is appropriate.
Since the 12b-1 fees associated with the Plan are paid out of the Portfolio's assets on an on-going basis, over time these fees will increase the cost of your investment and may cost you more than paying other types of sales charges.
The Adviser and/or the Distributor may pay additional compensation (out of their own funds and not as
an expense of the Portfolio) to certain affiliated or unaffiliated brokers, dealers and/or certain insurance companies or other financial intermediaries or service providers in connection with the sale, distribution, marketing and/or retention of shares of the Portfolio and/or shareholder servicing. Such compensation may be significant in amount and the prospect of receiving any such additional compensation may provide such affiliated or unaffiliated entities with an incentive to favor sales of the Portfolio's shares over other investment options. Any such payments will not change the NAV or the price of the Portfolio's shares. For more information, please see the Portfolio's SAI.
12 UIF Global Infrastructure Portfolio
Class II Prospectus
Shareholder Information
Share Class
This Prospectus offers Class II shares of the Portfolio. The Fund also offers Class I shares of the Portfolio through a separate prospectus. Class I shares are subject to lower expenses, but may not be available through your insurance company, qualified pension plan or retirement plan. For eligibility information, contact your insurance company or qualified pension or retirement plan.
Purchasing and Selling Portfolio Shares
Shares are offered on each day that the New York Stock Exchange (the "NYSE") is open for business.
The Portfolio offers its shares only to insurance companies for separate accounts that they establish to fund variable life insurance and variable annuity contracts, and to other entities under qualified pension and retirement plans. An insurance company purchases or redeems shares of the Portfolio based on, among other things, the amount of net contract premiums or purchase payments allocated to a separate account investment division, transfers to or from a separate account investment division, contract loans and repayments, contract withdrawals and surrenders, and benefit payments. The contract prospectus describes how contract owners may allocate, transfer and withdraw amounts to, and from, separate accounts.
There are no known disadvantages to variable product contract owners or qualified plan participants arising out of the fact that the Portfolio offers its shares to separate accounts of various insurance companies that offer variable annuity and variable life insurance products and various other entities under qualified pension and retirement plans. Nevertheless, the Board of Directors that oversees the Portfolio intends to monitor events to identify any material irreconcilable conflicts that may possibly arise due to these arrangements and to determine what action, if any, should be taken in response.
Pricing of Portfolio Shares
The price per share will be the NAV per share next determined after the Fund or the insurance company receives your purchase or redemption order. The NAV for one share is the value of that share's portion of all of the net assets in the Portfolio. The Fund determines the NAV per share for the Portfolio as of the close of the NYSE (normally 4:00 p.m. Eastern Time) on each day that the NYSE is open for business.
About Net Asset Value
The NAV per share of the Portfolio is determined by dividing the total of the value of the Portfolio's
investments and other assets, less any liabilities, by the total number of outstanding shares of the Portfolio. In making this calculation, the Portfolio generally values securities at market price. If market prices are unavailable or may be unreliable because of events occurring after the close of trading, the value for those securities will be determined in good faith at fair value using methods approved by the Board of Directors. In addition, with respect to securities that primarily are listed on foreign exchanges, when an event occurs after the close of such exchanges that is likely to have changed the value of the securities (e.g., a percentage change in value of one or more U.S. securities indices in excess of specified thresholds), such securities will be valued at their fair value, as determined under procedures established by the Fund's Board of Directors. Securities also may be fair valued in the event of a significant development affecting a country or region or an issuer-specific development which is likely to have changed the value of the security. In these cases, the Portfolio's NAV will reflect certain portfolio securities' fair value rather than their market price. To the extent the Portfolio invests in open-end management companies that are registered under the Investment Company Act of 1940, as amended, the Portfolio's NAV is calculated based upon the NAV of such funds. The prospectuses for such funds explain the circumstances under which they will use fair value pricing and its effects.
Fair value pricing involves subjective judgments and it is possible that the fair value determined for a security is materially different than the value that could be realized upon the sale of that security. The Portfolio may hold securities that are listed on foreign exchanges. These securities may trade on weekends or other days when the Portfolio does not calculate its NAV. As a result, the value of these investments may change on days when you cannot purchase or sell shares.
The NAV of Class II shares will differ from that of Class I shares because of class-specific expenses that each class may pay.
Dividends and Distributions
The Portfolio distributes its net investment income, if any, at least annually as dividends and makes distributions of its net realized capital gains, if any, at least annually.
Taxes
The Portfolio expects that it will not have to pay federal income taxes if it distributes annually all of its net investment income and net realized capital gains. The
UIF Global Infrastructure Portfolio 13
Shareholder Information (Cont'd)
Portfolio does not expect to be subject to federal excise taxes with respect to undistributed income.
Special tax rules apply to life insurance companies, variable annuity contracts and variable life insurance contracts. For information on federal income taxation of a life insurance company with respect to its receipt of distributions from the Portfolio and federal income taxation of owners of variable annuity or variable life insurance contracts, refer to the contract prospectus.
Because each investor's tax circumstances are unique and the tax laws may change, you should consult your tax adviser about the federal, state and local tax consequences applicable to your investment.
Frequent Purchases and Redemptions of Shares
Frequent purchases and redemptions of shares pursuant to the instructions of insurance company contract owners or qualified plan participants is referred to as "market-timing" or "short-term trading" and may present risks for other contract owners or participants with long-term interests in the Portfolio, which may include, among other things, dilution in the value of the Portfolio's shares indirectly held by contract owners or participants with long-term interests in the Portfolio, interference with the efficient management of the Portfolio, increased brokerage and administrative costs and forcing the Portfolio to hold excess levels of cash.
In addition, the Portfolio is subject to the risk that market-timers and/or short-term traders may take advantage of time zone differences between the foreign markets on which the Portfolio's securities trade and the time the Portfolio's NAV is calculated ("time-zone arbitrage"). For example, a market-timer may submit instructions for the purchase of shares of the Portfolio based on events occurring after foreign market closing prices are established, but before the Portfolio's NAV calculation that are likely to result in higher prices in foreign markets the following day. The market-timer would submit instructions to redeem the Portfolio's shares the next day when the Portfolio's share price would reflect the increased prices in foreign markets for a quick profit at the expense of contract owners or participants with long-term interests in the Portfolio.
Investments in other types of securities also may be susceptible to short-term trading strategies. These investments include securities that are, among other things, thinly traded, traded infrequently or relatively illiquid, which have the risk that the current market price for the securities may not accurately reflect current market
values. A contract owner may seek to engage in short-term trading to take advantage of these pricing differences (referred to as "price-arbitrage"). The Portfolio's policies with respect to valuing portfolio securities are described above in "About Net Asset Value."
The Fund's Board of Directors has adopted policies and procedures to discourage frequent purchases and redemptions of Portfolio shares by Portfolio shareholders. Insurance companies or qualified plans generally do not provide specific contract owner or plan participant transaction instructions to the Portfolio on an ongoing basis. Therefore, to some extent, the Portfolio relies on the insurance companies and qualified plans to monitor frequent short-term trading by contract owners. However, the Portfolio has entered into agreements with insurance companies and qualified plans whereby the insurance companies and qualified plans are required to provide certain contract owner identification and transaction information upon the Portfolio's request. The Portfolio may use this information to help identify and prevent market-timing activity in the Portfolio. There can be no assurance that the Portfolio will be able to identify or prevent all market-timing activity.
If the Portfolio identifies suspected market-timing activity, the insurance company or qualified plan will be contacted and asked to take steps to prevent further market-timing activity (e.g., sending warning letters or blocking frequent trading by underlying contract owners or participants). Insurance companies may be prohibited by the terms of the underlying insurance contract from restricting short-term trading of mutual fund shares by contract owners, thereby limiting the ability of such insurance company to implement remedial steps to prevent market-timing activity in the Portfolio. If the insurance company or qualified plan is unwilling or unable to take remedial steps to discourage or prevent frequent trading, or does not take action promptly, certain contract owners or participants may be able to engage in frequent trading to the detriment of contract owners or participants with long-term interests in the Portfolio. If the insurance company or qualified plan refuses to take remedial action, or takes action that the Portfolio deems insufficient, a determination will be made whether it is appropriate to terminate the relationship with such insurance company or qualified plan.
Portfolio Holdings Information
A description of the Fund's policies and procedures with respect to the disclosure of the Portfolio's securities is available in the Portfolio's SAI.
14 UIF Global Infrastructure Portfolio
Class II Prospectus
Financial Highlights
No financial information is provided for the Portfolio because it had not commenced operations as of the date of this Prospectus.
UIF Global Infrastructure Portfolio 15
[THIS PAGE INTENTIONALLY LEFT BLANK]
Where to Find Additional Information
Statement of Additional Information
In addition to this Prospectus, the Portfolio has a Statement of Additional Information, dated December 18, 2013, which contains additional, more detailed information about the Fund and the Portfolio. The Statement of Additional Information is incorporated by reference into this Prospectus and, therefore, legally forms a part of this Prospectus.
Shareholder Reports
The Portfolio publishes Annual and Semi-Annual Reports ("Shareholder Reports") containing financial statements. These reports contain additional information about the Portfolio's investments. In the Portfolio's Shareholder reports, when available, you will find a discussion of the market conditions and the investment strategies that significantly affected the Portfolio's performance during that period. For additional Fund information, including information regarding the investments comprising the Portfolio, and to make shareholder inquiries, please call 1-800-548-7786 or contact your insurance company.
You may obtain the Statement of Additional Information and Shareholder Reports without charge by contacting the Fund at the toll-free number above or your insurance company or on our web site at www.morganstanley.com/im.
Information about the Fund (including the Statement of Additional Information and Shareholder Reports) can be reviewed and copied at the SEC's Public Reference Room in Washington, D.C. Information on the operation of the Public Reference Room may be obtained by calling the SEC at (202) 551-8090. Shareholder Reports and other information about the Fund are available on the EDGAR Database on the SEC's Internet site at http://www.sec.gov, and copies of this information may be obtained, after paying a duplicating fee, by electronic request at the following E-mail address: publicinfo@sec.gov, or by writing the SEC's Public Reference Section, Washington, D.C. 20549-1520.
To aid you in obtaining this information, the Fund's Investment Company Act registration number is 811-7607.

October 4, 2013
Supplement
SUPPLEMENT DATED OCTOBER 4, 2013 TO THE PROSPECTUSES OF
MORGAN STANLEY SELECT DIMENSIONS INVESTMENT SERIES
THE GLOBAL INFRASTRUCTURE PORTFOLIO
CLASS X and CLASS Y
Dated April 30, 2013
The Board of Trustees (the "Board") of Morgan Stanley Select Dimensions Investment Series (the "Fund") approved an Agreement and Plan of Reorganization by and between the Fund, on behalf of its series Global Infrastructure Portfolio (the "Portfolio") and The Universal Institutional Funds, Inc., on behalf of its newly created series Global Infrastructure Portfolio ("UIF Global Infrastructure"), pursuant to which substantially all of the assets and liabilities of the Portfolio would be transferred to UIF Global Infrastructure and shareholders of the Portfolio would become shareholders of UIF Global Infrastructure, receiving shares of UIF Global Infrastructure equal to the value of their holdings in the Portfolio (the "Reorganization"). Each shareholder of the Portfolio would receive the Class of shares of UIF Global Infrastructure that corresponds to the Class of shares of the Portfolio currently held by that shareholder. The Reorganization is subject to the approval of shareholders of the Portfolio at a special meeting of shareholders scheduled to be held during the first quarter of 2014. A proxy statement formally detailing the proposal, the reasons for the Reorganization and information concerning UIF Global Infrastructure is expected to be distributed to shareholders of the Portfolio during the first quarter of 2014.
PLEASE RETAIN THIS SUPPLEMENT FOR FUTURE REFERENCE.

SUPPLEMENT DATED MAY 31, 2013 TO THE PROSPECTUSES OF
MORGAN STANLEY SELECT DIMENSIONS INVESTMENT SERIES
THE GLOBAL INFRASTRUCTURE PORTFOLIO
CLASS X and CLASS Y
Dated April 30, 2013
The first and second paragraphs under the section of the Prospectus entitled "Portfolio Summary—Principal Investment Strategies" are hereby deleted and replaced with the following:
The Portfolio will normally invest at least 80% of its assets in equity securities issued by companies located throughout the world that are engaged in the infrastructure business. A company will be considered to be in the infrastructure business if it derives at least 50% of its revenues or earnings from, or devotes at least 50% of its assets to, infrastructure-related activities. Infrastructure refers to the systems and networks of energy, transportation, communication and other services required for the normal function of society. Companies in the infrastructure business may be involved in a variety of areas, including, but not limited to, (i) the transmission, distribution, storage or transportation of electricity, oil and gas (and other bulk liquid products), water, and other natural resources used to produce energy, (ii) the construction and operation of renewable power facilities, (iii) the development, ownership, lease, concession, or management of highways, toll roads, tunnels, bridges, pipelines, airports, marine ports, refueling and related facilities, (iv) the provision of communications, including the development, lease, concession, or management of telephone, broadcast and mobile towers, fiber optic/copper cable, and satellite networks, (v) waste-water management and water purification/desalination and (vi) the construction or operation of essential public structures. The Portfolio's equity investments may include convertible securities. The Portfolio's investments may include securities of small and medium capitalization companies. The Portfolio may invest up to 100% of its net assets in foreign securities, which may include emerging market securities. Under normal market conditions, the Portfolio invests at least 40% of its assets in the securities of issuers located outside of the United States.
The Portfolio's "Adviser," Morgan Stanley Investment Management Inc., and/or "Sub-Advisers," Morgan Stanley Investment Management Limited and Morgan Stanley Investment Management Company, will shift the Portfolio's assets between the different types of companies in the infrastructure business described above based on relative valuation, underlying company fundamentals, and demographic and macroeconomic considerations. The Portfolio has a fundamental policy (i.e., one that cannot be changed without shareholder approval) of investing 25% or more of its assets in the infrastructure industry.
***
The section of the Prospectus entitled "Portfolio Summary—Principal Risks—Infrastructure-Related Companies" is hereby deleted and replaced with the following:
• Infrastructure Industry. By concentrating its investments in the infrastructure industry, the Portfolio has greater exposure to the potential adverse economic, regulatory, political and other changes affecting companies operating within such industry. Companies within the infrastructure industry are subject to a variety of factors that may adversely affect their business or operations, including high interest costs in connection with capital construction and improvement programs, high leverage, costs associated with compliance with and changes in environmental and other regulations, difficulty in raising capital in adequate amounts and on reasonable terms in periods of high inflation and unsettled capital markets or government budgetary constraints that impact publicly funded projects, the effects of economic slowdown or recession and surplus capacity, increased competition from other providers of services, uncertainties concerning the availability of fuel at reasonable prices, the effects of energy conservation policies and other factors.
Other factors that may affect the operations of companies within the infrastructure industry include innovations in technology that could render the way in which a company delivers a product or service obsolete, significant changes to the number of ultimate end-users of a company's products, inexperience with and potential losses resulting from a developing deregulatory environment, increased susceptibility to terrorist attacks, risks of environmental damage due to a company's operations or an accident, and general changes in market sentiment towards infrastructure and utilities assets. Companies operating in the infrastructure industry face operating risks, including the risk of fire, explosions, leaks, mining and drilling accidents or other catastrophic events. In addition, natural risks, such as earthquakes, floods, lightning, hurricanes, tsunamis and wind, are inherent risks in infrastructure company operations.
***
The section of the Prospectus entitled "Portfolio Summary—Principal Risks—Utilities Industry" is hereby deleted in its entirety.
***
The first and second paragraphs under the section of the Prospectus entitled "Portfolio Details—Additional Information about the Portfolio's Investment Objective, Strategies and Risks—Principal Investment Strategies" are hereby deleted and replaced with the following:
The Portfolio will normally invest at least 80% of its assets in equity securities issued by companies located throughout the world that are engaged in the infrastructure business. A company will be considered to be in the infrastructure business if it derives at least 50% of its revenues or earnings from, or devotes at least 50% of its assets to, infrastructure-related activities. Infrastructure refers to the systems and networks of energy, transportation, communication and other services required for the normal function of society. Companies in the infrastructure business may be involved in a variety of areas, including, but not limited to, (i) the transmission, distribution, storage or transportation of electricity, oil and gas (and other bulk liquid products), water, and other natural resources used to produce energy, (ii) the construction and operation of renewable power facilities, (iii) the development, ownership, lease, concession, or management of highways, toll roads, tunnels, bridges, pipelines, airports, marine ports, refueling and related facilities, (iv) the provision of communications, including the development, lease, concession, or management of telephone, broadcast and mobile towers, fiber optic/copper cable, and satellite networks, (v) waste-water management and water purification/desalination and (vi) the construction or operation of essential public structures. The Portfolio's equity investments may include convertible securities. The Portfolio's investments may include securities of small and medium capitalization companies. The Portfolio may invest up to 100% of its net assets in foreign securities, which may include emerging market securities. Under normal market conditions, the Portfolio invests at least 40% of its assets in the securities of issuers located outside of the United States.
The Adviser and/or Sub-Advisers shift the Portfolio's assets between the different types of companies in the infrastructure business described above based on relative valuation, underlying company fundamentals, and demographic and macroeconomic considerations. The Portfolio has a fundamental policy (i.e., one that cannot be changed without shareholder approval) of investing 25% or more of its assets in the infrastructure industry.
***
The second sentence under the section of the Prospectus entitled "Portfolio Details—Additional Information about the Portfolio's Investment Objective, Strategies and Risks—Additional Investment Strategy Information—Asset-Backed Securities" is hereby deleted and replaced with the following:
Asset-backed securities represent an interest in a pool of assets such as a pool of power generation assets or other infrastructure assets or infrastructure-related assets, that have been securitized in pass-through structures.
***
The last sentence of the last paragraph under the section of the Prospectus entitled "Portfolio Details—Additional Information about the Portfolio's Investment Objective, Strategies and Risks—Additional Investment Strategy Information" is hereby deleted and replaced with the following:
Except for the Portfolio's policy to concentrate its assets in the infrastructure industry, the Portfolio may change its principal investment strategies without shareholder approval; however, you would be notified of any changes.
***
The section of the Prospectus entitled "Portfolio Details—Additional Information about the Portfolio's Investment Objective, Strategies and Risks—Principal Risks—Infrastructure-Related Companies" is hereby deleted and replaced with the following:
Infrastructure Industry. By concentrating its investments in the infrastructure industry, the Portfolio has greater exposure to the potential adverse economic, regulatory, political and other changes affecting companies operating within such industry. Companies within the infrastructure industry are subject to a variety of factors that may adversely affect their business or operations, including high interest costs in connection with capital construction and improvement programs, high leverage, costs associated with compliance with and changes in environmental and other regulations, difficulty in raising capital in adequate amounts and on reasonable terms in periods of high inflation and unsettled capital markets or government budgetary constraints that impact publicly funded projects, the effects of economic slowdown or recession and surplus capacity, increased competition from other providers of services, uncertainties concerning the availability of fuel at reasonable prices, the effects of energy conservation policies and other factors. Additionally, companies within the infrastructure industry may be subject to regulation by various government authorities and may also be affected by government regulation of rates charged to customers, service interruption or legal challenges due to environmental, operational or other mishaps and the imposition of special tariffs and changes in tax laws, regulatory policies and accounting standards; technological innovations that may render existing plants, equipment or products obsolete, unforeseen delays, accidents, and cost overruns in infrastructure projects. Any market price movements, regulatory or technological changes, or economic conditions affecting infrastructure-related companies may have a significant impact on the Portfolio's performance. Other factors that may affect the operations of companies within the infrastructure industry include innovations in technology that could render the way in which a company delivers a product or service obsolete, significant changes to the number of ultimate end-users of a company's products, inexperience with and potential losses resulting from a developing deregulatory environment, increased susceptibility to terrorist attacks, risks of environmental damage due to a company's operations or an accident, and general changes in market sentiment towards infrastructure and utilities assets.
Companies operating in the infrastructure industry face operating risks, including the risk of fire, explosions, leaks, mining and drilling accidents or other catastrophic events. If any of these operating risks occur, it could cause substantial losses to the given infrastructure company. In addition, natural risks, such as earthquakes, floods, lightning, hurricanes, tsunamis and wind, are inherent risks in infrastructure company operations. For example, extreme weather patterns, such as Hurricane Ivan in 2004 and Hurricanes Katrina and Rita in 2005, the Tohuku earthquake and resulting tsunami in Japan in 2011, could result in substantial damage to the facilities of certain companies located in the affected areas and such extreme weather patterns, or the threat thereof, could adversely impact the prices of the securities in which the Portfolio invests. This volatility may create fluctuations in commodity prices and earnings of companies in the infrastructure industry.
***
The section of the Prospectus entitled "Portfolio Details—Additional Information about the Portfolio's Investment Objective, Strategies and Risks—Principal Risks—Utilities Industry" is hereby deleted in its entirety.
PLEASE RETAIN THIS SUPPLEMENT FOR FUTURE REFERENCE
PROSPECTUS n APRIL 30, 2013

SELECT DIMENSIONS INVESTMENT SERIES
THE GLOBAL INFRASTRUCTURE PORTFOLIO
Class X
Morgan Stanley Select Dimensions Investment Series is a mutual fund comprised of seven separate portfolios, each with its own distinct investment objective(s) and policies. In this Prospectus, shares of the Global Infrastructure Portfolio (the "Portfolio") are being offered.
Shares of the Portfolio are sold exclusively to certain life insurance companies in connection with particular variable life insurance and/or variable annuity contracts they issue. The insurance companies invest in shares of the Portfolio in accordance with instructions received from owners of the variable life insurance or variable annuity contracts.
This Prospectus must be accompanied by a current prospectus for the variable life insurance and/or variable annuity contract issued by your life insurance company.
The Securities and Exchange Commission ("SEC") has not approved or disapproved these securities or passed upon
the adequacy of this Prospectus. Any representation to the contrary is a criminal offense.
Contents
Portfolio Summary | | INVESTMENT OBJECTIVE | | | 1 | | |
| | | FEES AND EXPENSES OF THE PORTFOLIO | | | 1 | | |
| | | PORTFOLIO TURNOVER | | | 1 | | |
| | | PRINCIPAL INVESTMENT STRATEGIES | | | 1 | | |
| | | PRINCIPAL RISKS | | | 2 | | |
| | | PAST PERFORMANCE | | | 2 | | |
| | FUND MANAGEMENT | | | 3 | | |
| | | PURCHASE AND SALE OF PORTFOLIO SHARES | | | 3 | | |
| | | TAX INFORMATION | | | 3 | | |
| | | PAYMENTS TO INSURANCE COMPANIES AND OTHER FINANCIAL INTERMEDIARIES | | | 3 | | |
Portfolio Details | | ADDITIONAL INFORMATION ABOUT THE PORTFOLIO'S INVESTMENT OBJECTIVE,
STRATEGIES AND RISKS | | | 4 | | |
| | FUND MANAGEMENT | | | 9 | | |
Shareholder Information | | PURCHASES AND SALES OF PORTFOLIO SHARES | | | 11 | | |
| | | FREQUENT PURCHASES AND REDEMPTIONS OF SHARES | | | 11 | | |
| | | PRICING PORTFOLIO SHARES | | | 12 | | |
| | | DISTRIBUTIONS | | | 12 | | |
| | | TAX CONSEQUENCES | | | 13 | | |
| | | PORTFOLIO HOLDINGS INFORMATION | | | 13 | | |
| | | ADDITIONAL INFORMATION | | | 13 | | |
Financial Highlights | | | | | 14 | | |
This Prospectus contains important information about the Global Infrastructure Portfolio and the Morgan Stanley Select Dimensions Investment Series. Please read it carefully and keep it for future reference.
Investment Objective
The Portfolio seeks both capital appreciation and current income.
Fees and Expenses of the Portfolio
The table below describes the fees and expenses that you may pay if you buy and hold Class X shares of the Portfolio. Total Annual Portfolio Operating Expenses in the table and the Example below do not reflect the impact of any charges by your insurance company. If they did, expenses would be higher.
Annual Portfolio Operating Expenses
(expenses that you pay each year as a percentage of the value of your investment)
Advisory Fee | | | 0.57 | % | |
Distribution and/or Shareholder Service (12b-1) Fee | | | None | | |
Other Expenses | | | 0.54 | % | |
Total Annual Portfolio Operating Expenses | | | 1.11 | % | |
Example
The example below is intended to help you compare the cost of investing in the Portfolio with the cost of investing in other mutual funds.
The example assumes that you invest $10,000 in the Portfolio, your investment has a 5% return each year, and the Portfolio's operating expenses remain the same. Although your actual costs may be higher or lower, based on these assumptions your costs would be:
| | | Expenses Over Time | |
| | | 1 Year | | 3 Years | | 5 Years | | 10 Years | |
| | | | | $ | 113 | | | $ | 353 | | | $ | 612 | | | $ | 1,352 | | |
Portfolio Turnover
The Portfolio pays transaction costs, such as commissions, when it buys and sells securities (or "turns over" its portfolio). A higher portfolio turnover rate may indicate higher transaction costs. These costs, which are not reflected in Total Annual Portfolio Operating Expenses or in the Example, affect the Portfolio's performance. During the most recent fiscal year, the Portfolio's portfolio turnover rate was 28% of the average value of its portfolio.
Principal Investment Strategies
The Portfolio will normally invest at least 80% of its assets in equity securities issued by companies located throughout the world that are engaged in the infrastructure business. A company will be considered to be in the infrastructure business if it derives at least 50% of its revenues or earnings from, or devotes at least 50% of its assets to, infrastructure-related activities. Infrastructure refers to the systems and networks of energy, transportation, communication and other services required for the normal function of society. The Portfolio may invest up to 100% of its net assets in foreign securities, which may include emerging market securities. Under normal market conditions, the Portfolio invests at least 40% of its assets in the securities of issuers located outside of the United States. The Portfolio's equity investments may include convertible securities.
The Portfolio's "Adviser," Morgan Stanley Investment Management Inc., and/or "Sub-Advisers," Morgan Stanley Investment Management Limited and Morgan Stanley Investment Management Company, will shift the Portfolio's assets between the different types of companies in the infrastructure business described above based on relative valuation, underlying company fundamentals, and demographic and macroeconomic considerations. Utility companies represent a significant component of the universe of companies engaged in the infrastructure business. These companies may include traditionally regulated public utilities or fully or partially deregulated utility companies as well as unregulated utility companies. The Portfolio has a fundamental policy (i.e., one that cannot be changed without shareholder approval) of investing 25% or more of its assets in the utilities industry.
In selecting securities to buy, hold or sell for the Portfolio, the Adviser and/or Sub-Advisers actively manage the portfolio using a combination of bottom-up and top-down methodologies. The value-driven approach to bottom-up security selection utilizes proprietary research models to identify infrastructure companies that offer the best value relative to their underlying assets and growth prospects. The top-down allocation provides diversified exposure to major economic infrastructure sectors and countries, with an overweighting to those sectors/countries that offer the best relative valuation.
SDIS — The Global Infrastructure Portfolio
1
Principal Risks
There is no assurance that the Portfolio will achieve its investment objective and you can lose money investing in this Portfolio. The principal risks of investing in the Portfolio include:
• Infrastructure-Related Companies. Because the Portfolio concentrates its investments in infrastructure-related companies, the Portfolio has greater exposure to the potential adverse economic, regulatory, political and other changes affecting such entities. Infrastructure-related companies are subject to a variety of factors that may adversely affect their business or operations including high interest costs in connection with capital construction programs, costs associated with compliance with and changes in environmental and other regulations, difficulty in raising capital in adequate amounts on reasonable terms in periods of high inflation and unsettled capital markets, the effects of surplus capacity, increased competition from other providers of services in a developing deregulatory environment, uncertainties concerning the availability of fuel at reasonable prices, the effects of energy conservation policies and other factors.
Other factors that may affect the operations of infrastructure-related companies include innovations in technology, significant changes to the number of ultimate end-users of a company's products, increased susceptibility to terrorist acts or political actions, risks of environmental damage due to a company's operations or an accident, and general changes in market sentiment towards infrastructure and utilities assets.
• Utilities Industry. Changing regulation constitutes one of the key industry-specific risks for the Portfolio. State and other regulators often monitor and control utility revenues and costs. Regulatory authorities also may restrict a company's access to new markets. The deregulation of certain utilities companies may subject these companies to greater risks of loss. Individual sectors of the utility market are subject to additional risks. These risks apply to all utility companies—regulated, fully or partially deregulated and unregulated.
Certain utilities companies may incur unexpected increases in fuel and other operating costs. They are adversely affected when long-term interest rates rise. Long-term borrowings are used to finance most utility investments, and rising interest rates lead to higher financing costs and reduced earnings. There are also considerable costs associated with environmental compliance, nuclear waste clean-up and safety regulation. Increasingly, regulators are calling upon electric utilities to bear these added costs, and there is a risk that these costs will not be fully recovered through an increase in revenues.
• Common Stock and Other Equity Securities. In general, common stock and other equity security values fluctuate, and sometimes widely fluctuate, in response to activities specific to the issuer of the security as well as factors unrelated to the fundamental condition of the issuer, including general market, economic and political conditions. To the extent that the
Portfolio invests in convertible securities, and the convertible security's investment value is greater than its conversion value, its price will be likely to increase when interest rates fall and decrease when interest rates rise. If the conversion value exceeds the investment value, the price of the convertible security will tend to fluctuate directly with the price of the underlying equity security. The Portfolio's emphasis on industries may cause its performance to be more sensitive to developments affecting particular industries than a fund that places primary emphasis on individual companies.
• Small and Medium Capitalization Companies. Investments in small and medium capitalization companies may involve greater risks than investments in larger, more established companies. The securities issued by small and medium capitalization companies may be less liquid, and such companies may have more limited markets, financial resources and product lines, and may lack the depth of management of larger companies.
• Foreign and Emerging Market Securities. Investments in foreign markets entail special risks such as currency, political, economic and market risks. There also may be greater market volatility, less reliable financial information, higher transaction and custody costs, decreased market liquidity and less government and exchange regulation associated with investments in foreign markets. In addition, investments in certain foreign markets, which have historically been considered stable, may become more volatile and subject to increased risk due to ongoing developments and changing conditions in such markets. Moreover, the growing interconnectivity of global economies and financial markets has increased the probability that adverse developments and conditions in one country or region will affect the stability of economies and financial markets in other countries or regions. The risks of investing in emerging market countries are greater than risks associated with investments in foreign developed countries.
Shares of the Portfolio are not bank deposits and are not guaranteed or insured by the Federal Deposit Insurance Corporation or any other government agency.
Past Performance
The bar chart and table below provide some indication of the risks of investing in the Portfolio by showing changes in the performance of the Portfolio's Class X shares from year-to-year and by showing how the average annual returns of the Portfolio's Class X shares for the one, five and 10 year periods compare with a broad measure of market performance, as well as a comparative sector index, over time. This performance information does not include the impact of any charges deducted by your insurance company. If it did, returns would be lower. The Portfolio's past performance does not indicate how the Portfolio will perform in the future.
SDIS — The Global Infrastructure Portfolio
2
Annual Total Returns—Calendar Years

High Quarter | | 6/30/09: | | 20.93% | |
Low Quarter | | 9/30/08: | | –18.12% | |
Average Annual Total Returns For Periods Ended December 31, 2012
| | | Past
1 Year | | Past
5 Years | | Past
10 Years | |
Global Infrastructure Portfolio | | | 18.14 | % | | | 3.07 | % | | | 11.34 | % | |
Dow Jones Brookfield
Global Infrastructure IndexSM
(reflects no deduction for fees,
expenses or taxes)1 | | | 16.01 | % | | | 4.86 | % | | | 14.38 | % | |
S&P Global BMI Index
(reflects no deduction for fees,
expenses or taxes)2 | | | 17.15 | % | | | –0.26 | % | | | 9.31 | % | |
(1) The Dow Jones Brookfield Global Infrastructure IndexSM is a float-adjusted market capitalization weighted index that measures the stock performance of companies that exhibit strong infrastructure characteristics. The Index intends to measure all sectors of the infrastructure market. The Index was first published in July 2008; however, back-tested hypothetical performance information is available for this Index since December 31, 2002. Returns are calculated using the return data of the S&P Global BMI Index through December 31, 2002 and the return data of the Dow Jones Brookfield Global Infrastructure Index for periods thereafter. It is not possible to invest directly in an index.
(2) The Standard & Poor's Global BMI Index (S&P Global BMI Index) is a broad market index designed to capture exposure to equities in all countries in the world that meet minimum size and liquidity requirements. As of the date of this Prospectus, there are approximately 11,000 index members representing 26 developed and 20 emerging market countries. It is not possible to invest directly in an index.
Fund Management
Adviser. Morgan Stanley Investment Management Inc.
Sub-Advisers. Morgan Stanley Investment Management Limited and Morgan Stanley Investment Management Company.
Portfolio Managers. The Portfolio is managed by members of the Global Infrastructure Securities team. Information about the members jointly and primarily responsible for the day-to-day management of the Portfolio is shown below:
Name | | Title with Adviser | | Date Began
Managing Portfolio | |
Theodore R. Bigman | | Managing Director | | March 2010 | |
Matthew King | | Executive Director | | March 2010 | |
Purchase and Sale of Portfolio Shares
This Prospectus offers Class X shares of the Global Infrastructure Portfolio. The Portfolio also offers Class Y shares of the Portfolio through a separate prospectus. Class Y shares are subject to different expenses. For eligibility information, contact your insurance company.
Portfolio shares will be sold at the next price calculated after we receive the redemption request on your behalf.
The Portfolio offers its shares only to insurance companies' separate accounts that insurance companies establish to fund variable life insurance and/or variable annuity contracts. An insurance company purchases or redeems shares of the Portfolio based on, among other things, the amount of net contract premiums or purchase payments allocated to a separate account investment division, transfers to or from a separate account investment division, contract loans and repayments, contract withdrawals and surrenders, and benefit payments. The contract prospectus describes how contract owners may allocate, transfer and withdraw amounts to, and from, separate accounts.
For more information, please refer to the "Shareholder Information—Purchases and Sales of Portfolio Shares" section of this Prospectus.
Tax Information
Special tax rules apply to life insurance companies, variable annuity contracts and variable life insurance contracts. For information on federal income taxation of a life insurance company with respect to its receipt of distributions from the Portfolio and federal income taxation of owners of variable annuity or variable life insurance contracts, see the accompanying contract prospectus.
Payments to Insurance Companies and
Other Financial Intermediaries
If you purchase the Portfolio through an insurance company or other financial intermediary (such as a bank), the Adviser and/or the Portfolio's "Distributor," Morgan Stanley Distribution, Inc., may pay the intermediary for the sale of Portfolio shares and related services. These payments, which may be significant in amount, may create a conflict of interest by influencing the insurance company or other intermediary and your salesperson to recommend one variable annuity contract over another or be a factor in an insurance company's decision to include the Portfolio as an underlying investment option in its variable insurance products. Ask your salesperson or visit your insurance company's or other intermediary's web site for more information.
SDIS — The Global Infrastructure Portfolio
3
Portfolio Details
ADDITIONAL INFORMATION ABOUT THE PORTFOLIO'S INVESTMENT OBJECTIVE, STRATEGIES AND RISKS
INVESTMENT OBJECTIVE
The Portfolio seeks both capital appreciation and current income.
PRINCIPAL INVESTMENT STRATEGIES
GROWTH & INCOME
An investment objective having the goal of selecting securities with the potential to rise in price and pay out income.
The Portfolio will normally invest at least 80% of its assets in equity securities issued by companies located throughout the world that are engaged in the infrastructure business. A company will be considered to be in the infrastructure business if it derives at least 50% of its revenues or earnings from, or devotes at least 50% of its assets to, infrastructure-related activities. Infrastructure refers to the systems and networks of energy, transportation, communication and other services required for the normal function of society. Companies in the infrastructure business may be involved in, among other areas, the transmission and distribution of electric energy; the storage, transportation and distribution of natural resources, such as natural gas, used to produce energy; the building, operation and maintenance of highways, toll roads, tunnels, bridges and parking lots; the building, operation and maintenance of airports and ports, railroads and mass transit systems; telecommunications; water treatment and distribution; and other emerging infrastructure sectors. The Portfolio's investments may include securities of small and medium capitalization companies. The Portfolio may invest up to 100% of its net assets in foreign securities, which may include emerging market securities. Under normal market conditions, the Portfolio invests at least 40% of its assets in the securities of issuers located outside of the United States. The Portfolio's equity investments may include convertible securities.
The Adviser and/or Sub-Advisers will shift the Portfolio's assets between the different types of companies in the infrastructure business described above based on relative valuation, underlying company fundamentals, and demographic and macroeconomic considerations. Utility companies represent a significant component of the universe of companies engaged in the infrastructure business. These companies may include traditionally regulated public utilities or fully or partially deregulated utility companies as well as unregulated utility companies. The Portfolio has a fundamental policy (i.e., one that cannot be changed without shareholder approval) of investing 25% or more of its assets in the utilities industry. Utilities companies are involved in, among other areas, gas and electric energy, water distribution, telecommunications, and other new or emerging technologies.
In selecting securities to buy, hold or sell for the Portfolio, the Adviser and/or Sub-Advisers actively manage the Portfolio using a combination of bottom-up and top-down methodologies. The value-driven approach to bottom-up security selection utilizes proprietary research models to identify infrastructure companies that offer the best value relative to their underlying assets and growth prospects. The top-down allocation provides diversified exposure to major economic infrastructure sectors and countries, with an overweighting to those sectors/countries that offer the best relative valuation. The Adviser and/or Sub-Advisers generally consider selling a portfolio holding when it determines that the holding is less attractive based on a number of factors, including changes in the holding's share price, earnings prospects relative to its peers and/or business prospects.
SDIS — The Global Infrastructure Portfolio
4
Common stock is a share ownership or equity interest in a corporation. It may or may not pay dividends, as some companies reinvest all of their profits back into their businesses, while others pay out some of their profits to shareholders as dividends. A depositary receipt is generally issued by a bank or financial institution and represents an ownership interest in the common stock or other equity securities of a foreign company.
Other Investments. The remaining 20% of the Portfolio's assets may be invested in fixed-income securities, equity securities of companies not engaged in the infrastructure business, U.S. government securities issued, or guaranteed as to principal and interest, by the U.S. Government or its agencies or instrumentalities and asset-backed securities. The Portfolio may invest in real estate investment trusts (commonly known as "REITs") and foreign real estate companies and convertible securities. The Portfolio may invest up to 5% of its assets in fixed-income securities and convertible securities rated below investment grade (commonly known as "junk bonds"). For more information, see the "Additional Investment Strategy Information" section.
In pursuing the Portfolio's investment objective, the Adviser and/or Sub-Advisers have considerable leeway in deciding which investments they buy, hold or sell on a day-to-day basis and which trading strategies they use. For example, the Adviser and/or Sub-Advisers in their discretion may determine to use some permitted trading strategies while not using others.
ADDITIONAL INVESTMENT STRATEGY INFORMATION
This section provides additional information relating to the Portfolio's investment strategies.
Fixed-Income Securities. Fixed-income securities include debt securities such as bonds, notes or commercial paper. The issuer of a debt security borrows money from the investor who buys the security. Most debt securities pay either fixed or adjustable rates of interest at regular intervals until they mature, at which point investors get their principal back. The Portfolio's fixed-income investments may include zero coupon securities, which are purchased at a discount and generally accrue interest, but make no payments until maturity.
U.S. Government Securities. The U.S. government securities that the Portfolio may purchase include U.S. Treasury bills, notes and bonds, all of which are direct obligations of the U.S. Government. In addition, the Portfolio may purchase securities issued by agencies and instrumentalities of the U.S. Government which are backed by the full faith and credit of the United States. The Portfolio may also purchase securities issued by agencies and instrumentalities which are not backed by the full faith and credit of the United States, but whose issuing agency or instrumentality has the right to borrow, to meet its obligations, from the U.S. Treasury. Further, the Portfolio may purchase securities issued by agencies and instrumentalities which are backed solely by the credit of the issuing agency or instrumentality.
Asset-Backed Securities. The Portfolio may invest in asset-backed securities. Asset-backed securities represent an interest in a pool of assets, such as a pool of power generation assets or other utility assets or utility-related assets that have been securitized in pass-through structures. These types of pass-through securities provide for monthly payments that are a "pass through" of the monthly interest and principal payments made by the individual borrowers on the pooled receivables.
REITs and Foreign Real Estate Companies. The Portfolio may invest in REITs and foreign real estate companies, which are similar to entities organized and operated as REITs in the United States. REITs and foreign real estate companies pool investors' funds for investments primarily in real estate properties or real estate-related loans. They may also include, among other businesses, real estate developers, brokers and operating companies whose products and services are significantly related to the real estate industry such as building suppliers and mortgage lenders.
Defensive Investing. The Portfolio may take temporary "defensive" positions in attempting to respond to adverse market, economic, political or other conditions. The Portfolio may invest any amount of its assets in cash, cash equivalents or other fixed-income securities in a defensive posture that may be inconsistent with its principal investment strategies when the Adviser and/or the Sub-Advisers believe it advisable to do so. Although taking a defensive posture is designed to protect the Portfolio from an anticipated market downturn, it could have the effect of reducing the benefit from any upswing in the market. When the Portfolio takes a defensive position, it may not achieve its investment objective.
* * *
SDIS — The Global Infrastructure Portfolio
5
The percentage limitations relating to the composition of the Portfolio apply at the time the Portfolio acquires an investment. Subsequent percentage changes that result from market fluctuations generally will not require the Portfolio to sell any portfolio security. However, the Portfolio may be required to reduce its borrowings, if any, in response to fluctuations in the value of such holdings. Except for the Portfolio's policy to concentrate its assets in the utilities industry, the Portfolio may change its principal investment strategies without shareholder approval; however, you would be notified of any changes.
PRINCIPAL RISKS
There is no assurance that the Portfolio will achieve its investment objective. The Portfolio's share price and return will fluctuate with changes in the market value of its portfolio securities. When you sell Portfolio shares, they may be worth less than what you paid for them and, accordingly, you can lose money investing in this Portfolio.
Infrastructure-Related Companies. Because the Portfolio concentrates its investments in infrastructure-related companies, the Portfolio has greater exposure to the potential adverse economic, regulatory, political and other changes affecting such entities. Infrastructure-related companies are subject to a variety of factors that may adversely affect their business or operations including high interest costs in connection with capital construction programs, costs associated with compliance with and changes in environmental and other regulations, difficulty in raising capital in adequate amounts on reasonable terms in periods of high inflation and unsettled capital markets, the effects of surplus capacity, increased competition from other providers of services in a developing deregulatory environment, uncertainties concerning the availability of fuel at reasonable prices, the effects of energy conservation policies and other factors. Additionally, infrastructure-related entities may be subject to regulation by various governmental authorities and may also be affected by governmental regulation of rates charged to customers, government budgetary constraints, service interruption due to environmental, operational or other mishaps and the imposition of special tariffs and changes in tax laws, regulatory policies and accounting standards.
Other factors that may affect the operations of infrastructure-related companies include innovations in technology that could render the way in which a company delivers a product or service obsolete, significant changes to the number of ultimate end-users of a company's products, increased susceptibility to terrorist acts or political actions, risks of environmental damage due to a company's operations or an accident, and general changes in market sentiment towards infrastructure and utilities assets.
Utilities Industry. The Portfolio's investments in the utilities industry are impacted by risks particular to that industry. Changing regulation constitutes one of the key industry-specific risks for the Portfolio. State and other regulators often monitor and control utility revenues and costs, and therefore may limit utility profits and dividends paid to investors. Regulatory authorities also may restrict a company's access to new markets, thereby diminishing the company's long-term prospects. The deregulation of certain utilities companies may subject these companies to greater risks of loss. Individual sectors of the utility market are subject to additional risks. These risks apply to all utility companies — regulated, fully or partially deregulated and unregulated.
Certain utilities companies may incur unexpected increases in fuel and other operating costs. They are adversely affected when long-term interest rates rise. Long-term borrowings are used to finance most utility investments, and rising interest rates lead to higher financing costs and reduced earnings. There are also considerable costs associated with environmental compliance, nuclear waste clean-up and safety regulation. Increasingly, regulators are calling upon electric utilities to bear these added costs, and there is a risk that these costs will not be fully recovered through an increase in revenues.
In the case of the water utility sector, the industry is highly fragmented, and most water supply companies find themselves in mature markets, although upgrading of fresh water and waste water systems is an expanding business.
Common Stock and Other Equity Securities. A principal risk of investing in the Portfolio is associated with its common stock and other equity investments. In general, common stock and other equity security prices can fluctuate, and sometimes
SDIS — The Global Infrastructure Portfolio
6
widely fluctuate, in response to activities specific to the issuer of the security as well as factors unrelated to the fundamental condition of the issuer, including general market, economic and political conditions.
Investments in convertible securities subject the Portfolio to the risks associated with both fixed-income securities and common stocks. To the extent that a convertible security's investment value is greater than its conversion value, its price will be likely to increase when interest rates fall and decrease when interest rates rise, as with a fixed-income security. If the conversion value exceeds the investment value, the price of the convertible security will tend to fluctuate directly with the price of the underlying equity security. No more than 5% of the Portfolio's assets may be invested in convertible securities rated lower than investment grade (commonly known as "junk bonds").
Small and Medium Capitalization Companies. The Portfolio's investments in small and medium capitalization companies carry more risk than investments in larger companies. While some of the Portfolio's holdings in these companies may be listed on a national securities exchange, such securities are more likely to be traded in the over-the-counter market. The low market liquidity of these securities may have an adverse impact on the Portfolio's ability to sell certain securities at favorable prices and may also make it difficult for the Portfolio to obtain market quotations based on actual trades for purposes of valuing the Portfolio's securities. Investing in lesser-known, small and medium capitalization companies involves greater risk of volatility of the Portfolio's net asset value than is customarily associated with larger, more established companies. Often small and medium capitalization companies and the industries in which they are focused are still evolving and, while this may offer better growth potential than larger, more established companies, it also may make them more sensitive to changing market conditions.
Foreign and Emerging Market Securities. The Portfolio's investments in foreign securities involve risks that are in addition to the risks associated with domestic securities. One additional risk is currency risk. While the price of Portfolio shares is quoted in U.S. dollars, the Portfolio may convert U.S. dollars to a foreign market's local currency to purchase a security in that market. If the value of that local currency falls relative to the U.S. dollar, the U.S. dollar value of the foreign security will decrease. This is true even if the foreign security's local price remains unchanged.
Foreign securities also have risks related to economic and political developments abroad, including expropriations, confiscatory taxation, exchange control regulation, limitations on the use or transfer of Portfolio assets and any effects of foreign social, economic or political instability. Foreign companies, in general, are not subject to the regulatory requirements of U.S. companies and, as such, there may be less publicly available information about these companies. Moreover, foreign accounting, auditing and financial reporting standards generally are different from those applicable to U.S. companies. Finally, in the event of a default of any foreign debt obligations, it may be more difficult for the Fund to obtain or enforce a judgment against the issuers of the securities.
Securities of foreign issuers may be less liquid than comparable securities of U.S. issuers and, as such, their price changes may be more volatile. In addition, the prices of such securities may be susceptible to influence by large traders, due to the limited size of many foreign securities markets. Moreover, investments in certain foreign markets, which have historically been considered stable, may become more volatile and subject to increased risk due to ongoing developments and changing conditions in such markets. Also, the growing interconnectivity of global economies and financial markets has increased the probability that adverse developments and conditions in one country or region will affect the stability of economies and financial markets in other countries or regions. Furthermore, foreign exchanges and broker-dealers are generally subject to less government and exchange scrutiny and regulation than their U.S. counterparts. In addition, differences in clearance and settlement procedures in foreign markets may cause delays in settlement of the Portfolio's trades effected in those markets and could result in losses to the Portfolio due to subsequent declines in the value of the securities subject to the trades.
The foreign securities in which the Portfolio may invest may be issued by issuers located in emerging market or developing countries. Compared to the United States and other developed countries, emerging market or developing countries may have relatively unstable governments, economies based on only a few industries and securities markets that trade a small number of securities. Securities issued by companies located in these countries tend to be especially volatile and may be less liquid than securities traded in developed countries. In the past, securities in these countries have been characterized by greater potential loss than securities of companies located in developed countries.
SDIS — The Global Infrastructure Portfolio
7
Depositary receipts involve many of the same risks as those associated with direct investment in foreign securities. In addition, the underlying issuers of certain depositary receipts, particularly unsponsored or unregistered depositary receipts, are under no obligation to distribute shareholder communications to the holders of such receipts, or to pass through to them any voting rights with respect to the deposited securities.
Other Risks. The performance of the Portfolio also will depend on whether or not the Adviser and/or Sub-Advisers are successful in applying the Portfolio's investment strategies. The Portfolio is also subject to other risks from its permissible investments, including the risks associated with its investments in convertible securities (discussed above), fixed-income securities, including junk bonds, U.S. government securities, asset-backed securities and REITs and foreign real estate companies. For more information about these risks, see the "Additional Risk Information" section.
ADDITIONAL RISK INFORMATION
This section provides additional information relating to the risks of investing in the Portfolio.
Fixed-Income Securities. Fixed-income securities are subject to the risk of the issuer's inability to meet principal and interest payments on its obligations (i.e., credit risk) and are subject to price volatility resulting from, among other things, interest rate sensitivity, market perception of the creditworthiness of the issuer and general market liquidity (i.e., market risk). The Portfolio is not limited as to the maturities of the securities in which it may invest. Securities with longer durations are likely to be more sensitive to changes in interest rates, generally making them more volatile than securities with shorter durations. Zero coupon securities (which are purchased at a discount and generally accrue interest, but make no payments until maturity) are typically subject to greater price fluctuations than comparable securities that pay current interest. The Portfolio may invest up to 5% of its net assets in fixed-income securities rated below investment grade and these investments may have speculative characteristics. Lower rated fixed-income securities have greater volatility because there is less certainty that principal and interest payments will be made as scheduled.
U.S. Government Securities. U.S. government securities are subject to market and interest rate risk, as well as varying degrees of credit risk. Some U.S. government securities are issued or guaranteed by the U.S. Treasury and are supported by the full faith and credit of the United States (but not issued by the U.S. Treasury). These securities may have less credit risk than U.S. government securities not supported by the full faith and credit of the United States. With respect to U.S. government securities that are not backed by the full faith and credit of the United States, there is a risk that the U.S. Government will not provide financial support to such U.S. government agencies, instrumentalities or sponsored entities if it is not obligated to do so by law.
Asset-Backed Securities. Asset-backed securities involve the risk that various federal and state consumer laws and other legal and economic factors may result in the collateral backing the securities being insufficient to support payment on the securities. Asset-backed securities generally decrease in value as a result of interest rate increases, but may benefit less than other fixed-income securities from declining interest rates, principally because of prepayments. Prepayments may increase during a period of declining interest rates although other factors, such as changes in power usage or alternative power generation, may also influence prepayment rates.
REITs and Foreign Real Estate Companies. REITs and foreign real estate companies generally derive their income from rents on the underlying properties or interest on the underlying loans, and their value is impacted by changes in the value of the underlying property or changes in interest rates affecting the underlying loans owned by the REITs and/or foreign real estate companies. REITs and foreign real estate companies are more susceptible to risks associated with the ownership of real estate and the real estate industry in general. These risks can include fluctuations in the value of underlying properties; defaults by borrowers or tenants; market saturation; changes in general and local economic conditions; decreases in market rates for rents; increases in competition, property taxes, capital expenditures or operating expenses; and other economic, political or regulatory occurrences affecting the real estate industry. In addition, REITs and foreign real estate companies depend upon specialized
SDIS — The Global Infrastructure Portfolio
8
management skills, may not be diversified (which may increase the volatility of a REIT's and/or foreign real estate company's value), may have less trading volume and may be subject to more abrupt or erratic price movements than the overall securities market. Foreign real estate companies may be subject to laws, rules and regulations governing those entities and their failure to comply with those laws, rules and regulations could negatively impact the performance of those entities. Operating REITs and foreign real estate companies requires specialized management skills and the Portfolio indirectly bears REIT and foreign real estate company management expenses along with the direct expenses of the Portfolio. REITs are not taxed on income distributed to shareholders provided they comply with several requirements of the Internal Revenue Code of 1986, as amended (the "Code"). REITs are subject to the risk of failing to qualify for tax-free pass-through income under the Code.
FUND MANAGEMENT
MORGAN STANLEY INVESTMENT MANAGEMENT INC.
The Adviser, together with its affiliated asset management companies, had approximately $338.2 billion in assets under management or supervision as of December 31, 2012.
The Fund has retained the Adviser — Morgan Stanley Investment Management Inc. — to provide investment advisory services. The Adviser is a wholly-owned subsidiary of Morgan Stanley (NYSE: "MS"), a preeminent global financial services firm engaged in securities trading and brokerage activities, as well as providing investment banking, research and analysis, financing and financial advisory services. The Adviser's address is 522 Fifth Avenue, New York, NY 10036.
The Adviser has entered into sub-advisory agreements with the Sub-Advisers — Morgan Stanley Investment Management Limited ("MSIM Limited") and Morgan Stanley Investment Management Company ("MSIM Company"). The Sub-Advisers are wholly owned subsidiaries of Morgan Stanley. The Sub-Advisers provide the Portfolio with investment advisory services subject to the overall supervision of the Adviser and the Fund's Officers and Trustees. The Adviser pays MSIM Limited and MSIM Company on a monthly basis a portion of the net advisory fees the Adviser receives from the Portfolio. MSIM Limited's address is 25 Cabot Square, Canary Wharf, London, E14 4QA, England and MSIM Company's address is 23 Church Street, 16-01 Capital Square, Singapore 049481.
The Portfolio is managed by members of the Global Infrastructure Securities team. Current members of the team jointly and primarily responsible for the day-to-day management of the Portfolio are Theodore R. Bigman and Matthew King.
Mr. Bigman has been associated with the Adviser in an investment management capacity since 1995. Mr. King has been associated with the Adviser in an investment management capacity since 2008. Prior to 2008, Mr. King worked for Bear Stearns in a variety of roles, including investment banking, capital markets and research during which time he provided research and analytical support for a number of infrastructure-related financings.
As lead portfolio manager, Mr. Bigman, together with co-portfolio manager Mr. King, determine the investment strategy, establishes asset-allocation frameworks and directs the implementation of investment strategy.
The Fund's Statement of Additional Information ("SAI") provides additional information about the portfolio managers' compensation structure, other accounts managed by the portfolio managers and the portfolio managers' ownership of securities in the Portfolio.
The composition of the team may change from time to time.
SDIS — The Global Infrastructure Portfolio
9
The Portfolio pays the Adviser a monthly advisory fee as full compensation for the services and facilities furnished to the Portfolio, and for Portfolio expenses assumed by the Adviser. The fee is based on the Portfolio's average daily net assets. For the fiscal year ended December 31, 2012, the Portfolio paid total investment advisory compensation (net of affiliated rebates, if applicable) amounting to 0.57% of the Portfolio's average daily net assets.
A discussion regarding the Board of Trustees' approval of the investment advisory agreement and the sub-advisory agreements are available in the Fund's semiannual report to shareholders for the period ended June 30, 2012.
SDIS — The Global Infrastructure Portfolio
10
Shareholder Information
PURCHASES AND SALES OF PORTFOLIO SHARES
Shares are offered on each day that the New York Stock Exchange ("NYSE") is open for business. The Portfolio offers its shares only to insurance company separate accounts that insurance companies establish to fund variable life insurance and/or variable annuity contracts. An insurance company purchases or redeems shares of the Portfolio based on, among other things, the amount of net contract premiums or purchase payments allocated to a separate account investment division, transfers to or from a separate account investment division, contract loans and repayments, contract withdrawals and surrenders, and benefit payments. The contract prospectus describes how contract owners may allocate, transfer and withdraw amounts to and from separate accounts.
The Portfolio currently does not foresee any disadvantages to variable product contract owners arising out of the fact that the Portfolio offers its shares to separate accounts of various insurance companies that offer variable life insurance and/or variable annuity products. Nevertheless, the Board of Trustees that oversees the Portfolio intends to monitor events to identify any material irreconcilable conflicts that may arise due to these arrangements and to determine what action, if any, should be taken in response.
If the Adviser determines that it is in the best interest of the Portfolio not to pay redemption proceeds in cash, and subject to applicable agreements with life insurance companies and other qualified investors, the Portfolio may pay a portion or all of a redemption by distributing securities held by the Portfolio. Such in-kind securities may be illiquid and difficult or impossible to sell at a time and at a price that a shareholder would like. In addition, shareholders receiving distributions in-kind may incur brokerage costs when subsequently selling shares of those securities.
FREQUENT PURCHASES AND REDEMPTIONS OF SHARES
Frequent purchases and redemptions of shares pursuant to the instructions of insurance company contract owners are referred to as "market-timing" or "short-term trading" and may present risks for other contract owners with long-term interests in the Portfolio, which may include, among other things, dilution in the value of the Portfolio's shares indirectly held by contract owners with long-term interests in the Portfolio, interference with the efficient management of the Portfolio, increased brokerage and administrative costs and forcing the Portfolio to hold excess levels of cash.
In addition, the Portfolio is subject to the risk that market-timers and/or short-term traders may take advantage of time zone differences between the foreign markets on which the Portfolio's securities trade and the time the Portfolio's net asset value is calculated ("time-zone arbitrage"). For example, a market-timer may submit instructions for the purchase of shares of the Portfolio based on events occurring after foreign market closing prices are established, but before the Portfolio's net asset value calculation that are likely to result in higher prices in foreign markets the following day. The market-timer would submit instructions to redeem the Portfolio's shares the next day, when the Portfolio's share price would reflect the increased prices in foreign markets for a quick profit at the expense of contract owners or participants with long-term interests in the Portfolio.
Investments in other types of securities also may be susceptible to short-term trading strategies. These investments include securities that are, among other things, thinly traded, traded infrequently, or relatively illiquid, which have the risk that the current market price for the securities may not accurately reflect current market values. A contract owner may seek to engage in short-term trading to take advantage of these pricing differences (referred to as "price arbitrage"). Investments in certain fixed-income securities, such as junk bonds, may be adversely affected by price arbitrage trading strategies.
The Portfolio's policies with respect to valuing portfolio securities are described below in the "Pricing Portfolio Shares" section.
The Fund's Board of Trustees has adopted policies and procedures to discourage frequent purchases and redemptions of Portfolio shares by Portfolio shareholders. Insurance companies generally do not provide specific contract owner transaction instructions to the Portfolio on an ongoing basis. Therefore, to some extent, the Portfolio relies on the insurance companies to monitor frequent short-term trading by contract owners. However, the Portfolio or the Distributor has entered into agreements with insurance companies whereby the insurance companies are required to provide certain contract owner identification and transaction information upon the Portfolio's request. The Portfolio may use this information to help identify and prevent
SDIS — The Global Infrastructure Portfolio
11
market-timing activity in the Portfolio. There can be no assurance that the Portfolio will be able to identify or prevent all market-timing activity.
If the Portfolio identifies suspected market-timing activity, the insurance company will be contacted and asked to take steps to prevent further market-timing activity (e.g., sending warning letters or blocking frequent trading by underlying contract owners). Insurance companies may be prohibited by the terms of the underlying insurance contract from restricting short-term trading of mutual fund shares by contract owners, thereby limiting the ability of such insurance company to implement remedial steps to prevent market-timing activity in the Portfolio. If the insurance company is unwilling or unable to take remedial steps to discourage or prevent frequent trading, or does not take action promptly, certain contract owners may be able to engage in frequent trading to the detriment of contract owners with long-term interests in the Portfolio. If the insurance company refuses to take remedial action, or takes action that the Portfolio deems insufficient, a determination will be made whether it is appropriate to terminate the relationship with such insurance company.
PRICING PORTFOLIO SHARES
The price of shares of the Portfolio, called "net asset value," is based on the value of its portfolio securities.
The net asset value per share of the Portfolio is determined once daily at the NYSE close (normally 4:00 p.m. Eastern time) on each day that the NYSE is open. Shares will not be priced on days that the NYSE is closed.
The value of the Portfolio's securities is based on the securities' market price when available. When a market price is not readily available, including circumstances under which the Adviser and/or Sub-Advisers determine that a security's market price is not accurate, a portfolio security is valued at its fair value, as determined under procedures established by the Fund's Board of Trustees.
In addition, with respect to securities that primarily are listed on foreign exchanges, when an event occurs after the close of such exchanges that is likely to have changed the value of the securities (e.g., a percentage change in value of one or more U.S. securities indices in excess of specified thresholds), such securities will be valued at their fair value, as determined under procedures established by the Fund's Board of Trustees. Securities also may be fair valued in the event of a significant development affecting a country or region or an issuer-specific development which is likely to have changed the value of the security. In these cases, the Portfolio's net asset value will reflect certain portfolio securities' fair value rather than their market price. Fair value pricing involves subjective judgment and it is possible that the fair value determined for a security is materially different than the value that could be realized upon the sale of that security. With respect to securities that are primarily listed on foreign exchanges, the value of the Portfolio's securities may change on days when shareholders will not be able to purchase or sell their shares.
To the extent the Portfolio invests in open-end management companies that are registered under the Investment Company Act of 1940, as amended, the Portfolio's net asset value is calculated based upon the net asset value of such funds. The prospectuses for such funds explain the circumstances under which they will use fair value pricing and its effects.
An exception to the general policy of using market prices concerns the Portfolio's short-term debt portfolio securities. Debt securities with remaining maturities of 60 days or less at the time of purchase are valued at amortized cost. However, if the cost does not reflect the securities' market value, these securities will be valued at their fair value.
DISTRIBUTIONS
The Portfolio passes substantially all of its earnings from income and capital gains along to its investors as "distributions." The Portfolio earns income from stocks and interest from fixed-income investments. These amounts are passed along to Portfolio shareholders as "income dividend distributions." The Portfolio realizes capital gains whenever it sells securities for a higher price than it paid for them. These amounts may be passed along as "capital gains distributions."
Dividends from net investment income and capital gains distributions, if any, are declared and paid at least once per year.
SDIS — The Global Infrastructure Portfolio
12
TAX CONSEQUENCES
For information concerning the federal income tax consequences to holders of the underlying variable annuity or variable life insurance contracts, see the accompanying contract prospectus.
PORTFOLIO HOLDINGS INFORMATION
A description of the Fund's policies and procedures with respect to the disclosure of the Portfolio's securities is available in the Fund's SAI.
ADDITIONAL INFORMATION
The Adviser, the Sub-Advisers and/or the Distributor may pay compensation (out of their own funds and not as an expense of the Portfolio) to certain affiliated or unaffiliated broker-dealers or other financial intermediaries or service providers, including insurance companies and their affiliates, in connection with the sale, distribution, marketing or retention of Portfolio shares and/or shareholder servicing. Such compensation may be significant in amount and the prospect of receiving any such additional compensation may provide such affiliated or unaffiliated entities with an incentive to favor sales of shares of the Portfolio over other investment options. Any such payments will not change the net asset value or the price of the Portfolio's shares. For more information, please see the Fund's SAI.
SDIS — The Global Infrastructure Portfolio
13
The financial highlights table is intended to help you understand the financial performance of the Portfolio's Class X shares for the periods indicated. Certain information reflects financial results for a single Portfolio share throughout each period. The total returns in the table represent the rate an investor would have earned or lost on an investment in the Portfolio (assuming reinvestment of all dividends and distributions). The ratio of expenses to average net assets listed in the table below is based on the average net assets of the Portfolio for each of the periods listed in the table. To the extent that the Portfolio's average net assets decrease over the Portfolio's next fiscal year, such expense ratios can be expected to increase, potentially significantly, because certain fixed costs will be spread over a smaller amount of assets.
The information for the years ended December 31, 2012 and December 31, 2011 has been audited by Ernst & Young LLP, an independent registered public accounting firm, whose report, along with the Portfolio's financial statements, are incorporated by reference in the SAI from the Fund's annual report, which is available upon request. The financial highlights for each of the years in the three-year period ended December 31, 2010 have been audited by another independent registered public accounting firm.
Further information about the performance of the Portfolio is contained in its annual report and semiannual report to shareholders. See the accompanying contract prospectus for either the variable annuity or the variable life contract issued by your insurance company for a description of charges, which are applicable thereto. These charges are not reflected in the financial highlights below. Inclusion of any of these charges would reduce the total return figures for all periods shown.
For the Year Ended December 31, | | 2012 | | 2011 | | 2010^ | | 2009^ | | 2008^ | |
Selected Per Share Data: | |
Net asset value beginning of period | | $ | 23.72 | | | $ | 22.45 | | | $ | 22.68 | | | $ | 19.83 | | | $ | 29.77 | | |
Net investment income(a) | | | 0.55 | | | | 0.52 | | | | 0.56 | | | | 0.54 | | | | 0.58 | | |
Net realized and unrealized gain (loss) | | | 3.44 | | | | 2.95 | | | | 0.72 | | | | 3.00 | | | | (10.37 | ) | |
Total from investment operations | | | 3.99 | | | | 3.47 | | | | 1.28 | | | | 3.54 | | | | (9.79 | ) | |
Dividends to shareholders | | | (0.57 | ) | | | (0.69 | ) | | | (0.53 | ) | | | (0.69 | ) | | | (0.15 | ) | |
Distributions to shareholders | | | (2.36 | ) | | | (1.51 | ) | | | (0.98 | ) | | | — | | | | — | | |
Total dividends and distributions | | | (2.93 | ) | | | (2.20 | ) | | | (1.51 | ) | | | (0.69 | ) | | | (0.15 | ) | |
Net asset value end of period | | $ | 24.78 | | | $ | 23.72 | | | $ | 22.45 | | | $ | 22.68 | | | $ | 19.83 | | |
Total Return(b) | | | 18.14 | % | | | 15.81 | % | | | 7.13 | % | | | 18.47 | % | | | (33.02 | )% | |
Ratios to Average Net Assets:(c) | |
Expenses | | | 1.11 | %(d) | | | 1.10 | %(d) | | | 0.93 | %(d) | | | 1.42 | %(d) | | | 0.84 | %(d) | |
Net investment income | | | 2.27 | %(d) | | | 2.26 | %(d) | | | 2.66 | %(d) | | | 2.75 | %(d) | | | 2.28 | %(d) | |
Rebate from Morgan Stanley affiliate | | | 0.00 | %(e) | | | 0.00 | %(e) | | | 0.00 | %(e) | | | 0.00 | %(e) | | | 0.00 | %(e) | |
Supplemental Data: | |
Net assets end of period (000's) | | $ | 19,121 | | | $ | 20,282 | | | $ | 21,843 | | | $ | 24,953 | | | $ | 26,297 | | |
Portfolio turnover rate | | | 28 | % | | | 36 | % | | | 148 | % | | | 279 | % | | | 77 | % | |
^ Beginning with the year ended December 31, 2011, the Fund was audited by Ernst & Young LLP. The previous years were audited by another independent registered public accounting firm.
(a) The per share amounts were computed using an average number of shares outstanding during the period.
(b) Calculated based on the net asset value as of the last business day of the period. Performance shown does not reflect fees and expenses imposed by your insurance company. If performance information included the effect of these charges, the total returns would be lower.
(c) Reflects overall Portfolio ratios for investment income and non-class specific expenses.
(d) The ratios reflect the rebate of certain Portfolio expenses in connection with investments in a Morgan Stanley affiliate during the period. The effect of the rebate on the ratios is disclosed in the above table as "Rebate from Morgan Stanley affiliate."
(e) Amount is less than 0.005%.
SDIS — The Global Infrastructure Portfolio
14
Morgan Stanley
Select Dimensions Investment Series

ADDITIONAL INFORMATION ABOUT THE PORTFOLIO'S INVESTMENTS is available in the Fund's Annual and Semiannual Reports to Shareholders. In the Fund's Annual Report, you will find a discussion of the market conditions and investment strategies that significantly affected the Portfolio's performance during its last fiscal year. The Fund's Statement of Additional Information also provides additional information about the Portfolio. The Statement of Additional Information is incorporated herein by reference (legally is part of this Prospectus). For a free copy of the Fund's Annual Report, Semiannual Report or Statement of Additional Information, to request other information about the Portfolio or to make shareholder inquiries, please call toll-free (800) 869-NEWS. Free copies of these documents are also available from our Internet site at: www.morganstanley.com/im.

YOU ALSO MAY OBTAIN INFORMATION ABOUT THE FUND BY CALLING your Morgan Stanley Financial Advisor or by visiting our Internet site.

INFORMATION ABOUT THE FUND (including the Statement of Additional Information) can be viewed and copied at the SEC Public Reference Room in Washington, D.C. Information on the operation of the Public Reference Room may be obtained by calling the SEC at (202) 551-8090. Reports and other information about the Fund and the Portfolio are available on the EDGAR Database on the SEC's Internet site at: http://www.sec.gov, and copies of this information may be obtained, after paying a duplicating fee, by electronic request at the following E-mail address: publicinfo@sec.gov, or by writing to the SEC's Public Reference Section, Washington, D.C. 20549-1520.
(THE FUND'S INVESTMENT COMPANY ACT FILE NO. IS 811-7185)
PROSPECTUS n APRIL 30, 2013

SELECT DIMENSIONS INVESTMENT SERIES
THE GLOBAL INFRASTRUCTURE PORTFOLIO
Class Y
Morgan Stanley Select Dimensions Investment Series is a mutual fund comprised of seven separate portfolios, each with its own distinct investment objective(s) and policies. In this Prospectus, shares of the Global Infrastructure Portfolio (the "Portfolio") are being offered.
Shares of the Portfolio are sold exclusively to certain life insurance companies in connection with particular variable life insurance and/or variable annuity contracts they issue. The insurance companies invest in shares of the Portfolio in accordance with instructions received from owners of the variable life insurance or variable annuity contracts.
This Prospectus must be accompanied by a current prospectus for the variable life insurance and/or variable annuity contract issued by your life insurance company.
The Securities and Exchange Commission ("SEC") has not approved or disapproved these securities or passed upon
the adequacy of this Prospectus. Any representation to the contrary is a criminal offense.
Contents
Portfolio Summary | | INVESTMENT OBJECTIVE | | | 1 | | |
| | | FEES AND EXPENSES OF THE PORTFOLIO | | | 1 | | |
| | | PORTFOLIO TURNOVER | | | 1 | | |
| | | PRINCIPAL INVESTMENT STRATEGIES | | | 1 | | |
| | | PRINCIPAL RISKS | | | 2 | | |
| | | PAST PERFORMANCE | | | 2 | | |
| | FUND MANAGEMENT | | | 3 | | |
| | | PURCHASE AND SALE OF PORTFOLIO SHARES | | | 3 | | |
| | | TAX INFORMATION | | | 3 | | |
| | | PAYMENTS TO INSURANCE COMPANIES AND OTHER FINANCIAL INTERMEDIARIES | | | 3 | | |
Portfolio Details | | ADDITIONAL INFORMATION ABOUT THE PORTFOLIO'S INVESTMENT OBJECTIVE,
STRATEGIES AND RISKS | | | 4 | | |
| | FUND MANAGEMENT | | | 9 | | |
Shareholder Information | | PURCHASES AND SALES OF PORTFOLIO SHARES | | | 11 | | |
| | | FREQUENT PURCHASES AND REDEMPTIONS OF SHARES | | | 11 | | |
| | | PRICING PORTFOLIO SHARES | | | 12 | | |
| | | | | PLAN OF DISTRIBUTION | | | 12 | | |
| | | DISTRIBUTIONS | | | 13 | | |
| | | TAX CONSEQUENCES | | | 13 | | |
| | | PORTFOLIO HOLDINGS INFORMATION | | | 13 | | |
| | | ADDITIONAL INFORMATION | | | 13 | | |
Financial Highlights | | | | | 14 | | |
This Prospectus contains important information about the Global Infrastructure Portfolio and the Morgan Stanley Select Dimensions Investment Series. Please read it carefully and keep it for future reference.
Investment Objective
The Portfolio seeks both capital appreciation and current income.
Fees and Expenses of the Portfolio
The table below describes the fees and expenses that you may pay if you buy and hold Class Y shares of the Portfolio. Total Annual Portfolio Operating Expenses in the table and the Example below do not reflect the impact of any charges by your insurance company. If they did, expenses would be higher.
Annual Portfolio Operating Expenses
(expenses that you pay each year as a percentage of the value of your investment)
Advisory Fee | | | 0.57 | % | |
Distribution and/or Shareholder Service (12b-1) Fee | | | 0.25 | % | |
Other Expenses | | | 0.54 | % | |
Total Annual Portfolio Operating Expenses | | | 1.36 | % | |
Example
The example below is intended to help you compare the cost of investing in the Portfolio with the cost of investing in other mutual funds.
The example assumes that you invest $10,000 in the Portfolio, your investment has a 5% return each year, and the Portfolio's operating expenses remain the same. Although your actual costs may be higher or lower, based on these assumptions your costs would be:
| | | Expenses Over Time | |
| | | 1 Year | | 3 Years | | 5 Years | | 10 Years | |
| | | | | $ | 138 | | | $ | 431 | | | $ | 745 | | | $ | 1,635 | | |
Portfolio Turnover
The Portfolio pays transaction costs, such as commissions, when it buys and sells securities (or "turns over" its portfolio). A higher portfolio turnover rate may indicate higher transaction costs. These costs, which are not reflected in Total Annual Portfolio Operating Expenses or in the Example, affect the Portfolio's performance. During the most recent fiscal year, the Portfolio's portfolio turnover rate was 28% of the average value of its portfolio.
Principal Investment Strategies
The Portfolio will normally invest at least 80% of its assets in equity securities issued by companies located throughout the world that are engaged in the infrastructure business. A company will be considered to be in the infrastructure business if it derives at least 50% of its revenues or earnings from, or devotes at least 50% of its assets to, infrastructure-related activities. Infrastructure refers to the systems and networks of energy, transportation, communication and other services required for the normal function of society. The Portfolio may invest up to 100% of its net assets in foreign securities, which may include emerging market securities. Under normal market conditions, the Portfolio invests at least 40% of its assets in the securities of issuers located outside of the United States. The Portfolio's equity investments may include convertible securities.
The Portfolio's "Adviser," Morgan Stanley Investment Management Inc., and/or "Sub-Advisers," Morgan Stanley Investment Management Limited and Morgan Stanley Investment Management Company, will shift the Portfolio's assets between the different types of companies in the infrastructure business described above based on relative valuation, underlying company fundamentals, and demographic and macroeconomic considerations. Utility companies represent a significant component of the universe of companies engaged in the infrastructure business. These companies may include traditionally regulated public utilities or fully or partially deregulated utility companies as well as unregulated utility companies. The Portfolio has a fundamental policy (i.e., one that cannot be changed without shareholder approval) of investing 25% or more of its assets in the utilities industry.
In selecting securities to buy, hold or sell for the Portfolio, the Adviser and/or Sub-Advisers actively manage the portfolio using a combination of bottom-up and top-down methodologies. The value-driven approach to bottom-up security selection utilizes proprietary research models to identify infrastructure companies that offer the best value relative to their underlying assets and growth prospects. The top-down allocation provides diversified exposure to major economic infrastructure sectors and countries, with an overweighting to those sectors/countries that offer the best relative valuation.
SDIS — The Global Infrastructure Portfolio
1
Principal Risks
There is no assurance that the Portfolio will achieve its investment objective and you can lose money investing in this Portfolio. The principal risks of investing in the Portfolio include:
• Infrastructure-Related Companies. Because the Portfolio concentrates its investments in infrastructure-related companies, the Portfolio has greater exposure to the potential adverse economic, regulatory, political and other changes affecting such entities. Infrastructure-related companies are subject to a variety of factors that may adversely affect their business or operations including high interest costs in connection with capital construction programs, costs associated with compliance with and changes in environmental and other regulations, difficulty in raising capital in adequate amounts on reasonable terms in periods of high inflation and unsettled capital markets, the effects of surplus capacity, increased competition from other providers of services in a developing deregulatory environment, uncertainties concerning the availability of fuel at reasonable prices, the effects of energy conservation policies and other factors.
Other factors that may affect the operations of infrastructure-related companies include innovations in technology, significant changes to the number of ultimate end-users of a company's products, increased susceptibility to terrorist acts or political actions, risks of environmental damage due to a company's operations or an accident, and general changes in market sentiment towards infrastructure and utilities assets.
• Utilities Industry. Changing regulation constitutes one of the key industry-specific risks for the Portfolio. State and other regulators often monitor and control utility revenues and costs. Regulatory authorities also may restrict a company's access to new markets. The deregulation of certain utilities companies may subject these companies to greater risks of loss. Individual sectors of the utility market are subject to additional risks. These risks apply to all utility companies—regulated, fully or partially deregulated and unregulated.
Certain utilities companies may incur unexpected increases in fuel and other operating costs. They are adversely affected when long-term interest rates rise. Long-term borrowings are used to finance most utility investments, and rising interest rates lead to higher financing costs and reduced earnings. There are also considerable costs associated with environmental compliance, nuclear waste clean-up and safety regulation. Increasingly, regulators are calling upon electric utilities to bear these added costs, and there is a risk that these costs will not be fully recovered through an increase in revenues.
• Common Stock and Other Equity Securities. In general, common stock and other equity security values fluctuate, and sometimes widely fluctuate, in response to activities specific to the issuer of the security as well as factors unrelated to the fundamental condition of the issuer, including general market, economic and political conditions. To the extent that the
Portfolio invests in convertible securities, and the convertible security's investment value is greater than its conversion value, its price will be likely to increase when interest rates fall and decrease when interest rates rise. If the conversion value exceeds the investment value, the price of the convertible security will tend to fluctuate directly with the price of the underlying equity security. The Portfolio's emphasis on industries may cause its performance to be more sensitive to developments affecting particular industries than a fund that places primary emphasis on individual companies.
• Small and Medium Capitalization Companies. Investments in small and medium capitalization companies may involve greater risks than investments in larger, more established companies. The securities issued by small and medium capitalization companies may be less liquid, and such companies may have more limited markets, financial resources and product lines, and may lack the depth of management of larger companies.
• Foreign and Emerging Market Securities. Investments in foreign markets entail special risks such as currency, political, economic and market risks. There also may be greater market volatility, less reliable financial information, higher transaction and custody costs, decreased market liquidity and less government and exchange regulation associated with investments in foreign markets. In addition, investments in certain foreign markets, which have historically been considered stable, may become more volatile and subject to increased risk due to ongoing developments and changing conditions in such markets. Moreover, the growing interconnectivity of global economies and financial markets has increased the probability that adverse developments and conditions in one country or region will affect the stability of economies and financial markets in other countries or regions. The risks of investing in emerging market countries are greater than risks associated with investments in foreign developed countries.
Shares of the Portfolio are not bank deposits and are not guaranteed or insured by the Federal Deposit Insurance Corporation or any other government agency.
Past Performance
The bar chart and table below provide some indication of the risks of investing in the Portfolio by showing changes in the performance of the Portfolio's Class Y shares from year-to-year and by showing how the average annual returns of the Portfolio's Class Y shares for the one, five and 10 year periods compare with a broad measure of market performance, as well as a comparative sector index, over time. This performance information does not include the impact of any charges deducted by your insurance company. If it did, returns would be lower. The Portfolio's past performance does not indicate how the Portfolio will perform in the future.
SDIS — The Global Infrastructure Portfolio
2
Annual Total Returns—Calendar Years
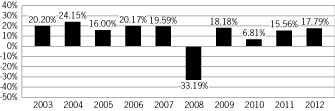
High Quarter | | 6/30/09: | | 20.83% | |
Low Quarter | | 9/30/08: | | –18.18% | |
Average Annual Total Returns For Periods Ended December 31, 2012
| | | Past
1 Year | | Past
5 Years | | Past
10 Years | |
Global Infrastructure Portfolio | | | 17.79 | % | | | 2.80 | % | | | 11.06 | % | |
Dow Jones Brookfield
Global Infrastructure IndexSM
(reflects no deduction for fees,
expenses or taxes)1 | | | 16.01 | % | | | 4.86 | % | | | 14.38 | % | |
S&P Global BMI Index
(reflects no deduction for fees,
expenses or taxes)2 | | | 17.15 | % | | | –0.26 | % | | | 9.31 | % | |
(1) The Dow Jones Brookfield Global Infrastructure IndexSM is a float-adjusted market capitalization weighted index that measures the stock performance of companies that exhibit strong infrastructure characteristics. The Index intends to measure all sectors of the infrastructure market. The Index was first published in July 2008; however, back-tested hypothetical performance information is available for this Index since December 31, 2002. Returns are calculated using the return data of the S&P Global BMI Index through December 31, 2002 and the return data of the Dow Jones Brookfield Global Infrastructure Index for periods thereafter. It is not possible to invest directly in an index.
(2) The Standard & Poor's Global BMI Index (S&P Global BMI Index) is a broad market index designed to capture exposure to equities in all countries in the world that meet minimum size and liquidity requirements. As of the date of this Prospectus, there are approximately 11,000 index members representing 26 developed and 20 emerging market countries. It is not possible to invest directly in an index.
Fund Management
Adviser. Morgan Stanley Investment Management Inc.
Sub-Advisers. Morgan Stanley Investment Management Limited and Morgan Stanley Investment Management Company.
Portfolio Managers. The Portfolio is managed by members of the Global Infrastructure Securities team. Information about the members jointly and primarily responsible for the day-to-day management of the Portfolio is shown below:
Name | | Title with Adviser | | Date Began
Managing Portfolio | |
Theodore R. Bigman | | Managing Director | | March 2010 | |
Matthew King | | Executive Director | | March 2010 | |
Purchase and Sale of Portfolio Shares
This Prospectus offers Class Y shares of the Global Infrastructure Portfolio. The Portfolio also offers Class X shares of the Portfolio through a separate prospectus. Class X shares are subject to different expenses. For eligibility information, contact your insurance company.
Portfolio shares will be sold at the next price calculated after we receive the redemption request on your behalf.
The Portfolio offers its shares only to insurance companies' separate accounts that insurance companies establish to fund variable life insurance and/or variable annuity contracts. An insurance company purchases or redeems shares of the Portfolio based on, among other things, the amount of net contract premiums or purchase payments allocated to a separate account investment division, transfers to or from a separate account investment division, contract loans and repayments, contract withdrawals and surrenders, and benefit payments. The contract prospectus describes how contract owners may allocate, transfer and withdraw amounts to, and from, separate accounts.
For more information, please refer to the "Shareholder Information—Purchases and Sales of Portfolio Shares" section of this Prospectus.
Tax Information
Special tax rules apply to life insurance companies, variable annuity contracts and variable life insurance contracts. For information on federal income taxation of a life insurance company with respect to its receipt of distributions from the Portfolio and federal income taxation of owners of variable annuity or variable life insurance contracts, see the accompanying contract prospectus.
Payments to Insurance Companies and
Other Financial Intermediaries
If you purchase the Portfolio through an insurance company or other financial intermediary (such as a bank), the Adviser and/or the Portfolio's "Distributor," Morgan Stanley Distribution, Inc., may pay the intermediary for the sale of Portfolio shares and related services. These payments, which may be significant in amount, may create a conflict of interest by influencing the insurance company or other intermediary and your salesperson to recommend one variable annuity contract over another or be a factor in an insurance company's decision to include the Portfolio as an underlying investment option in its variable insurance products. Ask your salesperson or visit your insurance company's or other intermediary's web site for more information.
SDIS — The Global Infrastructure Portfolio
3
Portfolio Details
ADDITIONAL INFORMATION ABOUT THE PORTFOLIO'S INVESTMENT OBJECTIVE, STRATEGIES AND RISKS
INVESTMENT OBJECTIVE
The Portfolio seeks both capital appreciation and current income.
PRINCIPAL INVESTMENT STRATEGIES
GROWTH & INCOME
An investment objective having the goal of selecting securities with the potential to rise in price and pay out income.
The Portfolio will normally invest at least 80% of its assets in equity securities issued by companies located throughout the world that are engaged in the infrastructure business. A company will be considered to be in the infrastructure business if it derives at least 50% of its revenues or earnings from, or devotes at least 50% of its assets to, infrastructure-related activities. Infrastructure refers to the systems and networks of energy, transportation, communication and other services required for the normal function of society. Companies in the infrastructure business may be involved in, among other areas, the transmission and distribution of electric energy; the storage, transportation and distribution of natural resources, such as natural gas, used to produce energy; the building, operation and maintenance of highways, toll roads, tunnels, bridges and parking lots; the building, operation and maintenance of airports and ports, railroads and mass transit systems; telecommunications; water treatment and distribution; and other emerging infrastructure sectors. The Portfolio's investments may include securities of small and medium capitalization companies. The Portfolio may invest up to 100% of its net assets in foreign securities, which may include emerging market securities. Under normal market conditions, the Portfolio invests at least 40% of its assets in the securities of issuers located outside of the United States. The Portfolio's equity investments may include convertible securities.
The Adviser and/or Sub-Advisers will shift the Portfolio's assets between the different types of companies in the infrastructure business described above based on relative valuation, underlying company fundamentals, and demographic and macroeconomic considerations. Utility companies represent a significant component of the universe of companies engaged in the infrastructure business. These companies may include traditionally regulated public utilities or fully or partially deregulated utility companies as well as unregulated utility companies. The Portfolio has a fundamental policy (i.e., one that cannot be changed without shareholder approval) of investing 25% or more of its assets in the utilities industry. Utilities companies are involved in, among other areas, gas and electric energy, water distribution, telecommunications, and other new or emerging technologies.
In selecting securities to buy, hold or sell for the Portfolio, the Adviser and/or Sub-Advisers actively manage the Portfolio using a combination of bottom-up and top-down methodologies. The value-driven approach to bottom-up security selection utilizes proprietary research models to identify infrastructure companies that offer the best value relative to their underlying assets and growth prospects. The top-down allocation provides diversified exposure to major economic infrastructure sectors and countries, with an overweighting to those sectors/countries that offer the best relative valuation. The Adviser and/or Sub-Advisers generally consider selling a portfolio holding when it determines that the holding is less attractive based on a number of factors, including changes in the holding's share price, earnings prospects relative to its peers and/or business prospects.
SDIS — The Global Infrastructure Portfolio
4
Common stock is a share ownership or equity interest in a corporation. It may or may not pay dividends, as some companies reinvest all of their profits back into their businesses, while others pay out some of their profits to shareholders as dividends. A depositary receipt is generally issued by a bank or financial institution and represents an ownership interest in the common stock or other equity securities of a foreign company.
Other Investments. The remaining 20% of the Portfolio's assets may be invested in fixed-income securities, equity securities of companies not engaged in the infrastructure business, U.S. government securities issued, or guaranteed as to principal and interest, by the U.S. Government or its agencies or instrumentalities and asset-backed securities. The Portfolio may invest in real estate investment trusts (commonly known as "REITs") and foreign real estate companies and convertible securities. The Portfolio may invest up to 5% of its assets in fixed-income securities and convertible securities rated below investment grade (commonly known as "junk bonds"). For more information, see the "Additional Investment Strategy Information" section.
In pursuing the Portfolio's investment objective, the Adviser and/or Sub-Advisers have considerable leeway in deciding which investments they buy, hold or sell on a day-to-day basis and which trading strategies they use. For example, the Adviser and/or Sub-Advisers in their discretion may determine to use some permitted trading strategies while not using others.
ADDITIONAL INVESTMENT STRATEGY INFORMATION
This section provides additional information relating to the Portfolio's investment strategies.
Fixed-Income Securities. Fixed-income securities include debt securities such as bonds, notes or commercial paper. The issuer of a debt security borrows money from the investor who buys the security. Most debt securities pay either fixed or adjustable rates of interest at regular intervals until they mature, at which point investors get their principal back. The Portfolio's fixed-income investments may include zero coupon securities, which are purchased at a discount and generally accrue interest, but make no payments until maturity.
U.S. Government Securities. The U.S. government securities that the Portfolio may purchase include U.S. Treasury bills, notes and bonds, all of which are direct obligations of the U.S. Government. In addition, the Portfolio may purchase securities issued by agencies and instrumentalities of the U.S. Government which are backed by the full faith and credit of the United States. The Portfolio may also purchase securities issued by agencies and instrumentalities which are not backed by the full faith and credit of the United States, but whose issuing agency or instrumentality has the right to borrow, to meet its obligations, from the U.S. Treasury. Further, the Portfolio may purchase securities issued by agencies and instrumentalities which are backed solely by the credit of the issuing agency or instrumentality.
Asset-Backed Securities. The Portfolio may invest in asset-backed securities. Asset-backed securities represent an interest in a pool of assets, such as a pool of power generation assets or other utility assets or utility-related assets that have been securitized in pass-through structures. These types of pass-through securities provide for monthly payments that are a "pass through" of the monthly interest and principal payments made by the individual borrowers on the pooled receivables.
REITs and Foreign Real Estate Companies. The Portfolio may invest in REITs and foreign real estate companies, which are similar to entities organized and operated as REITs in the United States. REITs and foreign real estate companies pool investors' funds for investments primarily in real estate properties or real estate-related loans. They may also include, among other businesses, real estate developers, brokers and operating companies whose products and services are significantly related to the real estate industry such as building suppliers and mortgage lenders.
Defensive Investing. The Portfolio may take temporary "defensive" positions in attempting to respond to adverse market, economic, political or other conditions. The Portfolio may invest any amount of its assets in cash, cash equivalents or other fixed-income securities in a defensive posture that may be inconsistent with its principal investment strategies when the Adviser and/or the Sub-Advisers believe it advisable to do so. Although taking a defensive posture is designed to protect the Portfolio from an anticipated market downturn, it could have the effect of reducing the benefit from any upswing in the market. When the Portfolio takes a defensive position, it may not achieve its investment objective.
* * *
SDIS — The Global Infrastructure Portfolio
5
The percentage limitations relating to the composition of the Portfolio apply at the time the Portfolio acquires an investment. Subsequent percentage changes that result from market fluctuations generally will not require the Portfolio to sell any portfolio security. However, the Portfolio may be required to reduce its borrowings, if any, in response to fluctuations in the value of such holdings. Except for the Portfolio's policy to concentrate its assets in the utilities industry, the Portfolio may change its principal investment strategies without shareholder approval; however, you would be notified of any changes.
PRINCIPAL RISKS
There is no assurance that the Portfolio will achieve its investment objective. The Portfolio's share price and return will fluctuate with changes in the market value of its portfolio securities. When you sell Portfolio shares, they may be worth less than what you paid for them and, accordingly, you can lose money investing in this Portfolio.
Infrastructure-Related Companies. Because the Portfolio concentrates its investments in infrastructure-related companies, the Portfolio has greater exposure to the potential adverse economic, regulatory, political and other changes affecting such entities. Infrastructure-related companies are subject to a variety of factors that may adversely affect their business or operations including high interest costs in connection with capital construction programs, costs associated with compliance with and changes in environmental and other regulations, difficulty in raising capital in adequate amounts on reasonable terms in periods of high inflation and unsettled capital markets, the effects of surplus capacity, increased competition from other providers of services in a developing deregulatory environment, uncertainties concerning the availability of fuel at reasonable prices, the effects of energy conservation policies and other factors. Additionally, infrastructure-related entities may be subject to regulation by various governmental authorities and may also be affected by governmental regulation of rates charged to customers, government budgetary constraints, service interruption due to environmental, operational or other mishaps and the imposition of special tariffs and changes in tax laws, regulatory policies and accounting standards.
Other factors that may affect the operations of infrastructure-related companies include innovations in technology that could render the way in which a company delivers a product or service obsolete, significant changes to the number of ultimate end-users of a company's products, increased susceptibility to terrorist acts or political actions, risks of environmental damage due to a company's operations or an accident, and general changes in market sentiment towards infrastructure and utilities assets.
Utilities Industry. The Portfolio's investments in the utilities industry are impacted by risks particular to that industry. Changing regulation constitutes one of the key industry-specific risks for the Portfolio. State and other regulators often monitor and control utility revenues and costs, and therefore may limit utility profits and dividends paid to investors. Regulatory authorities also may restrict a company's access to new markets, thereby diminishing the company's long-term prospects. The deregulation of certain utilities companies may subject these companies to greater risks of loss. Individual sectors of the utility market are subject to additional risks. These risks apply to all utility companies — regulated, fully or partially deregulated and unregulated.
Certain utilities companies may incur unexpected increases in fuel and other operating costs. They are adversely affected when long-term interest rates rise. Long-term borrowings are used to finance most utility investments, and rising interest rates lead to higher financing costs and reduced earnings. There are also considerable costs associated with environmental compliance, nuclear waste clean-up and safety regulation. Increasingly, regulators are calling upon electric utilities to bear these added costs, and there is a risk that these costs will not be fully recovered through an increase in revenues.
In the case of the water utility sector, the industry is highly fragmented, and most water supply companies find themselves in mature markets, although upgrading of fresh water and waste water systems is an expanding business.
Common Stock and Other Equity Securities. A principal risk of investing in the Portfolio is associated with its common stock and other equity investments. In general, common stock and other equity security prices can fluctuate, and sometimes
SDIS — The Global Infrastructure Portfolio
6
widely fluctuate, in response to activities specific to the issuer of the security as well as factors unrelated to the fundamental condition of the issuer, including general market, economic and political conditions.
Investments in convertible securities subject the Portfolio to the risks associated with both fixed-income securities and common stocks. To the extent that a convertible security's investment value is greater than its conversion value, its price will be likely to increase when interest rates fall and decrease when interest rates rise, as with a fixed-income security. If the conversion value exceeds the investment value, the price of the convertible security will tend to fluctuate directly with the price of the underlying equity security. No more than 5% of the Portfolio's assets may be invested in convertible securities rated lower than investment grade (commonly known as "junk bonds").
Small and Medium Capitalization Companies. The Portfolio's investments in small and medium capitalization companies carry more risk than investments in larger companies. While some of the Portfolio's holdings in these companies may be listed on a national securities exchange, such securities are more likely to be traded in the over-the-counter market. The low market liquidity of these securities may have an adverse impact on the Portfolio's ability to sell certain securities at favorable prices and may also make it difficult for the Portfolio to obtain market quotations based on actual trades for purposes of valuing the Portfolio's securities. Investing in lesser-known, small and medium capitalization companies involves greater risk of volatility of the Portfolio's net asset value than is customarily associated with larger, more established companies. Often small and medium capitalization companies and the industries in which they are focused are still evolving and, while this may offer better growth potential than larger, more established companies, it also may make them more sensitive to changing market conditions.
Foreign and Emerging Market Securities. The Portfolio's investments in foreign securities involve risks that are in addition to the risks associated with domestic securities. One additional risk is currency risk. While the price of Portfolio shares is quoted in U.S. dollars, the Portfolio may convert U.S. dollars to a foreign market's local currency to purchase a security in that market. If the value of that local currency falls relative to the U.S. dollar, the U.S. dollar value of the foreign security will decrease. This is true even if the foreign security's local price remains unchanged.
Foreign securities also have risks related to economic and political developments abroad, including expropriations, confiscatory taxation, exchange control regulation, limitations on the use or transfer of Portfolio assets and any effects of foreign social, economic or political instability. Foreign companies, in general, are not subject to the regulatory requirements of U.S. companies and, as such, there may be less publicly available information about these companies. Moreover, foreign accounting, auditing and financial reporting standards generally are different from those applicable to U.S. companies. Finally, in the event of a default of any foreign debt obligations, it may be more difficult for the Fund to obtain or enforce a judgment against the issuers of the securities.
Securities of foreign issuers may be less liquid than comparable securities of U.S. issuers and, as such, their price changes may be more volatile. In addition, the prices of such securities may be susceptible to influence by large traders, due to the limited size of many foreign securities markets. Moreover, investments in certain foreign markets, which have historically been considered stable, may become more volatile and subject to increased risk due to ongoing developments and changing conditions in such markets. Also, the growing interconnectivity of global economies and financial markets has increased the probability that adverse developments and conditions in one country or region will affect the stability of economies and financial markets in other countries or regions. Furthermore, foreign exchanges and broker-dealers are generally subject to less government and exchange scrutiny and regulation than their U.S. counterparts. In addition, differences in clearance and settlement procedures in foreign markets may cause delays in settlement of the Portfolio's trades effected in those markets and could result in losses to the Portfolio due to subsequent declines in the value of the securities subject to the trades.
The foreign securities in which the Portfolio may invest may be issued by issuers located in emerging market or developing countries. Compared to the United States and other developed countries, emerging market or developing countries may have relatively unstable governments, economies based on only a few industries and securities markets that trade a small number of securities. Securities issued by companies located in these countries tend to be especially volatile and may be less liquid than securities traded in developed countries. In the past, securities in these countries have been characterized by greater potential loss than securities of companies located in developed countries.
SDIS — The Global Infrastructure Portfolio
7
Depositary receipts involve many of the same risks as those associated with direct investment in foreign securities. In addition, the underlying issuers of certain depositary receipts, particularly unsponsored or unregistered depositary receipts, are under no obligation to distribute shareholder communications to the holders of such receipts, or to pass through to them any voting rights with respect to the deposited securities.
Other Risks. The performance of the Portfolio also will depend on whether or not the Adviser and/or Sub-Advisers are successful in applying the Portfolio's investment strategies. The Portfolio is also subject to other risks from its permissible investments, including the risks associated with its investments in convertible securities (discussed above), fixed-income securities, including junk bonds, U.S. government securities, asset-backed securities and REITs and foreign real estate companies. For more information about these risks, see the "Additional Risk Information" section.
ADDITIONAL RISK INFORMATION
This section provides additional information relating to the risks of investing in the Portfolio.
Fixed-Income Securities. Fixed-income securities are subject to the risk of the issuer's inability to meet principal and interest payments on its obligations (i.e., credit risk) and are subject to price volatility resulting from, among other things, interest rate sensitivity, market perception of the creditworthiness of the issuer and general market liquidity (i.e., market risk). The Portfolio is not limited as to the maturities of the securities in which it may invest. Securities with longer durations are likely to be more sensitive to changes in interest rates, generally making them more volatile than securities with shorter durations. Zero coupon securities (which are purchased at a discount and generally accrue interest, but make no payments until maturity) are typically subject to greater price fluctuations than comparable securities that pay current interest. The Portfolio may invest up to 5% of its net assets in fixed-income securities rated below investment grade and these investments may have speculative characteristics. Lower rated fixed-income securities have greater volatility because there is less certainty that principal and interest payments will be made as scheduled.
U.S. Government Securities. U.S. government securities are subject to market and interest rate risk, as well as varying degrees of credit risk. Some U.S. government securities are issued or guaranteed by the U.S. Treasury and are supported by the full faith and credit of the United States (but not issued by the U.S. Treasury). These securities may have less credit risk than U.S. government securities not supported by the full faith and credit of the United States. With respect to U.S. government securities that are not backed by the full faith and credit of the United States, there is a risk that the U.S. Government will not provide financial support to such U.S. government agencies, instrumentalities or sponsored entities if it is not obligated to do so by law.
Asset-Backed Securities. Asset-backed securities involve the risk that various federal and state consumer laws and other legal and economic factors may result in the collateral backing the securities being insufficient to support payment on the securities. Asset-backed securities generally decrease in value as a result of interest rate increases, but may benefit less than other fixed-income securities from declining interest rates, principally because of prepayments. Prepayments may increase during a period of declining interest rates although other factors, such as changes in power usage or alternative power generation, may also influence prepayment rates.
REITs and Foreign Real Estate Companies. REITs and foreign real estate companies generally derive their income from rents on the underlying properties or interest on the underlying loans, and their value is impacted by changes in the value of the underlying property or changes in interest rates affecting the underlying loans owned by the REITs and/or foreign real estate companies. REITs and foreign real estate companies are more susceptible to risks associated with the ownership of real estate and the real estate industry in general. These risks can include fluctuations in the value of underlying properties; defaults by borrowers or tenants; market saturation; changes in general and local economic conditions; decreases in market rates for rents; increases in competition, property taxes, capital expenditures or operating expenses; and other economic, political or regulatory occurrences affecting the real estate industry. In addition, REITs and foreign real estate companies depend upon specialized
SDIS — The Global Infrastructure Portfolio
8
management skills, may not be diversified (which may increase the volatility of a REIT's and/or foreign real estate company's value), may have less trading volume and may be subject to more abrupt or erratic price movements than the overall securities market. Foreign real estate companies may be subject to laws, rules and regulations governing those entities and their failure to comply with those laws, rules and regulations could negatively impact the performance of those entities. Operating REITs and foreign real estate companies requires specialized management skills and the Portfolio indirectly bears REIT and foreign real estate company management expenses along with the direct expenses of the Portfolio. REITs are not taxed on income distributed to shareholders provided they comply with several requirements of the Internal Revenue Code of 1986, as amended (the "Code"). REITs are subject to the risk of failing to qualify for tax-free pass-through income under the Code.
FUND MANAGEMENT
MORGAN STANLEY INVESTMENT MANAGEMENT INC.
The Adviser, together with its affiliated asset management companies, had approximately $338.2 billion in assets under management or supervision as of December 31, 2012.
The Fund has retained the Adviser — Morgan Stanley Investment Management Inc. — to provide investment advisory services. The Adviser is a wholly-owned subsidiary of Morgan Stanley (NYSE: "MS"), a preeminent global financial services firm engaged in securities trading and brokerage activities, as well as providing investment banking, research and analysis, financing and financial advisory services. The Adviser's address is 522 Fifth Avenue, New York, NY 10036.
The Adviser has entered into sub-advisory agreements with the Sub-Advisers — Morgan Stanley Investment Management Limited ("MSIM Limited") and Morgan Stanley Investment Management Company ("MSIM Company"). The Sub-Advisers are wholly owned subsidiaries of Morgan Stanley. The Sub-Advisers provide the Portfolio with investment advisory services subject to the overall supervision of the Adviser and the Fund's Officers and Trustees. The Adviser pays MSIM Limited and MSIM Company on a monthly basis a portion of the net advisory fees the Adviser receives from the Portfolio. MSIM Limited's address is 25 Cabot Square, Canary Wharf, London, E14 4QA, England and MSIM Company's address is 23 Church Street, 16-01 Capital Square, Singapore 049481.
The Portfolio is managed by members of the Global Infrastructure Securities team. Current members of the team jointly and primarily responsible for the day-to-day management of the Portfolio are Theodore R. Bigman and Matthew King.
Mr. Bigman has been associated with the Adviser in an investment management capacity since 1995. Mr. King has been associated with the Adviser in an investment management capacity since 2008. Prior to 2008, Mr. King worked for Bear Stearns in a variety of roles, including investment banking, capital markets and research during which time he provided research and analytical support for a number of infrastructure-related financings.
As lead portfolio manager, Mr. Bigman, together with co-portfolio manager Mr. King, determine the investment strategy, establishes asset-allocation frameworks and directs the implementation of investment strategy.
The Fund's Statement of Additional Information ("SAI") provides additional information about the portfolio managers' compensation structure, other accounts managed by the portfolio managers and the portfolio managers' ownership of securities in the Portfolio.
The composition of the team may change from time to time.
SDIS — The Global Infrastructure Portfolio
9
The Portfolio pays the Adviser a monthly advisory fee as full compensation for the services and facilities furnished to the Portfolio, and for Portfolio expenses assumed by the Adviser. The fee is based on the Portfolio's average daily net assets. For the fiscal year ended December 31, 2012, the Portfolio paid total investment advisory compensation (net of affiliated rebates, if applicable) amounting to 0.57% of the Portfolio's average daily net assets.
A discussion regarding the Board of Trustees' approval of the investment advisory agreement and the sub-advisory agreements are available in the Fund's semiannual report to shareholders for the period ended June 30, 2012.
SDIS — The Global Infrastructure Portfolio
10
Shareholder Information
PURCHASES AND SALES OF PORTFOLIO SHARES
Shares are offered on each day that the New York Stock Exchange ("NYSE") is open for business. The Portfolio offers its shares only to insurance company separate accounts that insurance companies establish to fund variable life insurance and/or variable annuity contracts. An insurance company purchases or redeems shares of the Portfolio based on, among other things, the amount of net contract premiums or purchase payments allocated to a separate account investment division, transfers to or from a separate account investment division, contract loans and repayments, contract withdrawals and surrenders, and benefit payments. The contract prospectus describes how contract owners may allocate, transfer and withdraw amounts to and from separate accounts.
The Portfolio currently does not foresee any disadvantages to variable product contract owners arising out of the fact that the Portfolio offers its shares to separate accounts of various insurance companies that offer variable life insurance and/or variable annuity products. Nevertheless, the Board of Trustees that oversees the Portfolio intends to monitor events to identify any material irreconcilable conflicts that may arise due to these arrangements and to determine what action, if any, should be taken in response.
If the Adviser determines that it is in the best interest of the Portfolio not to pay redemption proceeds in cash, and subject to applicable agreements with life insurance companies and other qualified investors, the Portfolio may pay a portion or all of a redemption by distributing securities held by the Portfolio. Such in-kind securities may be illiquid and difficult or impossible to sell at a time and at a price that a shareholder would like. In addition, shareholders receiving distributions in-kind may incur brokerage costs when subsequently selling shares of those securities.
FREQUENT PURCHASES AND REDEMPTIONS OF SHARES
Frequent purchases and redemptions of shares pursuant to the instructions of insurance company contract owners are referred to as "market-timing" or "short-term trading" and may present risks for other contract owners with long-term interests in the Portfolio, which may include, among other things, dilution in the value of the Portfolio's shares indirectly held by contract owners with long-term interests in the Portfolio, interference with the efficient management of the Portfolio, increased brokerage and administrative costs and forcing the Portfolio to hold excess levels of cash.
In addition, the Portfolio is subject to the risk that market-timers and/or short-term traders may take advantage of time zone differences between the foreign markets on which the Portfolio's securities trade and the time the Portfolio's net asset value is calculated ("time-zone arbitrage"). For example, a market-timer may submit instructions for the purchase of shares of the Portfolio based on events occurring after foreign market closing prices are established, but before the Portfolio's net asset value calculation that are likely to result in higher prices in foreign markets the following day. The market-timer would submit instructions to redeem the Portfolio's shares the next day, when the Portfolio's share price would reflect the increased prices in foreign markets for a quick profit at the expense of contract owners or participants with long-term interests in the Portfolio.
Investments in other types of securities also may be susceptible to short-term trading strategies. These investments include securities that are, among other things, thinly traded, traded infrequently, or relatively illiquid, which have the risk that the current market price for the securities may not accurately reflect current market values. A contract owner may seek to engage in short-term trading to take advantage of these pricing differences (referred to as "price arbitrage"). Investments in certain fixed-income securities, such as junk bonds, may be adversely affected by price arbitrage trading strategies.
The Portfolio's policies with respect to valuing portfolio securities are described below in the "Pricing Portfolio Shares" section.
The Fund's Board of Trustees has adopted policies and procedures to discourage frequent purchases and redemptions of Portfolio shares by Portfolio shareholders. Insurance companies generally do not provide specific contract owner transaction instructions to the Portfolio on an ongoing basis. Therefore, to some extent, the Portfolio relies on the insurance companies to monitor frequent short-term trading by contract owners. However, the Portfolio or the Distributor has entered into agreements with insurance companies whereby the insurance companies are required to provide certain contract owner identification and transaction information upon the Portfolio's request. The Portfolio may use this information to help identify and prevent
SDIS — The Global Infrastructure Portfolio
11
market-timing activity in the Portfolio. There can be no assurance that the Portfolio will be able to identify or prevent all market-timing activity.
If the Portfolio identifies suspected market-timing activity, the insurance company will be contacted and asked to take steps to prevent further market-timing activity (e.g., sending warning letters or blocking frequent trading by underlying contract owners). Insurance companies may be prohibited by the terms of the underlying insurance contract from restricting short-term trading of mutual fund shares by contract owners, thereby limiting the ability of such insurance company to implement remedial steps to prevent market-timing activity in the Portfolio. If the insurance company is unwilling or unable to take remedial steps to discourage or prevent frequent trading, or does not take action promptly, certain contract owners may be able to engage in frequent trading to the detriment of contract owners with long-term interests in the Portfolio. If the insurance company refuses to take remedial action, or takes action that the Portfolio deems insufficient, a determination will be made whether it is appropriate to terminate the relationship with such insurance company.
PRICING PORTFOLIO SHARES
The price of shares of the Portfolio, called "net asset value," is based on the value of its portfolio securities.
The net asset value per share of the Portfolio is determined once daily at the NYSE close (normally 4:00 p.m. Eastern time) on each day that the NYSE is open. Shares will not be priced on days that the NYSE is closed.
The value of the Portfolio's securities is based on the securities' market price when available. When a market price is not readily available, including circumstances under which the Adviser and/or Sub-Advisers determine that a security's market price is not accurate, a portfolio security is valued at its fair value, as determined under procedures established by the Fund's Board of Trustees.
In addition, with respect to securities that primarily are listed on foreign exchanges, when an event occurs after the close of such exchanges that is likely to have changed the value of the securities (e.g., a percentage change in value of one or more U.S. securities indices in excess of specified thresholds), such securities will be valued at their fair value, as determined under procedures established by the Fund's Board of Trustees. Securities also may be fair valued in the event of a significant development affecting a country or region or an issuer-specific development which is likely to have changed the value of the security. In these cases, the Portfolio's net asset value will reflect certain portfolio securities' fair value rather than their market price. Fair value pricing involves subjective judgment and it is possible that the fair value determined for a security is materially different than the value that could be realized upon the sale of that security. With respect to securities that are primarily listed on foreign exchanges, the value of the Portfolio's securities may change on days when shareholders will not be able to purchase or sell their shares.
To the extent the Portfolio invests in open-end management companies that are registered under the Investment Company Act of 1940, as amended (the "Investment Company Act"), the Portfolio's net asset value is calculated based upon the net asset value of such funds. The prospectuses for such funds explain the circumstances under which they will use fair value pricing and its effects.
An exception to the general policy of using market prices concerns the Portfolio's short-term debt portfolio securities. Debt securities with remaining maturities of 60 days or less at the time of purchase are valued at amortized cost. However, if the cost does not reflect the securities' market value, these securities will be valued at their fair value.
PLAN OF DISTRIBUTION
The Fund has adopted a Plan of Distribution for the Portfolio in accordance with Rule 12b-1 under the Investment Company Act. Class Y shares are subject to a distribution (12b-1) fee of 0.25% of the average daily net assets of the Class. The Plan allows Class Y shares of the Portfolio to bear distribution fees in connection with the sale and distribution of Class Y shares. It also allows the Portfolio to pay for services to Class Y shareholders. Because these fees are paid out of the assets of the Portfolio's Class Y shares on an ongoing basis, over time these fees will increase the cost of your investment and may cost you more than paying other types of sales charges.
SDIS — The Global Infrastructure Portfolio
12
DISTRIBUTIONS
The Portfolio passes substantially all of its earnings from income and capital gains along to its investors as "distributions." The Portfolio earns income from stocks and interest from fixed-income investments. These amounts are passed along to Portfolio shareholders as "income dividend distributions." The Portfolio realizes capital gains whenever it sells securities for a higher price than it paid for them. These amounts may be passed along as "capital gains distributions."
Dividends from net investment income and capital gains distributions, if any, are declared and paid at least once per year.
TAX CONSEQUENCES
For information concerning the federal income tax consequences to holders of the underlying variable annuity or variable life insurance contracts, see the accompanying contract prospectus.
PORTFOLIO HOLDINGS INFORMATION
A description of the Fund's policies and procedures with respect to the disclosure of the Portfolio's securities is available in the Fund's SAI.
ADDITIONAL INFORMATION
The Adviser, the Sub-Advisers and/or the Distributor may pay compensation (out of their own funds and not as an expense of the Portfolio) to certain affiliated or unaffiliated broker-dealers or other financial intermediaries or service providers, including insurance companies and their affiliates, in connection with the sale, distribution, marketing or retention of Portfolio shares and/or shareholder servicing. Such compensation may be significant in amount and the prospect of receiving any such additional compensation may provide such affiliated or unaffiliated entities with an incentive to favor sales of shares of the Portfolio over other investment options. Any such payments will not change the net asset value or the price of the Portfolio's shares. For more information, please see the Fund's SAI.
SDIS — The Global Infrastructure Portfolio
13
The financial highlights table is intended to help you understand the financial performance of the Portfolio's Class Y shares for the periods indicated. Certain information reflects financial results for a single Portfolio share throughout each period. The total returns in the table represent the rate an investor would have earned or lost on an investment in the Portfolio (assuming reinvestment of all dividends and distributions). The ratio of expenses to average net assets listed in the table below is based on the average net assets of the Portfolio for each of the periods listed in the table. To the extent that the Portfolio's average net assets decrease over the Portfolio's next fiscal year, such expense ratios can be expected to increase, potentially significantly, because certain fixed costs will be spread over a smaller amount of assets.
The information for the years ended December 31, 2012 and December 31, 2011 has been audited by Ernst & Young LLP, an independent registered public accounting firm, whose report, along with the Portfolio's financial statements, are incorporated by reference in the SAI from the Fund's annual report, which is available upon request. The financial highlights for each of the years in the three-year period ended December 31, 2010 have been audited by another independent registered public accounting firm.
Further information about the performance of the Portfolio is contained in its annual report and semiannual report to shareholders. See the accompanying contract prospectus for either the variable annuity or the variable life contract issued by your insurance company for a description of charges, which are applicable thereto. These charges are not reflected in the financial highlights below. Inclusion of any of these charges would reduce the total return figures for all periods shown.
For the Year Ended December 31 | | 2012 | | 2011 | | 2010^ | | 2009^ | | 2008^ | |
Selected Per Share Data: | |
Net asset value beginning of period | | $ | 23.68 | | | $ | 22.40 | | | $ | 22.63 | | | $ | 19.78 | | | $ | 29.75 | | |
Net investment income(a) | | | 0.49 | | | | 0.46 | | | | 0.51 | | | | 0.49 | | | | 0.52 | | |
Net realized and unrealized gain (loss) | | | 3.42 | | | | 2.95 | | | | 0.71 | | | | 3.00 | | | | (10.36 | ) | |
Total from investment operations | | | 3.91 | | | | 3.41 | | | | 1.22 | | | | 3.49 | | | | (9.84 | ) | |
Dividends to shareholders | | | (0.50 | ) | | | (0.62 | ) | | | (0.47 | ) | | | (0.64 | ) | | | (0.13 | ) | |
Distributions to shareholders | | | (2.36 | ) | | | (1.51 | ) | | | (0.98 | ) | | | — | | | | — | | |
Total dividends and distributions | | | (2.86 | ) | | | (2.13 | ) | | | (1.45 | ) | | | (0.64 | ) | | | (0.13 | ) | |
Net asset value end of period | | $ | 24.73 | | | $ | 23.68 | | | $ | 22.40 | | | $ | 22.63 | | | $ | 19.78 | | |
Total Return(b) | | | 17.79 | % | | | 15.56 | % | | | 6.81 | % | | | 18.18 | % | | | (33.19 | )% | |
Ratios to Average Net Assets:(c) | |
Expenses | | | 1.36 | %(d) | | | 1.35 | %(d) | | | 1.18 | %(d) | | | 1.67 | %(d) | | | 1.09 | %(d) | |
Net investment income | | | 2.02 | %(d) | | | 2.01 | %(d) | | | 2.41 | %(d) | | | 2.50 | %(d) | | | 2.03 | %(d) | |
Rebate from Morgan Stanley affiliate | | | 0.00 | %(e) | | | 0.00 | %(e) | | | 0.00 | %(e) | | | 0.00 | %(e) | | | 0.00 | %(e) | |
Supplemental Data: | |
Net assets end of period (000's) | | $ | 7,635 | | | $ | 7,863 | | | $ | 8,883 | | | $ | 10,332 | | | $ | 10,886 | | |
Portfolio turnover rate | | | 28 | % | | | 36 | % | | | 148 | % | | | 279 | % | | | 77 | % | |
^ Beginning with the year ended December 31, 2011, the Fund was audited by Ernst & Young LLP. The previous years were audited by another independent registered public accounting firm.
(a) The per share amounts were computed using an average number of shares outstanding during the period.
(b) Calculated based on the net asset value as of the last business day of the period. Performance shown does not reflect fees and expenses imposed by your insurance company. If performance information included the effect of these charges, the total returns would be lower.
(c) Reflects overall Portfolio ratios for investment income and non-class specific expenses.
(d) The ratios reflect the rebate of certain Portfolio expenses in connection with investments in a Morgan Stanley affiliate during the period. The effect of the rebate on the ratios is disclosed in the above table as "Rebate from Morgan Stanley affiliate."
(e) Amount is less than 0.005%.
SDIS — The Global Infrastructure Portfolio
14
Morgan Stanley
Select Dimensions Investment Series

ADDITIONAL INFORMATION ABOUT THE PORTFOLIO'S INVESTMENTS is available in the Fund's Annual and Semiannual Reports to Shareholders. In the Fund's Annual Report, you will find a discussion of the market conditions and investment strategies that significantly affected the Portfolio's performance during its last fiscal year. The Fund's Statement of Additional Information also provides additional information about the Portfolio. The Statement of Additional Information is incorporated herein by reference (legally is part of this Prospectus). For a free copy of the Fund's Annual Report, Semiannual Report or Statement of Additional Information, to request other information about the Portfolio or to make shareholder inquiries, please call toll-free (800) 869-NEWS. Free copies of these documents are also available from our Internet site at: www.morganstanley.com/im.

YOU ALSO MAY OBTAIN INFORMATION ABOUT THE FUND BY CALLING your Morgan Stanley Financial Advisor or by visiting our Internet site.

INFORMATION ABOUT THE FUND (including the Statement of Additional Information) can be viewed and copied at the SEC Public Reference Room in Washington, D.C. Information on the operation of the Public Reference Room may be obtained by calling the SEC at (202) 551-8090. Reports and other information about the Fund and the Portfolio are available on the EDGAR Database on the SEC's Internet site at: http://www.sec.gov, and copies of this information may be obtained, after paying a duplicating fee, by electronic request at the following E-mail address: publicinfo@sec.gov, or by writing to the SEC's Public Reference Section, Washington, D.C. 20549-1520.
(THE FUND'S INVESTMENT COMPANY ACT FILE NO. IS 811-7185)
MORGAN STANLEY
SELECT DIMENSIONS INVESTMENT SERIES
Annual Report
DECEMBER 31, 2012
The Portfolios are intended to be the funding vehicle for variable annuity contracts and variable life insurance policies offered by the separate accounts of certain life insurance companies.
Morgan Stanley Select Dimensions Investment Series
Table of Contents
| Letter to the Shareholders | | | 1 | | |
| Expense Example | | | 15 | | |
Portfolio of Investments: | |
| Money Market | | | 19 | | |
| Flexible Income | | | 23 | | |
| Global Infrastructure | | | 37 | | |
| Growth | | | 40 | | |
| Focus Growth | | | 43 | | |
| Multi Cap Growth | | | 45 | | |
| Mid Cap Growth | | | 48 | | |
Financial Statements: | |
| Statements of Assets and Liabilities | | | 52 | | |
| Statements of Operations | | | 54 | | |
| Statements of Changes in Net Assets | | | 56 | | |
| Notes to Financial Statements | | | 62 | | |
| Financial Highlights | | | 92 | | |
| Report of Independent Registered Public Accounting Firm | | | 100 | | |
| Trustee and Officer Information | | | 101 | | |
| Federal Tax Notice | | | 106 | | |
Morgan Stanley Select Dimensions Investment Series
Letter to the Shareholders n December 31, 2012 (unaudited)
Dear Shareholder:
In 2012, policy was a dominant theme driving global financial markets. Expectations and disappointments regarding the European Union initiatives addressing the credit crisis, the debate over the "fiscal cliff" in the U.S. Congress, and monetary easing from the U.S. Federal Reserve (the Fed), European Central Bank (ECB), Bank of Japan and other central banks contributed to volatility in the global markets throughout the year. Ultimately, the liquidity provided by the central banks and the reduced risk of financial crisis in Europe helped risk assets outperform relatively safer asset classes, despite some looming macroeconomic uncertainties.
Domestic Equity Overview
U.S. stocks, as measured by the S&P 500® Index, were up 16% for the year ended December 31, 2012. Gross domestic product (GDP) growth remained lackluster, registering 2.0% in the first quarter of 2012, 1.3% in the second quarter, and 3.1% in the third quarter. (Fourth quarter GDP estimates were not released at the time of this writing.) Unemployment declined during the period, but remained uncomfortably elevated. The housing market began to show signs of stabilization. Corporate profits continued to be surprisingly robust, although many expect that the strength has run its course. The Federal Open Market Committee enacted a number of measures intended to support the economy, including a third round of quantitative easing, extending its timeline for keeping the federal funds target rate near zero, and announcing late in the year that it would keep the rate low until unemployment reached 6.5% so long as the central bank's inflation projections stayed below 2.5%.
Stocks began the year on a relatively high note but investor sentiment deteriorated in the spring amid weaker economic data and renewed risks in the euro zone. The market turned positive in the summer on expectations of further stimulative actions from the Fed and additional measures from the European Central Bank to bolster the financial system. Later in the year, uncertainties about the fiscal cliff drove stocks lower as lawmakers debated until the very last hours of the deadline before coming to an agreement.
Fixed Income Overview
As in other asset classes during the review period, riskier segments of the fixed income market delivered stronger relative performance as investors grew more confident about global economic conditions and the European debt crisis. Emerging market debt and U.S. corporate debt outperformed "safe haven" Treasury securities.
Morgan Stanley Select Dimensions Investment Series
Letter to the Shareholders n December 31, 2012 (unaudited) continued
Emerging market debt began the year on a positive note but trended lower in the second quarter amid rising risk premiums in Europe and weaker economic data in China. However, losses were recovered in the third and fourth quarters, as investor sentiment was more optimistic regarding global growth prospects and the lower probability of Greece exiting the European Union. New issuance and fund flows both increased during 2012 from 2011 levels, further supporting the asset class.
Within the U.S. corporate sector, investment-grade debt performed very well, led by the financials sector. Investment-grade corporate spreads ended the year almost 100 basis points tighter, while financials spreads were 185 basis points tighter. High-yield corporate spreads narrowed by 180 basis points.
Mortgage-backed securities also performed well during the year. The Fed's quantitative easing announcement in September, focused on mortgages, led to a substantial tightening in lower coupon fixed rate mortgage spreads. Despite historically low mortgage rates, refinancing activity had been slower than it has been in the past under similar rate incentives, although with further quantitative easing, there has been an increase in mortgage refinancing.
The intermediate part of the U.S. Treasury yield curve performed the best as 10-year yields declined by 14 basis points. The 10-year Treasury yield reached an all time low of 1.47% at the beginning of June. Two-year yields were unchanged, whereas 30-year yields rose by 11 basis points.
Money market yields continued to be constrained by the Fed's near-zero interest rate policy. Even with the Fed now tying its interest policy to unemployment and inflation rates, rather than a date (previously expected to be 2015 or later), observers believe the near-zero rates are likely to continue beyond 2015.
International Equity Overview
International equity markets performed well in the 12 months ended December 31, 2012, with emerging market equities outpacing developed market equities and, among developed markets, Europe leading the U.S. and Japan.
In Europe, despite a double-dip recession with GDP growth and earnings estimates being revised downward during the course of the year, equity markets performed strongly. Market turbulence in the spring was driven by renewed concerns about Greece and Spain. However, markets rallied following ECB President Mario Draghi's pledge in July to preserve the euro no matter what and an announcement in September for a program of unlimited support for countries that agree to certain reforms. In essence, the ECB now provides a back-stop against further credit stress in the region. This helped bond yields among the most indebted European nations decline considerably. European Union finance ministers also appeared to make progress toward a single banking union.
2
Morgan Stanley Select Dimensions Investment Series
Letter to the Shareholders n December 31, 2012 (unaudited) continued
Japan's equity market began the year on strong footing, but slumped for most of the remainder of the year amid concerns about slowing exports to Europe and China. However, a sharply lower yen, which benefits exporting companies, and the election of the Liberal Democratic Party and its promises of reflation led Japanese stocks to rally dramatically in the final months of 2012.
As with other global risk assets, emerging market stocks were volatile throughout the year in response to global growth concerns and the European debt crisis. However, in the second half of the year, emerging market equities advanced strongly due to the weaker yen (which prompts investors to seek relatively higher yielding assets elsewhere), improved manufacturing data from China, and the reduced risk of a financial crisis in Europe.
Money Market Portfolio
An investment in a money market fund is not insured or guaranteed by the Federal Deposit Insurance Corporation or any other government agency. Although money market funds seek to preserve the value of an investment at $1.00 per share, it is possible to lose money by investing in such funds.
As of December 31, 2012, Select Dimensions – Money Market Portfolio had net assets of approximately $71 million with an average portfolio maturity of 29 days. For the seven-day period ended December 31, 2012, the Portfolio's Class X shares provided an effective annualized yield of 0.01% (subsidized) and – 0.51% (non-subsidized) and a current yield of 0.01% (subsidized) and – 0.51% (non-subsidized), while its 30-day moving average yield for December was 0.01% (subsidized) and – 0.45% (non-subsidized). Yield quotations more closely reflect the current earnings of the Portfolio. The non-subsidized yield reflects what the yield would have been had a fee and/or expense waiver not been in place during the period shown. For the 12-month period ended December 31, 2012, the Portfolio's Class X shares returned 0.01%. Past performance is no guarantee of future results.
For the seven-day period ended December 31, 2012, the Portfolio's Class Y shares provided an effective annualized yield of 0.01% (subsidized) and – 0.76% (non-subsidized) and a current yield of 0.01% (subsidized) and – 0.76% (non-subsidized), while its 30-day moving average yield for December was 0.01% (subsidized) and – 0.70% (non-subsidized). Yield quotations more closely reflect the current earnings of the Portfolio. The non-subsidized yield reflects what the yield would have been had a fee and/or expense waiver not been in place during the period shown. For the 12-month period ended December 31, 2012, the Portfolio's Class Y shares returned 0.01%. Past performance is no guarantee of future results.
3
Morgan Stanley Select Dimensions Investment Series
Letter to the Shareholders n December 31, 2012 (unaudited) continued
The performance of the Portfolio's two share classes varies because each has different expenses. The Portfolio's total returns assume the reinvestment of all distributions but do not reflect the deduction of any charges by your insurance company. Such costs would lower performance.
We continued to remain cautious in our investment approach, focusing on securities with what we believe are high liquidity and short durations. We believe this approach, together with our investment process, has put us in a favorable position to respond to market uncertainty.
During the period, we sought to purchase high-quality fixed and floating rate paper, while maintaining our conservative liquidity metrics. Our management strategy for the Portfolio remained consistent with our long-term focus on capital preservation and high liquidity.
There is no guarantee that any sectors mentioned will continue to perform as discussed above or that securities in such sectors will be held by the Portfolio in the future.
Flexible Income Portfolio
For the 12-month period ended December 31, 2012, Select Dimensions – Flexible Income Portfolio Class X shares produced a total return of 12.98%, outperforming the Barclays Capital Intermediate U.S. Government/Credit Index (the "Index"), which returned 3.89%. For the same period, the Portfolio's Class Y shares returned 12.75%. Past performance is no guarantee of future results.
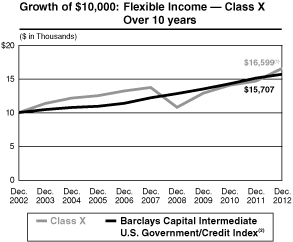
Performance data quoted represents past performance, which is no guarantee of future results and current performance may be lower or higher than the figures shown. For most recent month-end performance figures, please contact the issuing insurance company or speak with your Financial Advisor. Investment return and principal value will fluctuate. When you sell Portfolio shares, they may be worth less than their original cost. Total returns do not reflect the deduction of taxes that a shareholder would pay on Portfolio distributions or the redemption of Portfolio shares. Performance for Class Y shares will vary from the performance of Class X shares due to differences in expenses. Performance assumes reinvestment of all distributions for the underlying portfolio based on net asset value (NAV). It does not reflect the deduction of insurance expenses, an annual contract maintenance fee, or surrender charges. If performance information included the effect of these additional charges, the total returns would be lower.
Average Annual Total Returns as of December 31, 2012
| | | 1 Year | | 5 Years | | 10 Years | | Since Inception* | |
Class X | | | 12.98 | % | | | 3.86 | % | | | 5.20 | % | | | 4.33 | % | |
Class Y | | | 12.75 | % | | | 3.59 | % | | | 4.93 | % | | | 3.85 | % | |
(1) Ending value on December 31, 2012 for the underlying portfolio. This figure does not reflect the deduction of any account fees or sales charges.
(2) The Barclays Capital Intermediate U.S. Government/Credit Index tracks the performance of U.S. government and corporate obligations, including U.S. government agency and Treasury securities, and corporate and Yankee bonds with maturities of 1 to 10 years. The Index is unmanaged and its returns do not include any sales charges or fees. Such costs would lower performance. It is not possible to invest directly in an index.
* Inception dates of November 9, 1994 for Class X and July 24, 2000 for Class Y.
4
Morgan Stanley Select Dimensions Investment Series
Letter to the Shareholders n December 31, 2012 (unaudited) continued
The performance of the Portfolio's two share classes varies because each has different expenses. The Portfolio's total returns assume the reinvestment of all distributions but do not reflect the deduction of any charges by your insurance company. Such costs would lower performance.
The Portfolio's exposure to corporate bonds across the quality spectrum contributed significantly to performance given the tightening of spreads over the year as policy makers attempted to reduce tail risks globally. Within high yield, the benefit came from exposure to a variety of corporate sectors. The financials sector was the largest single contributor among the Portfolio's investment grade corporate holdings.
The Portfolio also benefitted from exposure to emerging markets and non-agency mortgage-backed securities. Within emerging markets, the principal countries contributing to performance were Russia, Brazil, Indonesia, Mexico and Venezuela. The Portfolio's exposure to non-agency mortgages benefited from the beginning of a recovery in the housing market in 2012, as well as the decision of the Federal Reserve to buy mortgage-backed securities as part of its quantitative easing policy.
The Portfolio's interest-rate positioning in the U.S. was a small additive to relative performance and the underweight in German interest rates detracted slightly. During the year, interest rates fell in most bond markets.
Currency positions, which are managed through the use of currency forwards, added a small amount to performance overall, largely via exposure to the Mexican peso and being long the Norwegian krone versus short the Swedish krone.
There is no guarantee that any sectors mentioned will continue to perform as discussed above or that securities in such sectors will be held by the Portfolio in the future.
5
Morgan Stanley Select Dimensions Investment Series
Letter to the Shareholders n December 31, 2012 (unaudited) continued
Global Infrastructure Portfolio
For the 12-month period ended December 31, 2012, Select Dimensions – Global Infrastructure Portfolio Class X shares produced a total return of 18.14%, outperforming the Dow Jones Brookfield Global Infrastructure Index (the "Index"), which returned 16.01%, and the S&P Global BMI Index, which returned 17.15%. For the same period, the Portfolio's Class Y shares returned 17.79%. Past performance is no guarantee of future results.
The performance of the Portfolio's two share classes varies because each has different expenses. The Portfolio's total returns assume the reinvestment of all distributions but do not reflect the deduction of any charges by your insurance company. Such costs would lower performance.
Infrastructure shares appreciated 16.01% during 2012, as measured by the Index. Among the major infrastructure sectors, the communications and European regulated utilities sectors exhibited relative outperformance, while the transmission and distribution, gas midstream, gas distribution utilities, and pipeline companies sectors underperformed the Index. Toll roads performed largely in line with the Index for the year. Among the smaller sectors, the airports, water, ports, and diversified sectors all outperformed the Index.
For full-year 2012, the Portfolio realized favorable performance from both bottom-up stock selection and top-down allocation, with bottom-up stock selection being the more significant driver of outperformance, as in past years. From a bottom-up

Performance data quoted represents past performance, which is no guarantee of future results and current performance may be lower or higher than the figures shown. For most recent month-end performance figures, please contact the issuing insurance company or speak with your Financial Advisor. Investment return and principal value will fluctuate. When you sell Portfolio shares, they may be worth less than their original cost. Total returns do not reflect the deduction of taxes that a shareholder would pay on Portfolio distributions or the redemption of Portfolio shares. Performance for Class Y shares will vary from the performance of Class X shares due to differences in expenses. Performance assumes reinvestment of all distributions for the underlying portfolio based on net asset value (NAV). It does not reflect the deduction of insurance expenses, an annual contract maintenance fee, or surrender charges. If performance information included the effect of these additional charges, the total returns would be lower.
Average Annual Total Returns as of December 31, 2012
| | | 1 Year | | 5 Years | | 10 Years | | Since Inception* | |
Class X | | | 18.14 | % | | | 3.07 | % | | | 11.34 | % | | | 9.62 | % | |
Class Y | | | 17.79 | % | | | 2.80 | % | | | 11.06 | % | | | 3.66 | % | |
(1) Ending value on December 31, 2012 for the underlying portfolio. This figure does not reflect the deduction of any account fees or sales charges.
(2) The Dow Jones Brookfield Global Infrastructure IndexSM is a float-adjusted market capitalization weighted index that measures the stock performance of companies that exhibit strong infrastructure characteristics. The Index intends to measure all sectors of the infrastructure market. The Index was first published in July 2008; however, back-tested hypothetical performance information is available for this Index since December 31, 2002. Returns are calculated using the return data of the S&P Global BMI Index through December 31, 2002 and the return data of the Dow Jones Brookfield Global Infrastructure Index for periods thereafter. The Index is unmanaged and its returns do not include any sales charges or fees. Such costs would lower performance. It is not possible to invest directly in an index.
(3) The Standard & Poor's Global BMI Index (S&P Global BMI Index) is a broad market index designed to capture exposure to equities in all countries in the world that meet minimum size and liquidity requirements. As of the date of this Report, there are approximately 11,000 index members representing 26 developed and 20 emerging market countries. The Index is unmanaged and its returns do not include any sales charges or fees. Such costs would lower performance. It is not possible to invest directly in an index.
* Inception dates of November 9, 1994 for Class X and July 24, 2000 for Class Y.
6
Morgan Stanley Select Dimensions Investment Series
Letter to the Shareholders n December 31, 2012 (unaudited) continued
perspective, stock selection was particularly favorable in the gas distribution utilities, communications, transmission and distribution, toll roads, and European regulated utilities sectors, only partially offset by adverse selection in the pipeline companies and gas midstream sectors. From a top-down perspective, our positioning was favorable or largely neutral in all sectors except for the negative impact of our cash holdings and an underweight to the water sector.
We attribute 2012 sector outperformance or underperformance within the infrastructure universe to a combination of macroeconomic and company/sector-specific considerations. On the macroeconomic front, we attribute the strong performance of European regulated utilities and toll roads largely to declining sovereign yields and lower perceived event risk in continental Europe, which has lowered the current market-derived cost of capital to levels closer to the medium- to longer-term levels appropriate for the asset class. In the U.S., we attribute the underperformance of transmission and distribution, gas distribution utilities, and pipeline companies to concerns over dividend and investment tax policies (debated during U.S. fiscal cliff negotiations), as well as to the potential for declining regulated returns resulting from low North American bond rates. These sectors, in our opinion, were also largely unfavorable from a valuation perspective.
With regard to company/sector fundamentals regionally, European regulated utilities benefited from increased/improved visibility in connection with several regulatory initiatives. In Asia, gas distribution utilities in China continued to benefit from strong demand for natural gas, as industrial customers looked to lower their cost structures and the central government attempted to reign in pollution created by the significant use of coal-fired power generation. In the U.S., we attribute the outperformance of the communications sector to the ongoing demand by telecommunications providers for wireless towers in order to meet the demands of customers using data-driven devices like smartphones and tablets. Also in North America, we attribute the underperformance of the gas midstream sector to concerns over excess natural gas and natural gas liquids (NGL) supply and the resultant impact on drilling patterns of exploration and production company customers as natural gas prices remain low and NGL prices declined from historical averages.
We remain committed to our core investment philosophy as an infrastructure value investor. As value-oriented, bottom-up driven investors, our investment perspective is that over the medium and long term, the key factor in determining the performance of infrastructure securities will be underlying infrastructure asset values. Given the large and growing private infrastructure market, we believe that there are limits as to the level of premium or discount at which the public sector should trade relative to its underlying private
7
Morgan Stanley Select Dimensions Investment Series
Letter to the Shareholders n December 31, 2012 (unaudited) continued
infrastructure value. These limits can be viewed as the point at which the arbitrage opportunity between owning infrastructure in the private versus public markets becomes compelling. In aiming to achieve core infrastructure exposure in a cost effective manner, we invest in equity securities of publicly listed infrastructure companies we believe offer the best value relative to their underlying infrastructure value and net asset value growth prospects. Our research currently leads us to an overweighting in the Portfolio (amongst the largest sectors) to a group of companies in the gas distribution, toll road, pipeline companies, and communications sectors, and an underweighting to companies in the gas midstream, transmission and distribution, and European regulated utilities sectors.
We started 2013, positioned largely the same from a sector perspective as we began 2012 (although some of our individual company weightings have meaningfully changed). We acknowledge that increased optimism over a potential upturn in global economic growth (as espoused by many market pundits and supported by an upturn in the equity markets witnessed in early 2013 at the time of writing) might argue for an increased weighting to GDP-growth/trade-leveraged sectors, particularly within transportation; however, we remain committed to and positive on existing positions in the Portfolio, as we believe such positions provide favorable total return potential going forward whether or not this economic upturn of the magnitude anticipated materializes. Our preference as in the past remains to find opportunities within the infrastructure universe that do not rely on meaningful improvements to economic growth, rather than relying on secular themes to drive fundamental growth or relying on a valuation gap that can be closed without a strong improvement in macroeconomic growth. While we concur in some cases with those who believe there is reason for optimism regarding the global economy over the near term, we also remain cautious due to concerns over the massive, unprecedented monetary policy being used to support current growth and the unanticipated consequences these policies might have.
There is no guarantee that any sectors mentioned will continue to perform as discussed above or that securities in such sectors will be held by the Portfolio in the future.
8
Morgan Stanley Select Dimensions Investment Series
Letter to the Shareholders n December 31, 2012 (unaudited) continued
Growth Portfolio
For the 12-month period ended December 31, 2012, Select Dimensions – Growth Portfolio Class X shares produced a total return of 14.50%, underperforming the Russell 1000® Growth Index (the "Index"), which returned 15.26% For the same period, the Portfolio's Class Y shares returned 14.18%. Past performance is no guarantee of future results.
The performance of the Portfolio's two share classes varies because each has different expenses. The Portfolio's total returns assume the reinvestment of all distributions but do not reflect the deduction of any charges by your insurance company. Such costs would lower performance.
Stock selection in the technology sector dampened relative returns, with a holding in a social networking web site detracting the most. Stock selection in the energy sector also hurt relative performance but the negative influence was moderately offset by the benefit of an underweight in the sector. Stock selection in materials and processing was detrimental as well, driven by weakness from a position in a rare earths miner.
Conversely, stock selection in the consumer discretionary sector was the largest contributor to relative performance. Within the sector, a position in an online retailer led gains. The financial services sector also drove positive relative performance, due to both stock selection and an overweight in the sector. A holding in a global asset manager focused on property, power and infrastructure assets was the
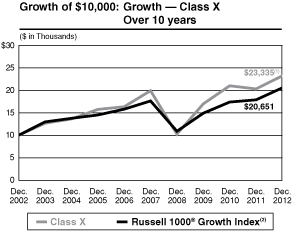
Performance data quoted represents past performance, which is no guarantee of future results and current performance may be lower or higher than the figures shown. For most recent month-end performance figures, please contact the issuing insurance company or speak with your Financial Advisor. Investment return and principal value will fluctuate. When you sell Portfolio shares, they may be worth less than their original cost. Total returns do not reflect the deduction of taxes that a shareholder would pay on Portfolio distributions or the redemption of Portfolio shares. Performance for Class Y shares will vary from the performance of Class X shares due to differences in expenses. Performance assumes reinvestment of all distributions for the underlying portfolio based on net asset value (NAV). It does not reflect the deduction of insurance expenses, an annual contract maintenance fee, or surrender charges. If performance information included the effect of these additional charges, the total returns would be lower.
Average Annual Total Returns as of December 31, 2012
| | | 1 Year | | 5 Years | | 10 Years | | Since Inception* | |
Class X | | | 14.50 | % | | | 3.13 | % | | | 8.84 | % | | | 7.05 | % | |
Class Y | | | 14.18 | % | | | 2.87 | % | | | 8.57 | % | | | 0.94 | % | |
(1) Ending value on December 31, 2012 for the underlying portfolio. This figure does not reflect the deduction of any account fees or sales charges.
(2) The Russell 1000® Growth Index measures the performance of the large-cap growth segment of the U.S. equity universe. It includes those Russell 1000® Index companies with higher price-to-book ratios and higher forecasted growth values. The Russell 1000® Index is an index of approximately 1,000 of the largest U.S. companies based on a combination of market capitalization and current index membership. The Index is unmanaged and its returns do not include any sales charges or fees. Such costs would lower performance. It is not possible to invest directly in an index.
* Inception dates of November 9, 1994 for Class X and July 24, 2000 for Class Y.
9
Morgan Stanley Select Dimensions Investment Series
Letter to the Shareholders n December 31, 2012 (unaudited) continued
top contributor in the sector. An underweight to the consumer staples sector benefited relative performance as well.
There is no guarantee that any sectors mentioned will continue to perform as discussed above or that securities in such sectors will be held by the Portfolio in the future.
Focus Growth Portfolio
For the 12-month period ended December 31, 2012, Select Dimensions – Focus Growth Portfolio Class X shares produced a total return of 14.10%, underperforming the Russell 1000® Growth Index (the "Index"), which returned 15.26%. For the same period, the Portfolio's Class Y shares returned 13.83%. Past performance is no guarantee of future results.
The performance of the Portfolio's two share classes varies because each has different expenses. The Portfolio's total returns assume the reinvestment of all distributions but do not reflect the deduction of any charges by your insurance company. Such costs would lower performance.
Stock selection in the technology sector dampened relative returns, with a holding in an online deals provider detracting the most. Stock selection in materials and processing was detrimental as well, driven by weakness from a position in a rare earths miner. Another area of weakness was the producer durables sector. Both stock selection and an underweight in the sector were unfavorable to relative results. Holdings in a global logistics firm and a global consumer goods sourcing company
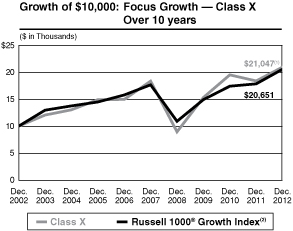
Performance data quoted represents past performance, which is no guarantee of future results and current performance may be lower or higher than the figures shown. For most recent month-end performance figures, please contact the issuing insurance company or speak with your Financial Advisor. Investment return and principal value will fluctuate. When you sell Portfolio shares, they may be worth less than their original cost. Total returns do not reflect the deduction of taxes that a shareholder would pay on Portfolio distributions or the redemption of Portfolio shares. Performance for Class Y shares will vary from the performance of Class X shares due to differences in expenses. Performance assumes reinvestment of all distributions for the underlying portfolio based on net asset value (NAV). It does not reflect the deduction of insurance expenses, an annual contract maintenance fee, or surrender charges. If performance information included the effect of these additional charges, the total returns would be lower.
Average Annual Total Returns as of December 31, 2012
| | | 1 Year | | 5 Years | | 10 Years | | Since Inception* | |
Class X | | | 14.10 | % | | | 2.72 | % | | | 7.73 | % | | | 8.94 | % | |
Class Y | | | 13.83 | % | | | 2.46 | % | | | 7.45 | % | | | 0.61 | % | |
(1) Ending value on December 31, 2012 for the underlying portfolio. This figure does not reflect the deduction of any account fees or sales charges.
(2) The Russell 1000® Growth Index measures the performance of the large-cap growth segment of the U.S. equity universe. It includes those Russell 1000® Index companies with higher price-to-book ratios and higher forecasted growth values. The Russell 1000® Index is an index of approximately 1,000 of the largest U.S. companies based on a combination of market capitalization and current index membership. The Index is unmanaged and its returns do not include any sales charges or fees. Such costs would lower performance. It is not possible to invest directly in an index.
* Inception dates of November 9, 1994 for Class X and July 24, 2000 for Class Y.
10
Morgan Stanley Select Dimensions Investment Series
Letter to the Shareholders n December 31, 2012 (unaudited) continued
based in China (and not represented in the Index) were the main detractors.
Conversely, stock selection in the consumer discretionary sector was the largest contributor to relative performance. Within the sector, a position in an online retailer led gains. The financial services sector also drove positive relative performance, due to both stock selection and an overweight in the sector. A holding in a global asset manager focused on property, power and infrastructure assets was the top contributor in the sector. An underweight to the consumer staples sector benefited relative performance as well.
There is no guarantee that any sectors mentioned will continue to perform as discussed above or that securities in such sectors will be held by the Portfolio in the future.
Multi Cap Growth Portfolio
For the 12-month period ended December 31, 2012, Select Dimensions – Multi Cap Growth Portfolio Class X shares produced a total return of 11.31%, underperforming the Russell 3000® Growth Index (the "Index"), which returned 15.21%. For the same period, the Portfolio's Class Y shares returned 11.11%. Past performance is no guarantee of future results.
The performance of the Portfolio's two share classes varies because each has different expenses. The Portfolio's total returns assume the reinvestment of all distributions but do not reflect the deduction of any charges by your insurance company. Such costs would lower performance.
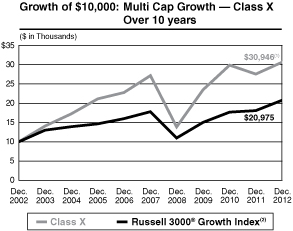
Performance data quoted represents past performance, which is no guarantee of future results and current performance may be lower or higher than the figures shown. For most recent month-end performance figures, please contact the issuing insurance company or speak with your Financial Advisor. Investment return and principal value will fluctuate. When you sell Portfolio shares, they may be worth less than their original cost. Total returns do not reflect the deduction of taxes that a shareholder would pay on Portfolio distributions or the redemption of Portfolio shares. Performance for Class Y shares will vary from the performance of Class X shares due to differences in expenses. Performance assumes reinvestment of all distributions for the underlying portfolio based on net asset value (NAV). It does not reflect the deduction of insurance expenses, an annual contract maintenance fee, or surrender charges. If performance information included the effect of these additional charges, the total returns would be lower.
Average Annual Total Returns as of December 31, 2012
| | | 1 Year | | 5 Years | | 10 Years | | Since Inception* | |
Class X | | | 11.31 | % | | | 2.46 | % | | | 11.96 | % | | | 4.05 | % | |
Class Y | | | 11.11 | % | | | 2.21 | % | | | 11.69 | % | | | –3.07 | % | |
(1) Ending value on December 31, 2012 for the underlying portfolio. This figure does not reflect the deduction of any account fees or sales charges.
(2) The Russell 3000® Growth Index measures the performance of the broad growth segment of the U.S. equity universe. It includes those Russell 3000® Index companies with higher price-to-book ratios and higher forecasted growth values. The Russell 3000® Index measures the performance of the largest 3000 U.S. companies representing approximately 98% of the investable U.S. equity market. The Index is unmanaged and its returns do not include any sales charges or fees. Such costs would lower performance. It is not possible to invest directly in an index.
* Inception dates of January 21, 1997 for Class X and July 24, 2000 for Class Y.
11
Morgan Stanley Select Dimensions Investment Series
Letter to the Shareholders n December 31, 2012 (unaudited) continued
The technology sector was the largest relative detractor during the period due to unfavorable stock selection. Exposure to an online deals provider was the most detrimental to performance within the sector. Stock selection and a slight overweight to the materials and processing sector hampered relative results. Holdings in two rare earths miners hurt performance. Stock selection in the energy sector also dampened returns, although an underweight in the sector helped slightly.
Positive contributions came from stock selection in health care, where all of the Portfolio's holdings performed well. An underweight in the consumer staples sector was also beneficial to relative returns. Stock selection in the consumer discretionary sector was another area of strength, despite the modestly dampening effect of the Portfolio's underweight in the sector. Within the sector, gains were led by a holding in an online retailer.
There is no guarantee that any sectors mentioned will continue to perform as discussed above or that securities in such sectors will be held by the Portfolio in the future.
Mid Cap Growth Portfolio
For the 12-month period ended December 31, 2012, Select Dimensions – Mid Cap Growth Portfolio Class X shares produced a total return of 8.51%, underperforming the Russell Midcap® Growth Index (the "Index"), which returned 15.81%. For the same period, the Portfolio's Class Y shares returned 8.24%. Past performance is no guarantee of future results.
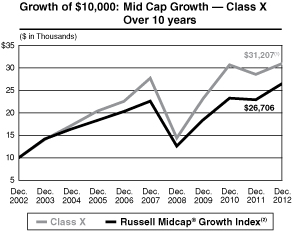
Performance data quoted represents past performance, which is no guarantee of future results and current performance may be lower or higher than the figures shown. For most recent month-end performance figures, please contact the issuing insurance company or speak with your Financial Advisor. Investment return and principal value will fluctuate. When you sell Portfolio shares, they may be worth less than their original cost. Total returns do not reflect the deduction of taxes that a shareholder would pay on Portfolio distributions or the redemption of Portfolio shares. Performance for Class Y shares will vary from the performance of Class X shares due to differences in expenses. Performance assumes reinvestment of all distributions for the underlying portfolio based on net asset value (NAV). It does not reflect the deduction of insurance expenses, an annual contract maintenance fee, or surrender charges. If performance information included the effect of these additional charges, the total returns would be lower.
Average Annual Total Returns as of December 31, 2012
| | | 1 Year | | 5 Years | | 10 Years | | Since Inception* | |
Class X | | | 8.51 | % | | | 2.24 | % | | | 12.05 | % | | | 9.81 | % | |
Class Y | | | 8.24 | % | | | 1.99 | % | | | 11.78 | % | | | 2.85 | % | |
(1) Ending value on December 31, 2012 for the underlying portfolio. This figure does not reflect the deduction of any account fees or sales charges.
(2) The Russell Midcap® Growth Index measures the performance of the mid-cap growth segment of the U.S. equity universe. It includes those Russell Midcap® Index companies with higher price-to-book ratios and higher forecasted growth values. The Russell Midcap® Index is a subset of the Russell 1000® Index and includes approximately 800 of the smallest securities in the Russell 1000® Index, which in turn consists of approximately 1,000 of the largest U.S. securities based on a combination of market capitalization and current index membership. The Index is unmanaged and its returns do not include any sales charges or fees. Such costs would lower performance. It is not possible to invest directly in an index.
* Inception dates of November 9, 1994 for Class X and July 24, 2000 for Class Y.
12
Morgan Stanley Select Dimensions Investment Series
Letter to the Shareholders n December 31, 2012 (unaudited) continued
The performance of the Portfolio's two share classes varies because each has different expenses. The Portfolio's total returns assume the reinvestment of all distributions but do not reflect the deduction of any charges by your insurance company. Such costs would lower performance.
Stock selection in the materials and processing sector hampered relative performance, primarily due to exposure to two rare earths miners. An underweight in the sector also cost the Portfolio relative performance, as materials and processing was Index's best performing sector. The technology sector detracted from performance, hurt by both stock selection and an overweight in the sector. Holdings in a social network gaming developer and an online deals site performed unfavorably. Stock selection in the financial services sector was disadvantageous. An investment data and services provider was the main detractor, with a lack of exposure to groups that performed well during the period such as real estate investment trusts and asset managers further dampening performance.
However, positive contributions came from stock selection in the producer durables sector. A holding in a product testing and inspection firm (its stock is not represented in the Index) was the largest contributor in the sector. The utilities sector was additive as well, although the relative gains somewhat offset by the negative effect of an overweight in the sector. Exposure to an infrastructure asset management company was beneficial to performance.
There is no guarantee that any sectors mentioned will continue to perform as discussed above or that securities in such sectors will be held by the Portfolio in the future.
We appreciate your ongoing support of Morgan Stanley Select Dimensions Investment Series and look forward to continuing to serve your investment needs.
Very truly yours,

Arthur Lev
President and Principal Executive Officer
13
Morgan Stanley Select Dimensions Investment Series
Letter to the Shareholders n December 31, 2012 (unaudited) continued
For More Information About Portfolio Holdings
Each Morgan Stanley fund provides a complete schedule of portfolio holdings in its semiannual and annual reports within 60 days of the end of the fund's second and fourth fiscal quarters. The semiannual reports and the annual reports are filed electronically with the Securities and Exchange Commission (SEC) on Form N-CSRS and Form N-CSR, respectively. Morgan Stanley also delivers the semiannual and annual reports to fund shareholders and makes these reports available on its public web site, www.morganstanley.com. Each Morgan Stanley fund also files a complete schedule of portfolio holdings with the SEC for the fund's first and third fiscal quarters on Form N-Q and monthly holdings for each money market fund on Form N-MFP. Morgan Stanley does not deliver these reports to shareholders, nor are the first and third fiscal quarter reports posted to the Morgan Stanley public web site. However, the holdings for each money market fund are posted to the Morgan Stanley public web site. You may obtain the Form N-Q filings (as well as the Form N-CSR, N-CSRS and N-MFP filings) by accessing the SEC's web site, http://www.sec.gov. You may also review and copy them at the SEC's public reference room in Washington, DC. Information on the operation of the SEC's public reference room may be obtained by calling the SEC at (800) SEC-0330. You can also request copies of these materials, upon payment of a duplicating fee, by electronic request at the SEC's e-mail address (publicinfo@sec.gov) or by writing the public reference section of the SEC, Washington, DC 20549-1520.
Proxy Voting Policy and Procedures and Proxy Voting Record
You may obtain a copy of the Portfolio's Proxy Voting Policy and Procedures without charge, upon request, by calling toll free (800) 869-NEWS or by visiting the Mutual Fund Center on our web site at www.morganstanley.com. It is also available on the SEC's web site at http://www.sec.gov.
You may obtain information regarding how the Portfolios voted proxies relating to portfolio securities during the most recent twelve-month period ended June 30 without charge by visiting the Mutual Fund Center on our web site at www.morganstanley.com. This information is also available on the SEC's web site at http://www.sec.gov.
14
Morgan Stanley Select Dimensions Investment Series
Expense Example n December 31, 2012 (unaudited)
As a shareholder of the Portfolio, you incur two types of costs: (1) insurance company charges; and (2) ongoing costs, including advisory fees; administration fees; distribution and service (12b-1) fees; and other Portfolio expenses. These examples are intended to help you understand your ongoing costs (in dollars) of investing in the Portfolio and to compare these costs with the ongoing costs of investing in other mutual funds.
These examples are based on an investment of $1,000 invested at the beginning of the period and held for the entire period 07/01/12 – 12/31/12.
Actual Expenses
The first line of the table below provides information about actual account values and actual expenses. You may use the information in this line, together with the amount you invested, to estimate the expenses that you paid over the period. Simply divide your account value by $1,000 (for example, an $8,600 account value divided by $1,000 = 8.6), then multiply the result by the number in the first line under the heading entitled "Expenses Paid During Period" to estimate the expenses you paid on your account during this period.
Please note that "Expenses Paid During Period" are grossed up to reflect Fund expenses prior to the effect of Expense Offset (See Note 9 in the Notes to Financial Statements). Therefore, the annualized net expense ratios may differ from the ratio of expenses to average net assets shown in the Financial Highlights.
Hypothetical Example for Comparison Purposes
The second line of the table below provides information about hypothetical expenses based on the Portfolio's actual expense ratio and an assumed rate of return of 5% per year before expenses, which is not the Portfolio's actual return. The hypothetical account values and expenses may not be used to estimate the actual ending account balance or expenses you paid for the period. You may use this information to compare the ongoing cost of investing in the Portfolio and other funds. To do so, compare this 5% hypothetical example with the 5% hypothetical examples that appear in the shareholder reports of the other funds.
Please note that the expenses shown in the table are meant to highlight your ongoing costs only and do not reflect any insurance company charges. Therefore, the second line of the table is useful in comparing ongoing costs, and will not help you determine the relative total cost of owning different funds. In addition, if these insurance company charges were included, your costs would have been higher.
15
Morgan Stanley Select Dimensions Investment Series
Expense Example n December 31, 2012 (unaudited) continued
Money Market
| | | Beginning
Account Value | | Ending
Account Value | | Expenses Paid
During Period@ | |
| | | 07/01/12 | | 12/31/12 | | 07/01/12 –
12/31/12 | |
Class X | |
| Actual (0.01% return) | | $ | 1,000.00 | | | $ | 1,000.10 | | | $ | 1.47 | | |
| Hypothetical (5% annual return before expenses) | | $ | 1,000.00 | | | $ | 1,023.81 | | | $ | 1.48 | | |
Class Y | |
| Actual (0.01% return) | | $ | 1,000.00 | | | $ | 1,000.10 | | | $ | 1.47 | | |
| Hypothetical (5% annual return before expenses) | | $ | 1,000.00 | | | $ | 1,023.81 | | | $ | 1.48 | | |
@ Expenses are equal to the Portfolio's annualized expense ratios of 0.29% and 0.29% for Class X and Class Y shares, respectively, multiplied by the average account value over the period, multiplied by 185/366 (to reflect the one-half year period). If the Portfolio had borne all of its expenses, the annualized expense ratios would have been 0.66% and 0.91% for Class X and Class Y shares, respectively.
Flexible Income
| | | Beginning
Account Value | | Ending
Account Value | | Expenses Paid
During Period@ | |
| | | 07/01/12 | | 12/31/12 | | 07/01/12 –
12/31/12 | |
Class X | |
| Actual (6.83% return) | | $ | 1,000.00 | | | $ | 1,068.30 | | | $ | 6.13 | | |
| Hypothetical (5% annual return before expenses) | | $ | 1,000.00 | | | $ | 1,019.20 | | | $ | 5.99 | | |
Class Y | |
| Actual (6.70% return) | | $ | 1,000.00 | | | $ | 1,067.00 | | | $ | 7.43 | | |
| Hypothetical (5% annual return before expenses) | | $ | 1,000.00 | | | $ | 1,017.95 | | | $ | 7.25 | | |
@ Expenses are equal to the Portfolio's annualized expense ratios of 1.18% and 1.43% for Class X and Class Y shares, respectively, multiplied by the average account value over the period, multiplied by 184/366 (to reflect the one-half year period).
Global Infrastructure
| | | Beginning
Account Value | | Ending
Account Value | | Expenses Paid
During Period@ | |
| | | 07/01/12 | | 12/31/12 | | 07/01/12 –
12/31/12 | |
Class X | |
| Actual (10.58% return) | | $ | 1,000.00 | | | $ | 1,105.80 | | | $ | 5.98 | | |
| Hypothetical (5% annual return before expenses) | | $ | 1,000.00 | | | $ | 1,019.46 | | | $ | 5.74 | | |
Class Y | |
| Actual (10.40% return) | | $ | 1,000.00 | | | $ | 1,104.00 | | | $ | 7.30 | | |
| Hypothetical (5% annual return before expenses) | | $ | 1,000.00 | | | $ | 1,018.20 | | | $ | 7.00 | | |
@ Expenses are equal to the Portfolio's annualized expense ratios of 1.13% and 1.38% for Class X and Class Y shares, respectively, multiplied by the average account value over the period, multiplied by 184/366 (to reflect the one-half year period).
16
Morgan Stanley Select Dimensions Investment Series
Expense Example n December 31, 2012 (unaudited) continued
Growth Portfolio
| | | Beginning
Account Value | | Ending
Account Value | | Expenses Paid
During Period@ | |
| | | 07/01/12 | | 12/31/12 | | 07/01/12 –
12/31/12 | |
Class X | |
| Actual (3.57% return) | | $ | 1,000.00 | | | $ | 1,035.70 | | | $ | 6.35 | | |
| Hypothetical (5% annual return before expenses) | | $ | 1,000.00 | | | $ | 1,018.90 | | | $ | 6.29 | | |
Class Y | |
| Actual (3.40% return) | | $ | 1,000.00 | | | $ | 1,034.00 | | | $ | 7.62 | | |
| Hypothetical (5% annual return before expenses) | | $ | 1,000.00 | | | $ | 1,017.65 | | | $ | 7.56 | | |
@ Expenses are equal to the Portfolio's annualized expense ratios of 1.24% and 1.49% for Class X and Class Y shares, respectively, multiplied by the average account value over the period, multiplied by 184/366 (to reflect the one-half year period).
Focus Growth
| | | Beginning
Account Value | | Ending
Account Value | | Expenses Paid
During Period@ | |
| | | 07/01/12 | | 12/31/12 | | 07/01/12 –
12/31/12 | |
Class X | |
| Actual (3.01% return) | | $ | 1,000.00 | | | $ | 1,030.10 | | | $ | 4.29 | | |
| Hypothetical (5% annual return before expenses) | | $ | 1,000.00 | | | $ | 1,020.91 | | | $ | 4.27 | | |
Class Y | |
| Actual (2.88% return) | | $ | 1,000.00 | | | $ | 1,028.80 | | | $ | 5.56 | | |
| Hypothetical (5% annual return before expenses) | | $ | 1,000.00 | | | $ | 1,019.66 | | | $ | 5.53 | | |
@ Expenses are equal to the Portfolio's annualized expense ratios of 0.84% and 1.09% for Class X and Class Y shares, respectively, multiplied by the average account value over the period, multiplied by 184/366 (to reflect the one-half year period).
Multi Cap Growth
| | | Beginning
Account Value | | Ending
Account Value | | Expenses Paid
During Period@ | |
| | | 07/01/12 | | 12/31/12 | | 07/01/12 –
12/31/12 | |
Class X | |
| Actual (1.93% return) | | $ | 1,000.00 | | | $ | 1,019.30 | | | $ | 7.51 | | |
| Hypothetical (5% annual return before expenses) | | $ | 1,000.00 | | | $ | 1,017.70 | | | $ | 7.51 | | |
Class Y | |
| Actual (1.86% return) | | $ | 1,000.00 | | | $ | 1,018.60 | | | $ | 8.78 | | |
| Hypothetical (5% annual return before expenses) | | $ | 1,000.00 | | | $ | 1,016.44 | | | $ | 8.77 | | |
@ Expenses are equal to the Portfolio's annualized expense ratios of 1.48% and 1.73% for Class X and Class Y shares, respectively, multiplied by the average account value over the period, multiplied by 184/366 (to reflect the one-half year period).
17
Morgan Stanley Select Dimensions Investment Series
Expense Example n December 31, 2012 (unaudited) continued
Mid Cap Growth
| | | Beginning
Account Value | | Ending
Account Value | | Expenses Paid
During Period@ | |
| | | 07/01/12 | | 12/31/12 | | 07/01/12 –
12/31/12 | |
Class X | |
| Actual (2.02% return) | | $ | 1,000.00 | | | $ | 1,020.20 | | | $ | 5.79 | | |
| Hypothetical (5% annual return before expenses) | | $ | 1,000.00 | | | $ | 1,019.41 | | | $ | 5.79 | | |
Class Y | |
| Actual (1.87% return) | | $ | 1,000.00 | | | $ | 1,018.70 | | | $ | 7.05 | | |
| Hypothetical (5% annual return before expenses) | | $ | 1,000.00 | | | $ | 1,018.15 | | | $ | 7.05 | | |
@ Expenses are equal to the Portfolio's annualized expense ratios of 1.14% and 1.39% for Class X and Class Y shares, respectively, multiplied by the average account value over the period, multiplied by 184/366 (to reflect the one-half year period).
18
Money Market
Portfolio of Investments n December 31, 2012
PRINCIPAL
AMOUNT
(000) | |
| | ANNUALIZED
YIELD
ON DATE OF
PURCHASE | | MATURITY
DATE | | VALUE | |
| | | Repurchase Agreements (50.3%) | |
$ | 10,000 | | | Bank of Nova Scotia, (dated 12/31/12;
proceeds $10,000,100; fully collateralized
by a U.S. Government Obligation; U.S.
Treasury Note 1.88% due 06/30/15;
valued at $10,200,000) | | | 0.18 | % | | 01/02/13 | | $ | 10,000,000 | | |
| | 2,000 | | | Barclays Capital, Inc., (dated 12/26/12;
proceeds $2,000,054; fully collateralized
by a U.S. Government Obligation; U.S.
Treasury Note 2.13% due 11/30/14;
valued at $2,040,016) | | | 0.14 | | | 01/02/13 | | | 2,000,000 | | |
| | 1,000 | | | BNP Paribas Securities Corp.,
(dated 12/28/12; proceeds $1,000,019;
fully collateralized by U.S. Government
Agencies; Federal Home Loan Mortgage
Corporation 5.50% due 02/01/36; Federal
National Mortgage Association 2.29% - 5.00%
due 09/01/19 - 10/01/35;
valued at $1,030,000) | | | 0.10 | | | 01/04/13 | | | 1,000,000 | | |
| | 1,000 | | | BNP Paribas Securities Corp., (dated 12/06/12;
proceeds $1,001,006; fully collateralized by
U.S. Government Agencies; Federal Home
Loan Mortgage Corporation 5.50%
due 03/01/34; Federal National Mortgage
Association 4.50% - 5.50%
due 03/01/21 - 09/01/41; valued at
$1,030,000) (Demand 01/07/13) | | | 0.20 | (a) | | 06/05/13 | | | 1,000,000 | | |
| | 1,000 | | | BNP Paribas Securities Corp., (dated 10/24/12;
proceeds $1,001,062; fully collateralized by
U.S. Government Agencies; Federal Home
Loan Mortgage Corporation 5.50%
due 04/01/16; Federal National Mortgage
Association 5.50% due 04/01/18;
Government National Mortgage Association
3.00% due 10/20/42; valued at $1,030,001)
(Demand 01/07/13) | | | 0.21 | (a) | | 04/24/13 | | | 1,000,000 | | |
See Notes to Financial Statements
19
Money Market
Portfolio of Investments n December 31, 2012 continued
PRINCIPAL
AMOUNT
(000) | |
| | ANNUALIZED
YIELD
ON DATE OF
PURCHASE | | MATURITY
DATE | | VALUE | |
$ | 1,000 | | | BNP Paribas Securities Corp., (dated 12/04/12;
proceeds $1,001,056; fully collateralized by
U.S. Government Agencies; Federal Home
Loan Mortgage Corporation 5.00% - 5.50%
due 03/01/34 - 10/01/35; Federal National
Mortgage Association 4.50% due 02/01/41;
valued at $1,030,000) (Demand 01/07/13) | | | 0.21 | (a) % | | 06/03/13 | | $ | 1,000,000 | | |
| | 9,620 | | | BNP Paribas Securities Corp., (dated 12/31/12;
proceeds $9,620,118; fully collateralized by
U.S. Government Agencies; Government
National Mortgage Association 2.50% - 7.10%
due 09/15/18 - 10/15/54;
valued at $9,908,601) | | | 0.22 | | | 01/02/13 | | | 9,620,000 | | |
| | 10,000 | | | Mizuho Securities USA, Inc., (dated 12/31/12;
proceeds $10,000,156; fully collateralized
by a U.S. Government Agency; Government
National Mortgage Association 5.00%
due 08/15/40; valued at $10,300,000) | | | 0.28 | | | 01/02/13 | | | 10,000,000 | | |
| | | Total Repurchase Agreements
(Cost $35,620,000) | | | 35,620,000 | | |
| | | Commercial Paper (24.9%) | |
| | | Automobiles (5.1%) | |
| | 2,250 | | | American Honda Finance Corp. | | | 0.15 | | | 01/25/13 | | | 2,249,775 | | |
| | 1,360 | | | Toyota Motor Credit Corp. | | | 0.17 - 0.25 | | | 01/04/13 - 02/13/13 | | | 1,359,822 | | |
| | | 3,609,597 | | |
| | | Food & Beverage (0.7%) | |
| | 500 | | | Coca-Cola Co. (b) | | | 0.26 - 0.27 | | | 05/01/13 - 05/14/13 | | | 499,540 | | |
| | | International Banks (19.1%) | |
| | 350 | | | ABN Amro Funding USA LLC (b) | | | 0.32 | | | 02/01/13 | | | 349,907 | | |
| | 3,000 | | | Credit Suisse | | | 0.26 | | | 04/05/13 | | | 2,997,963 | | |
| | 500 | | | DBS Bank Ltd. (b) | | | 0.45 | | | 01/14/13 | | | 499,920 | | |
| | 2,300 | | | Nordea North America, Inc. | | | 0.30 - 0.41 | | | 01/18/13 - 06/12/13 | | | 2,298,641 | | |
| | 3,000 | | | NRW Bank (b) | | | 0.21 - 0.22 | | | 01/09/13 - 02/01/13 | | | 2,999,583 | | |
| | 500 | | | Oversea Chinese Banking | | | 0.48 | | | 01/02/13 | | | 499,993 | | |
| | 3,000 | | | Rabobank USA Financial Corp. | | | 0.38 - 0.52 | | | 02/01/13 - 04/05/13 | | | 2,998,134 | | |
| | 625 | | | Svenska Handelsbanken AB (b) | | | 0.31 | | | 05/01/13 | | | 624,375 | | |
| | 300 | | | Westpac Securities NZ Ltd. (b) | | | 0.30 | | | 05/17/13 | | | 299,660 | | |
| | | | 13,568,176 | | |
| | | Total Commercial Paper
(Cost $17,677,313) | | | 17,677,313 | | |
See Notes to Financial Statements
20
Money Market
Portfolio of Investments n December 31, 2012 continued
PRINCIPAL
AMOUNT
(000) | |
| | ANNUALIZED
YIELD
ON DATE OF
PURCHASE | | MATURITY
DATE | | VALUE | |
| | | Certificates of Deposit (5.3%) | |
| | | International Banks | |
$ | 450 | | | Bank of Montreal | | | 0.30 | % | | 05/09/13 - 05/13/13 | | $ | 450,000 | | |
| | 2,300 | | | Sumitomo Mitsui Banking Corp. | | | 0.26 | | | 03/14/13 - 04/05/13 | | | 2,299,979 | | |
| | 1,000 | | | Svenska Handelsbanken AB | | | 0.31 | | | 06/05/13 | | | 1,000,022 | | |
| | | Total Certificates of Deposit
(Cost $3,750,001) | | | 3,750,001 | | |
| |
| |
COUPON
RATE(a) | |
DEMAND
DATE(c) | |
| |
| |
| | | Floating Rate Notes (15.3%) | |
| | | International Banks | |
| | 2,500 | | | Bank of Nova Scotia | | | 0.31 - 0.40 | % | | 01/02/13 - 01/28/13 | | 04/26/13 - 07/02/13 | | | 2,499,953 | | |
| | 2,000 | | | Deutsche Bank AG | | | 0.71 | | | 03/15/13 | | 03/15/13 | | | 2,000,000 | | |
| | 1,300 | | | National Australia Bank | | | 0.31 | | | 02/11/13 | | 08/09/13 | | | 1,300,000 | | |
| | 1,000 | | | Royal Bank of Canada | | | 0.40 | | | 01/11/13 | | 07/11/13 | | | 1,000,000 | | |
| | 2,510 | | | Toronto Dominion Bank | | | 0.31 - 0.32 | | | 01/22/13 - 03/13/13 | | 07/26/13 - 10/21/13 | | | 2,510,000 | | |
| | 1,500 | | | Westpac Banking Corp. (b) | | | 0.31 - 0.40 | | | 01/03/13 - 02/27/13 | | 04/03/13 - 08/27/13 | | | 1,499,960 | | |
| | | | | Total Floating Rate Notes
(Cost $10,809,913) | | | | | | | | | 10,809,913 | | |
| | | Tax-Exempt Instruments (4.2%) | |
| | | Weekly Variable Rate Bond (2.8%) | |
| | 2,000 | | | Miami-Dade County, FL,
Professional Sports Franchise
Facilities Tax Ser 2009 E | | | 0.15 | | | 01/07/13 | | 10/01/48 | | | 2,000,000 | | |
| | |
| | COUPON
RATE | | YIELD TO
MATURITY
ON DATE OF
PURCHASE | |
| |
| |
| | | Municipal Bond (1.4%) | |
| | 1,000 | | | California, Ser 2012-13
A-2 RANs, dtd 08/23/12 | | | 2.50 | % | | | 0.43 | % | | 06/20/13 | | | 1,009,607 | | |
| | | | | Total Tax-Exempt Instruments
(Cost $3,009,607) | | | | | | | | | 3,009,607 | | |
| | | | | Total Investments
(Cost $70,866,834) | | | | | | | 100.0 | % | | | 70,866,834 | | |
| | | | | Liabilities in Excess of Other Assets | | | | | | | 0.0 | (d) | | | (4,524 | ) | |
| | | | | Net Assets | | | | | | | 100.0 | % | | $ | 70,862,310 | | |
See Notes to Financial Statements
21
Money Market
Portfolio of Investments n December 31, 2012 continued
RANs Revenue Anticipation Notes.
(a) Rate shown is the rate in effect at December 31, 2012.
(b) 144A security — Certain conditions for public sale may exist. Unless otherwise noted, these securities are deemed to be liquid.
(c) Date of next interest rate reset.
(d) Amount is less than 0.05%.
MATURITY SCHEDULE†
| 1 - 30 Days | | | 70.3 | % | |
| 31 - 60 Days | | | 10.2 | | |
| 61 - 90 Days | | | 5.0 | | |
| 91 - 120 Days | | | 7.9 | | |
| 121 + Days | | | 6.6 | | |
| | | | 100.0 | % | |
† As a percentage of total investments
See Notes to Financial Statements
22
Flexible Income
Portfolio of Investments n December 31, 2012
PRINCIPAL
AMOUNT
(000) | |
| | COUPON
RATE | | MATURITY
DATE | | VALUE | |
| | | Corporate Bonds (59.8%) | |
| | | Australia (1.3%) | |
| | | Basic Materials | |
$ | 35 | | | FMG Resources August 2006 Pty Ltd. (a) | | | 6.375 | % | | 02/01/16 | | $ | 36,400 | | |
| | 100 | | | FMG Resources August 2006 Pty Ltd. (a) | | | 6.875 | | | 02/01/18 | | | 103,625 | | |
| | | | | | 140,025 | | |
| | | Consumer, Cyclical | |
| | 35 | | | Wesfarmers Ltd. (a) | | | 2.983 | | | 05/18/16 | | | 36,665 | | |
| | | Consumer, Non-Cyclical | |
| | 45 | | | Woolworths Ltd. (a) | | | 4.00 | | | 09/22/20 | | | 48,705 | | |
| | | Finance | |
| | 50 | | | Dexus Diversified Trust/Dexus Office Trust (a) | | | 5.60 | | | 03/15/21 | | | 53,836 | | |
| | | | | Total Australia | | | 279,231 | | |
| | | Belgium (0.1%) | |
| | | Consumer, Non-Cyclical | |
| | 32 | | | Delhaize Group SA | | | 5.70 | | | 10/01/40 | | | 30,095 | | |
| | | Brazil (0.3%) | |
| | | Basic Materials | |
| | 50 | | | Vale Overseas Ltd. | | | 5.625 | | | 09/15/19 | | | 57,100 | | |
| | 5 | | | Vale Overseas Ltd. | | | 6.875 | | | 11/10/39 | | | 6,294 | | |
| | | | | Total Brazil | | | 63,394 | | |
| | | Canada (1.8%) | |
| | | Basic Materials | |
| | 100 | | | HudBay Minerals, Inc. (a) | | | 9.50 | | | 10/01/20 | | | 106,125 | | |
| | 100 | | | Inmet Mining Corp. (a) | | | 8.75 | | | 06/01/20 | | | 109,750 | | |
| | | | | | 215,875 | | |
| | | Communications | |
| | 100 | | | MDC Partners, Inc. | | | 11.00 | | | 11/01/16 | | | 110,375 | | |
| | | Energy | |
| | 50 | | | Canadian Oil Sands Ltd. (a) | | | 7.75 | | | 05/15/19 | | | 63,799 | | |
| | | | | Total Canada | | | 390,049 | | |
| | | France (0.9%) | |
| | | Communications | |
| | 15 | | | France Telecom SA | | | 8.50 | | | 03/01/31 | | | 22,514 | | |
| | | Diversified | |
| | 75 | | | LVMH Moet Hennessy Louis Vuitton SA (a) | | | 1.625 | | | 06/29/17 | | | 76,320 | | |
See Notes to Financial Statements
23
Flexible Income
Portfolio of Investments n December 31, 2012 continued
PRINCIPAL
AMOUNT
(000) | |
| | COUPON
RATE | | MATURITY
DATE | | VALUE | |
| | | Energy | |
$ | 50 | | | Total Capital International SA | | | 2.875 | % | | 02/17/22 | | $ | 52,296 | | |
| | | Finance | |
| | 50 | | | BNP Paribas SA | | | 5.00 | | | 01/15/21 | | | 56,251 | | |
| | | | | Total France | | | 207,381 | | |
| | | Germany (0.2%) | |
| | | Communications | |
| | 25 | | | Deutsche Telekom International Finance BV | | | 8.75 | | | 06/15/30 | | | 37,555 | | |
| | | Greece (0.4%) | |
| | | Industrials | |
| | 100 | | | DryShips, Inc. | | | 5.00 | | | 12/01/14 | | | 79,500 | | |
| | | Ireland (0.2%) | |
| | | Industrials | |
| | 45 | | | CRH America, Inc. | | | 6.00 | | | 09/30/16 | | | 50,606 | | |
| | | Israel (0.4%) | |
| | | Consumer, Non-Cyclical | |
| | 80 | | | Teva Pharmaceutical Finance IV BV | | | 3.65 | | | 11/10/21 | | | 85,781 | | |
| | | Italy (0.6%) | |
| | | Communications | |
| | 25 | | | Telecom Italia Capital SA | | | 6.999 | | | 06/04/18 | | | 28,700 | | |
| | | Utilities | |
| | 100 | | | Enel Finance International N.V. (a) | | | 5.125 | | | 10/07/19 | | | 105,837 | | |
| | | | | Total Italy | | | 134,537 | | |
| | | Mexico (0.5%) | |
| | | Consumer, Non-Cyclical | |
| | 100 | | | Grupo Bimbo SAB de CV (a) | | | 4.875 | | | 06/30/20 | | | 113,883 | | |
| | | Netherlands (0.5%) | |
| | | Finance | |
| | 75 | | | Aegon N.V. | | | 4.625 | | | 12/01/15 | | | 81,817 | | |
| | 25 | | | Cooperatieve Centrale Raiffeisen-Boerenleenbank BA | | | 3.875 | | | 02/08/22 | | | 26,955 | | |
| | | | | Total Netherlands | | | 108,772 | | |
| | | Spain (1.6%) | |
| | | Communications | |
| | 200 | | | Nara Cable Funding Ltd. (a) | | | 8.875 | | | 12/01/18 | | | 201,500 | | |
| | 45 | | | Telefonica Europe BV | | | 8.25 | | | 09/15/30 | | | 53,494 | | |
| | | | | | 254,994 | | |
See Notes to Financial Statements
24
Flexible Income
Portfolio of Investments n December 31, 2012 continued
PRINCIPAL
AMOUNT
(000) | |
| | COUPON
RATE | | MATURITY
DATE | | VALUE | |
| | | Finance | |
$ | 30 | | | Santander Holdings USA, Inc. | | | 4.625 | % | | 04/19/16 | | $ | 31,389 | | |
| | | Utilities | |
| | 75 | | | Iberdrola Finance Ireland Ltd. (a) | | | 5.00 | | | 09/11/19 | | | 78,681 | | |
| | | | | Total Spain | | | 365,064 | | |
| | | Switzerland (0.8%) | |
| | | Finance | |
| | 65 | | | ABB Treasury Center USA, Inc. (a) | | | 2.50 | | | 06/15/16 | | | 67,641 | | |
| | 70 | | | Credit Suisse | | | 5.40 | | | 01/14/20 | | | 78,824 | | |
| | 5 | | | Credit Suisse | | | 6.00 | | | 02/15/18 | | | 5,755 | | |
| | | | | | 152,220 | | |
| | | Industrials | |
| | 25 | | | Holcim US Finance Sarl & Cie SCS (a) | | | 6.00 | | | 12/30/19 | | | 28,397 | | |
| | | | | Total Switzerland | | | 180,617 | | |
| | | United Kingdom (2.7%) | |
| | | Communications | |
| | 100 | | | WPP Finance UK | | | 8.00 | | | 09/15/14 | | | 110,629 | | |
| | | Consumer, Non-Cyclical | |
| | 50 | | | Diageo Capital PLC | | | 1.50 | | | 05/11/17 | | | 50,760 | | |
| | | Finance | |
| | 120 | | | Nationwide Building Society (a) | | | 6.25 | | | 02/25/20 | | | 141,934 | | |
| | | Industrials | |
| | 100 | | | BAA Funding Ltd. (a) | | | 4.875 | | | 07/15/21 | | | 109,326 | | |
| | 200 | | | CEVA Group PLC (a) | | | 8.375 | | | 12/01/17 | | | 199,000 | | |
| | | | | | 308,326 | | |
| | | | | Total United Kingdom | | | 611,649 | | |
| | | United States (47.5%) | |
| | | Basic Materials | |
| | 100 | | | American Gilsonite Co. (a) | | | 11.50 | | | 09/01/17 | | | 103,500 | | |
| | 40 | | | Barrick North America Finance LLC | | | 4.40 | | | 05/30/21 | | | 43,943 | | |
| | 65 | | | Georgia-Pacific LLC | | | 8.875 | | | 05/15/31 | | | 97,723 | | |
| | 100 | | | Kraton Polymers LLC/Kraton Polymers Capital Corp. | | | 6.75 | | | 03/01/19 | | | 103,875 | | |
| | 100 | | | Prince Mineral Holding Corp. (a) | | | 11.50 | | | 12/15/19 | | | 104,000 | | |
| | 100 | | | Taminco Acquisition Corp. (a) | | | 9.125 | (b) | | 12/15/17 | | | 99,250 | | |
| | 74 | | | Tronox Finance LLC (a) | | | 6.375 | | | 08/15/20 | | | 75,018 | | |
| | | | | | 627,309 | | |
See Notes to Financial Statements
25
Flexible Income
Portfolio of Investments n December 31, 2012 continued
PRINCIPAL
AMOUNT
(000) | |
| | COUPON
RATE | | MATURITY
DATE | | VALUE | |
| | | Communications | |
$ | 25 | | | CC Holdings GS V LLC (a) | | | 3.849 | % | | 04/15/23 | | $ | 25,487 | | |
| | 140 | | | CCO Holdings LLC/CCO Holdings Capital Corp. | | | 6.50 | | | 04/30/21 | | | 151,725 | | |
| | 30 | | | CenturyLink, Inc. | | | 6.45 | | | 06/15/21 | | | 33,205 | | |
| | 50 | | | Crown Castle International Corp. (a) | | | 5.25 | | | 01/15/23 | | | 53,687 | | |
| | 100 | | | CSC Holdings LLC | | | 8.625 | | | 02/15/19 | | | 120,000 | | |
| | 25 | | | DirecTV Holdings LLC/DirecTV Financing Co., Inc. | | | 3.80 | | | 03/15/22 | | | 25,841 | | |
| | 100 | | | DISH DBS Corp. | | | 6.75 | | | 06/01/21 | | | 114,500 | | |
| | 100 | | | GXS Worldwide, Inc. | | | 9.75 | | | 06/15/15 | | | 104,625 | | |
| | 150 | | | Harron Communications LP/Harron Finance Corp. (a) | | | 9.125 | | | 04/01/20 | | | 165,000 | | |
| | 100 | | | inVentiv Health, Inc. (a) | | | 9.00 | | | 01/15/18 | | | 101,250 | | |
| | 100 | | | Mediacom LLC/Mediacom Capital Corp. | | | 7.25 | | | 02/15/22 | | | 108,000 | | |
| | 50 | | | Motorola Solutions, Inc. | | | 3.75 | | | 05/15/22 | | | 51,186 | | |
| | 25 | | | NBC Universal Media LLC | | | 5.95 | | | 04/01/41 | | | 30,766 | | |
| | 50 | | | Omnicom Group, Inc. | | | 3.625 | | | 05/01/22 | | | 52,189 | | |
| | 25 | | | Time Warner Cable, Inc. | | | 4.50 | | | 09/15/42 | | | 24,480 | | |
| | 25 | | | Time Warner, Inc. | | | 4.90 | | | 06/15/42 | | | 26,926 | | |
| | 65 | | | Verizon Communications, Inc. | | | 6.35 | | | 04/01/19 | | | 82,256 | | |
| | 70 | | | XM Satellite Radio, Inc. (a) | | | 7.625 | | | 11/01/18 | | | 78,400 | | |
| | | | | | 1,349,523 | | |
| | | Consumer, Cyclical | |
| | 70 | | | Ameristar Casinos, Inc. | | | 7.50 | | | 04/15/21 | | | 76,213 | | |
| | 50 | | | Caesars Entertainment Operating Co., Inc. | | | 8.50 | | | 02/15/20 | | | 49,781 | | |
| | 80 | | | Caesars Entertainment Operating Co., Inc. | | | 10.00 | | | 12/15/18 | | | 53,400 | | |
| | 100 | | | CCM Merger, Inc. (a) | | | 9.125 | | | 05/01/19 | | | 101,250 | | |
| | 100 | | | Chester Downs & Marina LLC (a) | | | 9.25 | | | 02/01/20 | | | 98,750 | | |
| | 150 | | | Continental Airlines 2012-3 Class C Pass-Thru
Certificates | | | 6.125 | | | 04/29/18 | | | 151,125 | | |
| | 125 | | | Dana Holding Corp. | | | 6.50 | | | 02/15/19 | | | 134,062 | | |
| | 100 | | | Exide Technologies | | | 8.625 | | | 02/01/18 | | | 85,250 | | |
| | 30 | | | Gap, Inc. (The) | | | 5.95 | | | 04/12/21 | | | 34,378 | | |
| | 65 | | | Home Depot, Inc. | | | 5.875 | | | 12/16/36 | | | 85,729 | | |
| | 150 | | | IDQ Holdings, Inc. (a) | | | 11.50 | | | 04/01/17 | | | 162,375 | | |
| | 100 | | | Levi Strauss & Co. | | | 7.625 | | | 05/15/20 | | | 109,500 | | |
| | 100 | | | Logan's Roadhouse, Inc. | | | 10.75 | | | 10/15/17 | | | 93,375 | | |
| | 100 | | | MGM Resorts International | | | 7.75 | | | 03/15/22 | | | 107,500 | | |
| | 50 | | | QVC, Inc. (a) | | | 7.125 | | | 04/15/17 | | | 52,438 | | |
| | 299 | | | Resort at Summerlin LP, Series B (c)(d)(e)(f) | | | 13.00 | (b) | | 12/15/07 | | | 0 | | |
| | 100 | | | Sabre Holdings Corp. | | | 8.35 | | | 03/15/16 | | | 107,000 | | |
| | 100 | | | Tenneco, Inc. | | | 7.75 | | | 08/15/18 | | | 109,000 | | |
See Notes to Financial Statements
26
Flexible Income
Portfolio of Investments n December 31, 2012 continued
PRINCIPAL
AMOUNT
(000) | |
| | COUPON
RATE | | MATURITY
DATE | | VALUE | |
$ | 150 | | | VWR Funding, Inc. (a) | | | 7.25 | % | | 09/15/17 | | $ | 158,250 | | |
| | 35 | | | Wal-Mart Stores, Inc. | | | 5.25 | | | 09/01/35 | | | 42,669 | | |
| | 70 | | | Wyndham Worldwide Corp. | | | 4.25 | | | 03/01/22 | | | 72,410 | | |
| | 45 | | | Wynn Las Vegas LLC/Wynn Las Vegas Capital Corp. | | | 7.75 | | | 08/15/20 | | | 51,525 | | |
| | 30 | | | Yum! Brands, Inc. | | | 6.875 | | | 11/15/37 | | | 41,104 | | |
| | | | | | 1,977,084 | | |
| | | Consumer, Non-Cyclical | |
| | 30 | | | AbbVie, Inc. (a) | | | 4.40 | | | 11/06/42 | | | 32,030 | | |
| | 50 | | | Aetna, Inc. | | | 2.75 | | | 11/15/22 | | | 49,695 | | |
| | 25 | | | Altria Group, Inc. | | | 2.85 | | | 08/09/22 | | | 24,790 | | |
| | 25 | | | Amgen, Inc. | | | 3.875 | | | 11/15/21 | | | 27,505 | | |
| | 116 | | | Armored Autogroup, Inc. | | | 9.25 | | | 11/01/18 | | | 98,890 | | |
| | 40 | | | Boston Scientific Corp. | | | 6.00 | | | 01/15/20 | | | 46,726 | | |
| | 25 | | | Cigna Corp. | | | 2.75 | | | 11/15/16 | | | 26,323 | | |
| | 45 | | | Coventry Health Care, Inc. | | | 5.45 | | | 06/15/21 | | | 53,578 | | |
| | 40 | | | Express Scripts Holding Co. (a) | | | 2.65 | | | 02/15/17 | | | 41,616 | | |
| | 25 | | | Express Scripts Holding Co. (a) | | | 3.90 | | | 02/15/22 | | | 27,008 | | |
| | 100 | | | Gilead Sciences, Inc. | | | 4.50 | | | 04/01/21 | | | 114,485 | | |
| | 160 | | | Kindred Healthcare, Inc. | | | 8.25 | | | 06/01/19 | | | 156,400 | | |
| | 26 | | | Kraft Foods Group, Inc. (a) | | | 5.375 | | | 02/10/20 | | | 31,266 | | |
| | 50 | | | Life Technologies Corp. | | | 6.00 | | | 03/01/20 | | | 59,348 | | |
| | 24 | | | Mondelez International, Inc. | | | 5.375 | | | 02/10/20 | | | 29,018 | | |
| | 100 | | | ServiceMaster Co. | | | 8.00 | | | 02/15/20 | | | 104,750 | | |
| | 100 | | | Smithfield Foods, Inc. | | | 6.625 | | | 08/15/22 | | | 110,750 | | |
| | 20 | | | UnitedHealth Group, Inc. | | | 1.40 | | | 10/15/17 | | | 20,054 | | |
| | 10 | | | UnitedHealth Group, Inc. | | | 2.75 | | | 02/15/23 | | | 10,112 | | |
| | 35 | | | Verisk Analytics, Inc. | | | 5.80 | | | 05/01/21 | | | 39,288 | | |
| | | | | | 1,103,632 | | |
| | | Energy | |
| | 100 | | | Concho Resources, Inc. | | | 7.00 | | | 01/15/21 | | | 112,000 | | |
| | 100 | | | Continental Resources, Inc. | | | 5.00 | | | 09/15/22 | | | 108,250 | | |
| | 100 | | | Crestwood Midstream Partners LP/Crestwood
Midstream Finance Corp. | | | 7.75 | | | 04/01/19 | | | 104,250 | | |
| | 100 | | | Crosstex Energy LP/Crosstex Energy Finance
Corp. (a) | | | 7.125 | | | 06/01/22 | | | 104,750 | | |
| | 30 | | | Marathon Petroleum Corp. | | | 5.125 | | | 03/01/21 | | | 35,365 | | |
| | 150 | | | Northern Oil and Gas, Inc. | | | 8.00 | | | 06/01/20 | | | 153,750 | | |
| | 100 | | | Pioneer Natural Resources Co. | | | 7.50 | | | 01/15/20 | | | 126,881 | | |
| | 100 | | | SM Energy Co. | | | 6.50 | | | 01/01/23 | | | 107,500 | | |
| | 50 | | | Tesoro Corp. | | | 5.375 | | | 10/01/22 | | | 53,500 | | |
See Notes to Financial Statements
27
Flexible Income
Portfolio of Investments n December 31, 2012 continued
PRINCIPAL
AMOUNT
(000) | |
| | COUPON
RATE | | MATURITY
DATE | | VALUE | |
$ | 50 | | | Weatherford International Ltd. | | | 4.50 | % | | 04/15/22 | | $ | 53,162 | | |
| | 80 | | | Williams Cos., Inc. (The) | | | 7.875 | | | 09/01/21 | | | 103,239 | | |
| | | | | | 1,062,647 | | |
| | | Finance | |
| | 25 | | | Alexandria Real Estate Equities, Inc. | | | 4.60 | | | 04/01/22 | | | 26,884 | | |
| | 72 | | | Citigroup, Inc. (See Note 6) | | | 8.50 | | | 05/22/19 | | | 96,940 | | |
| | 70 | | | CNA Financial Corp. | | | 5.75 | | | 08/15/21 | | | 82,246 | | |
| | 125 | | | DPL, Inc. | | | 7.25 | | | 10/15/21 | | | 134,375 | | |
| | 200 | | | Ford Motor Credit Co., LLC | | | 4.207 | | | 04/15/16 | | | 213,487 | | |
| | 40 | | | General Electric Capital Corp. | | | 5.30 | | | 02/11/21 | | | 46,509 | | |
| | 50 | | | Genworth Financial, Inc. | | | 7.20 | | | 02/15/21 | | | 54,084 | | |
| | 135 | | | Goldman Sachs Group, Inc. (The) | | | 6.15 | | | 04/01/18 | | | 158,775 | | |
| | 35 | | | Harley-Davidson Funding Corp. (a) | | | 6.80 | | | 06/15/18 | | | 43,042 | | |
| | 60 | | | Hartford Financial Services Group, Inc.
(See Note 6) | | | 5.50 | | | 03/30/20 | | | 69,819 | | |
| | 75 | | | HCP, Inc. | | | 5.625 | | | 05/01/17 | | | 85,743 | | |
| | 100 | | | Host Hotels & Resorts LP | | | 6.00 | | | 10/01/21 | | | 115,250 | | |
| | 25 | | | JPMorgan Chase & Co. | | | 4.50 | | | 01/24/22 | | | 28,334 | | |
| | 65 | | | JPMorgan Chase & Co. | | | 4.625 | | | 05/10/21 | | | 74,241 | | |
| | 100 | | | Merrill Lynch & Co., Inc. | | | 6.11 | | | 01/29/37 | | | 109,511 | | |
| | 25 | | | MetLife, Inc. | | | 7.717 | | | 02/15/19 | | | 32,817 | | |
| | 100 | | | Nationstar Mortgage LLC/Nationstar Capital
Corp. (a) | | | 7.875 | | | 10/01/20 | | | 106,000 | | |
| | 35 | | | Nationwide Financial Services, Inc. (a) | | | 5.375 | | | 03/25/21 | | | 37,467 | | |
| | 35 | | | Prudential Financial, Inc., MTN | | | 6.625 | | | 12/01/37 | | | 43,754 | | |
| | 150 | | | Rivers Pittsburgh Borrower LP/Rivers Pittsburgh
Finance Corp. (a) | | | 9.50 | | | 06/15/19 | | | 163,500 | | |
| | 10 | | | Santander Holdings USA, Inc. | | | 3.00 | | | 09/24/15 | | | 10,190 | | |
| | 60 | | | SLM Corp., MTN | | | 8.00 | | | 03/25/20 | | | 68,850 | | |
| | | | | | 1,801,818 | | |
| | | Industrials | |
| | 100 | | | Atkore International, Inc. | | | 9.875 | | | 01/01/18 | | | 106,750 | | |
| | 50 | | | Ball Corp. | | | 5.00 | | | 03/15/22 | | | 53,750 | | |
| | 40 | | | Bemis Co., Inc. | | | 4.50 | | | 10/15/21 | | | 43,417 | | |
| | 100 | | | Cequel Communications Escrow 1 LLC/Cequel
Communications Escrow Capital Corp. (a) | | | 6.375 | | | 09/15/20 | | | 104,625 | | |
| | 100 | | | Consolidated Container Co., LLC/Consolidated
Container Capital, Inc. (a) | | | 10.125 | | | 07/15/20 | | | 107,500 | | |
| | 35 | | | Eaton Corp. (a) | | | 2.75 | | | 11/02/22 | | | 34,967 | | |
| | 75 | | | Graphic Packaging International, Inc. | | | 7.875 | | | 10/01/18 | | | 83,250 | | |
See Notes to Financial Statements
28
Flexible Income
Portfolio of Investments n December 31, 2012 continued
PRINCIPAL
AMOUNT
(000) | |
| | COUPON
RATE | | MATURITY
DATE | | VALUE | |
$ | 150 | | | Heckmann Corp. | | | 9.875 | % | | 04/15/18 | | $ | 155,625 | | |
| | 100 | | | JB Poindexter & Co., Inc. (a) | | | 9.00 | | | 04/01/22 | | | 103,875 | | |
| | 200 | | | Marquette Transportation Co./Marquette
Transportation Finance Corp. | | | 10.875 | | | 01/15/17 | | | 209,000 | | |
| | 100 | | | Pretium Packaging LLC/Pretium Finance, Inc. | | | 11.50 | | | 04/01/16 | | | 103,625 | | |
| | 100 | | | Sealed Air Corp. (a) | | | 8.125 | | | 09/15/19 | | | 113,000 | | |
| | 100 | | | Sequa Corp. (a) | | | 7.00 | | | 12/15/17 | | | 101,125 | | |
| | 100 | | | Silgan Holdings, Inc. | | | 5.00 | | | 04/01/20 | | | 104,250 | | |
| | 50 | | | Sonoco Products Co. | | | 5.75 | | | 11/01/40 | | | 57,766 | | |
| | 150 | | | Tekni-Plex, Inc. (a) | | | 9.75 | | | 06/01/19 | | | 164,250 | | |
| | 100 | | | Terex Corp. | | | 6.50 | | | 04/01/20 | | | 106,500 | | |
| | 30 | | | Union Pacific Corp. | | | 6.125 | | | 02/15/20 | | | 37,624 | | |
| | | | | | 1,790,899 | | |
| | | Technology | |
| | 135 | | | CDW LLC/CDW Finance Corp. | | | 8.50 | | | 04/01/19 | | | 146,812 | | |
| | 100 | | | First Data Corp. | | | 10.55 | | | 09/24/15 | | | 102,875 | | |
| | 45 | | | Hewlett-Packard Co. | | | 4.65 | | | 12/09/21 | | | 45,257 | | |
| | 150 | | | Infor US, Inc. | | | 9.375 | | | 04/01/19 | | | 169,125 | | |
| | 20 | | | Xerox Corp. | | | 6.35 | | | 05/15/18 | | | 23,093 | | |
| | | | | | 487,162 | | |
| | | Utilities | |
| | 100 | | | CMS Energy Corp. | | | 5.05 | | | 03/15/22 | | | 111,946 | | |
| | 40 | | | FirstEnergy Solutions Corp. | | | 6.05 | | | 08/15/21 | | | 45,859 | | |
| | 60 | | | PPL WEM Holdings PLC (a) | | | 3.90 | | | 05/01/16 | | | 63,233 | | |
| | 150 | | | Puget Energy, Inc. | | | 6.50 | | | 12/15/20 | | | 169,273 | | |
| | | | | | 390,311 | | |
| | | | | Total United States | | | 10,590,385 | | |
| | | Total Corporate Bonds
(Cost $12,686,815) | | | 13,328,499 | | |
| | | Sovereign (11.8%) | |
| | | Argentina (0.6%) | |
| | 141 | | | Argentina Boden Bonds | | | 7.00 | | | 10/03/15 | | | 126,630 | | |
| | | Brazil (2.0%) | |
| | 200 | | | Banco Nacional de Desenvolvimento, Economico e
Social (a) | | | 6.369 | | | 06/16/18 | | | 238,000 | | |
| | 150 | | | Brazilian Government International Bond | | | 5.875 | | | 01/15/19 | | | 186,300 | | |
| | 10 | | | Brazilian Government International Bond | | | 7.125 | | | 01/20/37 | | | 15,350 | | |
| | | | | Total Brazil | | | 439,650 | | |
See Notes to Financial Statements
29
Flexible Income
Portfolio of Investments n December 31, 2012 continued
PRINCIPAL
AMOUNT
(000) | |
| | COUPON
RATE | | MATURITY
DATE | | VALUE | |
| | | Indonesia (1.3%) | |
$ | 100 | | | Indonesia Government International Bond | | | 7.75 | % | | 01/17/38 | | $ | 151,500 | | |
| | 100 | | | Indonesia Government International Bond (a) | | | 11.625 | | | 03/04/19 | | | 151,750 | | |
| | | | | Total Indonesia | | | 303,250 | | |
| | | Kazakhstan (0.6%) | |
| | 100 | | | KazMunaiGaz Finance Sub BV (a) | | | 9.125 | | | 07/02/18 | | | 132,625 | | |
| | | Mexico (2.1%) | |
MXN | 810 | | | Mexican Bonos | | | 8.00 | | | 06/11/20 | | | 73,849 | | |
$ | 44 | | | Mexico Government International Bond | | | 5.95 | | | 03/19/19 | | | 54,340 | | |
| | 20 | | | Mexico Government International Bond | | | 6.05 | | | 01/11/40 | | | 26,920 | | |
| | 100 | | | Mexico Government International Bond | | | 6.75 | | | 09/27/34 | | | 144,500 | | |
| | 33 | | | Pemex Project Funding Master Trust | | | 6.625 | | | 06/15/35 | | | 42,075 | | |
| | 25 | | | Pemex Project Funding Master Trust | | | 6.625 | | | 06/15/38 | | | 31,812 | | |
| | 60 | | | Petroleos Mexicanos | | | 5.50 | | | 01/21/21 | | | 70,410 | | |
| | 15 | | | Petroleos Mexicanos | | | 8.00 | | | 05/03/19 | | | 19,688 | | |
| | | | | Total Mexico | | | 463,594 | | |
| | | Peru (0.4%) | |
| | 40 | | | Peruvian Government International Bond | | | 7.125 | | | 03/30/19 | | | 52,560 | | |
| | 10 | | | Peruvian Government International Bond | | | 7.35 | | | 07/21/25 | | | 14,540 | | |
| | 16 | | | Peruvian Government International Bond | | | 8.75 | | | 11/21/33 | | | 27,880 | | |
| | | | | Total Peru | | | 94,980 | | |
| | | Russia (1.4%) | |
| | 96 | | | Russian Foreign Bond - Eurobond | | | 7.50 | | | 03/31/30 | | | 123,623 | | |
| | 90 | | | Russian Foreign Bond - Eurobond | | | 12.75 | | | 06/24/28 | | | 182,700 | | |
| | | | | Total Russia | | | 306,323 | | |
| | | Turkey (0.9%) | |
| | 100 | | | Turkey Government International Bond | | | 6.75 | | | 04/03/18 | | | 121,125 | | |
| | 17 | | | Turkey Government International Bond | | | 6.875 | | | 03/17/36 | | | 23,014 | | |
| | 15 | | | Turkey Government International Bond | | | 8.00 | | | 02/14/34 | | | 22,537 | | |
| | 19 | | | Turkey Government International Bond | | | 11.875 | | | 01/15/30 | | | 37,359 | | |
| | | | | Total Turkey | | | 204,035 | | |
| | | Ukraine (0.4%) | |
| | 100 | | | Ukraine Government International Bond | | | 6.75 | | | 11/14/17 | | | 99,500 | | |
| | | Uruguay (0.1%) | |
| | 10 | | | Uruguay Government International Bond | | | 8.00 | | | 11/18/22 | | | 14,570 | | |
See Notes to Financial Statements
30
Flexible Income
Portfolio of Investments n December 31, 2012 continued
PRINCIPAL
AMOUNT
(000) | |
| | COUPON
RATE | | MATURITY
DATE | | VALUE | |
| | | Venezuela (2.0%) | | | |
$ | 130 | | | Petroleos de Venezuela SA | | | 8.50 | % | | 11/02/17 | | $ | 128,700 | | |
| | 20 | | | Venezuela Government International Bond | | | 6.00 | | | 12/09/20 | | | 16,800 | | |
| | 150 | | | Venezuela Government International Bond | | | 7.65 | | | 04/21/25 | | | 132,750 | | |
| | 159 | | | Venezuela Government International Bond | | | 9.25 | | | 09/15/27 | | | 159,795 | | |
| | | | | Total Venezuela | | | 438,045 | | |
| | | | | Total Sovereign
(Cost $2,069,913) | | | 2,623,202 | | |
| | | Municipal Bonds (1.4%) | | | |
| | 15 | | | City of Chicago, IL, O'Hare International Airport
Revenue | | | 6.395 | | | 01/01/40 | | | 19,502 | | |
| | 30 | | | City of New York, NY, Series G-1 | | | 5.968 | | | 03/01/36 | | | 38,244 | | |
| | 75 | | | Illinois State Toll Highway Authority, Highway
Revenue, Build America Bonds | | | 6.184 | | | 01/01/34 | | | 93,336 | | |
| | | Municipal Electric Authority of Georgia | | | |
| | 15 | | | | | | | | 6.637 | | | 04/01/57 | | | 17,867 | | |
| | 20 | | | | | | | | 6.655 | | | 04/01/57 | | | 23,702 | | |
| | 30 | | | New York City, NY, Transitional Finance Authority
Future Tax Secured Revenue | | | 5.267 | | | 05/01/27 | | | 36,656 | | |
| | | State of California, General Obligation Bonds | | | |
| | 40 | | | | | | | | 5.95 | | | 04/01/16 | | | 45,392 | | |
| | 25 | | | | | | | | 6.65 | | | 03/01/22 | | | 31,419 | | |
| | | Total Municipal Bonds
(Cost $251,662) | | | 306,118 | | |
| | | Agency Fixed Rate Mortgages (0.7%) | | | |
| | | Federal National Mortgage Association,
Conventional Pools: | | | | | |
| | 80 | | | | | | | | 6.50 | | | 07/01/29 – 11/01/33 | | | 93,596 | | |
| | 33 | | | | | | | | 7.00 | | | 02/01/33 | | | 39,365 | | |
| | | IO STRIPS | | | |
| | 23 | | | | | | | | 6.50 | | | 12/01/29 | | | 2,356 | | |
| | 17 | | | | | | | | 7.00 | | | 11/01/19 | | | 2,040 | | |
| | 63 | | | | | | | | 8.00 | | | 06/01/35 | | | 14,515 | | |
| | 1 | | | Government National Mortgage Association,
Various Pool | | | 8.00 | | | 06/15/26 | | | 631 | | |
| | | Total Agency Fixed Rate Mortgages
(Cost $122,427) | | | 152,503 | | |
See Notes to Financial Statements
31
Flexible Income
Portfolio of Investments n December 31, 2012 continued
PRINCIPAL
AMOUNT
(000) | |
| | COUPON
RATE | | MATURITY
DATE | | VALUE | |
| | | Asset-Backed Securities (3.0%) | | | |
$ | 100 | | | Ally Master Owner Trust (a) | | | 2.88 | % | | 04/15/15 | | $ | 100,691 | | |
| | 170 | | | Citigroup Mortgage Loan Trust, Inc. (See Note 6) | | | 5.53 | | | 11/25/34 | | | 162,848 | | |
| | 72 | | | CVS Pass-Through Trust | | | 6.036 | | | 12/10/28 | | | 83,833 | | |
| | 125 | | | Ford Credit Floorplan Master Owner Trust (a) | | | 1.909 | (g) | | 02/15/17 | | | 128,686 | | |
| | 177 | | | GSAA Trust | | | 4.751 | (g) | | 06/25/34 | | | 176,585 | | |
| | 20 | | | Specialty Underwriting & Residential Finance | | | 0.75 | (g) | | 05/25/35 | | | 16,841 | | |
| | | Total Asset-Backed Securities
(Cost $653,124) | | | 669,484 | | |
| | | U.S. Treasury Securities (13.1%) | | | |
| | 130 | | | U.S. Treasury Bond | | | 3.875 | | | 08/15/40 | | | 156,264 | | |
| | 302 | | | U.S. Treasury Inflation Indexed Bond | | | 0.125 | | | 07/15/22 | | | 327,727 | | |
| | | U.S. Treasury Notes | | | |
| | 2,266 | | | | | | | | 0.375 | | | 06/15/15 – 11/15/15 | | | 2,269,307 | | |
| | 155 | | | | | | | | 2.25 | | | 03/31/16 | | | 164,264 | | |
| | | Total U.S. Treasury Securities
(Cost $2,855,351) | | | 2,917,562 | | |
| | | Mortgages - Other (8.4%) | | | |
| | 169 | | | Banc of America Alternative Loan Trust | | | 5.913 | (g) | | 10/25/36 | | | 128,102 | | |
| | 48 | | | Banc of America Funding Corp. | | | 6.00 | | | 07/25/37 | | | 38,882 | | |
| | | Countrywide Alternative Loan Trust | | | |
| | 24 | | | | | | | | 5.50 | | | 02/25/36 | | | 19,018 | | |
| | 118 | | | | | | | | 5.50 | | | 05/25/36 | | | 98,425 | | |
| | 89 | | | | | | | | 6.00 | | | 04/25/36 | | | 70,290 | | |
| | 46 | | | | | | | | 6.00 | | | 05/25/36 | | | 36,219 | | |
| | 65 | | | | | | | | 6.00 | | | 12/25/36 | | | 47,699 | | |
| | 157 | | | | | | | | 6.00 | | | 07/25/37 | | | 129,983 | | |
| | 12 | | | PAC | | | 5.50 | | | 02/25/36 | | | 9,693 | | |
| | 43 | | | PAC | | | 6.00 | | | 04/25/36 | | | 33,837 | | |
| | 139 | | | Countrywide Home Loan Mortgage Pass-Through
Trust | | | 0.51 | (g) | | 04/25/46 | | | 32,083 | | |
| | 316 | | | CSMC Mortgage-Backed Trust | | | 5.837 | (g) | | 04/25/37 | | | 185,670 | | |
| | | First Horizon Alternative Mortgage Securities | | | |
| | 33 | | | | | | | | 6.00 | | | 08/25/36 | | | 28,042 | | |
| | 65 | | | | | | | | 6.25 | | | 08/25/36 | | | 56,023 | | |
| | 73 | | | GS Mortgage Securities Corp. (a) | | | 7.50 | (g) | | 09/25/36 | | | 59,410 | | |
| | | JP Morgan Alternative Loan Trust | | | |
| | 172 | | | | | | | | 6.00 | | | 12/25/35 | | | 152,177 | | |
| | 189 | | | | | | | | 6.00 | | | 08/25/36 | | | 174,990 | | |
See Notes to Financial Statements
32
Flexible Income
Portfolio of Investments n December 31, 2012 continued
PRINCIPAL
AMOUNT
(000) | |
| | COUPON
RATE | | MATURITY
DATE | | VALUE | |
| | | Lehman Mortgage Trust, | | | |
$ | 44 | | | | | | | | 5.50 | % | | 11/25/35 | | $ | 44,632 | | |
| | 114 | | | | | | | | 5.50 | | | 02/25/36 | | | 112,660 | | |
| | 187 | | | | | | | | 6.50 | | | 09/25/37 | | | 157,172 | | |
| | 79 | | | Luminent Mortgage Trust | | | 0.38 | (g) | | 10/25/46 | | | 19,044 | | |
| | | RALI Trust | | | |
| | 78 | | | | | | | | 0.71 | (g) | | 03/25/35 | | | 50,944 | | |
| | 89 | | | | | | | | 6.00 | | | 04/25/36 | | | 69,873 | | |
| | 34 | | | | | | | | 6.00 | | | 01/25/37 | | | 26,620 | | |
| | 45 | | | PAC | | | 6.00 | | | 04/25/36 | | | 35,075 | | |
| | 74 | | | Residential Asset Securitization Trust | | | 6.00 | | | 07/25/36 | | | 63,363 | | |
| | | Total Mortgages - Other
(Cost $1,797,984) | | | 1,879,926 | | |
NUMBER OF
SHARES | |
| |
| |
| |
| |
| | | Common Stocks (0.0%) | | | |
| | | Diversified Telecommunication Services | | | |
| | 563 | | | ORBCOMM, Inc. (h) | | | | | | | | | | | 2,207 | | |
| | | Electric Utilities | | | |
| | 13 | | | PNM Resources, Inc. (f) | | | | | | | | | | | 267 | | |
| | | Wireless Telecommunication Services | | | |
| | 49 | | | USA Mobility, Inc. (f) | | | | | | | | | | | 572 | | |
| | | Total Common Stocks
(Cost $365) | | | 3,046 | | |
See Notes to Financial Statements
33
Flexible Income
Portfolio of Investments n December 31, 2012 continued
NUMBER OF
SHARES (000) | |
| |
| |
| | VALUE | |
| | | Short-Term Investment (0.8%) | |
| | | Investment Company | |
| | 183 | | | Morgan Stanley Institutional Liquidity Funds - Money
Market Portfolio - Institutional Class (See Note 6)
(Cost $182,684) | | | | | | | | | | $ | 182,684 | | |
| | | Total Investments
(Cost $20,620,325) (i) | | | | | 99.0 | % | | | 22,063,024 | | |
| | | Other Assets in Excess of Liabilities | | | | | 1.0 | | | | 220,057 | | |
| | | Net Assets | | | | | 100.0 | % | | $ | 22,283,081 | | |
IO Interest Only.
MTN Medium Term Note.
PAC Planned Amortization Class.
STRIPS Separate Trading of Registered Interest and Principal of Securities.
(a) 144A security — Certain conditions for public sale may exist. Unless otherwise noted, these securities are deemed to be liquid.
(b) Payment-in-kind security.
(c) Issuer in bankruptcy.
(d) Non-income producing security; bond in default.
(e) At December 31, 2012, the Portfolio held a fair valued security valued at $0, representing 0.0% of net assets. This security has been fair valued as determined in good faith under procedures established by and under the general supervision of the Fund's Trustees.
(f) Acquired through exchange offer.
(g) Variable/Floating Rate Security — Interest rate changes on these instruments are based on changes in a designated base rate. The rates shown are those in effect on December 31, 2012.
(h) Non-income producing security.
(i) Securities are available for collateral in connection with open foreign currency exchange contracts, futures contracts and swap agreements.
See Notes to Financial Statements
34
Flexible Income
Portfolio of Investments n December 31, 2012 continued
FOREIGN CURRENCY EXCHANGE CONTRACTS OPEN AT DECEMBER 31, 2012:
COUNTERPARTY | | CONTRACTS
TO DELIVER | | IN EXCHANGE
FOR | | DELIVERY
DATE | | UNREALIZED
APPRECIATION
(DEPRECIATION) | |
Goldman Sachs International | | SEK | 960,000 | | | $ | 144,734 | | | 01/10/13 | | $ | (2,862 | ) | |
Wells Fargo Bank | | $ | 148,786 | | | NOK | 840,000 | | | 01/10/13 | | | 2,316 | | |
Net Unrealized Depreciation | | | | | | | | $ | (546 | ) | |
FUTURES CONTRACTS OPEN AT DECEMBER 31, 2012:
NUMBER OF
CONTRACTS | | LONG/SHORT | | DESCRIPTION, DELIVERY
MONTH AND YEAR | | UNDERLYING FACE
AMOUNT AT VALUE | | UNREALIZED
APPRECIATION
(DEPRECIATION) | |
| | 15 | | | Long | | U.S. Treasury 2 yr. Note,
March 2013 | | $ | 3,307,031 | | | $ | 688 | | |
| | 23 | | | Long | | U.S. Treasury 5 yr. Note,
March 2013 | | | 2,861,524 | | | | (4,030 | ) | |
| | 3 | | | Long | | U.S. Treasury Ultra Long Bond,
March 2013 | | | 487,781 | | | | (3,656 | ) | |
| | 2 | | | Short | | U.S. Treasury 30 yr. Bond,
March 2013 | | | (295,000 | ) | | | 4,109 | | |
| | 19 | | | Short | | U.S. Treasury 10 yr. Note,
March 2013 | | | (2,522,844 | ) | | | 8,925 | | |
Net Unrealized Appreciation | | $ | 6,036 | | |
CREDIT DEFAULT SWAP AGREEMENTS OPEN AT DECEMBER 31, 2012:
SWAP
COUNTERPARTY &
REFERENCE
OBLIGATION | | BUY/SELL
PROTECTION | | NOTIONAL
AMOUNT
(000's) | | INTEREST
RATE | | TERMINATION
DATE | | UNREALIZED
APPRECIATION | | UPFRONT
PAYMENTS | | VALUE | | CREDIT
RATING OF
REFERENCE
OBLIGATION† | |
| | | | | | | | | | | | | | | | | (unaudited) | |
JPMorgan
Chase Bank
CDX.NA.IG. 19 | | Sell | | $ | 150 | | | | 1.00 | % | | 12/20/17 | | $ | 264 | | | $ | 119 | | | $ | 383 | | | NR | |
JPMorgan
Chase Bank
Kohl's Corporate | | Buy | | | 150 | | | | 1.00 | | | 12/20/17 | | | 4,775 | | | | 5,197 | | | | 9,972 | | | BBB+ | |
Total Credit Default Swaps | | | | $ | 300 | | | | | | | $ | 5,039 | | | $ | 5,316 | | | $ | 10,355 | | | | |
See Notes to Financial Statements
35
Flexible Income
Portfolio of Investments n December 31, 2012 continued
INTEREST RATE SWAP AGREEMENTS OPEN AT DECEMBER 31, 2012:
SWAP COUNTERPARTY | | NOTIONAL
AMOUNT
(000) | | FLOATING
RATE INDEX | | PAY/RECEIVE
FLOATING RATE | | FIXED
RATE | | TERMINATION
DATE | | UNREALIZED
APPRECIATION
(DEPRECIATION) | |
Barclays Capital | | $ | 1,750 | | | 3 Month LIBOR | | Receive | | | 0.37 | % | | 10/05/14 | | $ | (401 | ) | |
Barclays Capital | | | 480 | | | 3 Month LIBOR | | Receive | | | 0.81 | | | 09/24/17 | | | (1,687 | ) | |
Credit Suisse | | | 1,500 | | | 3 Month LIBOR | | Receive | | | 0.39 | | | 09/25/14 | | | (2,388 | ) | |
Credit Suisse | | | 720 | | | 3 Month LIBOR | | Receive | | | 0.82 | | | 09/13/17 | | | (3,036 | ) | |
Deutsche Bank | | | 1,176 | | | 3 Month LIBOR | | Receive | | | 0.82 | | | 07/24/17 | | | (7,409 | ) | |
Goldman Sachs
International | | | 1,040 | | | 3 Month LIBOR | | Pay | | | 0.43 | | | 12/11/15 | | | 1,250 | | |
Net Unrealized Depreciation | | | | | | | | | | | | $ | (13,671 | ) | |
LIBOR London interbank Offered Rate.
NR Not Rated.
† Credit rating as issued by Standard & Poor's.
Currency Abbreviations:
MXN Mexican New Peso.
NOK Norwegian Krone.
SEK Swedish Krona.
SUMMARY OF INVESTMENTS
PORTFOLIO COMPOSITION | | VALUE | | PERCENT OF
TOTAL
INVESTMENTS | |
Corporate Bonds | | $ | 13,328,499 | | | | 60.4 | % | |
U.S. Treasury Securities | | | 2,917,562 | | | | 13.2 | | |
Sovereign | | | 2,623,202 | | | | 11.9 | | |
Mortgages - Other | | | 1,879,926 | | | | 8.5 | | |
Asset-Backed Securities | | | 669,484 | | | | 3.1 | | |
Municipal Bonds | | | 306,118 | | | | 1.4 | | |
Investment Company | | | 182,684 | | | | 0.8 | | |
Agency Fixed Rate Mortgages | | | 152,503 | | | | 0.7 | | |
Common Stocks | | | 3,046 | | | | 0.0 | * | |
| | | $ | 22,063,024 | ** | | | 100.0 | % | |
* Amount is less than 0.05%.
** Does not include open long/short futures contracts with an underlying face amount of $9,474,180 with net unrealized appreciation of $6,036. Does not include open foreign currency exchange contracts with net unrealized depreciation of $546. Also does not include open swap agreements with net unrealized depreciation of $8,632.
See Notes to Financial Statements
36
Global Infrastructure
Portfolio of Investments n December 31, 2012
NUMBER OF
SHARES | |
| | VALUE | |
| | | Common Stocks (99.0%) | |
| | | Australia (5.5%) | |
| | | Airports | |
| | 103,599 | | | Sydney Airport | | $ | 365,621 | | |
| | | Diversified | |
| | 97,254 | | | DUET Group | | | 211,336 | | |
| | | Oil & Gas Storage &
Transportation | |
| | 44,164 | | | APA Group | | | 254,927 | | |
| | | Toll Roads | |
| | 28,213 | | | Macquarie Atlas Roads
Group (a) | | | 49,120 | | |
| | 94,359 | | | Transurban Group | | | 599,286 | | |
| | | | 648,406 | | |
| | | | | Total Australia | | | 1,480,290 | | |
| | | Brazil (0.4%) | |
| | | Water | |
| | 1,400 | | | Cia de Saneamento Basico do
Estado de Sao Paulo ADR | | | 116,998 | | |
| | | Canada (12.1%) | |
| | | Oil & Gas Storage &
Transportation | |
| | 26,720 | | | Enbridge, Inc. | | | 1,155,619 | | |
| | 43,890 | | | TransCanada Corp. | | | 2,074,704 | | |
| | | | | Total Canada | | | 3,230,323 | | |
| | | China (12.4%) | |
| | | Oil & Gas Storage &
Transportation | |
| | 286,000 | | | Beijing Enterprises
Holdings Ltd. (b) | | | 1,875,109 | | |
| | 480,000 | | | China Gas Holdings Ltd. (b) | | | 381,424 | | |
| | 44,000 | | | ENN Energy Holdings Ltd. (b) | | | 192,377 | | |
| | 636,400 | | | Sichuan Expressway Co.,
Ltd., H Shares (b) | | | 231,922 | | |
| | | | 2,680,832 | | |
| | | Ports | |
| | 84,605 | | | China Merchants Holdings
International Co., Ltd. (b) | | | 276,077 | | |
NUMBER OF
SHARES | |
| | VALUE | |
| | | Toll Roads | |
| | 340,000 | | | Jiangsu Expressway Co.,
Ltd., H Shares (b) | | $ | 352,158 | | |
| | | | | Total China | | | 3,309,067 | | |
| | | France (2.8%) | |
| | | Communications | |
| | 4,553 | | | Eutelsat Communications SA | | | 151,177 | | |
| | 20,274 | | | SES SA | | | 586,503 | | |
| | | | | Total France | | | 737,680 | | |
| | | Germany (0.9%) | |
| | | Airports | |
| | 4,213 | | | Fraport AG Frankfurt Airport
Services Worldwide | | | 245,336 | | |
| | | Italy (6.4%) | |
| | | Oil & Gas Storage &
Transportation | |
| | 146,237 | | | Snam SpA | | | 680,011 | | |
| | | Toll Roads | |
| | 24,737 | | | Atlantia SpA | | | 448,655 | | |
| | 27,602 | | | Societa Iniziative Autostradali
e Servizi SpA | | | 258,044 | | |
| | | | 706,699 | | |
| | | Transmission & Distribution | |
| | 83,252 | | | Terna Rete Elettrica
Nazionale SpA | | | 333,407 | | |
| | | | | Total Italy | | | 1,720,117 | | |
| | | Japan (1.2%) | |
| | | Oil & Gas Storage &
Transportation | |
| | 67,000 | | | Tokyo Gas Co., Ltd. | | | 306,321 | | |
| | | Netherlands (0.8%) | |
| | | Oil & Gas Storage &
Transportation | |
| | 3,164 | | | Koninklijke Vopak N.V. | | | 223,093 | | |
| | | Spain (1.8%) | |
| | | Diversified | |
| | 12,895 | | | Ferrovial SA | | | 190,126 | | |
See Notes to Financial Statements
37
Global Infrastructure
Portfolio of Investments n December 31, 2012 continued
NUMBER OF
SHARES | |
| | VALUE | |
| | | Toll Roads | |
| | 17,366 | | | Abertis Infraestructuras SA | | $ | 289,415 | | |
| | | | | Total Spain | | | 479,541 | | |
| | | Switzerland (1.6%) | |
| | | Airports | |
| | 948 | | | Flughafen Zuerich AG
(Registered) | | | 439,150 | | |
| | | United Kingdom (8.7%) | |
| | | Transmission & Distribution | |
| | 150,399 | | | National Grid PLC | | | 1,722,734 | | |
| | | Water | |
| | 11,366 | | | Severn Trent PLC | | | 291,200 | | |
| | 29,182 | | | United Utilities Group PLC | | | 320,222 | | |
| | | | 611,422 | | |
| | | | | Total United Kingdom | | | 2,334,156 | | |
| | | United States (44.4%) | |
| | | Communications | |
| | 16,690 | | | American Tower Corp. REIT | | | 1,289,636 | | |
| | 9,110 | | | Crown Castle International
Corp. (a) | | | 657,378 | | |
| | 10,280 | | | SBA Communications Corp.,
Class A (a) | | | 730,085 | | |
| | | | 2,677,099 | | |
| | | Diversified | |
| | 23,820 | | | CenterPoint Energy, Inc. | | | 458,535 | | |
| | | Oil & Gas Storage &
Transportation | |
| | 3,920 | | | AGL Resources, Inc. | | | 156,682 | | |
| | 1,890 | | | Atmos Energy Corp. | | | 66,377 | | |
| | 8,280 | | | Cheniere Energy, Inc. (a) | | | 155,498 | | |
| | 23,503 | | | Enbridge Energy
Management LLC (a) | | | 679,002 | | |
| | 24,400 | | | Kinder Morgan, Inc. | | | 862,052 | | |
| | 3,440 | | | New Jersey Resources Corp. | | | 136,293 | | |
| | 15,320 | | | NiSource, Inc. | | | 381,315 | | |
| | 10,920 | | | Oneok, Inc. | | | 466,830 | | |
| | 16,870 | | | PG&E Corp. | | | 677,836 | | |
| | 13,650 | | | Sempra Energy | | | 968,331 | | |
NUMBER OF
SHARES | |
| | VALUE | |
| | 33,665 | | | Spectra Energy Corp. | | $ | 921,748 | | |
| | 3,080 | | | WGL Holdings, Inc. | | | 120,705 | | |
| | 29,820 | | | Williams Cos., Inc. (The) | | | 976,307 | | |
| | | | 6,568,976 | | |
| | | Transmission & Distribution | | | |
| | 4,128 | | | Consolidated Edison, Inc. | | | 229,269 | | |
| | 7,780 | | | ITC Holdings Corp. | | | 598,360 | | |
| | 24,138 | | | Northeast Utilities | | | 943,313 | | |
| | | | 1,770,942 | | |
| | | Water | | | |
| | 8,920 | | | American Water Works
Co., Inc. | | | 331,200 | | |
| | 3,840 | | | California Water Service
Group | | | 70,464 | | |
| | | | 401,664 | | |
| | | Total United States | | | 11,877,216 | | |
| | | Total Common Stocks
(Cost $20,322,075) | | | 26,499,288 | | |
NUMBER OF
SHARES (000) | | | | | |
| | | Short-Term Investment (0.8%) | | | |
| | | Investment Company | | | |
| | 215 | | | Morgan Stanley Institutional
Liquidity Funds - Treasury
Portfolio - Institutional
Class (See Note 6)
(Cost $214,894) | | | 214,894 | | |
Total Investments
(Cost $20,536,969) (c) | | | 99.8 | % | | | 26,714,182 | | |
Other Assets in Excess of
Liabilities | | | 0.2 | | | | 41,626 | | |
| Net Assets | | | 100.0 | % | | $ | 26,755,808 | | |
See Notes to Financial Statements
38
Global Infrastructure
Portfolio of Investments n December 31, 2012 continued
ADR American Depositary Receipt.
REIT Real Estate Investment Trust.
(a) Non-income producing security.
(b) Security trades on the Hong Kong exchange.
(c) The fair value and percentage of net assets, $11,274,751 and 42.1%, respectively, represent the securities that have been fair valued under the fair valuation policy for international investments as described in Note 1A within the Notes to the Financial Statements.
SUMMARY OF INVESTMENTS
INDUSTRY | | VALUE | | PERCENT OF
TOTAL
INVESTMENTS | |
Oil & Gas Storage &
Transportation | | $ | 13,944,483 | | | | 52.2 | % | |
Transmission & Distribution | | | 3,827,083 | | | | 14.3 | | |
Communications | | | 3,414,779 | | | | 12.8 | | |
Toll Roads | | | 1,996,678 | | | | 7.5 | | |
Water | | | 1,130,084 | | | | 4.2 | | |
Airports | | | 1,050,107 | | | | 3.9 | | |
Diversified | | | 859,997 | | | | 3.2 | | |
Ports | | | 276,077 | | | | 1.1 | | |
Investment Company | | | 214,894 | | | | 0.8 | | |
| | | $ | 26,714,182 | | | | 100.0 | % | |
See Notes to Financial Statements
39
Growth
Portfolio of Investments n December 31, 2012
NUMBER OF
SHARES | |
| | VALUE | |
| | | Common Stocks (97.7%) | |
| | | Alternative Energy (2.2%) | |
| | 4,092 | | | Range Resources Corp. | | $ | 257,100 | | |
| | 9,534 | | | Ultra Petroleum Corp. (a) | | | 172,852 | | |
| | | | 429,952 | | |
| | | Asset Management &
Custodian (1.7%) | |
| | 1,595 | | | BlackRock, Inc. | | | 329,702 | | |
| | | Beverage: Brewers &
Distillers (2.3%) | |
| | 39,730 | | | DE Master Blenders
1753 N.V. (Netherlands) (a) | | | 462,141 | | |
| | | Biotechnology (2.9%) | |
| | 10,233 | | | Illumina, Inc. (a) | | | 568,852 | | |
| | | Chemicals: Diversified (3.1%) | |
| | 6,426 | | | Monsanto Co. | | | 608,221 | | |
| | | Commercial Services (1.6%) | |
| | 6,314 | | | Intertek Group PLC
(United Kingdom) | | | 318,642 | | |
| | | Communications
Technology (3.9%) | |
| | 13,780 | | | Motorola Solutions, Inc. | | | 767,270 | | |
| | | Computer Services,
Software & Systems (20.8%) | |
| | 5,107 | | | Baidu, Inc. ADR (China) (a) | | | 512,181 | | |
| | 41,606 | | | Facebook, Inc., Class A (a) | | | 1,107,968 | | |
| | 1,806 | | | Google, Inc., Class A (a) | | | 1,281,122 | | |
| | 2,816 | | | LinkedIn Corp., Class A (a) | | | 323,333 | | |
| | 3,128 | | | Salesforce.com, Inc. (a) | | | 525,817 | | |
| | 2,474 | | | VMware, Inc., Class A (a) | | | 232,902 | | |
| | 2,456 | | | Workday, Inc. (a) | | | 133,852 | | |
| | | | 4,117,175 | | |
| | | Computer Technology (8.7%) | |
| | 2,865 | | | Apple, Inc. | | | 1,527,131 | | |
| | 9,192 | | | Yandex N.V., Class A
(Russia) (a) | | | 198,271 | | |
| | | | 1,725,402 | | |
NUMBER OF
SHARES | |
| | VALUE | |
| | | Consumer Lending (8.6%) | |
| | 5,198 | | | CME Group, Inc. | | $ | 263,591 | | |
| | 1,425 | | | Mastercard, Inc., Class A | | | 700,074 | | |
| | 4,849 | | | Visa, Inc., Class A | | | 735,011 | | |
| | | | 1,698,676 | | |
| | | Diversified Media (3.1%) | |
| | 5,711 | | | McGraw-Hill Cos., Inc. (The) | | | 312,220 | | |
| | 4,572 | | | Naspers Ltd., Class N
(South Africa) | | | 293,764 | | |
| | | | 605,984 | | |
| | | Diversified Retail (12.6%) | |
| | 6,462 | | | Amazon.com, Inc. (a) | | | 1,622,867 | | |
| | 47,090 | | | Groupon, Inc. (a) | | | 229,799 | | |
| | 1,053 | | | Priceline.com, Inc. (a) | | | 654,124 | | |
| | | | 2,506,790 | | |
| | | Electronic Components (1.4%) | |
| | 8,842 | | | Sensata Technologies
Holding N.V. (a) | | | 287,188 | | |
| | | Financial Data &
Systems (2.7%) | |
| | 7,524 | | | MSCI, Inc. (a) | | | 233,169 | | |
| | 5,754 | | | Verisk Analytics, Inc.,
Class A (a) | | | 293,454 | | |
| | | | 526,623 | | |
| | | Foods (1.5%) | |
| | 4,642 | | | Nestle SA ADR (Switzerland) | | | 302,519 | | |
| | | Insurance:
Property-Casualty (2.0%) | |
| | 19,166 | | | Progressive Corp. (The) | | | 404,403 | | |
| | | Medical Equipment (2.8%) | |
| | 1,141 | | | Intuitive Surgical, Inc. (a) | | | 559,512 | | |
| | | Pharmaceuticals (3.0%) | |
| | 4,545 | | | Mead Johnson Nutrition Co. | | | 299,470 | | |
| | 4,915 | | | Valeant Pharmaceuticals
International, Inc.
(Canada) (a) | | | 293,770 | | |
| | | | 593,240 | | |
See Notes to Financial Statements
40
Growth
Portfolio of Investments n December 31, 2012 continued
NUMBER OF
SHARES | |
| | VALUE | |
| | | Real Estate Investment Trusts (REIT) (3.7%) | | | |
| | 19,964 | | | Brookfield Asset Management,
Inc., Class A (Canada) | | $ | 731,681 | | |
| | | Recreational Vehicles &
Boats (3.7%) | | | |
| | 23,586 | | | Edenred (France) | | | 733,457 | | |
| | | Restaurants (2.6%) | | | |
| | 9,605 | | | Starbucks Corp. | | | 515,020 | | |
| | | Semiconductors &
Components (1.3%) | | | |
| | 8,185 | | | First Solar, Inc. (a) | | | 252,753 | | |
| | | Textiles Apparel & Shoes (1.5%) | | | |
| | 5,286 | | | Coach, Inc. | | | 293,426 | | |
| | | Total Common Stocks
(Cost $14,188,955) | | | 19,338,629 | | |
| | | Convertible Preferred
Stock (0.1%) | | | |
| | | Alternative Energy | | | |
| | 65,304 | | | Better Place, Inc. (a)(b)(c)
(acquisition cost - $163,260;
acquired 01/25/10)
(Cost $163,260) | | | 19,591 | | |
NUMBER OF
SHARES (000) | | | | | |
| | | Short-Term Investment (2.4%) | | | |
| | | Investment Company | | | |
| | 483 | | | Morgan Stanley Institutional
Liquidity Funds - Money
Market Portfolio - Institutional
Class (See Note 6)
(Cost $483,205) | | | 483,205 | | |
Total Investments
(Cost $14,835,420) (d) | | | 100.2 | % | | | 19,841,425 | | |
Liabilities in Excess of
Other Assets | | | (0.2 | ) | | | (31,998 | ) | |
| Net Assets | | | 100.0 | % | | $ | 19,809,427 | | |
ADR American Depositary Receipt.
(a) Non-income producing security.
(b) Security cannot be offered for public resale without first being registered under the Securities Act of 1933 and related rules ("restricted security"). Acquisition date represents the day on which an enforceable right to acquire such security is obtained and is presented along with related cost in the security description. The Portfolio has registration rights for certain restricted securities. Any costs related to such registration are borne by the issuer. The aggregate value of restricted securities (excluding 144A holdings) at December 31, 2012 amounts to $19,591 and represents 0.1% of net assets.
(c) At December 31, 2012, the Portfolio held fair valued securities valued at $19,591, representing 0.1% of net assets. These securities have been fair valued as determined in good faith under procedures established by and under the general supervision of the Fund's Trustees.
(d) The fair value and percentage of net assets, $1,808,004 and 9.1%, respectively, represent the securities that have been fair valued under the fair valuation policy for international investments as described in Note 1A within the Notes to the Financial Statements.
See Notes to Financial Statements
41
Growth
Portfolio of Investments n December 31, 2012 continued
Summary of Investments
INDUSTRY | | VALUE | | PERCENT OF
TOTAL
INVESTMENTS | |
Computer Services, Software & Systems | | $ | 4,117,175 | | | | 20.7 | % | |
Diversified Retail | | | 2,506,790 | | | | 12.6 | | |
Computer Technology | | | 1,725,402 | | | | 8.7 | | |
Consumer Lending | | | 1,698,676 | | | | 8.6 | | |
Communications Technology | | | 767,270 | | | | 3.9 | | |
Recreational Vehicles & Boats | | | 733,457 | | | | 3.7 | | |
Real Estate Investment Trusts (REIT) | | | 731,681 | | | | 3.7 | | |
Chemicals: Diversified | | | 608,221 | | | | 3.1 | | |
Diversified Media | | | 605,984 | | | | 3.0 | | |
Pharmaceuticals | | | 593,240 | | | | 3.0 | | |
Biotechnology | | | 568,852 | | | | 2.9 | | |
Medical Equipment | | | 559,512 | | | | 2.8 | | |
Financial Data & Systems | | | 526,623 | | | | 2.7 | | |
Restaurants | | | 515,020 | | | | 2.6 | | |
Investment Company | | | 483,205 | | | | 2.4 | | |
Beverage: Brewers & Distillers | | | 462,141 | | | | 2.3 | | |
Alternative Energy | | | 449,543 | | | | 2.3 | | |
Insurance: Property-Casualty | | | 404,403 | | | | 2.0 | | |
Asset Management & Custodian | | | 329,702 | | | | 1.7 | | |
Commercial Services | | | 318,642 | | | | 1.6 | | |
Foods | | | 302,519 | | | | 1.5 | | |
Textiles Apparel & Shoes | | | 293,426 | | | | 1.5 | | |
Electronic Components | | | 287,188 | | | | 1.4 | | |
Semiconductors & Components | | | 252,753 | | | | 1.3 | | |
| | | $ | 19,841,425 | | | | 100.0 | % | |
See Notes to Financial Statements
42
Focus Growth
Portfolio of Investments n December 31, 2012
NUMBER OF
SHARES | |
| | VALUE | |
| | | Common Stocks (99.1%) | |
| | | Alternative Energy (1.4%) | |
| | 15,346 | | | Range Resources Corp. | | $ | 964,189 | | |
| | | Asset Management &
Custodian (1.8%) | |
| | 5,995 | | | BlackRock, Inc. | | | 1,239,226 | | |
| | | Beverage: Brewers &
Distillers (2.8%) | |
| | 163,650 | | | DE Master Blenders
1753 N.V.
(Netherlands) (a) | | | 1,903,582 | | |
| | | Biotechnology (3.5%) | |
| | 42,798 | | | Illumina, Inc. (a) | | | 2,379,141 | | |
| | | Chemicals: Diversified (3.9%) | |
| | 28,100 | | | Monsanto Co. | | | 2,659,665 | | |
| | | Commercial Services (1.9%) | |
| | 25,584 | | | Intertek Group PLC
(United Kingdom) | | | 1,291,121 | | |
| | | Communications
Technology (4.6%) | |
| | 56,588 | | | Motorola Solutions, Inc. | | | 3,150,820 | | |
| | | Computer Services,
Software & Systems (23.7%) | |
| | 21,503 | | | Baidu, Inc. ADR (China) (a) | | | 2,156,536 | | |
| | 175,317 | | | Facebook, Inc., Class A (a) | | | 4,668,692 | | |
| | 7,674 | | | Google, Inc., Class A (a) | | | 5,443,705 | | |
| | 11,429 | | | LinkedIn Corp., Class A (a) | | | 1,312,278 | | |
| | 12,727 | | | Salesforce.com, Inc. (a) | | | 2,139,408 | | |
| | 8,218 | | | Workday, Inc. (a) | | | 447,881 | | |
| | | | 16,168,500 | | |
| | | Computer Technology (10.3%) | |
| | 11,533 | | | Apple, Inc. | | | 6,147,435 | | |
| | 40,288 | | | Yandex N.V., Class A
(Russia) (a) | | | 869,012 | | |
| | | | 7,016,447 | | |
| | | Consumer Lending (8.0%) | |
| | 5,398 | | | Mastercard, Inc., Class A | | | 2,651,930 | | |
| | 18,366 | | | Visa, Inc., Class A | | | 2,783,918 | | |
| | | | 5,435,848 | | |
NUMBER OF
SHARES | |
| | VALUE | |
| | | Diversified Media (2.0%) | |
| | 20,926 | | | Naspers Ltd., Class N
(South Africa) | | $ | 1,344,555 | | |
| | | Diversified Retail (15.4%) | |
| | 27,464 | | | Amazon.com, Inc. (a) | | | 6,897,309 | | |
| | 186,851 | | | Groupon, Inc. (a) | | | 911,833 | | |
| | 4,279 | | | Priceline.com, Inc. (a) | | | 2,658,115 | | |
| | | | 10,467,257 | | |
| | | Financial Data & Systems (1.3%) | |
| | 29,021 | | | MSCI, Inc. (a) | | | 899,361 | | |
| | | Insurance:
Property-Casualty (2.8%) | |
| | 89,091 | | | Progressive Corp. (The) | | | 1,879,820 | | |
| | | Medical Equipment (3.2%) | |
| | 4,404 | | | Intuitive Surgical, Inc. (a) | | | 2,159,590 | | |
| | | Real Estate Investment
Trusts (REIT) (4.1%) | |
| | 75,616 | | | Brookfield Asset Management,
Inc., Class A (Canada) | | | 2,771,326 | | |
| | | Recreational Vehicles &
Boats (4.0%) | |
| | 88,573 | | | Edenred (France) | | | 2,754,366 | | |
| | | Restaurants (2.9%) | |
| | 37,520 | | | Starbucks Corp. | | | 2,011,822 | | |
| | | Semiconductors &
Components (1.5%) | |
| | 32,642 | | | First Solar, Inc. (a) | | | 1,007,985 | | |
| | | | | Total Common Stocks
(Cost $47,581,118) | | | 67,504,621 | | |
| | | Convertible Preferred
Stock (0.1%) | |
| | | Alternative Energy | |
| | 200,178 | | | Better Place, Inc. (a)(b)(c)
(acquisition cost - $500,445;
acquired 01/25/10)
(Cost $500,445) | | | 60,053 | | |
See Notes to Financial Statements
43
Focus Growth
Portfolio of Investments n December 31, 2012 continued
NUMBER OF
SHARES (000) | |
| | VALUE | |
| | | Short-Term Investment (1.0%) | | | |
| | | Investment Company | | | |
| | 686 | | | Morgan Stanley Institutional
Liquidity Funds - Money Market
Portfolio - Institutional Class
(See Note 6)
(Cost $686,482) | | $ | 686,482 | | |
Total Investments
(Cost $48,768,045) (d) | | | 100.2 | % | | | 68,251,156 | | |
Liabilities in Excess of
Other Assets | | | (0.2 | ) | | | (110,672 | ) | |
Net Assets | | | 100.0 | % | | $ | 68,140,484 | | |
ADR American Depositary Receipt.
(a) Non-income producing security.
(b) Security cannot be offered for public resale without first being registered under the Securities Act of 1933 and related rules ("restricted security"). Acquisition date represents the day on which an enforceable right to acquire such security is obtained and is presented along with related cost in the security description. The Portfolio has registration rights for certain restricted securities. Any costs related to such registration are borne by the issuer. The aggregate value of restricted securities (excluding 144A holdings) at December 31, 2012 amounts to $60,053 and represents 0.1% of net assets.
(c) At December 31, 2012, the Portfolio held fair valued securities valued at $60,053, representing 0.1% of net assets. These securities have been fair valued as determined in good faith under procedures established by and under the general supervision of the Fund's Trustees.
(d) The fair value and percentage of net assets, $7,293,624 and 10.7%, respectively, represent the securities that have been fair valued under the fair valuation policy for international investments as described in Note 1A within the Notes to the Financial Statements.
SUMMARY OF INVESTMENTS
INDUSTRY | | VALUE | | PERCENT OF
TOTAL
INVESTMENTS | |
Computer Services,
Software & Systems | | $ | 16,168,500 | | | | 23.7 | % | |
Diversified Retail | | | 10,467,257 | | | | 15.3 | | |
Computer Technology | | | 7,016,447 | | | | 10.3 | | |
Consumer Lending | | | 5,435,848 | | | | 8.0 | | |
Communications
Technology | | | 3,150,820 | | | | 4.6 | | |
Real Estate Investment
Trusts (REIT) | | | 2,771,326 | | | | 4.1 | | |
Recreational Vehicles &
Boats | | | 2,754,366 | | | | 4.0 | | |
Chemicals: Diversified | | | 2,659,665 | | | | 3.9 | | |
Biotechnology | | | 2,379,141 | | | | 3.5 | | |
Medical Equipment | | | 2,159,590 | | | | 3.2 | | |
Restaurants | | | 2,011,822 | | | | 2.9 | | |
Beverage: Brewers &
Distillers | | | 1,903,582 | | | | 2.8 | | |
Insurance:
Property-Casualty | | | 1,879,820 | | | | 2.7 | | |
Diversified Media | | | 1,344,555 | | | | 2.0 | | |
Commercial Services | | | 1,291,121 | | | | 1.9 | | |
Asset Management &
Custodian | | | 1,239,226 | | | | 1.8 | | |
Alternative Energy | | | 1,024,242 | | | | 1.5 | | |
Semiconductors &
Components | | | 1,007,985 | | | | 1.5 | | |
Financial Data & Systems | | | 899,361 | | | | 1.3 | | |
Investment Company | | | 686,482 | | | | 1.0 | | |
| | | $ | 68,251,156 | | | | 100.0 | % | |
See Notes to Financial Statements
44
Multi Cap Growth
Portfolio of Investments n December 31, 2012
NUMBER OF
SHARES | |
| | VALUE | |
| | | Common Stocks (96.7%) | |
| | | Advertising Agencies (0.0%) | |
| | 368 | | | Aimia, Inc. (Canada) | | $ | 5,501 | | |
| | | Alternative Energy (2.2%) | |
| | 5,524 | | | Range Resources Corp. | | | 347,073 | | |
| | | Beverage: Brewers &
Distillers (2.2%) | |
| | 30,745 | | | DE Master Blenders
1753 N.V. (Netherlands) (a) | | | 357,627 | | |
| | | Biotechnology (3.2%) | |
| | 9,121 | | | Illumina, Inc. (a) | | | 507,036 | | |
| | | Chemicals: Diversified (3.1%) | |
| | 5,171 | | | Monsanto Co. | | | 489,435 | | |
| | | Commercial Services (4.7%) | |
| | 8,290 | | | Intertek Group PLC
(United Kingdom) | | | 418,362 | | |
| | 6,213 | | | Weight Watchers
International, Inc. | | | 325,313 | | |
| | | | 743,675 | | |
| | | Communications
Technology (3.9%) | |
| | 11,137 | | | Motorola Solutions, Inc. | | | 620,108 | | |
| | | Computer Services,
Software & Systems (23.8%) | |
| | 4,118 | | | Baidu, Inc. ADR (China) (a) | | | 412,994 | | |
| | 34,393 | | | Facebook, Inc., Class A (a) | | | 915,886 | | |
| | 1,455 | | | Google, Inc., Class A (a) | | | 1,032,133 | | |
| | 3,687 | | | LinkedIn Corp., Class A (a) | | | 423,341 | | |
| | 2,653 | | | Salesforce.com, Inc. (a) | | | 445,969 | | |
| | 8,210 | | | Solera Holdings, Inc. | | | 438,989 | | |
| | 1,916 | | | Workday, Inc. (a) | | | 104,422 | | |
| | | | 3,773,734 | | |
| | | Computer Technology (9.8%) | |
| | 2,308 | | | Apple, Inc. | | | 1,230,233 | | |
| | 15,283 | | | Yandex N.V., Class A
(Russia) (a) | | | 329,655 | | |
| | | | 1,559,888 | | |
NUMBER OF
SHARES | |
| | VALUE | |
| | | Consumer Lending (7.4%) | |
| | 1,162 | | | Mastercard, Inc., Class A | | $ | 570,867 | | |
| | 3,955 | | | Visa, Inc., Class A | | | 599,499 | | |
| | | | 1,170,366 | | |
| | | Diversified Retail (12.6%) | |
| | 5,196 | | | Amazon.com, Inc. (a) | | | 1,304,923 | | |
| | 37,523 | | | Groupon, Inc. (a) | | | 183,112 | | |
| | 828 | | | Priceline.com, Inc. (a) | | | 514,354 | | |
| | | | 2,002,389 | | |
| | | Financial Data &
Systems (4.9%) | |
| | 11,341 | | | MSCI, Inc. (a) | | | 351,458 | | |
| | 8,296 | | | Verisk Analytics, Inc.,
Class A (a) | | | 423,096 | | |
| | | | 774,554 | | |
| | | Health Care Services (3.8%) | |
| | 8,171 | | | athenahealth, Inc. (a) | | | 600,160 | | |
| | | Insurance:
Property-Casualty (0.4%) | |
| | 3,442 | | | Progressive Corp. (The) | | | 72,626 | | |
| | | Medical Equipment (2.9%) | |
| | 942 | | | Intuitive Surgical, Inc. (a) | | | 461,929 | | |
| | | Real Estate Investment
Trusts (REIT) (3.8%) | |
| | 16,283 | | | Brookfield Asset Management,
Inc., Class A (Canada) | | | 596,772 | | |
| | | Recreational Vehicles &
Boats (3.6%) | |
| | 18,657 | | | Edenred (France) | | | 580,179 | | |
| | | Restaurants (2.6%) | |
| | 7,819 | | | Starbucks Corp. | | | 419,255 | | |
| | | Semiconductors &
Components (1.8%) | |
| | 9,079 | | | First Solar, Inc. (a) | | | 280,360 | | |
| | | | | Total Common Stocks
(Cost $11,007,173) | | | 15,362,667 | | |
See Notes to Financial Statements
45
Multi Cap Growth
Portfolio of Investments n December 31, 2012 continued
NUMBER OF
SHARES | |
| | VALUE | |
| | | | | Convertible Preferred Stocks (0.8%) | | | |
| | | | | Alternative Energy (0.1%) | | | |
| | 48,317 | | | Better Place, Inc. (a)(b)(c)
(acquisition cost - $120,792;
acquired 01/25/10) | | $ | 14,495 | | |
| | | | | Computer Services,
Software & Systems (0.7%) | | | |
| | 2,142 | | | Workday, Inc. (a)(b)(c)
(acquisition cost - $28,403;
acquired 10/12/11) | | | 108,964 | | |
| | | | | Total Convertible
Preferred Stocks
(Cost $149,195) | | | 123,459 | | |
NUMBER OF
SHARES (000) | | | | | |
| | | | | Short-Term Investment (2.9%) | | | |
| | | | | Investment Company | | | |
| | 457 | | | Morgan Stanley Institutional
Liquidity Funds - Money Market
Portfolio - Institutional Class
(See Note 6)
(Cost $456,721) | | | 456,721 | | |
Total Investments
(Cost $11,613,089) (d) | | | 100.4 | % | | | 15,942,847 | | |
Liabilities in Excess of
Other Assets | | | (0.4 | ) | | | (68,111 | ) | |
Net Assets | | | 100.0 | % | | $ | 15,874,736 | | |
ADR American Depositary Receipt.
(a) Non-income producing security.
(b) Security cannot be offered for public resale without first being registered under the Securities Act of 1933 and related rules ("restricted security"). Acquisition date represents the day on which an enforceable right to acquire such security is obtained and is presented along with related cost in the security description. The Portfolio has registration rights for certain restricted securities. Any costs related to such registration are borne by the issuer. The aggregate value of restricted securities (excluding 144A holdings) at December 31, 2012 amounts to $123,459 and represents 0.8% of net assets.
(c) At December 31, 2012, the Portfolio held fair valued securities valued at $123,459, representing 0.8% of net assets. These securities have been fair valued as determined in good faith under procedures established by and under the general supervision of the Fund's Trustees.
(d) The fair value and percentage of net assets, $1,356,168 and 8.5%, respectively, represent the securities that have been fair valued under the fair valuation policy for international investments as described in Note 1A within the Notes to the Financial Statements.
See Notes to Financial Statements
46
Multi Cap Growth
Portfolio of Investments n December 31, 2012 continued
Summary of Investments
INDUSTRY | | VALUE | | PERCENT OF
TOTAL
INVESTMENTS | |
Computer Services, Software & Systems | | $ | 3,882,698 | | | | 24.3 | % | |
Diversified Retail | | | 2,002,389 | | | | 12.6 | | |
Computer Technology | | | 1,559,888 | | | | 9.8 | | |
Consumer Lending | | | 1,170,366 | | | | 7.3 | | |
Financial Data & Systems | | | 774,554 | | | | 4.9 | | |
Commercial Services | | | 743,675 | | | | 4.7 | | |
Communications Technology | | | 620,108 | | | | 3.9 | | |
Health Care Services | | | 600,160 | | | | 3.8 | | |
Real Estate Investment Trusts (REIT) | | | 596,772 | | | | 3.7 | | |
Recreational Vehicles & Boats | | | 580,179 | | | | 3.6 | | |
Biotechnology | | | 507,036 | | | | 3.2 | | |
Chemicals: Diversified | | | 489,435 | | | | 3.1 | | |
Medical Equipment | | | 461,929 | | | | 2.9 | | |
Investment Company | | | 456,721 | | | | 2.9 | | |
Restaurants | | | 419,255 | | | | 2.6 | | |
Alternative Energy | | | 361,568 | | | | 2.3 | | |
Beverage: Brewers & Distillers | | | 357,627 | | | | 2.2 | | |
Semiconductors & Components | | | 280,360 | | | | 1.8 | | |
Insurance: Property-Casualty | | | 72,626 | | | | 0.4 | | |
Advertising Agencies | | | 5,501 | | | | 0.0 | | |
| | | $ | 15,942,847 | | | | 100.0 | % | |
See Notes to Financial Statements
47
Mid Cap Growth
Portfolio of Investments n December 31, 2012
NUMBER OF
SHARES | |
| | VALUE | |
| | | Common Stocks (94.4%) | |
| | | Advertising Agencies (0.0%) | |
| | 546 | | | Aimia, Inc. (Canada) | | $ | 8,162 | | |
| | | Alternative Energy (2.9%) | |
| | 7,634 | | | Range Resources Corp. | | | 479,644 | | |
| | 10,731 | | | Ultra Petroleum Corp. (a) | | | 194,553 | | |
| | | | 674,197 | | |
| | | Asset Management &
Custodian (0.9%) | |
| | 3,867 | | | Greenhill & Co., Inc. | | | 201,045 | | |
| | | Automobiles (0.5%) | |
| | 3,807 | | | Tesla Motors, Inc. (a) | | | 128,943 | | |
| | | Beverage: Brewers &
Distillers (2.2%) | |
| | 44,803 | | | DE Master Blenders
1753 N.V. (Netherlands) (a) | | | 521,150 | | |
| | | Beverage: Soft Drinks (1.6%) | |
| | 7,204 | | | Monster Beverage Corp. (a) | | | 380,948 | | |
| | | Biotechnology (4.7%) | |
| | 3,396 | | | IDEXX Laboratories, Inc. (a) | | | 315,149 | | |
| | 13,948 | | | Illumina, Inc. (a) | | | 775,369 | | |
| | | | 1,090,518 | | |
| | | Cement (2.1%) | |
| | 5,220 | | | Martin Marietta Materials, Inc. | | | 492,142 | | |
| | | Chemicals: Diversified (2.6%) | |
| | 11,232 | | | Intrepid Potash, Inc. | | | 239,129 | | |
| | 7,410 | | | Rockwood Holdings, Inc. | | | 366,499 | | |
| | | | 605,628 | | |
| | | Commercial Services (7.9%) | |
| | 11,344 | | | Gartner, Inc. (a) | | | 522,051 | | |
| | 11,755 | | | Intertek Group PLC
(United Kingdom) | | | 593,227 | | |
| | 3,087 | | | MercadoLibre, Inc. (Brazil) | | | 242,546 | | |
| | 9,500 | | | Weight Watchers
International, Inc. | | | 497,420 | | |
| | | | 1,855,244 | | |
| | | Communications
Technology (3.5%) | |
| | 14,872 | | | Motorola Solutions, Inc. | | | 828,073 | | |
NUMBER OF
SHARES | |
| | VALUE | |
| | | Computer Services,
Software & Systems (17.0%) | |
| | 8,703 | | | Akamai Technologies, Inc. (a) | | $ | 356,040 | | |
| | 4,354 | | | Citrix Systems, Inc. (a) | | | 286,275 | | |
| | 5,089 | | | IHS, Inc., Class A (a) | | | 488,544 | | |
| | 5,241 | | | LinkedIn Corp., Class A (a) | | | 601,772 | | |
| | 4,651 | | | Qihoo 360 Technology
Co., Ltd. ADR (China) (a) | | | 138,088 | | |
| | 5,731 | | | Red Hat, Inc. (a) | | | 303,514 | | |
| | 3,767 | | | Salesforce.com, Inc. (a) | | | 633,233 | | |
| | 2,148 | | | SINA Corp. (China) (a) | | | 107,873 | | |
| | 14,641 | | | Solera Holdings, Inc. | | | 782,854 | | |
| | 2,891 | | | Workday, Inc. (a) | | | 157,559 | | |
| | 50,569 | | | Zynga, Inc., Class A (a) | | | 119,848 | | |
| | | | 3,975,600 | | |
| | | Computer Technology (3.8%) | |
| | 15,229 | | | Dropbox, Inc. (a)(b)(c)
(acquisition cost - $137,809;
acquired 05/01/12) | | | 137,809 | | |
| | 21,827 | | | Yandex N.V., Class A
(Russia) (a) | | | 470,808 | | |
| | 14,940 | | | Youku Tudou, Inc. ADR
(China) (a) | | | 272,506 | | |
| | | | 881,123 | | |
| | | Consumer Lending (1.3%) | |
| | 2,448 | | | Intercontinental
Exchange, Inc. (a) | | | 303,087 | | |
| | | Consumer Services:
Miscellaneous (1.7%) | |
| | 38,950 | | | Qualicorp SA (Brazil) (a) | | | 405,378 | | |
| | | Diversified Media (2.5%) | |
| | 1,453 | | | Factset Research Systems, Inc. | | | 127,951 | | |
| | 8,329 | | | McGraw-Hill Cos., Inc. (The) | | | 455,347 | | |
| | | | 583,298 | | |
| | | Diversified Retail (2.7%) | |
| | 9,040 | | | Dollar Tree, Inc. (a) | | | 366,663 | | |
| | 54,130 | | | Groupon, Inc. (a) | | | 264,154 | | |
| | | | 630,817 | | |
See Notes to Financial Statements
48
Mid Cap Growth
Portfolio of Investments n December 31, 2012 continued
NUMBER OF
SHARES | |
| | VALUE | |
| | | Education Services (1.5%) | |
| | 18,515 | | | New Oriental Education &
Technology Group ADR
(China) | | $ | 359,746 | | |
| | | Electronic Components (2.7%) | |
| | 11,579 | | | Sensata Technologies
Holding N.V. (a) | | | 376,086 | | |
| | 4,484 | | | Trimble Navigation Ltd. (a) | | | 268,053 | | |
| | | | 644,139 | | |
| | | Entertainment (1.2%) | |
| | 153 | | | Legend Pictures
LLC Ltd. (a)(b)(c)
(acquisition cost - $163,577;
acquired 03/08/12) | | | 283,537 | | |
| | | Financial Data & Systems (5.0%) | |
| | 18,261 | | | MSCI, Inc. (a) | | | 565,908 | | |
| | 11,834 | | | Verisk Analytics, Inc.,
Class A (a) | | | 603,534 | | |
| | | | 1,169,442 | | |
| | | Health Care Services (3.2%) | |
| | 5,458 | | | athenahealth, Inc. (a) | | | 400,890 | | |
| | 3,722 | | | Stericycle, Inc. (a) | | | 347,151 | | |
| | | | 748,041 | | |
| | | Insurance:
Property-Casualty (3.5%) | |
| | 7,863 | | | Arch Capital Group Ltd. (a) | | | 346,129 | | |
| | 22,362 | | | Progressive Corp. (The) | | | 471,838 | | |
| | | | 817,967 | | |
| | | Medical & Dental
Instruments & Supplies (1.2%) | |
| | 4,243 | | | Techne Corp. | | | 289,967 | | |
| | | Medical Equipment (2.3%) | |
| | 1,104 | | | Intuitive Surgical, Inc. (a) | | | 541,368 | | |
| | | Pharmaceuticals (2.0%) | |
| | 12,333 | | | Ironwood
Pharmaceuticals, Inc. (a) | | | 136,773 | | |
| | 5,086 | | | Mead Johnson Nutrition Co. | | | 335,117 | | |
| | | | 471,890 | | |
NUMBER OF
SHARES | |
| | VALUE | |
| | | Publishing (1.5%) | |
| | 5,551 | | | Morningstar, Inc. | | $ | 348,769 | | |
| | | Recreational Vehicles &
Boats (3.7%) | |
| | 27,620 | | | Edenred (France) | | | 858,903 | | |
| | | Restaurants (1.4%) | |
| | 9,935 | | | Dunkin' Brands Group, Inc. | | | 329,643 | | |
| | | Scientific Instruments:
Pollution Control (1.3%) | |
| | 16,435 | | | Covanta Holding Corp. | | | 302,733 | | |
| | | Semiconductors &
Components (1.3%) | |
| | 9,564 | | | First Solar, Inc. (a) | | | 295,336 | | |
| | | Textiles Apparel & Shoes (1.4%) | |
| | 5,907 | | | Coach, Inc. | | | 327,898 | | |
| | | Utilities: Electrical (3.3%) | |
| | 21,794 | | | Brookfield Infrastructure
Partners LP (Canada) | | | 768,239 | | |
| | | | | Total Common Stocks
(Cost $20,119,808) | | | 22,122,971 | | |
| | | Convertible Preferred Stocks (0.9%) | |
| | | Alternative Energy (0.1%) | |
| | 67,268 | | | Better Place, Inc. (a)(b)(c)
(acquisition cost - $168,168;
acquired 01/25/10) | | | 20,180 | | |
| | | Communications
Technology (0.0%) | |
| | 2,438 | | | Peixe Urbano, Inc.
(Brazil) (a)(b)(c)
(acquisition cost - $80,261;
acquired 12/02/11) | | | 11,605 | | |
| | | Computer Services,
Software & Systems (0.7%) | |
| | 3,419 | | | Workday, Inc. (a)(b)(c)
(acquisition cost - $45,336;
acquired 10/12/11) | | | 173,924 | | |
See Notes to Financial Statements
49
Mid Cap Growth
Portfolio of Investments n December 31, 2012 continued
NUMBER OF
SHARES | |
| | VALUE | |
| | | | | Computer Technology (0.1%) | | | |
| | 1,479 | | | Dropbox, Inc., Series A (a)(b)(c)
(acquisition cost - $13,384;
acquired 05/25/12) | | $ | 13,384 | | |
| | | | | Total Convertible
Preferred Stocks
(Cost $307,149) | | | 219,093 | | |
| | | | | Preferred Stock (0.2%) | | | |
| | | | | Computer Services,
Software & Systems | | | |
| | 14,953 | | | Palantir Technologies, Inc.,
Series G (a)(b)(c)
(acquisition cost - $45,756;
acquired 07/19/12)
(Cost $45,756) | | | 45,756 | | |
NUMBER OF
SHARES (000) | | | | | |
| | | | | Short-Term Investment (4.8%) | | | |
| | | | | Investment Company | | | |
| | 1,134 | | | Morgan Stanley Institutional
Liquidity Funds - Money Market
Portfolio - Institutional Class
(See Note 6)
(Cost $1,133,672) | | | 1,133,672 | | |
Total Investments
(Cost $21,606,385) (d) | | | 100.3 | % | | | 23,521,492 | | |
Liabilities in Excess of
Other Assets | | | (0.3 | ) | | | (80,296 | ) | |
| Net Assets | | | 100.0 | % | | $ | 23,441,196 | | |
ADR American Depositary Receipt.
(a) Non-income producing security.
(b) Security cannot be offered for public resale without first being registered under the Securities Act of 1933 and related rules ("restricted security"). Acquisition date represents the day on which an enforceable right to acquire such security is obtained and is presented along with related cost in the security description. The Portfolio has registration rights for certain restricted securities. Any costs related to such registration are borne by the issuer. The aggregate value of restricted securities (excluding 144A holdings) at December 31, 2012 amounts to $686,195 and represents 2.9% of net assets.
(c) At December 31, 2012, the Portfolio held fair valued securities valued at $686,195, representing 2.9% of net assets. These securities have been fair valued as determined in good faith under procedures established by and under the general supervision of the Fund's Trustees.
(d) The fair value and percentage of net assets, $2,378,658 and 10.1%, respectively, represent the securities that have been fair valued under the fair valuation policy for international investments as described in Note 1A within the Notes to the Financial Statements.
See Notes to Financial Statements
50
Mid Cap Growth
Portfolio of Investments n December 31, 2012 continued
INDUSTRY | | VALUE | | PERCENT OF
TOTAL
INVESTMENTS | |
Computer Services,
Software & Systems | | $ | 4,195,280 | | | | 17.8 | % | |
Commercial Services | | | 1,855,244 | | | | 7.9 | | |
Financial Data & Systems | | | 1,169,442 | | | | 5.0 | | |
Investment Company | | | 1,133,672 | | | | 4.8 | | |
Biotechnology | | | 1,090,518 | | | | 4.6 | | |
Computer Technology | | | 894,507 | | | | 3.8 | | |
Recreational Vehicles &
Boats | | | 858,903 | | | | 3.6 | | |
Communications Technology | | | 839,678 | | | | 3.6 | | |
Insurance:
Property-Casualty | | | 817,967 | | | | 3.5 | | |
Utilities: Electrical | | | 768,239 | | | | 3.3 | | |
Health Care Services | | | 748,041 | | | | 3.2 | | |
Alternative Energy | | | 694,377 | | | | 3.0 | | |
Electronic Components | | | 644,139 | | | | 2.7 | | |
Diversified Retail | | | 630,817 | | | | 2.7 | | |
Chemicals: Diversified | | | 605,628 | | | | 2.6 | | |
Diversified Media | | | 583,298 | | | | 2.5 | | |
Medical Equipment | | | 541,368 | | | | 2.3 | | |
Beverage: Brewers &
Distillers | | | 521,150 | | | | 2.2 | | |
INDUSTRY | | VALUE | | PERCENT OF
TOTAL
INVESTMENTS | |
Cement | | $ | 492,142 | | | | 2.1 | % | |
Pharmaceuticals | | | 471,890 | | | | 2.0 | | |
Consumer Services:
Miscellaneous | | | 405,378 | | | | 1.7 | | |
Beverage: Soft Drinks | | | 380,948 | | | | 1.6 | | |
Education Services | | | 359,746 | | | | 1.5 | | |
Publishing | | | 348,769 | | | | 1.5 | | |
Restaurants | | | 329,643 | | | | 1.4 | | |
Textiles Apparel & Shoes | | | 327,898 | | | | 1.4 | | |
Consumer Lending | | | 303,087 | | | | 1.3 | | |
Scientific Instruments:
Pollution Control | | | 302,733 | | | | 1.3 | | |
Semiconductors &
Components | | | 295,336 | | | | 1.3 | | |
Medical & Dental
Instruments & Supplies | | | 289,967 | | | | 1.2 | | |
Entertainment | | | 283,537 | | | | 1.2 | | |
Asset Management &
Custodian | | | 201,045 | | | | 0.9 | | |
Automobiles | | | 128,943 | | | | 0.5 | | |
Advertising Agencies | | | 8,162 | | | | 0.0 | | |
| | | $ | 23,521,492 | | | | 100.0 | % | |
See Notes to Financial Statements
51
Morgan Stanley Select Dimensions Investment Series
Financial Statements
Statements of Assets and Liabilities
December 31, 2012
| | | Money
Market | | Flexible
Income | | Global
Infrastructure | | Growth | |
Assets: | |
Investments in securities, at value* | | $ | 70,866,834 | (1) | | $ | 21,550,733 | | | $ | 26,499,288 | | | $ | 19,358,220 | | |
Investment in affiliates, at value** | | | — | | | | 512,291 | | | | 214,894 | | | | 483,205 | | |
Total investments in securities, at value | | | 70,866,834 | | | | 22,063,024 | | | | 26,714,182 | | | | 19,841,425 | | |
Unrealized appreciation on open swap agreements | | | — | | | | 6,289 | | | | — | | | | — | | |
Unrealized appreciation on open foreign currency exchange contracts | | | — | | | | 2,316 | | | | — | | | | — | | |
Cash | | | 9,595 | | | | 2,535 | (2) | | | 14,206 | (2) | | | — | | |
Receivable for: | |
Interest and paydown | | | 16,723 | | | | 271,535 | | | | — | | | | — | | |
Dividends | | | — | | | | — | | | | 102,432 | | | | 4,946 | | |
Investments sold | | | — | | | | — | | | | — | | | | 8,103 | | |
Shares of beneficial interest sold | | | 53,562 | | | | — | | | | — | | | | 2,308 | | |
Variation margin | | | — | | | | 32,491 | | | | — | | | | — | | |
Foreign withholding taxes reclaimed | | | — | | | | 317 | | | | 14,575 | | | | 889 | | |
Premium paid on open swap agreements | | | — | | | | 5,316 | | | | — | | | | — | | |
Interest and dividends from affiliates | | | — | | | | 2,338 | | | | 11 | | | | 61 | | |
Prepaid expenses and other assets | | | 2,360 | | | | 800 | | | | 562 | | | | 509 | | |
Total Assets | | | 70,949,074 | | | | 22,386,961 | | | | 26,845,968 | | | | 19,858,241 | | |
Liabilities: | |
Unrealized depreciation on open swap agreements | | | — | | | | 14,921 | | | | — | | | | — | | |
Unrealized depreciation on open foreign currency exchange contracts | | | — | | | | 2,862 | | | | — | | | | — | | |
Payable for: | |
Shares of beneficial interest redeemed | | | 64,204 | | | | 31,384 | | | | 8,860 | | | | 11,357 | | |
Investments purchased | | | — | | | | — | | | | 32,114 | | | | — | | |
Advisory fee | | | — | | | | 6,103 | | | | 12,821 | | | | 8,368 | | |
Administration fee | | | 2,103 | | | | 1,536 | | | | 1,806 | | | | 1,347 | | |
Distribution fee (Class Y) | | | — | | | | 2,604 | | | | 1,605 | | | | 2,338 | | |
Transfer agent fee | | | 325 | | | | 333 | | | | 333 | | | | 333 | | |
Accrued expenses and other payables | | | 20,132 | | | | 44,137 | | | | 32,621 | | | | 25,071 | | |
Total Liabilities | | | 86,764 | | | | 103,880 | | | | 90,160 | | | | 48,814 | | |
Net Assets | | $ | 70,862,310 | | | $ | 22,283,081 | | | $ | 26,755,808 | | | $ | 19,809,427 | | |
Composition of Net Assets: | |
Paid-in-capital | | $ | 70,861,676 | | | $ | 35,032,514 | | | $ | 17,799,770 | | | $ | 13,389,510 | | |
Net unrealized appreciation (depreciation) | | | — | | | | 1,439,525 | | | | 6,178,000 | | | | 5,006,005 | | |
| Accumulated undistributed net investment income (net investment loss) | | | 2,100 | | | | 1,139,493 | | | | 608,833 | | | | (990 | ) | |
| Accumulated net realized gain (loss) | | | (1,466 | ) | | | (15,328,451 | ) | | | 2,169,205 | | | | 1,414,902 | | |
Net Assets | | $ | 70,862,310 | | | $ | 22,283,081 | | | $ | 26,755,808 | | | $ | 19,809,427 | | |
| * Cost | | $ | 70,866,834 | | | $ | 20,137,037 | | | $ | 20,322,075 | | | $ | 14,352,215 | | |
| ** Affiliated Cost | | $ | — | | | $ | 483,288 | | | $ | 214,894 | | | $ | 483,205 | | |
Class X Shares: | |
Net Assets | | $ | 23,244,691 | | | $ | 10,316,542 | | | $ | 19,120,703 | | | $ | 8,794,346 | | |
| Shares Outstanding (unlimited shares authorized, $0.01 par value) | | | 23,244,826 | | | | 1,609,773 | | | | 771,679 | | | | 356,936 | | |
Net Asset Value Per Share | | $ | 1.00 | | | $ | 6.41 | | | $ | 24.78 | | | $ | 24.64 | | |
Class Y Shares: | |
Net Assets | | $ | 47,617,619 | | | $ | 11,966,539 | | | $ | 7,635,105 | | | $ | 11,015,081 | | |
| Shares Outstanding (unlimited shares authorized, $0.01 par value) | | | 47,616,850 | | | | 1,879,012 | | | | 308,680 | | | | 458,689 | | |
Net Asset Value Per Share | | $ | 1.00 | | | $ | 6.37 | | | $ | 24.73 | | | $ | 24.01 | | |
(1) Including repurchase agreements of $35,620,000.
(2) Including foreign currency valued at $2,535 and $14,206, respectively with a cost of $2,568 and $14,249, respectively.
See Notes to Financial Statements
52
| | | Focus
Growth | | Multi Cap
Growth | | Mid Cap
Growth | |
Assets: | |
Investments in securities, at value* | | $ | 67,564,674 | | | $ | 15,486,126 | | | $ | 22,387,820 | | |
Investment in affiliates, at value** | | | 686,482 | | | | 456,721 | | | | 1,133,672 | | |
Total investments in securities, at value | | | 68,251,156 | | | | 15,942,847 | | | | 23,521,492 | | |
Unrealized appreciation on open swap agreements | | | — | | | | — | | | | — | | |
Unrealized appreciation on open foreign currency exchange contracts | | | — | | | | — | | | | — | | |
Cash | | | — | | | | — | | | | — | | |
Receivable for: | |
Interest and paydown | | | — | | | | — | | | | — | | |
Dividends | | | 14,713 | | | | 2,896 | | | | 5,729 | | |
Investments sold | | | — | | | | 28,712 | | | | 39,879 | | |
Shares of beneficial interest sold | | | — | | | | — | | | | — | | |
Variation margin | | | — | | | | — | | | | — | | |
Foreign withholding taxes reclaimed | | | 3,573 | | | | — | | | | 1,565 | | |
Premium paid on open swap agreements | | | — | | | | — | | | | — | | |
Interest and dividends from affiliates | | | 177 | | | | 72 | | | | 234 | | |
Prepaid expenses and other assets | | | 1,610 | | | | 377 | | | | 809 | | |
Total Assets | | | 68,271,229 | | | | 15,974,904 | | | | 23,569,708 | | |
Liabilities: | |
Unrealized depreciation on open swap agreements | | | — | | | | — | | | | — | | |
Unrealized depreciation on open foreign currency exchange contracts | | | — | | | | — | | | | — | | |
Payable for: | |
Shares of beneficial interest redeemed | | | 54,400 | | | | 13,260 | | | | 28,880 | | |
Investments purchased | | | — | | | | 48,011 | | | | 62,483 | | |
Advisory fee | | | 31,356 | | | | 8,952 | | | | 8,143 | | |
Administration fee | | | 4,622 | | | | 1,076 | | | | 1,585 | | |
Distribution fee (Class Y) | | | 3,176 | | | | 1,795 | | | | 1,373 | | |
Transfer agent fee | | | 417 | | | | 333 | | | | 332 | | |
Accrued expenses and other payables | | | 36,774 | | | | 26,741 | | | | 25,716 | | |
Total Liabilities | | | 130,745 | | | | 100,168 | | | | 128,512 | | |
Net Assets | | $ | 68,140,484 | | | $ | 15,874,736 | | | $ | 23,441,196 | | |
Composition of Net Assets: | |
Paid-in-capital | | $ | 49,499,046 | | | $ | 11,217,095 | | | $ | 21,441,011 | | |
Net unrealized appreciation (depreciation) | | | 19,483,111 | | | | 4,329,754 | | | | 1,915,098 | | |
| Accumulated undistributed net investment income (net investment loss) | | | 188,525 | | | | (679 | ) | | | 72,136 | | |
| Accumulated net realized gain (loss) | | | (1,030,198 | ) | | | 328,566 | | | | 12,951 | | |
Net Assets | | $ | 68,140,484 | | | $ | 15,874,736 | | | $ | 23,441,196 | | |
| * Cost | | $ | 48,081,563 | | | $ | 11,156,368 | | | $ | 20,472,713 | | |
| ** Affiliated Cost | | $ | 686,482 | | | $ | 456,721 | | | $ | 1,133,672 | | |
Class X Shares: | |
Net Assets | | $ | 53,180,631 | | | $ | 7,389,151 | | | $ | 17,015,912 | | |
| Shares Outstanding (unlimited shares authorized, $0.01 par value) | | | 2,283,026 | | | | 465,293 | | | | 517,152 | | |
Net Asset Value Per Share | | $ | 23.29 | | | $ | 15.88 | | | $ | 32.90 | | |
Class Y Shares: | |
Net Assets | | $ | 14,959,853 | | | $ | 8,485,585 | | | $ | 6,425,284 | | |
| Shares Outstanding (unlimited shares authorized, $0.01 par value) | | | 654,076 | | | | 552,614 | | | | 200,138 | | |
Net Asset Value Per Share | | $ | 22.87 | | | $ | 15.36 | | | $ | 32.10 | | |
53
Morgan Stanley Select Dimensions Investment Series
Financial Statements continued
Statements of Operations
For the year ended December 31, 2012
| | | Money
Market | | Flexible
Income | | Global
Infrastructure | | Growth | |
Net Investment Income: | |
Income | |
Dividends† | | $ | — | | | $ | 2,914 | | | $ | 924,120 | | | $ | 279,195 | | |
| Interest† | | | 213,152 | | | | 1,387,035 | | | | — | | | | — | | |
Interest and dividends from affiliates (Note 6) | | | — | | | | 13,977 | | | | 249 | | | | 1,072 | | |
Total Income | | | 213,152 | | | | 1,403,926 | | | | 924,369 | | | | 280,267 | | |
†Net of foreign withholding taxes | | | — | | | | 643 | | | | 62,042 | | | | 5,852 | | |
Expenses | |
Advisory fee (Note 4) | | | 336,295 | | | | 74,831 | | | | 155,667 | | | | 110,328 | | |
Distribution fee (Class Y shares) (Note 5) | | | 123,507 | | | | 31,076 | | | | 19,181 | | | | 30,842 | | |
Professional fees | | | 57,833 | | | | 70,404 | | | | 66,351 | | | | 62,314 | | |
Administration fee (Note 4) | | | 37,366 | | | | 18,708 | | | | 21,848 | | | | 17,652 | | |
Shareholder reports and notices | | | 21,990 | | | | 13,488 | | | | 8,635 | | | | 12,265 | | |
Custodian fees | | | 14,935 | | | | 31,017 | | | | 31,795 | | | | 17,814 | | |
Trustees' fees and expenses | | | 3,228 | | | | 1,475 | | | | 1,981 | | | | 1,852 | | |
Transfer agent fees and expenses | | | 1,997 | | | | 2,000 | | | | 2,000 | | | | 2,000 | | |
Other | | | 8,608 | | | | 43,118 | | | | 13,938 | | | | 13,783 | | |
Total Expenses | | | 605,759 | | | | 286,117 | | | | 321,396 | | | | 268,850 | | |
Less: amounts waived (Note 5) | | | (398,637 | ) | | | — | | | | — | | | | — | | |
Less: expense offset (Note 9) | | | — | | | | (3 | ) | | | — | | | | — | | |
Less: rebate from Morgan Stanley affiliated cash sweep (Note 6) | | | — | | | | (883 | ) | | | (402 | ) | | | (801 | ) | |
Net Expenses | | | 207,122 | | | | 285,231 | | | | 320,994 | | | | 268,049 | | |
Net Investment Income (Loss) | | | 6,030 | | | | 1,118,695 | | | | 603,375 | | | | 12,218 | | |
Realized and Unrealized Gain (Loss): | |
Realized Gain (Loss) on: | |
Investments | | | 13 | | | | 963,642 | | | | 2,324,133 | | | | 1,564,046 | | |
Investments in affiliates (Note 6) | | | — | | | | 2,302 | | | | — | | | | 18,171 | | |
Futures contracts | | | — | | | | (135,447 | ) | | | — | | | | — | | |
Swap agreements | | | — | | | | (67,574 | ) | | | — | | | | — | | |
Foreign currency exchange contracts | | | — | | | | 214 | | | | — | | | | — | | |
Foreign currency translation | | | — | | | | (265 | ) | | | 5,367 | | | | (1,004 | ) | |
Net Realized Gain (Loss) | | | 13 | | | | 762,872 | | | | 2,329,500 | | | | 1,581,213 | | |
Change in Unrealized Appreciation (Depreciation) on: | |
Investments | | | — | | | | 848,246 | | | | 1,580,888 | | | | 1,502,498 | | |
Investments in affiliates (Note 6) | | | — | | | | 18,224 | | | | — | | | | (988 | ) | |
Futures contracts | | | — | | | | 32,732 | | | | — | | | | — | | |
Swap agreements | | | — | | | | 40,482 | | | | — | | | | — | | |
Foreign currency exchange contracts | | | — | | | | 2,576 | | | | — | | | | — | | |
Foreign currency translation | | | — | | | | 2,351 | | | | 1,332 | | | | 317 | | |
Net Change in Unrealized Appreciation (Depreciation) | | | — | | | | 944,611 | | | | 1,582,220 | | | | 1,501,827 | | |
Net Gain | | | 13 | | | | 1,707,483 | | | | 3,911,720 | | | | 3,083,040 | | |
Net Increase | | $ | 6,043 | | | $ | 2,826,178 | | | $ | 4,515,095 | | | $ | 3,095,258 | | |
See Notes to Financial Statements
54
| | | Focus
Growth | | Multi Cap
Growth | | Mid Cap
Growth | |
Net Investment Income: | |
Income | |
Dividends† | | $ | 861,652 | | | $ | 178,948 | | | $ | 357,910 | | |
| Interest† | | | — | | | | — | | | | — | | |
Interest and dividends from affiliates (Note 6) | | | 3,519 | | | | 907 | | | | 1,544 | | |
Total Income | | | 865,171 | | | | 179,855 | | | | 359,454 | | |
†Net of foreign withholding taxes | | | 21,589 | | | | 4,163 | | | | 5,581 | | |
Expenses | |
Advisory fee (Note 4) | | | 397,608 | | | | 113,505 | | | | 110,175 | | |
Distribution fee (Class Y shares) (Note 5) | | | 41,050 | | | | 22,415 | | | | 18,571 | | |
Professional fees | | | 69,273 | | | | 63,920 | | | | 62,838 | | |
Administration fee (Note 4) | | | 58,364 | | | | 13,553 | | | | 20,986 | | |
Shareholder reports and notices | | | 16,612 | | | | 8,824 | | | | 20,356 | | |
Custodian fees | | | 19,805 | | | | 16,012 | | | | 32,678 | | |
Trustees' fees and expenses | | | 3,176 | | | | 1,793 | | | | 1,715 | | |
Transfer agent fees and expenses | | | 2,500 | | | | 2,000 | | | | 1,997 | | |
Other | | | 16,467 | | | | 14,755 | | | | 16,916 | | |
Total Expenses | | | 624,855 | | | | 256,777 | | | | 286,232 | | |
Less: amounts waived (Note 5) | | | — | | | | — | | | | — | | |
Less: expense offset (Note 9) | | | — | | | | — | | | | — | | |
Less: rebate from Morgan Stanley affiliated cash sweep (Note 6) | | | (2,572 | ) | | | (778 | ) | | | (1,285 | ) | |
Net Expenses | | | 622,283 | | | | 255,999 | | | | 284,947 | | |
Net Investment Income (Loss) | | | 242,888 | | | | (76,144 | ) | | | 74,507 | | |
Realized and Unrealized Gain (Loss): | |
Realized Gain (Loss) on: | |
Investments | | | (1,010,620 | ) | | | 344,438 | | | | 54,243 | | |
Investments in affiliates (Note 6) | | | 13,282 | | | | — | | | | — | | |
Futures contracts | | | — | | | | — | | | | — | | |
Swap agreements | | | — | | | | — | | | | — | | |
Foreign currency exchange contracts | | | — | | | | — | | | | — | | |
Foreign currency translation | | | (1,137 | ) | | | (3,223 | ) | | | (1,851 | ) | |
Net Realized Gain (Loss) | | | (998,475 | ) | | | 341,215 | | | | 52,392 | | |
Change in Unrealized Appreciation (Depreciation) on: | |
Investments | | | 10,574,254 | | | | 1,558,170 | | | | 2,057,905 | | |
Investments in affiliates (Note 6) | | | — | | | | — | | | | — | | |
Futures contracts | | | — | | | | — | | | | — | | |
Swap agreements | | | — | | | | — | | | | — | | |
Foreign currency exchange contracts | | | — | | | | — | | | | — | | |
Foreign currency translation | | | 886 | | | | 176 | | | | 92 | | |
Net Change in Unrealized Appreciation (Depreciation) | | | 10,575,140 | | | | 1,558,346 | | | | 2,057,997 | | |
Net Gain | | | 9,576,665 | | | | 1,899,561 | | | | 2,110,389 | | |
Net Increase | | $ | 9,819,553 | | | $ | 1,823,417 | | | $ | 2,184,896 | | |
55
Morgan Stanley Select Dimensions Investment Series
Financial Statements continued
Statements of Changes in Net Assets
| | | Money Market | | Flexible Income | | Global Infrastructure | |
| | | For The Year
Ended
December 31, 2012 | | For The Year
Ended
December 31, 2011 | | For The Year
Ended
December 31, 2012 | | For The Year
Ended
December 31, 2011 | | For The Year
Ended
December 31, 2012 | | For The Year
Ended
December 31, 2011 | |
Increase (Decrease) in Net Assets: | |
Operations: | |
Net investment income (loss) | | $ | 6,030 | | | $ | 9,366 | | | $ | 1,118,695 | | | $ | 1,428,092 | | | $ | 603,375 | | | $ | 631,992 | | |
Net realized gain (loss) | | | 13 | | | | (1,549 | ) | | | 762,872 | | | | 195,884 | | | | 2,329,500 | | | | 2,497,127 | | |
Net change in unrealized appreciation (depreciation) | | | — | | | | — | | | | 944,611 | | | | (505,679 | ) | | | 1,582,220 | | | | 1,142,913 | | |
Net Increase (Decrease) | | | 6,043 | | | | 7,817 | | | | 2,826,178 | | | | 1,118,297 | | | | 4,515,095 | | | | 4,272,032 | | |
Dividends and Distributions to Shareholders from: | |
Net investment income | |
Class X shares | | | (3,087 | ) | | | (2,982 | ) | | | (689,754 | ) | | | (790,731 | ) | | | (438,478 | ) | | | (586,125 | ) | |
Class Y shares | | | (5,999 | ) | | | (6,385 | ) | | | (775,294 | ) | | | (838,939 | ) | | | (151,957 | ) | | | (208,666 | ) | |
Net realized gain | |
Class X shares | | | — | | | | — | | | | — | | | | — | | | | (1,819,783 | ) | | | (1,282,100 | ) | |
Class Y shares | | | — | | | | — | | | | — | | | | — | | | | (715,240 | ) | | | (506,405 | ) | |
Total Dividends and Distributions | | | (9,086 | ) | | | (9,367 | ) | | | (1,465,048 | ) | | | (1,629,670 | ) | | | (3,125,458 | ) | | | (2,583,296 | ) | |
Net decrease from transactions in shares of
beneficial interest | | | (12,770,135 | ) | | | (16,648,095 | ) | | | (3,011,347 | ) | | | (3,014,435 | ) | | | (2,779,186 | ) | | | (4,268,842 | ) | |
Net Decrease | | | (12,773,178 | ) | | | (16,649,645 | ) | | | (1,650,217 | ) | | | (3,525,808 | ) | | | (1,389,549 | ) | | | (2,580,106 | ) | |
Net Assets: | |
Beginning of period | | | 83,635,488 | | | | 100,285,133 | | | | 23,933,298 | | | | 27,459,106 | | | | 28,145,357 | | | | 30,725,463 | | |
End of Period | | $ | 70,862,310 | | | $ | 83,635,488 | | | $ | 22,283,081 | | | $ | 23,933,298 | | | $ | 26,755,808 | | | $ | 28,145,357 | | |
Accumulated Undistributed Net Investment
Income (Loss) | | $ | 2,100 | | | $ | 5,207 | | | $ | 1,139,493 | | | $ | 1,420,445 | | | $ | 608,833 | | | $ | 569,018 | | |
See Notes to Financial Statements
56
| | | Growth | | Focus Growth | |
| | | For The Year
Ended
December 31, 2012 | | For The Year
Ended
December 31, 2011 | | For The Year
Ended
December 31, 2012 | | For The Year
Ended
December 31, 2011 | |
Increase (Decrease) in Net Assets: | |
Operations: | |
Net investment income (loss) | | $ | 12,218 | | | $ | (87,190 | ) | | $ | 242,888 | | | $ | (105,629 | ) | |
Net realized gain (loss) | | | 1,581,213 | | | | 4,219,867 | | | | (998,475 | ) | | | 10,903,216 | | |
Net change in unrealized appreciation (depreciation) | | | 1,501,827 | | | | (4,659,700 | ) | | | 10,575,140 | | | | (14,661,098 | ) | |
Net Increase (Decrease) | | | 3,095,258 | | | | (527,023 | ) | | | 9,819,553 | | | | (3,863,511 | ) | |
Dividends and Distributions to Shareholders from: | |
Net investment income | |
Class X shares | | | — | | | | — | | | | — | | | | — | | |
Class Y shares | | | — | | | | — | | | | — | | | | — | | |
Net realized gain | |
Class X shares | | | (443,966 | ) | | | — | | | | (1,852,844 | ) | | | — | | |
Class Y shares | | | (552,326 | ) | | | — | | | | (553,913 | ) | | | — | | |
Total Dividends and Distributions | | | (996,292 | ) | | | — | | | | (2,406,757 | ) | | | — | | |
Net decrease from transactions in shares of
beneficial interest | | | (4,443,469 | ) | | | (6,566,694 | ) | | | (11,281,645 | ) | | | (18,076,585 | ) | |
Net Decrease | | | (2,344,503 | ) | | | (7,093,717 | ) | | | (3,868,849 | ) | | | (21,940,096 | ) | |
Net Assets: | |
Beginning of period | | | 22,153,930 | | | | 29,247,647 | | | | 72,009,333 | | | | 93,949,429 | | |
End of Period | | $ | 19,809,427 | | | $ | 22,153,930 | | | $ | 68,140,484 | | | $ | 72,009,333 | | |
Accumulated Undistributed Net Investment
Income (Loss) | | $ | (990 | ) | | $ | (14,608 | ) | | $ | 188,525 | | | $ | (76,700 | ) | |
57
Morgan Stanley Select Dimensions Investment Series
Financial Statements continued
Statements of Changes in Net Assets continued
| | | Multi Cap Growth | | Mid Cap Growth | |
| | | For The Year
Ended
December 31, 2012 | | For The Year
Ended
December 31, 2011 | | For The Year
Ended
December 31, 2012 | | For The Year
Ended
December 31, 2011 | |
Increase (Decrease) in Net Assets: | |
Operations: | |
Net investment income (loss) | | $ | (76,144 | ) | | $ | (144,516 | ) | | $ | 74,507 | | | $ | (89,696 | ) | |
Net realized gain | | | 341,215 | | | | 3,438,750 | | | | 52,392 | | | | 4,377,600 | | |
Net change in unrealized appreciation (depreciation) | | | 1,558,346 | | | | (4,645,205 | ) | | | 2,057,997 | | | | (6,164,401 | ) | |
Net Increase (Decrease) | | | 1,823,417 | | | | (1,350,971 | ) | | | 2,184,896 | | | | (1,876,497 | ) | |
Dividends and Distributions to Shareholders from: | |
Net investment income | |
Class X shares | | | — | | | | — | | | | — | | | | (80,806 | ) | |
Class Y shares | | | — | | | | — | | | | — | | | | (15,788 | ) | |
Net realized gain | |
Class X shares | | | (537,907 | ) | | | — | | | | (1,395,029 | ) | | | — | | |
Class Y shares | | | (609,634 | ) | | | — | | | | (581,952 | ) | | | — | | |
Total Dividends and Distributions | | | (1,147,541 | ) | | | — | | | | (1,976,981 | ) | | | (96,594 | ) | |
Net decrease from transactions in shares of
beneficial interest | | | (1,593,485 | ) | | | (5,144,842 | ) | | | (3,764,962 | ) | | | (6,175,477 | ) | |
Net Decrease | | | (917,609 | ) | | | (6,495,813 | ) | | | (3,557,047 | ) | | | (8,148,568 | ) | |
Net Assets: | |
Beginning of period | | | 16,792,345 | | | | 23,288,158 | | | | 26,998,243 | | | | 35,146,811 | | |
End of Period | | $ | 15,874,736 | | | $ | 16,792,345 | | | $ | 23,441,196 | | | $ | 26,998,243 | | |
Accumulated Undistributed Net Investment
Income (Loss) | | $ | (679 | ) | | $ | (16,009 | ) | | $ | 72,136 | | | $ | (1,052 | ) | |
See Notes to Financial Statements
58
Morgan Stanley Select Dimensions Investment Series
Financial Statements continued
Statements of Changes in Net Assets continued
Summary of Transactions in Shares of Beneficial Interest
| | | Money Market | | Flexible Income | |
| | | For The Year
Ended
December 31, 2012 | | For The Year
Ended
December 31, 2011 | | For The Year
Ended
December 31, 2012 | | For The Year
Ended
December 31, 2011 | |
Class X Shares | |
Shares | |
Sold | | | 4,239,694 | | | | 4,856,704 | | | | 38,236 | | | | 110,334 | | |
Reinvestment of dividends and distributions | | | 3,087 | | | | 2,982 | | | | 114,959 | | | | 131,570 | | |
Redeemed | | | (8,551,676 | ) | | | (9,733,428 | ) | | | (422,458 | ) | | | (411,857 | ) | |
Net Decrease - Class X | | | (4,308,895 | ) | | | (4,873,742 | ) | | | (269,263 | ) | | | (169,953 | ) | |
Amount | |
Sold | | $ | 4,239,694 | | | $ | 4,856,704 | | | $ | 237,182 | | | $ | 684,830 | | |
Reinvestment of dividends and distributions | | | 3,087 | | | | 2,982 | | | | 689,754 | | | | 790,731 | | |
Redeemed | | | (8,551,676 | ) | | | (9,733,428 | ) | | | (2,660,585 | ) | | | (2,540,228 | ) | |
Net Decrease - Class X | | $ | (4,308,895 | ) | | $ | (4,873,742 | ) | | $ | (1,733,649 | ) | | $ | (1,064,667 | ) | |
Class Y Shares | |
Shares | |
Sold | | | 20,134,683 | | | | 39,958,406 | | | | 207,902 | | | | 163,930 | | |
Reinvestment of dividends and distributions | | | 5,999 | | | | 6,385 | | | | 129,865 | | | | 140,291 | | |
Redeemed | | | (28,601,922 | ) | | | (51,739,144 | ) | | | (535,874 | ) | | | (616,688 | ) | |
Net Decrease - Class Y | | | (8,461,240 | ) | | | (11,774,353 | ) | | | (198,107 | ) | | | (312,467 | ) | |
Amount | |
Sold | | $ | 20,134,683 | | | $ | 39,958,406 | | | $ | 1,297,408 | | | $ | 999,654 | | |
Reinvestment of dividends and distributions | | | 5,999 | | | | 6,385 | | | | 775,294 | | | | 838,939 | | |
Redeemed | | | (28,601,922 | ) | | | (51,739,144 | ) | | | (3,350,400 | ) | | | (3,788,361 | ) | |
Net Decrease - Class Y | | $ | (8,461,240 | ) | | $ | (11,774,353 | ) | | $ | (1,277,698 | ) | | $ | (1,949,768 | ) | |
See Notes to Financial Statements
59
Morgan Stanley Select Dimensions Investment Series
Financial Statements continued
Statements of Changes in Net Assets continued
Summary of Transactions in Shares of Beneficial Interest continued
| | | Global Infrastructure | | Growth | | Focus Growth | |
| | | For The Year
Ended
December 31, 2012 | | For The Year
Ended
December 31, 2011 | | For The Year
Ended
December 31, 2012 | | For The Year
Ended
December 31, 2011 | | For The Year
Ended
December 31, 2012 | | For The Year
Ended
December 31, 2011 | |
Class X Shares | |
Shares | |
Sold | | | 6,829 | | | | 15,921 | | | | 14,027 | | | | 11,561 | | | | 17,711 | | | | 17,128 | | |
Reinvestment of dividends and distributions | | | 100,770 | | | | 81,298 | | | | 18,662 | | | | — | | | | 81,948 | | | | — | | |
Redeemed | | | (190,854 | ) | | | (215,273 | ) | | | (94,504 | ) | | | (94,806 | ) | | | (460,502 | ) | | | (594,979 | ) | |
Net Decrease - Class X | | | (83,255 | ) | | | (118,054 | ) | | | (61,815 | ) | | | (83,245 | ) | | | (360,843 | ) | | | (577,851 | ) | |
Amount | |
Sold | | $ | 159,855 | | | $ | 373,423 | | | $ | 344,756 | | | $ | 282,367 | | | $ | 393,653 | | | $ | 398,715 | | |
Reinvestment of dividends and distributions | | | 2,258,261 | | | | 1,868,225 | | | | 443,966 | | | | — | | | | 1,852,844 | | | | — | | |
Redeemed | | | (4,576,331 | ) | | | (5,010,940 | ) | | | (2,290,070 | ) | | | (2,307,685 | ) | | | (10,672,499 | ) | | | (13,778,514 | ) | |
Net Decrease - Class X | | $ | (2,158,215 | ) | | $ | (2,769,292 | ) | | $ | (1,501,348 | ) | | $ | (2,025,318 | ) | | $ | (8,426,002 | ) | | $ | (13,379,799 | ) | |
Class Y Shares | |
Shares | |
Sold | | | 14,958 | | | | 24,755 | | | | 43,858 | | | | 38,570 | | | | 38,350 | | | | 86,759 | | |
Reinvestment of dividends and distributions | | | 38,714 | | | | 31,131 | | | | 23,787 | | | | — | | | | 24,917 | | | | — | | |
Redeemed | | | (77,056 | ) | | | (120,310 | ) | | | (185,558 | ) | | | (228,632 | ) | | | (187,842 | ) | | | (293,107 | ) | |
Net Decrease - Class Y | | | (23,384 | ) | | | (64,424 | ) | | | (117,913 | ) | | | (190,062 | ) | | | (124,575 | ) | | | (206,348 | ) | |
Amount | |
Sold | | $ | 357,081 | | | $ | 573,294 | | | $ | 1,035,904 | | | $ | 898,899 | | | $ | 888,137 | | | $ | 1,966,965 | | |
Reinvestment of dividends and distributions | | | 867,197 | | | | 715,071 | | | | 552,326 | | | | — | | | | 553,913 | | | | — | | |
Redeemed | | | (1,845,249 | ) | | | (2,787,915 | ) | | | (4,530,351 | ) | | | (5,440,275 | ) | | | (4,297,693 | ) | | | (6,663,751 | ) | |
Net Decrease - Class Y | | $ | (620,971 | ) | | $ | (1,499,550 | ) | | $ | (2,942,121 | ) | | $ | (4,541,376 | ) | | $ | (2,855,643 | ) | | $ | (4,696,786 | ) | |
See Notes to Financial Statements
60
| | | Multi Cap Growth | | Mid Cap Growth | |
| | | For The Year
Ended
December 31, 2012 | | For The Year
Ended
December 31, 2011 | | For The Year
Ended
December 31, 2012 | | For The Year
Ended
December 31, 2011 | |
Class X Shares | |
Shares | |
Sold | | | 5,162 | | | | 5,172 | | | | 4,669 | | | | 6,721 | | |
Reinvestment of dividends and distributions | | | 34,525 | | | | — | | | | 43,257 | | | | 2,058 | | |
Redeemed | | | (97,286 | ) | | | (100,005 | ) | | | (116,274 | ) | | | (111,467 | ) | |
Net Decrease - Class X | | | (57,599 | ) | | | (94,833 | ) | | | (68,348 | ) | | | (102,688 | ) | |
Amount | |
Sold | | $ | 84,088 | | | $ | 85,322 | | | $ | 153,516 | | | $ | 251,586 | | |
Reinvestment of dividends and distributions | | | 537,907 | | | | — | | | | 1,395,029 | | | | 80,806 | | |
Redeemed | | | (1,554,688 | ) | | | (1,677,230 | ) | | | (3,925,346 | ) | | | (4,082,760 | ) | |
Net Decrease - Class X | | $ | (932,693 | ) | | $ | (1,591,908 | ) | | $ | (2,376,801 | ) | | $ | (3,750,368 | ) | |
Class Y Shares | |
Shares | |
Sold | | | 49,991 | | | | 39,117 | | | | 25,988 | | | | 93,013 | | |
Reinvestment of dividends and distributions | | | 40,427 | | | | — | | | | 18,469 | | | | 410 | | |
Redeemed | | | (130,015 | ) | | | (256,631 | ) | | | (87,618 | ) | | | (162,679 | ) | |
Net Decrease - Class Y | | | (39,597 | ) | | | (217,514 | ) | | | (43,161 | ) | | | (69,256 | ) | |
Amount | |
Sold | | $ | 792,606 | | | $ | 636,747 | | | $ | 902,541 | | | $ | 3,378,268 | | |
Reinvestment of dividends and distributions | | | 609,634 | | | | — | | | | 581,952 | | | | 15,788 | | |
Redeemed | | | (2,063,032 | ) | | | (4,189,681 | ) | | | (2,872,654 | ) | | | (5,819,165 | ) | |
Net Decrease - Class Y | | $ | (660,792 | ) | | $ | (3,552,934 | ) | | $ | (1,388,161 | ) | | $ | (2,425,109 | ) | |
61
Morgan Stanley Select Dimensions Investment Series
Notes to Financial Statements n December 31, 2012
1. Organization and Accounting Policies
Morgan Stanley Select Dimensions Investment Series (the "Fund") is registered under the Investment Company Act of 1940 as amended (the "Act"), as a diversified (except Focus Growth is non-diversified, effective August 8, 2007), open-end management investment company. The Fund is offered exclusively to life insurance companies in connection with particular life insurance and/or annuity contracts they offer.
The Fund, which consists of seven separate portfolios ("Portfolios"), was organized on June 2, 1994, as a Massachusetts business trust and commenced operations on November 9, 1994, with the exception of Multi Cap Growth which commenced operations on January 21, 1997.
On July 24, 2000, the Fund commenced offering one additional class of shares (Class Y shares). The two classes are identical except that Class Y shares incur distribution expenses. Class X shares are generally available to holders of contracts offered before May 1, 2000. Class Y shares are available to holders of contracts offered on or after July 24, 2000.
The investment objectives of each Portfolio are as follows:
| PORTFOLIO | | INVESTMENT OBJECTIVE | |
| Money Market | | Seeks high current income, preservation of capital and liquidity. | |
| Flexible Income | | Seeks, as a primary objective, to provide a high level of current income and, as a secondary objective, to maximize total return, but only to the extent consistent with its primary objective. | |
| Global Infrastructure | | Seeks both capital appreciation and current income. | |
| Growth | | Seeks long-term capital growth. | |
| Focus Growth | | Seeks long-term capital growth. | |
| Multi Cap Growth | | Seeks long-term capital growth. | |
| Mid Cap Growth | | Seeks long-term capital growth. | |
The following is a summary of significant accounting policies:
A. Valuation of Investments — Money Market: Portfolio securities are valued at amortized cost, which approximates fair value, in accordance with Rule 2a-7 under the Act. All remaining Portfolios: (1) an equity portfolio security listed or traded on the New York Stock Exchange ("NYSE") or American Stock Exchange or other domestic exchange is valued at its latest sales price (or the exchange official closing price if such exchange reports an official closing price) prior to the time when assets are valued; if there were no sales that
62
Morgan Stanley Select Dimensions Investment Series
Notes to Financial Statements n December 31, 2012 continued
day, the security is valued at the mean between the last reported bid and asked price; (2) an equity portfolio security listed or traded on the Nasdaq is valued at the Nasdaq Official Closing Price; if there were no sales that day, the security is valued at the mean between the last reported bid and asked price; (3) all other domestic securities for which over-the-counter market quotations are readily available are valued at the mean between the last reported bid and asked prices. In cases where a security is traded on more than one domestic exchange, the security is valued on the exchange designated as the primary market; (4) for equity securities traded on foreign exchanges, the latest reported sales price (or the exchange official closing price if such exchange reports an official closing price) or the mean between the last reported bid and asked prices may be used if there were no sales on a particular day or the latest bid price may be used if only bid prices are available; (5) futures are valued at the latest price published by the commodities exchange on which they trade; (6) swaps are marked-to-market daily based upon quotations from market makers; (7) when market quotations are not readily available, including circumstances under which Morgan Stanley Investment Management Inc. (the "Adviser") or Morgan Stanley Investment Management Limited or Morgan Stanley Investment Management Company (each, a "Sub-Adviser"), each a wholly owned subsidiary of Morgan Stanley, determines that the latest sale price, the bid price or the mean between the last reported bid and ask price do not reflect a security's fair value, portfolio securities are valued at their fair value as determined in good faith under procedures established by and under the general supervision of the Fund's Board of Trustees (the "Trustees"). Occasionally, developments affecting the closing prices of securities and other assets may occur between the times at which valuations of such securities are determined (that is, close of the foreign market on which the securities trade) and the close of business on the NYSE. If developments occur during such periods that are expected to materially affect the value of such securities, such valuations may be adjusted to reflect the estimated fair value of such securities as of the close of the NYSE, as determined in good faith by the Trustees or by the Adviser using a pricing service and/or procedures approved by the Trustees; (8) certain portfolio securities may be valued by an outside pricing service approved by the Trustees. The prices provided by a pricing service take into account broker-dealer market price quotations for trading in similar groups of securities, security quality, maturity, coupon and other security characteristics as well as any developments related to the specific securities; (9) investments in mutual funds, including the Morgan Stanley Institutional Liquidity Funds, are valued at the net asset value as of the close of each business day; and (10) short-term debt securities having a maturity date of more than sixty days at time of purchase are valued on a mark-to-market basis until sixty days prior to maturity and thereafter at amortized cost based on their value on the 61st day. Short-term debt securities having a maturity date of sixty days or less at the time of purchase are valued at amortized cost, which approximates fair value.
63
Morgan Stanley Select Dimensions Investment Series
Notes to Financial Statements n December 31, 2012 continued
Under procedures approved by the Trustees, the Fund's Adviser has formed a Valuation Committee. The Valuation Committee provides administration and oversight of the Fund's valuation policies and procedures, which are reviewed at least annually by the Trustees. Among other things, these procedures allow the Fund to utilize independent pricing services, quotations from securities and financial instrument dealers, and other market sources to determine fair value.
The Fund has procedures to determine the fair value of securities and other financial instruments for which market prices are not readily available. Under these procedures, the Valuation Committee convenes on a regular and ad hoc basis to review such securities and considers a number of factors, including valuation methodologies and significant unobservable valuation inputs, when arriving at fair value. The Valuation Committee may employ a market-based approach which may use related or comparable assets or liabilities, recent transactions, market multiples, book values, and other relevant information for the investment to determine the fair value of the investment. An income-based valuation approach may also be used in which the anticipated future cash flows of the investment are discounted to calculate fair value. Discounts may also be applied due to the nature or duration of any restrictions on the disposition of the investments. Due to the inherent uncertainty of valuations of such investments, the fair values may differ significantly from the values that would have been used had an active market existed. The Valuation Committee employs various methods for calibrating these valuation approaches including a regular review of valuation methodologies, key inputs and assumptions, transactional back-testing or disposition analysis, and reviews of any related market activity.
B. Accounting for Investments — Security transactions are accounted for on the trade date (date the order to buy or sell is executed). Realized gains and losses on security transactions are determined by the identified cost method. Dividend income and other distributions are recorded on the ex-dividend date except for certain dividends on foreign securities which are recorded as soon as the Fund is informed after the ex-dividend date. Interest income is accrued daily as earned except where collection is not expected. Discounts are accreted and premiums are amortized over the life of the respective securities and are included in interest income.
C. Repurchase Agreements — The Fund invests directly with institutions in repurchase agreements. The Fund's custodian receives the collateral, which is marked-to-market daily to determine that the value of the collateral does not decrease below the repurchase price plus accrued interest as earned. If such a decrease occurs, additional collateral will be requested and, when received, will be added to the account to maintain full collateralization.
64
Morgan Stanley Select Dimensions Investment Series
Notes to Financial Statements n December 31, 2012 continued
D. Multiple Class Allocations — Investment income, expenses (other than distribution fees), and realized and unrealized gains and losses are allocated to each class of shares based upon the relative net asset value on the date such items are recognized. Distribution fees are charged directly to the respective class.
E. Foreign Currency Translation — The books and records of the Fund are maintained in U.S. dollars as follows: (1) the foreign currency market value of investment securities, other assets and liabilities and foreign currency exchange contracts are translated at the exchange rates prevailing at the end of the period; and (2) purchases, sales, income and expenses are translated at the exchange rates prevailing on the respective dates of such transactions. The resultant exchange gains and losses are recorded as realized and unrealized gains/losses on foreign currency exchange contracts and foreign currency translations. Pursuant to U.S. federal income tax regulations, certain foreign exchange gains/losses included in realized and unrealized gains/losses are included in or are a reduction of ordinary income for federal income tax purposes. The Fund does not isolate that portion of the results of operations arising as a result of changes in the foreign exchange rates from the changes in the market prices of the securities held.
F. Restricted Securities — Certain Portfolios invested in unregistered or otherwise restricted securities. The term "restricted securities" refers to securities that are unregistered or are held by control persons of the issuer and securities that are subject to contractual restrictions on their resale. As a result, restricted securities may be more difficult to value and the Portfolio may have difficulty disposing of such assets either in a timely manner or for a reasonable price. In order to dispose of an unregistered security, the Portfolio, where it has contractual rights to do so, may have to cause such security to be registered. A considerable period may elapse between the time the decision is made to sell the security and the time the security is registered so that the Portfolio could sell it. Contractual restrictions on the resale of securities vary in length and scope and are generally the result of a negotiation between the issuer and acquirer of the securities. The Portfolio would, in either case, bear market risks during that period. Restricted Securities are identified in the Portfolio of Investments.
G. Dividends and Distributions to Shareholders — Dividends and distributions to shareholders are recorded on the ex-dividend date.
H. Expenses — Direct expenses are charged to the respective Portfolio and general Fund expenses are allocated on the basis of relative net assets or equally among the Portfolios.
I. Use of Estimates — The preparation of financial statements in accordance with generally accepted accounting principles in the United States ("GAAP") requires management to make estimates and assumptions that affect the reported amounts and disclosures. Actual results could differ from those estimates.
65
Morgan Stanley Select Dimensions Investment Series
Notes to Financial Statements n December 31, 2012 continued
J. Indemnifications — The Fund enters into contracts that contain a variety of indemnifications. The Fund's maximum exposure under these arrangements is unknown. However, the Fund has not had prior claims or losses pursuant to these contracts and expects the risk of loss to be remote.
2. Fair Valuation Measurements
Financial Accounting Standards Board ("FASB") Accounting Standards Codification ("ASC") 820, Fair Value Measurements and Disclosures ("ASC 820"), defines fair value as the value that the Fund would receive to sell an investment or pay to transfer a liability in a timely transaction with an independent buyer in the principal market, or in the absence of a principal market the most advantageous market for the investment or liability. ASC 820 establishes a three-tier hierarchy to distinguish between (1) inputs that reflect the assumptions market participants would use in valuing an asset or liability developed based on market data obtained from sources independent of the reporting entity (observable inputs); and (2) inputs that reflect the reporting entity's own assumptions about the assumptions market participants would use in valuing an asset or liability developed based on the best information available in the circumstances (unobservable inputs) and to establish classification of fair value measurements for disclosure purposes. Various inputs are used in determining the value of the Fund's investments. The inputs are summarized in the three broad levels listed below.
• Level 1 — unadjusted quoted prices in active markets for identical investments
• Level 2 — other significant observable inputs (including quoted prices for similar investments, interest rates, prepayment speeds, credit risk, etc.)
• Level 3 — significant unobservable inputs including the Fund's own assumptions in determining the fair value of investments. Factors considered in making this determination may include, but are not limited to, information obtained by contacting the issuer, analysts, or the appropriate stock exchange (for exchange-traded securities), analysis of the issuer's financial statements or other available documents and, if necessary, available information concerning other securities in similar circumstances
The inputs or methodology used for valuing securities are not necessarily an indication of the risk associated with investing in those securities and the determination of the significance of a particular input to the fair value measurement in its entirety requires judgment and considers factors specific to each security.
66
Morgan Stanley Select Dimensions Investment Series
Notes to Financial Statements n December 31, 2012 continued
The following is a summary of the inputs used to value each Portfolio's investments as of December 31, 2012.
Investment Type | | Level 1
Unadjusted
Quoted Prices | | Level 2
Other
Significant
Observable
Inputs | | Level 3
Significant
Unobservable
Inputs | | Total | |
Money Market | |
Assets: | |
Repurchase Agreements | | $ | — | | | $ | 35,620,000 | | | $ | — | | | $ | 35,620,000 | | |
Commercial Paper | | | — | | | | 17,677,313 | | | | — | | | | 17,677,313 | | |
Floating Rate Notes | | | — | | | | 10,809,913 | | | | — | | | | 10,809,913 | | |
Certificates of Deposit | | | — | | | | 3,750,001 | | | | — | | | | 3,750,001 | | |
Tax-Exempt Instruments | |
Municipal Bond | | | — | | | | 1,009,607 | | | | — | | | | 1,009,607 | | |
Weekly Variable Rate Bond | | | — | | | | 2,000,000 | | | | — | | | | 2,000,000 | | |
Total Tax-Exempt Instruments | | | — | | | | 3,009,607 | | | | — | | | | 3,009,607 | | |
Total Assets | | $ | — | | | $ | 70,866,834 | | | $ | — | | | $ | 70,866,834 | | |
Flexible Income | |
Assets: | |
Fixed Income Securities | |
Corporate Bonds | | $ | — | | | $ | 13,328,499 | | | $ | — | † | | $ | 13,328,499 | | |
Sovereign | | | — | | | | 2,623,202 | | | | — | | | | 2,623,202 | | |
Municipal Bonds | | | — | | | | 306,118 | | | | — | | | | 306,118 | | |
Agency Fixed Rate Mortgages | | | — | | | | 152,503 | | | | — | | | | 152,503 | | |
Asset-Backed Securities | | | — | | | | 669,484 | | | | — | | | | 669,484 | | |
U.S. Treasury Securities | | | — | | | | 2,917,562 | | | | — | | | | 2,917,562 | | |
Mortgages — Other | | | — | | | | 1,879,926 | | | | — | | | | 1,879,926 | | |
Total Fixed Income Securities | | | — | | | | 21,877,294 | | | | — | † | | | 21,877,294 | | |
Common Stocks | |
| Diversified Telecommunication Services | | | 2,207 | | | | — | | | | — | | | | 2,207 | | |
Electric Utilities | | | 267 | | | | — | | | | — | | | | 267 | | |
Wireless Telecommunication Services | | | 572 | | | | — | | | | — | | | | 572 | | |
Total Common Stocks | | | 3,046 | | | | — | | | | — | | | | 3,046 | | |
Short-Term Investment — Investment Company | | | 182,684 | | | | — | | | | — | | | | 182,684 | | |
Credit Default Swap Agreements | | | — | | | | 5,039 | | | | — | | | | 5,039 | | |
Foreign Currency Exchange Contracts | | | — | | | | 2,316 | | | | — | | | | 2,316 | | |
Futures Contracts | | | 13,722 | | | | — | | | | — | | | | 13,722 | | |
Interest Rate Swap Agreements | | | — | | | | 1,250 | | | | — | | | | 1,250 | | |
| Total Assets | | | 199,452 | | | | 21,885,899 | | | | — | † | | | 22,085,351 | | |
67
Morgan Stanley Select Dimensions Investment Series
Notes to Financial Statements n December 31, 2012 continued
Investment Type | | Level 1
Unadjusted
Quoted Prices | | Level 2
Other
Significant
Observable
Inputs | | Level 3
Significant
Unobservable
Inputs | | Total | |
Liabilities: | |
Foreign Currency Exchange Contracts | | $ | — | | | $ | (2,862 | ) | | $ | — | | | $ | (2,862 | ) | |
Futures Contracts | | | (7,686 | ) | | | — | | | | — | | | | (7,686 | ) | |
Interest Rate Swap Agreements | | | — | | | | (14,921 | ) | | | — | | | | (14,921 | ) | |
Total Liabilities | | | (7,686 | ) | | | (17,783 | ) | | | — | | | | (25,469 | ) | |
Total | | $ | 191,766 | | | $ | 21,868,116 | | | $ | — | † | | $ | 22,059,882 | | |
† Includes one security which is valued at zero.
Global Infrastructure | |
Assets: | |
Common Stocks | |
Airports | | $ | — | | | $ | 1,050,107 | | | $ | — | | | $ | 1,050,107 | | |
| Communications | | | 2,677,099 | | | | 737,680 | | | | — | | | | 3,414,779 | | |
Diversified | | | 458,535 | | | | 401,462 | | | | — | | | | 859,997 | | |
Oil & Gas Storage & Transportation | | | 9,799,299 | | | | 4,145,184 | | | | — | | | | 13,944,483 | | |
Ports | | | — | | | | 276,077 | | | | — | | | | 276,077 | | |
Toll Roads | | | — | | | | 1,996,678 | | | | — | | | | 1,996,678 | | |
Transmission & Distribution | | | 1,770,942 | | | | 2,056,141 | | | | — | | | | 3,827,083 | | |
Water | | | 518,662 | | | | 611,422 | | | | — | | | | 1,130,084 | | |
Total Common Stocks | | | 15,224,537 | | | | 11,274,751 | | | | — | | | | 26,499,288 | | |
Short-Term Investment — Investment Company | | | 214,894 | | | | — | | | | — | | | | 214,894 | | |
Total Assets | | $ | 15,439,431 | | | $ | 11,274,751 | | | $ | — | | | $ | 26,714,182 | | |
Growth | |
Assets: | |
Common Stocks | |
Alternative Energy | | $ | 429,952 | | | $ | — | | | $ | — | | | $ | 429,952 | | |
Asset Management & Custodian | | | 329,702 | | | | — | | | | — | | | | 329,702 | | |
Beverage: Brewers & Distillers | | | — | | | | 462,141 | | | | — | | | | 462,141 | | |
Biotechnology | | | 568,852 | | | | — | | | | — | | | | 568,852 | | |
Chemicals: Diversified | | | 608,221 | | | | — | | | | — | | | | 608,221 | | |
Commercial Services | | | — | | | | 318,642 | | | | — | | | | 318,642 | | |
Communications Technology | | | 767,270 | | | | — | | | | — | | | | 767,270 | | |
Computer Services, Software & Systems | | | 4,117,175 | | | | — | | | | — | | | | 4,117,175 | | |
Computer Technology | | | 1,725,402 | | | | — | | | | — | | | | 1,725,402 | | |
Consumer Lending | | | 1,698,676 | | | | — | | | | — | | | | 1,698,676 | | |
Diversified Media | | | 312,220 | | | | 293,764 | | | | — | | | | 605,984 | | |
Diversified Retail | | | 2,506,790 | | | | — | | | | — | | | | 2,506,790 | | |
Electronic Components | | | 287,188 | | | | — | | | | — | | | | 287,188 | | |
68
Morgan Stanley Select Dimensions Investment Series
Notes to Financial Statements n December 31, 2012 continued
Investment Type | | Level 1
Unadjusted
Quoted Prices | | Level 2
Other
Significant
Observable
Inputs | | Level 3
Significant
Unobservable
Inputs | | Total | |
Financial Data & Systems | | $ | 526,623 | | | $ | — | | | $ | — | | | $ | 526,623 | | |
Foods | | | 302,519 | | | | — | | | | — | | | | 302,519 | | |
Insurance: Property-Casualty | | | 404,403 | | | | — | | | | — | | | | 404,403 | | |
Medical Equipment | | | 559,512 | | | | — | | | | — | | | | 559,512 | | |
Pharmaceuticals | | | 593,240 | | | | — | | | | — | | | | 593,240 | | |
Real Estate Investment Trusts (REIT) | | | 731,681 | | | | — | | | | — | | | | 731,681 | | |
Recreational Vehicles & Boats | | | — | | | | 733,457 | | | | — | | | | 733,457 | | |
Restaurants | | | 515,020 | | | | — | | | | — | | | | 515,020 | | |
Semiconductors & Components | | | 252,753 | | | | — | | | | — | | | | 252,753 | | |
Textiles Apparel & Shoes | | | 293,426 | | | | — | | | | — | | | | 293,426 | | |
Total Common Stocks | | | 17,530,625 | | | | 1,808,004 | | | | — | | | | 19,338,629 | | |
Convertible Preferred Stock | | | — | | | | — | | | | 19,591 | | | | 19,591 | | |
Short-Term Investment — Investment Company | | | 483,205 | | | | — | | | | — | | | | 483,205 | | |
Total Assets | | $ | 18,013,830 | | | $ | 1,808,004 | | | $ | 19,591 | | | $ | 19,841,425 | | |
The following table presents additional information about valuation techniques and inputs used for investments that are measured at fair value and categorized within Level 3 as of December 31, 2012.
Growth
| | | Fair Value at
December 31,
2012 | | Valuation Technique | | Unobservable Input | | Range | | Weighted
Average | | Impact
to
Valuation
from an
Increase
in Input | |
Alternative Energy | |
Convertible Preferred
Stock
| | $ | 19,591
| | | Asset Approach
Discounted cash flow
| | Net Tangible Assets
Weighted average
cost of capital | | $0.25
24.7% | | $0.25
26.0% | | $0.25
25.0% | | Increase
Decrease | |
| | | | | | | Perpetual growth
rate | | 3.5% | | 4.5% | | 4.0% | | Increase | |
| | | | | Market Comparable
Companies | | Enterprise Value /
Revenue | | 2.8x | | 4.6x | | 3.7x | | Increase | |
| | | | | | | Discount for lack
of marketability | | 15% | | 15% | | 15% | | Decrease | |
69
Morgan Stanley Select Dimensions Investment Series
Notes to Financial Statements n December 31, 2012 continued
Investment Type | | Level 1
Unadjusted
Quoted Prices | | Level 2
Other
Significant
Observable
Inputs | | Level 3
Significant
Unobservable
Inputs | | Total | |
Focus Growth | |
Assets: | |
Common Stocks | |
Alternative Energy | | $ | 964,189 | | | $ | — | | | $ | — | | | $ | 964,189 | | |
Asset Management & Custodian | | | 1,239,226 | | | | — | | | | — | | | | 1,239,226 | | |
Beverage: Brewers & Distillers | | | — | | | | 1,903,582 | | | | — | | | | 1,903,582 | | |
Biotechnology | | | 2,379,141 | | | | — | | | | — | | | | 2,379,141 | | |
Chemicals: Diversified | | | 2,659,665 | | | | — | | | | — | | | | 2,659,665 | | |
Commercial Services | | | — | | | | 1,291,121 | | | | — | | | | 1,291,121 | | |
Communications Technology | | | 3,150,820 | | | | — | | | | — | | | | 3,150,820 | | |
Computer Services, Software & Systems | | | 16,168,500 | | | | — | | | | — | | | | 16,168,500 | | |
Computer Technology | | | 7,016,447 | | | | — | | | | — | | | | 7,016,447 | | |
Consumer Lending | | | 5,435,848 | | | | — | | | | — | | | | 5,435,848 | | |
Diversified Media | | | — | | | | 1,344,555 | | | | — | | | | 1,344,555 | | |
Diversified Retail | | | 10,467,257 | | | | — | | | | — | | | | 10,467,257 | | |
Financial Data & Systems | | | 899,361 | | | | — | | | | — | | | | 899,361 | | |
Insurance: Property-Casualty | | | 1,879,820 | | | | — | | | | — | | | | 1,879,820 | | |
Medical Equipment | | | 2,159,590 | | | | — | | | | — | | | | 2,159,590 | | |
Real Estate Investment Trusts (REIT) | | | 2,771,326 | | | | — | | | | — | | | | 2,771,326 | | |
Recreational Vehicles & Boats | | | — | | | | 2,754,366 | | | | — | | | | 2,754,366 | | |
Restaurants | | | 2,011,822 | | | | — | | | | — | | | | 2,011,822 | | |
Semiconductors & Components | | | 1,007,985 | | | | — | | | | — | | | | 1,007,985 | | |
Total Common Stocks | | | 60,210,997 | | | | 7,293,624 | | | | — | | | | 67,504,621 | | |
Convertible Preferred Stock | | | — | | | | — | | | | 60,053 | | | | 60,053 | | |
Short-Term Investment — Investment Company | | | 686,482 | | | | — | | | | — | | | | 686,482 | | |
Total Assets | | $ | 60,897,479 | | | $ | 7,293,624 | | | $ | 60,053 | | | $ | 68,251,156 | | |
70
Morgan Stanley Select Dimensions Investment Series
Notes to Financial Statements n December 31, 2012 continued
The following table presents additional information about valuation techniques and inputs used for investments that are measured at fair value and categorized within Level 3 as of December 31, 2012.
Focus Growth
| | | Fair Value at
December 31,
2012 | | Valuation Technique | | Unobservable Input | | Range | | Weighted
Average | | Impact
to
Valuation
from an
Increase
in Input | |
Alternative Energy | |
Convertible Preferred
Stock
| | $ | 60,053
| | | Asset Approach
Discounted cash flow
| | Net Tangible Assets
Weighted average
cost of capital | | $0.25
24.7% | | $0.25
26.0% | | $0.25
25.0% | | Increase
Decrease | |
| | | | | | | Perpetual growth
rate | | 3.5% | | 4.5% | | 4.0% | | Increase | |
| | | | | Market Comparable
Companies | | Enterprise Value /
Revenue | | 2.8x | | 4.6x | | 3.7x | | Increase | |
| | | | | | | Discount for lack
of marketability | | 15% | | 15% | | 15% | | Decrease | |
Investment Type | | Level 1
Unadjusted
Quoted Prices | | Level 2
Other
Significant
Observable
Inputs | | Level 3
Significant
Unobservable
Inputs | | Total | |
Multi Cap Growth | |
Assets: | |
Common Stocks | |
Advertising Agencies | | $ | 5,501 | | | $ | — | | | $ | — | | | $ | 5,501 | | |
Alternative Energy | | | 347,073 | | | | — | | | | — | | | | 347,073 | | |
Beverage: Brewers & Distillers | | | — | | | | 357,627 | | | | — | | | | 357,627 | | |
Biotechnology | | | 507,036 | | | | — | | | | — | | | | 507,036 | | |
Chemicals: Diversified | | | 489,435 | | | | — | | | | — | | | | 489,435 | | |
Commercial Services | | | 325,313 | | | | 418,362 | | | | — | | | | 743,675 | | |
Communications Technology | | | 620,108 | | | | — | | | | — | | | | 620,108 | | |
Computer Services, Software & Systems | | | 3,773,734 | | | | — | | | | — | | | | 3,773,734 | | |
Computer Technology | | | 1,559,888 | | | | — | | | | — | | | | 1,559,888 | | |
Consumer Lending | | | 1,170,366 | | | | — | | | | — | | | | 1,170,366 | | |
Diversified Retail | | | 2,002,389 | | | | — | | | | — | | | | 2,002,389 | | |
Financial Data & Systems | | | 774,554 | | | | — | | | | — | | | | 774,554 | | |
Health Care Services | | | 600,160 | | | | — | | | | — | | | | 600,160 | | |
71
Morgan Stanley Select Dimensions Investment Series
Notes to Financial Statements n December 31, 2012 continued
Investment Type | | Level 1
Unadjusted
Quoted Prices | | Level 2
Other
Significant
Observable
Inputs | | Level 3
Significant
Unobservable
Inputs | | Total | |
Insurance: Property-Casualty | | $ | 72,626 | | | $ | — | | | $ | — | | | $ | 72,626 | | |
Medical Equipment | | | 461,929 | | | | — | | | | — | | | | 461,929 | | |
Real Estate Investment Trusts (REIT) | | | 596,772 | | | | — | | | | — | | | | 596,772 | | |
Recreational Vehicles & Boats | | | — | | | | 580,179 | | | | — | | | | 580,179 | | |
Restaurants | | | 419,255 | | | | — | | | | — | | | | 419,255 | | |
Semiconductors & Components | | | 280,360 | | | | — | | | | — | | | | 280,360 | | |
Total Common Stocks | | | 14,006,499 | | | | 1,356,168 | | | | — | | | | 15,362,667 | | |
Convertible Preferred Stocks | | | — | | | | — | | | | 123,459 | | | | 123,459 | | |
Short-Term Investment — Investment Company | | | 456,721 | | | | — | | | | — | | | | 456,721 | | |
Total Assets | | $ | 14,463,220 | | | $ | 1,356,168 | | | $ | 123,459 | | | $ | 15,942,847 | | |
The following table presents additional information about valuation techniques and inputs used for investments that are measured at fair value and categorized within Level 3 as of December 31, 2012.
Multi Cap Growth
| | | Fair Value at
December 31,
2012 | | Valuation Technique | | Unobservable Input | | Range | | Weighted
Average | | Impact
to
Valuation
from an
Increase
in Input | |
Alternative Energy | |
Convertible Preferred
Stock
| | $ | 14,495
| | | Asset Approach
Discounted cash flow
| | Net Tangible Assets
Weighted average
cost of capital | | $0.25
24.7% | | $0.25
26.0% | | $0.25
25.0% | | Increase
Decrease | |
| | | | | | | Perpetual growth
rate | | 3.5% | | 4.5% | | 4.0% | | Increase | |
| | | | | Market Comparable
Companies | | Enterprise Value /
Revenue | | 2.8x | | 4.6x | | 3.7x | | Increase | |
| | | | | | | Discount for lack
of marketability | | 15% | | 15% | | 15% | | Decrease | |
Computer Services,
Software & Systems | |
Convertible Preferred
Stock | | $ | 108,964
| | | Adjusted Stock Price
| | Discount for
Illiquidity | | 6.7% | | 6.7% | | 6.7% | | Decrease | |
72
Morgan Stanley Select Dimensions Investment Series
Notes to Financial Statements n December 31, 2012 continued
Investment Type | | Level 1
Unadjusted
Quoted Prices | | Level 2
Other
Significant
Observable
Inputs | | Level 3
Significant
Unobservable
Inputs | | Total | |
Mid Cap Growth | |
Assets: | |
Common Stocks | |
Advertising Agencies | | $ | 8,162 | | | $ | — | | | $ | — | | | $ | 8,162 | | |
Alternative Energy | | | 674,197 | | | | — | | | | — | | | | 674,197 | | |
Asset Management & Custodian | | | 201,045 | | | | — | | | | — | | | | 201,045 | | |
Automobiles | | | 128,943 | | | | — | | | | — | | | | 128,943 | | |
Beverage: Brewers & Distillers | | | — | | | | 521,150 | | | | — | | | | 521,150 | | |
Beverage: Soft Drinks | | | 380,948 | | | | — | | | | — | | | | 380,948 | | |
Biotechnology | | | 1,090,518 | | | | — | | | | — | | | | 1,090,518 | | |
Cement | | | 492,142 | | | | — | | | | — | | | | 492,142 | | |
Chemicals: Diversified | | | 605,628 | | | | — | | | | — | | | | 605,628 | | |
Commercial Services | | | 1,262,017 | | | | 593,227 | | | | — | | | | 1,855,244 | | |
Communications Technology | | | 828,073 | | | | — | | | | — | | | | 828,073 | | |
Computer Services, Software & Systems | | | 3,975,600 | | | | — | | | | — | | | | 3,975,600 | | |
Computer Technology | | | 743,314 | | | | — | | | | 137,809 | | | | 881,123 | | |
Consumer Lending | | | 303,087 | | | | — | | | | — | | | | 303,087 | | |
Consumer Services: Miscellaneous | | | — | | | | 405,378 | | | | — | | | | 405,378 | | |
Diversified Media | | | 583,298 | | | | — | | | | — | | | | 583,298 | | |
Diversified Retail | | | 630,817 | | | | — | | | | — | | | | 630,817 | | |
Education Services | | | 359,746 | | | | — | | | | — | | | | 359,746 | | |
Electronic Components | | | 644,139 | | | | — | | | | — | | | | 644,139 | | |
Entertainment | | | — | | | | — | | | | 283,537 | | | | 283,537 | | |
Financial Data & Systems | | | 1,169,442 | | | | — | | | | — | | | | 1,169,442 | | |
Health Care Services | | | 748,041 | | | | — | | | | — | | | | 748,041 | | |
Insurance: Property-Casualty | | | 817,967 | | | | — | | | | — | | | | 817,967 | | |
Medical & Dental Instruments & Supplies | | | 289,967 | | | | — | | | | — | | | | 289,967 | | |
Medical Equipment | | | 541,368 | | | | — | | | | — | | | | 541,368 | | |
Pharmaceuticals | | | 471,890 | | | | — | | | | — | | | | 471,890 | | |
Publishing | | | 348,769 | | | | — | | | | — | | | | 348,769 | | |
Recreational Vehicles & Boats | | | — | | | | 858,903 | | | | — | | | | 858,903 | | |
Restaurants | | | 329,643 | | | | — | | | | — | | | | 329,643 | | |
Scientific Instruments: Pollution Control | | | 302,733 | | | | — | | | | — | | | | 302,733 | | |
Semiconductors & Components | | | 295,336 | | | | — | | | | — | | | | 295,336 | | |
73
Morgan Stanley Select Dimensions Investment Series
Notes to Financial Statements n December 31, 2012 continued
Investment Type | | Level 1
Unadjusted
Quoted Prices | | Level 2
Other
Significant
Observable
Inputs | | Level 3
Significant
Unobservable
Inputs | | Total | |
Textiles Apparel & Shoes | | $ | 327,898 | | | $ | — | | | $ | — | | | $ | 327,898 | | |
Utilities: Electrical | | | 768,239 | | | | — | | | | — | | | | 768,239 | | |
Total Common Stocks | | | 19,322,967 | | | | 2,378,658 | | | | 421,346 | | | | 22,122,971 | | |
Convertible Preferred Stocks | | | — | | | | — | | | | 219,093 | | | | 219,093 | | |
Preferred Stock | | | — | | | | — | | | | 45,756 | | | | 45,756 | | |
Short-Term Investment — Investment Company | | | 1,133,672 | | | | — | | | | — | | | | 1,133,672 | | |
Total Assets | | $ | 20,456,639 | | | $ | 2,378,658 | | | $ | 686,195 | | | $ | 23,521,492 | | |
The following table presents additional information about valuation techniques and inputs used for investments that are measured at fair value and categorized within Level 3 as of December 31, 2012.
Mid Cap Growth
| | | Fair Value at
December 31,
2012 | | Valuation Technique | | Unobservable Input | | Range | | Weighted
Average | | Impact
to
Valuation
from an
Increase
in Input | |
Alternative Energy | |
Convertible Preferred
Stock
| | $ | 20,180
| | | Asset Approach
Discounted cash flow
| | Net Tangible Assets
Weighted average
cost of capital | | $0.25
24.7% | | $0.25
26.0% | | $0.25
25.0% | | Increase
Decrease | |
| | | | | | | Perpetual growth
rate | | 3.5% | | 4.5% | | 4.0% | | Increase | |
| | | | | Market Comparable
Companies | | Enterprise Value /
Revenue | | 2.8x | | 4.6x | | 3.7x | | Increase | |
| | | | | | | Discount for lack
of marketability | | 15% | | 15% | | 15% | | Decrease | |
74
Morgan Stanley Select Dimensions Investment Series
Notes to Financial Statements n December 31, 2012 continued
| | | Fair Value at
December 31,
2012 | | Valuation Technique | | Unobservable Input | | Range | | Weighted
Average | | Impact
to
Valuation
from an
Increase
in Input | |
Communications
Technology | |
Convertible Preferred
Stock | | $ | 11,605
| | | Discounted cash flow
| | Weighted average
cost of capital | | | 27.5 | % | | | 28.5 | % | | | 28.0 | % | | Decrease | |
| | | | | | Perpetual growth
rate | | | 5.0 | % | | | 6.0 | % | | | 5.5 | % | | Increase | |
| | | | Market Comparable
Companies | | Enterprise Value /
Revenue | | | 2.4 | x | | | 3.2 | x | | | 2.8 | x | | Increase | |
| | | | | | Discount for lack
of marketability | | | 10 | % | | | 10 | % | | | 10 | % | | Decrease | |
Computer Services,
Software & Systems | |
Convertible Preferred
Stock | | $ | 173,924
| | | Adjusted Stock Price
| | Discount for
Illiquidity | | | 6.7 | % | | | 6.7 | % | | | 6.7 | % | | Decrease | |
Preferred Stock
| | $ | 45,756
| | | Discounted cash flow
| | Weighted average
cost of capital | | | 16.5 | % | | | 17.5 | % | | | 17.0 | % | | Decrease | |
| | | | | | | Perpetual growth
rate | | | 2.0 | % | | | 3.0 | % | | | 2.5 | % | | Increase | |
| | | | | Market Comparable
Companies | | Enterprise Value/
Revenue | | | 7.9 | x | | | 9.5 | x | | | 8.7 | x | | Increase | |
| | | | | | | Discount for lack
of marketability | | | 15 | % | | | 15 | % | | | 15 | % | | Decrease | |
Computer Technology | |
Common Stock
Convertible Preferred
Stock
| | $ | 137,809
$13,384
| | | Discounted cash flow
| | Weighted average
cost of capital
Perpetual growth
rate | | | 17.0
2.5% | % | | | 19.0
3.5% | % | | | 18.0
3.0% | % | |
Decrease
Increase | |
| | | | | Market Comparable
Companies | | Enterprise Value /
Revenue | | | 7.5 | x | | | 17.9 | x | | | 15.8 | x | | Increase | |
| | | | | | | Discount for lack
of marketability | | | 10 | % | | | 10 | % | | | 10 | % | | Decrease | |
75
Morgan Stanley Select Dimensions Investment Series
Notes to Financial Statements n December 31, 2012 continued
| | | Fair Value at
December 31,
2012 | | Valuation Technique | | Unobservable Input | | Range | | Weighted
Average | | Impact
to
Valuation
from an
Increase
in Input | |
Entertainment | |
Common Stock
| | $ | 283,537
| | | Discounted cash flow
| | Weighted average
cost of capital | | | 14.5 | % | | | 15.5 | % | | | 15.0 | % | | Decrease | |
| | | | | | | Perpetual growth
rate | | | 3.5 | % | | | 4.5 | % | | | 4.0 | % | | Increase | |
| | | | | Market Comparable
Companies | | Enterprise Value /
EBITDA | | | 12.2 | x | | | 25.5 | x | | | 18.8 | x | | Increase | |
| | | | | | | Discount for lack
of marketability | | | 10 | % | | | 10 | % | | | 10 | % | | Decrease | |
Transfers between investment levels may occur as the markets fluctuate and/or the availability of data used in an investment's valuation changes. The Fund recognizes transfers between the levels as of the end of the period. As of December 31, 2012, the fair value of certain securities were adjusted due to developments which occurred between the time of the close of the foreign markets on which they trade and the close of business on the NYSE which resulted in their Level 2 classification. The values of the transfers were as follows:
GLOBAL
INFRASTRUCUTRE | | GROWTH | | FOCUS GROWTH | | MULTI CAP
GROWTH | | MID CAP
GROWTH | |
$ | 11,274,751 | | | $ | 1,027,221 | | | $ | 4,098,921 | | | $ | 580,179 | | | $ | 1,857,508 | | |
76
Morgan Stanley Select Dimensions Investment Series
Notes to Financial Statements n December 31, 2012 continued
Following is a reconciliation of investments in which significant unobservable inputs (Level 3) were used in determining fair value:
| | | Flexible
Income | | Growth | | Focus Growth | | Multi Cap Growth | | Mid Cap Growth | |
| | | Corporate
Bonds | | Common
Stock | | Covertible
Preferred
Stock | | Common
Stock | | Covertible
Preferred
Stock | | Common
Stock | | Covertible
Preferred
Stocks | | Common
Stocks | | Convertible
Preferred
Stocks | | Preferred
Stocks | |
Beginning Balance | | $ | 14,262 | † | | $ | 899,721 | | | $ | 296,480 | | | $ | 2,956,041 | | | $ | 908,808 | | | $ | 715,689 | | | $ | 247,762 | | | $ | 627,131 | | | $ | 430,994 | | | $ | 149,241 | | |
Purchases | | | — | | | | — | | | | — | | | | — | | | | — | | | | — | | | | — | | | | 301,386 | | | | 13,383 | | | | 45,756 | | |
Sales | | | (13,451 | ) | | | — | | | | — | | | | — | | | | — | | | | — | | | | — | | | | — | | | | — | | | | — | | |
Amortization of
discount | | | — | | | | — | | | | — | | | | — | | | | — | | | | — | | | | — | | | | — | | | | — | | | | — | | |
Transfers in | | | — | | | | — | | | | — | | | | — | | | | — | | | | — | | | | — | | | | — | | | | — | | | | — | | |
Transfers out | | | — | | | | — | | | | — | | | | — | | | | — | | | | — | | | | — | | | | — | | | | — | | | | — | | |
Corporate action | | | — | | | | (733,162 | ) | | | — | | | | (1,939,357 | ) | | | — | | | | (583,198 | ) | | | — | | | | (261,913 | ) | | | — | | | | (247,193 | ) | |
Change in
unrealized
appreciation
(depreciation) | | | (166 | ) | | | (166,559 | ) | | | (276,889 | ) | | | (1,016,684 | ) | | | (848,755 | ) | | | (132,491 | ) | | | (124,303 | ) | | | (245,258 | ) | | | (225,284 | ) | | | 97,952 | | |
Realized gains
(losses) | | | (645 | ) | | | — | | | | — | | | | — | | | | — | | | | — | | | | — | | | | — | | | | — | | | | — | | |
Ending Balance | | $ | — | † | | $ | — | | | $ | 19,591 | | | $ | — | | | $ | 60,053 | | | $ | — | | | $ | 123,459 | | | $ | 421,346 | | | $ | 219,093 | | | $ | 45,756 | | |
Net change in
unrealized
appreciation/
depreciation from
investments still
held as of
December 31, 2012. | | $ | — | | | $ | — | | | $ | (276,889 | ) | | $ | — | | | $ | (848,755 | ) | | $ | — | | | $ | (124,303 | ) | | $ | 119,960 | | | $ | (225,284 | ) | | $ | — | | |
† Includes one security which is valued at zero.
3. Derivatives
Certain Portfolios may, but are not required to, use derivative instruments for a variety of purposes, including hedging, risk management, portfolio management or to earn income. Derivatives are financial instruments whose value is based on the value of an underlying asset, interest rate, index or financial instrument. A derivative instrument often has risks similar to its underlying asset and may have additional risks, including imperfect correlation between the value of the derivative and the underlying asset, risks of default by the counterparty to certain transactions, magnification of losses incurred due to changes in the market value of the securities, instruments, indices or interest rates to which they relate, and risks that the transactions may not be liquid. The use of derivatives involves risks that are different from, and possibly greater than, the risks associated with other portfolio investments. Derivatives may involve the use of highly specialized instruments that require investment techniques and risk analyses different from those associated
77
Morgan Stanley Select Dimensions Investment Series
Notes to Financial Statements n December 31, 2012 continued
with other portfolio investments. All of a Portfolio's holdings, including derivative instruments, are marked-to-market each day with the change in value reflected in unrealized appreciation (depreciation). Upon disposition, a realized gain or loss is recognized.
Certain derivative transactions may give rise to a form of leverage. Leverage magnifies the potential for gain and risk of loss. Leverage associated with derivative transactions may cause the Portfolios to liquidate portfolio positions when it may not be advantageous to do so to satisfy its obligations or to meet earmarking or segregation requirements, pursuant to applicable Securities and Exchange Commission rules and regulations, or may cause the Portfolios to be more volatile than if the Portfolios had not been leveraged. Although the Adviser and/or Sub-Advisers seek to use derivatives to further the Portfolio's investment objectives, there is no assurance that the use of derivatives will achieve this result.
Following is a description of the derivative instruments and techniques that the Portfolios used during the period and their associated risks:
Foreign Currency Exchange Contracts In connection with its investments in foreign securities, certain Portfolios entered into contracts with banks, brokers or dealers to purchase or sell foreign currencies at a future date. A foreign currency exchange contract ("currency contract") is a negotiated agreement between two parties to exchange specified amounts of two or more currencies at a specified future time at a specified rate. The rate specified by the currency contract can be higher or lower than the spot rate between the currencies that are the subject of the currency contract. Currency contracts may be used to protect against uncertainty in the level of future foreign currency exchange rates or to gain or modify exposure to a particular currency. Hedging a Portfolio's currency risks involves the risk of mismatching a Portfolio's objectives under a currency contract with the value of securities denominated in a particular currency. Furthermore, such transactions reduce or preclude the opportunity for gain if the value of the currency should move in the direction opposite to the position taken. There is an additional risk to the effect that currency contracts create exposure to currencies in which a Portfolio's securities are not denominated. Unanticipated changes in currency prices may result in poorer overall performance for a Portfolio than if it had not entered into such currency contracts. The use of currency contracts involves the risk of loss from the insolvency or bankruptcy of the counterparty to the contract or the failure of the counterparty to make payments or otherwise comply with the term of the contract. A currency contract is marked-to-market daily and the change in market value is recorded by a Portfolio as unrealized gain or (loss). A Portfolio records realized gains (losses) when the currency contract is closed equal to the difference between the value of the currency contract at the time it was opened and the value at the time it was closed.
78
Morgan Stanley Select Dimensions Investment Series
Notes to Financial Statements n December 31, 2012 continued
Futures A futures contract is a standardized agreement between two parties to buy or sell a specific quantity of an underlying instrument at a specific price at a specific future time. The value of a futures contract tends to increase and decrease in tandem with the value of the underlying instrument. Depending on the terms of the particular contract, futures contracts are settled through either physical delivery of the underlying instrument on the settlement date or by payment of a cash settlement amount on the settlement date. During the period the futures contract is open, payments are received from or made to the broker based upon changes in the value of the contract (the variation margin). A decision as to whether, when and how to use futures involves the exercise of skill and judgment and even a well-conceived futures transaction may be unsuccessful because of market behavior or unexpected events. In addition to the derivatives risks discussed above, the prices of futures can be highly volatile, using futures can lower total return, and the potential loss from futures can exceed a Portfolio's initial investment in such contracts.
Swaps An over-the-counter ("OTC") swap agreement is an agreement between two parties pursuant to which the parties exchange payments at specified dates on the basis of a specified notional amount, with the payments calculated by reference to specified securities, indexes, reference rates, currencies or other instruments. A small percentage of swap agreements are cleared through a central clearing house. Most swap agreements provide that when the period payment dates for both parties are the same, the payments are made on a net basis (i.e., the two payment streams are netted out, with only the net amount paid by one party to the other). A Portfolio's obligations or rights under a swap agreement entered into on a net basis will generally be equal only to the net amount to be paid or received under the agreement, based on the relative values of the positions held by each counterparty. Most swap agreements are not entered into or traded on exchanges and there is no central clearing or guaranty function for swaps. These OTC swaps are often subject to credit risk or the risk of default or non-performance by the counterparty. Swaps could result in losses if interest rate or foreign currency exchange rates or credit quality changes are not correctly anticipated by a Portfolio or if the reference index, security or investments do not perform as expected.
A Portfolio enters into credit default, interest rate and other forms of swap agreements to manage exposure to credit and interest rate risk.
A Portfolio's use of swaps during the period included those based on the credit of an underlying security and commonly referred to as credit default swaps. Where a Portfolio is the buyer of a credit default swap agreement, it would be entitled to receive the par (or other agreed-upon) value of a referenced debt obligation from the counterparty to the agreement only in the event of a default by a third party on the debt obligation. If no default occurs, a Portfolio would have paid to the counterparty a periodic stream of payments over the term of the agreement and received no benefit from the agreement. When a Portfolio is the seller of a credit default swap agreement, it receives the stream of payments but is obligated to pay an
79
Morgan Stanley Select Dimensions Investment Series
Notes to Financial Statements n December 31, 2012 continued
amount equal to the par (or other agreed upon) value of a referenced debt obligation upon default of the referenced debt obligation. The current credit rating of each individual issuer is listed in the table following the Portfolio of Investments and serves as an indicator of the current status of the payment/performance risk of the credit derivative. Alternatively, for credit default swaps on an index of credits, the quoted market prices and current values serve as an indicator of the current status of the payment/performance risk of the credit derivative. Generally, lower credit ratings and increasing market values, in absolute terms, represent a deterioration of the credit and a greater likelihood of an adverse credit event of the issuer.
When a Portfolio has an unrealized loss on a swap agreement, the Portfolio has instructed the custodian to pledge cash or liquid securities as collateral with a value approximately equal to the amount of the unrealized loss. Collateral pledges are monitored and subsequently adjusted if and when the swap valuations fluctuate. If applicable, cash collateral is included with "Due from (to) Broker" in the Statements of Assets and Liabilities.
Upfront payments received or paid by a Portfolio will be reflected as an asset or liability in the Statements of Assets and Liabilities.
FASB ASC 815, Derivatives and Hedging: Overall ("ASC 815"), is intended to improve financial reporting about derivative instruments by requiring enhanced disclosures to enable investors to better understand how and why a Portfolio uses derivative instruments, how these derivative instruments are accounted for and their effects on a Portfolio's financial position and results of operations.
The following table sets forth the fair value of each Portfolio's derivative contracts by primary risk exposure as of December 31, 2012.
PORTFOLIO | | PRIMARY RISK
EXPOSURE | | ASSET DERIVATIVES
STATEMENTS OF
ASSETS AND
LIABILITIES LOCATION | | FAIR VALUE | | LIABILITY DERIVATIVES
STATEMENTS OF
ASSETS AND
LIABILITIES LOCATION | | FAIR VALUE | |
Flexible Income | | Interest Rate | | Variation margin | | $ | 13,722 | † | | Variation margin | | $ | (7,686 | )† | |
| | | Risk
| | Unrealized appreciation
on open swap agreements | | | 1,250 | | | Unrealized depreciation
on open swap agreements | | | (14,921 | ) | |
| | | Credit Risk
| | Unrealized appreciation
on open swap agreements | | | 5,039 | | | Unrealized depreciation
on open swap agreements | | | — | | |
| | | Currency Risk
| | Unrealized appreciation
on open foreign currency
exchange contracts | | | 2,316 | | | Unrealized depreciation
on open foreign currency
exchange contracts | | | (2,862 | ) | |
| | | | | | | $ | 22,327 | | | | | $ | (25,469 | ) | |
† Includes cumulative appreciation (depreciation) of futures contracts as reported in the Portfolio of Investments. Only current day's net variation margin is reported within the Statements of Assets and Liabilities.
80
Morgan Stanley Select Dimensions Investment Series
Notes to Financial Statements n December 31, 2012 continued
The following tables set forth by primary risk exposure of each Portfolio's realized gains (losses) and change in unrealized appreciation (depreciation) by type of derivative contract for the year ended December 31, 2012 in accordance with ASC 815.
AMOUNT OF REALIZED GAIN (LOSS) ON DERIVATIVE CONTRACTS
PORTFOLIO | | PRIMARY RISK
EXPOSURE | | FUTURES | | SWAPS | | FOREIGN
CURRENCY
EXCHANGE | |
Flexible Income | | Interest Rate Risk | | $ | (135,447 | ) | | $ | (67,574 | ) | | | — | | |
| | | Currency Risk | | | — | | | | — | | | $ | 214 | | |
| | | Total | | $ | (135,447 | ) | | $ | (67,574 | ) | | $ | 214 | | |
CHANGE IN UNREALIZED APPRECIATION (DEPRECIATION) ON DERIVATIVE CONTRACTS
PORTFOLIO | | PRIMARY RISK
EXPOSURE | | FUTURES | | SWAPS | | FOREIGN
CURRENCY
EXCHANGE | |
Flexible Income | | Interest Rate Risk | | $ | 32,732 | | | $ | 35,443 | | | | — | | |
| | | Credit Risk | | | — | | | | 5,039 | | | | — | | |
| | | Currency Risk | | | — | | | | — | | | $ | 2,576 | | |
| | | Total | | $ | 32,732 | | | $ | 40,482 | | | $ | 2,576 | | |
For the year ended December 31, 2012, Flexible Income Portfolio's average monthly original value of futures contracts was $7,013,521, the average monthly notional value of swap agreements was $10,069,082 and the average monthly principal amount of foreign currency exchange contracts was $599,243.
4. Advisory/Administration and Sub-Advisory Agreements
Pursuant to an Investment Advisory Agreement with the Adviser and Sub-Advisers, the Fund pays an advisory fee, accrued daily and payable monthly, by applying the annual rates listed below to each Portfolio's net assets determined at the close of each business day.
Money Market — 0.45% to the portion of the daily net assets not exceeding $250 million; 0.375% to the portion of the daily net assets exceeding $250 million but not exceeding $750 million; 0.325% to the portion of the daily net assets exceeding $750 million but not exceeding $1.25 billion; 0.30% to the portion of the daily net assets exceeding $1.25 billion but not exceeding $1.5 billion; and 0.275% to the portion of the daily net assets in excess of $1.5 billion. For the year ended December 31, 2012, the advisory fee rate (net of waivers) was equivalent to an annual effective rate of 0.08% of the Portfolio's daily net assets.
Flexible Income — 0.32%.
81
Morgan Stanley Select Dimensions Investment Series
Notes to Financial Statements n December 31, 2012 continued
Global Infrastructure — 0.57% to the portion of the daily net assets not exceeding $500 million; 0.47% to the portion of the daily net assets exceeding $500 million but not exceeding $1 billion; 0.445% to the portion of the daily net assets exceeding $1 billion but not exceeding $1.5 billion; 0.42% to the portion of the daily net assets exceeding $1.5 billion but not exceeding $2.5 billion; 0.395% to the portion of the daily net assets exceeding $2.5 billion but not exceeding $3.5 billion; 0.37% to the portion of the daily net assets exceeding $3.5 billion but not exceeding $5 billion; and 0.345% to the portion of the daily net assets in excess of $5 billion. For the year ended December 31, 2012, the advisory fee rate was equivalent to an annual effective rate of 0.57% of the Portfolio's daily net assets.
Growth — 0.50% to the portion of the daily net assets not exceeding $1 billion; 0.45% to the portion of the daily net assets exceeding $1 billion but not exceeding $2 billion; 0.40% to the portion of the daily net assets exceeding $2 billion but not exceeding $3 billion; and 0.35% to the portion of the daily net assets in excess of $3 billion. For the year ended December 31, 2012, the advisory fee rate was equivalent to an annual effective rate of 0.50% of the Portfolio's daily net assets.
Focus Growth — 0.545% to the portion of the daily net assets not exceeding $250 million; 0.42% to the portion of the daily net assets exceeding $250 million but not exceeding $2.5 billion; 0.395% to the portion of the daily net assets exceeding $2.5 billion but not exceeding $3.5 billion; 0.37% to the portion of the daily net assets exceeding $3.5 billion but not exceeding $4.5 billion; and 0.345% to the portion of the daily net assets in excess of $4.5 billion. For the year ended December 31, 2012, the advisory fee rate was equivalent to an annual effective rate of 0.55% of the Portfolio's daily net assets.
Multi Cap Growth — 0.67% to the portion of the daily net assets not exceeding $500 million; 0.645% to the portion of the daily net assets exceeding $500 million but not exceeding $2 billion; 0.62% to the portion of the daily net assets exceeding $2 billion but not exceeding $3 billion; and 0.595% to the portion of the daily net assets in excess of $3 billion. For the year ended December 31, 2012, the advisory fee rate was equivalent to an annual effective rate of 0.67% of the Portfolio's daily net assets.
Mid Cap Growth — 0.42% to the portion of the daily net assets not exceeding $500 million; and 0.395% to the portion of the daily net assets in excess of $500 million. For the year ended December 31, 2012, the advisory fee rate was equivalent to an annual effective rate of 0.42% of the Portfolio's daily net assets.
Under the Sub-Advisory Agreement between the Adviser and the Sub-Advisers, the Sub-Advisers provide Global Infrastructure Portfolio and Money Market Portfolio (effective June 25th, 2012) with advisory services, subject to the overall supervision of the Adviser and the Fund's Officers and Trustees. The Adviser pays the Sub-Advisers on a monthly basis a portion of the net advisory fees the Adviser receives from each Portfolio.
82
Morgan Stanley Select Dimensions Investment Series
Notes to Financial Statements n December 31, 2012 continued
The Board voted to terminate the Sub-Advisory Agreement on December 5, 2012 for the Money Market Portfolio.
Pursuant to an Administration Agreement with Morgan Stanley Services Company Inc. (the "Administrator"), an affiliate of the Adviser, each Portfolio pays an administration fee, accrued daily and payable monthly, by applying the annual rate of 0.08% (Money Market 0.05%) to each Portfolio's daily net assets.
Under a Sub-Administration agreement between the Administrator and State Street Bank and Trust Company ("State Street"), State Street provides certain administrative services to the Fund. For such services, the Administrator pays State Street a portion of the fee the Administrator receives from the Fund.
5. Plan of Distribution
Shares of the Fund are distributed by Morgan Stanley Distribution, Inc. (the "Distributor"), an affiliate of the Adviser, Administrator and Sub-Advisers. The Fund has adopted a Plan of Distribution (the "Plan") pursuant to Rule 12b-1 under the Act. Under the Plan, Class Y shares of each Portfolio bear a distribution fee which is accrued daily and paid monthly at the annual rate of 0.25% of the average daily net assets of the class.
The Distributor, Adviser and Administrator have agreed to waive/reimburse all or a portion of the Money Market Portfolio's distribution fee, advisory fee and administration fee, respectively, to the extent that total expenses exceed total income of the Money Market Portfolio on a daily basis. For the year ended December 31, 2012, the Distributor waived $123,507, the Adviser waived $274,295 and the Administrator waived $835. These fee waivers and/or expense reimbursements will continue for at least one year or until such time that the Trustees acts to discontinue all or a portion of such waivers and/or expense reimbursements when it deems such action is appropriate.
6. Security Transactions and Transactions with Affiliates
For the year ended December 31, 2012, purchases and sales of investment securities, excluding short-term investments, were as follows:
| | | U.S. GOVERNMENT SECURITIES | | OTHER | |
PORTFOLIO | | PURCHASES | | SALES | | PURCHASES | | SALES | |
Flexible Income | | $ | 4,834,289 | | | $ | 3,847,172 | | | $ | 17,630,921 | | | $ | 21,013,346 | | |
Global Infrastructure | | | — | | | | — | | | | 7,466,779 | | | | 12,174,524 | | |
Growth | | | — | | | | — | | | | 10,184,909 | | | | 15,691,738 | | |
Focus Growth | | | — | | | | — | | | | 30,851,239 | | | | 43,894,918 | | |
Multi Cap Growth | | | — | | | | — | | | | 7,468,689 | | | | 9,727,283 | | |
Mid Cap Growth | | | — | | | | — | | | | 7,843,810 | | | | 13,339,859 | | |
83
Morgan Stanley Select Dimensions Investment Series
Notes to Financial Statements n December 31, 2012 continued
Each Portfolio (except Money Market) invests in the Institutional Class of the Morgan Stanley Institutional Liquidity Funds (the "Liquidity Funds"), an open-end management investment company managed by the Adviser. Advisory fees paid by the Fund are reduced by an amount equal to its pro-rata share of advisory and administrative fees paid by the Fund due to its investment in the Liquidity Funds.
A summary of the Portfolio's transactions in shares of the Liquidity Funds during the year ended December 31, 2012 is as follows:
PORTFOLIO | | VALUE
DECEMBER 31, 2011 | | PURCHASES
AT COST | | SALES | | DIVIDEND
INCOME | | VALUE
DECEMBER 31, 2012 | |
Flexible Income | | $ | 1,105,730 | | | $ | 11,614,679 | | | $ | 12,537,725 | | | $ | 1,056 | | | $ | 182,684 | | |
Global Infrastructure | | | 765,145 | | | | 6,629,201 | | | | 7,179,452 | | | | 249 | | | | 214,894 | | |
Growth | | | 379,026 | | | | 9,186,785 | | | | 9,082,606 | | | | 990 | | | | 483,205 | | |
Focus Growth | | | 1,101,134 | | | | 30,093,973 | | | | 30,508,625 | | | | 3,173 | | | | 686,482 | | |
Multi Cap Growth | | | 969,287 | | | | 5,679,415 | | | | 6,191,981 | | | | 907 | | | | 456,721 | | |
Mid Cap Growth | | | 1,001,688 | | | | 8,181,609 | | | | 8,049,625 | | | | 1,544 | | | | 1,133,672 | | |
In addition, the table also identifies the income distributions earned, if any, by each Portfolio for that Portfolio's investment in the Liquidity Funds.
Income distributions are included in "Interest and dividends from affiliates" in the Statements of Operations.
PORTFOLIO | | ADVISORY FEE
REDUCTION | |
Flexible Income | | $ | 883 | | |
Global Infrastructure | | | 402 | | |
Growth | | | 801 | | |
Focus Growth | | | 2,572 | | |
Multi Cap Growth | | | 778 | | |
Mid Cap Growth | | | 1,285 | | |
The following Portfolio had transactions with Hartford Financial Services Group, Inc., an affiliate of the Fund:
PORTFOLIO | | VALUE
DECEMBER 31,
2011 | | PURCHASES
AT COST | | SALES | | REALIZED
GAIN | | INTEREST
INCOME | | VALUE
DECEMBER 31,
2012 | |
Flexible Income | | $ | 60,996 | | | | — | | | | — | | | | — | | | $ | 3,557 | | | $ | 69,819 | | |
84
Morgan Stanley Select Dimensions Investment Series
Notes to Financial Statements n December 31, 2012 continued
The following Portfolios had transactions with Citigroup, Inc., and its affiliated broker-dealers, which may be deemed to be affiliates of the Adviser, Sub-Advisers, Administrator and Distributor under Section 17 of the Act, for the year ended December 31, 2012:
PORTFOLIO | | VALUE
DECEMBER 31,
2011 | | PURCHASES
AT COST | | SALES | | REALIZED
GAIN | | DIVIDEND/
INTEREST
INCOME | | VALUE
DECEMBER 31,
2012 | |
Flexible Income | | $ | 100,193 | | | $ | 164,316 | | | $ | 16,681 | | | $ | 2,302 | | | $ | 9,364 | | | $ | 259,788 | | |
Growth | | | 61,145 | | | | 24,516 | | | | 102,845 | | | | 18,171 | | | | 82 | | | | — | | |
Focus Growth | | | — | | | | 399,482 | | | | 412,764 | | | | 13,282 | | | | 346 | | | | — | | |
For the year ended December 31, 2012, the following Portfolio incurred brokerage commissions with Morgan Stanley & Co., LLC, an affiliate of the Adviser, Sub-Advisers, Administrator and Distributor, for portfolio transactions executed on behalf of each Portfolio:
For the year ended December 31, 2012, the following Portfolios incurred brokerage commissions with Citigroup, Inc., and its affiliated broker-dealers, which may be deemed affiliates of the Adviser, Sub-Advisers, Administrator and Distributor under Section 17 of the Act, for portfolio transactions executed on behalf of each Portfolio:
GLOBAL
INFRASTRUCUTRE | | GROWTH | | FOCUS
GROWTH | | MULTI CAP
GROWTH | | MID CAP
GROWTH | |
| $ | 597 | | | $ | 86 | | | $ | 192 | | | $ | 22 | | | $ | 165 | | |
Morgan Stanley Services Company Inc., an affiliate of the Adviser, Sub-Advisers and Distributor, is the Fund's transfer agent.
7. Purposes of and Risks Relating to Certain Financial Instruments
Certain Portfolios may invest in mortgage securities, including securities issued by Federal National Mortgage Association ("FNMA") and Federal Home Loan Mortgage Corporation ("FHLMC"). These are fixed income securities that derive their value from or represent interests in a pool of mortgages or mortgage securities. An unexpectedly high rate of defaults on the mortgages held by a mortgage pool may adversely affect the value of a mortgage backed security and could result in losses to the Portfolio. The risk of such defaults is generally higher in the case of mortgage pools that include sub-prime mortgages. Sub-prime
85
Morgan Stanley Select Dimensions Investment Series
Notes to Financial Statements n December 31, 2012 continued
mortgages refer to loans made to borrowers with weakened credit histories or with a lower capacity to make timely payments on their mortgages. The securities issued by FNMA and FHLMC that are held by the Portfolios are not backed by sub-prime mortgages.
Additionally, securities issued by FNMA and FHLMC are not backed by or entitled to the full faith and credit of the United States; rather, they are supported by the right of the issuer to borrow from the U.S. Department of the Treasury.
The Federal Housing Finance Agency ("FHFA") serves as conservator of FNMA and FHLMC and the U.S. Department of the Treasury has agreed to provide capital as needed to ensure FNMA and FHLMC continue to provide liquidity to the housing and mortgage markets.
The Money Market Portfolio may enter into repurchase agreements under which the Portfolio sends cash and takes possession of securities with an agreement that the counterparty will repurchase such securities. In the event of default on the obligation to repurchase, the Portfolio has the right to liquidate the collateral and apply the proceeds in satisfaction of the obligation. In the event of default or bankruptcy by the counterparty to the agreement, realization of the collateral proceeds may be subject to certain costs and delays.
8. Federal Income Tax Status
It is the Portfolios' intention to continue to qualify as a regulated investment company and distribute all of its taxable and tax-exempt income. Accordingly, no provision for Federal income taxes is required in the financial statements.
Dividend income and distributions to shareholders are recorded on the ex-dividend date. Interest income is recognized on an accrual basis. Dividends from net investment income, if any, are declared and paid annually. Net realized capital gains, if any, are distributed at least annually.
A Portfolio may be subject to taxes imposed by countries in which it invests. Such taxes are generally based on income and/or capital gains earned or repatriated. Taxes are accrued based on net investment income, net realized gains and net unrealized appreciation as such income and/or gains are earned. Taxes may also be based on transactions in foreign currency and are accrued based on the value of investments denominated in such currency.
FASB ASC 740-10, Income Taxes — Overall, sets forth a minimum threshold for financial statement recognition of the benefit of a tax position taken or expected to be taken in a tax return. Management has concluded there are no significant uncertain tax positions that would require recognition in the financial statements. If applicable, the Portfolios recognize interest accrued related to unrecognized tax benefits in
86
Morgan Stanley Select Dimensions Investment Series
Notes to Financial Statements n December 31, 2012 continued
"Interest Expense" and penalties in "Other Expenses" in the Statement of Operations. The Portfolios file tax returns with the U.S. Internal Revenue Service, New York and various states. Each of the tax years in the four-year period ended December 31, 2012, remains subject to examination by taxing authorities.
The tax character of distributions paid may differ from the character of distributions shown in the Statements of Changes in Net Assets due to short-term capital gains being treated as ordinary income for tax purposes. The tax character of distributions paid during fiscal 2012 and 2011 was as follows:
| | 2012 DISTRIBUTIONS PAID FROM: | | 2011 DISTRIBUTIONS PAID FROM: | |
| PORTFOLIO | | ORDINARY
INCOME | | LONG-TERM
CAPITAL GAIN | | ORDINARY
INCOME | | LONG-TERM
CAPITAL GAIN | |
Money Market | | $ | 9,086 | | | | — | | | $ | 9,367 | | | | — | | |
Flexible Income | | | 1,465,048 | | | | — | | | | 1,629,670 | | | | — | | |
Global Infrastructure | | | 1,127,854 | | | $ | 1,997,604 | | | | 794,791 | | | $ | 1,788,505 | | |
Growth | | | — | | | | 996,292 | | | | — | | | | — | | |
Focus Growth | | | 13 | | | | 2,406,744 | | | | — | | | | — | | |
Multi Cap Growth | | | — | | | | 1,147,541 | | | | — | | | | — | | |
Mid Cap Growth | | | — | | | | 1,976,981 | | | | 96,594 | | | | — | | |
The amount and character of income and gains to be distributed are determined in accordance with income tax regulations which may differ from GAAP. These book/tax differences are either considered temporary or permanent in nature.
Temporary differences are primarily due to differing book and tax treatments for the timing of the recognition of gains (losses) on certain investment transactions and the timing of the deductibility of certain expenses.
Permanent differences, primarily due to differing treatments of gains (losses) related to foreign currency transactions, swap transactions, paydown adjustments, book amortization of premium on debt securities, expiring capital losses, net operating losses, partnership basis adjustments and certain equity securities
87
Morgan Stanley Select Dimensions Investment Series
Notes to Financial Statements n December 31, 2012 continued
designated as issued by passive foreign investment companies, resulted in the following reclassifications among the Portfolios' components of net assets at December 31, 2012:
| PORTFOLIO | | ACCUMULATED UNDISTRIBUTED
(DISTRIBUTIONS IN EXCESS OF)
NET INVESTMENT INCOME | | ACCUMULATED
NET REALIZED GAIN (LOSS) | | PAID-IN-CAPITAL | |
Money Market | | $ | (51 | ) | | $ | 51 | | | | — | | |
Flexible Income | | | 65,401 | | | | 561,607 | | | $ | (627,008 | ) | |
| Global Infrastructure | | | 26,875 | | | | (26,875 | ) | | | — | | |
Growth | | | 1,400 | | | | (1,400 | ) | | | — | | |
Focus Growth | | | 22,337 | | | | (22,337 | ) | | | — | | |
Multi Cap Growth | | | 91,474 | | | | (12,481 | ) | | | (78,993 | ) | |
Mid Cap Growth | | | (1,319 | ) | | | 5,901 | | | | (4,582 | ) | |
At December 31, 2012, the components of distributable earnings on a tax basis were as follows:
| PORTFOLIO | | UNDISTRIBUTED
ORDINARY
INCOME | | UNDISTRIBUTED
LONG-TERM
CAPITAL GAIN | |
Money Market | | $ | 4,020 | | | | — | | |
Flexible Income | | | 1,150,444 | | | | — | | |
Global Infrastructure | | | 631,140 | | | $ | 2,292,581 | | |
Growth | | | 11,268 | | | | 1,657,859 | | |
Focus Growth | | | 241,913 | | | | — | | |
Multi Cap Growth | | | — | | | | 381,825 | | |
Mid Cap Growth | | | 72,841 | | | | 64,675 | | |
At December 31, 2012, cost, unrealized appreciation, unrealized depreciation, and net unrealized appreciation (depreciation) for U.S. Federal income tax purposes of the investments of each of the Portfolios were:
| PORTFOLIO | | COST | | APPRECIATION | | DEPRECIATION | | NET APPRECIATION
(DEPRECIATION) | |
Money Market | | $ | 70,866,834 | | | | — | | | | — | | | | — | | |
Flexible Income | | | 20,672,987 | | | $ | 1,791,297 | | | $ | (401,260 | ) | | $ | 1,390,037 | | |
Global Infrastructure | | | 20,660,234 | | | | 6,176,527 | | | | (122,579 | ) | | | 6,053,948 | | |
Growth | | | 15,090,151 | | | | 5,690,707 | | | | (939,433 | ) | | | 4,751,274 | | |
Focus Growth | | | 48,961,996 | | | | 22,085,685 | | | | (2,796,525 | ) | | | 19,289,160 | | |
Multi Cap Growth | | | 11,666,673 | | | | 5,092,169 | | | | (815,995 | ) | | | 4,276,174 | | |
Mid Cap Growth | | | 21,658,271 | | | | 4,373,918 | | | | (2,510,697 | ) | | | 1,863,221 | | |
88
Morgan Stanley Select Dimensions Investment Series
Notes to Financial Statements n December 31, 2012 continued
On December 22, 2010, the Regulated Investment Company Modernization Act of 2010 (the "Modernization Act") was signed into law. The Modernization Act modernizes several tax provisions related to Regulated Investment Companies ("RICs") and their shareholders. One key change made by the Modernization Act is that capital losses will generally retain their character as short-term or long-term and may be carried forward indefinitely to offset future gains. These losses are utilized before other capital loss carryforwards that expire. Generally, the Modernization Act is effective for taxable years beginning after December 22, 2010.
At December 31, 2012, the following Portfolios had available for Federal income tax purposes unused short term capital losses that will not expire:
| PORTFOLIO | | SHORT TERM LOSSES
NO EXPIRATION | |
Money Market | | $ | 1,466 | | |
Focus Growth | | | 888,108 | | |
In addition, the following Portfolios had available capital loss carryforwards to offset future net capital gains, to the extent provided by regulations which will expire on the indicated dates:
| | AMOUNTS IN THOUSANDS AVAILABLE THROUGH DECEMBER 31, | |
PORTFOLIO | | 2013 | | 2014 | | 2016 | | 2017 | | 2018 | | Total | |
Flexible Income | | $ | 562 | | | $ | 938 | | | $ | 4,961 | | | $ | 6,610 | | | $ | 2,202 | | | $ | 15,273 | | |
During the year ended December 31, 2012, the following Portfolios expired capital loss carryforwards for U.S. Federal income tax purposes as follows:
| PORTFOLIO | | EXPIRED CAPITAL LOSS
CARRYFORWARDS | |
Flexible Income | | $ | 590,958 | | |
To the extent that capital loss carryforwards are used to offset any future capital gains realized during the carryover period as provided by U.S. Federal income tax regulations, no capital gains tax liability will be incurred by a Portfolio for gains realized and not distributed. To the extent that capital gains are offset, such gains will not be distributed to the shareholders.
89
Morgan Stanley Select Dimensions Investment Series
Notes to Financial Statements n December 31, 2012 continued
During the year ended December 31, 2012, the following Portfolios utilized capital loss carryforwards for U.S. Federal income tax purposes of:
| PORTFOLIO | | UTILIZED CAPITAL LOSS
CARRYFORWARDS | |
Money Market | | $ | 64 | | |
Flexible Income | | | 608,226 | | |
9. Expense Offset
The Fund has entered into an arrangement with State Street (the "Custodian"), whereby credits realized on uninvested cash balances may be used to offset a portion of the Portfolio's expenses. If applicable, these custodian credits are shown as "Expense offset" in the Statements of Operations.
10. Accounting Pronouncement
In December 2011, FASB issued Accounting Standards Update ("ASU") 2011-11, Balance Sheet: Disclosures about Offsetting Assets and Liabilities. The pronouncement improves disclosures for recognized financial and derivative instruments that are either offset on the balance sheet in accordance with the offsetting guidance in ASC 210-20-45, Balance Sheet: Offsetting — Other Presentation Matters or ASC 815-10-45, Derivatives: Overall — Other Presentation Matters or are subject to enforceable master netting agreements or similar agreements. The Fund will be required to disclose information about rights to offset and related arrangements (such as collateral agreements) in order to enable financial statement users to understand the effect of those rights and arrangements on its financial position as well as disclose the following (1) gross amounts; (2) amounts offset in the statement of financial position; (3) any other amounts that can be offset in the event of bankruptcy, insolvency or default of any of the parties (including cash and noncash financial collateral); and (4) the Fund's net exposure. The requirements are effective for annual reporting periods beginning on or after January 1, 2013, and must be applied retrospectively. At this time, the Fund's management is evaluating the implications of ASU 2011-11 and its impact, if any, on the financial statements.
90
(This page has been intentionally left blank.)
Morgan Stanley Select Dimensions Investment Series
Financial Highlights
| | | | | | | | | | | | | | | | |
FOR THE YEAR
ENDED
DECEMBER 31 | | NET ASSET
VALUE
BEGINNING
OF PERIOD | | NET
INVESTMENT
INCOME(a) | | NET REALIZED
AND
UNREALIZED
GAIN (LOSS) | |
TOTAL FROM
INVESTMENT
OPERATIONS | |
DIVIDENDS
TO
SHAREHOLDERS | |
DISTRIBUTIONS
TO
SHAREHOLDERS | | TOTAL
DIVIDENDS
AND
DISTRIBUTIONS | |
MONEY MARKET
CLASS X SHARES | | | |
| 2008^ | | $ | 1.00 | | | $ | 0.020 | | | | — | | | $ | 0.020 | | | $ | (0.020 | ) | | | — | | | $ | (0.020 | ) | |
| 2009^ | | | 1.00 | | | | 0.000 | (d) | | | — | | | | 0.000 | (d) | | | (0.000 | )(d) | | | — | | | | (0.000 | )(d) | |
| 2010^ | | | 1.00 | | | | 0.000 | (d) | | | — | | | | 0.000 | (d) | | | (0.000 | )(d) | | | — | | | | (0.000 | )(d) | |
2011 | | | 1.00 | | | | 0.000 | (d) | | | (0.000 | )(d) | | | 0.000 | (d) | | | (0.000 | )(d) | | | — | | | | (0.000 | )(d) | |
2012 | | | 1.00 | | | | 0.000 | (d) | | | 0.000 | (d) | | | 0.000 | (d) | | | (0.000 | )(d) | | | — | | | | (0.000 | )(d) | |
CLASS Y SHARES | | | |
| 2008^ | | | 1.00 | | | | 0.020 | | | | — | | | | 0.020 | | | | (0.020 | ) | | | — | | | | (0.020 | ) | |
| 2009^ | | | 1.00 | | | | 0.000 | (d) | | | — | | | | 0.000 | (d) | | | (0.000 | )(d) | | | — | | | | (0.000 | )(d) | |
| 2010^ | | | 1.00 | | | | 0.000 | (d) | | | — | | | | 0.000 | (d) | | | (0.000 | )(d) | | | — | | | | (0.000 | )(d) | |
2011 | | | 1.00 | | | | 0.000 | (d) | | | (0.000 | )(d) | | | 0.000 | (d) | | | (0.000 | )(d) | | | — | | | | (0.000 | )(d) | |
2012 | | | 1.00 | | | | 0.000 | (d) | | | 0.000 | (d) | | | 0.000 | (d) | | | (0.000 | )(d) | | | — | | | | (0.000 | )(d) | |
FLEXIBLE INCOME
CLASS X SHARES | | | |
| 2008^ | | | 7.12 | | | | 0.41 | | | $ | (1.93 | ) | | | (1.52 | ) | | | (0.14 | ) | | | — | | | | (0.14 | ) | |
| 2009^ | | | 5.46 | | | | 0.32 | | | | 0.73 | | | | 1.05 | | | | (0.43 | ) | | | — | | | | (0.43 | ) | |
| 2010^ | | | 6.08 | | | | 0.27 | | | | 0.25 | | | | 0.52 | | | | (0.39 | ) | | | — | | | | (0.39 | ) | |
2011 | | | 6.21 | | | | 0.35 | | | | (0.08 | ) | | | 0.27 | | | | (0.41 | ) | | | — | | | | (0.41 | ) | |
2012 | | | 6.07 | | | | 0.31 | | | | 0.45 | | | | 0.76 | | | | (0.42 | ) | | | — | | | | (0.42 | ) | |
CLASS Y SHARES | | | |
| 2008^ | | | 7.10 | | | | 0.39 | | | | (1.93 | ) | | | (1.54 | ) | | | (0.13 | ) | | | — | | | | (0.13 | ) | |
| 2009^ | | | 5.43 | | | | 0.31 | | | | 0.72 | | | | 1.03 | | | | (0.42 | ) | | | — | | | | (0.42 | ) | |
| 2010^ | | | 6.04 | | | | 0.25 | | | | 0.26 | | | | 0.51 | | | | (0.38 | ) | | | — | | | | (0.38 | ) | |
2011 | | | 6.17 | | | | 0.33 | | | | (0.07 | ) | | | 0.26 | | | | (0.40 | ) | | | — | | | | (0.40 | ) | |
2012 | | | 6.03 | | | | 0.29 | | | | 0.45 | | | | 0.74 | | | | (0.40 | ) | | | — | | | | (0.40 | ) | |
See Notes to Financial Statements
92
| | | | | | | | | RATIO TO AVERAGE
NET ASSETS(c) | | | | | |
FOR THE YEAR
ENDED
DECEMBER 31 | | NET ASSET
VALUE
END OF
PERIOD | |
TOTAL
RETURN(b) | | NET ASSETS
END OF
PERIOD
(000'S) | |
EXPENSES | | NET
INVESTMENT
INCOME | | REBATE FROM
MORGAN STANLEY
AFFILIATE | | PORTFOLIO
TURNOVER
RATE | |
MONEY MARKET
CLASS X SHARES | |
| 2008^ | | $ | 1.00 | | | | 2.38 | % | | $ | 42,190 | | | | 0.58 | % | | | 2.34 | % | | | — | | | | N/A | | |
| 2009^ | | | 1.00 | | | | 0.03 | | | | 40,771 | | | | 0.39 | (e)(f) | | | 0.03 | (e)(f) | | | — | | | | N/A | | |
| 2010^ | | | 1.00 | | | | 0.01 | | | | 32,429 | | | | 0.30 | (f) | | | 0.01 | (f) | | | — | | | | N/A | | |
2011 | | | 1.00 | | | | 0.01 | | | | 27,555 | | | | 0.23 | (f) | | | 0.01 | (f) | | | — | | | | N/A | | |
2012 | | | 1.00 | | | | 0.01 | | | | 23,245 | | | | 0.28 | (f) | | | 0.01 | (f) | | | — | | | | N/A | | |
CLASS Y SHARES | |
| 2008^ | | | 1.00 | | | | 2.13 | | | | 173,595 | | | | 0.83 | | | | 1.91 | | | | — | | | | N/A | | |
| 2009^ | | | 1.00 | | | | 0.01 | | | | 101,015 | | | | 0.40 | (e)(f) | | | 0.02 | (e)(f) | | | — | | | | N/A | | |
| 2010^ | | | 1.00 | | | | 0.01 | | | | 67,856 | | | | 0.30 | (f) | | | 0.01 | (f) | | | — | | | | N/A | | |
2011 | | | 1.00 | | | | 0.01 | | | | 56,081 | | | | 0.23 | (f) | | | 0.01 | (f) | | | — | | | | N/A | | |
2012 | | | 1.00 | | | | 0.01 | | | | 47,618 | | | | 0.28 | (f) | | | 0.01 | (f) | | | — | | | | N/A | | |
FLEXIBLE INCOME
CLASS X SHARES | |
| 2008^ | | | 5.46 | | | | (21.62 | ) | | | 14,743 | | | | 0.67 | (i) | | | 6.48 | (i) | | | 0.01 | % | | | 73 | % | |
| 2009^ | | | 6.08 | | | | 19.77 | | | | 13,924 | | | | 0.92 | (i) | | | 5.58 | (i) | | | 0.01 | | | | 165 | | |
| 2010^ | | | 6.21 | | | | 9.08 | | | | 12,719 | | | | 0.90 | (i) | | | 4.38 | (i) | | | 0.00 | (g) | | | 91 | | |
2011 | | | 6.07 | | | | 4.48 | | | | 11,405 | | | | 1.07 | (i) | | | 5.71 | (i) | | | 0.00 | (g) | | | 65 | | |
2012 | | | 6.41 | | | | 12.98 | | | | 10,317 | | | | 1.09 | (i) | | | 4.92 | (i) | | | 0.00 | (g) | | | 100 | | |
CLASS Y SHARES | |
| 2008^ | | | 5.43 | | | | (21.89 | ) | | | 15,658 | | | | 0.92 | (i) | | | 6.23 | (i) | | | 0.01 | | | | 73 | | |
| 2009^ | | | 6.04 | | | | 19.45 | | | | 16,357 | | | | 1.17 | (i) | | | 5.33 | (i) | | | 0.01 | | | | 165 | | |
| 2010^ | | | 6.17 | | | | 8.85 | | | | 14,740 | | | | 1.15 | (i) | | | 4.13 | (i) | | | 0.00 | (g) | | | 91 | | |
2011 | | | 6.03 | | | | 4.20 | | | | 12,529 | | | | 1.32 | (i) | | | 5.46 | (i) | | | 0.00 | (g) | | | 65 | | |
2012 | | | 6.37 | | | | 12.75 | | | | 11,967 | | | | 1.34 | (i) | | | 4.67 | (i) | | | 0.00 | (g) | | | 100 | | |
93
Morgan Stanley Select Dimensions Investment Series
Financial Highlights continued
| | | | | | | | | | | | | | | | |
FOR THE YEAR
ENDED
DECEMBER 31 | | NET ASSET
VALUE
BEGINNING
OF PERIOD | | NET
INVESTMENT
INCOME (LOSS)(a) | | NET REALIZED
AND
UNREALIZED
GAIN (LOSS) | |
TOTAL FROM
INVESTMENT
OPERATIONS | |
DIVIDENDS
TO
SHAREHOLDERS | |
DISTRIBUTIONS
TO
SHAREHOLDERS | | TOTAL
DIVIDENDS
AND
DISTRIBUTIONS | |
GLOBAL INFRASTRUCTURE
CLASS X SHARES | | | |
| 2008^ | | $ | 29.77 | | | $ | 0.58 | | | $ | (10.37 | ) | | $ | (9.79 | ) | | $ | (0.15 | ) | | | — | | | $ | (0.15 | ) | |
| 2009^ | | | 19.83 | | | | 0.54 | | | | 3.00 | | | | 3.54 | | | | (0.69 | ) | | | — | | | | (0.69 | ) | |
| 2010^ | | | 22.68 | | | | 0.56 | | | | 0.72 | | | | 1.28 | | | | (0.53 | ) | | $ | (0.98 | ) | | | (1.51 | ) | |
2011 | | | 22.45 | | | | 0.52 | | | | 2.95 | | | | 3.47 | | | | (0.69 | ) | | | (1.51 | ) | | | (2.20 | ) | |
2012 | | | 23.72 | | | | 0.55 | | | | 3.44 | | | | 3.99 | | | | (0.57 | ) | | | (2.36 | ) | | | (2.93 | ) | |
CLASS Y SHARES | | | |
| 2008^ | | | 29.75 | | | | 0.52 | | | | (10.36 | ) | | | (9.84 | ) | | | (0.13 | ) | | | — | | | | (0.13 | ) | |
| 2009^ | | | 19.78 | | | | 0.49 | | | | 3.00 | | | | 3.49 | | | | (0.64 | ) | | | — | | | | (0.64 | ) | |
| 2010^ | | | 22.63 | | | | 0.51 | | | | 0.71 | | | | 1.22 | | | | (0.47 | ) | | | (0.98 | ) | | | (1.45 | ) | |
2011 | | | 22.40 | | | | 0.46 | | | | 2.95 | | | | 3.41 | | | | (0.62 | ) | | | (1.51 | ) | | | (2.13 | ) | |
2012 | | | 23.68 | | | | 0.49 | | | | 3.42 | | | | 3.91 | | | | (0.50 | ) | | | (2.36 | ) | | | (2.86 | ) | |
GROWTH
CLASS X SHARES | | | |
| 2008^ | | | 22.19 | | | | (0.04 | ) | | | (10.74 | ) | | | (10.78 | ) | | | (0.06 | ) | | | — | | | | (0.06 | ) | |
| 2009^ | | | 11.35 | | | | 0.02 | | | | 7.49 | | | | 7.51 | | | | — | | | | — | | | | — | | |
| 2010^ | | | 18.86 | | | | 0.02 | | | | 4.45 | | | | 4.47 | | | | — | | | | — | | | | — | | |
2011 | | | 23.33 | | | | (0.04 | ) | | | (0.75 | ) | | | (0.79 | ) | | | — | | | | — | | | | — | | |
2012 | | | 22.54 | | | | 0.05 | | | | 3.18 | | | | 3.23 | | | | — | | | | (1.13 | ) | | | (1.13 | ) | |
CLASS Y SHARES | | | |
| 2008^ | | | 21.86 | | | | (0.08 | ) | | | (10.59 | ) | | | (10.67 | ) | | | (0.00 | )(h) | | | — | | | | (0.00 | )(h) | |
| 2009^ | | | 11.19 | | | | (0.02 | ) | | | 7.37 | | | | 7.35 | | | | — | | | | — | | | | — | | |
| 2010^ | | | 18.54 | | | | (0.03 | ) | | | 4.36 | | | | 4.33 | | | | — | | | | — | | | | — | | |
2011 | | | 22.87 | | | | (0.10 | ) | | | (0.72 | ) | | | (0.82 | ) | | | — | | | | — | | | | — | | |
2012 | | | 22.05 | | | | (0.01 | ) | | | 3.10 | | | | 3.09 | | | | — | | | | (1.13 | ) | | | (1.13 | ) | |
See Notes to Financial Statements
94
| | | | | | | | | RATIO TO AVERAGE
NET ASSETS(c) | | | | | |
FOR THE YEAR
ENDED
DECEMBER 31 | | NET ASSET
VALUE
END OF
PERIOD | |
TOTAL
RETURN(b) | | NET ASSETS
END OF
PERIOD
(000'S) | |
EXPENSES | | NET
INVESTMENT
INCOME (LOSS) | | REBATE FROM
MORGAN STANLEY
AFFILIATE | | PORTFOLIO
TURNOVER
RATE | |
GLOBAL INFRASTRUCTURE
CLASS X SHARES | |
| 2008^ | | $ | 19.83 | | | | (33.02 | )% | | $ | 26,297 | | | | 0.84 | %(i) | | | 2.28 | %(i) | �� | | 0.00 | %(g) | | | 77 | % | |
| 2009^ | | | 22.68 | | | | 18.47 | | | | 24,953 | | | | 1.42 | (i) | | | 2.75 | (i) | | | 0.00 | (g) | | | 279 | | |
| 2010^ | | | 22.45 | | | | 7.13 | | | | 21,843 | | | | 0.93 | (i) | | | 2.66 | (i) | | | 0.00 | (g) | | | 148 | | |
2011 | | | 23.72 | | | | 15.81 | | | | 20,282 | | | | 1.10 | (i) | | | 2.26 | (i) | | | 0.00 | (g) | | | 36 | | |
2012 | | | 24.78 | | | | 18.14 | | | | 19,121 | | | | 1.11 | (i) | | | 2.27 | (i) | | | 0.00 | (g) | | | 28 | | |
CLASS Y SHARES | |
| 2008^ | | | 19.78 | | | | (33.19 | ) | | | 10,886 | | | | 1.09 | (i) | | | 2.03 | (i) | | | 0.00 | (g) | | | 77 | | |
| 2009^ | | | 22.63 | | | | 18.18 | | | | 10,332 | | | | 1.67 | (i) | | | 2.50 | (i) | | | 0.00 | (g) | | | 279 | | |
| 2010^ | | | 22.40 | | | | 6.81 | | | | 8,883 | | | | 1.18 | (i) | | | 2.41 | (i) | | | 0.00 | (g) | | | 148 | | |
2011 | | | 23.68 | | | | 15.56 | | | | 7,863 | | | | 1.35 | (i) | | | 2.01 | (i) | | | 0.00 | (g) | | | 36 | | |
2012 | | | 24.73 | | | | 17.79 | | | | 7,635 | | | | 1.36 | (i) | | | 2.02 | (i) | | | 0.00 | (g) | | | 28 | | |
GROWTH
CLASS X SHARES | |
| 2008^ | | | 11.35 | | | | (48.70 | ) | | | 8,621 | | | | 0.81 | (i) | | | (0.21 | )(i) | | | 0.00 | (g) | | | 42 | | |
| 2009^ | | | 18.86 | | | | 66.17 | | | | 11,748 | | | | 0.91 | (i) | | | 0.11 | (i) | | | 0.00 | (g) | | | 19 | | |
| 2010^ | | | 23.33 | | | | 23.70 | | | | 11,710 | | | | 0.89 | (i) | | | 0.11 | (i) | | | 0.00 | (g) | | | 33 | | |
2011 | | | 22.54 | | | | (3.39 | ) | | | 9,439 | | | | 0.94 | (i) | | | (0.19 | )(i) | | | 0.00 | (g) | | | 29 | | |
2012 | | | 24.64 | | | | 14.50 | | | | 8,794 | | | | 1.08 | (i) | | | 0.19 | (i) | | | 0.00 | (g) | | | 47 | | |
CLASS Y SHARES | |
| 2008^ | | | 11.19 | | | | (48.81 | ) | | | 12,953 | | | | 1.06 | (i) | | | (0.46 | )(i) | | | 0.00 | (g) | | | 42 | | |
| 2009^ | | | 18.54 | | | | 65.68 | | | | 17,864 | | | | 1.16 | (i) | | | (0.14 | )(i) | | | 0.00 | (g) | | | 19 | | |
| 2010^ | | | 22.87 | | | | 23.35 | | | | 17,537 | | | | 1.14 | (i) | | | (0.14 | )(i) | | | 0.00 | (g) | | | 33 | | |
2011 | | | 22.05 | | | | (3.59 | ) | | | 12,715 | | | | 1.19 | (i) | | | (0.44 | )(i) | | | 0.00 | (g) | | | 29 | | |
2012 | | | 24.01 | | | | 14.18 | | | | 11,015 | | | | 1.33 | (i) | | | (0.06 | )(i) | | | 0.00 | (g) | | | 47 | | |
95
Morgan Stanley Select Dimensions Investment Series
Financial Highlights continued
| | | | | | | | | | | | | | | | |
FOR THE YEAR
ENDED
DECEMBER 31 | | NET ASSET
VALUE
BEGINNING
OF PERIOD | | NET
INVESTMENT
INCOME (LOSS)(a) | | NET REALIZED
AND
UNREALIZED
GAIN (LOSS) | |
TOTAL FROM
INVESTMENT
OPERATIONS | |
DIVIDENDS
TO
SHAREHOLDERS | |
DISTRIBUTIONS
TO
SHAREHOLDERS | | TOTAL
DIVIDENDS
AND
DISTRIBUTIONS | |
FOCUS GROWTH
CLASS X SHARES | | | |
| 2008^ | | $ | 21.18 | | | $ | (0.03 | ) | | $ | (10.83 | ) | | $ | (10.86 | ) | | $ | (0.07 | ) | | | — | | | $ | (0.07 | ) | |
| 2009^ | | | 10.25 | | | | 0.01 | | | | 7.35 | | | | 7.36 | | | | (0.02 | ) | | | — | | | | (0.02 | ) | |
| 2010^ | | | 17.59 | | | | (0.01 | ) | | | 4.83 | | | | 4.82 | | | | (0.01 | ) | | | — | | | | (0.01 | ) | |
2011 | | | 22.40 | | | | (0.01 | ) | | | (1.28 | ) | | | (1.29 | ) | | | — | | | | — | | | | — | | |
2012 | | | 21.11 | | | | 0.09 | | | | 2.86 | | | | 2.95 | | | | — | | | $ | (0.77 | ) | | | (0.77 | ) | |
CLASS Y SHARES | | | |
| 2008^ | | | 20.97 | | | | (0.08 | ) | | | (10.73 | ) | | | (10.81 | ) | | | (0.01 | ) | | | — | | | | (0.01 | ) | |
| 2009^ | | | 10.15 | | | | (0.02 | ) | | | 7.27 | | | | 7.25 | | | | — | | | | — | | | | — | | |
| 2010^ | | | 17.40 | | | | (0.05 | ) | | | 4.77 | | | | 4.72 | | | | — | | | | — | | | | — | | |
2011 | | | 22.12 | | | | (0.07 | ) | | | (1.26 | ) | | | (1.33 | ) | | | — | | | | — | | | | — | | |
2012 | | | 20.79 | | | | 0.03 | | | | 2.82 | | | | 2.85 | | | | — | | | | (0.77 | ) | | | (0.77 | ) | |
MULTI CAP GROWTH
CLASS X SHARES | | | |
| 2008^ | | | 15.07 | | | | (0.05 | ) | | | (7.34 | ) | | | (7.39 | ) | | | — | | | | — | | | | — | | |
| 2009^ | | | 7.68 | | | | (0.02 | ) | | | 5.38 | | | | 5.36 | | | | — | | | | — | | | | — | | |
| 2010^ | | | 13.04 | | | | (0.04 | ) | | | 3.56 | | | | 3.52 | | | | — | | | | — | | | | — | | |
2011 | | | 16.56 | | | | (0.09 | ) | | | (1.18 | ) | | | (1.27 | ) | | | — | | | | — | | | | — | | |
2012 | | | 15.29 | | | | (0.05 | ) | | | 1.76 | | | | 1.71 | | | | — | | | | (1.12 | ) | | | (1.12 | ) | |
CLASS Y SHARES | | | |
| 2008^ | | | 14.79 | | | | (0.08 | ) | | | (7.19 | ) | | | (7.27 | ) | | | — | | | | — | | | | — | | |
| 2009^ | | | 7.52 | | | | (0.05 | ) | | | 5.26 | | | | 5.21 | | | | — | | | | — | | | | — | | |
| 2010^ | | | 12.73 | | | | (0.07 | ) | | | 3.47 | | | | 3.40 | | | | — | | | | — | | | | — | | |
2011 | | | 16.13 | | | | (0.13 | ) | | | (1.15 | ) | | | (1.28 | ) | | | — | | | | — | | | | — | | |
2012 | | | 14.85 | | | | (0.09 | ) | | | 1.72 | | | | 1.63 | | | | — | | | | (1.12 | ) | | | (1.12 | ) | |
See Notes to Financial Statements
96
| | | | | | | | | RATIO TO AVERAGE
NET ASSETS(c) | | | | | |
FOR THE YEAR
ENDED
DECEMBER 31 | | NET ASSET
VALUE
END OF
PERIOD | |
TOTAL
RETURN(b) | | NET ASSETS
END OF
PERIOD
(000'S) | |
EXPENSES | | NET
INVESTMENT
INCOME (LOSS) | | REBATE FROM
MORGAN STANLEY
AFFILIATE | | PORTFOLIO
TURNOVER
RATE | |
FOCUS GROWTH
CLASS X SHARES | |
| 2008^ | | $ | 10.25 | | | | (51.43 | )% | | $ | 48,722 | | | | 0.70 | %(i) | | | (0.19 | )%(i) | | | 0.01 | % | | | 31 | % | |
| 2009^ | | | 17.59 | | | | 71.83 | | | | 67,932 | | | | 0.77 | (i) | | | 0.10 | (i) | | | 0.00 | (g) | | | 11 | | |
| 2010^ | | | 22.40 | | | | 27.41 | | | | 72,166 | | | | 0.75 | (i) | | | (0.04 | )(i) | | | 0.00 | (g) | | | 44 | | |
2011 | | | 21.11 | | | | (5.76 | ) | | | 55,818 | | | | 0.76 | (i) | | | (0.07 | )(i) | | | 0.00 | (g) | | | 32 | | |
2012 | | | 23.29 | | | | 14.10 | | | | 53,181 | | | | 0.80 | (i) | | | 0.39 | (i) | | | 0.00 | (g) | | | 43 | | |
CLASS Y SHARES | |
| 2008^ | | | 10.15 | | | | (51.57 | ) | | | 14,206 | | | | 0.95 | (i) | | | (0.44 | )(i) | | | 0.01 | | | | 31 | | |
| 2009^ | | | 17.40 | | | | 71.43 | | | | 22,047 | | | | 1.02 | (i) | | | (0.15 | )(i) | | | 0.00 | (g) | | | 11 | | |
| 2010^ | | | 22.12 | | | | 27.07 | | | | 21,783 | | | | 1.00 | (i) | | | (0.29 | )(i) | | | 0.00 | (g) | | | 44 | | |
2011 | | | 20.79 | | | | (5.97 | ) | | | 16,191 | | | | 1.01 | (i) | | | (0.32 | )(i) | | | 0.00 | (g) | | | 32 | | |
2012 | | | 22.87 | | | | 13.83 | | | | 14,960 | | | | 1.05 | (i) | | | 0.14 | (i) | | | 0.00 | (g) | | | 43 | | |
MULTI CAP GROWTH
CLASS X SHARES | |
| 2008^ | | | 7.68 | | | | (49.04 | ) | | | 6,744 | | | | 1.04 | (i) | | | (0.37 | )(i) | | | 0.00 | (g) | | | 33 | | |
| 2009^ | | | 13.04 | | | | 69.79 | | | | 9,601 | | | | 1.23 | (i) | | | (0.24 | )(i) | | | 0.00 | (g) | | | 23 | | |
| 2010^ | | | 16.56 | | | | 26.99 | | | | 10,230 | | | | 1.08 | (i) | | | (0.31 | )(i) | | | 0.00 | (g) | | | 27 | | |
2011 | | | 15.29 | | | | (7.67 | ) | | | 7,995 | | | | 1.17 | (i) | | | (0.57 | )(i) | | | 0.00 | (g) | | | 27 | | |
2012 | | | 15.88 | | | | 11.31 | | | | 7,389 | | | | 1.38 | (i) | | | (0.32 | )(i) | | | 0.00 | (g) | | | 46 | | |
CLASS Y SHARES | |
| 2008^ | | | 7.52 | | | | (49.15 | ) | | | 8,571 | | | | 1.29 | (i) | | | (0.62 | )(i) | | | 0.00 | (g) | | | 33 | | |
| 2009^ | | | 12.73 | | | | 69.28 | | | | 12,455 | | | | 1.48 | (i) | | | (0.49 | )(i) | | | 0.00 | (g) | | | 23 | | |
| 2010^ | | | 16.13 | | | | 26.71 | | | | 13,058 | | | | 1.33 | (i) | | | (0.56 | )(i) | | | 0.00 | (g) | | | 27 | | |
2011 | | | 14.85 | | | | (7.94 | ) | | | 8,797 | | | | 1.42 | (i) | | | (0.82 | )(i) | | | 0.00 | (g) | | | 27 | | |
2012 | | | 15.36 | | | | 11.11 | | | | 8,486 | | | | 1.63 | (i) | | | (0.57 | )(i) | | | 0.00 | (g) | | | 46 | | |
97
Morgan Stanley Select Dimensions Investment Series
Financial Highlights continued
| | | | | | | | | | | | | | | | |
FOR THE YEAR
ENDED
DECEMBER 31 | | NET ASSET
VALUE
BEGINNING
OF PERIOD | | NET
INVESTMENT
INCOME (LOSS)(a) | | NET REALIZED
AND
UNREALIZED
GAIN (LOSS) | |
TOTAL FROM
INVESTMENT
OPERATIONS | |
DIVIDENDS
TO
SHAREHOLDERS | |
DISTRIBUTIONS
TO
SHAREHOLDERS | | TOTAL
DIVIDENDS
AND
DISTRIBUTIONS | |
MID CAP GROWTH
CLASS X SHARES | | | |
| 2008^ | | $ | 32.19 | | | $ | (0.05 | ) | | $ | (15.34 | ) | | $ | (15.39 | ) | | $ | (0.19 | ) | | | — | | | $ | (0.19 | ) | |
| 2009^ | | | 16.61 | | | | 0.03 | | | | 10.01 | | | | 10.04 | | | | — | | | | — | | | | — | | |
| 2010^ | | | 26.65 | | | | 0.10 | | | | 8.63 | | | | 8.73 | | | | (0.04 | ) | | | — | | | | (0.04 | ) | |
2011 | | | 35.34 | | | | (0.07 | ) | | | (2.37 | ) | | | (2.44 | ) | | | (0.13 | ) | | | — | | | | (0.13 | ) | |
2012 | | | 32.77 | | | | 0.12 | | | | 2.62 | | | | 2.74 | | | | — | | | $ | (2.61 | ) | | | (2.61 | ) | |
CLASS Y SHARES | | | |
| 2008^ | | | 31.67 | | | | (0.11 | ) | | | (15.10 | ) | | | (15.21 | ) | | | (0.12 | ) | | | — | | | | (0.12 | ) | |
| 2009^ | | | 16.34 | | | | (0.03 | ) | | | 9.84 | | | | 9.81 | | | | — | | | | — | | | | — | | |
| 2010^ | | | 26.15 | | | | 0.03 | | | | 8.46 | | | | 8.49 | | | | — | | | | — | | | | — | | |
2011 | | | 34.64 | | | | (0.16 | ) | | | (2.32 | ) | | | (2.48 | ) | | | (0.05 | ) | | | — | | | | (0.05 | ) | |
2012 | | | 32.11 | | | | 0.03 | | | | 2.57 | | | | 2.60 | | | | — | | | | (2.61 | ) | | | (2.61 | ) | |
^ Beginning with the year ended December 31, 2011, the Fund was audited by Ernst & Young LLP. The previous years were audited by another independent registered public accounting firm.
(a) The per share amounts were computed using an average number of shares outstanding during the period.
(b) Calculated based on the net asset value as of the last business day of the period. Performance shown does not reflect fees and expenses imposed by your insurance company. If performance information included the effect of these charges, the total returns would be lower.
(c) Reflects overall Portfolio ratios for investment income and non-class specific expenses.
(d) Amount is less than $0.001.
(e) Reflects fees paid in connection with the U.S. Treasury's Temporary Guarantee Program for Money Market Funds. This fee had an effect of 0.03% for the year ended 2009.
(f) If the Portfolio had borne all of its expenses that were reimbursed or waived by the Distributor, Adviser, and Administrator, the annualized expense and net investment loss ratios, would have been as follows:
PERIOD ENDED | | EXPENSE
RATIO | | NET INVESTMENT LOSS
RATIO | |
December 31, 2012 | | | | | | | | | |
Class X | | | 0.65 | % | | | (0.36 | )% | |
Class Y | | | 0.90 | | | | (0.61 | ) | |
December 31, 2011 | | | | | | | | | |
Class X | | | 0.61 | | | | (0.37 | ) | |
Class Y | | | 0.86 | | | | (0.62 | ) | |
December 31, 2010 | | | | | | | | | |
Class X | | | 0.59 | | | | (0.29 | ) | |
Class Y | | | 0.84 | | | | (0.54 | ) | |
December 31, 2009 | | | | | | | | | |
Class X | | | 0.59 | | | | (0.17 | ) | |
Class Y | | | 0.84 | | | | (0.42 | ) | |
See Notes to Financial Statements
98
| | | | | | | | | RATIO TO AVERAGE
NET ASSETS(c) | | | | | |
FOR THE YEAR
ENDED
DECEMBER 31 | | NET ASSET
VALUE
END OF
PERIOD | |
TOTAL
RETURN(b) | | NET ASSETS
END OF
PERIOD
(000'S) | |
EXPENSES | | NET
INVESTMENT
INCOME (LOSS) | | REBATE FROM
MORGAN STANLEY
AFFILIATE | | PORTFOLIO
TURNOVER
RATE | |
MID CAP GROWTH
CLASS X SHARES | |
| 2008^ | | $ | 16.61 | | | | (48.06 | )% | | $ | 16,023 | | | | 0.74 | %(i) | | | (0.19 | )%(i) | | | 0.01 | % | | | 43 | % | |
| 2009^ | | | 26.65 | | | | 60.45 | | | | 21,310 | | | | 0.84 | (i) | | | 0.12 | (i) | | | 0.00 | (g) | | | 36 | | |
| 2010^ | | | 35.34 | | | | 32.79 | | | | 24,319 | | | | 0.79 | (i) | | | 0.36 | (i) | | | 0.00 | (g) | | | 44 | | |
2011 | | | 32.77 | | | | (6.97 | ) | | | 19,186 | | | | 0.81 | (i) | | | (0.19 | )(i) | | | 0.00 | (g) | | | 33 | | |
2012 | | | 32.90 | | | | 8.51 | | | | 17,016 | | | | 1.02 | (i) | | | 0.35 | (i) | | | 0.00 | (g) | | | 31 | | |
CLASS Y SHARES | |
| 2008^ | | | 16.34 | | | | (48.20 | ) | | | 5,469 | | | | 0.99 | (i) | | | (0.44 | )(i) | | | 0.01 | | | | 43 | | |
| 2009^ | | | 26.15 | | | | 60.04 | | | | 8,267 | | | | 1.09 | (i) | | | (0.13 | )(i) | | | 0.00 | (g) | | | 36 | | |
| 2010^ | | | 34.64 | | | | 32.47 | | | | 10,828 | | | | 1.04 | (i) | | | 0.11 | (i) | | | 0.00 | (g) | | | 44 | | |
2011 | | | 32.11 | | | | (7.18 | ) | | | 7,812 | | | | 1.06 | (i) | | | (0.44 | )(i) | | | 0.00 | (g) | | | 33 | | |
2012 | | | 32.10 | | | | 8.24 | | | | 6,425 | | | | 1.27 | (i) | | | 0.10 | (i) | | | 0.00 | (g) | | | 31 | | |
(g) Amount is less than 0.005%.
(h) Includes dividends of less than $0.001.
(i) The ratios reflect the rebate of certain Portfolio expenses in connection with investments in a Morgan Stanley affiliate during the period. The effect of the rebate on the ratios is disclosed in the above table as "Rebate from Morgan Stanley affiliate."
99
Morgan Stanley Select Dimensions Investment Series
Report of Independent Registered Public Accounting Firm
To the Shareholders and Board of Trustees of
Morgan Stanley Select Dimensions Investment Series:
We have audited the accompanying statements of assets and liabilities, including the portfolios of investments, of Morgan Stanley Select Dimensions Investment Series (comprising, respectively, Money Market, Flexible Income, Global Infrastructure, Growth, Focus Growth, Multi Cap Growth, and Mid Cap Growth Portfolios) (collectively, the "Portfolios") as of December 31, 2012, and the related statements of operations for the year then ended, and the statements of changes in net assets and the financial highlights for each of the two years in the period then ended. These financial statements and financial highlights are the responsibility of the Portfolios' management. Our responsibility is to express an opinion on these financial statements and financial highlights based on our audits. The financial highlights for the three years ended December 31, 2010 were audited by another independent registered public accounting firm whose report, dated February 25, 2011, expressed an unqualified opinion on those financial highlights.
We conducted our audits in accordance with the standards of the Public Company Accounting Oversight Board (United States). Those standards require that we plan and perform the audit to obtain reasonable assurance about whether the financial statements and financial highlights are free of material misstatement. We were not engaged to perform an audit of the Portfolios' internal control over financial reporting. Our audits included consideration of internal control over financial reporting as a basis for designing audit procedures that are appropriate in the circumstances, but not for the purpose of expressing an opinion on the effectiveness of the Portfolios' internal control over financial reporting. Accordingly, we express no such opinion. An audit also includes examining, on a test basis, evidence supporting the amounts and disclosures in the financial statements and financial highlights, assessing the accounting principles used and significant estimates made by management, and evaluating the overall financial statement presentation. Our procedures included confirmation of securities owned as of December 31, 2012, by correspondence with the custodian and others or by other appropriate auditing procedures where replies from others were not received. We believe that our audits provide a reasonable basis for our opinion.
In our opinion, the financial statements and financial highlights referred to above present fairly, in all material respects, the financial position of each of the respective portfolios constituting the Morgan Stanley Select Dimensions Investment Series at December 31, 2012, the results of their operations for the year then ended, and the changes in their net assets and the financial highlights for each of the two years in the period then ended, in conformity with U.S. generally accepted accounting principles.

Boston, Massachusetts
February 19, 2013
100
Morgan Stanley Select Dimensions Investment Series
Trustee and Officer Information (unaudited)
Name, Age and Address of
Independent Trustee | | Position(s)
Held with
Registrant | | Length of
Time Served* | | Principal Occupation(s)
During Past 5 Years | | Number of
Portfolios
in Fund
Complex
Overseen by
Independent
Trustee** | | Other Directorships
Held by Independent Trustee*** | |
Frank L. Bowman (68)
c/o Kramer Levin Naftalis & Frankel LLP
Counsel to the Independent Trustees
1177 Avenue of the Americas
New York, NY 10036 | | Trustee | | Since
August 2006 | | President, Strategic Decisions, LLC (consulting) (since February 2009); Director or Trustee of various Morgan Stanley Funds (since August 2006); Chairperson of the Insurance Sub-Committee of the Compliance and Insurance Committee (since February 2007); served as President and Chief Executive Officer of the Nuclear Energy Institute (policy organization) (February 2005-November 2008); retired as Admiral, U.S. Navy after serving over 38 years on active duty including 8 years as Director of the Naval Nuclear Propulsion Program in the Department of the Navy and the U.S. Department of Energy (1996-2004); served as Chief of Naval Personnel (July 1994-September 1996); and on the Joint Staff as Director of Political Military Affairs (June 1992-July 1994); knighted as Honorary Knight Commander of the Most Excellent Order of the British Empire; Awarded the Officier de l'Orde National du Mérite by the French Government; elected to the National Academy of Engineering (2009). | | | 101 | | | Director of BP p.l.c.; Director of Naval and Nuclear Technologies LLP; Director of the Armed Services YMCA of the USA and the U.S. Naval Submarine League; Director of the American Shipbuilding Suppliers Association; Member of the National Security Advisory Council of the Center for U.S. Global Engagement and a member of the CNA Military Advisory Board. | |
Michael Bozic (72)
c/o Kramer Levin Naftalis & Frankel LLP
Counsel to the Independent Trustees
1177 Avenue of the Americas
New York, NY 10036 | | Trustee | | Since
April 1994 | | Private investor and a member of the advisory board of American Road Group LLC (retail) (since June 2000); Chairperson of the Compliance and Insurance Committee (since October 2006); Director or Trustee of various Morgan Stanley Funds (since April 1994); formerly, Chairperson of the Insurance Committee (July 2006-September 2006); Vice Chairman of Kmart Corporation (December 1998-October 2000), Chairman and Chief Executive Officer of Levitz Furniture Corporation (November 1995-November 1998) and President and Chief Executive Officer of Hills Department Stores (May 1991-July 1995); variously Chairman, Chief Executive Officer, President and Chief Operating Officer (1987-1991) of the Sears Merchandise Group of Sears, Roebuck & Co. | | | 103 | | | Trustee and member of the Hillsdale College Board of Trustees. | |
101
Morgan Stanley Select Dimensions Investment Series
Trustee and Officer Information (unaudited) continued
Name, Age and Address of
Independent Trustee | | Position(s)
Held with
Registrant | | Length of
Time Served* | | Principal Occupation(s)
During Past 5 Years | | Number of
Portfolios
in Fund
Complex
Overseen by
Independent
Trustee** | | Other Directorships
Held by Independent Trustee*** | |
Kathleen A. Dennis (59)
c/o Kramer Levin Naftalis & Frankel LLP
Counsel to the Independent Trustees
1177 Avenue of the Americas
New York, NY 10036 | | Trustee | | Since
August 2006 | | President, Cedarwood Associates (mutual fund and investment management consulting) (since July 2006); Chairperson of the Money Market and Alternatives Sub-Committee of the Investment Committee (since October 2006) and Director or Trustee of various Morgan Stanley Funds (since August 2006); formerly, Senior Managing Director of Victory Capital Management (1993-2006). | | | 101 | | | Director of various non-profit organizations. | |
Dr. Manuel H. Johnson (64)
c/o Johnson Smick Group, Inc.
888 16th Street, N.W.
Suite 740
Washington, D.C. 20006 | | Trustee | | Since
July 1991 | | Senior Partner, Johnson Smick International, Inc. (consulting firm); Chairperson of the Investment Committee (since October 2006) and Director or Trustee of various Morgan Stanley Funds (since July 1991); Co-Chairman and a founder of the Group of Seven Council (G7C) (international economic commission); formerly, Chairperson of the Audit Committee (July 1991-September 2006), Vice Chairman of the Board of Governors of the Federal Reserve System and Assistant Secretary of the U.S. Treasury. | | | 103 | | | Director of NVR, Inc. (home construction). | |
Joseph J. Kearns (70)
c/o Kearns & Associates LLC
PMB754
22631 Pacific Coast Highway
Malibu, CA 90265 | | Trustee | | Since
August 1994 | | President, Kearns & Associates LLC (investment consulting); Chairperson of the Audit Committee (since October 2006) and Director or Trustee of various Morgan Stanley Funds (since August 1994); formerly, Deputy Chairperson of the Audit Committee (July 2003-September 2006) and Chairperson of the Audit Committee of various Morgan Stanley Funds (since August 1994); CFO of the J. Paul Getty Trust. | | | 104 | | | Director of Electro Rent Corporation (equipment leasing) and The Ford Family Foundation. | |
102
Morgan Stanley Select Dimensions Investment Series
Trustee and Officer Information (unaudited) continued
Name, Age and Address of
Independent Trustee | | Position(s)
Held with
Registrant | | Length of
Time Served* | | Principal Occupation(s)
During Past 5 Years | | Number of
Portfolios
in Fund
Complex
Overseen by
Independent
Trustee** | | Other Directorships
Held by Independent Trustee*** | |
Michael F. Klein (54)
c/o Kramer Levin Naftalis & Frankel LLP
Counsel to the Independent Trustees
1177 Avenue of the Americas
New York, NY 10036 | | Trustee | | Since
August 2006 | | Managing Director, Aetos Capital, LLC (since March 2000) and Co-President, Aetos Alternatives Management, LLC (since January 2004); Chairperson of the Fixed Income Sub-Committee of the Investment Committee (since October 2006) and Director or Trustee of various Morgan Stanley Funds (since August 2006); formerly, Managing Director, Morgan Stanley & Co. Inc. and Morgan Stanley Dean Witter Investment Management, President, various Morgan Stanley Funds (June 1998-March 2000) and Principal, Morgan Stanley & Co. Inc. and Morgan Stanley Dean Witter Investment Management (August 1997-December 1999). | | | 101 | | | Director of certain investment funds managed or sponsored by Aetos Capital, LLC. Director of Sanitized AG and Sanitized Marketing AG (specialty chemicals). | |
Michael E. Nugent (76)
522 Fifth Avenue
New York, NY 10036 | | Chairperson of the Board and Trustee | | Chairperson of the Boards since July 2006 and Trustee since July 1991 | | General Partner, Triumph Capital, L.P. (private investment partnership); Chairperson of the Boards of various Morgan Stanley Funds (since July 2006); Chairperson of the Closed-End Fund Committee (since June 2012) and Director or Trustee of various Morgan Stanley Funds (since July 1991); formerly, Chairperson of the Insurance Committee (until July 2006). | | | 103 | | | None. | |
103
Morgan Stanley Select Dimensions Investment Series
Trustee and Officer Information (unaudited) continued
Name, Age and Address of
Independent Trustee | | Position(s)
Held with
Registrant | | Length of
Time Served* | | Principal Occupation(s)
During Past 5 Years | | Number of
Portfolios
in Fund
Complex
Overseen by
Independent
Trustee** | | Other Directorships
Held by Independent Trustee*** | |
W. Allen Reed (65)
c/o Kramer Levin Naftalis & Frankel LLP
Counsel to the Independent Trustees
1177 Avenue of the Americas
New York, NY 10036 | | Trustee | | Since
August 2006 | | Chairperson of the Equity Sub-Committee of the Investment Committee (since October 2006) and Director or Trustee of various Morgan Stanley Funds (since August 2006); formerly, President and CEO of General Motors Asset Management; Chairman and Chief Executive Officer of the GM Trust Bank and Corporate Vice President of General Motors Corporation (August 1994-December 2005). | | | 101 | | | Director of Temple-Inland Industries (packaging and forest products); Director of Legg Mason, Inc. and Director of the Auburn University Foundation. | |
Fergus Reid (80)
c/o Joe Pietryka, Inc.
85 Charles Colman Blvd.
Pawling, NY 12564 | | Trustee | | Since
June 1992 | | Chairman, Joe Pietryka, Inc.; Chairperson of the Governance Committee and Director or Trustee of various Morgan Stanley Funds (since June 1992). | | | 104 | | | None. | |
Interested Trustee:
Name, Age and Address of
Interested Trustee | | Position(s)
Held with
Registrant | | Length of
Time Served* | | Principal Occupation(s)
During Past 5 Years | | Number of
Portfolios
in Fund
Complex
Overseen by
Interested
Trustee** | | Other Directorships
Held by Interested Trustee*** | |
James F. Higgins (65)
c/o Morgan Stanley Services Company Inc.
Harborside Financial Center
201 Plaza Two
Jersey City, NJ 07311 | | Trustee | | Since
June 2000 | | Director or Trustee of various Morgan Stanley Funds (since June 2000); Senior Advisor of Morgan Stanley (since August 2000). | | | 102 | | | Director of AXA Financial, Inc. and The Equitable Life Assurance Society of the United States (financial services). | |
* Each Trustee serves an indefinite term, until his or her successor is elected.
** The Fund Complex includes (as of December 31, 2012) all open-end and closed-end funds (including all of their portfolios) advised by Morgan Stanley Investment Management Inc. (the "Adviser") and any funds that have an adviser that is an affiliated person of the Adviser (including, but not limited to, Morgan Stanley AIP GP LP).
*** This includes any directorships at public companies and registered investment companies held by the Trustee at any time during the past five years.
104
Morgan Stanley Select Dimensions Investment Series
Trustee and Officer Information (unaudited) continued
Name, Age and Address of
Executive Officer | | Position(s)
Held with
Registrant | | Length of
Time Served* | | Principal Occupation(s) During Past 5 Years | |
Arthur Lev (51)
522 Fifth Avenue
New York, NY 10036 | | President and Principal Executive Officer – Equity and Fixed Income Funds | | Since June 2011 | | President and Principal Executive Officer (since June 2011) of the Equity and Fixed Income Funds in the Fund Complex; Head of the Long Only Business of Morgan Stanley Investment Management (since February 2011); Managing Director of the Adviser and various entities affiliated with the Adviser (since December 2006). Formerly, Chief Strategy Officer of Morgan Stanley Investment Management's Traditional Asset Management business (November 2010-February 2011); General Counsel of Morgan Stanley Investment Management (December 2006-October 2010); Partner and General Counsel of FrontPoint Partners LLC (July 2002-December 2006); Managing Director and General Counsel of Morgan Stanley Investment Management (May 2000-June 2002). | |
Mary Ann Picciotto (39)
522 Fifth Avenue
New York, NY 10036 | | Chief Compliance Officer | | Since May 2010 | | Managing Director of the Adviser and various entities affiliated with the Adviser; Chief Compliance Officer of various Morgan Stanley Funds (since May 2010); Chief Compliance Officer of the Adviser (since April 2007). | |
Stefanie V. Chang Yu (46)
522 Fifth Avenue
New York, NY 10036 | | Vice President | | Since December 1997 | | Managing Director of the Adviser and various entities affiliated with the Adviser; Vice President of various Morgan Stanley Funds (since December 1997). | |
Francis J. Smith (47)
c/o Morgan Stanley Services Company Inc.
Harborside Financial Center
201 Plaza Two
Jersey City, NJ 07311 | | Treasurer and Principal Financial
Officer | | Treasurer since July 2003 and Principal Financial Officer since September 2002 | | Executive Director of the Adviser and various entities affiliated with the Adviser; Treasurer and Principal Financial Officer of various Morgan Stanley Funds (since July 2003). | |
Mary E. Mullin (45)
522 Fifth Avenue
New York, NY 10036 | | Secretary | | Since June 1999 | | Executive Director of the Adviser and various entities affiliated with the Adviser; Secretary of various Morgan Stanley Funds (since June 1999). | |
* Each officer serves an indefinite term, until his or her successor is elected.
105
Morgan Stanley Select Dimensions Investment Series
Federal Tax Notice n December 31, 2012 (unaudited)
For Federal income tax purposes, the following information is furnished with respect to the distributions paid by each applicable Portfolio during the taxable year ended December 31, 2012. For corporate shareholders, the following percentages of dividends paid by each of the applicable Portfolios qualified for the dividends received deduction.
| FUND | | DIVIDENDS RECEIVED
DEDUCTION % | |
Global Infrastructure Portfolio | | | 23.36 | % | |
Each of the applicable Portfolios designated and paid the following amounts as a long-term capital gain distribution:
FUND | | AMOUNT | |
Focus Growth Portfolio | | $ | 2,406,744 | | |
Global Infrastructure Portfolio | | | 1,997,604 | | |
Growth Portfolio | | | 996,292 | | |
Mid Cap Growth Portfolio | | | 1,976,981 | | |
Multi Cap Growth Portfolio | | | 1,147,541 | | |
For Federal income tax purposes, the following information is furnished with respect to the earnings of each applicable Portfolio for the taxable year ended December 31, 2012. The Global Infrastructure Portfolio intends to pass through foreign tax credits of $61,138 and has derived income from sources within foreign countries amounting to $705,571.
106
(This page has been intentionally left blank.)
(This page has been intentionally left blank.)
Trustees | |
| | | | | Frank L. Bowman | | Joseph J. Kearns | |
| | | | | Michael Bozic | | Michael F. Klein | |
| | | | | Kathleen A. Dennis | | Michael E. Nugent | |
| | | | | James F. Higgins | | W. Allen Reed | |
| | | | | Dr. Manuel H. Johnson | | Fergus Reid | |
Officers | |
Michael E. Nugent
Chairperson of the Board | |
Arthur Lev
President and Principal Executive Officer | |
Mary Ann Picciotto
Chief Compliance Officer | |
Stefanie V. Chang Yu
Vice President | |
Francis J. Smith
Treasurer and Principal Financial Officer | |
Mary E. Mullin
Secretary | |
| | | Transfer Agent | | Custodian | |
| | | | | Morgan Stanley Services Company Inc.
P.O. Box 219886
Kansas City, Missouri 64121 | | State Street Bank and Trust Company
One Lincoln Street
Boston, Massachusetts 02111 | |
| | | Independent Registered Public Accounting Firm | | Legal Counsel | |
| | | | | Ernst & Young LLP
200 Clarendon Street
Boston, Massachusetts 02116 | | Dechert LLP
1095 Avenue of the Americas
New York, New York 10036 | |
| | | Counsel to the Independent Trustees | | Adviser | |
| | | | | Kramer Levin Naftalis & Frankel LLP
1177 Avenue of the Americas
New York, New York 10036 | | Morgan Stanley Investment Management Inc.
522 Fifth Avenue
New York, New York 10036 | |
| | | Sub-Advisers | |
| | | Morgan Stanley Investment Management Limited
25 Cabot Square, Canary Wharf
London, E14 4QA England | |
| | | Morgan Stanley Investment Management Company
23 Church Street
16-01 Capital Square 049481 Singapore | |
This report is submitted for the general information of shareholders of the Fund. For more detailed information about the Fund, its fees and expenses and other pertinent information, please read its Prospectus. The Fund's Statement of Additional Information contains additional information about the Fund, including its trustees. It is available without charge, by calling (800) 869-NEWS.
This report is not authorized for distribution to prospective investors in the Fund unless preceded or accompanied by an effective Prospectus. Read the Prospectus carefully before investing.
Morgan Stanley Distribution, Inc., member FINRA.
SELDIMANN
IU13-00296P-Y12/12
MORGAN STANLEY
SELECT DIMENSIONS INVESTMENT SERIES
Semi-Annual Report
JUNE 30, 2013
The Portfolios are intended to be the funding vehicle for variable annuity contracts and variable life insurance policies offered by the separate accounts of certain life insurance companies.
Morgan Stanley Select Dimensions Investment Series
Table of Contents
Letter to the Shareholders | | | 1 | | |
Fund Performance | | | 13 | | |
Expense Examples | | | 15 | | |
Investment Advisory Agreement Approval | | | 19 | | |
Portfolio of Investments: | |
| Money Market | | | 23 | | |
| Flexible Income | | | 28 | | |
| Global Infrastructure | | | 42 | | |
Growth | | | 45 | | |
Focus Growth | | | 48 | | |
| Multi Cap Growth | | | 50 | | |
| Mid Cap Growth | | | 52 | | |
Financial Statements: | |
| Statements of Assets and Liabilities | | | 56 | | |
| Statements of Operations | | | 58 | | |
| Statements of Changes in Net Assets | | | 60 | | |
| Notes to Financial Statements | | | 66 | | |
Financial Highlights | | | 96 | | |
Results of Special Shareholder Meeting | | | 104 | | |
Morgan Stanley Select Dimensions Investment Series
Letter to the Shareholders n June 30, 2013 (unaudited)
Dear Shareholder:
In the six months ended June 30, 2013, global risk assets continued to outperform relatively safer assets despite a moderate global economic environment. With U.S. gross domestic product (GDP) growth still below 2%, Europe in recession and China's economy slowing, global central banks continued to pursue both conventional and unconventional means to bolster economic growth. This helped encourage investor confidence in the capital markets for most of the period. However, at the end of May the U.S. Federal Reserve (Fed) signaled that it could begin "tapering" its asset purchase program, known as quantitative easing (QE), sooner than expected. Global equity and bond markets responded with significant volatility, as the announcement took investors by surprise. In June, the Fed tried to calm the markets, emphasizing that tapering will be gradual and dependent on improvements in the economy and that tapering QE is not the same as monetary tightening — in other words, any potential increases to the target federal funds rate remain further down the road.
Domestic Equity Overview
Modest growth in the U.S. economy and a backdrop of accommodative monetary policy drove the U.S. stock market to positive returns for the six-month period ended June 30, 2013. Concerns about the effects of automatic federal spending cuts (called sequestration) and higher payroll taxes, problems in the European debt crisis and slackening growth in China contributed to market volatility throughout the period. Nevertheless, stock prices trended higher overall as investors continued to believe the Federal Reserve (the Fed) and other central banks around the world would continue providing ample liquidity through interest rate cuts and asset purchase programs. Although the Dow Jones Industrial Average and S&P 500® Index, two of the most commonly cited measures of the U.S. stock market, reached new highs in May, the market pulled back in June after the Fed announced its intention to possibly scale back stimulus in the second half of the year.
Fixed Income Overview
Most segments of the bond market declined during the six-month period. Fixed income returns were relatively weak early in 2013, and losses were exacerbated in the final month of the period. The yields on long-term U.S. Treasuries spiked in response to the Fed's tapering comments, with the 10-year Treasury yield exceeding 2.5% at one point (coming from a level well below 2% back in April). Prices across the fixed income spectrum fell, as prices drop when yields rise. The high yield corporate sector was a notable exception, with a small gain for the period, buoyed by demand for the sector's potentially higher relative returns.
Morgan Stanley Select Dimensions Investment Series
Letter to the Shareholders n June 30, 2013 (unaudited) continued
Money market yields continued to be constrained by the Fed's near-zero interest rate policy. While there was some speculation that tapering could begin as early as September, the Fed was careful to point out that the economy must meet certain expectations before its exit strategy would begin. Furthermore, the Fed indicated there have been no changes to its decision to leave the federal funds rate near zero until unemployment and inflation dictate otherwise, which could be 2015 by some estimates.
International Equity Overview
Although Japan was the strongest-performing market on a global basis, international equity markets as a whole underperformed the U.S. market during the reporting period. Japanese equities rallied as the country returned to economic expansion in the first quarter of 2013 (following a recession in the third and fourth quarters of 2012) and the newly appointed governor of the Bank of Japan took decisive steps to combat deflation with a new, aggressive QE program. Europe, however, remained in recession. A bailout in Cyprus, uncertainty in Italy's general elections and signs of distress in Portugal added further downward pressure to European equities during the period. Emerging markets lagged developed markets by a wide margin as the asset class suffered from considerable outflows by investors concerned about slowing growth, particularly in the "BRIC" economies (Brazil, Russia, India and China), and the implications of the Fed's exit from QE.
Money Market Portfolio
An investment in a money market fund is not insured or guaranteed by the Federal Deposit Insurance Corporation or any other government agency. Although money market funds seek to preserve the value of an investment at $1.00 per share, it is possible to lose money by investing in such funds.
As of June 30, 2013, Select Dimensions – Money Market Portfolio had net assets of approximately $62.2 million with an average portfolio maturity of 25 days. For the seven-day period ended June 30, 2013, the Portfolio's Class X shares provided an effective annualized yield of 0.01% (subsidized) and – 0.55% (non-subsidized) and a current yield of 0.01% (subsidized) and – 0.55% (non-subsidized), while its 30-day moving average yield for June was 0.01% (subsidized) and – 0.52% (non-subsidized). Yield quotations more closely reflect the current earnings of the Portfolio. The non-subsidized yield reflects what the yield would have been had a fee and/or expense waiver not been in place during the period shown. For the six-month period ended June 30, 2013, the Portfolio's Class X shares returned 0.00%. Past performance is no guarantee of future results.
For the seven-day period ended June 30, 2013, the Portfolio's Class Y shares provided an effective annualized yield of 0.01% (subsidized) and – 0.79% (non-subsidized) and a current yield of 0.01%
2
Morgan Stanley Select Dimensions Investment Series
Letter to the Shareholders n June 30, 2013 (unaudited) continued
(subsidized) and – 0.79% (non-subsidized), while its 30-day moving average yield for June was 0.01% (subsidized) and – 0.77% (non-subsidized). Yield quotations more closely reflect the current earnings of the Portfolio. The non-subsidized yield reflects what the yield would have been had a fee and/or expense waiver not been in place during the period shown. For the six-month period ended June 30, 2013, the Portfolio's Class Y shares returned 0.00%. Past performance is no guarantee of future results.
The performance of the Portfolio's two share classes varies because each has different expenses. The Portfolio's total returns assume the reinvestment of all distributions but do not reflect the deduction of any charges by your insurance company. Such costs would lower performance.
We continued to remain cautious in our investment approach, focusing on securities with high liquidity and short durations. We believe this approach, together with our investment process, has put us in a favorable position to respond to market uncertainty.
During the period, we purchased what we believe were high-quality fixed and floating rate paper, while maintaining our conservative liquidity metrics. Our management strategy for the Portfolio remained consistent with our long-term focus on capital preservation and high liquidity.
There is no guarantee that any sectors mentioned will continue to perform as discussed above or that securities in such sectors will be held by the Portfolio in the future.
Flexible Income Portfolio
For the six-month period ended June 30, 2013, Select Dimensions – Flexible Income Portfolio Class X shares produced a total return of – 0.62%, outperforming the Barclays Capital Intermediate U.S. Government/Credit Index (the "Index"),1 which returned – 1.45%. For the same period, the Portfolio's Class Y shares returned – 0.78%. Past performance is no guarantee of future results.
The performance of the Portfolio's two share classes varies because each has different expenses. The Portfolio's total returns assume the reinvestment of all distributions but do not reflect the deduction of any charges by your insurance company. Such costs would lower performance.
1 The Barclays Capital Intermediate U.S. Government/Credit Index tracks the performance of U.S. government and corporate obligations, including U.S. government agency and Treasury securities, and corporate and Yankee bonds with maturities of 1 to 10 years. The Index is unmanaged and its returns do not include any sales charges or fees. Such costs would lower performance. It is not possible to invest directly in an index.
3
Morgan Stanley Select Dimensions Investment Series
Letter to the Shareholders n June 30, 2013 (unaudited) continued
Exposure to corporate bonds contributed to the Portfolio's outperformance during the period. Within the Portfolio's corporate bond position, the high yield segment was particularly beneficial due to spread tightening across a variety of sectors, such as capital goods, cyclicals and non-cyclicals, as well as health care.
In contrast, the Portfolio was mainly hurt by its exposure to emerging markets and non-agency mortgage-backed securities. Within emerging markets, the principal countries detracting from performance were Indonesia, Kazakhstan, Indonesia, Mexico, Russia and the Ukraine. The Portfolio's exposure to non-agency mortgages was especially hit at the end of the reporting period, as the markets have begun to worry about the Federal Reserve's (Fed) asset purchase tapering plans. As the mortgage markets are the most sensitive to changes in Fed policy, their performance was particularly hurt by Fed Chairman Bernanke's speech at the end of May, which surprised financial markets with the Fed's intention to begin reducing the amount of its bond buying program later this year. Within the Portfolio's mortgage exposure, the Alt-A segment detracted the most.
Overall, the Portfolio's interest-rate positioning had a positive impact on relative performance. This was mainly due to the underweight to U.S. dollar rates, which rose during the period.
Currency positions, which are managed through the use of currency forwards, added a small amount to performance overall, largely via the Portfolio's underweight to the Australian dollar. This was partially offset by losses from the long position in the Norwegian krone.
Finally, the Portfolio's yield advantage over the Index added to performance.
There is no guarantee that any sectors mentioned will continue to perform as discussed above or that securities in such sectors will be held by the Portfolio in the future.
Global Infrastructure Portfolio
For the six-month period ended June 30, 2013, Select Dimensions – Global Infrastructure Portfolio Class X shares produced a total return of 5.29%, outperforming the Dow Jones Brookfield Global Infrastructure IndexSM (the "Index"),2 which returned 5.12%, and underperforming the S&P Global BMI Index,3 which
2 The Dow Jones Brookfield Global Infrastructure IndexSM is a float-adjusted market capitalization weighted index that measures the stock performance of companies that exhibit strong infrastructure characteristics. The Index intends to measure all sectors of the infrastructure market. The Index is unmanaged and its returns do not include any sales charges or fees. Such costs would lower performance. It is not possible to invest directly in an index.
3 The Standard & Poor's Global BMI Index (S&P Global BMI Index) is a broad market index designed to capture exposure to equities in all countries in the world that meet minimum size and liquidity requirements. As of the date of this Report, there are approximately 11,000 index members representing 26 developed and 20 emerging market countries. The Index is unmanaged and its returns do not include any sales charges or fees. Such costs would lower performance. It is not possible to invest directly in an index.
4
Morgan Stanley Select Dimensions Investment Series
Letter to the Shareholders n June 30, 2013 (unaudited) continued
returned 6.73%. For the same period, the Portfolio's Class Y shares returned 5.17%. Past performance is no guarantee of future results.
The performance of the Portfolio's two share classes varies because each has different expenses. The Portfolio's total returns assume the reinvestment of all distributions but do not reflect the deduction of any charges by your insurance company. Such costs would lower performance.
Infrastructure shares appreciated 5.12% during the first half of 2013, as measured by the Index, but underperformed global equities. Among the major infrastructure sectors, gas distribution utilities, gas midstream, and transmission and distribution exhibited relative outperformance, while pipeline companies, communications, toll roads, and European regulated utilities underperformed the Index.
Infrastructure performance was mixed in the first half of 2013, as strong sector performance through April gave way to a bout of selling toward the end of the reporting period, brought on predominantly by investor concerns over rising interest rates — in particular in the U.S. — and the perceived impact on valuation and company cost of capital. Investor rotation out of some of the perceived more defensive areas of infrastructure into more cyclically leveraged names may also have had some negative impact; however, we would note that flows into the infrastructure asset class overall remain relatively resilient.
Within the individual sectors, we view the relative outperformance of companies in the gas distribution, gas midstream, and transmission and distribution sectors as a combination of strong cash flow growth brought on by robust capital programs (gas distribution in China, gas midstream in Canada and the U.S., gas distribution in the U.S., in particular for those companies leveraged to liquefied natural gas export development), favorable rate case developments (select U.S. utility companies), and the resolution of dividend tax policy concerns (for U.S. utilities). We attribute the underperformance of pipeline companies to near-term concerns over valuation and company-specific events, the underperformance of communications to the potential for a slowdown in leasing for wireless towers in the U.S. as well as concerns over the impact of "sequestration" on U.S. government contracts for fixed satellite services operators, and the underperformance of European regulated utilities to regulatory interference and the prospects for reduced returns on capital brought on by ongoing rate cases or rate cases resolved in the quarter. Foreign currency trends had a large negative impact on toll roads during the first half, with sector performance largely in line with the overall infrastructure universe on a local currency basis.
At a high level, the dominant investor theme for infrastructure in the first half of 2013 was rising interest rates and their potential to negatively impact valuation. To generally address this, it is important to note that some companies and sectors within infrastructure will be affected more than others. It is also important
5
Morgan Stanley Select Dimensions Investment Series
Letter to the Shareholders n June 30, 2013 (unaudited) continued
to consider why rates are rising (i.e., if the economy is truly improving and improved operating fundamentals will offset rising rates). For many companies within the infrastructure universe, there is a self-correcting mechanism within the regulatory compact that will adjust for higher debt costs and rising interest rates such that the impact on a company is mitigated. Utilities or other regulatory asset based companies broadly fit within this category, as returns are adjusted through the rate case process. For example, in some U.S. jurisdictions such as California, the ability to pass through higher debt costs is formulaic and automatic if certain thresholds are met. For other companies that are not allowed higher returns on invested capital concurrent with rising interest rates, value should decline as rates rise, all else being equal.
While we understand that rising rates can have a negative near-term impact on certain companies within our portfolio, we continue to believe these companies reflect solid long-term investment value. Furthermore, despite the prospect for rising interest rates, we believe infrastructure as an asset class remains broadly appealing to public pension funds and other long-term institutional investors, with private market value continuing to exceed valuation levels in the public markets.
For the first half of 2013, the Portfolio realized favorable performance from bottom-up stock selection, partially offset by adverse top-down allocation. From a bottom-up perspective, the Portfolio benefited from stock selection in the gas distribution utilities, transmission and distribution, communications, and pipeline companies sectors, partially offset by unfavorable selection in the toll roads, gas midstream, and European regulated utilities sectors. From a top-down perspective, the Portfolio benefited from an overweight to the gas distribution utilities sector and an underweight to the European regulated utilities sector, but this was more than offset by adverse positioning in other sectors, most notably with the overweight to pipeline companies and the underweight to gas midstream.
We remain committed to our core investment philosophy as an infrastructure value investor. As value-oriented, bottom-up driven investors, our investment perspective is that over the medium- and long-term, the key factor in determining the performance of infrastructure securities will be underlying infrastructure asset values. Given the large and growing private infrastructure market, we believe that there are limits as to the level of premium or discount at which the public sector should trade relative to its underlying private infrastructure value. These limits can be viewed as the point at which the arbitrage opportunity between owning infrastructure in the private versus public markets becomes compelling. In aiming to achieve core infrastructure exposure in a cost effective manner, we invest in equity securities of publicly listed infrastructure companies we believe offer the best value relative to their underlying infrastructure value and Net Asset Value (NAV) growth prospects.
6
Morgan Stanley Select Dimensions Investment Series
Letter to the Shareholders n June 30, 2013 (unaudited) continued
Our research currently leads us to an overweighting in the Portfolio (amongst the largest sectors) to a group of companies in the pipeline companies, communications and toll roads sectors, and an underweighting to companies in the transmission and distribution, gas midstream, gas distribution utilities and European regulated utilities sectors. When compared to our year-end commentary, the primary changes from a sector perspective (resulting from shifts in company-specific investments) are a re-introduction of an overweight in the communications sector as well as a shift in gas distribution utilities from an overweight to an underweight, brought on primarily by the sale of outperforming Hong Kong-listed Chinese gas distribution utilities.
Looking forward, we continue to see good opportunities in sectors with secular growth themes, in particular energy infrastructure but also in communications. In addition, we believe we have a number of favorable company-specific positions across sectors with attractive total return prospects. These investments have been overlooked by the market during the first half of the year in large part, in our opinion, due to the short-term orientation of the market and a lack of near-term catalysts or the delay in catalyst realization. As long-term investors, we continue to see value in these companies and will wait patiently for these "value highlighting" opportunities to materialize.
There is no guarantee that any sectors mentioned will continue to perform as discussed above or that securities in such sectors will be held by the Portfolio in the future.
Growth Portfolio
For the six-month period ended June 30, 2013, Select Dimensions – Growth Portfolio Class X shares produced a total return of 11.81%, outperforming the Russell 1000® Growth Index (the "Index"),4 which returned 11.80% For the same period, the Portfolio's Class Y shares returned 11.70%. Past performance is no guarantee of future results.
The performance of the Portfolio's two share classes varies because each has different expenses. The Portfolio's total returns assume the reinvestment of all distributions but do not reflect the deduction of any charges by your insurance company. Such costs would lower performance.
The largest contributor to relative performance during the period was the financial services sector, as both stock selection and an overweight in the sector were beneficial. A credit card company was the most
4 The Russell 1000® Growth Index measures the performance of the large-cap growth segment of the U.S. equity universe. It includes those Russell 1000® Index companies with higher price-to-book ratios and higher forecasted growth values. The Russell 1000® Index is an index of approximately 1,000 of the largest U.S. securities based on a combination of market capitalization and current index membership. The Index is unmanaged and its returns do not include any sales charges or fees. Such costs would lower performance. It is not possible to invest directly in an index.
7
Morgan Stanley Select Dimensions Investment Series
Letter to the Shareholders n June 30, 2013 (unaudited) continued
additive holding in the sector. Stock selection in the consumer discretionary sector drove relative outperformance, led by a holding in an electric car and components manufacturer. Stock selection in the energy sector was also advantageous. Within the sector, a holding in a solar panel maker contributed the most to performance.
Conversely, the producer durables sector had a detrimental effect on relative performance. Only one of the Portfolio's holdings in the sector detracted from returns, and a lack of exposure to some of the better-performing producer durables stocks was disadvantageous as well. The Portfolio had no exposure to the utilities sector, which also diminished relative returns. An underweight to the health care sector hurt performance but was almost entirely offset by the positive contribution from stock selection in the sector.
There is no guarantee that any sectors mentioned will continue to perform as discussed above or that securities in such sectors will be held by the Portfolio in the future.
Focus Growth Portfolio
For the six-month period ended June 30, 2013, Select Dimensions – Focus Growth Portfolio Class X shares produced a total return of 12.28%, outperforming the Russell 1000® Growth Index (the "Index"),5 which returned 11.80%. For the same period, the Portfolio's Class Y shares returned 12.11%. Past performance is no guarantee of future results.
The performance of the Portfolio's two share classes varies because each has different expenses. The Portfolio's total returns assume the reinvestment of all distributions but do not reflect the deduction of any charges by your insurance company. Such costs would lower performance.
The consumer discretionary sector was the largest contributor to relative performance during the period. Stock selection was the primary driver of the sector's outperformance, with gains led by a holding in an electric car and components manufacturer. Stock selection in the energy sector was advantageous. Within the sector, a holding in a solar panel maker contributed the most to performance. An overweight to the financial services sector was beneficial to returns. A credit card company was the most additive holding in the sector.
Conversely, the producer durables sector had a detrimental effect on relative performance. Although the Portfolio's holdings in the sector did not actually detract from performance, relative performance was
5 The Russell 1000® Growth Index measures the performance of the large-cap growth segment of the U.S. equity universe. It includes those Russell 1000® Index companies with higher price-to-book ratios and higher forecasted growth values. The Russell 1000® Index is an index of approximately 1,000 of the largest U.S. securities based on a combination of market capitalization and current index membership. The Index is unmanaged and its returns do not include any sales charges or fees. Such costs would lower performance. It is not possible to invest directly in an index.
8
Morgan Stanley Select Dimensions Investment Series
Letter to the Shareholders n June 30, 2013 (unaudited) continued
hampered by a lack of exposure to some of the better-performing producer durables stocks. An underweight to the health care sector, which was moderately offset by relative gains from stock selection, hurt performance as well. No exposure to the utilities sector further diminished relative returns.
There is no guarantee that any sectors mentioned will continue to perform as discussed above or that securities in such sectors will be held by the Portfolio in the future.
Multi Cap Growth Portfolio
For the six-month period ended June 30, 2013, Select Dimensions – Multi Cap Growth Portfolio Class X shares produced a total return of 11.90%, underperforming the Russell 3000® Growth Index (the "Index"),6 which returned 12.23%. For the same period, the Portfolio's Class Y shares returned 11.72%. Past performance is no guarantee of future results.
The performance of the Portfolio's two share classes varies because each has different expenses. The Portfolio's total returns assume the reinvestment of all distributions but do not reflect the deduction of any charges by your insurance company. Such costs would lower performance.
The health care sector diminished relative performance, due to both stock selection and an underweight. A holding in a pharmaceuticals company was the main detractor. Stock selection and an underweight in the producer durables sector were unfavorable as well. Within the sector, underperformance was driven by a holding in a customer loyalty programs provider and a lack of exposure to other stronger-performing producer durables stocks. Stock selection in the financial services sector also dampened relative results, despite being moderately offset by a beneficial overweight in the sector. The Portfolio's only detractor in the financial services sector was a holding in an insurance and reinsurance company.
However, the technology sector was an area of relative strength, as strong stock selection more than offset the dampening effect of an overweight in the sector. A position in an internet search engine was the leading contributor in the sector. Stock selection in the energy sector also added to relative gains. A holding in a solar panel maker contributed the most to performance within the sector. Stock selection in the consumer discretionary sector boosted relative returns, with outperformance from exposure to an electric car and components manufacturer.
6 The Russell 3000® Growth Index measures the performance of the broad growth segment of the U.S. equity universe. It includes those Russell 3000® Index companies with higher price-to-book ratios and higher forecasted growth values. The Russell 3000® Index measures the performance of the largest 3000 U.S. companies representing approximately 98% of the investable U.S. equity market. The Index is unmanaged and its returns do not include any sales charges or fees. Such costs would lower performance. It is not possible to invest directly in an index.
9
Morgan Stanley Select Dimensions Investment Series
Letter to the Shareholders n June 30, 2013 (unaudited) continued
There is no guarantee that any sectors mentioned will continue to perform as discussed above or that securities in such sectors will be held by the Portfolio in the future.
Mid Cap Growth Portfolio
For the six-month period ended June 30, 2013, Select Dimensions – Mid Cap Growth Portfolio Class X shares produced a total return of 14.39%, underperforming the Russell Midcap® Growth Index (the "Index"),7 which returned 14.70%. For the same period, the Portfolio's Class Y shares returned 14.22%. Past performance is no guarantee of future results.
The performance of the Portfolio's two share classes varies because each has different expenses. The Portfolio's total returns assume the reinvestment of all distributions but do not reflect the deduction of any charges by your insurance company. Such costs would lower performance.
Stock selection in the producer durables sector was disadvantageous to relative results. Within the sector, a position in a product testing and certifications provider lagged the most. Stock selection in the health care sector dampened relative performance, with underperformance driven by a holding in health care insurance company. An underweight in the consumer discretionary sector also detracted from relative returns.
In contrast, the technology sector contributed positively to relative performance, as strong stock selection more than offset relative losses from an overweight in the sector. A professional networking web site was the Portfolio's most additive technology holding. Stock selection and an underweight in the materials and processing sector bolstered performance, led by a position in a specialty chemicals maker. Relative gains were also driven by stock selection in the consumer staples sector. A holding in a coffee and tea company led performance in the sector.
There is no guarantee that any sectors mentioned will continue to perform as discussed above or that securities in such sectors will be held by the Portfolio in the future.
7 The Russell Midcap® Growth Index measures the performance of the mid-cap growth segment of the U.S. equity universe. It includes those Russell Midcap® Index companies with higher price-to-book ratios and higher forecasted growth values. The Russell Midcap® Index is a subset of the Russell 1000® Index and includes approximately 800 of the smallest securities in the Russell 1000® Index, which in turn consists of approximately 1,000 of the largest U.S. securities based on a combination of market capitalization and current index membership. The Index is unmanaged and its returns do not include any sales charges or fees. Such costs would lower performance. It is not possible to invest directly in an index.
10
Morgan Stanley Select Dimensions Investment Series
Letter to the Shareholders n June 30, 2013 (unaudited) continued
We appreciate your ongoing support of Morgan Stanley Select Dimensions Investment Series and look forward to continuing to serve your investment needs.
Very truly yours,

Arthur Lev
President and Principal Executive Officer
11
Morgan Stanley Select Dimensions Investment Series
Letter to the Shareholders n June 30, 2013 (unaudited) continued
For More Information About Portfolio Holdings
Each Morgan Stanley fund provides a complete schedule of portfolio holdings in its semiannual and annual reports within 60 days of the end of the fund's second and fourth fiscal quarters. The semiannual reports and the annual reports are filed electronically with the Securities and Exchange Commission (SEC) on Form N-CSRS and Form N-CSR, respectively. Morgan Stanley also delivers the semiannual and annual reports to fund shareholders and makes these reports available on its public web site, www.morganstanley.com. Each Morgan Stanley fund also files a complete schedule of portfolio holdings with the SEC for the fund's first and third fiscal quarters on Form N-Q and monthly holdings for each money market fund on Form N-MFP. Morgan Stanley does not deliver these reports to shareholders, nor are the first and third fiscal quarter reports posted to the Morgan Stanley public web site. However, the holdings for each money market fund are posted to the Morgan Stanley public web site. You may obtain the Form N-Q filings (as well as the Form N-CSR, N-CSRS and N-MFP filings) by accessing the SEC's web site, http://www.sec.gov. You may also review and copy them at the SEC's public reference room in Washington, DC. Information on the operation of the SEC's public reference room may be obtained by calling the SEC at (800) SEC-0330. You can also request copies of these materials, upon payment of a duplicating fee, by electronic request at the SEC's e-mail address (publicinfo@sec.gov) or by writing the public reference section of the SEC, Washington, DC 20549-1520.
Proxy Voting Policy and Procedures and Proxy Voting Record
You may obtain a copy of the Portfolio's Proxy Voting Policy and Procedures without charge, upon request, by calling toll free (800) 869-NEWS or by visiting the Mutual Fund Center on our web site at www.morganstanley.com. It is also available on the SEC's web site at http://www.sec.gov.
You may obtain information regarding how the Portfolios voted proxies relating to portfolio securities during the most recent twelve-month period ended June 30 without charge by visiting the Mutual Fund Center on our web site at www.morganstanley.com. This information is also available on the SEC's web site at http://www.sec.gov.
12
Morgan Stanley Select Dimensions Investment Series
Fund Performance n June 30, 2013 (unaudited)
| Average Annual Total Returns—Period Ended June 30, 2013(1) | |
Class X | | 1 Year | | 5 Years | | 10 Years | | Since
Inception | | Gross Expense
Ratio | | Date of
Inception | |
Flexible Income | | | 6.17 | % | | | 5.48 | % | | | 4.36 | % | | | 4.18 | % | | | 1.09 | % | | 11/9/1994 | |
Focus Growth | | | 15.66 | | | | 6.86 | | | | 8.21 | | | | 9.37 | | | | 0.80 | | | 11/9/1994 | |
Global Infrastructure | | | 16.42 | | | | 5.07 | | | | 10.60 | | | | 9.65 | | | | 1.11 | | | 11/9/1994 | |
Growth | | | 15.80 | | | | 7.69 | | | | 8.77 | | | | 7.50 | | | | 1.08 | | | 11/9/1994 | |
Mid Cap Growth | | | 16.69 | | | | 7.20 | | | | 11.77 | | | | 10.33 | | | | 1.02 | | | 11/9/1994 | |
Money Market | | | 0.01 | | | | 0.18 | | | | 1.57 | | | | 2.90 | | | | 0.65 | | | 11/9/1994 | |
Multi Cap Growth | | | 14.06 | | | | 6.06 | | | | 11.40 | | | | 4.64 | | | | 1.38 | | | 1/21/1997 | |
Performance data quoted represents past performance, which is no guarantee of future results and current performance may be lower or higher than the figures shown. For most recent month-end performance figures, please contact the issuing insurance company or speak with your Financial Advisor. Investment return and principal value will fluctuate. When you sell Portfolio shares, they may be worth less than their original cost. Total returns do not reflect the deduction of taxes that a shareholder would pay on Portfolio distributions or the redemption of Portfolio shares. Performance for Class Y shares will vary from the performance of Class X shares due to differences in expenses. Expenses are as of each Portfolio's fiscal year end as outlined in the Portfolio's current prospectus.
(1) Figure assumes reinvestment of all distributions for the underlying fund based on net asset value (NAV). It does not reflect the deduction of insurance expenses, an annual contract maintenance fee, or surrender charges. If performance information included the effect of these additional charges, the total returns would be lower.
13
Morgan Stanley Select Dimensions Investment Series
Fund Performance n June 30, 2013 (unaudited) continued
| Average Annual Total Returns—Period Ended June 30, 2013(1) | |
Class Y | | 1 Year | | 5 Years | | 10 Years | | Since
Inception | | Gross Expense
Ratio | | Date of
Inception | |
Flexible Income | | | 5.86 | % | | | 5.23 | % | | | 4.10 | % | | | 3.64 | % | | | 1.34 | % | | 7/24/2000 | |
Focus Growth | | | 15.34 | | | | 6.59 | | | | 7.94 | | | | 1.48 | | | | 1.05 | | | 7/24/2000 | |
Global Infrastructure | | | 16.11 | | | | 4.80 | | | | 10.32 | | | | 3.92 | | | | 1.36 | | | 7/24/2000 | |
Growth | | | 15.50 | | | | 7.42 | | | | 8.50 | | | | 1.77 | | | | 1.33 | | | 7/24/2000 | |
Mid Cap Growth | | | 16.36 | | | | 6.93 | | | | 11.49 | | | | 3.80 | | | | 1.27 | | | 7/24/2000 | |
Money Market | | | 0.01 | | | | 0.15 | | | | 1.43 | | | | 1.68 | | | | 0.90 | | | 7/24/2000 | |
Multi Cap Growth | | | 13.79 | | | | 5.79 | | | | 11.12 | | | | -2.12 | | | | 1.63 | | | 7/24/2000 | |
Performance data quoted represents past performance, which is no guarantee of future results and current performance may be lower or higher than the figures shown. For most recent month-end performance figures, please contact the issuing insurance company or speak with your Financial Advisor. Investment return and principal value will fluctuate. When you sell Portfolio shares, they may be worth less than their original cost. Total returns do not reflect the deduction of taxes that a shareholder would pay on Portfolio distributions or the redemption of Portfolio shares. Performance for Class Y shares will vary from the performance of Class X shares due to differences in expenses. Expenses are as of each Portfolio's fiscal year end as outlined in the Portfolio's current prospectus.
(1) Figure assumes reinvestment of all distributions for the underlying fund based on net asset value (NAV). It does not reflect the deduction of insurance expenses, an annual contract maintenance fee, or surrender charges. If performance information included the effect of these additional charges, the total returns would be lower.
14
Morgan Stanley Select Dimensions Investment Series
Expense Examples n June 30, 2013 (unaudited)
As a shareholder of the Portfolio, you incur two types of costs: (1) insurance company charges; and (2) ongoing costs, including advisory fees; administration fees; distribution and services (12b-1) fees; and other Portfolio expenses. These examples are intended to help you understand your ongoing costs (in dollars) of investing in the Portfolio and to compare these costs with the ongoing costs of investing in other mutual funds.
These examples are based on an investment of $1,000 invested at the beginning of the period and held for the entire period 01/01/13 – 06/30/13.
Actual Expenses
The first line of the table below provides information about actual account values and actual expenses. You may use the information in this line, together with the amount you invested, to estimate the expenses that you paid over the period. Simply divide your account value by $1,000 (for example, an $8,600 account value divided by $1,000 = 8.6), then multiply the result by the number in the first line under the heading entitled "Expenses Paid During Period" to estimate the expenses you paid on your account during this period.
Hypothetical Example for Comparison Purposes
The second line of the table below provides information about hypothetical expenses based on the Portfolio's actual expense ratio and an assumed rate of return of 5% per year before expenses, which is not the Portfolio's actual return. The hypothetical account values and expenses may not be used to estimate the actual ending account balance or expenses you paid for the period. You may use this information to compare the ongoing cost of investing in the Portfolio and other funds. To do so, compare this 5% hypothetical example with the 5% hypothetical examples that appear in the shareholder reports of the other funds.
Please note that the expenses shown in the table are meant to highlight your ongoing costs only and do not reflect any insurance company charges. Therefore, the second line of the table is useful in comparing ongoing costs, and will not help you determine the relative total cost of owning different funds. In addition, if these insurance company charges were included, your costs would have been higher.
15
Morgan Stanley Select Dimensions Investment Series
Expense Examples n June 30, 2013 (unaudited) continued
Money Market
| | | Beginning
Account Value | | Ending
Account Value | | Expenses Paid
During Period@ | |
| | | 01/01/13 | | 06/30/13 | | 01/01/13 –
06/30/13 | |
Class X | |
| Actual (0.00% return) | | $ | 1,000.00 | | | $ | 1,000.05 | | | $ | 1.03 | | |
| Hypothetical (5% annual return before expenses) | | $ | 1,000.00 | | | $ | 1,023.49 | | | $ | 1.04 | | |
Class Y | |
| Actual (0.00% return) | | $ | 1,000.00 | | | $ | 1,000.05 | | | $ | 1.03 | | |
| Hypothetical (5% annual return before expenses) | | $ | 1,000.00 | | | $ | 1,023.49 | | | $ | 1.04 | | |
@ Expenses are equal to the Portfolio's annualized expense ratios of 0.21% and 0.21% for Class X and Class Y shares, respectively, multiplied by the average account value over the period, multiplied by 179@@/365 (to reflect the one-half year period). If the Portfolio had borne all of its expenses, the annualized expense ratios would have been 0.70% and 0.95% for Class X and Class Y shares, respectively.
@@ Adjusted to reflect non-business day accruals.
Flexible Income
| | | Beginning
Account Value | | Ending
Account Value | | Expenses Paid
During Period@ | |
| | | 01/01/13 | | 06/30/13 | | 01/01/13 –
06/30/13 | |
Class X | |
| Actual (-0.62% return) | | $ | 1,000.00 | | | $ | 993.80 | | | $ | 7.81 | | |
| Hypothetical (5% annual return before expenses) | | $ | 1,000.00 | | | $ | 1,016.96 | | | $ | 7.90 | | |
Class Y | |
| Actual (-0.78% return) | | $ | 1,000.00 | | | $ | 992.20 | | | $ | 9.04 | | |
| Hypothetical (5% annual return before expenses) | | $ | 1,000.00 | | | $ | 1,015.72 | | | $ | 9.15 | | |
@ Expenses are equal to the Portfolio's annualized expense ratios of 1.58% and 1.83% for Class X and Class Y shares, respectively, multiplied by the average account value over the period, multiplied by 181/365 (to reflect the one-half year period).
Global Infrastructure
| | | Beginning
Account Value | | Ending
Account Value | | Expenses Paid
During Period@ | |
| | | 01/01/13 | | 06/30/13 | | 01/01/13 –
06/30/13 | |
Class X | |
| Actual (5.29% return) | | $ | 1,000.00 | | | $ | 1,052.90 | | | $ | 5.85 | | |
| Hypothetical (5% annual return before expenses) | | $ | 1,000.00 | | | $ | 1,019.09 | | | $ | 5.76 | | |
Class Y | |
| Actual (5.17% return) | | $ | 1,000.00 | | | $ | 1,051.70 | | | $ | 7.12 | | |
| Hypothetical (5% annual return before expenses) | | $ | 1,000.00 | | | $ | 1,017.85 | | | $ | 7.00 | | |
@ Expenses are equal to the Portfolio's annualized expense ratios of 1.15% and 1.40% for Class X and Class Y shares, respectively, multiplied by the average account value over the period, multiplied by 181/365 (to reflect the one-half year period).
16
Morgan Stanley Select Dimensions Investment Series
Expense Examples n June 30, 2013 (unaudited) continued
Growth
| | | Beginning
Account Value | | Ending
Account Value | | Expenses Paid
During Period@ | |
| | | 01/01/13 | | 06/30/13 | | 01/01/13 –
06/30/13 | |
Class X | |
| Actual (11.81% return) | | $ | 1,000.00 | | | $ | 1,118.10 | | | $ | 6.77 | | |
| Hypothetical (5% annual return before expenses) | | $ | 1,000.00 | | | $ | 1,018.40 | | | $ | 6.46 | | |
Class Y | |
| Actual (11.70% return) | | $ | 1,000.00 | | | $ | 1,117.00 | | | $ | 8.08 | | |
| Hypothetical (5% annual return before expenses) | | $ | 1,000.00 | | | $ | 1,017.16 | | | $ | 7.70 | | |
@ Expenses are equal to the Portfolio's annualized expense ratios of 1.29% and 1.54% for Class X and Class Y shares, respectively, multiplied by the average account value over the period, multiplied by 181/365 (to reflect the one-half year period).
Focus Growth
| | | Beginning
Account Value | | Ending
Account Value | | Expenses Paid
During Period@ | |
| | | 01/01/13 | | 06/30/13 | | 01/01/13 –
06/30/13 | |
Class X | |
| Actual (12.28% return) | | $ | 1,000.00 | | | $ | 1,122.80 | | | $ | 4.00 | | |
| Hypothetical (5% annual return before expenses) | | $ | 1,000.00 | | | $ | 1,021.03 | | | $ | 3.81 | | |
Class Y | |
| Actual (12.11% return) | | $ | 1,000.00 | | | $ | 1,121.10 | | | $ | 5.31 | | |
| Hypothetical (5% annual return before expenses) | | $ | 1,000.00 | | | $ | 1,019.79 | | | $ | 5.06 | | |
@ Expenses are equal to the Portfolio's annualized expense ratios of 0.76% and 1.01% for Class X and Class Y shares, respectively, multiplied by the average account value over the period, multiplied by 181/365 (to reflect the one-half year period).
Multi Cap Growth
| | | Beginning
Account Value | | Ending
Account Value | | Expenses Paid
During Period@ | |
| | | 01/01/13 | | 06/30/13 | | 01/01/13 –
06/30/13 | |
Class X | |
| Actual (11.90% return) | | $ | 1,000.00 | | | $ | 1,119.00 | | | $ | 9.19 | | |
| Hypothetical (5% annual return before expenses) | | $ | 1,000.00 | | | $ | 1,016.12 | | | $ | 8.75 | | |
Class Y | |
| Actual (11.72% return) | | $ | 1,000.00 | | | $ | 1,117.20 | | | $ | 10.50 | | |
| Hypothetical (5% annual return before expenses) | | $ | 1,000.00 | | | $ | 1,014.88 | | | $ | 9.99 | | |
@ Expenses are equal to the Portfolio's annualized expense ratios of 1.75% and 2.00% for Class X and Class Y shares, respectively, multiplied by the average account value over the period, multiplied by 181/365 (to reflect the one-half year period).
17
Morgan Stanley Select Dimensions Investment Series
Expense Examples n June 30, 2013 (unaudited) continued
Mid Cap Growth
| | | Beginning
Account Value | | Ending
Account Value | | Expenses Paid
During Period@ | |
| | | 01/01/13 | | 06/30/13 | | 01/01/13 –
06/30/13 | |
Class X | |
| Actual (14.39% return) | | $ | 1,000.00 | | | $ | 1,143.90 | | | $ | 5.26 | | |
| Hypothetical (5% annual return before expenses) | | $ | 1,000.00 | | | $ | 1,019.89 | | | $ | 4.96 | | |
Class Y | |
| Actual (14.22% return) | | $ | 1,000.00 | | | $ | 1,142.20 | | | $ | 6.59 | | |
| Hypothetical (5% annual return before expenses) | | $ | 1,000.00 | | | $ | 1,018.65 | | | $ | 6.21 | | |
@ Expenses are equal to the Portfolio's annualized expense ratios of 0.99% and 1.24% for Class X and Class Y shares, respectively, multiplied by the average account value over the period, multiplied by 181/365 (to reflect the one-half year period).
18
Morgan Stanley Select Dimensions Investment Series
Investment Advisory Agreement Approval n June 30, 2013 (unaudited)
Nature, Extent and Quality of Services
The Board reviewed and considered the nature and extent of the investment advisory services provided by the Investment Adviser (as defined herein) under the advisory agreement, including portfolio management, investment research and equity and fixed income securities trading. The Board reviewed similar information and factors regarding the Sub-Advisers (as defined herein), to the extent applicable. The Board also reviewed and considered the nature and extent of the non-advisory, administrative services provided by the Administrator (as defined herein) under the administration agreement, including accounting, clerical, bookkeeping, compliance, business management and planning, and the provision of supplies, office space and utilities at the Investment Adviser's expense. (The Investment Adviser, Sub-Advisers and Administrator together are referred to as the "Adviser" and the advisory, sub-advisory and administration agreements together are referred to as the "Management Agreement.") The Board also compared the nature of the services provided by the Adviser with similar services provided by non-affiliated advisers as reported to the Board by Lipper, Inc. ("Lipper").
The Board reviewed and considered the qualifications of the portfolio managers, the senior administrative managers and other key personnel of the Adviser who provide the administrative and advisory services to the Portfolios. The Board determined that the Adviser's portfolio managers and key personnel are well qualified by education and/or training and experience to perform the services in an efficient and professional manner. The Board concluded that the nature and extent of the advisory and administrative services provided were necessary and appropriate for the conduct of the business and investment activities of the Portfolios and supported its decision to approve the Management Agreement.
Performance, Fees and Expenses of the Portfolios
The Board reviewed the performance, fees and expenses of the Portfolios compared to their peers, as determined by Lipper, and to appropriate benchmarks where applicable. The Board discussed with the Adviser the performance goals and the actual results achieved in managing the Portfolios. When considering a fund's performance, the Board and the Adviser place emphasis on trends and longer-term returns (focusing on one-year, three-year and five-year performance, as of December 31, 2012, or since inception, as applicable). When a fund underperforms its benchmark and/or its peer group average, they discuss the causes of such underperformance and, where necessary, they discuss specific changes to investment strategy or investment personnel.
Performance
The Board noted that the performance of the Money Market and Flexible Income Portfolios was better than the peer group averages for the one- and three-year periods but below the peer group averages for the five-year period.
19
Morgan Stanley Select Dimensions Investment Series
Investment Advisory Agreement Approval n June 30, 2013 (unaudited) continued
The Board noted that the performance of the Global Infrastructure Portfolio was better than its peer group average for the one-, three- and five-year periods.
The Board noted that the performance of the Growth and Focus Growth Portfolios was better than the peer group averages for the three- and five-year periods but below the peer group averages for the one-year period.
The Board noted that the performance of the Multi Cap Growth and Mid Cap Growth Portfolios was better than the peer group averages for the five-year period but below the peer group averages for the one- and three-year periods.
Performance Conclusions
With respect to the Money Market, Mid Cap Growth and Multi Cap Growth Portfolios, after discussion, the Board concluded that performance was acceptable.
With respect to the Growth, Focus Growth, Flexible Income and Global Infrastructure Portfolios, after discussion, the Board concluded that performance was competitive with the peer group averages.
Fees and Expenses
The Board members discussed with the Adviser the level of the advisory and administration fees (together, the "management fee") for the Portfolios relative to comparable funds and/or other accounts advised by the Adviser and/or compared to their peers as determined by Lipper. In addition to the management fee, the Board also reviewed the Portfolios' total expense ratios. When a fund's management fee and/or its total expense ratio are higher than its peers, the Board and the Adviser discuss the reasons for this and, where appropriate, they discuss possible waivers and/or caps.
The Board noted that the management fees and total expense ratios for the Money Market, Focus Growth, Growth and Mid Cap Growth Portfolios were lower than the peer group averages.
The Board noted for the Flexible Income Portfolio that while the management fee was lower than its peer group average, the total expense ratio was higher than its peer group average.
The Board noted for the Global Infrastructure Portfolio that while the management fee was lower than its peer group average, the total expense ratio was higher but close to its peer group average.
The Board noted for the Multi Cap Growth Portfolio that the management fee and total expense ratio were higher than its peer group averages.
20
Morgan Stanley Select Dimensions Investment Series
Investment Advisory Agreement Approval n June 30, 2013 (unaudited) continued
Fee and Expense Conclusions
With respect to the Money Market, Global Infrastructure, Growth, Focus Growth and Mid Cap Growth Portfolios, after discussion, the Board concluded that the management fees and total expense ratios were competitive with the peer group averages.
With respect to the Flexible Income Portfolio, after discussion, the Board concluded that the management fee was competitive with its peer group average and the total expense ratio was acceptable.
With respect to the Multi Cap Growth Portfolio, after discussion, the Board concluded that the management fee and total expense ratio were acceptable.
Economies of Scale
The Board considered the size and growth prospects of the Portfolios and how that relates to the Portfolios' total expense ratios and particularly the Portfolios' management fee rates (which, for all the Portfolios except Flexible Income, include one or more breakpoints). In conjunction with its review of the Adviser's profitability, the Board discussed with the Adviser how a change in assets can affect the efficiency or effectiveness of managing the Portfolios and whether the management fee level is appropriate relative to current and projected asset levels and/or whether the management fee structure reflects economies of scale as asset levels change. The Board has determined that its review of the actual and potential economies of scale of each Portfolio supports its decision to approve the Management Agreement.
Profitability of the Adviser and Affiliates
The Board considered information concerning the costs incurred and profits realized by the Adviser and its affiliates during the last year from their relationship with the Portfolios and during the last two years from their relationship with the Morgan Stanley Fund Complex and reviewed with the Adviser the cost allocation methodology used to determine the profitability of the Adviser and affiliates. The Board has determined that its review of the analysis of the Adviser's expenses and profitability supports its decision to approve the Management Agreement.
Other Benefits of the Relationship
The Board considered other benefits to the Adviser and its affiliates derived from their relationship with the Portfolios and other funds advised by the Adviser. These benefits may include, among other things, "float" benefits derived from handling of checks for purchases and sales, research received by the Adviser generated from commission dollars spent on funds' portfolio trading and fees for distribution and/or shareholder servicing. The Board reviewed with the Adviser each of these arrangements and the reasonableness of the Adviser's costs relative to the services performed.
21
Morgan Stanley Select Dimensions Investment Series
Investment Advisory Agreement Approval n June 30, 2013 (unaudited) continued
The Board has determined that its review of the other benefits received by the Adviser or its affiliates supports its decision to approve the Management Agreement.
Resources of the Adviser and Historical Relationship Between the Portfolios and the Adviser
The Board considered whether the Adviser is financially sound and has the resources necessary to perform its obligations under the Management Agreement. The Board also reviewed and considered the historical relationship between the Portfolios and the Adviser, including the organizational structure of the Adviser, the policies and procedures formulated and adopted by the Adviser for managing the Portfolios' operations and the Board's confidence in the competence and integrity of the senior managers and key personnel of the Adviser. The Board concluded that the Adviser has the financial resources necessary to fulfill its obligations under the Management Agreement and that it is beneficial for the Portfolios to continue their relationship with the Adviser.
Other Factors and Current Trends
The Board considered the controls and procedures adopted and implemented by the Adviser and monitored by the Fund's Chief Compliance Officer and concluded that the conduct of business by the Adviser indicates a good faith effort on its part to adhere to high ethical standards in the conduct of the Fund's business.
General Conclusion
After considering and weighing all of the above factors, the Board concluded that it would be in the best interest of each Portfolio and its shareholders to approve renewal of the Management Agreement for another year. In reaching this conclusion the Board did not give particular weight to any single factor referenced above. The Board considered these factors over the course of numerous meetings, some of which were in executive session with only the independent Board members and their counsel present. It is possible that individual Board members may have weighed these factors differently in reaching their individual decisions to approve the Management Agreement.
22
Money Market
Portfolio of Investments n June 30, 2013 (unaudited)
PRINCIPAL
AMOUNT
(000) | |
| | ANNUALIZED
YIELD
ON DATE OF
PURCHASE | |
| |
MATURITY
DATE | |
VALUE | |
| | | Repurchase Agreements (43.6%) | |
$ | 500 | | | Bank of Montreal, (dated 06/12/13;
proceeds $500,038; fully collateralized
by U.S. Government Agencies;
Federal Home Loan Mortgage
Corporation 4.00% due 05/01/25;
Federal National Mortgage Association
3.00% - 4.00% due 08/01/27 - 06/01/43;
and by a U.S. Government Obligation;
U.S. Treasury Note 1.00% due 10/31/16;
valued at $510,252) (Demand 07/05/13) | | | 0.09 | (a)% | | | | | | 07/12/13 | | $ | 500,000 | | |
| | 1,000 | | | BNP Paribas Securities Corp.,
(dated 06/03/13; proceeds $1,000,230;
fully collateralized by U.S. Government
Agencies; Government National Mortgage
Association 1.63% - 4.00% due 07/20/33 -
09/20/41; valued at $1,030,000)
(Demand 07/05/13) | | | 0.09 | (a) | | | | | | 09/03/13 | | | 1,000,000 | | |
| | 1,000 | | | BNP Paribas Securities Corp.,
(dated 06/05/13; proceeds $1,000,295;
fully collateralized by U.S. Government
Agencies; Government National Mortgage
Association 1.63% - 4.50% due 03/20/32 -
06/20/41; valued at $1,030,000)
(Demand 07/05/13) | | | 0.09 | (a) | | | | | | 10/01/13 | | | 1,000,000 | | |
| | 8,144 | | | BNP Paribas Securities Corp.,
(dated 06/28/13; proceeds $8,144,102;
fully collateralized by U.S. Government
Agencies; Government National Mortgage
Association 3.49% - 6.50% due 07/15/18 -
10/20/42; valued at $8,388,320) | | | 0.15 | | | | | | | 07/01/13 | | | 8,144,000 | | |
| | 1,000 | | | BNP Paribas Securities Corp.,
(dated 02/20/13; proceeds $1,000,704;
fully collateralized by U.S. Government
Agencies; Government National Mortgage
Association 1.63% - 5.00% due 12/20/22 -
07/20/41; valued at $1,030,000)
(Demand 07/05/13) | | | 0.17 | (a) | | | | | | 07/19/13 | | | 1,000,000 | | |
See Notes to Financial Statements
23
Money Market
Portfolio of Investments n June 30, 2013 (unaudited) continued
PRINCIPAL
AMOUNT
(000) | |
| | ANNUALIZED
YIELD
ON DATE OF
PURCHASE | |
| |
MATURITY
DATE | |
VALUE | |
$ | 1,000 | | | BNP Paribas Securities Corp.,
(dated 01/08/13; proceeds $1,000,905;
fully collateralized by U.S. Government
Agencies; Government National Mortgage
Association 1.63% - 4.00% due 05/20/34 -
06/20/41; valued at $1,030,000)
(Demand 07/05/13) | | | 0.18 | (a)% | | | | | | 07/08/13 | | $ | 1,000,000 | | |
| | 5,000 | | | ING Financial Markets LLC, (dated 06/28/13;
proceeds $5,000,067; fully collateralized by
U.S. Government Agencies; Federal National
Mortgage Association 2.61% - 2.68%
due 04/01/38 - 05/01/42; valued
at $5,142,435) | | | 0.16 | | | | | | | 07/01/13 | | | 5,000,000 | | |
| | 1,000 | | | Merrill Lynch Pierce Fenner & Smith,
(dated 04/10/13; proceeds $1,000,303;
fully collateralized by a U.S. Government
Obligation; U.S. Treasury Note 0.13%
due 12/31/13; valued at $1,020,049)
(Demand 07/05/13) | | | 0.12 | (a) | | | | | | 07/10/13 | | | 1,000,000 | | |
| | 500 | | | Merrill Lynch Pierce Fenner & Smith,
(dated 04/10/13; proceeds $500,276;
fully collateralized by a U.S. Government
Obligation; U.S. Treasury Bill Zero Coupon
due 07/05/13; valued at $510,098)
(Demand 07/05/13) | | | 0.16 | (a) | | | | | | 08/12/13 | | | 500,000 | | |
| | 3,000 | | | Merrill Lynch Pierce Fenner & Smith,
(dated 03/01/13; proceeds $3,003,100;
fully collateralized by a U.S. Government
Obligation; U.S. Treasury Bill Zero Coupon
due 07/05/13; valued at $3,060,088)
(Demand 07/05/13) | | | 0.20 | (a) | | | | | | 09/03/13 | | | 3,000,000 | | |
| | 5,000 | | | Mizuho Securities USA, Inc., (dated 06/28/13;
proceeds $5,000,063; fully collateralized
by a U.S. Government Agency; Government
National Mortgage Association 4.50%
due 09/20/41; valued
at $5,178,248) | | | 0.15 | | | | | | | 07/01/13 | | | 5,000,000 | | |
| | | | | Total Repurchase Agreements
(Cost $27,144,000) | | | | | | | | | 27,144,000 | | |
See Notes to Financial Statements
24
Money Market
Portfolio of Investments n June 30, 2013 (unaudited) continued
PRINCIPAL
AMOUNT
(000) | |
| |
COUPON
RATE(a) | |
DEMAND
DATE(b) | |
MATURITY
DATE | |
VALUE | |
| | | Floating Rate Notes (18.8%) | |
| | | International Banks | |
$ | 500 | | | ASB Finance Ltd. (c) | | | 0.30 | % | | 07/03/13 | | 01/03/14 | | $ | 500,000 | | |
| | 1,000 | | | Bank of Nova Scotia | | | 0.33 | | | 07/02/13 | | 07/02/13 | | | 1,000,000 | | |
| | 300 | | | BNZ International Funding Ltd. | | | 0.29 | | | 09/06/13 | | 12/06/13 | | | 300,000 | | |
| | 250 | | | BNZ International Funding
Ltd. (c) | | | 0.29 | | | 09/09/13 | | 12/09/13 | | | 250,000 | | |
| | 2,600 | | | National Australia Bank | | | 0.27 - 0.28 | | | 07/11/13 - 08/09/13 | | 08/09/13 - 10/11/13 | | | 2,600,000 | | |
| | 1,500 | | | Rabobank Nederland NY | | | 0.33 | | | 09/24/13 | | 03/24/14 | | | 1,500,000 | | |
| | 1,000 | | | Royal Bank of Canada | | | 0.33 | | | 07/11/13 | | 07/11/13 | | | 1,000,000 | | |
| | 2,510 | | | Toronto Dominion Bank | | | 0.27 - 0.28 | | | 07/19/13 - 09/13/13 | | 07/26/13 - 10/21/13 | | | 2,510,000 | | |
| | 1,000 | | | Westpac Banking Corp. (c) | | | 0.27 | | | 08/27/13 | | 08/27/13 | | | 999,993 | | |
| | 1,000 | | | Westpac Banking Corp. | | | 0.28 | | | 07/09/13 | | 10/09/13 | | | 1,000,000 | | |
| | | | | Total Floating Rate Notes
(Cost $11,659,993) | | | | | | | | | 11,659,993 | | |
| |
| |
| |
ANNUALIZED
YIELD
ON DATE OF
PURCHASE | |
| |
| |
| | | Certificates of Deposit (12.9%) | |
| | | Domestic Bank (3.2%) | |
| | 2,000 | | | Branch Banking & Trust Co. | | | | | | | 0.10 | % | | 07/02/13 | | | 2,000,000 | | |
| | | International Banks (9.7%) | |
| | 2,000 | | | Bank of Montreal | | | | | | | 0.13 | | | 07/05/13 | | | 2,000,000 | | |
| | 700 | | | Credit Suisse NY | | | | | | | 0.25 | | | 07/31/13 | | | 700,000 | | |
| | 1,600 | | | Deutsche Bank AG | | | | | | | 0.35 - 0.37 | | | 10/30/13 - 11/26/13 | | | 1,600,000 | | |
| | 700 | | | Skandin Ens Banken AB | | | | | | | 0.30 | | | 11/07/13 | | | 699,987 | | |
| | 500 | | | Sumitomo Mitsui Banking Corp. | | | | | | | 0.23 | | | 09/10/13 | | | 500,000 | | |
| | 500 | | | Toronto Dominion Bank | | | | | | | 0.15 | | | 07/15/13 | | | 500,000 | | |
| | | | 5,999,987 | | |
| | | | | Total Certificates of Deposit
(Cost $7,999,987) | | | | | | | | | 7,999,987 | | |
| | | Commercial Paper (12.6%) | |
| | | International Banks | |
| | 500 | | | KFW International Finance, Inc. (c) | | | | | | | 0.20 | | | 07/10/13 | | | 499,969 | | |
| | 1,900 | | | Mizuho Funding LLC (c) | | | | | | | 0.24 - 0.25 | | | 07/12/13 - 07/19/13 | | | 1,899,808 | | |
| | 1,000 | | | NRW Bank | | | | | | | 0.11 | | | 07/02/13 | | | 999,991 | | |
| | 1,150 | | | Oversea Chinese Banking Corporation | | | | | | | 0.22 - 0.27 | | | 07/22/13 - 10/04/13 | | | 1,149,403 | | |
See Notes to Financial Statements
25
Money Market
Portfolio of Investments n June 30, 2013 (unaudited) continued
PRINCIPAL
AMOUNT
(000) | |
| | ANNUALIZED
YIELD
ON DATE OF
PURCHASE | |
| |
MATURITY
DATE | |
VALUE | |
$ | 1,400 | | | Skandin Ens Banken AB (c) | | | 0.31 | % | | | | | | 11/01/13 | | $ | 1,398,542 | | |
| | 1,000 | | | Sumitomo Mitsui Banking Corp. | | | 0.24 | | | | | | | 08/27/13 | | | 999,607 | | |
| | 400 | | | Svenska Handelsbanken AB (c) | | | 0.25 | | | | | | | 07/05/13 | | | 399,983 | | |
| | 500 | | | UOB Funding LLC | | | 0.22 | | | | | | | 07/10/13 - 07/16/13 | | | 499,959 | | |
| | | | | Total Commercial Paper
(Cost $7,847,262) | | | | | | | | | 7,847,262 | | |
| |
| |
COUPON
RATE(a) | |
DEMAND
DATE(b) | |
| |
| |
| | | Extendible Floating Rate Notes (9.6%) | |
| | | Domestic Banks (5.2%) | |
| | 1,500 | | | JP Morgan Chase Bank NA
(Extendible Maturity
Date 07/07/14) | | | 0.35 | % | | 09/07/13 | | 03/07/19 | | | 1,500,000 | | |
| | 1,750 | | | Wells Fargo Bank NA
(Extendible Maturity
Date 07/14/14 - 07/18/14) | | | 0.32 - 0.33 | | | 07/22/13 - 09/15/13 | | 03/20/19 - 07/15/19 | | | 1,750,000 | | |
| | | | 3,250,000 | | |
| | | International Banks (4.4%) | | | | | |
| | 750 | | | Bank of Nova Scotia
(Extendible Maturity
Date 07/30/14) | | | 0.34 | | | 07/30/13 | | 01/31/19 | | | 750,000 | | |
| | 1,000 | | | Royal Bank of Canada
(Extendible Maturity
Date 07/01/14) | | | 0.37 | | | 07/01/13 | | 04/01/19 | | | 999,924 | | |
| | 1,000 | | | Svenska Handelsbanken AB (c)
(Extendible Maturity
Date 12/13/13) | | | 0.28 | | | 07/15/13 | | 05/13/16 | | | 1,000,000 | | |
| | | | 2,749,924 | | |
| | | | | Total Extendible Floating Rate Notes
(Cost $5,999,924) | | | | | | | | | 5,999,924 | | |
See Notes to Financial Statements
26
Money Market
Portfolio of Investments n June 30, 2013 (unaudited) continued
PRINCIPAL
AMOUNT
(000) | |
| |
COUPON
RATE(a) | |
DEMAND
DATE(b) | |
MATURITY
DATE | |
VALUE | |
| | | Tax-Exempt Instrument (3.2%) | |
| | | Weekly Variable Rate Bond | |
$ | 2,000 | | | Miami-Dade County, FL,
Professional Sports Franchise
Facilities Tax Ser 2009 E
(Cost $2,000,000) | | | 0.06 | % | | 07/05/13 | | 10/01/48 | | $ | 2,000,000 | | |
| | | Total Investments
(Cost $62,651,166) | | | | | | | 100.7 | % | | | 62,651,166 | | |
| | | Liabilities in Excess of Other Assets | | | | | | | (0.7 | ) | | | (465,219 | ) | |
| | | Net Assets | | | | | | | 100.0 | % | | $ | 62,185,947 | | |
(a) Rate shown is the rate in effect at June 30, 2013.
(b) Date of next interest rate reset.
(c) 144A security — Certain conditions for public sale may exist. Unless otherwise noted, these securities are deemed to be liquid.
MATURITY SCHEDULE†
| 1 - 30 Days | | | 76.3 | % | |
| 31 - 60 Days | | | 7.6 | | |
| 61 - 90 Days | | | 9.0 | | |
| 91 - 120 Days | | | 1.2 | | |
| 121 + Days | | | 5.9 | | |
| | | 100.0 | % | |
† As a percentage of total investments.
See Notes to Financial Statements
27
Flexible Income
Portfolio of Investments n June 30, 2013 (unaudited)
PRINCIPAL
AMOUNT
(000) | |
| | COUPON
RATE | | MATURITY
DATE | | VALUE | |
| | | Corporate Bonds (61.1%) | |
| | | Australia (1.1%) | |
| | | Basic Materials | |
$ | 35 | | | FMG Resources August 2006 Pty Ltd. (a) | | | 6.375 | % | | 02/01/16 | | $ | 35,000 | | |
| | 100 | | | FMG Resources August 2006 Pty Ltd. (a) | | | 6.875 | | | 02/01/18 | | | 99,125 | | |
| | | | | | 134,125 | | |
| | | Consumer, Cyclical | |
| | 35 | | | Wesfarmers Ltd. (a) | | | 2.983 | | | 05/18/16 | | | 36,435 | | |
| | | Finance | |
| | 50 | | | Dexus Diversified Trust/Dexus Office Trust (a) | | | 5.60 | | | 03/15/21 | | | 53,700 | | |
| | | | | Total Australia | | | 224,260 | | |
| | | Bermuda (0.2%) | |
| | | Industrials | |
| | 30 | | | Ingersoll-Rand Global Holding Co., Ltd. (a) | | | 4.25 | | | 06/15/23 | | | 29,872 | | |
| | | Brazil (0.3%) | |
| | | Basic Materials | |
| | 50 | | | Vale Overseas Ltd. | | | 5.625 | | | 09/15/19 | | | 54,121 | | |
| | 5 | | | Vale Overseas Ltd. | | | 6.875 | | | 11/10/39 | | | 5,072 | | |
| | | | | Total Brazil | | | 59,193 | | |
| | | Canada (0.9%) | |
| | | Basic Materials | |
| | 10 | | | Agrium, Inc. | | | 3.50 | | | 06/01/23 | | | 9,639 | | |
| | 40 | | | Goldcorp, Inc. | | | 3.70 | | | 03/15/23 | | | 35,491 | | |
| | | | | | 45,130 | | |
| | | Communications | |
| | 25 | | | Rogers Communications, Inc. | | | 4.50 | | | 03/15/43 | | | 22,851 | | |
| | | Energy | |
| | 50 | | | Canadian Oil Sands Ltd. (a) | | | 7.75 | | | 05/15/19 | | | 60,419 | | |
| | | Utilities | |
| | 50 | | | TransAlta Corp. | | | 4.50 | | | 11/15/22 | | | 47,774 | | |
| | | | | Total Canada | | | 176,174 | | |
| | | France (1.0%) | |
| | | Communications | |
| | 15 | | | France Telecom SA | | | 8.50 | | | 03/01/31 | | | 20,432 | | |
See Notes to Financial Statements
28
Flexible Income
Portfolio of Investments n June 30, 2013 (unaudited) continued
PRINCIPAL
AMOUNT
(000) | |
| | COUPON
RATE | | MATURITY
DATE | | VALUE | |
| | | Diversified | |
$ | 75 | | | LVMH Moet Hennessy Louis Vuitton SA (a) | | | 1.625 | % | | 06/29/17 | | $ | 73,931 | | |
| | | Energy | |
| | 50 | | | Total Capital International SA | | | 2.875 | | | 02/17/22 | | | 48,149 | | |
| | | Finance | |
| | 50 | | | BNP Paribas SA | | | 5.00 | | | 01/15/21 | | | 53,246 | | |
| | | | | Total France | | | 195,758 | | |
| | | Germany (0.2%) | |
| | | Communications | |
| | 25 | | | Deutsche Telekom International Finance BV | | | 8.75 | | | 06/15/30 | | | 34,769 | | |
| | | Greece (0.4%) | |
| | | Industrials | |
| | 100 | | | DryShips, Inc. | | | 5.00 | | | 12/01/14 | | | 89,313 | | |
| | | Ireland (0.3%) | |
| | | Industrials | |
| | 45 | | | CRH America, Inc. | | | 6.00 | | | 09/30/16 | | | 50,713 | | |
| | | Israel (0.4%) | |
| | | Consumer, Non-Cyclical | |
| | 80 | | | Teva Pharmaceutical Finance IV BV | | | 3.65 | | | 11/10/21 | | | 80,150 | | |
| | | Italy (0.5%) | |
| | | Utilities | |
| | 100 | | | Enel Finance International N.V. (a) | | | 5.125 | | | 10/07/19 | | | 103,992 | | |
| | | Jamaica (0.2%) | |
| | | Communications | |
| | 50 | | | Digicel Ltd. (a) | | | 6.00 | | | 04/15/21 | | | 47,375 | | |
| | | Netherlands (0.5%) | |
| | | Finance | |
| | 75 | | | Aegon N.V. | | | 4.625 | | | 12/01/15 | | | 80,868 | | |
| | 25 | | | Cooperatieve Centrale Raiffeisen-Boerenleenbank BA | | | 3.875 | | | 02/08/22 | | | 25,221 | | |
| | | | | Total Netherlands | | | 106,089 | | |
| | | Spain (1.9%) | |
| | | Communications | |
| | 200 | | | Nara Cable Funding Ltd. (a) | | | 8.875 | | | 12/01/18 | | | 206,000 | | |
| | 45 | | | Telefonica Europe BV | | | 8.25 | | | 09/15/30 | | | 54,157 | | |
| | | | | | 260,157 | | |
See Notes to Financial Statements
29
Flexible Income
Portfolio of Investments n June 30, 2013 (unaudited) continued
PRINCIPAL
AMOUNT
(000) | |
| | COUPON
RATE | | MATURITY
DATE | | VALUE | |
| | | Finance | |
$ | 30 | | | Santander Holdings USA, Inc. | | | 4.625 | % | | 04/19/16 | | $ | 31,668 | | |
| | | Utilities | |
| | 75 | | | Iberdrola Finance Ireland Ltd. (a) | | | 5.00 | | | 09/11/19 | | | 78,975 | | |
| | | | | Total Spain | | | 370,800 | | |
| | | Switzerland (0.9%) | |
| | | Finance | |
| | 65 | | | ABB Treasury Center USA, Inc. (a) | | | 2.50 | | | 06/15/16 | | | 67,348 | | |
| | 70 | | | Credit Suisse | | | 5.40 | | | 01/14/20 | | | 75,946 | | |
| | 5 | | | Credit Suisse | | | 6.00 | | | 02/15/18 | | | 5,622 | | |
| | | | | | 148,916 | | |
| | | Industrials | |
| | 25 | | | Holcim US Finance Sarl & Cie SCS (a) | | | 6.00 | | | 12/30/19 | | | 27,952 | | |
| | | | | Total Switzerland | | | 176,868 | | |
| | | United Kingdom (2.9%) | |
| | | Communications | |
| | 50 | | | WPP Finance 2010 | | | 3.625 | | | 09/07/22 | | | 47,267 | | |
| | | Finance | |
| | 50 | | | HSBC Holdings PLC | | | 4.00 | | | 03/30/22 | | | 51,285 | | |
| | 120 | | | Nationwide Building Society (a) | | | 6.25 | | | 02/25/20 | | | 133,956 | | |
| | 55 | | | Royal Bank of Scotland Group PLC | | | 6.125 | | | 12/15/22 | | | 52,520 | | |
| | | | | | 237,761 | | |
| | | Industrials | |
| | 200 | | | CEVA Group PLC (a) | | | 8.375 | | | 12/01/17 | | | 197,000 | | |
| | 100 | | | Heathrow Funding Ltd. (a) | | | 4.875 | | | 07/15/21 | | | 106,953 | | |
| | | | | | 303,953 | | |
| | | | | Total United Kingdom | | | 588,981 | | |
| | | United States (49.4%) | |
| | | Basic Materials | |
| | 30 | | | Allegheny Technologies, Inc. | | | 4.25 | | | 06/01/14 | | | 31,013 | | |
| | 100 | | | American Gilsonite Co. (a) | | | 11.50 | | | 09/01/17 | | | 105,750 | | |
| | 40 | | | Georgia-Pacific LLC | | | 8.875 | | | 05/15/31 | | | 56,020 | | |
| | 100 | | | Prince Mineral Holding Corp. (a) | | | 11.50 | | | 12/15/19 | | | 107,500 | | |
| | 31 | | | United States Steel Corp. | | | 4.00 | | | 05/15/14 | | | 31,852 | | |
| | | | | | 332,135 | | |
See Notes to Financial Statements
30
Flexible Income
Portfolio of Investments n June 30, 2013 (unaudited) continued
PRINCIPAL
AMOUNT
(000) | |
| | COUPON
RATE | | MATURITY
DATE | | VALUE | |
| | | Communications | |
$ | 25 | | | CC Holdings GS V LLC/Crown Castle GS III Corp. | | | 3.849 | % | | 04/15/23 | | $ | 23,621 | | |
| | 140 | | | CCO Holdings LLC/CCO Holdings Capital Corp. | | | 6.50 | | | 04/30/21 | | | 146,650 | | |
| | 50 | | | Crown Castle International Corp. | | | 5.25 | | | 01/15/23 | | | 48,187 | | |
| | 100 | | | CSC Holdings LLC | | | 8.625 | | | 02/15/19 | | | 116,000 | | |
| | 25 | | | DirecTV Holdings LLC/DirecTV Financing Co., Inc. | | | 3.80 | | | 03/15/22 | | | 24,058 | | |
| | 25 | | | Discovery Communications LLC | | | 3.25 | | | 04/01/23 | | | 23,492 | | |
| | 100 | | | GXS Worldwide, Inc. | | | 9.75 | | | 06/15/15 | | | 102,000 | | |
| | 150 | | | Harron Communications LP/Harron
Finance Corp. (a) | | | 9.125 | | | 04/01/20 | | | 162,750 | | |
| | 100 | | | inVentiv Health, Inc. (a) | | | 9.00 | | | 01/15/18 | | | 104,750 | | |
| | 100 | | | Mediacom LLC/Mediacom Capital Corp. | | | 7.25 | | | 02/15/22 | | | 105,750 | | |
| | 80 | | | MetroPCS Wireless, Inc. (a) | | | 6.25 | | | 04/01/21 | | | 81,700 | | |
| | 25 | | | NBC Universal Media LLC | | | 5.95 | | | 04/01/41 | | | 28,656 | | |
| | 100 | | | NBCUniversal Enterprise, Inc. (a) | | | 1.974 | | | 04/15/19 | | | 97,458 | | |
| | 25 | | | News America, Inc. | | | 6.15 | | | 02/15/41 | | | 27,859 | | |
| | 50 | | | Omnicom Group, Inc. | | | 3.625 | | | 05/01/22 | | | 48,314 | | |
| | 30 | | | Priceline.com, Inc. | | | 1.00 | | | 03/15/18 | | | 35,025 | | |
| | 25 | | | Time Warner Cable, Inc. | | | 4.50 | | | 09/15/42 | | | 19,457 | | |
| | | | | | 1,195,727 | | |
| | | Consumer, Cyclical | |
| | 70 | | | Ameristar Casinos, Inc. | | | 7.50 | | | 04/15/21 | | | 73,150 | | |
| | 50 | | | Caesars Entertainment Operating Co., Inc. | | | 8.50 | | | 02/15/20 | | | 47,281 | | |
| | 50 | | | Caesars Entertainment Operating Co., Inc. | | | 10.00 | | | 12/15/18 | | | 30,250 | | |
| | 100 | | | CCM Merger, Inc. (a) | | | 9.125 | | | 05/01/19 | | | 105,000 | | |
| | 100 | | | Chester Downs & Marina LLC (a) | | | 9.25 | | | 02/01/20 | | | 97,000 | | |
| | 150 | | | Continental Airlines 2012-3 Class C Pass-Thru
Certificates | | | 6.125 | | | 04/29/18 | | | 151,500 | | |
| | 100 | | | Exide Technologies (b)(c) | | | 8.625 | | | 02/01/18 | | | 62,000 | | |
| | 30 | | | Gap, Inc. (The) | | | 5.95 | | | 04/12/21 | | | 33,233 | | |
| | 40 | | | Glencore Funding LLC (a) | | | 2.50 | | | 01/15/19 | | | 36,234 | | |
| | 100 | | | HD Supply, Inc. (a) | | | 7.50 | | | 07/15/20 | | | 101,500 | | |
| | 65 | | | Home Depot, Inc. | | | 5.875 | | | 12/16/36 | | | 76,689 | | |
| | 150 | | | IDQ Holdings, Inc. (a) | | | 11.50 | | | 04/01/17 | | | 165,000 | | |
| | 31 | | | International Game Technology | | | 3.25 | | | 05/01/14 | | | 33,093 | | |
| | 100 | | | Levi Strauss & Co. | | | 7.625 | | | 05/15/20 | | | 108,500 | | |
| | 100 | | | Logan's Roadhouse, Inc. | | | 10.75 | | | 10/15/17 | | | 93,250 | | |
| | 100 | | | MGM Resorts International | | | 7.75 | | | 03/15/22 | | | 109,125 | | |
| | 25 | | | QVC, Inc. (a) | | | 4.375 | | | 03/15/23 | | | 23,364 | | |
| | 299 | | | Resort at Summerlin LP, Series B (b)(c)(e)(f) | | | 13.00 | (d) | | 12/15/07 | | | 0 | | |
See Notes to Financial Statements
31
Flexible Income
Portfolio of Investments n June 30, 2013 (unaudited) continued
PRINCIPAL
AMOUNT
(000) | |
| | COUPON
RATE | | MATURITY
DATE | | VALUE | |
$ | 100 | | | Rite Aid Corp. (a)(g) | | | 6.75 | % | | 06/15/21 | | $ | 98,750 | | |
| | 100 | | | RSI Home Products, Inc. (a) | | | 6.875 | | | 03/01/18 | | | 102,750 | | |
| | 50 | | | Sabre Holdings Corp. | | | 8.35 | | | 03/15/16 | | | 53,750 | | |
| | 150 | | | VWR Funding, Inc. | | | 7.25 | | | 09/15/17 | | | 156,000 | | |
| | 35 | | | Wal-Mart Stores, Inc. | | | 5.25 | | | 09/01/35 | | | 38,128 | | |
| | 70 | | | Wyndham Worldwide Corp. | | | 4.25 | | | 03/01/22 | | | 68,295 | | |
| | | | | | 1,863,842 | | |
| | | Consumer, Non-Cyclical | |
| | 75 | | | Actavis, Inc. | | | 3.25 | | | 10/01/22 | | | 70,060 | | |
| | 50 | | | Aetna, Inc. | | | 2.75 | | | 11/15/22 | | | 46,143 | | |
| | 25 | | | Altria Group, Inc. | | | 2.85 | | | 08/09/22 | | | 23,162 | | |
| | 25 | | | Amgen, Inc. | | | 5.15 | | | 11/15/41 | | | 24,991 | | |
| | 116 | | | Armored Autogroup, Inc. | | | 9.25 | | | 11/01/18 | | | 107,010 | | |
| | 40 | | | Boston Scientific Corp. | | | 6.00 | | | 01/15/20 | | | 45,337 | | |
| | 15 | | | ConAgra Foods, Inc. | | | 3.20 | | | 01/25/23 | | | 14,373 | | |
| | 25 | | | ConAgra Foods, Inc. | | | 4.65 | | | 01/25/43 | | | 23,248 | | |
| | 45 | | | Coventry Health Care, Inc. | | | 5.45 | | | 06/15/21 | | | 50,205 | | |
| | 150 | | | HCA, Inc. | | | 4.75 | | | 05/01/23 | | | 144,000 | | |
| | 160 | | | Kindred Healthcare, Inc. | | | 8.25 | | | 06/01/19 | | | 164,800 | | |
| | 26 | | | Kraft Foods Group, Inc. | | | 5.375 | | | 02/10/20 | | | 29,369 | | |
| | 50 | | | Life Technologies Corp. | | | 6.00 | | | 03/01/20 | | | 56,407 | | |
| | 24 | | | Mondelez International, Inc. | | | 5.375 | | | 02/10/20 | | | 26,958 | | |
| | 29 | | | PHH Corp. | | | 4.00 | | | 09/01/14 | | | 30,812 | | |
| | 60 | | | RR Donnelley & Sons Co. | | | 7.875 | | | 03/15/21 | | | 61,500 | | |
| | 100 | | | ServiceMaster Co. | | | 8.00 | | | 02/15/20 | | | 100,250 | | |
| | 100 | | | Smithfield Foods, Inc. | | | 6.625 | | | 08/15/22 | | | 107,750 | | |
| | 20 | | | UnitedHealth Group, Inc. | | | 1.40 | | | 10/15/17 | | | 19,657 | | |
| | 35 | | | Verisk Analytics, Inc. | | | 5.80 | | | 05/01/21 | | | 38,693 | | |
| | | | | | 1,184,725 | | |
| | | Energy | |
| | 100 | | | Continental Resources, Inc. | | | 5.00 | | | 09/15/22 | | | 102,250 | | |
| | 100 | | | Crestwood Midstream Partners LP/Crestwood
Midstream Finance Corp. | | | 7.75 | | | 04/01/19 | | | 103,500 | | |
| | 50 | | | Enterprise Products Operating LLC | | | 3.35 | | | 03/15/23 | | | 48,214 | | |
| | 30 | | | Marathon Petroleum Corp. | | | 5.125 | | | 03/01/21 | | | 33,137 | | |
| | 100 | | | Northern Oil and Gas, Inc. | | | 8.00 | | | 06/01/20 | | | 101,500 | | |
| | 100 | | | Petroquest Energy LLC (a) | | | 10.00 | | | 09/01/17 | | | 100,000 | | |
| | 75 | | | Pioneer Natural Resources Co. | | | 7.50 | | | 01/15/20 | | | 92,220 | | |
| | 50 | | | Weatherford International Ltd. | | | 4.50 | | | 04/15/22 | | | 49,521 | | |
See Notes to Financial Statements
32
Flexible Income
Portfolio of Investments n June 30, 2013 (unaudited) continued
PRINCIPAL
AMOUNT
(000) | |
| | COUPON
RATE | | MATURITY
DATE | | VALUE | |
$ | 80 | | | Williams Cos., Inc. (The) | | | 7.875 | % | | 09/01/21 | | $ | 96,723 | | |
| | | | | | 727,065 | | |
| | | Finance | |
| | 27 | | | Affiliated Managers Group, Inc. | | | 3.95 | | | 08/15/38 | | | 34,796 | | |
| | 25 | | | Alexandria Real Estate Equities, Inc. | | | 4.60 | | | 04/01/22 | | | 25,523 | | |
| | 25 | | | American Campus Communities Operating
Partnership LP | | | 3.75 | | | 04/15/23 | | | 24,039 | | |
| | 75 | | | American Financial Group, Inc. | | | 9.875 | | | 06/15/19 | | | 97,119 | | |
| | 10 | | | Boston Properties LP | | | 3.80 | | | 02/01/24 | | | 9,843 | | |
| | 62 | | | Citigroup, Inc. (See Note 6) | | | 8.50 | | | 05/22/19 | | | 78,216 | | |
| | 40 | | | Citigroup, Inc.(See Note 6) | | | 4.05 | | | 07/30/22 | | | 38,516 | | |
| | 70 | | | CNA Financial Corp. | | | 5.75 | | | 08/15/21 | | | 78,916 | | |
| | 100 | | | DPL, Inc. | | | 7.25 | | | 10/15/21 | | | 104,000 | | |
| | 200 | | | Ford Motor Credit Co., LLC | | | 4.207 | | | 04/15/16 | | | 209,067 | | |
| | 40 | | | General Electric Capital Corp. | | | 5.30 | | | 02/11/21 | | | 43,948 | | |
| | 25 | | | General Electric Capital Corp., MTN | | | 5.875 | | | 01/14/38 | | | 27,612 | | |
| | 50 | | | Genworth Holdings, Inc. | | | 7.20 | | | 02/15/21 | | | 56,223 | | |
| | 100 | | | GETCO Financing Escrow LLC (a) | | | 8.25 | | | 06/15/18 | | | 95,000 | | |
| | 50 | | | Goldman Sachs Group, Inc. (The) | | | 2.375 | | | 01/22/18 | | | 49,144 | | |
| | 50 | | | Goldman Sachs Group, Inc. (The) | | | 6.75 | | | 10/01/37 | | | 51,372 | | |
| | 35 | | | Harley-Davidson Funding Corp. (a) | | | 6.80 | | | 06/15/18 | | | 41,665 | | |
| | 60 | | | Hartford Financial Services Group, Inc. (See Note 6) | | | 5.50 | | | 03/30/20 | | | 66,451 | | |
| | 50 | | | Healthcare Trust of America Holdings LP (a) | | | 3.70 | | | 04/15/23 | | | 47,036 | | |
| | 50 | | | Host Hotels & Resorts LP | | | 6.00 | | | 10/01/21 | | | 54,278 | | |
| | 25 | | | Host Hotels & Resorts LP, Series D | | | 3.75 | | | 10/15/23 | | | 22,976 | | |
| | 50 | | | ING US, Inc. (a) | | | 5.50 | | | 07/15/22 | | | 53,282 | | |
| | 200 | | | Jefferies Finance LLC/JFIN Co-Issuer Corp. (a) | | | 7.375 | | | 04/01/20 | | | 195,000 | | |
| | 200 | | | Jefferies LoanCore LLC/JLC Finance Corp. (a) | | | 6.875 | | | 06/01/20 | | | 195,000 | | |
| | 25 | | | JPMorgan Chase & Co. | | | 3.375 | | | 05/01/23 | | | 23,327 | | |
| | 65 | | | JPMorgan Chase & Co. | | | 4.625 | | | 05/10/21 | | | 68,820 | | |
| | 100 | | | Merrill Lynch & Co., Inc. | | | 6.11 | | | 01/29/37 | | | 98,740 | | |
| | 100 | | | Nationstar Mortgage LLC/Nationstar Capital Corp. | | | 7.875 | | | 10/01/20 | | | 106,500 | | |
| | 35 | | | Nationwide Financial Services, Inc. (a) | | | 5.375 | | | 03/25/21 | | | 38,223 | | |
| | 50 | | | Piedmont Operating Partnership LP (a) | | | 3.40 | | | 06/01/23 | | | 45,626 | | |
| | 35 | | | Prudential Financial, Inc., MTN | | | 6.625 | | | 12/01/37 | | | 41,675 | | |
| | 50 | | | Realty Income Corp. | | | 3.25 | | | 10/15/22 | | | 45,822 | | |
| | 139 | | | Rivers Pittsburgh Borrower LP/Rivers Pittsburgh
Finance Corp. (a) | | | 9.50 | | | 06/15/19 | | | 150,815 | | |
| | 10 | | | Santander Holdings USA, Inc. | | | 3.00 | | | 09/24/15 | | | 10,259 | | |
| | 60 | | | SLM Corp., MTN | | | 8.00 | | | 03/25/20 | | | 65,175 | | |
| | | | | | 2,394,004 | | |
See Notes to Financial Statements
33
Flexible Income
Portfolio of Investments n June 30, 2013 (unaudited) continued
PRINCIPAL
AMOUNT
(000) | |
| | COUPON
RATE | | MATURITY
DATE | | VALUE | |
| | | Industrials | |
$ | 100 | | | Atkore International, Inc. | | | 9.875 | % | | 01/01/18 | | $ | 106,500 | | |
| | 50 | | | Ball Corp. | | | 5.00 | | | 03/15/22 | | | 50,000 | | |
| | 40 | | | Bemis Co., Inc. | | | 4.50 | | | 10/15/21 | | | 41,104 | | |
| | 100 | | | Cequel Communications Holdings I LLC/Cequel
Capital Corp. (a) | | | 6.375 | | | 09/15/20 | | | 102,250 | | |
| | 100 | | | Consolidated Container Co., LLC/Consolidated
Container Capital, Inc. (a) | | | 10.125 | | | 07/15/20 | | | 105,500 | | |
| | 35 | | | Eaton Corp. (a) | | | 2.75 | | | 11/02/22 | | | 32,810 | | |
| | 100 | | | JB Poindexter & Co., Inc. (a) | | | 9.00 | | | 04/01/22 | | | 105,500 | | |
| | 200 | | | Marquette Transportation Co./Marquette
Transportation Finance Corp. | | | 10.875 | | | 01/15/17 | | | 215,000 | | |
| | 100 | | | Navios Maritime Holdings, Inc./Navios Maritime
Finance II US, Inc. | | | 8.125 | | | 02/15/19 | | | 95,250 | | |
| | 100 | | | Nuverra Environmental Solutions, Inc. | | | 9.875 | | | 04/15/18 | | | 105,500 | | |
| | 100 | | | Pretium Packaging LLC/Pretium Finance, Inc. | | | 11.50 | | | 04/01/16 | | | 107,500 | | |
| | 50 | | | Sequa Corp. (a) | | | 7.00 | | | 12/15/17 | | | 49,750 | | |
| | 100 | | | Silgan Holdings, Inc. | | | 5.00 | | | 04/01/20 | | | 99,500 | | |
| | 109 | | | Tekni-Plex, Inc. (a) | | | 9.75 | | | 06/01/19 | | | 116,357 | | |
| | 28 | | | Trinity Industries, Inc. | | | 3.875 | | | 06/01/36 | | | 32,970 | | |
| | 100 | | | Zachry Holdings, Inc. (a) | | | 7.50 | | | 02/01/20 | | | 103,500 | | |
| | | | | | 1,468,991 | | |
| | | Technology | |
| | 50 | | | Apple, Inc. | | | 2.40 | | | 05/03/23 | | | 46,473 | | |
| | 100 | | | First Data Corp. (a) | | | 10.625 | | | 06/15/21 | | | 99,250 | | |
| | 50 | | | First Data Corp. (a) | | | 11.25 | | | 01/15/21 | | | 50,125 | | |
| | 20 | | | Hewlett-Packard Co. | | | 4.65 | | | 12/09/21 | | | 20,036 | | |
| | 150 | | | Infor US, Inc. | | | 9.375 | | | 04/01/19 | | | 163,313 | | |
| | 31 | | | Intel Corp. | | | 2.95 | | | 12/15/35 | | | 33,809 | | |
| | 31 | | | Lam Research Corp. | | | 1.25 | | | 05/15/18 | | | 34,546 | | |
| | 29 | | | Nuance Communications, Inc. | | | 2.75 | | | 11/01/31 | | | 30,015 | | |
| | 26 | | | SanDisk Corp. | | | 1.50 | | | 08/15/17 | | | 34,791 | | |
| | | | | | 512,358 | | |
| | | Utilities | |
| | 50 | | | CMS Energy Corp. | | | 5.05 | | | 03/15/22 | | | 54,116 | | |
| | 60 | | | PPL WEM Holdings PLC (a) | | | 3.90 | | | 05/01/16 | | | 62,748 | | |
| | 100 | | | Puget Energy, Inc. | | | 6.50 | | | 12/15/20 | | | 112,168 | | |
| | | | | | 229,032 | | |
| | | | | Total United States | | | 9,907,879 | | |
| | | | | Total Corporate Bonds
(Cost $12,179,854) | | | | | | | 12,242,186 | | |
See Notes to Financial Statements
34
Flexible Income
Portfolio of Investments n June 30, 2013 (unaudited) continued
PRINCIPAL
AMOUNT
(000) | |
| | COUPON
RATE | | MATURITY
DATE | | VALUE | |
| | | Sovereign (11.0%) | |
| | | Brazil (2.0%) | |
$ | 200 | | | Banco Nacional de Desenvolvimento, Economico e
Social (a) | | | 6.369 | % | | 06/16/18 | | $ | 218,000 | | |
| | 150 | | | Brazilian Government International Bond | | | 5.875 | | | 01/15/19 | | | 171,600 | | |
| | 10 | | | Brazilian Government International Bond | | | 7.125 | | | 01/20/37 | | | 11,950 | | |
| | | | | Total Brazil | | | 401,550 | | |
| | | Indonesia (1.3%) | |
| | 100 | | | Indonesia Government International Bond | | | 7.75 | | | 01/17/38 | | | 124,000 | | |
| | 100 | | | Indonesia Government International Bond (a) | | | 11.625 | | | 03/04/19 | | | 136,500 | | |
| | | | | Total Indonesia | | | 260,500 | | |
| | | Kazakhstan (0.6%) | |
| | 100 | | | KazMunayGas National Co., JSC (a) | | | 9.125 | | | 07/02/18 | | | 120,125 | | |
| | | Mexico (2.0%) | |
MXN | 810 | | | Mexican Bonos | | | 8.00 | | | 06/11/20 | | | 71,626 | | |
$ | 44 | | | Mexico Government International Bond | | | 5.95 | | | 03/19/19 | | | 50,578 | | |
| | 20 | | | Mexico Government International Bond | | | 6.05 | | | 01/11/40 | | | 21,900 | | |
| | 100 | | | Mexico Government International Bond | | | 6.75 | | | 09/27/34 | | | 118,500 | | |
| | 33 | | | Pemex Project Funding Master Trust | | | 6.625 | | | 06/15/35 | | | 34,815 | | |
| | 25 | | | Pemex Project Funding Master Trust | | | 6.625 | | | 06/15/38 | | | 26,375 | | |
| | 60 | | | Petroleos Mexicanos | | | 5.50 | | | 01/21/21 | | | 64,200 | | |
| | 15 | | | Petroleos Mexicanos | | | 8.00 | | | 05/03/19 | | | 18,225 | | |
| | | | | Total Mexico | | | 406,219 | | |
| | | Peru (0.4%) | |
| | 40 | | | Peruvian Government International Bond | | | 7.125 | | | 03/30/19 | | | 48,600 | | |
| | 10 | | | Peruvian Government International Bond | | | 7.35 | | | 07/21/25 | | | 12,850 | | |
| | 16 | | | Peruvian Government International Bond | | | 8.75 | | | 11/21/33 | | | 23,360 | | |
| | | | | Total Peru | | | 84,810 | | |
| | | Russia (1.3%) | |
| | 92 | | | Russian Foreign Bond - Eurobond | | | 7.50 | | | 03/31/30 | | | 108,385 | | |
| | 90 | | | Russian Foreign Bond - Eurobond | | | 12.75 | | | 06/24/28 | | | 156,600 | | |
| | | | | Total Russia | | | 264,985 | | |
| | | Turkey (0.9%) | |
| | 100 | | | Turkey Government International Bond | | | 6.75 | | | 04/03/18 | | | 112,500 | | |
| | 17 | | | Turkey Government International Bond | | | 6.875 | | | 03/17/36 | | | 19,019 | | |
See Notes to Financial Statements
35
Flexible Income
Portfolio of Investments n June 30, 2013 (unaudited) continued
PRINCIPAL
AMOUNT
(000) | |
| | COUPON
RATE | | MATURITY
DATE | | VALUE | |
$ | 15 | | | Turkey Government International Bond | | | 8.00 | % | | 02/14/34 | | $ | 18,713 | | |
| | 19 | | | Turkey Government International Bond | | | 11.875 | | | 01/15/30 | | | 31,967 | | |
| | | | | Total Turkey | | | 182,199 | | |
| | | Ukraine (0.5%) | | | |
| | 100 | | | Ukraine Government International Bond | | | 6.75 | | | 11/14/17 | | | 92,000 | | |
| | | Uruguay (0.1%) | | | |
| | 10 | | | Uruguay Government International Bond | | | 8.00 | | | 11/18/22 | | | 12,665 | | |
| | | Venezuela (1.9%) | | | |
| | 130 | | | Petroleos de Venezuela SA | | | 8.50 | | | 11/02/17 | | | 119,437 | | |
| | 20 | | | Venezuela Government International Bond | | | 6.00 | | | 12/09/20 | | | 14,700 | | |
| | 150 | | | Venezuela Government International Bond | | | 7.65 | | | 04/21/25 | | | 112,500 | | |
| | 159 | | | Venezuela Government International Bond | | | 9.25 | | | 09/15/27 | | | 135,150 | | |
| | | | | Total Venezuela | | | 381,787 | | |
| | | | | Total Sovereign
(Cost $1,937,166) | | | | | | | 2,206,840 | | |
| | | Municipal Bonds (1.0%) | | | |
| | 15 | | | City of Chicago, IL, O'Hare International Airport
Revenue | | | 6.395 | | | 01/01/40 | | | 17,794 | | |
| | 30 | | | City of New York, NY, Series G-1 | | | 5.968 | | | 03/01/36 | | | 34,548 | | |
| | 75 | | | Illinois State Toll Highway Authority, Highway Revenue,
Build America Bonds | | | 6.184 | | | 01/01/34 | | | 89,051 | | |
| | 20 | | | Municipal Electric Authority of Georgia | | | 6.655 | | | 04/01/57 | | | 21,715 | | |
| | 40 | | | State of California, General Obligation Bonds | | | 5.95 | | | 04/01/16 | | | 44,544 | | |
| | | | | Total Municipal Bonds
(Cost $180,202) | | | | | | | 207,652 | | |
| | | Agency Fixed Rate Mortgages (0.7%) | | | |
| | | | | Federal National Mortgage Association,
Conventional Pools: | | | | | | | | | | | | | |
| | 74 | | | | | | | | 6.50 | | | 07/01/29 - 11/01/33 | | | 84,038 | | |
| | 33 | | | | | | | | 7.00 | | | 02/01/33 | | | 38,158 | | |
| | | | | IO STRIPS | | | | | | | | | | | | | |
| | 17 | | | | | | | | 6.50 | (h) | | 12/01/29 | | | 2,033 | | |
| | 14 | | | | | | | | 7.00 | (h) | | 11/01/19 | | | 1,978 | | |
| | 56 | | | | | | | | 8.00 | (h) | | 06/01/35 | | | 10,651 | | |
| | 1 | | | Government National Mortgage Association,
Various Pool | | | 8.00 | | | 06/15/26 | | | 616 | | |
| | | | | Total Agency Fixed Rate Mortgages
(Cost $114,459) | | | | | | | 137,474 | | |
See Notes to Financial Statements
36
Flexible Income
Portfolio of Investments n June 30, 2013 (unaudited) continued
PRINCIPAL
AMOUNT
(000) | |
| | COUPON
RATE | | MATURITY
DATE | | VALUE | |
| | | Asset-Backed Securities (2.9%) | | | |
$ | 170 | | | Citigroup Mortgage Loan Trust, Inc. (See Note 6) | | | 5.53 | % | | 11/25/34 | | $ | 175,642 | | |
| | 70 | | | CVS Pass-Through Trust | | | 6.036 | | | 12/10/28 | | | 79,320 | | |
| | 125 | | | Ford Credit Floorplan Master Owner Trust (a) | | | 1.893 | (h) | | 02/15/17 | | | 127,578 | | |
| | 167 | | | GSAA Home Equity Trust | | | 4.606 | (h) | | 06/25/34 | | | 177,079 | | |
| | 20 | | | Specialty Underwriting & Residential Finance | | | 0.733 | (h) | | 05/25/35 | | | 17,786 | | |
| | | | | Total Asset-Backed Securities
(Cost $541,197) | | | | | | | 577,405 | | |
| | | U.S. Treasury Securities (11.1%) | | | |
| | | | | U.S. Treasury Bonds | | | | | | | | | | | | | |
| | 200 | | | | | | | | 3.125 | | | 11/15/41 - 02/15/43 | | | 187,303 | | |
| | 120 | | | | | | | | 6.25 | | | 05/15/30 | | | 170,053 | | |
| | 1,875 | | | U.S. Treasury Notes | | | 0.375 | | | 06/15/15 - 01/15/16 | | | 1,873,155 | | |
| | | | | Total U.S. Treasury Securities
(Cost $2,257,274) | | | | | | | 2,230,511 | | |
| | | Mortgages - Other (8.7%) | | | |
| | | | | Alternative Loan Trust | | | | | | | | | | | | | |
| | 22 | | | | | | | | 5.50 | | | 02/25/36 | | | 18,080 | | |
| | 107 | | | | | | | | 5.50 | | | 05/25/36 | | | 92,545 | | |
| | 81 | | | | | | | | 6.00 | | | 04/25/36 | | | 66,461 | | |
| | 42 | | | | | | | | 6.00 | | | 05/25/36 | | | 34,688 | | |
| | 61 | | | | | | | | 6.00 | | | 12/25/36 | | | 44,452 | | |
| | 144 | | | | | | | | 6.00 | | | 07/25/37 | | | 124,036 | | |
| | | | | PAC | | | | | | | | | | | | | |
| | 11 | | | | | | | | 5.50 | | | 02/25/36 | | | 9,215 | | |
| | 40 | | | | | | | | 6.00 | | | 04/25/36 | | | 32,183 | | |
| | 160 | | | Banc of America Alternative Loan Trust | | | 5.913 | (h) | | 10/25/36 | | | 123,351 | | |
| | 46 | | | Banc of America Funding Trust | | | 6.00 | | | 07/25/37 | | | 36,924 | | |
| | 96 | | | CHL Mortgage Pass-Through Trust | | | 0.493 | (h) | | 04/25/46 | | | 20,433 | | |
| | 309 | | | CSMC Mortgage-Backed Trust | | | 5.837 | (h) | | 04/25/37 | | | 185,769 | | |
| | | | | First Horizon Alternative Mortgage Securities Trust | | | | | | | | | | | | | |
| | 30 | | | | | | | | 6.00 | | | 08/25/36 | | | 25,713 | | |
| | 59 | | | | | | | | 6.25 | | | 08/25/36 | | | 49,633 | | |
| | 69 | | | GSMSC Pass-Through Trust (a) | | | 7.50 | (h) | | 09/25/36 | | | 63,164 | | |
| | | | | JP Morgan Alternative Loan Trust | | | | | | | | | | | | | |
| | 157 | | | | | | | | 6.00 | | | 12/25/35 | | | 137,941 | | |
| | 160 | | | | | | | | 6.00 | | | 08/25/36 | | | 144,353 | | |
| | | | | Lehman Mortgage Trust | | | | | | | | | | | | | |
| | 34 | | | | | | | | 5.50 | | | 11/25/35 | | | 33,315 | | |
| | 109 | | | | | | | | 5.50 | | | 02/25/36 | | | 108,070 | | |
| | 167 | | | | | | | | 6.50 | | | 09/25/37 | | | 144,471 | | |
See Notes to Financial Statements
37
Flexible Income
Portfolio of Investments n June 30, 2013 (unaudited) continued
PRINCIPAL
AMOUNT
(000) | |
| | COUPON
RATE | | MATURITY
DATE | | VALUE | |
$ | 67 | | | Luminent Mortgage Trust | | | 0.363 | (h)% | | 10/25/46 | | $ | 18,330 | | |
| | | | | RALI Trust | | | | | | | | | | | | | |
| | 77 | | | | | | | | 0.693 | (h) | | 03/25/35 | | | 50,062 | | |
| | 83 | | | | | | | | 6.00 | | | 04/25/36 | | | 67,911 | | |
| | 32 | | | | | | | | 6.00 | | | 01/25/37 | | | 24,484 | | |
| | | | | PAC | | | | | | | | | | | | | |
| | 42 | | | | | | | | 6.00 | | | 04/25/36 | | | 34,208 | | |
| | 71 | | | Residential Asset Securitization Trust | | | 6.00 | | | 07/25/36 | | | 61,071 | | |
| | | | | Total Mortgages - Other
(Cost $1,645,446) | | | | | | | 1,750,863 | | |
NUMBER OF
SHARES (000) | |
| |
| |
| |
| |
| | | Short-Term Investment (2.6%) | | | |
| | | Investment Company | | | |
| | 515 | | | Morgan Stanley Institutional Liquidity Funds - Money Market Portfolio - Institutional Class
(See Note 6)
(Cost $514,637) | | | 514,637 | | |
| | | | | Total Investments
(Cost $19,370,235) (i) | | | | | | | 99.1 | % | | | 19,867,568 | | |
| | | | | Other Assets in Excess of Liabilities | | | | | | | 0.9 | | | | 175,020 | | |
| | | | | Net Assets | | | | | | | 100.0 | % | | $ | 20,042,588 | | |
IO Interest Only.
MTN Medium Term Note.
PAC Planned Amortization Class.
STRIPS Separate Trading of Registered Interest and Principal of Securities.
(a) 144A security — Certain conditions for public sale may exist. Unless otherwise noted, these securities are deemed to
be liquid.
(b) Issuer in bankruptcy.
(c) Non-income producing security; bond in default.
(d) Payment-in-kind security.
(e) At June 30, 2013, the Portfolio held a fair valued security valued at $0, representing 0.0% of net assets. This security has been fair valued as determined in good faith under procedures established by and under the general supervision of the Fund's Trustees.
(f) Acquired through exchange offer.
(g) When-issued security.
(h) Variable/Floating Rate Security — Interest rate changes on these instruments are based on changes in a designated base rate. The rates shown are those in effect on June 30, 2013.
(i) Securities are available for collateral in connection with purchase of a when-issued security, open foreign currency forward exchange contracts, futures contracts and swap agreements.
See Notes to Financial Statements
38
Flexible Income
Portfolio of Investments n June 30, 2013 (unaudited) continued
FOREIGN CURRENCY FORWARD EXCHANGE CONTRACTS OPEN AT JUNE 30, 2013:
COUNTERPARTY | | CONTRACTS
TO DELIVER | | IN EXCHANGE
FOR | | DELIVERY
DATE | | UNREALIZED
APPRECIATION
(DEPRECIATION) | |
Credit Suisse | | $ | 328,390 | | | CHF | 310,000 | | | 07/05/13 | | $ | (183 | ) | |
Goldman Sachs International | | NOK | 1,482,974 | | | $ | 242,834 | | | 07/05/13 | | | (1,278 | ) | |
HSBC Bank PLC | | MXN | 1,010,000 | | | $ | 78,378 | | | 07/05/13 | | | 452 | | |
HSBC Bank PLC | | SEK | 960,000 | | | $ | 143,076 | | | 07/05/13 | | | (67 | ) | |
HSBC Bank PLC | | $ | 76,659 | | | MXN | 1,010,000 | | | 07/05/13 | | | 1,268 | | |
UBS AG | | AUD | 160,000 | | | $ | 154,394 | | | 07/05/13 | | | 8,098 | | |
UBS AG | | CHF | 310,000 | | | $ | 325,254 | | | 07/05/13 | | | (2,953 | ) | |
UBS AG | | $ | 148,576 | | | AUD | 160,000 | | | 07/05/13 | | | (2,280 | ) | |
UBS AG | | $ | 142,307 | | | SEK | 960,000 | | | 07/05/13 | | | 837 | | |
Wells Fargo Bank | | $ | 251,549 | | | NOK | 1,482,974 | | | 07/05/13 | | | (7,437 | ) | |
Credit Suisse | | CHF | 310,000 | | | $ | 328,487 | | | 08/07/13 | | | 187 | | |
Goldman Sachs International | | $ | 242,545 | | | NOK | 1,482,974 | | | 08/07/13 | | | 1,291 | | |
HSBC Bank PLC | | MXN | 1,010,000 | | | $ | 76,445 | | | 08/07/13 | | | (1,254 | ) | |
UBS AG | | AUD | 160,000 | | | $ | 148,211 | | | 08/07/13 | | | 2,269 | | |
UBS AG | | SEK | 960,000 | | | $ | 142,197 | | | 08/07/13 | | | (837 | ) | |
Net Unrealized Depreciation | | $ | (1,887 | ) | |
FUTURES CONTRACTS OPEN AT JUNE 30, 2013:
NUMBER OF
CONTRACTS | | LONG/SHORT | | DESCRIPTION, DELIVERY
MONTH AND YEAR | | UNDERLYING FACE
AMOUNT AT VALUE | | UNREALIZED
APPRECIATION
(DEPRECIATION) | |
| | 7 | | | Long | | U.S. Treasury Ultra Long Bond,
Sep-13 | | $ | 1,031,188 | | | $ | (39,484 | ) | |
| | 4 | | | Long | | U.S. Treasury 2 yr. Note,
Sep-13 | | | 880,000 | | | | (547 | ) | |
| | 5 | | | Short | | U.S. Treasury 5 yr. Note,
Sep-13 | | | (605,234 | ) | | | 6,453 | | |
| | 7 | | | Short | | U.S. Treasury 10 yr. Note,
Sep-13 | | | (885,938 | ) | | | (2,198 | ) | |
Net Unrealized Depreciation | | $ | (35,776 | ) | |
See Notes to Financial Statements
39
Flexible Income
Portfolio of Investments n June 30, 2013 (unaudited) continued
CREDIT DEFAULT SWAP AGREEMENTS OPEN AT JUNE 30, 2013:
SWAP
COUNTERPARTY &
REFERENCE
OBLIGATION | | BUY/SELL
PROTECTION | | NOTIONAL
AMOUNT
(000) | | INTEREST
RATE | | TERMINATION
DATE | | UNREALIZED
APPRECIATION
(DEPRECIATION) | | UPFRONT
PAYMENTS | | VALUE | | CREDIT
RATING OF
REFERENCE
OBLIGATION† | |
Barclays Bank
Alcoa, Inc. | | Buy | | $ | 100 | | | | 1.00 | % | | 9/20/18 | | $ | (352 | ) | | $ | 10,456 | | | $ | 10,104 | | | BBB- | |
JPMorgan Chase
CDX.NA.IG.20 | | Sell | | | 45 | | | | 1.00 | | | 6/20/18 | | | (240 | ) | | | 528 | | | | 288 | | | NR | |
JPMorgan Chase
CDX.NA.IG.20 | | Sell | | | 200 | | | | 1.00 | | | 6/20/18 | | | 174 | | | | 1,104 | | | | 1,278 | | | NR | |
JPMorgan Chase
Kohl's Corporation | | Buy | | | 125 | | | | 1.00 | | | 6/20/18 | | | (5,114 | ) | | | 7,104 | | | | 1,990 | | | BBB+ | |
Total Credit
Default Swaps | | | | $ | 470 | | | | | | | $ | (5,532 | ) | | $ | 19,192 | | | $ | 13,660 | | | | | | |
INTEREST RATE SWAP AGREEMENTS OPEN AT JUNE 30, 2013:
SWAP COUNTERPARTY | | NOTIONAL
AMOUNT
(000) | | FLOATING
RATE INDEX | | PAY/RECEIVE
FLOATING RATE | | FIXED RATE | | TERMINATION
DATE | | UNREALIZED
APPRECIATION | |
Bank of America | | $ | 300 | | | 3 Month LIBOR | | Receive | | | 2.10 | % | | 02/05/23 | | $ | 11,484 | | |
Deutsche Bank | | | 265 | | | 3 Month LIBOR | | Receive | | | 2.80 | | | 05/01/43 | | | 32,252 | | |
Goldman Sachs | | | 270 | | | 3 Month LIBOR | | Receive | | | 2.90 | | | 05/13/43 | | | 27,923 | | |
JPMorgan Chase | | | 530 | | | 3 Month LIBOR | | Receive | | | 2.06 | | | 02/06/23 | | | 22,553 | | |
JPMorgan Chase | | | 480 | | | 3 Month LIBOR | | Receive | | | 2.09 | | | 02/15/23 | | | 19,388 | | |
Total Unrealized Appreciation | | | | | | | | | | | | $ | 113,600 | | |
LIBOR London Interbank Offered Rate.
NR Not Rated.
† Credit rating as issued by Standard & Poor's.
Currency Abbreviations:
AUD Australian Dollar.
CHF Swiss Franc.
MXN Mexican New Peso.
NOK Norwegian Krone.
SEK Swedish Krona.
See Notes to Financial Statements
40
Flexible Income
Summary of Investments n June 30, 2013 (unaudited)
PORTFOLIO COMPOSITION | | VALUE | | PERCENT OF
TOTAL
INVESTMENTS | |
Corporate Bonds | | $ | 12,242,186 | | | | 61.6 | % | |
U.S. Treasury Securities | | | 2,230,511 | | | | 11.2 | | |
Sovereign | | | 2,206,840 | | | | 11.1 | | |
Mortgages - Other | | | 1,750,863 | | | | 8.8 | | |
Asset-Backed Securities | | | 577,405 | | | | 2.9 | | |
Investment Company | | | 514,637 | | | | 2.6 | | |
Municipal Bonds | | | 207,652 | | | | 1.1 | | |
Agency Fixed Rate Mortgages | | | 137,474 | | | | 0.7 | | |
| | | $ | 19,867,568 | * | | | 100.0 | % | |
* Does not include open long/short futures contracts with an underlying face amount of $3,402,360 with net unrealized depreciation of $35,776. Does not include open foreign currency forward exchange contracts with net unrealized depreciation of $1,887. Also does not include open swap agreements with net unrealized appreciation of $108,068.
See Notes to Financial Statements
41
Global Infrastructure
Portfolio of Investments n June 30, 2013 (unaudited)
NUMBER OF
SHARES | |
| | VALUE | |
| | | Common Stocks (98.4%)
Australia (4.0%) | |
| | | Airports | |
| | 21,584 | | | Sydney Airport | | $ | 66,720 | | |
| | | Diversified | |
| | 67,850 | | | DUET Group (a) | | | 124,725 | | |
| | | Oil & Gas Storage &
Transportation | |
| | 21,186 | | | APA Group (a) | | | 116,060 | | |
| | | Toll Roads | |
| | 28,213 | | | Macquarie Atlas Roads
Group | | | 50,056 | | |
| | 100,591 | | | Transurban Group (a) | | | 621,890 | | |
| | | | 671,946 | | |
| | | Transmission & Distribution | |
| | 24,898 | | | Spark Infrastructure
Group | | | 39,507 | | |
| | | | | Total Australia | | | 1,018,958 | | |
| | | Austria (0.6%) | |
| | | Airports | |
| | 2,528 | | | Flughafen Wien AG | | | 144,522 | | |
| | | Brazil (1.2%) | |
| | | Water | |
| | 30,110 | | | Cia de Saneamento Basico do
Estado de Sao Paulo ADR | | | 313,445 | | |
| | | Canada (11.7%) | |
| | | Oil & Gas Storage &
Transportation | |
| | 25,320 | | | Enbridge, Inc. | | | 1,064,369 | | |
| | 43,800 | | | TransCanada Corp. (a) | | | 1,885,770 | | |
| | | | | Total Canada | | | 2,950,139 | | |
| | | China (6.1%) | |
| | | Oil & Gas Storage &
Transportation | |
| | 122,500 | | | Beijing Enterprises
Holdings Ltd. (b) | | | 882,102 | | |
| | 106,000 | | | China Gas Holdings
Ltd. (b) | | | 108,377 | | |
NUMBER OF
SHARES | |
| | VALUE | |
| | 24,000 | | | ENN Energy Holdings
Ltd. (b) | | $ | 127,952 | | |
| | | | 1,118,431 | | |
| | | Ports | |
| | 56,605 | | | China Merchants Holdings
International Co., Ltd. (b) | | | 176,251 | | |
| | | Toll Roads | |
| | 128,000 | | | Jiangsu Expressway Co.,
Ltd., H Shares (b) | | | 132,026 | | |
| | 449,700 | | | Sichuan Expressway Co.,
Ltd., H Shares (b) | | | 120,599 | | |
| | | | 252,625 | | |
| | | | | Total China | | | 1,547,307 | | |
| | | France (2.7%) | |
| | | Communications | |
| | 6,675 | | | Eutelsat
Communications SA | | | 189,496 | | |
| | 16,944 | | | SES SA | | | 485,213 | | |
| | | | | Total France | | | 674,709 | | |
| | | Germany (1.9%) | |
| | | Airports | |
| | 7,923 | | | Fraport AG Frankfurt Airport
Services Worldwide | | | 479,347 | | |
| | | Italy (6.3%) | |
| | | Oil & Gas Storage &
Transportation | |
| | 166,387 | | | Snam SpA | | | 758,021 | | |
| | | Toll Roads | |
| | 18,817 | | | Atlantia SpA | | | 306,899 | | |
| | 19,732 | | | Societa Iniziative Autostradali
e Servizi SpA | | | 161,425 | | |
| | | | 468,324 | | |
| | | Transmission & Distribution | |
| | 91,922 | | | Terna Rete Elettrica
Nazionale SpA | | | 381,924 | | |
| | | | | Total Italy | | | 1,608,269 | | |
See Notes to Financial Statements
42
Global Infrastructure
Portfolio of Investments n June 30, 2013 (unaudited) continued
NUMBER OF
SHARES | |
| | VALUE | |
| | | Japan (1.4%) | |
| | | Oil & Gas Storage &
Transportation | |
| | 64,000 | | | Tokyo Gas Co., Ltd. | | $ | 353,620 | | |
| | | Luxembourg (0.6%) | |
| | | Communications | |
| | 7,650 | | | Intelsat SA (a)(c) | | | 153,000 | | |
| | | Netherlands (1.5%) | |
| | | Oil & Gas Storage &
Transportation | |
| | 6,384 | | | Koninklijke Vopak N.V. | | | 376,638 | | |
| | | Spain (1.2%) | |
| | | Diversified | |
| | 9,065 | | | Ferrovial SA | | | 144,897 | | |
| | | Toll Roads | |
| | 9,876 | | | Abertis Infraestructuras SA | | | 172,258 | | |
| | | | | Total Spain | | | 317,155 | | |
| | | Switzerland (1.4%) | |
| | | Airports | |
| | 689 | | | Flughafen Zuerich AG
(Registered) | | | 346,123 | | |
| | | United Kingdom (8.2%) | |
| | | Transmission & Distribution | |
| | 135,599 | | | National Grid PLC | | | 1,538,545 | | |
| | | Water | |
| | 3,990 | | | Pennon Group PLC | | | 39,112 | | |
| | 14,796 | | | Severn Trent PLC | | | 374,466 | | |
| | 12,602 | | | United Utilities Group PLC | | | 131,102 | | |
| | | | 544,680 | | |
| | | | | Total United Kingdom | | | 2,083,225 | | |
| | | United States (49.6%) | |
| | | Communications | |
| | 16,890 | | | American Tower Corp. REIT | | | 1,235,841 | | |
| | 10,350 | | | Crown Castle International
Corp. (c) | | | 749,237 | | |
NUMBER OF
SHARES | |
| | VALUE | |
| | 13,420 | | | SBA Communications Corp.,
Class A (c) | | $ | 994,690 | | |
| | | | 2,979,768 | | |
| | | Diversified | |
| | 39,110 | | | CenterPoint Energy, Inc. | | | 918,694 | | |
| | | Oil & Gas Storage &
Transportation | |
| | 2,280 | | | Atmos Energy Corp. | | | 93,617 | | |
| | 13,030 | | | Cheniere Energy, Inc. (c) | | | 361,713 | | |
| | 20,100 | | | Enbridge Energy
Management LLC (a)(c) | | | 608,628 | | |
| | 25,660 | | | Kinder Morgan, Inc. | | | 978,929 | | |
| | 15,260 | | | NiSource, Inc. | | | 437,047 | | |
| | 15,630 | | | ONEOK, Inc. | | | 645,675 | | |
| | 18,410 | | | PG&E Corp. | | | 841,889 | | |
| | 12,380 | | | Sempra Energy | | | 1,012,189 | | |
| | 24,385 | | | Spectra Energy Corp. | | | 840,307 | | |
| | 25,970 | | | Williams Cos., Inc. (The) | | | 843,246 | | |
| | | | 6,663,240 | | |
| | | Transmission & Distribution | |
| | 9,390 | | | ITC Holdings Corp. | | | 857,307 | | |
| | 15,668 | | | Northeast Utilities | | | 658,369 | | |
| | | | 1,515,676 | | |
| | | Water | |
| | 9,800 | | | American Water Works
Co., Inc. | | | 404,054 | | |
| | 3,090 | | | California Water Service
Group | | | 60,286 | | |
| | | | 464,340 | | |
| | | | | Total United States | | | 12,541,718 | | |
| | | | | Total Common Stocks
(Cost $19,300,600) | | | 24,908,175 | | |
See Notes to Financial Statements
43
Global Infrastructure
Portfolio of Investments n June 30, 2013 (unaudited) continued
NUMBER OF
SHARES (000) | |
| | VALUE | |
| | | Short-Term Investments (10.0%)
Securities held as Collateral
on Loaned Securities | | | |
| | | Investment Company (8.9%) | | | |
| | 2,244 | | | Morgan Stanley Institutional Liquidity
Funds - Money Market Portfolio -
Institutional Class (See Note 6)
(Cost $2,244,356) | | $ | 2,244,356 | | |
PRINCIPAL
AMOUNT
(000) | |
| |
| |
| | | Repurchase Agreements (1.1%) | | | |
$ | 178,504 | | | HSBC Securities USA, Inc. (0.15%,
dated 06/28/13, due 07/01/13;
proceeds $178,506; fully
collateralized by U.S. Government
Agencies; Federal National Mortgage
Association 3.50% - 5.00%
due 12/01/26 - 05/01/38;
valued at $182,076) | | | 178,504 | | |
| | 99,169 | | | Merrill Lynch & Co., Inc. (0.18%,
dated 06/28/13, due 07/01/13;
proceeds $99,170; fully
collateralized by Common Stocks; a
Convertible Preferred Stock; and
Exchange Traded Funds;
valued at $108,647) | | | 99,169 | | |
| | | | 277,673 | | |
| | | | | Total Short-Term
Investments
(Cost $2,522,029) | | | 2,522,029 | | |
| Total Investments
(Cost $21,822,629) | | | | 108.4 | % | | | 27,430,204 | | |
| Liabilities in Excess of
Other Assets | | | | (8.4 | ) | | | (2,128,208 | ) | |
| | Net Assets | | | | 100.0 | % | | $ | 25,301,996 | | |
ADR American Depositary Receipt.
REIT Real Estate Investment Trust.
(a) All or a portion of this security was on loan at June 30, 2013.
(b) Security trades on the Hong Kong exchange.
(c) Non-income producing security.
SUMMARY OF INVESTMENTS
INDUSTRY | | VALUE | | PERCENT OF
TOTAL
INVESTMENTS | |
Oil & Gas Storage &
Transportation | | $ | 12,336,149 | | | | 49.5 | % | |
Communications | | | 3,807,477 | | | | 15.3 | | |
Transmission &
Distribution | | | 3,475,652 | | | | 13.9 | | |
Toll Roads | | | 1,565,153 | | | | 6.3 | | |
Water | | | 1,322,465 | | | | 5.3 | | |
Diversified | | | 1,188,316 | | | | 4.8 | | |
Airports | | | 1,036,712 | | | | 4.2 | | |
Ports | | | 176,251 | | | | 0.7 | | |
| | | $ | 24,908,175 | + | | | 100.0 | % | |
+ Does not reflect the value of securities held as collateral on loaned securities.
See Notes to Financial Statements
44
Growth
Portfolio of Investments n June 30, 2013 (unaudited)
NUMBER OF
SHARES | |
| | VALUE | |
| | | Common Stocks (100.2%) | |
| | | Alternative Energy (1.4%) | |
| | 3,592 | | | Range Resources Corp. | | $ | 277,733 | | |
| | | Asset Management &
Custodian (2.6%) | |
| | 1,943 | | | BlackRock, Inc. | | | 499,060 | | |
| | | Automobiles (2.5%) | |
| | 4,464 | | | Tesla Motors, Inc. (a) | | | 479,568 | | |
| | | Biotechnology (3.5%) | |
| | 8,983 | | | Illumina, Inc. (a) | | | 672,288 | | |
| | | Cable Television
Services (0.5%) | |
| | 843 | | | Charter Communications, Inc.,
Class A (a) | | | 104,406 | | |
| | | Chemicals: Diversified (2.9%) | |
| | 5,640 | | | Monsanto Co. | | | 557,232 | | |
| | | Commercial Services (1.3%) | |
| | 5,590 | | | Intertek Group PLC
(United Kingdom) | | | 248,517 | | |
| | | Communications
Technology (3.6%) | |
| | 12,096 | | | Motorola Solutions, Inc. | | | 698,302 | | |
| | | Computer Services,
Software & Systems (19.8%) | |
| | 2,297 | | | Baidu, Inc. ADR (China) (a) | | | 217,136 | | |
| | 45,319 | | | Facebook, Inc., Class A (a) | | | 1,126,630 | | |
| | 1,774 | | | Google, Inc., Class A (a) | | | 1,561,776 | | |
| | 1,768 | | | LinkedIn Corp., Class A (a) | | | 315,234 | | |
| | 10,984 | | | Salesforce.com, Inc. (a) | | | 419,369 | | |
| | 3,149 | | | Workday, Inc., Class A (a) | | | 201,820 | | |
| | | | 3,841,965 | | |
| | | Computer Technology (4.0%) | |
| | 1,390 | | | Apple, Inc. | | | 550,551 | | |
| | 8,069 | | | Yandex N.V., Class A
(Russia) (a) | | | 222,947 | | |
| | | | 773,498 | | |
NUMBER OF
SHARES | |
| | VALUE | |
| | | Consumer Lending (9.5%) | |
| | 4,563 | | | CME Group, Inc. | | $ | 346,697 | | |
| | 1,251 | | | Mastercard, Inc., Class A | | | 718,699 | | |
| | 4,256 | | | Visa, Inc., Class A | | | 777,784 | | |
| | | | 1,843,180 | | |
| | | Diversified Media (2.9%) | |
| | 5,013 | | | McGraw Hill Financial, Inc. | | | 266,641 | | |
| | 4,013 | | | Naspers Ltd., Class N
(South Africa) | | | 296,356 | | |
| | | | 562,997 | | |
| | | Diversified Retail (14.8%) | |
| | 5,673 | | | Amazon.com, Inc. (a) | | | 1,575,335 | | |
| | 52,843 | | | Groupon, Inc. (a) | | | 449,166 | | |
| | 443 | | | NetFlix, Inc. (a) | | | 93,513 | | |
| | 924 | | | Priceline.com, Inc. (a) | | | 764,268 | | |
| | | | 2,882,282 | | |
| | | Drug & Grocery Store
Chains (0.5%) | |
| | 1,978 | | | Whole Foods Market, Inc. | | | 101,827 | | |
| | | Financial Data &
Systems (2.7%) | |
| | 6,605 | | | MSCI, Inc. (a) | | | 219,748 | | |
| | 5,051 | | | Verisk Analytics, Inc.,
Class A (a) | | | 301,545 | | |
| | | | 521,293 | | |
| | | Health Care Services (0.5%) | |
| | 1,160 | | | athenahealth, Inc. (a) | | | 98,275 | | |
| | | Insurance: Multi-Line (1.1%) | |
| | 5,032 | | | American International
Group, Inc. (a) | | | 224,930 | | |
| | | Insurance:
Property-Casualty (4.0%) | |
| | 5,549 | | | Arch Capital Group Ltd. (a) | | | 285,274 | | |
| | 19,106 | | | Progressive Corp. (The) | | | 485,675 | | |
| | | | 770,949 | | |
| | | Medical Equipment (3.1%) | |
| | 1,180 | | | Intuitive Surgical, Inc. (a) | | | 597,764 | | |
See Notes to Financial Statements
45
Growth
Portfolio of Investments n June 30, 2013 (unaudited) continued
NUMBER OF
SHARES | |
| | VALUE | |
| | | Pharmaceuticals (5.6%) | |
| | 6,217 | | | Mead Johnson Nutrition Co. | | $ | 492,573 | | |
| | 6,999 | | | Valeant Pharmaceuticals
International, Inc.
(Canada) (a) | | | 602,474 | | |
| | | | 1,095,047 | | |
| | | Radio & TV
Broadcasters (0.5%) | |
| | 28,815 | | | Sirius XM Radio, Inc. | | | 96,530 | | |
| | | Recreational Vehicles &
Boats (3.3%) | |
| | 20,703 | | | Edenred (France) | | | 633,279 | | |
| | | Restaurants (2.8%) | |
| | 8,431 | | | Starbucks Corp. | | | 552,146 | | |
| | | Semiconductors &
Components (2.0%) | |
| | 2,062 | | | ARM Holdings PLC ADR
(United Kingdom) | | | 74,603 | | |
| | 7,185 | | | First Solar, Inc. (a) | | | 321,385 | | |
| | | | 395,988 | | |
| | | Textiles Apparel &
Shoes (4.8%) | |
| | 2,743 | | | Christian Dior SA (France) | | | 442,733 | | |
| | 8,666 | | | Coach, Inc. | | | 494,742 | | |
| | | | 937,475 | | |
| | | | | Total Common Stocks
(Cost $13,140,087) | | | 19,466,531 | | |
NUMBER OF
SHARES (000) | |
| | VALUE | |
| | | Short-Term Investment (0.1%) | | | |
| | | Investment Company | | | |
| | 18 | | | Morgan Stanley Institutional
Liquidity Funds - Money
Market Portfolio -
Institutional Class
(See Note 6)
(Cost $18,195) | | $ | 18,195 | | |
Total Investments
(Cost $13,158,282) | | | 100.3 | % | | | 19,484,726 | | |
Liabilities in Excess of
Other Assets | | | (0.3 | ) | | | (51,375 | ) | |
Net Assets | | | 100.0 | % | | $ | 19,433,351 | | |
ADR American Depositary Receipt.
(a) Non-income producing security.
See Notes to Financial Statements
46
Growth
Summary of Investments n June 30, 2013 (unaudited)
INDUSTRY | | VALUE | | PERCENT OF
TOTAL
INVESTMENTS | |
Computer Services,
Software & Systems | | $ | 3,841,965 | | | | 19.7 | % | |
Diversified Retail | | | 2,882,282 | | | | 14.8 | | |
Consumer Lending | | | 1,843,180 | | | | 9.5 | | |
Pharmaceuticals | | | 1,095,047 | | | | 5.6 | | |
Textiles Apparel & Shoes | | | 937,475 | | | | 4.8 | | |
Computer Technology | | | 773,498 | | | | 4.0 | | |
Insurance:
Property-Casualty | | | 770,949 | | | | 4.0 | | |
Communications
Technology | | | 698,302 | | | | 3.6 | | |
Biotechnology | | | 672,288 | | | | 3.4 | | |
Recreational Vehicles &
Boats | | | 633,279 | | | | 3.2 | | |
Medical Equipment | | | 597,764 | | | | 3.1 | | |
Diversified Media | | | 562,997 | | | | 2.9 | | |
Chemicals: Diversified | | | 557,232 | | | | 2.9 | | |
INDUSTRY | | VALUE | | PERCENT OF
TOTAL
INVESTMENTS | |
Restaurants | | $ | 552,146 | | | | 2.8 | % | |
Financial Data & Systems | | | 521,293 | | | | 2.7 | | |
Asset Management &
Custodian | | | 499,060 | | | | 2.6 | | |
Automobiles | | | 479,568 | | | | 2.5 | | |
Semiconductors &
Components | | | 395,988 | | | | 2.0 | | |
Alternative Energy | | | 277,733 | | | | 1.4 | | |
Commercial Services | | | 248,517 | | | | 1.3 | | |
Insurance: Multi-Line | | | 224,930 | | | | 1.1 | | |
Cable Television Services | | | 104,406 | | | | 0.5 | | |
Drug & Grocery
Store Chains | | | 101,827 | | | | 0.5 | | |
Health Care Services | | | 98,275 | | | | 0.5 | | |
Radio & TV Broadcasters | | | 96,530 | | | | 0.5 | | |
Investment Company | | | 18,195 | | | | 0.1 | | |
| | | $ | 19,484,726 | | | | 100.0 | % | |
See Notes to Financial Statements
47
Focus Growth
Portfolio of Investments n June 30, 2013 (unaudited)
NUMBER OF
SHARES | |
| | VALUE | |
| | | Common Stocks (99.2%) | |
| | | Alternative Energy (1.5%) | |
| | 13,009 | | | Range Resources Corp. | | $ | 1,005,856 | | |
| | | Asset Management &
Custodian (2.8%) | |
| | 7,382 | | | BlackRock, Inc. | | | 1,896,067 | | |
| | | Automobiles (2.4%) | |
| | 15,041 | | | Tesla Motors, Inc. (a) | | | 1,615,855 | | |
| | | Biotechnology (4.0%) | |
| | 36,255 | | | Illumina, Inc. (a) | | | 2,713,324 | | |
| | | Chemicals:
Diversified (3.5%) | |
| | 23,804 | | | Monsanto Co. | | | 2,351,835 | | |
| | | Communications
Technology (4.1%) | |
| | 47,937 | | | Motorola Solutions, Inc. | | | 2,767,403 | | |
| | | Computer Services,
Software & Systems (21.4%) | |
| | 8,001 | | | Baidu, Inc. ADR (China) (a) | | | 756,335 | | |
| | 171,980 | | | Facebook, Inc., Class A (a) | | | 4,275,423 | | |
| | 6,735 | | | Google, Inc., Class A (a) | | | 5,929,292 | | |
| | 6,714 | | | LinkedIn Corp., Class A (a) | | | 1,197,106 | | |
| | 43,124 | | | Salesforce.com, Inc. (a) | | | 1,646,474 | | |
| | 10,947 | | | Workday, Inc., Class A (a) | | | 701,593 | | |
| | | | 14,506,223 | | |
| | | Computer Technology (4.5%) | |
| | 5,295 | | | Apple, Inc. | | | 2,097,244 | | |
| | 34,129 | | | Yandex N.V., Class A
(Russia) (a) | | | 942,984 | | |
| | | | 3,040,228 | | |
| | | Consumer Lending (8.0%) | |
| | 4,551 | | | Mastercard, Inc., Class A | | | 2,614,550 | | |
| | 15,483 | | | Visa, Inc., Class A | | | 2,829,518 | | |
| | | | 5,444,068 | | |
| | | Diversified Media (1.9%) | |
| | 17,696 | | | Naspers Ltd., Class N
(South Africa) | | | 1,306,830 | | |
NUMBER OF
SHARES | |
| | VALUE | |
| | | Diversified Retail (16.5%) | |
| | 23,265 | | | Amazon.com, Inc. (a) | | $ | 6,460,458 | | |
| | 202,404 | | | Groupon, Inc. (a) | | | 1,720,434 | | |
| | 3,618 | | | Priceline.com, Inc. (a) | | | 2,992,556 | | |
| | | | 11,173,448 | | |
| | | Financial Data &
Systems (1.2%) | |
| | 24,584 | | | MSCI, Inc. (a) | | | 817,910 | | |
| | | Insurance:
Property-Casualty (4.7%) | |
| | 21,754 | | | Arch Capital Group Ltd. (a) | | | 1,118,373 | | |
| | 80,401 | | | Progressive Corp. (The) | | | 2,043,793 | | |
| | | | 3,162,166 | | |
| | | Medical Equipment (3.3%) | |
| | 4,481 | | | Intuitive Surgical, Inc. (a) | | | 2,269,985 | | |
| | | Pharmaceuticals (5.8%) | |
| | 22,196 | | | Mead Johnson
Nutrition Co. | | | 1,758,589 | | |
| | 25,287 | | | Valeant Pharmaceuticals
International, Inc.
(Canada) (a) | | | 2,176,705 | | |
| | | | 3,935,294 | | |
| | | Recreational Vehicles &
Boats (3.4%) | |
| | 75,032 | | | Edenred (France) | | | 2,295,136 | | |
| | | Restaurants (3.1%) | |
| | 31,818 | | | Starbucks Corp. | | | 2,083,761 | | |
| | | Semiconductors &
Components (1.8%) | |
| | 27,656 | | | First Solar, Inc. (a) | | | 1,237,053 | | |
| | | Textiles Apparel &
Shoes (5.3%) | |
| | 10,738 | | | Christian Dior SA (France) | | | 1,733,162 | | |
| | 33,160 | | | Coach, Inc. | | | 1,893,104 | | |
| | | | 3,626,266 | | |
| | | | | Total Common Stocks
(Cost $44,944,278) | | | 67,248,708 | | |
See Notes to Financial Statements
48
Focus Growth
Portfolio of Investments n June 30, 2013 (unaudited) continued
NUMBER OF
SHARES (000) | |
| | VALUE | |
| | | Short-Term Investment (0.9%) | | | |
| | | Investment Company | | | |
| | 606 | | | Morgan Stanley Institutional
Liquidity Funds - Money
Market Portfolio -
Institutional Class
(See Note 6)
(Cost $605,745) | | $ | 605,745 | | |
Total Investments
(Cost $45,550,023) | | | 100.1 | % | | | 67,854,453 | | |
Liabilities in Excess of
Other Assets | | | (0.1 | ) | | | (44,636 | ) | |
Net Assets | | | 100.0 | % | | $ | 67,809,817 | | |
ADR American Depositary Receipt.
(a) Non-income producing security.
SUMMARY OF INVESTMENTS
INDUSTRY | | VALUE | | PERCENT OF
TOTAL
INVESTMENTS | |
Computer Services,
Software & Systems | | $ | 14,506,223 | | | | 21.4 | % | |
Diversified Retail | | | 11,173,448 | | | | 16.5 | | |
Consumer Lending | | | 5,444,068 | | | | 8.0 | | |
Pharmaceuticals | | | 3,935,294 | | | | 5.8 | | |
Textiles Apparel & Shoes | | | 3,626,266 | | | | 5.3 | | |
Insurance:
Property-Casualty | | | 3,162,166 | | | | 4.6 | | |
Computer Technology | | | 3,040,228 | | | | 4.5 | | |
Communications
Technology | | | 2,767,403 | | | | 4.1 | | |
Biotechnology | | | 2,713,324 | | | | 4.0 | | |
Chemicals: Diversified | | | 2,351,835 | | | | 3.5 | | |
Recreational Vehicles &
Boats | | | 2,295,136 | | | | 3.4 | | |
Medical Equipment | | | 2,269,985 | | | | 3.3 | | |
Restaurants | | | 2,083,761 | | | | 3.1 | | |
Asset Management &
Custodian | | | 1,896,067 | | | | 2.8 | | |
Automobiles | | | 1,615,855 | | | | 2.4 | | |
Diversified Media | | | 1,306,830 | | | | 1.9 | | |
Semiconductors &
Components | | | 1,237,053 | | | | 1.8 | | |
Alternative Energy | | | 1,005,856 | | | | 1.5 | | |
Financial Data &
Systems | | | 817,910 | | | | 1.2 | | |
Investment Company | | | 605,745 | | | | 0.9 | | |
| | | $ | 67,854,453 | | | | 100.0 | % | |
See Notes to Financial Statements
49
Multi Cap Growth
Portfolio of Investments n June 30, 2013 (unaudited)
NUMBER OF
SHARES | |
| | VALUE | |
| | | Common Stocks (100.5%) | |
| | | Alternative Energy (1.4%) | |
| | 2,892 | | | Range Resources Corp. | | $ | 223,609 | | |
| | | Automobiles (2.6%) | |
| | 3,829 | | | Tesla Motors, Inc. (a) | | | 411,349 | | |
| | | Biotechnology (4.1%) | |
| | 8,642 | | | Illumina, Inc. (a) | | | 646,767 | | |
| | | Chemicals: Diversified (2.9%) | |
| | 4,565 | | | Monsanto Co. | | | 451,022 | | |
| | | Commercial Services (7.7%) | |
| | 11,374 | | | Advisory Board Co. (The) (a) | | | 621,589 | | |
| | 9,407 | | | Corporate Executive
Board Co. (The) | | | 594,711 | | |
| | | | 1,216,300 | | |
| | | Communications
Technology (3.6%) | |
| | 9,776 | | | Motorola Solutions, Inc. | | | 564,369 | | |
| | | Computer Services,
Software & Systems (23.3%) | |
| | 1,859 | | | Baidu, Inc. ADR (China) (a) | | | 175,731 | | |
| | 34,865 | | | Facebook, Inc., Class A (a) | | | 866,744 | | |
| | 1,378 | | | Google, Inc., Class A (a) | | | 1,213,150 | | |
| | 2,096 | | | LinkedIn Corp., Class A (a) | | | 373,717 | | |
| | 9,044 | | | Salesforce.com, Inc. (a) | | | 345,300 | | |
| | 9,319 | | | Solera Holdings, Inc. | | | 518,602 | | |
| | 2,539 | | | Workday, Inc., Class A (a) | | | 162,725 | | |
| | | | 3,655,969 | | |
| | | Computer Technology (4.9%) | |
| | 925 | | | Apple, Inc. | | | 366,374 | | |
| | 14,481 | | | Yandex N.V., Class A
(Russia) (a) | | | 400,110 | | |
| | | | 766,484 | | |
| | | Consumer Lending (7.7%) | |
| | 1,013 | | | Mastercard, Inc., Class A | | | 581,969 | | |
| | 3,440 | | | Visa, Inc., Class A | | | 628,660 | | |
| | | | 1,210,629 | | |
NUMBER OF
SHARES | |
| | VALUE | |
| | | Diversified Retail (14.6%) | |
| | 4,589 | | | Amazon.com, Inc. (a) | | $ | 1,274,319 | | |
| | 43,492 | | | Groupon, Inc. (a) | | | 369,682 | | |
| | 785 | | | Priceline.com, Inc. (a) | | | 649,297 | | |
| | | | 2,293,298 | | |
| | | Financial Data & Systems (2.3%) | |
| | 10,746 | | | MSCI, Inc. (a) | | | 357,519 | | |
| | | Foods (1.7%) | |
| | 7,787 | | | Fiesta Restaurant
Group, Inc. (a) | | | 267,795 | | |
| | | Health Care Services (3.4%) | |
| | 6,344 | | | athenahealth, Inc. (a) | | | 537,464 | | |
| | | Insurance:
Property-Casualty (2.5%) | |
| | 7,468 | | | Arch Capital Group Ltd. (a) | | | 383,930 | | |
| | | Medical Equipment (3.1%) | |
| | 951 | | | Intuitive Surgical, Inc. (a) | | | 481,758 | | |
| | | Pharmaceuticals (3.7%) | |
| | 9,679 | | | Ironwood
Pharmaceuticals, Inc. (a) | | | 96,306 | | |
| | 5,630 | | | Valeant Pharmaceuticals
International, Inc.
(Canada) (a) | | | 484,630 | | |
| | | | 580,936 | | |
| | | Recreational Vehicles &
Boats (3.4%) | |
| | 17,678 | | | Edenred (France) | | | 540,748 | | |
| | | Restaurants (2.8%) | |
| | 6,810 | | | Starbucks Corp. | | | 445,987 | | |
| | | Semiconductors &
Components (2.5%) | |
| | 8,602 | | | First Solar, Inc. (a) | | | 384,767 | | |
| | | Textiles Apparel & Shoes (2.3%) | |
| | 2,219 | | | Christian Dior SA (France) | | | 358,157 | | |
| | | | | Total Common Stocks
(Cost $10,956,589) | | | 15,778,857 | | |
See Notes to Financial Statements
50
Multi Cap Growth
Portfolio of Investments n June 30, 2013 (unaudited) continued
NUMBER OF
SHARES (000) | |
| |
VALUE | |
| | | Short-Term Investment (0.0%) | | | |
| | | Investment Company | | | |
| | 7 | | | Morgan Stanley Institutional
Liquidity Funds - Money Market
Portfolio - Institutional Class
(See Note 6)
(Cost $6,669) | | $ | 6,669 | | |
Total Investments
(Cost $10,963,258) | | | 100.5 | % | | | 15,785,526 | | |
Liabilities in Excess of
Other Assets | | | (0.5 | ) | | | (76,488 | ) | |
Net Assets | | | 100.0 | % | | $ | 15,709,038 | | |
ADR American Depositary Receipt.
(a) Non-income producing security.
SUMMARY OF INVESTMENTS
INDUSTRY | | VALUE | | PERCENT OF
TOTAL
INVESTMENTS | |
Computer Services,
Software & Systems | | $ | 3,655,969 | | | | 23.2 | % | |
Diversified Retail | | | 2,293,298 | | | | 14.5 | | |
Commercial Services | | | 1,216,300 | | | | 7.7 | | |
Consumer Lending | | | 1,210,629 | | | | 7.7 | | |
Computer Technology | | | 766,484 | | | | 4.9 | | |
Biotechnology | | | 646,767 | | | | 4.1 | | |
Pharmaceuticals | | | 580,936 | | | | 3.7 | | |
Communications
Technology | | | 564,369 | | | | 3.6 | | |
Recreational Vehicles &
Boats | | | 540,748 | | | | 3.4 | | |
Health Care Services | | | 537,464 | | | | 3.4 | | |
Medical Equipment | | | 481,758 | | | | 3.0 | | |
Chemicals: Diversified | | | 451,022 | | | | 2.9 | | |
Restaurants | | | 445,987 | | | | 2.8 | | |
Automobiles | | | 411,349 | | | | 2.6 | | |
Semiconductors &
Components | | | 384,767 | | | | 2.4 | | |
Insurance:
Property-Casualty | | | 383,930 | | | | 2.4 | | |
Textiles Apparel & Shoes | | | 358,157 | | | | 2.3 | | |
Financial Data & Systems | | | 357,519 | | | | 2.3 | | |
Foods | | | 267,795 | | | | 1.7 | | |
Alternative Energy | | | 223,609 | | | | 1.4 | | |
Investment Company | | | 6,669 | | | | 0.0 | * | |
| | | $ | 15,785,526 | | | | 100.0 | % | |
* Amount is less than 0.05%
See Notes to Financial Statements
51
Mid Cap Growth
Portfolio of Investments n June 30, 2013 (unaudited)
NUMBER OF
SHARES | |
| |
VALUE | |
| | | Common Stocks (98.1%) | |
| | | Advertising Agencies (1.1%) | |
| | 17,325 | | | Aimia, Inc. (Canada) | | $ | 259,290 | | |
| | | Alternative Energy (2.8%) | |
| | 7,109 | | | Range Resources Corp. | | | 549,668 | | |
| | 6,058 | | | Ultra Petroleum Corp. (a) | | | 120,069 | | |
| | | | 669,737 | | |
| | | Automobiles (2.4%) | |
| | 5,410 | | | Tesla Motors, Inc. (a) | | | 581,196 | | |
| | | Beverage: Soft Drinks (1.7%) | |
| | 6,708 | | | Monster Beverage Corp. (a) | | | 407,645 | | |
| | | Biotechnology (4.0%) | |
| | 12,988 | | | Illumina, Inc. (a) | | | 972,022 | | |
| | | Cement (2.3%) | |
| | 5,618 | | | Martin Marietta Materials, Inc. | | | 552,924 | | |
| | | Chemicals: Diversified (2.4%) | |
| | 9,036 | | | Rockwood Holdings, Inc. | | | 578,575 | | |
| | | Commercial Services (4.9%) | |
| | 11,673 | | | Gartner, Inc. (a) | | | 665,244 | | |
| | 6,677 | | | Intertek Group PLC
(United Kingdom) | | | 296,842 | | |
| | 2,031 | | | MercadoLibre, Inc. (Brazil) | | | 218,861 | | |
| | | | 1,180,947 | | |
| | | Communications
Technology (3.3%) | |
| | 13,849 | | | Motorola Solutions, Inc. | | | 799,503 | | |
| | | Computer Services,
Software & Systems (17.4%) | |
| | 15,728 | | | Akamai Technologies, Inc. (a) | | | 669,227 | | |
| | 5,550 | | | IHS, Inc., Class A (a) | | | 579,309 | | |
| | 3,194 | | | LinkedIn Corp., Class A (a) | | | 569,490 | | |
| | 4,300 | | | Mail.ru Group Ltd.
GDR (Russia) | | | 123,238 | | |
| | 6,301 | | | Qihoo 360 Technology Co.,
Ltd. ADR (China) (a) | | | 290,917 | | |
| | 14,032 | | | Salesforce.com, Inc. (a) | | | 535,742 | | |
| | 3,511 | | | ServiceNow, Inc. (a) | | | 141,809 | | |
| | 2,000 | | | SINA Corp. (China) (a) | | | 111,460 | | |
| | 14,425 | | | Solera Holdings, Inc. | | | 802,751 | | |
NUMBER OF
SHARES | |
| |
VALUE | |
| | 3,869 | | | Workday, Inc., Class A (a) | | $ | 247,964 | | |
| | 47,090 | | | Zynga, Inc., Class A (a) | | | 130,910 | | |
| | | | 4,202,817 | | |
| | | Computer Technology (4.0%) | |
| | 15,229 | | | Dropbox, Inc. (a)(b)(c)
(acquisition cost - $137,809;
acquired 05/01/12) | | | 129,903 | | |
| | 20,431 | | | Yandex N.V., Class A
(Russia) (a) | | | 564,509 | | |
| | 13,912 | | | Youku Tudou, Inc. ADR
(China) (a) | | | 266,971 | | |
| | | | 961,383 | | |
| | | Consumer Lending (1.7%) | |
| | 2,280 | | | IntercontinentalExchange,
Inc. (a) | | | 405,293 | | |
| | | Consumer Services:
Miscellaneous (0.8%) | |
| | 25,470 | | | Qualicorp SA (Brazil) (a) | | | 192,907 | | |
| | | Diversified Manufacturing
Operations (1.0%) | |
| | 4,757 | | | Colfax Corp. (a) | | | 247,887 | | |
| | | Diversified Media (1.5%) | |
| | 6,631 | | | McGraw Hill Financial, Inc. | | | 352,703 | | |
| | | Diversified Retail (6.1%) | |
| | 12,316 | | | Dollar Tree, Inc. (a) | | | 626,146 | | |
| | 65,242 | | | Groupon, Inc. (a) | | | 554,557 | | |
| | 4,791 | | | TripAdvisor, Inc. (a) | | | 291,628 | | |
| | | | 1,472,331 | | |
| | | Electronic Components (0.6%) | |
| | 3,501 | | | 3D Systems Corp. (a) | | | 153,694 | | |
| | | Electronic Entertainment (0.7%) | |
| | 3,549 | | | Splunk, Inc. (a) | | | 164,532 | | |
| | | Entertainment (1.1%) | |
| | 153 | | | Legend Pictures LLC
Ltd. (a)(b)(c)
(acquisition cost - $163,577;
acquired 03/08/12) | | | 257,576 | | |
See Notes to Financial Statements
52
Mid Cap Growth
Portfolio of Investments n June 30, 2013 (unaudited) continued
NUMBER OF
SHARES | |
| |
VALUE | |
| | | Financial Data & Systems (3.9%) | |
| | 17,005 | | | MSCI, Inc. (a) | | $ | 565,756 | | |
| | 6,277 | | | Verisk Analytics, Inc.,
Class A (a) | | | 374,737 | | |
| | | | 940,493 | | |
| | | Foods (2.2%) | |
| | 7,755 | | | McCormick & Co., Inc. | | | 545,642 | | |
| | | Health Care Services (4.1%) | |
| | 7,155 | | | athenahealth, Inc. (a) | | | 606,172 | | |
| | 3,399 | | | Stericycle, Inc. (a) | | | 375,351 | | |
| | | | 981,523 | | |
| | | Hotel/Motel (0.9%) | |
| | 3,940 | | | Wyndham Worldwide Corp. | | | 225,486 | | |
| | | Insurance:
Property-Casualty (4.9%) | |
| | 11,459 | | | Arch Capital Group Ltd. (a) | | | 589,107 | | |
| | 23,005 | | | Progressive Corp. (The) | | | 584,787 | | |
| | | | 1,173,894 | | |
| | | Medical Equipment (2.0%) | |
| | 937 | | | Intuitive Surgical, Inc. (a) | | | 474,665 | | |
| | | Personal Care (0.5%) | |
| | 4,065 | | | Sally Beauty Holdings, Inc. (a) | | | 126,422 | | |
| | | Pharmaceuticals (3.1%) | |
| | 14,671 | | | Ironwood Pharmaceuticals,
Inc. (a) | | | 145,977 | | |
| | 7,635 | | | Mead Johnson Nutrition Co. | | | 604,921 | | |
| | | | 750,898 | | |
| | | Publishing (1.6%) | |
| | 4,914 | | | Morningstar, Inc. | | | 381,228 | | |
| | | Recreational Vehicles & Boats (3.2%) | |
| | 25,720 | | | Edenred (France) | | | 786,743 | | |
| | | Restaurants (4.2%) | |
| | 9,251 | | | Dunkin' Brands Group, Inc. | | | 396,128 | | |
| | 3,371 | | | Panera Bread Co., Class A (a) | | | 626,804 | | |
| | | | 1,022,932 | | |
| | | Scientific Instruments:
Pollution Control (1.5%) | |
| | 18,502 | | | Covanta Holding Corp. | | | 370,410 | | |
NUMBER OF
SHARES | |
| |
VALUE | |
| | | Semiconductors &
Components (1.6%) | |
| | 8,906 | | | First Solar, Inc. (a) | | $ | 398,365 | | |
| | | Specialty Retail (0.5%) | |
| | 1,339 | | | Ulta Salon Cosmetics &
Fragrance, Inc. (a) | | | 134,114 | | |
| | | Textiles Apparel & Shoes (2.6%) | |
| | 8,491 | | | Carter's, Inc. | | | 628,928 | | |
| | | Utilities: Electrical (1.5%) | |
| | 9,671 | | | Brookfield Infrastructure
Partners LP (Canada) | | | 353,185 | | |
| | | | | Total Common Stocks
(Cost $18,830,160) | | | 23,707,890 | | |
| | | Convertible Preferred Stocks (0.1%) | |
| | | Communications
Technology (0.0%) | |
| | 2,438 | | | Peixe Urbano, Inc.
(Brazil) (a)(b)(c)
(acquisition cost - $80,261;
acquired 12/02/11) | | | 4,754 | | |
| | | Computer Technology (0.1%) | |
| | 1,479 | | | Dropbox, Inc.,
Series A (a)(b)(c) (acquisition
cost - $13,384;
acquired 05/25/12) | | | 12,616 | | |
| | | | | Total Convertible
Preferred Stocks
(Cost $93,645) | | | 17,370 | | |
| | | Preferred Stock (0.2%) | |
| | | Computer Services,
Software & Systems | |
| | 14,953 | | | Palantir Technologies, Inc.,
Series G (a)(b)(c)
(acquisition cost - $45,756;
acquired 07/19/12)
(Cost $45,756) | | | 42,915 | | |
See Notes to Financial Statements
53
Mid Cap Growth
Portfolio of Investments n June 30, 2013 (unaudited) continued
NUMBER OF
SHARES (000) | |
| |
VALUE | |
| | | Short-Term Investment (1.5%) | | | |
| | | Investment Company | | | |
| | 364 | | | Morgan Stanley Institutional
Liquidity Funds - Money Market
Portfolio - Institutional Class
(See Note 6)
(Cost $364,358) | | $ | 364,358 | | |
Total Investments
(Cost $19,333,919) | | | 99.9 | % | | | 24,132,533 | | |
Other Assets in Excess of
Liabilities | | | 0.1 | | | | 16,490 | | |
Net Assets | | | 100.0 | % | | $ | 24,149,023 | | |
ADR American Depositary Receipt.
GDR Global Depositary Receipt.
(a) Non-income producing security.
(b) Security cannot be offered for public resale without first being registered under the Securities Act of 1933 and related rules ("restricted security"). Acquisition date represents the day on which an enforceable right to acquire such security is obtained and is presented along with related cost in the security description. The Portfolio has registration rights for certain restricted securities. Any costs related to such registration are borne by the issuer. The aggregate value of restricted securities (excluding 144A holdings) at June 30, 2013 amounts to $447,764 and represents 1.9% of net assets.
(c) At June 30, 2013, the Portfolio held fair valued securities valued at $447,764, representing 1.9% of net assets. These securities have been fair valued as determined in good faith under procedures established by and under the general supervision of the Fund's Trustees.
See Notes to Financial Statements
54
Mid Cap Growth
Summary of Investments n June 30, 2013 (unaudited)
INDUSTRY | | VALUE | | PERCENT OF
TOTAL
INVESTMENTS | |
Computer Services,
Software & Systems | | $ | 4,245,732 | | | | 17.6 | % | |
Diversified Retail | | | 1,472,331 | | | | 6.1 | | |
Commercial Services | | | 1,180,947 | | | | 4.9 | | |
Insurance:
Property-Casualty | | | 1,173,894 | | | | 4.9 | | |
Restaurants | | | 1,022,932 | | | | 4.2 | | |
Health Care Services | | | 981,523 | | | | 4.1 | | |
Computer Technology | | | 973,999 | | | | 4.0 | | |
Biotechnology | | | 972,022 | | | | 4.0 | | |
Financial Data & Systems | | | 940,493 | | | | 3.9 | | |
Communications
Technology | | | 804,257 | | | | 3.3 | | |
Recreational Vehicles &
Boats | | | 786,743 | | | | 3.3 | | |
Pharmaceuticals | | | 750,898 | | | | 3.1 | | |
Alternative Energy | | | 669,737 | | | | 2.8 | | |
Textiles Apparel & Shoes | | | 628,928 | | | | 2.6 | | |
Automobiles | | | 581,196 | | | | 2.4 | | |
Chemicals: Diversified | | | 578,575 | | | | 2.4 | | |
Cement | | | 552,924 | | | | 2.3 | | |
Foods | | | 545,642 | | | | 2.3 | | |
Medical Equipment | | | 474,665 | | | | 2.0 | | |
INDUSTRY | | VALUE | | PERCENT OF
TOTAL
INVESTMENTS | |
Beverage: Soft Drinks | | $ | 407,645 | | | | 1.7 | % | |
Consumer Lending | | | 405,293 | | | | 1.7 | | |
Semiconductors &
Components | | | 398,365 | | | | 1.6 | | |
Publishing | | | 381,228 | | | | 1.6 | | |
Scientific Instruments:
Pollution Control | | | 370,410 | | | | 1.5 | | |
Investment Company | | | 364,358 | | | | 1.5 | | |
Utilities: Electrical | | | 353,185 | | | | 1.5 | | |
Diversified Media | | | 352,703 | | | | 1.5 | | |
Advertising Agencies | | | 259,290 | | | | 1.1 | | |
Entertainment | | | 257,576 | | | | 1.1 | | |
Diversified Manufacturing
Operations | | | 247,887 | | | | 1.0 | | |
Hotel/Motel | | | 225,486 | | | | 0.9 | | |
Consumer Services:
Miscellaneous | | | 192,907 | | | | 0.8 | | |
Electronic Entertainment | | | 164,532 | | | | 0.7 | | |
Electronic Components | | | 153,694 | | | | 0.6 | | |
Specialty Retail | | | 134,114 | | | | 0.5 | | |
Personal Care | | | 126,422 | | | | 0.5 | | |
| | | $ | 24,132,533 | | | | 100.0 | % | |
See Notes to Financial Statements
55
Morgan Stanley Select Dimensions Investment Series
Financial Statements
Statements of Assets and Liabilities
June 30, 2013 (unaudited)
| | |
Money
Market | |
Flexible
Income | |
Global
Infrastructure | |
Growth | |
Assets: | |
Investments in securities, at value* | | $ | 62,651,166 | (1) | | $ | 18,994,106 | | | $ | 25,185,848 | (2) | | $ | 19,466,531 | | |
Investments in affiliates, at value** | | | — | | | | 873,462 | | | | 2,244,356 | | | | 18,195 | | |
Total investments in securities, at value | | | 62,651,166 | | | | 19,867,568 | | | | 27,430,204 | | | | 19,484,726 | | |
Unrealized appreciation on open swap agreements | | | — | | | | 113,774 | | | | — | | | | — | | |
Unrealized appreciation on open foreign currency forward exchange contracts | | | — | | | | 14,402 | | | | — | | | | — | | |
Cash | | | 9,115 | | | | 5,671 | (3) | | | 261,321 | (3) | | | — | | |
Receivable for: | |
Investments sold | | | — | | | | 146,951 | | | | 326,853 | | | | — | | |
Interest and paydown | | | 13,594 | | | | 253,049 | | | | — | | | | — | | |
Dividends | | | — | | | | — | | | | 152,633 | | | | 8,184 | | |
Variation margin | | | — | | | | 37,030 | | | | — | | | | — | | |
Foreign withholding taxes reclaimed | | | — | | | | — | | | | 16,004 | | | | 3,835 | | |
Premium paid on open swap agreements | | | — | | | | 19,192 | | | | — | | | | — | | |
Interest and dividends from affiliates | | | — | | | | 2,764 | | | | 1 | | | | 17 | | |
Due from Adviser | | | 1,486 | | | | — | | | | — | | | | — | | |
Prepaid expenses and other assets | | | 3,485 | | | | 2,677 | | | | 5,812 | | | | 3,243 | | |
Total Assets | | | 62,678,846 | | | | 20,463,078 | | | | 28,192,828 | | | | 19,500,005 | | |
Liabilities: | |
Collateral on securities loaned, at value | | | — | | | | — | | | | 2,842,160 | | | | — | | |
Unrealized depreciation on open swap agreements | | | — | | | | 5,706 | | | | — | | | | — | | |
Unrealized depreciation on open foreign currency forward exchange contracts | | | — | | | | 16,289 | | | | — | | | | — | | |
Payable for: | |
Shares of beneficial interest redeemed | | | 465,101 | | | | 8,276 | | | | 12,080 | | | | 7,818 | | |
Investments purchased | | | — | | | | 286,895 | | | | — | | | | — | | |
Advisory fee | | | — | | | | 5,342 | | | | 12,195 | | | | 8,025 | | |
Distribution fee (Class Y) | | | — | | | | 2,246 | | | | 1,486 | | | | 2,181 | | |
Administration fee | | | — | | | | 1,352 | | | | 1,712 | | | | 1,288 | | |
Transfer agent fee | | | 504 | | | | 282 | | | | 218 | | | | 177 | | |
Accrued expenses and other payables | | | 27,294 | | | | 94,102 | | | | 20,981 | | | | 47,165 | | |
Total Liabilities | | | 492,899 | | | | 420,490 | | | | 2,890,832 | | | | 66,654 | | |
Net Assets | | $ | 62,185,947 | | | $ | 20,042,588 | | | $ | 25,301,996 | | | $ | 19,433,351 | | |
Composition of Net Assets: | |
Paid-in-capital | | $ | 62,185,312 | | | $ | 32,900,193 | | | $ | 17,836,763 | | | $ | 10,807,893 | | |
Net unrealized appreciation (depreciation) | | | — | | | | 567,617 | | | | 5,606,230 | | | | 6,326,444 | | |
Accumulated undistributed net investment income (net investment loss) | | | 2,101 | | | | 1,547,541 | | | | 283,529 | | | | (30,351 | ) | |
Accumulated net realized gain (loss) | | | (1,466 | ) | | | (14,972,763 | ) | | | 1,575,474 | | | | 2,329,365 | | |
Net Assets | | $ | 62,185,947 | | | $ | 20,042,588 | | | $ | 25,301,996 | | | $ | 19,433,351 | | |
| * Cost | | $ | 62,651,166 | | | $ | 18,525,923 | | | $ | 19,578,273 | | | $ | 13,140,087 | | |
| ** Affiliated Cost | | $ | — | | | $ | 844,312 | | | $ | 2,244,356 | | | $ | 18,195 | | |
Class X Shares: | |
Net Assets | | $ | 22,193,183 | | | $ | 9,449,707 | | | $ | 18,229,528 | | | $ | 8,918,053 | | |
| Shares Outstanding (unlimited shares authorized, $0.01 par value) | | | 22,193,193 | | | | 1,483,493 | | | | 790,653 | | | | 323,714 | | |
Net Asset Value Per Share | | $ | 1.00 | | | $ | 6.37 | | | $ | 23.06 | | | $ | 27.55 | | |
Class Y Shares: | |
Net Assets | | $ | 39,992,764 | | | $ | 10,592,881 | | | $ | 7,072,468 | | | $ | 10,515,298 | | |
| Shares Outstanding (unlimited shares authorized, $0.01 par value) | | | 39,992,119 | | | | 1,675,509 | | | | 306,852 | | | | 392,097 | | |
Net Asset Value Per Share | | $ | 1.00 | | | $ | 6.32 | | | $ | 23.05 | | | $ | 26.82 | | |
(1) Including repurchase agreements of $27,144,000.
(2) Including security loaned at value of $2,694,871.
(3) Including foreign currency valued at $5,058, $24,570, and $2,380, respectively with a cost of $5,182, $24,611, and $2,390, respectively.
See Notes to Financial Statements
56
| | |
Focus
Growth | |
Multi Cap
Growth | |
Mid Cap
Growth | |
Assets: | |
Investments in securities, at value* | | $ | 67,248,708 | | | $ | 15,778,857 | | | $ | 23,768,175 | | |
Investments in affiliates, at value** | | | 605,745 | | | | 6,669 | | | | 364,358 | | |
Total investments in securities, at value | | | 67,854,453 | | | | 15,785,526 | | | | 24,132,533 | | |
Unrealized appreciation on open swap agreements | | | — | | | | — | | | | — | | |
Unrealized appreciation on open foreign currency forward exchange contracts | | | — | | | | — | | | | — | | |
Cash | | | — | | | | — | | | | 5,936 | (3) | |
Receivable for: | |
Investments sold | | | — | | | | — | | | | 41,496 | | |
Interest and paydown | | | — | | | | — | | | | — | | |
Dividends | | | 31,202 | | | | 2,542 | | | | 9,540 | | |
Variation margin | | | — | | | | — | | | | — | | |
Foreign withholding taxes reclaimed | | | 14,739 | | | | — | | | | 1,516 | | |
Premium paid on open swap agreements | | | — | | | | — | | | | — | | |
Interest and dividends from affiliates | | | 99 | | | | 19 | | | | 42 | | |
Due from Adviser | | | — | | | | — | | | | — | | |
Prepaid expenses and other assets | | | 4,427 | | | | 4,495 | | | | 7,432 | | |
Total Assets | | | 67,904,920 | | | | 15,792,582 | | | | 24,198,495 | | |
Liabilities: | |
Collateral on securities loaned, at value | | | — | | | | — | | | | — | | |
Unrealized depreciation on open swap agreements | | | — | | | | — | | | | — | | |
Unrealized depreciation on open foreign currency forward exchange contracts | | | — | | | | — | | | | — | | |
Payable for: | |
Shares of beneficial interest redeemed | | | 22,431 | | | | 13,099 | | | | 8,324 | | |
Investments purchased | | | — | | | | — | | | | — | | |
Advisory fee | | | 30,420 | | | | 8,658 | | | | 8,264 | | |
Distribution fee (Class Y) | | | 2,977 | | | | 1,706 | | | | 1,311 | | |
Administration fee | | | 4,488 | | | | 1,037 | | | | 1,587 | | |
Transfer agent fee | | | 255 | | | | 531 | | | | 689 | | |
Accrued expenses and other payables | | | 34,532 | | | | 58,513 | | | | 29,297 | | |
Total Liabilities | | | 95,103 | | | | 83,544 | | | | 49,472 | | |
Net Assets | | $ | 67,809,817 | | | $ | 15,709,038 | | | $ | 24,149,023 | | |
Composition of Net Assets: | |
Paid-in-capital | | $ | 41,198,132 | | | $ | 9,258,370 | | | $ | 19,065,879 | | |
Net unrealized appreciation (depreciation) | | | 22,304,429 | | | | 4,822,268 | | | | 4,798,553 | | |
Accumulated undistributed net investment income (net investment loss) | | | 249,376 | | | | (99,458 | ) | | | (19,434 | ) | |
Accumulated net realized gain (loss) | | | 4,057,880 | | | | 1,727,858 | | | | 304,025 | | |
Net Assets | | $ | 67,809,817 | | | $ | 15,709,038 | | | $ | 24,149,023 | | |
| * Cost | | $ | 44,944,278 | | | $ | 10,956,589 | | | $ | 18,969,561 | | |
| ** Affiliated Cost | | $ | 605,745 | | | $ | 6,669 | | | $ | 364,358 | | |
Class X Shares: | |
Net Assets | | $ | 53,357,709 | | | $ | 7,414,890 | | | $ | 17,778,826 | | |
| Shares Outstanding (unlimited shares authorized, $0.01 par value) | | | 2,040,529 | | | | 417,420 | | | | 475,458 | | |
Net Asset Value Per Share | | $ | 26.15 | | | $ | 17.76 | | | $ | 37.39 | | |
Class Y Shares: | |
Net Assets | | $ | 14,452,108 | | | $ | 8,294,148 | | | $ | 6,370,197 | | |
| Shares Outstanding (unlimited shares authorized, $0.01 par value) | | | 563,584 | | | | 483,487 | | | | 174,330 | | |
Net Asset Value Per Share | | $ | 25.64 | | | $ | 17.15 | | | $ | 36.54 | | |
57
Morgan Stanley Select Dimensions Investment Series
Financial Statements continued
Statements of Operations
For the six months ended June 30, 2013 (unaudited)
| | | Money
Market | | Flexible
Income | | Global
Infrastructure | | Growth | |
Net Investment Income: | |
Income | |
Dividends† | | $ | — | | | $ | 16 | | | $ | 469,679 | | | $ | 110,844 | | |
Interest† | | | 70,946 | | | | 581,313 | | | | — | | | | — | | |
Interest and dividends from affiliates (Note 6) | | | — | | | | 10,042 | | | | 41 | | | | 346 | | |
Income from securities loaned - net | | | — | | | | — | | | | 3 | | | | — | | |
Total Income | | | 70,946 | | | | 591,371 | | | | 469,723 | | | | 111,190 | | |
†Net of foreign withholding taxes | | | — | | | | — | | | | 25,486 | | | | 6,011 | | |
Expenses | |
Advisory fee (Note 4) | | | 143,722 | | | | 34,324 | | | | 76,851 | | | | 49,260 | | |
Professional fees | | | 38,038 | | | | 20,968 | | | | 29,662 | | | | 20,533 | | |
Distribution fee (Class Y shares) (Note 5) | | | 52,095 | | | | 14,385 | | | | 9,475 | | | | 13,409 | | |
Merger expense | | | — | | | | 53,829 | | | | — | | | | 29,187 | | |
Custodian fees | | | 9,046 | | | | 15,939 | | | | 20,921 | | | | 7,991 | | |
Administration fee (Note 4) | | | 15,969 | | | | 8,581 | | | | 10,786 | | | | 7,882 | | |
Shareholder reports and notices | | | 10,650 | | | | 7,286 | | | | 5,841 | | | | 3,649 | | |
Transfer agent fees and expenses | | | 1,846 | | | | 1,615 | | | | 1,551 | | | | 1,510 | | |
Trustees' fees and expenses | | | 1,261 | | | | 220 | | | | 449 | | | | 410 | | |
Other | | | 3,722 | | | | 26,551 | | | | 8,548 | | | | 7,125 | | |
Total Expenses | | | 276,349 | | | | 183,698 | | | | 164,084 | | | | 140,956 | | |
Less: amounts waived (Note 5) | | | (208,598 | ) | | | — | | | | — | | | | — | | |
Less: rebate from Morgan Stanley affiliated cash sweep (Note 6) | | | — | | | | (375 | ) | | | (197 | ) | | | (405 | ) | |
Net Expenses | | | 67,751 | | | | 183,323 | | | | 163,887 | | | | 140,551 | | |
Net Investment Income (Loss) | | | 3,195 | | | | 408,048 | | | | 305,836 | | | | (29,361 | ) | |
Realized and Unrealized Gain (Loss): | |
Realized Gain (Loss) on: | |
Investments | | | — | | | | 338,015 | | | | 1,700,155 | | | | 913,764 | | |
Investments in affiliates (Note 6) | | | — | | | | 2,264 | | | | — | | | | — | | |
Futures contracts | | | — | | | | (66,027 | ) | | | — | | | | — | | |
Swap agreements | | | — | | | | 70,191 | | | | — | | | | — | | |
Foreign currency forward exchange contracts | | | — | | | | 11,143 | | | | — | | | | — | | |
Foreign currency translation | | | — | | | | 102 | | | | (1,297 | ) | | | 699 | | |
Net Realized Gain | | | — | | | | 355,688 | | | | 1,698,858 | | | | 914,463 | | |
Change in Unrealized Appreciation (Depreciation) on: | |
Investments | | | — | | | | (945,513 | ) | | | (569,638 | ) | | | 1,320,439 | | |
Investments in affiliates (Note 6) | | | — | | | | 147 | | | | — | | | | — | | |
Futures contracts | | | — | | | | (41,812 | ) | | | — | | | | — | | |
Swap agreements | | | — | | | | 116,700 | | | | — | | | | — | | |
Foreign currency forward exchange contracts | | | — | | | | (1,341 | ) | | | — | | | | — | | |
Foreign currency translation | | | — | | | | (89 | ) | | | (2,132 | ) | | | — | | |
Net Change in Unrealized Appreciation (Depreciation) | | | — | | | | (871,908 | ) | | | (571,770 | ) | | | 1,320,439 | | |
Net Gain (Loss) | | | — | | | | (516,220 | ) | | | 1,127,088 | | | | 2,234,902 | | |
Net Increase (Decrease) | | $ | 3,195 | | | $ | (108,172 | ) | | $ | 1,432,924 | | | $ | 2,205,541 | | |
See Notes to Financial Statements
58
| | | Focus
Growth | | Multi Cap
Growth | | Mid Cap
Growth | |
Net Investment Income: | |
Income | |
Dividends† | | $ | 337,414 | | | $ | 50,438 | | | $ | 99,382 | | |
Interest† | | | — | | | | — | | | | — | | |
Interest and dividends from affiliates (Note 6) | | | 1,282 | | | | 288 | | | | 383 | | |
Income from securities loaned - net | | | — | | | | — | | | | — | | |
Total Income | | | 338,696 | | | | 50,726 | | | | 99,765 | | |
†Net of foreign withholding taxes | | | 19,864 | | | | 4,608 | | | | 5,360 | | |
Expenses | |
Advisory fee (Note 4) | | | 186,611 | | | | 53,234 | | | | 50,124 | | |
Professional fees | | | 22,113 | | | | 23,090 | | | | 31,684 | | |
Distribution fee (Class Y shares) (Note 5) | | | 18,524 | | | | 10,496 | | | | 7,980 | | |
Merger expense | | | — | | | | 29,319 | | | | — | | |
Custodian fees | | | 7,368 | | | | 12,075 | | | | 13,371 | | |
Administration fee (Note 4) | | | 27,392 | | | | 6,356 | | | | 9,547 | | |
Shareholder reports and notices | | | 7,381 | | | | 7,540 | | | | 4,793 | | |
Transfer agent fees and expenses | | | 1,755 | | | | 1,864 | | | | 2,024 | | |
Trustees' fees and expenses | | | 940 | | | | 295 | | | | 818 | | |
Other | | | 7,295 | | | | 5,576 | | | | 5,667 | | |
Total Expenses | | | 279,379 | | | | 149,845 | | | | 126,008 | | |
Less: amounts waived (Note 5) | | | — | | | | — | | | | — | | |
Less: rebate from Morgan Stanley affiliated cash sweep (Note 6) | | | (1,534 | ) | | | (340 | ) | | | (452 | ) | |
Net Expenses | | | 277,845 | | | | 149,505 | | | | 125,556 | | |
Net Investment Income (Loss) | | | 60,851 | | | | (98,779 | ) | | | (25,791 | ) | |
Realized and Unrealized Gain (Loss): | |
Realized Gain (Loss) on: | |
Investments | | | 5,089,776 | | | | 1,399,438 | | | | 356,887 | | |
Investments in affiliates (Note 6) | | | — | | | | — | | | | — | | |
Futures contracts | | | — | | | | — | | | | — | | |
Swap agreements | | | — | | | | — | | | | — | | |
Foreign currency forward exchange contracts | | | — | | | | — | | | | — | | |
Foreign currency translation | | | (1,698 | ) | | | (146 | ) | | | 501 | | |
Net Realized Gain | | | 5,088,078 | | | | 1,399,292 | | | | 357,388 | | |
Change in Unrealized Appreciation (Depreciation) on: | |
Investments | | | 2,821,318 | | | | 492,510 | | | | 2,883,507 | | |
Investments in affiliates (Note 6) | | | — | | | | — | | | | — | | |
Futures contracts | | | — | | | | — | | | | — | | |
Swap agreements | | | — | | | | — | | | | — | | |
Foreign currency forward exchange contracts | | | — | | | | — | | | | — | | |
Foreign currency translation | | | — | | | | 4 | | | | (52 | ) | |
Net Change in Unrealized Appreciation (Depreciation) | | | 2,821,318 | | | | 492,514 | | | | 2,883,455 | | |
Net Gain (Loss) | | | 7,909,396 | | | | 1,891,806 | | | | 3,240,843 | | |
Net Increase (Decrease) | | $ | 7,970,247 | | | $ | 1,793,027 | | | $ | 3,215,052 | | |
59
Morgan Stanley Select Dimensions Investment Series
Financial Statements continued
Statements of Changes in Net Assets
| | | Money Market | | Flexible Income | | Global Infrastructure | |
| | | For The Six
Months Ended
June 30, 2013 | | For The Year
Ended
December 31, 2012 | | For The Six
Months Ended
June 30, 2013 | | For The Year
Ended
December 31, 2012 | | For The Six
Months Ended
June 30, 2013 | | For The Year
Ended
December 31, 2012 | |
| | | (unaudited) | | | | (unaudited) | | | | (unaudited) | | | |
Increase (Decrease) in Net Assets: | |
Operations: | |
Net investment income (loss) | | $ | 3,195 | | | $ | 6,030 | | | $ | 408,048 | | | $ | 1,118,695 | | | $ | 305,836 | | | $ | 603,375 | | |
Net realized gain (loss) | | | — | | | | 13 | | | | 355,688 | | | | 762,872 | | | | 1,698,858 | | | | 2,329,500 | | |
Net change in unrealized appreciation (depreciation) | | | — | | | | — | | | | (871,908 | ) | | | 944,611 | | | | (571,770 | ) | | | 1,582,220 | | |
Net Increase (Decrease) | | | 3,195 | | | | 6,043 | | | | (108,172 | ) | | | 2,826,178 | | | | 1,432,924 | | | | 4,515,095 | | |
Dividends and Distributions to Shareholders from: | |
Net investment income | |
Class X Shares | | | (1,110 | ) | | | (3,087 | ) | | | — | | | | (689,754 | ) | | | (468,224 | ) | | | (438,478 | ) | |
Class Y Shares | | | (2,084 | ) | | | (5,999 | ) | | | — | | | | (775,294 | ) | | | (162,916 | ) | | | (151,957 | ) | |
Net realized gain | |
Class X Shares | | | — | | | | — | | | | — | | | | — | | | | (1,650,640 | ) | | | (1,819,783 | ) | |
Class Y Shares | | | — | | | | — | | | | — | | | | — | | | | (641,949 | ) | | | (715,240 | ) | |
Total Dividends and Distributions | | | (3,194 | ) | | | (9,086 | ) | | | — | | | | (1,465,048 | ) | | | (2,923,729 | ) | | | (3,125,458 | ) | |
Net increase (decrease) from transactions in shares of
beneficial interest | | | (8,676,364 | ) | | | (12,770,135 | ) | | | (2,132,321 | ) | | | (3,011,347 | ) | | | 36,993 | | | | (2,779,186 | ) | |
Net Decrease | | | (8,676,363 | ) | | | (12,773,178 | ) | | | (2,240,493 | ) | | | (1,650,217 | ) | | | (1,453,812 | ) | | | (1,389,549 | ) | |
Net Assets: | |
Beginning of period | | | 70,862,310 | | | | 83,635,488 | | | | 22,283,081 | | | | 23,933,298 | | | | 26,755,808 | | | | 28,145,357 | | |
End of Period | | $ | 62,185,947 | | | $ | 70,862,310 | | | $ | 20,042,588 | | | $ | 22,283,081 | | | $ | 25,301,996 | | | $ | 26,755,808 | | |
Accumulated Undistributed Net Investment
Income (Loss) | | $ | 2,101 | | | $ | 2,100 | | | $ | 1,547,541 | | | $ | 1,139,493 | | | $ | 283,529 | | | $ | 608,833 | | |
See Notes to Financial Statements
60
| | | Growth | | Focus Growth | |
| | | For The Six
Months Ended
June 30, 2013 | | For The Year
Ended
December 31, 2012 | | For The Six
Months Ended
June 30, 2013 | | For The Year
Ended
December 31, 2012 | |
| | | (unaudited) | | | | (unaudited) | | | |
Increase (Decrease) in Net Assets: | |
Operations: | |
Net investment income (loss) | | $ | (29,361 | ) | | $ | 12,218 | | | $ | 60,851 | | | $ | 242,888 | | |
Net realized gain (loss) | | | 914,463 | | | | 1,581,213 | | | | 5,088,077 | | | | (998,475 | ) | |
Net change in unrealized appreciation (depreciation) | | | 1,320,439 | | | | 1,501,827 | | | | 2,821,319 | | | | 10,575,140 | | |
Net Increase (Decrease) | | | 2,205,541 | | | | 3,095,258 | | | | 7,970,247 | | | | 9,819,553 | | |
Dividends and Distributions to Shareholders from: | |
Net investment income | |
Class X Shares | | | — | | | | — | | | | — | | | | — | | |
Class Y Shares | | | — | | | | — | | | | — | | | | — | | |
Net realized gain | |
Class X Shares | | | — | | | | (443,966 | ) | | | — | | | | (1,852,844 | ) | |
Class Y Shares | | | — | | | | (552,326 | ) | | | — | | | | (553,913 | ) | |
Total Dividends and Distributions | | | — | | | | (996,292 | ) | | | — | | | | (2,406,757 | ) | |
Net increase (decrease) from transactions in shares of
beneficial interest | | | (2,581,617 | ) | | | (4,443,469 | ) | | | (8,300,914 | ) | | | (11,281,645 | ) | |
Net Decrease | | | (376,076 | ) | | | (2,344,503 | ) | | | (330,667 | ) | | | (3,868,849 | ) | |
Net Assets: | |
Beginning of period | | | 19,809,427 | | | | 22,153,930 | | | | 68,140,484 | | | | 72,009,333 | | |
End of Period | | $ | 19,433,351 | | | $ | 19,809,427 | | | $ | 67,809,817 | | | $ | 68,140,484 | | |
Accumulated Undistributed Net Investment
Income (Loss) | | $ | (30,351 | ) | | $ | (990 | ) | | $ | 249,376 | | | $ | 188,525 | | |
61
Morgan Stanley Select Dimensions Investment Series
Financial Statements continued
Statements of Changes in Net Assets continued
| | | Multi Cap Growth | | Mid Cap Growth | |
| | | For The Six
Months Ended
June 30, 2013 | | For The Year
Ended
December 31, 2012 | | For The Six
Months Ended
June 30, 2013 | | For The Year
Ended
December 31, 2012 | |
| | | (unaudited) | | | | (unaudited) | | | |
Increase (Decrease) in Net Assets: | |
Operations: | |
Net investment income (loss) | | $ | (98,779 | ) | | $ | (76,144 | ) | | $ | (25,791 | ) | | $ | 74,507 | | |
Net realized gain | | | 1,399,292 | | | | 341,215 | | | | 357,388 | | | | 52,392 | | |
Net change in unrealized appreciation (depreciation) | | | 492,514 | | | | 1,558,346 | | | | 2,883,455 | | | | 2,057,997 | | |
Net Increase | | | 1,793,027 | | | | 1,823,417 | | | | 3,215,052 | | | | 2,184,896 | | |
Dividends and Distributions to Shareholders from: | |
Net investment income | |
Class X Shares | | | — | | | | — | | | | (61,680 | ) | | | — | | |
Class Y Shares | | | — | | | | — | | | | (4,099 | ) | | | — | | |
Net realized gain | |
Class X Shares | | | — | | | | (537,907 | ) | | | (48,492 | ) | | | (1,395,029 | ) | |
Class Y Shares | | | — | | | | (609,634 | ) | | | (17,822 | ) | | | (581,952 | ) | |
Total Dividends and Distributions | | | — | | | | (1,147,541 | ) | | | (132,093 | ) | | | (1,976,981 | ) | |
Net decrease from transactions in shares of
beneficial interest | | | (1,958,725 | ) | | | (1,593,485 | ) | | | (2,375,132 | ) | | | (3,764,962 | ) | |
Net Increase (Decrease) | | | (165,698 | ) | | | (917,609 | ) | | | 707,827 | | | | (3,557,047 | ) | |
Net Assets: | |
Beginning of period | | | 15,874,736 | | | | 16,792,345 | | | | 23,441,196 | | | | 26,998,243 | | |
End of Period | | $ | 15,709,038 | | | $ | 15,874,736 | | | $ | 24,149,023 | | | $ | 23,441,196 | | |
Accumulated Undistributed Net Investment
Income (Loss) | | $ | (99,458 | ) | | $ | (679 | ) | | $ | (19,434 | ) | | $ | 72,136 | | |
See Notes to Financial Statements
62
Morgan Stanley Select Dimensions Investment Series
Financial Statements continued
Statements of Changes in Net Assets continued
Summary of Transactions in Shares of Beneficial Interest
| | | Money Market | | Flexible Income | |
| | | For The Six
Months Ended
June 30, 2013 | | For The Year
Ended
December 31, 2012 | | For The Six
Months Ended
June 30, 2013 | | For The Year
Ended
December 31, 2012 | |
| | | (unaudited) | | | | (unaudited) | | | |
Class X Shares | |
Shares | |
Sold | | | 6,122,404 | | | | 4,239,694 | | | | 114,670 | | | | 38,236 | | |
Reinvestment of dividends and distributions | | | 1,110 | | | | 3,087 | | | | — | | | | 114,959 | | |
Redeemed | | | (7,175,147 | ) | | | (8,551,676 | ) | | | (240,950 | ) | | | (422,458 | ) | |
Net Decrease - Class X | | | (1,051,633 | ) | | | (4,308,895 | ) | | | (126,280 | ) | | | (269,263 | ) | |
Amount | |
Sold | | $ | 6,122,404 | | | $ | 4,239,694 | | | $ | 743,818 | | | $ | 237,182 | | |
Reinvestment of dividends and distributions | | | 1,110 | | | | 3,087 | | | | — | | | | 689,754 | | |
Redeemed | | | (7,175,147 | ) | | | (8,551,676 | ) | | | (1,565,303 | ) | | | (2,660,585 | ) | |
Net Decrease - Class X | | $ | (1,051,633 | ) | | $ | (4,308,895 | ) | | $ | (821,485 | ) | | $ | (1,733,649 | ) | |
Class Y Shares | |
Shares | |
Sold | | | 13,275,461 | | | | 20,134,683 | | | | 114,285 | | | | 207,902 | | |
Reinvestment of dividends and distributions | | | 2,084 | | | | 5,999 | | | | — | | | | 129,865 | | |
Redeemed | | | (20,902,276 | ) | | | (28,601,922 | ) | | | (317,788 | ) | | | (535,874 | ) | |
Net Decrease - Class Y | | | (7,624,731 | ) | | | (8,461,240 | ) | | | (203,503 | ) | | | (198,107 | ) | |
Amount | |
Sold | | $ | 13,275,461 | | | $ | 20,134,683 | | | $ | 739,984 | | | $ | 1,297,408 | | |
Reinvestment of dividends and distributions | | | 2,084 | | | | 5,999 | | | | — | | | | 775,294 | | |
Redeemed | | | (20,902,276 | ) | | | (28,601,922 | ) | | | (2,050,820 | ) | | | (3,350,400 | ) | |
Net Decrease - Class Y | | $ | (7,624,731 | ) | | $ | (8,461,240 | ) | | $ | (1,310,836 | ) | | $ | (1,277,698 | ) | |
See Notes to Financial Statements
63
Morgan Stanley Select Dimensions Investment Series
Financial Statements continued
Statements of Changes in Net Assets continued
Summary of Transactions in Shares of Beneficial Interest
| | | Global Infrastructure | | Growth | | Focus Growth | |
| | | For The Six
Months Ended
June 30, 2013 | | For The Year
Ended
December 31, 2012 | | For The Six
Months Ended
June 30, 2013 | | For The Year
Ended
December 31, 2012 | | For The Six
Months Ended
June 30, 2013 | | For The Year
Ended
December 31, 2012 | |
| | | (unaudited) | | | | (unaudited) | | | | (unaudited) | | | |
Class X Shares | |
Shares | |
Sold | | | 5,680 | | | | 6,829 | | | | 10,597 | | | | 14,027 | | | | 61,533 | | | | 17,711 | | |
Reinvestment of dividends and distributions | | | 91,885 | | | | 100,770 | | | | — | | | | 18,662 | | | | — | | | | 81,948 | | |
Redeemed | | | (78,591 | ) | | | (190,854 | ) | | | (43,819 | ) | | | (94,504 | ) | | | (304,030 | ) | | | (460,502 | ) | |
Net Increase (Decrease) - Class X | | | 18,974 | | | | (83,255 | ) | | | (33,222 | ) | | | (61,815 | ) | | | (242,497 | ) | | | (360,843 | ) | |
Amount | |
Sold | | $ | 151,461 | | | $ | 159,855 | | | $ | 272,178 | | | $ | 344,756 | | | $ | 1,517,129 | | | $ | 393,653 | | |
Reinvestment of dividends and distributions | | | 2,118,864 | | | | 2,258,261 | | | | — | | | | 443,966 | | | | — | | | | 1,852,844 | | |
Redeemed | | | (2,068,241 | ) | | | (4,576,331 | ) | | | (1,150,772 | ) | | | (2,290,070 | ) | | | (7,583,047 | ) | | | (10,672,499 | ) | |
Net Increase (Decrease) - Class X | | $ | 202,084 | | | $ | (2,158,215 | ) | | $ | (878,594 | ) | | $ | (1,501,348 | ) | | $ | (6,065,918 | ) | | $ | (8,426,002 | ) | |
Class Y Shares | |
Shares | |
Sold | | | 6,015 | | | | 14,958 | | | | 3,623 | | | | 43,858 | | | | 2,691 | | | | 38,350 | | |
Reinvestment of dividends and distributions | | | 34,919 | | | | 38,714 | | | | — | | | | 23,787 | | | | — | | | | 24,917 | | |
Redeemed | | | (42,762 | ) | | | (77,056 | ) | | | (70,215 | ) | | | (185,558 | ) | | | (93,183 | ) | | | (187,842 | ) | |
Net Decrease - Class Y | | | (1,828 | ) | | | (23,384 | ) | | | (66,592 | ) | | | (117,913 | ) | | | (90,492 | ) | | | (124,575 | ) | |
Amount | |
Sold | | $ | 157,050 | | | $ | 357,081 | | | $ | 91,585 | | | $ | 1,035,904 | | | $ | 63,819 | | | $ | 888,137 | | |
Reinvestment of dividends and distributions | | | 804,865 | | | | 867,197 | | | | — | | | | 552,326 | | | | — | | | | 553,913 | | |
Redeemed | | | (1,127,006 | ) | | | (1,845,249 | ) | | | (1,794,608 | ) | | | (4,530,351 | ) | | | (2,298,815 | ) | | | (4,297,693 | ) | |
Net Decrease - Class Y | | $ | (165,091 | ) | | $ | (620,971 | ) | | $ | (1,703,023 | ) | | $ | (2,942,121 | ) | | $ | (2,234,996 | ) | | $ | (2,855,643 | ) | |
See Notes to Financial Statements
64
| | | Multi Cap Growth | | Mid Cap Growth | |
| | | For The Six
Months Ended
June 30, 2013 | | For The Year
Ended
December 31, 2012 | | For The Six
Months Ended
June 30, 2013 | | For The Year
Ended
December 31, 2012 | |
| | | (unaudited) | | | | (unaudited) | | | |
Class X Shares | |
Shares | |
Sold | | | 2,706 | | | | 5,162 | | | | 1,447 | | | | 4,669 | | |
Reinvestment of dividends and distributions | | | — | | | | 34,525 | | | | 2,946 | | | | 43,257 | | |
Redeemed | | | (50,579 | ) | | | (97,286 | ) | | | (46,087 | ) | | | (116,274 | ) | |
Net Increase (Decrease) - Class X | | | (47,873 | ) | | | (57,599 | ) | | | (41,694 | ) | | | (68,348 | ) | |
Amount | |
Sold | | $ | 46,476 | | | $ | 84,088 | | | $ | 51,496 | | | $ | 153,516 | | |
Reinvestment of dividends and distributions | | | — | | | | 537,907 | | | | 110,172 | | | | 1,395,029 | | |
Redeemed | | | (869,014 | ) | | | (1,554,688 | ) | | | (1,641,531 | ) | | | (3,925,346 | ) | |
Net Increase (Decrease) - Class X | | $ | (822,538 | ) | | $ | (932,693 | ) | | $ | (1,479,863 | ) | | $ | (2,376,801 | ) | |
Class Y Shares | |
Shares | |
Sold | | | 4,418 | | | | 49,991 | | | | 3,920 | | | | 25,988 | | |
Reinvestment of dividends and distributions | | | — | | | | 40,427 | | | | 599 | | | | 18,469 | | |
Redeemed | | | (73,545 | ) | | | (130,015 | ) | | | (30,327 | ) | | | (87,618 | ) | |
Net Decrease - Class Y | | | (69,127 | ) | | | (39,597 | ) | | | (25,808 | ) | | | (43,161 | ) | |
Amount | |
Sold | | $ | 71,712 | | | $ | 792,606 | | | $ | 139,454 | | | $ | 902,541 | | |
Reinvestment of dividends and distributions | | | — | | | | 609,634 | | | | 21,921 | | | | 581,952 | | |
Redeemed | | | (1,207,899 | ) | | | (2,063,032 | ) | | | (1,056,644 | ) | | | (2,872,654 | ) | |
Net Decrease - Class Y | | $ | (1,136,187 | ) | | $ | (660,792 | ) | | $ | (895,269 | ) | | $ | (1,388,161 | ) | |
65
Morgan Stanley Select Dimensions Investment Series
Notes to Financial Statements n June 30, 2013 (unaudited)
1. Organization and Accounting Policies
Morgan Stanley Select Dimensions Investment Series (the "Fund") is registered under the Investment Company Act of 1940 as amended (the "Act"), as a diversified (except Focus Growth is non-diversified, effective August 8, 2007), open-end management investment company. The Fund is offered exclusively to life insurance companies in connection with particular life insurance and/or annuity contracts they offer.
The Fund, which consists of seven separate portfolios ("Portfolios"), was organized on June 2, 1994, as a Massachusetts business trust and commenced operations on November 9, 1994, with the exception of Multi Cap Growth which commenced operations on January 21, 1997.
On July 24, 2000, the Fund commenced offering one additional class of shares (Class Y shares). The two classes are identical except that Class Y shares incur distribution expenses. Class X shares are generally available to holders of contracts offered before May 1, 2000. Class Y shares are available to holders of contracts offered on or after July 24, 2000.
The investment objectives of each Portfolio are as follows:
| PORTFOLIO | | INVESTMENT OBJECTIVE | |
| Money Market | | Seeks high current income, preservation of capital and liquidity. | |
| Flexible Income | | Seeks, as a primary objective, to provide a high level of current income and, as a secondary objective, to maximize total return, but only to the extent consistent with its primary objective. | |
| Global Infrastructure | | Seeks both capital appreciation and current income. | |
| Growth | | Seeks long-term growth of capital. | |
| Focus Growth | | Seeks long-term capital growth. | |
| Multi Cap Growth | | Seeks long-term capital growth. | |
| Mid Cap Growth | | Seeks long-term capital growth. | |
The following is a summary of significant accounting policies:
A. Valuation of Investments — Money Market: Portfolio securities are valued at amortized cost, which approximates fair value, in accordance with Rule 2a-7 under the Act. The amortized cost of an instrument is determined by valuing it at its original cost and thereafter amortizing any discount or premium from its face value at a constant rate until maturity. All remaining Portfolios: (1) an equity portfolio security listed or traded on an exchange is valued at its latest reported sales price (or at the exchange official closing price if such exchange reports an official closing price), if there were no sales on a given day, the security is valued at
66
Morgan Stanley Select Dimensions Investment Series
Notes to Financial Statements n June 30, 2013 (unaudited) continued
the mean between the last reported bid and asked prices; (2) all other equity portfolio securities for which over-the-counter market quotations are readily available are valued at the mean between the last reported bid and asked prices. In cases where a security is traded on more than one exchange, the security is valued on the exchange designated as the primary market; (3) quotations of foreign portfolio securities, other assets and liabilities and forward contracts stated in foreign currency are translated into U.S. dollar equivalents at the prevailing market rates prior to the close of the New York Stock Exchange ("NYSE"); (4) futures are valued at the latest price published by the commodities exchange on which they trade; (5) swaps are marked-to-market daily based upon quotations from market makers; (6) when market quotations are not readily available, including circumstances under which Morgan Stanley Investment Management Inc. (the "Adviser") or Morgan Stanley Investment Management Limited or Morgan Stanley Investment Management Company (each, a "Sub-Adviser"), each a wholly owned subsidiary of Morgan Stanley, determines that the closing price, last sale price or the mean between the last reported bid and asked prices are not reflective of a security's market value, portfolio securities are valued at their fair value as determined in good faith under procedures established by and under the general supervision of the Fund's Board of Trustees (the "Trustees"). Occasionally, developments affecting the closing prices of securities and other assets may occur between the times at which valuations of such securities are determined (that is, close of the foreign market on which the securities trade) and the close of business on the NYSE. If developments occur during such periods that are expected to materially affect the value of such securities, such valuations may be adjusted to reflect the estimated fair value of such securities as of the close of the NYSE, as determined in good faith by the Trustees or by the Adviser using a pricing service and/or procedures approved by the Trustees; (7) certain portfolio securities may be valued by an outside pricing service approved by the Trustees. The pricing service may utilize a matrix system or other model incorporating attributes such as security quality, maturity and coupon as the evaluation model parameters, and/or research evaluations by its staff, including review of broker-dealer market price quotations in determining what it believes is the fair valuation of the portfolio securities valued by such pricing service; (8) investments in mutual funds, including the Morgan Stanley Institutional Liquidity Funds, are valued at the net asset value as of the close of each business day; and (9) short-term debt securities with remaining maturities of 60 days or less at the time of purchase may be valued at amortized cost, unless the Adviser determines such valuation does not reflect the securities' market value, in which case these securities will be valued at their fair market value determined by the Adviser.
Under procedures approved by the Trustees, the Fund's Adviser has formed a Valuation Committee. The Valuation Committee provides administration and oversight of the Fund's valuation policies and procedures, which are reviewed at least annually by the Trustees. These procedures allow the Fund to utilize independent pricing services, quotations from securities and financial instrument dealers, and other market sources to determine fair value.
67
Morgan Stanley Select Dimensions Investment Series
Notes to Financial Statements n June 30, 2013 (unaudited) continued
The Fund has procedures to determine the fair value of securities and other financial instruments for which market prices are not readily available. Under these procedures, the Valuation Committee convenes on a regular and ad hoc basis to review such securities and considers a number of factors, including valuation methodologies and significant unobservable valuation inputs, when arriving at fair value. The Valuation Committee may employ a market-based approach which may use related or comparable assets or liabilities, recent transactions, market multiples, book values, and other relevant information for the investment to determine the fair value of the investment. An income-based valuation approach may also be used in which the anticipated future cash flows of the investment are discounted to calculate fair value. Discounts may also be applied due to the nature or duration of any restrictions on the disposition of the investments. Due to the inherent uncertainty of valuations of such investments, the fair values may differ significantly from the values that would have been used had an active market existed. The Valuation Committee employs various methods for calibrating these valuation approaches including a regular review of valuation methodologies, key inputs and assumptions, transactional back-testing or disposition analysis, and reviews of any related market activity.
B. Accounting for Investments — Security transactions are accounted for on the trade date (date the order to buy or sell is executed). Realized gains and losses on security transactions are determined by the identified cost method. Dividend income and other distributions are recorded on the ex-dividend date except for certain dividends on foreign securities which are recorded as soon as the Fund is informed after the ex-dividend date. Interest income is accrued daily as earned except where collection is not expected. Discounts are accreted and premiums are amortized over the life of the respective securities and are included in interest income.
C. Repurchase Agreements — The Fund invests directly with institutions in repurchase agreements. The Fund's custodian receives the collateral, which is marked-to-market daily to determine that the value of the collateral does not decrease below the repurchase price plus accrued interest as earned. If such a decrease occurs, additional collateral will be requested and, when received, will be added to the account to maintain full collateralization.
The following table presents financial instruments that are subject to enforceable netting arrangements as of June 30, 2013.
| | GROSS AMOUNTS NOT OFFSET IN THE STATEMENTS OF ASSETS AND LIABILITIES | |
| PORTFOLIO | | GROSS ASSET AMOUNT
PRESENTED IN STATEMENTS OF
ASSETS AND LIABILITIES | | FINANCIAL
INSTRUMENT | | COLLATERAL
RECEIVED | | NET AMOUNT
(NOT LESS THAN 0) | |
Money Market | | $ | 27,144,000 | | | | — | | | $ | (27,144,000 | )(1) | | $ | 0 | | |
(1) The actual collateral received is greater than the amount shown here due to overcollateralization.
68
Morgan Stanley Select Dimensions Investment Series
Notes to Financial Statements n June 30, 2013 (unaudited) continued
D. Multiple Class Allocations — Investment income, expenses (other than distribution fees), and realized and unrealized gains and losses are allocated to each class of shares based upon the relative net asset value on the date such items are recognized. Distribution fees are charged directly to the respective class.
E. Foreign Currency Translation and Foreign Investments — The books and records of the Fund are maintained in U.S. dollars. Foreign currency amounts are translated into U.S. dollars at the mean of the bid and asked prices of such currencies against U.S. dollars last quoted by a major bank as follows:
— investments, other assets and liabilities at the prevailing rate of exchange on the valuation date;
— investment transactions and investment income at the prevailing rates of exchange on the dates of such transactions.
Although the net assets of the Fund are presented at the foreign exchange rates and market values at the close of the period, the Fund does not isolate that portion of the results of operations arising as a result of changes in the foreign exchange rates from the fluctuations arising from changes in the market prices of securities held at period end. Similarly, the Fund does not isolate the effect of changes in foreign exchange rates from the fluctuations arising from changes in the market prices of securities sold during the period. Accordingly, realized and unrealized foreign currency gains (losses) on investments in securities are included in the reported net realized and unrealized gains (losses) on investment transactions and balances. However, pursuant to U.S. Federal income tax regulations, gains and losses from certain foreign currency transactions and the foreign currency portion of gains and losses realized on sales and maturities of foreign denominated debt securities are treated as ordinary income for U.S. Federal income tax purposes.
Net realized gains (losses) on foreign currency transactions represent net foreign exchange gains (losses) from foreign currency forward exchange contracts, disposition of foreign currencies, currency gains (losses) realized between the trade and settlement dates on securities transactions, and the difference between the amount of investment income and foreign withholding taxes recorded on the Fund's books and the U.S. dollar equivalent amounts actually received or paid. Net unrealized currency gains (losses) from valuing foreign currency denominated assets and liabilities at period end exchange rates are reflected as a component of unrealized appreciation (depreciation) on the Statements of Assets and Liabilities. The change in unrealized currency gains (losses) on foreign currency translations for the period is reflected in the Statements of Operations.
Foreign security and currency transactions may involve certain considerations and risks not typically associated with those of U.S. dollar denominated transactions as a result of, among other factors, fluctuations of exchange rates in relation to the U.S. dollar, the possibility of lower levels of governmental supervision and regulation of foreign securities markets and the possibility of political or economic instability.
69
Morgan Stanley Select Dimensions Investment Series
Notes to Financial Statements n June 30, 2013 (unaudited) continued
F. Restricted Securities — Certain Portfolios invest in unregistered or otherwise restricted securities. The term "restricted securities" refers to securities that are unregistered or are held by control persons of the issuer and securities that are subject to contractual restrictions on their resale. As a result, restricted securities may be more difficult to value and the Portfolio may have difficulty disposing of such assets either in a timely manner or for a reasonable price. In order to dispose of an unregistered security, the Portfolio, where it has contractual rights to do so, may have to cause such security to be registered. A considerable period may elapse between the time the decision is made to sell the security and the time the security is registered so that the Portfolio could sell it. Contractual restrictions on the resale of securities vary in length and scope and are generally the result of a negotiation between the issuer and acquirer of the securities. The Portfolio would, in either case, bear market risks during that period. Restricted Securities are identified in the Portfolio of Investments.
G. When-Issued/Delayed Delivery Securities — The Fund may purchase or sell when-issued and delayed delivery securities. Securities purchased on a when-issued or delayed delivery basis are purchased for delivery beyond the normal settlement date at a stated price, and no income accrues to the Fund on such securities prior to delivery date. Payment and delivery for when-issued and delayed delivery securities can take place a month or more after the date of the transaction. When the Fund enters into a purchase transaction on a when-issued or delayed delivery basis, securities are available for collateral in an amount at least equal in value to the Fund's commitments to purchase such securities. Purchasing securities on a when-issued or delayed delivery basis may involve a risk that the market price at the time of delivery may be lower than the agreed upon purchase price, in which case there could be an unrealized loss at the time of delivery. Purchasing investments on a when-issued or delayed delivery basis may be considered a form of leverage which may increase the impact that gains (losses) may have on the Fund.
H. Securities Lending — Certain Portfolios may lend securities to qualified financial institutions, such as broker-dealers, to earn additional income. Any increase or decrease in the fair value of the securities loaned that might occur and any interest earned or dividends declared on those securities during the term of the loan would remain in the Portfolio. The Portfolio receives cash or securities as collateral in an amount equal to or exceeding 100% of the current fair value of the loaned securities. The collateral is marked-to-market daily, by State Street Bank and Trust Company ("State Street"), the securities lending agent, to ensure that a minimum of 100% collateral coverage is maintained.
Based on pre-established guidelines, the securities lending agent invests any cash collateral that is received in high-quality short-term investments. Securities lending income is generated from the earnings on the invested collateral and borrowing fees, less any rebates owed to the borrowers and compensation to the lending agent.
70
Morgan Stanley Select Dimensions Investment Series
Notes to Financial Statements n June 30, 2013 (unaudited) continued
The Portfolio has the right under the lending agreement to recover the securities from the borrower on demand.
The following table presents financial instruments that are subject to enforceable netting arrangements as of June 30, 2013.
| | GROSS AMOUNTS NOT OFFSET IN THE STATEMENTS OF ASSETS AND LIABILITIES | |
| PORTFOLIO | | GROSS ASSET AMOUNT
PRESENTED IN STATEMENTS OF
ASSETS AND LIABILITIES | | FINANCIAL
INSTRUMENT | | COLLATERAL
RECEIVED | | NET AMOUNT
(NOT LESS THAN 0) | |
Global Infrastructure | | $ | 2,694,871 | (1) | | | — | | | $ | (2,694,871 | )(2)(3) | | $ | 0 | | |
(1) Represents market value of loaned securities at period end.
(2) The Portfolio received cash collateral of $2,842,160, of which $2,522,029 was subsequently invested in Repurchase Agreements and Morgan Stanley Institutional Liquidity Funds as reported in the Portfolio of Investments. As of June 30, 2013, there was uninvested cash collateral of $320,131 which is not reflected in the Portfolio of Investments.
(3) The actual collateral received is greater than the amount shown here due to overcollateralization.
I. Dividends and Distributions to Shareholders — Dividends and distributions to shareholders are recorded on the ex-dividend date.
J. Expenses — Direct expenses are charged to the respective Portfolio and general Fund expenses are allocated on the basis of relative net assets or equally among the Portfolios.
K. Use of Estimates — The preparation of financial statements in accordance with generally accepted accounting principles in the United States ("GAAP") requires management to make estimates and assumptions that affect the reported amounts and disclosures. Actual results could differ from those estimates.
L. Indemnifications — The Fund enters into contracts that contain a variety of indemnifications. The Fund's maximum exposure under these arrangements is unknown. However, the Fund has not had prior claims or losses pursuant to these contracts and expects the risk of loss to be remote.
2. Fair Valuation Measurements
Financial Accounting Standards Board ("FASB") Accounting Standards Codification ("ASC") 820, Fair Value Measurements and Disclosures ("ASC 820"), defines fair value as the value that the Fund would receive to sell an investment or pay to transfer a liability in a timely transaction with an independent buyer in the principal market, or in the absence of a principal market the most advantageous market for the investment or liability. ASC 820 establishes a three-tier hierarchy to distinguish between (1) inputs that reflect the assumptions market participants would use in valuing an asset or liability developed based on market data obtained from sources independent of the reporting entity (observable inputs); and (2) inputs that reflect
71
Morgan Stanley Select Dimensions Investment Series
Notes to Financial Statements n June 30, 2013 (unaudited) continued
the reporting entity's own assumptions about the assumptions market participants would use in valuing an asset or liability developed based on the best information available in the circumstances (unobservable inputs) and to establish classification of fair value measurements for disclosure purposes. Various inputs are used in determining the value of the Fund's investments. The inputs are summarized in the three broad levels listed below.
• Level 1 — unadjusted quoted prices in active markets for identical investments
• Level 2 — other significant observable inputs (including quoted prices for similar investments, interest rates, prepayment speeds, credit risk, etc.)
• Level 3 — significant unobservable inputs including the Fund's own assumptions in determining the fair value of investments. Factors considered in making this determination may include, but are not limited to, information obtained by contacting the issuer, analysts, or the appropriate stock exchange (for exchange-traded securities), analysis of the issuer's financial statements or other available documents and, if necessary, available information concerning other securities in similar circumstances
The inputs or methodology used for valuing securities are not necessarily an indication of the risk associated with investing in those securities and the determination of the significance of a particular input to the fair value measurement in its entirety requires judgment and considers factors specific to each security.
The following is a summary of the inputs used to value each Portfolio's investments as of June 30, 2013.
Investment Type | | Level 1
Unadjusted
Quoted Prices | | Level 2
Other
Significant
Observable
Inputs | | Level 3
Significant
Unobservable
Inputs | | Total | |
Money Market | |
Assets: | |
Repurchase Agreements | | $ | — | | | $ | 27,144,000 | | | $ | — | | | $ | 27,144,000 | | |
Floating Rate Notes | | | — | | | | 11,659,993 | | | | — | | | | 11,659,993 | | |
Certificates of Deposit | | | — | | | | 7,999,987 | | | | — | | | | 7,999,987 | | |
Commercial Paper | | | — | | | | 7,847,262 | | | | — | | | | 7,847,262 | | |
Extendible Floating Rate Notes | | | — | | | | 5,999,924 | | | | — | | | | 5,999,924 | | |
Tax-Exempt Instrument | |
Weekly Variable Rate Bond | | | — | | | | 2,000,000 | | | | — | | | | 2,000,000 | | |
Total Assets | | $ | — | | | $ | 62,651,166 | | | $ | — | | | $ | 62,651,166 | | |
72
Morgan Stanley Select Dimensions Investment Series
Notes to Financial Statements n June 30, 2013 (unaudited) continued
Investment Type | | Level 1
Unadjusted
Quoted Prices | | Level 2
Other
Significant
Observable
Inputs | | Level 3
Significant
Unobservable
Inputs | | Total | |
Flexible Income | |
Assets: | |
Fixed Income Securities | |
Corporate Bonds | | $ | — | | | $ | 12,242,186 | | | $ | — | † | | $ | 12,242,186 | | |
Sovereign | | | — | | | | 2,206,840 | | | | — | | | | 2,206,840 | | |
Municipal Bonds | | | — | | | | 207,652 | | | | — | | | | 207,652 | | |
Agency Fixed Rate Mortgages | | | — | | | | 137,474 | | | | — | | | | 137,474 | | |
Asset-Backed Securities | | | — | | | | 577,405 | | | | — | | | | 577,405 | | |
U.S. Treasury Securities | | | — | | | | 2,230,511 | | | | — | | | | 2,230,511 | | |
Mortgages — Other | | | — | | | | 1,750,863 | | | | — | | | | 1,750,863 | | |
Total Fixed Income Securities | | | — | | | | 19,352,931 | | | | — | † | | | 19,352,931 | | |
Short-Term Investment — Investment Company | | | 514,637 | | | | — | | | | — | | | | 514,637 | | |
Foreign Currency Forward Exchange Contracts | | | — | | | | 14,402 | | | | — | | | | 14,402 | | |
Futures Contracts | | | 6,453 | | | | — | | | | — | | | | 6,453 | | |
Credit Default Swap Agreements | | | — | | | | 174 | | | | — | | | | 174 | | |
Interest Rate Swap Agreements | | | — | | | | 113,600 | | | | — | | | | 113,600 | | |
Total Assets | | | 521,090 | | | | 19,481,107 | | | | — | † | | | 20,002,197 | | |
Liabilities: | |
Foreign Currency Forward Exchange Contracts | | | — | | | | (16,289 | ) | | | — | | | | (16,289 | ) | |
Futures Contracts | | | (42,229 | ) | | | — | | | | — | | | | (42,229 | ) | |
Credit Default Swap Agreements | | | — | | | | (5,706 | ) | | | — | | | | (5,706 | ) | |
Total Liabilities | | | (42,229 | ) | | | (21,995 | ) | | | — | | | | (64,224 | ) | |
Total | | $ | 478,861 | | | $ | 19,459,112 | | | $ | — | † | | $ | 19,937,973 | | |
† Includes one security which is valued at zero.
Global Infrastructure | |
Assets: | |
Common Stocks | |
Airports | | $ | 1,036,712 | | | $ | — | | | $ | — | | | $ | 1,036,712 | | |
Communications | | | 3,807,477 | | | | — | | | | — | | | | 3,807,477 | | |
Diversified | | | 1,188,316 | | | | — | | | | — | | | | 1,188,316 | | |
| Oil & Gas Storage & Transportation | | | 12,336,149 | | | | — | | | | — | | | | 12,336,149 | | |
Ports | | | 176,251 | | | | — | | | | — | | | | 176,251 | | |
Toll Roads | | | 1,565,153 | | | | — | | | | — | | | | 1,565,153 | | |
| Transmission & Distribution | | | 3,475,652 | | | | — | | | | — | | | | 3,475,652 | | |
Water | | | 1,322,465 | | | | — | | | | — | | | | 1,322,465 | | |
Total Common Stocks | | | 24,908,175 | | | | — | | | | — | | | | 24,908,175 | | |
73
Morgan Stanley Select Dimensions Investment Series
Notes to Financial Statements n June 30, 2013 (unaudited) continued
| Investment Type | | Level 1
Unadjusted
Quoted Prices | | Level 2
Other
Significant
Observable
Inputs | | Level 3
Significant
Unobservable
Inputs | | Total | |
Short-Term Investments | |
Investment Company | | $ | 2,244,356 | | | $ | — | | | $ | — | | | $ | 2,244,356 | | |
Repurchase Agreements | | | — | | | | 277,673 | | | | — | | | | 277,673 | | |
Total Assets | | $ | 27,152,531 | | | $ | 277,673 | | | $ | — | | | $ | 27,430,204 | | |
Growth | |
Assets: | |
Common Stocks | |
Alternative Energy | | $ | 277,733 | | | $ | — | | | $ | — | | | $ | 277,733 | | |
| Asset Management & Custodian | | | 499,060 | | | | — | | | | — | | | | 499,060 | | |
Automobiles | | | 479,568 | | | | — | | | | — | | | | 479,568 | | |
Biotechnology | | | 672,288 | | | | — | | | | — | | | | 672,288 | | |
Cable Television Services | | | 104,406 | | | | — | | | | — | | | | 104,406 | | |
Chemicals: Diversified | | | 557,232 | | | | — | | | | — | | | | 557,232 | | |
Commercial Services | | | 248,517 | | | | — | | | | — | | | | 248,517 | | |
Communications Technology | | | 698,302 | | | | — | | | | — | | | | 698,302 | | |
| Computer Services, Software & Systems | | | 3,841,965 | | | | — | | | | — | | | | 3,841,965 | | |
Computer Technology | | | 773,498 | | | | — | | | | — | | | | 773,498 | | |
Consumer Lending | | | 1,843,180 | | | | — | | | | — | | | | 1,843,180 | | |
Diversified Media | | | 562,997 | | | | — | | | | — | | | | 562,997 | | |
Diversified Retail | | | 2,882,282 | | | | — | | | | — | | | | 2,882,282 | | |
| Drug & Grocery Store Chains | | | 101,827 | | | | — | | | | — | | | | 101,827 | | |
| Financial Data & Systems | | | 521,293 | | | | — | | | | — | | | | 521,293 | | |
Health Care Services | | | 98,275 | | | | — | | | | — | | | | 98,275 | | |
Insurance: Multi-Line | | | 224,930 | | | | — | | | | — | | | | 224,930 | | |
Insurance: Property-Casualty | | | 770,949 | | | | — | | | | — | | | | 770,949 | | |
Medical Equipment | | | 597,764 | | | | — | | | | — | | | | 597,764 | | |
Pharmaceuticals | | | 1,095,047 | | | | — | | | | — | | | | 1,095,047 | | |
| Radio & TV Broadcasters | | | 96,530 | | | | — | | | | — | | | | 96,530 | | |
| Recreational Vehicles & Boats | | | 633,279 | | | | — | | | | — | | | | 633,279 | | |
Restaurants | | | 552,146 | | | | — | | | | — | | | | 552,146 | | |
| Semiconductors & Components | | | 395,988 | | | | — | | | | — | | | | 395,988 | | |
| Textiles Apparel & Shoes | | | 937,475 | | | | — | | | | — | | | | 937,475 | | |
Total Common Stocks | | | 19,466,531 | | | | — | | | | — | | | | 19,466,531 | | |
Short-Term Investment — Investment Company | | | 18,195 | | | | — | | | | — | | | | 18,195 | | |
Total Assets | | $ | 19,484,726 | | | $ | — | | | $ | — | | | $ | 19,484,726 | | |
74
Morgan Stanley Select Dimensions Investment Series
Notes to Financial Statements n June 30, 2013 (unaudited) continued
Investment Type | | Level 1
Unadjusted
Quoted Prices | | Level 2
Other
Significant
Observable
Inputs | | Level 3
Significant
Unobservable
Inputs | | Total | |
Focus Growth | |
Assets: | |
Common Stocks | |
Alternative Energy | | $ | 1,005,856 | | | $ | — | | | $ | — | | | $ | 1,005,856 | | |
| Asset Management & Custodian | | | 1,896,067 | | | | — | | | | — | | | | 1,896,067 | | |
Automobiles | | | 1,615,855 | | | | — | | | | — | | | | 1,615,855 | | |
Biotechnology | | | 2,713,324 | | | | — | | | | — | | | | 2,713,324 | | |
Chemicals: Diversified | | | 2,351,835 | | | | — | | | | — | | | | 2,351,835 | | |
Communications Technology | | | 2,767,403 | | | | — | | | | — | | | | 2,767,403 | | |
| Computer Services, Software & Systems | | | 14,506,223 | | | | — | | | | — | | | | 14,506,223 | | |
Computer Technology | | | 3,040,228 | | | | — | | | | — | | | | 3,040,228 | | |
Consumer Lending | | | 5,444,068 | | | | — | | | | — | | | | 5,444,068 | | |
Diversified Media | | | 1,306,830 | | | | — | | | | — | | | | 1,306,830 | | |
Diversified Retail | | | 11,173,448 | | | | — | | | | — | | | | 11,173,448 | | |
| Financial Data & Systems | | | 817,910 | | | | — | | | | — | | | | 817,910 | | |
Insurance: Property-Casualty | | | 3,162,166 | | | | — | | | | — | | | | 3,162,166 | | |
Medical Equipment | | | 2,269,985 | | | | — | | | | — | | | | 2,269,985 | | |
Pharmaceuticals | | | 3,935,294 | | | | — | | | | — | | | | 3,935,294 | | |
| Recreational Vehicles & Boats | | | 2,295,136 | | | | — | | | | — | | | | 2,295,136 | | |
Restaurants | | | 2,083,761 | | | | — | | | | — | | | | 2,083,761 | | |
| Semiconductors & Components | | | 1,237,053 | | | | — | | | | — | | | | 1,237,053 | | |
| Textiles Apparel & Shoes | | | 3,626,266 | | | | — | | | | — | | | | 3,626,266 | | |
Total Common Stocks | | | 67,248,708 | | | | — | | | | — | | | | 67,248,708 | | |
Short-Term Investment — Investment Company | | | 605,745 | | | | — | | | | — | | | | 605,745 | | |
Total Assets | | $ | 67,854,453 | | | $ | — | | | $ | — | | | $ | 67,854,453 | | |
Multi Cap Growth | |
Assets: | |
Common Stocks | |
Alternative Energy | | $ | 223,609 | | | $ | — | | | $ | — | | | $ | 223,609 | | |
Automobiles | | | 411,349 | | | | — | | | | — | | | | 411,349 | | |
Biotechnology | | | 646,767 | | | | — | | | | — | | | | 646,767 | | |
Chemicals: Diversified | | | 451,022 | | | | — | | | | — | | | | 451,022 | | |
Commercial Services | | | 1,216,300 | | | | — | | | | — | | | | 1,216,300 | | |
Communications Technology | | | 564,369 | | | | — | | | | — | | | | 564,369 | | |
| Computer Services, Software & Systems | | | 3,655,969 | | | | — | | | | — | | | | 3,655,969 | | |
75
Morgan Stanley Select Dimensions Investment Series
Notes to Financial Statements n June 30, 2013 (unaudited) continued
Investment Type | | Level 1
Unadjusted
Quoted Prices | | Level 2
Other
Significant
Observable
Inputs | | Level 3
Significant
Unobservable
Inputs | | Total | |
Computer Technology | | $ | 766,484 | | | $ | — | | | $ | — | | | $ | 766,484 | | |
Consumer Lending | | | 1,210,629 | | | | — | | | | — | | | | 1,210,629 | | |
Diversified Retail | | | 2,293,298 | | | | — | | | | — | | | | 2,293,298 | | |
| Financial Data & Systems | | | 357,519 | | | | — | | | | — | | | | 357,519 | | |
Foods | | | 267,795 | | | | — | | | | — | | | | 267,795 | | |
Health Care Services | | | 537,464 | | | | — | | | | — | | | | 537,464 | | |
Insurance: Property-Casualty | | | 383,930 | | | | — | | | | — | | | | 383,930 | | |
Medical Equipment | | | 481,758 | | | | — | | | | — | | | | 481,758 | | |
Pharmaceuticals | | | 580,936 | | | | — | | | | — | | | | 580,936 | | |
| Recreational Vehicles & Boats | | | 540,748 | | | | — | | | | — | | | | 540,748 | | |
Restaurants | | | 445,987 | | | | — | | | | — | | | | 445,987 | | |
| Semiconductors & Components | | | 384,767 | | | | — | | | | — | | | | 384,767 | | |
| Textiles Apparel & Shoes | | | 358,157 | | | | — | | | | — | | | | 358,157 | | |
Total Common Stocks | | | 15,778,857 | | | | — | | | | — | | | | 15,778,857 | | |
Short-Term Investment — Investment Company | | | 6,669 | | | | — | | | | — | | | | 6,669 | | |
Total Assets | | $ | 15,785,526 | | | $ | — | | | $ | — | | | $ | 15,785,526 | | |
Mid Cap Growth | |
Assets: | |
Common Stocks | |
Advertising Agencies | | $ | 259,290 | | | $ | — | | | $ | — | | | $ | 259,290 | | |
Alternative Energy | | | 669,737 | | | | — | | | | — | | | | 669,737 | | |
Automobiles | | | 581,196 | | | | — | | | | — | | | | 581,196 | | |
Beverage: Soft Drinks | | | 407,645 | | | | — | | | | — | | | | 407,645 | | |
Biotechnology | | | 972,022 | | | | — | | | | — | | | | 972,022 | | |
Cement | | | 552,924 | | | | — | | | | — | | | | 552,924 | | |
Chemicals: Diversified | | | 578,575 | | | | — | | | | — | | | | 578,575 | | |
Commercial Services | | | 1,180,947 | | | | — | | | | — | | | | 1,180,947 | | |
Communications Technology | | | 799,503 | | | | — | | | | — | | | | 799,503 | | |
| Computer Services, Software & Systems | | | 4,202,817 | | | | — | | | | — | | | | 4,202,817 | | |
Computer Technology | | | 831,480 | | | | — | | | | 129,903 | | | | 961,383 | | |
Consumer Lending | | | 405,293 | | | | — | | | | — | | | | 405,293 | | |
Consumer Services: Miscellaneous | | | 192,907 | | | | — | | | | — | | | | 192,907 | | |
Diversified Manufacturing Operations | | | 247,887 | | | | — | | | | — | | | | 247,887 | | |
Diversified Media | | | 352,703 | | | | — | | | | — | | | | 352,703 | | |
Diversified Retail | | | 1,472,331 | | | | — | | | | — | | | | 1,472,331 | | |
76
Morgan Stanley Select Dimensions Investment Series
Notes to Financial Statements n June 30, 2013 (unaudited) continued
Investment Type | | Level 1
Unadjusted
Quoted Prices | | Level 2
Other
Significant
Observable
Inputs | | Level 3
Significant
Unobservable
Inputs | | Total | |
Electronic Components | | $ | 153,694 | | | $ | — | | | $ | — | | | $ | 153,694 | | |
Electronic Entertainment | | | 164,532 | | | | — | | | | — | | | | 164,532 | | |
Entertainment | | | — | | | | — | | | | 257,576 | | | | 257,576 | | |
| Financial Data & Systems | | | 940,493 | | | | — | | | | — | | | | 940,493 | | |
Foods | | | 545,642 | | | | — | | | | — | | | | 545,642 | | |
Health Care Services | | | 981,523 | | | | — | | | | — | | | | 981,523 | | |
Hotel/Motel | | | 225,486 | | | | — | | | | — | | | | 225,486 | | |
Insurance: Property-Casualty | | | 1,173,894 | | | | — | | | | — | | | | 1,173,894 | | |
Medical Equipment | | | 474,665 | | | | — | | | | — | | | | 474,665 | | |
Personal Care | | | 126,422 | | | | — | | | | — | | | | 126,422 | | |
Pharmaceuticals | | | 750,898 | | | | — | | | | — | | | | 750,898 | | |
Publishing | | | 381,228 | | | | — | | | | — | | | | 381,228 | | |
| Recreational Vehicles & Boats | | | 786,743 | | | | — | | | | — | | | | 786,743 | | |
Restaurants | | | 1,022,932 | | | | — | | | | — | | | | 1,022,932 | | |
Scientific Instruments: Pollution Control | | | 370,410 | | | | — | | | | — | | | | 370,410 | | |
| Semiconductors & Components | | | 398,365 | | | | — | | | | — | | | | 398,365 | | |
Specialty Retail | | | 134,114 | | | | — | | | | — | | | | 134,114 | | |
| Textiles Apparel & Shoes | | | 628,928 | | | | — | | | | — | | | | 628,928 | | |
Utilities: Electrical | | | 353,185 | | | | — | | | | — | | | | 353,185 | | |
Total Common Stocks | | | 23,320,411 | | | | — | | | | 387,479 | | | | 23,707,890 | | |
Convertible Preferred Stocks | | | — | | | | — | | | | 17,370 | | | | 17,370 | | |
Preferred Stock | | | — | | | | — | | | | 42,915 | | | | 42,915 | | |
Short-Term Investment — Investment Company | | | 364,358 | | | | — | | | | — | | | | 364,358 | | |
Total Assets | | $ | 23,684,769 | | | $ | — | | | $ | 447,764 | | | $ | 24,132,533 | | |
77
Morgan Stanley Select Dimensions Investment Series
Notes to Financial Statements n June 30, 2013 (unaudited) continued
The following table presents additional information about valuation techniques and inputs used for investments that are measured at fair value and categorized within Level 3 as of June 30, 2013.
Mid Cap Growth
| | | Fair Value at
June 30,
2013 | | Valuation Technique | | Unobservable Input | | Range | | Weighted
Average | | Impact
to
Valuation
from an
Increase
in Input | |
Communications
Technology | |
Convertible Preferred
Stock | | $ | 4,754 | | |
Asset Approach | |
Net Tangible Assets | | $ | 0.13 | | | $ | 0.13 | | | $ | 0.13 | | |
Increase | |
| | |
| | Discounted Cash Flow
| | Weighted Average
Cost of Capital | | | 27.5 | % | | | 28.5 | % | | | 28.0 | % | |
Decrease | |
| | |
| |
| | Perpetual Growth
Rate | | | 5.0 | % | | | 6.0 | % | | | 5.5 | % | |
Increase | |
| | |
| | Market Comparable
Companies | | Enterprise Value/
Revenue | | | 0.6 | x | | | 1.9 | x | | | 1.2 | x | |
Increase | |
| | |
| |
| | Discount for Lack
of Marketability | | | 10.0 | % | | | 10.0 | % | | | 10.0 | % | |
Decrease | |
| | |
| | Merger & Acquisition
Transactions | | Sale/Merger
Scenario | | $ | 9.65 | | | $ | 9.65 | | | $ | 9.65 | | |
Increase | |
Computer Services,
Software & Systems | |
Preferred Stock
| | $ | 42,915
| | | Discounted Cash Flow
| | Weighted Average
Cost of Capital | | | 16.5 | % | | | 17.5 | % | | | 17.0 | % | |
Decrease | |
| |
| |
| | Perpetual Growth
Rate | | | 2.0 | % | | | 3.0 | % | | | 2.5 | % | |
Increase | |
| | |
| | Market Comparable
Companies | | Enterprise Value/
Revenue | | | 11.0 | x | | | 16.1 | x | | | 12.1 | x | |
Increase | |
| | |
| |
| | Discount for Lack
of Marketability | | | 15.0 | % | | | 15.0 | % | | | 15.0 | % | |
Decrease | |
78
Morgan Stanley Select Dimensions Investment Series
Notes to Financial Statements n June 30, 2013 (unaudited) continued
| | | Fair Value at
June 30,
2013 | | Valuation Technique | | Unobservable Input | | Range | | Weighted
Average | | Impact
to
Valuation
from an
Increase
in Input | |
Computer Technology | |
Common Stock
| | $ | 129,903
| | | Discounted Cash Flow
| | Weighted Average
Cost of Capital | | | 17.0 | % | | | 19.0 | % | | | 18.0 | % | |
Decrease | |
Convertible Preferred
Stock | | $ | 12,616
| | |
| | Perpetual Growth
Rate | | | 2.5 | % | | | 3.5 | % | | | 3.0 | % | |
Increase | |
| | | | | Market Comparable
Companies | | Enterprise Value/
Revenue | | | 7.7 | x | | | 14.3 | x | | | 12.5 | x | |
Increase | |
| | |
| |
| | Discount for Lack
of Marketability | | | 15.0 | % | | | 15.0 | % | | | 15.0 | % | |
Decrease | |
Entertainment | |
Common Stock
| | $ | 257,576
| | | Discounted Cash Flow
| | Weighted Average
Cost of Capital | | | 15.0 | % | | | 16.0 | % | | | 15.6 | % | |
Decrease | |
| |
| |
| | Perpetual Growth
Rate | | | 3.5 | % | | | 4.5 | % | | | 4.0 | % | |
Increase | |
| | |
| | Market Comparable
Companies | | Enterprise Value/
EBITDA | | | 11.1 | x | | | 24.5 | x | | | 19.7 | x | |
Increase | |
| | |
| |
| | Discount for Lack
of Marketability | | | 10.0 | % | | | 10.0 | % | | | 10.0 | % | |
Decrease | |
Transfers between investment levels may occur as the markets fluctuate and/or the availability of data used in an investment's valuation changes. The Fund recognizes transfers between the levels as of the end of the period. As of December 31, 2012, the fair value of certain securities were adjusted due to developments which occurred between the time of the close of the foreign markets on which they trade and the close of business on the NYSE which resulted in their Level 2 classification. As of June 30, 2013, securities transferred from Level 2 to Level 1. The values of the transfers were as follows:
GLOBAL
INFRASTRUCUTRE | |
GROWTH | |
FOCUS GROWTH | | MULTI CAP
GROWTH | | MID CAP
GROWTH | |
| $ | 8,726,733 | | | $ | 1,178,151 | | | $ | 3,601,966 | | | $ | 540,748 | | | $ | 1,276,492 | | |
79
Morgan Stanley Select Dimensions Investment Series
Notes to Financial Statements n June 30, 2013 (unaudited) continued
Following is a reconciliation of investments in which significant unobservable inputs (Level 3) were used in determining fair value:
| | | Flexible
Income | | Growth | | Focus Growth | | Multi Cap Growth | | Mid Cap Growth | |
| | | Corporate
Bond | | Convertible
Preferred
Stock | | Convertible
Preferred
Stock | | Convertible
Preferred
Stocks | | Common
Stocks | | Convertible
Preferred
Stocks | | Preferred
Stock | |
Beginning Balance | | $ | — | † | | $ | 19,591 | | | $ | 60,053 | | | $ | 123,459 | | | $ | 421,346 | | | $ | 219,093 | | | $ | 45,756 | | |
Purchases | | | — | | | | — | | | | — | | | | — | | | | — | | | | — | | | | — | | |
Sales | | | — | | | | — | | | | — | | | | — | | | | — | | | | — | | | | — | | |
Amortization of discount | | | — | | | | — | | | | — | | | | — | | | | — | | | | — | | | | — | | |
Transfers in | | | — | | | | — | | | | — | | | | — | | | | — | | | | — | | | | — | | |
Transfers out | | | — | | | | — | | | | — | | | | — | | | | — | | | | — | | | | — | | |
Corporate action | | | — | | | | — | | | | — | | | | (28,403 | ) | | | — | | | | (45,336 | ) | | | — | | |
Change in unrealized
appreciation/depreciation | | | — | | | | 143,669 | | | | 440,392 | | | | 25,736 | | | | (33,867 | ) | | | 11,781 | | | | (2,841 | ) | |
Realized gains (losses) | | | — | | | | (163,260 | ) | | | (500,445 | ) | | | (120,792 | ) | | | — | | | | (168,168 | ) | | | — | | |
Ending Balance | | $ | — | † | | $ | — | | | $ | — | | | $ | — | | | $ | 387,479 | | | $ | 17,370 | | | $ | 42,915 | | |
Net change in unrealized
appreciation/depreciation
from investments still held
as of June 30, 2013. | | $ | — | | | $ | — | | | $ | — | | | $ | — | | | $ | (33,867 | ) | | $ | (7,619 | ) | | $ | (2,841 | ) | |
† Includes one security which is valued at zero.
3. Derivatives
Certain Portfolios may, but are not required to, use derivative instruments for a variety of purposes, including hedging, risk management, portfolio management or to earn income. Derivatives are financial instruments whose value is based on the value of an underlying asset, interest rate, index or financial instrument. A derivative instrument often has risks similar to its underlying asset and may have additional risks, including imperfect correlation between the value of the derivative and the underlying asset, risks of default by the counterparty to certain transactions, magnification of losses incurred due to changes in the market value of the securities, instruments, indices or interest rates to which they relate, and risks that the transactions may not be liquid. The use of derivatives involves risks that are different from, and possibly greater than, the risks associated with other portfolio investments. Derivatives may involve the use of highly specialized instruments that require investment techniques and risk analyses different from those associated with other portfolio investments. All of a Portfolio's holdings, including derivative instruments, are marked-to-market each day with the change in value reflected in unrealized appreciation (depreciation). Upon disposition, a realized gain or loss is recognized.
80
Morgan Stanley Select Dimensions Investment Series
Notes to Financial Statements n June 30, 2013 (unaudited) continued
Certain derivative transactions may give rise to a form of leverage. Leverage magnifies the potential for gain and risk of loss. Leverage associated with derivative transactions may cause the Portfolios to liquidate portfolio positions when it may not be advantageous to do so to satisfy its obligations or to meet earmarking or segregation requirements, pursuant to applicable Securities and Exchange Commission rules and regulations, or may cause the Portfolios to be more volatile than if the Portfolios had not been leveraged. Although the Adviser and/or Sub-Advisers seek to use derivatives to further the Portfolio's investment objectives, there is no assurance that the use of derivatives will achieve this result.
Following is a description of the derivative instruments and techniques that the Portfolios used during the period and their associated risks:
Foreign Currency Forward Exchange Contracts In connection with its investments in foreign securities, certain Portfolios entered into contracts with banks, brokers or dealers to purchase or sell securities or foreign currencies at a future date. A foreign currency forward exchange contract ("currency contract") is a negotiated agreement between the contracting parties to exchange a specified amount of currency at a specified future time at a specified rate. The rate can be higher or lower than the spot rate between the currencies that are the subject of the contract. Currency contracts may be used to protect against uncertainty in the level of future foreign currency exchange rates or to gain or modify exposure to a particular currency. Furthermore, such transactions reduce or preclude the opportunity for gain if the value of the currency should move in the direction opposite to the position taken. There is additional risk to the extent that currency contracts create exposure to currencies in which a Portfolio's securities are not denominated. Unanticipated changes in currency prices may result in poorer overall performance for a Portfolio than if it had not entered into such contracts. The use of currency contracts involves the risk of loss from the insolvency or bankruptcy of the counterparty to the contract or the failure of the counterparty to make payments or otherwise comply with the terms of the contract. A currency contract is marked-to-market daily and the change in market value is recorded by a Portfolio as unrealized gain or loss. A Portfolio records realized gains (losses) when the currency contract is closed equal to the difference between the value of the currency contract at the time it was opened and the value at the time it was closed.
Futures A futures contract is a standardized, exchange-traded agreement to buy or sell a specific quantity of an underlying instrument at a specific price at a specific future time. The value of a futures contract tends to increase and decrease in tandem with the value of the underlying instrument. Depending on the terms of the particular contract, futures contracts are settled through either physical delivery of the underlying instrument on the settlement date or by payment of a cash settlement amount on the settlement date. During the period the futures contract is open, payments are received from or made to the broker based upon
81
Morgan Stanley Select Dimensions Investment Series
Notes to Financial Statements n June 30, 2013 (unaudited) continued
changes in the value of the contract (the variation margin). A decision as to whether, when and how to use futures contracts involves the exercise of skill and judgment and even a well-conceived futures transaction may be unsuccessful because of market behavior or unexpected events. In addition to the derivatives risks discussed above, the prices of futures contracts can be highly volatile, using futures contracts can lower total return, and the potential loss from futures contracts can exceed a Portfolio's initial investment in such contracts. No assurance can be given that a liquid market will exist for any particular futures contract at any particular time. There is also the risk of loss by the Portfolio of margin deposits in the event of bankruptcy of a broker with whom the Portfolio has open positions in the futures contract.
Swaps An over-the-counter ("OTC") swap contract is an agreement between two parties pursuant to which the parties exchange payments at specified dates on the basis of a specified notional amount, with the payments calculated by reference to specified securities, indices, reference rates, currencies or other instruments. Most swap agreements provide that when the period payment dates for both parties are the same, the payments are made on a net basis (i.e., the two payment streams are netted out, with only the net amount paid by one party to the other). A Portfolio's obligations or rights under a swap contract entered into on a net basis will generally be equal only to the net amount to be paid or received under the agreement, based on the relative values of the positions held by each party. Many swap agreements are not entered into or traded on exchanges and often there is no central clearing or guaranty function for swaps. These OTC swaps are often subject to credit risk or the risk of default or non-performance by the counterparty. Swaps could result in losses if interest rates or foreign currency exchange rates or credit quality changes are not correctly anticipated by a Portfolio or if the reference index, security or investments do not perform as expected.
A Portfolio enters into credit default, interest rate and other forms of swap agreements to manage exposure to credit and interest rate risks.
A Portfolio's use of swaps during the period included those based on the credit of an underlying security, commonly referred to as credit default swaps. Where a Portfolio is the buyer of a credit default swap contract, it would be entitled to receive the par (or other agreed-upon) value of a referenced debt obligation from the counterparty to the contract only in the event of a default or similar event by the issuer of the debt obligation. If no default occurs, a Portfolio would have paid to the counterparty a periodic stream of payments over the term of the contract and received no benefit from the contract. When a Portfolio is the seller of a credit default swap contract, it receives the stream of payments but is obligated to pay an amount equal to the par (or other agreed upon) value of a referenced debt obligation upon the default or similar event of the issuer of the referenced debt obligation. The Dodd-Frank Wall Street Reform and Consumer Protection Act and related regulatory developments require the clearing and exchange-trading of certain OTC swap agreements. Mandatory exchange-trading and clearing is occurring on a phased-in basis.
82
Morgan Stanley Select Dimensions Investment Series
Notes to Financial Statements n June 30, 2013 (unaudited) continued
The current credit rating of each individual issuer is listed in the table following the Portfolio of Investments and serves as an indicator of the current status of the payment/performance risk of the credit derivative. Alternatively, for credit default swaps on an index of credits, the quoted market prices and current values serve as an indicator of the current status of the payment/performance risk of the credit derivative. Generally, lower credit ratings and increasing market values, in absolute terms, represent a deterioration of the credit and a greater likelihood of an adverse credit event of the issuer.
When a Portfolio has an unrealized loss on a swap agreement, the Portfolio has instructed the custodian to pledge cash or liquid securities as collateral with a value approximately equal to the amount of the unrealized loss. Collateral pledges are monitored and subsequently adjusted if and when the swap valuations fluctuate. If applicable, cash collateral is included with "Due from (to) Broker" in the Statements of Assets and Liabilities.
Upfront payments received or paid by a Portfolio will be reflected as an asset or liability in the Statements of Assets and Liabilities.
FASB ASC 815, Derivatives and Hedging: Overall ("ASC 815"), is intended to improve financial reporting about derivative instruments by requiring enhanced disclosures to enable investors to better understand how and why a Portfolio uses derivative instruments, how these derivative instruments are accounted for and their effects on a Portfolio's financial position and results of operations.
The following table sets forth the fair value of each Portfolio's derivative contracts by primary risk exposure as of June 30, 2013.
PORTFOLIO | | PRIMARY RISK
EXPOSURE | | ASSET DERIVATIVES
STATEMENTS OF
ASSETS AND
LIABILITIES LOCATION | | FAIR VALUE | | LIABILITY DERIVATIVES
STATEMENTS OF
ASSETS AND
LIABILITIES LOCATION | | FAIR VALUE | |
Flexible Income | | Interest Rate | | Net variation margin | | $ | 6,453 | † | | Net variation margin | | $ | (42,229 | )† | |
| | Risk
| | Unrealized appreciation
on open swap agreements | | | 113,600 | | | Unrealized appreciation
on open swap agreements | | |
— | | |
| | Credit Risk
| | Unrealized appreciation
on open swap agreements | | | 174 | | | Unrealized depreciation
on open swap agreements | | | (5,706 | ) | |
| | Foreign
Currency
Risk
| | Unrealized appreciation
on open foreign currency
forward exchange
contracts | | | 14,402 | | | Unrealized depreciation
on open foreign currency
forward exchange
contracts | | | (16,289 | ) | |
| | | | | | | $ | 134,629 | | | | | $ | (64,224 | ) | |
† Includes cumulative appreciation (depreciation) of futures contracts as reported in the Portfolio of Investments. Only current day's net variation margin is reported within the Statements of Assets and Liabilities.
83
Morgan Stanley Select Dimensions Investment Series
Notes to Financial Statements n June 30, 2013 (unaudited) continued
The following tables set forth by primary risk exposure of each Portfolio's realized gains (losses) and change in unrealized appreciation (depreciation) by type of derivative contract for the six months ended June 30, 2013 in accordance with ASC 815.
AMOUNT OF REALIZED GAIN (LOSS) ON DERIVATIVE CONTRACTS
PORTFOLIO | | PRIMARY RISK
EXPOSURE | | FUTURES | | FOREIGN
CURRENCY
FORWARD
EXCHANGE | | SWAPS | |
Flexible Income | | Interest Rate Risk | | $ | (66,027 | ) | | | — | | | $ | 72,169 | | |
| | | Credit Risk | | | — | | | | — | | | | (1,978 | ) | |
| | | Foreign Currency Risk | | | — | | | $ | 11,143 | | | | — | | |
| | | Total | | $ | (66,027 | ) | | $ | 11,143 | | | $ | 70,191 | | |
CHANGE IN UNREALIZED APPRECIATION (DEPRECIATION) ON DERIVATIVE CONTRACTS
PORTFOLIO | | PRIMARY RISK
EXPOSURE | | FUTURES | | FOREIGN
CURRENCY
FORWARD
EXCHANGE | | SWAPS | |
Flexible Income | | Interest Rate Risk | | $ | (41,812 | ) | | | — | | | $ | 127,271 | | |
| | | Credit Risk | | | — | | | | — | | | | (10,571 | ) | |
| | | Foreign Currency Risk | | | — | | | $ | (1,341 | ) | | | — | | |
| | | Total | | $ | (41,812 | ) | | $ | (1,341 | ) | | $ | 116,700 | | |
84
Morgan Stanley Select Dimensions Investment Series
Notes to Financial Statements n June 30, 2013 (unaudited) continued
The following tables present derivatives financial instruments that are subject to enforceable netting arrangements as of June 30, 2013.
GROSS AMOUNTS NOT OFFSET IN THE STATEMENTS OF ASSETS AND LIABILITIES
PORTFOLIO | | COUNTERPARTY | | GROSS
ASSET
DERIVATIVES
PRESENTED IN
STATEMENTS OF
ASSETS AND
LIABILITIES | | FINANCIAL
INSTRUMENT | | COLLATERAL
RECEIVED | | NET
AMOUNT
(NOT LESS
THAN 0) | |
Flexible Income | | Bank of America | | $ | 11,484 | | | $ | — | | | $ | — | | | $ | 11,484 | | |
| | | Credit Suisse | | | 187 | | | | — | | | | — | | | | 187 | | |
| | | Deutsche Bank | | | 32,252 | | | | — | | | | — | | | | 32,252 | | |
| | | Exchange Traded Futures | | | 6,453 | † | | | — | | | | — | | | | 6,453 | † | |
| | | Goldman Sachs International | | | 29,214 | | | | — | | | | — | | | | 29,214 | | |
| | | HSBC Bank PLC | | | 1,720 | | | | — | | | | — | | | | 1,720 | | |
| | | JPMorgan Chase | | | 42,115 | | | | (5,354 | ) | | | — | | | | 36,761 | | |
| | | UBS AG | | | 11,204 | | | | — | | | | — | | | | 11,204 | | |
| | | Total | | $ | 134,629 | | | $ | (5,354 | ) | | $ | — | | | $ | 129,275 | | |
GROSS AMOUNTS NOT OFFSET IN THE STATEMENTS OF ASSETS AND LIABILITIES
PORTFOLIO | | COUNTERPARTY | | GROSS
LIABILITY
DERIVATIVES
PRESENTED IN
STATEMENTS OF
ASSETS AND
LIABILITIES | | FINANCIAL
INSTRUMENT | | COLLATERAL
PLEDGED | | NET
AMOUNT
(NOT LESS
THAN 0) | |
Flexible Income | | Barclays Bank | | $ | 352 | | | $ | — | | | $ | — | | | $ | 352 | | |
| | | Credit Suisse | | | 183 | | | | — | | | | — | | | | 183 | | |
| | | Exchange Traded Futures | | | 42,229 | † | | | — | | | | — | | | | 42,229 | † | |
| | | Goldman Sachs International | | | 1,278 | | | | — | | | | — | | | | 1,278 | | |
| | | HSBC Bank PLC | | | 1,321 | | | | — | | | | — | | | | 1,321 | | |
| | | JPMorgan Chase | | | 5,354 | | | | (5,354 | ) | | | — | | | | 0 | | |
| | | UBS AG | | | 6,070 | | | | — | | | | — | | | | 6,070 | | |
| | | Wells Fargo Bank | | | 7,437 | | | | — | | | | — | | | | 7,437 | | |
| | | Total | | $ | 64,224 | | | $ | (5,354 | ) | | $ | — | | | $ | 58,870 | | |
† Includes cumulative appreciation (depreciation) of futures contracts as reported in the Portfolio of Investments. Only current day's net variation margin is reported within the Statements of Assets and Liabilities.
85
Morgan Stanley Select Dimensions Investment Series
Notes to Financial Statements n June 30, 2013 (unaudited) continued
For the six months ended June 30, 2013, Flexible Income Portfolio's average monthly amount outstanding for each derivative type is as follows:
Foreign Currency Forward Exchange Contracts: | |
Average monthly principal amount | | $ | | 2,162,159 | |
Futures Contracts: | |
Average monthly original value | | $ | | 5,167,711 | |
Swap Agreements: | |
Average monthly notional amount | | $ | | 5,476,120 | |
4. Advisory/Administration and Sub-Advisory Agreements
Pursuant to an Investment Advisory Agreement with the Adviser and Sub-Advisers, the Fund pays an advisory fee, accrued daily and payable monthly, by applying the annual rates listed below to each Portfolio's net assets determined at the close of each business day.
Money Market — 0.45% to the portion of the daily net assets not exceeding $250 million; 0.375% to the portion of the daily net assets exceeding $250 million but not exceeding $750 million; 0.325% to the portion of the daily net assets exceeding $750 million but not exceeding $1.25 billion; 0.30% to the portion of the daily net assets exceeding $1.25 billion but not exceeding $1.5 billion; and 0.275% to the portion of the daily net assets in excess of $1.5 billion. For the six months ended June 30, 2013, the advisory fee rate (net of waivers) was equivalent to an annual effective rate of 0.00% of the Portfolio's daily net assets.
Flexible Income — 0.32%.
Global Infrastructure — 0.57% to the portion of the daily net assets not exceeding $500 million; 0.47% to the portion of the daily net assets exceeding $500 million but not exceeding $1 billion; 0.445% to the portion of the daily net assets exceeding $1 billion but not exceeding $1.5 billion; 0.42% to the portion of the daily net assets exceeding $1.5 billion but not exceeding $2.5 billion; 0.395% to the portion of the daily net assets exceeding $2.5 billion but not exceeding $3.5 billion; 0.37% to the portion of the daily net assets exceeding $3.5 billion but not exceeding $5 billion; and 0.345% to the portion of the daily net assets in excess of $5 billion. For the six months ended June 30, 2013, the advisory fee rate (net of rebate) was equivalent to an annual effective rate of 0.57% of the Portfolio's daily net assets.
Growth — 0.50% to the portion of the daily net assets not exceeding $1 billion; 0.45% to the portion of the daily net assets exceeding $1 billion but not exceeding $2 billion; 0.40% to the portion of the daily net assets exceeding $2 billion but not exceeding $3 billion; and 0.35% to the portion of the daily net assets in excess of
86
Morgan Stanley Select Dimensions Investment Series
Notes to Financial Statements n June 30, 2013 (unaudited) continued
$3 billion. For the six months ended June 30, 2013, the advisory fee rate (net of rebate) was equivalent to an annual effective rate of 0.50% of the Portfolio's daily net assets.
Focus Growth — 0.545% to the portion of the daily net assets not exceeding $250 million; 0.42% to the portion of the daily net assets exceeding $250 million but not exceeding $2.5 billion; 0.395% to the portion of the daily net assets exceeding $2.5 billion but not exceeding $3.5 billion; 0.37% to the portion of the daily net assets exceeding $3.5 billion but not exceeding $4.5 billion; and 0.345% to the portion of the daily net assets in excess of $4.5 billion. For the six months ended June 30, 2013, the advisory fee rate (net of rebate) was equivalent to an annual effective rate of 0.54% of the Portfolio's daily net assets.
Multi Cap Growth — 0.67% to the portion of the daily net assets not exceeding $500 million; 0.645% to the portion of the daily net assets exceeding $500 million but not exceeding $2 billion; 0.62% to the portion of the daily net assets exceeding $2 billion but not exceeding $3 billion; and 0.595% to the portion of the daily net assets in excess of $3 billion. For the six months ended June 30, 2013, the advisory fee rate (net of rebate) was equivalent to an annual effective rate of 0.67% of the Portfolio's daily net assets.
Mid Cap Growth — 0.42% to the portion of the daily net assets not exceeding $500 million; and 0.395% to the portion of the daily net assets in excess of $500 million. For the six months ended June 30, 2013, the advisory fee rate (net of rebate) was equivalent to an annual effective rate of 0.42% of the Portfolio's daily net assets.
Under the Sub-Advisory Agreement between the Adviser and the Sub-Advisers, the Sub-Advisers provide Global Infrastructure Portfolio with advisory services, subject to the overall supervision of the Adviser and the Fund's Officers and Trustees. The Adviser pays the Sub-Advisers on a monthly basis a portion of the net advisory fees the Adviser receives from the Portfolio.
Pursuant to an Administration Agreement with Morgan Stanley Services Company Inc. (the "Administrator"), an affiliate of the Adviser, each Portfolio pays an administration fee, accrued daily and payable monthly, by applying the annual rate of 0.08% (Money Market Portfolio's rate is 0.05%) to each Portfolio's daily net assets.
Under a Sub-Administration agreement between the Administrator and State Street, State Street provides certain administrative services to the Fund. For such services, the Administrator pays State Street a portion of the fee the Administrator receives from the each Portfolio.
87
Morgan Stanley Select Dimensions Investment Series
Notes to Financial Statements n June 30, 2013 (unaudited) continued
5. Plan of Distribution
Shares of the Fund are distributed by Morgan Stanley Distribution, Inc. (the "Distributor"), an affiliate of the Adviser, Administrator and Sub-Advisers. The Fund has adopted a Plan of Distribution (the "Plan") pursuant to Rule 12b-1 under the Act. Under the Plan, Class Y shares of each Portfolio bear a distribution fee which is accrued daily and paid monthly at the annual rate of 0.25% of the average daily net assets of the class.
The Distributor, Adviser and Administrator have agreed to waive/reimburse all or a portion of the Money Market Portfolio's distribution fee, advisory fee and administration fee, respectively, to the extent that total expenses exceed total income of the Money Market Portfolio on a daily basis. For the six months ended June 30, 2013, the Distributor waived $52,095, the Adviser waived $143,722 and the Administrator waived $11,258. For the six months ended June 30, 2013, the Adviser waived additional fees and/or reimbursed expenses to the extent the Fund's total expenses exceeded total income on a daily basis in the amount of $1,523. These fee waivers and/or expense reimbursements will continue for at least one year or until such time that the Trustees act to discontinue all or a portion of such waivers and/or expense reimbursements when it deems such action is appropriate.
6. Security Transactions and Transactions with Affiliates
For the six months ended June 30, 2013, purchases and sales of investment securities, excluding short-term investments, were as follows:
| | | U.S. GOVERNMENT SECURITIES | | OTHER | |
PORTFOLIO | | PURCHASES | | SALES | | PURCHASES | | SALES | |
Flexible Income | | $ | 1,350,443 | | | $ | 2,009,605 | | | $ | 4,274,151 | | | $ | 5,539,928 | | |
Global Infrastructure | | | — | | | | — | | | | 4,076,367 | | | | 6,785,687 | | |
Growth | | | — | | | | — | | | | 3,726,541 | | | | 5,857,071 | | |
Focus Growth | | | — | | | | — | | | | 14,155,979 | | | | 22,376,486 | | |
Multi Cap Growth | | | — | | | | — | | | | 3,395,283 | | | | 4,994,229 | | |
Mid Cap Growth | | | — | | | | — | | | | 5,825,866 | | | | 7,685,683 | | |
Each Portfolio (except Money Market) invests in the Institutional Class of the Morgan Stanley Institutional Liquidity Funds (the "Liquidity Funds"), an open-end management investment company managed by the Adviser. Advisory fees paid by each Portfolio are reduced by an amount equal to its pro-rata share of advisory and administrative fees paid by each Portfolio due to its investment in the Liquidity Funds.
88
Morgan Stanley Select Dimensions Investment Series
Notes to Financial Statements n June 30, 2013 (unaudited) continued
A summary of each Portfolio's transactions in shares of the Liquidity Funds during the six months ended June 30, 2013 is as follows:
PORTFOLIO | | VALUE
DECEMBER 31, 2012 | | PURCHASES
AT COST | | SALES | | DIVIDEND
INCOME | | VALUE
JUNE 30, 2013 | |
Flexible Income | | $ | 182,684 | | | $ | 802,256 | | | $ | 470,303 | | | $ | 303 | | | $ | 514,637 | | |
Global Infrastructure | | | 214,894 | | | | 5,472,287 | | | | 3,442,825 | | | | 41 | | | | 2,244,356 | | |
Growth | | | 483,205 | | | | 3,803,455 | | | | 4,268,465 | | | | 346 | | | | 18,195 | | |
Focus Growth | | | 686,482 | | | | 15,073,988 | | | | 15,154,725 | | | | 1,282 | | | | 605,745 | | |
Multi Cap Growth | | | 456,721 | | | | 3,368,677 | | | | 3,818,729 | | | | 288 | | | | 6,669 | | |
Mid Cap Growth | | | 1,133,672 | | | | 3,410,619 | | | | 4,179,933 | | | | 383 | | | | 364,358 | | |
In addition, the table also identifies the income distributions earned, if any, by each Portfolio for that Portfolio's investment in the Liquidity Funds.
Income distributions are included in "Interest and dividends from affiliates" in the Statements of Operations.
PORTFOLIO | | ADVISORY FEE
REDUCTION | |
Flexible Income | | $ | 375 | | |
Global Infrastructure | | | 197 | | |
Growth | | | 405 | | |
Focus Growth | | | 1,534 | | |
Multi Cap Growth | | | 340 | | |
Mid Cap Growth | | | 452 | | |
The following Portfolio had transactions with Hartford Financial Services Group, Inc., an affiliate of the Fund, for the six months ended June 30, 2013:
PORTFOLIO | | VALUE
DECEMBER 31,
2012 | | PURCHASES
AT COST | | SALES | | REALIZED
GAIN | | INTEREST
INCOME | | VALUE
JUNE 30,
2013 | |
Flexible Income | | $ | 69,819 | | | | — | | | | — | | | | — | | | $ | 1,763 | | | $ | 66,451 | | |
The following Portfolio had transactions with Citigroup, Inc., and its affiliated broker-dealers, which may be deemed to be affiliates of the Adviser, Sub-Advisers, Administrator and Distributor under Section 17 of the Act, for the six months ended June 30, 2013:
PORTFOLIO | | VALUE
DECEMBER 31,
2012 | | PURCHASES
AT COST | | SALES | | REALIZED
GAIN | | INTEREST
INCOME | | VALUE
JUNE 30,
2013 | |
Flexible Income | | $ | 259,788 | | | $ | 40,000 | | | $ | 13,325 | | | $ | 2,264 | | | $ | 7,976 | | | $ | 292,374 | | |
89
Morgan Stanley Select Dimensions Investment Series
Notes to Financial Statements n June 30, 2013 (unaudited) continued
For the six months ended June 30, 2013, the following Portfolios incurred brokerage commissions with Morgan Stanley & Co., LLC, an affiliate of the Adviser, Sub-Advisers, Administrator and Distributor, for portfolio transactions executed on behalf of each Portfolio:
| GROWTH | | FOCUS
GROWTH | | MULTI CAP
GROWTH | | MID CAP
GROWTH | |
| $ | 258 | | | $ | 1,011 | | | $ | 243 | | | $ | 71 | | |
For the six months ended June 30, 2013, the following Portfolios incurred brokerage commissions with Citigroup, Inc., and its affiliated broker-dealers, which may be deemed affiliates of the Adviser, Sub-Advisers, Administrator and Distributor under Section 17 of the Act, for portfolio transactions executed on behalf of each Portfolio:
GLOBAL
INFRASTRUCTURE | | GROWTH | | FOCUS
GROWTH | | MULTI CAP
GROWTH | | MID CAP
GROWTH | |
| $ | 49 | | | $ | 163 | | | $ | 835 | | | $ | 149 | | | $ | 391 | | |
Morgan Stanley Services Company Inc., an affiliate of the Adviser, Sub-Advisers and Distributor, was the Fund's transfer agent. Effective July 1, 2013, the Trustees approved changing the transfer agent to Boston Financial Data Services, Inc.
7. Purposes of and Risks Relating to Certain Financial Instruments
Certain Portfolios may lend securities to qualified financial institutions, such as broker-dealers, to earn additional income. Risks in securities lending transactions are that a borrower may not provide additional collateral when required or return the securities when due, and that the value of the short-term investments will be less than the amount of cash collateral plus any rebate that is required to be returned to the borrower.
Certain Portfolios may invest in mortgage securities, including securities issued by Federal National Mortgage Association ("FNMA") and Federal Home Loan Mortgage Corporation ("FHLMC"). These are fixed income securities that derive their value from or represent interests in a pool of mortgages or mortgage securities. An unexpectedly high rate of defaults on the mortgages held by a mortgage pool may adversely affect the value of a mortgage backed security and could result in losses to the Portfolio. The risk of such defaults is generally higher in the case of mortgage pools that include sub-prime mortgages. Sub-prime mortgages refer to loans made to borrowers with weakened credit histories or with a lower capacity to make timely payments on their mortgages. The securities issued by FNMA and FHLMC that are held by the Portfolios are not backed by sub-prime mortgages.
90
Morgan Stanley Select Dimensions Investment Series
Notes to Financial Statements n June 30, 2013 (unaudited) continued
Additionally, securities issued by FNMA and FHLMC are not backed by or entitled to the full faith and credit of the United States; rather, they are supported by the right of the issuer to borrow from the U.S. Department of the Treasury.
The Federal Housing Finance Agency ("FHFA") serves as conservator of FNMA and FHLMC and the U.S. Department of the Treasury has agreed to provide capital as needed to ensure FNMA and FHLMC continue to provide liquidity to the housing and mortgage markets.
The Money Market Portfolio may enter into repurchase agreements under which the Portfolio sends cash and takes possession of securities with an agreement that the counterparty will repurchase such securities. In the event of default on the obligation to repurchase, the Portfolio has the right to liquidate the collateral and apply the proceeds in satisfaction of the obligation. In the event of default or bankruptcy by the counterparty to the agreement, realization of the collateral proceeds may be subject to certain costs and delays.
8. Federal Income Tax Status
It is the Portfolios' intention to continue to qualify as a regulated investment company and distribute all of its taxable and tax-exempt income. Accordingly, no provision for Federal income taxes is required in the financial statements.
Dividend income and distributions to shareholders are recorded on the ex-dividend date. Interest income is recognized on an accrual basis. Dividends from net investment income, if any, are declared and paid annually. Net realized capital gains, if any, are distributed at least annually.
A Portfolio may be subject to taxes imposed by countries in which it invests. Such taxes are generally based on income and/or capital gains earned or repatriated. Taxes are accrued based on net investment income, net realized gains and net unrealized appreciation as such income and/or gains are earned. Taxes may also be based on transactions in foreign currency and are accrued based on the value of investments denominated in such currency.
FASB ASC 740-10, Income Taxes — Overall, sets forth a minimum threshold for financial statement recognition of the benefit of a tax position taken or expected to be taken in a tax return. Management has concluded there are no significant uncertain tax positions that would require recognition in the financial statements. If applicable, the Portfolios recognize interest accrued related to unrecognized tax benefits in "Interest Expense" and penalties in "Other Expenses" in the Statements of Operations. The Portfolios file tax returns with the U.S. Internal Revenue Service, New York and various states. Each of the tax years in the four-year period ended December 31, 2012, remains subject to examination by taxing authorities.
91
Morgan Stanley Select Dimensions Investment Series
Notes to Financial Statements n June 30, 2013 (unaudited) continued
The tax character of distributions paid may differ from the character of distributions shown in the Statements of Changes in Net Assets due to short-term capital gains being treated as ordinary income for tax purposes. The tax character of distributions paid during fiscal years 2012 and 2011 was as follows:
| | | 2012 DISTRIBUTIONS PAID FROM: | | 2011 DISTRIBUTIONS PAID FROM: | |
PORTFOLIO | | ORDINARY
INCOME | | LONG-TERM
CAPITAL GAIN | | ORDINARY
INCOME | | LONG-TERM
CAPITAL GAIN | |
Money Market | | $ | 9,086 | | | | — | | | $ | 9,367 | | | | — | | |
Flexible Income | | | 1,465,048 | | | | — | | | | 1,629,670 | | | | — | | |
Global Infrastructure | | | 1,127,854 | | | $ | 1,997,604 | | | | 794,791 | | | $ | 1,788,505 | | |
Growth | | | — | | | | 996,292 | | | | — | | | | — | | |
Focus Growth | | | 13 | | | | 2,406,744 | | | | — | | | | — | | |
Multi Cap Growth | | | — | | | | 1,147,541 | | | | — | | | | — | | |
Mid Cap Growth | | | — | | | | 1,976,981 | | | | 96,594 | | | | — | | |
The amount and character of income and gains to be distributed are determined in accordance with income tax regulations which may differ from GAAP. These book/tax differences are either considered temporary or permanent in nature.
Temporary differences are primarily due to differing book and tax treatments for the timing of the recognition of gains (losses) on certain investment transactions and the timing of the deductibility of certain expenses.
Permanent differences, primarily due to differing treatments of gains (losses) related to foreign currency transactions, swap transactions, paydown adjustments, book amortization of premium on debt securities, expiring capital losses, net operating losses, partnership basis adjustments and certain equity securities designated as issued by passive foreign investment companies, resulted in the following reclassifications among the Portfolio's components of net assets at December 31, 2012:
PORTFOLIO | | ACCUMULATED UNDISTRIBUTED
(DISTRIBUTION IN EXCESS OF)
NET INVESTMENT INCOME | | ACCUMULATED
NET REALIZED GAIN (LOSS) | | PAID-IN-CAPITAL | |
Money Market | | $ | (51 | ) | | $ | 51 | | | | — | | |
Flexible Income | | | 65,401 | | | | 561,607 | | | $ | (627,008 | ) | |
Global Infrastructure | | | 26,875 | | | | (26,875 | ) | | | — | | |
Growth | | | 1,400 | | | | (1,400 | ) | | | — | | |
Focus Growth | | | 22,337 | | | | (22,337 | ) | | | — | | |
Multi Cap Growth | | | 91,474 | | | | (12,481 | ) | | | (78,993 | ) | |
Mid Cap Growth | | | (1,319 | ) | | | 5,901 | | | | (4,582 | ) | |
92
Morgan Stanley Select Dimensions Investment Series
Notes to Financial Statements n June 30, 2013 (unaudited) continued
At December 31, 2012, the components of distributable earnings on a tax basis were as follows:
PORTFOLIO | | UNDISTRIBUTED
ORDINARY
INCOME | | UNDISTRIBUTED
LONG-TERM
CAPITAL GAIN | |
Money Market | | $ | 4,020 | | | | — | | |
Flexible Income | | | 1,150,444 | | | | — | | |
Global Infrastructure | | | 631,140 | | | $ | 2,292,581 | | |
Growth | | | 11,268 | | | | 1,657,859 | | |
Focus Growth | | | 241,913 | | | | — | | |
Multi Cap Growth | | | — | | | | 381,825 | | |
Mid Cap Growth | | | 72,841 | | | | 64,675 | | |
At June 30, 2013, cost, gross unrealized appreciation (depreciation) and net unrealized appreciation (depreciation) of the investments of each of the Portfolios were as follows:
PORTFOLIO | | COST | | APPRECIATION | | DEPRECIATION | | NET APPRECIATION
(DEPRECIATION) | |
Money Market | | $ | 62,651,166 | | | | — | | | | — | | | | — | | |
Flexible Income | | | 19,370,235 | | | $ | 1,057,158 | | | $ | (559,825 | ) | | $ | 497,333 | | |
Global Infrastructure | | | 21,822,629 | | | | 5,742,902 | | | | (135,327 | ) | | | 5,607,575 | | |
Growth | | | 13,158,282 | | | | 6,479,466 | | | | (153,022 | ) | | | 6,326,444 | | |
Focus Growth | | | 45,550,023 | | | | 22,921,197 | | | | (616,767 | ) | | | 22,304,430 | | |
Multi Cap Growth | | | 10,963,258 | | | | 5,229,765 | | | | (407,497 | ) | | | 4,822,268 | | |
Mid Cap Growth | | | 19,333,919 | | | | 5,729,070 | | | | (930,456 | ) | | | 4,798,614 | | |
On December 22, 2010, the Regulated Investment Company Modernization Act of 2010 (the "Modernization Act") was signed into law. The Modernization Act modernizes several tax provisions related to Regulated Investment Companies ("RICs") and their shareholders. One key change made by the Modernization Act is that capital losses will generally retain their character as short-term or long-term and may be carried forward indefinitely to offset future gains. These losses are utilized before other capital loss carryforwards that expire. Generally, the Modernization Act is effective for taxable years beginning after December 22, 2010.
At December 31, 2012, the following Portfolios had available for Federal income tax purposes unused short-term capital losses that will not expire:
PORTFOLIO | | SHORT-TERM LOSSES
NO EXPIRATION | |
Money Market | | $ | 1,466 | | |
Focus Growth | | | 888,108 | | |
93
Morgan Stanley Select Dimensions Investment Series
Notes to Financial Statements n June 30, 2013 (unaudited) continued
In addition, the following Portfolio had available capital loss carryforwards to offset future net capital gains, to the extent provided by regulations which will expire on the indicated dates:
| | | AMOUNT IN THOUSANDS AVAILABLE THROUGH DECEMBER 31, | |
PORTFOLIO | | 2013 | | 2014 | | 2016 | | 2017 | | 2018 | | TOTAL | |
Flexible Income | | $ | 562 | | | $ | 938 | | | $ | 4,961 | | | $ | 6,610 | | | $ | 2,202 | | | $ | 15,273 | | |
During the year ended December 31, 2012, the following Portfolio expired capital loss carryforwards for U.S. Federal income tax purposes of:
PORTFOLIO | | EXPIRED CAPITAL LOSS
CARRYFORWARDS | |
Flexible Income | | $ | 590,958 | | |
To the extent that capital loss carryforwards are used to offset any future capital gains realized during the carryover period as provided by U.S. Federal income tax regulations, no capital gains tax liability will be incurred by a Portfolio for gains realized and not distributed. To the extent that capital gains are offset, such gains will not be distributed to the shareholders.
During the year ended December 31, 2012, the following Portfolios utilized capital loss carryforwards for U.S. Federal income tax purposes of:
PORTFOLIO | | UTILIZED CAPITAL LOSS
CARRYFORWARDS | |
Money Market | | $ | 64 | | |
Flexible Income | | | 608,226 | | |
94
(This page has been intentionally left blank.)
Morgan Stanley Select Dimensions Investment Series
Financial Highlights
| | | | | | | | | | | | | | | |
FOR THE YEAR
ENDED
DECEMBER 31 | | NET ASSET
VALUE
BEGINNING
OF PERIOD | | NET
INVESTMENT
INCOME(a) | | NET REALIZED
AND
UNREALIZED
GAIN (LOSS) | | TOTAL FROM
INVESTMENT
OPERATIONS | | DIVIDENDS
TO
SHAREHOLDERS | | DISTRIBUTIONS
TO
SHAREHOLDERS | | TOTAL
DIVIDENDS
AND
DISTRIBUTIONS | |
MONEY MARKET
CLASS X SHARES | | | |
| 2008^ | | $ | 1.00 | | | $ | 0.020 | | | | — | | | $ | 0.020 | | | $ | (0.020 | ) | | | — | | | $ | (0.020 | ) | |
| 2009^ | | | 1.00 | | | | 0.000 | (d) | | | — | | | | 0.000 | (d) | | | (0.000 | )(d) | | | — | | | | (0.000 | )(d) | |
| 2010^ | | | 1.00 | | | | 0.000 | (d) | | | — | | | | 0.000 | (d) | | | (0.000 | )(d) | | | — | | | | (0.000 | )(d) | |
2011 | | | 1.00 | | | | 0.000 | (d) | | $ | (0.000 | )(d) | | | 0.000 | (d) | | | (0.000 | )(d) | | | — | | | | (0.000 | )(d) | |
2012 | | | 1.00 | | | | 0.000 | (d) | | | 0.000 | (d) | | | 0.000 | (d) | | | (0.000 | )(d) | | | — | | | | (0.000 | )(d) | |
| 2013^^ | | | 1.00 | | | | 0.000 | (d) | | | — | | | | 0.000 | (d) | | | (0.000 | )(d) | | | — | | | | (0.000 | )(d) | |
CLASS Y SHARES | | | |
| 2008^ | | | 1.00 | | | | 0.020 | | | | — | | | | 0.020 | | | | (0.020 | ) | | | — | | | | (0.020 | ) | |
| 2009^ | | | 1.00 | | | | 0.000 | (d) | | | — | | | | 0.000 | (d) | | | (0.000 | )(d) | | | — | | | | (0.000 | )(d) | |
| 2010^ | | | 1.00 | | | | 0.000 | (d) | | | — | | | | 0.000 | (d) | | | (0.000 | )(d) | | | — | | | | (0.000 | )(d) | |
2011 | | | 1.00 | | | | 0.000 | (d) | | | (0.000 | )(d) | | | 0.000 | (d) | | | (0.000 | )(d) | | | — | | | | (0.000 | )(d) | |
2012 | | | 1.00 | | | | 0.000 | (d) | | | 0.000 | (d) | | | 0.000 | (d) | | | (0.000 | )(d) | | | — | | | | (0.000 | )(d) | |
| 2013^^ | | | 1.00 | | | | 0.000 | (d) | | | — | | | | 0.000 | (d) | | | (0.000 | )(d) | | | — | | | | (0.000 | )(d) | |
FLEXIBLE INCOME
CLASS X SHARES | | | |
| 2008^ | | | 7.12 | | | | 0.41 | | | | (1.93 | ) | | | (1.52 | ) | | | (0.14 | ) | | | — | | | | (0.14 | ) | |
| 2009^ | | | 5.46 | | | | 0.32 | | | | 0.73 | | | | 1.05 | | | | (0.43 | ) | | | — | | | | (0.43 | ) | |
| 2010^ | | | 6.08 | | | | 0.27 | | | | 0.25 | | | | 0.52 | | | | (0.39 | ) | | | — | | | | (0.39 | ) | |
2011 | | | 6.21 | | | | 0.35 | | | | (0.08 | ) | | | 0.27 | | | | (0.41 | ) | | | — | | | | (0.41 | ) | |
2012 | | | 6.07 | | | | 0.31 | | | | 0.45 | | | | 0.76 | | | | (0.42 | ) | | | — | | | | (0.42 | ) | |
| 2013^^ | | | 6.41 | | | | 0.13 | | | | (0.17 | ) | | | (0.04 | ) | | | — | | | | — | | | | — | | |
CLASS Y SHARES | | | |
| 2008^ | | | 7.10 | | | | 0.39 | | | | (1.93 | ) | | | (1.54 | ) | | | (0.13 | ) | | | — | | | | (0.13 | ) | |
| 2009^ | | | 5.43 | | | | 0.31 | | | | 0.72 | | | | 1.03 | | | | (0.42 | ) | | | — | | | | (0.42 | ) | |
| 2010^ | | | 6.04 | | | | 0.25 | | | | 0.26 | | | | 0.51 | | | | (0.38 | ) | | | — | | | | (0.38 | ) | |
2011 | | | 6.17 | | | | 0.33 | | | | (0.07 | ) | | | 0.26 | | | | (0.40 | ) | | | — | | | | (0.40 | ) | |
2012 | | | 6.03 | | | | 0.29 | | | | 0.45 | | | | 0.74 | | | | (0.40 | ) | | | — | | | | (0.40 | ) | |
| 2013^^ | | | 6.37 | | | | 0.12 | | | | (0.17 | ) | | | (0.05 | ) | | | — | | | | — | | | | — | | |
See Notes to Financial Statements
96
| | | | | | | | | RATIO TO AVERAGE
NET ASSETS(c) | | | | | |
FOR THE YEAR
ENDED
DECEMBER 31 | | NET ASSET
VALUE
END OF
PERIOD | | TOTAL
RETURN(b) | | NET ASSETS
END OF
PERIOD
(000'S) | | EXPENSES | | NET
INVESTMENT
INCOME | | REBATE FROM
MORGAN STANLEY
AFFILIATE | | PORTFOLIO
TURNOVER
RATE | |
MONEY MARKET
CLASS X SHARES | |
| 2008^ | | $ | 1.00 | | | | 2.38 | % | | $ | 42,190 | | | | 0.58 | % | | | 2.34 | % | | | — | | | | N/A | | |
| 2009^ | | | 1.00 | | | | 0.03 | | | | 40,771 | | | | 0.39 | (e)(f) | | | 0.03 | (e)(f) | | | — | | | | N/A | | |
| 2010^ | | | 1.00 | | | | 0.01 | | | | 32,429 | | | | 0.30 | (f) | | | 0.01 | (f) | | | — | | | | N/A | | |
2011 | | | 1.00 | | | | 0.01 | | | | 27,555 | | | | 0.23 | (f) | | | 0.01 | (f) | | | — | | | | N/A | | |
2012 | | | 1.00 | | | | 0.01 | | | | 23,245 | | | | 0.28 | (f) | | | 0.01 | (f) | | | — | | | | N/A | | |
| 2013^^ | | | 1.00 | | | | 0.00 | (g)(k) | | | 22,193 | | | | 0.21 | (f)(l) | | | 0.01 | (f)(l) | | | — | | | | N/A | | |
CLASS Y SHARES | |
| 2008^ | | | 1.00 | | | | 2.13 | | | | 173,595 | | | | 0.83 | | | | 1.91 | | | | — | | | | N/A | | |
| 2009^ | | | 1.00 | | | | 0.01 | | | | 101,015 | | | | 0.40 | (e)(f) | | | 0.02 | (e)(f) | | | — | | | | N/A | | |
| 2010^ | | | 1.00 | | | | 0.01 | | | | 67,856 | | | | 0.30 | (f) | | | 0.01 | (f) | | | — | | | | N/A | | |
2011 | | | 1.00 | | | | 0.01 | | | | 56,081 | | | | 0.23 | (f) | | | 0.01 | (f) | | | — | | | | N/A | | |
2012 | | | 1.00 | | | | 0.01 | | | | 47,618 | | | | 0.28 | (f) | | | 0.01 | (f) | | | — | | | | N/A | | |
| 2013^^ | | | 1.00 | | | | 0.00 | (g)(k) | | | 39,993 | | | | 0.21 | (f)(l) | | | 0.01 | (f)(l) | | | — | | | | N/A | | |
FLEXIBLE INCOME
CLASS X SHARES | |
| 2008^ | | | 5.46 | | | | (21.62 | ) | | | 14,743 | | | | 0.67 | (i) | | | 6.48 | (i) | | | 0.01 | % | | | 73 | % | |
| 2009^ | | | 6.08 | | | | 19.77 | | | | 13,924 | | | | 0.92 | (i) | | | 5.58 | (i) | | | 0.01 | | | | 165 | | |
| 2010^ | | | 6.21 | | | | 9.08 | | | | 12,719 | | | | 0.90 | (i) | | | 4.38 | (i) | | | 0.00 | (g) | | | 91 | | |
2011 | | | 6.07 | | | | 4.48 | | | | 11,405 | | | | 1.07 | (i) | | | 5.71 | (i) | | | 0.00 | (g) | | | 65 | | |
2012 | | | 6.41 | | | | 12.98 | | | | 10,317 | | | | 1.09 | (i) | | | 4.92 | (i) | | | 0.00 | (g) | | | 100 | | |
| 2013^^ | | | 6.37 | | | | (0.62 | )(k) | | | 9,450 | | | | 1.58 | (i)(l) | | | 3.94 | (i)(l) | | | 0.00 | (g)(l) | | | 27 | (k) | |
CLASS Y SHARES | |
| 2008^ | | | 5.43 | | | | (21.89 | ) | | | 15,658 | | | | 0.92 | (i) | | | 6.23 | (i) | | | 0.01 | | | | 73 | | |
| 2009^ | | | 6.04 | | | | 19.45 | | | | 16,357 | | | | 1.17 | (i) | | | 5.33 | (i) | | | 0.01 | | | | 165 | | |
| 2010^ | | | 6.17 | | | | 8.85 | | | | 14,740 | | | | 1.15 | (i) | | | 4.13 | (i) | | | 0.00 | (g) | | | 91 | | |
2011 | | | 6.03 | | | | 4.20 | | | | 12,529 | | | | 1.32 | (i) | | | 5.46 | (i) | | | 0.00 | (g) | | | 65 | | |
2012 | | | 6.37 | | | | 12.75 | | | | 11,967 | | | | 1.34 | (i) | | | 4.67 | (i) | | | 0.00 | (g) | | | 100 | | |
| 2013^^ | | | 6.32 | | | | (0.78 | )(k) | | | 10,593 | | | | 1.83 | (i)(l) | | | 3.69 | (i)(l) | | | 0.00 | (g)(l) | | | 27 | (k) | |
97
Morgan Stanley Select Dimensions Investment Series
Financial Highlights continued
| | | | | | | | | | | | | | | | |
FOR THE YEAR
ENDED
DECEMBER 31 | | NET ASSET
VALUE
BEGINNING
OF PERIOD | | NET
INVESTMENT
INCOME
(LOSS)(a) | | NET REALIZED
AND
UNREALIZED
GAIN (LOSS) | | TOTAL FROM
INVESTMENT
OPERATIONS | | DIVIDENDS
TO
SHAREHOLDERS | | DISTRIBUTIONS
TO
SHAREHOLDERS | | TOTAL
DIVIDENDS
AND
DISTRIBUTIONS | |
GLOBAL INFRASTRUCTURE
CLASS X SHARES | | | |
| 2008^ | | $ | 29.77 | | | $ | 0.58 | | | $ | (10.37 | ) | | $ | (9.79 | ) | | $ | (0.15 | ) | | | — | | | $ | (0.15 | ) | |
| 2009^ | | | 19.83 | | | | 0.54 | | | | 3.00 | | | | 3.54 | | | | (0.69 | ) | | | — | | | | (0.69 | ) | |
| 2010^ | | | 22.68 | | | | 0.56 | | | | 0.72 | | | | 1.28 | | | | (0.53 | ) | | $ | (0.98 | ) | | | (1.51 | ) | |
2011 | | | 22.45 | | | | 0.52 | | | | 2.95 | | | | 3.47 | | | | (0.69 | ) | | | (1.51 | ) | | | (2.20 | ) | |
2012 | | | 23.72 | | | | 0.55 | | | | 3.44 | | | | 3.99 | | | | (0.57 | ) | | | (2.36 | ) | | | (2.93 | ) | |
| 2013^^ | | | 24.78 | | | | 0.31 | | | | 1.00 | | | | 1.31 | | | | (0.67 | ) | | | (2.36 | ) | | | (3.03 | ) | |
CLASS Y SHARES | | | |
| 2008^ | | | 29.75 | | | | 0.52 | | | | (10.36 | ) | | | (9.84 | ) | | | (0.13 | ) | | | — | | | | (0.13 | ) | |
| 2009^ | | | 19.78 | | | | 0.49 | | | | 3.00 | | | | 3.49 | | | | (0.64 | ) | | | — | | | | (0.64 | ) | |
| 2010^ | | | 22.63 | | | | 0.51 | | | | 0.71 | | | | 1.22 | | | | (0.47 | ) | | | (0.98 | ) | | | (1.45 | ) | |
2011 | | | 22.40 | | | | 0.46 | | | | 2.95 | | | | 3.41 | | | | (0.62 | ) | | | (1.51 | ) | | | (2.13 | ) | |
2012 | | | 23.68 | | | | 0.49 | | | | 3.42 | | | | 3.91 | | | | (0.50 | ) | | | (2.36 | ) | | | (2.86 | ) | |
| 2013^^ | | | 24.73 | | | | 0.27 | | | | 1.01 | | | | 1.28 | | | | (0.60 | ) | | | (2.36 | ) | | | (2.96 | ) | |
GROWTH
CLASS X SHARES | | | |
| 2008^ | | | 22.19 | | | | (0.04 | ) | | | (10.74 | ) | | | (10.78 | ) | | | (0.06 | ) | | | — | | | | (0.06 | ) | |
| 2009^ | | | 11.35 | | | | 0.02 | | | | 7.49 | | | | 7.51 | | | | — | | | | — | | | | — | | |
| 2010^ | | | 18.86 | | | | 0.02 | | | | 4.45 | | | | 4.47 | | | | — | | | | — | | | | — | | |
2011 | | | 23.33 | | | | (0.04 | ) | | | (0.75 | ) | | | (0.79 | ) | | | — | | | | — | | | | — | | |
2012 | | | 22.54 | | | | 0.05 | | | | 3.18 | | | | 3.23 | | | | — | | | | (1.13 | ) | | | (1.13 | ) | |
| 2013^^ | | | 24.64 | | | | (0.02 | ) | | | 2.93 | | | | 2.91 | | | | — | | | | — | | | | — | | |
CLASS Y SHARES | | | |
| 2008^ | | | 21.86 | | | | (0.08 | ) | | | (10.59 | ) | | | (10.67 | ) | | | (0.00 | )(h) | | | — | | | | (0.00 | )(h) | |
| 2009^ | | | 11.19 | | | | (0.02 | ) | | | 7.37 | | | | 7.35 | | | | — | | | | — | | | | — | | |
| 2010^ | | | 18.54 | | | | (0.03 | ) | | | 4.36 | | | | 4.33 | | | | — | | | | — | | | | — | | |
2011 | | | 22.87 | | | | (0.10 | ) | | | (0.72 | ) | | | (0.82 | ) | | | — | | | | — | | | | — | | |
2012 | | | 22.05 | | | | (0.01 | ) | | | 3.10 | | | | 3.09 | | | | — | | | | (1.13 | ) | | | (1.13 | ) | |
| 2013^^ | | | 24.01 | | | | (0.05 | ) | | | 2.86 | | | | 2.81 | | | | — | | | | — | | | | — | | |
See Notes to Financial Statements
98
| | | | | | | | | RATIO TO AVERAGE
NET ASSETS(c) | | | | | |
FOR THE YEAR
ENDED
DECEMBER 31 | | NET ASSET
VALUE
END OF
PERIOD | | TOTAL
RETURN(b) | | NET ASSETS
END OF
PERIOD
(000'S) | | EXPENSES | | NET
INVESTMENT
INCOME (LOSS) | | REBATE FROM
MORGAN STANLEY
AFFILIATE | | PORTFOLIO
TURNOVER
RATE | |
GLOBAL INFRASTRUCTURE
CLASS X SHARES | |
| 2008^ | | $ | 19.83 | | | | (33.02 | )% | | $ | 26,297 | | | | 0.84 | %(i) | | | 2.28 | %(i) | | | 0.00 | %(g) | | | 77 | % | |
| 2009^ | | | 22.68 | | | | 18.47 | | | | 24,953 | | | | 1.42 | (i) | | | 2.75 | (i) | | | 0.00 | (g) | | | 279 | | |
| 2010^ | | | 22.45 | | | | 7.13 | | | | 21,843 | | | | 0.93 | (i) | | | 2.66 | (i) | | | 0.00 | (g) | | | 148 | | |
2011 | | | 23.72 | | | | 15.81 | | | | 20,282 | | | | 1.10 | (i) | | | 2.26 | (i) | | | 0.00 | (g) | | | 36 | | |
2012 | | | 24.78 | | | | 18.14 | | | | 19,121 | | | | 1.11 | (i) | | | 2.27 | (i) | | | 0.00 | (g) | | | 28 | | |
| 2013^^ | | | 23.06 | | | | 5.29 | (k) | | | 18,230 | | | | 1.15 | (i)(l) | | | 2.33 | (i)(l) | | | 0.00 | (g)(l) | | | 15 | (k) | |
CLASS Y SHARES | |
| 2008^ | | | 19.78 | | | | (33.19 | ) | | | 10,886 | | | | 1.09 | (i) | | | 2.03 | (i) | | | 0.00 | (g) | | | 77 | | |
| 2009^ | | | 22.63 | | | | 18.18 | | | | 10,332 | | | | 1.67 | (i) | | | 2.50 | (i) | | | 0.00 | (g) | | | 279 | | |
| 2010^ | | | 22.40 | | | | 6.81 | | | | 8,883 | | | | 1.18 | (i) | | | 2.41 | (i) | | | 0.00 | (g) | | | 148 | | |
2011 | | | 23.68 | | | | 15.56 | | | | 7,863 | | | | 1.35 | (i) | | | 2.01 | (i) | | | 0.00 | (g) | | | 36 | | |
2012 | | | 24.73 | | | | 17.79 | | | | 7,635 | | | | 1.36 | (i) | | | 2.02 | (i) | | | 0.00 | (g) | | | 28 | | |
| 2013^^ | | | 23.05 | | | | 5.17 | (k) | | | 7,072 | | | | 1.40 | (i)(l) | | | 2.08 | (i)(l) | | | 0.00 | (g)(l) | | | 15 | (k) | |
GROWTH
CLASS X SHARES | |
| 2008^ | | | 11.35 | | | | (48.70 | ) | | | 8,621 | | | | 0.81 | (i) | | | (0.21 | )(i) | | | 0.00 | (g) | | | 42 | | |
| 2009^ | | | 18.86 | | | | 66.17 | | | | 11,748 | | | | 0.91 | (i) | | | 0.11 | (i) | | | 0.00 | (g) | | | 19 | | |
| 2010^ | | | 23.33 | | | | 23.70 | | | | 11,710 | | | | 0.89 | (i) | | | 0.11 | (i) | | | 0.00 | (g) | | | 33 | | |
2011 | | | 22.54 | | | | (3.39 | ) | | | 9,439 | | | | 0.94 | (i) | | | (0.19 | )(i) | | | 0.00 | (g) | | | 29 | | |
2012 | | | 24.64 | | | | 14.50 | | | | 8,794 | | | | 1.08 | (i) | | | 0.19 | (i) | | | 0.00 | (g) | | | 47 | | |
| 2013^^ | | | 27.55 | | | | 11.81 | (k) | | | 8,918 | | | | 1.29 | (i)(l) | | | (0.16 | )(i)(l) | | | 0.00 | (g)(l) | | | 19 | (k) | |
CLASS Y SHARES | |
| 2008^ | | | 11.19 | | | | (48.81 | ) | | | 12,953 | | | | 1.06 | (i) | | | (0.46 | )(i) | | | 0.00 | (g) | | | 42 | | |
| 2009^ | | | 18.54 | | | | 65.68 | | | | 17,864 | | | | 1.16 | (i) | | | (0.14 | )(i) | | | 0.00 | (g) | | | 19 | | |
| 2010^ | | | 22.87 | | | | 23.35 | | | | 17,537 | | | | 1.14 | (i) | | | (0.14 | )(i) | | | 0.00 | (g) | | | 33 | | |
2011 | | | 22.05 | | | | (3.59 | ) | | | 12,715 | | | | 1.19 | (i) | | | (0.44 | )(i) | | | 0.00 | (g) | | | 29 | | |
2012 | | | 24.01 | | | | 14.18 | | | | 11,015 | | | | 1.33 | (i) | | | (0.06 | )(i) | | | 0.00 | (g) | | | 47 | | |
| 2013^^ | | | 26.82 | | | | 11.70 | (k) | | | 10,515 | | | | 1.54 | (i)(l) | | | (0.41 | )(i)(l) | | | 0.00 | (g)(l) | | | 19 | (k) | |
99
Morgan Stanley Select Dimensions Investment Series
Financial Highlights continued
| | | | | | | | | | | | | | | | |
FOR THE YEAR
ENDED
DECEMBER 31 | | NET ASSET
VALUE
BEGINNING
OF PERIOD | | NET
INVESTMENT
INCOME
(LOSS)(a) | | NET REALIZED
AND
UNREALIZED
GAIN (LOSS) | | TOTAL FROM
INVESTMENT
OPERATIONS | | DIVIDENDS
TO
SHAREHOLDERS | | DISTRIBUTIONS
TO
SHAREHOLDERS | | TOTAL
DIVIDENDS
AND
DISTRIBUTIONS | |
FOCUS GROWTH
CLASS X SHARES | | | |
| 2008^ | | $ | 21.18 | | | $ | (0.03 | ) | | $ | (10.83 | ) | | $ | (10.86 | ) | | $ | (0.07 | ) | | | — | | | $ | (0.07 | ) | |
| 2009^ | | | 10.25 | | | | 0.01 | | | | 7.35 | | | | 7.36 | | | | (0.02 | ) | | | — | | | | (0.02 | ) | |
| 2010^ | | | 17.59 | | | | (0.01 | ) | | | 4.83 | | | | 4.82 | | | | (0.01 | ) | | | — | | | | (0.01 | ) | |
2011 | | | 22.40 | | | | (0.01 | ) | | | (1.28 | ) | | | (1.29 | ) | | | — | | | | — | | | | — | | |
2012 | | | 21.11 | | | | 0.09 | | | | 2.86 | | | | 2.95 | | | | — | | | $ | (0.77 | ) | | | (0.77 | ) | |
| 2013^^ | | | 23.29 | | | | 0.03 | | | | 2.83 | | | | 2.86 | | | | — | | | | — | | | | — | | |
CLASS Y SHARES | | | |
| 2008^ | | | 20.97 | | | | (0.08 | ) | | | (10.73 | ) | | | (10.81 | ) | | | (0.01 | ) | | | — | | | | (0.01 | ) | |
| 2009^ | | | 10.15 | | | | (0.02 | ) | | | 7.27 | | | | 7.25 | | | | — | | | | — | | | | — | | |
| 2010^ | | | 17.40 | | | | (0.05 | ) | | | 4.77 | | | | 4.72 | | | | — | | | | — | | | | — | | |
2011 | | | 22.12 | | | | (0.07 | ) | | | (1.26 | ) | | | (1.33 | ) | | | — | | | | — | | | | — | | |
2012 | | | 20.79 | | | | 0.03 | | | | 2.82 | | | | 2.85 | | | | — | | | | (0.77 | ) | | | (0.77 | ) | |
| 2013^^ | | | 22.87 | | | | 0.00 | (j) | | | 2.77 | | | | 2.77 | | | | — | | | | — | | | | — | | |
MULTI CAP GROWTH
CLASS X SHARES | | | |
| 2008^ | | | 15.07 | | | | (0.05 | ) | | | (7.34 | ) | | | (7.39 | ) | | | — | | | | — | | | | — | | |
| 2009^ | | | 7.68 | | | | (0.02 | ) | | | 5.38 | | | | 5.36 | | | | — | | | | — | | | | — | | |
| 2010^ | | | 13.04 | | | | (0.04 | ) | | | 3.56 | | | | 3.52 | | | | — | | | | — | | | | — | | |
2011 | | | 16.56 | | | | (0.09 | ) | | | (1.18 | ) | | | (1.27 | ) | | | — | | | | — | | | | — | | |
2012 | | | 15.29 | | | | (0.05 | ) | | | 1.76 | | | | 1.71 | | | | — | | | | (1.12 | ) | | | (1.12 | ) | |
| 2013^^ | | | 15.88 | | | | (0.09 | ) | | | 1.97 | | | | 1.88 | | | | — | | | | — | | | | — | | |
CLASS Y SHARES | | | |
| 2008^ | | | 14.79 | | | | (0.08 | ) | | | (7.19 | ) | | | (7.27 | ) | | | — | | | | — | | | | — | | |
| 2009^ | | | 7.52 | | | | (0.05 | ) | | | 5.26 | | | | 5.21 | | | | — | | | | — | | | | — | | |
| 2010^ | | | 12.73 | | | | (0.07 | ) | | | 3.47 | | | | 3.40 | | | | — | | | | — | | | | — | | |
2011 | | | 16.13 | | | | (0.13 | ) | | | (1.15 | ) | | | (1.28 | ) | | | — | | | | — | | | | — | | |
2012 | | | 14.85 | | | | (0.09 | ) | | | 1.72 | | | | 1.63 | | | | — | | | | (1.12 | ) | | | (1.12 | ) | |
| 2013^^ | | | 15.36 | | | | (0.11 | ) | | | 1.90 | | | | 1.79 | | | | — | | | | — | | | | — | | |
See Notes to Financial Statements
100
| | | | | | | | | RATIO TO AVERAGE
NET ASSETS(c) | | | | | |
FOR THE YEAR
ENDED
DECEMBER 31 | | NET ASSET
VALUE
END OF
PERIOD | | TOTAL
RETURN(b) | | NET ASSETS
END OF
PERIOD
(000'S) | | EXPENSES | | NET
INVESTMENT
INCOME (LOSS) | | REBATE FROM
MORGAN STANLEY
AFFILIATE | | PORTFOLIO
TURNOVER
RATE | |
FOCUS GROWTH
CLASS X SHARES | |
| 2008^ | | $ | 10.25 | | | | (51.43 | )% | | $ | 48,722 | | | | 0.70 | %(i) | | | (0.19 | )%(i) | | | 0.01 | % | | | 31 | % | |
| 2009^ | | | 17.59 | | | | 71.83 | | | | 67,932 | | | | 0.77 | (i) | | | 0.10 | (i) | | | 0.00 | (g) | | | 11 | | |
| 2010^ | | | 22.40 | | | | 27.41 | | | | 72,166 | | | | 0.75 | (i) | | | (0.04 | )(i) | | | 0.00 | (g) | | | 44 | | |
2011 | | | 21.11 | | | | (5.76 | ) | | | 55,818 | | | | 0.76 | (i) | | | (0.07 | )(i) | | | 0.00 | (g) | | | 32 | | |
2012 | | | 23.29 | | | | 14.10 | | | | 53,181 | | | | 0.80 | (i) | | | 0.39 | (i) | | | 0.00 | (g) | | | 43 | | |
| 2013^^ | | | 26.15 | | | | 12.28 | (k) | | | 53,358 | | | | 0.76 | (i)(l) | | | 0.23 | (i)(l) | | | 0.00 | (g)(l) | | | 21 | (k) | |
CLASS Y SHARES | |
| 2008^ | | | 10.15 | | | | (51.57 | ) | | | 14,206 | | | | 0.95 | (i) | | | (0.44 | )(i) | | | 0.01 | | | | 31 | | |
| 2009^ | | | 17.40 | | | | 71.43 | | | | 22,047 | | | | 1.02 | (i) | | | (0.15 | )(i) | | | 0.00 | (g) | | | 11 | | |
| 2010^ | | | 22.12 | | | | 27.07 | | | | 21,783 | | | | 1.00 | (i) | | | (0.29 | )(i) | | | 0.00 | (g) | | | 44 | | |
2011 | | | 20.79 | | | | (5.97 | ) | | | 16,191 | | | | 1.01 | (i) | | | (0.32 | )(i) | | | 0.00 | (g) | | | 32 | | |
2012 | | | 22.87 | | | | 13.83 | | | | 14,960 | | | | 1.05 | (i) | | | 0.14 | (i) | | | 0.00 | (g) | | | 43 | | |
| 2013^^ | | | 25.64 | | | | 12.11 | (k) | | | 14,452 | | | | 1.01 | (i)(l) | | | (0.02 | )(i)(l) | | | 0.00 | (g)(l) | | | 21 | (k) | |
MULTI CAP GROWTH
CLASS X SHARES | |
| 2008^ | | | 7.68 | | | | (49.04 | ) | | | 6,744 | | | | 1.04 | (i) | | | (0.37 | )(i) | | | 0.00 | (g) | | | 33 | | |
| 2009^ | | | 13.04 | | | | 69.79 | | | | 9,601 | | | | 1.23 | (i) | | | (0.24 | )(i) | | | 0.00 | (g) | | | 23 | | |
| 2010^ | | | 16.56 | | | | 26.99 | | | | 10,230 | | | | 1.08 | (i) | | | (0.31 | )(i) | | | 0.00 | (g) | | | 27 | | |
2011 | | | 15.29 | | | | (7.67 | ) | | | 7,995 | | | | 1.17 | (i) | | | (0.57 | )(i) | | | 0.00 | (g) | | | 27 | | |
2012 | | | 15.88 | | | | 11.31 | | | | 7,389 | | | | 1.38 | (i) | | | (0.32 | )(i) | | | 0.00 | (g) | | | 46 | | |
| 2013^^ | | | 17.76 | | | | 11.90 | (k) | | | 7,415 | | | | 1.75 | (i)(l) | | | (1.11 | )(i)(l) | | | 0.00 | (g)(l) | | | 22 | (k) | |
CLASS Y SHARES | |
| 2008^ | | | 7.52 | | | | (49.15 | ) | | | 8,571 | | | | 1.29 | (i) | | | (0.62 | )(i) | | | 0.00 | (g) | | | 33 | | |
| 2009^ | | | 12.73 | | | | 69.28 | | | | 12,455 | | | | 1.48 | (i) | | | (0.49 | )(i) | | | 0.00 | (g) | | | 23 | | |
| 2010^ | | | 16.13 | | | | 26.71 | | | | 13,058 | | | | 1.33 | (i) | | | (0.56 | )(i) | | | 0.00 | (g) | | | 27 | | |
2011 | | | 14.85 | | | | (7.94 | ) | | | 8,797 | | | | 1.42 | (i) | | | (0.82 | )(i) | | | 0.00 | (g) | | | 27 | | |
2012 | | | 15.36 | | | | 11.11 | | | | 8,486 | | | | 1.63 | (i) | | | (0.57 | )(i) | | | 0.00 | (g) | | | 46 | | |
| 2013^^ | | | 17.15 | | | | 11.72 | (k) | | | 8,294 | | | | 2.00 | (i)(l) | | | (1.36 | )(i)(l) | | | 0.00 | (g)(l) | | | 22 | (k) | |
101
Morgan Stanley Select Dimensions Investment Series
Financial Highlights continued
| | | | | | | | | | | | | | | | |
FOR THE YEAR
ENDED
DECEMBER 31 | | NET ASSET
VALUE
BEGINNING
OF PERIOD | | NET
INVESTMENT
INCOME
(LOSS)(a) | | NET REALIZED
AND
UNREALIZED
GAIN (LOSS) | | TOTAL FROM
INVESTMENT
OPERATIONS | | DIVIDENDS
TO
SHAREHOLDERS | | DISTRIBUTIONS
TO
SHAREHOLDERS | | TOTAL
DIVIDENDS
AND
DISTRIBUTIONS | |
MID CAP GROWTH
CLASS X SHARES | | | |
| 2008^ | | $ | 32.19 | | | $ | (0.05 | ) | | $ | (15.34 | ) | | $ | (15.39 | ) | | $ | (0.19 | ) | | | — | | | $ | (0.19 | ) | |
| 2009^ | | | 16.61 | | | | 0.03 | | | | 10.01 | | | | 10.04 | | | | — | | | | — | | | | — | | |
| 2010^ | | | 26.65 | | | | 0.10 | | | | 8.63 | | | | 8.73 | | | | (0.04 | ) | | | — | | | | (0.04 | ) | |
2011 | | | 35.34 | | | | (0.07 | ) | | | (2.37 | ) | | | (2.44 | ) | | | (0.13 | ) | | | — | | | | (0.13 | ) | |
2012 | | | 32.77 | | | | 0.12 | | | | 2.62 | | | | 2.74 | | | | — | | | $ | (2.61 | ) | | | (2.61 | ) | |
| 2013^^ | | | 32.90 | | | | (0.03 | ) | | | 4.75 | | | | 4.72 | | | | (0.13 | ) | | | (0.10 | ) | | | (0.23 | ) | |
CLASS Y SHARES | | | |
| 2008^ | | | 31.67 | | | | (0.11 | ) | | | (15.10 | ) | | | (15.21 | ) | | | (0.12 | ) | | | — | | | | (0.12 | ) | |
| 2009^ | | | 16.34 | | | | (0.03 | ) | | | 9.84 | | | | 9.81 | | | | — | | | | — | | | | — | | |
| 2010^ | | | 26.15 | | | | 0.03 | | | | 8.46 | | | | 8.49 | | | | — | | | | — | | | | — | | |
2011 | | | 34.64 | | | | (0.16 | ) | | | (2.32 | ) | | | (2.48 | ) | | | (0.05 | ) | | | — | | | | (0.05 | ) | |
2012 | | | 32.11 | | | | 0.03 | | | | 2.57 | | | | 2.60 | | | | — | | | | (2.61 | ) | | | (2.61 | ) | |
| 2013^^ | | | 32.10 | | | | (0.07 | ) | | | 4.63 | | | | 4.56 | | | | (0.02 | ) | | | (0.10 | ) | | | (0.12 | ) | |
^^ For the six months ended June 30, 2013 (unaudited).
^ Beginning with the year ended December 31, 2011, the Fund was audited by Ernst & Young LLP. The previous years were audited by another independent registered public accounting firm.
(a) The per share amounts were computed using an average number of shares outstanding during the period.
(b) Calculated based on the net asset value as of the last business day of the period. Performance shown does not reflect fees and expenses imposed by your insurance company. If performance information included the effect of these charges, the total returns would be lower.
(c) Reflects overall Portfolio ratios for investment income and non-class specific expenses.
(d) Amount is less than $0.001.
(e) Reflects fees paid in connection with the U.S. Treasury's Temporary Guarantee Program for Money Market Funds. This fee had an effect of 0.03% for the year ended 2009.
See Notes to Financial Statements
102
| | | | | | | | | RATIO TO AVERAGE
NET ASSETS(c) | | | | | |
FOR THE YEAR
ENDED
DECEMBER 31 | | NET ASSET
VALUE
END OF
PERIOD | | TOTAL
RETURN(b) | | NET ASSETS
END OF
PERIOD
(000'S) | | EXPENSES | | NET
INVESTMENT
INCOME (LOSS) | | REBATE FROM
MORGAN STANLEY
AFFILIATE | | PORTFOLIO
TURNOVER
RATE | |
MID CAP GROWTH
CLASS X SHARES | |
| 2008^ | | $ | 16.61 | | | | (48.06 | )% | | $ | 16,023 | | | | 0.74 | %(i) | | | (0.19 | )%(i) | | | 0.01 | % | | | 43 | % | |
| 2009^ | | | 26.65 | | | | 60.45 | | | | 21,310 | | | | 0.84 | (i) | | | 0.12 | (i) | | | 0.00 | (g) | | | 36 | | |
| 2010^ | | | 35.34 | | | | 32.79 | | | | 24,319 | | | | 0.79 | (i) | | | 0.36 | (i) | | | 0.00 | (g) | | | 44 | | |
2011 | | | 32.77 | | | | (6.97 | ) | | | 19,186 | | | | 0.81 | (i) | | | (0.19 | )(i) | | | 0.00 | (g) | | | 33 | | |
2012 | | | 32.90 | | | | 8.51 | | | | 17,016 | | | | 1.02 | (i) | | | 0.35 | (i) | | | 0.00 | (g) | | | 31 | | |
| 2013^^ | | | 37.39 | | | | 14.39 | (k) | | | 17,779 | | | | 0.99 | (i)(l) | | | (0.15 | )(i)(l) | | | 0.00 | (g)(l) | | | 25 | (k) | |
CLASS Y SHARES | |
| 2008^ | | | 16.34 | | | | (48.20 | ) | | | 5,469 | | | | 0.99 | (i) | | | (0.44 | )(i) | | | 0.01 | | | | 43 | | |
| 2009^ | | | 26.15 | | | | 60.04 | | | | 8,267 | | | | 1.09 | (i) | | | (0.13 | )(i) | | | 0.00 | (g) | | | 36 | | |
| 2010^ | | | 34.64 | | | | 32.47 | | | | 10,828 | | | | 1.04 | (i) | | | 0.11 | (i) | | | 0.00 | (g) | | | 44 | | |
2011 | | | 32.11 | | | | (7.18 | ) | | | 7,812 | | | | 1.06 | (i) | | | (0.44 | )(i) | | | 0.00 | (g) | | | 33 | | |
2012 | | | 32.10 | | | | 8.24 | | | | 6,425 | | | | 1.27 | (i) | | | 0.10 | (i) | | | 0.00 | (g) | | | 31 | | |
| 2013^^ | | | 36.54 | | | | 14.22 | (k) | | | 6,370 | | | | 1.24 | (i)(l) | | | (0.40 | )(i)(l) | | | 0.00 | (g)(l) | | | 25 | (k) | |
(f) If the Portfolio had borne all of its expenses that were reimbursed or waived by the Distributor, Adviser and Administrator, the annualized expense and net investment loss ratios, would have been as follows:
PERIOD ENDED | | EXPENSE
RATIO | | NET INVESTMENT LOSS
RATIO | |
June 30, 2013 | | | | | | | | | |
Class X | | | 0.70 | % | | | (0.48 | )% | |
Class Y | | | 0.95 | | | | (0.73 | ) | |
December 31, 2012 | | | | | | | | | |
Class X | | | 0.65 | | | | (0.36 | ) | |
Class Y | | | 0.90 | | | | (0.61 | ) | |
December 31, 2011 | | | | | | | | | |
Class X | | | 0.61 | | | | (0.37 | ) | |
Class Y | | | 0.86 | | | | (0.62 | ) | |
December 31, 2010 | | | | | | | | | |
Class X | | | 0.59 | | | | (0.29 | ) | |
Class Y | | | 0.84 | | | | (0.54 | ) | |
December 31, 2009 | | | | | | | | | |
Class X | | | 0.59 | | | | (0.17 | ) | |
Class Y | | | 0.84 | | | | (0.42 | ) | |
(g) Amount is less than 0.005%.
(h) Includes dividends of less than $0.001.
(i) The ratios reflect the rebate of certain Portfolio expenses in connection with investments in a Morgan Stanley affiliate during the period. The effect of the rebate on the ratios is disclosed in the above table as "Rebate from Morgan Stanley affiliate."
(j) Amount is less than $0.005.
(k) Not annualized.
(l) Annualized.
103
Morgan Stanley Select Dimensions Investment Series
Results of Special Shareholder Meeting (unaudited)
On May 31, 2013, a Special Meeting of Shareholders of Global Infrastructure Portfolio (the "Portfolio") was held in order to approve changing the Portfolio's fundamental investment restriction regarding industry concentration. The voting results were as follows:
| | | Number of Shares | |
| | | For | | Against | | Abstain | |
| | | | | | 900,096 | | | | 35,810 | | | | 95,164 | | |
104
Trustees | |
| | | | | Frank L. Bowman | | Joseph J. Kearns | |
| | | | | Michael Bozic | | Michael F. Klein | |
| | | | | Kathleen A. Dennis | | Michael E. Nugent | |
| | | | | James F. Higgins | | W. Allen Reed | |
| | | | | Dr. Manuel H. Johnson | | Fergus Reid | |
Officers | |
Michael E. Nugent
Chairperson of the Board | |
Arthur Lev
President and Principal Executive Officer | |
Mary Ann Picciotto
Chief Compliance Officer | |
Stefanie V. Chang Yu
Vice President | |
Francis J. Smith
Treasurer and Principal Financial Officer | |
Mary E. Mullin
Secretary | |
| | | Transfer Agent | | Custodian | |
| | | | | Boston Financial Data Services, Inc.
2000 Crown Colony Drive
Quincy, Massachusetts 02169 | | State Street Bank and Trust Company
One Lincoln Street
Boston, Massachusetts 02111 | |
| �� | | Independent Registered Public Accounting Firm | | Legal Counsel | |
| | | | | Ernst & Young LLP
200 Clarendon Street
Boston, Massachusetts 02116 | | Dechert LLP
1095 Avenue of the Americas
New York, New York 10036 | |
| | | Counsel to the Independent Trustees | | Adviser | |
| | | | | Kramer Levin Naftalis & Frankel LLP
1177 Avenue of the Americas
New York, New York 10036 | | Morgan Stanley Investment Management Inc.
522 Fifth Avenue
New York, New York 10036 | |
| | | Sub-Advisers | |
| | | | |
| | | Morgan Stanley Investment Management Limited
25 Cabot Square, Canary Wharf
London, E14 4QA England | |
| | | Morgan Stanley Investment Management Company
23 Church Street
16-01 Capital Square 049481 Singapore | |
This report is submitted for the general information of shareholders of the Fund. For more detailed information about the Fund, its fees and expenses and other pertinent information, please read its Prospectus. The Fund's Statement of Additional Information contains additional information about the Fund, including its trustees. It is available without charge, by calling (800) 869-NEWS.
This report is not authorized for distribution to prospective investors in the Fund unless preceded or accompanied by an effective Prospectus. Read the Prospectus carefully before investing.
Morgan Stanley Distribution, Inc., member FINRA.
#40474
SELDIMSAN
704334 EXP [08/31/14]

October 4, 2013
Supplement
SUPPLEMENT DATED OCTOBER 4, 2013 TO THE PROSPECTUSES OF
MORGAN STANLEY VARIABLE INVESTMENT SERIES
THE GLOBAL INFRASTRUCTURE PORTFOLIO
CLASS X and CLASS Y
Dated April 30, 2013
The Board of Trustees (the "Board") of Morgan Stanley Variable Investment Series (the "Fund") approved an Agreement and Plan of Reorganization by and between the Fund, on behalf of its series Global Infrastructure Portfolio (the "Portfolio") and The Universal Institutional Funds, Inc., on behalf of its newly created series Global Infrastructure Portfolio ("UIF Global Infrastructure"), pursuant to which substantially all of the assets and liabilities of the Portfolio would be transferred to UIF Global Infrastructure and shareholders of the Portfolio would become shareholders of UIF Global Infrastructure, receiving shares of UIF Global Infrastructure equal to the value of their holdings in the Portfolio (the "Reorganization"). Each shareholder of the Portfolio would receive the Class of shares of UIF Global Infrastructure that corresponds to the Class of shares of the Portfolio currently held by that shareholder. The Reorganization is subject to the approval of shareholders of the Portfolio at a special meeting of shareholders scheduled to be held during the first quarter of 2014. A proxy statement formally detailing the proposal, the reasons for the Reorganization and information concerning UIF Global Infrastructure is expected to be distributed to shareholders of the Portfolio during the first quarter of 2014.
PLEASE RETAIN THIS SUPPLEMENT FOR FUTURE REFERENCE.

SUPPLEMENT DATED MAY 31, 2013 TO THE PROSPECTUSES OF
MORGAN STANLEY VARIABLE INVESTMENT SERIES
THE GLOBAL INFRASTRUCTURE PORTFOLIO
CLASS X and CLASS Y
Dated April 30, 2013
The first and second paragraphs under the section of the Prospectus entitled "Portfolio Summary—Principal Investment Strategies" are hereby deleted and replaced with the following:
The Portfolio will normally invest at least 80% of its assets in equity securities issued by companies located throughout the world that are engaged in the infrastructure business. A company will be considered to be in the infrastructure business if it derives at least 50% of its revenues or earnings from, or devotes at least 50% of its assets to, infrastructure-related activities. Infrastructure refers to the systems and networks of energy, transportation, communication and other services required for the normal function of society. Companies in the infrastructure business may be involved in a variety of areas, including, but not limited to, (i) the transmission, distribution, storage or transportation of electricity, oil and gas (and other bulk liquid products), water, and other natural resources used to produce energy, (ii) the construction and operation of renewable power facilities, (iii) the development, ownership, lease, concession, or management of highways, toll roads, tunnels, bridges, pipelines, airports, marine ports, refueling and related facilities, (iv) the provision of communications, including the development, lease, concession, or management of telephone, broadcast and mobile towers, fiber optic/copper cable, and satellite networks, (v) waste-water management and water purification/desalination and (vi) the construction or operation of essential public structures. The Portfolio's equity investments may include convertible securities. The Portfolio's investments may include securities of small and medium capitalization companies. The Portfolio may invest up to 100% of its net assets in foreign securities, which may include emerging market securities. Under normal market conditions, the Portfolio invests at least 40% of its assets in the securities of issuers located outside of the United States.
The Portfolio's "Adviser," Morgan Stanley Investment Management Inc., and/or "Sub-Advisers," Morgan Stanley Investment Management Limited and Morgan Stanley Investment Management Company, will shift the Portfolio's assets between the different types of companies in the infrastructure business described above based on relative valuation, underlying company fundamentals, and demographic and macroeconomic considerations. The Portfolio has a fundamental policy (i.e., one that cannot be changed without shareholder approval) of investing 25% or more of its assets in the infrastructure industry.
***
The section of the Prospectus entitled "Portfolio Summary—Principal Risks—Infrastructure-Related Companies" is hereby deleted and replaced with the following:
• Infrastructure Industry. By concentrating its investments in the infrastructure industry, the Portfolio has greater exposure to the potential adverse economic, regulatory, political and other changes affecting companies operating within such industry. Companies within the infrastructure industry are subject to a variety of factors that may adversely affect their business or operations, including high interest costs in connection with capital construction and improvement programs, high leverage, costs associated with compliance with and changes in environmental and other regulations, difficulty in raising capital in adequate amounts and on reasonable terms in periods of high inflation and unsettled capital markets or government budgetary constraints that impact publicly funded projects, the effects of economic slowdown or recession and surplus capacity, increased competition from other providers of services, uncertainties concerning the availability of fuel at reasonable prices, the effects of energy conservation policies and other factors.
Other factors that may affect the operations of companies within the infrastructure industry include innovations in technology that could render the way in which a company delivers a product or service obsolete, significant changes to the number of ultimate end-users of a company's products, inexperience with and potential losses resulting from a developing deregulatory environment, increased susceptibility to terrorist attacks, risks of environmental damage due to a company's operations or an accident, and general changes in market sentiment towards infrastructure and utilities assets. Companies operating in the infrastructure industry face operating risks, including the risk of fire, explosions, leaks, mining and drilling accidents or other catastrophic events. In addition, natural risks, such as earthquakes, floods, lightning, hurricanes, tsunamis and wind, are inherent risks in infrastructure company operations.
***
The section of the Prospectus entitled "Portfolio Summary—Principal Risks—Utilities Industry" is hereby deleted in its entirety.
***
The first and second paragraphs under the section of the Prospectus entitled "Portfolio Details—Additional Information about the Portfolio's Investment Objective, Strategies and Risks—Principal Investment Strategies" are hereby deleted and replaced with the following:
The Portfolio will normally invest at least 80% of its assets in equity securities issued by companies located throughout the world that are engaged in the infrastructure business. A company will be considered to be in the infrastructure business if it derives at least 50% of its revenues or earnings from, or devotes at least 50% of its assets to, infrastructure-related activities. Infrastructure refers to the systems and networks of energy, transportation, communication and other services required for the normal function of society. Companies in the infrastructure business may be involved in a variety of areas, including, but not limited to, (i) the transmission, distribution, storage or transportation of electricity, oil and gas (and other bulk liquid products), water, and other natural resources used to produce energy, (ii) the construction and operation of renewable power facilities, (iii) the development, ownership, lease, concession, or management of highways, toll roads, tunnels, bridges, pipelines, airports, marine ports, refueling and related facilities, (iv) the provision of communications, including the development, lease, concession, or management of telephone, broadcast and mobile towers, fiber optic/copper cable, and satellite networks, (v) waste-water management and water purification/desalination and (vi) the construction or operation of essential public structures. The Portfolio's equity investments may include convertible securities. The Portfolio's investments may include securities of small and medium capitalization companies. The Portfolio may invest up to 100% of its net assets in foreign securities, which may include emerging market securities. Under normal market conditions, the Portfolio invests at least 40% of its assets in the securities of issuers located outside of the United States.
The Adviser and/or Sub-Advisers shift the Portfolio's assets between the different types of companies in the infrastructure business described above based on relative valuation, underlying company fundamentals, and demographic and macroeconomic considerations. The Portfolio has a fundamental policy (i.e., one that cannot be changed without shareholder approval) of investing 25% or more of its assets in the infrastructure industry.
***
The second sentence under the section of the Prospectus entitled "Portfolio Details—Additional Information about the Portfolio's Investment Objective, Strategies and Risks—Additional Investment Strategy Information—Asset-Backed Securities" is hereby deleted and replaced with the following:
Asset-backed securities represent an interest in a pool of assets such as a pool of power generation assets or other infrastructure assets or infrastructure-related assets, that have been securitized in pass-through structures.
***
The last sentence of the last paragraph under the section of the Prospectus entitled "Portfolio Details—Additional Information about the Portfolio's Investment Objective, Strategies and Risks—Additional Investment Strategy Information" is hereby deleted and replaced with the following:
Except for the Portfolio's policy to concentrate its assets in the infrastructure industry, the Portfolio may change its principal investment strategies without shareholder approval; however, you would be notified of any changes.
***
The section of the Prospectus entitled "Portfolio Details—Additional Information about the Portfolio's Investment Objective, Strategies and Risks—Principal Risks—Infrastructure-Related Companies" is hereby deleted and replaced with the following:
Infrastructure Industry. By concentrating its investments in the infrastructure industry, the Portfolio has greater exposure to the potential adverse economic, regulatory, political and other changes affecting companies operating within such industry. Companies within the infrastructure industry are subject to a variety of factors that may adversely affect their business or operations, including high interest costs in connection with capital construction and improvement programs, high leverage, costs associated with compliance with and changes in environmental and other regulations, difficulty in raising capital in adequate amounts and on reasonable terms in periods of high inflation and unsettled capital markets or government budgetary constraints that impact publicly funded projects, the effects of economic slowdown or recession and surplus capacity, increased competition from other providers of services, uncertainties concerning the availability of fuel at reasonable prices, the effects of energy conservation policies and other factors. Additionally, companies within the infrastructure industry may be subject to regulation by various government authorities and may also be affected by government regulation of rates charged to customers, service interruption or legal challenges due to environmental, operational or other mishaps and the imposition of special tariffs and changes in tax laws, regulatory policies and accounting standards; technological innovations that may render existing plants, equipment or products obsolete, unforeseen delays, accidents, and cost overruns in infrastructure projects. Any market price movements, regulatory or technological changes, or economic conditions affecting infrastructure-related companies may have a significant impact on the Portfolio's performance. Other factors that may affect the operations of companies within the infrastructure industry include innovations in technology that could render the way in which a company delivers a product or service obsolete, significant changes to the number of ultimate end-users of a company's products, inexperience with and potential losses resulting from a developing deregulatory environment, increased susceptibility to terrorist attacks, risks of environmental damage due to a company's operations or an accident, and general changes in market sentiment towards infrastructure and utilities assets.
Companies operating in the infrastructure industry face operating risks, including the risk of fire, explosions, leaks, mining and drilling accidents or other catastrophic events. If any of these operating risks occur, it could cause substantial losses to the given infrastructure company. In addition, natural risks, such as earthquakes, floods, lightning, hurricanes, tsunamis and wind, are inherent risks in infrastructure company operations. For example, extreme weather patterns, such as Hurricane Ivan in 2004 and Hurricanes Katrina and Rita in 2005, the Tohuku earthquake and resulting tsunami in Japan in 2011, could result in substantial damage to the facilities of certain companies located in the affected areas and such extreme weather patterns, or the threat thereof, could adversely impact the prices of the securities in which the Portfolio invests. This volatility may create fluctuations in commodity prices and earnings of companies in the infrastructure industry.
***
The section of the Prospectus entitled "Portfolio Details—Additional Information about the Portfolio's Investment Objective, Strategies and Risks—Principal Risks—Utilities Industry" is hereby deleted in its entirety.
PLEASE RETAIN THIS SUPPLEMENT FOR FUTURE REFERENCE
PROSPECTUS n APRIL 30, 2013

VARIABLE INVESTMENT SERIES
THE GLOBAL INFRASTRUCTURE PORTFOLIO
Class X
Morgan Stanley Variable Investment Series is a mutual fund comprised of six separate portfolios, each with its own distinct investment objective(s) and policies. In this Prospectus, shares of the Global Infrastructure Portfolio (the "Portfolio") are being offered.
Shares of the Portfolio are sold exclusively to certain life insurance companies in connection with particular variable life insurance and/or variable annuity contracts they issue. The insurance companies invest in shares of the Portfolio in accordance with instructions received from owners of variable life insurance or variable annuity contracts.
This Prospectus must be accompanied by a current prospectus for the variable life insurance and/or variable annuity contract issued by your insurance company.
The Securities and Exchange Commission ("SEC") has not approved or disapproved these securities or passed upon
the adequacy of this Prospectus. Any representation to the contrary is a criminal offense.
Contents
Portfolio Summary | | INVESTMENT OBJECTIVE | | | 1 | | |
| | | FEES AND EXPENSES OF THE PORTFOLIO | | | 1 | | |
| | | PORTFOLIO TURNOVER | | | 1 | | |
| | | PRINCIPAL INVESTMENT STRATEGIES | | | 1 | | |
| | | PRINCIPAL RISKS | | | 2 | | |
| | | PAST PERFORMANCE | | | 2 | | |
| | FUND MANAGEMENT | | | 3 | | |
| | | PURCHASE AND SALE OF PORTFOLIO SHARES | | | 3 | | |
| | | TAX INFORMATION | | | 3 | | |
| | | PAYMENTS TO INSURANCE COMPANIES AND OTHER FINANCIAL INTERMEDIARIES | | | 3 | | |
Portfolio Details | | ADDITIONAL INFORMATION ABOUT THE PORTFOLIO'S INVESTMENT OBJECTIVE,
STRATEGIES AND RISKS | | | 4 | | |
| | FUND MANAGEMENT | | | 9 | | |
Shareholder Information | | PURCHASES AND SALES OF PORTFOLIO SHARES | | | 11 | | |
| | | FREQUENT PURCHASES AND REDEMPTIONS OF SHARES | | | 11 | | |
| | | PRICING PORTFOLIO SHARES | | | 12 | | |
| | | DISTRIBUTIONS | | | 12 | | |
| | | TAX CONSEQUENCES | | | 13 | | |
| | | PORTFOLIO HOLDINGS INFORMATION | | | 13 | | |
| | | ADDITIONAL INFORMATION | | | 13 | | |
Financial Highlights | | | | | 14 | | |
This Prospectus contains important information about the Global Infrastructure Portfolio and the Morgan Stanley Variable Investment Series. Please read it carefully and keep it for future reference.
Investment Objective
The Portfolio seeks both capital appreciation and current income.
Fees and Expenses of the Portfolio
The table below describes the fees and expenses that you may pay if you buy and hold Class X shares of the Portfolio. Total Annual Portfolio Operating Expenses in the table and the Example below do not reflect the impact of any charges by your insurance company. If they did, expenses would be higher.
Annual Portfolio Operating Expenses
(expenses that you pay each year as a percentage of the value of your investment)
Advisory Fee | | | 0.57 | % | |
Distribution and/or Shareholder Service (12b-1) Fee | | | None | | |
Other Expenses | | | 0.30 | % | |
Total Annual Portfolio Operating Expenses | | | 0.87 | % | |
Example
The example below is intended to help you compare the cost of investing in the Portfolio with the cost of investing in other mutual funds.
The example assumes that you invest $10,000 in the Portfolio, your investment has a 5% return each year, and the Portfolio's operating expenses remain the same. Although your actual costs may be higher or lower, based on these assumptions your costs would be:
| | | Expenses Over Time | |
| | | 1 Year | | 3 Years | | 5 Years | | 10 Years | |
| | | | | $ | 89 | | | $ | 278 | | | $ | 482 | | | $ | 1,073 | | |
Portfolio Turnover
The Portfolio pays transaction costs, such as commissions, when it buys and sells securities (or "turns over" its portfolio). A higher portfolio turnover rate may indicate higher transaction costs. These costs, which are not reflected in Total Annual Portfolio Operating Expenses or in the Example, affect the Portfolio's performance. During the most recent fiscal year, the Portfolio's portfolio turnover rate was 28% of the average value of its portfolio.
Principal Investment Strategies
The Portfolio will normally invest at least 80% of its assets in equity securities issued by companies located throughout the world that are engaged in the infrastructure business. A company will be considered to be in the infrastructure business if it derives at least 50% of its revenues or earnings from, or devotes at least 50% of its assets to, infrastructure-related activities. Infrastructure refers to the systems and networks of energy, transportation, communication and other services required for the normal function of society. The Portfolio may invest up to 100% of its net assets in foreign securities, which may include emerging market securities. Under normal market conditions, the Portfolio invests at least 40% of its assets in the securities of issuers located outside of the United States. The Portfolio's equity investments may include convertible securities.
The Portfolio's "Adviser," Morgan Stanley Investment Management Inc., and/or "Sub-Advisers," Morgan Stanley Investment Management Limited and Morgan Stanley Investment Management Company, will shift the Portfolio's assets between the different types of companies in the infrastructure business described above based on relative valuation, underlying company fundamentals, and demographic and macroeconomic considerations. Utility companies represent a significant component of the universe of companies engaged in the infrastructure business. These companies may include traditionally regulated public utilities or fully or partially deregulated utility companies as well as unregulated utility companies. The Portfolio has a fundamental policy (i.e., one that cannot be changed without shareholder approval) of investing 25% or more of its assets in the utilities industry.
In selecting securities to buy, hold or sell for the Portfolio, the Adviser and/or Sub-Advisers actively manage the portfolio using a combination of bottom-up and top-down methodologies. The value-driven approach to bottom-up security selection utilizes proprietary research models to identify infrastructure companies that offer the best value relative to their underlying assets and growth prospects. The top-down allocation provides diversified exposure to major economic infrastructure sectors and countries, with an overweighting to those sectors/countries that offer the best relative valuation.
VIS — The Global Infrastructure Portfolio
1
Principal Risks
There is no assurance that the Portfolio will achieve its investment objective and you can lose money investing in this Portfolio. The principal risks of investing in the Portfolio include:
• Infrastructure-Related Companies. Because the Portfolio concentrates its investments in infrastructure-related companies, the Portfolio has greater exposure to the potential adverse economic, regulatory, political and other changes affecting such entities. Infrastructure-related companies are subject to a variety of factors that may adversely affect their business or operations including high interest costs in connection with capital construction programs, costs associated with compliance with and changes in environmental and other regulations, difficulty in raising capital in adequate amounts on reasonable terms in periods of high inflation and unsettled capital markets, the effects of surplus capacity, increased competition from other providers of services in a developing deregulatory environment, uncertainties concerning the availability of fuel at reasonable prices, the effects of energy conservation policies and other factors.
Other factors that may affect the operations of infrastructure-related companies include innovations in technology, significant changes to the number of ultimate end-users of a company's products, increased susceptibility to terrorist acts or political actions, risks of environmental damage due to a company's operations or an accident, and general changes in market sentiment towards infrastructure and utilities assets.
• Utilities Industry. Changing regulation constitutes one of the key industry-specific risks for the Portfolio. State and other regulators often monitor and control utility revenues and costs. Regulatory authorities also may restrict a company's access to new markets. The deregulation of certain utilities companies may subject these companies to greater risks of loss. Individual sectors of the utility market are subject to additional risks. These risks apply to all utility companies—regulated, fully or partially deregulated, and unregulated.
Certain utilities companies may incur unexpected increases in fuel and other operating costs. They are adversely affected when long-term interest rates rise. Long-term borrowings are used to finance most utility investments, and rising interest rates lead to higher financing costs and reduced earnings. There are also considerable costs associated with environmental compliance, nuclear waste clean-up and safety regulation. Increasingly, regulators are calling upon electric utilities to bear these added costs, and there is a risk that these costs will not be fully recovered through an increase in revenues.
• Common Stock and Other Equity Securities. In general, common stock and other equity security values fluctuate, and sometimes widely fluctuate, in response to activities specific to the issuer of the security as well as factors unrelated to the fundamental condition of the issuer, including general market, economic and political conditions. To the extent that the Portfolio invests in convertible securities, and the convertible security's investment value is greater than its conversion value,
its price will be likely to increase when interest rates fall and decrease when interest rates rise. If the conversion value exceeds the investment value, the price of the convertible security will tend to fluctuate directly with the price of the underlying equity security. The Portfolio's emphasis on industries may cause its performance to be more sensitive to developments affecting particular industries than a fund that places primary emphasis on individual companies.
• Small and Medium Capitalization Companies. Investments in small and medium capitalization companies may involve greater risks than investments in larger, more established companies. The securities issued by small and medium capitalization companies may be less liquid, and such companies may have more limited markets, financial resources and product lines, and may lack the depth of management of larger companies.
• Foreign and Emerging Market Securities. Investments in foreign markets entail special risks such as currency, political, economic and market risks. There also may be greater market volatility, less reliable financial information, higher transaction and custody costs, decreased market liquidity and less government and exchange regulation associated with investments in foreign markets. In addition, investments in certain foreign markets, which have historically been considered stable, may become more volatile and subject to increased risk due to ongoing developments and changing conditions in such markets. Moreover, the growing interconnectivity of global economies and financial markets has increased the probability that adverse developments and conditions in one country or region will affect the stability of economies and financial markets in other countries or regions. The risks of investing in emerging market countries are greater than risks associated with investments in foreign developed countries.
Shares of the Portfolio are not bank deposits and are not guaranteed or insured by the Federal Deposit Insurance Corporation or any other government agency.
Past Performance
The bar chart and table below provide some indication of the risks of investing in the Portfolio by showing changes in the performance of the Portfolio's Class X shares from year-to-year and by showing how the average annual returns of the Portfolio's Class X shares for the one, five and 10 year periods compare with those of a broad measure of market performance, as well as a comparative sector index, over time. This performance information does not include the impact of any charges deducted by your insurance company. If it did, returns would be lower. The Portfolio's past performance does not indicate how the Portfolio will perform in the future.
VIS — The Global Infrastructure Portfolio
2
Annual Total Returns—Calendar Years
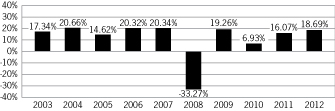
High Quarter | | 6/30/09: | | | 21.03 | % | |
Low Quarter | | 9/30/08: | | | –18.12 | % | |
Average Annual Total Returns For Periods Ended December 31, 2012
| | | Past
1 Year | | Past
5 Years | | Past
10 Years | |
Global Infrastructure Portfolio | | | 18.69 | % | | | 3.23 | % | | | 10.66 | % | |
Dow Jones Brookfield Global
Infrastructure IndexSM (reflects no
deduction for fees, expenses,
or taxes)1 | | | 16.01 | % | | | 4.86 | % | | | 14.38 | % | |
S&P Global BMI Index (reflects no
deduction for fees, expenses,
or taxes)2 | | | 17.15 | % | | | –0.26 | % | | | 9.31 | % | |
(1) The Dow Jones Brookfield Global Infrastructure IndexSM is a float-adjusted market capitalization weighted index that measures the stock performance of companies that exhibit strong infrastructure characteristics. The Index intends to measure all sectors of the infrastructure market. The Index was first published in July 2008; however, back-tested hypothetical performance information is available for this Index since December 31, 2002. Returns are calculated using the return data of the S&P Global BMI Index through December 31, 2002 and the return data of the Dow Jones Brookfield Global Infrastructure Index for periods thereafter. It is not possible to invest directly in an index.
(2) The Standard & Poor's Global BMI Index (S&P Global BMI Index) is a broad market index designed to capture exposure to equities in all countries in the world that meet minimum size and liquidity requirements. As of the date of this Prospectus, there are approximately 11,000 index members representing 26 developed and 20 emerging market countries. It is not possible to invest directly in an index.
Fund Management
Adviser. Morgan Stanley Investment Management Inc.
Sub-Advisers. Morgan Stanley Investment Management Limited and Morgan Stanley Investment Management Company.
Portfolio Managers. The Portfolio is managed by members of the Global Infrastructure Securities team. Information about the members jointly and primarily responsible for the day-to-day management of the Portfolio is shown below:
Name | | Title with Adviser | | Date Began
Managing Portfolio | |
Theodore R. Bigman | | Managing Director | | March 2010 | |
Matthew King | | Executive Director | | March 2010 | |
Purchase and Sale of Portfolio Shares
This Prospectus offers Class X shares of the Global Infrastructure Portfolio. The Portfolio also offers Class Y shares of the Portfolio through a separate prospectus. Class Y shares are subject to different expenses. For eligibility information, contact your insurance company.
Portfolio shares will be sold at the next price calculated after we receive the redemption request on your behalf.
The Portfolio offers its shares only to insurance companies' separate accounts that insurance companies establish to fund variable life insurance and/or variable annuity contracts. An insurance company purchases or redeems shares of the Portfolio based on, among other things, the amount of net contract premiums or purchase payments allocated to a separate account investment division, transfers to or from a separate account investment division, contract loans and repayments, contract withdrawals and surrenders, and benefit payments. The contract prospectus describes how contract owners may allocate, transfer and withdraw amounts to, and from, separate accounts.
For more information, please refer to the "Shareholder Information—Purchases and Sales of Portfolio Shares" section of this Prospectus.
Tax Information
Special tax rules apply to life insurance companies, variable annuity contracts and variable life insurance contracts. For information on federal income taxation of a life insurance company with respect to its receipt of distributions from the Portfolio and federal income taxation of owners of variable annuity or variable life insurance contracts, see the accompanying contract prospectus.
Payments to Insurance Companies and
Other Financial Intermediaries
If you purchase the Portfolio through an insurance company or other financial intermediary (such as a bank), the Adviser and/or the Portfolio's "Distributor," Morgan Stanley Distribution, Inc., may pay the intermediary for the sale of Portfolio shares and related services. These payments, which may be significant in amount, may create a conflict of interest by influencing the insurance company or other intermediary and your salesperson to recommend one variable annuity contract over another or be a factor in an insurance company's decision to include the Portfolio as an underlying investment option in its variable insurance products. Ask your salesperson or visit your insurance company's or other intermediary's web site for more information.
VIS — The Global Infrastructure Portfolio
3
Portfolio Details
ADDITIONAL INFORMATION ABOUT THE PORTFOLIO'S INVESTMENT OBJECTIVE, STRATEGIES AND RISKS
INVESTMENT OBJECTIVE
The Portfolio seeks both capital appreciation and current income.
PRINCIPAL INVESTMENT STRATEGIES
GROWTH & INCOME
An investment objective having the goal of selecting securities with the potential to rise in price and pay out income.
The Portfolio will normally invest at least 80% of its assets in equity securities issued by companies located throughout the world that are engaged in the infrastructure business. A company will be considered to be in the infrastructure business if it derives at least 50% of its revenues or earnings from, or devotes at least 50% of its assets to, infrastructure-related activities. Infrastructure refers to the systems and networks of energy, transportation, communication and other services required for the normal function of society. Companies in the infrastructure business may be involved in, among other areas, the transmission and distribution of electric energy; the storage, transportation and distribution of natural resources, such as natural gas, used to produce energy; the building, operation and maintenance of highways, toll roads, tunnels, bridges and parking lots; the building, operation and maintenance of airports and ports, railroads and mass transit systems; telecommunications; water treatment and distribution; and other emerging infrastructure sectors. The Portfolio's investments may include securities of small and medium capitalization companies. The Portfolio may invest up to 100% of its net assets in foreign securities, which may include emerging market securities. Under normal market conditions, the Portfolio invests at least 40% of its assets in the securities of issuers located outside of the United States. The Portfolio's equity investments may include convertible securities.
The Adviser and/or Sub-Advisers will shift the Portfolio's assets between the different types of companies in the infrastructure business described above based on relative valuation, underlying company fundamentals, and demographic and macroeconomic considerations. Utility companies represent a significant component of the universe of companies engaged in the infrastructure business. These companies may include traditionally regulated public utilities or fully or partially deregulated utility companies as well as unregulated utility companies. The Portfolio has a fundamental policy (i.e., one that cannot be changed without shareholder approval) of investing 25% or more of its assets in the utilities industry. Utilities companies are involved in, among other areas, gas and electric energy, water distribution, telecommunications, and other new or emerging technologies.
In selecting securities to buy, hold or sell for the Portfolio, the Adviser and/or Sub-Advisers actively manage the Portfolio using a combination of bottom-up and top-down methodologies. The value-driven approach to bottom-up security selection utilizes proprietary research models to identify infrastructure companies that offer the best value relative to their underlying assets and growth prospects. The top-down allocation provides diversified exposure to major economic infrastructure sectors and countries, with an overweighting to those sectors/countries that offer the best relative valuation. The Adviser and/or Sub-Advisers generally consider selling a portfolio holding when it determines that the holding is less attractive based on a number of factors, including changes in the holding's share price, earnings prospects relative to its peers and/or business prospects.
VIS — The Global Infrastructure Portfolio
4
Common stock is a share ownership or equity interest in a corporation. It may or may not pay dividends, as some companies reinvest all of their profits back into their businesses, while others pay out some of their profits to shareholders as dividends. A depositary receipt is generally issued by a bank or financial institution and represents an ownership interest in the common stock or other equity securities of a foreign company.
Other Investments. The remaining 20% of the Portfolio's assets may be invested in fixed-income securities, equity securities of companies not engaged in the infrastructure business, U.S. government securities issued, or guaranteed as to principal and interest, by the U.S. Government or its agencies or instrumentalities and asset-backed securities. The Portfolio may invest in real estate investment trusts (commonly known as "REITs") and foreign real estate companies and convertible securities. The Portfolio may invest up to 5% of its assets in fixed-income securities and convertible securities rated below investment grade (commonly known as "junk bonds"). For more information, see the "Additional Investment Strategy Information" section.
In pursuing the Portfolio's investment objective, the Adviser and/or Sub-Advisers have considerable leeway in deciding which investments they buy, hold or sell on a day-to-day basis and which trading strategies they use. For example, the Adviser and/or Sub-Advisers in their discretion may determine to use some permitted trading strategies while not using others.
ADDITIONAL INVESTMENT STRATEGY INFORMATION
This section provides additional information relating to the Portfolio's investment strategies.
Fixed-Income Securities. Fixed-income securities include debt securities such as bonds, notes or commercial paper. The issuer of a debt security borrows money from the investor who buys the security. Most debt securities pay either fixed or adjustable rates of interest at regular intervals until they mature, at which point investors get their principal back. The Portfolio's fixed-income investments may include zero coupon securities, which are purchased at a discount and generally accrue interest, but make no payment, until maturity.
U.S. Government Securities. The U.S. government securities that the Portfolio may purchase include U.S. Treasury bills, notes and bonds, all of which are direct obligations of the U.S. Government. In addition, the Portfolio may purchase securities issued by agencies and instrumentalities of the U.S. Government which are backed by the full faith and credit of the United States. The Portfolio may also purchase securities issued by agencies and instrumentalities which are not backed by the full faith and credit of the United States, but whose issuing agency or instrumentality has the right to borrow, to meet its obligations, from the U.S. Treasury. Further, the Portfolio may purchase securities issued by agencies and instrumentalities which are backed solely by the credit of the issuing agency or instrumentality.
Asset-Backed Securities. The Portfolio may invest in asset-backed securities. Asset-backed securities represent an interest in a pool of assets such as a pool of power generation assets or other utility assets or utility-related assets, that have been securitized in pass-through structures. These types of pass-through securities provide for monthly payments that are a "pass-through" of the monthly interest and principal payments made by the individual borrowers on the pooled receivables.
REITs and Foreign Real Estate Companies. The Portfolio may invest in REITs and foreign real estate companies, which are similar to entities organized and operated as REITs in the United States. REITs and foreign real estate companies pool investors' funds for investments primarily in real estate properties or real estate-related loans. They may also include, among other businesses, real estate developers, brokers and operating companies whose products and services are significantly related to the real estate industry such as building suppliers and mortgage lenders.
Defensive Investing. The Portfolio may take temporary "defensive" positions in attempting to respond to adverse market, economic, political or other conditions. The Portfolio may invest any amount of its assets in cash, cash equivalents or other fixed-income securities in a defensive posture that may be inconsistent with its principal investment strategies when the Adviser and/or the Sub-Advisers believe it advisable to do so. Although taking a defensive posture is designed to protect the Portfolio
VIS — The Global Infrastructure Portfolio
5
from an anticipated market downturn, it could have the effect of reducing the benefit from any upswing in the market. When the Portfolio takes a defensive position, it may not achieve its investment objective.
* * *
The percentage limitations relating to the composition of the Portfolio apply at the time the Portfolio acquires an investment. Subsequent percentage changes that result from market fluctuations generally will not require the Portfolio to sell any portfolio security. However, the Portfolio may be required to reduce its borrowings, in response to fluctuations in the value of such holdings. Except for the Portfolio's policy to concentrate its assets in the utilities industry, the Portfolio may change its principal investment strategies without shareholder approval; however, you would be notified of any changes.
PRINCIPAL RISKS
There is no assurance that the Portfolio will achieve its investment objective. The Portfolio's share price and return will fluctuate with changes in the market value of its portfolio securities. When you sell Portfolio shares, they may be worth less than what you paid for them and, accordingly, you can lose money investing in this Portfolio.
Infrastructure-Related Companies. Because the Portfolio concentrates its investments in infrastructure-related companies, the Portfolio has greater exposure to the potential adverse economic, regulatory, political and other changes affecting such entities. Infrastructure-related companies are subject to a variety of factors that may adversely affect their business or operations including high interest costs in connection with capital construction programs, costs associated with compliance with and changes in environmental and other regulations, difficulty in raising capital in adequate amounts on reasonable terms in periods of high inflation and unsettled capital markets, the effects of surplus capacity, increased competition from other providers of services in a developing deregulatory environment, uncertainties concerning the availability of fuel at reasonable prices, the effects of energy conservation policies and other factors. Additionally, infrastructure-related entities may be subject to regulation by various governmental authorities and may also be affected by governmental regulation of rates charged to customers, government budgetary constraints, service interruption due to environmental, operational or other mishaps and the imposition of special tariffs and changes in tax laws, regulatory policies and accounting standards.
Other factors that may affect the operations of infrastructure-related companies include innovations in technology that could render the way in which a company delivers a product or service obsolete, significant changes to the number of ultimate end-users of a company's products, increased susceptibility to terrorist acts or political actions, risks of environmental damage due to a company's operations or an accident, and general changes in market sentiment towards infrastructure and utilities assets.
Utilities Industry. The Portfolio's investments in the utilities industry are impacted by risks particular to that industry. Changing regulation constitutes one of the key industry-specific risks for the Portfolio. State and other regulators often monitor and control utility revenues and costs, and therefore may limit utility profits and dividends paid to investors. Regulatory authorities also may restrict a company's access to new markets, thereby diminishing the company's long-term prospects. The deregulation of certain utilities companies may subject these companies to greater risks of loss. Individual sectors of the utility market are subject to additional risks. These risks apply to all utility companies—regulated, fully or partially deregulated and unregulated.
Certain utilities companies may incur unexpected increases in fuel and other operating costs. They are adversely affected when long-term interest rates rise. Long-term borrowings are used to finance most utility investments, and rising interest rates lead to higher financing costs and reduced earnings. There are also considerable costs associated with environmental compliance, nuclear waste clean-up and safety regulation. Increasingly, regulators are calling upon electric utilities to bear these added costs, and there is a risk that these costs will not be fully recovered through an increase in revenues.
In the case of the water utility sector, the industry is highly fragmented, and most water supply companies find themselves in mature markets, although upgrading of fresh water and waste water systems is an expanding business.
VIS — The Global Infrastructure Portfolio
6
Common Stock and Other Equity Securities. A principal risk of investing in the Portfolio is associated with its common stock and other equity investments. In general, common stock and other equity security prices can fluctuate, and sometimes widely fluctuate, in response to activities specific to the issuer of the security as well as factors unrelated to the fundamental condition of the issuer, including general market, economic and political conditions.
Investments in convertible securities subject the Portfolio to the risks associated with both fixed-income securities and common stocks. To the extent that a convertible security's investment value is greater than its conversion value, its price will be likely to increase when interest rates fall and decrease when interest rates rise, as with a fixed-income security. If the conversion value exceeds the investment value, the price of the convertible security will tend to fluctuate directly with the price of the underlying equity security. No more than 5% of the Portfolio's assets may be invested in convertible securities rated lower than investment grade (commonly known as "junk bonds").
Small and Medium Capitalization Companies. The Portfolio's investments in small and medium capitalization companies carry more risk than investments in larger companies. While some of the Portfolio's holdings in these companies may be listed on a national securities exchange, such securities are more likely to be traded in the over-the-counter market. The low market liquidity of these securities may have an adverse impact on the Portfolio's ability to sell certain securities at favorable prices and may also make it difficult for the Portfolio to obtain market quotations based on actual trades for purposes of valuing the Portfolio's securities. Investing in lesser-known, small and medium capitalization companies involves greater risk of volatility of the Portfolio's net asset value than is customarily associated with larger, more established companies. Often small and medium capitalization companies and the industries in which they are focused are still evolving and, while this may offer better growth potential than larger, more established companies, it also may make them more sensitive to changing market conditions.
Foreign and Emerging Market Securities. The Portfolio's investments in foreign securities involve risks that are in addition to the risks associated with domestic securities. One additional risk is currency risk. While the price of Portfolio shares is quoted in U.S. dollars, the Portfolio may convert U.S. dollars to a foreign market's local currency to purchase a security in that market. If the value of that local currency falls relative to the U.S. dollar, the U.S. dollar value of the foreign security will decrease. This is true even if the foreign security's local price remains unchanged.
Foreign securities also have risks related to economic and political developments abroad, including expropriations, confiscatory taxation, exchange control regulation, limitations on the use or transfer of Portfolio assets and any effects of foreign social, economic or political instability. Foreign companies, in general, are not subject to the regulatory requirements of U.S. companies and, as such, there may be less publicly available information about these companies. Moreover, foreign accounting, auditing and financial reporting standards generally are different from those applicable to U.S. companies. Finally, in the event of a default of any foreign debt obligations, it may be more difficult for the Fund to obtain or enforce a judgment against the issuers of the securities.
Securities of foreign issuers may be less liquid than comparable securities of U.S. issuers and, as such, their price changes may be more volatile. In addition, the prices of such securities may be susceptible to influence by large traders, due to the limited size of many foreign securities markets. Moreover, investments in certain foreign markets, which have historically been considered stable, may become more volatile and subject to increased risk due to ongoing developments and changing conditions in such markets. Also, the growing interconnectivity of global economies and financial markets has increased the probability that adverse developments and conditions in one country or region will affect the stability of economies and financial markets in other countries or regions. Furthermore, foreign exchanges and broker-dealers are generally subject to less government and exchange scrutiny and regulation than their U.S. counterparts. In addition, differences in clearance and settlement procedures in foreign markets may cause delays in settlement of the Portfolio's trades effected in those markets and could result in losses to the Portfolio due to subsequent declines in the value of the securities subject to the trades.
The foreign securities in which the Portfolio may invest may be issued by issuers located in emerging market or developing countries. Compared to the United States and other developed countries, emerging market or developing countries may have relatively unstable governments, economies based on only a few industries and securities markets that trade a small number of securities. Securities issued by companies located in these countries tend to be especially volatile and may be less liquid than
VIS — The Global Infrastructure Portfolio
7
securities traded in developed countries. In the past, securities in these countries have been characterized by greater potential loss than securities of companies located in developed countries.
Depositary receipts involve many of the same risks as those associated with direct investment in foreign securities. In addition, the underlying issuers of certain depositary receipts, particularly unsponsored or unregistered depositary receipts, are under no obligation to distribute shareholder communications to the holders of such receipts, or to pass through to them any voting rights with respect to the deposited securities.
Other Risks. The performance of the Portfolio also will depend on whether or not the Adviser and/or Sub-Advisers are successful in applying the Portfolio's investment strategies. The Portfolio is also subject to other risks from its permissible investments, including the risks associated with its investments in convertible securities (discussed above), fixed-income securities, including junk bonds, U.S. government securities, asset-backed securities and REITs and foreign real estate companies. For more information about these risks, see the "Additional Risk Information" section.
ADDITIONAL RISK INFORMATION
This section provides additional information relating to the risks of investing in the Portfolio.
Fixed-Income Securities. Fixed-income securities are subject to the risk of the issuer's inability to meet principal and interest payments on its obligations (i.e., credit risk) and are subject to price volatility resulting from, among other things, interest rate sensitivity, market perception of the creditworthiness of the issuer and general market liquidity (i.e., market risk). The Portfolio is not limited as to the maturities of the securities in which it may invest. Securities with longer durations are likely to be more sensitive to changes in interest rates, generally making them more volatile than securities with shorter durations. Zero coupon securities (which are purchased at a discount and generally accrue interest, but make no payments until maturity) are typically subject to greater price fluctuations than comparable securities that pay current interest. The Portfolio may invest up to 5% of its net assets in fixed-income securities rated below investment grade and these investments may have speculative characteristics. Lower rated fixed-income securities have greater volatility because there is less certainty that principal and interest payments will be made as scheduled.
U.S. Government Securities. U.S. government securities are subject to market and interest rate risk, as well as varying degrees of credit risk. Some U.S. government securities are issued or guaranteed by the U.S. Treasury and are supported by the full faith and credit of the United States (but not issued by the U.S. Treasury). These securities may have less credit risk than U.S. government securities not supported by the full faith and credit of the United States. With respect to U.S. government securities that are not backed by the full faith and credit of the United States, there is a risk that the U.S. Government will not provide financial support to such U.S. government agencies, instrumentalities or sponsored entities if it is not obligated to do so by law.
Asset-Backed Securities. Asset-backed securities involve the risk that various federal and state consumer laws and other legal and economic factors may result in the collateral backing the securities being insufficient to support payment on the securities. Asset-backed securities generally decrease in value as a result of interest rate increases, but may benefit less than other fixed-income securities from declining interest rates, principally because of prepayments. Prepayments may increase during a period of declining interest rates, although other factors, such as changes in your usage or alternative power generation, may also influence prepayment rates.
REITs and Foreign Real Estate Companies. REITs and foreign real estate companies generally derive their income from rents on the underlying properties or interest on the underlying loans, and their value is impacted by changes in the value of the underlying property or changes in interest rates affecting the underlying loans owned by the REITs and/or foreign real estate companies. REITs and foreign real estate companies are more susceptible to risks associated with the ownership of real estate and the real estate industry in general. These risks can include fluctuations in the value of underlying properties; defaults by borrowers or tenants; market saturation; changes in general and local economic conditions; decreases in market rates for rents;
VIS — The Global Infrastructure Portfolio
8
increases in competition, property taxes, capital expenditures or operating expenses; and other economic, political or regulatory occurrences affecting the real estate industry. In addition, REITs and foreign real estate companies depend upon specialized management skills, may not be diversified (which may increase the volatility of a REIT's and/or foreign real estate company's value), may have less trading volume and may be subject to more abrupt or erratic price movements than the overall securities market. Foreign real estate companies may be subject to laws, rules and regulations governing those entities and their failure to comply with those laws, rules and regulations could negatively impact the performance of those entities. Operating REITs and foreign real estate companies requires specialized management skills and the Portfolio indirectly bears REIT and foreign real estate company management expenses along with the direct expenses of the Portfolio. REITs are not taxed on income distributed to shareholders provided they comply with several requirements of the Internal Revenue Code of 1986, as amended (the "Code"). REITs are subject to the risk of failing to qualify for tax-free pass-through income under the Code.
FUND MANAGEMENT
MORGAN STANLEY INVESTMENT
MANAGEMENT INC.
The Adviser, together with its affiliated asset management companies, had approximately $338.2 billion in assets under management or supervision as of December 31, 2012.
The Fund has retained the Adviser—Morgan Stanley Investment Management Inc.—to provide investment advisory services. The Adviser is a wholly-owned subsidiary of Morgan Stanley (NYSE: "MS"), a preeminent global financial services firm engaged in securities trading and brokerage activities, as well as providing investment banking, research and analysis, financing and financial advisory services. The Adviser's address is 522 Fifth Avenue, New York, NY 10036.
The Adviser has entered into sub-advisory agreements with the Sub-Advisers—Morgan Stanley Investment Management Limited ("MSIM Limited") and Morgan Stanley Investment Management Company ("MSIM Company"). The Sub-Advisers are wholly owned subsidiaries of Morgan Stanley. The Sub-Advisers provide the Portfolio with investment advisory services subject to the overall supervision of the Adviser and the Fund's Officers and Trustees. The Adviser pays MSIM Limited and MSIM Company on a monthly basis a portion of the net advisory fees the Adviser receives from the Portfolio. MSIM Limited's address is 25 Cabot Square, Canary Wharf, London, E14 4QA, England and MSIM Company's address is 23 Church Street, 16-01 Capital Square, Singapore 049481.
The Portfolio is managed by members of the Global Infrastructure Securities team. Current members of the team jointly and primarily responsible for the day-to-day management of the Portfolio are Theodore R. Bigman and Matthew King.
Mr. Bigman has been associated with the Adviser in an investment management capacity since 1995. Mr. King has been associated with the Adviser in an investment management capacity since 2008 and began managing the Portfolio in March 2010. Prior to 2008, Mr. King worked for Bear Stearns in a variety of roles, including investment banking, capital markets and research during which time he provided research and analytical support for a number of infrastructure-related financings.
As lead portfolio manager, Mr. Bigman, together with co-portfolio manager Mr. King, determine the investment strategy, establishes asset-allocation frameworks and directs the implementation of investment strategy.
The Fund's Statement of Additional Information ("SAI") provides additional information about the portfolio managers' compensation structure, other accounts managed by the portfolio managers and the portfolio managers' ownership of securities in the Portfolio.
VIS — The Global Infrastructure Portfolio
9
The composition of the team may change from time to time.
The Portfolio pays the Adviser a monthly advisory fee as full compensation for the services and facilities furnished to the Portfolio, and for Portfolio expenses assumed by the Adviser. The fee is based on the Portfolio's average daily net assets. For the fiscal year ended December 31, 2012, the Portfolio paid total investment advisory compensation (net of affiliated rebates, if applicable) amounting to 0.57% of the Portfolio's average daily net assets.
A discussion regarding the Board of Trustees' approval of the investment advisory agreement and the sub-advisory agreements are available in the Fund's semiannual report to shareholders for the period ended June 30, 2012.
VIS — The Global Infrastructure Portfolio
10
Shareholder Information
PURCHASES AND SALES OF PORTFOLIO SHARES
Shares are offered on each day that the New York Stock Exchange ("NYSE") is open for business. The Portfolio offers its shares only to insurance company separate accounts that insurance companies establish to fund variable life insurance and/or variable annuity contracts. An insurance company purchases or redeems shares of the Portfolio based on, among other things, the amount of net contract premiums or purchase payments allocated to a separate account investment division, transfers to or from a separate account investment division, contract loans and repayments, contract withdrawals and surrenders, and benefit payments. The contract prospectus describes how contract owners may allocate, transfer and withdraw amounts to and from separate accounts.
The Portfolio currently does not foresee any disadvantages to variable product contract owners arising out of the fact that the Portfolio offers its shares to separate accounts of various insurance companies that offer variable life insurance and/or variable annuity products. Nevertheless, the Board of Trustees that oversees the Portfolio intends to monitor events to identify any material irreconcilable conflicts that may arise due to these arrangements and to determine what action, if any, should be taken in response.
If the Adviser determines that it is in the best interest of the Portfolio not to pay redemption proceeds in cash, and subject to applicable agreements with life insurance companies and other qualified investors, the Portfolio may pay a portion or all of a redemption by distributing securities held by the Portfolio. Such in-kind securities may be illiquid and difficult or impossible for a shareholder to sell at a time and at a price that a shareholder would like. In addition, shareholders receiving distributions in-kind may incur brokerage costs when subsequently selling shares of those securities.
FREQUENT PURCHASES AND REDEMPTIONS OF SHARES
Frequent purchases and redemptions of shares pursuant to the instructions of insurance company contract owners are referred to as "market-timing" or "short-term trading" and may present risks for other contract owners with long-term interests in the Portfolio, which may include, among other things, dilution in the value of Portfolio shares indirectly held by contract owners with long-term interests in the Portfolio, interference with the efficient management of the Portfolio, increased brokerage and administrative costs, and forcing the Portfolio to hold excess levels of cash.
In addition, the Portfolio is subject to the risk that market-timers and/or short-term traders may take advantage of time zone differences between the foreign markets on which the Portfolio's securities trade and the time the Portfolio's net asset value is calculated ("time-zone arbitrage"). For example, a market-timer may submit instructions for the purchase of shares of the Portfolio based on events occurring after foreign market closing prices are established, but before the Portfolio's net asset value calculation, that are likely to result in higher prices in foreign markets the following day. The market-timer would submit instructions to redeem the Portfolio's shares the next day, when the Portfolio's share price would reflect the increased prices in foreign markets for a quick profit at the expense of contract owners or participants with long-term interests in the Portfolio.
Investments in other types of securities also may be susceptible to short-term trading strategies. These investments include securities that are, among other things, thinly traded, traded infrequently, or relatively illiquid, which have the risk that the current market price for the securities may not accurately reflect current market values. A contract owner may seek to engage in short-term trading to take advantage of these pricing differences (referred to as "price-arbitrage"). Investments in certain fixed-income securities, such as junk bonds, may be adversely affected by price arbitrage trading strategies.
The Portfolio's policies with respect to valuing portfolio securities are described below in the "Pricing Portfolio Shares" section.
The Fund's Board of Trustees has adopted policies and procedures to discourage frequent purchases and redemptions of Portfolio shares by Portfolio shareholders. Insurance companies generally do not provide specific contract owner transaction instructions to the Portfolio on an ongoing basis. Therefore, to some extent, the Portfolio relies on the insurance companies to monitor frequent short-term trading by contract owners. However, the Portfolio or the Distributor has entered into
VIS — The Global Infrastructure Portfolio
11
agreements with insurance companies whereby the insurance companies are required to provide certain contract owner identification and transaction information upon the Portfolio's request. The Portfolio may use this information to help identify and prevent market-timing activity in the Portfolio. There can be no assurance that the Portfolio will be able to identify or prevent all market-timing activity.
If the Portfolio identifies suspected market-timing activity, the insurance company will be contacted and asked to take steps to prevent further market-timing activity (e.g., sending warning letters or blocking frequent trading by underlying contract owners). Insurance companies may be prohibited by the terms of the underlying insurance contract from restricting short-term trading of mutual fund shares by contract owners, thereby limiting the ability of such insurance company to implement remedial steps to prevent market-timing activity in the Portfolio. If the insurance company is unwilling or unable to take remedial steps to discourage or prevent frequent trading, or does not take action promptly, certain contract owners may be able to engage in frequent trading to the detriment of contract owners with long-term interests in the Portfolio. If the insurance company refuses to take remedial action, or takes action that the Portfolio deems insufficient, a determination will be made whether it is appropriate to terminate the relationship with such insurance company.
PRICING PORTFOLIO SHARES
The price of Portfolio shares, called "net asset value," is based on the value of its portfolio securities.
The net asset value per share of the Portfolio is calculated once daily at the NYSE close (normally 4:00 p.m. Eastern time) on each day that the NYSE is open. Shares will not be priced on days that the NYSE is closed.
The value of the Portfolio's securities is based on the securities' market price when available. When a market price is not readily available, including circumstances under which the Adviser and/or Sub-Advisers determine that a security's market price is not accurate, a portfolio security is valued at its fair value, as determined under procedures established by the Fund's Board of Trustees.
In addition, with respect to securities that primarily are listed on foreign exchanges, when an event occurs after the close of such exchanges that is likely to have changed the value of the securities (e.g., a percentage change in value of one or more U.S. securities indices in excess of specified thresholds), such securities will be valued at their fair value, as determined under procedures established by the Fund's Board of Trustees. Securities also may be fair valued in the event of a significant development affecting a country or region or an issuer-specific development, which is likely to have changed the value of the security. In these cases, the Portfolio's net asset value will reflect certain portfolio securities' fair value rather than their market price. Fair value pricing involves subjective judgment and it is possible that the fair value determined for a security is materially different than the value that could be realized upon the sale of that security. With respect to securities that are primarily listed on foreign exchanges, the value of the Portfolio's securities may change on days when shareholders will not be able to purchase or sell their shares.
To the extent the Portfolio invests in open-end management companies that are registered under the Investment Company Act of 1940, as amended, the Portfolio's net asset value is calculated based upon the net asset value of such funds. The prospectuses for such funds explain the circumstances under which they will use fair value pricing and its effects.
An exception to the general policy of using market prices concerns the Portfolio's short-term debt portfolio securities. Debt securities with remaining maturities of 60 days or less at the time of purchase are valued at amortized cost. However, if the cost does not reflect the securities' market value, these securities will be valued at their fair value.
DISTRIBUTIONS
The Portfolio passes substantially all of its earnings from income and capital gains along to its investors as "distributions." The Portfolio earns income from stocks and interest from fixed-income investments. These amounts are passed along to the Portfolio
VIS — The Global Infrastructure Portfolio
12
shareholders as "income dividend distributions." The Portfolio realizes capital gains whenever it sells securities for a higher price than it paid for them. These amounts may be passed along as "capital gains distributions."
Dividends from net investment income and capital gains distributions, if any, are declared and paid at least once per year.
TAX CONSEQUENCES
For information concerning the federal income tax consequences to holders of the underlying variable annuity or variable life insurance contracts, see the accompanying contract prospectus.
PORTFOLIO HOLDINGS INFORMATION
A description of the Fund's policies and procedures with respect to the disclosure of the Portfolio's securities is available in the Fund's SAI.
ADDITIONAL INFORMATION
The Adviser, Sub-Advisers and/or Distributor may pay compensation (out of their own funds and not as an expense of the Portfolio) to certain affiliated or unaffiliated broker-dealers or other financial intermediaries or service providers, including insurance companies and their affiliates, in connection with the sale, distribution, marketing or retention of Portfolio shares and/or shareholder servicing. Such compensation may be significant in amount and the prospect of receiving any such additional compensation may provide such affiliated or unaffiliated entities with an incentive to favor sales of shares of the Portfolio over other investment options. Any such payments will not change the net asset value or the price of the Portfolio's shares. For more information, please see the Fund's SAI.
VIS — The Global Infrastructure Portfolio
13
The financial highlights table is intended to help you understand the financial performance of the Portfolio's Class X shares for the periods indicated. Certain information reflects financial results for a single Portfolio share throughout each period. The total returns in the table represent the rate an investor would have earned or lost on an investment in the Portfolio (assuming reinvestment of all dividends and distributions). The ratio of expenses to average net assets listed in the table below is based on the average net assets of the Portfolio for each of the periods listed in the table. To the extent that the Portfolio's average net assets decrease over the Portfolio's next fiscal year, such expense ratios can be expected to increase, potentially significantly, because certain fixed costs will be spread over a smaller amount of assets.
The information for the years ended December 31, 2012 and December 31, 2011 has been audited by Ernst & Young LLP, an independent registered public accounting firm, whose report, along with the Portfolio's financial statements, are incorporated by reference in the SAI from the Fund's annual report, which is available upon request. The financial highlights for each of the years in the three-year period ended December 31, 2010 have been audited by another independent registered public accounting firm.
Further information about the performance of the Portfolio is contained in its annual report and semiannual report to shareholders. See the accompanying contract prospectus for either the variable annuity or the variable life contract issued by your insurance company for a description of charges which are applicable thereto. These charges are not reflected in the financial highlights below. Inclusion of any of these charges would reduce the total return figures for all periods shown.
For the Year Ended December 31, | | 2012 | | 2011 | | 2010^ | | 2009^ | | 2008^ | |
Selected Per Share Data: | |
Net asset value beginning of period | | $ | 8.72 | | | $ | 8.13 | | | $ | 8.68 | | | $ | 11.30 | | | $ | 20.66 | | |
Net investment income(a) | | | 0.22 | | | | 0.21 | | | | 0.21 | | | | 0.31 | | | | 0.40 | | |
Net realized and unrealized gain (loss) | | | 1.30 | | | | 1.07 | | | | 0.18 | | | | 1.16 | | | | (6.21 | ) | |
Total from investment operations | | | 1.52 | | | | 1.28 | | | | 0.39 | | | | 1.47 | | | | (5.81 | ) | |
Dividends to shareholders | | | (0.23 | ) | | | (0.23 | ) | | | (0.25 | ) | | | (0.38 | ) | | | (0.11 | ) | |
Distributions to shareholders | | | (0.82 | ) | | | (0.46 | ) | | | (0.69 | ) | | | (3.71 | ) | | | (3.44 | ) | |
Total dividends and distributions | | | (1.05 | ) | | | (0.69 | ) | | | (0.94 | ) | | | (4.09 | ) | | | (3.55 | ) | |
Net asset value end of period | | $ | 9.19 | | | $ | 8.72 | | | $ | 8.13 | | | $ | 8.68 | | | $ | 11.30 | | |
Total Return(b) | | | 18.69 | % | | | 16.07 | % | | | 6.93 | % | | | 19.26 | % | | | (33.27 | )% | |
Ratio to Average Net Assets:(c) | |
Expenses | | | 0.87 | %(d) | | | 0.86 | %(d) | | | 0.87 | %(d) | | | 0.96 | %(d) | | | 0.74 | %(d) | |
Net investment income | | | 2.51 | %(d) | | | 2.48 | %(d) | | | 2.71 | %(d) | | | 3.37 | %(d) | | | 2.46 | %(d) | |
Rebate from Morgan Stanley affiliate | | | 0.00 | %(e) | | | 0.00 | %(e) | | | 0.00 | %(e) | | | 0.00 | %(e) | | | 0.00 | %(e) | |
Supplemental Data: | |
Net assets end of period (000's) | | $ | 57,628 | | | $ | 58,998 | | | $ | 61,408 | | | $ | 68,748 | | | $ | 70,951 | | |
Portfolio turnover rate | | | 28 | % | | | 36 | % | | | 148 | % | | | 280 | % | | | 76 | % | |
^ Beginning with the year ended December 31, 2011, the Fund was audited by Ernst & Young LLP. The previous years were audited by another independent registered public accounting firm.
(a) The per share amounts were computed using an average number of shares outstanding during the period.
(b) Calculated based on the net asset value as of the last business day of the period. Performance shown does not reflect fees and expenses imposed by your insurance company. If performance information included the effect of these additional charges, the total returns would be lower.
(c) Reflects overall Portfolio ratios for investment income and non-class specific expenses.
(d) The ratios reflect the rebate of certain Portfolio expenses in connection with investments in a Morgan Stanley affiliate during the period. The effect of the rebate on the ratios is disclosed in the above table as "Rebate from Morgan Stanley affiliate."
(e) Amount is less than 0.005%.
VIS — The Global Infrastructure Portfolio
14
(This page has been left blank intentionally.)
(This page has been left blank intentionally.)
Morgan Stanley Variable Investment Series

ADDITIONAL INFORMATION ABOUT THE PORTFOLIO'S INVESTMENTS is available in the Fund's Annual and Semiannual Reports to Shareholders. In the Fund's Annual Report, you will find a discussion of the market conditions and investment strategies that significantly affected the Portfolio's performance during its last fiscal year. The Fund's Statement of Additional Information also provides additional information about the Portfolio. The Statement of Additional Information is incorporated herein by reference (legally is part of this Prospectus). For a free copy of the Fund's Annual Report, Semiannual Report or Statement of Additional Information, to request information about the Portfolio or to make shareholder inquiries, please call toll-free (800) 869-NEWS. Free copies of these documents are also available from our Internet site at: www.morganstanley.com/im.

YOU ALSO MAY OBTAIN INFORMATION ABOUT THE FUND BY CALLING your Morgan Stanley Financial Advisor or by visiting our Internet site.

INFORMATION ABOUT THE FUND (including the Statement of Additional Information) can be viewed and copied at the SEC Public Reference Room in Washington, D.C. Information on the operation of the Public Reference Room may be obtained by calling the SEC at (202) 551-8090. Reports and other information about the Fund and the Portfolio are available on the EDGAR Database on the SEC's Internet site at: http://www.sec.gov, and copies of this information may be obtained, after paying a duplicating fee, by electronic request at the following E-mail address: publicinfo@sec.gov, or by writing to the SEC's Public Reference Section, Washington, D.C. 20549-1520.
(THE FUND'S INVESTMENT COMPANY ACT FILE NO. IS 811-3692)
PROSPECTUS n APRIL 30, 2013

VARIABLE INVESTMENT SERIES
THE GLOBAL INFRASTRUCTURE PORTFOLIO
Class Y
Morgan Stanley Variable Investment Series is a mutual fund comprised of six separate portfolios, each with its own distinct investment objective(s) and policies. In this Prospectus, shares of the Global Infrastructure Portfolio (the "Portfolio") are being offered.
Shares of the Portfolio are sold exclusively to certain life insurance companies in connection with particular variable life insurance and/or variable annuity contracts they issue. The insurance companies invest in shares of the Portfolio in accordance with instructions received from owners of variable life insurance or variable annuity contracts.
This Prospectus must be accompanied by a current prospectus for the variable life insurance and/or variable annuity contract issued by your insurance company.
The Securities and Exchange Commission ("SEC") has not approved or disapproved these securities or passed upon
the adequacy of this Prospectus. Any representation to the contrary is a criminal offense.
Contents
Portfolio Summary | | INVESTMENT OBJECTIVE | | | 1 | | |
| | | FEES AND EXPENSES OF THE PORTFOLIO | | | 1 | | |
| | | PORTFOLIO TURNOVER | | | 1 | | |
| | | PRINCIPAL INVESTMENT STRATEGIES | | | 1 | | |
| | | PRINCIPAL RISKS | | | 2 | | |
| | | PAST PERFORMANCE | | | 2 | | |
| | FUND MANAGEMENT | | | 3 | | |
| | | PURCHASE AND SALE OF PORTFOLIO SHARES | | | 3 | | |
| | | TAX INFORMATION | | | 3 | | |
| | | PAYMENTS TO INSURANCE COMPANIES AND OTHER FINANCIAL INTERMEDIARIES | | | 3 | | |
Portfolio Details | | ADDITIONAL INFORMATION ABOUT THE PORTFOLIO'S INVESTMENT OBJECTIVE,
STRATEGIES AND RISKS | | | 4 | | |
| | FUND MANAGEMENT | | | 9 | | |
Shareholder Information | | PURCHASES AND SALES OF PORTFOLIO SHARES | | | 11 | | |
| | | FREQUENT PURCHASES AND REDEMPTIONS OF SHARES | | | 11 | | |
| | | PRICING PORTFOLIO SHARES | | | 12 | | |
| | | PLAN OF DISTRIBUTION | | | 12 | | |
| | | DISTRIBUTIONS | | | 13 | | |
| | | TAX CONSEQUENCES | | | 13 | | |
| | | PORTFOLIO HOLDINGS INFORMATION | | | 13 | | |
| | | ADDITIONAL INFORMATION | | | 13 | | |
Financial Highlights | | | | | 14 | | |
This Prospectus contains important information about the Global Infrastructure Portfolio and the Morgan Stanley Variable Investment Series. Please read it carefully and keep it for future reference.
Investment Objective
The Portfolio seeks both capital appreciation and current income.
Fees and Expenses of the Portfolio
The table below describes the fees and expenses that you may pay if you buy and hold Class Y shares of the Portfolio. Total Annual Portfolio Operating Expenses in the table and the Example below do not reflect the impact of any charges by your insurance company. If they did, expenses would be higher.
Annual Portfolio Operating Expenses
(expenses that you pay each year as a percentage of the value of your investment)
Advisory Fee | | | 0.57 | % | |
Distribution and/or Shareholder Service (12b-1) Fee | | | 0.25 | % | |
Other Expenses | | | 0.30 | % | |
Total Annual Portfolio Operating Expenses | | | 1.12 | % | |
Example
The example below is intended to help you compare the cost of investing in the Portfolio with the cost of investing in other mutual funds.
The example assumes that you invest $10,000 in the Portfolio, your investment has a 5% return each year, and the Portfolio's operating expenses remain the same. Although your actual costs may be higher or lower, based on these assumptions your costs would be:
| | | Expenses Over Time | |
| | | 1 Year | | 3 Years | | 5 Years | | 10 Years | |
| | | | | $ | 114 | | | $ | 356 | | | $ | 617 | | | $ | 1,363 | | |
Portfolio Turnover
The Portfolio pays transaction costs, such as commissions, when it buys and sells securities (or "turns over" its portfolio). A higher portfolio turnover rate may indicate higher transaction costs. These costs, which are not reflected in Total Annual Portfolio Operating Expenses or in the Example, affect the Portfolio's performance. During the most recent fiscal year, the Portfolio's portfolio turnover rate was 28% of the average value of its portfolio.
Principal Investment Strategies
The Portfolio will normally invest at least 80% of its assets in equity securities issued by companies located throughout the world that are engaged in the infrastructure business. A company will be considered to be in the infrastructure business if it derives at least 50% of its revenues or earnings from, or devotes at least 50% of its assets to, infrastructure-related activities. Infrastructure refers to the systems and networks of energy, transportation, communication and other services required for the normal function of society. The Portfolio may invest up to 100% of its net assets in foreign securities, which may include emerging market securities. Under normal market conditions, the Portfolio invests at least 40% of its assets in the securities of issuers located outside of the United States. The Portfolio's equity investments may include convertible securities.
The Portfolio's "Adviser," Morgan Stanley Investment Management Inc., and/or "Sub-Advisers," Morgan Stanley Investment Management Limited and Morgan Stanley Investment Management Company, will shift the Portfolio's assets between the different types of companies in the infrastructure business described above based on relative valuation, underlying company fundamentals, and demographic and macroeconomic considerations. Utility companies represent a significant component of the universe of companies engaged in the infrastructure business. These companies may include traditionally regulated public utilities or fully or partially deregulated utility companies as well as unregulated utility companies. The Portfolio has a fundamental policy (i.e., one that cannot be changed without shareholder approval) of investing 25% or more of its assets in the utilities industry.
In selecting securities to buy, hold or sell for the Portfolio, the Adviser and/or Sub-Advisers actively manage the portfolio using a combination of bottom-up and top-down methodologies. The value-driven approach to bottom-up security selection utilizes proprietary research models to identify infrastructure companies that offer the best value relative to their underlying assets and growth prospects. The top-down allocation provides diversified exposure to major economic infrastructure sectors and countries, with an overweighting to those sectors/countries that offer the best relative valuation.
VIS — The Global Infrastructure Portfolio
1
Principal Risks
There is no assurance that the Portfolio will achieve its investment objective and you can lose money investing in this Portfolio. The principal risks of investing in the Portfolio include:
• Infrastructure-Related Companies. Because the Portfolio concentrates its investments in infrastructure-related companies, the Portfolio has greater exposure to the potential adverse economic, regulatory, political and other changes affecting such entities. Infrastructure-related companies are subject to a variety of factors that may adversely affect their business or operations including high interest costs in connection with capital construction programs, costs associated with compliance with and changes in environmental and other regulations, difficulty in raising capital in adequate amounts on reasonable terms in periods of high inflation and unsettled capital markets, the effects of surplus capacity, increased competition from other providers of services in a developing deregulatory environment, uncertainties concerning the availability of fuel at reasonable prices, the effects of energy conservation policies and other factors.
Other factors that may affect the operations of infrastructure-related companies include innovations in technology, significant changes to the number of ultimate end-users of a company's products, increased susceptibility to terrorist acts or political actions, risks of environmental damage due to a company's operations or an accident, and general changes in market sentiment towards infrastructure and utilities assets.
• Utilities Industry. Changing regulation constitutes one of the key industry-specific risks for the Portfolio. State and other regulators often monitor and control utility revenues and costs. Regulatory authorities also may restrict a company's access to new markets. The deregulation of certain utilities companies may subject these companies to greater risks of loss. Individual sectors of the utility market are subject to additional risks. These risks apply to all utility companies—regulated, fully or partially deregulated, and unregulated.
Certain utilities companies may incur unexpected increases in fuel and other operating costs. They are adversely affected when long-term interest rates rise. Long-term borrowings are used to finance most utility investments, and rising interest rates lead to higher financing costs and reduced earnings. There are also considerable costs associated with environmental compliance, nuclear waste clean-up and safety regulation. Increasingly, regulators are calling upon electric utilities to bear these added costs, and there is a risk that these costs will not be fully recovered through an increase in revenues.
• Common Stock and Other Equity Securities. In general, common stock and other equity security values fluctuate, and sometimes widely fluctuate, in response to activities specific to the issuer of the security as well as factors unrelated to the fundamental condition of the issuer, including general market, economic and political conditions. To the extent that the Portfolio invests in convertible securities, and the convertible security's investment value is greater than its conversion value,
its price will be likely to increase when interest rates fall and decrease when interest rates rise. If the conversion value exceeds the investment value, the price of the convertible security will tend to fluctuate directly with the price of the underlying equity security. The Portfolio's emphasis on industries may cause its performance to be more sensitive to developments affecting particular industries than a fund that places primary emphasis on individual companies.
• Small and Medium Capitalization Companies. Investments in small and medium capitalization companies may involve greater risks than investments in larger, more established companies. The securities issued by small and medium capitalization companies may be less liquid, and such companies may have more limited markets, financial resources and product lines, and may lack the depth of management of larger companies.
• Foreign and Emerging Market Securities. Investments in foreign markets entail special risks such as currency, political, economic and market risks. There also may be greater market volatility, less reliable financial information, higher transaction and custody costs, decreased market liquidity and less government and exchange regulation associated with investments in foreign markets. In addition, investments in certain foreign markets, which have historically been considered stable, may become more volatile and subject to increased risk due to ongoing developments and changing conditions in such markets. Moreover, the growing interconnectivity of global economies and financial markets has increased the probability that adverse developments and conditions in one country or region will affect the stability of economies and financial markets in other countries or regions. The risks of investing in emerging market countries are greater than risks associated with investments in foreign developed countries.
Shares of the Portfolio are not bank deposits and are not guaranteed or insured by the Federal Deposit Insurance Corporation or any other government agency.
Past Performance
The bar chart and table below provide some indication of the risks of investing in the Portfolio by showing changes in the performance of the Portfolio's Class Y shares from year-to-year and by showing how the average annual returns of the Portfolio's Class Y shares for the one, five and 10 year periods compare with those of a broad measure of market performance, as well as a comparative sector index, over time. This performance information does not include the impact of any charges deducted by your insurance company. If it did, returns would be lower. The Portfolio's past performance does not indicate how the Portfolio will perform in the future.
VIS — The Global Infrastructure Portfolio
2
Annual Total Returns—Calendar Years
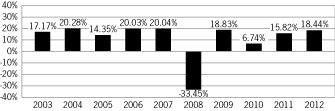
High Quarter | | 6/30/09: | | 21.02% | |
Low Quarter | | 9/30/08: | | –18.14% | |
Average Annual Total Returns For Periods Ended December 31, 2012
| | | Past
1 Year | | Past
5 Years | | Past
10 Years | |
Global Infrastructure Portfolio | | | 18.44 | % | | | 2.98 | % | | | 10.40 | % | |
Dow Jones Brookfield Global
Infrastructure IndexSM (reflects no
deduction for fees, expenses,
or taxes)1 | | | 16.01 | % | | | 4.86 | % | | | 14.38 | % | |
S&P Global BMI Index (reflects no
deduction for fees, expenses,
or taxes)2 | | | 17.15 | % | | | –0.26 | % | | | 9.31 | % | |
(1) The Dow Jones Brookfield Global Infrastructure IndexSM is a float-adjusted market capitalization weighted index that measures the stock performance of companies that exhibit strong infrastructure characteristics. The Index intends to measure all sectors of the infrastructure market. The Index was first published in July 2008; however, back-tested hypothetical performance information is available for this Index since December 31, 2002. Returns are calculated using the return data of the S&P Global BMI Index through December 31, 2002 and the return data of the Dow Jones Brookfield Global Infrastructure Index for periods thereafter. It is not possible to invest directly in an index.
(2) The Standard & Poor's Global BMI Index (S&P Global BMI Index) is a broad market index designed to capture exposure to equities in all countries in the world that meet minimum size and liquidity requirements. As of the date of this Prospectus, there are approximately 11,000 index members representing 26 developed and 20 emerging market countries. It is not possible to invest directly in an index.
Fund Management
Adviser. Morgan Stanley Investment Management Inc.
Sub-Advisers. Morgan Stanley Investment Management Limited and Morgan Stanley Investment Management Company.
Portfolio Managers. The Portfolio is managed by members of the Global Infrastructure Securities team. Information about the members jointly and primarily responsible for the day-to-day management of the Portfolio is shown below:
Name | | Title with Adviser | | Date Began
Managing Portfolio | |
Theodore R. Bigman | | Managing Director | | March 2010 | |
Matthew King | | Executive Director | | March 2010 | |
Purchase and Sale of Portfolio Shares
This Prospectus offers Class Y shares of the Global Infrastructure Portfolio. The Portfolio also offers Class X shares of the Portfolio through a separate prospectus. Class X shares are subject to different expenses. For eligibility information, contact your insurance company.
Portfolio shares will be sold at the next price calculated after we receive the redemption request on your behalf.
The Portfolio offers its shares only to insurance companies' separate accounts that insurance companies establish to fund variable life insurance and/or variable annuity contracts. An insurance company purchases or redeems shares of the Portfolio based on, among other things, the amount of net contract premiums or purchase payments allocated to a separate account investment division, transfers to or from a separate account investment division, contract loans and repayments, contract withdrawals and surrenders, and benefit payments. The contract prospectus describes how contract owners may allocate, transfer and withdraw amounts to, and from, separate accounts.
For more information, please refer to the "Shareholder Information—Purchases and Sales of Portfolio Shares" section of this Prospectus.
Tax Information
Special tax rules apply to life insurance companies, variable annuity contracts and variable life insurance contracts. For information on federal income taxation of a life insurance company with respect to its receipt of distributions from the Portfolio and federal income taxation of owners of variable annuity or variable life insurance contracts, see the accompanying contract prospectus.
Payments to Insurance Companies and
Other Financial Intermediaries
If you purchase the Portfolio through an insurance company or other financial intermediary (such as a bank), the Adviser and/or the Portfolio's "Distributor," Morgan Stanley Distribution, Inc., may pay the intermediary for the sale of Portfolio shares and related services. These payments, which may be significant in amount, may create a conflict of interest by influencing the insurance company or other intermediary and your salesperson to recommend one variable annuity contract over another or be a factor in an insurance company's decision to include the Portfolio as an underlying investment option in its variable insurance products. Ask your salesperson or visit your insurance company's or other intermediary's web site for more information.
VIS — The Global Infrastructure Portfolio
3
Portfolio Details
ADDITIONAL INFORMATION ABOUT THE PORTFOLIO'S INVESTMENT OBJECTIVE, STRATEGIES AND RISKS
INVESTMENT OBJECTIVE
The Portfolio seeks both capital appreciation and current income.
PRINCIPAL INVESTMENT STRATEGIES
GROWTH & INCOME
An investment objective having the goal of selecting securities with the potential to rise in price and pay out income.
The Portfolio will normally invest at least 80% of its assets in equity securities issued by companies located throughout the world that are engaged in the infrastructure business. A company will be considered to be in the infrastructure business if it derives at least 50% of its revenues or earnings from, or devotes at least 50% of its assets to, infrastructure-related activities. Infrastructure refers to the systems and networks of energy, transportation, communication and other services required for the normal function of society. Companies in the infrastructure business may be involved in, among other areas, the transmission and distribution of electric energy; the storage, transportation and distribution of natural resources, such as natural gas, used to produce energy; the building, operation and maintenance of highways, toll roads, tunnels, bridges and parking lots; the building, operation and maintenance of airports and ports, railroads and mass transit systems; telecommunications; water treatment and distribution; and other emerging infrastructure sectors. The Portfolio's investments may include securities of small and medium capitalization companies. The Portfolio may invest up to 100% of its net assets in foreign securities, which may include emerging market securities. Under normal market conditions, the Portfolio invests at least 40% of its assets in the securities of issuers located outside of the United States. The Portfolio's equity investments may include convertible securities.
The Adviser and/or Sub-Advisers will shift the Portfolio's assets between the different types of companies in the infrastructure business described above based on relative valuation, underlying company fundamentals, and demographic and macroeconomic considerations. Utility companies represent a significant component of the universe of companies engaged in the infrastructure business. These companies may include traditionally regulated public utilities or fully or partially deregulated utility companies as well as unregulated utility companies. The Portfolio has a fundamental policy (i.e., one that cannot be changed without shareholder approval) of investing 25% or more of its assets in the utilities industry. Utilities companies are involved in, among other areas, gas and electric energy, water distribution, telecommunications, and other new or emerging technologies.
In selecting securities to buy, hold or sell for the Portfolio, the Adviser and/or Sub-Advisers actively manage the Portfolio using a combination of bottom-up and top-down methodologies. The value-driven approach to bottom-up security selection utilizes proprietary research models to identify infrastructure companies that offer the best value relative to their underlying assets and growth prospects. The top-down allocation provides diversified exposure to major economic infrastructure sectors and countries, with an overweighting to those sectors/countries that offer the best relative valuation. The Adviser and/or Sub-Advisers generally consider selling a portfolio holding when it determines that the holding is less attractive based on a number of factors, including changes in the holding's share price, earnings prospects relative to its peers and/or business prospects.
VIS — The Global Infrastructure Portfolio
4
Common stock is a share ownership or equity interest in a corporation. It may or may not pay dividends, as some companies reinvest all of their profits back into their businesses, while others pay out some of their profits to shareholders as dividends. A depositary receipt is generally issued by a bank or financial institution and represents an ownership interest in the common stock or other equity securities of a foreign company.
Other Investments. The remaining 20% of the Portfolio's assets may be invested in fixed-income securities, equity securities of companies not engaged in the infrastructure business, U.S. government securities issued, or guaranteed as to principal and interest, by the U.S. Government or its agencies or instrumentalities and asset-backed securities. The Portfolio may invest in real estate investment trusts (commonly known as "REITs") and foreign real estate companies and convertible securities. The Portfolio may invest up to 5% of its assets in fixed-income securities and convertible securities rated below investment grade (commonly known as "junk bonds"). For more information, see the "Additional Investment Strategy Information" section.
In pursuing the Portfolio's investment objective, the Adviser and/or Sub-Advisers have considerable leeway in deciding which investments they buy, hold or sell on a day-to-day basis and which trading strategies they use. For example, the Adviser and/or Sub-Advisers in their discretion may determine to use some permitted trading strategies while not using others.
ADDITIONAL INVESTMENT STRATEGY INFORMATION
This section provides additional information relating to the Portfolio's investment strategies.
Fixed-Income Securities. Fixed-income securities include debt securities such as bonds, notes or commercial paper. The issuer of a debt security borrows money from the investor who buys the security. Most debt securities pay either fixed or adjustable rates of interest at regular intervals until they mature, at which point investors get their principal back. The Portfolio's fixed-income investments may include zero coupon securities, which are purchased at a discount and generally accrue interest, but make no payment, until maturity.
U.S. Government Securities. The U.S. government securities that the Portfolio may purchase include U.S. Treasury bills, notes and bonds, all of which are direct obligations of the U.S. Government. In addition, the Portfolio may purchase securities issued by agencies and instrumentalities of the U.S. Government which are backed by the full faith and credit of the United States. The Portfolio may also purchase securities issued by agencies and instrumentalities which are not backed by the full faith and credit of the United States, but whose issuing agency or instrumentality has the right to borrow, to meet its obligations, from the U.S. Treasury. Further, the Portfolio may purchase securities issued by agencies and instrumentalities which are backed solely by the credit of the issuing agency or instrumentality.
Asset-Backed Securities. The Portfolio may invest in asset-backed securities. Asset-backed securities represent an interest in a pool of assets such as a pool of power generation assets or other utility assets or utility-related assets, that have been securitized in pass-through structures. These types of pass-through securities provide for monthly payments that are a "pass-through" of the monthly interest and principal payments made by the individual borrowers on the pooled receivables.
REITs and Foreign Real Estate Companies. The Portfolio may invest in REITs and foreign real estate companies, which are similar to entities organized and operated as REITs in the United States. REITs and foreign real estate companies pool investors' funds for investments primarily in real estate properties or real estate-related loans. They may also include, among other businesses, real estate developers, brokers and operating companies whose products and services are significantly related to the real estate industry such as building suppliers and mortgage lenders.
Defensive Investing. The Portfolio may take temporary "defensive" positions in attempting to respond to adverse market, economic, political or other conditions. The Portfolio may invest any amount of its assets in cash, cash equivalents or other fixed-income securities in a defensive posture that may be inconsistent with its principal investment strategies when the Adviser and/or the Sub-Advisers believe it advisable to do so. Although taking a defensive posture is designed to protect the Portfolio
VIS — The Global Infrastructure Portfolio
5
from an anticipated market downturn, it could have the effect of reducing the benefit from any upswing in the market. When the Portfolio takes a defensive position, it may not achieve its investment objective.
* * *
The percentage limitations relating to the composition of the Portfolio apply at the time the Portfolio acquires an investment. Subsequent percentage changes that result from market fluctuations generally will not require the Portfolio to sell any portfolio security. However, the Portfolio may be required to reduce its borrowings, in response to fluctuations in the value of such holdings. Except for the Portfolio's policy to concentrate its assets in the utilities industry, the Portfolio may change its principal investment strategies without shareholder approval; however, you would be notified of any changes.
PRINCIPAL RISKS
There is no assurance that the Portfolio will achieve its investment objective. The Portfolio's share price and return will fluctuate with changes in the market value of its portfolio securities. When you sell Portfolio shares, they may be worth less than what you paid for them and, accordingly, you can lose money investing in this Portfolio.
Infrastructure-Related Companies. Because the Portfolio concentrates its investments in infrastructure-related companies, the Portfolio has greater exposure to the potential adverse economic, regulatory, political and other changes affecting such entities. Infrastructure-related companies are subject to a variety of factors that may adversely affect their business or operations including high interest costs in connection with capital construction programs, costs associated with compliance with and changes in environmental and other regulations, difficulty in raising capital in adequate amounts on reasonable terms in periods of high inflation and unsettled capital markets, the effects of surplus capacity, increased competition from other providers of services in a developing deregulatory environment, uncertainties concerning the availability of fuel at reasonable prices, the effects of energy conservation policies and other factors. Additionally, infrastructure-related entities may be subject to regulation by various governmental authorities and may also be affected by governmental regulation of rates charged to customers, government budgetary constraints, service interruption due to environmental, operational or other mishaps and the imposition of special tariffs and changes in tax laws, regulatory policies and accounting standards.
Other factors that may affect the operations of infrastructure-related companies include innovations in technology that could render the way in which a company delivers a product or service obsolete, significant changes to the number of ultimate end-users of a company's products, increased susceptibility to terrorist acts or political actions, risks of environmental damage due to a company's operations or an accident, and general changes in market sentiment towards infrastructure and utilities assets.
Utilities Industry. The Portfolio's investments in the utilities industry are impacted by risks particular to that industry. Changing regulation constitutes one of the key industry-specific risks for the Portfolio. State and other regulators often monitor and control utility revenues and costs, and therefore may limit utility profits and dividends paid to investors. Regulatory authorities also may restrict a company's access to new markets, thereby diminishing the company's long-term prospects. The deregulation of certain utilities companies may subject these companies to greater risks of loss. Individual sectors of the utility market are subject to additional risks. These risks apply to all utility companies—regulated, fully or partially deregulated and unregulated.
Certain utilities companies may incur unexpected increases in fuel and other operating costs. They are adversely affected when long-term interest rates rise. Long-term borrowings are used to finance most utility investments, and rising interest rates lead to higher financing costs and reduced earnings. There are also considerable costs associated with environmental compliance, nuclear waste clean-up and safety regulation. Increasingly, regulators are calling upon electric utilities to bear these added costs, and there is a risk that these costs will not be fully recovered through an increase in revenues.
In the case of the water utility sector, the industry is highly fragmented, and most water supply companies find themselves in mature markets, although upgrading of fresh water and waste water systems is an expanding business.
VIS — The Global Infrastructure Portfolio
6
Common Stock and Other Equity Securities. A principal risk of investing in the Portfolio is associated with its common stock and other equity investments. In general, common stock and other equity security prices can fluctuate, and sometimes widely fluctuate, in response to activities specific to the issuer of the security as well as factors unrelated to the fundamental condition of the issuer, including general market, economic and political conditions.
Investments in convertible securities subject the Portfolio to the risks associated with both fixed-income securities and common stocks. To the extent that a convertible security's investment value is greater than its conversion value, its price will be likely to increase when interest rates fall and decrease when interest rates rise, as with a fixed-income security. If the conversion value exceeds the investment value, the price of the convertible security will tend to fluctuate directly with the price of the underlying equity security. No more than 5% of the Portfolio's assets may be invested in convertible securities rated lower than investment grade (commonly known as "junk bonds").
Small and Medium Capitalization Companies. The Portfolio's investments in small and medium capitalization companies carry more risk than investments in larger companies. While some of the Portfolio's holdings in these companies may be listed on a national securities exchange, such securities are more likely to be traded in the over-the-counter market. The low market liquidity of these securities may have an adverse impact on the Portfolio's ability to sell certain securities at favorable prices and may also make it difficult for the Portfolio to obtain market quotations based on actual trades for purposes of valuing the Portfolio's securities. Investing in lesser-known, small and medium capitalization companies involves greater risk of volatility of the Portfolio's net asset value than is customarily associated with larger, more established companies. Often small and medium capitalization companies and the industries in which they are focused are still evolving and, while this may offer better growth potential than larger, more established companies, it also may make them more sensitive to changing market conditions.
Foreign and Emerging Market Securities. The Portfolio's investments in foreign securities involve risks that are in addition to the risks associated with domestic securities. One additional risk is currency risk. While the price of Portfolio shares is quoted in U.S. dollars, the Portfolio may convert U.S. dollars to a foreign market's local currency to purchase a security in that market. If the value of that local currency falls relative to the U.S. dollar, the U.S. dollar value of the foreign security will decrease. This is true even if the foreign security's local price remains unchanged.
Foreign securities also have risks related to economic and political developments abroad, including expropriations, confiscatory taxation, exchange control regulation, limitations on the use or transfer of Portfolio assets and any effects of foreign social, economic or political instability. Foreign companies, in general, are not subject to the regulatory requirements of U.S. companies and, as such, there may be less publicly available information about these companies. Moreover, foreign accounting, auditing and financial reporting standards generally are different from those applicable to U.S. companies. Finally, in the event of a default of any foreign debt obligations, it may be more difficult for the Fund to obtain or enforce a judgment against the issuers of the securities.
Securities of foreign issuers may be less liquid than comparable securities of U.S. issuers and, as such, their price changes may be more volatile. In addition, the prices of such securities may be susceptible to influence by large traders, due to the limited size of many foreign securities markets. Moreover, investments in certain foreign markets, which have historically been considered stable, may become more volatile and subject to increased risk due to ongoing developments and changing conditions in such markets. Also, the growing interconnectivity of global economies and financial markets has increased the probability that adverse developments and conditions in one country or region will affect the stability of economies and financial markets in other countries or regions. Furthermore, foreign exchanges and broker-dealers are generally subject to less government and exchange scrutiny and regulation than their U.S. counterparts. In addition, differences in clearance and settlement procedures in foreign markets may cause delays in settlement of the Portfolio's trades effected in those markets and could result in losses to the Portfolio due to subsequent declines in the value of the securities subject to the trades.
The foreign securities in which the Portfolio may invest may be issued by issuers located in emerging market or developing countries. Compared to the United States and other developed countries, emerging market or developing countries may have relatively unstable governments, economies based on only a few industries and securities markets that trade a small number of securities. Securities issued by companies located in these countries tend to be especially volatile and may be less liquid than
VIS — The Global Infrastructure Portfolio
7
securities traded in developed countries. In the past, securities in these countries have been characterized by greater potential loss than securities of companies located in developed countries.
Depositary receipts involve many of the same risks as those associated with direct investment in foreign securities. In addition, the underlying issuers of certain depositary receipts, particularly unsponsored or unregistered depositary receipts, are under no obligation to distribute shareholder communications to the holders of such receipts, or to pass through to them any voting rights with respect to the deposited securities.
Other Risks. The performance of the Portfolio also will depend on whether or not the Adviser and/or Sub-Advisers are successful in applying the Portfolio's investment strategies. The Portfolio is also subject to other risks from its permissible investments, including the risks associated with its investments in convertible securities (discussed above), fixed-income securities, including junk bonds, U.S. government securities, asset-backed securities and REITs and foreign real estate companies. For more information about these risks, see the "Additional Risk Information" section.
ADDITIONAL RISK INFORMATION
This section provides additional information relating to the risks of investing in the Portfolio.
Fixed-Income Securities. Fixed-income securities are subject to the risk of the issuer's inability to meet principal and interest payments on its obligations (i.e., credit risk) and are subject to price volatility resulting from, among other things, interest rate sensitivity, market perception of the creditworthiness of the issuer and general market liquidity (i.e., market risk). The Portfolio is not limited as to the maturities of the securities in which it may invest. Securities with longer durations are likely to be more sensitive to changes in interest rates, generally making them more volatile than securities with shorter durations. Zero coupon securities (which are purchased at a discount and generally accrue interest, but make no payments until maturity) are typically subject to greater price fluctuations than comparable securities that pay current interest. The Portfolio may invest up to 5% of its net assets in fixed-income securities rated below investment grade and these investments may have speculative characteristics. Lower rated fixed-income securities have greater volatility because there is less certainty that principal and interest payments will be made as scheduled.
U.S. Government Securities. U.S. government securities are subject to market and interest rate risk, as well as varying degrees of credit risk. Some U.S. government securities are issued or guaranteed by the U.S. Treasury and are supported by the full faith and credit of the United States (but not issued by the U.S. Treasury). These securities may have less credit risk than U.S. government securities not supported by the full faith and credit of the United States. With respect to U.S. government securities that are not backed by the full faith and credit of the United States, there is a risk that the U.S. Government will not provide financial support to such U.S. government agencies, instrumentalities or sponsored entities if it is not obligated to do so by law.
Asset-Backed Securities. Asset-backed securities involve the risk that various federal and state consumer laws and other legal and economic factors may result in the collateral backing the securities being insufficient to support payment on the securities. Asset-backed securities generally decrease in value as a result of interest rate increases, but may benefit less than other fixed-income securities from declining interest rates, principally because of prepayments. Prepayments may increase during a period of declining interest rates, although other factors, such as changes in your usage or alternative power generation, may also influence prepayment rates.
REITs and Foreign Real Estate Companies. REITs and foreign real estate companies generally derive their income from rents on the underlying properties or interest on the underlying loans, and their value is impacted by changes in the value of the underlying property or changes in interest rates affecting the underlying loans owned by the REITs and/or foreign real estate companies. REITs and foreign real estate companies are more susceptible to risks associated with the ownership of real estate and the real estate industry in general. These risks can include fluctuations in the value of underlying properties; defaults by borrowers or tenants; market saturation; changes in general and local economic conditions; decreases in market rates for rents;
VIS — The Global Infrastructure Portfolio
8
increases in competition, property taxes, capital expenditures or operating expenses; and other economic, political or regulatory occurrences affecting the real estate industry. In addition, REITs and foreign real estate companies depend upon specialized management skills, may not be diversified (which may increase the volatility of a REIT's and/or foreign real estate company's value), may have less trading volume and may be subject to more abrupt or erratic price movements than the overall securities market. Foreign real estate companies may be subject to laws, rules and regulations governing those entities and their failure to comply with those laws, rules and regulations could negatively impact the performance of those entities. Operating REITs and foreign real estate companies requires specialized management skills and the Portfolio indirectly bears REIT and foreign real estate company management expenses along with the direct expenses of the Portfolio. REITs are not taxed on income distributed to shareholders provided they comply with several requirements of the Internal Revenue Code of 1986, as amended (the "Code"). REITs are subject to the risk of failing to qualify for tax-free pass-through income under the Code.
FUND MANAGEMENT
MORGAN STANLEY INVESTMENT
MANAGEMENT INC.
The Adviser, together with its affiliated asset management companies, had approximately $338.2 billion in assets under management or supervision as of December 31, 2012.
The Fund has retained the Adviser—Morgan Stanley Investment Management Inc.—to provide investment advisory services. The Adviser is a wholly-owned subsidiary of Morgan Stanley (NYSE: "MS"), a preeminent global financial services firm engaged in securities trading and brokerage activities, as well as providing investment banking, research and analysis, financing and financial advisory services. The Adviser's address is 522 Fifth Avenue, New York, NY 10036.
The Adviser has entered into sub-advisory agreements with the Sub-Advisers—Morgan Stanley Investment Management Limited ("MSIM Limited") and Morgan Stanley Investment Management Company ("MSIM Company"). The Sub-Advisers are wholly owned subsidiaries of Morgan Stanley. The Sub-Advisers provide the Portfolio with investment advisory services subject to the overall supervision of the Adviser and the Fund's Officers and Trustees. The Adviser pays MSIM Limited and MSIM Company on a monthly basis a portion of the net advisory fees the Adviser receives from the Portfolio. MSIM Limited's address is 25 Cabot Square, Canary Wharf, London, E14 4QA, England and MSIM Company's address is 23 Church Street, 16-01 Capital Square, Singapore 049481.
The Portfolio is managed by members of the Global Infrastructure Securities team. Current members of the team jointly and primarily responsible for the day-to-day management of the Portfolio are Theodore R. Bigman and Matthew King.
Mr. Bigman has been associated with the Adviser in an investment management capacity since 1995. Mr. King has been associated with the Adviser in an investment management capacity since 2008 and began managing the Portfolio in March 2010. Prior to 2008, Mr. King worked for Bear Stearns in a variety of roles, including investment banking, capital markets and research during which time he provided research and analytical support for a number of infrastructure-related financings.
As lead portfolio manager, Mr. Bigman, together with co-portfolio manager Mr. King, determine the investment strategy, establishes asset-allocation frameworks and directs the implementation of investment strategy.
The Fund's Statement of Additional Information ("SAI") provides additional information about the portfolio managers' compensation structure, other accounts managed by the portfolio managers and the portfolio managers' ownership of securities in the Portfolio.
VIS — The Global Infrastructure Portfolio
9
The composition of the team may change from time to time.
The Portfolio pays the Adviser a monthly advisory fee as full compensation for the services and facilities furnished to the Portfolio, and for Portfolio expenses assumed by the Adviser. The fee is based on the Portfolio's average daily net assets. For the fiscal year ended December 31, 2012, the Portfolio paid total investment advisory compensation (net of affiliated rebates, if applicable) amounting to 0.57% of the Portfolio's average daily net assets.
A discussion regarding the Board of Trustees' approval of the investment advisory agreement and the sub-advisory agreements are available in the Fund's semiannual report to shareholders for the period ended June 30, 2012.
VIS — The Global Infrastructure Portfolio
10
Shareholder Information
PURCHASES AND SALES OF PORTFOLIO SHARES
Shares are offered on each day that the New York Stock Exchange ("NYSE") is open for business. The Portfolio offers its shares only to insurance company separate accounts that insurance companies establish to fund variable life insurance and/or variable annuity contracts. An insurance company purchases or redeems shares of the Portfolio based on, among other things, the amount of net contract premiums or purchase payments allocated to a separate account investment division, transfers to or from a separate account investment division, contract loans and repayments, contract withdrawals and surrenders, and benefit payments. The contract prospectus describes how contract owners may allocate, transfer and withdraw amounts to and from separate accounts.
The Portfolio currently does not foresee any disadvantages to variable product contract owners arising out of the fact that the Portfolio offers its shares to separate accounts of various insurance companies that offer variable life insurance and/or variable annuity products. Nevertheless, the Board of Trustees that oversees the Portfolio intends to monitor events to identify any material irreconcilable conflicts that may arise due to these arrangements and to determine what action, if any, should be taken in response.
If the Adviser determines that it is in the best interest of the Portfolio not to pay redemption proceeds in cash, and subject to applicable agreements with life insurance companies and other qualified investors, the Portfolio may pay a portion or all of a redemption by distributing securities held by the Portfolio. Such in-kind securities may be illiquid and difficult or impossible for a shareholder to sell at a time and at a price that a shareholder would like. In addition, shareholders receiving distributions in-kind may incur brokerage costs when subsequently selling shares of those securities.
FREQUENT PURCHASES AND REDEMPTIONS OF SHARES
Frequent purchases and redemptions of shares pursuant to the instructions of insurance company contract owners are referred to as "market-timing" or "short-term trading" and may present risks for other contract owners with long-term interests in the Portfolio, which may include, among other things, dilution in the value of Portfolio shares indirectly held by contract owners with long-term interests in the Portfolio, interference with the efficient management of the Portfolio, increased brokerage and administrative costs, and forcing the Portfolio to hold excess levels of cash.
In addition, the Portfolio is subject to the risk that market-timers and/or short-term traders may take advantage of time zone differences between the foreign markets on which the Portfolio's securities trade and the time the Portfolio's net asset value is calculated ("time-zone arbitrage"). For example, a market-timer may submit instructions for the purchase of shares of the Portfolio based on events occurring after foreign market closing prices are established, but before the Portfolio's net asset value calculation, that are likely to result in higher prices in foreign markets the following day. The market-timer would submit instructions to redeem the Portfolio's shares the next day, when the Portfolio's share price would reflect the increased prices in foreign markets for a quick profit at the expense of contract owners or participants with long-term interests in the Portfolio.
Investments in other types of securities also may be susceptible to short-term trading strategies. These investments include securities that are, among other things, thinly traded, traded infrequently, or relatively illiquid, which have the risk that the current market price for the securities may not accurately reflect current market values. A contract owner may seek to engage in short-term trading to take advantage of these pricing differences (referred to as "price-arbitrage"). Investments in certain fixed-income securities, such as junk bonds, may be adversely affected by price arbitrage trading strategies.
The Portfolio's policies with respect to valuing portfolio securities are described below in the "Pricing Portfolio Shares" section.
The Fund's Board of Trustees has adopted policies and procedures to discourage frequent purchases and redemptions of Portfolio shares by Portfolio shareholders. Insurance companies generally do not provide specific contract owner transaction instructions to the Portfolio on an ongoing basis. Therefore, to some extent, the Portfolio relies on the insurance companies to monitor frequent short-term trading by contract owners. However, the Portfolio or the Distributor has entered into
VIS — The Global Infrastructure Portfolio
11
agreements with insurance companies whereby the insurance companies are required to provide certain contract owner identification and transaction information upon the Portfolio's request. The Portfolio may use this information to help identify and prevent market-timing activity in the Portfolio. There can be no assurance that the Portfolio will be able to identify or prevent all market-timing activity.
If the Portfolio identifies suspected market-timing activity, the insurance company will be contacted and asked to take steps to prevent further market-timing activity (e.g., sending warning letters or blocking frequent trading by underlying contract owners). Insurance companies may be prohibited by the terms of the underlying insurance contract from restricting short-term trading of mutual fund shares by contract owners, thereby limiting the ability of such insurance company to implement remedial steps to prevent market-timing activity in the Portfolio. If the insurance company is unwilling or unable to take remedial steps to discourage or prevent frequent trading, or does not take action promptly, certain contract owners may be able to engage in frequent trading to the detriment of contract owners with long-term interests in the Portfolio. If the insurance company refuses to take remedial action, or takes action that the Portfolio deems insufficient, a determination will be made whether it is appropriate to terminate the relationship with such insurance company.
PRICING PORTFOLIO SHARES
The price of Portfolio shares, called "net asset value," is based on the value of its portfolio securities.
The net asset value per share of the Portfolio is calculated once daily at the NYSE close (normally 4:00 p.m. Eastern time) on each day that the NYSE is open. Shares will not be priced on days that the NYSE is closed.
The value of the Portfolio's securities is based on the securities' market price when available. When a market price is not readily available, including circumstances under which the Adviser and/or Sub-Advisers determine that a security's market price is not accurate, a portfolio security is valued at its fair value, as determined under procedures established by the Fund's Board of Trustees.
In addition, with respect to securities that primarily are listed on foreign exchanges, when an event occurs after the close of such exchanges that is likely to have changed the value of the securities (e.g., a percentage change in value of one or more U.S. securities indices in excess of specified thresholds), such securities will be valued at their fair value, as determined under procedures established by the Fund's Board of Trustees. Securities also may be fair valued in the event of a significant development affecting a country or region or an issuer-specific development, which is likely to have changed the value of the security. In these cases, the Portfolio's net asset value will reflect certain portfolio securities' fair value rather than their market price. Fair value pricing involves subjective judgment and it is possible that the fair value determined for a security is materially different than the value that could be realized upon the sale of that security. With respect to securities that are primarily listed on foreign exchanges, the value of the Portfolio's securities may change on days when shareholders will not be able to purchase or sell their shares.
To the extent the Portfolio invests in open-end management companies that are registered under the Investment Company Act of 1940, as amended (the "Investment Company Act"), the Portfolio's net asset value is calculated based upon the net asset value of such funds. The prospectuses for such funds explain the circumstances under which they will use fair value pricing and its effects.
An exception to the general policy of using market prices concerns the Portfolio's short-term debt portfolio securities. Debt securities with remaining maturities of 60 days or less at the time of purchase are valued at amortized cost. However, if the cost does not reflect the securities' market value, these securities will be valued at their fair value.
PLAN OF DISTRIBUTION
The Fund has adopted a Plan of Distribution for the Portfolio in accordance with Rule 12b-1 under the Investment Company Act. Class Y shares are subject to a distribution (12b-1) fee of 0.25% of the average daily net assets of the Class. The Plan allows
VIS — The Global Infrastructure Portfolio
12
Class Y shares of the Portfolio to bear distribution fees in connection with the sale and distribution of Class Y shares. It also allows the Portfolio to pay for services to Class Y shareholders. Because these fees are paid out of the assets of the Portfolio's Class Y shares on an ongoing basis, over time these fees will increase the cost of your investment and may cost you more than paying other types of sales charges.
DISTRIBUTIONS
The Portfolio passes substantially all of its earnings from income and capital gains along to its investors as "distributions." The Portfolio earns income from stocks and interest from fixed-income investments. These amounts are passed along to the Portfolio shareholders as "income dividend distributions." The Portfolio realizes capital gains whenever it sells securities for a higher price than it paid for them. These amounts may be passed along as "capital gains distributions."
Dividends from net investment income and capital gains distributions, if any, are declared and paid at least once per year.
TAX CONSEQUENCES
For information concerning the federal income tax consequences to holders of the underlying variable annuity or variable life insurance contracts, see the accompanying contract prospectus.
PORTFOLIO HOLDINGS INFORMATION
A description of the Fund's policies and procedures with respect to the disclosure of the Portfolio's securities is available in the Fund's SAI.
ADDITIONAL INFORMATION
The Adviser, Sub-Advisers and/or Distributor may pay compensation (out of their own funds and not as an expense of the Portfolio) to certain affiliated or unaffiliated broker-dealers or other financial intermediaries or service providers, including insurance companies and their affiliates, in connection with the sale, distribution, marketing or retention of Portfolio shares and/or shareholder servicing. Such compensation may be significant in amount and the prospect of receiving any such additional compensation may provide such affiliated or unaffiliated entities with an incentive to favor sales of shares of the Portfolio over other investment options. Any such payments will not change the net asset value or the price of the Portfolio's shares. For more information, please see the Fund's SAI.
VIS — The Global Infrastructure Portfolio
13
The financial highlights table is intended to help you understand the financial performance of the Portfolio's Class Y shares for the periods indicated. Certain information reflects financial results for a single Portfolio share throughout each period. The total returns in the table represent the rate an investor would have earned or lost on an investment in the Portfolio (assuming reinvestment of all dividends and distributions). The ratio of expenses to average net assets listed in the table below is based on the average net assets of the Portfolio for each of the periods listed in the table. To the extent that the Portfolio's average net assets decrease over the Portfolio's next fiscal year, such expense ratios can be expected to increase, potentially significantly, because certain fixed costs will be spread over a smaller amount of assets.
The information for the years ended December 31, 2012 and December 31, 2011 has been audited by Ernst & Young LLP, an independent registered public accounting firm, whose report, along with the Portfolio's financial statements, are incorporated by reference in the SAI from the Fund's annual report, which is available upon request. The financial highlights for each of the years in the three-year period ended December 31, 2010 have been audited by another independent registered public accounting firm.
Further information about the performance of the Portfolio is contained in its annual report and semiannual report to shareholders. See the accompanying contract prospectus for either the variable annuity or the variable life contract issued by your insurance company for a description of charges which are applicable thereto. These charges are not reflected in the financial highlights below. Inclusion of any of these charges would reduce the total return figures for all periods shown.
For the Year Ended December 31, | | 2012 | | 2011 | | 2010^ | | 2009^ | | 2008^ | |
Selected Per Share Data: | |
Net asset value beginning of period | | $ | 8.69 | | | $ | 8.10 | | | $ | 8.64 | | | $ | 11.27 | | | $ | 20.65 | | |
Net investment income(a) | | | 0.20 | | | | 0.19 | | | | 0.19 | | | | 0.28 | | | | 0.35 | | |
Net realized and unrealized gain (loss) | | | 1.29 | | | | 1.06 | | | | 0.19 | | | | 1.15 | | | | (6.20 | ) | |
Total from investment operations | | | 1.49 | | | | 1.25 | | | | 0.38 | | | | 1.43 | | | | (5.85 | ) | |
Dividends to shareholders | | | (0.20 | ) | | | (0.20 | ) | | | (0.23 | ) | | | (0.35 | ) | | | (0.09 | ) | |
Distributions to shareholders | | | (0.82 | ) | | | (0.46 | ) | | | (0.69 | ) | | | (3.71 | ) | | | (3.44 | ) | |
Total dividends and distributions | | | (1.02 | ) | | | (0.66 | ) | | | (0.92 | ) | | | (4.06 | ) | | | (3.53 | ) | |
Net asset value end of period | | $ | 9.16 | | | $ | 8.69 | | | $ | 8.10 | | | $ | 8.64 | | | $ | 11.27 | | |
Total Return(b) | | | 18.44 | % | | | 15.82 | % | | | 6.74 | % | | | 18.83 | % | | | (33.45 | )% | |
Ratio to Average Net Assets:(c) | |
Expenses | | | 1.12 | %(d) | | | 1.11 | %(d) | | | 1.12 | %(d) | | | 1.21 | %(d) | | | 0.99 | %(d) | |
Net investment income | | | 2.26 | %(d) | | | 2.23 | %(d) | | | 2.46 | %(d) | | | 3.12 | %(d) | | | 2.21 | %(d) | |
Rebate from Morgan Stanley affiliate | | | 0.00 | %(e) | | | 0.00 | %(e) | | | 0.00 | %(e) | | | 0.00 | %(e) | | | 0.00 | %(e) | |
Supplemental Data: | |
Net assets end of period (000's) | | $ | 14,506 | | | $ | 14,472 | | | $ | 15,789 | | | $ | 17,818 | | | $ | 16,545 | | |
Portfolio turnover rate | | | 28 | % | | | 36 | % | | | 148 | % | | | 280 | % | | | 76 | % | |
^ Beginning with the year ended December 31, 2011, the Fund was audited by Ernst & Young LLP. The previous years were audited by another independent registered public accounting firm.
(a) The per share amounts were computed using an average number of shares outstanding during the period.
(b) Calculated based on the net asset value as of the last business day of the period. Performance shown does not reflect fees and expenses imposed by your insurance company. If performance information included the effect of these additional charges, the total returns would be lower.
(c) Reflects overall Portfolio ratios for investment income and non-class specific expenses.
(d) The ratios reflect the rebate of certain Portfolio expenses in connection with investments in a Morgan Stanley affiliate during the period. The effect of the rebate on the ratios is disclosed in the above table as "Rebate from Morgan Stanley affiliate."
(e) Amount is less than 0.005%.
VIS — The Global Infrastructure Portfolio
14
(This page has been left blank intentionally.)
(This page has been left blank intentionally.)
Morgan Stanley Variable Investment Series

ADDITIONAL INFORMATION ABOUT THE PORTFOLIO'S INVESTMENTS is available in the Fund's Annual and Semiannual Reports to Shareholders. In the Fund's Annual Report, you will find a discussion of the market conditions and investment strategies that significantly affected the Portfolio's performance during its last fiscal year. The Fund's Statement of Additional Information also provides additional information about the Portfolio. The Statement of Additional Information is incorporated herein by reference (legally is part of this Prospectus). For a free copy of the Fund's Annual Report, Semiannual Report or Statement of Additional Information, to request information about the Portfolio or to make shareholder inquiries, please call toll-free (800) 869-NEWS. Free copies of these documents are also available from our Internet site at: www.morganstanley.com/im.

YOU ALSO MAY OBTAIN INFORMATION ABOUT THE FUND BY CALLING your Morgan Stanley Financial Advisor or by visiting our Internet site.

INFORMATION ABOUT THE FUND (including the Statement of Additional Information) can be viewed and copied at the SEC Public Reference Room in Washington, D.C. Information on the operation of the Public Reference Room may be obtained by calling the SEC at (202) 551-8090. Reports and other information about the Fund and the Portfolio are available on the EDGAR Database on the SEC's Internet site at: http://www.sec.gov, and copies of this information may be obtained, after paying a duplicating fee, by electronic request at the following E-mail address: publicinfo@sec.gov, or by writing to the SEC's Public Reference Section, Washington, D.C. 20549-1520.
(THE FUND'S INVESTMENT COMPANY ACT FILE NO. IS 811-3692)
MORGAN STANLEY
VARIABLE INVESTMENT SERIES
Annual Report
DECEMBER 31, 2012
The Portfolios are intended to be the funding vehicle for variable annuity contracts and variable life insurance policies offered by the separate accounts of certain life insurance companies.
Morgan Stanley Variable Investment Series
Table of Contents
Letter to the Shareholders | | | 1 | | |
| Expense Examples | | | 19 | | |
Portfolios of Investments: | |
| Money Market | | | 23 | | |
| Limited Duration | | | 27 | | |
| Income Plus | | | 35 | | |
| Global Infrastructure | | | 46 | | |
| European Equity | | | 49 | | |
| Multi Cap Growth | | | 52 | | |
| Aggressive Equity | | | 55 | | |
| Strategist | | | 58 | | |
Financial Statements: | |
| Statements of Assets and Liabilities | | | 68 | | |
| Statements of Operations | | | 70 | | |
| Statements of Changes in Net Assets | | | 72 | | |
| Notes to Financial Statements | | | 80 | | |
| Financial Highlights | | | 110 | | |
| Report of Independent Registered Public Accounting Firm | | | 118 | | |
| Trustee and Officer Information | | | 119 | | |
| Federal Tax Notice | | | 124 | | |
Morgan Stanley Variable Investment Series
Letter to the Shareholders n December 31, 2012 (unaudited)
Dear Shareholder:
In 2012, policy was a dominant theme driving global financial markets. Expectations and disappointments regarding the European Union initiatives addressing the credit crisis, the debate over the "fiscal cliff" in the U.S. Congress, and monetary easing from the U.S. Federal Reserve (the Fed), European Central Bank (ECB), Bank of Japan and other central banks contributed to volatility in the global markets throughout the year. Ultimately, the liquidity provided by the central banks and the reduced risk of financial crisis in Europe helped risk assets outperform relatively safer asset classes, despite some looming macroeconomic uncertainties.
Domestic Equity Overview
U.S. stocks, as measured by the S&P 500® Index, were up 16% for the year ended December 31, 2012. Gross domestic product (GDP) growth remained lackluster, registering 2.0% in the first quarter of 2012, 1.3% in the second quarter, and 3.1% in the third quarter. (Fourth quarter GDP estimates were not released at the time of this writing.) Unemployment declined during the period, but remained uncomfortably elevated. The housing market began to show signs of stabilization. Corporate profits continued to be surprisingly robust, although many expect that the strength has run its course. The Federal Open Market Committee enacted a number of measures intended to support the economy, including a third round of quantitative easing, extending its timeline for keeping the federal funds target rate near zero, and announcing late in the year that it would keep the rate low until unemployment reached 6.5% so long as the central bank's inflation projections stayed below 2.5%.
Stocks began the year on a relatively high note but investor sentiment deteriorated in the spring amid weaker economic data and renewed risks in the euro zone. The market turned positive in the summer on expectations of further stimulative actions from the Fed and additional measures from the European Central Bank to bolster the financial system. Later in the year, uncertainties about the fiscal cliff drove stocks lower as lawmakers debated until the very last hours of the deadline before coming to an agreement.
Fixed Income Overview
As in other asset classes during the review period, riskier segments of the fixed income market delivered stronger relative performance as investors grew more confident about global economic conditions and the European debt crisis. Emerging market debt and U.S. corporate debt outperformed "safe haven" Treasury securities.
Emerging market debt began the year on a positive note but trended lower in the second quarter amid rising risk premiums in Europe and weaker economic data in China. However, losses were recovered in the
Morgan Stanley Variable Investment Series
Letter to the Shareholders n December 31, 2012 (unaudited) continued
third and fourth quarters, as investor sentiment was more optimistic regarding global growth prospects and the lower probability of Greece exiting the European Union. New issuance and fund flows both increased during 2012 from 2011 levels, further supporting the asset class.
Within the U.S. corporate sector, investment-grade debt performed very well, led by the financials sector. Investment-grade corporate spreads ended the year almost 100 basis points tighter, while financials spreads were 185 basis points tighter. High-yield corporate spreads narrowed by 180 basis points.
Mortgage-backed securities also performed well during the year. The Fed's quantitative easing announcement in September, focused on mortgages, led to a substantial tightening in lower coupon fixed rate mortgage spreads. Despite historically low mortgage rates, refinancing activity had been slower than it has been in the past under similar rate incentives, although with further quantitative easing, there has been an increase in mortgage refinancing.
The intermediate part of the U.S. Treasury yield curve performed the best as 10-year yields declined by 14 basis points. The 10-year Treasury yield reached an all time low of 1.47% at the beginning of June. Two-year yields were unchanged, whereas 30-year yields rose by 11 basis points.
Money market yields continued to be constrained by the Fed's near-zero interest rate policy. Even with the Fed now tying its interest policy to unemployment and inflation rates, rather than a date (previously expected to be 2015 or later), observers believe the near-zero rates are likely to continue beyond 2015.
International Equity Overview
International equity markets performed well in the 12 months ended December 31, 2012, with emerging market equities outpacing developed market equities and, among developed markets, Europe leading the U.S. and Japan.
In Europe, despite a double-dip recession with GDP growth and earnings estimates being revised downward during the course of the year, equity markets performed strongly. Market turbulence in the spring was driven by renewed concerns about Greece and Spain. However, markets rallied following ECB President Mario Draghi's pledge in July to preserve the euro no matter what and an announcement in September for a program of unlimited support for countries that agree to certain reforms. In essence, the ECB now provides a back-stop against further credit stress in the region. This helped bond yields among the most indebted European nations decline considerably. European Union finance ministers also appeared to make progress toward a single banking union.
2
Morgan Stanley Variable Investment Series
Letter to the Shareholders n December 31, 2012 (unaudited) continued
Japan's equity market began the year on strong footing, but slumped for most of the remainder of the year amid concerns about slowing exports to Europe and China. However, a sharply lower yen, which benefits exporting companies, and the election of the Liberal Democratic Party and its promises of reflation led Japanese stocks to rally dramatically in the final months of 2012.
As with other global risk assets, emerging market stocks were volatile throughout the year in response to global growth concerns and the European debt crisis. However, in the second half of the year, emerging market equities advanced strongly due to the weaker yen (which prompts investors to seek relatively higher yielding assets elsewhere), improved manufacturing data from China, and the reduced risk of a financial crisis in Europe.
Money Market Portfolio
An investment in a money market fund is not insured or guaranteed by the Federal Deposit Insurance Corporation or any other government agency. Although money market funds seek to preserve the value of an investment at $1.00 per share, it is possible to lose money by investing in such funds.
As of December 31, 2012, Variable Investment Series – Money Market Portfolio had net assets of approximately $91 million with an average portfolio maturity of 31 days. For the seven-day period ended December 31, 2012, the Portfolio's Class X shares provided an effective annualized yield of 0.01% (subsidized) and – 0.47% (non-subsidized) and a current yield of 0.01% (subsidized) and – 0.47% (non-subsidized), while its 30-day moving average yield for December 31, 2012 was 0.01% (subsidized) and – 0.42% (non-subsidized). Yield quotations more closely reflect the current earnings of the Portfolio. The non-subsidized yield reflects what the yield would have been had a fee and/or expense waiver not been in place during the period shown. For the 12-month period ended December 31, 2012, the Portfolio's Class X shares returned 0.01%. Past performance is no guarantee of future results.
For the seven-day period ended December 31, 2012, the Portfolio's Class Y shares provided an effective annualized yield of 0.01% (subsidized) and – 0.71% (non-subsidized) and a current yield of 0.01% (subsidized) and – 0.71% (non-subsidized), while its 30-day moving average yield for December 31, 2012 was 0.01% (subsidized) and – 0.66% (non-subsidized). Yield quotations more closely reflect the current earnings of the Portfolio. The non-subsidized yield reflects what the yield would have been had a fee and/or expense waiver not been in place during the period shown. For the 12-month period ended December 31, 2012, the Portfolio's Class Y shares returned 0.01%. Past performance is no guarantee of future results.
The performance of the Portfolio's two share classes varies because each has different expenses. The Portfolio's total returns assume the reinvestment of all distributions but do not reflect the deduction of any charges by your
3
Morgan Stanley Variable Investment Series
Letter to the Shareholders n December 31, 2012 (unaudited) continued
insurance company. Such costs would lower performance.
We continued to remain cautious in our investment approach, focusing on securities with high liquidity and short durations. We believe this approach, together with our investment process, has put us in a favorable position to respond to market uncertainty.
During the period, we sought to purchase high-quality fixed and floating rate paper, while maintaining our conservative liquidity metrics. Our management strategy for the Portfolio remained consistent with our long-term focus on capital preservation and high liquidity.
There is no guarantee that any sectors mentioned will continue to perform as discussed above or that securities in such sectors will be held by the Portfolio in the future.
Limited Duration Portfolio
For the 12-month period ended December 31, 2012, Variable Investment Series – Limited Duration Portfolio Class X shares produced a total return of 3.34%, outperforming the Barclays Capital U.S. Government/Credit Index (1-5 Year) (the "Index"), which returned 2.24%. For the same period, the Portfolio's Class Y shares returned 3.05%. Past performance is no guarantee of future results.
The performance of the Portfolio's two share classes varies because each has different expenses. The Portfolio's total returns assume the reinvestment of all
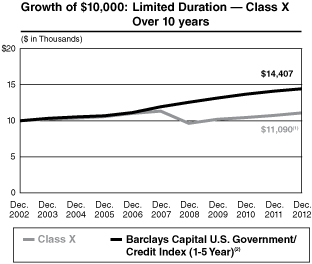
Performance data quoted represents past performance, which is no guarantee of future results and current performance may be lower or higher than the figures shown. For most recent month-end performance figures, please contact the issuing insurance company or speak with your Financial Advisor. Investment return and principal value will fluctuate. When you sell Portfolio shares, they may be worth less than their original cost. Total returns do not reflect the deduction of taxes that a shareholder would pay on Portfolio distributions or the redemption of Portfolio shares. Performance for Class Y shares will vary from the performance of Class X shares due to differences in expenses. Performance assumes reinvestment of all distributions for the underlying portfolio based on net asset value (NAV). It does not reflect the deduction of insurance expenses, an annual contract maintenance fee, or surrender charges. If performance information included the effect of these additional charges, the total returns would be lower.
Average Annual Total Returns as of December 31, 2012
| | | 1 Year | | 5 Years | | 10 Years | | Since Inception* | |
Class X | | | 3.34 | % | | | –0.44 | % | | | 1.04 | % | | | 2.07 | % | |
Class Y | | | 3.05 | % | | | –0.69 | % | | | 0.79 | % | | | 1.74 | % | |
(1) Ending value on December 31, 2012 for the underlying portfolio. This figure does not reflect the deduction of any account fees or sales charges.
(2) The Barclays Capital U.S. Government/Credit Index (1-5 Year) tracks the performance of U.S. government and corporate obligations, including U.S. government agency and Treasury securities, and corporate and Yankee bonds with maturities of one to five years. The Index is unmanaged and its returns do not include any sales charges or fees. Such costs would lower performance. It is not possible to invest directly in an index.
* Inception dates of May 4, 1999 for Class X and June 5, 2000 for Class Y.
4
Morgan Stanley Variable Investment Series
Letter to the Shareholders n December 31, 2012 (unaudited) continued
distributions but do not reflect the deduction of any charges by your insurance company. Such costs would lower performance.
The Portfolio's overweight to the investment-grade credit sector was the main driver of performance as spread sectors posted very strong performance in 2012. The riskier segments of the market performed the best. In particular, an overweight to financials helped, as it was the best performing corporate sector. Spreads over Treasuries of short maturity financials narrowed by 185 basis points, while short maturity corporate spreads overall tightened by 110 basis points over the year.
An allocation to short-maturity, high-quality asset-backed securities also helped performance.
Conversely, the Portfolio was underweight in the agency sector, which detracted slightly from relative performance as spreads tightened over the period.
There is no guarantee that any sectors mentioned will continue to perform as discussed above or that securities in such sectors will be held by the Portfolio in the future.
5
Morgan Stanley Variable Investment Series
Letter to the Shareholders n December 31, 2012 (unaudited) continued
Income Plus Portfolio
For the 12-month period ended December 31, 2012, Variable Investment Series – Income Plus Portfolio Class X shares produced a total return of 14.09%, outperforming the Barclays Capital U.S. Corporate Index (the "Index"), which returned 9.82%. For the same period, the Portfolio's Class Y shares returned 13.82%. Past performance is no guarantee of future results.
The performance of the Portfolio's two share classes varies because each has different expenses. The Portfolio's total returns assume the reinvestment of all distributions but do not reflect the deduction of any charges by your insurance company. Such costs would lower performance.
The Portfolio entered 2012 overweight investment grade corporate bonds as well as exposure to high yield corporate bonds and convertible bonds. These positions were designed to attempt to benefit from a normalization of credit spreads, which we believed would be driven by supportive global monetary policy and a continued modest U.S. economic recovery. Our expectations were realized as global monetary policy helped lower volatility and depress government yields. Investors flocked towards riskier asset classes, including corporate bonds, which had an exceptionally strong year.
Financial sector corporate bonds, which remain one of the Portfolio's largest overweights, responded especially strongly to the "risk-on" environment, wherein traders strongly favored riskier asset classes, in 2012. In addition to supportive central
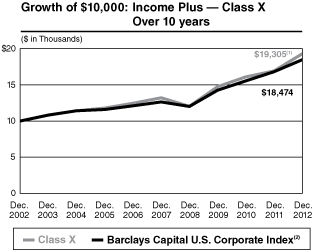
Performance data quoted represents past performance, which is no guarantee of future results and current performance may be lower or higher than the figures shown. For most recent month-end performance figures, please contact the issuing insurance company or speak with your Financial Advisor. Investment return and principal value will fluctuate. When you sell Portfolio shares, they may be worth less than their original cost. Total returns do not reflect the deduction of taxes that a shareholder would pay on Portfolio distributions or the redemption of Portfolio shares. Performance for Class Y shares will vary from the performance of Class X shares due to differences in expenses. Performance assumes reinvestment of all distributions for the underlying portfolio based on net asset value (NAV). It does not reflect the deduction of insurance expenses, an annual contract maintenance fee, or surrender charges. If performance information included the effect of these additional charges, the total returns would be lower.
Average Annual Total Returns as of December 31, 2012
| | | 1 Year | | 5 Years | | 10 Years | | Since Inception* | |
Class X | | | 14.09 | % | | | 7.89 | % | | | 6.80 | % | | | 7.52 | % | |
Class Y | | | 13.82 | % | | | 7.63 | % | | | 6.53 | % | | | 7.02 | % | |
(1) Ending value on December 31, 2012 for the underlying portfolio. This figure does not reflect the deduction of any account fees or sales charges.
(2) The Barclays Capital U.S. Corporate Index covers U.S. dollar-denominated, investment-grade, fixed rate, taxable securities sold by industrial, utility and financial issuers. It includes publicly issued U.S. corporate and foreign debentures and secured notes that meet specified maturity, liquidity and quality requirements. The Index is unmanaged and its returns do not include any sales charges or fees. Such costs would lower performance. It is not possible to invest directly in an index.
* Inception dates of March 1, 1987 for Class X and June 5, 2000 for Class Y.
6
Morgan Stanley Variable Investment Series
Letter to the Shareholders n December 31, 2012 (unaudited) continued
bank policies, financial credits benefited from the ongoing recovery, continuing emphasis on regulation and low supply. High yield bonds held in the Portfolio also performed well in 2012. However, underweights to selected non-financial corporate sectors, such as health care and pharmaceuticals, detracted from relative performance during the period as spreads in these sectors also tightened relative to Treasuries.
Looking ahead to 2013, we believe corporate bonds are likely to continue to be supported by investor demand for assets with positive real yields, accommodative central bank policies, and an improving economy. In particular, in our opinion, the Portfolio's overweight to financial credits and opportunistic exposure to high yield bonds have the potential to perform well in 2013.
There is no guarantee that any sectors mentioned will continue to perform as discussed above or that securities in such sectors will be held by the Portfolio in the future.
7
Morgan Stanley Variable Investment Series
Letter to the Shareholders n December 31, 2012 (unaudited) continued
Global Infrastructure Portfolio
For the 12-month period ended December 31, 2012, Variable Investment Series – Global Infrastructure Portfolio Class X shares produced a total return of 18.69%, outperforming the Dow Jones Brookfield Global Infrastructure IndexSM (the "Index"), which returned 16.01%, and the S&P Global BMI Index, which returned 17.15%. For the same period, the Portfolio's Class Y shares returned 18.44%. Past performance is no guarantee of future results.
The performance of the Portfolio's two share classes varies because each has different expenses. The Portfolio's total returns assume the reinvestment of all distributions but do not reflect the deduction of any charges by your insurance company. Such costs would lower performance.
Infrastructure shares appreciated 16.01% during 2012, as measured by the Index. Among the major infrastructure sectors, the communications and European regulated utilities sectors exhibited relative outperformance, while the transmission and distribution, gas midstream, gas distribution utilities, and pipeline companies sectors underperformed the Index. Toll roads performed largely in line with the Index for the year. Among the smaller sectors, the airports, water, ports, and diversified sectors all outperformed the Index.
For full-year 2012, the Portfolio realized favorable performance from both bottom-up stock selection and top-down allocation, with bottom-up stock selection being the more significant driver of outperformance, as in past years. From a bottom-up
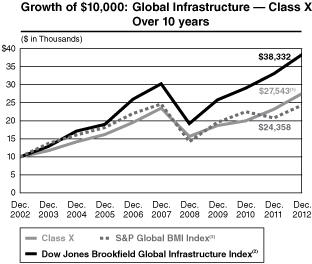
Performance data quoted represents past performance, which is no guarantee of future results and current performance may be lower or higher than the figures shown. For most recent month-end performance figures, please contact the issuing insurance company or speak with your Financial Advisor. Investment return and principal value will fluctuate. When you sell Portfolio shares, they may be worth less than their original cost. Total returns do not reflect the deduction of taxes that a shareholder would pay on Portfolio distributions or the redemption of Portfolio shares. Performance for Class Y shares will vary from the performance of Class X shares due to differences in expenses. Performance assumes reinvestment of all distributions for the underlying portfolio based on net asset value (NAV). It does not reflect the deduction of insurance expenses, an annual contract maintenance fee, or surrender charges. If performance information included the effect of these additional charges, the total returns would be lower.
Average Annual Total Returns as of December 31, 2012
| | | 1 Year | | 5 Years | | 10 Years | | Since Inception* | |
Class X | | | 18.69 | % | | | 3.23 | % | | | 10.66 | % | | | 8.18 | % | |
Class Y | | | 18.44 | % | | | 2.98 | % | | | 10.40 | % | | | 3.61 | % | |
(1) Ending value on December 31, 2012 for the underlying portfolio. This figure does not reflect the deduction of any account fees or sales charges.
(2) Dow Jones Brookfield Global Infrastructure IndexSM is a float-adjusted market capitalization weighted index that measures the stock performance of companies that exhibit strong infrastructure characteristics. The Index intends to measure all sectors of the infrastructure market. The Index was first published in July 2008; however, back-tested hypothetical performance information is available for this Index since December 31, 2002. Returns are calculated using the return data of the S&P Global BMI Index through December 31, 2002 and the return data of the Dow Jones Brookfield Global Infrastructure Index for periods thereafter. The Index is unmanaged and its returns do not include any sales charges or fees. Such costs would lower performance. It is not possible to invest directly in an index.
(3) The Standard & Poor's Global BMI Index (S&P Global BMI Index) is a broad market index designed to capture exposure to equities in all countries in the world that meet minimum size and liquidity requirements. As of the date of this Report, there are approximately 11,000 index members representing 26 developed and 20 emerging market countries. The Index is unmanaged and its returns do not include any sales charges or fees. Such costs would lower performance. It is not possible to invest directly in an index.
* Inception dates of March 1, 1990 for Class X and June 5, 2000 for Class Y.
8
Morgan Stanley Variable Investment Series
Letter to the Shareholders n December 31, 2012 (unaudited) continued
perspective, stock selection was particularly favorable in the gas distribution utilities, communications, transmission and distribution, toll roads, and European regulated utilities sectors, only partially offset by adverse selection in the pipeline companies and gas midstream sectors. From a top-down perspective, our positioning was favorable or largely neutral in all sectors except for the negative impact of our cash holdings and an underweight to the water sector.
We attribute 2012 sector outperformance or underperformance within the infrastructure universe to a combination of macroeconomic and company/sector-specific considerations. On the macroeconomic front, we attribute the strong performance of European regulated utilities and toll roads largely to declining sovereign yields and lower perceived event risk in continental Europe, which has lowered the current market-derived cost of capital to levels closer to the medium- to longer-term levels appropriate for the asset class. In the U.S., we attribute the underperformance of transmission and distribution, gas distribution utilities, and pipeline companies to concerns over dividend and investment tax policies (debated during U.S. fiscal cliff negotiations), as well as to the potential for declining regulated returns resulting from low North American bond rates. These sectors, in our opinion, were also largely unfavorable from a valuation perspective.
With regard to company/sector fundamentals regionally, European regulated utilities benefited from increased/improved visibility in connection with several regulatory initiatives. In Asia, gas distribution utilities in China continued to benefit from strong demand for natural gas, as industrial customers looked to lower their cost structures and the central government attempted to reign in pollution created by the significant use of coal-fired power generation. In the U.S., we attribute the outperformance of the communications sector to the ongoing demand by telecommunications providers for wireless towers in order to meet the demands of customers using data-driven devices like smartphones and tablets. Also in North America, we attribute the underperformance of the gas midstream sector to concerns over excess natural gas and natural gas liquids (NGL) supply and the resultant impact on drilling patterns of exploration and production company customers as natural gas prices remain low and NGL prices declined from historical averages.
We remain committed to our core investment philosophy as an infrastructure value investor. As value-oriented, bottom-up driven investors, our investment perspective is that over the medium- and long-term, the key factor in determining the performance of infrastructure securities will be underlying infrastructure asset values. Given the large and growing private infrastructure market, we believe that there are limits as to the level of premium or discount at which the public sector should trade relative to its underlying private infrastructure value. These limits can be viewed as the point at which the arbitrage opportunity between
9
Morgan Stanley Variable Investment Series
Letter to the Shareholders n December 31, 2012 (unaudited) continued
owning infrastructure in the private versus public markets becomes compelling. In aiming to achieve core infrastructure exposure in a cost effective manner, we invest in equity securities of publicly listed infrastructure companies we believe offer the best value relative to their underlying infrastructure value and net asset value growth prospects. Our research currently leads us to an overweighting in the Portfolio (amongst the largest sectors) to a group of companies in the gas distribution, toll road, pipeline companies, and communications sectors, and an underweighting to companies in the gas midstream, transmission and distribution, and European regulated utilities sectors.
We started 2013, positioned largely the same from a sector perspective as we began 2012 (although some of our individual company weightings have meaningfully changed). We acknowledge that increased optimism over a potential upturn in global economic growth (as espoused by many market pundits and supported by an upturn in the equity markets witnessed in early 2013 at the time of writing) might argue for an increased weighting to GDP-growth/trade-leveraged sectors, particularly within transportation; however, we remain committed to and positive on existing positions in the Portfolio, as we believe such positions provide favorable total return potential going forward whether or not this economic upturn of the magnitude anticipated materializes. Our preference as in the past remains to find opportunities within the infrastructure universe that do not rely on meaningful improvements to economic growth, rather than relying on secular themes to drive fundamental growth or relying on a valuation gap that can be closed without a strong improvement in macroeconomic growth. While we concur in some cases with those who believe there is reason for optimism regarding the global economy over the near term, we also remain cautious due to concerns over the massive, unprecedented monetary policy being used to support current growth and the unanticipated consequences these policies might have.
There is no guarantee that any sectors mentioned will continue to perform as discussed above or that securities in such sectors will be held by the Portfolio in the future.
10
Morgan Stanley Variable Investment Series
Letter to the Shareholders n December 31, 2012 (unaudited) continued
European Equity Portfolio
For the 12-month period ended December 31, 2012, Variable Investment Series – European Equity Portfolio Class X shares produced a total return of 18.51%, underperforming the MSCI Europe Index (the "Index"), which returned 19.12%. For the same period, the Portfolio's Class Y shares returned 18.16%. Past performance is no guarantee of future results.
The performance of the Portfolio's two share classes varies because each has different expenses. The Portfolio's total returns assume the reinvestment of all distributions but do not reflect the deduction of any charges by your insurance company. Such costs would lower performance.
On an industry level, stock selection in and an overweight allocation to banks were favorable to performance. Holdings in two French banks and a U.K. bank rallied in the second half of the year following comments by ECB President Mario Draghi that he would do whatever it takes to preserve the euro. Both stock selection and an overweight allocation to software and services were additive as well. Here, a holding in a Spanish company, which is the world's leading transaction processor for the travel industry, drove gains. The stock has attractive valuations, in our view, and has demonstrated low sensitivity to the global economic cycle. Also bolstering returns were stock selection in capital goods, an overweight allocation to insurance and an underweight allocation to telecommunications.
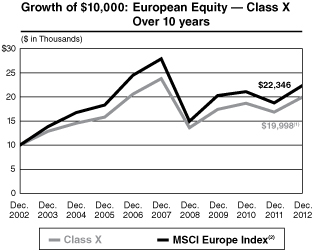
Performance data quoted represents past performance, which is no guarantee of future results and current performance may be lower or higher than the figures shown. For most recent month-end performance figures, please contact the issuing insurance company or speak with your Financial Advisor. Investment return and principal value will fluctuate. When you sell Portfolio shares, they may be worth less than their original cost. Total returns do not reflect the deduction of taxes that a shareholder would pay on Portfolio distributions or the redemption of Portfolio shares. Performance for Class Y shares will vary from the performance of Class X shares due to differences in expenses. Performance assumes reinvestment of all distributions for the underlying portfolio based on net asset value (NAV). It does not reflect the deduction of insurance expenses, an annual contract maintenance fee, or surrender charges. If performance information included the effect of these additional charges, the total returns would be lower.
Average Annual Total Returns as of December 31, 2012
| | | 1 Year | | 5 Years | | 10 Years | | Since Inception* | |
Class X | | | 18.51 | % | | | –3.42 | % | | | 7.18 | % | | | 8.56 | % | |
Class Y | | | 18.16 | % | | | –3.66 | % | | | 6.90 | % | | | 1.21 | % | |
(1) Ending value on December 31, 2012 for the underlying portfolio. This figure does not reflect the deduction of any account fees or sales charges.
(2) The Morgan Stanley Capital International (MSCI) Europe Index is a free float-adjusted market capitalization index that is designed to measure developed market equity performance in Europe. The term "free float" represents the portion of shares outstanding that are deemed to be available for purchase in the public equity markets by investors. The performance of the Index is listed in U.S. dollars and assumes reinvestment of net dividends. The Index is unmanaged and its returns do not include any sales charges or fees. Such costs would lower performance. It is not possible to invest directly in an index.
* Inception dates of March 1, 1991 for Class X and June 5, 2000 for Class Y.
11
Morgan Stanley Variable Investment Series
Letter to the Shareholders n December 31, 2012 (unaudited) continued
However, stock selection in food, beverage and tobacco and in materials was detrimental to performance, as was stock selection in and an overweight allocation to energy. Within these industries, positions that underperformed included a U.K. natural gas company that issued a profit warning when its production growth came in lower than expected, a global mining company based in the U.K. with high exposure to political risk in South Africa as well as a CEO who resigned during the year (the position was sold), and a U.K. supermarket chain that continued to lose market share (the position was sold). In addition, an underweight allocation to consumer durables and apparel hurt returns.
On a country level, key contributors to performance included stock selection in France, both stock selection in and an underweight allocation to Spain, and both stock selection in and an overweight allocation to Germany. In addition, stock selection in Finland boosted performance. The main detractors from performance included stock selection in the United Kingdom, Sweden and Switzerland.
On aggregate, recent economic data were relatively positive, especially in the second half of 2012. In the U.S., both consumer confidence and non-farm payrolls improved. In addition, housing data continued to be robust and the third quarter GDP growth rate was revised upward to 2.7% from 2.0%. In Europe, the ECB cut interests rate to a record 0.75% and economic activity appears to be stabilizing.
Despite European equities' recent strong performance, the bar for potential growth surprise in Europe is set very low. We believe the bulk of equities' advance over the past six months was explained by the re-rating of price-to-earnings multiples. Financials were the best performing sector in the second half of the year. Nevertheless, banks are still the least liked sector by sell-side analysts and investors. We remain overweight financials in the Portfolio, as we believe that the current valuations for financial stocks owned in the Portfolio remain compelling.
We believe that the positive tone in the markets is likely to continue in the near term, supported by improvement in global activity momentum. Structural adjustments in peripheral Europe are taking place. For example, for the first time in 14 years Spain's current account has moved into a surplus recently, from a deficit of €18 billion in 2008. Spanish exports have grown 6% in the past 12 months alone, ahead of Germany's.
We continue to have a positive stance on the European equity asset class. Our main reasons include the reduced "tail risks" (or, an extreme level of risk) of a financial crisis, now that the ECB has assumed the role of buyer of last resort. This appears to have broken the vicious spiral that had engulfed peripheral bond markets. Moreover, European valuations are attractive by our measures, and earnings have fallen 22% since 2011 and are 40% below the 2008 peak. By contrast, U.S. earnings are currently at all-time highs.
12
Morgan Stanley Variable Investment Series
Letter to the Shareholders n December 31, 2012 (unaudited) continued
Finally, despite strong performance in 2012, the euro zone remains out of favor with investors.
There is no guarantee that any sectors mentioned will continue to perform as discussed above or that securities in such sectors will be held by the Portfolio in the future.
Multi Cap Growth Portfolio
For the 12-month period ended December 31, 2012, Variable Investment Series – Multi Cap Growth Portfolio Class X shares produced a total return of 12.37%, underperforming the Russell 3000® Growth Index (the "Index"), which returned 15.21%. For the same period, the Portfolio's Class Y shares returned 12.09%. Past performance is no guarantee of future results.
The performance of the Portfolio's two share classes varies because each has different expenses. The Portfolio's total returns assume the reinvestment of all distributions but do not reflect the deduction of any charges by your insurance company. Such costs would lower performance.
The technology sector was the largest relative detractor during the period due to unfavorable stock selection. Exposure to an online deals provider was the most detrimental to performance within the sector. Stock selection and a slight overweight to the materials and processing sector hampered relative results. Holdings in two rare earths miners hurt performance. Stock selection in the energy sector also dampened returns, although an underweight in the sector helped slightly.
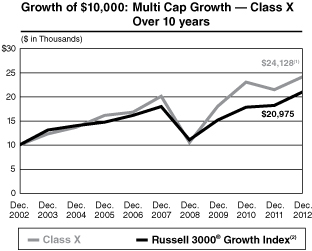
Performance data quoted represents past performance, which is no guarantee of future results and current performance may be lower or higher than the figures shown. For most recent month-end performance figures, please contact the issuing insurance company or speak with your Financial Advisor. Investment return and principal value will fluctuate. When you sell Portfolio shares, they may be worth less than their original cost. Total returns do not reflect the deduction of taxes that a shareholder would pay on Portfolio distributions or the redemption of Portfolio shares. Performance for Class Y shares will vary from the performance of Class X shares due to differences in expenses. Performance assumes reinvestment of all distributions for the underlying portfolio based on net asset value (NAV). It does not reflect the deduction of insurance expenses, an annual contract maintenance fee, or surrender charges. If performance information included the effect of these additional charges, the total returns would be lower.
Average Annual Total Returns as of December 31, 2012
| | | 1 Year | | 5 Years | | 10 Years | | Since Inception* | |
Class X | | | 12.37 | % | | | 3.74 | % | | | 9.21 | % | | | 10.77 | % | |
Class Y | | | 12.09 | % | | | 3.48 | % | | | 8.94 | % | | | 2.08 | % | |
(1) Ending value on December 31, 2012 for the underlying portfolio. This figure does not reflect the deduction of any account fees or sales charges.
(2) The Russell 3000® Growth Index measures the performance of the broad growth segment of the U.S. equity universe. It includes those Russell 3000® Index companies with higher price-to-book ratios and higher forecasted growth values. The Russell 3000® Index measures the performance of the largest 3000 U.S. companies representing approximately 98% of the investable U.S. equity market. The Index is unmanaged and its returns do not include any sales charges or fees. Such costs would lower performance. It is not possible to invest directly in an index.
* Inception dates of March 9, 1984 for Class X and June 5, 2000 for Class Y.
13
Morgan Stanley Variable Investment Series
Letter to the Shareholders n December 31, 2012 (unaudited) continued
Positive contributions came from stock selection in health care, where all three of the Portfolio's holdings performed well. An underweight in the consumer staples sector was also beneficial to relative returns. Stock selection in the consumer discretionary sector was another area of strength, despite the modestly dampening effect of the Portfolio's underweight in the sector. Within the sector, gains were led by a holding in an online retailer.
There is no guarantee that any sectors mentioned will continue to perform as discussed above or that securities in such sectors will be held by the Portfolio in the future.
14
Morgan Stanley Variable Investment Series
Letter to the Shareholders n December 31, 2012 (unaudited) continued
Aggressive Equity Portfolio
For the 12-month period ended December 31, 2012, Variable Investment Series – Aggressive Equity Portfolio Class X shares produced a total return of 11.85%, underperforming the Russell 3000® Growth Index (the "Index"), which returned 15.21%. For the same period, the Portfolio's Class Y shares returned 11.62%. Past performance is no guarantee of future results.
The performance of the Portfolio's two share classes varies because each has different expenses. The Portfolio's total returns assume the reinvestment of all distributions but do not reflect the deduction of any charges by your insurance company. Such costs would lower performance.
The technology sector was the largest relative detractor during the period due to unfavorable stock selection. Exposure to an online deals provider was the most detrimental to performance within the sector. Stock selection and a slight overweight to the materials and processing sector hampered relative results. Holdings in two rare earths miners hurt performance. Stock selection in the energy sector also dampened returns, although an underweight in the sector helped slightly.
Positive contributions came from stock selection in health care, where all of the Portfolio's holdings performed well. An underweight in the consumer staples sector was also beneficial to relative returns. Stock selection in the consumer discretionary sector was another area of strength, despite the modestly dampening effect of the Portfolio's underweight in
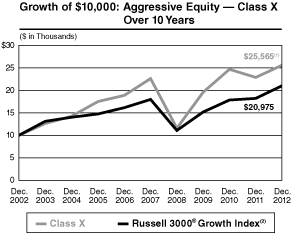
Performance data quoted represents past performance, which is no guarantee of future results and current performance may be lower or higher than the figures shown. For most recent month-end performance figures, please contact the issuing insurance company or speak with your Financial Advisor. Investment return and principal value will fluctuate. When you sell Portfolio shares, they may be worth less than their original cost. Total returns do not reflect the deduction of taxes that a shareholder would pay on Portfolio distributions or the redemption of Portfolio shares. Performance for Class Y shares will vary from the performance of Class X shares due to differences in expenses. Performance assumes reinvestment of all distributions for the underlying portfolio based on net asset value (NAV). It does not reflect the deduction of insurance expenses, an annual contract maintenance fee, or surrender charges. If performance information included the effect of these additional charges, the total returns would be lower.
Average Annual Total Returns as of December 31, 2012
| | | 1 Year | | 5 Years | | 10 Years | | Since Inception* | |
Class X | | | 11.85 | % | | | 2.51 | % | | | 9.84 | % | | | 5.33 | % | |
Class Y | | | 11.62 | % | | | 2.26 | % | | | 9.57 | % | | | 2.35 | % | |
(1) Ending value on December 31, 2012 for the underlying portfolio. This figure does not reflect the deduction of any account fees or sales charges.
(2) The Russell 3000® Growth Index measures the performance of the broad growth segment of the U.S. equity universe. It includes those Russell 3000® Index companies with higher price-to-book ratios and higher forecasted growth values. The Russell 3000® Index measures the performance of the largest 3000 U.S. companies representing approximately 98% of the investable U.S. equity market. The Index is unmanaged and its returns do not include any sales charges or fees. Such costs would lower performance. It is not possible to invest directly in an index.
* Inception dates of May 4, 1999 for Class X and June 5, 2000 for Class Y.
15
Morgan Stanley Variable Investment Series
Letter to the Shareholders n December 31, 2012 (unaudited) continued
the sector. Within the sector, gains were led by a holding in an online retailer.
There is no guarantee that any sectors mentioned will continue to perform as discussed above or that securities in such sectors will be held by the Portfolio in the future.
Strategist Portfolio
For the 12-month period ended December 31, 2012, Variable Investment Series – Strategist Portfolio Class X shares produced a total return of 6.91%, underperforming the S&P 500® Index (the "Index"), which returned 16.00%, and outperforming the Barclays Capital U.S. Government/Credit Index, which returned 4.82%. For the same period, the Portfolio's Class Y shares returned 6.68%. Past performance is no guarantee of future results.
The performance of the Portfolio's two share classes varies because each has different expenses. The Portfolio's total returns assume the reinvestment of all distributions but do not reflect the deduction of any charges by your insurance company. Such costs would lower performance.
During the period under review, the Portfolio held a majority of its assets in U.S. large capitalization equities (between 55% and 65% throughout the year), a quarter of its assets in U.S. fixed income instruments and the balance in cash equivalents. At period-end, the Portfolio's asset allocation (as a percentage of total Portfolio assets) stood at approximately 58% equities, 24% fixed income and 18% cash equivalents.
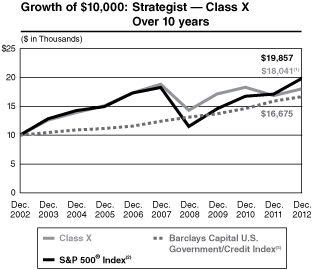
Performance data quoted represents past performance, which is no guarantee of future results and current performance may be lower or higher than the figures shown. For most recent month-end performance figures, please contact the issuing insurance company or speak with your Financial Advisor. Investment return and principal value will fluctuate. When you sell Portfolio shares, they may be worth less than their original cost. Total returns do not reflect the deduction of taxes that a shareholder would pay on Portfolio distributions or the redemption of Portfolio shares. Performance for Class Y shares will vary from the performance of Class X shares due to differences in expenses. Performance assumes reinvestment of all distributions for the underlying portfolio based on net asset value (NAV). It does not reflect the deduction of insurance expenses, an annual contract maintenance fee, or surrender charges. If performance information included the effect of these additional charges, the total returns would be lower.
Average Annual Total Returns as of December 31, 2012
| | | 1 Year | | 5 Years | | 10 Years | | Since Inception* | |
Class X | | | 6.91 | % | | | –0.88 | % | | | 6.08 | % | | | 7.44 | % | |
Class Y | | | 6.68 | % | | | –1.13 | % | | | 5.82 | % | | | 2.81 | % | |
(1) Ending value on December 31, 2012 for the underlying portfolio. This figure does not reflect the deduction of any account fees or sales charges.
(2) The Standard & Poor's 500® Index (S&P 500®) measures the performance of the large cap segment of the U.S. equities market, covering approximately 75% of the U.S. equities market. The Index includes 500 leading companies in leading industries of the U.S. economy. The Index is unmanaged and its returns do not include any sales charges or fees. Such costs would lower performance. It is not possible to invest directly in an index.
(3) The Barclays Capital U.S. Government/Credit Index tracks the performance of government and corporate obligations, including U.S. government agency and Treasury securities and corporate and Yankee bonds. The Index is unmanaged and its returns do not include any sales charges or fees. Such costs would lower performance. It is not possible to invest directly in an index.
* Inception dates of March 1, 1987 for Class X and June 5, 2000 for Class Y.
16
Morgan Stanley Variable Investment Series
Letter to the Shareholders n December 31, 2012 (unaudited) continued
The Portfolio's underperformance relative to the Index during the period was driven by an overweight cash position and a modest overweight in large-capitalization stocks, relative to mid- and small-capitalization equities. Sector and style selection also detracted from performance, due to overweights in consumer staples, industrials and dividend-paying stocks. In contrast, the Portfolio's fixed income exposure was accretive to performance during the year, as was the sector selection within the bond portfolio overall.
There is no guarantee that any sectors mentioned will continue to perform as discussed above or that securities in such sectors will be held by the Portfolio in the future.
We appreciate your ongoing support of Morgan Stanley Variable Investment Series and look forward to continuing to serve your investment needs.
Very truly yours,

Arthur Lev
President and Principal Executive Officer
17
Morgan Stanley Variable Investment Series
Letter to the Shareholders n December 31, 2012 (unaudited) continued
For More Information About Portfolio Holdings
Each Morgan Stanley fund provides a complete schedule of portfolio holdings in its semiannual and annual reports within 60 days of the end of the fund's second and fourth fiscal quarters. The semiannual reports and the annual reports are filed electronically with the Securities and Exchange Commission (SEC) on Form N-CSRS and Form N-CSR, respectively. Morgan Stanley also delivers the semiannual and annual reports to fund shareholders and makes these reports available on its public web site, www.morganstanley.com. Each Morgan Stanley fund also files a complete schedule of portfolio holdings with the SEC for the fund's first and third fiscal quarters on Form N-Q and monthly holdings for each money market fund on Form N-MFP. Morgan Stanley does not deliver these reports to shareholders, nor are the first and third fiscal quarter reports posted to the Morgan Stanley public web site. However, the holdings for each money market fund are posted to the Morgan Stanley public web site. You may obtain the Form N-Q filings (as well as the Form N-CSR, N-CSRS and N-MFP filings) by accessing the SEC's web site, http://www.sec.gov. You may also review and copy them at the SEC's public reference room in Washington, DC. Information on the operation of the SEC's public reference room may be obtained by calling the SEC at (800) SEC-0330. You can also request copies of these materials, upon payment of a duplicating fee, by electronic request at the SEC's e-mail address (publicinfo@sec.gov) or by writing the public reference section of the SEC, Washington, DC 20549-1520.
Proxy Voting Policy and Procedures and Proxy Voting Record
You may obtain a copy of the Portfolio's Proxy Voting Policy and Procedures without charge, upon request, by calling toll free (800) 869-NEWS or by visiting the Mutual Fund Center on our web site at www.morganstanley.com. It is also available on the SEC's web site at http://www.sec.gov.
You may obtain information regarding how the Portfolios voted proxies relating to portfolio securities during the most recent twelve-month period ended June 30 without charge by visiting the Mutual Fund Center on our web site at www.morganstanley.com. This information is also available on the SEC's web site at http://www.sec.gov.
18
Morgan Stanley Variable Investment Series
Expense Examples n December 31, 2012 (unaudited)
As a shareholder of the Portfolio, you incur two types of costs: (1) insurance company charges; and (2) ongoing costs, including advisory fees; administration fees; distribution and service (12b-1) fees; and other Portfolio expenses. These examples are intended to help you understand your ongoing costs (in dollars) of investing in the Portfolio and to compare these costs with the ongoing costs of investing in other mutual funds.
These examples are based on an investment of $1,000 invested at the beginning of the period and held for the entire period 07/01/12 – 12/31/12.
Actual Expenses
The first line of the table below provides information about actual account values and actual expenses. You may use the information in this line, together with the amount you invested, to estimate the expenses that you paid over the period. Simply divide your account value by $1,000 (for example, an $8,600 account value divided by $1,000 = 8.6), then multiply the result by the number in the first line under the heading entitled "Expenses Paid During Period" to estimate the expenses you paid on your account during this period.
Please note that "Expenses Paid During Period" are grossed up to reflect Fund expenses prior to the effect of Expense Offset (See Note 9 in the Notes to Financial Statements). Therefore, the annualized net expense ratios may differ from the ratio of expenses to average net assets shown in the Financial Highlights.
Hypothetical Example for Comparison Purposes
The second line of the table below provides information about hypothetical expenses based on the Portfolio's actual expense ratio and an assumed rate of return of 5% per year before expenses, which is not the Portfolio's actual return. The hypothetical account values and expenses may not be used to estimate the actual ending account balance or expenses you paid for the period. You may use this information to compare the ongoing cost of investing in the Portfolio and other funds. To do so, compare this 5% hypothetical example with the 5% hypothetical examples that appear in the shareholder reports of the other funds.
Please note that the expenses shown in the table are meant to highlight your ongoing costs only and do not reflect any insurance company charges. Therefore, the second line of the table is useful in comparing ongoing costs, and will not help you determine the relative total cost of owning different funds. In addition, if these insurance company charges were included, your costs would have been higher.
19
Morgan Stanley Variable Investment Series
Expense Examples n December 31, 2012 (unaudited) continued
Money Market
| | | Beginning
Account Value | | Ending
Account Value | | Expenses Paid
During Period@ | |
| | | 07/01/12 | | 12/31/12 | | 07/01/12 –
12/31/12 | |
Class X | |
| Actual (0.01% return) | | $ | 1,000.00 | | | $ | 1,000.10 | | | $ | 1.47 | | |
| Hypothetical (5% annual return before expenses) | | $ | 1,000.00 | | | $ | 1,023.81 | | | $ | 1.48 | | |
Class Y | |
| Actual (0.01% return) | | $ | 1,000.00 | | | $ | 1,000.10 | | | $ | 1.47 | | |
| Hypothetical (5% annual return before expenses) | | $ | 1,000.00 | | | $ | 1,023.81 | | | $ | 1.48 | | |
@ Expenses are equal to the Portfolio's annualized expense ratios of 0.29% and 0.29% for Class X and Class Y shares, respectively, multiplied by the average account value over the period, multiplied by 185/366 (to reflect the one-half year period). If the Portfolio had borne all of its expenses, the annualized expense ratios would have been 0.63% and 0.88% for Class X and Class Y shares, respectively.
Limited Duration
| | | Beginning
Account Value | | Ending
Account Value | | Expenses Paid
During Period@ | |
| | | 07/01/12 | | 12/31/12 | | 07/01/12 –
12/31/12 | |
Class X | |
| Actual (1.45% return) | | $ | 1,000.00 | | | $ | 1,014.50 | | | $ | 3.44 | | |
| Hypothetical (5% annual return before expenses) | | $ | 1,000.00 | | | $ | 1,021.72 | | | $ | 3.46 | | |
Class Y | |
| Actual (1.32% return) | | $ | 1,000.00 | | | $ | 1,013.20 | | | $ | 4.71 | | |
| Hypothetical (5% annual return before expenses) | | $ | 1,000.00 | | | $ | 1,020.46 | | | $ | 4.72 | | |
@ Expenses are equal to the Portfolio's annualized expense ratios of 0.68% and 0.93% for Class X and Class Y shares, respectively, multiplied by the average account value over the period, multiplied by 184/366 (to reflect the one-half year period).
Income Plus
| | | Beginning
Account Value | | Ending
Account Value | | Expenses Paid
During Period@ | |
| | | 07/01/12 | | 12/31/12 | | 07/01/12 –
12/31/12 | |
Class X | |
| Actual (7.07% return) | | $ | 1,000.00 | | | $ | 1,070.70 | | | $ | 3.23 | | |
| Hypothetical (5% annual return before expenses) | | $ | 1,000.00 | | | $ | 1,022.02 | | | $ | 3.15 | | |
Class Y | |
| Actual (7.00% return) | | $ | 1,000.00 | | | $ | 1,070.00 | | | $ | 4.53 | | |
| Hypothetical (5% annual return before expenses) | | $ | 1,000.00 | | | $ | 1,020.76 | | | $ | 4.42 | | |
@ Expenses are equal to the Portfolio's annualized expense ratios of 0.62% and 0.87% for Class X and Class Y shares, respectively, multiplied by the average account value over the period, multiplied by 184/366 (to reflect the one-half year period).
20
Morgan Stanley Variable Investment Series
Expense Examples n December 31, 2012 (unaudited) continued
Global Infrastructure
| | | Beginning
Account Value | | Ending
Account Value | | Expenses Paid
During Period@ | |
| | | 07/01/12 | | 12/31/12 | | 07/01/12 –
12/31/12 | |
Class X | |
| Actual (10.86% return) | | $ | 1,000.00 | | | $ | 1,108.60 | | | $ | 4.77 | | |
| Hypothetical (5% annual return before expenses) | | $ | 1,000.00 | | | $ | 1,020.61 | | | $ | 4.57 | | |
Class Y | |
| Actual (10.76% return) | | $ | 1,000.00 | | | $ | 1,107.60 | | | $ | 6.09 | | |
| Hypothetical (5% annual return before expenses) | | $ | 1,000.00 | | | $ | 1,019.36 | | | $ | 5.84 | | |
@ Expenses are equal to the Portfolio's annualized expense ratios of 0.90% and 1.15% for Class X and Class Y shares, respectively, multiplied by the average account value over the period, multiplied by 184/366 (to reflect the one-half year period).
European Equity
| | | Beginning
Account Value | | Ending
Account Value | | Expenses Paid
During Period@ | |
| | | 07/01/12 | | 12/31/12 | | 07/01/12 –
12/31/12 | |
Class X | |
| Actual (15.01% return) | | $ | 1,000.00 | | | $ | 1,150.10 | | | $ | 5.40 | | |
| Hypothetical (5% annual return before expenses) | | $ | 1,000.00 | | | $ | 1,020.11 | | | $ | 5.08 | | |
Class Y | |
| Actual (14.83% return) | | $ | 1,000.00 | | | $ | 1,148.30 | | | $ | 6.75 | | |
| Hypothetical (5% annual return before expenses) | | $ | 1,000.00 | | | $ | 1,018.85 | | | $ | 6.34 | | |
@ Expenses are equal to the Portfolio's annualized expense ratios of 1.00% and 1.25% for Class X and Class Y shares, respectively, multiplied by the average account value over the period, multiplied by 184/366 (to reflect the one-half year period). If the Portfolio had borne all of its expenses, the annualized expense ratios would have been 1.24% and 1.49% for Class X and Class Y shares, respectively.
Multi Cap Growth
| | | Beginning
Account Value | | Ending
Account Value | | Expenses Paid
During Period@ | |
| | | 07/01/12 | | 12/31/12 | | 07/01/12 –
12/31/12 | |
Class X | |
| Actual (2.29% return) | | $ | 1,000.00 | | | $ | 1,022.90 | | | $ | 3.01 | | |
| Hypothetical (5% annual return before expenses) | | $ | 1,000.00 | | | $ | 1,022.23 | | | $ | 3.01 | | |
Class Y | |
| Actual (2.17% return) | | $ | 1,000.00 | | | $ | 1,021.70 | | | $ | 4.28 | | |
| Hypothetical (5% annual return before expenses) | | $ | 1,000.00 | | | $ | 1,020.97 | | | $ | 4.28 | | |
@ Expenses are equal to the Portfolio's annualized expense ratios of 0.59% and 0.84% for Class X and Class Y shares, respectively, multiplied by the average account value over the period, multiplied by 184/366 (to reflect the one-half year period).
21
Morgan Stanley Variable Investment Series
Expense Examples n December 31, 2012 (unaudited) continued
Aggressive Equity
| | | Beginning
Account Value | | Ending
Account Value | | Expenses Paid
During Period@ | |
| | | 07/01/12 | | 12/31/12 | | 07/01/12 –
12/31/12 | |
Class X | |
| Actual (1.87% return) | | $ | 1,000.00 | | | $ | 1,018.70 | | | $ | 7.22 | | |
| Hypothetical (5% annual return before expenses) | | $ | 1,000.00 | | | $ | 1,018.05 | | | $ | 7.22 | | |
Class Y | |
| Actual (1.75% return) | | $ | 1,000.00 | | | $ | 1,017.50 | | | $ | 8.49 | | |
| Hypothetical (5% annual return before expenses) | | $ | 1,000.00 | | | $ | 1,016.79 | | | $ | 8.49 | | |
@ Expenses are equal to the Portfolio's annualized expense ratios of 1.42% and 1.67% for Class X and Class Y shares, respectively, multiplied by the average account value over the period, multiplied by 184/366 (to reflect the one-half year period).
Strategist
| | | Beginning
Account Value | | Ending
Account Value | | Expenses Paid
During Period@ | |
| | | 07/01/12 | | 12/31/12 | | 07/01/12 –
12/31/12 | |
Class X | |
| Actual (2.39% return) | | $ | 1,000.00 | | | $ | 1,023.90 | | | $ | 3.51 | | |
| Hypothetical (5% annual return before expenses) | | $ | 1,000.00 | | | $ | 1,021.67 | | | $ | 3.51 | | |
Class Y | |
| Actual (2.29% return) | | $ | 1,000.00 | | | $ | 1,022.90 | | | $ | 4.78 | | |
| Hypothetical (5% annual return before expenses) | | $ | 1,000.00 | | | $ | 1,020.41 | | | $ | 4.77 | | |
@ Expenses are equal to the Portfolio's annualized expense ratios of 0.69% and 0.94% for Class X and Class Y shares, respectively, multiplied by the average account value over the period, multiplied by 184/366 (to reflect the one-half year period). If the Portfolio had borne all of its expenses, the annualized expense ratios would have been 0.71% and 0.96% for Class X and Class Y shares, respectively.
22
Morgan Stanley Variable Investment Series - Money Market
Portfolio of Investments n December 31, 2012
PRINCIPAL
AMOUNT
(000) | |
| | ANNUALIZED
YIELD
ON DATE OF
PURCHASE | | MATURITY
DATE | | VALUE | |
| | | Repurchase Agreements (48.7%) | |
$ | 5,000 | | | Bank of Nova Scotia, (dated 12/31/12;
proceeds $5,000,050; fully collateralized
by a U.S. Government Obligation; U.S.
Treasury Note 1.88% due 06/30/15;
valued at $5,100,055) | | | 0.18 | % | | 01/02/13 | | $ | 5,000,000 | | |
| | 5,000 | | | Bank of Nova Scotia, (dated 12/31/12;
proceeds $5,000,056; fully collateralized
by a U.S. Government Obligation; U.S.
Treasury Note 1.88% due 10/31/17;
valued at $5,100,007) | | | 0.20 | | | 01/02/13 | | | 5,000,000 | | |
| | 3,000 | | | Barclays Capital, Inc., (dated 12/26/12;
proceeds $3,000,082; fully collateralized
by a U.S. Government Obligation; U.S.
Treasury Note 2.13% due 11/30/14;
valued at $3,060,076) | | | 0.14 | | | 01/02/13 | | | 3,000,000 | | |
| | 1,000 | | | BNP Paribas Securities Corp., (dated 12/28/12;
proceeds $1,000,019; fully collateralized
by U.S. Government Agencies; Federal Home
Loan Mortgage Corporation 4.50% due
06/01/24 - 05/01/40; Federal National
Mortgage Association 5.00% - 6.00% due
09/01/19 - 09/01/21 valued at $1,030,000) | | | 0.10 | | | 01/04/13 | | | 1,000,000 | | |
| | 1,000 | | | BNP Paribas Securities Corp., (dated 12/06/12;
proceeds $1,001,006; fully collateralized
by U.S. Government Agencies; Federal National
Mortgage Association 5.50% due
04/01/36 - 01/01/40; valued at $1,030,001)
(Demand 01/07/13) | | | 0.20 | (a) | | 06/05/13 | | | 1,000,000 | | |
| | 1,500 | | | BNP Paribas Securities Corp., (dated 10/24/12;
proceeds $1,501,593; fully collateralized
by U.S. Government Agencies; Federal National
Mortgage Association 2.35% - 4.50% due
05/01/27 - 12/01/41; valued at $1,545,000)
(Demand 01/07/13) | | | 0.21 | (a) | | 04/24/13 | | | 1,500,000 | | |
| | 1,000 | | | BNP Paribas Securities Corp., (dated 12/04/12;
proceeds $1,001,056; fully collateralized by
U.S. Government Agencies; Federal National
Mortgage Association 4.50% - 4.85% due
08/01/38 - 02/01/41; Government National
Mortgage Association 3.00% due 10/20/42;
valued at $1,030,000) (Demand 01/07/13) | | | 0.21 | (a) | | 06/03/13 | | | 1,000,000 | | |
See Notes to Financial Statements
23
Morgan Stanley Variable Investment Series - Money Market
Portfolio of Investments n December 31, 2012 continued
PRINCIPAL
AMOUNT
(000) | |
| | ANNUALIZED
YIELD
ON DATE OF
PURCHASE | | MATURITY
DATE | | VALUE | |
$ | 11,715 | | | BNP Paribas Securities Corp., (dated 12/31/12;
proceeds $11,715,143; fully collateralized
by U.S. Government Agencies; Government
National Mortgage Association 2.42% - 7.50%
due 02/15/18 - 05/15/54;
valued at $12,066,450) | | | 0.22 | % | | 01/02/13 | | $ | 11,715,000 | | |
| | 15,000 | | | Mizuho Securities USA, Inc., (dated 12/31/12;
proceeds $15,000,233; fully collateralized
by a U.S. Government Agency; Government
National Mortgage Association 5.00%
due 08/15/40; valued at $15,458,592) | | | 0.28 | | | 01/02/13 | | | 15,000,000 | | |
| | | Total Repurchase Agreements
(Cost $44,215,000) | | | 44,215,000 | | |
| | | Commercial Paper (25.4%) | |
| | | Automobiles (4.9%) | |
| | 2,750 | | | American Honda Finance Corp. | | | 0.15 | | | 01/25/13 | | | 2,749,725 | | |
| | 1,750 | | | Toyota Motor Credit Corp. | | | 0.17 - 0.25 | | | 01/04/13 - 02/13/13 | | | 1,749,764 | | |
| | | | 4,499,489 | | |
| | | Food & Beverage (0.7%) | |
| | 650 | | | Coca-Cola Co. (b) | | | 0.26 - 0.27 | | | 05/01/13 - 05/14/13 | | | 649,403 | | |
| | | International Banks (19.8%) | |
| | 500 | | | ABN Amro Funding USA LLC (b) | | | 0.31 | | | 02/01/13 | | | 499,867 | | |
| | 4,000 | | | Credit Suisse NY | | | 0.26 | | | 04/05/13 | | | 3,997,284 | | |
| | 500 | | | DBS Bank Ltd. (b) | | | 0.45 | | | 01/14/13 | | | 499,921 | | |
| | 3,200 | | | Nordea North America, Inc. | | | 0.30 - 0.41 | | | 01/18/13 - 06/12/13 | | | 3,198,011 | | |
| | 4,000 | | | NRW Bank (b) | | | 0.21 - 0.22 | | | 01/09/13 - 02/01/13 | | | 3,999,398 | | |
| | 500 | | | Oversea Chinese Banking | | | 0.48 | | | 01/02/13 | | | 499,993 | | |
| | 4,000 | | | Rabobank USA Financial Corp. | | | 0.38 - 0.52 | | | 02/01/13 - 04/05/13 | | | 3,997,422 | | |
| | 875 | | | Svenska Handelsbanken AB (b) | | | 0.30 | | | 05/01/13 | | | 874,125 | | |
| | 400 | | | Westpac Securities NZ Ltd. (b) | | | 0.30 | | | 05/17/13 | | | 399,547 | | |
| | | 17,965,568 | | |
| | | Total Commercial Paper
(Cost $23,114,460) | | | 23,114,460 | | |
| | | Certificates of Deposit (5.0%) | |
| | | International Banks | |
| | 700 | | | Bank of Montreal | | | 0.30 | | | 05/09/13 - 05/13/13 | | | 700,000 | | |
| | 2,900 | | | Sumitomo Mitsui Banking Corp. | | | 0.26 | | | 03/14/13 - 04/05/13 | | | 2,899,973 | | |
| | 1,000 | | | Svenska Handelsbanken AB | | | 0.31 | | | 06/05/13 | | | 1,000,021 | | |
| | | Total Certificates of Deposit
(Cost $4,599,994) | | | 4,599,994 | | |
See Notes to Financial Statements
24
Morgan Stanley Variable Investment Series - Money Market
Portfolio of Investments n December 31, 2012 continued
PRINCIPAL
AMOUNT
(000)
| |
| | COUPON
RATE(a) | | DEMAND
DATE(c) | | MATURITY
DATE | | VALUE | |
| | | Floating Rate Notes (15.8%) | |
| | | International Banks | |
$ | 3,000 | | | Bank of Nova Scotia | | | 0.31 - 0.40 | % | | 01/02/13 - 01/28/13 | | 04/26/13 - 07/02/13 | | $ | 2,999,937 | | |
| | 3,000 | | | Deutsche Bank AG | | | 0.71 | | | 03/15/13 | | 03/15/13 | | | 3,000,000 | | |
| | 1,800 | | | National Australia Bank | | | 0.31 | | | 02/11/13 | | 08/09/13 | | | 1,800,000 | | |
| | 1,000 | | | Royal Bank of Canada | | | 0.40 | | | 01/11/13 | | 07/11/13 | | | 1,000,000 | | |
| | 3,270 | | | Toronto Dominion Bank | | | 0.31 - 0.32 | | | 01/22/13 - 03/13/13 | | 07/26/13 - 10/21/13 | | | 3,270,000 | | |
| | 2,250 | | | Westpac Banking Corp. (b) | | | 0.31 - 0.40 | | | 01/03/13 - 02/27/13 | | 04/03/13 - 08/27/13 | | | 2,249,944 | | |
| | | Total Floating Rate Notes
(Cost $14,319,881) | | | | | | | | | 14,319,881 | | |
| | | Tax-Exempt Instruments (5.0%) | |
| | | Weekly Variable Rate Bond (3.3%) | |
| | 3,000 | | | Miami-Dade County, FL,
Professional Sports Franchise
Facilities Tax Ser 2009 E | | | 0.15 | | | 01/07/13 | | 10/01/48 | | | 3,000,000 | | |
| | |
| | COUPON
RATE | | YIELD TO
MATURITY
ON DATE OF
PURCHASE | |
| |
| |
| | | Municipal Bond (1.7%) | |
| | 1,500 | | | California, Ser 2012-13
A-2 RANs, dtd, 08/23/12 | | | 2.50 | % | | | 0.43 | % | | 06/20/13 | | | 1,514,410 | | |
| | | Total Tax-Exempt Instruments
(Cost $4,514,410) | | | | | | | | | 4,514,410 | | |
| | | Total Investments
(Cost $90,763,745) | | | | | | | 99.9 | % | | | 90,763,745 | | |
| | | Other Assets in Excess of Liabilities | | | | | | | 0.1 | | | | 68,952 | | |
| | | Net Assets | | | | | | | 100.0 | % | | $ | 90,832,697 | | |
RANs Revenue Anticipation Notes.
(a) Rate shown is the rate in effect at December 31, 2012.
(b) 144A security — Certain conditions for public sale may exist. Unless otherwise noted, these securities are deemed to be liquid.
(c) Date of next interest rate reset.
See Notes to Financial Statements
25
Morgan Stanley Variable Investment Series - Money Market
Portfolio of Investments n December 31, 2012 continued
SUMMARY OF INVESTMENTS
MATURITY SCHEDULE†
| 1 - 30 Days | | | 68.4 | % | |
| 31 - 60 Days | | | 10.8 | | |
| 61 - 90 Days | | | 5.4 | | |
| 91 - 120 Days | | | 8.4 | | |
| 121 + Days | | | 7.0 | | |
| | | 100.0 | % | |
† As a percentage of total investments.
See Notes to Financial Statements
26
Morgan Stanley Variable Investment Series - Limited Duration
Portfolio of Investments n December 31, 2012
PRINCIPAL
AMOUNT
(000) | |
| | COUPON
RATE | | MATURITY
DATE | | VALUE | |
| | | Corporate Bonds (61.5%) | |
| | | Basic Materials (2.4%) | |
$ | 190 | | | ArcelorMittal (Luxembourg) | | | 9.50 | % | | 02/15/15 | | $ | 211,541 | | |
| | 230 | | | Barrick Gold Corp. (Canada) | | | 1.75 | | | 05/30/14 | | | 233,294 | | |
| | 85 | | | Ecolab, Inc. | | | 1.00 | | | 08/09/15 | | | 85,292 | | |
| | 115 | | | Ecolab, Inc. | | | 3.00 | | | 12/08/16 | | | 122,326 | | |
| | 260 | | | Kinross Gold Corp. (Canada) | | | 3.625 | | | 09/01/16 | | | 264,763 | | |
| | 260 | | | Xstrata Finance Canada Ltd. (Canada) (a) | | | 1.80 | | | 10/23/15 | | | 261,590 | | |
| | | | | | 1,178,806 | | |
| | | Communications (5.6%) | |
| | 250 | | | Amazon.com, Inc. | | | 1.20 | | | 11/29/17 | | | 248,921 | | |
| | 375 | | | AT&T, Inc. | | | 2.50 | | | 08/15/15 | | | 391,215 | | |
| | 300 | | | Comcast Corp. | | | 6.50 | | | 01/15/15 | | | 334,445 | | |
| | 220 | | | DirecTV Holdings LLC/DirecTV
Financing Co., Inc. | | | 4.75 | | | 10/01/14 | | | 234,998 | | |
| | 290 | | | NBC Universal Media LLC | | | 2.10 | | | 04/01/14 | | | 295,399 | | |
| | 145 | | | News America, Inc. | | | 5.30 | | | 12/15/14 | | | 157,670 | | |
| | 175 | | | Time Warner Cable, Inc. | | | 6.75 | | | 07/01/18 | | | 218,866 | | |
| | 225 | | | Verizon Communications, Inc. | | | 1.10 | | | 11/01/17 | | | 224,252 | | |
| | 350 | | | Viacom, Inc. | | | 4.375 | | | 09/15/14 | | | 370,983 | | |
| | 275 | | | Vodafone Group PLC (United Kingdom) | | | 1.25 | | | 09/26/17 | | | 274,483 | | |
| | | | | | 2,751,232 | | |
| | | Consumer, Cyclical (2.8%) | |
| | 305 | | | Best Buy Co., Inc. | | | 3.75 | | | 03/15/16 | | | 286,700 | | |
| | 280 | | | Daimler Finance North America LLC (a) | | | 1.875 | | | 09/15/14 | | | 284,709 | | |
| | 220 | | | Home Depot, Inc. | | | 5.40 | | | 03/01/16 | | | 251,517 | | |
| | 430 | | | Volkswagen International Finance N.V.
(Germany) (a) | | | 1.625 | | | 03/22/15 | | | 436,103 | | |
| | 135 | | | Wesfarmers Ltd. (Australia) (a) | | | 2.983 | | | 05/18/16 | | | 141,422 | | |
| | | | | | 1,400,451 | | |
| | | Consumer, Non-Cyclical (11.9%) | |
| | 255 | | | AbbVie, Inc. (a) | | | 1.20 | | | 11/06/15 | | | 256,883 | | |
| | 265 | | | AbbVie, Inc. (a) | | | 1.75 | | | 11/06/17 | | | 268,193 | | |
| | 250 | | | Altria Group, Inc. | | | 4.125 | | | 09/11/15 | | | 271,536 | | |
| | 150 | | | Amgen, Inc. | | | 2.50 | | | 11/15/16 | | | 157,747 | | |
| | 165 | | | Anheuser-Busch InBev Worldwide, Inc. (Belgium) | | | 4.125 | | | 01/15/15 | | | 176,403 | | |
| | 205 | | | Anheuser-Busch InBev Worldwide, Inc. (Belgium) | | | 5.375 | | | 11/15/14 | | | 222,636 | | |
| | 265 | | | Bacardi Ltd. (Bermuda) (a) | | | 7.45 | | | 04/01/14 | | | 285,990 | | |
| | 200 | | | BAT International Finance PLC
(United Kingdom) (a) | | | 1.40 | | | 06/05/15 | | | 202,989 | | |
See Notes to Financial Statements
27
Morgan Stanley Variable Investment Series - Limited Duration
Portfolio of Investments n December 31, 2012 (continued)
PRINCIPAL
AMOUNT
(000) | |
| | COUPON
RATE | | MATURITY
DATE | | VALUE | |
$ | 260 | | | Bunge Ltd. Finance Corp. | | | 5.35 | % | | 04/15/14 | | $ | 273,675 | | |
| | 430 | | | Coca-Cola Co. (The) | | | 0.75 | | | 03/13/15 | | | 433,511 | | |
| | 100 | | | Covidien International Finance SA | | | 1.35 | | | 05/29/15 | | | 101,413 | | |
| | 275 | | | Diageo Capital PLC (United Kingdom) | | | 1.50 | | | 05/11/17 | | | 279,182 | | |
| | 210 | | | Experian Finance PLC (United Kingdom) (a) | | | 2.375 | | | 06/15/17 | | | 213,867 | | |
| | 15 | | | Express Scripts Holding Co. (a) | | | 2.65 | | | 02/15/17 | | | 15,606 | | |
| | 200 | | | Express Scripts Holding Co. (a) | | | 2.75 | | | 11/21/14 | | | 206,414 | | |
| | 350 | | | Gilead Sciences, Inc. | | | 3.05 | | | 12/01/16 | | | 375,206 | | |
| | 120 | | | GlaxoSmithKline Capital PLC (United Kingdom) | | | 0.75 | | | 05/08/15 | | | 120,656 | | |
| | 75 | | | Kellogg Co. | | | 1.125 | | | 05/15/15 | | | 75,772 | | |
| | 250 | | | Kraft Foods Group, Inc. (a) | | | 2.25 | | | 06/05/17 | | | 258,851 | | |
| | 225 | | | Kroger Co. (The) | | | 7.50 | | | 01/15/14 | | | 240,735 | | |
| | 370 | | | McKesson Corp. | | | 3.25 | | | 03/01/16 | | | 396,904 | | |
| | 175 | | | PepsiCo, Inc. | | | 0.75 | | | 03/05/15 | | | 175,724 | | |
| | 250 | | | Stryker Corp. | | | 2.00 | | | 09/30/16 | | | 260,555 | | |
| | 200 | | | Takeda Pharmaceutical Co., Ltd. (Japan) (a) | | | 1.031 | | | 03/17/15 | | | 200,901 | | |
| | 85 | | | UnitedHealth Group, Inc. | | | 1.40 | | | 10/15/17 | | | 85,231 | | |
| | 55 | | | UnitedHealth Group, Inc. | | | 2.75 | | | 02/15/23 | | | 55,614 | | |
| | 240 | | | WellPoint, Inc. | | | 1.875 | | | 01/15/18 | | | 243,272 | | |
| | | | | | 5,855,466 | | |
| | | Diversified (0.4%) | |
| | 200 | | | LVMH Moet Hennessy Louis Vuitton SA
(France) (a) | | | 1.625 | | | 06/29/17 | | | 203,519 | | |
| | | Energy (3.0%) | |
| | 115 | | | Enterprise Products Operating LLC | | | 1.25 | | | 08/13/15 | | | 115,780 | | |
| | 225 | | | Enterprise Products Operating LLC,
Series O | | | 9.75 | | | 01/31/14 | | | 246,237 | | |
| | 380 | | | Marathon Petroleum Corp. | | | 3.50 | | | 03/01/16 | | | 404,817 | | |
| | 275 | | | Phillips 66 (a) | | | 1.95 | | | 03/05/15 | | | 280,742 | | |
| | 305 | | | Spectra Energy Capital LLC | | | 5.90 | | | 09/15/13 | | | 315,694 | | |
| | 100 | | | TransCanada PipeLines Ltd. (Canada) | | | 0.875 | | | 03/02/15 | | | 100,620 | | |
| | | | | | 1,463,890 | | |
| | | Finance (28.7%) | |
| | 265 | | | ABB Treasury Center USA, Inc. (Switzerland) (a) | | | 2.50 | | | 06/15/16 | | | 275,769 | | |
| | 255 | | | Abbey National Treasury Services PLC
(United Kingdom) | | | 2.875 | | | 04/25/14 | | | 260,412 | | |
| | 110 | | | Aflac, Inc. | | | 3.45 | | | 08/15/15 | | | 117,456 | | |
| | 475 | | | American Express Co. | | | 7.25 | | | 05/20/14 | | | 517,071 | | |
| | 260 | | | American International Group, Inc. | | | 3.65 | | | 01/15/14 | | | 267,084 | | |
| | 325 | | | Banco Bradesco SA (Brazil) | | | 4.50 | | | 01/12/17 | | | 346,938 | | |
See Notes to Financial Statements
28
Morgan Stanley Variable Investment Series - Limited Duration
Portfolio of Investments n December 31, 2012 (continued)
PRINCIPAL
AMOUNT
(000) | |
| | COUPON
RATE | | MATURITY
DATE | | VALUE | |
$ | 620 | | | Bank of America Corp., Series 1 | | | 3.75 | % | | 07/12/16 | | $ | 663,284 | | |
| | 195 | | | Bank of Montreal (Canada) | | | 1.40 | | | 09/11/17 | | | 195,963 | | |
| | 300 | | | Barclays Bank PLC (United Kingdom) | | | 5.20 | | | 07/10/14 | | | 319,323 | | |
| | 315 | | | BNP Paribas SA (France) | | | 2.375 | | | 09/14/17 | | | 319,873 | | |
| | 205 | | | BP Capital Markets PLC (United Kingdom) | | | 3.875 | | | 03/10/15 | | | 218,512 | | |
| | 150 | | | Canadian Imperial Bank of Commerce (Canada) | | | 0.90 | | | 10/01/15 | | | 150,749 | | |
| | 300 | | | Capital One Financial Corp. | | | 7.375 | | | 05/23/14 | | | 326,458 | | |
| | 405 | | | Citigroup, Inc. (See Note 6) | | | 4.45 | | | 01/10/17 | | | 449,075 | | |
| | 250 | | | Commonwealth Bank of Australia (Australia) | | | 1.95 | | | 03/16/15 | | | 256,674 | | |
| | 115 | | | Cooperatieve Centrale
Raiffeisen-Boerenleenbank BA (Netherlands) | | | 3.375 | | | 01/19/17 | | | 123,660 | | |
| | 250 | | | Credit Agricole SA (France) (a) | | | 3.00 | | | 10/01/17 | | | 256,297 | | |
| | 340 | | | Credit Suisse (Switzerland) | | | 5.50 | | | 05/01/14 | | | 361,875 | | |
| | 355 | | | Deutsche Bank AG (Germany) | | | 2.375 | | | 01/11/13 | | | 355,176 | | |
| | 205 | | | DNB Bank ASA (Norway) (a) | | | 3.20 | | | 04/03/17 | | | 218,555 | | |
| | 975 | | | General Electric Capital Corp. | | | 2.95 | | | 05/09/16 | | | 1,027,856 | | |
| | 300 | | | Genworth Life Institutional Funding Trust (a) | | | 5.875 | | | 05/03/13 | | | 304,592 | | |
| | 425 | | | Goldman Sachs Group, Inc. (The) | | | 3.625 | | | 02/07/16 | | | 450,202 | | |
| | 200 | | | HCP, Inc. | | | 2.70 | | | 02/01/14 | | | 203,644 | | |
| | 350 | | | HSBC Finance Corp. | | | 5.25 | | | 04/15/15 | | | 379,708 | | |
| | 255 | | | Hyundai Capital America (a) | | | 2.125 | | | 10/02/17 | | | 257,115 | | |
| | 200 | | | ING Bank N.V. (Netherlands) (a) | | | 3.75 | | | 03/07/17 | | | 212,760 | | |
| | 425 | | | JPMorgan Chase & Co. | | | 1.875 | | | 03/20/15 | | | 432,876 | | |
| | 135 | | | JPMorgan Chase & Co. | | | 3.15 | | | 07/05/16 | | | 143,145 | | |
| | 230 | | | Macquarie Group Ltd. (Australia) (a) | | | 7.30 | | | 08/01/14 | | | 248,197 | | |
| | 200 | | | Metropolitan Life Global Funding I
(See Note 6) (a) | | | 1.70 | | | 06/29/15 | | | 204,282 | | |
| | 325 | | | Metropolitan Life Global Funding I
(See Note 6) (a) | | | 2.00 | | | 01/10/14 | | | 329,730 | | |
| | 350 | | | Monumental Global Funding III (a) | | | 5.25 | | | 01/15/14 | | | 365,548 | | |
| | 250 | | | National Australia Bank Ltd. (Australia) | | | 2.00 | | | 03/09/15 | | | 256,117 | | |
| | 270 | | | Nationwide Building Society
(United Kingdom) (a) | | | 4.65 | | | 02/25/15 | | | 285,665 | | |
| | 30 | | | Nissan Motor Acceptance Corp. (Japan) (a) | | | 3.25 | | | 01/30/13 | | | 30,050 | | |
| | 200 | | | Nordea Bank AB (Sweden) (a) | | | 2.25 | | | 03/20/15 | | | 204,978 | | |
| | 250 | | | Principal Financial Group, Inc. | | | 1.85 | | | 11/15/17 | | | 251,614 | | |
| | 320 | | | Prudential Financial, Inc., MTN | | | 4.75 | | | 09/17/15 | | | 350,992 | | |
| | 170 | | | Royal Bank of Scotland Group PLC
(United Kingdom) | | | 2.55 | | | 09/18/15 | | | 174,093 | | |
| | 40 | | | Santander Holdings USA, Inc. | | | 3.00 | | | 09/24/15 | | | 40,760 | | |
| | 300 | | | Standard Chartered PLC (United Kingdom) (a) | | | 3.85 | | | 04/27/15 | | | 316,950 | | |
See Notes to Financial Statements
29
Morgan Stanley Variable Investment Series - Limited Duration
Portfolio of Investments n December 31, 2012 (continued)
PRINCIPAL
AMOUNT
(000) | |
| | COUPON
RATE | | MATURITY
DATE | | VALUE | |
$ | 250 | | | Toyota Motor Credit Corp. (Japan) | | | 0.875 | % | | 07/17/15 | | $ | 251,187 | | |
| | 365 | | | UBS AG (Switzerland) | | | 3.875 | | | 01/15/15 | | | 385,871 | | |
| | 330 | | | US Bancorp | | | 2.20 | | | 11/15/16 | | | 344,142 | | |
| | 470 | | | Wells Fargo & Co. | | | 3.676 | | | 06/15/16 | | | 508,533 | | |
| | 200 | | | Westpac Banking Corp. (Australia) (a) | | | 1.375 | | | 07/17/15 | | | 203,087 | | |
| | | | | | 14,163,898 | | |
| | | Industrials (1.7%) | | | |
| | 200 | | | BAA Funding Ltd. (United Kingdom) (a) | | | 2.50 | | | 06/25/15 | | | 206,696 | | |
| | 90 | | | Danaher Corp. | | | 1.30 | | | 06/23/14 | | | 91,020 | | |
| | 50 | | | Precision Castparts Corp. | | | 0.70 | | | 12/20/15 | | | 50,079 | | |
| | 215 | | | Turlock Corp. (a) | | | 1.50 | | | 11/02/17 | | | 215,690 | | |
| | 250 | | | Waste Management, Inc. | | | 2.60 | | | 09/01/16 | | | 262,121 | | |
| | | | | | 825,606 | | |
| | | Technology (1.3%) | | | |
| | 160 | | | Applied Materials, Inc. | | | 2.65 | | | 06/15/16 | | | 168,422 | | |
| | 285 | | | Hewlett-Packard Co. | | | 3.30 | | | 12/09/16 | | | 290,365 | | |
| | 200 | | | Intel Corp. | | | 1.35 | | | 12/15/17 | | | 200,181 | | |
| | | | | | 658,968 | | |
| | | Utilities (3.7%) | | | |
| | 300 | | | Commonwealth Edison Co. | | | 1.625 | | | 01/15/14 | | | 303,309 | | |
| | 350 | | | Enel Finance International N.V. (Italy) (a) | | | 3.875 | | | 10/07/14 | | | 360,518 | | |
| | 215 | | | FirstEnergy Solutions Corp. | | | 4.80 | | | 02/15/15 | | | 231,004 | | |
| | 225 | | | GDF Suez (France) (a) | | | 1.625 | | | 10/10/17 | | | 225,204 | | |
| | 125 | | | Georgia Power Co. | | | 0.75 | | | 08/10/15 | | | 125,432 | | |
| | 265 | | | NextEra Energy Capital Holdings, Inc. | | | 5.35 | | | 06/15/13 | | | 270,473 | | |
| | 320 | | | Sempra Energy | | | 2.00 | | | 03/15/14 | | | 324,938 | | |
| | | | 1,840,878 | | |
| | | | | Total Corporate Bonds
(Cost $29,379,312) | | | | | | | 30,342,714 | | |
| | | U.S. Treasury Securities (16.5%) | | | |
| | | U.S. Treasury Notes | | | |
| | 2,063 | | | | | | | | 0.375 | | | 11/15/15 | | | 2,065,257 | | |
| | 1,200 | | | | | | | | 0.875 | | | 04/30/17 | | | 1,214,906 | | |
| | 1,338 | | | | | | | | 1.25 | | | 10/31/15 | | | 1,372,182 | | |
| | 3,275 | | | | | | | | 2.25 | | | 03/31/16 | | | 3,470,734 | | |
| | | | | Total U.S. Treasury Securities
(Cost $8,129,271) | | | | | | | 8,123,079 | | |
See Notes to Financial Statements
30
Morgan Stanley Variable Investment Series - Limited Duration
Portfolio of Investments n December 31, 2012 (continued)
PRINCIPAL
AMOUNT
(000) | |
| | COUPON
RATE | | MATURITY
DATE | | VALUE | |
| | | Asset-Backed Securities (12.2%) | | | |
$ | 200 | | | Ally Auto Receivables Trust Series 2012-SN1 | | | 0.57 | % | | 08/20/15 | | $ | 200,274 | | |
| | | Ally Master Owner Trust | | | |
| | 100 | | | (a) | | | 1.959 | (b) | | 01/15/15 | | | 100,069 | | |
| | 200 | | | | | | | | 2.15 | | | 01/15/16 | | | 203,315 | | |
| | 225 | | | (a) | | | 2.88 | | | 04/15/15 | | | 226,556 | | |
| | 800 | | | American Express Credit Account Master Trust | | | 1.459 | (b) | | 03/15/17 | | | 816,180 | | |
| | | CarMax Auto Owner Trust | | | |
| | 180 | | | | | | | | 0.52 | | | 07/17/17 | | | 180,016 | | |
| | 162 | | | | | | | | 1.29 | | | 09/15/15 | | | 163,233 | | |
| | | Chase Issuance Trust | | | |
| | 425 | | | | | | | | 0.54 | | | 10/16/17 | | | 424,847 | | |
| | 573 | | | | | | | | 0.59 | | | 08/15/17 | | | 573,267 | | |
| | 169 | | | CNH Equipment Trust | | | 1.17 | | | 05/15/15 | | | 169,582 | | |
| | 115 | | | Ford Credit Auto Lease Trust | | | 0.57 | | | 09/15/15 | | | 115,143 | | |
| | 375 | | | Ford Credit Floorplan Master Owner Trust (a) | | | 4.20 | | | 02/15/17 | | | 402,806 | | |
| | | GE Dealer Floorplan Master Note Trust | | | |
| | 275 | | | | | | | | 0.701 | (b) | | 06/20/17 | | | 276,388 | | |
| | 330 | | | | | | | | 0.811 | (b) | | 07/20/16 | | | 331,890 | | |
| | 64 | | | GE Equipment Midticket LLC, Series 2010-1 (a) | | | 0.94 | | | 07/14/14 | | | 64,052 | | |
| | 233 | | | Harley-Davidson Motorcycle Trust, Series 2010-1 | | | 1.16 | | | 02/15/15 | | | 233,277 | | |
| | 296 | | | Hyundai Auto Lease Securitization Trust,
Series 2011-A (a) | | | 1.02 | | | 08/15/14 | | | 297,149 | | |
| | 145 | | | Hyundai Auto Receivables Trust,
Series 2010-A A3 | | | 1.50 | | | 10/15/14 | | | 145,092 | | |
| | 80 | | | Macquarie Equipment Funding Trust (a) | | | 1.21 | | | 09/20/13 | | | 80,047 | | |
| | 147 | | | MMCA Auto Owner Trust 2011-A (a) | | | 1.22 | | | 01/15/15 | | | 147,288 | | |
| | 144 | | | Nissan Auto Lease Trust, Series 2010-B | | | 1.12 | | | 12/15/13 | | | 143,782 | | |
| | 200 | | | Nissan Master Owner Trust Receivables (a) | | | 1.359 | (b) | | 01/15/15 | | | 200,082 | | |
| | | North Carolina State Education Assistance Authority | | | |
| | 123 | | | | | | | | 0.765 | (b) | | 01/25/21 | | | 123,414 | | |
| | 225 | | | | | | | | 1.115 | (b) | | 07/25/25 | | | 225,938 | | |
| | 100 | | | Panhandle-Plains Higher Education Authority, Inc. | | | 1.31 | (b) | | 07/01/24 | | | 101,123 | | |
| | 23 | | | Toyota Auto Receivables Owner Trust,
Series 2010-A | | | 1.27 | | | 12/16/13 | | | 23,119 | | |
| | 60 | | | World Omni Automobile Lease Securitization Trust | | | 0.93 | | | 11/16/15 | | | 60,393 | | |
| | | | | Total Asset-Backed Securities
(Cost $5,976,510) | | | | | | | 6,028,322 | | |
See Notes to Financial Statements
31
Morgan Stanley Variable Investment Series - Limited Duration
Portfolio of Investments n December 31, 2012 (continued)
PRINCIPAL
AMOUNT
(000) | |
| | COUPON
RATE | | MATURITY
DATE | | VALUE | |
| | | Agency Adjustable Rate Mortgages (3.8%) | | | |
| | | Federal Home Loan Mortgage Corporation,
Conventional Pools: | | | | | |
$ | 68 | | | | | | | | 2.778 | % | | 07/01/36 | | $ | 72,083 | | |
| | 208 | | | | | | | | 2.863 | | | 07/01/38 | | | 221,554 | | |
| | 52 | | | | | | | | 5.322 | | | 01/01/38 | | | 54,814 | | |
| | | Federal National Mortgage Association,
Conventional Pools: | | | | | |
| | 233 | | | | | | | | 2.332 | | | 05/01/35 | | | 247,496 | | |
| | 276 | | | | | | | | 2.762 | | | 09/01/38 | | | 294,147 | | |
| | 430 | | | | | | | | 2.845 | | | 04/01/38 | | | 461,195 | | |
| | 312 | | | | | | | | 3.054 | | | 10/01/39 | | | 334,306 | | |
| | | Government National Mortgage Association,
Various Pools: | | | | | |
| | 184 | | | | | | | | 4.00 | | | 11/20/39 - 02/20/40 | | | 192,688 | | |
| | | | | Total Agency Adjustable Rate Mortgages
(Cost $1,879,510) | | | | | | | 1,878,283 | | |
| | | Agency Fixed Rate Mortgages (0.6%) | | | |
| | | Federal National Mortgage Association,
Conventional Pools: | | | | | |
| | 142 | | | | | | | | 6.50 | | | 01/01/32 - 11/01/33 | | | 166,060 | | |
| | 113 | | | | | | | | 7.00 | | | 08/01/29 - 06/01/32 | | | 135,205 | | |
| | | | | Total Agency Fixed Rate Mortgages
(Cost $266,789) | | | | | | | 301,265 | | |
| | | Collateralized Mortgage Obligations - Agency Collateral Series (0.9%) | | | |
| | 253 | | | Federal Home Loan Mortgage Corporation,
REMIC | | | 7.50 | | | 09/15/29 | | | 298,893 | | |
| | 125 | | | Federal National Mortgage Association | | | 0.953 | | | 11/25/15 | | | 126,361 | | |
| | | | | Total Collateralized Mortgage Obligations - Agency Collateral Series
(Cost $397,328) | | | | | | | 425,254 | | |
| | | Municipal Bond (0.6%) | | | |
| | 300 | | | New Jersey Economic Development Authority
(Cost $300,000) | | | 1.308 | (b) | | 06/15/13 | | | 300,642 | | |
| | | Sovereign (0.4%) | | | |
| | 200 | | | Qatar Government International Bond (Qatar)
(Cost $211,500) (a) | | | 4.00 | | | 01/20/15 | | | 211,000 | | |
See Notes to Financial Statements
32
Morgan Stanley Variable Investment Series - Limited Duration
Portfolio of Investments n December 31, 2012 (continued)
PRINCIPAL
AMOUNT
(000) | |
| | COUPON
RATE | | MATURITY
DATE | | VALUE | |
| | | Short-Term Investments (3.0%) | |
| | | U.S. Treasury Security (0.1%) | |
$ | 75 | | | U.S. Treasury Bill
(Cost $74,986) (c)(d) | | | 0.129 | % | | 02/21/13 | | $ | 74,986 | | |
NUMBER OF
SHARES (000) | |
| |
| |
| |
| |
| | | Investment Company (2.9%) | |
| | 1,439 | | | Morgan Stanley Institutional Liquidity Funds - Money
Market Portfolio - Institutional Class (See Note 6)
(Cost $1,439,331) | | | 1,439,331 | | |
| | | Total Short-Term Investments
(Cost $1,514,317) | | | | | | | 1,514,317 | | |
| | | Total Investments
(Cost $48,054,537) (e) | | | | | 99.5 | % | | | 49,124,876 | | |
| | | Other Assets in Excess of Liabilities | | | | | 0.5 | | | | 238,899 | | |
| | | Net Assets | | | | | 100.0 | % | | $ | 49,363,775 | | |
MTN Medium Term Note.
REMIC Real Estate Mortgage Investment Conduit.
(a) 144A security — Certain conditions for public sale may exist. Unless otherwise noted, these securities are deemed to be liquid.
(b) Variable/Floating Rate Security — Interest rate changes on these instruments are based on changes in a designated base rate. The rates shown are those in effect on December 31, 2012.
(c) Rate shown is the yield to maturity at December 31, 2012.
(d) All or a portion of this security has been physically segregated in connection with open futures contracts.
(e) Securities are available for collateral in connection with futures contracts and swap agreements.
FUTURES CONTRACTS OPEN AT DECEMBER 31, 2012:
NUMBER OF
CONTRACTS | | LONG/SHORT | | DESCRIPTION, DELIVERY
MONTH AND YEAR | | UNDERLYING FACE
AMOUNT AT VALUE | | UNREALIZED
APPRECIATION
(DEPRECIATION) | |
| | 37 | | | Long | | U.S. Treasury 2 yr. Note,
Mar-13 | | $ | 8,157,344 | | | $ | 1,500 | | |
| | 83 | | | Long | | U.S. Treasury 5 yr. Note,
Mar-13 | | | 10,326,367 | | | | (13,261 | ) | |
| | 2 | | | Short | | U.S. Treasury 10 yr. Note,
Mar-13 | | | (265,563 | ) | | | 891 | | |
Net Unrealized Depreciation | | $ | (10,870 | ) | |
See Notes to Financial Statements
33
Morgan Stanley Variable Investment Series - Limited Duration
Portfolio of Investments n December 31, 2012 (continued)
INTEREST RATE SWAP AGREEMENTS OPEN AT DECEMBER 31, 2012:
SWAP
COUNTERPARTY | | NOTIONAL
AMOUNT
(000) | |
FLOATING
RATE INDEX | |
PAY/RECEIVE
FLOATING RATE | |
FIXED
RATE | |
TERMINATION
DATE | | UNREALIZED
APPRECIATION
(DEPRECIATION) | |
Barclays Capital | | $ | 3,880 | | | 3 Month LIBOR | | Receive | | | 0.37 | % | | 10/05/14 | | $ | (889 | ) | |
Barclays Capital | | | 1,060 | | | 3 Month LIBOR | | Receive | | | 0.81 | | | 09/24/17 | | | (3,725 | ) | |
Credit Suisse | | | 3,330 | | | 3 Month LIBOR | | Receive | | | 0.39 | | | 09/25/14 | | | (5,301 | ) | |
Credit Suisse | | | 1,590 | | | 3 Month LIBOR | | Receive | | | 0.82 | | | 09/13/17 | | | (6,704 | ) | |
Deutsche Bank | | | 2,280 | | | 3 Month LIBOR | | Receive | | | 0.43 | | | 12/11/15 | | | 2,740 | | |
Deutsche Bank | | | 2,760 | | | 3 Month LIBOR | | Receive | | | 0.82 | | | 07/24/17 | | | (17,389 | ) | |
Net Unrealized Depreciation | | | | $ | (31,268 | ) | |
LIBOR London Interbank Offered Rate.
LONG TERM CREDIT ANALYSIS+ | |
AAA | | | 12.6 | % | |
AA | | | 33.8 | | |
A | | | 34.2 | | |
BBB | | | 16.1 | | |
BB | | | 0.4 | | |
Not Rated | | | 2.9 | | |
| | | | 100.0 | %++ | |
+ The ratings shown are based on the Portfolio's security ratings as determined by Standard & Poor's, Moody's or Fitch, each a Nationally Recognized Statistical Ratings Organization ("NRSRO").
++ Does not include open long/short futures contracts with an underlying face amount of $18,749,274 with net unrealized depreciation of $10,870. Also does not include open swap agreements with net unrealized depreciation of $31,268.
See Notes to Financial Statements
34
Morgan Stanley Variable Investment Series - Income Plus
Portfolio of Investments n December 31, 2012
PRINCIPAL
AMOUNT
(000) | |
| | COUPON
RATE | | MATURITY
DATE | | VALUE | |
| | | Corporate Bonds (94.2%) | |
| | | Basic Materials (6.2%) | |
$ | 545 | | | ArcelorMittal (Luxembourg) | | | 10.35 | % | | 06/01/19 | | $ | 654,448 | | |
EUR | 811 | | | ArcelorMittal, Series MT (Luxembourg) | | | 7.25 | | | 04/01/14 | | | 233,678 | | |
$ | 540 | | | Barrick Gold Corp. (Canada) | | | 3.85 | | | 04/01/22 | | | 572,719 | | |
| | 1,570 | | | CF Industries, Inc. | | | 6.875 | | | 05/01/18 | | | 1,920,132 | | |
| | 390 | | | Eldorado Gold Corp. (Canada) (a) | | | 6.125 | | | 12/15/20 | | | 398,775 | | |
| | 540 | | | FMG Resources August 2006 Pty Ltd.
(Australia) (a) | | | 6.375 | | | 02/01/16 | | | 561,600 | | |
| | 595 | | | Georgia-Pacific LLC | | | 8.875 | | | 05/15/31 | | | 894,540 | | |
| | 203 | | | Goldcorp, Inc. (Canada) | | | 2.00 | | | 08/01/14 | | | 224,949 | | |
| | 535 | | | Incitec Pivot Ltd. (Australia) (a) | | | 4.00 | | | 12/07/15 | | | 562,994 | | |
| | 580 | | | Kinross Gold Corp. (Canada) | | | 5.125 | | | 09/01/21 | | | 596,103 | | |
| | 545 | | | Lubrizol Corp. | | | 8.875 | | | 02/01/19 | | | 761,412 | | |
| | 1,000 | | | MeadWestvaco Corp. | | | 7.375 | | | 09/01/19 | | | 1,256,062 | | |
| | 550 | | | NewMarket Corp. (a) | | | 4.10 | | | 12/15/22 | | | 560,771 | | |
| | 290 | | | Syngenta Finance N.V. (Switzerland) | | | 4.375 | | | 03/28/42 | | | 318,236 | | |
| | 280 | | | Teck Resources Ltd. (Canada) | | | 6.25 | | | 07/15/41 | | | 330,542 | | |
| | 572 | | | Tronox Finance LLC (a) | | | 6.375 | | | 08/15/20 | | | 579,865 | | |
| | 195 | | | Vale Overseas Ltd. (Brazil) | | | 6.875 | | | 11/21/36 | | | 242,693 | | |
| | 210 | | | Vale Overseas Ltd. (Brazil) | | | 6.875 | | | 11/10/39 | | | 264,349 | | |
| | 550 | | | Xstrata Finance Canada Ltd. (Canada) (a) | | | 4.00 | | | 10/25/22 | | | 557,068 | | |
| | | | | | 11,490,936 | | |
| | | Communications (10.9%) | |
| | 426 | | | America Movil SAB de CV (Mexico) | | | 3.125 | | | 07/16/22 | | | 434,072 | | |
| | 1,100 | | | AT&T, Inc. | | | 5.35 | | | 09/01/40 | | | 1,285,935 | | |
| | 875 | | | AT&T, Inc. | | | 6.30 | | | 01/15/38 | | | 1,125,884 | | |
| | 575 | | | British Sky Broadcasting Group PLC
(United Kingdom) (a) | | | 3.125 | | | 11/26/22 | | | 574,211 | | |
| | 310 | | | Cablevision Systems Corp. | | | 7.75 | | | 04/15/18 | | | 346,425 | | |
| | 450 | | | CC Holdings GS V LLC (a) | | | 3.849 | | | 04/15/23 | | | 458,758 | | |
| | 325 | | | CenturyLink, Inc., Series Q | | | 6.15 | | | 09/15/19 | | | 357,253 | | |
| | 655 | | | CenturyLink, Inc., Series S | | | 6.45 | | | 06/15/21 | | | 724,967 | | |
| | 920 | | | Comcast Corp. | | | 6.40 | | | 05/15/38 | | | 1,179,616 | | |
| | 195 | | | CSC Holdings LLC (a) | | | 6.75 | | | 11/15/21 | | | 217,181 | | |
| | 315 | | | Deutsche Telekom International Finance BV
(Germany) | | | 6.75 | | | 08/20/18 | | | 391,615 | | |
| | 300 | | | Deutsche Telekom International Finance BV
(Germany) | | | 8.75 | | | 06/15/30 | | | 450,657 | | |
| | 825 | | | DirecTV Holdings LLC/DirecTV
Financing Co., Inc. | | | 3.80 | | | 03/15/22 | | | 852,765 | | |
See Notes to Financial Statements
35
Morgan Stanley Variable Investment Series - Income Plus
Portfolio of Investments n December 31, 2012 continued
PRINCIPAL
AMOUNT
(000) | |
| | COUPON
RATE | | MATURITY
DATE | | VALUE | |
$ | 575 | | | DISH DBS Corp. | | | 5.875 | % | | 07/15/22 | | $ | 621,000 | | |
| | 225 | | | NBC Universal Media LLC | | | 2.875 | | | 01/15/23 | | | 226,447 | | |
| | 1,045 | | | NBC Universal Media LLC | | | 4.375 | | | 04/01/21 | | | 1,175,949 | | |
| | 200 | | | News America, Inc. | | | 6.40 | | | 12/15/35 | | | 249,086 | | |
| | 575 | | | Omnicom Group, Inc. | | | 3.625 | | | 05/01/22 | | | 600,174 | | |
| | 263 | | | Priceline.com, Inc. (a) | | | 1.00 | | | 03/15/18 | | | 282,232 | | |
| | 900 | | | Qtel International Finance Ltd. (Qatar) (a) | | | 3.25 | | | 02/21/23 | | | 901,350 | | |
| | 260 | | | Qwest Corp. | | | 6.875 | | | 09/15/33 | | | 262,600 | | |
| | 320 | | | SK Telecom Co., Ltd. (Korea, Republic of) (a) | | | 2.125 | | | 05/01/18 | | | 322,550 | | |
| | 350 | | | Symantec Corp., Series B | | | 1.00 | | | 06/15/13 | | | 377,344 | | |
| | 655 | | | Telecom Italia Capital SA (Italy) | | | 7.175 | | | 06/18/19 | | | 763,403 | | |
| | 375 | | | Telefonaktiebolaget LM Ericsson (Sweden) | | | 4.125 | | | 05/15/22 | | | 390,492 | | |
| | 580 | | | Telefonica Europe BV (Spain) | | | 8.25 | | | 09/15/30 | | | 689,475 | | |
| | 490 | | | Time Warner Cable, Inc. | | | 4.50 | | | 09/15/42 | | | 479,803 | | |
| | 1,200 | | | Time Warner Cable, Inc. | | | 6.75 | | | 07/01/18 | | | 1,500,796 | | |
| | 610 | | | Time Warner, Inc. | | | 6.50 | | | 11/15/36 | | | 765,566 | | |
| | 760 | | | Time Warner, Inc. | | | 7.70 | | | 05/01/32 | | | 1,065,672 | | |
| | 785 | | | Verizon Communications, Inc. | | | 3.85 | | | 11/01/42 | | | 775,495 | | |
| | 150 | | | Verizon Communications, Inc. | | | 6.40 | | | 02/15/38 | | | 203,805 | | |
| | | | | | 20,052,578 | | |
| | | Consumer, Cyclical (4.4%) | |
| | 715 | | | Chrysler Group LLC/CG Co-Issuer, Inc. | | | 8.00 | | | 06/15/19 | | | 782,925 | | |
| | 395 | | | Daimler Finance North America LLC (Germany) | | | 8.50 | | | 01/18/31 | | | 616,485 | | |
| | 425 | | | Exide Technologies | | | 8.625 | | | 02/01/18 | | | 362,312 | | |
| | 925 | | | Gap, Inc. (The) | | | 5.95 | | | 04/12/21 | | | 1,059,994 | | |
| | 208 | | | International Game Technology | | | 3.25 | | | 05/01/14 | | | 218,010 | | |
| | 720 | | | Macy's Retail Holdings, Inc. | | | 3.875 | | | 01/15/22 | | | 768,858 | | |
| | 800 | | | McDonald's Corp. | | | 2.625 | | | 01/15/22 | | | 823,008 | | |
| | 620 | | | QVC, Inc. (a) | | | 7.125 | | | 04/15/17 | | | 650,231 | | |
| | 565 | | | Volkswagen International Finance N.V.
(Germany) (a) | | | 2.375 | | | 03/22/17 | | | 582,522 | | |
| | 780 | | | Wyndham Worldwide Corp. | | | 4.25 | | | 03/01/22 | | | 806,854 | | |
| | 265 | | | Wynn Las Vegas LLC/Wynn Las Vegas
Capital Corp. | | | 7.75 | | | 08/15/20 | | | 303,425 | | |
| | 840 | | | Yum! Brands, Inc. | | | 6.875 | | | 11/15/37 | | | 1,150,920 | | |
| | | | | | 8,125,544 | | |
| | | Consumer, Non-Cyclical (10.2%) | |
| | 695 | | | AbbVie, Inc. (a) | | | 4.40 | | | 11/06/42 | | | 742,019 | | |
| | 765 | | | Aetna, Inc. | | | 2.75 | | | 11/15/22 | | | 760,331 | | |
| | 125 | | | Aetna, Inc. | | | 4.125 | | | 11/15/42 | | | 124,482 | | |
| | 400 | | | Albea Beauty Holdings SA (a) | | | 8.375 | | | 11/01/19 | | | 424,000 | | |
See Notes to Financial Statements
36
Morgan Stanley Variable Investment Series - Income Plus
Portfolio of Investments n December 31, 2012 continued
PRINCIPAL
AMOUNT
(000) | |
| | COUPON
RATE | | MATURITY
DATE | | VALUE | |
$ | 1,520 | | | Amgen, Inc. | | | 3.875 | % | | 11/15/21 | | $ | 1,672,322 | | |
| | 795 | | | Boston Scientific Corp. | | | 6.00 | | | 01/15/20 | | | 928,686 | | |
| | 720 | | | Cigna Corp. | | | 5.375 | | | 02/15/42 | | | 841,545 | | |
| | 723 | | | Delhaize Group SA (Belgium) | | | 5.70 | | | 10/01/40 | | | 679,965 | | |
| | 475 | | | Diageo Investment Corp. (United Kingdom) | | | 2.875 | | | 05/11/22 | | | 491,336 | | |
| | 845 | | | Experian Finance PLC (United Kingdom) (a) | | | 2.375 | | | 06/15/17 | | | 860,558 | | |
| | 690 | | | Express Scripts Holding Co. (a) | | | 2.65 | | | 02/15/17 | | | 717,878 | | |
| | 855 | | | Express Scripts Holding Co. (a) | | | 3.90 | | | 02/15/22 | | | 923,684 | | |
| | 605 | | | Gilead Sciences, Inc. | | | 4.50 | | | 04/01/21 | | | 692,635 | | |
| | 490 | | | Grupo Bimbo SAB de CV (Mexico) (a) | | | 4.875 | | | 06/30/20 | | | 558,026 | | |
| | 279 | | | Jarden Corp. (a) | | | 1.875 | | | 09/15/18 | | | 283,708 | | |
| | 1,100 | | | Kraft Foods Group, Inc. (a) | | | 6.875 | | | 01/26/39 | | | 1,486,174 | | |
| | 415 | | | Life Technologies Corp. | | | 6.00 | | | 03/01/20 | | | 492,587 | | |
| | 500 | | | PepsiCo, Inc. | | | 2.75 | | | 03/05/22 | | | 514,696 | | |
| | 600 | | | Philip Morris International, Inc. | | | 4.50 | | | 03/20/42 | | | 654,775 | | |
| | 550 | | | SABMiller Holdings, Inc. (a) | | | 3.75 | | | 01/15/22 | | | 595,052 | | |
| | 305 | | | SABMiller Holdings, Inc. (a) | | | 4.95 | | | 01/15/42 | | | 347,128 | | |
| | 800 | | | Sigma Alimentos SA de CV (Mexico) (a) | | | 5.625 | | | 04/14/18 | | | 906,000 | | |
| | 260 | | | Smithfield Foods, Inc. | | | 4.00 | | | 06/30/13 | | | 275,763 | | |
| | 230 | | | Teva Pharmaceutical Finance Co. BV (Israel) | | | 2.95 | | | 12/18/22 | | | 233,159 | | |
| | 665 | | | Teva Pharmaceutical Finance IV BV (Israel) | | | 3.65 | | | 11/10/21 | | | 713,056 | | |
| | 330 | | | UnitedHealth Group, Inc. | | | 1.40 | | | 10/15/17 | | | 330,898 | | |
| | 205 | | | UnitedHealth Group, Inc. | | | 2.75 | | | 02/15/23 | | | 207,289 | | |
| | 630 | | | Verisk Analytics, Inc. | | | 5.80 | | | 05/01/21 | | | 707,189 | | |
| | 280 | | | Vertex Pharmaceuticals, Inc. | | | 3.35 | | | 10/01/15 | | | 316,225 | | |
| | 281 | | | WellPoint, Inc. (a) | | | 2.75 | | | 10/15/42 | | | 303,656 | | |
| | | | | | 18,784,822 | | |
| | | Energy (7.4%) | |
| | 160 | | | Access Midstream Partners LP/ACMP
Finance Corp. | | | 4.875 | | | 05/15/23 | | | 162,600 | | |
| | 1,075 | | | BP Capital Markets PLC (United Kingdom) | | | 3.245 | | | 05/06/22 | | | 1,134,807 | | |
| | 450 | | | Canadian Natural Resources Ltd. (Canada) | | | 6.25 | | | 03/15/38 | | | 581,789 | | |
| | 225 | | | Canadian Oil Sands Ltd. (Canada) (a) | | | 6.00 | | | 04/01/42 | | | 265,232 | | |
| | 550 | | | Canadian Oil Sands Ltd. (Canada) (a) | | | 7.75 | | | 05/15/19 | | | 701,787 | | |
| | 420 | | | Continental Resources, Inc. | | | 7.125 | | | 04/01/21 | | | 476,700 | | |
| | 275 | | | Enterprise Products Operating LLC | | | 5.25 | | | 01/31/20 | | | 327,270 | | |
| | 850 | | | Enterprise Products Operating LLC | | | 5.95 | | | 02/01/41 | | | 1,030,002 | | |
| | 395 | | | FMC Technologies, Inc. | | | 3.45 | | | 10/01/22 | | | 403,968 | | |
| | 500 | | | Halliburton Co. | | | 4.50 | | | 11/15/41 | | | 560,516 | | |
| | 200 | | | Lukoil International Finance BV (Russia) | | | 2.625 | | | 06/16/15 | | | 227,200 | | |
| | 225 | | | Marathon Petroleum Corp. | | | 5.125 | | | 03/01/21 | | | 265,240 | | |
See Notes to Financial Statements
37
Morgan Stanley Variable Investment Series - Income Plus
Portfolio of Investments n December 31, 2012 continued
PRINCIPAL
AMOUNT
(000) | |
| | COUPON
RATE | | MATURITY
DATE | | VALUE | |
$ | 375 | | | Marathon Petroleum Corp. | | | 6.50 | % | | 03/01/41 | | $ | 476,858 | | |
| | 900 | | | Murphy Oil Corp. | | | 3.70 | | | 12/01/22 | | | 898,421 | | |
| | 925 | | | Phillips 66 (a) | | | 4.30 | | | 04/01/22 | | | 1,035,609 | | |
| | 675 | | | Pioneer Natural Resources Co. | | | 3.95 | | | 07/15/22 | | | 708,692 | | |
| | 670 | | | Plains All American Pipeline LP/PAA
Finance Corp. | | | 6.70 | | | 05/15/36 | | | 858,881 | | |
| | 675 | | | Plains All American Pipeline LP/PAA
Finance Corp. | | | 8.75 | | | 05/01/19 | | | 919,460 | | |
| | 355 | | | Sinopec Group Overseas Development 2012 Ltd.
(China) (a)(b) | | | 2.75 | | | 05/17/17 | | | 369,001 | | |
| | 225 | | | Spectra Energy Capital LLC | | | 8.00 | | | 10/01/19 | | | 297,560 | | |
| | 170 | | | Tesoro Corp. | | | 5.375 | | | 10/01/22 | | | 181,900 | | |
| | 700 | | | Valero Energy Corp. | | | 6.125 | | | 02/01/20 | | | 852,446 | | |
| | 650 | | | Weatherford International Ltd. | | | 4.50 | | | 04/15/22 | | | 691,102 | | |
| | 225 | | | Williams Cos., Inc. (The) | | | 3.70 | | | 01/15/23 | | | 227,421 | | |
| | | | | | 13,654,462 | | |
| | | Finance (38.2%) | |
EUR | 200 | | | Aabar Investments PJSC (Germany) | | | 4.00 | | | 05/27/16 | | | 270,326 | | |
$ | 390 | | | ABB Treasury Center USA, Inc.
(Switzerland) (a) | | | 4.00 | | | 06/15/21 | | | 432,224 | | |
| | 630 | | | ABN Amro Bank N.V. (Netherlands) (a) | | | 4.25 | | | 02/02/17 | | | 688,725 | | |
| | 1,125 | | | Aegon N.V. (Netherlands) | | | 4.625 | | | 12/01/15 | | | 1,227,252 | | |
| | 264 | | | Affiliated Managers Group, Inc. | | | 3.95 | | | 08/15/38 | | | 293,700 | | |
| | 475 | | | Alexandria Real Estate Equities, Inc. | | | 4.60 | | | 04/01/22 | | | 510,799 | | |
| | 650 | | | Ally Financial, Inc. | | | 5.50 | | | 02/15/17 | | | 698,552 | | |
| | 1,285 | | | American Financial Group, Inc. | | | 9.875 | | | 06/15/19 | | | 1,670,334 | | |
| | 720 | | | American International Group, Inc. | | | 6.40 | | | 12/15/20 | | | 894,815 | | |
| | 175 | | | Ares Capital Corp. (a) | | | 5.75 | | | 02/01/16 | | | 188,781 | | |
| | 400 | | | AvalonBay Communities, Inc. | | | 2.95 | | | 09/15/22 | | | 399,286 | | |
| | 444 | | | Banco Santander Brasil SA (Brazil) (a) | | | 4.25 | | | 01/14/16 | | | 462,870 | | |
| | 725 | | | Banco Santander Brasil SA (Brazil) (a) | | | 4.625 | | | 02/13/17 | | | 770,312 | | |
| | 970 | | | Banco Santander Mexico SA Institucion
de Banca Multiple Grupo Financiero Santand
(Mexico) (a) | | | 4.125 | | | 11/09/22 | | | 989,400 | | |
| | 990 | | | Banco Votorantim SA (Brazil) (a) | | | 5.25 | | | 02/11/16 | | | 1,046,925 | | |
| | 1,930 | | | Barclays Bank PLC (United Kingdom) (a) | | | 6.05 | | | 12/04/17 | | | 2,144,502 | | |
| | 610 | | | Bear Stearns Cos. LLC (The) | | | 5.55 | | | 01/22/17 | | | 688,533 | | |
| | 300 | | | Billion Express Investments Ltd. (China) (b) | | | 0.75 | | | 10/18/15 | | | 318,075 | | |
| | 540 | | | BNP Paribas SA (France) | | | 5.00 | | | 01/15/21 | | | 607,515 | | |
| | 675 | | | Boston Properties LP | | | 3.85 | | | 02/01/23 | | | 710,530 | | |
| | 490 | | | Brookfield Asset Management, Inc. (Canada) | | | 5.80 | | | 04/25/17 | | | 553,728 | | |
See Notes to Financial Statements
38
Morgan Stanley Variable Investment Series - Income Plus
Portfolio of Investments n December 31, 2012 continued
PRINCIPAL
AMOUNT
(000) | |
| | COUPON
RATE | | MATURITY
DATE | | VALUE | |
$ | 780 | | | Capital One Bank, USA NA | | | 8.80 | % | | 07/15/19 | | $ | 1,057,586 | | |
| | 800 | | | Capital One Capital VI | | | 8.875 | | | 05/15/40 | | | 800,000 | | |
| | 1,735 | | | Citigroup, Inc.(See Note 6) | | | 5.875 | | | 05/29/37 | | | 2,095,151 | | |
| | 700 | | | CNA Financial Corp. | | | 7.35 | | | 11/15/19 | | | 879,198 | | |
| | 500 | | | Cooperatieve Centrale Raiffeisen-Boerenleenbank
BA (Netherlands) | | | 3.95 | | | 11/09/22 | | | 513,059 | | |
| | 260 | | | Cooperatieve Centrale Raiffeisen-Boerenleenbank
BA (Netherlands) (a) | | | 11.00 | (c) | | 02/08/22(d) | | | 353,796 | | |
| | 415 | | | Credit Suisse (Switzerland) | | | 5.40 | | | 01/14/20 | | | 467,312 | | |
| | 280 | | | Credit Suisse (Switzerland) | | | 6.00 | | | 02/15/18 | | | 322,268 | | |
| | 800 | | | Dexus Diversified Trust/Dexus Office Trust
(Australia) (a) | | | 5.60 | | | 03/15/21 | | | 861,378 | | |
| | 425 | | | Discover Bank | | | 7.00 | | | 04/15/20 | | | 528,501 | | |
| | 715 | | | Discover Financial Services (a) | | | 3.85 | | | 11/21/22 | | | 739,304 | | |
| | 990 | | | DNB Bank ASA (Norway) (a) | | | 3.20 | | | 04/03/17 | | | 1,055,461 | | |
| | 1,060 | | | Ford Motor Credit Co., LLC | | | 4.207 | | | 04/15/16 | | | 1,131,483 | | |
| | 600 | | | Ford Motor Credit Co., LLC | | | 5.00 | | | 05/15/18 | | | 663,562 | | |
| | 400 | | | Ford Motor Credit Co., LLC | | | 5.875 | | | 08/02/21 | | | 466,618 | | |
| | 2,295 | | | General Electric Capital Corp. | | | 3.15 | | | 09/07/22 | | | 2,349,665 | | |
| | 545 | | | General Electric Capital Corp. | | | 5.30 | | | 02/11/21 | | | 633,689 | | |
| | 1,650 | | | General Electric Capital Corp., Series G | | | 6.00 | | | 08/07/19 | | | 2,010,136 | | |
| | 1,195 | | | Genworth Financial, Inc. | | | 7.70 | | | 06/15/20 | | | 1,323,077 | | |
| | 1,940 | | | Goldman Sachs Group, Inc. (The) | | | 5.75 | | | 01/24/22 | | | 2,297,647 | | |
| | 815 | | | Goldman Sachs Group, Inc. (The) | | | 6.15 | | | 04/01/18 | | | 958,530 | | |
| | 900 | | | Goldman Sachs Group, Inc. (The) | | | 6.75 | | | 10/01/37 | | | 1,023,244 | | |
| | 950 | | | Goodman Funding Pty Ltd. (Australia) (a) | | | 6.375 | | | 04/15/21 | | | 1,081,039 | | |
| | 550 | | | Harley-Davidson Funding Corp. (a) | | | 6.80 | | | 06/15/18 | | | 676,372 | | |
| | 600 | | | Hartford Financial Services Group, Inc. | | | 5.50 | | | 03/30/20 | | | 698,186 | | |
| | 1,675 | | | HBOS PLC, Series G (United Kingdom) (a) | | | 6.75 | | | 05/21/18 | | | 1,811,094 | | |
| | 185 | | | HCP, Inc. | | | 5.625 | | | 05/01/17 | | | 211,500 | | |
| | 550 | | | Health Care REIT, Inc. | | | 3.75 | | | 03/15/23 | | | 552,181 | | |
| | 485 | | | HSBC Finance Corp. | | | 6.676 | | | 01/15/21 | | | 576,309 | | |
| | 440 | | | HSBC Holdings PLC (United Kingdom) | | | 4.00 | | | 03/30/22 | | | 482,679 | | |
| | 705 | | | HSBC Holdings PLC (United Kingdom) | | | 6.50 | | | 05/02/36 | | | 883,718 | | |
| | 575 | | | ING Bank N.V. (Netherlands) (a) | | | 3.75 | | | 03/07/17 | | | 611,685 | | |
| | 600 | | | ING US, Inc. (a) | | | 5.50 | | | 07/15/22 | | | 652,342 | | |
| | 3,245 | | | JPMorgan Chase & Co. | | | 4.50 | | | 01/24/22 | | | 3,677,792 | | |
| | 705 | | | Macquarie Group Ltd. (Australia) (a) | | | 6.00 | | | 01/14/20 | | | 763,973 | | |
| | 555 | | | Merrill Lynch & Co., Inc. | | | 7.75 | | | 05/14/38 | | | 724,741 | | |
| | 3,625 | | | Merrill Lynch & Co., Inc., MTN | | | 6.875 | | | 04/25/18 | | | 4,374,751 | | |
| | 600 | | | Metlife Capital Trust IV (See Note 6) (a) | | | 7.875 | | | 12/15/37 | | | 741,000 | | |
See Notes to Financial Statements
39
Morgan Stanley Variable Investment Series - Income Plus
Portfolio of Investments n December 31, 2012 continued
PRINCIPAL
AMOUNT
(000) | |
| | COUPON
RATE | | MATURITY
DATE | | VALUE | |
$ | 1,315 | | | Nationwide Building Society
(United Kingdom) (a) | | | 6.25 | % | | 02/25/20 | | $ | 1,555,362 | | |
| | 525 | | | Nationwide Financial Services, Inc. (a) | | | 5.375 | | | 03/25/21 | | | 561,999 | | |
| | 1,100 | | | Nordea Bank AB (Sweden) (a) | | | 4.875 | | | 05/13/21 | | | 1,182,082 | | |
| | 370 | | | Platinum Underwriters Finance, Inc., Series B | | | 7.50 | | | 06/01/17 | | | 414,868 | | |
| | 1,035 | | | Post Apartment Homes LP | | | 3.375 | | | 12/01/22 | | | 1,031,835 | | |
| | 350 | | | Principal Financial Group, Inc. | | | 1.85 | | | 11/15/17 | | | 352,260 | | |
| | 425 | | | Principal Financial Group, Inc. | | | 8.875 | | | 05/15/19 | | | 571,017 | | |
| | 925 | | | Protective Life Corp. | | | 7.375 | | | 10/15/19 | | | 1,125,911 | | |
| | 675 | | | Prudential Financial, Inc. | | | 5.625 | (c) | | 06/15/43 | | | 702,877 | | |
| | 135 | | | Prudential Financial, Inc., MTN | | | 6.625 | | | 12/01/37 | | | 168,764 | | |
| | 775 | | | QBE Capital Funding III Ltd. (Australia) (a) | | | 7.25 | (c) | | 05/24/41 | | | 803,382 | | |
| | 575 | | | Realty Income Corp. | | | 3.25 | | | 10/15/22 | | | 564,044 | | |
| | 195 | | | Santander Holdings USA, Inc. | | | 3.00 | | | 09/24/15 | | | 198,706 | | |
| | 360 | | | Santander Holdings USA, Inc. (Spain) | | | 4.625 | | | 04/19/16 | | | 376,664 | | |
| | 700 | | | Santander US Debt SAU (Spain) (a) | | | 3.724 | | | 01/20/15 | | | 703,522 | | |
| | 495 | | | SLM Corp., MTN | | | 8.00 | | | 03/25/20 | | | 568,013 | | |
| | 775 | | | Societe Generale SA (France) (a) | | | 5.20 | | | 04/15/21 | | | 860,415 | | |
| | 885 | | | Standard Chartered Bank (United Kingdom) (a) | | | 6.40 | | | 09/26/17 | | | 1,039,140 | | |
| | 250 | | | Wachovia Bank NA | | | 6.60 | | | 01/15/38 | | | 344,365 | | |
| | 575 | | | Weingarten Realty Investors | | | 3.375 | | | 10/15/22 | | | 568,100 | | |
| | | | | | 70,310,537 | | |
| | | Industrials (7.6%) | |
| | 522 | | | Anixter, Inc. | | | 5.625 | | | 05/01/19 | | | 552,015 | | |
| | 1,060 | | | BAA Funding Ltd. (United Kingdom) (a) | | | 4.875 | | | 07/15/21 | | | 1,158,852 | | |
| | 540 | | | Ball Corp. | | | 7.375 | | | 09/01/19 | | | 603,450 | | |
| | 500 | | | Bemis Co., Inc. | | | 4.50 | | | 10/15/21 | | | 542,713 | | |
| | 505 | | | Bombardier, Inc. (Canada) (a) | | | 7.75 | | | 03/15/20 | | | 575,700 | | |
| | 1,000 | | | Burlington Northern Santa Fe LLC | | | 3.05 | | | 03/15/22 | | | 1,034,023 | | |
| | 820 | | | CRH America, Inc. | | | 6.00 | | | 09/30/16 | | | 922,153 | | |
| | 480 | | | CRH America, Inc. | | | 8.125 | | | 07/15/18 | | | 580,290 | | |
| | 255 | | | Deere & Co. | | | 3.90 | | | 06/09/42 | | | 261,759 | | |
| | 675 | | | Eaton Corp. (a) | | | 2.75 | | | 11/02/22 | | | 674,359 | | |
| | 248 | | | General Cable Corp. | | | 4.50 | | | 11/15/29 | | | 268,770 | | |
| | 545 | | | Holcim US Finance Sarl & Cie SCS
(Switzerland) (a) | | | 6.00 | | | 12/30/19 | | | 619,050 | | |
| | 950 | | | Koninklijke Philips Electronics N.V.
(Netherlands) | | | 3.75 | | | 03/15/22 | | | 1,028,951 | | |
| | 915 | | | L-3 Communications Corp. | | | 4.95 | | | 02/15/21 | | | 1,034,149 | | |
| | 445 | | | Lafarge SA (France) (a) | | | 6.20 | | | 07/09/15 | | | 482,825 | | |
| | 630 | | | Odebrecht Finance Ltd. (Brazil) (a) | | | 6.00 | | | 04/05/23 | | | 731,587 | | |
See Notes to Financial Statements
40
Morgan Stanley Variable Investment Series - Income Plus
Portfolio of Investments n December 31, 2012 continued
PRINCIPAL
AMOUNT
(000) | |
| | COUPON
RATE | | MATURITY
DATE | | VALUE | |
$ | 900 | | | Schneider Electric SA (France) (a) | | | 2.95 | % | | 09/27/22 | | $ | 909,022 | | |
| | 135 | | | Sonoco Products Co. | | | 4.375 | | | 11/01/21 | | | 145,023 | | |
| | 470 | | | Sonoco Products Co. | | | 5.75 | | | 11/01/40 | | | 542,998 | | |
| | 269 | | | Trinity Industries, Inc. | | | 3.875 | | | 06/01/36 | | | 302,121 | | |
| | 525 | | | United Technologies Corp. | | | 4.50 | | | 06/01/42 | | | 585,837 | | |
| | 525 | | | Waste Management, Inc. | | | 2.90 | | | 09/15/22 | | | 520,552 | | |
| | | | | | 14,076,199 | | |
| | | Technology (3.3%) | |
| | 750 | | | Dun & Bradstreet Corp. (The) | | | 3.25 | | | 12/01/17 | | | 758,800 | | |
| | 235 | | | Hewlett-Packard Co. | | | 2.60 | | | 09/15/17 | | | 229,178 | | |
| | 895 | | | Hewlett-Packard Co. | | | 4.65 | | | 12/09/21 | | | 900,111 | | |
| | 775 | | | Intel Corp. | | | 2.70 | | | 12/15/22 | | | 775,596 | | |
| | 234 | | | Intel Corp. | | | 2.95 | | | 12/15/35 | | | 243,799 | | |
| | 475 | | | International Business Machines Corp. | | | 1.875 | | | 05/15/19 | | | 482,844 | | |
| | 255 | | | Lam Research Corp. | | | 1.25 | | | 05/15/18 | | | 253,247 | | |
| | 185 | | | Microsoft Corp. (a) | | | 0.00 | | | 06/15/13 | | | 186,041 | | |
| | 400 | | | NetApp, Inc. | | | 2.00 | | | 12/15/17 | | | 399,042 | | |
| | 264 | | | Nuance Communications, Inc. | | | 2.75 | | | 11/01/31 | | | 287,925 | | |
| | 1,175 | | | Oracle Corp. | | | 1.20 | | | 10/15/17 | | | 1,179,855 | | |
| | 276 | | | SanDisk Corp. | | | 1.50 | | | 08/15/17 | | | 321,540 | | |
| | | | | | 6,017,978 | | |
| | | Utilities (6.0%) | |
| | 775 | | | Boston Gas Co. (a) | | | 4.487 | | | 02/15/42 | | | 823,083 | | |
| | 530 | | | CEZ AS (Czech Republic) (a) | | | 4.25 | | | 04/03/22 | | | 569,983 | | |
| | 495 | | | CMS Energy Corp. | | | 5.05 | | | 03/15/22 | | | 554,136 | | |
| | 280 | | | CMS Energy Corp. | | | 6.25 | | | 02/01/20 | | | 328,416 | | |
| | 730 | | | Consolidated Edison Co. of New York, Inc. | | | 6.65 | | | 04/01/19 | | | 931,212 | | |
| | 750 | | | EDP Finance BV (Portugal) (a) | | | 4.90 | | | 10/01/19 | | | 747,551 | | |
| | 675 | | | Enel Finance International N.V. (Italy) (a) | | | 5.125 | | | 10/07/19 | | | 714,402 | | |
| | 2,100 | | | Exelon Generation Co., LLC | | | 4.00 | | | 10/01/20 | | | 2,211,254 | | |
| | 975 | | | FirstEnergy Solutions Corp. | | | 6.80 | | | 08/15/39 | | | 1,099,268 | | |
| | 575 | | | Iberdrola Finance Ireland Ltd. (Spain) (a) | | | 5.00 | | | 09/11/19 | | | 603,224 | | |
| | 900 | | | PPL WEM Holdings PLC (a) | | | 3.90 | | | 05/01/16 | | | 948,489 | | |
| | 590 | | | Puget Energy, Inc. | | | 6.50 | | | 12/15/20 | | | 665,806 | | |
| | 870 | | | TransAlta Corp. (Canada) | | | 4.50 | | | 11/15/22 | | | 883,748 | | |
| | | | | | 11,080,572 | | |
| | | Total Corporate Bonds
(Cost $157,781,898) | | | 173,593,628 | | |
See Notes to Financial Statements
41
Morgan Stanley Variable Investment Series - Income Plus
Portfolio of Investments n December 31, 2012 continued
PRINCIPAL
AMOUNT
(000) | |
| | COUPON
RATE | | MATURITY
DATE | | VALUE | |
| | | Asset-Backed Securities (0.7%) | | | |
| | | CVS Pass-Through Trust | | | |
$ | 993 | | | | | | 6.036 | % | | 12/10/28 | | $ | 1,163,796 | | |
| | 112 | | | (a) | | | 8.353 | | | 07/10/31 | | | 155,391 | | |
| | | Total Asset-Backed Securities
(Cost $1,105,466) | | | 1,319,187 | | |
| | | Municipal Bond (0.4%) | | | |
| | 600 | | | State of California, General Obligation Bonds
(Cost $603,036) | | | 5.95 | | | 04/01/16 | | | 680,886 | | |
| | | Agency Fixed Rate Mortgage (0.0%) | | | |
| | 1 | | | Federal Home Loan Mortgage Corporation,
Gold Pool
(Cost $1,394) | | | 6.50 | | | 12/01/28 | | | 1,577 | | |
NUMBER OF
SHARES | | | | | | | |
| |
| | | Convertible Preferred Stocks (0.5%) | | | |
| | | Diversified Financial Services (0.2%) | | | |
| | 350 | | | Bank of America Corp., Series L | | | | | | | | | | | 397,250 | | |
| | | Electric Utilities (0.1%) | | | |
| | 4,430 | | | PPL Corp. | | | | | | | | | | | 231,733 | | |
| | | Oil, Gas & Consumable Fuels (0.2%) | | | |
| | 5,855 | | | Apache Corp., Series D | | | | | | | | | | | 267,574 | | |
| | | Total Convertible Preferred Stocks
(Cost $867,225) | | | 896,557 | | |
PRINCIPAL
AMOUNT
(000) | |
| |
| |
| |
| |
| | | Short-Term Investments (3.4%) | | | |
| | | U.S. Treasury Securities (0.1%) | | | |
| | | | | U.S. Treasury Bills | | | | | | | | | | | | | |
$ | 35 | | | (e)(f) | | | 0.113 | | | 02/21/13 | | | 34,994 | | |
| | 10 | | | (e)(f) | | | 0.117 | | | 02/21/13 | | | 9,998 | | |
| | 10 | | | (e)(f) | | | 0.119 | | | 02/21/13 | | | 9,998 | | |
| | 20 | | | (e)(f) | | | 0.12 | | | 02/21/13 | | | 19,997 | | |
| | 20 | | | (e)(f) | | | 0.12 | | | 02/21/13 | | | 19,997 | | |
See Notes to Financial Statements
42
Morgan Stanley Variable Investment Series - Income Plus
Portfolio of Investments n December 31, 2012 continued
PRINCIPAL
AMOUNT
(000) | |
| | COUPON
RATE | | MATURITY
DATE | | VALUE | |
$ | 20 | | | (e)(f) | | | 0.122 | % | | 02/21/13 | | $ | 19,997 | | |
| | 25 | | | (e)(f) | | | 0.128 | | | 02/21/13 | | | 24,995 | | |
| | 165 | | | (e)(f) | | | 0.129 | | | 02/21/13 | | | 164,970 | | |
| | | Total U.S. Treasury Securities
(Cost $304,946) | | | 304,946 | | |
NUMBER OF
SHARES (000) | |
| |
| |
| |
| |
| | | Investment Company (3.3%) | | | |
| | 6,041 | | | Morgan Stanley Institutional Liquidity Funds - Money
Market Portfolio - Institutional Class (See Note 6)
(Cost $6,041,017) | | | 6,041,017 | | |
| | | Total Short-Term Investments
(Cost $6,345,963) | | | 6,345,963 | | |
| | | | | Total Investments
(Cost $166,704,982) (g) | | | | | 99.2 | % | | | 182,837,798 | | |
| | | | | Other Assets in Excess of Liabilities | | | | | 0.8 | | | | 1,506,906 | | |
| | | | | Net Assets | | | | | 100.0 | % | | $ | 184,344,704 | | |
MTN Medium Term Note.
PJSC Public Joint Stock Company.
REIT Real Estate Investment Trust.
(a) 144A security — Certain conditions for public sale may exist. Unless otherwise noted, these securities are deemed to be liquid.
(b) Security trades on the Hong Kong exchange.
(c) Variable/Floating Rate Security — Interest rate changes on these instruments are based on changes in a designated base rate. The rates shown are those in effect on December 31, 2012.
(d) Perpetual — Security does not have a predetermined maturity date. Rate for this security is fixed for a period of time then reverts to a floating rate. The interest shown is the rate in effect at December 31, 2012.
(e) All or a portion of this security has been physically segregated in connection with open futures contracts.
(f) Rate shown is the yield to maturity at December 31, 2012.
(g) Securities are available for collateral in connection with open foreign currency exchange contracts, futures contracts and swap agreements.
See Notes to Financial Statements
43
Morgan Stanley Variable Investment Series - Income Plus
Portfolio of Investments n December 31, 2012 continued
FOREIGN CURRENCY EXCHANGE CONTRACTS OPEN AT DECEMBER 31, 2012:
COUNTERPARTY | | CONTRACTS
TO DELIVER | | IN EXCHANGE
FOR | | DELIVERY
DATE | | UNREALIZED
DEPRECIATION | |
Wells Fargo Bank | | EUR | 396,597 | | | $ | 518,547 | | | 01/10/13 | | $ | (4,972 | ) | |
FUTURES CONTRACTS OPEN AT DECEMBER 31, 2012:
NUMBER OF
CONTRACTS | | LONG/SHORT | | DESCRIPTION, DELIVERY
MONTH AND YEAR | | UNDERLYING FACE
AMOUNT AT VALUE | | UNREALIZED
APPRECIATION
(DEPRECIATION) | |
| | 142 | | | Long | | U.S. Treasury 2 yr. Note,
Mar-13 | | $ | 31,306,562 | | | $ | 6,297 | | |
| | 242 | | | Long | | U.S. Treasury 5 yr. Note,
Mar-13 | | | 30,108,203 | | | | (45,704 | ) | |
| | 74 | | | Long | | U.S. Treasury Ultra Long Bond,
Mar-13 | | | 12,031,938 | | | | (219,110 | ) | |
| | 25 | | | Short | | U.S. Treasury 30 yr. Bond,
Mar-13 | | | (3,687,500 | ) | | | 44,930 | | |
| | 282 | | | Short | | U.S. Treasury 10 yr. Note,
Mar-13 | | | (37,444,312 | ) | | | 133,884 | | |
Net Unrealized Depreciation | | $ | (79,703 | ) | |
CREDIT DEFAULT SWAP AGREEMENTS OPEN AT DECEMBER 31, 2012:
SWAP
COUNTERPARTY &
REFERENCE
OBLIGATION | | BUY/SELL
PROTECTION | | NOTIONAL
AMOUNT
(000'S) | | INTEREST
RATE | | TERMINATION
DATE | | UNREALIZED
APPRECIATION | | UPFRONT
PAYMENTS | | VALUE | | CREDIT
RATING OF
REFERENCE
OBLIGATION† | |
| | | | | | | | | | | | | | | | | (unaudited) | |
JPMorgan Chase Bank
CDX.NA. IG. 19 | | Sell | | $ | 1,975 | | | | 1.00 | % | | 12/20/2017 | | $ | 3,470 | | | $ | 1,569 | | | $ | 5,039 | | | NR | |
JPMorgan Chase Bank
Kohl's Corporate | | Buy | | | 1,975 | | | | 1.00 | | | 12/20/2017 | | | 62,877 | | | | 68,430 | | | | 131,307 | | | BBB+ | |
Total Credit Default Swaps | | | | $ | 3,950 | | | | | | | $ | 66,347 | | | $ | 69,999 | | | $ | 136,346 | | | | |
See Notes to Financial Statements
44
Morgan Stanley Variable Investment Series - Income Plus
Portfolio of Investments n December 31, 2012 continued
INTEREST RATE SWAP AGREEMENTS OPEN AT DECEMBER 31, 2012:
SWAP COUNTERPARTY | | NOTIONAL
AMOUNT
(000) | | FLOATING
RATE INDEX | | PAY/RECEIVE
FLOATING RATE | | FIXED
RATE | | TERMINATION
DATE | | UNREALIZED
DEPRECIATION | |
Barclays Capital | | $ | 3,870 | | | 3 Month LIBOR | | Receive | | | 0.81 | % | | 09/24/17 | | $ | (13,600 | ) | |
Credit Suisse | | | 12,200 | | | 3 Month LIBOR | | Receive | | | 0.39 | | | 09/25/14 | | | (19,420 | ) | |
Credit Suisse | | | 5,820 | | | 3 Month LIBOR | | Receive | | | 0.82 | | | 09/13/17 | | | (24,540 | ) | |
Deutsche Bank | | | 9,834 | | | 3 Month LIBOR | | Receive | | | 0.82 | | | 07/24/17 | | | (61,956 | ) | |
Goldman Sachs | | | 2,200 | | | 3 Month LIBOR | | Receive | | | 2.42 | | | 03/22/22 | | | (155,013 | ) | |
JPMorgan Chase | | | 1,069 | | | 3 Month LIBOR | | Receive | | | 2.43 | | | 03/22/22 | | | (76,806 | ) | |
Total Unrealized Depreciation | | | | | | | | | | | | $ | (351,335 | ) | |
LIBOR London Interbank Offered Rate.
NR Not Rated.
† Credit rating as issued by Standard & Poor's.
Currency Abbreviations:
EUR Euro.
LONG TERM CREDIT ANALYSIS+ | |
AAA | | | 0.1 | % | |
AA | | | 4.3 | | |
A | | | 33.1 | | |
BBB | | | 50.2 | | |
BB | | | 6.2 | | |
B or below | | | 2.1 | | |
Not Rated | | | 4.0 | | |
| | | | 100.0 | %++ | |
+ The ratings shown are based on the Portfolio's security ratings as determined by Standard & Poor's, Moody's or Fitch, each a Nationally Recognized Statistical Ratings Organization ("NRSRO").
++ Does not include open foreign currency exchange contracts with total unrealized depreciation of $4,972. Does not include open long/short futures contracts with an underlying face amount of $114,578,515 with net unrealized depreciation of $79,703. Also does not include open swap agreements with net unrealized depreciation of $284,988.
See Notes to Financial Statements
45
Morgan Stanley Variable Investment Series - Global Infrastructure
Portfolio of Investments n December 31, 2012
NUMBER OF
SHARES | |
| | VALUE | |
| | | Common Stocks (98.1%)
Australia (5.6%) | |
| | | Airports | |
| | 259,722 | | | Sydney Airport | | $ | 916,609 | | |
| | | Diversified | |
| | 355,726 | | | DUET Group | | | 773,006 | | |
| | | Oil & Gas Storage &
Transportation | |
| | 114,509 | | | APA Group | | | 660,979 | | |
| | | Toll Roads | |
| | 75,579 | | | Macquarie Atlas Roads
Group (a) | | | 131,587 | | |
| | 240,858 | | | Transurban Group | | | 1,529,719 | | |
| | | | 1,661,306 | | |
| | | | | Total Australia | | | 4,011,900 | | |
| | | Brazil (0.4%) | |
| | | Water | |
| | 3,000 | | | Cia de Saneamento Basico do
Estado de Sao Paulo ADR | | | 250,710 | | |
| | | Canada (12.3%) | |
| | | Oil & Gas Storage &
Transportation | |
| | 79,240 | | | Enbridge, Inc. | | | 3,427,068 | | |
| | 114,600 | | | TransCanada Corp. | | | 5,417,203 | | |
| | | | | Total Canada | | | 8,844,271 | | |
| | | China (12.1%) | |
| | | Oil & Gas Storage &
Transportation | |
| | 777,500 | | | Beijing Enterprises
Holdings Ltd. (b) | | | 5,097,542 | | |
| | 1,253,000 | | | China Gas
Holdings Ltd. (b) | | | 995,677 | | |
| | 94,000 | | | ENN Energy
Holdings Ltd. (b) | | | 410,987 | | |
| | 1,667,400 | | | Sichuan Expressway Co., Ltd.,
H Shares (b) | | | 607,648 | | |
| | | | 7,111,854 | | |
NUMBER OF
SHARES | |
| | VALUE | |
| | | Ports | |
| | 178,293 | | | China Merchants Holdings
International Co., Ltd. (b) | | $ | 581,793 | | |
| | | Toll Roads | |
| | 1,022,000 | | | Jiangsu Expressway Co., Ltd.,
H Shares (b) | | | 1,058,544 | | |
| | | | | Total China | | | 8,752,191 | | |
| | | France (2.7%) | |
| | | Communications | |
| | 13,651 | | | Eutelsat Communications SA | | | 453,265 | | |
| | 52,735 | | | SES SA | | | 1,525,562 | | |
| | | | | Total France | | | 1,978,827 | | |
| | | Germany (0.8%) | |
| | | Airports | |
| | 10,415 | | | Fraport AG Frankfurt Airport
Services Worldwide | | | 606,497 | | |
| | | Italy (6.5%) | |
| | | Oil & Gas Storage &
Transportation | |
| | 413,226 | | | Snam SpA | | | 1,921,526 | | |
| | | Toll Roads | |
| | 67,242 | | | Atlantia SpA | | | 1,219,569 | | |
| | 72,395 | | | Societa Iniziative Autostradali
e Servizi SpA | | | 676,802 | | |
| | | | 1,896,371 | | |
| | | Transmission & Distribution | |
| | 213,020 | | | Terna Rete Elettrica
Nazionale SpA | | | 853,101 | | |
| | | | | Total Italy | | | 4,670,998 | | |
| | | Japan (1.2%) | |
| | | Oil & Gas Storage &
Transportation | |
| | 181,000 | | | Tokyo Gas Co., Ltd. | | | 827,524 | | |
| | | Netherlands (0.8%) | |
| | | Oil & Gas Storage &
Transportation | |
| | 7,866 | | | Koninklijke Vopak N.V. | | | 554,629 | | |
See Notes to Financial Statements
46
Morgan Stanley Variable Investment Series - Global Infrastructure
Portfolio of Investments n December 31, 2012 continued
NUMBER OF
SHARES | |
| | VALUE | |
| | | Spain (1.6%) | |
| | | Diversified | |
| | 33,823 | | | Ferrovial SA | | $ | 498,691 | | |
| | | Toll Roads | |
| | 39,983 | | | Abertis Infraestructuras SA | | | 666,341 | | |
| | | | | Total Spain | | | 1,165,032 | | |
| | | Switzerland (1.6%) | |
| | | Airports | |
| | 2,517 | | | Flughafen Zuerich AG
(Registered) | | | 1,165,970 | | |
| | | United Kingdom (8.7%) | |
| | | Transmission & Distribution | |
| | 406,620 | | | National Grid PLC | | | 4,657,599 | | |
| | | Water | |
| | 32,160 | | | Severn Trent PLC | | | 823,948 | | |
| | 75,080 | | | United Utilities Group PLC | | | 823,872 | | |
| | | | 1,647,820 | | |
| | | | | Total United Kingdom | | | 6,305,419 | | |
| | | United States (43.8%) | |
| | | Communications | |
| | 45,100 | | | American Tower Corp. REIT | | | 3,484,877 | | |
| | 24,400 | | | Crown Castle International
Corp. (a) | | | 1,760,704 | | |
| | 32,520 | | | SBA Communications Corp.,
Class A (a) | | | 2,309,570 | | |
| | | | 7,555,151 | | |
| | | Diversified | |
| | 57,760 | | | CenterPoint Energy, Inc. | | | 1,111,880 | | |
| | | Oil & Gas Storage &
Transportation | |
| | 10,580 | | | AGL Resources, Inc. | | | 422,883 | | |
| | 4,940 | | | Atmos Energy Corp. | | | 173,493 | | |
| | 22,460 | | | Cheniere Energy, Inc. (a) | | | 421,799 | | |
| | 63,052 | | | Enbridge Energy
Management LLC (a) | | | 1,821,572 | | |
| | 65,320 | | | Kinder Morgan, Inc. | | | 2,307,756 | | |
NUMBER OF
SHARES | |
| | VALUE | |
| | 9,120 | | | New Jersey Resources Corp. | | $ | 361,334 | | |
| | 38,450 | | | NiSource, Inc. | | | 957,020 | | |
| | 32,540 | | | Oneok, Inc. | | | 1,391,085 | | |
| | 41,070 | | | PG&E Corp. | | | 1,650,193 | | |
| | 34,790 | | | Sempra Energy | | | 2,468,003 | | |
| | 87,996 | | | Spectra Energy Corp. | | | 2,409,330 | | |
| | 8,270 | | | WGL Holdings, Inc. | | | 324,101 | | |
| | 80,100 | | | Williams Cos., Inc. (The) | | | 2,622,474 | | |
| | | | 17,331,043 | | |
| | | Transmission & Distribution | | | |
| | 11,144 | | | Consolidated Edison, Inc. | | | 618,938 | | |
| | 19,080 | | | ITC Holdings Corp. | | | 1,467,443 | | |
| | 62,988 | | | Northeast Utilities | | | 2,461,571 | | |
| | | | 4,547,952 | | |
| | | Water | | | |
| | 23,650 | | | American Water
Works Co., Inc. | | | 878,124 | | |
| | 10,350 | | | California Water Service Group | | | 189,923 | | |
| | | | 1,068,047 | | |
| | | | | Total United States | | | 31,614,073 | | |
| | | | | Total Common Stocks
(Cost $54,237,466) | | | 70,748,041 | | |
NUMBER OF
SHARES (000) | | | | | |
| | | Short-Term Investment (1.8%) | | | |
| | | Investment Company | | | |
| | 1,301 | | | Morgan Stanley Institutional
Liquidity Funds - Treasury
Portfolio - Institutional
Class (See Note 6)
(Cost $1,300,782) | | | 1,300,782 | | |
Total Investments
(Cost $55,538,248) (c) | | | 99.9 | % | | | 72,048,823 | | |
Other Assets in Excess of
Liabilities | | | 0.1 | | | | 84,480 | | |
Net Assets | | | 100.0 | % | | $ | 72,133,303 | | |
See Notes to Financial Statements
47
Morgan Stanley Variable Investment Series - Global Infrastructure
Portfolio of Investments n December 31, 2012 continued
ADR American Depositary Receipt.
REIT Real Estate Investment Trust.
(a) Non-income producing security.
(b) Security trades on the Hong Kong exchange.
(c) The fair value and percentage of net assets, $30,038,987 and 41.6%, respectively, represent the securities that have been fair valued under the fair valuation policy for international investments as described in Note 1A within the Notes to the Financial Statements.
SUMMARY OF INVESTMENTS
INDUSTRY | | VALUE | | PERCENT OF
TOTAL
INVESTMENTS | |
Oil & Gas Storage &
Transportation | | $ | 37,251,826 | | | | 51.7 | % | |
Transmission & Distribution | | | 10,058,652 | | | | 14.0 | | |
Communications | | | 9,533,978 | | | | 13.3 | | |
Toll Roads | | | 5,282,562 | | | | 7.3 | | |
Water | | | 2,966,577 | | | | 4.1 | | |
Airports | | | 2,689,076 | | | | 3.7 | | |
Diversified | | | 2,383,577 | | | | 3.3 | | |
Investment Company | | | 1,300,782 | | | | 1.8 | | |
Ports | | | 581,793 | | | | 0.8 | | |
| | | $ | 72,048,823 | | | | 100.0 | % | |
See Notes to Financial Statements
48
Morgan Stanley Variable Investment Series - European Equity
Portfolio of Investments n December 31, 2012
NUMBER OF
SHARES | |
| | VALUE | |
| | | Common Stocks (98.8%)
Belgium (2.0%) | |
| | | Metals & Mining | |
| | 18,630 | | | Umicore SA | | $ | 1,027,275 | | |
| | | Finland (1.9%) | |
| | | Machinery | |
| | 13,264 | | | Kone Oyj, Class B | | | 982,167 | | |
| | | France (12.9%) | |
| | | Commercial Banks | |
| | 25,716 | | | BNP Paribas SA | | | 1,449,538 | | |
| | 28,086 | | | Societe Generale SA (a) | | | 1,056,433 | | |
| | | | 2,505,971 | | |
| | | Electrical Equipment | |
| | 17,844 | | | Schneider Electric SA | | | 1,330,869 | | |
| | | Hotels, Restaurants & Leisure | |
| | 20,869 | | | Accor SA | | | 748,582 | | |
| | | Insurance | |
| | 66,113 | | | AXA SA | | | 1,195,849 | | |
| | | Media | |
| | 31,082 | | | SES SA | | | 899,166 | | |
| | | | | Total France | | | 6,680,437 | | |
| | | Germany (16.1%) | |
| | | Automobiles | |
| | 22,594 | | | Daimler AG (Registered) | | | 1,234,644 | | |
| | 5,575 | | | Volkswagen AG (Preference) | | | 1,268,345 | | |
| | | | 2,502,989 | | |
| | | Health Care Providers &
Services | |
| | 8,510 | | | Fresenius SE & Co., KGaA | | | 979,442 | | |
| | | Industrial Conglomerates | |
| | 15,140 | | | Siemens AG (Registered) | | | 1,645,561 | | |
| | | Insurance | |
| | 6,279 | | | Muenchener
Rueckversicherungs AG
(Registered) | | | 1,127,354 | | |
| | | Machinery | |
| | 6,399 | | | MAN SE | | | 684,238 | | |
NUMBER OF
SHARES | |
| | VALUE | |
| | | Pharmaceuticals | |
| | 14,958 | | | Bayer AG (Registered) | | $ | 1,420,449 | | |
| | | | | Total Germany | | | 8,360,033 | | |
| | | Netherlands (4.7%) | |
| | | Food Products | |
| | 69,127 | | | DE Master Blenders
1753 N.V. (a) | | | 804,088 | | |
| | | Media | |
| | 63,650 | | | Reed Elsevier N.V. | | | 943,038 | | |
| | | Metals & Mining | |
| | 41,164 | | | ArcelorMittal | | | 712,592 | | |
| | | | | Total Netherlands | | | 2,459,718 | | |
| | | Portugal (1.4%) | |
| | | Oil, Gas & Consumable Fuels | |
| | 46,436 | | | Galp Energia SGPS SA | | | 721,384 | | |
| | | Spain (4.3%) | |
| | | Commercial Banks | |
| | 146,370 | | | Banco Bilbao Vizcaya
Argentaria SA (b) | | | 1,343,727 | | |
| | | Information Technology
Services | |
| | 35,187 | | | Amadeus IT Holding SA,
Class A (b) | | | 882,992 | | |
| | | | | Total Spain | | | 2,226,719 | | |
| | | Sweden (1.4%) | |
| | | Wireless Telecommunication
Services | |
| | 8,681 | | | Millicom International Cellular
SA SDR | | | 754,520 | | |
| | | Switzerland (14.6%) | |
| | | Food Products | |
| | 37,511 | | | Nestle SA (Registered) | | | 2,444,746 | | |
| | | Insurance | |
| | 4,546 | | | Zurich Insurance
Group AG (a) | | | 1,215,562 | | |
See Notes to Financial Statements
49
Morgan Stanley Variable Investment Series - European Equity
Portfolio of Investments n December 31, 2012 continued
NUMBER OF
SHARES | |
| | VALUE | |
| | | Pharmaceuticals | |
| | 31,650 | | | Novartis AG (Registered) | | $ | 2,003,810 | | |
| | 9,359 | | | Roche Holding AG
(Genusschein) | | | 1,906,661 | | |
| | | | 3,910,471 | | |
| | | | | Total Switzerland | | | 7,570,779 | | |
| | | United Kingdom (39.5%) | |
| | | Aerospace & Defense | |
| | 67,924 | | | Rolls-Royce Holdings PLC (a) | | | 978,666 | | |
| | | Commercial Banks | |
| | 326,647 | | | Barclays PLC | | | 1,410,587 | | |
| | 216,026 | | | HSBC Holdings PLC | | | 2,284,870 | | |
| | | | 3,695,457 | | |
| | | Household Products | |
| | 20,238 | | | Reckitt Benckiser
Group PLC | | | 1,267,784 | | |
| | | Insurance | |
| | 90,434 | | | Prudential PLC | | | 1,261,851 | | |
| | | Metals & Mining | |
| | 63,567 | | | Xstrata PLC | | | 1,130,607 | | |
| | | Oil, Gas & Consumable Fuels | |
| | 68,434 | | | BG Group PLC | | | 1,147,519 | | |
| | 254,411 | | | BP PLC | | | 1,762,753 | | |
| | 51,239 | | | Royal Dutch Shell PLC,
Class A | | | 1,810,506 | | |
| | 43,783 | | | Tullow Oil PLC | | | 891,613 | | |
| | | | 5,612,391 | | |
| | | Pharmaceuticals | |
| | 67,310 | | | GlaxoSmithKline PLC | | | 1,461,407 | | |
| | | Professional Services | |
| | 60,661 | | | Experian PLC | | | 980,115 | | |
| | | Tobacco | |
| | 29,247 | | | British American
Tobacco PLC | | | 1,481,947 | | |
| | 26,926 | | | Imperial Tobacco Group PLC | | | 1,039,743 | | |
| | | | 2,521,690 | | |
NUMBER OF
SHARES | |
| | VALUE | |
| | | Wireless Telecommunication
Services | |
| | 634,664 | | | Vodafone Group PLC | | $ | 1,596,095 | | |
| | | | | Total United Kingdom | | | 20,506,063 | | |
| | | | | Total Common Stocks
(Cost $40,065,159) | | | 51,289,095 | | |
PRINCIPAL
AMOUNT
(000) | | | | | |
| | | Short-Term Investments (1.9%)
Securities held as Collateral
on Loaned Securities (0.9%) | |
| | | Repurchase Agreements (0.1%) | |
$ | 26 | | | Barclays Capital, Inc. (0.20%,
dated 12/31/12, due
01/02/13; proceeds
$26,225; fully collateralized
by a U.S. Government
Obligation; U.S. Treasury
Note 2.00% due 01/31/16;
valued at $26,750) | | | 26,225 | | |
| | 18 | | | Merrill Lynch & Co., Inc.
(0.20%, dated 12/31/12,
due 01/02/13; proceeds
$18,358; fully collateralized
by a U.S. Government
Agency; Federal National
Mortgage Association
2.50% due 08/01/27;
valued at $18,725) | | | 18,358 | | |
| | | | | Total Repurchase
Agreements
(Cost $44,583) | | | 44,583 | | |
See Notes to Financial Statements
50
Morgan Stanley Variable Investment Series - European Equity
Portfolio of Investments n December 31, 2012 continued
NUMBER OF
SHARES (000) | |
| | VALUE | |
| | | Investment Company (0.8%) | | | |
| | 463 | | | Morgan Stanley Institutional
Liquidity Funds - Money
Market Portfolio - Institutional
Class (See Note 6)
(Cost $462,965) | | $ | 462,965 | | |
| | | Total Securities held as
Collateral on Loaned
Securities
(Cost $507,548) | | | 507,548 | | |
| | | Investment Company (1.0%) | | | |
| | 498 | | | Morgan Stanley Institutional
Liquidity Funds - Money
Market Portfolio - Institutional
Class (See Note 6)
(Cost $498,454) | | | 498,454 | | |
| | | Total Short-Term
Investments
(Cost $1,006,002) | | | 1,006,002 | | |
Total Investments
(Cost $41,071,161) (c) | | | 100.7 | % | | | 52,295,097 | | |
Liabilities in Excess of
Other Assets | | | (0.7 | ) | | | (381,810 | ) | |
Net Assets | | | 100.0 | % | | $ | 51,913,287 | | |
SDR Swedish Depositary Receipt.
(a) Non-income producing security.
(b) All or a portion of this security was on loan at December 31, 2012.
(c) The fair value and percentage of net assets, $51,289,095 and 98.8%, respectively, represent the securities that have been fair valued under the fair valuation policy for international investments as described in Note 1A within the Notes to the Financial Statements.
SUMMARY OF INVESTMENTS
INDUSTRY | | VALUE | | PERCENT OF
TOTAL
INVESTMENTS | |
Commercial Banks | | $ | 7,545,155 | | | | 14.6 | % | |
Pharmaceuticals | | | 6,792,327 | | | | 13.1 | | |
Oil, Gas &
Consumable Fuels | | | 6,333,775 | | | | 12.2 | | |
Insurance | | | 4,800,616 | | | | 9.3 | | |
Food Products | | | 3,248,834 | | | | 6.3 | | |
Metals & Mining | | | 2,870,474 | | | | 5.5 | | |
Tobacco | | | 2,521,690 | | | | 4.9 | | |
Automobiles | | | 2,502,989 | | | | 4.8 | | |
Wireless Telecommunication
Services | | | 2,350,615 | | | | 4.5 | | |
Media | | | 1,842,204 | | | | 3.6 | | |
Machinery | | | 1,666,405 | | | | 3.2 | | |
Industrial Conglomerates | | | 1,645,561 | | | | 3.2 | | |
Electrical Equipment | | | 1,330,869 | | | | 2.6 | | |
Household Products | | | 1,267,784 | | | | 2.4 | | |
Professional Services | | | 980,115 | | | | 1.9 | | |
Health Care Providers &
Services | | | 979,442 | | | | 1.9 | | |
Aerospace & Defense | | | 978,666 | | | | 1.9 | | |
Information Technology
Services | | | 882,992 | | | | 1.7 | | |
Hotels, Restaurants &
Leisure | | | 748,582 | | | | 1.4 | | |
Investment Company | | | 498,454 | | | | 1.0 | | |
| | | $ | 51,787,549 | ++ | | | 100.0 | % | |
++ Does not reflect the value of securities held as collateral on loaned securities.
See Notes to Financial Statements
51
Morgan Stanley Variable Investment Series - Multi Cap Growth
Portfolio of Investments n December 31, 2012
NUMBER OF
SHARES | |
| | VALUE | |
| | | Common Stocks (97.3%) | |
| | | Advertising Agencies (0.0%) | |
| | 4,877 | | | Aimia, Inc. (Canada) | | $ | 72,907 | | |
| | | Alternative Energy (2.2%) | |
| | 73,566 | | | Range Resources Corp. | | | 4,622,152 | | |
| | | Beverage: Brewers &
Distillers (2.3%) | |
| | 408,755 | | | DE Master Blenders 1753 N.V.
(Netherlands) (a) | | | 4,754,652 | | |
| | | Biotechnology (3.2%) | |
| | 121,265 | | | Illumina, Inc. (a) | | | 6,741,121 | | |
| | | Chemicals: Diversified (3.1%) | |
| | 68,752 | | | Monsanto Co. | | | 6,507,377 | | |
| | | Commercial Services (4.7%) | |
| | 112,526 | | | Intertek Group PLC
(United Kingdom) | | | 5,678,731 | | |
| | 82,601 | | | Weight Watchers
International, Inc. | | | 4,324,988 | | |
| | | | 10,003,719 | | |
| | | Communications
Technology (3.9%) | |
| | 148,061 | | | Motorola Solutions, Inc. | | | 8,244,036 | | |
| | | Computer Services,
Software & Systems (23.9%) | |
| | 54,746 | | | Baidu, Inc. ADR (China) (a) | | | 5,490,476 | | |
| | 457,388 | | | Facebook, Inc., Class A (a) | | | 12,180,242 | | |
| | 19,340 | | | Google, Inc., Class A (a) | | | 13,719,216 | | |
| | 50,038 | | | LinkedIn Corp., Class A (a) | | | 5,745,363 | | |
| | 35,270 | | | Salesforce.com, Inc. (a) | | | 5,928,887 | | |
| | 109,244 | | | Solera Holdings, Inc. | | | 5,841,277 | | |
| | 25,355 | | | Workday, Inc. (a) | | | 1,381,848 | | |
| | | | 50,287,309 | | |
| | | Computer Technology (9.9%) | |
| | 30,689 | | | Apple, Inc. | | | 16,358,158 | | |
| | 203,181 | | | Yandex N.V., Class A
(Russia) (a) | | | 4,382,614 | | |
| | | | 20,740,772 | | |
NUMBER OF
SHARES | |
| | VALUE | |
| | | Consumer Lending (7.4%) | |
| | 15,528 | | | Mastercard, Inc., Class A | | $ | 7,628,596 | | |
| | 52,831 | | | Visa, Inc., Class A | | | 8,008,123 | | |
| | | | 15,636,719 | | |
| | | Diversified Retail (12.7%) | |
| | 69,078 | | | Amazon.com, Inc. (a) | | | 17,348,249 | | |
| | 498,047 | | | Groupon, Inc. (a) | | | 2,430,469 | | |
| | 11,246 | | | Priceline.com, Inc. (a) | | | 6,986,015 | | |
| | | | 26,764,733 | | |
| | | Financial Data &
Systems (4.9%) | |
| | 150,780 | | | MSCI, Inc. (a) | | | 4,672,672 | | |
| | 110,974 | | | Verisk Analytics, Inc.,
Class A (a) | | | 5,659,674 | | |
| | | | 10,332,346 | | |
| | | Health Care Services (3.9%) | |
| | 110,870 | | | athenahealth, Inc. (a) | | | 8,143,402 | | |
| | | Insurance:
Property-Casualty (0.4%) | |
| | 43,918 | | | Progressive Corp. (The) | | | 926,670 | | |
| | | Medical Equipment (2.9%) | |
| | 12,518 | | | Intuitive Surgical, Inc. (a) | | | 6,138,452 | | |
| | | Real Estate Investment
Trusts (REIT) (3.8%) | |
| | 217,520 | | | Brookfield Asset
Management, Inc., Class A
(Canada) | | | 7,972,108 | | |
| | | Recreational Vehicles &
Boats (3.7%) | |
| | 248,045 | | | Edenred (France) | | | 7,713,486 | | |
| | | Restaurants (2.6%) | |
| | 103,898 | | | Starbucks Corp. | | | 5,571,011 | | |
| | | Semiconductors &
Components (1.8%) | |
| | 121,369 | | | First Solar, Inc. (a) | | | 3,747,875 | | |
| | | | | Total Common Stocks
(Cost $145,395,962) | | | 204,920,847 | | |
See Notes to Financial Statements
52
Morgan Stanley Variable Investment Series - Multi Cap Growth
Portfolio of Investments n December 31, 2012 continued
NUMBER OF
SHARES | |
| | VALUE | |
| | | Convertible Preferred
Stocks (0.8%) | | | |
| | | Alternative Energy (0.1%) | | | |
| | 586,326 | | | Better Place, Inc. (a)(b)(c)
(acquisition cost - $1,465,815;
acquired 01/25/10) | | $ | 175,898 | | |
| | | Computer Services,
Software & Systems (0.7%) | | | |
| | 28,236 | | | Workday, Inc. (a)(b)(c)
(acquisition cost - $374,409;
acquired 10/12/11) | | | 1,436,365 | | |
| | | | | Total Convertible
Preferred Stocks
(Cost $1,840,224) | | | 1,612,263 | | |
NUMBER OF
SHARES (000) | | | | | |
| | | Short-Term Investment (2.1%) | | | |
| | | Investment Company | | | |
| | 4,451 | | | Morgan Stanley Institutional
Liquidity Funds - Money
Market Portfolio - Institutional
Class (See Note 6)
(Cost $4,451,243) | | | 4,451,243 | | |
Total Investments
(Cost $151,687,429) (d) | | | 100.2 | % | | | 210,984,353 | | |
Liabilities in Excess of
Other Assets | | | (0.2 | ) | | | (510,786 | ) | |
Net Assets | | | 100.0 | % | | $ | 210,473,567 | | |
ADR American Depositary Receipt.
(a) Non-income producing security.
(b) Security cannot be offered for public resale without first being registered under the Securities Act of 1933 and related rules ("restricted security"). Acquisition date represents the day on which an enforceable right to acquire such security is obtained and is presented along with related cost in the security description. The Portfolio has registration rights for certain restricted securities. Any costs related to such registration are borne by the issuer. The aggregate value of restricted securities (excluding 144A holdings) at December 31, 2012 amounts to $1,612,263 and represents 0.8% of net assets.
(c) At December 31, 2012, the Portfolio held fair valued securities valued at $1,612,263, representing 0.8% of net assets. These securities have been fair valued as determined in good faith under procedures established by and under the general supervision of the Fund's Trustees.
(d) The fair value and percentage of net assets, $18,146,869 and 8.6%, respectively, represent the securities that have been fair valued under the fair valuation policy for international investments as described in Note 1A within the Notes to the Financial Statements.
See Notes to Financial Statements
53
Morgan Stanley Variable Investment Series - Multi Cap Growth
Portfolio of Investments n December 31, 2012 continued
INDUSTRY | | VALUE | | PERCENT OF
TOTAL
INVESTMENTS | |
Computer Services,
Software & Systems | | $ | 51,723,674 | | | | 24.5 | % | |
Diversified Retail | | | 26,764,733 | | | | 12.7 | | |
Computer Technology | | | 20,740,772 | | | | 9.8 | | |
Consumer Lending | | | 15,636,719 | | | | 7.4 | | |
Financial Data & Systems | | | 10,332,346 | | | | 4.9 | | |
Commercial Services | | | 10,003,719 | | | | 4.7 | | |
Communications
Technology | | | 8,244,036 | | | | 3.9 | | |
Health Care Services | | | 8,143,402 | | | | 3.9 | | |
Real Estate Investment
Trusts (REIT) | | | 7,972,108 | | | | 3.8 | | |
Recreational Vehicles &
Boats | | | 7,713,486 | | | | 3.7 | | |
Biotechnology | | | 6,741,121 | | | | 3.2 | | |
INDUSTRY | | VALUE | | PERCENT OF
TOTAL
INVESTMENTS | |
Chemicals: Diversified | | $ | 6,507,377 | | | | 3.1 | % | |
Medical Equipment | | | 6,138,452 | | | | 2.9 | | |
Restaurants | | | 5,571,011 | | | | 2.6 | | |
Alternative Energy | | | 4,798,050 | | | | 2.3 | | |
Beverage: Brewers &
Distillers | | | 4,754,652 | | | | 2.3 | | |
Investment Company | | | 4,451,243 | | | | 2.1 | | |
Semiconductors &
Components | | | 3,747,875 | | | | 1.8 | | |
Insurance:
Property-Casualty | | | 926,670 | | | | 0.4 | | |
Advertising Agencies | | | 72,907 | | | | 0.0 | | |
| | | $ | 210,984,353 | | | | 100.0 | % | |
See Notes to Financial Statements
54
Morgan Stanley Variable Investment Series - Aggressive Equity
Portfolio of Investments n December 31, 2012
NUMBER OF
SHARES | |
| | VALUE | |
| | | Common Stocks (98.4%) | |
| | | Advertising Agencies (0.0%) | |
| | 614 | | | Aimia, Inc. (Canada) | | $ | 9,179 | | |
| | | Alternative Energy (2.2%) | |
| | 9,333 | | | Range Resources Corp. | | | 586,392 | | |
| | | Beverage: Brewers &
Distillers (2.3%) | |
| | 51,836 | | | DE Master Blenders 1753 N.V.
(Netherlands) (a) | | | 602,958 | | |
| | | Biotechnology (3.2%) | |
| | 15,378 | | | Illumina, Inc. (a) | | | 854,863 | | |
| | | Chemicals: Diversified (3.1%) | |
| | 8,719 | | | Monsanto Co. | | | 825,253 | | |
| | | Commercial Services (4.8%) | |
| | 14,323 | | | Intertek Group PLC (United
Kingdom) | | | 722,824 | | |
| | 10,475 | | | Weight Watchers
International, Inc. | | | 548,471 | | |
| | | | 1,271,295 | | |
| | | Communications
Technology (4.0%) | |
| | 18,776 | | | Motorola Solutions, Inc. | | | 1,045,448 | | |
| | | Computer Services,
Software & Systems (24.1%) | |
| | 6,943 | | | Baidu, Inc. ADR (China) (a) | | | 696,313 | | |
| | 57,917 | | | Facebook, Inc., Class A (a) | | | 1,542,330 | | |
| | 2,453 | | | Google, Inc., Class A (a) | | | 1,740,085 | | |
| | 6,373 | | | LinkedIn Corp., Class A (a) | | | 731,748 | | |
| | 4,473 | | | Salesforce.com, Inc. (a) | | | 751,911 | | |
| | 13,738 | | | Solera Holdings, Inc. | | | 734,571 | | |
| | 3,215 | | | Workday, Inc. (a) | | | 175,217 | | |
| | | | 6,372,175 | | |
| | | Computer Technology (10.0%) | |
| | 3,892 | | | Apple, Inc. | | | 2,074,552 | | |
| | 25,766 | | | Yandex N.V., Class A
(Russia) (a) | | | 555,772 | | |
| | | | 2,630,324 | | |
NUMBER OF
SHARES | |
| | VALUE | |
| | | Consumer Lending (7.5%) | |
| | 1,976 | | | Mastercard, Inc., Class A | | $ | 970,769 | | |
| | 6,723 | | | Visa, Inc., Class A | | | 1,019,073 | | |
| | | | 1,989,842 | | |
| | | Diversified Retail (12.8%) | |
| | 8,760 | | | Amazon.com, Inc. (a) | | | 2,199,986 | | |
| | 62,918 | | | Groupon, Inc. (a) | | | 307,040 | | |
| | 1,428 | | | Priceline.com, Inc. (a) | | | 887,074 | | |
| | | | 3,394,100 | | |
| | | Financial Data &
Systems (5.0%) | |
| | 19,121 | | | MSCI, Inc. (a) | | | 592,560 | | |
| | 14,070 | | | Verisk Analytics, Inc.,
Class A (a) | | | 717,570 | | |
| | | | 1,310,130 | | |
| | | Health Care Services (3.9%) | |
| | 14,095 | | | athenahealth, Inc. (a) | | | 1,035,278 | | |
| | | Insurance:
Property-Casualty (0.5%) | |
| | 5,567 | | | Progressive Corp. (The) | | | 117,464 | | |
| | | Medical Equipment (3.0%) | |
| | 1,587 | | | Intuitive Surgical, Inc. (a) | | | 778,217 | | |
| | | Real Estate Investment Trusts
(REIT) (3.8%) | |
| | 27,678 | | | Brookfield Asset Management,
Inc., Class A (Canada) | | | 1,014,399 | | |
| | | Recreational Vehicles &
Boats (3.7%) | |
| | 31,456 | | | Edenred (France) | | | 978,191 | | |
| | | Restaurants (2.7%) | |
| | 13,174 | | | Starbucks Corp. | | | 706,390 | | |
| | | Semiconductors &
Components (1.8%) | |
| | 15,423 | | | First Solar, Inc. (a) | | | 476,262 | | |
| | | | | Total Common Stocks
(Cost $18,780,683) | | | 25,998,160 | | |
See Notes to Financial Statements
55
Morgan Stanley Variable Investment Series - Aggressive Equity
Portfolio of Investments n December 31, 2012 continued
NUMBER OF
SHARES | |
| | VALUE | |
| | | Convertible Preferred
Stocks (0.7%) | | | |
| | | Alternative Energy (0.1%) | | | |
| | 70,908 | | | Better Place, Inc. (a)(b)(c)
(acquisition cost - $177,270;
acquired 01/25/10) | | $ | 21,273 | | |
| | | Computer Services,
Software & Systems (0.6%) | | | |
| | 3,313 | | | Workday, Inc. (a)(b)(c)
(acquisition cost - $43,930;
acquired 10/12/11) | | | 168,532 | | |
| | | | | Total Convertible
Preferred Stocks
(Cost $221,200) | | | 189,805 | | |
NUMBER OF
SHARES (000) | | | | | |
| | | Short-Term Investment (1.4%) | | | |
| | | Investment Company | | | |
| | 370 | | | Morgan Stanley Institutional
Liquidity Funds - Money
Market Portfolio - Institutional
Class (See Note 6)
(Cost $370,129) | | | 370,129 | | |
Total Investments
(Cost $19,372,012) (d) | | | 100.5 | % | | | 26,558,094 | | |
Liabilities in Excess of
Other Assets | | | (0.5 | ) | | | (120,160 | ) | |
Net Assets | | | 100.0 | % | | $ | 26,437,934 | | |
ADR American Depositary Receipt.
(a) Non-income producing security.
(b) Security cannot be offered for public resale without first being registered under the Securities Act of 1933 and related rules ("restricted security"). Acquisition date represents the day on which an enforceable right to acquire such security is obtained and is presented along with related cost in the security description. The Portfolio has registration rights for certain restricted securities. Any costs related to such registration are borne by the issuer. The aggregate value of restricted securities (excluding 144A holdings) at December 31, 2012 amounts to $189,805 and represents 0.7% of net assets.
(c) At December 31, 2012, the Portfolio held fair valued securities valued at $189,805, representing 0.7% of net assets. These securities have been fair valued as determined in good faith under procedures established by and under the general supervision of the Fund's Trustees.
(d) The fair value and percentage of net assets, $2,303,973 and 8.7%, respectively, represent the securities that have been fair valued under the fair valuation policy for international investments as described in Note 1A within the Notes to the Financial Statements.
See Notes to Financial Statements
56
Morgan Stanley Variable Investment Series - Aggressive Equity
Portfolio of Investments n December 31, 2012 continued
INDUSTRY | | VALUE | | PERCENT OF
TOTAL
INVESTMENTS | |
Computer Services,
Software & Systems | | $ | 6,540,707 | | | | 24.6 | % | |
Diversified Retail | | | 3,394,100 | | | | 12.8 | | |
Computer Technology | | | 2,630,325 | | | | 9.9 | | |
Consumer Lending | | | 1,989,842 | | | | 7.5 | | |
Financial Data & Systems | | | 1,310,130 | | | | 4.9 | | |
Commercial Services | | | 1,271,295 | | | | 4.8 | | |
Communications
Technology | | | 1,045,448 | | | | 3.9 | | |
Health Care Services | | | 1,035,278 | | | | 3.9 | | |
Real Estate Investment
Trusts (REIT) | | | 1,014,399 | | | | 3.8 | | |
Recreational Vehicles &
Boats | | | 978,191 | | | | 3.7 | | |
Biotechnology | | | 854,863 | | | | 3.2 | | |
INDUSTRY | | VALUE | | PERCENT OF
TOTAL
INVESTMENTS | |
Chemicals: Diversified | | $ | 825,253 | | | | 3.1 | % | |
Medical Equipment | | | 778,217 | | | | 2.9 | | |
Restaurants | | | 706,390 | | | | 2.7 | | |
Alternative Energy | | | 607,665 | | | | 2.3 | | |
Beverage: Brewers &
Distillers | | | 602,958 | | | | 2.3 | | |
Semiconductors &
Components | | | 476,262 | | | | 1.8 | | |
Investment Company | | | 370,128 | | | | 1.4 | | |
Insurance:
Property-Casualty | | | 117,464 | | | | 0.5 | | |
Advertising Agencies | | | 9,179 | | | | 0.0 | | |
| | | $ | 26,558,094 | | | | 100.0 | % | |
See Notes to Financial Statements
57
Morgan Stanley Variable Investment Series - Strategist
Portfolio of Investments n December 31, 2012
NUMBER OF
SHARES | |
| | VALUE | |
| | | Common Stocks (51.5%) | |
| | | Aerospace & Defense (1.9%) | |
| | 39,230 | | | Raytheon Co. | | $ | 2,258,079 | | |
| | | Auto Components (0.9%) | |
| | 35,180 | | | Johnson Controls, Inc. | | | 1,080,026 | | |
| | | Chemicals (1.3%) | |
| | 35,570 | | | EI du Pont de Nemours & Co. | | | 1,599,583 | | |
| | | Commercial Services & Supplies (1.0%) | |
| | 42,890 | | | Tyco International Ltd. | | | 1,254,533 | | |
| | | Computers & Peripherals (0.5%) | |
| | 40,115 | | | Hewlett-Packard Co. | | | 571,639 | | |
| | | Diversified Financial Services (2.0%) | |
| | 53,745 | | | JPMorgan Chase & Co. | | | 2,363,168 | | |
| | | Diversified Telecommunication Services (2.8%) | |
| | 29,280 | | | CenturyLink, Inc. | | | 1,145,433 | | |
| | 52,270 | | | Verizon Communications, Inc. | | | 2,261,723 | | |
| | | | 3,407,156 | | |
| | | Food & Staples Retailing (1.1%) | |
| | 73,150 | | | Safeway, Inc. | | | 1,323,284 | | |
| | | Food Products (1.4%) | |
| | 59,470 | | | ConAgra Foods, Inc. | | | 1,754,365 | | |
| | | Hotels, Restaurants & Leisure (4.2%) | |
| | 21,850 | | | McDonald's Corp. | | | 1,927,388 | | |
| | 47,480 | | | Yum! Brands, Inc. | | | 3,152,672 | | |
| | | | 5,080,060 | | |
| | | Industrial Conglomerates (1.8%) | |
| | 101,370 | | | General Electric Co. | | | 2,127,756 | | |
| | | Information Technology Services (1.6%) | |
| | 10,000 | | | International Business Machines Corp. | | | 1,915,500 | | |
| | | Insurance (2.1%) | |
| | 33,850 | | | Chubb Corp. (The) | | | 2,549,582 | | |
| | | Machinery (1.6%) | |
| | 32,025 | | | Illinois Tool Works, Inc. | | | 1,947,440 | | |
| | | Media (2.6%) | |
| | 65,280 | | | Time Warner, Inc. | | | 3,122,342 | | |
See Notes to Financial Statements
58
Morgan Stanley Variable Investment Series - Strategist
Portfolio of Investments n December 31, 2012 continued
NUMBER OF
SHARES | |
| | VALUE | |
| | | Metals & Mining (3.1%) | |
| | 36,000 | | | Barrick Gold Corp. (Canada) | | $ | 1,260,360 | | |
| | 37,000 | | | Freeport-McMoRan Copper & Gold, Inc. | | | 1,265,400 | | |
| | 27,300 | | | Newmont Mining Corp. | | | 1,267,812 | | |
| | | | 3,793,572 | | |
| | | Multi-Utilities (1.4%) | |
| | 32,880 | | | Integrys Energy Group, Inc. | | | 1,716,994 | | |
| | | Oil, Gas & Consumable Fuels (5.0%) | |
| | 19,950 | | | Chevron Corp. | | | 2,157,393 | | |
| | 33,135 | | | ConocoPhillips | | | 1,921,499 | | |
| | 23,200 | | | Exxon Mobil Corp. | | | 2,007,960 | | |
| | | | 6,086,852 | | |
| | | Paper & Forest Products (0.9%) | |
| | 35,770 | | | MeadWestvaco Corp. | | | 1,139,990 | | |
| | | Pharmaceuticals (4.5%) | |
| | 41,775 | | | Abbott Laboratories | | | 2,736,262 | | |
| | 85,240 | | | Bristol-Myers Squibb Co. | | | 2,777,972 | | |
| | | | 5,514,234 | | |
| | | Road & Rail (1.2%) | |
| | 24,310 | | | Norfolk Southern Corp. | | | 1,503,330 | | |
| | | Semiconductors & Semiconductor Equipment (1.1%) | |
| | 62,805 | | | Intel Corp. | | | 1,295,667 | | |
| | | Software (1.6%) | |
| | 74,560 | | | Microsoft Corp. | | | 1,992,989 | | |
| | | Specialty Retail (2.2%) | |
| | 42,405 | | | Home Depot, Inc. | | | 2,622,749 | | |
| | | Textiles, Apparel & Luxury Goods (1.6%) | |
| | 12,510 | | | VF Corp. | | | 1,888,635 | | |
| | | Tobacco (2.1%) | |
| | 17,800 | | | Philip Morris International, Inc. | | | 1,488,792 | | |
| | 25,780 | | | Reynolds American, Inc. | | | 1,068,065 | | |
| | | | 2,556,857 | | |
| | | | | Total Common Stocks
(Cost $57,695,877) | | | 62,466,382 | | |
| | | Investment Companies (4.1%) | |
| | 35,000 | | | SPDR S&P 500 ETF Trust
(Cost $5,076,414) | | | 4,988,200 | | |
See Notes to Financial Statements
59
Morgan Stanley Variable Investment Series - Strategist
Portfolio of Investments n December 31, 2012 continued
PRINCIPAL
AMOUNT
(000) | |
| | COUPON
RATE | | MATURITY
DATE | | VALUE | |
| | | Corporate Bonds (8.7%) | |
| | | Basic Materials (0.4%) | |
$ | 105 | | | Air Products & Chemicals, Inc. | | | 2.00 | % | | 08/02/16 | | $ | 109,170 | | |
| | 60 | | | Barrick Gold Corp. (Canada) | | | 3.85 | | | 04/01/22 | | | 63,635 | | |
| | 55 | | | Barrick North America Finance LLC | | | 4.40 | | | 05/30/21 | | | 60,422 | | |
| | 50 | | | Georgia-Pacific LLC | | | 8.875 | | | 05/15/31 | | | 75,172 | | |
| | 75 | | | Syngenta Finance N.V. (Switzerland) | | | 3.125 | | | 03/28/22 | | | 79,027 | | |
| | 60 | | | Vale Overseas Ltd. (Brazil) | | | 5.625 | | | 09/15/19 | | | 68,520 | | |
| | 25 | | | Westvaco Corp. | | | 8.20 | | | 01/15/30 | | | 33,070 | | |
| | 45 | | | Xstrata Finance Canada Ltd. (Canada) (a) | | | 4.00 | | | 10/25/22 | | | 45,578 | | |
| | | | 534,594 | | |
| | | Communications (0.9%) | |
| | 75 | | | Amazon.com, Inc. | | | 1.20 | | | 11/29/17 | | | 74,676 | | |
| | 25 | | | AT&T, Inc. | | | 5.35 | | | 09/01/40 | | | 29,226 | | |
| | 85 | | | AT&T, Inc. | | | 6.30 | | | 01/15/38 | | | 109,371 | | |
| | 50 | | | British Sky Broadcasting Group PLC
(United Kingdom) (a) | | | 3.125 | | | 11/26/22 | | | 49,931 | | |
| | 45 | | | CenturyLink, Inc. | | | 6.45 | | | 06/15/21 | | | 49,807 | | |
| | 50 | | | Comcast Corp. | | | 5.15 | | | 03/01/20 | | | 59,354 | | |
| | 25 | | | Comcast Corp. | | | 6.40 | | | 05/15/38 | | | 32,055 | | |
| | 45 | | | Deutsche Telekom International Finance BV (Germany) | | | 8.75 | | | 06/15/30 | | | 67,599 | | |
| | 50 | | | Motorola Solutions, Inc. | | | 3.75 | | | 05/15/22 | | | 51,186 | | |
| | 50 | | | NBC Universal Media LLC | | | 2.875 | | | 01/15/23 | | | 50,322 | | |
| | 40 | | | NBC Universal Media LLC | | | 4.375 | | | 04/01/21 | | | 45,012 | | |
| | 25 | | | NBC Universal Media LLC | | | 5.95 | | | 04/01/41 | | | 30,766 | | |
| | 50 | | | Nippon Telegraph & Telephone Corp. (Japan) | | | 1.40 | | | 07/18/17 | | | 50,660 | | |
| | 55 | | | Omnicom Group, Inc. | | | 3.625 | | | 05/01/22 | | | 57,408 | | |
| | 40 | | | Qwest Corp. | | | 6.875 | | | 09/15/33 | | | 40,400 | | |
| | 25 | | | Time Warner Cable, Inc. | | | 4.50 | | | 09/15/42 | | | 24,480 | | |
| | 25 | | | Time Warner, Inc. | | | 7.70 | | | 05/01/32 | | | 35,055 | | |
| | 95 | | | Verizon Communications, Inc. | | | 3.85 | | | 11/01/42 | | | 93,850 | | |
| | 100 | | | WPP Finance UK (United Kingdom) | | | 8.00 | | | 09/15/14 | | | 110,629 | | |
| | | | 1,061,787 | | |
| | | Consumer, Cyclical (0.3%) | |
| | 65 | | | Gap, Inc. (The) | | | 5.95 | | | 04/12/21 | | | 74,486 | | |
| | 55 | | | Macy's Retail Holdings, Inc. | | | 3.875 | | | 01/15/22 | | | 58,732 | | |
| | 70 | | | VF Corp. | | | 3.50 | | | 09/01/21 | | | 74,183 | | |
| | 100 | | | Volkswagen International Finance N.V. (Germany) (a) | | | 2.375 | | | 03/22/17 | | | 103,101 | | |
| | 40 | | | Wal-Mart Stores, Inc. | | | 5.25 | | | 09/01/35 | | | 48,764 | | |
See Notes to Financial Statements
60
Morgan Stanley Variable Investment Series - Strategist
Portfolio of Investments n December 31, 2012 continued
PRINCIPAL
AMOUNT
(000) | |
| | COUPON
RATE | | MATURITY
DATE | | VALUE | |
$ | 45 | | | Wesfarmers Ltd. (Australia) (a) | | | 2.983 | % | | 05/18/16 | | $ | 47,141 | | |
| | 5 | | | Yum! Brands, Inc. | | | 6.875 | | | 11/15/37 | | | 6,851 | | |
| | | | 413,258 | | |
| | | Consumer, Non-Cyclical (1.3%) | |
| | 45 | | | AbbVie, Inc. (a) | | | 4.40 | | | 11/06/42 | | | 48,044 | | |
| | 70 | | | Aetna, Inc. | | | 2.75 | | | 11/15/22 | | | 69,573 | | |
| | 80 | | | Altria Group, Inc. | | | 2.85 | | | 08/09/22 | | | 79,327 | | |
| | 50 | | | Amgen, Inc. | | | 3.875 | | | 11/15/21 | | | 55,011 | | |
| | 60 | | | Boston Scientific Corp. | | | 6.00 | | | 01/15/20 | | | 70,089 | | |
| | 90 | | | Cigna Corp. | | | 2.75 | | | 11/15/16 | | | 94,762 | | |
| | 65 | | | Coventry Health Care, Inc. | | | 5.45 | | | 06/15/21 | | | 77,390 | | |
| | 65 | | | CR Bard, Inc. | | | 1.375 | | | 01/15/18 | | | 65,423 | | |
| | 85 | | | Delhaize Group SA (Belgium) | | | 5.70 | | | 10/01/40 | | | 79,941 | | |
| | 85 | | | Express Scripts Holding Co. (a) | | | 3.90 | | | 02/15/22 | | | 91,828 | | |
| | 65 | | | Gilead Sciences, Inc. | | | 4.50 | | | 04/01/21 | | | 74,415 | | |
| | 100 | | | Grupo Bimbo SAB de CV (Mexico) (a) | | | 4.875 | | | 06/30/20 | | | 113,883 | | |
| | 50 | | | Kraft Foods Group, Inc. (a) | | | 6.50 | | | 02/09/40 | | | 65,956 | | |
| | 70 | | | Life Technologies Corp. | | | 6.00 | | | 03/01/20 | | | 83,087 | | |
| | 55 | | | McKesson Corp. | | | 2.70 | | | 12/15/22 | | | 55,138 | | |
| | 80 | | | Philip Morris International, Inc. | | | 2.50 | | | 08/22/22 | | | 80,539 | | |
| | 75 | | | Sanofi (France) | | | 4.00 | | | 03/29/21 | | | 85,640 | | |
| | 120 | | | Teva Pharmaceutical Finance IV BV (Israel) | | | 3.65 | | | 11/10/21 | | | 128,672 | | |
| | 25 | | | UnitedHealth Group, Inc. | | | 1.40 | | | 10/15/17 | | | 25,068 | | |
| | 15 | | | UnitedHealth Group, Inc. | | | 2.75 | | | 02/15/23 | | | 15,167 | | |
| | 55 | | | Verisk Analytics, Inc. | | | 5.80 | | | 05/01/21 | | | 61,739 | | |
| | 65 | | | Woolworths Ltd. (Australia) (a) | | | 4.00 | | | 09/22/20 | | | 70,351 | | |
| | | | 1,591,043 | | |
| | | Diversified (0.1%) | |
| | 75 | | | LVMH Moet Hennessy Louis Vuitton SA (France) (a) | | | 1.625 | | | 06/29/17 | | | 76,320 | | |
| | | Energy (0.7%) | |
| | 75 | | | BP Capital Markets PLC (United Kingdom) | | | 3.245 | | | 05/06/22 | | | 79,172 | | |
| | 35 | | | Enterprise Products Operating LLC | | | 5.25 | | | 01/31/20 | | | 41,653 | | |
| | 90 | | | Enterprise Products Operating LLC, Series N | | | 6.50 | | | 01/31/19 | | | 112,935 | | |
| | 30 | | | FMC Technologies, Inc. | | | 3.45 | | | 10/01/22 | | | 30,681 | | |
| | 50 | | | Kinder Morgan Energy Partners LP | | | 5.95 | | | 02/15/18 | | | 59,933 | | |
| | 75 | | | Murphy Oil Corp. | | | 3.70 | | | 12/01/22 | | | 74,868 | | |
| | 50 | | | Phillips 66 (a) | | | 4.30 | | | 04/01/22 | | | 55,979 | | |
| | 60 | | | Plains All American Pipeline LP/PAA Finance Corp. | | | 6.70 | | | 05/15/36 | | | 76,915 | | |
| | 60 | | | Plains All American Pipeline LP/PAA Finance Corp. | | | 8.75 | | | 05/01/19 | | | 81,730 | | |
See Notes to Financial Statements
61
Morgan Stanley Variable Investment Series - Strategist
Portfolio of Investments n December 31, 2012 continued
PRINCIPAL
AMOUNT
(000) | |
| | COUPON
RATE | | MATURITY
DATE | | VALUE | |
$ | 50 | | | Spectra Energy Capital LLC | | | 7.50 | % | | 09/15/38 | | $ | 69,537 | | |
| | 55 | | | Texas Eastern Transmission LP | | | 7.00 | | | 07/15/32 | | | 75,665 | | |
| | 50 | | | Weatherford International Ltd. | | | 4.50 | | | 04/15/22 | | | 53,162 | | |
| | | | 812,230 | | |
| | | Finance (3.6%) | |
| | 100 | | | ABB Treasury Center USA, Inc. (Switzerland) (a) | | | 2.50 | | | 06/15/16 | | | 104,064 | | |
| | 50 | | | ABB Treasury Center USA, Inc. (Switzerland) (a) | | | 4.00 | | | 06/15/21 | | | 55,413 | | |
| | 100 | | | Abbey National Treasury Services PLC, MTN
(United Kingdom) (a) | | | 3.875 | | | 11/10/14 | | | 103,807 | | |
| | 75 | | | Aegon N.V. (Netherlands) | | | 4.625 | | | 12/01/15 | | | 81,817 | | |
| | 100 | | | Australia & New Zealand Banking Group Ltd.
(Australia) (a) | | | 4.875 | | | 01/12/21 | | | 117,402 | | |
| | 50 | | | AvalonBay Communities, Inc. | | | 2.95 | | | 09/15/22 | | | 49,911 | | |
| | 100 | | | Bank of America Corp., Series L | | | 5.65 | | | 05/01/18 | | | 116,480 | | |
| | 100 | | | Barclays Bank PLC (United Kingdom) (a) | | | 6.05 | | | 12/04/17 | | | 111,114 | | |
| | 130 | | | Berkshire Hathaway, Inc. | | | 3.75 | | | 08/15/21 | | | 143,468 | | |
| | 50 | | | BNP Paribas SA (France) | | | 5.00 | | | 01/15/21 | | | 56,251 | | |
| | 75 | | | Boston Properties LP | | | 3.85 | | | 02/01/23 | | | 78,948 | | |
| | 45 | | | Brookfield Asset Management, Inc. (Canada) | | | 5.80 | | | 04/25/17 | | | 50,853 | | |
| | 35 | | | Citigroup, Inc. (See Note 6) | | | 5.875 | | | 05/29/37 | | | 42,265 | | |
| | 22 | | | Citigroup, Inc. (See Note 6) | | | 6.125 | | | 05/15/18 | | | 26,396 | | |
| | 95 | | | CNA Financial Corp. | | | 5.75 | | | 08/15/21 | | | 111,620 | | |
| | 50 | | | Cooperatieve Centrale Raiffeisen-Boerenleenbank BA
(Netherlands) | | | 3.875 | | | 02/08/22 | | | 53,910 | | |
| | 200 | | | Credit Mutuel - CIC Home Loan SFH (France) (a) | | | 1.50 | | | 11/16/17 | | | 198,403 | | |
| | 240 | | | Credit Suisse (Switzerland) | | | 5.40 | | | 01/14/20 | | | 270,253 | | |
| | 25 | | | Credit Suisse (Switzerland) | | | 6.00 | | | 02/15/18 | | | 28,774 | | |
| | 60 | | | Dexus Diversified Trust/Dexus Office Trust
(Australia) (a) | | | 5.60 | | | 03/15/21 | | | 64,603 | | |
| | 140 | | | Farmers Exchange Capital (a) | | | 7.05 | | | 07/15/28 | | | 172,479 | | |
| | 200 | | | Ford Motor Credit Co., LLC | | | 4.207 | | | 04/15/16 | | | 213,487 | | |
| | 60 | | | General Electric Capital Corp. | | | 5.30 | | | 02/11/21 | | | 69,764 | | |
| | 145 | | | General Electric Capital Corp., Series G | | | 6.00 | | | 08/07/19 | | | 176,648 | | |
| | 75 | | | Genworth Financial, Inc. | | | 7.20 | | | 02/15/21 | | | 81,125 | | |
| | 45 | | | Harley-Davidson Funding Corp. (a) | | | 6.80 | | | 06/15/18 | | | 55,340 | | |
| | 60 | | | Hartford Financial Services Group, Inc. | | | 5.50 | | | 03/30/20 | | | 69,819 | | |
| | 50 | | | Health Care REIT, Inc. | | | 3.75 | | | 03/15/23 | | | 50,198 | | |
| | 70 | | | HSBC Holdings PLC (United Kingdom) | | | 4.00 | | | 03/30/22 | | | 76,790 | | |
| | 60 | | | JPMorgan Chase & Co. | | | 4.25 | | | 10/15/20 | | | 66,839 | | |
| | 140 | | | JPMorgan Chase & Co. | | | 4.625 | | | 05/10/21 | | | 159,904 | | |
| | 50 | | | Macquarie Bank Ltd. (Australia) (a) | | | 6.625 | | | 04/07/21 | | | 55,356 | | |
See Notes to Financial Statements
62
Morgan Stanley Variable Investment Series - Strategist
Portfolio of Investments n December 31, 2012 continued
PRINCIPAL
AMOUNT
(000) | |
| | COUPON
RATE | | MATURITY
DATE | | VALUE | |
$ | 55 | | | Macquarie Group Ltd. (Australia) (a) | | | 6.00 | % | | 01/14/20 | | $ | 59,601 | | |
| | 225 | | | Merrill Lynch & Co., Inc., MTN | | | 6.875 | | | 04/25/18 | | | 271,536 | | |
| | 35 | | | MetLife, Inc. (See Note 6) | | | 7.717 | | | 02/15/19 | | | 45,944 | | |
| | 170 | | | Nationwide Building Society (United Kingdom) (a) | | | 6.25 | | | 02/25/20 | | | 201,073 | | |
| | 50 | | | Nationwide Financial Services, Inc. (a) | | | 5.375 | | | 03/25/21 | | | 53,524 | | |
| | 75 | | | Pacific LifeCorp (a) | | | 6.00 | | | 02/10/20 | | | 83,843 | | |
| | 60 | | | Platinum Underwriters Finance, Inc., Series B | | | 7.50 | | | 06/01/17 | | | 67,276 | | |
| | 50 | | | Principal Financial Group, Inc. | | | 8.875 | | | 05/15/19 | | | 67,179 | | |
| | 40 | | | Prudential Financial, Inc., MTN | | | 6.625 | | | 12/01/37 | | | 50,004 | | |
| �� | 70 | | | Royal Bank of Scotland Group PLC
(United Kingdom) | | | 2.55 | | | 09/18/15 | | | 71,686 | | |
| | 70 | | | SLM Corp., MTN | | | 6.25 | | | 01/25/16 | | | 76,475 | | |
| | 100 | | | Standard Chartered Bank (United Kingdom) (a) | | | 6.40 | | | 09/26/17 | | | 117,417 | | |
| | 95 | | | Wells Fargo & Co. | | | 5.625 | | | 12/11/17 | | | 113,432 | | |
| | | | 4,392,491 | | |
| | | Industrials (0.8%) | |
| | 100 | | | BAA Funding Ltd. (United Kingdom) (a) | | | 4.875 | | | 07/15/21 | | | 109,326 | | |
| | 65 | | | Bemis Co., Inc. | | | 4.50 | | | 10/15/21 | | | 70,553 | | |
| | 75 | | | CRH America, Inc. | | | 6.00 | | | 09/30/16 | | | 84,343 | | |
| | 55 | | | Eaton Corp. (a) | | | 2.75 | | | 11/02/22 | | | 54,948 | | |
| | 30 | | | Holcim US Finance Sarl & Cie SCS (Switzerland) (a) | | | 6.00 | | | 12/30/19 | | | 34,076 | | |
| | 75 | | | L-3 Communications Corp. | | | 4.95 | | | 02/15/21 | | | 84,766 | | |
| | 64 | | | Norfolk Southern Corp. (a) | | | 2.903 | | | 02/15/23 | | | 64,560 | | |
| | 10 | | | Norfolk Southern Corp. | | | 4.837 | | | 10/01/41 | | | 11,202 | | |
| | 75 | | | Schneider Electric SA (France) (a) | | | 2.95 | | | 09/27/22 | | | 75,752 | | |
| | 70 | | | Sonoco Products Co. | | | 5.75 | | | 11/01/40 | | | 80,872 | | |
| | 75 | | | Thermo Fisher Scientific, Inc. | | | 3.15 | | | 01/15/23 | | | 76,813 | | |
| | 40 | | | Union Pacific Corp. | | | 6.125 | | | 02/15/20 | | | 50,166 | | |
| | 20 | | | United Technologies Corp. | | | 4.50 | | | 06/01/42 | | | 22,318 | | |
| | 50 | | | Waste Management, Inc. | | | 2.90 | | | 09/15/22 | | | 49,576 | | |
| | 80 | | | Waste Management, Inc. | | | 6.125 | | | 11/30/39 | | | 101,651 | | |
| | | | 970,922 | | |
| | | Technology (0.4%) | |
| | 50 | | | Fiserv, Inc. | | | 3.125 | | | 06/15/16 | | | 52,567 | | |
| | 75 | | | Hewlett-Packard Co. | | | 4.65 | | | 12/09/21 | | | 75,428 | | |
| | 50 | | | Intel Corp. | | | 2.70 | | | 12/15/22 | | | 50,039 | | |
| | 100 | | | International Business Machines Corp. | | | 7.625 | | | 10/15/18 | | | 133,733 | | |
| | 25 | | | NetApp, Inc. | | | 2.00 | | | 12/15/17 | | | 24,940 | | |
| | 150 | | | Oracle Corp. | | | 1.20 | | | 10/15/17 | | | 150,620 | | |
| | | | 487,327 | | |
See Notes to Financial Statements
63
Morgan Stanley Variable Investment Series - Strategist
Portfolio of Investments n December 31, 2012 continued
PRINCIPAL
AMOUNT
(000) | |
| | COUPON
RATE | | MATURITY
DATE | | VALUE | |
| | | Utilities (0.2%) | |
$ | 75 | | | Ohio Power Co., Series M | | | 5.375 | % | | 10/01/21 | | $ | 91,044 | | |
| | 80 | | | Oncor Electric Delivery Co., LLC | | | 6.80 | | | 09/01/18 | | | 99,335 | | |
| | 75 | | | PPL WEM Holdings PLC (a) | | | 3.90 | | | 05/01/16 | | | 79,041 | | |
| | | | 269,420 | | |
| | | | | Total Corporate Bonds
(Cost $9,630,395) | | | | | | | 10,609,392 | | |
| | | Sovereign (0.9%) | |
| | 100 | | | Banco Nacional de Desenvolvimento,
Economico e Social (Brazil) (a) | | | 5.50 | | | 07/12/20 | | | 118,250 | | |
| | 150 | | | Brazilian Government International Bond (Brazil) | | | 4.875 | | | 01/22/21 | | | 181,500 | | |
| | 200 | | | Eskom Holdings SOC Ltd. (South Africa) (a) | | | 5.75 | | | 01/26/21 | | | 227,750 | | |
| | 80 | | | Mexico Government International Bond (Mexico) | | | 3.625 | | | 03/15/22 | | | 87,700 | | |
| | 70 | | | Peruvian Government International Bond (Peru) | | | 8.75 | | | 11/21/33 | | | 121,975 | | |
| | 190 | | | Petroleos Mexicanos (Mexico) | | | 4.875 | | | 01/24/22 | | | 214,890 | | |
| | 180 | | | Poland Government International Bond (Poland) | | | 5.00 | | | 03/23/22 | | | 213,030 | | |
| | | | | Total Sovereign
(Cost $1,130,830) | | | | | | | 1,165,095 | | |
| | | Municipal Bonds (0.4%) | |
| | 30 | | | City of Chicago, IL, O'Hare International Airport
Revenue | | | 6.395 | | | 01/01/40 | | | 39,003 | | |
| | 70 | | | City of New York, NY, Series G-1 | | | 5.968 | | | 03/01/36 | | | 89,236 | | |
| | 85 | | | Illinois State Toll Highway Authority, Highway
Revenue, Build America Bonds | | | 6.184 | | | 01/01/34 | | | 105,781 | | |
| | 95 | | | Municipal Electric Authority of Georgia | | | 6.655 | | | 04/01/57 | | | 112,586 | | |
| | 65 | | | New York City, NY, Transitional Finance Authority
Future Tax Secured Revenue | | | 5.267 | | | 05/01/27 | | | 79,422 | | |
| | | State of California, | |
| | | General Obligation Bonds | |
| | 45 | | | | | | | | 5.95 | | | 04/01/16 | | | 51,066 | | |
| | 30 | | | | | | | | 6.65 | | | 03/01/22 | | | 37,703 | | |
| | | | | Total Municipal Bonds
(Cost $421,205) | | | | | | | 514,797 | | |
| | | Agency Fixed Rate Mortgage (0.0%) | |
| | (b) | | | Federal Home Loan Mortgage Corporation,
Gold Pool
(Cost $178) | | | 6.50 | | | 05/01/29 | | | 200 | | |
See Notes to Financial Statements
64
Morgan Stanley Variable Investment Series - Strategist
Portfolio of Investments n December 31, 2012 continued
PRINCIPAL
AMOUNT
(000) | |
| | COUPON
RATE | | MATURITY
DATE | | VALUE | |
| | | Asset-Backed Securities (0.8%) | | | |
$ | 100 | | | Ally Master Owner Trust | | | 1.079 | (c)% | | 01/15/16 | | $ | 100,675 | | |
| | 27 | | | Brazos Student Finance Corp. | | | 1.21 | (c) | | 06/25/35 | | | 27,009 | | |
| | 139 | | | CVS Pass-Through Trust | | | 6.036 | | | 12/10/28 | | | 162,734 | | |
| | 175 | | | Louisiana Public Facilities Authority | | | 0.815 | (c) | | 04/26/27 | | | 177,112 | | |
| | 150 | | | Nissan Auto Receivables Owner Trust | | | 1.18 | | | 02/16/15 | | | 150,699 | | |
| | 180 | | | PFS Financing Corp., Class A (a) | | | 1.709 | (c) | | 10/17/16 | | | 181,128 | | |
| | 125 | | | World Omni Automobile Lease Securitization Trust | | | 1.49 | | | 10/15/14 | | | 125,674 | | |
| | | | | Total Asset-Backed Securities
(Cost $893,497) | | | | | | | 925,031 | | |
| | | U.S. Treasury Securities (13.4%) | | | |
| | | U.S. Treasury Bonds | | | |
| | 1,505 | | | | | | | | 3.50 | | | 02/15/39 | | | 1,701,591 | | |
| | 610 | | | | | | | | 3.875 | | | 08/15/40 | | | 733,239 | | |
| | 255 | | | | | | | | 5.375 | | | 02/15/31 | | | 364,052 | | |
| | 402 | | | U.S. Treasury Inflation Indexed Bond | | | 0.125 | | | 07/15/22 | | | 436,969 | | |
| | | U.S. Treasury Notes | | | |
| | 1,710 | | | | | | | | 1.00 | | | 09/30/16 | | | 1,742,865 | | |
| | 2,452 | | | | | | | | 1.25 | | | 10/31/15 | | | 2,514,641 | | |
| | 2,855 | | | | | | | | 1.75 | | | 07/31/15 | | | 2,959,833 | | |
| | 1,320 | | | | | | | | 1.875 | | | 09/30/17 | | | 1,394,044 | | |
| | 2,645 | | | | | | | | 2.25 | | | 01/31/15 - 03/31/16 | | | 2,768,631 | | |
| | 1,500 | | | | | | | | 2.375 | | | 06/30/18 | | | 1,625,859 | | |
| | | | | Total U.S. Treasury Securities
(Cost $15,838,530) | | | | | | | 16,241,724 | | |
| | | U.S. Agency Securities (1.5%) | | | |
| | | Federal Home Loan Mortgage Corporation | | | |
| | 150 | | | | | | | | 3.75 | | | 03/27/19 | | | 173,633 | | |
| | 45 | | | | | | | | 6.75 | | | 03/15/31 | | | 69,369 | | |
| | | Federal National Mortgage Association | | | |
| | 1,000 | | | | | | | | 0.875 | | | 10/26/17 | | | 1,005,230 | | |
| | 450 | | | | | | | | 5.375 | | | 06/12/17 | | | 541,662 | | |
| | | | | Total U.S. Agency Securities
(Cost $1,729,591) | | | | | | | 1,789,894 | | |
See Notes to Financial Statements
65
Morgan Stanley Variable Investment Series - Strategist
Portfolio of Investments n December 31, 2012 continued
NUMBER OF
SHARES (000) | |
| | VALUE | |
| | | Short-Term Investment (21.7%) | |
| | | Investment Company | |
| | 26,277 | | | Morgan Stanley Institutional Liquidity Funds - Money
Market Portfolio - Institutional Class (See Note 6)
(Cost $26,277,144) | | $ | 26,277,144 | | |
Total Investments
(Cost $118,693,661) (d) | | | 103.0 | % | | | 124,977,859 | | |
Liabilities in Excess of Other Assets | | | (3.0 | ) | | | (3,631,578 | ) | |
Net Assets | | | 100.0 | % | | $ | 121,346,281 | | |
ETF Exchange Traded Fund.
MTN Medium Term Note.
REIT Real Estate Investment Trust.
SPDR Standard & Poor's Depository Receipt.
(a) 144A security — Certain conditions for public sale may exist. Unless otherwise noted, these securities are deemed to be liquid.
(b) Par less than $500.
(c) Variable/Floating Rate Security — Interest rate changes on these instruments are based on changes in a designated base rate. The rates shown are those in effect on December 31, 2012.
(d) Securities are available for collateral in connection with open futures contracts and swap agreements.
FUTURES CONTRACTS OPEN AT DECEMBER 31, 2012:
| NUMBER OF CONTRACTS | | LONG/SHORT | | DESCRIPTION, DELIVERY
MONTH AND YEAR | | UNDERLYING FACE
AMOUNT AT VALUE | | UNREALIZED
APPRECIATION
(DEPRECIATION) | |
| | 20 | | | Long | | U.S. Treasury 5 yr. Note,
Mar-13 | | $ | 2,488,281 | | | $ | (3,397 | ) | |
| | 8 | | | Long | | U.S. Treasury 2 yr. Note,
Mar-13 | | | 1,763,750 | | | | 125 | | |
| | 13 | | | Short | | U.S. Treasury 10 yr. Note,
Mar-13 | | | (1,726,156 | ) | | | 6,194 | | |
Net Unrealized Appreciation | | $ | 2,922 | | |
See Notes to Financial Statements
66
Morgan Stanley Variable Investment Series - Strategist
Portfolio of Investments n December 31, 2012 continued
INTEREST RATE SWAP AGREEMENTS OPEN AT DECEMBER 31, 2012:
SWAP
COUNTERPARTY | | NOTIONAL
AMOUNT
(000) | | FLOATING
RATE INDEX | | PAY/RECEIVE
FLOATING RATE | | FIXED RATE | | TERMINATION
DATE | | UNREALIZED
APPRECIATION
(DEPRECIATION) | |
Barclays Capital | | $ | 660 | | | 3 Month LIBOR | | Receive | | | 0.81 | % | | 09/24/17 | | $ | (2,319 | ) | |
Credit Suisse | | | 2,080 | | | 3 Month LIBOR | | Receive | | | 0.39 | | | 09/25/14 | | | (3,311 | ) | |
Credit Suisse | | | 1,000 | | | 3 Month LIBOR | | Receive | | | 0.82 | | | 09/13/17 | | | (4,217 | ) | |
Deutsche Bank | | | 1,695 | | | 3 Month LIBOR | | Receive | | | 0.82 | | | 07/24/17 | | | (10,679 | ) | |
Goldman Sachs | | CAD | 3,420 | | | 3 Month CDOR | | Pay | | | 1.75 | | | 08/01/16 | | | 4,903 | | |
Goldman Sachs | | $ | 3,350 | | | 3 Month LIBOR | | Receive | | | 0.83 | | | 08/03/16 | | | (5,828 | ) | |
Net Unrealized Depreciation | | | | | | | | | | | | $ | (21,451 | ) | |
CDOR Canadian Dealer Offered Rate.
LIBOR London Interbank Offered Rate.
Currency Abbreviation:
CAD Canadian Dollar.
PORTFOLIO COMPOSITION | | VALUE | | PERCENT OF
TOTAL
INVESTMENTS | |
Common Stocks | | $ | 62,466,382 | | | | 50.0 | % | |
Investment Companies | | | 31,265,344 | | | | 25.0 | | |
U.S. Treasury Securities | | | 16,241,724 | | | | 13.0 | | |
Corporate Bonds | | | 10,609,392 | | | | 8.5 | | |
U.S. Agency Securities | | | 1,789,894 | | | | 1.4 | | |
Sovereign | | | 1,165,095 | | | | 0.9 | | |
Asset-Backed Securities | | | 925,031 | | | | 0.8 | | |
Municipal Bonds | | | 514,797 | | | | 0.4 | | |
Agency Fixed Rate Mortgages | | | 200 | | | | 0.0 | + | |
| | | $ | 124,977,859 | ++ | | | 100.0 | % | |
+ Amount is less than 0.05%
++ Does not include open long/short futures contracts with an underlying face amount of $5,978,187 with net unrealized appreciation of $2,922. Does not include open swap agreements with net unrealized depreciation of $21,451.
See Notes to Financial Statements
67
Morgan Stanley Variable Investment Series
Financial Statements
Statements of Assets and Liabilities
December 31, 2012
| | | Money
Market | | Limited
Duration | | Income
Plus | | Global
Infrastructure | |
Assets: | |
Investments in securities, at value* | | $ | 90,763,745 | (1) | | $ | 46,702,458 | | | $ | 173,960,630 | | | $ | 70,748,041 | | |
Investment in affiliates, at value** | | | — | | | | 2,422,418 | | | | 8,877,168 | | | | 1,300,782 | | |
Total investments in securities, at value | | | 90,763,745 | | | | 49,124,876 | | | | 182,837,798 | | | | 72,048,823 | | |
Unrealized appreciation on open swap agreements | | | — | | | | 2,740 | | | | 66,347 | | | | — | | |
Cash | | | 9,517 | | | | 1,700 | | | | 47,874 | (3) | | | 38,426 | (3) | |
Receivable for: | |
Interest | | | 23,463 | | | | 314,573 | | | | 1,958,460 | | | | — | | |
Dividends | | | — | | | | — | | | | 11,604 | | | | 282,257 | | |
Investments sold | | | — | | | | — | | | | — | | | | — | | |
Shares of beneficial interest sold | | | 144,904 | | | | 27,594 | | | | — | | | | — | | |
Foreign withholding taxes reclaimed | | | — | | | | 115 | | | | 349 | | | | 34,075 | | |
Premium paid on open swap agreements | | | — | | | | — | | | | 69,999 | | | | — | | |
Variation margin | | | — | | | | 1,499 | | | | — | | | | — | | |
Interest and dividends from affiliates | | | — | | | | 11,820 | | | | 12,277 | | | | 20 | | |
Prepaid expenses and other assets | | | 3,343 | | | | 1,534 | | | | 5,033 | | | | 1,732 | | |
Total Assets | | | 90,944,972 | | | | 49,486,451 | | | | 185,009,741 | | | | 72,405,333 | | |
Liabilities: | |
Collateral on securities loaned, at value | | | — | | | | — | | | | — | | | | — | | |
Unrealized depreciation on open swap agreements | | | — | | | | 34,008 | | | | 351,335 | | | | — | | |
Unrealized depreciation on open foreign currency exchange contracts | | | — | | | | — | | | | 4,972 | | | | — | | |
Payable for: | |
Investments purchased | | | — | | | | — | | | | — | | | | 87,978 | | |
Shares of beneficial interest redeemed | | | 67,140 | | | | 19,914 | | | | 108,186 | | | | 90,691 | | |
Advisory fee | | | 2,015 | | | | 12,523 | | | | 65,285 | | | | 34,670 | | |
Distribution fee (Class Y) | | | — | | | | 8,274 | | | | 20,822 | | | | 3,058 | | |
Administration fee | | | 3,844 | | | | 3,372 | | | | 12,601 | | | | 4,879 | | |
Variation margin | | | — | | | | — | | | | 20,685 | | | | — | | |
Transfer agent fee | | | 500 | | | | 417 | | | | 500 | | | | 500 | | |
Accrued expenses and other payables | | | 38,776 | | | | 44,168 | | | | 80,651 | | | | 50,254 | | |
Total Liabilities | | | 112,275 | | | | 122,676 | | | | 665,037 | | | | 272,030 | | |
Net Assets | | $ | 90,832,697 | | | $ | 49,363,775 | | | $ | 184,344,704 | | | $ | 72,133,303 | | |
Composition of Net Assets: | |
Paid-in-capital | | $ | 90,837,113 | | | $ | 78,592,691 | | | $ | 171,284,994 | | | $ | 48,193,299 | | |
Net unrealized appreciation (depreciation) | | | — | | | | 1,028,201 | | | | 15,763,213 | | | | 16,512,665 | | |
| Accumulated undistributed net investment income (net investment loss) | | | (2,481 | ) | | | 1,063,037 | | | | 8,046,009 | | | | 1,799,716 | | |
| Accumulated net realized gain (loss) | | | (1,935 | ) | | | (31,320,154 | ) | | | (10,749,512 | ) | | | 5,627,623 | | |
Net Assets | | $ | 90,832,697 | | | $ | 49,363,775 | | | $ | 184,344,704 | | | $ | 72,133,303 | | |
| * Cost | | $ | 90,763,745 | | | $ | 45,660,888 | | | $ | 158,451,341 | | | $ | 54,237,466 | | |
| ** Affiliated Cost | | $ | — | | | $ | 2,393,649 | | | $ | 8,253,641 | | | $ | 1,300,782 | | |
Class X Shares: | |
Net Assets | | $ | 42,267,326 | | | $ | 10,628,138 | | | $ | 86,765,387 | | | $ | 57,627,699 | | |
Shares Outstanding (unlimited shares authorized, $0.01 par value) | | | 42,269,361 | | | | 1,377,783 | | | | 7,247,917 | | | | 6,270,228 | | |
Net Asset Value Per Share | | $ | 1.00 | | | $ | 7.71 | | | $ | 11.97 | | | $ | 9.19 | | |
Class Y Shares: | |
Net Assets | | $ | 48,565,371 | | | $ | 38,735,637 | | | $ | 97,579,317 | | | $ | 14,505,604 | | |
Shares Outstanding (unlimited shares authorized, $0.01 par value) | | | 48,567,758 | | | | 5,035,988 | | | | 8,180,504 | | | | 1,584,119 | | |
Net Asset Value Per Share | | $ | 1.00 | | | $ | 7.69 | | | $ | 11.93 | | | $ | 9.16 | | |
(1) Including repurchase agreements of $44,215,000.
(2) Including security loaned at value of $500,332.
(3) Including foreign currency valued at $5,280, $38,426, and $66,261, respectively with a cost of $5,229, $38,508, and $65,740, respectively.
See Notes to Financial Statements
68
| | | European
Equity | | Multi Cap
Growth | | Aggressive
Equity | | Strategist | |
Assets: | |
Investments in securities, at value* | | $ | 51,333,678 | (2) | | $ | 206,533,110 | | | $ | 26,187,965 | | | $ | 98,586,110 | | |
Investment in affiliates, at value** | | | 961,419 | | | | 4,451,243 | | | | 370,129 | | | | 26,391,749 | | |
Total investments in securities, at value | | | 52,295,097 | | | | 210,984,353 | | | | 26,558,094 | | | | 124,977,859 | | |
Unrealized appreciation on open swap agreements | | | — | | | | — | | | | — | | | | 4,903 | | |
Cash | | | 84,339 | (3) | | | — | | | | — | | | | 3,338 | | |
Receivable for: | |
Interest | | | — | | | | — | | | | — | | | | 239,104 | | |
Dividends | | | 53,395 | | | | 38,496 | | | | 4,882 | | | | 129,168 | | |
Investments sold | | | 22,156 | | | | 366,264 | | | | 46,441 | | | | — | | |
Shares of beneficial interest sold | | | 11,430 | | | | 19,466 | | | | — | | | | — | | |
Foreign withholding taxes reclaimed | | | 59,209 | | | | — | | | | — | | | | 30 | | |
Premium paid on open swap agreements | | | — | | | | — | | | | — | | | | — | | |
Variation margin | | | — | | | | — | | | | — | | | | 28,667 | | |
Interest and dividends from affiliates | | | 87 | | | | 902 | | | | 86 | | | | 4,142 | | |
Prepaid expenses and other assets | | | 1,571 | | | | 5,304 | | | | 938 | | | | 3,660 | | |
Total Assets | | | 52,527,284 | | | | 211,414,785 | | | | 26,610,441 | | | | 125,390,871 | | |
Liabilities: | |
Collateral on securities loaned, at value | | | 525,626 | | | | — | | | | — | | | | — | | |
Unrealized depreciation on open swap agreements | | | — | | | | — | | | | — | | | | 26,354 | | |
Unrealized depreciation on open foreign currency exchange contracts | | | — | | | | — | | | | — | | | | — | | |
Payable for: | |
Investments purchased | | | 15 | | | | 629,470 | | | | 78,874 | | | | 3,711,257 | | |
Shares of beneficial interest redeemed | | | 9,822 | | | | 147,162 | | | | 65,631 | | | | 163,540 | | |
Advisory fee | | | 25,463 | | | | 74,105 | | | | 14,958 | | | | 41,364 | | |
Distribution fee (Class Y) | | | 2,486 | | | | 9,648 | | | | 3,238 | | | | 7,460 | | |
Administration fee | | | 3,503 | | | | 14,247 | | | | 1,794 | | | | 8,300 | | |
Variation margin | | | — | | | | — | | | | — | | | | — | | |
Transfer agent fee | | | 500 | | | | 585 | | | | 416 | | | | 500 | | |
Accrued expenses and other payables | | | 46,582 | | | | 66,001 | | | | 7,596 | | | | 85,815 | | |
Total Liabilities | | | 613,997 | | | | 941,218 | | | | 172,507 | | | | 4,044,590 | | |
Net Assets | | $ | 51,913,287 | | | $ | 210,473,567 | | | $ | 26,437,934 | | | $ | 121,346,281 | | |
Composition of Net Assets: | |
Paid-in-capital | | $ | 53,838,540 | | | $ | 147,368,528 | | | $ | 18,818,061 | | | $ | 114,511,572 | | |
Net unrealized appreciation (depreciation) | | | 11,222,936 | | | | 59,296,867 | | | | 7,186,075 | | | | 6,265,669 | | |
| Accumulated undistributed net investment income (net investment loss) | | | 1,514,061 | | | | 769,489 | | | | (20,770 | ) | | | 2,603,122 | | |
| Accumulated net realized gain (loss) | | | (14,662,250 | ) | | | 3,038,683 | | | | 454,568 | | | | (2,034,082 | ) | |
Net Assets | | $ | 51,913,287 | | | $ | 210,473,567 | | | $ | 26,437,934 | | | $ | 121,346,281 | | |
| * Cost | | $ | 40,109,742 | | | $ | 147,236,186 | | | $ | 19,001,883 | | | $ | 92,320,222 | | |
| ** Affiliated Cost | | $ | 961,419 | | | $ | 4,451,243 | | | $ | 370,129 | | | $ | 26,373,439 | | |
Class X Shares: | |
Net Assets | | $ | 40,140,549 | | | $ | 164,917,461 | | | $ | 11,089,440 | | | $ | 86,318,471 | | |
Shares Outstanding (unlimited shares authorized, $0.01 par value) | | | 2,460,011 | | | | 4,021,096 | | | | 598,003 | | | | 8,038,501 | | |
Net Asset Value Per Share | | $ | 16.32 | | | $ | 41.01 | | | $ | 18.54 | | | $ | 10.74 | | |
Class Y Shares: | |
Net Assets | | $ | 11,772,738 | | | $ | 45,556,106 | | | $ | 15,348,494 | | | $ | 35,027,810 | | |
Shares Outstanding (unlimited shares authorized, $0.01 par value) | | | 723,997 | | | | 1,123,152 | | | | 851,910 | | | | 3,272,562 | | |
Net Asset Value Per Share | | $ | 16.26 | | | $ | 40.56 | | | $ | 18.02 | | | $ | 10.70 | | |
69
Morgan Stanley Variable Investment Series
Financial Statements continued
Statements of Operations
For the year ended December 31, 2012
| | | Money
Market | | Limited
Duration | | Income
Plus | | Global
Infrastructure | |
Net Investment Income: | |
Income | |
Interest† | | $ | 278,912 | | | $ | 1,114,730 | | | $ | 8,792,783 | | | $ | 28 | | |
Dividends† | | | — | | | | — | | | | 59,983 | | | | 2,448,718 | | |
Interest and dividends from affiliates (Note 6) | | | — | | | | 41,609 | | | | 248,428 | | | | 757 | | |
Income from securities loaned - net | | | — | | | | — | | | | — | | | | — | | |
Total Income | | | 278,912 | | | | 1,156,339 | | | | 9,101,194 | | | | 2,449,503 | | |
†Net of foreign withholding taxes | | | — | | | | — | | | | — | | | | 165,124 | | |
Expenses | |
Advisory fee (Note 4) | | | 444,622 | | | | 161,388 | | | | 805,994 | | | | 413,066 | | |
Distribution fee (Class Y shares) (Note 5) | | | 129,903 | | | | 105,473 | | | | 255,476 | | | | 36,232 | | |
Professional fees | | | 66,314 | | | | 67,880 | | | | 75,367 | | | | 77,113 | | |
Administration fee (Note 4) | | | 49,403 | | | | 43,037 | | | | 153,523 | | | | 57,974 | | |
Shareholder reports and notices | | | 27,574 | | | | 17,193 | | | | 47,476 | | | | 20,809 | | |
Custodian fees | | | 16,648 | | | | 19,118 | | | | 33,144 | | | | 38,088 | | |
Trustees' fees and expenses | | | 4,108 | | | | 2,612 | | | | 6,506 | | | | 3,012 | | |
Transfer agent fees and expenses | | | 3,007 | | | | 2,500 | | | | 3,000 | | | | 3,000 | | |
Merger expense | | | — | | | | — | | | | — | | | | — | | |
Other | | | 8,766 | | | | 26,509 | | | | 42,629 | | | | 16,310 | | |
Total Expenses | | | 750,345 | | | | 445,710 | | | | 1,423,115 | | | | 665,604 | | |
Less: amounts waived (Note 5) | | | (479,459 | ) | | | — | | | | — | | | | — | | |
Less: rebate from Morgan Stanley affiliated cash sweep (Note 6) | | | — | | | | (1,369 | ) | | | (8,989 | ) | | | (1,179 | ) | |
Less: expense offset (Note 9) | | | — | | | | (7 | ) | | | (12 | ) | | | — | | |
Net Expenses | | | 270,886 | | | | 444,334 | | | | 1,414,114 | | | | 664,425 | | |
Net Investment Income (Loss) | | | 8,026 | | | | 712,005 | | | | 7,687,080 | | | | 1,785,078 | | |
Realized and Unrealized Gain (Loss): | |
Realized Gain (Loss) on: | |
Investments | | | 15 | | | | 332,475 | | | | 9,791,948 | | | | 5,951,107 | | |
Investments in affiliates (Note 6) | | | — | | | | 13,699 | | | | 619,212 | | | | — | | |
Futures contracts | | | — | | | | 135,353 | | | | (762,483 | ) | | | — | | |
Swap agreements | | | — | | | | (270,344 | ) | | | (91,230 | ) | | | — | | |
Foreign currency exchange contracts | | | — | | | | — | | | | 15,809 | | | | — | | |
Foreign currency translation | | | — | | | | — | | | | 757 | | | | 19,338 | | |
Net Realized Gain (Loss) | | | 15 | | | | 211,183 | | | | 9,574,013 | | | | 5,970,445 | | |
Change in Unrealized Appreciation (Depreciation) on: | |
Investments | | | — | | | | 526,151 | | | | 7,888,949 | | | | 4,612,140 | | |
Investments in affiliates (Note 6) | | | — | | | | 31,970 | | | | 60,556 | | | | — | | |
Futures contracts | | | — | | | | (38,468 | ) | | | 129,095 | | | | — | | |
Swap agreements | | | — | | | | 239,725 | | | | (274,088 | ) | | | — | | |
Foreign currency exchange contracts | | | — | | | | — | | | | (4,972 | ) | | | — | | |
Foreign currency translation | | | — | | | | — | | | | 60 | | | | 3,182 | | |
Net Change in Unrealized Appreciation (Depreciation) | | | — | | | | 759,378 | | | | 7,799,600 | | | | 4,615,322 | | |
Net Gain | | | 15 | | | | 970,561 | | | | 17,373,613 | | | | 10,585,767 | | |
Net Increase | | $ | 8,041 | | | $ | 1,682,566 | | | $ | 25,060,693 | | | $ | 12,370,845 | | |
See Notes to Financial Statements
70
| | | European
Equity | | Multi Cap
Growth | | Aggressive
Equity | | Strategist | |
Net Investment Income: | |
Income | |
Interest† | | $ | — | | | $ | — | | | $ | — | | | $ | 820,749 | | |
Dividends† | | | 2,274,816 | | | | 2,366,332 | | | | 298,711 | | | | 2,506,199 | | |
Interest and dividends from affiliates (Note 6) | | | 1,043 | | | | 10,163 | | | | 1,375 | | | | 47,423 | | |
Income from securities loaned - net | | | 60,564 | | | | — | | | | — | | | | — | | |
Total Income | | | 2,336,423 | | | | 2,376,495 | | | | 300,086 | | | | 3,374,371 | | |
†Net of foreign withholding taxes | | | 161,556 | | | | 55,114 | | | | 7,000 | | | | — | | |
Expenses | |
Advisory fee (Note 4) | | | 451,223 | | | | 945,905 | | | | 189,913 | | | | 546,883 | | |
Distribution fee (Class Y shares) (Note 5) | | | 29,225 | | | | 123,379 | | | | 40,291 | | | | 93,633 | | |
Professional fees | | | 81,259 | | | | 72,788 | | | | 61,620 | | | | 86,090 | | |
Administration fee (Note 4) | | | 41,492 | | | | 180,172 | | | | 22,676 | | | | 104,168 | | |
Shareholder reports and notices | | | 14,069 | | | | 54,633 | | | | 14,017 | | | | 40,509 | | |
Custodian fees | | | 22,269 | | | | 24,909 | | | | 12,060 | | | | 27,116 | | |
Trustees' fees and expenses | | | 2,507 | | | | 7,914 | | | | 1,733 | | | | 4,846 | | |
Transfer agent fees and expenses | | | 3,000 | | | | 3,501 | | | | 2,499 | | | | 3,000 | | |
Merger expense | | | — | | | | — | | | | 33,250 | | | | 22,750 | | |
Other | | | 17,197 | | | | 17,093 | | | | 15,314 | | | | 35,876 | | |
Total Expenses | | | 662,241 | | | | 1,430,294 | | | | 393,373 | | | | 964,871 | | |
Less: amounts waived (Note 5) | | | (114,369 | ) | | | — | | | | — | | | | — | | |
Less: rebate from Morgan Stanley affiliated cash sweep (Note 6) | | | (871 | ) | | | (9,118 | ) | | | (1,303 | ) | | | (29,640 | ) | |
Less: expense offset (Note 9) | | | — | | | | (5 | ) | | | — | | | | (2 | ) | |
Net Expenses | | | 547,001 | | | | 1,421,171 | | | | 392,070 | | | | 935,229 | | |
Net Investment Income (Loss) | | | 1,789,422 | | | | 955,324 | | | | (91,984 | ) | | | 2,439,142 | | |
Realized and Unrealized Gain (Loss): | |
Realized Gain (Loss) on: | |
Investments | | | (81,833 | ) | | | 3,762,928 | | | | 465,634 | | | | (331,971 | ) | |
Investments in affiliates (Note 6) | | | — | | | | — | | | | — | | | | (898,255 | ) | |
Futures contracts | | | — | | | | — | | | | — | | | | 25,894 | | |
Swap agreements | | | — | | | | — | | | | — | | | | (72,745 | ) | |
Foreign currency exchange contracts | | | (180,292 | ) | | | — | | | | — | | | | 4,044 | | |
Foreign currency translation | | | (238,563 | ) | | | (7,252 | ) | | | (855 | ) | | | (373 | ) | |
Net Realized Gain (Loss) | | | (500,688 | ) | | | 3,755,676 | | | | 464,779 | | | | (1,273,406 | ) | |
Change in Unrealized Appreciation (Depreciation) on: | |
Investments | | | 7,405,770 | | | | 22,329,104 | | | | 2,822,065 | | | | 6,656,999 | | |
Investments in affiliates (Note 6) | | | — | | | | — | | | | — | | | | 999,063 | | |
Futures contracts | | | — | | | | — | | | | — | | | | 5,945 | | |
Swap agreements | | | — | | | | — | | | | — | | | | 28,005 | | |
Foreign currency exchange contracts | | | 147,144 | | | | — | | | | — | | | | 4,074 | | |
Foreign currency translation | | | 5,308 | | | | 2,289 | | | | 268 | | | | 3,175 | | |
Net Change in Unrealized Appreciation (Depreciation) | | | 7,558,222 | | | | 22,331,393 | | | | 2,822,333 | | | | 7,697,261 | | |
Net Gain | | | 7,057,534 | | | | 26,087,069 | | | | 3,287,112 | | | | 6,423,855 | | |
Net Increase | | $ | 8,846,956 | | | $ | 27,042,393 | | | $ | 3,195,128 | | | $ | 8,862,997 | | |
71
Morgan Stanley Variable Investment Series
Financial Statements continued
Statements of Changes in Net Assets
| | | Money Market | | Limited Duration | | Income Plus | |
| | | For The Year
Ended
December 31, 2012 | | For The Year
Ended
December 31, 2011 | | For The Year
Ended
December 31, 2012 | | For The Year
Ended
December 31, 2011 | | For The Year
Ended
December 31, 2012 | | For The Year
Ended
December 31, 2011 | |
Increase (Decrease) in Net Assets: | |
Operations: | |
Net investment income | | $ | 8,026 | | | $ | 12,040 | | | $ | 712,005 | | | $ | 1,217,838 | | | $ | 7,687,080 | | | $ | 10,385,354 | | |
Net realized gain (loss) | | | 15 | | | | (2,034 | ) | | | 211,183 | | | | 340,336 | | | | 9,574,013 | | | | 5,672,980 | | |
Net change in unrealized appreciation (depreciation) | | | — | | | | — | | | | 759,378 | | | | 74,923 | | | | 7,799,600 | | | | (5,677,427 | ) | |
Net Increase (Decrease) | | | 8,041 | | | | 10,006 | | | | 1,682,566 | | | | 1,633,097 | | | | 25,060,693 | | | | 10,380,907 | | |
Dividends and Distributions to Shareholders from: | |
Net investment income | |
Class X shares | | | (4,981 | ) | | | (5,521 | ) | | | (347,237 | ) | | | (456,806 | ) | | | (5,085,206 | ) | | | (5,809,741 | ) | |
Class Y shares | | | (5,523 | ) | | | (6,188 | ) | | | (1,155,973 | ) | | | (1,462,462 | ) | | | (5,615,046 | ) | | | (6,427,424 | ) | |
Net realized gain | |
Class X shares | | | — | | | | — | | | | — | | | | — | | | | — | | | | — | | |
Class Y shares | | | — | | | | — | | | | — | | | | — | | | | — | | | | — | | |
Total Dividends and Distributions | | | (10,504 | ) | | | (11,709 | ) | | | (1,503,210 | ) | | | (1,919,268 | ) | | | (10,700,252 | ) | | | (12,237,165 | ) | |
Net decrease from transactions in shares of
beneficial interest | | | (16,444,948 | ) | | | (19,788,308 | ) | | | (7,593,029 | ) | | | (11,618,059 | ) | | | (23,839,687 | ) | | | (35,004,480 | ) | |
Net Decrease | | | (16,447,411 | ) | | | (19,790,011 | ) | | | (7,413,673 | ) | | | (11,904,230 | ) | | | (9,479,246 | ) | | | (36,860,738 | ) | |
Net Assets: | |
Beginning of period | | | 107,280,108 | | | | 127,070,119 | | | | 56,777,448 | | | | 68,681,678 | | | | 193,823,950 | | | | 230,684,688 | | |
End of Period | | $ | 90,832,697 | | | $ | 107,280,108 | | | $ | 49,363,775 | | | $ | 56,777,448 | | | $ | 184,344,704 | | | $ | 193,823,950 | | |
Accumulated Undistributed Net Investment
Income (Loss) | | $ | (2,481 | ) | | $ | 58 | | | $ | 1,063,037 | | | $ | 1,499,321 | | | $ | 8,046,009 | | | $ | 10,694,720 | | |
See Notes to Financial Statements
72
| | | Global Infrastructure | | European Equity | |
| | | For The Year
Ended
December 31, 2012 | | For The Year
Ended
December 31, 2011 | | For The Year
Ended
December 31, 2012 | | For The Year
Ended
December 31, 2011 | |
Increase (Decrease) in Net Assets: | |
Operations: | |
Net investment income | | $ | 1,785,078 | | | $ | 1,821,472 | | | $ | 1,789,422 | | | $ | 1,640,380 | | |
Net realized gain (loss) | | | 5,970,445 | | | | 6,272,022 | | | | (500,688 | ) | | | 1,393,180 | | |
Net change in unrealized appreciation (depreciation) | | | 4,615,322 | | | | 3,163,169 | | | | 7,558,222 | | | | (8,877,969 | ) | |
Net Increase (Decrease) | | | 12,370,845 | | | | 11,256,663 | | | | 8,846,956 | | | | (5,844,409 | ) | |
Dividends and Distributions to Shareholders from: | |
Net investment income | |
Class X shares | | | (1,393,488 | ) | | | (1,548,002 | ) | | | (1,129,845 | ) | | | (1,159,573 | ) | |
Class Y shares | | | (317,994 | ) | | | (341,922 | ) | | | (291,780 | ) | | | (329,209 | ) | |
Net realized gain | |
Class X shares | | | (5,078,266 | ) | | | (3,167,474 | ) | | | — | | | | — | | |
Class Y shares | | | (1,294,994 | ) | | | (781,261 | ) | | | — | | | | — | | |
Total Dividends and Distributions | | | (8,084,742 | ) | | | (5,838,659 | ) | | | (1,421,625 | ) | | | (1,488,782 | ) | |
Net decrease from transactions in shares of
beneficial interest | | | (5,623,624 | ) | | | (9,143,834 | ) | | | (8,361,702 | ) | | | (12,462,693 | ) | |
Net Decrease | | | (1,337,521 | ) | | | (3,725,830 | ) | | | (936,371 | ) | | | (19,795,884 | ) | |
Net Assets: | |
Beginning of period | | | 73,470,824 | | | | 77,196,654 | | | | 52,849,658 | | | | 72,645,542 | | |
End of Period | | $ | 72,133,303 | | | $ | 73,470,824 | | | $ | 51,913,287 | | | $ | 52,849,658 | | |
Accumulated Undistributed Net Investment
Income (Loss) | | $ | 1,799,716 | | | $ | 1,649,890 | | | $ | 1,514,061 | | | $ | 1,565,150 | | |
73
Morgan Stanley Variable Investment Series
Financial Statements continued
Statements of Changes in Net Assets continued
| | | Multi Cap Growth | | Aggressive Equity | |
| | | For The Year
Ended
December 31, 2012 | | For The Year
Ended
December 31, 2011 | | For The Year
Ended
December 31, 2012 | | For The Year
Ended
December 31, 2011 | |
Increase (Decrease) in Net Assets: | |
Operations: | |
Net investment income (loss) | | $ | 955,324 | | | $ | (64,872 | ) | | $ | (91,984 | ) | | $ | (188,722 | ) | |
Net realized gain (loss) | | | 3,755,676 | | | | 32,645,551 | | | | 464,779 | | | | 4,222,056 | | |
Net change in unrealized appreciation (depreciation) | | | 22,331,393 | | | | (48,028,545 | ) | | | 2,822,333 | | | | (6,086,619 | ) | |
Net Increase (Decrease) | | | 27,042,393 | | | | (15,447,866 | ) | | | 3,195,128 | | | | (2,053,285 | ) | |
Distributions to Shareholders from: | |
Net investment income | |
Class X Shares | | | — | | | | (327,521 | ) | | | — | | | | — | | |
Class Y Shares | | | — | | | | — | | | | — | | | | — | | |
Net realized gain | |
Class X Shares | | | (3,819,990 | ) | | | — | | | | (939,227 | ) | | | — | | |
Class Y Shares | | | (1,066,481 | ) | | | — | | | | (1,257,234 | ) | | | — | | |
Total Dividends and Distributions | | | (4,886,471 | ) | | | (327,521 | ) | | | (2,196,461 | ) | | | — | | |
Net decrease from transactions in shares of beneficial interest | | | (34,644,616 | ) | | | (49,118,412 | ) | | | (2,459,111 | ) | | | (4,238,872 | ) | |
Net Decrease | | | (12,488,694 | ) | | | (64,893,799 | ) | | | (1,460,444 | ) | | | (6,292,157 | ) | |
Net Assets: | |
Beginning of period | | | 222,962,261 | | | | 287,856,060 | | | | 27,898,378 | | | | 34,190,535 | | |
End of Period | | $ | 210,473,567 | | | $ | 222,962,261 | | | $ | 26,437,934 | | | $ | 27,898,378 | | |
Accumulated Undistributed Net Investment Income (Loss) | | $ | 769,489 | | | $ | (240,492 | ) | | $ | (20,770 | ) | | $ | (33,028 | ) | |
See Notes to Financial Statements
74
| | | Strategist | |
| | | For The Year
Ended
December 31, 2012 | | For The Year
Ended
December 31, 2011 | |
Increase (Decrease) in Net Assets: | |
Operations: | |
Net investment income (loss) | | $ | 2,439,142 | | | $ | 2,351,102 | | |
Net realized gain (loss) | | | (1,273,406 | ) | | | 1,769,803 | | |
Net change in unrealized appreciation (depreciation) | | | 7,697,261 | | | | (16,475,705 | ) | |
Net Increase (Decrease) | | | 8,862,997 | | | | (12,354,800 | ) | |
Distributions to Shareholders from: | |
Net investment income | |
Class X Shares | | | (1,835,044 | ) | | | (2,406,851 | ) | |
Class Y Shares | | | (615,244 | ) | | | (860,346 | ) | |
Net realized gain | |
Class X Shares | | | (1,393,988 | ) | | | (12,604,023 | ) | |
Class Y Shares | | | (559,117 | ) | | | (5,258,076 | ) | |
Total Dividends and Distributions | | | (4,403,393 | ) | | | (21,129,296 | ) | |
Net decrease from transactions in shares of beneficial interest | | | (20,125,652 | ) | | | (14,118,840 | ) | |
Net Decrease | | | (15,666,048 | ) | | | (47,602,936 | ) | |
Net Assets: | |
Beginning of period | | | 137,012,329 | | | | 184,615,265 | | |
End of Period | | $ | 121,346,281 | | | $ | 137,012,329 | | |
Accumulated Undistributed Net Investment Income (Loss) | | $ | 2,603,122 | | | $ | 2,444,177 | | |
75
Morgan Stanley Variable Investment Series
Financial Statements continued
Statements of Changes in Net Assets continued
Summary of Transactions in Shares of Beneficial Interest
| | | Money Market | | Limited Duration | | Income Plus | |
| | | For The Year
Ended
December 31, 2012 | | For The Year
Ended
December 31, 2011 | | For The Year
Ended
December 31, 2012 | | For The Year
Ended
December 31, 2011 | | For The Year
Ended
December 31, 2012 | | For The Year
Ended
December 31, 2011 | |
Class X Shares | |
Shares | |
Sold | | | 8,138,796 | | | | 9,528,528 | | | | 39,757 | | | | 37,891 | | | | 158,115 | | | | 120,523 | | |
Reinvestment of dividends and distributions | | | 4,981 | | | | 5,521 | | | | 45,689 | | | | 59,870 | | | | 454,849 | | | | 529,120 | | |
Redeemed | | | (17,306,444 | ) | | | (18,033,730 | ) | | | (357,172 | ) | | | (375,310 | ) | | | (1,526,605 | ) | | | (1,931,499 | ) | |
Net Decrease - Class X | | | (9,162,667 | ) | | | (8,499,681 | ) | | | (271,726 | ) | | | (277,549 | ) | | | (913,641 | ) | | | (1,281,856 | ) | |
Amount | |
Sold | | $ | 8,138,796 | | | $ | 9,528,528 | | | $ | 308,431 | | | $ | 292,242 | | | $ | 1,835,747 | | | $ | 1,351,724 | | |
Reinvestment of dividends and distributions | | | 4,981 | | | | 5,521 | | | | 347,237 | | | | 456,806 | | | | 5,085,206 | | | | 5,809,741 | | |
Redeemed | | | (17,306,444 | ) | | | (18,033,730 | ) | | | (2,761,250 | ) | | | (2,907,547 | ) | | | (17,784,137 | ) | | | (21,828,131 | ) | |
Net Decrease - Class X | | $ | (9,162,667 | ) | | $ | (8,499,681 | ) | | $ | (2,105,582 | ) | | $ | (2,158,499 | ) | | $ | (10,863,184 | ) | | $ | (14,666,666 | ) | |
Class Y Shares | |
Shares | |
Sold | | | 10,141,795 | | | | 14,834,425 | | | | 152,869 | | | | 159,097 | | | | 188,882 | | | | 238,653 | | |
Reinvestment of dividends and distributions | | | 5,523 | | | | 6,188 | | | | 152,302 | | | | 191,924 | | | | 503,592 | | | | 586,444 | | |
Redeemed | | | (17,429,599 | ) | | | (26,129,240 | ) | | | (1,016,517 | ) | | | (1,571,630 | ) | | | (1,792,003 | ) | | | (2,627,052 | ) | |
Net Decrease - Class Y | | | (7,282,281 | ) | | | (11,288,627 | ) | | | (711,346 | ) | | | (1,220,609 | ) | | | (1,099,529 | ) | | | (1,801,955 | ) | |
Amount | |
Sold | | $ | 10,141,795 | | | $ | 14,834,425 | | | $ | 1,184,321 | | | $ | 1,222,848 | | | $ | 2,189,967 | | | $ | 2,668,015 | | |
Reinvestment of dividends and distributions | | | 5,523 | | | | 6,188 | | | | 1,155,973 | | | | 1,462,462 | | | | 5,615,046 | | | | 6,427,424 | | |
Redeemed | | | (17,429,599 | ) | | | (26,129,240 | ) | | | (7,827,741 | ) | | | (12,144,870 | ) | | | (20,781,516 | ) | | | (29,433,253 | ) | |
Net Decrease - Class Y | | $ | (7,282,281 | ) | | $ | (11,288,627 | ) | | $ | (5,487,447 | ) | | $ | (9,459,560 | ) | | $ | (12,976,503 | ) | | $ | (20,337,814 | ) | |
See Notes to Financial Statements
76
| | | Global Infrastructure | | European Equity | |
| | | For The Year
Ended
December 31, 2012 | | For The Year
Ended
December 31, 2011 | | For The Year
Ended
December 31, 2012 | | For The Year
Ended
December 31, 2011 | |
Class X Shares | |
Shares | |
Sold | | | 30,394 | | | | 41,008 | | | | 13,569 | | | | 10,124 | | |
Reinvestment of dividends and distributions | | | 780,670 | | | | 560,033 | | | | 79,622 | | | | 68,170 | | |
Redeemed | | | (1,303,365 | ) | | | (1,394,386 | ) | | | (536,124 | ) | | | (590,445 | ) | |
Net Decrease - Class X | | | (492,301 | ) | | | (793,345 | ) | | | (442,933 | ) | | | (512,151 | ) | |
Amount | |
Sold | | $ | 269,633 | | | $ | 350,997 | | | $ | 209,416 | | | $ | 152,977 | | |
Reinvestment of dividends and distributions | | | 6,471,754 | | | | 4,715,476 | | | | 1,129,845 | | | | 1,159,573 | | |
Redeemed | | | (11,564,117 | ) | | | (11,775,763 | ) | | | (8,130,383 | ) | | | (9,410,517 | ) | |
Net Decrease - Class X | | $ | (4,822,730 | ) | | $ | (6,709,290 | ) | | $ | (6,791,122 | ) | | $ | (8,097,967 | ) | |
Class Y Shares | |
Shares | |
Sold | | | 46,975 | | | | 37,827 | | | | 1,462 | | | | 4,450 | | |
Reinvestment of dividends and distributions | | | 195,041 | | | | 133,712 | | | | 20,606 | | | | 19,411 | | |
Redeemed | | | (322,481 | ) | | | (456,268 | ) | | | (124,257 | ) | | | (312,722 | ) | |
Net Decrease - Class Y | | | (80,465 | ) | | | (284,729 | ) | | | (102,189 | ) | | | (288,861 | ) | |
Amount | |
Sold | | $ | 415,592 | | | $ | 315,142 | | | $ | 21,281 | | | $ | 67,572 | | |
Reinvestment of dividends and distributions | | | 1,612,988 | | | | 1,123,183 | | | | 291,780 | | | | 329,209 | | |
Redeemed | | | (2,829,474 | ) | | | (3,872,869 | ) | | | (1,883,641 | ) | | | (4,761,507 | ) | |
Net Decrease - Class Y | | $ | (800,894 | ) | | $ | (2,434,544 | ) | | $ | (1,570,580 | ) | | $ | (4,364,726 | ) | |
77
Morgan Stanley Variable Investment Series
Financial Statements continued
Statements of Changes in Net Assets continued
Summary of Transactions in Shares of Beneficial Interest
| | | Multi Cap Growth | | Aggressive Equity | |
| | | For The Year
Ended
December 31, 2012 | | For The Year
Ended
December 31, 2011 | | For The Year
Ended
December 31, 2012 | | For The Year
Ended
December 31, 2011 | |
Class X Shares | |
Shares | |
Sold | | | 15,963 | | | | 23,630 | | | | 6,451 | | | | 22,589 | | |
Reinvestment of dividends and distributions | | | 95,285 | | | | 7,793 | | | | 51,606 | | | | — | | |
Redeemed | | | (734,540 | ) | | | (891,278 | ) | | | (132,751 | ) | | | (145,437 | ) | |
Net Decrease - Class X | | | (623,292 | ) | | | (859,855 | ) | | | (74,694 | ) | | | (122,848 | ) | |
Amount | |
Sold | | $ | 651,185 | | | $ | 952,101 | | | $ | 123,043 | | | $ | 434,357 | | |
Reinvestment of dividends and distributions | | | 3,819,990 | | | | 327,521 | | | | 939,227 | | | | — | | |
Redeemed | | | (30,117,363 | ) | | | (36,256,926 | ) | | | (2,499,725 | ) | | | (2,852,868 | ) | |
Net Decrease - Class X | | $ | (25,646,188 | ) | | $ | (34,977,304 | ) | | $ | (1,437,455 | ) | | $ | (2,418,511 | ) | |
Class Y Shares | |
Shares | |
Sold | | | 20,602 | | | | 44,490 | | | | 8,066 | | | | 154,196 | | |
Reinvestment of dividends and distributions | | | 26,864 | | | | — | | | | 70,990 | | | | — | | |
Redeemed | | | (266,996 | ) | | | (394,005 | ) | | | (129,942 | ) | | | (241,830 | ) | |
Net Decrease - Class Y | | | (219,530 | ) | | | (349,515 | ) | | | (50,886 | ) | | | (87,634 | ) | |
Amount | |
Sold | | $ | 812,587 | | | $ | 1,698,262 | | | $ | 149,633 | | | $ | 2,809,245 | | |
Reinvestment of dividends and distributions | | | 1,066,481 | | | | — | | | | 1,257,234 | | | | — | | |
Redeemed | | | (10,877,496 | ) | | | (15,839,370 | ) | | | (2,428,523 | ) | | | (4,629,606 | ) | |
Net Decrease - Class Y | | $ | (8,998,428 | ) | | $ | (14,141,108 | ) | | $ | (1,021,656 | ) | | $ | (1,820,361 | ) | |
See Notes to Financial Statements
78
| | | Strategist | |
| | | For The Year
Ended
December 31, 2012 | | For The Year
Ended
December 31, 2011 | |
Class X Shares | |
Shares | |
Sold | | | 53,608 | | | | 33,714 | | |
Reinvestment of dividends and distributions | | | 308,114 | | | | 1,314,437 | | |
Redeemed | | | (1,664,383 | ) | | | (1,905,781 | ) | |
Net Decrease - Class X | | | (1,302,661 | ) | | | (557,630 | ) | |
Amount | |
Sold | | $ | 571,585 | | | $ | 381,164 | | |
Reinvestment of dividends and distributions | | | 3,229,032 | | | | 15,010,874 | | |
Redeemed | | | (17,794,208 | ) | | | (22,742,640 | ) | |
Net Decrease - Class X | | $ | (13,993,591 | ) | | $ | (7,350,602 | ) | |
Class Y Shares | |
Shares | |
Sold | | | 37,081 | | | | 11,243 | | |
Reinvestment of dividends and distributions | | | 112,272 | | | | 537,175 | | |
Redeemed | | | (722,191 | ) | | | (1,070,631 | ) | |
Net Decrease - Class Y | | | (572,838 | ) | | | (522,213 | ) | |
Amount | |
Sold | | $ | 395,377 | | | $ | 130,345 | | |
Reinvestment of dividends and distributions | | | 1,174,361 | | | | 6,118,422 | | |
Redeemed | | | (7,701,799 | ) | | | (13,017,005 | ) | |
Net Decrease - Class Y | | $ | (6,132,061 | ) | | $ | (6,768,238 | ) | |
79
Morgan Stanley Variable Investment Series
Notes to Financial Statements n December 31, 2012
1. Organization and Accounting Policies
Morgan Stanley Variable Investment Series (the "Fund") is registered under the Investment Company Act of 1940, as amended (the "Act"), as a diversified, open-end management investment company. The Fund is offered exclusively to life insurance companies in connection with particular life insurance and/or annuity contracts they offer.
The Fund, organized on February 25, 1983 as a Massachusetts business trust, consists of eight Portfolios ("Portfolios") which commenced operations as follows:
PORTFOLIO | | COMMENCEMENT OF
OPERATIONS | | PORTFOLIO | | COMMENCEMENT OF
OPERATIONS | |
Money Market | | March 9, 1984 | | European Equity | | March 1, 1991 | |
Limited Duration | | May 4, 1999 | | Multi Cap Growth | | March 9, 1984 | |
Income Plus | | March 1, 1987 | | Aggressive Equity | | May 4, 1999 | |
Global Infrastructure | | March 1, 1990 | | Strategist | | March 1, 1987 | |
On June 5, 2000, the Fund commenced offering one additional class of shares (Class Y shares). The two classes are identical except that Class Y shares incur distribution expenses. Class X shares are generally available to holders of contracts offered before May 1, 2000. Class Y shares are available to holders of contracts offered on or after June 5, 2000.
The investment objectives of each Portfolio are as follows:
| Money Market | | Seeks high current income, preservation of capital and liquidity. | |
| Limited Duration | | Seeks to provide a high level of current income, consistent with the preservation of capital. | |
| Income Plus | | Seeks, as its primary objective, to provide a high level of current income and, as a secondary objective, capital appreciation, but only when consistent with its primary objective. | |
| Global Infrastructure | | Seeks both capital appreciation and current income. | |
| European Equity | | Seeks to maximize the capital appreciation of its investments. | |
| Multi Cap Growth | | Seeks, as its primary objective, growth of capital and, as a secondary objective, income, but only when consistent with its primary objective. | |
| Aggressive Equity | | Seeks long-term capital growth. | |
| Strategist | | Seeks high total investment return. | |
80
Morgan Stanley Variable Investment Series
Notes to Financial Statements n December 31, 2012 continued
The following is a summary of significant policies:
A. Valuation of Investments — Money Market: Portfolio securities are valued at amortized cost, which approximates fair value, in accordance with Rule 2a-7 under the Act. All remaining Portfolios: (1) an equity portfolio security listed or traded on the New York Stock Exchange ("NYSE") or American Stock Exchange or other domestic exchange is valued at its latest reported sales price (or the exchange official closing price if such exchange reports an official closing price) prior to the time when assets are valued; if there were no sales that day, the security is valued at the mean between the last reported bid and asked price; (2) an equity portfolio security listed or traded on the Nasdaq is valued at the Nasdaq Official Closing Price; if there were no sales that day, the security is valued at the mean between the last reported bid and asked price; (3) all other domestic securities for which over-the-counter market quotations are readily available are valued at the mean between the last reported bid and asked prices. In cases where a security is traded on more than one domestic exchange, the security is valued on the exchange designated as the primary market; (4) swaps are marked-to-market daily based upon quotations from market makers; (5) for equity securities traded on foreign exchanges, the latest reported sales price (or the exchange official closing price if such exchange reports an official closing price) or the mean between the last reported bid and asked prices may be used if there were no sales on a particular day or the latest bid price may be used if only bid prices are available; (6) futures are valued at the latest price published by the commodities exchange on which they trade; (7) when market quotations are not readily available, including circumstances under which Morgan Stanley Investment Management Inc. (the "Adviser") or Morgan Stanley Investment Management Limited or Morgan Stanley Investment Management Company (each, a "Sub-Adviser"), each a wholly owned subsidiary of Morgan Stanley, determines that the latest sale price, the bid price or the mean between the last reported bid and ask price do not reflect a security's fair value, portfolio securities are valued at their fair value as determined in good faith under procedures established by and under the general supervision of the Fund's Board of Trustees (the "Trustees"). Occasionally, developments affecting the closing prices of securities and other assets may occur between the times at which valuations of such securities are determined (that is, close of the foreign market on which the securities trade) and the close of business on the NYSE. If developments occur during such periods that are expected to materially affect the value of such securities, such valuations may be adjusted to reflect the estimated fair value of such securities as of the close of the NYSE, as determined in good faith by the Trustees or by the Adviser using a pricing service and/or procedures approved by the Trustees; (8) certain portfolio securities may be valued by an outside pricing service approved by the Trustees. The prices provided by a pricing service take into account broker-dealer market price quotations for trading in similar groups of securities, security quality, maturity, coupon and other security characteristics as well as any developments related to the specific securities; (9) investments in mutual funds, including the Morgan Stanley Institutional Liquidity Funds, are valued at the
81
Morgan Stanley Variable Investment Series
Notes to Financial Statements n December 31, 2012 continued
net asset value as of the close of each business day; and (10) short-term debt securities having a maturity date of more than sixty days at time of purchase are valued on a mark-to-market basis until sixty days prior to maturity and thereafter at amortized cost based on their value on the 61st day. Short-term debt securities having a maturity date of sixty days or less at the time of purchase are valued at amortized cost, which approximates fair value.
Under procedures approved by the Trustees, the Fund's Adviser has formed a Valuation Committee. The Valuation Committee provides administration and oversight of the Fund's valuation policies and procedures, which are reviewed at least annually by the Trustees. Among other things, these procedures allow the Fund to utilize independent pricing services, quotations from securities and financial instrument dealers, and other market sources to determine fair value.
The Fund has procedures to determine the fair value of securities and other financial instruments for which market prices are not readily available. Under these procedures, the Valuation Committee convenes on a regular and ad hoc basis to review such securities and considers a number of factors, including valuation methodologies and significant unobservable valuation inputs, when arriving at fair value. The Valuation Committee may employ a market-based approach which may use related or comparable assets or liabilities, recent transactions, market multiples, book values, and other relevant information for the investment to determine the fair value of the investment. An income-based valuation approach may also be used in which the anticipated future cash flows of the investment are discounted to calculate fair value. Discounts may also be applied due to the nature or duration of any restrictions on the disposition of the investments. Due to the inherent uncertainty of valuations of such investments, the fair values may differ significantly from the values that would have been used had an active market existed. The Valuation Committee employs various methods for calibrating these valuation approaches including a regular review of valuation methodologies, key inputs and assumptions, transactional back-testing or disposition analysis, and reviews of any related market activity.
B. Accounting for Investments — Security transactions are accounted for on the trade date (date the order to buy or sell is executed). Realized gains and losses on security transactions are determined by the identified cost method. Dividend income and other distributions are recorded on the ex-dividend date except for certain dividends on foreign securities which are recorded as soon as the Fund is informed after the ex-dividend date. Interest income is accrued daily as earned except where collection is not expected. Discounts are accreted and premiums are amortized over the life of the respective securities and are included in interest income.
82
Morgan Stanley Variable Investment Series
Notes to Financial Statements n December 31, 2012 continued
C. Repurchase Agreements — The Fund invests directly with institutions in repurchase agreements. The Fund's custodian receives the collateral, which is marked-to-market daily to determine that the value of the collateral does not decrease below the repurchase price plus accrued interest as earned. If such a decrease occurs, additional collateral will be requested and, when received, will be added to the account to maintain full collateralization.
D. Multiple Class Allocations — Investment income, expenses (other than distribution fees), and realized and unrealized gains and losses are allocated to each class of shares based upon the relative net asset value on the date such items are recognized. Distribution fees are charged directly to the respective class.
E. Foreign Currency Translation — The books and records of the Fund are maintained in U.S. dollars as follows: (1) the foreign currency market value of investment securities, other assets and liabilities and foreign currency exchange contracts are translated at the exchange rates prevailing at the end of the period; and (2) purchases, sales, income and expenses are translated at the exchange rates prevailing on the respective dates of such transactions. The resultant exchange gains and losses are recorded as realized and unrealized gains/losses on foreign currency exchange contracts and foreign currency translations. Pursuant to U.S. federal income tax regulations, certain foreign exchange gains/losses included in realized and unrealized gains/losses are included in or are a reduction of ordinary income for federal income tax purposes. The Fund does not isolate that portion of the results of operations arising as a result of changes in the foreign exchange rates from the changes in the market prices of the securities held.
F. Restricted Securities — Certain Portfolios invested in unregistered or otherwise restricted securities. The term "restricted securities" refers to securities that are unregistered or are held by control persons of the issuer and securities that are subject to contractual restrictions on their resale. As a result, restricted securities may be more difficult to value and the Portfolio may have difficulty disposing of such assets either in a timely manner or for a reasonable price. In order to dispose of an unregistered security, the Portfolio, where it has contractual rights to do so, may have to cause such security to be registered. A considerable period may elapse between the time the decision is made to sell the security and the time the security is registered so that the Portfolio could sell it. Contractual restrictions on the resale of securities vary in length and scope and are generally the result of a negotiation between the issuer and acquirer of the securities. The Portfolio would, in either case, bear market risks during that period. Restricted Securities are identified in the Portfolio of Investments.
G. Securities Lending — The Fund may lend securities to qualified financial institutions, such as broker-dealers, to earn additional income. Any increase or decrease in the fair value of the securities loaned that might occur and any interest earned or dividends declared on those securities during the term of the
83
Morgan Stanley Variable Investment Series
Notes to Financial Statements n December 31, 2012 continued
loan would remain in the Fund. The Fund receives cash or securities as collateral in an amount equal to or exceeding 100% of the current fair value of the loaned securities. The collateral is marked-to-market daily, by the securities lending agent, to ensure that a minimum of 100% collateral coverage is maintained.
Based on pre-established guidelines, the securities lending agent invests any cash collateral that is received in high-quality short-term investments. Securities lending income is generated from the earnings on the invested collateral and borrowing fees, less any rebates owed to the borrowers and compensation to the lending agent.
PORTFOLIO | | VALUE OF LOANED
SECURITIES | | VALUE OF COLLATERAL
CASH(1) | |
European Equity | | $ | 500,332 | | | $ | 525,626 | | |
(1) The Portfolio received cash collateral of $507,548 which was subsequently invested in Repurchase Agreements and Morgan Stanley Institutional Liquidity Funds as reported in the Portfolio of Investments. As of December 31, 2012 there was uninvested cash of $18,078, which is not reflected in the Portfolio of Investments.
The Portfolio has the right under the lending agreement to recover the securities from the borrower on demand.
H. Dividends and Distributions to Shareholders — Dividends and distributions to shareholders are recorded on the ex-dividend date.
I. Expenses — Direct expenses are charged to the respective Portfolio and general Fund expenses are allocated on the basis of relative net assets or equally among the Portfolios.
J. Use of Estimates — The preparation of financial statements in accordance with generally accepted accounting principles in the United States ("GAAP") requires management to make estimates and assumptions that affect the reported amounts and disclosures. Actual results could differ from those estimates.
K. Indemnifications — The Fund enters into contracts that contain a variety of indemnifications. The Fund's maximum exposure under these arrangements is unknown. However, the Fund has not had prior claims or losses pursuant to these contracts and expects the risk of loss to be remote.
2. Fair Valuation Measurements
Financial Accounting Standards Board ("FASB") Accounting Standards Codification ("ASC") 820, Fair Value Measurements and Disclosures ("ASC 820"), defines fair value as the value that the Fund would receive to sell an investment or pay to transfer a liability in a timely transaction with an independent buyer in the principal market, or in the absence of a principal market the most advantageous market for the investment or liability. ASC 820 establishes a three-tier hierarchy to distinguish between (1) inputs that reflect the assumptions market participants would use in valuing an asset or liability developed based on market data obtained from
84
Morgan Stanley Variable Investment Series
Notes to Financial Statements n December 31, 2012 continued
sources independent of the reporting entity (observable inputs); and (2) inputs that reflect the reporting entity's own assumptions about the assumptions market participants would use in valuing an asset or liability developed based on the best information available in the circumstances (unobservable inputs) and to establish classification of fair value measurements for disclosure purposes. Various inputs are used in determining the value of the Fund's investments. The inputs are summarized in the three broad levels listed below.
• Level 1 — unadjusted quoted prices in active markets for identical investments
• Level 2 — other significant observable inputs (including quoted prices for similar investments, interest rates, prepayment speeds, credit risk, etc.)
• Level 3 — significant unobservable inputs including the Fund's own assumptions in determining the fair value of investments. Factors considered in making this determination may include, but are not limited to, information obtained by contacting the issuer, analysts, or the appropriate stock exchange (for exchange-traded securities), analysis of the issuer's financial statements or other available documents and, if necessary, available information concerning other securities in similar circumstances
The inputs or methodology used for valuing securities are not necessarily an indication of the risk associated with investing in those securities and the determination of the significance of a particular input to the fair value measurement in its entirety requires judgment and considers factors specific to each security.
The following is a summary of the inputs used to value each Portfolio's investments as of December 31, 2012.
Investment Type | | Level 1
Unadjusted
Quoted Prices | | Level 2
Other
Significant
Observable
Inputs | | Level 3
Significant
Unobservable
Inputs | | Total | |
Money Market | |
Assets: | |
Repurchase Agreements | | $ | — | | | $ | 44,215,000 | | | $ | — | | | $ | 44,215,000 | | |
Commercial Paper | | | — | | | | 23,114,460 | | | | — | | | | 23,114,460 | | |
Certificates of Deposit | | | — | | | | 4,599,994 | | | | — | | | | 4,599,994 | | |
Floating Rate Notes | | | — | | | | 14,319,881 | | | | — | | | | 14,319,881 | | |
Tax-Exempt Instruments | |
Weekly Variable Rate Bond | | | — | | | | 3,000,000 | | | | — | | | | 3,000,000 | | |
Municipal Bond | | | — | | | | 1,514,410 | | | | — | | | | 1,514,410 | | |
Total Tax-Exempt Instruments | | | — | | | | 4,514,410 | | | | — | | | | 4,514,410 | | |
Total Assets | | $ | — | | | $ | 90,763,745 | | | $ | — | | | $ | 90,763,745 | | |
85
Morgan Stanley Variable Investment Series
Notes to Financial Statements n December 31, 2012 continued
Investment Type | | Level 1
Unadjusted
Quoted Prices | | Level 2
Other
Significant
Observable
Inputs | | Level 3
Significant
Unobservable
Inputs | | Total | |
Limited Duration | |
Assets: | |
Fixed Income Securities | |
Corporate Bonds | | $ | — | | | $ | 30,342,714 | | | $ | — | | | $ | 30,342,714 | | |
U.S. Treasury Securities | | | — | | | | 8,123,079 | | | | — | | | | 8,123,079 | | |
Asset-Backed Securities | | | — | | | | 6,028,322 | | | | — | | | | 6,028,322 | | |
Agency Adjustable Rate Mortgages | | | — | | | | 1,878,283 | | | | — | | | | 1,878,283 | | |
Collateralized Mortgage Obligations —
Agency Collateral Series | | | — | | | | 425,254 | | | | — | | | | 425,254 | | |
Agency Fixed Rate Mortgages | | | — | | | | 301,265 | | | | — | | | | 301,265 | | |
Municipal Bond | | | — | | | | 300,642 | | | | — | | | | 300,642 | | |
Sovereign | | | — | | | | 211,000 | | | | — | | | | 211,000 | | |
Total Fixed Income Securities | | | — | | | | 47,610,559 | | | | — | | | | 47,610,559 | | |
Short-Term Investments | |
U.S. Treasury Security | | | — | | | | 74,986 | | | | — | | | | 74,986 | | |
Investment Company | | | 1,439,331 | | | | — | | | | — | | | | 1,439,331 | | |
Total Short-Term Investments | | | 1,439,331 | | | | 74,986 | | | | — | | | | 1,514,317 | | |
Futures Contracts | | | 2,391 | | | | — | | | | — | | | | 2,391 | | |
Interest Rate Swap Agreements | | | — | | | | 2,740 | | | | — | | | | 2,740 | | |
Total Assets | | | 1,441,722 | | | | 47,688,285 | | | | — | | | | 49,130,007 | | |
Liabilities: | |
Futures Contracts | | | (13,261 | ) | | | — | | | | — | | | | (13,261 | ) | |
Interest Rate Swap Agreements | | | — | | | | (34,008 | ) | | | — | | | | (34,008 | ) | |
Total Liabilities | | | (13,261 | ) | | | (34,008 | ) | | | — | | | | (47,269 | ) | |
Total | | $ | 1,428,461 | | | $ | 47,654,277 | | | $ | — | | | $ | 49,082,738 | | |
Income Plus | |
Assets: | |
Fixed Income Securities | |
Corporate Bonds | | $ | — | | | $ | 173,593,628 | | | $ | — | | | $ | 173,593,628 | | |
Asset-Backed Securities | | | — | | | | 1,319,187 | | | | — | | | | 1,319,187 | | |
Municipal Bond | | | — | | | | 680,886 | | | | — | | | | 680,886 | | |
Agency Fixed Rate Mortgage | | | — | | | | 1,577 | | | | — | | | | 1,577 | | |
Total Fixed Income Securities | | | — | | | | 175,595,278 | | | | — | | | | 175,595,278 | | |
Convertible Preferred Stocks | | | 896,557 | | | | — | | | | — | | | | 896,557 | | |
Short-Term Investments | |
U.S. Treasury Securities | | | — | | | | 304,946 | | | | — | | | | 304,946 | | |
Investment Company | | | 6,041,017 | | | | — | | | | — | | | | 6,041,017 | | |
Total Short-Term Investments | | | 6,041,017 | | | | 304,946 | | | | — | | | | 6,345,963 | | |
86
Morgan Stanley Variable Investment Series
Notes to Financial Statements n December 31, 2012 continued
Investment Type | | Level 1
Unadjusted
Quoted Prices | | Level 2
Other
Significant
Observable
Inputs | | Level 3
Significant
Unobservable
Inputs | | Total | |
Credit Default Swap Agreements | | $ | — | | | $ | 66,347 | | | $ | — | | | $ | 66,347 | | |
Futures Contracts | | | 185,111 | | | | — | | | | — | | | | 185,111 | | |
Total Assets | | | 7,122,685 | | | | 175,966,571 | | | | — | | | | 183,089,256 | | |
Liabilities: | |
Foreign Currency Exchange Contracts | | | — | | | | (4,972 | ) | | | — | | | | (4,972 | ) | |
Futures Contracts | | | (264,814 | ) | | | — | | | | — | | | | (264,814 | ) | |
Interest Rate Swap Agreements | | | — | | | | (351,335 | ) | | | — | | | | (351,335 | ) | |
Total Liabilities | | | (264,814 | ) | | | (356,307 | ) | | | — | | | | (621,121 | ) | |
Total | | $ | 6,857,871 | | | $ | 175,610,264 | | | $ | — | | | $ | 182,468,135 | | |
Global Infrastructure | |
Assets: | |
Common Stocks | |
Airports | | $ | — | | | $ | 2,689,076 | | | $ | — | | | $ | 2,689,076 | | |
Communications | | | 7,555,151 | | | | 1,978,827 | | | | — | | | | 9,533,978 | | |
Diversified | | | 1,111,880 | | | | 1,271,697 | | | | — | | | | 2,383,577 | | |
| Oil & Gas Storage & Transportation | | | 26,175,314 | | | | 11,076,512 | | | | — | | | | 37,251,826 | | |
Ports | | | — | | | | 581,793 | | | | — | | | | 581,793 | | |
Toll Roads | | | — | | | | 5,282,562 | | | | — | | | | 5,282,562 | | |
| Transmission & Distribution | | | 4,547,952 | | | | 5,510,700 | | | | — | | | | 10,058,652 | | |
Water | | | 1,318,757 | | | | 1,647,820 | | | | — | | | | 2,966,577 | | |
Total Common Stocks | | | 40,709,054 | | | | 30,038,987 | | | | — | | | | 70,748,041 | | |
Short-Term Investment — Investment Company | | | 1,300,782 | | | | — | | | | — | | | | 1,300,782 | | |
Total Assets | | $ | 42,009,836 | | | $ | 30,038,987 | | | $ | — | | | $ | 72,048,823 | | |
European Equity | |
Assets: | |
Common Stocks | |
| Aerospace & Defense | | $ | — | | | $ | 978,666 | | | $ | — | | | $ | 978,666 | | |
Automobiles | | | — | | | | 2,502,989 | | | | — | | | | 2,502,989 | | |
Commercial Banks | | | — | | | | 7,545,155 | | | | — | | | | 7,545,155 | | |
Electrical Equipment | | | — | | | | 1,330,869 | | | | — | | | | 1,330,869 | | |
Food Products | | | — | | | | 3,248,834 | | | | — | | | | 3,248,834 | | |
| Health Care Providers & Services | | | — | | | | 979,442 | | | | — | | | | 979,442 | | |
| Hotels, Restaurants & Leisure | | | — | | | | 748,582 | | | | — | | | | 748,582 | | |
Household Products | | | — | | | | 1,267,784 | | | | — | | | | 1,267,784 | | |
Industrial Conglomerates | | | — | | | | 1,645,561 | | | | — | | | | 1,645,561 | | |
Information Technology Services | | | — | | | | 882,992 | | | | — | | | | 882,992 | | |
Insurance | | | — | | | | 4,800,616 | | | | — | | | | 4,800,616 | | |
Machinery | | | — | | | | 1,666,405 | | | | — | | | | 1,666,405 | | |
Media | | | — | | | | 1,842,204 | | | | — | | | | 1,842,204 | | |
87
Morgan Stanley Variable Investment Series
Notes to Financial Statements n December 31, 2012 continued
Investment Type | | Level 1
Unadjusted
Quoted Prices | | Level 2
Other
Significant
Observable
Inputs | | Level 3
Significant
Unobservable
Inputs | | Total | |
| Metals & Mining | | $ | — | | | $ | 2,870,474 | | | $ | — | | | $ | 2,870,474 | | |
| Oil, Gas & Consumable Fuels | | | — | | | | 6,333,775 | | | | — | | | | 6,333,775 | | |
Pharmaceuticals | | | — | | | | 6,792,327 | | | | — | | | | 6,792,327 | | |
Professional Services | | | — | | | | 980,115 | | | | — | | | | 980,115 | | |
Tobacco | | | — | | | | 2,521,690 | | | | — | | | | 2,521,690 | | |
Wireless Telecommunication Services | | | — | | | | 2,350,615 | | | | — | | | | 2,350,615 | | |
Total Common Stocks | | | — | | | | 51,289,095 | | | | — | | | | 51,289,095 | | |
Short-Term Investments | |
Repurchase Agreements | | | — | | | | 44,583 | | | | — | | | | 44,583 | | |
| Investment Company | | | 961,419 | | | | — | | | | — | | | | 498,454 | | |
Total Short-Term Investments | | | 961,419 | | | | 44,583 | | | | — | | | | 1,006,002 | | |
Total Assets | | $ | 961,419 | | | $ | 51,333,678 | | | $ | — | | | $ | 52,295,097 | | |
Multi Cap Growth | |
Assets: | |
Common Stocks | |
Advertising Agencies | | $ | 72,907 | | | $ | — | | | $ | — | | | $ | 72,907 | | |
Alternative Energy | | | 4,622,152 | | | | — | | | | — | | | | 4,622,152 | | |
| Beverage: Brewers & Distillers | | | — | | | | 4,754,652 | | | | — | | | | 4,754,652 | | |
Biotechnology | | | 6,741,121 | | | | — | | | | — | | | | 6,741,121 | | |
Chemicals: Diversified | | | 6,507,377 | | | | — | | | | — | | | | 6,507,377 | | |
Commercial Services | | | 4,324,988 | | | | 5,678,731 | | | | — | | | | 10,003,719 | | |
Communications Technology | | | 8,244,036 | | | | — | | | | — | | | | 8,244,036 | | |
| Computer Services, Software & Systems | | | 50,287,309 | | | | — | | | | — | | | | 50,287,309 | | |
Computer Technology | | | 20,740,772 | | | | — | | | | — | | | | 20,740,772 | | |
Consumer Lending | | | 15,636,719 | | | | — | | | | — | | | | 15,636,719 | | |
Diversified Retail | | | 26,764,733 | | | | — | | | | — | | | | 26,764,733 | | |
| Financial Data & Systems | | | 10,332,346 | | | | — | | | | — | | | | 10,332,346 | | |
Health Care Services | | | 8,143,402 | | | | — | | | | — | | | | 8,143,402 | | |
Insurance: Property-Casualty | | | 926,670 | | | | — | | | | — | | | | 926,670 | | |
Medical Equipment | | | 6,138,452 | | | | — | | | | — | | | | 6,138,452 | | |
Real Estate Investment Trusts (REIT) | | | 7,972,108 | | | | — | | | | — | | | | 7,972,108 | | |
| Recreational Vehicles & Boats | | | — | | | | 7,713,486 | | | | — | | | | 7,713,486 | | |
Restaurants | | | 5,571,011 | | | | — | | | | — | | | | 5,571,011 | | |
| Semiconductors & Components | | | 3,747,875 | | | | — | | | | — | | | | 3,747,875 | | |
Total Common Stocks | | | 186,773,978 | | | | 18,146,869 | | | | — | | | | 204,920,847 | | |
Convertible Preferred Stocks | | | — | | | | — | | | | 1,612,263 | | | | 1,612,263 | | |
Short-Term Investment — Investment Company | | | 4,451,243 | | | | — | | | | — | | | | 4,451,243 | | |
Total Assets | | $ | 191,225,221 | | | $ | 18,146,869 | | | $ | 1,612,263 | | | $ | 210,984,353 | | |
88
Morgan Stanley Variable Investment Series
Notes to Financial Statements n December 31, 2012 continued
The following table presents additional information about valuation techniques and inputs used for investments that are measured at fair value and categorized within Level 3 as of December 31, 2012.
Multi Cap Growth
| | Fair Value at
December 31,
2012 | | Valuation Technique | | Unobservable Input | | Range | | Weighted
Average | | Impact
to
Valuation
from an
Increase
in Input | |
| Alternative Energy | |
Convertible Preferred
Stock | | $ | 175,898 | | | Asset Approach | | Net Tangible Assets | | $ | 0.25 | | | $ | 0.25 | | | $ | 0.25 | | | Increase | |
| | | | | | | Discounted cash flow
| | Weighted average
cost of capital | | | 24.7 | % | | | 26.0 | % | | | 25.0 | % | | Decrease | |
| | | | |
| | Perpetual growth
rate | | | 3.5 | % | | | 4.5 | % | | | 4.0 | % | | Increase | |
| | | | | Market Comparable
Companies | | Enterprise Value /
Revenue | | | 2.8 | x | | | 4.6 | x | | | 3.7 | x | | Increase | |
| | | | |
| | Discount for lack
of marketability | | | 15 | % | | | 15 | % | | | 15 | % | | Decrease | |
Computer Services,
Software & Systems | |
Convertible Preferred
Stock | | $ | 1,436,365 | | |
Adjusted Stock Price
| |
Discount for
Illiquidity | | | 6.7 | % | | | 6.7 | % | | | 6.7 | % | | Decrease | |
Investment Type | | Level 1
Unadjusted
Quoted Prices | | Level 2
Other
Significant
Observable
Inputs | | Level 3
Significant
Unobservable
Inputs | | Total | |
Aggressive Equity | |
Assets: | |
Common Stocks | |
Advertising Agencies | | $ | 9,179 | | | $ | — | | | $ | — | | | $ | 9,179 | | |
Alternative Energy | | | 586,392 | | | | — | | | | — | | | | 586,392 | | |
| Beverage: Brewers & Distillers | | | — | | | | 602,958 | | | | — | | | | 602,958 | | |
Biotechnology | | | 854,863 | | | | — | | | | — | | | | 854,863 | | |
Chemicals: Diversified | | | 825,253 | | | | — | | | | — | | | | 825,253 | | |
Commercial Services | | | 548,471 | | | | 722,824 | | | | — | | | | 1,271,295 | | |
Communications Technology | | | 1,045,448 | | | | — | | | | — | | | | 1,045,448 | | |
| Computer Services, Software & Systems | | | 6,372,175 | | | | — | | | | — | | | | 6,372,175 | | |
Computer Technology | | | 2,630,324 | | | | — | | | | — | | | | 2,630,324 | | |
Consumer Lending | | | 1,989,842 | | | | — | | | | — | | | | 1,989,842 | | |
89
Morgan Stanley Variable Investment Series
Notes to Financial Statements n December 31, 2012 continued
Investment Type | | Level 1
Unadjusted
Quoted Prices | | Level 2
Other
Significant
Observable
Inputs | | Level 3
Significant
Unobservable
Inputs | | Total | |
Diversified Retail | | $ | 3,394,100 | | | $ | — | | | $ | — | | | $ | 3,394,100 | | |
| Financial Data & Systems | | | 1,310,130 | | | | — | | | | — | | | | 1,310,130 | | |
Health Care Services | | | 1,035,278 | | | | — | | | | — | | | | 1,035,278 | | |
Insurance: Property-Casualty | | | 117,464 | | | | — | | | | — | | | | 117,464 | | |
Medical Equipment | | | 778,217 | | | | — | | | | — | | | | 778,217 | | |
Real Estate Investment Trusts (REIT) | | | 1,014,399 | | | | — | | | | — | | | | 1,014,399 | | |
| Recreational Vehicles & Boats | | | — | | | | 978,191 | | | | — | | | | 978,191 | | |
Restaurants | | | 706,390 | | | | — | | | | — | | | | 706,390 | | |
| Semiconductors & Components | | | 476,262 | | | | — | | | | — | | | | 476,262 | | |
Total Common Stocks | | | 23,694,187 | | | | 2,303,973 | | | | — | | | | 25,998,160 | | |
Convertible Preferred Stocks | | | — | | | | — | | | | 189,805 | | | | 189,805 | | |
Short-Term Investment — Investment Company | | | 370,129 | | | | — | | | | — | | | | 370,129 | | |
Total Assets | | $ | 24,064,316 | | | $ | 2,303,973 | | | $ | 189,805 | | | $ | 26,558,094 | | |
The following table presents additional information about valuation techniques and inputs used for investments that are measured at fair value and categorized within Level 3 as of December 31, 2012.
Aggressive Equity
| | Fair Value at
December 31,
2012 | | Valuation Technique | | Unobservable Input | | Range | | Weighted
Average | | Impact
to
Valuation
from an
Increase
in Input | |
| Alternative Energy | |
Convertible Preferred
Stock | | $ | 21,273 | | | Asset Approach | | Net Tangible Assets | | $ | 0.25 | | | $ | 0.25 | | | $ | 0.25 | | | Increase | |
| | | | | Discounted cash flow
| | Weighted average
cost of capital | | | 24.7 | % | | | 26.0 | % | | | 25.0 | % | | Decrease | |
| | | | |
| | Perpetual growth
rate | | | 3.5 | % | | | 4.5 | % | | | 4.0 | % | | Increase | |
| | | | | Market Comparable
Companies | | Enterprise Value /
Revenue | | | 2.8 | x | | | 4.6 | x | | | 3.7 | x | | Increase | |
| | | | |
| | Discount for lack
of marketability | | | 15 | % | | | 15 | % | | | 15 | % | | Decrease | |
Computer Services,
Software & Systems | |
Convertible Preferred
Stock | | $ | 168,532 | | |
Adjusted Stock Price
| |
Discount for
Illiquidity | | | 6.7 | % | | | 6.7 | % | | | 6.7 | % | | Decrease | |
90
Morgan Stanley Variable Investment Series
Notes to Financial Statements n December 31, 2012 continued
Investment Type | | Level 1
Unadjusted
Quoted Prices | | Level 2
Other
Significant
Observable
Inputs | | Level 3
Significant
Unobservable
Inputs | | Total | |
Strategist | |
Assets: | |
Common Stocks | |
| Aerospace & Defense | | $ | 2,258,079 | | | $ | — | | | $ | — | | | $ | 2,258,079 | | |
Auto Components | | | 1,080,026 | | | | — | | | | — | | | | 1,080,026 | | |
Chemicals | | | 1,599,583 | | | | — | | | | — | | | | 1,599,583 | | |
| Commercial Services & Supplies | | | 1,254,533 | | | | — | | | | — | | | | 1,254,533 | | |
| Computers & Peripherals | | | 571,639 | | | | — | | | | — | | | | 571,639 | | |
Diversified Financial Services | | | 2,363,168 | | | | — | | | | — | | | | 2,363,168 | | |
Diversified Telecommunication Services | | | 3,407,156 | | | | — | | | | — | | | | 3,407,156 | | |
| Food & Staples Retailing | | | 1,323,284 | | | | — | | | | — | | | | 1,323,284 | | |
Food Products | | | 1,754,365 | | | | — | | | | — | | | | 1,754,365 | | |
| Hotels, Restaurants & Leisure | | | 5,080,060 | | | | — | | | | — | | | | 5,080,060 | | |
Industrial Conglomerates | | | 2,127,756 | | | | — | | | | — | | | | 2,127,756 | | |
Information Technology Services | | | 1,915,500 | | | | — | | | | — | | | | 1,915,500 | | |
Insurance | | | 2,549,582 | | | | — | | | | — | | | | 2,549,582 | | |
Machinery | | | 1,947,440 | | | | — | | | | — | | | | 1,947,440 | | |
Media | | | 3,122,342 | | | | — | | | | — | | | | 3,122,342 | | |
| Metals & Mining | | | 3,793,572 | | | | — | | | | — | | | | 3,793,572 | | |
Multi-Utilities | | | 1,716,994 | | | | — | | | | — | | | | 1,716,994 | | |
| Oil, Gas & Consumable Fuels | | | 6,086,852 | | | | — | | | | — | | | | 6,086,852 | | |
| Paper & Forest Products | | | 1,139,990 | | | | — | | | | — | | | | 1,139,990 | | |
Pharmaceuticals | | | 5,514,234 | | | | — | | | | — | | | | 5,514,234 | | |
| Road & Rail | | | 1,503,330 | | | | — | | | | — | | | | 1,503,330 | | |
| Semiconductors & Semiconductor Equipment | | | 1,295,667 | | | | — | | | | — | | | | 1,295,667 | | |
Software | | | 1,992,989 | | | | — | | | | — | | | | 1,992,989 | | |
Specialty Retail | | | 2,622,749 | | | | — | | | | — | | | | 2,622,749 | | |
| Textiles, Apparel & Luxury Goods | | | 1,888,635 | | | | — | | | | — | | | | 1,888,635 | | |
Tobacco | | | 2,556,857 | | | | — | | | | — | | | | 2,556,857 | | |
Total Common Stocks | | | 62,466,382 | | | | — | | | | — | | | | 62,466,382 | | |
Investment Companies | | | 4,988,200 | | | | — | | | | — | | | | 4,988,200 | | |
Fixed Income Securities | |
Corporate Bonds | | | — | | | | 10,609,392 | | | | — | | | | 10,609,392 | | |
Sovereign | | | — | | | | 1,165,095 | | | | — | | | | 1,165,095 | | |
Municipal Bonds | | | — | | | | 514,797 | | | | — | | | | 514,797 | | |
Agency Fixed Rate Mortgage | | | — | | | | 200 | | | | — | | | | 200 | | |
Asset-Backed Securities | | | — | | | | 925,031 | | | | — | | | | 925,031 | | |
U.S. Treasury Securities | | | — | | | | 16,241,724 | | | | — | | | | 16,241,724 | | |
U.S. Agency Securities | | | — | | | | 1,789,894 | | | | — | | | | 1,789,894 | | |
Total Fixed Income Securities | | | — | | | | 31,246,133 | | | | — | | | | 31,246,133 | | |
91
Morgan Stanley Variable Investment Series
Notes to Financial Statements n December 31, 2012 continued
Investment Type | | Level 1
Unadjusted
Quoted Prices | | Level 2
Other
Significant
Observable
Inputs | | Level 3
Significant
Unobservable
Inputs | | Total | |
Short-Term Investment — Investment Company | | $ | 26,277,144 | | | $ | — | | | $ | — | | | $ | 26,277,144 | | |
Futures Contracts | | | 6,319 | | | | — | | | | — | | | | 6,319 | | |
Interest Rate Swap Agreements | | | — | | | | 4,903 | | | | — | | | | 4,903 | | |
Total Assets | | | 93,738,045 | | | | 31,251,036 | | | | — | | | | 124,989,081 | | |
Liabilities: | |
Futures Contracts | | | (3,397 | ) | | | — | | | | — | | | | (3,397 | ) | |
Interest Rate Swap Agreements | | | — | | | | (26,354 | ) | | | — | | | | (26,354 | ) | |
Total Liabilities | | | (3,397 | ) | | | (26,354 | ) | | | — | | | | (29,751 | ) | |
Total | | $ | 93,734,648 | | | $ | 31,224,682 | | | $ | — | | | $ | 124,959,330 | | |
Transfers between investment levels may occur as the markets fluctuate and/or the availability of data used in an investment's valuation changes. The Fund recognizes transfers between the levels as of the end of the period. As of December 31, 2012, the fair value of certain securities were adjusted due to developments which occurred between the time of the close of the foreign markets on which they trade and the close of business on the NYSE which resulted in their Level 2 classification. The values of the transfers were as follows:
GLOBAL
INFRASTRUCUTRE | | EUROPEAN
EQUITY | | MULTI CAP
GROWTH | | AGGRESSIVE
EQUITY | |
| $ | 30,038,987 | | | $ | 47,266,294 | | | $ | 7,713,486 | | | $ | 978,191 | | |
Following is a reconciliation of investments in which significant unobservable inputs (Level 3) were used in determining fair value:
| | | Multi Cap Growth | | Aggressive Equity | |
| | | Common
Stock | | Convertible
Preferred
Stocks | | Common
Stock | | Convertible
Preferred
Stocks | |
Beginning Balance | | $ | 8,853,246 | | | $ | 3,036,329 | | | $ | 1,058,994 | | | $ | 365,853 | | |
Purchases | | | — | | | | — | | | | — | | | | — | | |
Sales | | | — | | | | — | | | | — | | | | | | |
Amortization of discount | | | — | | | | — | | | | — | | | | — | | |
Transfers in | | | — | | | | — | | | | — | | | | — | | |
Transfers out | | | — | | | | — | | | | — | | | | — | | |
Corporate action | | | (5,811,839 | ) | | | — | | | | (862,949 | ) | | | — | | |
92
Morgan Stanley Variable Investment Series
Notes to Financial Statements n December 31, 2012 continued
| | | Multi Cap Growth | | Aggressive Equity | |
| | | Common
Stock | | Convertible
Preferred
Stocks | | Common
Stock | | Convertible
Preferred
Stocks | |
Change in unrealized appreciation (depreciation) | | $ | (3,041,407 | ) | | $ | (1,424,066 | ) | | $ | (196,045 | ) | | $ | (176,048 | ) | |
Realized gains (losses) | | | — | | | | — | | | | — | | | | — | | |
Ending Balance | | | — | | | $ | 1,612,263 | | | | — | | | $ | 189,805 | | |
Net change in unrealized appreciation/depreciation from
investments still held as of December 31, 2012 | | | — | | | $ | (1,424,066 | ) | | | — | | | $ | (176,048 | ) | |
3. Derivatives
Certain Portfolios may, but are not required to, use derivative instruments for a variety of purposes, including hedging, risk management, portfolio management or to earn income. Derivatives are financial instruments whose value is based on the value of an underlying asset, interest rate, index or financial instrument. A derivative instrument often has risks similar to its underlying asset and may have additional risks, including imperfect correlation between the value of the derivative and the underlying asset, risks of default by the counterparty to certain transactions, magnification of losses incurred due to changes in the market value of the securities, instruments, indices or interest rates to which they relate, and risks that the transactions may not be liquid. The use of derivatives involves risks that are different from, and possibly greater than, the risks associated with other portfolio investments. Derivatives may involve the use of highly specialized instruments that require investment techniques and risk analyses different from those associated with other portfolio investments. All of a Portfolio's holdings, including derivative instruments, are marked-to-market each day with the change in value reflected in unrealized appreciation (depreciation). Upon disposition, a realized gain or loss is recognized.
Certain derivative transactions may give rise to a form of leverage. Leverage magnifies the potential for gain and risk of loss. Leverage associated with derivative transactions may cause the Portfolios to liquidate portfolio positions when it may not be advantageous to do so to satisfy its obligations or to meet earmarking or segregation requirements, pursuant to applicable Securities and Exchange Commission rules and regulations, or may cause the Portfolios to be more volatile than if the Portfolios had not been leveraged. Although the Adviser and/or Sub-Advisers seek to use derivatives to further the Portfolio's investment objectives, there is no assurance that the use of derivatives will achieve this result.
93
Morgan Stanley Variable Investment Series
Notes to Financial Statements n December 31, 2012 continued
Following is a description of the derivative instruments and techniques that the Portfolios used during the period and their associated risks:
Foreign Currency Exchange Contracts In connection with its investments in foreign securities, certain Portfolios entered into contracts with banks, brokers or dealers to purchase or sell foreign currencies at a future date. A foreign currency exchange contract ("currency contract") is a negotiated agreement between two parties to exchange specified amounts of two or more currencies at a specified future time at a specified rate. The rate specified by the currency contract can be higher or lower than the spot rate between the currencies that are the subject of the currency contract. Currency contracts may be used to protect against uncertainty in the level of future foreign currency exchange rates or to gain or modify exposure to a particular currency. In addition, certain Portfolios may use cross currency hedging or proxy hedging with respect to currencies in which a Portfolio has or expects to have portfolio or currency exposure. Cross currency hedges involve the sale of one currency against the positive exposure to a different currency and may be used for hedging purposes or to establish an active exposure to the exchange rate between any two currencies. Hedging a Portfolio's currency risks involves the risk of mismatching a Portfolio's objectives under a currency contract with the value of securities denominated in a particular currency. Furthermore, such transactions reduce or preclude the opportunity for gain if the value of the currency should move in the direction opposite to the position taken. There is an additional risk to the effect that currency contracts create exposure to currencies in which a Portfolio's securities are not denominated. Unanticipated changes in currency prices may result in poorer overall performance for a Portfolio than if it had not entered into such currency contracts. The use of currency contracts involves the risk of loss from the insolvency or bankruptcy of the counterparty to the contract or the failure of the counterparty to make payments or otherwise comply with the term of the contract. A currency contract is marked-to-market daily and the change in market value is recorded by a Portfolio as unrealized gain or (loss). A Portfolio records realized gains (losses) when the currency contract is closed equal to the difference between the value of the currency contract at the time it was opened and the value at the time it was closed.
Futures A futures contract is a standardized agreement between two parties to buy or sell a specific quantity of an underlying instrument at a specific price at a specific future time. The value of a futures contract tends to increase and decrease in tandem with the value of the underlying instrument. Depending on the terms of the particular contract, futures contracts are settled through either physical delivery of the underlying instrument on the settlement date or by payment of a cash settlement amount on the settlement date. During the period the futures contract is open, payments are received from or made to the broker based upon changes in the value of the contract (the variation margin). A decision as to whether, when and how to use futures involves the exercise of skill and judgment and even a well-conceived futures transaction
94
Morgan Stanley Variable Investment Series
Notes to Financial Statements n December 31, 2012 continued
may be unsuccessful because of market behavior or unexpected events. In addition to the derivatives risks discussed above, the prices of futures can be highly volatile, using futures can lower total return, and the potential loss from futures can exceed a Portfolio's initial investment in such contracts.
Swaps An over-the-counter ("OTC") swap agreement is an agreement between two parties pursuant to which the parties exchange payments at specified dates on the basis of a specified notional amount, with the payments calculated by reference to specified securities, indexes, reference rates, currencies or other instruments. A small percentage of swap agreements are cleared through a central clearing house. Most swap agreements provide that when the period payment dates for both parties are the same, the payments are made on a net basis (i.e., the two payment streams are netted out, with only the net amount paid by one party to the other). A Portfolio's obligations or rights under a swap agreement entered into on a net basis will generally be equal only to the net amount to be paid or received under the agreement, based on the relative values of the positions held by each counterparty. Most swap agreements are not entered into or traded on exchanges and there is no central clearing or guaranty function for swaps. These OTC swaps are often subject to credit risk or the risk of default or non-performance by the counterparty. Swaps could result in losses if interest rate or foreign currency exchange rates or credit quality changes are not correctly anticipated by a Portfolio or if the reference index, security or investments do not perform as expected.
A Portfolio enters into credit default, interest rate and other forms of swap agreements to manage exposure to credit and interest rate risk.
A Portfolio's use of swaps during the period included those based on the credit of an underlying security and commonly referred to as credit default swaps. Where a Portfolio is the buyer of a credit default swap agreement, it would be entitled to receive the par (or other agreed-upon) value of a referenced debt obligation from the counterparty to the agreement only in the event of a default by a third party on the debt obligation. If no default occurs, a Portfolio would have paid to the counterparty a periodic stream of payments over the term of the agreement and received no benefit from the agreement. When a Portfolio is the seller of a credit default swap agreement, it receives the stream of payments but is obligated to pay an amount equal to the par (or other agreed upon) value of a referenced debt obligation upon default of the referenced debt obligation. The current credit rating of each individual issuer is listed in the table following the Portfolio of Investments and serves as an indicator of the current status of the payment/performance risk of the credit derivative. Alternatively, for credit default swaps on an index of credits, the quoted market prices and current values serve as an indicator of the current status of the payment/performance risk of the credit derivative. Generally, lower credit ratings and increasing market values, in absolute terms, represent a deterioration of the credit and a greater likelihood of an adverse credit event of the issuer.
95
Morgan Stanley Variable Investment Series
Notes to Financial Statements n December 31, 2012 continued
When a Portfolio has an unrealized loss on a swap agreement, the Portfolio has instructed the custodian to pledge cash or liquid securities as collateral with a value approximately equal to the amount of the unrealized loss. Collateral pledges are monitored and subsequently adjusted if and when the swap valuations fluctuate. If applicable, cash collateral is included with "Due from (to) Broker" in the Statements of Assets and Liabilities.
Upfront payments received or paid by a Portfolio will be reflected as an asset or liability in the Statements of Assets and Liabilities.
FASB ASC 815, Derivatives and Hedging: Overall ("ASC 815"), is intended to improve financial reporting about derivative instruments by requiring enhanced disclosures to enable investors to better understand how and why a Portfolio uses derivative instruments, how these derivative instruments are accounted for and their effects on a Portfolio's financial position and results of operations.
The following table sets forth the fair value of each Portfolio's derivative contracts by primary risk exposure as of December 31, 2012.
PORTFOLIO | | PRIMARY RISK
EXPOSURE | | ASSET DERIVATIVES
STATEMENTS OF
ASSETS AND
LIABILITIES LOCATION | | FAIR VALUE | | LIABILITY DERIVATIVES
STATEMENTS OF
ASSETS AND
LIABILITIES LOCATION | | FAIR VALUE | |
Limited Duration | | Interest Rate
Risk | |
Variation margin | | $ | 2,391 | † | |
Variation margin | | $ | (13,261 | )† | |
| | | | | Unrealized appreciation
on open swap agreements | | | 2,740 | | | Unrealized depreciation
on open swap agreements | | | (34,008 | ) | |
| | | | | Total | | $ | 5,131 | | | Total | | $ | (47,269 | ) | |
Income Plus | | Interest Rate
Risk | |
Variation margin | | $ | 185,111 | † | |
Variation margin | | $ | (264,814 | )† | |
| | | | | Unrealized depreciation
on open swap agreements | | | — | | | Unrealized depreciation
on open swap agreements | | | (351,335 | ) | |
| | | Credit Risk | | Unrealized appreciation
on open swap agreements | | | 66,347 | | | Unrealized depreciation
on open swap agreements | | | — | | |
| | | Currency Risk | | Unrealized appreciation
on open foreign currency
exchange contracts | | | — | | | Unrealized depreciation
on open foreign currency
exchange contracts | | | (4,972 | ) | |
| | | | | Total | | $ | 251,458 | | | Total | | $ | (621,121 | ) | |
96
Morgan Stanley Variable Investment Series
Notes to Financial Statements n December 31, 2012 continued
PORTFOLIO | | PRIMARY RISK
EXPOSURE | | ASSET DERIVATIVES
STATEMENTS OF
ASSETS AND
LIABILITIES LOCATION | | FAIR VALUE | | LIABILITY DERIVATIVES
STATEMENTS OF
ASSETS AND
LIABILITIES LOCATION | | FAIR VALUE | |
Strategist | | Interest Rate
Risk | |
Variation margin | | $ | 6,319 | † | |
Variation margin | | $ | (3,397 | )† | |
| | | | | Unrealized appreciation
on open swap agreements | | | 4,903 | | | Unrealized depreciation
on open swap agreements | | | (26,354 | ) | |
| | | | | Total | | $ | 11,222 | | | Total | | $ | (29,751 | ) | |
† Includes cumulative appreciation (depreciation) of futures contracts as reported in the Portfolio of Investments. Only current day's net variation margin is reported within the Statements of Assets and Liabilities.
The following tables set forth by primary risk exposure of each Portfolio's realized gains (losses) and change in unrealized appreciation (depreciation) by type of derivative contract for the year ended December 31, 2012 in accordance with ASC 815.
AMOUNT OF REALIZED GAIN (LOSS) ON DERIVATIVE CONTRACTS
PORTFOLIO | | PRIMARY RISK
EXPOSURE | | FUTURES | | SWAPS | | FOREIGN
CURRENCY
EXCHANGE | |
Limited Duration | | Interest Rate Risk | | $ | 135,353 | | | $ | (270,344 | ) | | $ | — | | |
Income Plus | | Interest Rate Risk | | $ | (762,483 | ) | | $ | (71,691 | ) | | $ | — | | |
| | | Credit Risk | | | — | | | | (19,539 | ) | | | — | | |
| | | Currency Risk | | | — | | | | — | | | | 15,809 | | |
| | | Total | | $ | (762,483 | ) | | $ | (91,230 | ) | | $ | 15,809 | | |
European Equity | | Currency Risk | | $ | — | | | $ | — | | | $ | (180,292 | ) | |
Strategist | | Interest Rate Risk | | $ | 25,894 | | | $ | (72,745 | ) | | $ | — | | |
| | | Currency Risk | | | — | | | | — | | | | 4,044 | | |
| | | Total | | $ | 25,894 | | | $ | (72,745 | ) | | $ | 4,044 | | |
CHANGE IN UNREALIZED APPRECIATION (DEPRECIATION) ON DERIVATIVE CONTRACTS
PORTFOLIO | | PRIMARY RISK
EXPOSURE | | FUTURES | | SWAPS | | FOREIGN
CURRENCY
EXCHANGE | |
Limited Duration | | Interest Rate Risk | | $ | (38,468 | ) | | $ | 239,725 | | | $ | — | | |
Income Plus | | Interest Rate Risk | | $ | 129,095 | | | $ | (351,335 | ) | | $ | — | | |
| | | Credit Risk | | | — | | | | 77,247 | | | | — | | |
| | | Currency Risk | | | — | | | | — | | | | (4,972 | ) | |
| | | Total | | $ | 129,095 | | | $ | (274,088 | ) | | $ | (4,972 | ) | |
97
Morgan Stanley Variable Investment Series
Notes to Financial Statements n December 31, 2012 continued
PORTFOLIO | | PRIMARY RISK
EXPOSURE | | FUTURES | | SWAPS | | FOREIGN
CURRENCY
EXCHANGE | |
European Equity | | Currency Risk | | $ | — | | | $ | — | | | $ | 147,144 | | |
Strategist | | Interest Rate Risk | | $ | 5,945 | | | $ | 28,005 | | | $ | — | | |
| | | Currency Risk | | | — | | | | — | | | | 4,074 | | |
| | | Total | | $ | 5,945 | | | $ | 28,005 | | | $ | 4,074 | | |
For the year ended December 31, 2012, Limited Duration Portfolio's average monthly original value of futures contracts was $13,739,000 and average monthly notional value of swap agreements was $5,963,000. Income Plus and Strategist Portfolio's average monthly principal amount of foreign currency exchange contracts was $553,000 and $101,000, average monthly original value of futures contracts was $89,688,000 and $3,430,000 and average monthly notional value of swap agreements was $16,279,000 and $16,142,000. European Equity Portfolio's average monthly principal amount of foreign currency exchange contracts was $4,090,000.
4. Advisory/Administration and Sub-Advisory Agreements
Pursuant to an Investment Advisory Agreement with the Adviser and Sub-Advisers, the Fund pays an advisory fee, accrued daily and payable monthly, by applying the annual rates listed below to each Portfolio's net assets determined at the close of each business day.
Money Market — 0.45% to the portion of the daily net assets not exceeding $250 million; 0.375% to the portion of the daily net assets exceeding $250 million but not exceeding $750 million; 0.325% to the portion of the daily net assets exceeding $750 million but not exceeding $1.25 billion; 0.30% to the portion of the daily net assets exceeding $1.25 billion but not exceeding $1.5 billion; and 0.275% to the portion of the daily net assets in excess of $1.5 billion. For the year ended December 31, 2012, the advisory fee rate (net of waivers) was equivalent to an annual effective rate of 0.10% of the Portfolio's daily net assets.
Limited Duration — 0.30%.
Income Plus — 0.42% to the portion of the daily net assets not exceeding $500 million; 0.35% to the portion of the daily net assets exceeding $500 million but not exceeding $1.25 billion; and 0.22% to the portion of the daily net assets in excess of $1.25 billion. For the year ended December 31, 2012, the advisory fee rate was equivalent to an annual effective rate of 0.42% of the Portfolio's daily net assets.
Global Infrastructure — 0.57% to the portion of the daily net assets not exceeding $500 million; 0.47% to the portion of the daily net assets exceeding $500 million but not exceeding $1 billion; 0.445% to the portion
98
Morgan Stanley Variable Investment Series
Notes to Financial Statements n December 31, 2012 continued
of the daily net assets exceeding $1 billion but not exceeding $1.5 billion; 0.42% to the portion of the daily net assets exceeding $1.5 billion but not exceeding $2.5 billion; 0.395% to the portion of the daily net assets exceeding $2.5 billion but not exceeding $3.5 billion; 0.37% to the portion of the daily net assets exceeding $3.5 billion but not exceeding $5 billion; and 0.345% to the portion of the daily net assets in excess of $5 billion. For the year ended December 31, 2012, the advisory fee rate was equivalent to an annual effective rate of 0.57% of the Portfolio's daily net assets.
European Equity — 0.87% to the portion of the daily net assets not exceeding $500 million; 0.82% to the portion of the daily net assets exceeding $500 million but not exceeding $2 billion; 0.77% to the portion of the daily net assets exceeding $2 billion but not exceeding $3 billion; and 0.745% to the portion of the daily net assets in excess of $3 billion. For the year ended December 31, 2012, the advisory fee rate (net of waivers/rebate) was equivalent to an annual effective rate of 0.65% of the Fund's daily net assets.
Multi Cap Growth — 0.42% to the portion of the daily net assets not exceeding $1 billion; 0.395% to the portion of the daily net assets exceeding $1 billion but not exceeding $2 billion; and 0.37% to the portion of the daily net assets in excess of $2 billion. For the year ended December 31, 2012, the advisory fee rate was equivalent to an annual effective rate of 0.42% of the Portfolio's daily net assets.
Aggressive Equity — 0.67% to the portion of the daily net assets not exceeding $500 million; 0.645% to the portion of the daily net assets exceeding $500 million but not exceeding $2 billion; 0.62% to the portion of the daily net assets exceeding $2 billion but not exceeding $3 billion; and 0.595% to the portion of the daily net assets in excess of $3 billion. For the year ended December 31, 2012, the advisory fee rate was equivalent to an annual effective rate of 0.67% of the Portfolio's daily net assets.
Strategist — 0.42% to the portion of the daily net assets not exceeding $1.5 billion; and 0.395% to the portion of the daily net assets in excess of $1.5 billion. For the year ended December 31, 2012, the advisory fee rate (net of rebate) was equivalent to an annual effective rate of 0.40% of the Portfolio's daily net assets.
Under the Sub-Advisory Agreement between the Adviser and the Sub-Advisers, the Sub-Advisers provide Global Infrastructure Portfolio, European Equity Portfolio and Money Market Portfolio (effective June 25th, 2012) with advisory services subject to the overall supervision of the Adviser and the Fund's Officers and Trustees. The Adviser pays the Sub-Advisers on a monthly basis a portion of the net advisory fees the Adviser receives from each Portfolio.
The Board voted to terminate the Sub-Advisory Agreement on December 5, 2012 for the Money Market Portfolio.
99
Morgan Stanley Variable Investment Series
Notes to Financial Statements n December 31, 2012 continued
The Adviser has agreed to cap European Equity's operating expenses (except for brokerage and 12b-1 fees) by assuming the Portfolio's "other expenses" and/or waiving the Portfolio's advisory fees, and Morgan Stanley Services Company Inc. (the "Administrator") has agreed to waive the Portfolio's administrative fees, to the extent such operating expenses exceed 1.00% of the average daily net assets of the Portfolio on an annualized basis. These fee waivers and/or expense reimbursements will continue for at least one year or until such time as the Fund's Board of Trustees acts to discontinue such waivers and/or reimbursements when it deems that such action is appropriate. For the year ended December 31, 2012, approximately $114,369 of advisory fees were waived and/or reimbursed pursuant to this arrangement.
Pursuant to an Administration Agreement with the Administrator, an affiliate of the Adviser and Sub-Advisers, each Portfolio pays an administration fee, accrued daily and payable monthly, by applying the annual rate of 0.08% (Money Market 0.05%) to the Portfolio's daily net assets.
Under a Sub-Administration agreement between the Administrator and State Street Bank and Trust Company ("State Street"), State Street provides certain administrative services to the Fund. For such services, the Administrator pays State Street a portion of the fee the Administrator receives from the Fund.
5. Plan of Distribution
Shares of the Fund are distributed by Morgan Stanley Distribution, Inc. (the "Distributor"), an affiliate of the Adviser, Administrator and Sub-Advisers. The Fund has adopted a Plan of Distribution (the "Plan") pursuant to Rule 12b-1 under the Act. Under the Plan, Class Y shares of each Portfolio bear a distribution fee which is accrued daily and paid monthly at the annual rate of 0.25% of the average daily net assets of the class.
The Distributor, Adviser and Administrator have agreed to waive/reimburse all or a portion of the Money Market Portfolio's distribution fee, advisory fee and administration fee, respectively, to the extent that total expenses exceed total income of the Money Market Portfolio on a daily basis. For the year ended December 31, 2012, the Distributor waived $129,903 and the Adviser waived $349,556. These fee waivers and/or expense reimbursements will continue for at least one year or until such time that the Trustees acts to discontinue all or a portion of such waivers and/or expense reimbursements when it deems such action is appropriate.
100
Morgan Stanley Variable Investment Series
Notes to Financial Statements n December 31, 2012 continued
6. Security Transactions and Transactions with Affiliates
For the year ended December 31, 2012, purchases and sales of investment securities, excluding short-term investments, were as follows:
| | | U.S. GOVERNMENT SECURITIES | | OTHER | |
PORTFOLIO | | PURCHASES | | SALES | | PURCHASES | | SALES | |
Limited Duration | | $ | 15,790,834 | | | $ | 11,020,888 | | | $ | 14,563,720 | | | $ | 23,984,538 | | |
Income Plus | | | — | | | | 44 | | | | 123,787,147 | | | | 154,014,903 | | |
Global Infrastructure | | | — | | | | — | | | | 19,723,694 | | | | 30,789,187 | | |
European Equity | | | — | | | | — | | | | 5,370,190 | | | | 13,515,850 | | |
Multi Cap Growth | | | — | | | | — | | | | 96,392,807 | | | | 126,658,291 | | |
Aggressive Equity | | | — | | | | — | | | | 12,256,816 | | | | 15,514,323 | | |
Strategist | | | 15,485,256 | | | | 13,486,084 | | | | 41,067,177 | | | | 60,487,856 | | |
Each Portfolio (except Money Market) invests in the Institutional Class of the Morgan Stanley Institutional Liquidity Funds (the "Liquidity Funds"), an open-end management investment company managed by the Adviser, both directly, and as a portion of the securities held as collateral on loaned securities. Advisory fees paid by the Fund are reduced by an amount equal to its pro-rata share of advisory and administrative fees paid by the Fund due to its investment in the Liquidity Funds.
A summary of the Portfolio's transactions in shares of the Liquidity Funds during the year ended December 31, 2012 is as follows:
PORTFOLIO | | VALUE
DECEMBER 31, 2011 | | PURCHASES
AT COST | | SALES | | DIVIDEND
INCOME | | VALUE
DECEMBER 31, 2012 | |
Limited Duration | | $ | 110,511 | | | $ | 28,439,027 | | | $ | 27,110,207 | | | $ | 1,791 | | | $ | 1,439,331 | | |
Income Plus | | | 208,270 | | | | 77,207,717 | | | | 71,374,970 | | | | 12,071 | | | | 6,041,017 | | |
Global Infrastructure | | | 1,993,348 | | | | 16,074,021 | | | | 16,766,587 | | | | 757 | | | | 1,300,782 | | |
European Equity | | | 718,547 | | | | 10,581,659 | | | | 10,338,787 | | | | 1,043 | | | | 961,419 | | |
Multi Cap Growth | | | 12,216,664 | | | | 59,148,006 | | | | 66,913,427 | | | | 10,163 | | | | 4,451,243 | | |
Aggressive Equity | | | 1,790,916 | | | | 7,332,015 | | | | 8,752,802 | | | | 1,375 | | | | 370,129 | | |
Strategist | | | 26,626,452 | | | | 42,378,894 | | | | 42,728,202 | | | | 35,177 | | | | 26,277,144 | | |
In addition, the table also identifies the income distributions earned, if any, by each Portfolio for that Portfolio's investment in the Liquidity Funds.
Income distributions are included in "Interest and dividends from affiliates" in the Statements of Operations.
101
Morgan Stanley Variable Investment Series
Notes to Financial Statements n December 31, 2012 continued
PORTFOLIO | | ADVISORY FEE
REDUCTION | |
Limited Duration | | $ | 1,369 | | |
Income Plus | | | 8,989 | | |
Global Infrastructure | | | 1,179 | | |
European Equity | | | 871 | | |
Multi Cap Growth | | | 9,118 | | |
Aggressive Equity | | | 1,303 | | |
Strategist | | | 29,640 | | |
The following Portfolios had transactions with the following affiliates of the Fund:
PORTFOLIO | | ISSUER | | VALUE
DECEMBER 31,
2011 | | PURCHASES
AT COST | | SALES | | NET
REALIZED
GAIN | | INTEREST
INCOME | | VALUE
DECEMBER 31,
2012 | |
Limited
Duration | | Metropolitan Life
Global Funding I | | $ | 327,079 | | | $ | 199,842 | | | $ | — | | | $ | — | | | $ | 8,219 | | | $ | 534,012 | | |
Income Plus | | MetLife Capital Trust IV | | | — | | | | 633,000 | | | | — | | | | — | | | | 45,019 | | | | 741,000 | | |
| | | MetLife, Inc. | | | 1,276,994 | | | | — | | | | 1,297,925 | | | | 333,109 | | | | 4,899 | | | | — | | |
Strategist | | MetLife, Inc. | | | 43,951 | | | | — | | | | — | | | | — | | | | 2,701 | | | | 45,944 | | |
The following Portfolios had transactions with Citigroup, Inc., and its affiliated broker-dealers, which may be deemed to be affiliates of the Adviser, Sub-Advisers, Administrator and Distributor under Section 17 of the Act, for the year ended December 31, 2012:
PORTFOLIO | | VALUE
DECEMBER 31,
2011 | | PURCHASES
AT COST | | SALES | | NET
REALIZED
GAIN (LOSS) | | INTEREST
INCOME | | VALUE
DECEMBER 31,
2012 | |
Limited Duration | | $ | 1,087,480 | | | $ | 427,870 | | | $ | 1,104,854 | | | $ | 13,699 | | | $ | 31,599 | | | $ | 449,075 | | |
Income Plus | | | 3,188,387 | | | | — | | | | 1,646,592 | | | | 286,103 | | | | 186,439 | | | | 2,095,151 | | |
Strategist | | | 2,483,400 | | | | — | | | | 2,513,846 | | | | (898,255 | ) | | | 9,545 | | | | 68,661 | | |
For the year ended December 31, 2012, the following Portfolios incurred brokerage commissions with Morgan Stanley & Co., LLC, an affiliate of the Adviser, Sub-Advisers, Administrator and Distributor, for portfolio transactions executed on behalf of each Portfolio:
EUROPEAN
EQUITY | | STRATEGIST | |
| $ | 325 | | | $ | 21,747 | | |
102
Morgan Stanley Variable Investment Series
Notes to Financial Statements n December 31, 2012 continued
For the year ended December 31, 2012, the following Portfolios incurred brokerage commissions with Citigroup, Inc., and its affiliated broker-dealers, which may be deemed affiliates of the Adviser, Sub-Advisers, Administrator and Distributor under Section 17 of the Act, for portfolio transactions executed on behalf of each Portfolio:
GLOBAL
INFRASTRUCTURE | | EUROPEAN
EQUITY | | MULTI CAP
GROWTH | | AGGRESSIVE
EQUITY | |
| $ | 1,461 | | | $ | 2,085 | | | $ | 358 | | | $ | 45 | | |
Morgan Stanley Services Company Inc., an affiliate of the Adviser, Sub-Advisers and Distributor, is the Fund's transfer agent.
The Fund has an unfunded noncontributory defined benefit pension plan covering certain independent Trustees of the Fund who will have served as independent Trustees for at least five years at the time of retirement. Benefits under this plan are based on factors which include years of service and compensation. The Trustees voted to close the plan to new participants and eliminate the future benefits growth due to increases to compensation after July 31, 2003.
Aggregate pension costs for the year ended December 31, 2012, included in "trustees' fees and expenses" in the Statements of Operations and the accrued pension liability included in "accrued expenses and other payables" in the Statements of Assets and Liabilities are as follows:
AGGREGATE PENSION COSTS
MONEY
MARKET | | LIMITED
DURATION | | INCOME
PLUS | | GLOBAL
INFRASTRUCTURE | | EUROPEAN
EQUITY | | MULTI CAP
GROWTH | | AGGRESSIVE
EQUITY | | STRATEGIST | |
$ | 327 | | | $ | 179 | | | $ | 611 | | | $ | 245 | | | $ | 201 | | | $ | 769 | | | $ | 92 | | | $ | 505 | | |
AGGREGATE PENSION LIABILITY
MONEY
MARKET | | LIMITED
DURATION | | INCOME
PLUS | | GLOBAL
INFRASTRUCTURE | | EUROPEAN
EQUITY | | MULTI CAP
GROWTH | | AGGRESSIVE
EQUITY | | STRATEGIST | |
$ | 5,353 | | | $ | 2,788 | | | $ | 9,237 | | | $ | 2,850 | | | $ | 2,573 | | | $ | 9,756 | | | $ | 1,155 | | | $ | 7,383 | | |
The Fund has an unfunded Deferred Compensation Plan (the "Compensation Plan"), which allows each independent Trustee to defer payment of all, or a portion, of the fees he or she receives for serving on the Board of Trustees. Each eligible Trustee generally may elect to have the deferred amounts credited with a return equal to the total return on one or more of the Morgan Stanley funds that are offered as investment options under the Compensation Plan. Appreciation/depreciation and distributions received from these
103
Morgan Stanley Variable Investment Series
Notes to Financial Statements n December 31, 2012 continued
investments are recorded with an offsetting increase/decrease in the deferred compensation obligation and do not affect the net asset value of the Fund.
7. Federal Income Tax Status
It is the Portfolios' intention to continue to qualify as a regulated investment company and distribute all of its taxable and tax-exempt income. Accordingly, no provision for Federal income taxes is required in the financial statements.
Dividend income and distributions to shareholders are recorded on the ex-dividend date. Interest income is recognized on an accrual basis. Dividends from net investment income, if any, are declared and paid annually. Net realized capital gains, if any, are distributed at least annually.
A Portfolio may be subject to taxes imposed by countries in which it invests. Such taxes are generally based on income and/or capital gains earned or repatriated. Taxes are accrued based on net investment income, net realized gains and net unrealized appreciation as such income and/or gains are earned. Taxes may also be based on transactions in foreign currency and are accrued based on the value of investments denominated in such currency.
FASB ASC 740-10, Income Taxes – Overall, sets forth a minimum threshold for financial statement recognition of the benefit of a tax position taken or expected to be taken in a tax return. Management has concluded there are no significant uncertain tax positions that would require recognition in the financial statements. If applicable, the Portfolios recognize interest accrued related to unrecognized tax benefits in "Interest Expense" and penalties in "Other Expenses" in the Statement of Operations. The Portfolios file tax returns with the U.S. Internal Revenue Service, New York and various states. Each of the tax years in the four-year period ended December 31, 2012, remains subject to examination by taxing authorities.
The tax character of distributions paid may differ from the character of distributions shown in the Statements of Changes in Net Assets due to short-term capital gains being treated as ordinary income for tax purposes. The tax character of distributions paid during fiscal 2012 and 2011 was as follows:
| | 2012 DISTRIBUTIONS PAID FROM: | | 2011 DISTRIBUTIONS PAID FROM: | |
| PORTFOLIO | | ORDINARY
INCOME | | LONG-TERM
CAPITAL GAIN | | ORDINARY
INCOME | | LONG-TERM
CAPITAL GAIN | |
Money Market | | $ | 10,504 | | | $ | — | | | $ | 11,709 | | | $ | — | | |
Limited Duration | | | 1,503,210 | | | | — | | | | 1,919,268 | | | | — | | |
104
Morgan Stanley Variable Investment Series
Notes to Financial Statements n December 31, 2012 continued
| | | 2012 DISTRIBUTIONS PAID FROM: | | 2011 DISTRIBUTIONS PAID FROM: | |
PORTFOLIO | | ORDINARY
INCOME | | LONG-TERM
CAPITAL GAIN | | ORDINARY
INCOME | | LONG-TERM
CAPITAL GAIN | |
| Income Plus | | $ | 10,700,252 | | | $ | — | | | $ | 12,237,165 | | | $ | — | | |
Global Infrastructure | | | 2,854,317 | | | | 5,230,425 | | | | 1,889,924 | | | | 3,948,735 | | |
European Equity | | | 1,421,625 | | | | — | | | | 1,488,782 | | | | — | | |
Multi Cap Growth | | | — | | | | 4,886,471 | | | | 327,516 | | | | 5 | | |
Aggressive Equity | | | — | | | | 2,196,461 | | | | — | | | | — | | |
Strategist | | | 2,314,605 | | | | 2,088,788 | | | | 5,463,608 | | | | 15,665,688 | | |
The amount and character of income and gains to be distributed are determined in accordance with income tax regulations which may differ from GAAP. These book/tax differences are either considered temporary or permanent in nature.
Temporary differences are primarily due to differing book and tax treatments for the timing of the recognition of gains (losses) on certain investment transactions and the timing of the deductibility of certain expenses.
Permanent differences, primarily due to differing treatments of gains (losses) related to foreign currency transactions, swap transactions, paydown adjustments, expiring capital losses, net operating losses, partnership basis adjustments, distribution redesignations, book amortization of premium on debt securities, nondeductible expenses and certain equity securities designated as issued by passive foreign investment companies, resulted in the following reclassifications among the Portfolios' components of net assets at December 31, 2012:
| PORTFOLIO | | ACCUMULATED UNDISTRIBUTED
(DISTRIBUTIONS IN EXCESS OF)
NET INVESTMENT INCOME | | ACCUMULATED
NET REALIZED GAIN (LOSS) | | PAID-IN-CAPITAL | |
Money Market | | $ | (61 | ) | | $ | 61 | | | $ | — | | |
Limited Duration | | | 354,921 | | | | 3,670,702 | | | | (4,025,623 | ) | |
Income Plus | | | 364,461 | | | | (364,461 | ) | | | — | | |
| Global Infrastructure | | | 76,230 | | | | (76,230 | ) | | | — | | |
European Equity | | | (418,886 | ) | | | 418,886 | | | | — | | |
Multi Cap Growth | | | 54,657 | | | | (54,657 | ) | | | — | | |
Aggressive Equity | | | 104,242 | | | | (10,077 | ) | | | (94,165 | ) | |
| Strategist | | | 170,091 | | | | (170,091 | ) | | | — | | |
105
Morgan Stanley Variable Investment Series
Notes to Financial Statements n December 31, 2012 continued
At December 31, 2012, the components of distributable earnings on a tax basis were as follows:
| PORTFOLIO | | UNDISTRIBUTED
ORDINARY
INCOME | | UNDISTRIBUTED
LONG-TERM
CAPITAL GAIN | |
Money Market | | $ | 5,186 | | | $ | — | | |
Limited Duration | | | 1,067,041 | | | | — | | |
| Income Plus | | | 8,060,936 | | | | — | | |
| Global Infrastructure | | | 1,864,469 | | | | 5,863,655 | | |
European Equity | | | 1,517,809 | | | | — | | |
Multi Cap Growth | | | 953,113 | | | | 3,476,909 | | |
Aggressive Equity | | | — | | | | 509,083 | | |
Strategist | | | 2,613,716 | | | | — | | |
At December 31, 2012, cost, unrealized appreciation, unrealized depreciation, and net unrealized appreciation (depreciation) for U.S. Federal income tax purposes of the investments of each of the Portfolios were:
| PORTFOLIO | | COST | | APPRECIATION | | DEPRECIATION | | NET APPRECIATION
(DEPRECIATION) | |
Money Market | | $ | 90,763,745 | | | $ | — | | | $ | — | | | $ | — | | |
Limited Duration | | | 48,571,679 | | | | 821,403 | | | | (268,206 | ) | | | 553,197 | | |
| Income Plus | | | 167,278,904 | | | | 16,096,967 | | | | (538,073 | ) | | | 15,558,894 | | |
Global Infrastructure | | | 55,774,279 | | | | 16,577,796 | | | | (303,252 | ) | | | 16,274,544 | | |
European Equity | | | 41,792,430 | | | | 12,016,297 | | | | (1,513,630 | ) | | | 10,502,667 | | |
Multi Cap Growth | | | 152,295,061 | | | | 69,364,913 | | | | (10,675,621 | ) | | | 58,689,292 | | |
Aggressive Equity | | | 19,445,611 | | | | 8,451,954 | | | | (1,339,471 | ) | | | 7,112,483 | | |
| Strategist | | | 118,839,001 | | | | 8,929,731 | | | | (2,790,873 | ) | | | 6,138,858 | | |
On December 22, 2010, the Regulated Investment Company Modernization Act of 2010 (the "Modernization Act") was signed into law. The Modernization Act modernizes several tax provisions related to Regulated Investment Companies ("RICs") and their shareholders. One key change made by the Modernization Act is that capital losses will generally retain their character as short-term or long-term and may be carried forward indefinitely to offset future gains. These losses are utilized before other capital loss carryforwards that expire. Generally, the Modernization Act is effective for taxable years beginning after December 22, 2010.
106
Morgan Stanley Variable Investment Series
Notes to Financial Statements n December 31, 2012 continued
At December 31, 2012, the following Portfolios had available for Federal income tax purposes unused short term and/or long term capital losses that will not expire:
| PORTFOLIO | | SHORT TERM LOSSES
(NO EXPIRATION) | | LONG TERM LOSSES
(NO EXPIRATION) | |
Money Market | | $ | 1,935 | | | $ | — | | |
Limited Duration | | | — | | | | 169,582 | | |
European Equity | | | 51,260 | | | | 22,783 | | |
Strategist | | | 1,679,061 | | | | — | | |
In addition, at December 31, 2012, the following Portfolios had available capital loss carryforwards to offset future net capital gains, to the extent provided by regulations, through the indicated expiration dates:
| | AMOUNTS IN THOUSANDS AVAILABLE THROUGH DECEMBER 31, | |
PORTFOLIO | | 2013 | | 2014 | | 2015 | | 2016 | | 2017 | | 2018 | | TOTAL | |
Limited Duration | | $ | 1,267 | | | $ | 2,233 | | | $ | 1,063 | | | $ | 17,119 | | | $ | 8,980 | | | $ | — | | | $ | 30,662 | | |
Income Plus | | | — | | | | — | | | | — | | | | 10,349 | | | | — | | | | — | | | | 10,349 | | |
European Equity | | | — | | | | — | | | | — | | | | — | | | | 10,552 | | | | 3,315 | | | | 13,867 | | |
During the year ended December 31, 2012, the following Portfolios expired capital loss carryforwards for U.S. Federal income tax purposes as follows:
| PORTFOLIO | | EXPIRED CAPITAL LOSS
CARRYFORWARDS | |
Limited Duration | | $ | 4,025,623 | | |
To the extent that capital loss carryforwards are used to offset any future capital gains realized during the carryover period as provided by U.S. Federal income tax regulations, no capital gains tax liability will be incurred by a Portfolio for gains realized and not distributed. To the extent that capital gains are offset, such gains will not be distributed to the shareholders.
During the year ended December 31, 2012, the following Portfolios utilized capital loss carryforwards for U.S. Federal income tax purposes as follows:
| PORTFOLIO | | UTILIZED CAPITAL LOSS
CARRYFORWARDS | |
Money Market | | $ | 76 | | |
Income Plus | | | 9,226,616 | | |
107
Morgan Stanley Variable Investment Series
Notes to Financial Statements n December 31, 2012 continued
8. Purposes of and Risks Relating to Certain Financial Instruments
Certain Portfolios may lend securities to qualified financial institutions, such as broker-dealers, to earn additional income. Risks in securities lending transactions are that a borrower may not provide additional collateral when required or return the securities when due, and that the value of the short-term investments will be less than the amount of cash collateral plus any rebate that is required to be returned to the borrower.
Certain Portfolios may invest in mortgage securities, including securities issued by Federal National Mortgage Association ("FNMA") and Federal Home Loan Mortgage Corporation ("FHLMC"). These are fixed income securities that derive their value from or represent interests in a pool of mortgages or mortgage securities. An unexpectedly high rate of defaults on the mortgages held by a mortgage pool may adversely affect the value of a mortgage backed security and could result in losses to the Portfolio. The risk of such defaults is generally higher in the case of mortgage pools that include sub-prime mortgages. Sub-prime mortgages refer to loans made to borrowers with weakened credit histories or with a lower capacity to make timely payments on their mortgages. The securities issued by FNMA and FHLMC that are held by the Portfolios are not backed by sub-prime mortgages.
Additionally, securities issued by FNMA and FHLMC are not backed by or entitled to the full faith and credit of the United States; rather, they are supported by the right of the issuer to borrow from the U.S. Department of the Treasury.
The Federal Housing Finance Agency ("FHFA") serves as conservator of FNMA and FHLMC and the U.S. Department of the Treasury has agreed to provide capital as needed to ensure FNMA and FHLMC continue to provide liquidity to the housing and mortgage markets.
The Money Market Portfolio may enter into repurchase agreements under which the Portfolio sends cash and takes possession of securities with an agreement that the counterparty will repurchase such securities. In the event of default on the obligation to repurchase, the Portfolio has the right to liquidate the collateral and apply the proceeds in satisfaction of the obligation. In the event of default or bankruptcy by the counterparty to the agreement, realization of the collateral proceeds may be subject to certain costs and delays.
At December 31, 2012, European Equity Portfolio's investments in securities of issuers in the United Kingdom, Germany, Switzerland and France represented 39.5%, 16.1%, 14.6% and 12.9%, respectively of the Portfolio's net assets. These investments, as well as other non-U.S. investments, which involve risks and considerations not present with respect to U.S. securities, may be affected by economic or political developments in these countries.
108
Morgan Stanley Variable Investment Series
Notes to Financial Statements n December 31, 2012 continued
9. Expense Offset
The Fund has entered into an arrangement with State Street (the "Custodian"), whereby credits realized on uninvested cash balances may be used to offset a portion of the Fund's expenses. If applicable, these custodian credits are shown as "Expense offset" in the Statements of Operations.
10. Accounting Pronouncement
In December 2011, FASB issued Accounting Standards Update ("ASU") 2011-11, Balance Sheet: Disclosures about Offsetting Assets and Liabilities. The pronouncement improves disclosures for recognized financial and derivative instruments that are either offset on the balance sheet in accordance with the offsetting guidance in ASC 210-20-45, Balance Sheet: Offsetting — Other Presentation Matters or ASC 815-10-45, Derivatives: Overall — Other Presentation Matters or are subject to enforceable master netting agreements or similar agreements. The Fund will be required to disclose information about rights to offset and related arrangements (such as collateral agreements) in order to enable financial statement users to understand the effect of those rights and arrangements on its financial position as well as disclose the following (1) gross amounts; (2) amounts offset in the statement of financial position; (3) any other amounts that can be offset in the event of bankruptcy, insolvency or default of any of the parties (including cash and noncash financial collateral); and (4) the Fund's net exposure. The requirements are effective for annual reporting periods beginning on or after January 1, 2013, and must be applied retrospectively. At this time, the Fund's management is evaluating the implications of ASU 2011-11 and its impact, if any, on the financial statements.
109
Morgan Stanley Variable Investment Series
Financial Highlights
| | | | | | | | | | | | | | | | |
FOR THE YEAR
ENDED
DECEMBER 31 | | NET ASSET
VALUE
BEGINNING
OF PERIOD | | NET
INVESTMENT
INCOME(a) | | NET REALIZED
AND
UNREALIZED
GAIN (LOSS) | | TOTAL FROM
INVESTMENT
OPERATIONS | | DIVIDENDS
TO
SHAREHOLDERS | | DISTRIBUTIONS
TO
SHAREHOLDERS | | TOTAL
DIVIDENDS
AND
DISTRIBUTIONS | |
MONEY MARKET
CLASS X SHARES | | | |
| 2008^ | | $ | 1.00 | | | $ | 0.020 | | | | — | | | $ | 0.020 | | | $ | (0.020 | ) | | | — | | | $ | (0.020 | ) | |
| 2009^ | | | 1.00 | | | | 0.000 | (d) | | | — | | | | 0.000 | (d) | | | (0.000 | )(d) | | | — | | | | (0.000 | )(d) | |
| 2010^ | | | 1.00 | | | | 0.000 | (d) | | | — | | | | 0.000 | (d) | | | (0.000 | )(d) | | | — | | | | (0.000 | )(d) | |
2011 | | | 1.00 | | | | 0.000 | (d) | | | (0.000 | )(d) | | | 0.000 | (d) | | | (0.000 | )(d) | | | — | | | | (0.000 | )(d) | |
2012 | | | 1.00 | | | | 0.000 | (d) | | | 0.000 | (d) | | | 0.000 | (d) | | | (0.000 | )(d) | | | — | | | | (0.000 | )(d) | |
CLASS Y SHARES | | | |
| 2008^ | | | 1.00 | | | | 0.020 | | | | — | | | | 0.020 | | | | (0.020 | ) | | | — | | | | (0.020 | ) | |
| 2009^ | | | 1.00 | | | | 0.000 | (d) | | | — | | | | 0.000 | (d) | | | (0.000 | )(d) | | | — | | | | (0.000 | )(d) | |
| 2010^ | | | 1.00 | | | | 0.000 | (d) | | | — | | | | 0.000 | (d) | | | (0.000 | )(d) | | | — | | | | (0.000 | )(d) | |
2011 | | | 1.00 | | | | 0.000 | (d) | | | (0.000 | )(d) | | | 0.000 | (d) | | | (0.000 | )(d) | | | — | | | | (0.000 | )(d) | |
2012 | | | 1.00 | | | | 0.000 | (d) | | | 0.000 | (d) | | | 0.000 | (d) | | | (0.000 | )(d) | | | — | | | | (0.000 | )(d) | |
LIMITED DURATION
CLASS X SHARES | | | |
| 2008^ | | | 9.27 | | | | 0.36 | | | $ | (1.72 | ) | | | (1.36 | ) | | | (0.15 | ) | | | — | | | | (0.15 | ) | |
| 2009^ | | | 7.76 | | | | 0.20 | | | | 0.24 | | | | 0.44 | | | | (0.36 | ) | | | — | | | | (0.36 | ) | |
| 2010^ | | | 7.84 | | | | 0.18 | | | | 0.00 | | | | 0.18 | | | | (0.28 | ) | | | — | | | | (0.28 | ) | |
2011 | | | 7.74 | | | | 0.17 | | | | 0.04 | | | | 0.21 | | | | (0.26 | ) | | | — | | | | (0.26 | ) | |
2012 | | | 7.69 | | | | 0.12 | | | | 0.13 | | | | 0.25 | | | | (0.23 | ) | | | — | | | | (0.23 | ) | |
CLASS Y SHARES | | | |
| 2008^ | | | 9.26 | | | | 0.34 | | | | (1.73 | ) | | | (1.39 | ) | | | (0.14 | ) | | | — | | | | (0.14 | ) | |
| 2009^ | | | 7.73 | | | | 0.18 | | | | 0.24 | | | | 0.42 | | | | (0.34 | ) | | | — | | | | (0.34 | ) | |
| 2010^ | | | 7.81 | | | | 0.16 | | | | 0.01 | | | | 0.17 | | | | (0.26 | ) | | | — | | | | (0.26 | ) | |
2011 | | | 7.72 | | | | 0.15 | | | | 0.04 | | | | 0.19 | | | | (0.24 | ) | | | — | | | | (0.24 | ) | |
2012 | | | 7.67 | | | | 0.10 | | | | 0.13 | | | | 0.23 | | | | (0.21 | ) | | | — | | | | (0.21 | ) | |
INCOME PLUS
CLASS X SHARES | | | |
| 2008^ | | | 10.56 | | | | 0.53 | | | | (1.46 | ) | | | (0.93 | ) | | | (0.18 | ) | | | — | | | | (0.18 | ) | |
| 2009^ | | | 9.45 | | | | 0.57 | | | | 1.50 | | | | 2.07 | | | | (0.53 | ) | | | — | | | | (0.53 | ) | |
| 2010^ | | | 10.99 | | | | 0.58 | | | | 0.39 | | | | 0.97 | | | | (0.70 | ) | | | — | | | | (0.70 | ) | |
2011 | | | 11.26 | | | | 0.57 | | | | (0.02 | ) | | | 0.55 | | | | (0.68 | ) | | | — | | | | (0.68 | ) | |
2012 | | | 11.13 | | | | 0.48 | | | | 1.04 | | | | 1.52 | | | | (0.68 | ) | | | — | | | | (0.68 | ) | |
See Notes to Financial Statements
110
| | | | | | | | | RATIO TO AVERAGE
NET ASSETS(c) | | | | | |
FOR THE YEAR
ENDED
DECEMBER 31 | | NET ASSET
VALUE
END OF
PERIOD | | TOTAL
RETURN(b) | | NET ASSETS
END OF
PERIOD
(000'S) | | EXPENSES | | NET
INVESTMENT
INCOME | | REBATE FROM
MORGAN STANLEY
AFFILIATE | | PORTFOLIO
TURNOVER
RATE | |
MONEY MARKET
CLASS X SHARES | |
| 2008^ | | $ | 1.00 | | | | 2.45 | % | | $ | 115,415 | | | | 0.57 | % | | | 2.40 | % | | | — | | | | N/A | | |
| 2009^ | | | 1.00 | | | | 0.03 | | | | 84,486 | | | | 0.40 | (e)(f) | | | 0.03 | (e)(f) | | | — | | | | N/A | | |
| 2010^ | | | 1.00 | | | | 0.01 | | | | 59,932 | | | | 0.29 | (f) | | | 0.00 | (f)(g) | | | — | | | | N/A | | |
2011 | | | 1.00 | | | | 0.01 | | | | 51,431 | | | | 0.22 | (f) | | | 0.01 | (f) | | | — | | | | N/A | | |
2012 | | | 1.00 | | | | 0.01 | | | | 42,267 | | | | 0.27 | (f) | | | 0.01 | (f) | | | — | | | | N/A | | |
CLASS Y SHARES | |
| 2008^ | | | 1.00 | | | | 2.19 | | | | 112,113 | | | | 0.82 | | | | 2.15 | | | | — | | | | N/A | | |
| 2009^ | | | 1.00 | | | | 0.01 | | | | 81,145 | | | | 0.41 | (e)(f) | | | 0.01 | (e)(f) | | | — | | | | N/A | | |
| 2010^ | | | 1.00 | | | | 0.01 | | | | 67,139 | | | | 0.29 | (f) | | | 0.00 | (f)(g) | | | — | | | | N/A | | |
2011 | | | 1.00 | | | | 0.01 | | | | 55,849 | | | | 0.22 | (f) | | | 0.01 | (f) | | | — | | | | N/A | | |
2012 | | | 1.00 | | | | 0.01 | | | | 48,565 | | | | 0.27 | (f) | | | 0.01 | (f) | | | — | | | | N/A | | |
LIMITED DURATION
CLASS X SHARES | |
| 2008^ | | | 7.76 | | | | (14.91 | ) | | | 16,405 | | | | 0.48 | (h) | | | 4.27 | (h) | | | 0.01 | % | | | 54 | % | |
| 2009^ | | | 7.84 | | | | 5.76 | | | | 16,889 | | | | 0.49 | (h) | | | 2.61 | (h) | | | 0.00 | (g) | | | 105 | | |
| 2010^ | | | 7.74 | | | | 2.35 | | | | 14,921 | | | | 0.55 | (h) | | | 2.25 | (h) | | | 0.00 | (g) | | | 88 | | |
2011 | | | 7.69 | | | | 2.75 | | | | 12,693 | | | | 0.60 | (h) | | | 2.15 | (h) | | | 0.00 | (g) | | | 45 | | |
2012 | | | 7.71 | | | | 3.34 | | | | 10,628 | | | | 0.63 | (h) | | | 1.52 | (h) | | | 0.00 | (g) | | | 58 | | |
CLASS Y SHARES | |
| 2008^ | | | 7.73 | | | | (15.22 | ) | | | 63,223 | | | | 0.73 | (h) | | | 4.02 | (h) | | | 0.01 | | | | 54 | | |
| 2009^ | | | 7.81 | | | | 5.56 | | | | 60,753 | | | | 0.74 | (h) | | | 2.36 | (h) | | | 0.00 | (g) | | | 105 | | |
| 2010^ | | | 7.72 | | | | 2.22 | | | | 53,760 | | | | 0.80 | (h) | | | 2.00 | (h) | | | 0.00 | (g) | | | 88 | | |
2011 | | | 7.67 | | | | 2.45 | | | | 44,085 | | | | 0.85 | (h) | | | 1.90 | (h) | | | 0.00 | (g) | | | 45 | | |
2012 | | | 7.69 | | | | 3.05 | | | | 38,736 | | | | 0.88 | (h) | | | 1.27 | (h) | | | 0.00 | (g) | | | 58 | | |
INCOME PLUS
CLASS X SHARES | |
| 2008^ | | | 9.45 | | | | (8.92 | ) | | | 109,833 | | | | 0.55 | (h) | | | 5.34 | (h) | | | 0.00 | (g) | | | 55 | | |
| 2009^ | | | 10.99 | | | | 22.57 | | | | 114,488 | | | | 0.56 | (h) | | | 5.64 | (h) | | | 0.00 | (g) | | | 75 | | |
| 2010^ | | | 11.26 | | | | 9.28 | | | | 106,363 | | | | 0.59 | (h) | | | 5.23 | (h) | | | 0.00 | (g) | | | 53 | | |
2011 | | | 11.13 | | | | 5.01 | | | | 90,876 | | | | 0.59 | (h) | | | 5.01 | (h) | | | 0.00 | (g) | | | 43 | | |
2012 | | | 11.97 | | | | 14.09 | | | | 86,765 | | | | 0.61 | (h) | | | 4.14 | (h) | | | 0.00 | (g) | | | 68 | | |
111
Morgan Stanley Variable Investment Series
Financial Highlights continued
| | | | | | | | | | | | | | | | |
FOR THE YEAR
ENDED
DECEMBER 31 | | NET ASSET
VALUE
BEGINNING
OF PERIOD | | NET
INVESTMENT
INCOME(a) | | NET REALIZED
AND
UNREALIZED
GAIN (LOSS) | | TOTAL FROM
INVESTMENT
OPERATIONS | | DIVIDENDS
TO
SHAREHOLDERS | | DISTRIBUTIONS
TO
SHAREHOLDERS | | TOTAL
DIVIDENDS
AND
DISTRIBUTIONS | |
INCOME PLUS
CLASS Y SHARES | | | |
| 2008^ | | $ | 10.54 | | | $ | 0.51 | | | $ | (1.45 | ) | | $ | (0.94 | ) | | $ | (0.18 | ) | | | — | | | $ | (0.18 | ) | |
| 2009^ | | | 9.42 | | | | 0.55 | | | | 1.49 | | | | 2.04 | | | | (0.51 | ) | | | — | | | | (0.51 | ) | |
| 2010^ | | | 10.95 | | | | 0.55 | | | | 0.39 | | | | 0.94 | | | | (0.67 | ) | | | — | | | | (0.67 | ) | |
2011 | | | 11.22 | | | | 0.54 | | | | (0.02 | ) | | | 0.52 | | | | (0.65 | ) | | | — | | | | (0.65 | ) | |
2012 | | | 11.09 | | | | 0.45 | | | | 1.04 | | | | 1.49 | | | | (0.65 | ) | | | — | | | | (0.65 | ) | |
GLOBAL INFRASTRUCTURE
CLASS X SHARES | | | |
| 2008^ | | | 20.66 | | | | 0.40 | | | | (6.21 | ) | | | (5.81 | ) | | | (0.11 | ) | | $ | (3.44 | ) | | | (3.55 | ) | |
| 2009^ | | | 11.30 | | | | 0.31 | | | | 1.16 | | | | 1.47 | | | | (0.38 | ) | | | (3.71 | ) | | | (4.09 | ) | |
| 2010^ | | | 8.68 | | | | 0.21 | | | | 0.18 | | | | 0.39 | | | | (0.25 | ) | | | (0.69 | ) | | | (0.94 | ) | |
2011 | | | 8.13 | | | | 0.21 | | | | 1.07 | | | | 1.28 | | | | (0.23 | ) | | | (0.46 | ) | | | (0.69 | ) | |
2012 | | | 8.72 | | | | 0.22 | | | | 1.30 | | | | 1.52 | | | | (0.23 | ) | | | (0.82 | ) | | | (1.05 | ) | |
CLASS Y SHARES | | | |
| 2008^ | | | 20.65 | | | | 0.35 | | | | (6.20 | ) | | | (5.85 | ) | | | (0.09 | ) | | | (3.44 | ) | | | (3.53 | ) | |
| 2009^ | | | 11.27 | | | | 0.28 | | | | 1.15 | | | | 1.43 | | | | (0.35 | ) | | | (3.71 | ) | | | (4.06 | ) | |
| 2010^ | | | 8.64 | | | | 0.19 | | | | 0.19 | | | | 0.38 | | | | (0.23 | ) | | | (0.69 | ) | | | (0.92 | ) | |
2011 | | | 8.10 | | | | 0.19 | | | | 1.06 | | | | 1.25 | | | | (0.20 | ) | | | (0.46 | ) | | | (0.66 | ) | |
2012 | | | 8.69 | | | | 0.20 | | | | 1.29 | | | | 1.49 | | | | (0.20 | ) | | | (0.82 | ) | | | (1.02 | ) | |
EUROPEAN EQUITY
CLASS X SHARES | | | |
| 2008^ | | | 28.83 | | | | 0.63 | | | | (11.31 | ) | | | (10.68 | ) | | | (0.61 | ) | | | (4.22 | ) | | | (4.83 | ) | |
| 2009^ | | | 13.32 | | | | 0.36 | | | | 3.01 | | | | 3.37 | | | | (0.56 | ) | | | (0.71 | ) | | | (1.27 | ) | |
| 2010^ | | | 15.42 | | | | 0.26 | | | | 0.76 | | | | 1.02 | | | | (0.39 | ) | | | — | | | | (0.39 | ) | |
2011 | | | 16.05 | | | | 0.41 | | | | (1.90 | ) | | | (1.49 | ) | | | (0.37 | ) | | | — | | | | (0.37 | ) | |
2012 | | | 14.19 | | | | 0.53 | | | | 2.03 | | | | 2.56 | | | | (0.43 | ) | | | — | | | | (0.43 | ) | |
CLASS Y SHARES | | | |
| 2008^ | | | 28.65 | | | | 0.58 | | | | (11.25 | ) | | | (10.67 | ) | | | (0.52 | ) | | | (4.22 | ) | | | (4.74 | ) | |
| 2009^ | | | 13.24 | | | | 0.32 | | | | 3.00 | | | | 3.32 | | | | (0.50 | ) | | | (0.71 | ) | | | (1.21 | ) | |
| 2010^ | | | 15.35 | | | | 0.22 | | | | 0.76 | | | | 0.98 | | | | (0.35 | ) | | | — | | | | (0.35 | ) | |
2011 | | | 15.98 | | | | 0.37 | | | | (1.90 | ) | | | (1.53 | ) | | | (0.33 | ) | | | — | | | | (0.33 | ) | |
2012 | | | 14.12 | | | | 0.49 | | | | 2.03 | | | | 2.52 | | | | (0.38 | ) | | | — | | | | (0.38 | ) | |
See Notes to Financial Statements
112
| | | | | | | | | RATIO TO AVERAGE
NET ASSETS(c) | | | | | |
FOR THE YEAR
ENDED
DECEMBER 31 | | NET ASSET
VALUE
END OF
PERIOD | | TOTAL
RETURN(b) | | NET ASSETS
END OF
PERIOD
(000'S) | | EXPENSES | | NET
INVESTMENT
INCOME | | REBATE FROM
MORGAN STANLEY
AFFILIATE | | PORTFOLIO
TURNOVER
RATE | |
INCOME PLUS
CLASS Y SHARES | |
| 2008^ | | $ | 9.42 | | | | (9.11 | )% | | $ | 135,850 | | | | 0.80 | %(h) | | | 5.09 | %(h) | | | 0.00 | %(g) | | | 55 | % | |
| 2009^ | | | 10.95 | | | | 22.29 | | | | 148,108 | | | | 0.81 | (h) | | | 5.39 | (h) | | | 0.00 | (g) | | | 75 | | |
| 2010^ | | | 11.22 | | | | 9.01 | | | | 124,322 | | | | 0.84 | (h) | | | 4.98 | (h) | | | 0.00 | (g) | | | 53 | | |
2011 | | | 11.09 | | | | 4.71 | | | | 102,948 | | | | 0.84 | (h) | | | 4.76 | (h) | | | 0.00 | (g) | | | 43 | | |
2012 | | | 11.93 | | | | 13.82 | | | | 97,579 | | | | 0.86 | (h) | | | 3.89 | (h) | | | 0.00 | (g) | | | 68 | | |
GLOBAL INFRASTRUCTURE
CLASS X SHARES | |
| 2008^ | | | 11.30 | | | | (33.27 | ) | | | 70,951 | | | | 0.74 | (h) | | | 2.46 | (h) | | | 0.00 | (g) | | | 76 | | |
| 2009^ | | | 8.68 | | | | 19.26 | | | | 68,748 | | | | 0.96 | (h) | | | 3.37 | (h) | | | 0.00 | (g) | | | 280 | | |
| 2010^ | | | 8.13 | | | | 6.93 | | | | 61,408 | | | | 0.87 | (h) | | | 2.71 | (h) | | | 0.00 | (g) | | | 148 | | |
2011 | | | 8.72 | | | | 16.07 | | | | 58,998 | | | | 0.86 | (h) | | | 2.48 | (h) | | | 0.00 | (g) | | | 36 | | |
2012 | | | 9.19 | | | | 18.69 | | | | 57,628 | | | | 0.87 | (h) | | | 2.51 | (h) | | | 0.00 | (g) | | | 28 | | |
CLASS Y SHARES | |
| 2008^ | | | 11.27 | | | | (33.45 | ) | | | 16,545 | | | | 0.99 | (h) | | | 2.21 | (h) | | | 0.00 | (g) | | | 76 | | |
| 2009^ | | | 8.64 | | | | 18.83 | | | | 17,818 | | | | 1.21 | (h) | | | 3.12 | (h) | | | 0.00 | (g) | | | 280 | | |
| 2010^ | | | 8.10 | | | | 6.74 | | | | 15,789 | | | | 1.12 | (h) | | | 2.46 | (h) | | | 0.00 | (g) | | | 148 | | |
2011 | | | 8.69 | | | | 15.82 | | | | 14,472 | | | | 1.11 | (h) | | | 2.23 | (h) | | | 0.00 | (g) | | | 36 | | |
2012 | | | 9.16 | | | | 18.44 | | | | 14,506 | | | | 1.12 | (h) | | | 2.26 | (h) | | | 0.00 | (g) | | | 28 | | |
EUROPEAN EQUITY
CLASS X SHARES | |
| 2008^ | | | 13.32 | | | | (42.70 | ) | | | 57,734 | | | | 1.00 | (h)(i) | | | 3.01 | (h)(i) | | | 0.00 | (g) | | | 15 | | |
| 2009^ | | | 15.42 | | | | 27.73 | | | | 61,197 | | | | 1.00 | (h)(i) | | | 2.67 | (h)(i) | | | 0.00 | (g) | | | 26 | | |
| 2010^ | | | 16.05 | | | | 7.23 | (j) | | | 54,824 | | | | 1.00 | (h)(i) | | | 1.81 | (h)(i) | | | 0.00 | (g) | | | 22 | | |
2011 | | | 14.19 | | | | (9.64 | ) | | | 41,181 | | | | 1.00 | (h)(i) | | | 2.56 | (h)(i) | | | 0.00 | (g) | | | 11 | | |
2012 | | | 16.32 | | | | 18.51 | | | | 40,141 | | | | 1.00 | (h)(i) | | | 3.50 | (h)(i) | | | 0.00 | (g) | | | 11 | | |
CLASS Y SHARES | |
| 2008^ | | | 13.24 | | | | (42.84 | ) | | | 17,845 | | | | 1.25 | (h)(i) | | | 2.76 | (h)(i) | | | 0.00 | (g) | | | 15 | | |
| 2009^ | | | 15.35 | | | | 27.41 | | | | 19,323 | | | | 1.25 | (h)(i) | | | 2.42 | (h)(i) | | | 0.00 | (g) | | | 26 | | |
| 2010^ | | | 15.98 | | | | 6.96 | (j) | | | 17,821 | | | | 1.25 | (h)(i) | | | 1.56 | (h)(i) | | | 0.00 | (g) | | | 22 | | |
2011 | | | 14.12 | | | | (9.85 | ) | | | 11,668 | | | | 1.25 | (h)(i) | | | 2.31 | (h)(i) | | | 0.00 | (g) | | | 11 | | |
2012 | | | 16.26 | | | | 18.16 | | | | 11,773 | | | | 1.25 | (h)(i) | | | 3.25 | (h)(i) | | | 0.00 | (g) | | | 11 | | |
113
Morgan Stanley Variable Investment Series
Financial Highlights continued
| | | | | | | | | | | | | | | | |
FOR THE YEAR
ENDED
DECEMBER 31 | | NET ASSET
VALUE
BEGINNING
OF PERIOD | | NET
INVESTMENT
INCOME
(LOSS)(a) | | NET REALIZED
AND
UNREALIZED
GAIN (LOSS) | | TOTAL FROM
INVESTMENT
OPERATIONS | | DIVIDENDS
TO
SHAREHOLDERS | | DISTRIBUTIONS
TO
SHAREHOLDERS | | TOTAL
DIVIDENDS
AND
DISTRIBUTIONS | |
MULTI CAP GROWTH
CLASS X SHARES | | | |
| 2008^ | | $ | 35.23 | | | $ | 0.03 | | | $ | (16.78 | ) | | $ | (16.75 | ) | | $ | (0.07 | ) | | | — | | | $ | (0.07 | ) | |
| 2009^ | | | 18.41 | | | | 0.11 | | | | 12.99 | | | | 13.10 | | | | (0.09 | ) | | | — | | | | (0.09 | ) | |
| 2010^ | | | 31.42 | | | | 0.06 | | | | 8.65 | | | | 8.71 | | | | (0.06 | ) | | | — | | | | (0.06 | ) | |
2011 | | | 40.07 | | | | 0.01 | | | | (2.70 | ) | | | (2.69 | ) | | | (0.07 | ) | | | — | | | | (0.07 | ) | |
2012 | | | 37.31 | | | | 0.20 | | | | 4.40 | | | | 4.60 | | | | — | | | $ | (0.90 | ) | | | (0.90 | ) | |
CLASS Y SHARES | | | |
| 2008^ | | | 35.06 | | | | (0.05 | ) | | | (16.67 | ) | | | (16.72 | ) | | | (0.05 | ) | | | — | | | | (0.05 | ) | |
| 2009^ | | | 18.29 | | | | 0.05 | | | | 12.90 | | | | 12.95 | | | | (0.03 | ) | | | — | | | | (0.03 | ) | |
| 2010^ | | | 31.21 | | | | (0.02 | ) | | | 8.58 | | | | 8.56 | | | | — | | | | — | | | | — | | |
2011 | | | 39.77 | | | | (0.09 | ) | | | (2.68 | ) | | | (2.77 | ) | | | — | | | | — | | | | — | | |
2012 | | | 37.00 | | | | 0.09 | | | | 4.37 | | | | 4.46 | | | | — | | | | (0.90 | ) | | | (0.90 | ) | |
AGGRESSIVE EQUITY
CLASS X SHARES | | | |
| 2008^ | | | 17.77 | | | | (0.04 | ) | | | (8.63 | ) | | | (8.67 | ) | | | (0.03 | ) | | | — | | | | (0.03 | ) | |
| 2009^ | | | 9.07 | | | | 0.00 | | | | 6.30 | | | | 6.30 | | | | — | | | | — | | | | — | | |
| 2010^ | | | 15.37 | | | | (0.05 | ) | | | 4.05 | | | | 4.00 | | | | — | | | | — | | | | — | | |
2011 | | | 19.37 | | | | (0.09 | ) | | | (1.33 | ) | | | (1.42 | ) | | | — | | | | — | | | | — | | |
2012 | | | 17.95 | | | | (0.03 | ) | | | 2.13 | | | | 2.10 | | | | — | | | | (1.51 | ) | | | (1.51 | ) | |
CLASS Y SHARES | | | |
| 2008^ | | | 17.49 | | | | (0.08 | ) | | | (8.49 | ) | | | (8.57 | ) | | | — | | | | — | | | | — | | |
| 2009^ | | | 8.92 | | | | (0.03 | ) | | | 6.19 | | | | 6.16 | | | | — | | | | — | | | | — | | |
| 2010^ | | | 15.08 | | | | (0.09 | ) | | | 3.97 | | | | 3.88 | | | | — | | | | — | | | | — | | |
2011 | | | 18.96 | | | | (0.14 | ) | | | (1.30 | ) | | | (1.44 | ) | | | — | | | | — | | | | — | | |
2012 | | | 17.52 | | | | (0.08 | ) | | | 2.09 | | | | 2.01 | | | | — | | | | (1.51 | ) | | | (1.51 | ) | |
STRATEGIST
CLASS X SHARES | | | |
| 2008^ | | | 15.55 | | | | 0.30 | | | | (3.76 | ) | | | (3.46 | ) | | | (0.10 | ) | | | (1.39 | ) | | | (1.49 | ) | |
| 2009^ | | | 10.60 | | | | 0.16 | | | | 1.90 | | | | 2.06 | | | | (0.26 | ) | | | — | | | | (0.26 | ) | |
| 2010^ | | | 12.40 | | | | 0.24 | | | | 0.59 | | | | 0.83 | | | | (0.20 | ) | | | (0.07 | ) | | | (0.27 | ) | |
2011 | | | 12.96 | | | | 0.18 | | | | (1.06 | ) | | | (0.88 | ) | | | (0.27 | ) | | | (1.41 | ) | | | (1.68 | ) | |
2012 | | | 10.40 | | | | 0.21 | | | | 0.51 | | | | 0.72 | | | | (0.22 | ) | | | (0.16 | ) | | | (0.38 | ) | |
See Notes to Financial Statements
114
| | | | | | | | RATIO TO AVERAGE
NET ASSETS(c) | | | | | |
FOR THE YEAR
ENDED
DECEMBER 31 | | NET ASSET
VALUE
END OF
PERIOD | | TOTAL
RETURN(b) | | NET ASSETS
END OF
PERIOD
(000'S) | | EXPENSES | | NET
INVESTMENT
INCOME (LOSS) | | REBATE FROM
MORGAN STANLEY
AFFILIATE | | PORTFOLIO
TURNOVER
RATE | |
MULTI CAP GROWTH
CLASS X SHARES | |
| 2008^ | | $ | 18.41 | | | | (47.62 | )% | | $ | 140,041 | | | | 0.55 | %(h) | | | 0.08 | %(h) | | | 0.01 | % | | | 33 | % | |
| 2009^ | | | 31.42 | | | | 71.32 | | | | 202,279 | | | | 0.55 | (h) | | | 0.44 | (h) | | | 0.00 | (g) | | | 23 | | |
| 2010^ | | | 40.07 | | | | 27.76 | | | | 220,553 | | | | 0.58 | (h) | | | 0.19 | (h) | | | 0.00 | (g) | | | 29 | | |
2011 | | | 37.31 | | | | (6.74 | ) | | | 173,284 | | | | 0.56 | (h) | | | 0.03 | (h) | | | 0.00 | (g) | | | 24 | | |
2012 | | | 41.01 | | | | 12.37 | | | | 164,917 | | | | 0.58 | (h) | | | 0.48 | (h) | | | 0.00 | (g) | | | 44 | | |
CLASS Y SHARES | |
| 2008^ | | | 18.29 | | | | (47.75 | ) | | | 45,671 | | | | 0.80 | (h) | | | (0.17 | )(h) | | | 0.01 | | | | 33 | | |
| 2009^ | | | 31.21 | | | | 70.85 | | | | 64,122 | | | | 0.80 | (h) | | | 0.19 | (h) | | | 0.00 | (g) | | | 23 | | |
| 2010^ | | | 39.77 | | | | 27.43 | | | | 67,303 | | | | 0.83 | (h) | | | (0.06 | )(h) | | | 0.00 | (g) | | | 29 | | |
2011 | | | 37.00 | | | | (6.97 | ) | | | 49,678 | | | | 0.81 | (h) | | | (0.22 | )(h) | | | 0.00 | (g) | | | 24 | | |
2012 | | | 40.56 | | | | 12.09 | | | | 45,556 | | | | 0.83 | (h) | | | 0.23 | (h) | | | 0.00 | (g) | | | 44 | | |
AGGRESSIVE EQUITY
CLASS X SHARES | |
| 2008^ | | | 9.07 | | | | (48.86 | ) | | | 10,289 | | | | 0.90 | (h) | | | (0.29 | )(h) | | | 0.00 | (g) | | | 33 | | |
| 2009^ | | | 15.37 | | | | 69.46 | | | | 14,898 | | | | 1.01 | (h) | | | (0.02 | )(h) | | | 0.01 | | | | 23 | | |
| 2010^ | | | 19.37 | | | | 26.02 | | | | 15,413 | | | | 1.09 | (h) | | | (0.32 | )(h) | | | 0.00 | (g) | | | 27 | | |
2011 | | | 17.95 | | | | (7.33 | ) | | | 12,078 | | | | 1.06 | (h) | | | (0.47 | )(h) | | | 0.00 | (g) | | | 28 | | |
2012 | | | 18.54 | | | | 11.85 | | | | 11,089 | | | | 1.25 | (h) | | | (0.19 | )(h) | | | 0.00 | (g) | | | 45 | | |
CLASS Y SHARES | |
| 2008^ | | | 8.92 | | | | (49.00 | ) | | | 12,272 | | | | 1.15 | (h) | | | (0.54 | )(h) | | | 0.00 | (g) | | | 33 | | |
| 2009^ | | | 15.08 | | | | 69.06 | | | | 17,541 | | | | 1.26 | (h) | | | (0.27 | )(h) | | | 0.01 | | | | 23 | | |
| 2010^ | | | 18.96 | | | | 25.73 | | | | 18,777 | | | | 1.34 | (h) | | | (0.57 | )(h) | | | 0.00 | (g) | | | 27 | | |
2011 | | | 17.52 | | | | (7.59 | ) | | | 15,821 | | | | 1.31 | (h) | | | (0.72 | )(h) | | | 0.00 | (g) | | | 28 | | |
2012 | | | 18.02 | | | | 11.62 | | | | 15,348 | | | | 1.50 | (h) | | | (0.44 | )(h) | | | 0.00 | (g) | | | 45 | | |
STRATEGIST
CLASS X SHARES | |
| 2008^ | | | 10.60 | | | | (23.98 | ) | | | 134,668 | | | | 0.54 | (h) | | | 2.28 | (h) | | | 0.02 | | | | 52 | | |
| 2009^ | | | 12.40 | | | | 19.74 | | | | 137,731 | | | | 0.55 | (h) | | | 1.41 | (h) | | | 0.03 | | | | 96 | | |
| 2010^ | | | 12.96 | | | | 6.81 | | | | 128,254 | | | | 0.59 | (h) | | | 1.89 | (h) | | | 0.02 | | | | 119 | | |
2011 | | | 10.40 | | | | (7.96 | ) | | | 97,169 | | | | 0.59 | (h) | | | 1.52 | (h) | | | 0.02 | | | | 121 | | |
2012 | | | 10.74 | | | | 6.91 | | | | 86,318 | | | | 0.65 | (h) | | | 1.98 | (h) | | | 0.02 | | | | 51 | | |
115
Morgan Stanley Variable Investment Series
Financial Highlights continued
| | | | | | | | | | | | | | | | |
FOR THE YEAR
ENDED
DECEMBER 31 | | NET ASSET
VALUE
BEGINNING
OF PERIOD | | NET
INVESTMENT
INCOME(a) | | NET REALIZED
AND
UNREALIZED
GAIN (LOSS) | | TOTAL FROM
INVESTMENT
OPERATIONS | | DIVIDENDS
TO
SHAREHOLDERS | | DISTRIBUTIONS
TO
SHAREHOLDERS | | TOTAL
DIVIDENDS
AND
DISTRIBUTIONS | |
STRATEGIST
CLASS Y SHARES | | | |
| 2008^ | | $ | 15.53 | | | $ | 0.27 | | | $ | (3.76 | ) | | $ | (3.49 | ) | | $ | (0.09 | ) | | $ | (1.39 | ) | | $ | (1.48 | ) | |
| 2009^ | | | 10.56 | | | | 0.13 | | | | 1.89 | | | | 2.02 | | | | (0.23 | ) | | | — | | | | (0.23 | ) | |
| 2010^ | | | 12.35 | | | | 0.21 | | | | 0.58 | | | | 0.79 | | | | (0.17 | ) | | | (0.07 | ) | | | (0.24 | ) | |
2011 | | | 12.90 | | | | 0.15 | | | | (1.05 | ) | | | (0.90 | ) | | | (0.23 | ) | | | (1.41 | ) | | | (1.64 | ) | |
2012 | | | 10.36 | | | | 0.18 | | | | 0.50 | | | | 0.68 | | | | (0.18 | ) | | | (0.16 | ) | | | (0.34 | ) | |
^ Beginning with the year ended December 31, 2011, the Fund was audited by Ernst & Young LLP. The previous years were audited by another independent registered public accounting firm.
(a) The per share amounts were computed using an average number of shares outstanding during the period.
(b) Calculated based on the net asset value as of the last business day of the period.
(c) Reflects overall Portfolio ratios for investment income and non-class specific expenses. Performance shown does not reflect fees and expenses imposed by your insurance company. If performance information included the effect of these additional charges, the total returns would be lower.
(d) Amount is less than $0.001.
(e) Reflects fees paid in connection with the U.S. Treasury Guarantee Program for Money Market Funds. This fee had an effect of 0.04% for the year ended 2009.
(f) If the Portfolio had borne all of its expenses that were reimbursed or waived by the Distributor, Adviser, and Administrator, the annualized expense and net investment loss ratios, would have been as follows:
PERIOD ENDED | | EXPENSE
RATIO | | NET INVESTMENT LOSS
RATIO | |
December 31, 2012 | | | | | | | | | |
Class X | | | 0.63 | % | | | (0.35 | )% | |
Class Y | | | 0.88 | | | | (0.60 | ) | |
December 31, 2011 | | | | | | | | | |
Class X | | | 0.60 | | | | (0.37 | ) | |
Class Y | | | 0.85 | | | | (0.62 | ) | |
December 31, 2010 | | | | | | | | | |
Class X | | | 0.62 | | | | (0.33 | ) | |
Class Y | | | 0.87 | | | | (0.58 | ) | |
December 31, 2009 | | | | | | | | | |
Class X | | | 0.59 | | | | (0.16 | ) | |
Class Y | | | 0.84 | | | | (0.42 | ) | |
(g) Amount is less than 0.005%.
(h) The ratios reflect the rebate of certain Portfolio expenses in connection with investments in a Morgan Stanley affiliate during the period. The effect of the rebate on the ratios is disclosed in the above table as "Rebate from Morgan Stanley affiliate."
See Notes to Financial Statements
116
| | | | | | | | | RATIO TO AVERAGE
NET ASSETS(c) | | | | | |
FOR THE YEAR
ENDED
DECEMBER 31 | | NET ASSET
VALUE
END OF
PERIOD | | TOTAL
RETURN(b) | | NET ASSETS
END OF
PERIOD
(000'S) | | EXPENSES | | NET
INVESTMENT
INCOME | | REBATE FROM
MORGAN STANLEY
AFFILIATE | | PORTFOLIO
TURNOVER
RATE | |
STRATEGIST
CLASS Y SHARES | |
| 2008^ | | $ | 10.56 | | | | (24.20 | )% | | $ | 53,046 | | | | 0.79 | %(h) | | | 2.03 | %(h) | | | 0.02 | % | | | 52 | % | |
| 2009^ | | | 12.35 | | | | 19.44 | | | | 59,737 | | | | 0.80 | (h) | | | 1.16 | (h) | | | 0.03 | | | | 96 | | |
| 2010^ | | | 12.90 | | | | 6.50 | | | | 56,361 | | | | 0.84 | (h) | | | 1.64 | (h) | | | 0.02 | | | | 119 | | |
2011 | | | 10.36 | | | | (8.13 | ) | | | 39,844 | | | | 0.84 | (h) | | | 1.27 | (h) | | | 0.02 | | | | 121 | | |
2012 | | | 10.70 | | | | 6.68 | | | | 35,028 | | | | 0.90 | (h) | | | 1.73 | (h) | | | 0.02 | | | | 51 | | |
(i) If the Portfolio had borne all of its expenses that were reimbursed or waived by the Adviser and Administrator, the annualized expense and net investment income ratios, would have been as follows:
PERIOD ENDED | | EXPENSE
RATIO | | NET INVESTMENT INCOME
RATIO | |
December 31, 2012 | | | | | | | | | |
Class X | | | 1.22 | % | | | 3.28 | % | |
Class Y | | | 1.47 | | | | 3.03 | | |
December 31, 2011 | | | | | | | | | |
Class X | | | 1.17 | | | | 2.39 | | |
Class Y | | | 1.42 | | | | 2.14 | | |
December 31, 2010 | | | | | | | | | |
Class X | | | 1.16 | | | | 1.65 | | |
Class Y | | | 1.41 | | | | 1.40 | | |
December 31, 2009 | | | | | | | | | |
Class X | | | 1.12 | | | | 2.55 | | |
Class Y | | | 1.37 | | | | 2.30 | | |
December 31, 2008 | | | | | | | | | |
Class X | | | 1.08 | | | | 2.93 | | |
Class Y | | | 1.33 | | | | 2.68 | | |
(j) During the year ended December 31, 2010, the Portfolio received a regulatory settlement from an unaffiliated third party which had an impact of approximately 0.14% and 0.14% for Class X and Y, respectively, on the total return. This was a one-time settlement, and as a result, the impact on the NAV and consequently the performance will not likely be repeated in the future. Had this settlement not occurred, the total return for Class X and Y shares would have been approximately 7.09% and 6.82%, respectively.
117
Morgan Stanley Variable Investment Series
Report of Independent Registered Public Accounting Firm
To the Shareholders and Board of Trustees of
Morgan Stanley Variable Investment Series:
We have audited the accompanying statements of assets and liabilities, including the portfolios of investments, of Morgan Stanley Variable Investment Series (comprising, respectively, Money Market, Limited Duration, Income Plus, Global Infrastructure, European Equity, Multi Cap Growth, Aggressive Equity, and Strategist Portfolios) (collectively, the "Portfolios") as of December 31, 2012, and the related statements of operations for the year then ended, and the statements of changes in net assets and the financial highlights for each of the two years in the period then ended. These financial statements and financial highlights are the responsibility of the Portfolios' management. Our responsibility is to express an opinion on these financial statements and financial highlights based on our audits. The financial highlights for the three years ended December 31, 2010 were audited by another independent registered public accounting firm whose report, dated February 25, 2011, expressed an unqualified opinion on those financial highlights.
We conducted our audits in accordance with the standards of the Public Company Accounting Oversight Board (United States). Those standards require that we plan and perform the audit to obtain reasonable assurance about whether the financial statements and financial highlights are free of material misstatement. We were not engaged to perform an audit of the Portfolios' internal control over financial reporting. Our audits included consideration of internal control over financial reporting as a basis for designing audit procedures that are appropriate in the circumstances, but not for the purpose of expressing an opinion on the effectiveness of the Portfolios' internal control over financial reporting. Accordingly, we express no such opinion. An audit also includes examining, on a test basis, evidence supporting the amounts and disclosures in the financial statements and financial highlights, assessing the accounting principles used and significant estimates made by management, and evaluating the overall financial statement presentation. Our procedures included confirmation of securities owned as of December 31, 2012, by correspondence with the custodian and others or by other appropriate auditing procedures where replies from others were not received. We believe that our audits provide a reasonable basis for our opinion.
In our opinion, the financial statements and financial highlights referred to above present fairly, in all material respects, the financial position of each of the respective portfolios constituting Morgan Stanley Variable Investment Series at December 31, 2012, the results of their operations for the year then ended, and the changes in their net assets and the financial highlights for each of the two years in the period then ended, in conformity with U.S. generally accepted accounting principles.

Boston, Massachusetts
February 19, 2013
118
Morgan Stanley Variable Investment Series
Trustee and Officer Information (unaudited)
Name, Age and Address of
Independent Trustee | | Position(s)
Held with
Registrant | | Length of
Time Served* | | Principal Occupation(s)
During Past 5 Years | | Number of
Portfolios
in Fund
Complex
Overseen by
Independent
Trustee** | | Other Directorships
Held by Independent Trustee*** | |
Frank L. Bowman (68)
c/o Kramer Levin Naftalis & Frankel LLP
Counsel to the Independent Trustees
1177 Avenue of the Americas
New York, NY 10036 | | Trustee | | Since
August 2006 | | President, Strategic Decisions, LLC (consulting) (since February 2009); Director or Trustee of various Morgan Stanley Funds (since August 2006); Chairperson of the Insurance Sub-Committee of the Compliance and Insurance Committee (since February 2007); served as President and Chief Executive Officer of the Nuclear Energy Institute (policy organization) (February 2005-November 2008); retired as Admiral, U.S. Navy after serving over 38 years on active duty including 8 years as Director of the Naval Nuclear Propulsion Program in the Department of the Navy and the U.S. Department of Energy (1996-2004); served as Chief of Naval Personnel (July 1994-September 1996); and on the Joint Staff as Director of Political Military Affairs (June 1992-July 1994); knighted as Honorary Knight Commander of the Most Excellent Order of the British Empire; Awarded the Officier de l'Orde National du Mérite by the French Government; elected to the National Academy of Engineering (2009). | | | 101 | | | Director of BP p.l.c.; Director of Naval and Nuclear Technologies LLP; Director of the Armed Services YMCA of the USA and the U.S. Naval Submarine League; Director of the American Shipbuilding Suppliers Association; Member of the National Security Advisory Council of the Center for U.S. Global Engagement and a member of the CNA Military Advisory Board. | |
Michael Bozic (72)
c/o Kramer Levin Naftalis & Frankel LLP
Counsel to the Independent Trustees
1177 Avenue of the Americas
New York, NY 10036 | | Trustee | | Since
April 1994 | | Private investor and a member of the advisory board of American Road Group LLC (retail) (since June 2000); Chairperson of the Compliance and Insurance Committee (since October 2006); Director or Trustee of various Morgan Stanley Funds (since April 1994); formerly, Chairperson of the Insurance Committee (July 2006-September 2006); Vice Chairman of Kmart Corporation (December 1998-October 2000), Chairman and Chief Executive Officer of Levitz Furniture Corporation (November 1995-November 1998) and President and Chief Executive Officer of Hills Department Stores (May 1991-July 1995); variously Chairman, Chief Executive Officer, President and Chief Operating Officer (1987-1991) of the Sears Merchandise Group of Sears, Roebuck & Co. | | | 103 | | | Trustee and member of the Hillsdale College Board of Trustees. | |
119
Morgan Stanley Variable Investment Series
Trustee and Officer Information (unaudited) continued
Name, Age and Address of
Independent Trustee | | Position(s)
Held with
Registrant | | Length of
Time Served* | | Principal Occupation(s)
During Past 5 Years | | Number of
Portfolios
in Fund
Complex
Overseen by
Independent
Trustee** | | Other Directorships
Held by Independent Trustee*** | |
Kathleen A. Dennis (59)
c/o Kramer Levin Naftalis & Frankel LLP
Counsel to the Independent Trustees
1177 Avenue of the Americas
New York, NY 10036 | | Trustee | | Since
August 2006 | | President, Cedarwood Associates (mutual fund and investment management consulting) (since July 2006); Chairperson of the Money Market and Alternatives Sub-Committee of the Investment Committee (since October 2006) and Director or Trustee of various Morgan Stanley Funds (since August 2006); formerly, Senior Managing Director of Victory Capital Management (1993-2006). | | | 101 | | | Director of various non-profit organizations. | |
Dr. Manuel H. Johnson (64)
c/o Johnson Smick Group, Inc.
888 16th Street, N.W.
Suite 740
Washington, D.C. 20006 | | Trustee | | Since
July 1991 | | Senior Partner, Johnson Smick International, Inc. (consulting firm); Chairperson of the Investment Committee (since October 2006) and Director or Trustee of various Morgan Stanley Funds (since July 1991); Co-Chairman and a founder of the Group of Seven Council (G7C) (international economic commission); formerly, Chairperson of the Audit Committee (July 1991-September 2006), Vice Chairman of the Board of Governors of the Federal Reserve System and Assistant Secretary of the U.S. Treasury. | | | 103 | | | Director of NVR, Inc. (home construction). | |
Joseph J. Kearns (70)
c/o Kearns & Associates LLC
PMB754
22631 Pacific Coast Highway
Malibu, CA 90265 | | Trustee | | Since
August 1994 | | President, Kearns & Associates LLC (investment consulting); Chairperson of the Audit Committee (since October 2006) and Director or Trustee of various Morgan Stanley Funds (since August 1994); formerly, Deputy Chairperson of the Audit Committee (July 2003-September 2006) and Chairperson of the Audit Committee of various Morgan Stanley Funds (since August 1994); CFO of the J. Paul Getty Trust. | | | 104 | | | Director of Electro Rent Corporation (equipment leasing) and The Ford Family Foundation. | |
120
Morgan Stanley Variable Investment Series
Trustee and Officer Information (unaudited) continued
Name, Age and Address of
Independent Trustee | | Position(s)
Held with
Registrant | | Length of
Time Served* | | Principal Occupation(s)
During Past 5 Years | | Number of
Portfolios
in Fund
Complex
Overseen by
Independent
Trustee** | | Other Directorships
Held by Independent Trustee*** | |
Michael F. Klein (54)
c/o Kramer Levin Naftalis & Frankel LLP
Counsel to the Independent Trustees
1177 Avenue of the Americas
New York, NY 10036 | | Trustee | | Since
August 2006 | | Managing Director, Aetos Capital, LLC (since March 2000) and Co-President, Aetos Alternatives Management, LLC (since January 2004); Chairperson of the Fixed Income Sub-Committee of the Investment Committee (since October 2006) and Director or Trustee of various Morgan Stanley Funds (since August 2006); formerly, Managing Director, Morgan Stanley & Co. Inc. and Morgan Stanley Dean Witter Investment Management, President, various Morgan Stanley Funds (June 1998-March 2000) and Principal, Morgan Stanley & Co. Inc. and Morgan Stanley Dean Witter Investment Management (August 1997-December 1999). | | | 101 | | | Director of certain investment funds managed or sponsored by Aetos Capital, LLC. Director of Sanitized AG and Sanitized Marketing AG (specialty chemicals). | |
Michael E. Nugent (76)
522 Fifth Avenue
New York, NY 10036 | | Chairperson of the Board and Trustee | | Chairperson of the Boards since July 2006 and Trustee since July 1991 | | General Partner, Triumph Capital, L.P. (private investment partnership); Chairperson of the Boards of various Morgan Stanley Funds (since July 2006); Chairperson of the Closed-End Fund Committee (since June 2012) and Director or Trustee of various Morgan Stanley Funds (since July 1991); formerly, Chairperson of the Insurance Committee (until July 2006). | | | 103 | | | None. | |
121
Morgan Stanley Variable Investment Series
Trustee and Officer Information (unaudited) continued
Name, Age and Address of
Independent Trustee | | Position(s)
Held with
Registrant | | Length of
Time Served* | | Principal Occupation(s)
During Past 5 Years | | Number of
Portfolios
in Fund
Complex
Overseen by
Independent
Trustee** | | Other Directorships
Held by Independent Trustee*** | |
W. Allen Reed (65)
c/o Kramer Levin Naftalis & Frankel LLP
Counsel to the Independent Trustees
1177 Avenue of the Americas
New York, NY 10036 | | Trustee | | Since
August 2006 | | Chairperson of the Equity Sub-Committee of the Investment Committee (since October 2006) and Director or Trustee of various Morgan Stanley Funds (since August 2006); formerly, President and CEO of General Motors Asset Management; Chairman and Chief Executive Officer of the GM Trust Bank and Corporate Vice President of General Motors Corporation (August 1994-December 2005). | | | 101 | | | Director of Temple-Inland Industries (packaging and forest products); Director of Legg Mason, Inc. and Director of the Auburn University Foundation. | |
Fergus Reid (80)
c/o Joe Pietryka, Inc.
85 Charles Colman Blvd.
Pawling, NY 12564 | | Trustee | | Since
June 1992 | | Chairman, Joe Pietryka, Inc.; Chairperson of the Governance Committee and Director or Trustee of various Morgan Stanley Funds (since June 1992). | | | 104 | | | None. | |
Interested Trustee:
Name, Age and Address of
Interested Trustee | | Position(s)
Held with
Registrant | | Length of
Time Served* | | Principal Occupation(s)
During Past 5 Years | | Number of
Portfolios
in Fund
Complex
Overseen by
Interested
Trustee** | | Other Directorships
Held by Interested Trustee*** | |
James F. Higgins (65)
c/o Morgan Stanley Services Company Inc.
Harborside Financial Center
201 Plaza Two
Jersey City, NJ 07311 | | Trustee | | Since
June 2000 | | Director or Trustee of various Morgan Stanley Funds (since June 2000); Senior Advisor of Morgan Stanley (since August 2000). | | | 102 | | | Director of AXA Financial, Inc. and The Equitable Life Assurance Society of the United States (financial services). | |
* Each Trustee serves an indefinite term, until his or her successor is elected.
** The Fund Complex includes (as of December 31, 2012) all open-end and closed-end funds (including all of their portfolios) advised by Morgan Stanley Investment Management Inc. (the "Adviser") and any funds that have an adviser that is an affiliated person of the Adviser (including, but not limited to, Morgan Stanley AIP GP LP).
*** This includes any directorships at public companies and registered investment companies held by the Trustee at any time during the past five years.
122
Morgan Stanley Variable Investment Series
Trustee and Officer Information (unaudited) continued
Name, Age and Address of
Executive Officer | | Position(s)
Held with
Registrant | | Length of
Time Served* | | Principal Occupation(s) During Past 5 Years | |
Arthur Lev (51)
522 Fifth Avenue
New York, NY 10036 | | President and Principal Executive Officer – Equity and Fixed Income Funds | | Since June 2011 | | President and Principal Executive Officer (since June 2011) of the Equity and Fixed Income Funds in the Fund Complex; Head of the Long Only Business of Morgan Stanley Investment Management (since February 2011); Managing Director of the Adviser and various entities affiliated with the Adviser (since December 2006). Formerly, Chief Strategy Officer of Morgan Stanley Investment Management's Traditional Asset Management business (November 2010-February 2011); General Counsel of Morgan Stanley Investment Management (December 2006-October 2010); Partner and General Counsel of FrontPoint Partners LLC (July 2002-December 2006); Managing Director and General Counsel of Morgan Stanley Investment Management (May 2000-June 2002). | |
Mary Ann Picciotto (39)
522 Fifth Avenue
New York, NY 10036 | | Chief Compliance Officer | | Since May 2010 | | Managing Director of the Adviser and various entities affiliated with the Adviser; Chief Compliance Officer of various Morgan Stanley Funds (since May 2010); Chief Compliance Officer of the Adviser (since April 2007). | |
Stefanie V. Chang Yu (46)
522 Fifth Avenue
New York, NY 10036 | | Vice President | | Since December 1997 | | Managing Director of the Adviser and various entities affiliated with the Adviser; Vice President of various Morgan Stanley Funds (since December 1997). | |
Francis J. Smith (47)
c/o Morgan Stanley Services Company Inc.
Harborside Financial Center
201 Plaza Two
Jersey City, NJ 07311 | | Treasurer and Principal Financial
Officer | | Treasurer since July 2003 and Principal Financial Officer since September 2002 | | Executive Director of the Adviser and various entities affiliated with the Adviser; Treasurer and Principal Financial Officer of various Morgan Stanley Funds (since July 2003). | |
Mary E. Mullin (45)
522 Fifth Avenue
New York, NY 10036 | | Secretary | | Since June 1999 | | Executive Director of the Adviser and various entities affiliated with the Adviser; Secretary of various Morgan Stanley Funds (since June 1999). | |
* Each officer serves an indefinite term, until his or her successor is elected.
123
Morgan Stanley Variable Investment Series
Federal Tax Notice n December 31, 2012 (unaudited)
For Federal income tax purposes, the following information is furnished with respect to the distributions paid by each applicable Portfolio during the taxable year ended December 31, 2012. For corporate shareholders, the following percentages of dividends paid by each of the applicable Portfolios qualified for the dividends received deduction.
| FUND | | DIVIDENDS RECEIVED
DEDUCTION % | |
Global Infrastructure Portfolio | | | 23.80 | % | |
Strategist Portfolio | | | 80.70 | % | |
Each of the applicable Portfolios designated and paid the following amounts as a long-term capital gain distribution:
FUND | | AMOUNT | |
Aggressive Equity Portfolio | | $ | 2,196,461 | | |
Global Infrastructure Portfolio | | | 5,230,425 | | |
Multi Cap Growth Portfolio | | | 4,886,471 | | |
Strategist Portfolio | | | 2,088,788 | | |
For Federal income tax purposes, the following information is furnished with respect to the earnings of each applicable Portfolio for the taxable year ended December 31, 2012. The European Equity Portfolio intends to pass through foreign tax credits of $54,492, and has derived income from sources within foreign countries amounting to $2,436,372. The Global Infrastructure Portfolio intends to pass through foreign tax credits of $161,871, and has derived income from sources within foreign countries amounting to $1,893,434.
124
Trustees | |
| Frank L. Bowman | | Joseph J. Kearns | |
| Michael Bozic | | Michael F. Klein | |
| Kathleen A. Dennis | | Michael E. Nugent | |
| James F. Higgins | | W. Allen Reed | |
| Dr. Manuel H. Johnson | | Fergus Reid | |
Officers | |
Michael E. Nugent
Chairperson of the Board | |
Arthur Lev
President and Principal Executive Officer | |
Mary Ann Picciotto
Chief Compliance Officer | |
Stefanie V. Chang Yu
Vice President | |
Francis J. Smith
Treasurer and Principal Financial Officer | |
Mary E. Mullin
Secretary | |
| Transfer Agent | | Custodian | |
Morgan Stanley Services Company Inc.
P.O. Box 219886
Kansas City, Missouri 64121 | | State Street Bank and Trust Company
One Lincoln Street
Boston, Massachusetts 02111 | |
| Independent Registered Public Accounting Firm | | Legal Counsel | |
Ernst & Young LLP
200 Clarendon Street
Boston, Massachusetts 02116 | | Dechert LLP
1095 Avenue of the Americas
New York, New York 10036 | |
| Counsel to the Independent Trustees | | Adviser | |
Kramer Levin Naftalis & Frankel LLP
1177 Avenue of the Americas
New York, New York 10036 | | Morgan Stanley Investment Management Inc.
522 Fifth Avenue
New York, New York 10036 | |
Sub-Advisers | |
Morgan Stanley Investment Management Limited
25 Cabot Square, Canary Wharf
London, E14 4QA, England | |
Morgan Stanley Investment Management Company
23 Church Street
16-01 Capital Square 049481 Singapore | |
This report is submitted for the general information of shareholders of the Fund. For more detailed information about the Fund, its fees and expenses and other pertinent information, please read its Prospectus. The Fund's Statement of Additional Information contains additional information about the Fund, including its trustees. It is available without charge, by calling (800) 869-NEWS.
This report is not authorized for distribution to prospective investors in the Fund unless preceded or accompanied by an effective Prospectus. Read the Prospectus carefully before investing.
Morgan Stanley Distribution, Inc., member FINRA.
VARINANN
IU13-00311P-Y12/12
MORGAN STANLEY
VARIABLE INVESTMENT SERIES
Semi-Annual Report
JUNE 30, 2013
The Portfolios are intended to be the funding vehicle for variable annuity contracts and variable life insurance policies offered by the separate accounts of certain life insurance companies.
Morgan Stanley Variable Investment Series
Table of Contents
Letter to the Shareholders | | | 1 | | |
Fund Performance | | | 13 | | |
| Expense Examples | | | 15 | | |
| Investment Advisory Agreement Approval | | | 18 | | |
Portfolio of Investments: | |
| Money Market | | | 22 | | |
| Limited Duration | | | 27 | | |
| Income Plus | | | 36 | | |
| Global Infrastructure | | | 47 | | |
| European Equity | | | 50 | | |
| Multi Cap Growth | | | 53 | | |
Financial Statements: | |
| Statements of Assets and Liabilities | | | 56 | | |
| Statements of Operations | | | 58 | | |
| Statements of Changes in Net Assets | | | 60 | | |
| Notes to Financial Statements | | | 67 | | |
| Financial Highlights | | | 96 | | |
Results of Special Shareholder Meetings | | | 104 | | |
Morgan Stanley Variable Investment Series
Letter to the Shareholders n June 30, 2013 (unaudited)
Dear Shareholder:
In the six months ended June 30, 2013, global risk assets continued to outperform relatively safer assets despite a moderate global economic environment. With U.S. gross domestic product (GDP) growth still below 2%, Europe in recession and China's economy slowing, global central banks continued to pursue both conventional and unconventional means to bolster economic growth. This helped encourage investor confidence in the capital markets for most of the period. However, at the end of May the U.S. Federal Reserve (Fed) signaled that it could begin "tapering" its asset purchase program, known as quantitative easing (QE), sooner than expected. Global equity and bond markets responded with significant volatility, as the announcement took investors by surprise. In June, the Fed tried to calm the markets, emphasizing that tapering will be gradual and dependent on improvements in the economy and that tapering QE is not the same as monetary tightening — in other words, any potential increases to the target federal funds rate remain further down the road.
Domestic Equity Overview
Modest growth in the U.S. economy and a backdrop of accommodative monetary policy drove the U.S. stock market to positive returns for the six-month period ended June 30, 2013. Concerns about the effects of automatic federal spending cuts (called sequestration) and higher payroll taxes, problems in the European debt crisis and slackening growth in China contributed to market volatility throughout the period. Nevertheless, stock prices trended higher overall as investors continued to believe the Federal Reserve (the Fed) and other central banks around the world would continue providing ample liquidity through interest rate cuts and asset purchase programs. Although the Dow Jones Industrial Average and S&P 500® Index, two of the most commonly cited measures of the U.S. stock market, reached new highs in May, the market pulled back in June after the Fed announced its intention to possibly scale back stimulus in the second half of the year.
Fixed Income Overview
Most segments of the bond market declined during the six-month period. Fixed income returns were relatively weak early in 2013, and losses were exacerbated in the final month of the period. The yields on long-term U.S. Treasuries spiked in response to the Fed's tapering comments, with the 10-year Treasury yield exceeding 2.5% at one point (coming from a level well below 2% back in April). Prices across the fixed income spectrum fell, as prices drop when yields rise. The high yield corporate sector was a notable exception, with a small gain for the period, buoyed by demand for the sector's potentially higher relative returns.
Morgan Stanley Variable Investment Series
Letter to the Shareholders n June 30, 2013 (unaudited) continued
Money market yields continued to be constrained by the Fed's near-zero interest rate policy. While there was some speculation that tapering could begin as early as September, the Fed was careful to point out that the economy must meet certain expectations before its exit strategy would begin. Furthermore, the Fed indicated there have been no changes to its decision to leave the federal funds rate near zero until unemployment and inflation dictate otherwise, which could be 2015 by some estimates.
International Equity Overview
Although Japan was the strongest-performing market on a global basis, international equity markets as a whole underperformed the U.S. market during the reporting period. Japanese equities rallied as the country returned to economic expansion in the first quarter of 2013 (following a recession in the third and fourth quarters of 2012) and the newly appointed governor of the Bank of Japan took decisive steps to combat deflation with a new, aggressive QE program. Europe, however, remained in recession. A bailout in Cyprus, uncertainty in Italy's general elections and signs of distress in Portugal added further downward pressure to European equities during the period. Emerging markets lagged developed markets by a wide margin as the asset class suffered from considerable outflows by investors concerned about slowing growth, particularly in the "BRIC" economies (Brazil, Russia, India and China), and the implications of the Fed's exit from QE.
Money Market Portfolio
An investment in a money market fund is not insured or guaranteed by the Federal Deposit Insurance Corporation or any other government agency. Although money market funds seek to preserve the value of an investment at $1.00 per share, it is possible to lose money by investing in such funds.
As of June 30, 2013, Variable Investment Series – Money Market Portfolio had net assets of approximately $84.2 million with an average portfolio maturity of 25 days. For the seven-day period ended June 30, 2013, the Portfolio's Class X shares provided an effective annualized yield of 0.01% (subsidized) and – 0.48% (non-subsidized) and a current yield of 0.01% (subsidized) and – 0.48% (non-subsidized), while its 30-day moving average yield for June was 0.01% (subsidized) and – 0.48% (non-subsidized). Yield quotations more closely reflect the current earnings of the Portfolio. The non-subsidized yield reflects what the yield would have been had a fee and/or expense waiver not been in place during the period shown. For the six-month period ended June 30, 2013, the Portfolio's Class X shares returned 0.00%. Past performance is no guarantee of future results.
For the seven-day period ended June 30, 2013, the Portfolio's Class Y shares provided an effective annualized yield of 0.01% (subsidized) and – 0.73% (non-subsidized) and a current yield of 0.01%
2
Morgan Stanley Variable Investment Series
Letter to the Shareholders n June 30, 2013 (unaudited) continued
(subsidized) and – 0.73% (non-subsidized), while its 30-day moving average yield for June was 0.01% (subsidized) and – 0.73% (non-subsidized). Yield quotations more closely reflect the current earnings of the Portfolio. The non-subsidized yield reflects what the yield would have been had a fee and/or expense waiver not been in place during the period shown. For the six-month period ended June 30, 2013, the Portfolio's Class Y shares returned 0.00%. Past performance is no guarantee of future results.
The performance of the Portfolio's two share classes varies because each has different expenses. The Portfolio's total returns assume the reinvestment of all distributions but do not reflect the deduction of any charges by your insurance company. Such costs would lower performance.
We continued to remain cautious in our investment approach, focusing on securities with high liquidity and short durations. We believe this approach, together with our investment process, has put us in a favorable position to respond to market uncertainty.
During the period, we purchased what we believe are high-quality fixed and floating rate paper, while maintaining our conservative liquidity metrics. Our management strategy for the Portfolio remained consistent with our long-term focus on capital preservation and high liquidity.
There is no guarantee that any sectors mentioned will continue to perform as discussed above or that securities in such sectors will be held by the Portfolio in the future.
Limited Duration Portfolio
For the six-month period ended June 30, 2013, Variable Investment Series – Limited Duration Portfolio Class X shares produced a total return of – 0.54%, underperforming the Barclays Capital U.S. Government/Credit Index (1-5 Year) (the "Index"),1 which returned – 0.48%. For the same period, the Portfolio's Class Y shares returned – 0.71%. Past performance is no guarantee of future results.
The performance of the Portfolio's two share classes varies because each has different expenses. The Portfolio's total returns assume the reinvestment of all distributions but do not reflect the deduction of any charges by your insurance company. Such costs would lower performance.
Spread sectors (non-government bonds) generally did well the first few months of the year but underperformed Treasuries toward the end of the period as concerns about a potential early tapering of the Fed's asset purchase program led to a sharp sell-off in bonds. The Portfolio's positioning in the credit sector, in particular an
1 The Barclays Capital U.S. Government/Credit Index (1-5 Year) tracks the performance of U.S. government and corporate obligations, including U.S. government agency and Treasury securities, and corporate and Yankee bonds with maturities of one to five years. The Index is unmanaged and its returns do not include any sales charges or fees. Such costs would lower performance. It is not possible to invest directly in an index.
3
Morgan Stanley Variable Investment Series
Letter to the Shareholders n June 30, 2013 (unaudited) continued
overweight to financials, was beneficial to performance. Financial spreads ended the period a few basis points tighter. However, an overweight to asset-backed securities detracted slightly from performance as spreads widened.
There is no guarantee that any sectors mentioned will continue to perform as discussed above or that securities in such sectors will be held by the Portfolio in the future.
Income Plus Portfolio
For the six-month period ended June 30, 2013, Variable Investment Series – Income Plus Portfolio Class X shares produced a total return of – 2.58%, outperforming the Barclays Capital U.S. Corporate Index (the "Index"),2 which returned – 3.41%. For the same period, the Portfolio's Class Y shares returned – 2.71%. Past performance is no guarantee of future results.
The performance of the Portfolio's two share classes varies because each has different expenses. The Portfolio's total returns assume the reinvestment of all distributions but do not reflect the deduction of any charges by your insurance company. Such costs would lower performance.
The Portfolio entered 2013 overweight investment grade corporate bonds, while also having exposure to high yield corporate bonds and convertible bonds. These positions were designed to attempt to benefit from a normalization of credit spreads, which we believed would be driven by supportive global monetary policy and a continued modest U.S. economic recovery. Despite a bout of volatility late in the period, this thesis played out as expected over the first half of 2013.
Financial sector corporate bonds, which remain one of the Portfolio's largest overweights, were the best performers in the investment grade corporate market. Spreads in this sector have continued to compress relative to non-financial sector corporates. High yield and convertible bonds also contributed positively to performance. With equity markets performing well in the first half of 2013, those fixed income sectors with the most equity-like characteristics (such as high yield and convertibles) performed strongly.
The primary detractor from performance was a basket of single-name credit default swap (CDS) positions that was designed to benefit if spreads widened. The average spread of the CDS positions tightened during the period, generating some modest underperformance for the Portfolio.
2 The Barclays Capital U.S. Corporate Index covers U.S. dollar-denominated, investment-grade, fixed rate, taxable securities sold by industrial, utility and financial issuers. It includes publicly issued U.S. corporate and foreign debentures and secured notes that meet specified maturity, liquidity and quality requirements. The Index is unmanaged and its returns do not include any sales charges or fees. Such costs would lower performance. It is not possible to invest directly in an index.
4
Morgan Stanley Variable Investment Series
Letter to the Shareholders n June 30, 2013 (unaudited) continued
Looking ahead, we believe corporate bond spreads will continue to compress toward long-term median levels and we have positioned the Portfolio accordingly. We also maintain opportunistic exposures to high yield and convertible bonds — two sectors that we believe are attractively positioned for the current environment, especially if interest rates continue to rise.
There is no guarantee that any sectors mentioned will continue to perform as discussed above or that securities in such sectors will be held by the Portfolio in the future.
Global Infrastructure Portfolio
For the six-month period ended June 30, 2013, Variable Investment Series – Global Infrastructure Portfolio Class X shares produced a total return of 5.19%, outperforming the Dow Jones Brookfield Global Infrastructure IndexSM (the "Index"),3 which returned 5.12%, and the S&P Global BMI Index,4 which returned 6.73%. For the same period, the Portfolio's Class Y shares returned 4.93%. Past performance is no guarantee of future results.
The performance of the Portfolio's two share classes varies because each has different expenses. The Portfolio's total returns assume the reinvestment of all distributions but do not reflect the deduction of any charges by your insurance company. Such costs would lower performance.
Infrastructure shares appreciated 5.12% during the first half of 2013, as measured by the Index, but underperformed global equities. Among the major infrastructure sectors, gas distribution utilities, gas midstream, and transmission and distribution exhibited relative outperformance, while pipeline companies, communications, toll roads, and European regulated utilities underperformed the Index.
Infrastructure performance was mixed in the first half of 2013, as strong sector performance through April gave way to a bout of selling toward the end of the reporting period, brought on predominantly by investor concerns over rising interest rates — in particular in the U.S. — and the perceived impact on valuation and company cost of capital. Investor rotation out of some of the perceived more defensive areas of infrastructure into more cyclically leveraged names may also have had some negative impact; however, we would note that flows into the infrastructure asset class overall remain relatively resilient.
3 The Dow Jones Brookfield Global Infrastructure IndexSM is a float-adjusted market capitalization weighted index that measures the stock performance of companies that exhibit strong infrastructure characteristics. The Index intends to measure all sectors of the infrastructure market. The Index is unmanaged and its returns do not include any sales charge or fees. Such costs would lower performance. It is not possible to invest directly in an index.
4 The Standard & Poor's Global BMI Index (S&P Global BMI Index) is a broad market index designed to capture exposure to equities in all countries in the world that meet minimum size and liquidity requirements. As of the date of this Report, there are approximately 11,000 index members representing 26 developed and 20 emerging market countries. The Index is unmanaged and its returns do not include any sales charges or fees. Such costs would lower performance. It is not possible to invest directly in an index.
5
Morgan Stanley Variable Investment Series
Letter to the Shareholders n June 30, 2013 (unaudited) continued
Within the individual sectors, we view the relative outperformance of companies in the gas distribution, gas midstream, and transmission and distribution sectors as a combination of strong cash flow growth brought on by robust capital programs (gas distribution in China, gas midstream in Canada and the U.S., gas distribution in the U.S., in particular for those companies leveraged to liquefied export development), favorable rate case developments (select U.S. utility companies), and the resolution of dividend tax policy concerns (for U.S. utilities). We attribute the underperformance of pipeline companies to near-term concerns over valuation and company-specific events, the underperformance of communications to the potential for a slowdown in leasing for wireless towers in the U.S. as well as concerns over the impact of "sequestration" on U.S. government contracts for fixed satellite services operators, and the underperformance of European regulated utilities to regulatory interference and the prospects for reduced returns on capital brought on by ongoing rate cases or rate cases resolved in the quarter. Foreign currency trends had a large negative impact on toll roads during the first half, with sector performance largely in line with the overall infrastructure universe on a local currency basis.
At a high level, the dominant investor theme for infrastructure in the first half of 2013 was rising interest rates and their potential to negatively impact valuation. To generally address this, it is important to note that some companies and sectors within infrastructure will be affected more than others. It is also important to consider why rates are rising (i.e., if the economy is truly improving and improved operating fundamentals will offset rising rates). For many companies within the infrastructure universe, there is a self-correcting mechanism within the regulatory compact that will adjust for higher debt costs and rising interest rates such that the impact on a company is mitigated. Utilities or other regulatory asset based companies broadly fit within this category, as returns are adjusted through the rate case process. For example, in some U.S. jurisdictions such as California, the ability to pass through higher debt costs is formulaic and automatic if certain thresholds are met. For other companies that are not allowed higher returns on invested capital concurrent with rising interest rates, value should decline as rates rise, all else being equal.
While we understand that rising rates can have a negative near-term impact on certain companies within our portfolio, we continue to believe these companies reflect solid long-term investment value. Furthermore, despite the prospect for rising interest rates, we believe infrastructure as an asset class remains broadly appealing to public pension funds and other long-term institutional investors, with private market value continuing to exceed valuation levels in the public markets.
For the first half of 2013, the Portfolio realized favorable performance from bottom-up stock selection, partially offset by adverse top-down allocation. From a bottom-up perspective, the Portfolio benefited from stock selection in the gas distribution utilities, transmission and distribution, communications, and pipeline
6
Morgan Stanley Variable Investment Series
Letter to the Shareholders n June 30, 2013 (unaudited) continued
companies sectors, partially offset by unfavorable selection in the toll roads, gas midstream, and European regulated utilities sectors. From a top-down perspective, the Portfolio benefited from an overweight to the gas distribution utilities sector and an underweight to the European regulated utilities sector, but this was more than offset by adverse positioning in other sectors, most notably with the overweight to pipeline companies and the underweight to gas midstream.
We remain committed to our core investment philosophy as an infrastructure value investor. As value-oriented, bottom-up driven investors, our investment perspective is that over the medium- and long-term, the key factor in determining the performance of infrastructure securities will be underlying infrastructure asset values. Given the large and growing private infrastructure market, we believe that there are limits as to the level of premium or discount at which the public sector should trade relative to its underlying private infrastructure value. These limits can be viewed as the point at which the arbitrage opportunity between owning infrastructure in the private versus public markets becomes compelling. In aiming to achieve core infrastructure exposure in a cost effective manner, we invest in equity securities of publicly listed infrastructure companies we believe offer the best value relative to their underlying infrastructure value and Net Asset Value (NAV) growth prospects.
Our research currently leads us to an overweighting in the Portfolio (amongst the largest sectors) to a group of companies in the pipeline companies, communications and toll roads sectors, and an underweighting to companies in the transmission and distribution, gas midstream, gas distribution utilities and European regulated utilities sectors. When compared to our year-end commentary, the primary changes from a sector perspective (resulting from shifts in company-specific investments) are a re-introduction of an overweight in the communications sector as well as a shift in gas distribution utilities from an overweight to an underweight, brought on primarily by the sale of outperforming Hong Kong-listed Chinese gas distribution utilities.
Looking forward, we continue to see good opportunities in sectors with secular growth themes, in particular energy infrastructure but also in communications. In addition, we believe we have a number of favorable company-specific positions across sectors with attractive total return prospects. These investments have been overlooked by the market during the first half of the year in large part, in our opinion, due to the short-term orientation of the market and a lack of near-term catalysts or the delay in catalyst realization. As long-term investors, we continue to see value in these companies and will wait patiently for these "value highlighting" opportunities to materialize.
There is no guarantee that any sectors mentioned will continue to perform as discussed above or that securities in such sectors will be held by the Portfolio in the future.
7
Morgan Stanley Variable Investment Series
Letter to the Shareholders n June 30, 2013 (unaudited) continued
European Equity Portfolio
For the six-month period ended June 30, 2013, Variable Investment Series – European Equity Portfolio Class X shares produced a total return of 4.04%, outperforming the MSCI Europe Index (the "Index"),5 which returned 2.18%. For the same period, the Portfolio's Class Y shares returned 3.90%. Past performance is no guarantee of future results.
The performance of the Portfolio's two share classes varies because each has different expenses. The Portfolio's total returns assume the reinvestment of all distributions but do not reflect the deduction of any charges by your insurance company. Such costs would lower performance.
On a country level, key contributors to performance included our stock selection in the United Kingdom, Spain, the Netherlands, Switzerland and Germany. Furthermore, an underweight allocation to Italy added to the overall performance. Key detractors, however, were stock selection in both Belgium and France.
Looking at industries, our stock selection in software and services, capital goods, and food, beverage and tobacco drove relative outperformance. In addition, both an overweight allocation and stock selection in the pharmaceuticals and insurance industries bolstered relative gains. The main industry-level detractor from performance was an underweight allocation to diversified financials.
Top contributors at the stock level included a Dutch coffee and tea company that rallied following an acquisition bid from its largest shareholder (and we subsequently sold the position as we believe further upside would likely be limited), a Swiss global pharmaceutical company, a Spanish transaction processor for the travel industry and a U.K. global financial services firm. No exposure to a U.K.-based global metals and mining company further benefited relative returns. Top detractors include a Belgian materials company, a U.K. oil and gas explorer and producer, a U.K. global diversified natural resources company, an emerging markets telecommunications provider based in Sweden and a German automobile maker.
The reporting period started with a continuation of the rally in financials, which began in response to the European Central Bank's (ECB) intervention in the stressed sovereign debt markets at the end of July 2012. Banks — particularly those in the peripheral countries — continued to outperform and led the market until late-February. Subsequently, we saw a significant sector rotation toward more defensive sectors. This came with little surprise as there were significant concerns in Europe about the results of the Cyprus bailout
5 The Morgan Stanley Capital International (MSCI) Europe Index is a free float-adjusted market capitalization index that is designed to measure developed market equity performance in Europe. The term "free float" represents the portion of shares outstanding that are deemed to be available for purchase in the public equity markets by investors. The performance of the Index is listed in U.S. dollars and assumes reinvestment of net dividends. The Index is unmanaged and its returns do not include any sales charges or fees. Such costs would lower performance. It is not possible to invest directly in an index.
8
Morgan Stanley Variable Investment Series
Letter to the Shareholders n June 30, 2013 (unaudited) continued
and the outcome of elections in Italy. In addition, economic data and earnings releases at the time were not encouraging. European defensive sectors performed strongly for the period overall, as these sectors tended to offer companies rich in cash with high free cash flow yields and wide international (especially emerging markets) exposure, available at attractive valuations. These characteristics have been appealing to global investors seeking high and reliable yields.
Furthermore, equities in general continued to rank well versus other assets with respect to the prospective returns and yields they offer. Stocks are also perceived as more attractive than bonds if inflationary expectations continue to increase. The asset class remains underowned within institutional and private portfolios, and we believe this could support asset rotation to equities from fixed income over the medium term.
Over the long term, we expect the European economy to be a major beneficiary of a global recovery, and recent macroeconomic European data have been encouraging, including rising PMIs (purchasing managers indexes, which gauge the health of the manufacturing sector), falling inflation and improving consumer sentiment. The periphery is undergoing a severe adjustment in activity level and the hurdle rate for a positive surprise is very low. For example, according to J.P. Morgan research (June 2013), car registrations in Italy and Spain are already down 60% to 70% from their peaks, while current accounts are moving into surplus and unit labor costs are falling.
Additionally, the ECB is still in an expansionary mode and ready to support the economy further if necessary. European governments are finally easing the austerity measures put in place in the past few years, providing a boost to the domestic economies. In fact, the European Commission recently extended the time period for countries such as Spain, Italy, France and the Netherlands to reduce their deficits. As of the close of the period, while current valuations for European equities are not as cheap as they were in the spring of 2012, they are still trading at discounts to their long-term average and provide appealing opportunities for the long-term investor, in our view.
We believe that emerging markets exposure, asset allocation shift out of fixed income into equities and cheap valuations make a compelling case for European equities. Our investment approach remains the same. We continue to seek high-quality companies with high earnings visibility and predictability, stable and strong cash flow, and low levels of debt trading at attractive valuations.
There is no guarantee that any sectors mentioned will continue to perform as discussed above or that securities in such sectors will be held by the Portfolio in the future.
9
Morgan Stanley Variable Investment Series
Letter to the Shareholders n June 30, 2013 (unaudited) continued
Multi Cap Growth Portfolio
For the six-month period ended June 30, 2013, Variable Investment Series – Multi Cap Growth Portfolio Class X shares produced a total return of 12.42%, outperforming the Russell 3000® Growth Index (the "Index"),6 which returned 12.23%. For the same period, the Portfolio's Class Y shares returned 12.28%. Past performance is no guarantee of future results.
The performance of the Portfolio's two share classes varies because each has different expenses. The Portfolio's total returns assume the reinvestment of all distributions but do not reflect the deduction of any charges by your insurance company. Such costs would lower performance.
Stock selection in the energy sector helped the Portfolio outperform the Index. A holding in a solar panel maker contributed the most to performance within the sector. Stock selection in the consumer discretionary sector also boosted relative returns, with outperformance from a position in an electric car and components manufacturer. The technology sector was another area of relative strength, as strong stock selection more than offset relative losses from an overweight in the sector. A position in an internet search engine was the leading contributor in the sector.
However, the health care sector diminished relative performance, due to both stock selection and an underweight. A holding in a pharmaceuticals company was the main detractor. Stock selection and an underweight in the producer durables sector were unfavorable as well. Within the sector, underperformance was driven by a holding in a customer loyalty programs provider and a lack of exposure to other stronger-performing producer durables stocks. Stock selection in the financial services sector also dampened relative results, despite being moderately offset by a beneficial overweight in the sector. The Portfolio's only detractor in the sector was a holding in an insurance and reinsurance company.
There is no guarantee that any sectors mentioned will continue to perform as discussed above or that securities in such sectors will be held by the Portfolio in the future.
6 The Russell 3000® Growth Index measures the performance of the broad growth segment of the U.S. equity universe. It includes those Russell 3000® Index companies with higher price-to-book ratios and higher forecasted growth values. The Russell 3000® Index measures the performance of the largest 3000 U.S. companies representing approximately 98% of the investable U.S. equity market. The Index is unmanaged and its returns do not include any sales charges or fees. Such costs would lower performance. It is not possible to invest directly in an index.
10
Morgan Stanley Variable Investment Series
Letter to the Shareholders n June 30, 2013 (unaudited) continued
We appreciate your ongoing support of Morgan Stanley Variable Investment Series and look forward to continuing to serve your investment needs.
Very truly yours,

Arthur Lev
President and Principal Executive Officer
11
Morgan Stanley Variable Investment Series
Letter to the Shareholders n June 30, 2013 (unaudited) continued
For More Information About Portfolio Holdings
Each Morgan Stanley fund provides a complete schedule of portfolio holdings in its semiannual and annual reports within 60 days of the end of the fund's second and fourth fiscal quarters. The semiannual reports and the annual reports are filed electronically with the Securities and Exchange Commission (SEC) on Form N-CSRS and Form N-CSR, respectively. Morgan Stanley also delivers the semiannual and annual reports to fund shareholders and makes these reports available on its public web site, www.morganstanley.com. Each Morgan Stanley fund also files a complete schedule of portfolio holdings with the SEC for the fund's first and third fiscal quarters on Form N-Q and monthly holdings for each money market fund on Form N-MFP. Morgan Stanley does not deliver these reports to shareholders, nor are the first and third fiscal quarter reports posted to the Morgan Stanley public web site. However, the holdings for each money market fund are posted to the Morgan Stanley public web site. You may obtain the Form N-Q filings (as well as the Form N-CSR, N-CSRS and N-MFP filings) by accessing the SEC's web site, http://www.sec.gov. You may also review and copy them at the SEC's public reference room in Washington, DC. Information on the operation of the SEC's public reference room may be obtained by calling the SEC at (800) SEC-0330. You can also request copies of these materials, upon payment of a duplicating fee, by electronic request at the SEC's e-mail address (publicinfo@sec.gov) or by writing the public reference section of the SEC, Washington, DC 20549-1520.
Proxy Voting Policy and Procedures and Proxy Voting Record
You may obtain a copy of the Portfolio's Proxy Voting Policy and Procedures without charge, upon request, by calling toll free (800) 869-NEWS or by visiting the Mutual Fund Center on our web site at www.morganstanley.com. It is also available on the SEC's web site at http://www.sec.gov.
You may obtain information regarding how the Portfolios voted proxies relating to portfolio securities during the most recent twelve-month period ended June 30 without charge by visiting the Mutual Fund Center on our web site at www.morganstanley.com. This information is also available on the SEC's web site at http://www.sec.gov.
12
Morgan Stanley Variable Investment Series
Fund Performance n June 30, 2013 (unaudited)
| Average Annual Total Returns—Period Ended June 30, 2013(1) | |
Class X | | 1 Year | | 5 Years | | 10 Years | | Since
Inception | | Gross Expense
Ratio | | Date of
Inception | |
European Equity | | | 19.65 | % | | | 0.22 | % | | | 6.91 | % | | | 8.56 | % | | | 1.22 | % | | 3/1/1991 | |
Global Infrastructure | | | 16.61 | | | | 5.25 | | | | 10.13 | | | | 8.23 | | | | 0.87 | | | 3/1/1990 | |
Income Plus | | | 4.30 | | | | 7.84 | | | | 5.88 | | | | 7.27 | | | | 0.61 | | | 3/1/1987 | |
Limited Duration | | | 0.90 | | | | 1.17 | | | | 0.86 | | | | 1.96 | | | | 0.63 | | | 5/4/1999 | |
Money Market | | | 0.01 | | | | 0.18 | | | | 1.58 | | | | 4.12 | | | | 0.63 | | | 3/9/1984 | |
Multi Cap Growth | | | 15.00 | | | | 7.57 | | | | 9.62 | | | | 11.02 | | | | 0.58 | | | 3/9/1984 | |
Performance data quoted represents past performance, which is no guarantee of future results and current performance may be lower or higher than the figures shown. For most recent month-end performance figures, please contact the issuing insurance company or speak with your Financial Advisor. Investment return and principal value will fluctuate. When you sell Portfolio shares, they may be worth less than their original cost. Total returns do not reflect the deduction of taxes that a shareholder would pay on Portfolio distributions or the redemption of Portfolio shares. Performance for Class Y shares will vary from the performance of Class X shares due to differences in expenses. Expenses are as of each Portfolio's fiscal year end as outlined in the Portfolio's current prospectus.
(1) Figure assumes reinvestment of all distributions for the underlying fund based on net asset value (NAV). It does not reflect the deduction of insurance expenses, an annual contract maintenance fee, or surrender charges. If performance information included the effect of these additional charges, the total returns would be lower.
13
Morgan Stanley Variable Investment Series
Fund Performance n June 30, 2013 (unaudited) continued
| Average Annual Total Returns—Period Ended June 30, 2013(1) | |
Class Y | | 1 Year | | 5 Years | | 10 Years | | Since
Inception | | Gross Expense
Ratio | | Date of
Inception | |
European Equity | | | 19.31 | % | | | -0.04 | % | | | 6.64 | % | | | 1.46 | % | | | 1.47 | % | | 6/5/2000 | |
Global Infrastructure | | | 16.22 | | | | 4.96 | | | | 9.85 | | | | 3.86 | | | | 1.12 | | | 6/5/2000 | |
Income Plus | | | 4.10 | | | | 7.57 | | | | 5.62 | | | | 6.52 | | | | 0.86 | | | 6/5/2000 | |
Limited Duration | | | 0.60 | | | | 0.93 | | | | 0.61 | | | | 1.61 | | | | 0.88 | | | 6/5/2000 | |
Money Market | | | 0.01 | | | | 0.16 | | | | 1.44 | | | | 1.74 | | | | 0.88 | | | 6/5/2000 | |
Multi Cap Growth | | | 14.71 | | | | 7.30 | | | | 9.35 | | | | 2.91 | | | | 0.83 | | | 6/5/2000 | |
Performance data quoted represents past performance, which is no guarantee of future results and current performance may be lower or higher than the figures shown. For most recent month-end performance figures, please contact the issuing insurance company or speak with your Financial Advisor. Investment return and principal value will fluctuate. When you sell Portfolio shares, they may be worth less than their original cost. Total returns do not reflect the deduction of taxes that a shareholder would pay on Portfolio distributions or the redemption of Portfolio shares. Performance for Class Y shares will vary from the performance of Class X shares due to differences in expenses. Expenses are as of each Portfolio's fiscal year end as outlined in the Portfolio's current prospectus.
(1) Figure assumes reinvestment of all distributions for the underlying fund based on net asset value (NAV). It does not reflect the deduction of insurance expenses, an annual contract maintenance fee, or surrender charges. If performance information included the effect of these additional charges, the total returns would be lower.
14
Morgan Stanley Variable Investment Series
Expense Examples n June 30, 2013 (unaudited)
As a shareholder of the Portfolio, you incur two types of costs: (1) insurance company charges; and (2) ongoing costs, including advisory fees; administration fees; distribution and services (12b-1) fees; and other Portfolio expenses. These examples are intended to help you understand your ongoing costs (in dollars) of investing in the Portfolio and to compare these costs with the ongoing costs of investing in other mutual funds.
These examples are based on an investment of $1,000 invested at the beginning of the period and held for the entire period 01/01/13 – 06/30/13.
Actual Expenses
The first line of the table below provides information about actual account values and actual expenses. You may use the information in this line, together with the amount you invested, to estimate the expenses that you paid over the period. Simply divide your account value by $1,000 (for example, an $8,600 account value divided by $1,000 = 8.6), then multiply the result by the number in the first line under the heading entitled "Expenses Paid During Period" to estimate the expenses you paid on your account during this period.
Hypothetical Example for Comparison Purposes
The second line of the table below provides information about hypothetical expenses based on the Portfolio's actual expense ratio and an assumed rate of return of 5% per year before expenses, which is not the Portfolio's actual return. The hypothetical account values and expenses may not be used to estimate the actual ending account balance or expenses you paid for the period. You may use this information to compare the ongoing cost of investing in the Portfolio and other funds. To do so, compare this 5% hypothetical example with the 5% hypothetical examples that appear in the shareholder reports of the other funds.
Please note that the expenses shown in the table are meant to highlight your ongoing costs only and do not reflect any insurance company charges. Therefore, the second line of the table is useful in comparing ongoing costs, and will not help you determine the relative total cost of owning different funds. In addition, if these insurance company charges were included, your costs would have been higher.
15
Morgan Stanley Variable Investment Series
Expense Examples n June 30, 2013 (unaudited) continued
Money Market
| | | Beginning
Account Value | | Ending
Account Value | | Expenses Paid
During Period@ | |
| | | 01/01/13 | | 06/30/13 | | 01/01/13 –
06/30/13 | |
Class X | |
| Actual (0.00% return) | | $ | 1,000.00 | | | $ | 1,000.05 | | | $ | 1.03 | | |
| Hypothetical (5% annual return before expenses) | | $ | 1,000.00 | | | $ | 1,023.49 | | | $ | 1.04 | | |
Class Y | |
| Actual (0.00% return) | | $ | 1,000.00 | | | $ | 1,000.05 | | | $ | 1.03 | | |
| Hypothetical (5% annual return before expenses) | | $ | 1,000.00 | | | $ | 1,023.49 | | | $ | 1.04 | | |
@ Expenses are equal to the Portfolio's annualized expense ratios of 0.21% and 0.21% for Class X and Class Y shares, respectively, multiplied by the average account value over the period, multiplied by 179@@/365 (to reflect the one-half year period). If the Portfolio had borne all of its expenses, the annualized expense ratios would have been 0.66% and 0.91% for Class X and Class Y shares, respectively.
@@ Adjusted to reflect non--business day accruals.
Limited Duration
| | | Beginning
Account Value | | Ending
Account Value | | Expenses Paid
During Period@ | |
| | | 01/01/13 | | 06/30/13 | | 01/01/13 –
06/30/13 | |
Class X | |
| Actual (-0.54% return) | | $ | 1,000.00 | | | $ | 994.60 | | | $ | 3.41 | | |
| Hypothetical (5% annual return before expenses) | | $ | 1,000.00 | | | $ | 1,021.37 | | | $ | 3.46 | | |
Class Y | |
| Actual (-0.71% return) | | $ | 1,000.00 | | | $ | 992.90 | | | $ | 4.64 | | |
| Hypothetical (5% annual return before expenses) | | $ | 1,000.00 | | | $ | 1,020.13 | | | $ | 4.71 | | |
@ Expenses are equal to the Portfolio's annualized expense ratios of 0.69% and 0.94% for Class X and Class Y shares, respectively, multiplied by the average account value over the period, multiplied by 181/365 (to reflect the one-half year period).
Income Plus
| | | Beginning
Account Value | | Ending
Account Value | | Expenses Paid
During Period@ | |
| | | 01/01/13 | | 06/30/13 | | 01/01/13 –
06/30/13 | |
Class X | |
| Actual (-2.58% return) | | $ | 1,000.00 | | | $ | 974.20 | | | $ | 2.99 | | |
| Hypothetical (5% annual return before expenses) | | $ | 1,000.00 | | | $ | 1,021.77 | | | $ | 3.06 | | |
Class Y | |
| Actual (-2.71% return) | | $ | 1,000.00 | | | $ | 972.90 | | | $ | 4.21 | | |
| Hypothetical (5% annual return before expenses) | | $ | 1,000.00 | | | $ | 1,020.53 | | | $ | 4.31 | | |
@ Expenses are equal to the Portfolio's annualized expense ratios of 0.61% and 0.86% for Class X and Class Y shares, respectively, multiplied by the average account value over the period, multiplied by 181/365 (to reflect the one-half year period).
16
Morgan Stanley Variable Investment Series
Expense Examples n June 30, 2013 (unaudited) continued
Global Infrastructure
| | | Beginning
Account Value | | Ending
Account Value | | Expenses Paid
During Period@ | |
| | | 01/01/13 | | 06/30/13 | | 01/01/13 –
06/30/13 | |
Class X | |
| Actual (5.19% return) | | $ | 1,000.00 | | | $ | 1,051.90 | | | $ | 4.38 | | |
| Hypothetical (5% annual return before expenses) | | $ | 1,000.00 | | | $ | 1,020.53 | | | $ | 4.31 | | |
Class Y | |
| Actual (4.93% return) | | $ | 1,000.00 | | | $ | 1,049.30 | | | $ | 5.64 | | |
| Hypothetical (5% annual return before expenses) | | $ | 1,000.00 | | | $ | 1,019.29 | | | $ | 5.56 | | |
@ Expenses are equal to the Portfolio's annualized expense ratios of 0.86% and 1.11% for Class X and Class Y shares, respectively, multiplied by the average account value over the period, multiplied by 181/365 (to reflect the one-half year period).
European Equity
| | | Beginning
Account Value | | Ending
Account Value | | Expenses Paid
During Period@ | |
| | | 01/01/13 | | 06/30/13 | | 01/01/13 –
06/30/13 | |
Class X | |
| Actual (4.04% return) | | $ | 1,000.00 | | | $ | 1,040.40 | | | $ | 5.06 | | |
| Hypothetical (5% annual return before expenses) | | $ | 1,000.00 | | | $ | 1,019.84 | | | $ | 5.01 | | |
Class Y | |
| Actual (3.90% return) | | $ | 1,000.00 | | | $ | 1,039.00 | | | $ | 6.32 | | |
| Hypothetical (5% annual return before expenses) | | $ | 1,000.00 | | | $ | 1,018.60 | | | $ | 6.26 | | |
@ Expenses are equal to the Portfolio's annualized expense ratios of 1.00% and 1.25% for Class X and Class Y shares, respectively, multiplied by the average account value over the period, multiplied by 181/365 (to reflect the one-half year period). If the Portfolio had borne all of its expenses, the annualized expense ratios would have been 1.20% and 1.45% for Class X and Class Y shares, respectively.
Multi Cap Growth
| | | Beginning
Account Value | | Ending
Account Value | | Expenses Paid
During Period@ | |
| | | 01/01/13 | | 06/30/13 | | 01/01/13 –
06/30/13 | |
Class X | |
| Actual (12.42% return) | | $ | 1,000.00 | | | $ | 1,124.20 | | | $ | 3.00 | | |
| Hypothetical (5% annual return before expenses) | | $ | 1,000.00 | | | $ | 1,021.97 | | | $ | 2.86 | | |
Class Y | |
| Actual (12.28% return) | | $ | 1,000.00 | | | $ | 1,122.80 | | | $ | 4.32 | | |
| Hypothetical (5% annual return before expenses) | | $ | 1,000.00 | | | $ | 1,020.73 | | | $ | 4.11 | | |
@ Expenses are equal to the Portfolio's annualized expense ratios of 0.57% and 0.82% for Class X and Class Y shares, respectively, multiplied by the average account value over the period, multiplied by 181/365 (to reflect the one-half year period).
17
Morgan Stanley Variable Investment Series
Investment Advisory Agreement Approval n June 30, 2013 (unaudited)
Nature, Extent and Quality of Services
The Board reviewed and considered the nature and extent of the investment advisory services provided by the Investment Adviser (as defined herein) under the advisory agreement, including portfolio management, investment research and equity and fixed income securities trading. The Board reviewed similar information and factors regarding the Sub-Advisers (as defined herein), to the extent applicable. The Board also reviewed and considered the nature and extent of the non-advisory, administrative services provided by the Administrator (as defined herein) under the administration agreement, including accounting, clerical, bookkeeping, compliance, business management and planning, and the provision of supplies, office space and utilities at the Investment Adviser's expense. (The Investment Adviser, Sub-Advisers and Administrator together are referred to as the "Adviser" and the advisory, sub-advisory and administration agreements together are referred to as the "Management Agreement.") The Board also compared the nature of the services provided by the Adviser with similar services provided by non-affiliated advisers as reported to the Board by Lipper, Inc. ("Lipper").
The Board reviewed and considered the qualifications of the portfolio managers, the senior administrative managers and other key personnel of the Adviser who provide the administrative and advisory services to the Portfolios. The Board determined that the Adviser's portfolio managers and key personnel are well qualified by education and/or training and experience to perform the services in an efficient and professional manner. The Board concluded that the nature and extent of the advisory and administrative services provided were necessary and appropriate for the conduct of the business and investment activities of the Portfolios and supported its decision to approve the Management Agreement.
Performance, Fees and Expenses of the Portfolios
The Board reviewed the performance, fees and expenses of the Portfolios compared to their peers, as determined by Lipper, and to appropriate benchmarks where applicable. The Board discussed with the Adviser the performance goals and the actual results achieved in managing the Portfolios. When considering a fund's performance, the Board and the Adviser place emphasis on trends and longer-term returns (focusing on one-year, three-year and five-year performance, as of December 31, 2012, or since inception, as applicable). When a fund underperforms its benchmark and/or its peer group average, they discuss the causes of such underperformance and, where necessary, they discuss specific changes to investment strategy or investment personnel.
Performance
The Board noted that the performance of the Global Infrastructure and Income Plus Portfolios was better than the peer group averages for the one-, three- and five-year periods.
18
Morgan Stanley Variable Investment Series
Investment Advisory Agreement Approval n June 30, 2013 (unaudited) continued
The Board noted that the performance of the Multi Cap Growth Portfolio was better than its peer group average for the five-year period but below its peer group average for the one- and three-year periods.
The Board noted that the performance of the European Equity and Money Market Portfolios was better than the peer group averages for the one- and three-year periods but below the peer group averages for the five-year period.
The Board noted that the performance of the Limited Duration Portfolio was better than its peer group average for the one-year period, equal to its peer group average for the three-year period but below its peer group average for the five-year period.
Performance Conclusions
With respect to the Multi Cap Growth, Money Market and Limited Duration, after discussion, the Board concluded that performance was acceptable.
With respect to the Income Plus, Global Infrastructure and European Equity Portfolios, after discussion, the Board concluded that performance was competitive with the peer group averages.
Fees and Expenses
The Board members discussed with the Adviser the level of the advisory and administration fees (together, the "management fee") for the Portfolios relative to comparable funds and/or other accounts advised by the Adviser and/or compared to their peers as determined by Lipper. In addition to the management fee, the Board also reviewed the Portfolios' total expense ratios.
The Board noted that the management fees and total expense ratios for the Money Market, Limited Duration, Income Plus, Multi Cap Growth, Global Infrastructure and European Equity Portfolios were lower than the peer group averages.
Fee and Expense Conclusions
With respect to the Money Market, Limited Duration, Income Plus, Multi Cap Growth, Global Infrastructure and European Equity Portfolios, after discussion, the Board concluded that the management fees and total expense ratios were competitive with the peer group averages.
Economies of Scale
The Board considered the size and growth prospects of the Portfolios and how that relates to the Portfolios' total expense ratios and particularly the Portfolios' management fee rates (which, for all the Portfolios except Limited Duration, include one or more breakpoints). In conjunction with its review of the Adviser's profitability, the Board
19
Morgan Stanley Variable Investment Series
Investment Advisory Agreement Approval n June 30, 2013 (unaudited) continued
discussed with the Adviser how a change in assets can affect the efficiency or effectiveness of managing the Portfolios and whether the management fee level is appropriate relative to current and projected asset levels and/or whether the management fee structure reflects economies of scale as asset levels change. The Board has determined that its review of the actual and potential economies of scale of each Portfolio supports its decision to approve the Management Agreement.
Profitability of the Adviser and Affiliates
The Board considered information concerning the costs incurred and profits realized by the Adviser and its affiliates during the last year from their relationship with the Portfolios and during the last two years from their relationship with the Morgan Stanley Fund Complex and reviewed with the Adviser the cost allocation methodology used to determine the profitability of the Adviser and affiliates. The Board has determined that its review of the analysis of the Adviser's expenses and profitability supports its decision to approve the Management Agreement.
Other Benefits of the Relationship
The Board considered other benefits to the Adviser and its affiliates derived from their relationship with the Portfolios and other funds advised by the Adviser. These benefits may include, among other things, "float" benefits derived from handling of checks for purchases and sales, research received by the Adviser generated from commission dollars spent on funds' portfolio trading and fees for distribution and/or shareholder servicing. The Board reviewed with the Adviser each of these arrangements and the reasonableness of the Adviser's costs relative to the services performed. The Board has determined that its review of the other benefits received by the Adviser or its affiliates supports its decision to approve the Management Agreement.
Resources of the Adviser and Historical Relationship Between the Portfolios and the Adviser
The Board considered whether the Adviser is financially sound and has the resources necessary to perform its obligations under the Management Agreement. The Board also reviewed and considered the historical relationship between the Portfolios and the Adviser, including the organizational structure of the Adviser, the policies and procedures formulated and adopted by the Adviser for managing the Portfolios' operations and the Board's confidence in the competence and integrity of the senior managers and key personnel of the Adviser. The Board concluded that the Adviser has the financial resources necessary to fulfill its obligations under the Management Agreement and that it is beneficial for the Portfolios to continue their relationship with the Adviser.
Other Factors and Current Trends
The Board considered the controls and procedures adopted and implemented by the Adviser and monitored by the Fund's Chief Compliance Officer and concluded that the conduct of business by the Adviser indicates a good faith effort on its part to adhere to high ethical standards in the conduct of the Fund's business.
20
Morgan Stanley Variable Investment Series
Investment Advisory Agreement Approval n June 30, 2013 (unaudited) continued
General Conclusion
After considering and weighing all of the above factors, the Board concluded that it would be in the best interest of each Portfolio and its shareholders to approve renewal of the Management Agreement for another year. In reaching this conclusion the Board did not give particular weight to any single factor referenced above. The Board considered these factors over the course of numerous meetings, some of which were in executive session with only the independent Board members and their counsel present. It is possible that individual Board members may have weighed these factors differently in reaching their individual decisions to approve the Management Agreement.
21
Morgan Stanley Variable Investment Series - Money Market
Portfolio of Investments n June 30, 2013 (unaudited)
PRINCIPAL
AMOUNT
(000) | |
| | ANNUALIZED
YIELD
ON DATE OF
PURCHASE | | MATURITY
DATE | | VALUE | |
| | | Repurchase Agreements (44.9%) | |
$ | 500 | | | Bank of Montreal, (dated 06/12/13;
proceeds $500,038; fully collateralized
by U.S. Government Agencies;
Federal Home Loan Mortgage
Corporation 4.00% due 05/01/25;
Federal National Mortgage Association
3.00% - 5.00% due 08/01/27 - 06/01/43;
and by a U.S. Government Obligation;
U.S. Treasury Note 1.00% due 10/31/16;
valued at $510,344) (Demand 07/05/13) | | | 0.09 | (a)% | | 07/12/13 | | $ | 500,000 | | |
| | 1,000 | | | BNP Paribas Securities Corp.,
(dated 06/03/13; proceeds $1,000,230;
fully collateralized by U.S. Government
Agencies; Government National Mortgage
Association 1.75% - 4.00% due 06/20/34 -
04/20/41; valued at $1,030,000)
(Demand 07/05/13) | | | 0.09 | (a) | | 09/03/13 | | | 1,000,000 | | |
| | 1,000 | | | BNP Paribas Securities Corp.,
(dated 06/05/13; proceeds $1,000,295;
fully collateralized by U.S. Government
Agencies; Government National Mortgage
Association 1.63% - 4.00% due 02/20/21 -
09/20/40; valued at $1,030,000)
(Demand 07/05/13) | | | 0.09 | (a) | | 10/01/13 | | | 1,000,000 | | |
| | 12,300 | | | BNP Paribas Securities Corp.,
(dated 06/28/13; proceeds $12,300,154;
fully collateralized by U.S. Government
Agencies; Government National Mortgage
Association 2.49% - 9.00% due 03/15/22 -
05/15/53; valued at $12,669,000) | | | 0.15 | | | 07/01/13 | | | 12,300,000 | | |
| | 1,000 | | | BNP Paribas Securities Corp.,
(dated 02/20/13; proceeds $1,000,704;
fully collateralized by U.S. Government
Agencies; Government National Mortgage
Association 1.63% - 6.00% due 03/20/19 -
10/20/41; valued at $1,030,000)
(Demand 07/05/13) | | | 0.17 | (a) | | 07/19/13 | | | 1,000,000 | | |
See Notes to Financial Statements
22
Morgan Stanley Variable Investment Series - Money Market
Portfolio of Investments n June 30, 2013 (unaudited) continued
PRINCIPAL
AMOUNT
(000) | |
| | ANNUALIZED
YIELD
ON DATE OF
PURCHASE | | MATURITY
DATE | | VALUE | |
$ | 1,000 | | | BNP Paribas Securities Corp.,
(dated 01/08/13; proceeds $1,000,905;
fully collateralized by U.S. Government
Agencies; Government National Mortgage
Association 1.63% - 2.50% due 01/20/33 -
12/20/38; valued at $1,030,000)
(Demand 07/05/13) | | | 0.18 | (a)% | | 07/08/13 | | $ | 1,000,000 | | |
| | 5,000 | | | ING Financial Markets LLC, (dated 06/28/13;
proceeds $5,000,067; fully collateralized by
a U.S. Government Agency; Federal National
Mortgage Association 2.61% due 04/01/38;
valued at $5,140,907) | | | 0.16 | | | 07/01/13 | | | 5,000,000 | | |
| | 1,500 | | | Merrill Lynch Pierce Fenner & Smith,
(dated 04/10/13; proceeds $1,500,455;
fully collateralized by a U.S. Government
Obligation; U.S. Treasury Note 0.13%
due 12/31/13; valued at $1,530,023)
(Demand 07/05/13) | | | 0.12 | (a) | | 07/10/13 | | | 1,500,000 | | |
| | 500 | | | Merrill Lynch Pierce Fenner & Smith,
(dated 04/10/13; proceeds $500,276;
fully collateralized by a U.S. Government
Obligation; U.S. Treasury Bill Zero Coupon
due 07/05/13; valued at $510,098)
(Demand 07/05/13) | | | 0.16 | (a) | | 08/12/13 | | | 500,000 | | |
| | 4,000 | | | Merrill Lynch Pierce Fenner & Smith,
(dated 03/01/13; proceeds $4,004,133;
fully collateralized by a U.S. Government
Obligation; U.S. Treasury Bill Zero Coupon
due 07/05/13; valued at $4,080,084)
(Demand 07/05/13) | | | 0.20 | (a) | | 09/03/13 | | | 4,000,000 | | |
| | 10,000 | | | Mizuho Securities USA, Inc., (dated 06/28/13;
proceeds $10,000,125; fully collateralized
by U.S. Government Agencies; Government
National Mortgage Association 4.50%
due 07/20/41 - 09/20/41; valued
at $10,356,493) | | | 0.15 | | | 07/01/13 | | | 10,000,000 | | |
| | | Total Repurchase Agreements
(Cost $37,800,000) | | | 37,800,000 | | |
See Notes to Financial Statements
23
Morgan Stanley Variable Investment Series - Money Market
Portfolio of Investments n June 30, 2013 (unaudited) continued
PRINCIPAL
AMOUNT
(000) | |
| | COUPON
RATE(a) | | DEMAND
DATE(b) | | MATURITY
DATE | |
VALUE | |
| | | Floating Rate Notes (16.8%) | |
| | | International Banks | |
$ | 500 | | | ASB Finance Ltd. (c) | | | 0.30 | % | | 07/03/13 | | 01/03/14 | | $ | 500,000 | | |
| | 1,000 | | | Bank of Nova Scotia | | | 0.33 | | | 07/02/13 | | 07/02/13 | | | 1,000,000 | | |
| | 300 | | | BNZ International Funding Ltd. | | | 0.29 | | | 09/06/13 | | 12/06/13 | | | 300,000 | | |
| | 350 | | | BNZ International Funding
Ltd. (c) | | | 0.29 | | | 09/09/13 | | 12/09/13 | | | 350,000 | | |
| | 3,500 | | | National Australia Bank | | | 0.27 - 0.28 | | | 07/11/13 - 08/09/13 | | 08/09/13 - 10/11/13 | | | 3,500,000 | | �� |
| | 2,000 | | | Rabobank Nederland NY | | | 0.33 | | | 09/24/13 | | 03/24/14 | | | 2,000,000 | | |
| | 1,000 | | | Royal Bank of Canada | | | 0.33 | | | 07/11/13 | | 07/11/13 | | | 1,000,000 | | |
| | 3,270 | | | Toronto Dominion Bank | | | 0.27 - 0.28 | | | 07/19/13 - 09/13/13 | | 07/26/13 - 10/21/13 | | | 3,270,000 | | |
| | 1,250 | | | Westpac Banking Corp. (c) | | | 0.27 | | | 08/27/13 | | 08/27/13 | | | 1,249,990 | | |
| | 1,000 | | | Westpac Banking Corp. | | | 0.28 | | | 07/09/13 | | 10/09/13 | | | 1,000,000 | | |
| | | | | Total Floating Rate Notes
(Cost $14,169,990) | | | | | | | | | 14,169,990 | | |
| |
| |
| | ANNUALIZED
YIELD
ON DATE OF
PURCHASE | |
| |
| |
| | | Certificates of Deposit (13.3%) | |
| | | Domestic Bank (3.6%) | |
| | 3,000 | | | Branch Banking & Trust Co. | | | | | | | 0.10 | % | | 07/02/13 | | | 3,000,000 | | |
| | | International Banks (9.7%) | |
| | 3,000 | | | Bank of Montreal | | | | | | | 0.13 | | | 07/05/13 | | | 3,000,000 | | |
| | 900 | | | Credit Suisse NY | | | | | | | 0.25 | | | 07/31/13 | | | 900,000 | | |
| | 1,850 | | | Deutsche Bank AG | | | | | | | 0.35 - 0.37 | | | 10/30/13 - 11/26/13 | | | 1,850,000 | | |
| | 900 | | | Skandin Ens Banken AB | | | | | | | 0.30 | | | 11/07/13 | | | 899,984 | | |
| | 750 | | | Sumitomo Mitsui Banking Corp. | | | | | | | 0.23 | | | 09/10/13 | | | 750,000 | | |
| | 750 | | | Toronto Dominion Bank | | | | | | | 0.15 | | | 07/15/13 | | | 750,000 | | |
| | | | 8,149,984 | | |
| | | | | Total Certificates of Deposit
(Cost $11,149,984) | | | | | | | | | 11,149,984 | | |
| | | Commercial Paper (12.8%) | |
| | | International Banks | |
| | 800 | | | KFW International Finance, Inc. (c) | | | | | | | 0.20 | | | 07/10/13 | | | 799,951 | | |
| | 2,600 | | | Mizuho Funding LLC (c) | | | | | | | 0.24 - 0.25 | | | 07/12/13 - 07/19/13 | | | 2,599,733 | | |
| | 1,000 | | | NRW Bank | | | | | | | 0.11 | | | 07/02/13 | | | 999,991 | | |
| | 1,900 | | | Oversea Chinese Banking Corporation | | | | | | | 0.22 - 0.27 | | | 07/22/13 - 10/04/13 | | | 1,899,036 | | |
See Notes to Financial Statements
24
Morgan Stanley Variable Investment Series - Money Market
Portfolio of Investments n June 30, 2013 (unaudited) continued
PRINCIPAL
AMOUNT
(000) | |
| |
| | ANNUALIZED
YIELD
ON DATE OF
PURCHASE | | MATURITY
DATE | | VALUE | |
$ | 2,000 | | | Skandin Ens Banken AB (c) | | | | | | | 0.30 | % | | 11/01/13 | | $ | 1,997,917 | | |
| | 1,500 | | | Sumitomo Mitsui Banking Corp. | | | | | | | 0.24 | | | 08/27/13 | | | 1,499,410 | | |
| | 400 | | | Svenska Handelsbanken AB (c) | | | | | | | 0.25 | | | 07/05/13 | | | 399,983 | | |
| | 600 | | | UOB Funding LLC | | | | | | | 0.22 | | | 07/10/13 - 07/16/13 | | | 599,953 | | |
| | | | | Total Commercial Paper
(Cost $10,795,974) | | | | | | | | | 10,795,974 | | |
| |
| | COUPON
RATE(a) | | DEMAND
DATE(b) | |
| |
| |
| | | Extendible Floating Rate Notes (8.7%) | |
| | | Domestic Banks (4.8%) | |
| | 2,000 | | | JPMorgan Chase Bank NA
(Extendible Maturity Date
07/07/14) | | | 0.35 | % | | 09/07/13 | | 03/07/19 | | | 2,000,000 | | |
| | 2,000 | | | Wells Fargo Bank NA
(Extendible Maturity Date
07/14/14 - 07/18/14) | | | 0.32 - 0.33 | | | 07/22/13 - 09/15/13 | | 03/20/19 - 07/15/19 | | | 2,000,000 | | |
| | | 4,000,000 | | |
| | | International Banks (3.9%) | |
| | 1,000 | | | Bank of Nova Scotia
(Extendible Maturity Date
07/30/14) | | | 0.34 | | | 07/30/13 | | 01/31/19 | | | 1,000,000 | | |
| | 1,000 | | | Royal Bank of Canada
(Extendible Maturity Date
07/01/14) | | | 0.37 | | | 07/01/13 | | 04/01/19 | | | 999,924 | | |
| | 1,300 | | | Svenska Handelsbanken AB (b)
(Extendible Maturity Date
12/31/13) | | | 0.28 | | | 07/15/13 | | 05/13/16 | | | 1,300,000 | | |
| | | 3,299,924 | | |
| | | | | Total Extendible Floating Rate Notes
(Cost $7,299,924) | | | | | | | | | 7,299,924 | | |
See Notes to Financial Statements
25
Morgan Stanley Variable Investment Series - Money Market
Portfolio of Investments n June 30, 2013 (unaudited) continued
PRINCIPAL
AMOUNT
(000) | |
| | COUPON
RATE(a) | | DEMAND
DATE(b) | |
MATURITY
DATE | |
VALUE | |
| | | Tax-Exempt Instruments (3.6%) | |
| | | Weekly Variable Rate Bond | |
$ | 3,000 | | | Miami-Dade County, FL,
Professional Sports Franchise
Facilities Tax Ser 2009 E
(Cost $3,000,000) | | | 0.06 | % | | 07/05/13 | | 10/01/48 | | $ | 3,000,000 | | |
| | | Total Investments
(Cost $84,215,872) | | | | | | | 100.1 | % | | | 84,215,872 | | |
| | | Liabilities in Excess of Other Assets | | | | | | | (0.1 | ) | | | (61,741 | ) | |
| | | Net Assets | | | | | | | 100.0 | % | | $ | 84,154,131 | | |
(a) Rate shown is the rate in effect at June 30, 2013.
(b) Date of next interest rate reset.
(c) 144A security — Certain conditions for public sale may exist. Unless otherwise noted, these securities are deemed to be liquid.
MATURITY SCHEDULE†
| 1 - 30 Days | | | 76.3 | % | |
| 31 - 60 Days | | | 7.7 | | |
| 61 - 90 Days | | | 9.0 | | |
| 91 - 120 Days | | | 1.4 | | |
| 121 + Days | | | 5.6 | | |
| | | | 100.0 | % | |
† As a percentage of total investments.
See Notes to Financial Statements
26
Morgan Stanley Variable Investment Series - Limited Duration
Portfolio of Investments n June 30, 2013 (unaudited)
PRINCIPAL
AMOUNT
(000) | |
| | COUPON
RATE | | MATURITY
DATE | | VALUE | |
| | | Corporate Bonds (67.6%) | |
| | | Basic Materials (2.3%) | |
$ | 190 | | | ArcelorMittal (Luxembourg) | | | 9.50 | % | | 02/15/15 | | $ | 208,288 | | |
| | 85 | | | Ecolab, Inc. | | | 1.00 | | | 08/09/15 | | | 84,952 | | |
| | 115 | | | Ecolab, Inc. | | | 3.00 | | | 12/08/16 | | | 120,081 | | |
| | 60 | | | Freeport-McMoRan Copper & Gold, Inc. (a) | | | 2.375 | | | 03/15/18 | | | 57,127 | | |
| | 175 | | | Goldcorp, Inc. (Canada) | | | 2.125 | | | 03/15/18 | | | 167,753 | | |
| | 260 | | | Kinross Gold Corp. (Canada) | | | 3.625 | | | 09/01/16 | | | 259,650 | | |
| | 125 | | | Rio Tinto Finance USA PLC (United Kingdom) | | | 1.375 | | | 06/17/16 | | | 124,337 | | |
| | | | | | 1,022,188 | | |
| | | Communications (5.4%) | |
| | 250 | | | Amazon.com, Inc. | | | 1.20 | | | 11/29/17 | | | 242,041 | | |
| | 375 | | | AT&T, Inc. | | | 2.50 | | | 08/15/15 | | | 386,613 | | |
| | 300 | | | Comcast Corp. | | | 6.50 | | | 01/15/15 | | | 326,021 | | |
| | 220 | | | DirecTV Holdings LLC/DirecTV Financing Co., Inc. | | | 4.75 | | | 10/01/14 | | | 230,295 | | |
| | 145 | | | News America, Inc. | | | 5.30 | | | 12/15/14 | | | 154,328 | | |
| | 175 | | | Time Warner Cable, Inc. | | | 6.75 | | | 07/01/18 | | | 200,530 | | |
| | 225 | | | Verizon Communications, Inc. | | | 1.10 | | | 11/01/17 | | | 217,941 | | |
| | 350 | | | Viacom, Inc. | | | 4.375 | | | 09/15/14 | | | 365,008 | | |
| | 275 | | | Vodafone Group PLC (United Kingdom) | | | 1.25 | | | 09/26/17 | | | 263,231 | | |
| | | | | | 2,386,008 | | |
| | | Consumer, Cyclical (3.7%) | |
| | 305 | | | Best Buy Co., Inc. | | | 3.75 | | | 03/15/16 | | | 305,762 | | |
| | 280 | | | Daimler Finance North America LLC (a) | | | 1.875 | | | 09/15/14 | | | 282,554 | | |
| | 230 | | | Glencore Funding LLC (a) | | | 1.70 | | | 05/27/16 | | | 223,190 | | |
| | 220 | | | Home Depot, Inc. | | | 5.40 | | | 03/01/16 | | | 245,297 | | |
| | 430 | | | Volkswagen International Finance N.V.
(Germany) (a) | | | 1.625 | | | 03/22/15 | | | 435,203 | | |
| | 135 | | | Wesfarmers Ltd. (Australia) (a) | | | 2.983 | | | 05/18/16 | | | 140,537 | | |
| | | | | | 1,632,543 | | |
| | | Consumer, Non-Cyclical (12.8%) | |
| | 255 | | | AbbVie, Inc. (a) | | | 1.20 | | | 11/06/15 | | | 255,427 | | |
| | 265 | | | AbbVie, Inc. (a) | | | 1.75 | | | 11/06/17 | | | 259,895 | | |
| | 250 | | | Altria Group, Inc. | | | 4.125 | | | 09/11/15 | | | 266,549 | | |
| | 150 | | | Amgen, Inc. | | | 2.50 | | | 11/15/16 | | | 155,109 | | |
| | 165 | | | Anheuser-Busch InBev Worldwide, Inc. (Belgium) | | | 4.125 | | | 01/15/15 | | | 173,429 | | |
| | 205 | | | Anheuser-Busch InBev Worldwide, Inc. (Belgium) | | | 5.375 | | | 11/15/14 | | | 217,671 | | |
| | 265 | | | Bacardi Ltd. (Bermuda) (a) | | | 7.45 | | | 04/01/14 | | | 277,635 | | |
| | 200 | | | BAT International Finance PLC
(United Kingdom) (a) | | | 1.40 | | | 06/05/15 | | | 201,683 | | |
See Notes to Financial Statements
27
Morgan Stanley Variable Investment Series - Limited Duration
Portfolio of Investments n June 30, 2013 (unaudited) continued
PRINCIPAL
AMOUNT
(000) | |
| | COUPON
RATE | | MATURITY
DATE | | VALUE | |
$ | 265 | | | Baxter International, Inc. | | | 1.85 | % | | 06/15/18 | | $ | 263,163 | | |
| | 260 | | | Bunge Ltd. Finance Corp. | | | 5.35 | | | 04/15/14 | | | 268,076 | | |
| | 430 | | | Coca-Cola Co. (The) | | | 0.75 | | | 03/13/15 | | | 431,686 | | |
| | 100 | | | Covidien International Finance SA | | | 1.35 | | | 05/29/15 | | | 100,910 | | |
| | 275 | | | Diageo Capital PLC (United Kingdom) | | | 1.50 | | | 05/11/17 | | | 272,774 | | |
| | 210 | | | Experian Finance PLC (United Kingdom) (a) | | | 2.375 | | | 06/15/17 | | | 208,254 | | |
| | 200 | | | Express Scripts Holding Co. | | | 2.75 | | | 11/21/14 | | | 204,469 | | |
| | 120 | | | General Mills, Inc. | | | 0.875 | | | 01/29/16 | | | 119,380 | | |
| | 350 | | | Gilead Sciences, Inc. | | | 3.05 | | | 12/01/16 | | | 370,258 | | |
| | 75 | | | Kellogg Co. | | | 1.125 | | | 05/15/15 | | | 75,357 | | |
| | 250 | | | Kraft Foods Group, Inc. | | | 2.25 | | | 06/05/17 | | | 251,989 | | |
| | 225 | | | Kroger Co. (The) | | | 7.50 | | | 01/15/14 | | | 233,356 | | |
| | 370 | | | McKesson Corp. | | | 3.25 | | | 03/01/16 | | | 390,410 | | |
| | 175 | | | PepsiCo, Inc. | | | 0.75 | | | 03/05/15 | | | 175,386 | | |
| | 200 | | | Takeda Pharmaceutical Co., Ltd. (Japan) (a) | | | 1.031 | | | 03/17/15 | | | 201,164 | | |
| | 85 | | | UnitedHealth Group, Inc. | | | 1.40 | | | 10/15/17 | | | 83,543 | | |
| | 240 | | | WellPoint, Inc. | | | 1.875 | | | 01/15/18 | | | 235,248 | | |
| | | | | | 5,692,821 | | |
| | | Diversified (0.4%) | |
| | 200 | | | LVMH Moet Hennessy Louis Vuitton SA
(France) (a) | | | 1.625 | | | 06/29/17 | | | 197,149 | | |
| | | Energy (3.2%) | |
| | 115 | | | Enterprise Products Operating LLC | | | 1.25 | | | 08/13/15 | | | 115,437 | | |
| | 225 | | | Enterprise Products Operating LLC, Series O | | | 9.75 | | | 01/31/14 | | | 236,409 | | |
| | 380 | | | Marathon Petroleum Corp. | | | 3.50 | | | 03/01/16 | | | 399,145 | | |
| | 275 | | | Phillips 66 | | | 1.95 | | | 03/05/15 | | | 279,379 | | |
| | 305 | | | Spectra Energy Capital LLC | | | 5.90 | | | 09/15/13 | | | 308,130 | | |
| | 100 | | | TransCanada PipeLines Ltd. (Canada) | | | 0.875 | | | 03/02/15 | | | 100,128 | | |
| | | | | | 1,438,628 | | |
| | | Finance (32.8%) | |
| | 265 | | | ABB Treasury Center USA, Inc. (Switzerland) (a) | | | 2.50 | | | 06/15/16 | | | 274,572 | | |
| | 255 | | | Abbey National Treasury Services PLC
(United Kingdom) | | | 2.875 | | | 04/25/14 | | | 258,171 | | |
| | 110 | | | Aflac, Inc. | | | 3.45 | | | 08/15/15 | | | 115,708 | | |
| | 475 | | | American Express Co. | | | 7.25 | | | 05/20/14 | | | 502,419 | | |
| | 205 | | | American Honda Finance Corp. (Japan) (a) | | | 1.60 | | | 02/16/18 | | | 201,775 | | |
| | 260 | | | American International Group, Inc. | | | 3.65 | | | 01/15/14 | | | 263,887 | | |
| | 200 | | | Australia & New Zealand Banking Group Ltd.
(Australia) | | | 1.45 | | | 05/15/18 | | | 193,674 | | |
See Notes to Financial Statements
28
Morgan Stanley Variable Investment Series - Limited Duration
Portfolio of Investments n June 30, 2013 (unaudited) continued
PRINCIPAL
AMOUNT
(000) | |
| | COUPON
RATE | | MATURITY
DATE | | VALUE | |
$ | 325 | | | Banco Bradesco SA (Brazil) | | | 4.50 | % | | 01/12/17 | | $ | 338,813 | | |
| | 620 | | | Bank of America Corp., Series 1 | | | 3.75 | | | 07/12/16 | | | 650,401 | | |
| | 195 | | | Bank of Montreal (Canada) | | | 1.40 | | | 09/11/17 | | | 190,618 | | |
| | 300 | | | Barclays Bank PLC (United Kingdom) | | | 5.20 | | | 07/10/14 | | | 313,038 | | |
| | 315 | | | BNP Paribas SA (France) | | | 2.375 | | | 09/14/17 | | | 312,159 | | |
| | 205 | | | BP Capital Markets PLC (United Kingdom) | | | 3.875 | | | 03/10/15 | | | 215,403 | | |
| | 110 | | | Canadian Imperial Bank of Commerce (Canada) | | | 1.55 | | | 01/23/18 | | | 107,255 | | |
| | 300 | | | Capital One Financial Corp. | | | 7.375 | | | 05/23/14 | | | 317,126 | | |
| | 405 | | | Citigroup, Inc. (See Note 6) | | | 4.45 | | | 01/10/17 | | | 434,024 | | |
| | 250 | | | Commonwealth Bank of Australia (Australia) | | | 1.95 | | | 03/16/15 | | | 254,607 | | |
| | 115 | | | Cooperatieve Centrale
Raiffeisen-Boerenleenbank BA (Netherlands) | | | 3.375 | | | 01/19/17 | | | 120,877 | | |
| | 250 | | | Credit Agricole SA (France) (a) | | | 2.125 | | | 04/17/18 | | | 243,132 | | |
| | 340 | | | Credit Suisse (Switzerland) | | | 5.50 | | | 05/01/14 | | | 353,929 | | |
| | 250 | | | Discover Bank | | | 2.00 | | | 02/21/18 | | | 242,235 | | |
| | 205 | | | DNB Bank ASA (Norway) (a) | | | 3.20 | | | 04/03/17 | | | 212,428 | | |
| | 635 | | | General Electric Capital Corp. | | | 1.625 | | | 04/02/18 | | | 619,247 | | |
| | 325 | | | Goldman Sachs Group, Inc. (The) | | | 2.375 | | | 01/22/18 | | | 319,437 | | |
| | 350 | | | HSBC Finance Corp. | | | 5.25 | | | 04/15/15 | | | 374,047 | | |
| | 255 | | | Hyundai Capital America (a) | | | 2.125 | | | 10/02/17 | | | 246,777 | | |
| | 200 | | | ING Bank N.V. (Netherlands) (a) | | | 3.75 | | | 03/07/17 | | | 209,508 | | |
| | 125 | | | ING US, Inc. (Netherlands) (a) | | | 2.90 | | | 02/15/18 | | | 125,764 | | |
| | 200 | | | Intesa Sanpaolo SpA (Italy) | | | 3.875 | | | 01/16/18 | | | 192,239 | | |
| | 425 | | | JPMorgan Chase & Co. | | | 1.875 | | | 03/20/15 | | | 430,160 | | |
| | 135 | | | JPMorgan Chase & Co. | | | 3.15 | | | 07/05/16 | | | 140,312 | | |
| | 245 | | | Korea Development Bank (The)
(Korea, Republic of) | | | 1.50 | | | 01/22/18 | | | 228,960 | | |
| | 230 | | | Macquarie Group Ltd. (Australia) (a) | | | 7.30 | | | 08/01/14 | | | 242,631 | | |
| | 275 | | | Metropolitan Life Global Funding I
(See Note 6) (a) | | | 1.50 | | | 01/10/18 | | | 266,904 | | |
| | 230 | | | Mizuho Corporate Bank Ltd. (Japan) (a) | | | 1.85 | | | 03/21/18 | | | 223,508 | | |
| | 350 | | | Monumental Global Funding III (a) | | | 5.25 | | | 01/15/14 | | | 358,801 | | |
| | 250 | | | National Australia Bank Ltd. (Australia) | | | 2.00 | | | 03/09/15 | | | 254,764 | | |
| | 270 | | | Nationwide Building Society
(United Kingdom) (a) | | | 4.65 | | | 02/25/15 | | | 281,449 | | |
| | 240 | | | Nordea Bank AB (Sweden) (a) | | | 0.875 | | | 05/13/16 | | | 237,522 | | |
| | 250 | | | PNC Bank NA | | | 0.80 | | | 01/28/16 | | | 248,487 | | |
| | 250 | | | Principal Financial Group, Inc. | | | 1.85 | | | 11/15/17 | | | 245,782 | | |
| | 320 | | | Prudential Financial, Inc., MTN | | | 4.75 | | | 09/17/15 | | | 344,523 | | |
| | 200 | | | QBE Insurance Group Ltd. (Australia) (a) | | | 2.40 | | | 05/01/18 | | | 196,290 | | |
See Notes to Financial Statements
29
Morgan Stanley Variable Investment Series - Limited Duration
Portfolio of Investments n June 30, 2013 (unaudited) continued
PRINCIPAL
AMOUNT
(000) | |
| | COUPON
RATE | | MATURITY
DATE | | VALUE | |
$ | 170 | | | Royal Bank of Scotland Group PLC
(United Kingdom) | | | 2.55 | % | | 09/18/15 | | $ | 172,942 | | |
| | 40 | | | Santander Holdings USA, Inc. | | | 3.00 | | | 09/24/15 | | | 41,035 | | |
| | 200 | | | Skandinaviska Enskilda Banken AB
(Sweden) (a) | | | 1.75 | | | 03/19/18 | | | 194,718 | | |
| | 300 | | | Standard Chartered PLC (United Kingdom) (a) | | | 3.85 | | | 04/27/15 | | | 313,080 | | |
| | 200 | | | Swedbank AB (Sweden) (a) | | | 1.75 | | | 03/12/18 | | | 194,537 | | |
| | 250 | | | Toyota Motor Credit Corp. (Japan) | | | 0.875 | | | 07/17/15 | | | 251,000 | | |
| | 365 | | | UBS AG (Switzerland) | | | 3.875 | | | 01/15/15 | | | 380,545 | | |
| | 330 | | | US Bancorp | | | 2.20 | | | 11/15/16 | | | 338,764 | | |
| | 470 | | | Wells Fargo & Co. | | | 3.676 | | | 06/15/16 | | | 502,509 | | |
| | 350 | | | Westpac Banking Corp. (Australia) (a) | | | 1.375 | | | 05/30/18 | | | 338,779 | | |
| | | | | | 14,631,272 | | |
| | | Industrials (2.1%) | |
| | 90 | | | Danaher Corp. | | | 1.30 | | | 06/23/14 | | | 90,647 | | |
| | 215 | | | Eaton Corp. (a) | | | 1.50 | | | 11/02/17 | | | 208,921 | | |
| | 200 | | | Heathrow Funding Ltd. (United Kingdom) (a) | | | 2.50 | | | 06/25/15 | | | 203,282 | | |
| | 115 | | | Ingersoll-Rand Global Holding Co. Ltd.
(Bermuda) (a) | | | 2.875 | | | 01/15/19 | | | 113,589 | | |
| | 50 | | | Precision Castparts Corp. | | | 0.70 | | | 12/20/15 | | | 49,736 | | |
| | 250 | | | Waste Management, Inc. | | | 2.60 | | | 09/01/16 | | | 258,384 | | |
| | | | | | 924,559 | | |
| | | Technology (2.3%) | |
| | 160 | | | Applied Materials, Inc. | | | 2.65 | | | 06/15/16 | | | 165,951 | | |
| | 275 | | | EMC Corp. | | | 1.875 | | | 06/01/18 | | | 272,156 | | |
| | 110 | | | Hewlett-Packard Co. | | | 3.30 | | | 12/09/16 | | | 114,278 | | |
| | 200 | | | Intel Corp. | | | 1.35 | | | 12/15/17 | | | 195,934 | | |
| | 300 | | | TSMC Global Ltd. (Taiwan) (a) | | | 1.625 | | | 04/03/18 | | | 289,154 | | |
| | | | | | 1,037,473 | | |
| | | Utilities (2.6%) | |
| | 300 | | | Commonwealth Edison Co. | | | 1.625 | | | 01/15/14 | | | 301,744 | | |
| | 350 | | | Enel Finance International N.V. (Italy) (a) | | | 3.875 | | | 10/07/14 | | | 358,504 | | |
| | 225 | | | GDF Suez (France) (a) | | | 1.625 | | | 10/10/17 | | | 221,812 | | |
| | 125 | | | Georgia Power Co. | | | 0.75 | | | 08/10/15 | | | 124,825 | | |
| | 175 | | | Northeast Utilities | | | 1.45 | | | 05/01/18 | | | 170,057 | | |
| | | | | | 1,176,942 | | |
| | | | | Total Corporate Bonds
(Cost $30,374,462) | | | | | | | 30,139,583 | | |
See Notes to Financial Statements
30
Morgan Stanley Variable Investment Series - Limited Duration
Portfolio of Investments n June 30, 2013 (unaudited) continued
PRINCIPAL
AMOUNT
(000) | |
| | COUPON
RATE | | MATURITY
DATE | | VALUE | |
| | | U.S. Treasury Securities (12.1%) | | | |
| | | U.S. Treasury Notes | | | |
$ | 970 | | | | | | 0.375 | % | | 01/15/16 | | $ | 966,589 | | |
| | 640 | | | | | | 0.875 | | | 04/30/17 | | | 636,900 | | |
| | 408 | | | | | | 1.25 | | | 10/31/15 | | | 415,555 | | |
| | 428 | | | | | | 1.625 | | | 11/15/22 | | | 399,595 | | |
| | 2,825 | | | | | | 2.25 | | | 03/31/16 | | | 2,952,676 | | |
| | | | | Total U.S. Treasury Securities
(Cost $5,446,921) | | | | | | | 5,371,315 | | |
| | | Asset-Backed Securities (11.6%) | | | |
| | 200 | | | Ally Auto Receivables Trust | | | 0.57 | | | 08/20/15 | | | 199,357 | | |
| | 200 | | | Ally Master Owner Trust | | | 2.15 | | | 01/15/16 | | | 201,173 | | |
| | 800 | | | American Express Credit Account Master Trust | | | 1.443 | (b) | | 03/15/17 | | | 809,800 | | |
| | | CarMax Auto Owner Trust | | | |
| | 180 | | | | | | | | 0.52 | | | 07/17/17 | | | 178,889 | | |
| | 88 | | | | | | | | 1.29 | | | 09/15/15 | | | 88,408 | | |
| | | Chase Issuance Trust | | | |
| | 425 | | | | | | | | 0.54 | | | 10/16/17 | | | 422,088 | | |
| | 573 | | | | | | | | 0.59 | | | 08/15/17 | | | 570,155 | | |
| | 76 | | | CNH Equipment Trust | | | 1.17 | | | 05/15/15 | | | 75,861 | | |
| | | Ford Credit Auto Lease Trust | | | |
| | 115 | | | | | | | | 0.57 | | | 09/15/15 | | | 114,414 | | |
| | 210 | | | | | | | | 0.60 | | | 03/15/16 | | | 207,760 | | |
| | 375 | | | Ford Credit Floorplan Master Owner Trust (a) | | | 4.20 | | | 02/15/17 | | | 394,904 | | |
| | | GE Dealer Floorplan Master Note Trust | | | |
| | 275 | | | | | | | | 0.682 | (b) | | 06/20/17 | | | 275,136 | | |
| | 330 | | | | | | | | 0.792 | (b) | | 07/20/16 | | | 330,925 | | |
| | 116 | | | Hyundai Auto Lease Securitization Trust (a) | | | 1.02 | | | 08/15/14 | | | 116,315 | | |
| | 475 | | | John Deere Owner Trust | | | 0.60 | | | 03/15/17 | | | 472,904 | | |
| | 34 | | | MMCA Auto Owner Trust (a) | | | 1.22 | | | 01/15/15 | | | 34,376 | | |
| | | North Carolina State Education Assistance Authority | | | |
| | 67 | | | | | | | | 0.00 | (b) | | 01/25/21 | | | 66,900 | | |
| | 225 | | | | | | | | 1.076 | (b) | | 07/25/25 | | | 226,337 | | |
| | 100 | | | Panhandle-Plains Higher Education Authority, Inc. | | | 1.224 | (b) | | 07/01/24 | | | 100,117 | | |
| | 235 | | | Volvo Financial Equipment LLC (a) | | | 0.74 | | | 03/15/17 | | | 234,042 | | |
| | 60 | | | World Omni Automobile Lease Securitization Trust | | | 0.93 | | | 11/16/15 | | | 60,010 | | |
| | | | | Total Asset-Backed Securities
(Cost $4,618,708) | | | | | | | 5,179,871 | | |
See Notes to Financial Statements
31
Morgan Stanley Variable Investment Series - Limited Duration
Portfolio of Investments n June 30, 2013 (unaudited) continued
PRINCIPAL
AMOUNT
(000) | |
| | COUPON
RATE | | MATURITY
DATE | | VALUE | |
| | | Agency Adjustable Rate Mortgages (3.7%) | | | |
| | | Federal Home Loan Mortgage Corporation,
Conventional Pools: | | | |
$ | 189 | | | | | | | | 2.698 | % | | 07/01/38 | | $ | 200,846 | | |
| | 61 | | | | | | | | 2.726 | | | 07/01/36 | | | 65,068 | | |
| | 41 | | | | | | | | 2.933 | | | 01/01/38 | | | 43,487 | | |
| | | Federal National Mortgage Association,
Conventional Pools: | | | |
| | 207 | | | | | | | | 2.342 | | | 05/01/35 | | | 220,585 | | |
| | 249 | | | | | | | | 2.624 | | | 09/01/38 | | | 265,885 | | |
| | 378 | | | | | | | | 2.658 | | | 04/01/38 | | | 402,611 | | |
| | 269 | | | | | | | | 2.816 | | | 10/01/39 | | | 286,918 | | |
| | | Government National Mortgage Association,
Various Pools: | | | |
| | 154 | | | | | | | | 3.00 | | | 11/20/39 - 02/20/40 | | | 162,398 | | |
| | | | | Total Agency Adjustable Rate Mortgages
(Cost $1,651,653) | | | | | | | 1,647,798 | | |
| | | Collateralized Mortgage Obligations - Agency Collateral Series (2.5%) | | | |
| | | Federal Home Loan Mortgage Corporation | | | |
| | 245 | | | | | | | | 1.426 | | | 08/25/17 | | | 246,494 | | |
| | 221 | | | REMIC | | | 7.50 | | | 09/15/29 | | | 256,266 | | |
| | | Federal National Mortgage Association | | | |
| | 225 | | | | | | | | 0.595 | | | 08/25/15 | | | 224,851 | | |
| | 125 | | | | | | | | 0.953 | | | 11/25/15 | | | 125,831 | | |
| | 250 | | | | | | | | 1.083 | | | 02/25/16 | | | 251,701 | | |
| | | | | Total Collateralized Mortgage Obligations - Agency Collateral Series
(Cost $1,089,706) | | | | | | | 1,105,143 | | |
| | | Agency Fixed Rate Mortgages (0.6%) | | | |
| | | Federal National Mortgage Association,
Conventional Pools: | | | |
| | 132 | | | | | | | | 6.50 | | | 01/01/32 - 11/01/33 | | | 148,317 | | |
| | 107 | | | | | | | | 7.00 | | | 08/01/29 - 06/01/32 | | | 124,248 | | |
| | | | | Total Agency Fixed Rate Mortgages
(Cost $248,475) | | | | | | | 272,565 | | |
See Notes to Financial Statements
32
Morgan Stanley Variable Investment Series - Limited Duration
Portfolio of Investments n June 30, 2013 (unaudited) continued
PRINCIPAL
AMOUNT
(000) | |
| | COUPON
RATE | | MATURITY
DATE | | VALUE | |
| | | Sovereign (0.5%) | |
$ | 200 | | | Qatar Government International Bond (Qatar)
(Cost $211,500) (a) | | | 4.00 | % | | 01/20/15 | | $ | 208,260 | | |
| | | Commercial Mortgage-Backed Security (0.2%) | |
| | 99 | | | Citigroup Commercial Mortgage Trust (See Note 6)
(Cost $101,737) | | | 2.11 | | | 01/12/18 | | | 99,806 | | |
| | | Short-Term Investments (1.7%) | |
| | | U.S. Treasury Securities (0.2%) | |
| | | U.S. Treasury Bills | |
| | 10 | | | (c)(d) | | | 0.018 | | | 08/08/13 | | | 10,000 | | |
| | 75 | | | (c)(d) | | | 0.121 | | | 08/08/13 | | | 74,990 | | |
| | | Total U.S. Treasury Securities
(Cost $84,990) | | | | | | | 84,990 | | |
NUMBER OF
SHARES (000)
| |
| |
| |
| |
| |
| | | Investment Company (1.5%) | |
| | 646 | | | Morgan Stanley Institutional Liquidity Funds - Money
Market Portfolio - Institutional Class (See Note 6)
(Cost $645,972) | | | 645,972 | | |
| | | Total Short-Term Investments
(Cost $730,962) | | | | | | | 730,962 | | |
| | | Total Investments
(Cost $44,474,124) (e) | | | | | 100.5 | % | | | 44,755,303 | | |
| | | Liabilities in Excess of Other Assets | | | | | (0.5 | ) | | | (208,084 | ) | |
| | | Net Assets | | | | | 100.0 | % | | $ | 44,547,219 | | |
MTN Medium Term Note.
REMIC Real Estate Mortgage Investment Conduit.
(a) 144A security — Certain conditions for public sale may exist. Unless otherwise noted, these securities are deemed to be liquid.
(b) Variable/Floating Rate Security — Interest rate changes on these instruments are based on changes in a designated base rate. The rates shown are those in effect on June 30, 2013.
(c) Rate shown is the yield to maturity at June 30, 2013.
(d) All or a portion of this security has been physically segregated in connection with open futures contracts.
(e) Securities are available for collateral in connection with open futures contracts and swap agreements.
See Notes to Financial Statements
33
Morgan Stanley Variable Investment Series - Limited Duration
Portfolio of Investments n June 30, 2013 (unaudited) continued
FUTURES CONTRACTS OPEN AT JUNE 30, 2013:
NUMBER OF
CONTRACTS | | LONG/SHORT | | DESCRIPTION, DELIVERY
MONTH AND YEAR | | UNDERLYING FACE
AMOUNT AT VALUE | | UNREALIZED
DEPRECIATION | |
| | 31 | | | Long | | U.S. Treasury 2 yr. Note,
Sep-13 | | $ | 6,820,000 | | | $ | (5,969 | ) | |
| | 16 | | | Long | | U.S. Treasury 10 yr. Note,
Sep-13 | | | 2,025,000 | | | | (46,625 | ) | |
| | 6 | | | Long | | U.S. Treasury Long Bond,
Sep-13 | | | 815,062 | | | | (28,734 | ) | |
| | 1 | | | Long | | U.S. Treasury 5 yr. Note,
Sep-13 | | | 121,047 | | | | (1,516 | ) | |
Total Unrealized Depreciation | | $ | (82,844 | ) | |
CREDIT DEFAULT SWAP AGREEMENTS OPEN AT JUNE 30, 2013:
SWAP
COUNTERPARTY &
REFERENCE
OBLIGATION | | BUY/SELL
PROTECTION | | NOTIONAL
AMOUNT
(000) | | INTEREST
RATE | | TERMINATION
DATE | | UNREALIZED
APPRECIATION
(DEPRECIATION) | | UPFRONT
PAYMENTS | | VALUE | | CREDIT
RATING OF
REFERENCE
OBLIGATION† | |
Barclays Bank
Alcoa, Inc. | | Buy | | $ | 250 | | | | 1.00 | % | | 9/20/18 | | $ | (879 | ) | | $ | 26,140 | | | $ | 25,261 | | | BBB- | |
JPMorgan Chase
CDX.NA.IG.20 | | Sell | | | 110 | | | | 1.00 | | | 6/20/18 | | | (587 | ) | | | 1,290 | | | | 703 | | | NR | |
JPMorgan Chase
CDX.NA.IG.20 | | Sell | | | 600 | | | | 1.00 | | | 6/20/18 | | | 522 | | | | 3,314 | | | | 3,836 | | | NR | |
JPMorgan Chase
Kohl's Corporation | | Buy | | | 250 | | | | 1.00 | | | 6/20/18 | | | (10,228 | ) | | | 14,208 | | | | 3,980 | | | BBB+ | |
Total Credit
Default Swaps | | | | $ | 1,210 | | | | | | | | | | | $ | (11,172 | ) | | $ | 44,952 | | | $ | 33,780 | | | | | | |
See Notes to Financial Statements
34
Morgan Stanley Variable Investment Series - Limited Duration
Portfolio of Investments n June 30, 2013 (unaudited) continued
INTEREST RATE SWAP AGREEMENTS OPEN AT JUNE 30, 2013:
SWAP COUNTERPARTY | | NOTIONAL
AMOUNT
(000) | | FLOATING
RATE INDEX | | PAY/RECEIVE
FLOATING RATE | | FIXED RATE | | TERMINATION
DATE | | UNREALIZED
APPRECIATION | |
Bank of America | | $ | 660 | | | 3 Month LIBOR | | Receive | | | 2.10 | % | | 02/05/23 | | $ | 25,264 | | |
Goldman Sachs | | | 1,050 | | | 3 Month LIBOR | | Receive | | | 2.09 | | | 02/15/23 | | | 42,432 | | |
Royal Bank of Canada | | | 1,060 | | | 3 Month LIBOR | | Receive | | | 2.06 | | | 02/06/23 | | | 44,912 | | |
Total Unrealized Appreciation | | | | | | | | | | | | $ | 112,608 | | |
LIBOR London Interbank Offered Rate.
NR Not Rated.
† Credit rating as issued by Standard & Poor's.
LONG TERM CREDIT ANALYSIS+ | |
AAA | | | 12.5 | % | |
AA | | | 30.7 | | |
A | | | 38.7 | | |
BBB | | | 16.1 | | |
BB | | | 0.5 | | |
B or Below | | | 0.0 | | |
Not Rated | | | 1.5 | | |
| | | | 100.0 | %++ | |
+ The ratings shown are based on the Portfolio's security ratings as determined by Standard & Poor's, Moody's or Fitch, each a Nationally Recognized Statistical Ratings Organization ("NRSRO").
++ Does not include open long futures contracts with an underlying face amount of $9,781,109 with total unrealized depreciation of $82,844. Also does not include open swap agreements with net unrealized appreciation of $101,436.
See Notes to Financial Statements
35
Morgan Stanley Variable Investment Series - Income Plus
Portfolio of Investments n June 30, 2013 (unaudited)
PRINCIPAL
AMOUNT
(000) | |
| | COUPON
RATE | | MATURITY
DATE | | VALUE | |
| | | Corporate Bonds (95.7%) | |
| | | Basic Materials (5.9%) | |
$ | 175 | | | Agrium, Inc. (Canada) | | | 3.50 | % | | 06/01/23 | | $ | 168,683 | | |
| | 333 | | | Allegheny Technologies, Inc. | | | 4.25 | | | 06/01/14 | | | 344,239 | | |
| | 545 | | | ArcelorMittal (Luxembourg) | | | 10.35 | | | 06/01/19 | | | 647,187 | | |
EUR | 811 | | | ArcelorMittal, Series MT (Luxembourg) | | | 7.25 | | | 04/01/14 | | | 221,823 | | |
$ | 745 | | | CF Industries, Inc. | | | 6.875 | | | 05/01/18 | | | 876,828 | | |
| | 390 | | | Eldorado Gold Corp. (Canada) (a) | | | 6.125 | | | 12/15/20 | | | 378,300 | | |
| | 420 | | | Freeport-McMoRan Copper & Gold, Inc. (a) | | | 2.375 | | | 03/15/18 | | | 399,891 | | |
| | 350 | | | Freeport-McMoRan Copper & Gold, Inc. (a) | | | 3.875 | | | 03/15/23 | | | 317,407 | | |
| | 595 | | | Georgia-Pacific LLC | | | 8.875 | | | 05/15/31 | | | 833,296 | | |
| | 890 | | | Goldcorp, Inc. (Canada) | | | 3.70 | | | 03/15/23 | | | 789,681 | | |
| | 535 | | | Incitec Pivot Ltd. (Australia) (a) | | | 4.00 | | | 12/07/15 | | | 559,356 | | |
| | 580 | | | Kinross Gold Corp. (Canada) | | | 5.125 | | | 09/01/21 | | | 561,617 | | |
| | 545 | | | Lubrizol Corp. | | | 8.875 | | | 02/01/19 | | | 717,245 | | |
| | 1,000 | | | MeadWestvaco Corp. | | | 7.375 | | | 09/01/19 | | | 1,184,550 | | |
| | 550 | | | NewMarket Corp. | | | 4.10 | | | 12/15/22 | | | 533,897 | | |
| | 290 | | | Syngenta Finance N.V. (Switzerland) | | | 4.375 | | | 03/28/42 | | | 283,619 | | |
| | 341 | | | United States Steel Corp. | | | 4.00 | | | 05/15/14 | | | 350,377 | | |
| | 195 | | | Vale Overseas Ltd. (Brazil) | | | 6.875 | | | 11/21/36 | | | 198,410 | | |
| | 210 | | | Vale Overseas Ltd. (Brazil) | | | 6.875 | | | 11/10/39 | | | 213,020 | | |
| | | | | | 9,579,426 | | |
| | | Communications (10.2%) | |
| | 1,100 | | | AT&T, Inc. | | | 5.35 | | | 09/01/40 | | | 1,117,017 | | |
| | 875 | | | AT&T, Inc. | | | 6.30 | | | 01/15/38 | | | 975,974 | | |
| | 575 | | | British Sky Broadcasting Group PLC (United Kingdom) (a) | | | 3.125 | | | 11/26/22 | | | 538,769 | | |
| | 310 | | | Cablevision Systems Corp. | | | 7.75 | | | 04/15/18 | | | 334,800 | | |
| | 575 | | | CC Holdings GS V LLC/Crown Castle GS III Corp. | | | 3.849 | | | 04/15/23 | | | 543,286 | | |
| | 920 | | | Comcast Corp. | | | 6.40 | | | 05/15/38 | | | 1,101,786 | | |
| | 195 | | | CSC Holdings LLC | | | 6.75 | | | 11/15/21 | | | 211,088 | | |
| | 300 | | | Deutsche Telekom International Finance BV (Germany) | | | 8.75 | | | 06/15/30 | | | 417,229 | | |
| | 825 | | | DirecTV Holdings LLC/DirecTV Financing Co., Inc. | | | 3.80 | | | 03/15/22 | | | 793,935 | | |
| | 250 | | | Discovery Communications LLC | | | 3.25 | | | 04/01/23 | | | 234,916 | | |
| | 350 | | | MDC Partners, Inc. (Canada) (a) | | | 6.75 | | | 04/01/20 | | | 350,875 | | |
| | 505 | | | MetroPCS Wireless, Inc. (a) | | | 6.25 | | | 04/01/21 | | | 515,731 | | |
| | 225 | | | NBC Universal Media LLC | | | 2.875 | | | 01/15/23 | | | 214,154 | | |
| | 1,045 | | | NBC Universal Media LLC | | | 4.375 | | | 04/01/21 | | | 1,129,096 | | |
| | 350 | | | News America, Inc. | | | 6.15 | | | 02/15/41 | | | 390,022 | | |
| | 200 | | | News America, Inc. | | | 6.40 | | | 12/15/35 | | | 224,094 | | |
| | 700 | | | Omnicom Group, Inc. | | | 3.625 | | | 05/01/22 | | | 676,396 | | |
| | 263 | | | Priceline.com, Inc. | | | 1.00 | | | 03/15/18 | | | 307,052 | | |
See Notes to Financial Statements
36
Morgan Stanley Variable Investment Series - Income Plus
Portfolio of Investments n June 30, 2013 (unaudited) continued
PRINCIPAL
AMOUNT
(000) | |
| | COUPON
RATE | | MATURITY
DATE | | VALUE | |
$ | 900 | | | Qtel International Finance Ltd. (Qatar) (a) | | | 3.25 | % | | 02/21/23 | | $ | 821,250 | | |
| | 260 | | | Qwest Corp. | | | 6.875 | | | 09/15/33 | | | 252,850 | | |
| | 357 | | | RF Micro Devices, Inc. | | | 1.00 | | | 04/15/14 | | | 365,479 | | |
| | 320 | | | SK Telecom Co., Ltd. (Korea, Republic of) (a) | | | 2.125 | | | 05/01/18 | | | 305,344 | | |
| | 375 | | | Telefonaktiebolaget LM Ericsson (Sweden) | | | 4.125 | | | 05/15/22 | | | 367,393 | | |
| | 580 | | | Telefonica Europe BV (Spain) | | | 8.25 | | | 09/15/30 | | | 698,024 | | |
| | 490 | | | Time Warner Cable, Inc. | | | 4.50 | | | 09/15/42 | | | 381,354 | | |
| | 1,200 | | | Time Warner Cable, Inc. | | | 6.75 | | | 07/01/18 | | | 1,375,062 | | |
| | 760 | | | Time Warner, Inc. | | | 7.70 | | | 05/01/32 | | | 968,926 | | |
| | 785 | | | Verizon Communications, Inc. | | | 3.85 | | | 11/01/42 | | | 653,998 | | |
| | 450 | | | WPP Finance 2010 (United Kingdom) | | | 3.625 | | | 09/07/22 | | | 425,403 | | |
| | | | | | 16,691,303 | | |
| | | Consumer, Cyclical (5.1%) | |
| | 425 | | | American Airlines 2013-1 Class A Pass-Through Trust (a) | | | 4.00 | | | 07/15/25 | | | 401,625 | | |
| | 650 | | | British Airways PLC (United Kingdom) (a)(b) | | | 4.625 | | | 06/20/24 | | | 651,215 | | |
| | 715 | | | Chrysler Group LLC/CG Co-Issuer, Inc. | | | 8.00 | | | 06/15/19 | | | 783,819 | | |
| | 395 | | | Daimler Finance North America LLC (Germany) | | | 8.50 | | | 01/18/31 | | | 560,343 | | |
| | 425 | | | Exide Technologies (c)(d) | | | 8.625 | | | 02/01/18 | | | 263,500 | | |
| | 925 | | | Gap, Inc. (The) | | | 5.95 | | | 04/12/21 | | | 1,024,684 | | |
| | 470 | | | Glencore Funding LLC (a) | | | 2.50 | | | 01/15/19 | | | 425,752 | | |
| | 333 | | | Iconix Brand Group, Inc. | | | 2.50 | | | 06/01/16 | | | 377,123 | | |
| | 208 | | | International Game Technology | | | 3.25 | | | 05/01/14 | | | 222,040 | | |
| | 445 | | | Macy's Retail Holdings, Inc. | | | 3.875 | | | 01/15/22 | | | 446,946 | | |
| | 575 | | | QVC, Inc. (a) | | | 4.375 | | | 03/15/23 | | | 537,381 | | |
| | 275 | | | US Airways 2013-1 Class A Pass-Through Trust | | | 3.95 | | | 11/15/25 | | | 264,688 | | |
| | 565 | | | Volkswagen International Finance N.V. (Germany) (a) | | | 2.375 | | | 03/22/17 | | | 574,818 | | |
| | 745 | | | Wesfarmers Ltd. (Australia) (a) | | | 1.874 | | | 03/20/18 | | | 732,485 | | |
| | 780 | | | Wyndham Worldwide Corp. | | | 4.25 | | | 03/01/22 | | | 761,005 | | |
| | 265 | | | Wynn Las Vegas LLC/Wynn Las Vegas Capital Corp. | | | 7.75 | | | 08/15/20 | | | 295,581 | | |
| | | | | | 8,323,005 | | |
| | | Consumer, Non-Cyclical (8.1%) | |
| | 775 | | | Actavis, Inc. | | | 3.25 | | | 10/01/22 | | | 723,951 | | |
| | 765 | | | Aetna, Inc. | | | 2.75 | | | 11/15/22 | | | 705,986 | | |
| | 400 | | | Albea Beauty Holdings SA (a) | | | 8.375 | | | 11/01/19 | | | 394,000 | | |
| | 819 | | | Amgen, Inc. | | | 5.15 | | | 11/15/41 | | | 818,701 | | |
| | 340 | | | ARAMARK Corp. (a) | | | 5.75 | | | 03/15/20 | | | 349,350 | | |
| | 795 | | | Boston Scientific Corp. | | | 6.00 | | | 01/15/20 | | | 901,074 | | |
| | 260 | | | BRF SA (Brazil) (a) | | | 3.95 | | | 05/22/23 | | | 229,450 | | |
| | 290 | | | ConAgra Foods, Inc. | | | 3.20 | | | 01/25/23 | | | 277,883 | | |
| | 275 | | | ConAgra Foods, Inc. | | | 4.65 | | | 01/25/43 | | | 255,726 | | |
| | 350 | | | ESAL GmbH (Brazil) (a) | | | 6.25 | | | 02/05/23 | | | 321,300 | | |
See Notes to Financial Statements
37
Morgan Stanley Variable Investment Series - Income Plus
Portfolio of Investments n June 30, 2013 (unaudited) continued
PRINCIPAL
AMOUNT
(000) | |
| | COUPON
RATE | | MATURITY
DATE | | VALUE | |
$ | 279 | | | Jarden Corp. (a) | | | 1.875 | % | | 09/15/18 | | $ | 314,747 | | |
| | 450 | | | Kraft Foods Group, Inc. | | | 6.875 | | | 01/26/39 | | | 547,721 | | |
| | 760 | | | Life Technologies Corp. | | | 6.00 | | | 03/01/20 | | | 857,383 | | |
| | 700 | | | Mallinckrodt International Finance SA (a) | | | 4.75 | | | 04/15/23 | | | 668,105 | | |
| | 321 | | | PHH Corp. | | | 4.00 | | | 09/01/14 | | | 341,062 | | |
| | 600 | | | Philip Morris International, Inc. | | | 4.50 | | | 03/20/42 | | | 562,124 | | |
| | 455 | | | RR Donnelley & Sons Co. | | | 7.875 | | | 03/15/21 | | | 466,375 | | |
| | 550 | | | SABMiller Holdings, Inc. (a) | | | 3.75 | | | 01/15/22 | | | 560,745 | | |
| | 305 | | | SABMiller Holdings, Inc. (a) | | | 4.95 | | | 01/15/42 | | | 304,437 | | |
| | 342 | | | Salix Pharmaceuticals Ltd. | | | 1.50 | | | 03/15/19 | | | 409,759 | | |
| | 800 | | | Sigma Alimentos SA de CV (Mexico) (a) | | | 5.625 | | | 04/14/18 | | | 862,000 | | |
| | 230 | | | Teva Pharmaceutical Finance Co., BV (Israel) | | | 2.95 | | | 12/18/22 | | | 215,928 | | |
| | 665 | | | Teva Pharmaceutical Finance IV BV (Israel) | | | 3.65 | | | 11/10/21 | | | 666,251 | | |
| | 450 | | | UnitedHealth Group, Inc. | | | 4.25 | | | 03/15/43 | | | 412,201 | | |
| | 630 | | | Verisk Analytics, Inc. | | | 5.80 | | | 05/01/21 | | | 696,471 | | |
| | 281 | | | WellPoint, Inc. (a) | | | 2.75 | | | 10/15/42 | | | 351,250 | | |
| | | | | | 13,213,980 | | |
| | | Energy (9.2%) | |
| | 160 | | | Access Midstream Partners LP/ACMP Finance Corp. | | | 4.875 | | | 05/15/23 | | | 149,200 | | |
| | 1,075 | | | BP Capital Markets PLC (United Kingdom) | | | 3.245 | | | 05/06/22 | | | 1,045,234 | | |
| | 675 | | | Buckeye Partners LP | | | 4.15 | | | 07/01/23 | | | 658,065 | | |
| | 450 | | | Canadian Natural Resources Ltd. (Canada) | | | 6.25 | | | 03/15/38 | | | 504,309 | | |
| | 225 | | | Canadian Oil Sands Ltd. (Canada) (a) | | | 6.00 | | | 04/01/42 | | | 232,453 | | |
| | 550 | | | Canadian Oil Sands Ltd. (Canada) (a) | | | 7.75 | | | 05/15/19 | | | 664,611 | | |
| | 400 | | | Cimarex Energy Co. | | | 5.875 | | | 05/01/22 | | | 416,000 | | |
| | 125 | | | Continental Resources, Inc. (a) | | | 4.50 | | | 04/15/23 | | | 121,719 | | |
| | 420 | | | Continental Resources, Inc. | | | 7.125 | | | 04/01/21 | | | 464,100 | | |
| | 600 | | | DCP Midstream Operating LP | | | 3.875 | | | 03/15/23 | | | 563,848 | | |
| | 425 | | | Energy Transfer Partners LP | | | 3.60 | | | 02/01/23 | | | 398,545 | | |
| | 275 | | | Enterprise Products Operating LLC | | | 5.25 | | | 01/31/20 | | | 307,780 | | |
| | 850 | | | Enterprise Products Operating LLC | | | 5.95 | | | 02/01/41 | | | 929,302 | | |
| | 395 | | | FMC Technologies, Inc. | | | 3.45 | | | 10/01/22 | | | 379,123 | | |
| | 875 | | | Kinder Morgan Energy Partners LP | | | 3.50 | | | 09/01/23 | | | 821,734 | | |
| | 200 | | | Lukoil International Finance BV (Russia) | | | 2.625 | | | 06/16/15 | | | 214,900 | | |
| | 225 | | | Marathon Petroleum Corp. | | | 5.125 | | | 03/01/21 | | | 248,526 | | |
| | 375 | | | Marathon Petroleum Corp. | | | 6.50 | | | 03/01/41 | | | 429,737 | | |
| | 555 | | | Murphy Oil Corp. | | | 3.70 | | | 12/01/22 | | | 515,836 | | |
| | 500 | | | Nexen, Inc. (Canada) | | | 6.40 | | | 05/15/37 | | | 545,164 | | |
| | 650 | | | Phillips 66 | | | 4.30 | | | 04/01/22 | | | 672,818 | | |
| | 675 | | | Pioneer Natural Resources Co. | | | 3.95 | | | 07/15/22 | | | 667,752 | | |
| | 670 | | | Plains All American Pipeline LP/PAA Finance Corp. | | | 6.70 | | | 05/15/36 | | | 782,368 | | |
See Notes to Financial Statements
38
Morgan Stanley Variable Investment Series - Income Plus
Portfolio of Investments n June 30, 2013 (unaudited) continued
PRINCIPAL
AMOUNT
(000) | |
| | COUPON
RATE | | MATURITY
DATE | | VALUE | |
$ | 675 | | | Plains All American Pipeline LP/PAA Finance Corp. | | | 8.75 | % | | 05/01/19 | | $ | 880,739 | | |
| | 355 | | | Sinopec Group Overseas Development 2012 Ltd.
(China) (a)(e) | | | 2.75 | | | 05/17/17 | | | 357,796 | | |
| | 225 | | | Spectra Energy Capital LLC | | | 8.00 | | | 10/01/19 | | | 285,125 | | |
| | 170 | | | Tesoro Corp. | | | 5.375 | | | 10/01/22 | | | 172,975 | | |
| | 700 | | | Valero Energy Corp. | | | 6.125 | | | 02/01/20 | | | 814,554 | | |
| | 875 | | | Weatherford International Ltd. | | | 4.50 | | | 04/15/22 | | | 866,610 | | |
| | | | | | 15,110,923 | | |
| | | Finance (41.3%) | |
EUR | 200 | | | Aabar Investments PJSC (Germany) | | | 4.00 | | | 05/27/16 | | | 275,299 | | |
$ | 390 | | | ABB Treasury Center USA, Inc. (Switzerland) (a) | | | 4.00 | | | 06/15/21 | | | 407,471 | | |
| | 1,005 | | | ABN Amro Bank N.V. (Netherlands) (a) | | | 4.25 | | | 02/02/17 | | | 1,073,983 | | |
| | 264 | | | Affiliated Managers Group, Inc. | | | 3.95 | �� | | 08/15/38 | | | 340,230 | | |
| | 375 | | | Alexandria Real Estate Equities, Inc. | | | 3.90 | | | 06/15/23 | | | 358,747 | | |
| | 475 | | | Alexandria Real Estate Equities, Inc. | | | 4.60 | | | 04/01/22 | | | 484,933 | | |
| | 325 | | | American Campus Communities Operating Partnership LP | | | 3.75 | | | 04/15/23 | | | 312,505 | | |
| | 1,285 | | | American Financial Group, Inc. | | | 9.875 | | | 06/15/19 | | | 1,663,979 | | |
| | 720 | | | American International Group, Inc. | | | 6.40 | | | 12/15/20 | | | 836,236 | | |
| | 350 | | | American International Group, Inc. | | | 8.25 | | | 08/15/18 | | | 434,987 | | |
| | 775 | | | American Tower Corp. | | | 3.50 | | | 01/31/23 | | | 711,062 | | |
| | 175 | | | Ares Capital Corp. | | | 5.75 | | | 02/01/16 | | | 191,844 | | |
| | 825 | | | Banco de Credito del Peru (Peru) (a) | | | 6.125 | (f) | | 04/24/27 | | | 839,437 | | |
| | 1,930 | | | Barclays Bank PLC (United Kingdom) (a) | | | 6.05 | | | 12/04/17 | | | 2,095,856 | | |
| | 800 | | | BBVA Bancomer SA (Mexico) (a) | | | 6.50 | | | 03/10/21 | | | 844,000 | | |
| | 610 | | | Bear Stearns Cos. LLC (The) | | | 5.55 | | | 01/22/17 | | | 668,777 | | |
| | 300 | | | Billion Express Investments Ltd. (China) (e) | | | 0.75 | | | 10/18/15 | | | 303,225 | | |
| | 540 | | | BNP Paribas SA (France) | | | 5.00 | | | 01/15/21 | | | 575,062 | | |
| | 75 | | | Boston Properties LP | | | 3.80 | | | 02/01/24 | | | 73,820 | | |
| | 490 | | | Brookfield Asset Management, Inc. (Canada) | | | 5.80 | | | 04/25/17 | | | 538,897 | | |
| | 936 | | | Capital One Bank, USA NA | | | 3.375 | | | 02/15/23 | | | 886,547 | | |
| | 1,200 | | | Citigroup, Inc. (See Note 6) | | | 8.125 | | | 07/15/39 | | | 1,589,881 | | |
| | 700 | | | CNA Financial Corp. | | | 7.35 | | | 11/15/19 | | | 848,676 | | |
| | 260 | | | Cooperatieve Centrale Raiffeisen-Boerenleenbank BA
(Netherlands) (a) | | | 11.00 | (f) | | 06/30/19(g) | | | 335,525 | | |
| | 415 | | | Credit Suisse (Switzerland) | | | 5.40 | | | 01/14/20 | | | 450,249 | | |
| | 280 | | | Credit Suisse (Switzerland) | | | 6.00 | | | 02/15/18 | | | 314,826 | | |
| | 665 | | | Deutsche Bank AG (Germany) | | | 4.296 | (f) | | 05/24/28 | | | 615,230 | | |
| | 800 | | | Dexus Diversified Trust/Dexus Office Trust (Australia) (a) | | | 5.60 | | | 03/15/21 | | | 859,193 | | |
| | 425 | | | Discover Bank | | | 7.00 | | | 04/15/20 | | | 496,671 | | |
| | 715 | | | Discover Financial Services | | | 3.85 | | | 11/21/22 | | | 672,746 | | |
| | 1,060 | | | Ford Motor Credit Co., LLC | | | 4.207 | | | 04/15/16 | | | 1,108,054 | | |
See Notes to Financial Statements
39
Morgan Stanley Variable Investment Series - Income Plus
Portfolio of Investments n June 30, 2013 (unaudited) continued
PRINCIPAL
AMOUNT
(000) | |
| | COUPON
RATE | | MATURITY
DATE | | VALUE | |
$ | 600 | | | Ford Motor Credit Co., LLC | | | 5.00 | % | | 05/15/18 | | $ | 641,354 | | |
| | 850 | | | Ford Motor Credit Co., LLC | | | 5.875 | | | 08/02/21 | | | 928,214 | | |
| | 1,145 | | | General Electric Capital Corp. | | | 3.15 | | | 09/07/22 | | | 1,084,060 | | |
| | 545 | | | General Electric Capital Corp. | | | 5.30 | | | 02/11/21 | | | 598,793 | | |
| | 595 | | | General Electric Capital Corp., MTN | | | 5.875 | | | 01/14/38 | | | 657,160 | | |
| | 1,650 | | | General Electric Capital Corp., Series G | | | 6.00 | | | 08/07/19 | | | 1,918,028 | | |
| | 620 | | | Genworth Financial, Inc. | | | 7.70 | | | 06/15/20 | | | 712,213 | | |
| | 3,490 | | | Goldman Sachs Group, Inc. (The) | | | 2.375 | | | 01/22/18 | | | 3,430,262 | | |
| | 900 | | | Goldman Sachs Group, Inc. (The) | | | 6.75 | | | 10/01/37 | | | 924,700 | | |
| | 950 | | | Goodman Funding Pty Ltd. (Australia) (a) | | | 6.375 | | | 04/15/21 | | | 1,070,565 | | |
| | 550 | | | Harley-Davidson Funding Corp. (a) | | | 6.80 | | | 06/15/18 | | | 654,729 | | |
| | 600 | | | Hartford Financial Services Group, Inc. | | | 5.50 | | | 03/30/20 | | | 664,515 | | |
| | 1,675 | | | HBOS PLC, Series G (United Kingdom) (a) | | | 6.75 | | | 05/21/18 | | | 1,781,927 | | |
| | 400 | | | Healthcare Trust of America Holdings LP (a) | | | 3.70 | | | 04/15/23 | | | 376,286 | | |
| | 300 | | | Host Hotels & Resorts LP, Series D | | | 3.75 | | | 10/15/23 | | | 275,718 | | |
| | 485 | | | HSBC Finance Corp. | | | 6.676 | | | 01/15/21 | | | 536,993 | | |
| | 440 | | | HSBC Holdings PLC (United Kingdom) | | | 4.00 | | | 03/30/22 | | | 451,310 | | |
| | 705 | | | HSBC Holdings PLC (United Kingdom) | | | 6.50 | | | 05/02/36 | | | 783,978 | | |
| | 575 | | | ING Bank N.V. (Netherlands) (a) | | | 3.75 | | | 03/07/17 | | | 602,335 | | |
| | 375 | | | ING US, Inc. (a) | | | 5.65 | (f) | | 05/15/53 | | | 353,437 | | |
| | 935 | | | Intesa Sanpaolo SpA (Italy) | | | 3.875 | | | 01/16/18 | | | 898,717 | | |
| | 310 | | | Jefferies Finance LLC/JFIN Co-Issuer Corp. (a) | | | 7.375 | | | 04/01/20 | | | 302,250 | | |
| | 1,675 | | | JPMorgan Chase & Co. | | | 3.375 | | | 05/01/23 | | | 1,562,899 | | |
| | 1,745 | | | JPMorgan Chase & Co. | | | 4.50 | | | 01/24/22 | | | 1,830,474 | | |
| | 900 | | | Kerry Group Financial Services (Ireland) (a) | | | 3.20 | | | 04/09/23 | | | 831,658 | | |
| | 550 | | | Kilroy Realty LP | | | 3.80 | | | 01/15/23 | | | 516,211 | | |
| | 275 | | | Lincoln National Corp. | | | 7.00 | | | 06/15/40 | | | 342,950 | | |
| | 705 | | | Macquarie Group Ltd. (Australia) (a) | | | 6.00 | | | 01/14/20 | | | 733,043 | | |
| | 625 | | | Markel Corp. | | | 3.625 | | | 03/30/23 | | | 596,311 | | |
| | 555 | | | Merrill Lynch & Co., Inc. | | | 7.75 | | | 05/14/38 | | | 636,733 | | |
| | 3,625 | | | Merrill Lynch & Co., Inc., MTN | | | 6.875 | | | 04/25/18 | | | 4,176,435 | | |
| | 600 | | | Metlife Capital Trust IV (See Note 6) (a) | | | 7.875 | | | 12/15/37 | | | 717,544 | | |
| | 830 | | | Mizuho Corporate Bank Ltd. (Japan) (a) | | | 1.85 | | | 03/21/18 | | | 806,572 | | |
| | 600 | | | National Retail Properties, Inc. | | | 3.30 | | | 04/15/23 | | | 543,353 | | |
| | 1,315 | | | Nationwide Building Society (United Kingdom) (a) | | | 6.25 | | | 02/25/20 | | | 1,467,928 | | |
| | 775 | | | Nationwide Financial Services, Inc. (a) | | | 5.375 | | | 03/25/21 | | | 846,361 | | |
| | 450 | | | Piedmont Operating Partnership LP (a) | | | 3.40 | | | 06/01/23 | | | 410,631 | | |
| | 370 | | | Platinum Underwriters Finance, Inc., Series B | | | 7.50 | | | 06/01/17 | | | 413,772 | | |
| | 1,035 | | | Post Apartment Homes LP | | | 3.375 | | | 12/01/22 | | | 968,909 | | |
| | 350 | | | Principal Financial Group, Inc. | | | 1.85 | | | 11/15/17 | | | 344,095 | | |
| | 425 | | | Principal Financial Group, Inc. | | | 8.875 | | | 05/15/19 | | | 550,735 | | |
| | 925 | | | Protective Life Corp. | | | 7.375 | | | 10/15/19 | | | 1,122,183 | | |
See Notes to Financial Statements
40
Morgan Stanley Variable Investment Series - Income Plus
Portfolio of Investments n June 30, 2013 (unaudited) continued
PRINCIPAL
AMOUNT
(000) | |
| | COUPON
RATE | | MATURITY
DATE | | VALUE | |
$ | 675 | | | Prudential Financial, Inc. | | | 5.625 | (f)% | | 06/15/43 | | $ | 663,187 | | |
| | 135 | | | Prudential Financial, Inc., MTN | | | 6.625 | | | 12/01/37 | | | 160,747 | | |
| | 775 | | | QBE Capital Funding III Ltd. (Australia) (a) | | | 7.25 | (f) | | 05/24/41 | | | 819,631 | | |
| | 575 | | | Realty Income Corp. | | | 3.25 | | | 10/15/22 | | | 526,955 | | |
| | 610 | | | Royal Bank of Scotland Group PLC (United Kingdom) | | | 6.125 | | | 12/15/22 | | | 582,497 | | |
| | 195 | | | Santander Holdings USA, Inc. | | | 3.00 | | | 09/24/15 | | | 200,047 | | |
| | 360 | | | Santander Holdings USA, Inc. (Spain) | | | 4.625 | | | 04/19/16 | | | 380,020 | | |
| | 700 | | | Santander US Debt SAU (Spain) (a) | | | 3.724 | | | 01/20/15 | | | 706,816 | | |
| | 495 | | | SLM Corp., MTN | | | 8.00 | | | 03/25/20 | | | 537,694 | | |
| | 775 | | | Societe Generale SA (France) (a) | | | 5.20 | | | 04/15/21 | | | 819,533 | | |
| | 510 | | | Standard Chartered PLC (United Kingdom) (a) | | | 3.95 | | | 01/11/23 | | | 475,349 | | |
| | 610 | | | Turkiye Is Bankasi (Turkey) (a) | | | 3.75 | | | 10/10/18 | | | 574,925 | | |
| | 250 | | | Wachovia Bank NA | | | 6.60 | | | 01/15/38 | | | 306,500 | | |
| | 575 | | | Weingarten Realty Investors | | | 3.375 | | | 10/15/22 | | | 528,262 | | |
| | | | | | 67,556,452 | | |
| | | Industrials (7.9%) | |
| | 675 | | | Agilent Technologies, Inc. | | | 3.875 | | | 07/15/23 | | | 653,223 | | |
| | 522 | | | Anixter, Inc. | | | 5.625 | | | 05/01/19 | | | 542,880 | | |
| | 685 | | | Ball Corp. | | | 4.00 | | | 11/15/23 | | | 636,194 | | |
| | 500 | | | Bemis Co., Inc. | | | 4.50 | | | 10/15/21 | | | 513,798 | | |
| | 505 | | | Bombardier, Inc. (Canada) (a) | | | 7.75 | | | 03/15/20 | | | 563,075 | | |
| | 1,000 | | | Burlington Northern Santa Fe LLC | | | 3.05 | | | 03/15/22 | | | 975,036 | | |
| | 480 | | | CRH America, Inc. | | | 8.125 | | | 07/15/18 | | | 584,657 | | |
| | 255 | | | Deere & Co. | | | 3.90 | | | 06/09/42 | | | 232,606 | | |
| | 675 | | | Eaton Corp. (a) | | | 2.75 | | | 11/02/22 | | | 632,757 | | |
| | 248 | | | General Cable Corp. | | | 4.50 | | | 11/15/29 | | | 274,350 | | |
| | 1,060 | | | Heathrow Funding Ltd. (United Kingdom) (a) | | | 4.875 | | | 07/15/21 | | | 1,133,706 | | |
| | 545 | | | Holcim US Finance Sarl & Cie SCS (Switzerland) (a) | | | 6.00 | | | 12/30/19 | | | 609,357 | | |
| | 460 | | | Ingersoll-Rand Global Holding Co., Ltd. (Bermuda) (a) | | | 4.25 | | | 06/15/23 | | | 458,031 | | |
| | 950 | | | Koninklijke Philips N.V. (Netherlands) | | | 3.75 | | | 03/15/22 | | | 954,647 | | |
| | 915 | | | L-3 Communications Corp. | | | 4.95 | | | 02/15/21 | | | 967,656 | | |
| | 445 | | | Lafarge SA (France) (a) | | | 6.20 | | | 07/09/15 | | | 476,150 | | |
| | 510 | | | MasTec, Inc. | | | 4.875 | | | 03/15/23 | | | 485,775 | | |
| | 900 | | | Schneider Electric SA (France) (a) | | | 2.95 | | | 09/27/22 | | | 857,553 | | |
| | 135 | | | Sonoco Products Co. | | | 4.375 | | | 11/01/21 | | | 138,434 | | |
| | 269 | | | Trinity Industries, Inc. | | | 3.875 | | | 06/01/36 | | | 316,748 | | |
| | 525 | | | United Technologies Corp. | | | 4.50 | | | 06/01/42 | | | 519,779 | | |
| | 525 | | | Waste Management, Inc. | | | 2.90 | | | 09/15/22 | | | 483,447 | | |
| | | | | | 13,009,859 | | |
See Notes to Financial Statements
41
Morgan Stanley Variable Investment Series - Income Plus
Portfolio of Investments n June 30, 2013 (unaudited) continued
PRINCIPAL
AMOUNT
(000) | |
| | COUPON
RATE | | MATURITY
DATE | | VALUE | |
| | | Technology (2.5%) | |
$ | 245 | | | CACI International, Inc. | | | 2.125 | % | | 05/01/14 | | $ | 294,000 | | |
| | 235 | | | Hewlett-Packard Co. | | | 2.60 | | | 09/15/17 | | | 234,924 | | |
| | 495 | | | Hewlett-Packard Co. | | | 4.65 | | | 12/09/21 | | | 495,901 | | |
| | 775 | | | Intel Corp. | | | 2.70 | | | 12/15/22 | | | 725,278 | | |
| | 234 | | | Intel Corp. | | | 2.95 | | | 12/15/35 | | | 255,206 | | |
| | 255 | | | Lam Research Corp. | | | 1.25 | | | 05/15/18 | | | 284,166 | | |
| | 400 | | | NetApp, Inc. | | | 2.00 | | | 12/15/17 | | | 390,012 | | |
| | 264 | | | Nuance Communications, Inc. | | | 2.75 | | | 11/01/31 | | | 273,240 | | |
| | 438 | | | Salesforce.com, Inc. (a) | | | 0.25 | | | 04/01/18 | | | 417,469 | | |
| | 276 | | | SanDisk Corp. | | | 1.50 | | | 08/15/17 | | | 369,323 | | |
| | 355 | | | Take-Two Interactive Software, Inc. | | | 1.75 | | | 12/01/16 | | | 391,609 | | |
| | | | | | 4,131,128 | | |
| | | Utilities (5.5%) | |
| | 775 | | | Boston Gas Co. (a) | | | 4.487 | | | 02/15/42 | | | 747,714 | | |
| | 530 | | | CEZ AS (Czech Republic) (a) | | | 4.25 | | | 04/03/22 | | | 528,569 | | |
| | 495 | | | CMS Energy Corp. | | | 5.05 | | | 03/15/22 | | | 535,746 | | |
| | 280 | | | CMS Energy Corp. | | | 6.25 | | | 02/01/20 | | | 325,718 | | |
| | 730 | | | Consolidated Edison Co. of New York, Inc. | | | 6.65 | | | 04/01/19 | | | 892,114 | | |
| | 750 | | | EDP Finance BV (Portugal) (a) | | | 4.90 | | | 10/01/19 | | | 740,625 | | |
| | 675 | | | Enel Finance International N.V. (Italy) (a) | | | 5.125 | | | 10/07/19 | | | 701,945 | | |
| | 1,400 | | | Exelon Generation Co., LLC | | | 4.00 | | | 10/01/20 | | | 1,422,561 | | |
| | 575 | | | Iberdrola Finance Ireland Ltd. (Spain) (a) | | | 5.00 | | | 09/11/19 | | | 605,475 | | |
| | 900 | | | PPL WEM Holdings PLC (a) | | | 3.90 | | | 05/01/16 | | | 941,216 | | |
| | 590 | | | Puget Energy, Inc. | | | 6.50 | | | 12/15/20 | | | 661,792 | | |
| | 870 | | | TransAlta Corp. (Canada) | | | 4.50 | | | 11/15/22 | | | 831,259 | | |
| | | | | | 8,934,734 | | |
| | | Total Corporate Bonds
(Cost $153,247,038) | | | 156,550,810 | | |
| | | Asset-Backed Securities (0.8%) | |
| | | CVS Pass-Through Trust | |
| | 974 | | | | | | 6.036 | | | 12/10/28 | | | 1,101,152 | | |
| | 111 | | | (a) | | | 8.353 | | | 07/10/31 | | | 142,677 | | |
| | | Total Asset-Backed Securities
(Cost $1,085,203) | | | 1,243,829 | | |
| | | Agency Fixed Rate Mortgage (0.0%) | |
| | 1 | | | Federal Home Loan Mortgage Corporation,
Gold Pool
(Cost $1,370) | | | 6.50 | | | 12/01/28 | | | 1,515 | | |
See Notes to Financial Statements
42
Morgan Stanley Variable Investment Series - Income Plus
Portfolio of Investments n June 30, 2013 (unaudited) continued
NUMBER OF
SHARES | |
| | VALUE | |
| | | Convertible Preferred Stocks (0.8%) | |
| | | Automobiles (0.1%) | |
| | 4,208 | | | General Motors Co., Series B | | | | | | | | | | $ | 202,657 | | |
| | | Diversified Financial Services (0.2%) | |
| | 306 | | | Bank of America Corp., Series L | | | | | | | | | | | 339,813 | | |
| | | Electric Utilities (0.3%) | |
| | 4,950 | | | NextEra Energy, Inc. | | | | | | | | | | | 300,712 | | |
| | 4,350 | | | PPL Corp. | | | | | | | | | | | 234,987 | | |
| | | | 535,699 | | |
| | | Oil, Gas & Consumable Fuels (0.2%) | |
| | 5,855 | | | Apache Corp., Series D | | | | | | | | | | | 279,518 | | |
| | | | | Total Convertible Preferred Stocks
(Cost $1,272,176) | | | | | | | 1,357,687 | | |
PRINCIPAL
AMOUNT
(000) | |
| | COUPON
RATE | | MATURITY
DATE | |
| |
| | | Short-Term Investments (1.0%) | |
| | | U.S. Treasury Securities (0.4%) | |
| | | U.S. Treasury Bills | |
$ | 300 | | | (h)(i) | | | 0.037 | % | | 08/08/13 | | | 299,988 | | |
| | 350 | | | (h)(i) | | | 0.121 | | | 08/08/13 | | | 349,953 | | |
| | | Total U.S. Treasury Securities
(Cost $649,945) | | | 649,941 | | |
NUMBER OF
SHARES (000) | |
| |
| |
| |
| |
| | | Investment Company (0.6%) | |
| | 1,002 | | | Morgan Stanley Institutional Liquidity Funds - Money Market
Portfolio - Institutional Class (See Note 6)
(Cost $1,002,163) | | | 1,002,163 | | |
| | | Total Short-Term Investments
(Cost $1,652,108) | | | 1,652,104 | | |
| | | | | Total Investments
(Cost $157,257,895) (j) | | | | | 98.3 | % | | | 160,805,945 | | |
| | | | | Other Assets in Excess of Liabilities | | | | | 1.7 | | | | 2,799,896 | | |
| | | | | Net Assets | | | | | 100.0 | % | | $ | 163,605,841 | | |
See Notes to Financial Statements
43
Morgan Stanley Variable Investment Series - Income Plus
Portfolio of Investments n June 30, 2013 (unaudited) continued
MTN Medium Term Note.
PJSC Public Joint Stock Company.
(a) 144A security — Certain conditions for public sale may exist. Unless otherwise noted, these securities are deemed to be liquid.
(b) When-issued security.
(c) Issuer in bankruptcy.
(d) Non-income producing security; bond in default.
(e) Security trades on the Hong Kong exchange.
(f) Variable/Floating Rate Security — Interest rate changes on these instruments are based on changes in a designated base rate. The rates shown are those in effect on June 30, 2013.
(g) Perpetual — Security does not have a predetermined maturity date. Rate for this security is fixed for a period of time then reverts to a floating rate. The interest shown is the rate in effect at June 30, 2013.
(h) Rate shown is the yield to maturity at June 30, 2013.
(i) All or a portion of this security has been physically segregated in connection with open futures contracts.
(j) Securities are available for collateral in connection with purchase of when-issued securities, open foreign currency forward exchange contracts, futures contracts and swap agreements.
FOREIGN CURRENCY FORWARD EXCHANGE CONTRACTS OPEN AT JUNE 30, 2013:
COUNTERPARTY | | CONTRACTS
TO DELIVER | | IN EXCHANGE
FOR | | DELIVERY
DATE | | UNREALIZED
APPRECIATION
(DEPRECIATION) | |
Wells Fargo Bank | | $ | 515,893 | | | EUR | 396,597 | | | 07/05/13 | | $ | 343 | | |
HSBC Bank PLC | | EUR | 396,597 | | | $ | 514,403 | | | 07/05/13 | | | (1,833 | ) | |
Wells Fargo Bank | | EUR | 396,597 | | | $ | 515,959 | | | 08/07/13 | | | (347 | ) | |
Net Unrealized Depreciation | | $ | (1,837 | ) | |
See Notes to Financial Statements
44
Morgan Stanley Variable Investment Series - Income Plus
Portfolio of Investments n June 30, 2013 (unaudited) continued
FUTURES CONTRACTS OPEN AT JUNE 30, 2013:
NUMBER OF
CONTRACTS | | LONG/SHORT | | DESCRIPTION, DELIVERY
MONTH AND YEAR | | UNDERLYING FACE
AMOUNT AT VALUE | | UNREALIZED
APPRECIATION
(DEPRECIATION) | |
| | 164 | | | Long | | U.S. Treasury 2 yr. Note,
Sep-13 | | $ | 36,080,000 | | | $ | (28,344 | ) | |
| | 147 | | | Long | | U.S. Treasury Ultra Long Bond,
Sep-13 | | | 21,654,938 | | | | (829,172 | ) | |
| | 10 | | | Short | | U.S. Treasury Long Bond,
Sep-13 | | | (1,358,437 | ) | | | (9,739 | ) | |
| | 24 | | | Short | | U.S. Treasury 5 yr. Note,
Sep-13 | | | (2,905,125 | ) | | | 29,625 | | |
| | 205 | | | Short | | U.S. Treasury 10 yr. Note,
Sep-13 | | | (25,945,313 | ) | | | 403,027 | | |
Net Unrealized Depreciation | | $ | (434,603 | ) | |
CREDIT DEFAULT SWAP AGREEMENTS OPEN AT JUNE 30, 2013:
SWAP
COUNTERPARTY &
REFERENCE
OBLIGATION | | BUY/SELL
PROTECTION | | NOTIONAL
AMOUNT
(000) | | INTEREST
RATE | | TERMINATION
DATE | | UNREALIZED
APPRECIATION
(DEPRECIATION) | | UPFRONT
PAYMENTS | | VALUE | | CREDIT
RATING OF
REFERENCE
OBLIGATION† | |
Barclays Bank
Alcoa, Inc. | | Buy | | $ | 850 | | | | 1.00 | % | | 9/20/18 | | $ | (2,988 | ) | | $ | 88,874 | | | $ | 85,886 | | | BBB- | |
JPMorgan Chase
CDX.NA.IG.20 | | Sell | | | 385 | | | | 1.00 | | | 6/20/18 | | | (2,054 | ) | | | 4,515 | | | | 2,461 | | | NR | |
JPMorgan Chase
CDX.NA.IG.20 | | Sell | | | 1,700 | | | | 1.00 | | | 6/20/18 | | | 1,479 | | | | 9,390 | | | | 10,869 | | | NR | |
JPMorgan Chase
Kohl's Corporation | | Buy | | | 950 | | | | 1.00 | | | 6/20/18 | | | (38,867 | ) | | | 53,992 | | | | 15,125 | | | BBB+ | |
Total Credit
Default Swaps | | | | $ | 3,885 | | | | | | | $ | (42,430 | ) | | $ | 156,771 | | | $ | 114,341 | | | | |
See Notes to Financial Statements
45
Morgan Stanley Variable Investment Series - Income Plus
Portfolio of Investments n June 30, 2013 (unaudited) continued
INTEREST RATE SWAP AGREEMENTS OPEN AT JUNE 30, 2013:
SWAP COUNTERPARTY | | NOTIONAL
AMOUNT
(000) | | FLOATING
RATE INDEX | | PAY/RECEIVE
FLOATING RATE | | FIXED RATE | | TERMINATION
DATE | | UNREALIZED
APPRECIATION
(DEPRECIATION) | |
Bank of America | | $ | 2,000 | | | 3 Month LIBOR | | Receive | | | 2.04 | % | | 02/13/23 | | $ | 89,850 | | |
Deutsche Bank | | | 2,185 | | | 3 Month LIBOR | | Receive | | | 2.80 | | | 05/01/43 | | | 267,639 | | |
Deutsche Bank | | | 6,510 | | | 3 Month LIBOR | | Receive | | | 3.03 | | | 05/14/43 | | | 511,877 | | |
Goldman Sachs | | | 2,200 | | | 3 Month LIBOR | | Receive | | | 2.42 | | | 03/22/22 | | | (3,855 | ) | |
JPMorgan Chase | | | 1,069 | | | 3 Month LIBOR | | Receive | | | 2.43 | | | 03/22/22 | | | (3,261 | ) | |
JPMorgan Chase | | | 3,960 | | | 3 Month LIBOR | | Receive | | | 2.09 | | | 02/15/23 | | | 159,954 | | |
Royal Bank of Canada | | | 2,000 | | | 3 Month LIBOR | | Receive | | | 2.06 | | | 02/06/23 | | | 85,242 | | |
Net Unrealized Appreciation | | | | $1,107,446 | |
LIBOR London Interbank Offered Rate.
NR Not Rated.
† Credit rating as issued by Standard & Poor's.
Currency Abbreviations:
EUR Euro.
LONG TERM CREDIT ANALYSIS+ | |
AA | | | 4.3 | % | |
A | | | 31.7 | | |
BBB | | | 50.3 | | |
BB | | | 8.7 | | |
B or Below | | | 2.1 | | |
Not Rated | | | 2.9 | | |
| | | | 100.0 | %++ | |
+ The ratings shown are based on the Portfolio's security ratings as determined by Standard & Poor's, Moody's or Fitch, each a Nationally Recognized Statistical Ratings Organization ("NRSRO").
++ Does not include open long/short futures contracts with an underlying face amount of $87,943,813 with net unrealized depreciation of $434,603. Does not include open foreign currency forward exchange contracts with net unrealized depreciation of $1,837. Also does not include open swap agreements with net unrealized appreciation of $1,065,016.
See Notes to Financial Statements
46
Morgan Stanley Variable Investment Series - Global Infrastructure
Portfolio of Investments n June 30, 2013 (unaudited)
NUMBER OF
SHARES | |
| | VALUE | |
| | | Common Stocks (98.9%)
Australia (4.1%) | |
| | | Airports | |
| | 43,546 | | | Sydney Airport | | $ | 134,608 | | |
| | | Diversified | |
| | 221,026 | | | DUET Group (a) | | | 406,300 | | |
| | | Oil & Gas Storage &
Transportation | |
| | 90,223 | | | APA Group (a) | | | 494,256 | | |
| | | Toll Roads | |
| | 75,579 | | | Macquarie Atlas Roads
Group | | | 134,094 | | |
| | 257,687 | | | Transurban Group (a) | | | 1,593,113 | | |
| | | | 1,727,207 | | |
| | | Transmission & Distribution | |
| | 67,443 | | | Spark Infrastructure
Group (a) | | | 107,015 | | |
| | | | | Total Australia | | | 2,869,386 | | |
| | | Austria (0.5%) | |
| | | Airports | |
| | 6,832 | | | Flughafen Wien AG | | | 390,575 | | |
| | | Brazil (1.2%) | |
| | | Water | |
| | 79,000 | | | Cia de Saneamento Basico
do Estado de Sao Paulo
ADR | | | 822,390 | | |
| | | Canada (12.3%) | |
| | | Oil & Gas Storage &
Transportation | |
| | 76,840 | | | Enbridge, Inc. | | | 3,230,100 | | |
| | 125,580 | | | TransCanada Corp. (a) | | | 5,406,735 | | |
| | | | | Total Canada | | | 8,636,835 | | |
| | | China (6.3%) | |
| | | Oil & Gas Storage &
Transportation | |
| | 350,500 | | | Beijing Enterprises
Holdings Ltd. (b) | | | 2,523,891 | | |
| | 369,000 | | | China Gas Holdings
Ltd. (b) | | | 377,276 | | |
NUMBER OF
SHARES | |
| | VALUE | |
| | 56,000 | | | ENN Energy Holdings
Ltd. (b) | | $ | 298,554 | | |
| | | | 3,199,721 | | |
| | | Ports | |
| | 154,293 | | | China Merchants Holdings
International Co., Ltd. (b) | | | 480,422 | | |
| | | Toll Roads | |
| | 408,000 | | | Jiangsu Expressway Co.,
Ltd., H Shares (b) | | | 420,833 | | |
| | 1,210,300 | | | Sichuan Expressway Co.,
Ltd., H Shares (b) | | | 324,575 | | |
| | | | 745,408 | | |
| | | | | Total China | | | 4,425,551 | | |
| | | France (2.6%) | |
| | | Communications | |
| | 19,630 | | | Eutelsat
Communications SA | | | 557,275 | | |
| | 45,575 | | | SES SA | | | 1,305,099 | | |
| | | | | Total France | | | 1,862,374 | | |
| | | Germany (1.7%) | |
| | | Airports | |
| | 19,865 | | | Fraport AG Frankfurt Airport
Services Worldwide | | | 1,201,846 | | |
| | | Italy (5.9%) | |
| | | Oil & Gas Storage &
Transportation | |
| | 428,036 | | | Snam SpA | | | 1,950,035 | | |
| | | Toll Roads | |
| | 52,512 | | | Atlantia SpA (a) | | | 856,453 | | |
| | 53,155 | | | Societa Iniziative
Autostradali e
Servizi SpA | | | 434,854 | | |
| | | | 1,291,307 | | |
| | | Transmission & Distribution | |
| | 210,360 | | | Terna Rete Elettrica
Nazionale SpA (a) | | | 874,018 | | |
| | | | | Total Italy | | | 4,115,360 | | |
See Notes to Financial Statements
47
Morgan Stanley Variable Investment Series - Global Infrastructure
Portfolio of Investments n June 30, 2013 (unaudited) continued
NUMBER OF
SHARES | |
| | VALUE | |
| | | Japan (1.4%) | |
| | | Oil & Gas Storage &
Transportation | |
| | 174,000 | | | Tokyo Gas Co., Ltd. | | $ | 961,404 | | |
| | | Luxembourg (0.6%) | |
| | | Communications | |
| | 20,600 | | | Intelsat SA (c) | | | 412,000 | | |
| | | Netherlands (1.4%) | |
| | | Oil & Gas Storage &
Transportation | |
| | 16,686 | | | Koninklijke Vopak N.V. | | | 984,428 | | |
| | | Spain (1.3%) | |
| | | Diversified | |
| | 24,553 | | | Ferrovial SA | | | 392,461 | | |
| | | Toll Roads | |
| | 28,113 | | | Abertis Infraestructuras SA | | | 490,350 | | |
| | | | | Total Spain | | | 882,811 | | |
| | | Switzerland (1.3%) | |
| | | Airports | |
| | 1,854 | | | Flughafen Zuerich AG
(Registered) | | | 931,367 | | |
| | | United Kingdom (8.3%) | |
| | | Transmission & Distribution | |
| | 378,670 | | | National Grid PLC | | | 4,296,497 | | |
| | | Water | |
| | 10,820 | | | Pennon Group PLC | | | 106,064 | | |
| | 42,100 | | | Severn Trent PLC | | | 1,065,492 | | |
| | 33,130 | | | United Utilities Group PLC | | | 344,661 | | |
| | | | 1,516,217 | | |
| | | | | Total United Kingdom | | | 5,812,714 | | |
| | | United States (50.0%) | |
| | | Communications | |
| | 45,680 | | | American Tower Corp. REIT | | | 3,342,405 | | |
| | 28,220 | | | Crown Castle International
Corp. (c) | | | 2,042,846 | | |
NUMBER OF
SHARES | |
| | VALUE | |
| | 42,400 | | | SBA Communications Corp.,
Class A (c) | | $ | 3,142,688 | | |
| | | | 8,527,939 | | |
| | | Diversified | |
| | 95,960 | | | CenterPoint Energy, Inc. | | | 2,254,100 | | |
| | | Oil & Gas Storage &
Transportation | |
| | 5,840 | | | Atmos Energy Corp. | | | 239,790 | | |
| | 35,660 | | | Cheniere Energy, Inc. (c) | | | 989,922 | | |
| | 55,865 | | | Enbridge Energy
Management LLC (c) | | | 1,691,592 | | |
| | 76,050 | | | Kinder Morgan, Inc. | | | 2,901,307 | | |
| | 38,940 | | | NiSource, Inc. | | | 1,115,242 | | |
| | 45,280 | | | Oneok, Inc. | | | 1,870,517 | | |
| | 46,850 | | | PG&E Corp. | | | 2,142,451 | | |
| | 36,030 | | | Sempra Energy | | | 2,945,813 | | |
| | 70,696 | | | Spectra Energy Corp. | | | 2,436,184 | | |
| | 74,630 | | | Williams Cos., Inc. (The) | | | 2,423,236 | | |
| | | | 18,756,054 | | |
| | | Transmission & Distribution | |
| | 25,810 | | | ITC Holdings Corp. | | | 2,356,453 | | |
| | 44,978 | | | Northeast Utilities | | | 1,889,976 | | |
| | | | 4,246,429 | | |
| | | Water | |
| | 26,380 | | | American Water Works
Co., Inc. | | | 1,087,647 | | |
| | 8,490 | | | California Water Service
Group | | | 165,640 | | |
| | | | 1,253,287 | | |
| | | | | Total United States | | | 35,037,809 | | |
| | | | | Total Common Stocks
(Cost $53,541,865) | | | 69,346,850 | | |
See Notes to Financial Statements
48
Morgan Stanley Variable Investment Series - Global Infrastructure
Portfolio of Investments n June 30, 2013 (unaudited) continued
NUMBER OF
SHARES (000) | |
| | VALUE | |
| | | Short-Term Investments (5.8%)
Securities held as Collateral
on Loaned Securities (5.5%) | |
| | | Investment Company (4.9%) | |
| | 3,473 | | | Morgan Stanley Institutional
Liquidity Funds - Money
Market Portfolio -
Institutional Class
(See Note 6)
(Cost $3,472,839) | | $ | 3,472,839 | | |
PRINCIPAL
AMOUNT
(000) | |
| |
| |
| | | Repurchase Agreements (0.6%) | |
$ | 276 | | | HSBC Securities USA, Inc.
(0.15%, dated 06/28/13,
due 07/01/13; proceeds
$276,214; fully
collateralized by U.S.
Government Agencies;
Federal National Mortgage
Association 3.50% - 5.00%
due 12/01/26 - 05/01/38;
valued at $281,739) | | | 276,210 | | |
| | 153 | | | Merrill Lynch & Co., Inc.
(0.18%, dated 06/28/13,
due 07/01/13; proceeds
$153,453; fully
collateralized by Common
Stocks; a Convertible
Preferred Stock; and
Exchange Traded Funds;
valued at $168,117) | | | 153,450 | | |
| | | | | Total Repurchase
Agreements
(Cost $429,660) | | | 429,660 | | |
| | | | | Total Securities held as
Collateral on Loaned
Securities
(Cost $3,902,499) | | | 3,902,499 | | |
NUMBER OF
SHARES (000) | |
| | VALUE | |
| | | Investment Company (0.3%) | | | |
| | 199 | | | Morgan Stanley Institutional
Liquidity Funds - Treasury
Portfolio - Institutional
Class (See Note 6)
(Cost $198,967) | | $ | 198,967 | | |
| | | Total Short-Term
Investments
(Cost $4,101,466) | | | 4,101,466 | | |
Total Investments
(Cost $57,643,331) | | | 104.7 | % | | | 73,448,316 | | |
Liabilities in Excess of
Other Assets | | | (4.7 | ) | | | (3,315,999 | ) | |
Net Assets | | | 100.0 | % | | $ | 70,132,317 | | |
ADR American Depositary Receipt.
REIT Real Estate Investment Trust.
(a) All or a portion of this security was on loan at June 30, 2013.
(b) Security trades on the Hong Kong exchange.
(c) Non-income producing security.
SUMMARY OF INVESTMENTS
INDUSTRY | | VALUE | | PERCENT OF
TOTAL
INVESTMENTS | |
Oil & Gas Storage &
Transportation | | $ | 34,982,733 | | | | 50.3 | % | |
Communications | | | 10,802,313 | | | | 15.5 | | |
Transmission &
Distribution | | | 9,523,959 | | | | 13.7 | | |
Toll Roads | | | 4,254,272 | | | | 6.1 | | |
Water | | | 3,591,894 | | | | 5.2 | | |
Diversified | | | 3,052,861 | | | | 4.4 | | |
Airports | | | 2,658,396 | | | | 3.8 | | |
Ports | | | 480,422 | | | | 0.7 | | |
Investment Company | | | 198,967 | | | | 0.3 | | |
| | $ | 69,545,817 | * | | | 100.0 | % | |
* Does not include the value of securities held as collateral on loaned securities.
See Notes to Financial Statements
49
Morgan Stanley Variable Investment Series - European Equity
Portfolio of Investments n June 30, 2013 (unaudited)
NUMBER OF
SHARES | |
| | VALUE | |
| | | Common Stocks (97.6%)
Belgium (1.5%) | |
| | | Chemicals | |
| | 17,897 | | | Umicore SA | | $ | 743,829 | | |
| | | Finland (1.7%) | |
| | | Machinery | |
| | 10,227 | | | Kone Oyj, Class B (a) | | | 812,696 | | |
| | | France (14.2%) | |
| | | Commercial Banks | |
| | 23,227 | | | BNP Paribas SA | | | 1,269,047 | | |
| | 90,453 | | | Credit Agricole SA (b) | | | 777,425 | | |
| | 25,004 | | | Societe Generale SA | | | 859,226 | | |
| | | | 2,905,698 | | |
| | | Electrical Equipment | |
| | 17,143 | | | Schneider Electric SA | | | 1,243,569 | | |
| | | Hotels, Restaurants & Leisure | |
| | 22,674 | | | Accor SA | | | 797,900 | | |
| | | Insurance | |
| | 63,513 | | | AXA SA | | | 1,247,929 | | |
| | | Media | |
| | 29,871 | | | SES SA | | | 855,395 | | |
| | | | | Total France | | | 7,050,491 | | |
| | | Germany (14.3%) | |
| | | Automobiles | |
| | 21,706 | | | Daimler AG (Registered) | | | 1,313,368 | | |
| | 5,356 | | | Volkswagen AG (Preference) | | | 1,084,438 | | |
| | | | 2,397,806 | | |
| | | Health Care Providers &
Services | |
| | 6,634 | | | Fresenius SE & Co., KGaA | | | 817,834 | | |
| | | Industrial Conglomerates | |
| | 13,800 | | | Siemens AG (Registered) | | | 1,394,809 | | |
| | | Insurance | |
| | 5,201 | | | Muenchener
Rueckversicherungs AG
(Registered) | | | 957,261 | | |
| | | Pharmaceuticals | |
| | 14,370 | | | Bayer AG (Registered) | | | 1,532,476 | | |
| | | | | Total Germany | | | 7,100,186 | | |
NUMBER OF
SHARES | |
| | VALUE | |
| | | Netherlands (2.1%) | |
| | | Media | |
| | 61,147 | | | Reed Elsevier N.V. | | $ | 1,018,777 | | |
| | | Portugal (1.3%) | |
| | | Oil, Gas & Consumable Fuels | |
| | 44,610 | | | Galp Energia SGPS SA | | | 660,507 | | |
| | | Spain (4.2%) | |
| | | Commercial Banks | |
| | 120,491 | | | Banco Bilbao Vizcaya
Argentaria SA | | | 1,010,815 | | |
| | | Information Technology
Services | |
| | 33,803 | | | Amadeus IT Holding SA,
Class A (a) | | | 1,080,411 | | |
| | | | | Total Spain | | | 2,091,226 | | |
| | | Sweden (3.0%) | |
| | | Household Products | |
| | 34,018 | | | Svenska Cellulosa AB,
Class B | | | 853,735 | | |
| | | Wireless Telecommunication
Services | |
| | 8,972 | | | Millicom International
Cellular SA SDR | | | 646,333 | | |
| | | | | Total Sweden | | | 1,500,068 | | |
| | | Switzerland (15.5%) | |
| | | Food Products | |
| | 36,035 | | | Nestle SA (Registered) | | | 2,363,420 | | |
| | | Insurance | |
| | 4,367 | | | Zurich Insurance
Group AG (b) | | | 1,132,725 | | |
| | | Pharmaceuticals | |
| | 28,751 | | | Novartis AG (Registered) | | | 2,042,446 | | |
| | 8,486 | | | Roche Holding AG
(Genusschein) | | | 2,111,280 | | |
| | | | 4,153,726 | | |
| | | | | Total Switzerland | | | 7,649,871 | | |
See Notes to Financial Statements
50
Morgan Stanley Variable Investment Series - European Equity
Portfolio of Investments n June 30, 2013 (unaudited) continued
NUMBER OF
SHARES | |
| | VALUE | |
| | | United Kingdom (39.8%) | |
| | | Aerospace & Defense | |
| | 65,252 | | | Rolls-Royce Holdings PLC (b) | | $ | 1,125,438 | | |
| | | Commercial Banks | |
| | 266,347 | | | Barclays PLC | | | 1,128,002 | | |
| | 195,425 | | | HSBC Holdings PLC | | | 2,027,119 | | |
| | | | 3,155,121 | | |
| | | Household Products | |
| | 17,611 | | | Reckitt Benckiser
Group PLC | | | 1,244,987 | | |
| | | Insurance | |
| | 72,320 | | | Prudential PLC | | | 1,182,447 | | |
| | | Metals & Mining | |
| | 208,875 | | | Glencore Xstrata PLC | | | 864,589 | | |
| | | Oil, Gas & Consumable Fuels | |
| | 65,743 | | | BG Group PLC | | | 1,118,408 | | |
| | 244,406 | | | BP PLC | | | 1,692,297 | | |
| | 49,224 | | | Royal Dutch Shell PLC,
Class A | | | 1,572,212 | | |
| | 53,328 | | | Tullow Oil PLC | | | 811,903 | | |
| | | | 5,194,820 | | |
| | | Pharmaceuticals | |
| | 64,662 | | | GlaxoSmithKline PLC | | | 1,620,769 | | |
| | | Professional Services | |
| | 58,276 | | | Experian PLC | | | 1,013,097 | | |
| | | Tobacco | |
| | 28,097 | | | British American
Tobacco PLC | | | 1,439,072 | | |
| | 32,814 | | | Imperial Tobacco Group PLC | | | 1,137,912 | | |
| | | | 2,576,984 | | |
| | | Wireless Telecommunication
Services | |
| | 609,705 | | | Vodafone Group PLC | | | 1,741,991 | | |
| | | | | Total United Kingdom | | | 19,720,243 | | |
| | | | | Total Common Stocks
(Cost $36,924,470) | | | 48,347,894 | | |
NUMBER OF
SHARES | |
| | VALUE | |
| | | Short-Term Investments (3.7%)
Securities held as Collateral
on Loaned Securities (1.6%) | |
| | | Investment Company (1.3%) | |
| | 632 | | | Morgan Stanley Institutional
Liquidity Funds - Money
Market Portfolio -
Institutional Class
(See Note 6)
(Cost $631,601) | | $ | 631,601 | | |
PRINCIPAL
AMOUNT
(000) | |
| |
| |
| | | Repurchase Agreements (0.3%) | |
$ | 110 | | | Barclays Capital, Inc.
(0.10%, dated 06/28/13,
due 07/01/13; proceeds
$109,818; fully
collateralized by a U.S.
Government Obligation;
U.S. Treasury Note 0.63%
due 05/31/17; valued at
$112,015) | | | 109,818 | | |
| | 42 | | | Merrill Lynch & Co., Inc.
(0.18%, dated 06/28/13,
due 07/01/13; proceeds
$42,238; fully collateralized
by Common Stocks and
Exchange Traded Funds;
valued at $46,275) | | | 42,238 | | |
| | | | | Total Repurchase
Agreements
(Cost $152,056) | | | 152,056 | | |
| | | | | Total Securities held as
Collateral on Loaned
Securities
(Cost $783,657) | | | 783,657 | | |
See Notes to Financial Statements
51
Morgan Stanley Variable Investment Series - European Equity
Portfolio of Investments n June 30, 2013 (unaudited) continued
NUMBER OF
SHARES (000) | |
| | VALUE | |
| | | Investment Company (2.1%) | | | |
| | 1,050 | | | Morgan Stanley Institutional
Liquidity Funds - Money
Market Portfolio -
Institutional Class
(See Note 6)
(Cost $1,049,904) | | $ | 1,049,904 | | |
| | | Total Short-Term
Investments
(Cost $1,833,561) | | | 1,833,561 | | |
Total Investments
(Cost $38,758,031) | | | 101.3 | % | | | 50,181,455 | | |
Liabilities in Excess of
Other Assets | | | (1.3 | ) | | | (644,821 | ) | |
Net Assets | | | 100.0 | % | | $ | 49,536,634 | | |
SDR Swedish Depositary Receipt.
(a) All or a portion of this security was on loan at June 30, 2013.
(b) Non-income producing security.
SUMMARY OF INVESTMENTS
INDUSTRY | | VALUE | | PERCENT OF
TOTAL
INVESTMENTS | |
Pharmaceuticals | | $ | 7,306,971 | | | | 14.8 | % | |
Commercial Banks | | | 7,071,634 | | | | 14.3 | | |
Oil, Gas & Consumable
Fuels | | | 5,855,327 | | | | 11.9 | | |
Insurance | | | 4,520,362 | | | | 9.2 | | |
Tobacco | | | 2,576,984 | | | | 5.2 | | |
Automobiles | | | 2,397,806 | | | | 4.9 | | |
Wireless Telecommunication
Services | | | 2,388,324 | | | | 4.8 | | |
Food Products | | | 2,363,420 | | | | 4.8 | | |
Household Products | | | 2,098,722 | | | | 4.2 | | |
Media | | | 1,874,172 | | | | 3.8 | | |
Industrial Conglomerates | | | 1,394,809 | | | | 2.8 | | |
Electrical Equipment | | | 1,243,569 | | | | 2.5 | | |
Aerospace & Defense | | | 1,125,438 | | | | 2.3 | | |
Information Technology
Services | | | 1,080,411 | | | | 2.2 | | |
Investment Company | | | 1,049,904 | | | | 2.1 | | |
Professional Services | | | 1,013,097 | | | | 2.1 | | |
Metals & Mining | | | 864,589 | | | | 1.7 | | |
Health Care Providers &
Services | | | 817,834 | | | | 1.7 | | |
Machinery | | | 812,696 | | | | 1.6 | | |
Hotels, Restaurants &
Leisure | | | 797,900 | | | | 1.6 | | |
Chemicals | | | 743,829 | | | | 1.5 | | |
| | | $ | 49,397,798 | ++ | | | 100.0 | % | |
++ Does not reflect the value of securities held as collateral on loaned securities.
See Notes to Financial Statements
52
Morgan Stanley Variable Investment Series - Multi Cap Growth
Portfolio of Investments n June 30, 2013 (unaudited)
NUMBER OF
SHARES | |
| | VALUE | |
| | | Common Stocks (99.8%) | |
| | | Alternative Energy (1.4%) | |
| | 44,527 | | | Range Resources Corp. | | $ | 3,442,828 | | |
| | | Automobiles (2.5%) | |
| | 57,537 | | | Tesla Motors, Inc. (a) | | | 6,181,200 | | |
| | | Biotechnology (3.8%) | |
| | 122,852 | | | Illumina, Inc. (a) | | | 9,194,244 | | |
| | | Chemicals: Diversified (2.9%) | |
| | 70,069 | | | Monsanto Co. | | | 6,922,817 | | |
| | | Commercial Services (7.7%) | |
| | 174,341 | | | Advisory Board Co. (The) (a) | | | 9,527,736 | | |
| | 144,314 | | | Corporate Executive
Board Co. (The) | | | 9,123,531 | | |
| | | | 18,651,267 | | |
| | | Communications
Technology (3.4%) | |
| | 142,146 | | | Motorola Solutions, Inc. | | | 8,206,089 | | |
| | | Computer Services,
Software & Systems (24.0%) | |
| | 28,449 | | | Baidu, Inc. ADR (China) (a) | | | 2,689,284 | | |
| | 562,871 | | | Facebook, Inc., Class A (a) | | | 13,992,973 | | |
| | 22,039 | | | Google, Inc., Class A (a) | | | 19,402,475 | | |
| | 31,764 | | | LinkedIn Corp., Class A (a) | | | 5,663,521 | | |
| | 142,929 | | | Salesforce.com, Inc. (a) | | | 5,457,029 | | |
| | 155,161 | | | Solera Holdings, Inc. | | | 8,634,710 | | |
| | 38,838 | | | Workday, Inc., Class A (a) | | | 2,489,127 | | |
| | | | 58,329,119 | | |
| | | Computer Technology (4.8%) | |
| | 14,240 | | | Apple, Inc. | | | 5,640,179 | | |
| | 216,366 | | | Yandex N.V., Class A
(Russia) (a) | | | 5,978,193 | | |
| | | | 11,618,372 | | |
| | | Consumer Lending (7.7%) | |
| | 15,547 | | | Mastercard, Inc., Class A | | | 8,931,751 | | |
| | 52,804 | | | Visa, Inc., Class A | | | 9,649,931 | | |
| | | | 18,581,682 | | |
NUMBER OF
SHARES | |
| | VALUE | |
| | | Diversified Retail (14.4%) | |
| | 70,434 | | | Amazon.com, Inc. (a) | | $ | 19,558,817 | | |
| | 662,809 | | | Groupon, Inc. (a) | | | 5,633,877 | | |
| | 11,723 | | | Priceline.com, Inc. (a) | | | 9,696,445 | | |
| | | | 34,889,139 | | |
| | | Financial Data &
Systems (2.2%) | |
| | 160,565 | | | MSCI, Inc. (a) | | | 5,341,997 | | |
| | | Foods (1.7%) | |
| | 119,501 | | | Fiesta Restaurant
Group, Inc. (a) | | | 4,109,639 | | |
| | | Health Care Services (3.4%) | |
| | 97,378 | | | athenahealth, Inc. (a) | | | 8,249,864 | | |
| | | Insurance:
Property-Casualty (2.4%) | |
| | 114,321 | | | Arch Capital Group Ltd. (a) | | | 5,877,243 | | |
| | | Medical Equipment (3.0%) | |
| | 14,572 | | | Intuitive Surgical, Inc. (a) | | | 7,381,884 | | |
| | | Pharmaceuticals (3.7%) | |
| | 144,249 | | | Ironwood
Pharmaceuticals, Inc. (a) | | | 1,435,277 | | |
| | 86,635 | | | Valeant Pharmaceuticals
International, Inc.
(Canada) (a) | | | 7,457,541 | | |
| | | | 8,892,818 | | |
| | | Recreational Vehicles &
Boats (3.3%) | |
| | 264,141 | | | Edenred (France) | | | 8,079,746 | | |
| | | Restaurants (2.8%) | |
| | 104,522 | | | Starbucks Corp. | | | 6,845,146 | | |
| | | Semiconductors &
Components (2.4%) | |
| | 128,535 | | | First Solar, Inc. (a) | | | 5,749,370 | | |
| | | Textiles Apparel &
Shoes (2.3%) | |
| | 33,972 | | | Christian Dior SA (France) | | | 5,483,235 | | |
| | | | | Total Common Stocks
(Cost $167,249,567) | | | 242,027,699 | | |
See Notes to Financial Statements
53
Morgan Stanley Variable Investment Series - Multi Cap Growth
Portfolio of Investments n June 30, 2013 (unaudited) continued
NUMBER OF
SHARES (000) | |
| | VALUE | |
| | | Short-Term Investment (0.2%) | | | |
| | | Investment Company | | | |
| | 606 | | | Morgan Stanley Institutional
Liquidity Funds - Money
Market Portfolio -
Institutional Class
(See Note 6)
(Cost $606,178) | | $ | 606,178 | | |
Total Investments
(Cost $167,855,745) | | | 100.0 | % | | | 242,633,877 | | |
Liabilities in Excess of
Other Assets | | | 0.0 | (b) | | | (13,833 | ) | |
Net Assets | | | 100.0 | % | | $ | 242,620,044 | | |
ADR American Depositary Receipt.
(a) Non-income producing security.
(b) Amount is less than 0.05%.
SUMMARY OF INVESTMENTS
INDUSTRY | | VALUE | | PERCENT OF
TOTAL
INVESTMENTS | |
Computer Services,
Software & Systems | | $ | 58,329,119 | | | | 24.0 | % | |
Diversified Retail | | | 34,889,139 | | | | 14.4 | | |
Commercial Services | | | 18,651,267 | | | | 7.7 | | |
Consumer Lending | | | 18,581,682 | | | | 7.7 | | |
Computer Technology | | | 11,618,372 | | | | 4.8 | | |
Biotechnology | | | 9,194,244 | | | | 3.8 | | |
Pharmaceuticals | | | 8,892,818 | | | | 3.7 | | |
Health Care Services | | | 8,249,864 | | | | 3.4 | | |
Communications
Technology | | | 8,206,089 | | | | 3.4 | | |
Recreational Vehicles &
Boats | | | 8,079,746 | | | | 3.3 | | |
Medical Equipment | | | 7,381,884 | | | | 3.0 | | |
Chemicals: Diversified | | | 6,922,817 | | | | 2.9 | | |
Restaurants | | | 6,845,146 | | | | 2.8 | | |
Automobiles | | | 6,181,200 | | | | 2.5 | | |
Insurance:
Property-Casualty | | | 5,877,243 | | | | 2.4 | | |
Semiconductors &
Components | | | 5,749,370 | | | | 2.4 | | |
Textiles Apparel & Shoes | | | 5,483,235 | | | | 2.3 | | |
Financial Data & Systems | | | 5,341,997 | | | | 2.2 | | |
Foods | | | 4,109,639 | | | | 1.7 | | |
Alternative Energy | | | 3,442,828 | | | | 1.4 | | |
Investment Company | | | 606,178 | | | | 0.2 | | |
| | | $ | 242,633,877 | | | | 100.0 | % | |
See Notes to Financial Statements
54
(This page has been intentionally left blank.)
Morgan Stanley Variable Investment Series
Financial Statements
Statements of Assets and Liabilities
June 30, 2013 (unaudited)
| | | Money
Market | | Limited
Duration | | Income
Plus | |
Assets: | |
Investments in securities, at value* | | $ | 84,215,872 | (1) | | $ | 43,308,597 | | | $ | 157,496,357 | | |
Investments in affiliates, at value** | | | — | | | | 1,446,706 | | | | 3,309,588 | | |
Total investments in securities, at value | | | 84,215,872 | | | | 44,755,303 | | | | 160,805,945 | | |
Unrealized appreciation on open swap agreements | | | — | | | | 113,130 | | | | 1,116,041 | | |
Unrealized appreciation on open foreign currency forward exchange contracts | | | — | | | | — | | | | 343 | | |
Cash | | | 9,286 | | | | — | | | | 18,164 | (3) | |
Receivable for: | | | | | | | |
Investments sold | | | — | | | | — | | | | 1,418,351 | | |
Interest and paydown | | | 16,120 | | | | 299,968 | | | | 1,812,751 | | |
Dividends | | | — | | | | — | | | | 5,546 | | |
Premium paid on open swap agreements | | | — | | | | 44,952 | | | | 156,771 | | |
Variation margin | | | — | | | | — | | | | 183,130 | | |
Foreign withholding taxes reclaimed | | | — | | | | — | | | | 1,880 | | |
Interest and dividends from affiliates | | | — | | | | 10,612 | | | | 46,339 | | |
Shares of beneficial interest sold | | | 158 | | | | — | | | | — | | |
Prepaid expenses and other assets | | | 5,089 | | | | 2,755 | | | | 7,891 | | |
Total Assets | | | 84,246,525 | | | | 45,226,720 | | | | 165,573,152 | | |
Liabilities: | |
Collateral on securities loaned, at value | | | — | | | | — | | | | — | | |
Unrealized depreciation on open swap agreements | | | — | | | | 11,694 | | | | 51,025 | | |
Unrealized depreciation on open foreign currency forward exchange contracts | | | — | | | | — | | | | 2,180 | | |
Due to broker | | | — | | | | — | | | | 940,000 | | |
Payable for: | | | | | | | |
Shares of beneficial interest redeemed | | | 44,927 | | | | 603,563 | | | | 161,288 | | |
Investments purchased | | | — | | | | — | | | | 650,000 | | |
Advisory fee | | | — | | | | 11,153 | | | | 57,678 | | |
Distribution fee (Class Y) | | | — | | | | 7,360 | | | | 18,169 | | |
Administration fee | | | 882 | | | | 2,996 | | | | 11,011 | | |
Transfer agent fee | | | 471 | | | | 407 | | | | 488 | | |
Variation margin | | | — | | | | 696 | | | | — | | |
Accrued expenses and other payables | | | 46,114 | | | | 41,632 | | | | 75,472 | | |
Total Liabilities | | | 92,394 | | | | 679,501 | | | | 1,967,311 | | |
Net Assets | | $ | 84,154,131 | | | $ | 44,547,219 | | | $ | 163,605,841 | | |
Composition of Net Assets: | |
Paid-in-capital | | $ | 84,158,544 | | | $ | 75,157,704 | | | $ | 162,893,901 | | |
Net unrealized appreciation (depreciation) | | | — | | | | 299,771 | | | | 4,176,683 | | |
Accumulated undistributed net investment income (net investment loss) | | | (2,476 | ) | | | 285,379 | | | | 3,478,634 | | |
Accumulated net realized gain (loss) | | | (1,937 | ) | | | (31,195,635 | ) | | | (6,943,377 | ) | |
Net Assets | | $ | 84,154,131 | | | $ | 44,547,219 | | | $ | 163,605,841 | | |
| * Cost | | $ | 84,215,872 | | | $ | 43,024,981 | | | $ | 153,969,576 | | |
| ** Affiliated Cost | | $ | — | | | $ | 1,449,143 | | | $ | 3,288,319 | | |
Class X Shares: | |
Net Assets | | $ | 39,287,811 | | | $ | 9,636,563 | | | $ | 77,213,397 | | |
Shares Outstanding (unlimited shares authorized, $0.01 par value) | | | 39,289,647 | | | | 1,290,260 | | | | 6,970,929 | | |
Net Asset Value Per Share | | $ | 1.00 | | | $ | 7.47 | | | $ | 11.08 | | |
Class Y Shares: | |
Net Assets | | $ | 44,866,320 | | | $ | 34,910,656 | | | $ | 86,392,444 | | |
Shares Outstanding (unlimited shares authorized, $0.01 par value) | | | 44,868,903 | | | | 4,679,839 | | | | 7,814,934 | | |
Net Asset Value Per Share | | $ | 1.00 | | | $ | 7.46 | | | $ | 11.05 | | |
(1) Including repurchase agreements of $37,800,000.
(2) Including securities loaned at value of $8,996,073 and $841,237, respectively.
(3) Including foreign currency valued at $18,164, $65,081, and $31,438, respectively with a cost of $18,097, $65,192, and $31,546, respectively.
See Notes to Financial Statements
56
| | Global
Infrastructure | | European
Equity | | Multi Cap
Growth | |
Assets: | |
Investments in securities, at value* | | $ | 69,776,510 | (2) | | $ | 48,499,950 | (2) | | $ | 242,027,699 | | |
Investments in affiliates, at value** | | | 3,671,806 | | | | 1,681,505 | | | | 606,178 | | |
Total investments in securities, at value | | | 73,448,316 | | | | 50,181,455 | | | | 242,633,877 | | |
Unrealized appreciation on open swap agreements | | | — | | | | — | | | | — | | |
Unrealized appreciation on open foreign currency forward exchange contracts | | | — | | | | — | | | | — | | |
Cash | | | 560,441 | (3) | | | 128,974 | (3) | | | — | | |
Receivable for: | | | | | | | |
Investments sold | | | 271,772 | | | | 11,950 | | | | 471,123 | | |
Interest and paydown | | | — | | | | — | | | | — | | |
Dividends | | | 417,681 | | | | 116,603 | | | | 39,015 | | |
Premium paid on open swap agreements | | | — | | | | — | | | | — | | |
Variation margin | | | — | | | | — | | | | — | | |
Foreign withholding taxes reclaimed | | | 34,824 | | | | 103,128 | | | | — | | |
Interest and dividends from affiliates | | | 10 | | | | 26 | | | | 286 | | |
Shares of beneficial interest sold | | | 1,659 | | | | — | | | | — | | |
Prepaid expenses and other assets | | | 5,869 | | | | 5,136 | | | | 10,463 | | |
Total Assets | | | 74,740,572 | | | | 50,547,272 | | | | 243,154,764 | | |
Liabilities: | |
Collateral on securities loaned, at value | | | 4,397,859 | | | | 881,194 | | | | — | | |
Unrealized depreciation on open swap agreements | | | — | | | | — | | | | — | | |
Unrealized depreciation on open foreign currency forward exchange contracts | | | — | | | | — | | | | — | | |
Due to broker | | | — | | | | — | | | | — | | |
Payable for: | | | | | | | |
Shares of beneficial interest redeemed | | | 132,228 | | | | 51,644 | | | | 278,044 | | |
Investments purchased | | | — | | | | — | | | | — | | |
Advisory fee | | | 33,357 | | | | 29,382 | | | | 83,577 | | |
Distribution fee (Class Y) | | | 2,902 | | | | 2,360 | | | | 12,568 | | |
Administration fee | | | 4,689 | | | | 3,377 | | | | 16,000 | | |
Transfer agent fee | | | 488 | | | | 488 | | | | 916 | | |
Variation margin | | | — | | | | — | | | | — | | |
Accrued expenses and other payables | | | 36,732 | | | | 42,193 | | | | 143,615 | | |
Total Liabilities | | | 4,608,255 | | | | 1,010,638 | | | | 534,720 | | |
Net Assets | | $ | 70,132,317 | | | $ | 49,536,634 | | | $ | 242,620,044 | | |
Composition of Net Assets: | |
Paid-in-capital | | $ | 50,180,103 | | | $ | 50,844,311 | | | $ | 149,611,637 | | |
Net unrealized appreciation (depreciation) | | | 15,801,207 | | | | 11,415,992 | | | | 74,778,132 | | |
Accumulated undistributed net investment income (net investment loss) | | | 869,796 | | | | 1,071,195 | | | | (161,300 | ) | |
Accumulated net realized gain (loss) | | | 3,281,211 | | | | (13,794,864 | ) | | | 18,391,575 | | |
Net Assets | | $ | 70,132,317 | | | $ | 49,536,634 | | | $ | 242,620,044 | | |
| * Cost | | $ | 53,971,525 | | | $ | 37,076,526 | | | $ | 167,249,567 | | |
| ** Affiliated Cost | | $ | 3,671,806 | | | $ | 1,681,505 | | | $ | 606,178 | | |
Class X Shares: | |
Net Assets | | $ | 56,248,741 | | | $ | 38,441,266 | | | $ | 181,870,280 | | |
Shares Outstanding (unlimited shares authorized, $0.01 par value) | | | 6,543,253 | | | | 2,337,653 | | | | 4,020,354 | | |
Net Asset Value Per Share | | $ | 8.60 | | | $ | 16.44 | | | $ | 45.24 | | |
Class Y Shares: | |
Net Assets | | $ | 13,883,576 | | | $ | 11,095,368 | | | $ | 60,749,764 | | |
Shares Outstanding (unlimited shares authorized, $0.01 par value) | | | 1,619,419 | | | | 676,177 | | | | 1,357,092 | | |
Net Asset Value Per Share | | $ | 8.57 | | | $ | 16.41 | | | $ | 44.76 | | |
57
Morgan Stanley Variable Investment Series
Financial Statements continued
Statements of Operations
For the six months ended June 30, 2013 (unaudited)
| | | Money
Market | | Limited
Duration | | Income
Plus | |
Net Investment Income: | |
Income | |
Interest† | | $ | 94,130 | | | $ | 484,218 | | | $ | 4,026,845 | | |
Dividends† | | | — | | | | — | | | | 43,553 | | |
Interest and dividends from affiliates (Note 6) | | | — | | | | 12,082 | | | | 75,539 | | |
Income from securities loaned - net | | | — | | | | — | | | | — | | |
Total Income | | | 94,130 | | | | 496,300 | | | | 4,145,937 | | |
†Net of foreign withholding taxes | | | — | | | | — | | | | — | | |
Expenses | |
Advisory fee (Note 4) | | | 192,843 | | | | 70,314 | | | | 368,611 | | |
Distribution fee (Class Y shares) (Note 5) | | | 56,981 | | | | 46,007 | | | | 115,788 | | |
Professional fees | | | 43,480 | | | | 33,754 | | | | 39,017 | | |
Administration fee (Note 4) | | | 21,427 | | | | 18,750 | | | | 70,212 | | |
Custodian fees | | | 10,129 | | | | 10,999 | | | | 16,327 | | |
Shareholder reports and notices | | | 8,858 | | | | 8,574 | | | | 15,553 | | |
Trustees' fees and expenses | | | 1,564 | | | | 1,026 | | | | 2,821 | | |
Transfer agent fees and expenses | | | 1,471 | | | | 1,240 | | | | 1,488 | | |
Other | | | 3,704 | | | | 16,830 | | | | 25,244 | | |
Total Expenses | | | 340,457 | | | | 207,494 | | | | 655,061 | | |
Less: amounts waived | | | (250,617 | )(4) | | | — | | | | — | | |
Less: rebate from Morgan Stanley affiliated cash sweep (Note 6) | | | — | | | | (579 | ) | | | (2,687 | ) | |
Net Expenses | | | 89,840 | | | | 206,915 | | | | 652,374 | | |
Net Investment Income | | | 4,290 | | | | 289,385 | | | | 3,493,563 | | |
Realized and Unrealized Gain (Loss): | |
Realized Gain (Loss) on: | |
Investments | | | (2 | ) | | | 182,067 | | | | 3,722,447 | | |
Investments in affiliates (Note 6) | | | — | | | | 8,018 | | | | 481,934 | | |
Futures contracts | | | — | | | | (167,609 | ) | | | (781,238 | ) | |
Swap agreements | | | — | | | | 102,043 | | | | 378,242 | | |
Foreign currency forward exchange contracts | | | — | | | | — | | | | 4,825 | | |
Foreign currency translation | | | — | | | | — | | | | (75 | ) | |
Net Realized Gain (Loss) | | | (2 | ) | | | 124,519 | | | | 3,806,135 | | |
Change in Unrealized Appreciation (Depreciation) on: | |
Investments | | | — | | | | (757,954 | ) | | | (11,982,508 | ) | |
Investments in affiliates (Note 6) | | | — | | | | (31,206 | ) | | | (602,258 | ) | |
Futures contracts | | | — | | | | (71,974 | ) | | | (354,900 | ) | |
Swap agreements | | | — | | | | 132,704 | | | | 1,350,004 | | |
Foreign currency forward exchange contracts | | | — | | | | — | | | | 3,135 | | |
Foreign currency translation | | | — | | | | — | | | | (3 | ) | |
Net Change in Unrealized Appreciation (Depreciation) | | | — | | | | (728,430 | ) | | | (11,586,530 | ) | |
Net Gain (Loss) | | | (2 | ) | | | (603,911 | ) | | | (7,780,395 | ) | |
Net Increase (Decrease) | | $ | 4,288 | | | $ | (314,526 | ) | | $ | (4,286,832 | ) | |
(4) See Note 5.
(5) See Note 4.
See Notes to Financial Statements
58
| | | Global
Infrastructure | | European
Equity | | Multi Cap
Growth | |
Net Investment Income: | |
Income | |
Interest† | | | — | | | | — | | | | — | | |
Dividends† | | $ | 1,259,932 | | | $ | 1,288,316 | | | $ | 722,919 | | |
Interest and dividends from affiliates (Note 6) | | | 150 | | | | 294 | | | | 3,654 | | |
Income from securities loaned - net | | | 6,849 | | | | 61,033 | | | | — | | |
Total Income | | | 1,266,931 | | | | 1,349,643 | | | | 726,573 | | |
†Net of foreign withholding taxes | | | 69,273 | | | | 136,228 | | | | 65,861 | | |
Expenses | |
Advisory fee (Note 4) | | | 208,034 | | | | 226,495 | | | | 471,179 | | |
Distribution fee (Class Y shares) (Note 5) | | | 18,038 | | | | 14,718 | | | | 64,331 | | |
Professional fees | | | 36,733 | | | | 35,001 | | | | 36,337 | | |
Administration fee (Note 4) | | | 29,198 | | | | 20,827 | | | | 89,748 | | |
Custodian fees | | | 22,501 | | | | 10,732 | | | | 14,864 | | |
Shareholder reports and notices | | | 7,445 | | | | 7,880 | | | | 17,734 | | |
Trustees' fees and expenses | | | 1,417 | | | | 1,184 | | | | 2,826 | | |
Transfer agent fees and expenses | | | 1,488 | | | | 1,488 | | | | 2,290 | | |
Other | | | 8,239 | | | | 7,953 | | | | 9,406 | | |
Total Expenses | | | 333,093 | | | | 326,278 | | | | 708,715 | | |
Less: amounts waived | | | — | | | | (51,221 | )(5) | | | — | | |
Less: rebate from Morgan Stanley affiliated cash sweep (Note 6) | | | (716 | ) | | | (360 | ) | | | (4,469 | ) | |
Net Expenses | | | 332,377 | | | | 274,697 | | | | 704,246 | | |
Net Investment Income | | | 934,554 | | | | 1,074,946 | | | | 22,327 | | |
Realized and Unrealized Gain (Loss): | |
Realized Gain (Loss) on: | |
Investments | | | 3,521,901 | | | | 877,667 | | | | 18,831,591 | | |
Investments in affiliates (Note 6) | | | — | | | | — | | | | — | | |
Futures contracts | | | — | | | | — | | | | — | | |
Swap agreements | | | — | | | | — | | | | — | | |
Foreign currency forward exchange contracts | | | — | | | | — | | | | — | | |
Foreign currency translation | | | (4,648 | ) | | | (10,281 | ) | | | (1,754 | ) | |
Net Realized Gain (Loss) | | | 3,517,253 | | | | 867,386 | | | | 18,829,837 | | |
Change in Unrealized Appreciation (Depreciation) on: | |
Investments | | | (705,590 | ) | | | 199,488 | | | | 7,537,677 | | |
Investments in affiliates (Note 6) | | | — | | | | — | | | | — | | |
Futures contracts | | | — | | | | — | | | | — | | |
Swap agreements | | | — | | | | — | | | | — | | |
Foreign currency forward exchange contracts | | | — | | | | — | | | | — | | |
Foreign currency translation | | | (5,868 | ) | | | (6,432 | ) | | | (1,046 | ) | |
Net Change in Unrealized Appreciation (Depreciation) | | | (711,458 | ) | | | 193,056 | | | | 7,536,631 | | |
Net Gain (Loss) | | | 2,805,795 | | | | 1,060,442 | | | | 26,366,468 | | |
Net Increase (Decrease) | | $ | 3,740,349 | | | $ | 2,135,388 | | | $ | 26,388,795 | | |
59
Morgan Stanley Variable Investment Series
Financial Statements continued
Statements of Changes in Net Assets
| | Money Market | | Limited Duration | | Income Plus | |
| | | For The Six
Months Ended
June 30, 2013 | | For The Year
Ended
December 31, 2012 | | For The Six
Months Ended
June 30, 2013 | | For The Year
Ended
December 31, 2012 | | For The Six
Months Ended
June 30, 2013 | | For The Year
Ended
December 31, 2012 | |
| | | (unaudited) | | | | (unaudited) | | | | (unaudited) | | | |
Increase (Decrease) in Net Assets: | |
Operations: | |
Net investment income | | $ | 4,290 | | | $ | 8,026 | | | $ | 289,385 | | | $ | 712,005 | | | $ | 3,493,563 | | | $ | 7,687,080 | | |
Net realized gain (loss) | | | (2 | ) | | | 15 | | | | 124,519 | | | | 211,183 | | | | 3,806,135 | | | | 9,574,013 | | |
Net change in unrealized appreciation (depreciation) | | | — | | | | — | | | | (728,430 | ) | | | 759,378 | | | | (11,586,530 | ) | | | 7,799,600 | | |
Net Increase (Decrease) | | | 4,288 | | | | 8,041 | | | | (314,526 | ) | | | 1,682,566 | | | | (4,286,832 | ) | | | 25,060,693 | | |
Dividends and Distributions to Shareholders from: | |
Net investment income | |
Class X Shares | | | (2,006 | ) | | | (4,981 | ) | | | (250,020 | ) | | | (347,237 | ) | | | (3,915,814 | ) | | | (5,085,206 | ) | |
Class Y Shares | | | (2,279 | ) | | | (5,523 | ) | | | (817,023 | ) | | | (1,155,973 | ) | | | (4,145,124 | ) | | | (5,615,046 | ) | |
Net realized gain | |
Class X Shares | | | — | | | | — | | | | — | | | | — | | | | — | | | | — | | |
Class Y Shares | | | — | | | | — | | | | — | | | | — | | | | — | | | | — | | |
Total Dividends and Distributions | | | (4,285 | ) | | | (10,504 | ) | | | (1,067,043 | ) | | | (1,503,210 | ) | | | (8,060,938 | ) | | | (10,700,252 | ) | |
Net increase (decrease) from transactions in shares of
beneficial interest | | | (6,678,569 | ) | | | (16,444,948 | ) | | | (3,434,987 | ) | | | (7,593,029 | ) | | | (8,391,093 | ) | | | (23,839,687 | ) | |
Net Decrease | | | (6,678,566 | ) | | | (16,447,411 | ) | | | (4,816,556 | ) | | | (7,413,673 | ) | | | (20,738,863 | ) | | | (9,479,246 | ) | |
Net Assets: | |
Beginning of period | | | 90,832,697 | | | | 107,280,108 | | | | 49,363,775 | | | | 56,777,448 | | | | 184,344,704 | | | | 193,823,950 | | |
End of Period | | $ | 84,154,131 | | | $ | 90,832,697 | | | $ | 44,547,219 | | | $ | 49,363,775 | | | $ | 163,605,841 | | | $ | 184,344,704 | | |
Accumulated Undistributed Net Investment
Income (Loss) | | $ | (2,476 | ) | | $ | (2,481 | ) | | $ | 285,379 | | | $ | 1,063,037 | | | $ | 3,478,634 | | | $ | 8,046,009 | | |
See Notes to Financial Statements
60
| | | Global Infrastructure | | European Equity | |
| | | For The Six
Months Ended
June 30, 2013 | | For The Year
Ended
December 31, 2012 | | For The Six
Months Ended
June 30, 2013 | | For The Year
Ended
December 31, 2012 | |
| | | (unaudited) | | | | (unaudited) | | | |
Increase (Decrease) in Net Assets: | |
Operations: | |
Net investment income | | $ | 934,554 | | | $ | 1,785,078 | | | $ | 1,074,946 | | | $ | 1,789,422 | | |
Net realized gain (loss) | | | 3,517,253 | | | | 5,970,445 | | | | 867,386 | | | | (500,688 | ) | |
Net change in unrealized appreciation (depreciation) | | | (711,458 | ) | | | 4,615,322 | | | | 193,056 | | | | 7,558,222 | | |
Net Increase (Decrease) | | | 3,740,349 | | | | 12,370,845 | | | | 2,135,388 | | | | 8,846,956 | | |
Dividends and Distributions to Shareholders from: | |
Net investment income | |
Class X Shares | | | (1,522,959 | ) | | | (1,393,488 | ) | | | (1,199,464 | ) | | | (1,129,845 | ) | |
Class Y Shares | | | (341,515 | ) | | | (317,994 | ) | | | (318,348 | ) | | | (291,780 | ) | |
Net realized gain | |
Class X Shares | | | (4,698,319 | ) | | | (5,078,266 | ) | | | — | | | | — | | |
Class Y Shares | | | (1,165,346 | ) | | | (1,294,994 | ) | | | — | | | | — | | |
Total Dividends and Distributions | | | (7,728,139 | ) | | | (8,084,742 | ) | | | (1,517,812 | ) | | | (1,421,625 | ) | |
Net increase (decrease) from transactions in shares of
beneficial interest | | | 1,986,804 | | | | (5,623,624 | ) | | | (2,994,229 | ) | | | (8,361,702 | ) | |
Net Decrease | | | (2,000,986 | ) | | | (1,337,521 | ) | | | (2,376,653 | ) | | | (936,371 | ) | |
Net Assets: | |
Beginning of period | | | 72,133,303 | | | | 73,470,824 | | | | 51,913,287 | | | | 52,849,658 | | |
End of Period | | $ | 70,132,317 | | | $ | 72,133,303 | | | $ | 49,536,634 | | | $ | 51,913,287 | | |
Accumulated Undistributed Net Investment
Income (Loss) | | $ | 869,796 | | | $ | 1,799,716 | | | $ | 1,071,195 | | | $ | 1,514,061 | | |
61
Morgan Stanley Variable Investment Series
Financial Statements continued
Statements of Changes in Net Assets continued
| | | Multi Cap Growth | |
| | | For The Six
Months Ended
June 30, 2013 | | For The Year
Ended
December 31, 2012 | |
| | | (unaudited) | | | |
Increase (Decrease) in Net Assets: | |
Operations: | |
Net investment income | | $ | 22,327 | | | $ | 955,324 | | |
Net realized gain | | | 18,829,837 | | | | 3,755,676 | | |
Net change in unrealized appreciation (depreciation) | | | 7,536,631 | | | | 22,331,393 | | |
Net Increase | | | 26,388,795 | | | | 27,042,393 | | |
Dividends and Distributions to Shareholders from: | |
Net investment income | |
Class X Shares | | | (803,872 | ) | | | — | | |
Class Y Shares | | | (149,244 | ) | | | — | | |
Net realized gain | |
Class X Shares | | | (2,596,410 | ) | | | (3,819,990 | ) | |
Class Y Shares | | | (880,535 | ) | | | (1,066,481 | ) | |
Total Dividends and Distributions | | | (4,430,061 | ) | | | (4,886,471 | ) | |
Net increase (decrease) from transactions in shares of beneficial interest | | | 10,187,743 | | | | (34,644,616 | ) | |
Net Increase (Decrease) | | | 32,146,477 | | | | (12,488,694 | ) | |
Net Assets: | |
Beginning of period | | | 210,473,567 | | | | 222,962,261 | | |
End of Period | | $ | 242,620,044 | | | $ | 210,473,567 | | |
Accumulated Undistributed Net Investment Income (Loss) | | $ | (161,300 | ) | | $ | 769,489 | | |
See Notes to Financial Statements
62
(This page has been intentionally left blank.)
Morgan Stanley Variable Investment Series
Financial Statements continued
Statements of Changes in Net Assets continued
Summary of Transactions in Shares of Beneficial Interest
| | | Money Market | | Limited Duration | | Income Plus | |
| | | For The Six
Months Ended
June 30, 2013 | | For The Year
Ended
December 31, 2012 | | For The Six
Months Ended
June 30, 2013 | | For The Year
Ended
December 31, 2012 | | For The Six
Months Ended
June 30, 2013 | | For The Year
Ended
December 31, 2012 | |
| | | (unaudited) | | | | (unaudited) | | | | (unaudited) | | | |
Class X Shares | |
Shares | |
Sold | | | 4,516,697 | | | | 8,138,796 | | | | 15,741 | | | | 39,757 | | | | 29,910 | | | | 158,115 | | |
Reinvestment of dividends and distributions | | | 2,006 | | | | 4,981 | | | | 33,470 | | | | 45,689 | | | | 353,732 | | | | 454,849 | | |
Redeemed | | | (7,498,417 | ) | | | (17,306,444 | ) | | | (136,734 | ) | | | (357,172 | ) | | | (660,630 | ) | | | (1,526,605 | ) | |
Net Increase (Decrease) - Class X | | | (2,979,714 | ) | | | (9,162,667 | ) | | | (87,523 | ) | | | (271,726 | ) | | | (276,988 | ) | | | (913,641 | ) | |
Amount | |
Sold | | $ | 4,516,697 | | | $ | 8,138,796 | | | $ | 121,623 | | | $ | 308,431 | | | $ | 358,871 | | | $ | 1,835,747 | | |
Reinvestment of dividends and distributions | | | 2,006 | | | | 4,981 | | | | 250,020 | | | | 347,237 | | | | 3,915,814 | | | | 5,085,206 | | |
Redeemed | | | (7,498,417 | ) | | | (17,306,444 | ) | | | (1,056,310 | ) | | | (2,761,250 | ) | | | (7,948,552 | ) | | | (17,784,137 | ) | |
Net Increase (Decrease) - Class X | | $ | (2,979,714 | ) | | $ | (9,162,667 | ) | | $ | (684,667 | ) | | $ | (2,105,582 | ) | | $ | (3,673,867 | ) | | $ | (10,863,184 | ) | |
Class Y Shares | |
Shares | |
Sold | | | 8,898,487 | | | | 10,141,795 | | | | 87,298 | | | | 152,869 | | | | 98,784 | | | | 188,882 | | |
Reinvestment of dividends and distributions | | | 2,279 | | | | 5,523 | | | | 109,520 | | | | 152,302 | | | | 375,124 | | | | 503,592 | | |
Redeemed | | | (12,599,621 | ) | | | (17,429,599 | ) | | | (552,967 | ) | | | (1,016,517 | ) | | | (839,478 | ) | | | (1,792,003 | ) | |
Net Increase (Decrease) - Class Y | | | (3,698,855 | ) | | | (7,282,281 | ) | | | (356,149 | ) | | | (711,346 | ) | | | (365,570 | ) | | | (1,099,529 | ) | |
Amount | |
Sold | | $ | 8,898,487 | | | $ | 10,141,795 | | | $ | 673,492 | | | $ | 1,184,321 | | | $ | 1,183,422 | | | $ | 2,189,967 | | |
Reinvestment of dividends and distributions | | | 2,279 | | | | 5,523 | | | | 817,023 | | | | 1,155,973 | | | | 4,145,124 | | | | 5,615,046 | | |
Redeemed | | | (12,599,621 | ) | | | (17,429,599 | ) | | | (4,240,835 | ) | | | (7,827,741 | ) | | | (10,045,772 | ) | | | (20,781,516 | ) | |
Net Increase (Decrease) - Class Y | | $ | (3,698,855 | ) | | $ | (7,282,281 | ) | | $ | (2,750,320 | ) | | $ | (5,487,447 | ) | | $ | (4,717,226 | ) | | $ | (12,976,503 | ) | |
See Notes to Financial Statements
64
| | | Global Infrastructure | | European Equity | |
| | | For The Six
Months Ended
June 30, 2013 | | For The Year
Ended
December 31, 2012 | | For The Six
Months Ended
June 30, 2013 | | For The Year
Ended
December 31, 2012 | |
| | | (unaudited) | | | | (unaudited) | | | |
Class X Shares | |
Shares | |
Sold | | | 55,470 | | | | 30,394 | | | | 9,747 | | | | 13,569 | | |
Reinvestment of dividends and distributions | | | 723,404 | | | | 780,670 | | | | 72,916 | | | | 79,622 | | |
Redeemed | | | (505,849 | ) | | | (1,303,365 | ) | | | (205,021 | ) | | | (536,124 | ) | |
Net Increase (Decrease) - Class X | | | 273,025 | | | | (492,301 | ) | | | (122,358 | ) | | | (442,933 | ) | |
Amount | |
Sold | | $ | 540,834 | | | $ | 269,633 | | | $ | 167,991 | | | $ | 209,416 | | |
Reinvestment of dividends and distributions | | | 6,221,278 | | | | 6,471,754 | | | | 1,199,464 | | | | 1,129,845 | | |
Redeemed | | | (4,936,755 | ) | | | (11,564,117 | ) | | | (3,520,647 | ) | | | (8,130,383 | ) | |
Net Increase (Decrease) - Class X | | $ | 1,825,357 | | | $ | (4,822,730 | ) | | $ | (2,153,192 | ) | | $ | (6,791,122 | ) | |
Class Y Shares | |
Shares | |
Sold | | | 27,749 | | | | 46,975 | | | | 3,735 | | | | 1,462 | | |
Reinvestment of dividends and distributions | | | 175,830 | | | | 195,041 | | | | 19,400 | | | | 20,606 | | |
Redeemed | | | (168,279 | ) | | | (322,481 | ) | | | (70,955 | ) | | | (124,257 | ) | |
Net Increase (Decrease) - Class Y | | | 35,300 | | | | (80,465 | ) | | | (47,820 | ) | | | (102,189 | ) | |
Amount | |
Sold | | $ | 270,907 | | | $ | 415,592 | | | $ | 62,697 | | | $ | 21,281 | | |
Reinvestment of dividends and distributions | | | 1,506,861 | | | | 1,612,988 | | | | 318,348 | | | | 291,780 | | |
Redeemed | | | (1,616,321 | ) | | | (2,829,474 | ) | | | (1,222,082 | ) | | | (1,883,641 | ) | |
Net Increase (Decrease) - Class Y | | $ | 161,447 | | | $ | (800,894 | ) | | $ | (841,037 | ) | | $ | (1,570,580 | ) | |
65
Morgan Stanley Variable Investment Series
Financial Statements continued
Statements of Changes in Net Assets continued
Summary of Transactions in Shares of Beneficial Interest
| | | Multi Cap Growth | |
| | | For The Six
Months Ended
June 30, 2013 | | For The Year
Ended
December 31, 2012 | |
| | | (unaudited) | | | |
Class X Shares | |
Shares | |
Sold | | | 8,124 | | | | 15,963 | | |
Issued due to a tax-free reorganization | | | 249,276 | | | | — | | |
Reinvestment of dividends and distributions | | | 75,161 | | | | 95,285 | | |
Redeemed | | | (333,303 | ) | | | (734,540 | ) | |
Net Decrease - Class X | | | (742 | ) | | | (623,292 | ) | |
Amount | |
Sold | | $ | 353,153 | | | $ | 651,185 | | |
Issued due to a tax-free reorganization | | | 10,973,148 | | | | — | | |
Reinvestment of dividends and distributions | | | 3,400,282 | | | | 3,819,990 | | |
Redeemed | | | (14,713,506 | ) | | | (30,117,363 | ) | |
Net Increase (Decrease) - Class X | | $ | 13,077 | | | $ | (25,646,188 | ) | |
Class Y Shares | |
Shares | |
Sold | | | 809 | | | | 20,602 | | |
Issued due to a tax-free reorganization | | | 360,951 | | | | — | | |
Reinvestment of dividends and distributions | | | 23,001 | | | | 26,864 | | |
Redeemed | | | (150,821 | ) | | | (266,996 | ) | |
Net Increase (Decrease) - Class Y | | | 233,940 | | | | (219,530 | ) | |
Amount | |
Sold | | $ | 36,793 | | | $ | 812,587 | | |
Issued due to a tax-free reorganization | | | 15,701,356 | | | | — | | |
Reinvestment of dividends and distributions | | | 1,029,779 | | | | 1,066,481 | | |
Redeemed | | | (6,593,262 | ) | | | (10,877,496 | ) | |
Net Increase (Decrease) - Class Y | | $ | 10,174,666 | | | $ | (8,998,428 | ) | |
See Notes to Financial Statements
66
Morgan Stanley Variable Investment Series
Notes to Financial Statements n June 30, 2013 (unaudited)
1. Organization and Accounting Policies
Morgan Stanley Variable Investment Series (the "Fund") is registered under the Investment Company Act of 1940, as amended (the "Act"), as a diversified, open-end management investment company. The Fund is offered exclusively to life insurance companies in connection with particular life insurance and/or annuity contracts they offer.
The Fund, organized on February 25, 1983 as a Massachusetts business trust, consists of six Portfolios ("Portfolios") which commenced operations as follows:
PORTFOLIO | | COMMENCEMENT OF
OPERATIONS | | PORTFOLIO | | COMMENCEMENT OF
OPERATIONS | |
Money Market | | March 9, 1984 | | Global Infrastructure | | March 1, 1990 | |
Limited Duration | | May 4, 1999 | | European Equity | | March 1, 1991 | |
Income Plus | | March 1, 1987 | | Multi Cap Growth | | March 9, 1984 | |
On June 5, 2000, the Fund commenced offering one additional class of shares (Class Y shares). The two classes are identical except that Class Y shares incur distribution expenses. Class X shares are generally available to holders of contracts offered before May 1, 2000. Class Y shares are available to holders of contracts offered on or after June 5, 2000.
The investment objectives of each Portfolio are as follows:
| Money Market | | Seeks high current income, preservation of capital and liquidity. | |
| Limited Duration | | Seeks to provide a high level of current income, consistent with the preservation of capital. | |
| Income Plus | | Seeks, as its primary objective, to provide a high level of current income and, as a secondary objective, capital appreciation, but only when consistent with its primary objective. | |
| Global Infrastructure | | Seeks both capital appreciation and current income. | |
| European Equity | | Seeks to maximize the capital appreciation of its investments. | |
| Multi Cap Growth | | Seeks, as its primary objective, growth of capital and, as a secondary objective, income, but only when consistent with its primary objective. | |
67
Morgan Stanley Variable Investment Series
Notes to Financial Statements n June 30, 2013 (unaudited) continued
The following is a summary of significant accounting policies:
A. Valuation of Investments — Money Market: Portfolio securities are valued at amortized cost, which approximates fair value, in accordance with Rule 2a-7 under the Act. The amortized cost of an instrument is determined by valuing it at its original cost and thereafter amortizing any discount or premium from its face value at a constant rate until maturity. All remaining Portfolios: (1) an equity portfolio security listed or traded on an exchange is valued at its latest reported sales price (or at the exchange official closing price if such exchange reports an official closing price), if there were no sales on a given day, the security is valued at the mean between the last reported bid and asked prices; (2) all other equity portfolio securities for which over-the-counter market quotations are readily available are valued at the mean between the last reported bid and asked prices. In cases where a security is traded on more than one exchange, the security is valued on the exchange designated as the primary market; (3) quotations of foreign portfolio securities, other assets and liabilities and forward contracts stated in foreign currency are translated into U.S. dollar equivalents at the prevailing market rates prior to the close of the New York Stock Exchange ("NYSE"); (4) futures are valued at the latest price published by the commodities exchange on which they trade; (5) swaps are marked-to-market daily based upon quotations from market makers; (6) when market quotations are not readily available, including circumstances under which Morgan Stanley Investment Management Inc. (the "Adviser") or Morgan Stanley Investment Management Limited or Morgan Stanley Investment Management Company (each, a "Sub-Adviser"), each a wholly owned subsidiary of Morgan Stanley, determines that the closing price, last sale price or the mean between the last reported bid and asked prices are not reflective of a security's fair value, portfolio securities are valued at their fair value as determined in good faith under procedures established by and under the general supervision of the Fund's Board of Trustees (the "Trustees"). Occasionally, developments affecting the closing prices of securities and other assets may occur between the times at which valuations of such securities are determined (that is, close of the foreign market on which the securities trade) and the close of business on the NYSE. If developments occur during such periods that are expected to materially affect the value of such securities, such valuations may be adjusted to reflect the estimated fair value of such securities as of the close of the NYSE, as determined in good faith by the Trustees or by the Adviser using a pricing service and/or procedures approved by the Trustees; (7) certain portfolio securities may be valued by an outside pricing service approved by the Trustees. The pricing service may utilize a matrix system or other model incorporating attributes such as security quality, maturity and coupon as the evaluation model parameters, and/or research evaluations by its staff, including review of broker-dealer market price quotations in determining what it believes is the fair valuation of the portfolio securities valued by such pricing service; (8) investments in mutual funds,
68
Morgan Stanley Variable Investment Series
Notes to Financial Statements n June 30, 2013 (unaudited) continued
including the Morgan Stanley Institutional Liquidity Funds, are valued at the net asset value as of the close of each business day; and (9) short-term debt securities with remaining maturities of 60 days or less at the time of purchase may be valued at amortized cost, unless the Adviser determines such valuation does not reflect the securities' market value, in which case these securities will be valued at their fair market value determined by the Adviser.
Under procedures approved by the Trustees, the Fund's Adviser has formed a Valuation Committee. The Valuation Committee provides administration and oversight of the Fund's valuation policies and procedures, which are reviewed at least annually by the Trustees. These procedures allow the Fund to utilize independent pricing services, quotations from securities and financial instrument dealers, and other market sources to determine fair value.
The Fund has procedures to determine the fair value of securities and other financial instruments for which market prices are not readily available. Under these procedures, the Valuation Committee convenes on a regular and ad hoc basis to review such securities and considers a number of factors, including valuation methodologies and significant unobservable valuation inputs, when arriving at fair value. The Valuation Committee may employ a market-based approach which may use related or comparable assets or liabilities, recent transactions, market multiples, book values, and other relevant information for the investment to determine the fair value of the investment. An income-based valuation approach may also be used in which the anticipated future cash flows of the investment are discounted to calculate fair value. Discounts may also be applied due to the nature or duration of any restrictions on the disposition of the investments. Due to the inherent uncertainty of valuations of such investments, the fair values may differ significantly from the values that would have been used had an active market existed. The Valuation Committee employs various methods for calibrating these valuation approaches including a regular review of valuation methodologies, key inputs and assumptions, transactional back-testing or disposition analysis, and reviews of any related market activity.
B. Accounting for Investments — Security transactions are accounted for on the trade date (date the order to buy or sell is executed). Realized gains and losses on security transactions are determined by the identified cost method. Dividend income and other distributions are recorded on the ex-dividend date except for certain dividends on foreign securities which are recorded as soon as the Fund is informed after the ex-dividend date. Interest income is accrued daily as earned except where collection is not expected. Discounts are accreted and premiums are amortized over the life of the respective securities and are included in interest income.
69
Morgan Stanley Variable Investment Series
Notes to Financial Statements n June 30, 2013 (unaudited) continued
C. Repurchase Agreements — The Fund invests directly with institutions in repurchase agreements. The Fund's custodian receives the collateral, which is marked-to-market daily to determine that the value of the collateral does not decrease below the repurchase price plus accrued interest as earned. If such a decrease occurs, additional collateral will be requested and, when received, will be added to the account to maintain full collateralization.
The following table presents financial instruments that are subject to enforceable netting arrangements as of June 30, 2013.
GROSS AMOUNTS NOT OFFSET IN THE STATEMENTS OF ASSETS AND LIABILITIES
| PORTFOLIO | | GROSS ASSET AMOUNT
PRESENTED IN STATEMENTS OF
ASSETS AND LIABILITIES | | FINANCIAL
INSTRUMENT | | COLLATERAL
RECEIVED | | NET AMOUNT
(NOT LESS THAN 0) | |
Money Market | | $ | 37,800,000 | | | | — | | | $( | 37,800,000 | )(1) | | $ | 0 | | |
(1) The actual collateral received is greater than the amount shown here due to overcollateralization.
D. When-Issued/Delayed Delivery Securities — The Fund may purchase or sell when-issued and delayed delivery securities. Securities purchased on a when-issued or delayed delivery basis are purchased for delivery beyond the normal settlement date at a stated price and no income accrues to the Fund on such securities prior to delivery date. Payment and delivery for when-issued and delayed delivery securities can take place a month or more after the date of the transaction. When the Fund enters into a purchase transaction on a when-issued or delayed delivery basis, securities are available for collateral in an amount at least equal in value to the Fund's commitments to purchase such securities. Purchasing securities on a when-issued or delayed delivery basis may involve a risk that the market price at the time of delivery may be lower than the agreed upon purchase price, in which case there could be an unrealized loss at the time of delivery. Purchasing investments on a when-issued or delayed delivery basis may be considered a form of leverage which may increase the impact that gains (losses) may have on the Fund.
E. Multiple Class Allocations — Investment income, expenses (other than distribution fees), and realized and unrealized gains and losses are allocated to each class of shares based upon the relative net asset value on the date such items are recognized. Distribution fees are charged directly to the respective class.
F. Foreign Currency Translation and Foreign Investments — The books and records of the Fund are maintained in U.S. dollars. Foreign currency amounts are translated into U.S. dollars at the mean of the bid and asked prices of such currencies against U.S. dollars last quoted by a major bank as follows:
— investments, other assets and liabilities at the prevailing rate of exchange on the valuation date;
— investment transactions and investment income at the prevailing rates of exchange on the dates of such transactions.
70
Morgan Stanley Variable Investment Series
Notes to Financial Statements n June 30, 2013 (unaudited) continued
Although the net assets of the Fund are presented at the foreign exchange rates and market values at the close of the period, the Fund does not isolate that portion of the results of operations arising as a result of changes in the foreign exchange rates from the fluctuations arising from changes in the market prices of securities held at period end. Similarly, the Fund does not isolate the effect of changes in foreign exchange rates from the fluctuations arising from changes in the market prices of securities sold during the period. Accordingly, realized and unrealized foreign currency gains (losses) on investments in securities are included in the reported net realized and unrealized gains (losses) on investment transactions and balances. However, pursuant to U.S. Federal income tax regulations, gains and losses from certain foreign currency transactions and the foreign currency portion of gains and losses realized on sales and maturities of foreign denominated debt securities are treated as ordinary income for U.S. Federal income tax purposes.
Net realized gains (losses) on foreign currency transactions represent net foreign exchange gains (losses) from foreign currency forward exchange contracts, disposition of foreign currencies, currency gains (losses) realized between the trade and settlement dates on securities transactions, and the difference between the amount of investment income and foreign withholding taxes recorded on the Fund's books and the U.S. dollar equivalent amounts actually received or paid. Net unrealized currency gains (losses) from valuing foreign currency denominated assets and liabilities at period end exchange rates are reflected as a component of unrealized appreciation (depreciation) on the Statements of Assets and Liabilities. The change in unrealized currency gains (losses) on foreign currency translations for the period is reflected in the Statements of Operations.
Foreign security and currency transactions may involve certain considerations and risks not typically associated with those of U.S. dollar denominated transactions as a result of, among other factors, fluctuations of exchange rates in relation to the U.S. dollar, the possibility of lower levels of governmental supervision and regulation of foreign securities markets and the possibility of political or economic instability.
G. Securities Lending — Certain Portfolios may lend securities to qualified financial institutions, such as broker-dealers, to earn additional income. Any increase or decrease in the fair value of the securities loaned that might occur and any interest earned or dividends declared on those securities during the term of the loan would remain in the Portfolio. The Portfolio receives cash or securities as collateral in an amount equal to or exceeding 100% of the current fair value of the loaned securities. The collateral is marked-to-market daily, by State Street Bank and Trust Company ("State Street"), the securities lending agent, to ensure that a minimum of 100% collateral coverage is maintained.
Based on pre-established guidelines, the securities lending agent invests any cash collateral that is received in high-quality short-term investments. Securities lending income is generated from the earnings on the invested collateral and borrowing fees, less any rebates owed to the borrowers and compensation to the lending agent.
71
Morgan Stanley Variable Investment Series
Notes to Financial Statements n June 30, 2013 (unaudited) continued
The Portfolios have the right under the lending agreement to recover the securities from the borrower on demand.
The following table presents financial instruments that are subject to enforceable netting arrangements as of June 30, 2013.
GROSS AMOUNTS NOT OFFSET IN THE STATEMENTS OF ASSETS AND LIABILITIES
| PORTFOLIO | | GROSS ASSET AMOUNTS
PRESENTED IN STATEMENTS OF
ASSETS AND LIABILITIES | | FINANCIAL
INSTRUMENT | | COLLATERAL
RECEIVED | | NET AMOUNT
(NOT LESS THAN 0) | |
Global Infrastructure | | $ | 8,996,073 | (1) | | | — | | | $( | 8,996,073 | )(2)(3) | | $ | 0 | | |
European Equity | | | 841,273 | (1) | | | — | | | | (841,273 | )(3)(4) | | | 0 | | |
(1) Represents market value of loaned securities at period end.
(2) The Portfolio received cash collateral of $4,397,859, of which $3,902,499 was subsequently invested in Repurchase Agreements and Morgan Stanley Institutional Liquidity Funds as reported in the Portfolio of Investments. As of June 30, 2013, there was uninvested cash collateral of $495,360 which is not reflected in the Portfolio of Investments. In addition, the Portfolio received non-cash collateral of $5,073,976 in the form of U.S. Government Obligations, which the Portfolio cannot sell or re-pledge and accordingly are not reflected in the Portfolio of Investments.
(3) The actual collateral received is greater than the amount shown here due to overcollateralization.
(4) The Portfolio received cash collateral of $881,194, of which $783,657 was subsequently invested in Repurchase Agreements and Morgan Stanley Institutional Liquidity Funds as reported in the Portfolio of Investments. As of June 30, 2013, there was uninvested cash collateral of $97,537 which is not reflected in the Portfolio of Investments.
H. Dividends and Distributions to Shareholders — Dividends and distributions to shareholders are recorded on the ex-dividend date.
I. Expenses — Direct expenses are charged to the respective Portfolio and general Fund expenses are allocated on the basis of relative net assets or equally among the Portfolios.
J. Use of Estimates — The preparation of financial statements in accordance with generally accepted accounting principles in the United States ("GAAP") requires management to make estimates and assumptions that affect the reported amounts and disclosures. Actual results could differ from those estimates.
K. Indemnifications — The Fund enters into contracts that contain a variety of indemnifications. The Fund's maximum exposure under these arrangements is unknown. However, the Fund has not had prior claims or losses pursuant to these contracts and expects the risk of loss to be remote.
72
Morgan Stanley Variable Investment Series
Notes to Financial Statements n June 30, 2013 (unaudited) continued
2. Fair Valuation Measurements
Financial Accounting Standards Board ("FASB") Accounting Standards Codification ("ASC") 820, Fair Value Measurements and Disclosures ("ASC 820"), defines fair value as the value that the Fund would receive to sell an investment or pay to transfer a liability in a timely transaction with an independent buyer in the principal market, or in the absence of a principal market the most advantageous market for the investment or liability. ASC 820 establishes a three-tier hierarchy to distinguish between (1) inputs that reflect the assumptions market participants would use in valuing an asset or liability developed based on market data obtained from sources independent of the reporting entity (observable inputs); and (2) inputs that reflect the reporting entity's own assumptions about the assumptions market participants would use in valuing an asset or liability developed based on the best information available in the circumstances (unobservable inputs) and to establish classification of fair value measurements for disclosure purposes. Various inputs are used in determining the value of the Fund's investments. The inputs are summarized in the three broad levels listed below.
• Level 1 — unadjusted quoted prices in active markets for identical investments
• Level 2 — other significant observable inputs (including quoted prices for similar investments, interest rates, prepayment speeds, credit risk, etc.)
• Level 3 — significant unobservable inputs including the Fund's own assumptions in determining the fair value of investments. Factors considered in making this determination may include, but are not limited to, information obtained by contacting the issuer, analysts, or the appropriate stock exchange (for exchange-traded securities), analysis of the issuer's financial statements or other available documents and, if necessary, available information concerning other securities in similar circumstances
The inputs or methodology used for valuing securities are not necessarily an indication of the risk associated with investing in those securities and the determination of the significance of a particular input to the fair value measurement in its entirety requires judgment and considers factors specific to each security.
73
Morgan Stanley Variable Investment Series
Notes to Financial Statements n June 30, 2013 (unaudited) continued
The following is a summary of the inputs used to value each Portfolio's investments as of June 30, 2013.
Investment Type | | Level 1
Unadjusted
Quoted Prices | | Level 2
Other
Significant
Observable
Inputs | | Level 3
Significant
Unobservable
Inputs | | Total | |
Money Market | |
Assets: | |
Repurchase Agreements | | $ | — | | | $ | 37,800,000 | | | $ | — | | | $ | 37,800,000 | | |
Floating Rate Notes | | | — | | | | 14,169,990 | | | | — | | | | 14,169,990 | | |
Certificates of Deposit | | | — | | | | 11,149,984 | | | | — | | | | 11,149,984 | | |
Commercial Paper | | | — | | | | 10,795,974 | | | | — | | | | 10,795,974 | | |
Extendible Floating Rate Notes | | | — | | | | 7,299,924 | | | | — | | | | 7,299,924 | | |
Tax-Exempt Instruments | |
Weekly Variable Rate Bond | | | — | | | | 3,000,000 | | | | — | | | | 3,000,000 | | |
Total Assets | | $ | — | | | $ | 84,215,872 | | | $ | — | | | $ | 84,215,872 | | |
Limited Duration | |
Assets: | |
Fixed Income Securities | |
Corporate Bonds | | $ | — | | | $ | 30,139,583 | | | $ | — | | | $ | 30,139,583 | | |
U.S. Treasury Securities | | | — | | | | 5,371,315 | | | | — | | | | 5,371,315 | | |
Asset-Backed Securities | | | — | | | | 5,179,871 | | | | — | | | | 5,179,871 | | |
Agency Adjustable Rate Mortgages | | | — | | | | 1,647,798 | | | | — | | | | 1,647,798 | | |
Collateralized Mortgage Obligations — Agency
Collateral Series | | | — | | | | 1,105,143 | | | | — | | | | 1,105,143 | | |
Agency Fixed Rate Mortgages | | | — | | | | 272,565 | | | | — | | | | 272,565 | | |
Sovereign | | | — | | | | 208,260 | | | | — | | | | 208,260 | | |
Commercial Mortgage-Backed Security | | | — | | | | 99,806 | | | | — | | | | 99,806 | | |
Total Fixed Income Securities | | | — | | | | 44,024,341 | | | | — | | | | 44,024,341 | | |
Short-Term Investments | |
U.S. Treasury Securities | | | — | | | | 84,990 | | | | — | | | | 84,990 | | |
Investment Company | | | 645,972 | | | | — | | | | — | | | | 645,972 | | |
Total Short-Term Investments | | | 645,972 | | | | 84,990 | | | | — | | | | 730,962 | | |
Credit Default Swap Agreements | | | — | | | | 522 | | | | — | | | | 522 | | |
Interest Rate Swap Agreements | | | — | | | | 112,608 | | | | — | | | | 112,608 | | |
Total Assets | | | 645,972 | | | | 44,222,461 | | | | — | | | | 44,868,433 | | |
Liabilities: | |
Futures Contracts | | | (82,844 | ) | | | — | | | | — | | | | (82,844 | ) | |
Credit Default Swap Agreements | | | — | | | | (11,694 | ) | | | — | | | | (11,694 | ) | |
Total Liabilities | | | (82,844 | ) | | | (11,694 | ) | | | — | | | | (94,538 | ) | |
Total | | $ | 563,128 | | | $ | 44,210,767 | | | $ | — | | | $ | 44,773,895 | | |
74
Morgan Stanley Variable Investment Series
Notes to Financial Statements n June 30, 2013 (unaudited) continued
Investment Type | | Level 1
Unadjusted
Quoted Prices | | Level 2
Other
Significant
Observable
Inputs | | Level 3
Significant
Unobservable
Inputs | | Total | |
Income Plus | |
Assets: | |
Fixed Income Securities | |
Corporate Bonds | | $ | — | | | $ | 156,550,810 | | | $ | — | | | $ | 156,550,810 | | |
Asset-Backed Securities | | | — | | | | 1,243,829 | | | | — | | | | 1,243,829 | | |
Agency Fixed Rate Mortgage | | | — | | | | 1,515 | | | | — | | | | 1,515 | | |
Total Fixed Income Securities | | | — | | | | 157,796,154 | | | | — | | | | 157,796,154 | | |
Convertible Preferred Stocks | | | 1,357,687 | | | | — | | | | — | | | | 1,357,687 | | |
Short-Term Investments | |
U.S. Treasury Securities | | | — | | | | 649,941 | | | | — | | | | 649,941 | | |
Investment Company | | | 1,002,163 | | | | — | | | | — | | | | 1,002,163 | | |
Total Short-Term Investments | | | 1,002,163 | | | | 649,941 | | | | — | | | | 1,652,104 | | |
Foreign Currency Forward Exchange Contracts | | | — | | | | 343 | | | | — | | | | 343 | | |
Futures Contracts | | | 432,652 | | | | — | | | | — | | | | 432,652 | | |
Credit Default Swap Agreements | | | — | | | | 1,479 | | | | — | | | | 1,479 | | |
Interest Rate Swap Agreements | | | — | | | | 1,114,562 | | | | — | | | | 1,114,562 | | |
Total Assets | | | 2,792,502 | | | | 159,562,479 | | | | — | | | | 162,354,981 | | |
Liabilities: | |
Foreign Currency Forward Exchange Contracts | | | — | | | | (2,180 | ) | | | — | | | | (2,180 | ) | |
Futures Contracts | | | (867,255 | ) | | | — | | | | — | | | | (867,255 | ) | |
Credit Default Swap Agreements | | | — | | | | (43,909 | ) | | | — | | | | (43,909 | ) | |
Interest Rate Swap Agreements | | | — | | | | (7,116 | ) | | | — | | | | (7,116 | ) | |
Total Liabilities | | | (867,255 | ) | | | (53,205 | ) | | | — | | | | (920,460 | ) | |
Total | | $ | 1,925,247 | | | $ | 159,509,274 | | | $ | — | | | $ | 161,434,521 | | |
Global Infrastructure | |
Assets: | |
Common Stocks | |
Airports | | $ | 2,658,396 | | | $ | — | | | $ | — | | | $ | 2,658,396 | | |
Communications | | | 10,802,313 | | | | — | | | | — | | | | 10,802,313 | | |
Diversified | | | 3,052,861 | | | | — | | | | — | | | | 3,052,861 | | |
| Oil & Gas Storage & Transportation | | | 34,982,733 | | | | — | | | | — | | | | 34,982,733 | | |
Ports | | | 480,422 | | | | — | | | | — | | | | 480,422 | | |
Toll Roads | | | 4,254,272 | | | | — | | | | — | | | | 4,254,272 | | |
| Transmission & Distribution | | | 9,523,959 | | | | — | | | | — | | | | 9,523,959 | | |
Water | | | 3,591,894 | | | | — | | | | — | | | | 3,591,894 | | |
Total Common Stocks | | | 69,346,850 | | | | — | | | | — | | | | 69,346,850 | | |
75
Morgan Stanley Variable Investment Series
Notes to Financial Statements n June 30, 2013 (unaudited) continued
Investment Type | | Level 1
Unadjusted
Quoted Prices | | Level 2
Other
Significant
Observable
Inputs | | Level 3
Significant
Unobservable
Inputs | | Total | |
Short-Term Investments | |
Investment Company | | $ | 3,671,806 | | | $ | — | | | $ | — | | | $ | 3,671,806 | | |
Repurchase Agreements | | | — | | | | 429,660 | | | | — | | | | 429,660 | | |
Total Short-Term Investments | | | 3,671,806 | | | | 429,660 | | | | — | | | | 4,101,466 | | |
Total Assets | | $ | 73,018,656 | | | $ | 429,660 | | | $ | — | | | $ | 73,448,316 | | |
European Equity | |
Assets: | |
Common Stocks | |
| Aerospace & Defense | | $ | 1,125,438 | | | $ | — | | | $ | — | | | $ | 1,125,438 | | |
Automobiles | | | 2,397,806 | | | | — | | | | — | | | | 2,397,806 | | |
Chemicals | | | 743,829 | | | | — | | | | — | | | | 743,829 | | |
Commercial Banks | | | 7,071,634 | | | | — | | | | — | | | | 7,071,634 | | |
Electrical Equipment | | | 1,243,569 | | | | — | | | | — | | | | 1,243,569 | | |
Food Products | | | 2,363,420 | | | | — | | | | — | | | | 2,363,420 | | |
| Health Care Providers & Services | | | 817,834 | | | | — | | | | — | | | | 817,834 | | |
| Hotels, Restaurants & Leisure | | | 797,900 | | | | — | | | | — | | | | 797,900 | | |
Household Products | | | 2,098,722 | | | | — | | | | — | | | | 2,098,722 | | |
Industrial Conglomerates | | | 1,394,809 | | | | — | | | | — | | | | 1,394,809 | | |
Information Technology Services | | | 1,080,411 | | | | — | | | | — | | | | 1,080,411 | | |
Insurance | | | 4,520,362 | | | | — | | | | — | | | | 4,520,362 | | |
Machinery | | | 812,696 | | | | — | | | | — | | | | 812,696 | | |
Media | | | 1,874,172 | | | | — | | | | — | | | | 1,874,172 | | |
| Metals & Mining | | | 864,589 | | | | — | | | | — | | | | 864,589 | | |
| Oil, Gas & Consumable Fuels | | | 5,855,327 | | | | — | | | | — | | | | 5,855,327 | | |
Pharmaceuticals | | | 7,306,971 | | | | — | | | | — | | | | 7,306,971 | | |
Professional Services | | | 1,013,097 | | | | — | | | | — | | | | 1,013,097 | | |
Tobacco | | | 2,576,984 | | | | — | | | | — | | | | 2,576,984 | | |
Wireless Telecommunication Services | | | 2,388,324 | | | | — | | | | — | | | | 2,388,324 | | |
Total Common Stocks | | | 48,347,894 | | | | — | | | | — | | | | 48,347,894 | | |
Short-Term Investments | |
Investment Company | | | 1,681,505 | | | | — | | | | — | | | | 1,681,505 | | |
Repurchase Agreements | | | — | | | | 152,056 | | | | — | | | | 152,056 | | |
Total Short-Term Investments | | | 1,681,505 | | | | 152,056 | | | | — | | | | 1,833,561 | | |
Total Assets | | $ | 50,029,399 | | | $ | 152,056 | | | $ | — | | | $ | 50,181,455 | | |
76
Morgan Stanley Variable Investment Series
Notes to Financial Statements n June 30, 2013 (unaudited) continued
Investment Type | | Level 1
Unadjusted
Quoted Prices | | Level 2
Other
Significant
Observable
Inputs | | Level 3
Significant
Unobservable
Inputs | | Total | |
Multi Cap Growth | |
Assets: | |
Common Stocks | |
Alternative Energy | | $ | 3,442,828 | | | $ | — | | | $ | — | | | $ | 3,442,828 | | |
Automobiles | | | 6,181,200 | | | | — | | | | — | | | | 6,181,200 | | |
Biotechnology | | | 9,194,244 | | | | — | | | | — | | | | 9,194,244 | | |
Chemicals: Diversified | | | 6,922,817 | | | | — | | | | — | | | | 6,922,817 | | |
Commercial Services | | | 18,651,267 | | | | — | | | | — | | | | 18,651,267 | | |
Communications Technology | | | 8,206,089 | | | | — | | | | — | | | | 8,206,089 | | |
| Computer Services, Software & Systems | | | 58,329,119 | | | | — | | | | — | | | | 58,329,119 | | |
Computer Technology | | | 11,618,372 | | | | — | | | | — | | | | 11,618,372 | | |
Consumer Lending | | | 18,581,682 | | | | — | | | | — | | | | 18,581,682 | | |
Diversified Retail | | | 34,889,139 | | | | — | | | | — | | | | 34,889,139 | | |
| Financial Data & Systems | | | 5,341,997 | | | | — | | | | — | | | | 5,341,997 | | |
Foods | | | 4,109,639 | | | | — | | | | — | | | | 4,109,639 | | |
Health Care Services | | | 8,249,864 | | | | — | | | | — | | | | 8,249,864 | | |
Insurance: Property-Casualty | | | 5,877,243 | | | | — | | | | — | | | | 5,877,243 | | |
Medical Equipment | | | 7,381,884 | | | | — | | | | — | | | | 7,381,884 | | |
Pharmaceuticals | | | 8,892,818 | | | | — | | | | — | | | | 8,892,818 | | |
| Recreational Vehicles & Boats | | | 8,079,746 | | | | — | | | | — | | | | 8,079,746 | | |
Restaurants | | | 6,845,146 | | | | — | | | | — | | | | 6,845,146 | | |
| Semiconductors & Components | | | 5,749,370 | | | | — | | | | — | | | | 5,749,370 | | |
| Textiles Apparel & Shoes | | | 5,483,235 | | | | — | | | | — | | | | 5,483,235 | | |
Total Common Stocks | | | 242,027,699 | | | | — | | | | — | | | | 242,027,699 | | |
Short-Term Investment — Investment Company | | | 606,178 | | | | — | | | | — | | | | 606,178 | | |
Total Assets | | $ | 242,633,877 | | | $ | — | | | $ | — | | | $ | 242,633,877 | | |
Transfers between investment levels may occur as the markets fluctuate and/or the availability of data used in an investment's valuation changes. The Fund recognizes transfers between the levels as of the end of the period. As of December 31, 2012, the fair value of certain securities were adjusted due to developments which occurred between the time of the close of the foreign markets on which they trade and the close of business on
77
Morgan Stanley Variable Investment Series
Notes to Financial Statements n June 30, 2013 (unaudited) continued
the NYSE which resulted in their Level 2 classification. As of June 30, 2013, securities transferred from Level 2 to Level 1. The values of the transfers were as follows:
GLOBAL
INFRASTRUCUTRE | | EUROPEAN
EQUITY | | MULTI CAP
GROWTH | |
| $ | 23,834,163 | | | $ | 45,852,146 | | | $ | 8,079,746 | | |
Following is a reconciliation of investments in which significant unobservable inputs (Level 3) were used in determining fair value:
| | | Multi Cap Growth | |
| | | Convertible
Preferred Stocks | |
Beginning Balance | | $ | 1,612,263 | | |
Purchases | | | 177,270 | | |
Sales | | | — | | |
Amortization of discount | | | — | | |
Transfers in | | | — | | |
Transfers out | | | — | | |
Corporate action | | | (374,409 | ) | |
Change in unrealized appreciation/depreciation | | | 227,961 | | |
Realized gains (losses) | | | (1,643,085 | ) | |
Ending Balance | | $ | — | | |
Net change in unrealized appreciation/depreciation from
investments still held as of June 30, 2013. | | $ | — | | |
3. Derivatives
Certain Portfolios may, but are not required to, use derivative instruments for a variety of purposes, including hedging, risk management, portfolio management or to earn income. Derivatives are financial instruments whose value is based on the value of an underlying asset, interest rate, index or financial instrument. A derivative instrument often has risks similar to its underlying asset and may have additional risks, including imperfect correlation between the value of the derivative and the underlying asset, risks of default by the counterparty to certain transactions, magnification of losses incurred due to changes in the market value of the securities, instruments, indices or interest rates to which they relate, and risks that the transactions may not be liquid. The use of derivatives involves risks that are different from, and possibly greater than, the risks associated with other portfolio investments. Derivatives may involve the use of highly specialized instruments that require investment techniques and risk analyses different from those associated with other portfolio investments. All of a Portfolio's holdings, including derivative instruments, are
78
Morgan Stanley Variable Investment Series
Notes to Financial Statements n June 30, 2013 (unaudited) continued
marked-to-market each day with the change in value reflected in unrealized appreciation (depreciation). Upon disposition, a realized gain or loss is recognized.
Certain derivative transactions may give rise to a form of leverage. Leverage magnifies the potential for gain and risk of loss. Leverage associated with derivative transactions may cause the Portfolios to liquidate portfolio positions when it may not be advantageous to do so to satisfy its obligations or to meet earmarking or segregation requirements, pursuant to applicable Securities and Exchange Commission rules and regulations, or may cause the Portfolios to be more volatile than if the Portfolios had not been leveraged. Although the Adviser and/or Sub-Advisers seek to use derivatives to further the Portfolio's investment objectives, there is no assurance that the use of derivatives will achieve this result.
Following is a description of the derivative instruments and techniques that the Portfolios used during the period and their associated risks:
Foreign Currency Forward Exchange Contracts In connection with its investments in foreign securities, certain Portfolios entered into contracts with banks, brokers or dealers to purchase or sell securities or foreign currencies at a future date. A foreign currency forward exchange contract ("currency contract") is a negotiated agreement between the contracting parties to exchange a specified amount of currency at a specified future time at a specified rate. The rate can be higher or lower than the spot rate between the currencies that are the subject of the contract. Currency contracts may be used to protect against uncertainty in the level of future foreign currency exchange rates or to gain or modify exposure to a particular currency. There is additional risk to the extent that currency contracts create exposure to currencies in which a Portfolio's securities are not denominated. Unanticipated changes in currency prices may result in poorer overall performance for a Portfolio than if it had not entered into such contracts. The use of currency contracts involves the risk of loss from the insolvency or bankruptcy of the counterparty to the contract or the failure of the counterparty to make payments or otherwise comply with the terms of the contract. A currency contract is marked-to-market daily and the change in market value is recorded by a Portfolio as unrealized gain or loss. A Portfolio records realized gains (losses) when the currency contract is closed equal to the difference between the value of the currency contract at the time it was opened and the value at the time it was closed.
Futures A futures contract is a standardized, exchange-traded agreement to buy or sell a specific quantity of an underlying instrument at a specific price at a specific future time. The value of a futures contract tends to increase and decrease in tandem with the value of the underlying instrument. Depending on the terms of the particular contract, futures contracts are settled through either physical delivery of the underlying instrument on the settlement date or by payment of a cash settlement amount on the settlement date. During
79
Morgan Stanley Variable Investment Series
Notes to Financial Statements n June 30, 2013 (unaudited) continued
the period the futures contract is open, payments are received from or made to the broker based upon changes in the value of the contract (the variation margin). A decision as to whether, when and how to use futures contracts involves the exercise of skill and judgment and even a well-conceived futures transaction may be unsuccessful because of market behavior or unexpected events. In addition to the derivatives risks discussed above, the prices of futures contracts can be highly volatile, using futures contracts can lower total return, and the potential loss from futures contracts can exceed a Portfolio's initial investment in such contracts. No assurance can be given that a liquid market will exist for any particular futures contract at any particular time. There is also the risk of loss by the Portfolio of margin deposits in the event of bankruptcy of a broker with whom the Portfolio has open positions in the futures contract.
Swaps An over-the-counter ("OTC") swap contract is an agreement between two parties pursuant to which the parties exchange payments at specified dates on the basis of a specified notional amount, with the payments calculated by reference to specified securities, indices, reference rates, currencies or other instruments. Most swap agreements provide that when the period payment dates for both parties are the same, the payments are made on a net basis (i.e., the two payment streams are netted out, with only the net amount paid by one party to the other). A Portfolio's obligations or rights under a swap contract entered into on a net basis will generally be equal only to the net amount to be paid or received under the agreement, based on the relative values of the positions held by each party. Many swap agreements are not entered into or traded on exchanges and often there is no central clearing or guaranty function for swaps. These OTC swaps are often subject to credit risk or the risk of default or non-performance by the counterparty. Swaps could result in losses if interest rates or foreign currency exchange rates or credit quality changes are not correctly anticipated by a Portfolio or if the reference index, security or investments do not perform as expected.
A Portfolio enters into credit default, interest rate and other forms of swap agreements to manage exposure to credit and interest rate risks.
A Portfolio's use of swaps during the period included those based on the credit of an underlying security commonly referred to as credit default swaps. Where a Portfolio is the buyer of a credit default swap contract, it would be entitled to receive the par (or other agreed-upon) value of a referenced debt obligation from the counterparty to the contract only in the event of a default or similar event by a third party on the debt obligation. If no default occurs, a Portfolio would have paid to the counterparty a periodic stream of payments over the term of the contract and received no benefit from the contract. When a Portfolio is the seller of a credit default swap contract, it receives the stream of payments but is obligated to pay an amount equal to the par (or other agreed upon) value of a referenced debt obligation upon the default or similar event of the issuer of the referenced debt obligation. The Dodd-Frank Wall Street Reform and Consumer
80
Morgan Stanley Variable Investment Series
Notes to Financial Statements n June 30, 2013 (unaudited) continued
Protection Act and related regulatory developments require the clearing and exchange-trading of certain OTC swap agreements. Mandatory exchange-trading and clearing is occurring on a phased-in basis.
The current credit rating of each individual issuer is listed in the table following the Portfolio of Investments and serves as an indicator of the current status of the payment/performance risk of the credit derivative. Alternatively, for credit default swaps on an index of credits, the quoted market prices and current values serve as an indicator of the current status of the payment/performance risk of the credit derivative. Generally, lower credit ratings and increasing market values, in absolute terms, represent a deterioration of the credit and a greater likelihood of an adverse credit event of the issuer.
When a Portfolio has an unrealized loss on a swap agreement, the Portfolio has instructed the custodian to pledge cash or liquid securities as collateral with a value approximately equal to the amount of the unrealized loss. Collateral pledges are monitored and subsequently adjusted if and when the swap valuations fluctuate. If applicable, cash collateral is included with "Due from (to) Broker" in the Statements of Assets and Liabilities.
Upfront payments received or paid by a Portfolio will be reflected as an asset or liability in the Statements of Assets and Liabilities.
FASB ASC 815, Derivatives and Hedging: Overall ("ASC 815"), is intended to improve financial reporting about derivative instruments by requiring enhanced disclosures to enable investors to better understand how and why a Portfolio uses derivative instruments, how these derivative instruments are accounted for and their effects on a Portfolio's financial position and results of operations.
The following table sets forth the fair value of each Portfolio's derivative contracts by primary risk exposure as of June 30, 2013.
PORTFOLIO | | PRIMARY RISK
EXPOSURE | | ASSET DERIVATIVES
STATEMENTS OF
ASSETS AND
LIABILITIES LOCATION | | FAIR VALUE | | LIABILITY DERIVATIVES
STATEMENTS OF
ASSETS AND
LIABILITIES LOCATION | | FAIR VALUE | |
Limited Duration | | Interest Rate | | Net variation margin | | $ | — | | | Net variation margin | | $ | (82,844 | )† | |
| | | Risk
| | Unrealized appreciation
on open swap agreements | | | 112,608 | | | Unrealized depreciation
on open swap agreements | | | — | | |
| | | Credit Risk
| | Unrealized appreciation
on open swap agreements | | | 522 | | | Unrealized depreciation
on open swap agreements | | | (11,694 | ) | |
| | | | | Total | | $ | 113,130 | | | Total | | $ | (94,538 | ) | |
81
Morgan Stanley Variable Investment Series
Notes to Financial Statements n June 30, 2013 (unaudited) continued
PORTFOLIO | | PRIMARY RISK
EXPOSURE | | ASSET DERIVATIVES
STATEMENTS OF
ASSETS AND
LIABILITIES LOCATION | | FAIR VALUE | | LIABILITY DERIVATIVES
STATEMENTS OF
ASSETS AND
LIABILITIES LOCATION | | FAIR VALUE | |
Income Plus | | Interest Rate | | Net variation margin | | $ | 432,652 | † | | Net variation margin | | $ | (867,255 | )† | |
| | | Risk
| | Unrealized appreciation
on open swap agreements | | | 1,114,562 | | | Unrealized depreciation
on open swap agreements | | | (7,116 | ) | |
| | | Credit Risk
| | Unrealized appreciation
on open swap agreements | | | 1,479 | | | Unrealized depreciation
on open swap agreements | | | (43,909 | ) | |
| | | Foreign
Currency
Risk
| | Unrealized appreciation
on open foreign currency
forward exchange
contracts | | | 343 | | | Unrealized depreciation
on open foreign currency
forward exchange
contracts | | | (2,180 | ) | |
| | | | | Total | | $ | 1,549,036 | | | Total | | $ | (920,460 | ) | |
† Includes cumulative appreciation (depreciation) of futures contracts as reported in the Portfolio of Investments. Only current day's net variation margin is reported within the Statements of Assets and Liabilities.
The following tables set forth by primary risk exposure of each Portfolio's realized gains (losses) and change in unrealized appreciation (depreciation) by type of derivative contract for the six months ended June 30, 2013 in accordance with ASC 815.
AMOUNT OF REALIZED GAIN (LOSS) ON DERIVATIVE CONTRACTS
PORTFOLIO | | PRIMARY RISK
EXPOSURE | | FUTURES | | FOREIGN
CURRENCY
FORWARD
EXCHANGE | | SWAPS | |
Limited Duration | | Interest Rate Risk | | $ | (167,609 | ) | | $ | — | | | $ | 114,099 | | |
| | | Credit Risk | | | — | | | | — | | | | (12,056 | ) | |
| | | Total | | $ | (167,609 | ) | | $ | — | | | $ | 102,043 | | |
Income Plus | | Interest Rate Risk | | $ | (781,238 | ) | | $ | — | | | $ | 365,670 | | |
| | | Credit Risk | | | | | | | | | | | 12,572 | | |
| | | Foreign Currency Risk | | | — | | | | 4,825 | | | | — | | |
| | | Total | | $ | (781,238 | ) | | $ | 4,825 | | | $ | 378,242 | | |
82
Morgan Stanley Variable Investment Series
Notes to Financial Statements n June 30, 2013 (unaudited) continued
CHANGE IN UNREALIZED APPRECIATION (DEPRECIATION) ON DERIVATIVE CONTRACTS
PORTFOLIO | | PRIMARY RISK
EXPOSURE | | FUTURES | | FOREIGN
CURRENCY
FORWARD
EXCHANGE | | SWAPS | |
Limited Duration | | Interest Rate Risk | | $ | (71,974 | ) | | $ | — | | | $ | 143,876 | | |
| | | Credit Risk | | | — | | | | — | | | | (11,172 | ) | |
| | | Total | | $ | (71,974 | ) | | $ | — | | | $ | 132,704 | | |
Income Plus | | Interest Rate Risk | | $ | (354,900 | ) | | $ | — | | | $ | 1,458,781 | | |
| | | Credit Risk | | | | | | | | | | | (108,777 | ) | |
| | | Foreign Currency Risk | | | — | | | | 3,135 | | | | — | | |
| | | Total | | $ | (354,900 | ) | | $ | 3,135 | | | $ | 1,350,004 | | |
The following tables present derivatives financial instruments that are subject to enforceable netting arrangements as of June 30, 2013.
GROSS AMOUNTS NOT OFFSET IN THE STATEMENTS OF ASSETS AND LIABILITIES
PORTFOLIO | | COUNTERPARTY | | GROSS ASSET
DERIVATIVES
PRESENTED IN
STATEMENTS OF
ASSETS AND
LIABILITIES | | FINANCIAL
INSTRUMENT | | COLLATERAL
RECEIVED | | NET AMOUNT
(NOT LESS
THAN 0) | |
Limited Duration | | Bank of America | | $ | 25,264 | | | $ | — | | | $ | — | | | $ | 25,264 | | |
| | | Goldman Sachs | | | 42,432 | | | | — | | | | — | | | | 42,432 | | |
| | | JPMorgan Chase | | | 522 | | | | (522 | ) | | | — | | | | 0 | | |
| | | Royal Bank of Canada | | | 44,912 | | | | — | | | | — | | | | 44,912 | | |
| | | Total | | $ | 113,130 | | | $ | (522 | ) | | $ | — | | | $ | 112,608 | | |
Income Plus | | Bank of America | | $ | 89,850 | | | $ | — | | | $ | — | | | $ | 89,850 | | |
| | | Deutsche Bank | | | 779,516 | | | | — | | | | (779,516 | )* | | | 0 | | |
| | | Exchange Traded Futures | | | 432,652 | † | | | — | | | | — | | | | 432,652 | † | |
| | | JPMorgan Chase | | | 161,433 | | | | (44,182 | ) | | | — | | | | 117,251 | | |
| | | Royal Bank of Canada | | | 85,242 | | | | — | | | | (85,242 | )* | | | 0 | | |
| | | Wells Fargo Bank | | | 343 | | | | — | | | | — | | | | 343 | | |
| | | Total | | $ | 1,549,036 | | | $ | (44,182 | ) | | $ | (864,758 | ) | | $ | 640,096 | | |
83
Morgan Stanley Variable Investment Series
Notes to Financial Statements n June 30, 2013 (unaudited) continued
GROSS AMOUNTS NOT OFFSET IN THE STATEMENTS OF ASSETS AND LIABILITIES
PORTFOLIO | | COUNTERPARTY | | GROSS
LIABILITY
DERIVATIVES
PRESENTED IN
STATEMENTS OF
ASSETS AND
LIABILITIES | | FINANCIAL
INSTRUMENT | | COLLATERAL
PLEDGED | | NET AMOUNT
(NOT LESS
THAN 0) | |
Limited Duration | | Barclays Bank | | $ | 879 | | | $ | — | | | $ | — | | | $ | 879 | | |
| | | Exchange Traded Futures | | | 82,844 | † | | | — | | | | — | | | | 82,844 | † | |
| | | JPMorgan Chase | | | 10,815 | | | | (522 | ) | | | — | | | | 10,293 | | |
| | | Total | | $ | 94,538 | | | $ | (522 | ) | | $ | — | | | $ | 94,016 | | |
Income Plus | | Barclays Bank | | $ | 2,988 | | | $ | — | | | $ | — | | | $ | 2,988 | | |
| | | Exchange Traded Futures | | | 867,255 | † | | | — | | | | — | | | | 867,255 | † | |
| | | Goldman Sachs | | | 3,855 | | | | — | | | | — | | | | 3,855 | | |
| | | HSBC | | | 1,833 | | | | — | | | | — | | | | 1,833 | | |
| | | JPMorgan Chase | | | 44,182 | | | | (44,182 | ) | | | — | | | | 0 | | |
| | | Wells Fargo Bank | | | 347 | | | | — | | | | — | | | | 347 | | |
| | | Total | | $ | 920,460 | | | $ | (44,182 | ) | | $ | — | | | $ | 876,278 | | |
* In some instances the actual collateral received and/or pledged may be more than the amount shown due to overcollateralization.
† Includes cumulative appreciation (depreciation) of futures contracts as reported in the Portfolio of Investments. Only current day's net variation margin is reported within the Statements of Assets and Liabilities.
For the six months ended June 30, 2013, the average monthly amount outstanding for each derivative type is as follows:
Limited Duration: | |
Futures Contracts: | |
Average monthly original value | | $ | 12,249,095 | | |
Swap Agreements: | |
Average monthly notional amount | | $ | 9,126,667 | | |
Income Plus: | |
Foreign Currency Forward Exchange Contracts: | |
Average monthly principal amount | | $ | 1,205,806 | | |
Futures Contracts: | |
Average monthly original value | | $ | 101,117,114 | | |
Swap Agreements: | |
Average monthly notional amount | | $ | 36,066,667 | | |
84
Morgan Stanley Variable Investment Series
Notes to Financial Statements n June 30, 2013 (unaudited) continued
4. Advisory/Administration and Sub-Advisory Agreements
Pursuant to an Investment Advisory Agreement with the Adviser and Sub-Advisers, the Fund pays an advisory fee, accrued daily and payable monthly, by applying the annual rates listed below to each Portfolio's net assets determined at the close of each business day.
Money Market — 0.45% to the portion of the daily net assets not exceeding $250 million; 0.375% to the portion of the daily net assets exceeding $250 million but not exceeding $750 million; 0.325% to the portion of the daily net assets exceeding $750 million but not exceeding $1.25 billion; 0.30% to the portion of the daily net assets exceeding $1.25 billion but not exceeding $1.5 billion; and 0.275% to the portion of the daily net assets in excess of $1.5 billion. For the six months ended June 30, 2013, the advisory fee rate (net of waivers) was equivalent to an annual effective rate of 0.01% of the Portfolio's daily net assets.
Limited Duration — 0.30%.
Income Plus — 0.42% to the portion of the daily net assets not exceeding $500 million; 0.35% to the portion of the daily net assets exceeding $500 million but not exceeding $1.25 billion; and 0.22% to the portion of the daily net assets in excess of $1.25 billion. For the six months ended June 30, 2013, the advisory fee rate (net of rebate) was equivalent to an annual effective rate of 0.42% of the Portfolio's daily net assets.
Global Infrastructure — 0.57% to the portion of the daily net assets not exceeding $500 million; 0.47% to the portion of the daily net assets exceeding $500 million but not exceeding $1 billion; 0.445% to the portion of the daily net assets exceeding $1 billion but not exceeding $1.5 billion; 0.42% to the portion of the daily net assets exceeding $1.5 billion but not exceeding $2.5 billion; 0.395% to the portion of the daily net assets exceeding $2.5 billion but not exceeding $3.5 billion; 0.37% to the portion of the daily net assets exceeding $3.5 billion but not exceeding $5 billion; and 0.345% to the portion of the daily net assets in excess of $5 billion. For the six months ended June 30, 2013, the advisory fee rate (net of rebate) was equivalent to an annual effective rate of 0.57% of the Portfolio's daily net assets.
European Equity — 0.87% to the portion of the daily net assets not exceeding $500 million; 0.82% to the portion of the daily net assets exceeding $500 million but not exceeding $2 billion; 0.77% to the portion of the daily net assets exceeding $2 billion but not exceeding $3 billion; and 0.745% to the portion of the daily net assets in excess of $3 billion. For the six months ended June 30, 2013, the advisory fee rate (net of waivers/rebate/reimbursement) was equivalent to an annual effective rate of 0.67% of the Portfolio's daily net assets.
85
Morgan Stanley Variable Investment Series
Notes to Financial Statements n June 30, 2013 (unaudited) continued
Multi Cap Growth — 0.42% to the portion of the daily net assets not exceeding $1 billion; 0.395% to the portion of the daily net assets exceeding $1 billion but not exceeding $2 billion; and 0.37% to the portion of the daily net assets in excess of $2 billion. For the six months ended June 30, 2013, the advisory fee rate (net of rebate) was equivalent to an annual effective rate of 0.42% of the Portfolio's daily net assets.
Under the Sub-Advisory Agreement between the Adviser and the Sub-Advisers, the Sub-Advisers provide Global Infrastructure Portfolio and European Equity Portfolio with advisory services subject to the overall supervision of the Adviser and the Fund's Officers and Trustees. The Adviser pays the Sub-Advisers on a monthly basis a portion of the net advisory fees the Adviser receives from each Portfolio.
The Adviser and Morgan Stanley Services Company Inc. (the "Administrator"), have agreed to reduce its advisory fee, its administration fee and/or reimburse European Equity Portfolio so that total annual Portfolio operating expenses, excluding certain investment related expenses, 12b-1 fees, taxes, interest and other extraordinary expenses (including litigation), will not exceed 1.00%. The fee waivers and/or expense reimbursements will continue for at least one year or until such time as the Trustees act to discontinue all or a portion of such waivers and/or reimbursements when it deems such action is appropriate. For the six months ended June 30, 2013, $51,221 of advisory fees were waived and/or reimbursed pursuant to this arrangement.
Pursuant to the Reorganization (defined herein), the Adviser and Administrator have agreed to reduce its advisory fee, its administration fee and/or reimburse Multi Cap Growth Portfolio so that total Portfolio operating expenses, excluding certain investment related expenses, 12b-1 fees, taxes, interest and other extraordinary expenses (including litigation), will not exceed 0.57% . The fee waivers and/or expense reimbursements will continue for at least two years from the date of the Reorganization or until such time as the Trustees act to discontinue all or a portion of such waivers and/or reimbursements when it deems such action is appropriate.
Pursuant to an Administration Agreement with the Administrator, an affiliate of the Adviser and Sub-Advisers, each Portfolio pays an administration fee, accrued daily and payable monthly, by applying the annual rate of 0.08% (Money Market Portfolio's rate is 0.05%) to the Portfolio's daily net assets.
Under a Sub-Administration agreement between the Administrator and State Street, State Street provides certain administrative services to the Fund. For such services, the Administrator pays State Street a portion of the fee the Administrator receives from each Portfolio.
86
Morgan Stanley Variable Investment Series
Notes to Financial Statements n June 30, 2013 (unaudited) continued
5. Plan of Distribution
Shares of the Fund are distributed by Morgan Stanley Distribution, Inc. (the "Distributor"), an affiliate of the Adviser, Administrator and Sub-Advisers. The Fund has adopted a Plan of Distribution (the "Plan") pursuant to Rule 12b-1 under the Act. Under the Plan, Class Y shares of each Portfolio bear a distribution fee which is accrued daily and paid monthly at the annual rate of 0.25% of the average daily net assets of the class.
The Distributor, Adviser and Administrator have agreed to waive/reimburse all or a portion of the Money Market Portfolio's distribution fee, advisory fee and administration fee, respectively, to the extent that total expenses exceed total income of the Money Market Portfolio on a daily basis. For the six months ended June 30, 2013, the Distributor waived $56,981, the Adviser waived $189,733 and the Administrator waived $3,903. These fee waivers and/or expense reimbursements will continue for at least one year or until such time that the Trustees act to discontinue all or a portion of such waivers and/or expense reimbursements when it deems such action is appropriate.
6. Security Transactions and Transactions with Affiliates
For the six months ended June 30, 2013, purchases and sales of investment securities, excluding short-term investments, were as follows:
| | | U.S. GOVERNMENT SECURITIES | | OTHER | |
PORTFOLIO | | PURCHASES | | SALES | | PURCHASES | | SALES | |
Limited Duration | | $ | 2,755,157 | | | $ | 4,971,627 | | | $ | 8,638,441 | | | $ | 9,302,430 | | |
Income Plus | | | — | | | | 23 | | | | 54,718,463 | | | | 63,762,973 | | |
Global Infrastructure | | | — | | | | — | | | | 10,661,342 | | | | 14,901,285 | | |
European Equity | | | — | | | | — | | | | 2,615,081 | | | | 6,624,877 | | |
Multi Cap Growth | | | — | | | | — | | | | 53,183,272 | | | | 69,711,884 | | |
Each Portfolio (except Money Market) invests in the Institutional Class of the Morgan Stanley Institutional Liquidity Funds (the "Liquidity Funds"), an open-end management investment company managed by the Adviser, both directly, and as a portion of the securities held as collateral on loaned securities. Advisory fees paid by each Portfolio are reduced by an amount equal to its pro-rata share of advisory and administrative fees paid by each Portfolio due to its investment in the Liquidity Funds.
87
Morgan Stanley Variable Investment Series
Notes to Financial Statements n June 30, 2013 (unaudited) continued
A summary of each Portfolio's transactions in shares of the Liquidity Funds during the six months ended June 30, 2013 is as follows:
PORTFOLIO | | VALUE
DECEMBER 31, 2012 | | PURCHASES
AT COST | | SALES | | DIVIDEND
INCOME | | VALUE
JUNE 30, 2013 | |
Limited Duration | | $ | 1,439,331 | | | $ | 11,854,163 | | | $ | 12,647,522 | | | $ | 483 | | | $ | 645,972 | | |
Income Plus | | | 6,041,017 | | | | 32,256,501 | | | | 37,295,355 | | | | 2,320 | | | | 1,002,163 | | |
Global Infrastructure | | | 1,300,782 | | | | 11,008,677 | | | | 8,637,653 | | | | 150 | | | | 3,671,806 | | |
European Equity | | | 961,419 | | | | 5,642,461 | | | | 4,922,375 | | | | 294 | | | | 1,681,505 | | |
Multi Cap Growth | | | 4,451,243 | | | | 44,843,931 | | | | 48,688,996 | | | | 3,654 | | | | 606,178 | | |
In addition, the table also identifies the income distributions earned, if any, by each Portfolio for that Portfolio's investment in the Liquidity Funds.
Income distributions are included in "Interest and dividends from affiliates" in the Statements of Operations.
PORTFOLIO | | ADVISORY FEE
REDUCTION | |
Limited Duration | | $ | 579 | | |
Income Plus | | | 2,687 | | |
Global Infrastructure | | | 716 | | |
European Equity | | | 360 | | |
Multi Cap Growth | | | 4,469 | | |
The following Portfolios had transactions with the following affiliates of the Fund:
PORTFOLIO | | ISSUER | | VALUE
DECEMBER 31,
2012 | | PURCHASES
AT COST | | SALES | | NET
REALIZED
GAIN | | INTEREST
INCOME | | VALUE
JUNE 30,
2013 | |
Limited
Duration | | Metropolitan Life
Global Funding I | | $ | 534,012 | | | $ | 273,565 | | | $ | 534,466 | | | $ | 8,018 | | | $ | 2,129 | | | $ | 266,904 | | |
Income Plus | | MetLife Capital Trust IV | | | 741,000 | | | | — | | | | — | | | | — | | | | 23,363 | | | | 717,544 | | |
The following Portfolios had transactions with Citigroup, Inc., and its affiliated broker-dealers, which may be deemed to be affiliates of the Adviser, Sub-Advisers, Administrator and Distributor under Section 17 of the Act, for the six months ended June 30, 2013:
PORTFOLIO | | VALUE
DECEMBER 31,
2012 | | PURCHASES
AT COST | | SALES | | NET
REALIZED
GAIN (LOSS) | | INTEREST
INCOME | | VALUE
JUNE 30,
2013 | |
Limited Duration | | $ | 449,075 | | | $ | 102,497 | | | $ | 741 | | | $ | — | | | $ | 9,470 | | | $ | 533,830 | | |
Income Plus | | | 2,095,151 | | | | 1,653,156 | | | | 2,062,776 | | | | 481,934 | | | | 49,856 | | | | 1,589,881 | | |
88
Morgan Stanley Variable Investment Series
Notes to Financial Statements n June 30, 2013 (unaudited) continued
For the six months ended June 30, 2013, Multi Cap Growth incurred $3,721 in brokerage commissions with Morgan Stanley & Co., LLC, an affiliate of the Adviser, Sub-Advisers, Administrator and Distributor, for portfolio transactions executed on behalf of the Portfolio:
For the six months ended June 30, 2013, the following Portfolios incurred brokerage commissions with Citigroup, Inc., and its affiliated broker-dealers, which may be deemed affiliates of the Adviser, Sub-Advisers, Administrator and Distributor under Section 17 of the Act, for portfolio transactions executed on behalf of each Portfolio:
GLOBAL
INFRASTRUCTURE | | EUROPEAN
EQUITY | | MULTI CAP
GROWTH | |
| $ | 132 | | | $ | 96 | | | $ | 1,883 | | |
Morgan Stanley Services Company Inc., an affiliate of the Adviser, Sub-Advisers and Distributor, was the Fund's transfer agent. Effective July 1, 2013, the Trustees approved changing the transfer agent to Boston Financial Data Services, Inc.
The Fund has an unfunded noncontributory defined benefit pension plan covering certain independent Trustees of the Fund who will have served as independent Trustees for at least five years at the time of retirement. Benefits under this plan are based on factors which include years of service and compensation. The Trustees voted to close the plan to new participants and eliminate the future benefits growth due to increases to compensation after July 31, 2003.
Aggregate pension costs for the six months ended June 30, 2013, included in "Trustees' fees and expenses" in the Statements of Operations and the accrued pension liability included in "accrued expenses and other payables" in the Statements of Assets and Liabilities are as follows:
| | | AGGREGATE PENSION COSTS | |
MONEY
MARKET | | LIMITED
DURATION | | INCOME
PLUS | | GLOBAL
INFRASTRUCTURE | | EUROPEAN
EQUITY | | MULTI CAP
GROWTH | |
$ | 159 | | | $ | 89 | | | $ | 302 | | | $ | 121 | | | $ | 100 | | | $ | 380 | | |
| | | AGGREGATE PENSION LIABILITY | |
MONEY
MARKET | | LIMITED
DURATION | | INCOME
PLUS | | GLOBAL
INFRASTRUCTURE | | EUROPEAN
EQUITY | | MULTI CAP
GROWTH | |
$ | 5,224 | | | $ | 2,721 | | | $ | 8,956 | | | $ | 2,736 | | | $ | 2,505 | | | $ | 10,545 | | |
89
Morgan Stanley Variable Investment Series
Notes to Financial Statements n June 30, 2013 (unaudited) continued
The Fund has an unfunded Deferred Compensation Plan (the "Compensation Plan"), which allows each independent Trustee to defer payment of all, or a portion, of the fees they receive for serving on the Board of Trustees. Each eligible Trustee generally may elect to have the deferred amounts credited with a return equal to the total return on one or more of the Morgan Stanley funds that are offered as investment options under the Compensation Plan. Appreciation/depreciation and distributions received from these investments are recorded with an offsetting increase/decrease in the deferred compensation obligation and do not affect the net asset value of the Fund.
7. Federal Income Tax Status
It is the Portfolios' intention to continue to qualify as a regulated investment company and distribute all of its taxable and tax-exempt income. Accordingly, no provision for Federal income taxes is required in the financial statements.
Dividend income and distributions to shareholders are recorded on the ex-dividend date. Interest income is recognized on an accrual basis. Dividends from net investment income, if any, are declared and paid annually. Net realized capital gains, if any, are distributed at least annually.
A Portfolio may be subject to taxes imposed by countries in which it invests. Such taxes are generally based on income and/or capital gains earned or repatriated. Taxes are accrued based on net investment income, net realized gains and net unrealized appreciation as such income and/or gains are earned. Taxes may also be based on transactions in foreign currency and are accrued based on the value of investments denominated in such currency.
FASB ASC 740-10, Income Taxes — Overall, sets forth a minimum threshold for financial statement recognition of the benefit of a tax position taken or expected to be taken in a tax return. Management has concluded there are no significant uncertain tax positions that would require recognition in the financial statements. If applicable, the Portfolios recognize interest accrued related to unrecognized tax benefits in "Interest Expense" and penalties in "Other Expenses" in the Statements of Operations. The Portfolios file tax returns with the U.S. Internal Revenue Service, New York and various states. Each of the tax years in the four-year period ended December 31, 2012, remains subject to examination by taxing authorities.
90
Morgan Stanley Variable Investment Series
Notes to Financial Statements n June 30, 2013 (unaudited) continued
The tax character of distributions paid may differ from the character of distributions shown in the Statements of Changes in Net Assets due to short-term capital gains being treated as ordinary income for tax purposes. The tax character of distributions paid during fiscal years 2012 and 2011 was as follows:
| | | 2012 DISTRIBUTIONS PAID FROM: | | 2011 DISTRIBUTIONS PAID FROM: | |
PORTFOLIO | | ORDINARY
INCOME | | LONG-TERM
CAPITAL GAIN | | ORDINARY
INCOME | | LONG-TERM
CAPITAL GAIN | |
Money Market | | $ | 10,504 | | | $ | — | | | $ | 11,709 | | | $ | — | | |
Limited Duration | | | 1,503,210 | | | | — | | | | 1,919,268 | | | | — | | |
Income Plus | | | 10,700,252 | | | | — | | | | 12,237,165 | | | | — | | |
Global Infrastructure | | | 2,854,317 | | | | 5,230,425 | | | | 1,889,924 | | | | 3,948,735 | | |
European Equity | | | 1,421,625 | | | | — | | | | 1,488,782 | | | | — | | |
Multi Cap Growth | | | — | | | | 4,886,471 | | | | 327,516 | | | | 5 | | |
The amount and character of income and gains to be distributed are determined in accordance with income tax regulations which may differ from GAAP. These book/tax differences are either considered temporary or permanent in nature.
Temporary differences are primarily due to differing book and tax treatments for the timing of the recognition of gains (losses) on certain investment transactions and the timing of the deductibility of certain expenses.
Permanent differences, primarily due to differing treatments of gains (losses) related to foreign currency transactions, swap transactions, paydown adjustments, expiring capital losses, net operating losses, partnership basis adjustments, distribution redesignations, book amortization of premium on debt securities, nondeductible expenses and certain equity securities designated as issued by passive foreign investment companies, resulted in the following reclassifications among the Portfolio's components of net assets at December 31, 2012:
PORTFOLIO | | ACCUMULATED UNDISTRIBUTED
(DISTRIBUTIONS IN EXCESS OF)
NET INVESTMENT INCOME | | ACCUMULATED
NET REALIZED GAIN (LOSS) | | PAID-IN-CAPITAL | |
Money Market | | $ | (61 | ) | | $ | 61 | | | $ | — | | |
Limited Duration | | | 354,921 | | | | 3,670,702 | | | | (4,025,623 | ) | |
Income Plus | | | 364,461 | | | | (364,461 | ) | | | — | | |
Global Infrastructure | | | 76,230 | | | | (76,230 | ) | | | — | | |
European Equity | | | (418,886 | ) | | | 418,886 | | | | — | | |
Multi Cap Growth | | | 54,657 | | | | (54,657 | ) | | | — | | |
91
Morgan Stanley Variable Investment Series
Notes to Financial Statements n June 30, 2013 (unaudited) continued
At December 31, 2012, the components of distributable earnings on a tax basis were as follows:
PORTFOLIO | | UNDISTRIBUTED
ORDINARY
INCOME | | UNDISTRIBUTED
LONG-TERM
CAPITAL GAIN | |
Money Market | | $ | 5,186 | | | $ | — | | |
Limited Duration | | | 1,067,041 | | | | — | | |
Income Plus | | | 8,060,936 | | | | — | | |
Global Infrastructure | | | 1,864,469 | | | | 5,863,655 | | |
European Equity | | | 1,517,809 | | | | — | | |
Multi Cap Growth | | | 953,113 | | | | 3,476,909 | | |
At June 30, 2013, cost, gross unrealized appreciation (depreciation) and net unrealized appreciation (depreciation) of the investments of each of the Portfolios were:
PORTFOLIO | | COST | | APPRECIATION | | DEPRECIATION | | NET APPRECIATION
(DEPRECIATION) | |
Money Market | | $ | 84,215,872 | | | $ | — | | | $ | — | | | $ | — | | |
Limited Duration | | | 44,474,124 | | | | 944,620 | | | | (663,441 | ) | | | 281,179 | | |
Income Plus | | | 157,257,895 | | | | 7,553,994 | | | | (4,005,944 | ) | | | 3,548,050 | | |
Global Infrastructure | | | 57,643,331 | | | | 16,198,046 | | | | (393,061 | ) | | | 15,804,985 | | |
European Equity | | | 38,758,031 | | | | 13,056,055 | | | | (1,632,631 | ) | | | 11,423,424 | | |
Multi Cap Growth | | | 167,855,745 | | | | 80,377,759 | | | | (5,599,627 | ) | | | 74,778,132 | | |
On December 22, 2010, the Regulated Investment Company Modernization Act of 2010 (the "Modernization Act") was signed into law. The Modernization Act modernizes several tax provisions related to Regulated Investment Companies ("RICs") and their shareholders. One key change made by the Modernization Act is that capital losses will generally retain their character as short-term or long-term and may be carried forward indefinitely to offset future gains. These losses are utilized before other capital loss carryforwards that expire. Generally, the Modernization Act is effective for taxable years beginning after December 22, 2010.
At December 31, 2012, the following Portfolios had available for Federal income tax purposes unused short term and/or long term capital losses that will not expire:
PORTFOLIO | | SHORT TERM LOSSES
(NO EXPIRATION) | | LONG TERM LOSSES
(NO EXPIRATION) | |
Money Market | | $ | 1,935 | | | $ | — | | |
Limited Duration | | | — | | | | 169,582 | | |
European Equity | | | 51,260 | | | | 22,783 | | |
92
Morgan Stanley Variable Investment Series
Notes to Financial Statements n June 30, 2013 (unaudited) continued
In addition, at December 31, 2012, the following Portfolios had available capital loss carryforwards to offset future net capital gains, to the extent provided by regulations, through the indicated expiration dates:
| | | AMOUNT IN THOUSANDS AVAILABLE THROUGH DECEMBER 31, | |
PORTFOLIO | | 2013 | | 2014 | | 2015 | | 2016 | | 2017 | | 2018 | | TOTAL | |
Limited Duration | | $ | 1,267 | | | $ | 2,233 | | | $ | 1,063 | | | $ | 17,119 | | | $ | 8,980 | | | $ | — | | | $ | 30,662 | | |
Income Plus | | | — | | | | — | | | | — | | | | 10,349 | | | | — | | | | — | | | | 10,349 | | |
European Equity | | | — | | | | — | | | | — | | | | — | | | | 10,552 | | | | 3,315 | | | | 13,867 | | |
During the year ended December 31, 2012, the following Portfolios expired capital loss carryforwards for U.S. Federal income tax purposes as follows:
PORTFOLIO | | EXPIRED CAPITAL LOSS
CARRYFORWARDS | |
Limited Duration | | $ | 4,025,623 | | |
To the extent that capital loss carryforwards are used to offset any future capital gains realized during the carryover period as provided by U.S. Federal income tax regulations, no capital gains tax liability will be incurred by a Portfolio for gains realized and not distributed. To the extent that capital gains are offset, such gains will not be distributed to the shareholders.
During the year ended December 31, 2012, the following Portfolios utilized capital loss carryforwards for U.S. Federal income tax purposes as follows:
PORTFOLIO | | UTILIZED CAPITAL LOSS
CARRYFORWARDS | |
Money Market | | $ | 76 | | |
Income Plus | | | 9,226,616 | | |
8. Purposes of and Risks Relating to Certain Financial Instruments
Certain Portfolios may lend securities to qualified financial institutions, such as broker-dealers, to earn additional income. Risks in securities lending transactions are that a borrower may not provide additional collateral when required or return the securities when due, and that the value of the short-term investments will be less than the amount of cash collateral plus any rebate that is required to be returned to the borrower.
Certain Portfolios may invest in mortgage securities, including securities issued by Federal National Mortgage Association ("FNMA") and Federal Home Loan Mortgage Corporation ("FHLMC"). These are fixed income securities that derive their value from or represent interests in a pool of mortgages or mortgage securities. An unexpectedly high rate of defaults on the mortgages held by a mortgage pool may adversely affect the value of a mortgage backed security and could result in losses to the Portfolio. The risk of such defaults is generally higher in the case of mortgage pools that include sub-prime mortgages. Sub-prime
93
Morgan Stanley Variable Investment Series
Notes to Financial Statements n June 30, 2013 (unaudited) continued
mortgages refer to loans made to borrowers with weakened credit histories or with a lower capacity to make timely payments on their mortgages. The securities issued by FNMA and FHLMC that are held by the Portfolios are not backed by sub-prime mortgages.
Additionally, securities issued by FNMA and FHLMC are not backed by or entitled to the full faith and credit of the United States; rather, they are supported by the right of the issuer to borrow from the U.S. Department of the Treasury.
The Federal Housing Finance Agency ("FHFA") serves as conservator of FNMA and FHLMC and the U.S. Department of the Treasury has agreed to provide capital as needed to ensure FNMA and FHLMC continue to provide liquidity to the housing and mortgage markets.
The Money Market Portfolio may enter into repurchase agreements under which the Portfolio sends cash and takes possession of securities with an agreement that the counterparty will repurchase such securities. In the event of default on the obligation to repurchase, the Portfolio has the right to liquidate the collateral and apply the proceeds in satisfaction of the obligation. In the event of default or bankruptcy by the counterparty to the agreement, realization of the collateral proceeds may be subject to certain costs and delays.
At June 30, 2013, European Equity Portfolio's investments in securities of issuers in the United Kingdom, Switzerland, Germany and France represented 39.8%, 15.5%, 14.3% and 14.2%, respectively of the Portfolio's net assets. These investments, as well as other non-U.S. investments, which involve risks and considerations not present with respect to U.S. securities, may be affected by economic or political developments in these countries.
9. Portfolio Mergers
On April 29, 2013, the Multi Cap Growth Portfolio (the "Portfolio") acquired the net assets of Morgan Stanley Variable Investment Series Aggressive Equity Portfolio ("Aggressive Equity Portfolio"), an open-end investment company, based on the respective valuations as of the close of business on April 26, 2013, pursuant to a Plan of Reorganization approved by the shareholders of Aggressive Equity Portfolio on February 21, 2013 ("Reorganization"). The purpose of the transaction was to combine two portfolios managed by Morgan Stanley Investment Management Inc. with comparable investment objectives and strategies. The acquisition was accomplished by a tax-free exchange of 249,276 Class X shares of the Portfolio at a net asset value of $44.02 per share for 592,874 Class X shares of Aggressive Equity Portfolio; 360,951 Class Y shares of the Portfolio at a net asset value of $43.50 for 875,713 Class Y shares of Aggressive Equity Portfolio. The net assets of Aggressive Equity Portfolio before the Reorganization were $26,674,482, including unrealized appreciation of $7,944,634 at April 26, 2013. The investment portfolio of Aggressive Equity Portfolio, with a fair value of $26,791,965 and identified cost of $18,847,335 on April 26, 2013, was the principal asset acquired by the Portfolio. For financial reporting purposes, assets received and shares
94
Morgan Stanley Variable Investment Series
Notes to Financial Statements n June 30, 2013 (unaudited) continued
issued by the Portfolio were recorded at fair value; however, the cost basis of the investments received from Aggressive Equity Portfolio was carried forward to align ongoing reporting of the Portfolio's realized and unrealized gains and losses with amounts distributable to shareholders for tax purposes. Immediately prior to the Reorganization, the net assets of the Portfolio were $213,552,626. Immediately after the merger, the net assets of the Portfolio were $240,227,108.
Upon closing of the Reorganization, shareholders of Aggressive Equity Portfolio received shares of the Portfolio as follows:
AGGRESSIVE
EQUITY PORTFOLIO | | MULTI CAP
GROWTH PORTFOLIO | |
| Class X | | Class X | |
| Class Y | | Class Y | |
Assuming the acquisition had been completed on January 1, 2013, the beginning of the annual reporting period of the Portfolio, the Portfolio's pro forma results of operations for the period ended June 30, 2013, are as follows:
| Net investment income(1) | | $ | 307,185 | | |
| Net gain realized and unrealized gain(2) | | $ | 27,575,271 | | |
Net increase (decrease) in net assets resulting from operations | | $ | 27,882,456 | | |
(1) $22,327 as reported, plus $37,505 Aggressive Equity Portfolio premerger, plus $247,353 of estimated pro-forma eliminated expenses.
(2) $26,366,468 as reported, plus $1,208,803 Aggressive Equity Portfolio premerger.
Because the combined investment portfolios have been managed as a single integrated portfolio since the acquisition was completed, it is not practicable to separate the amounts of revenue and earnings of Aggressive Equity Portfolio that have been included in the Portfolio's Statement of Operations since April 26, 2013.
On February 21, 2013, shareholders of the Strategist Portfolio (the "Portfolio") approved an Agreement and Plan of Reorganization by and between Morgan Stanley Variable Investment Series (the "Fund"), on behalf of the Portfolio, and The Universal Institutional Funds, Inc., on behalf of the Global Tactical Asset Allocation Portfolio ("Global Tactical Asset Allocation"), pursuant to which substantially all of the assets and liabilities of the Portfolio would be transferred to Global Tactical Asset Allocation in exchange for shares of Global Tactical Asset Allocation and pursuant to which the Portfolio will be liquidated and terminated (the "Reorganization"). Each Class X shareholder of the Portfolio will receive Class I shares of Global Tactical Asset Allocation and each Class Y shareholder of the Portfolio will receive Class II shares of the Global Tactical Asset Allocation. The Reorganization was consummated on April 29, 2013.
95
Morgan Stanley Variable Investment Series
Financial Highlights
| | | | | | | | | | | | | | | | |
FOR THE YEAR
ENDED
DECEMBER 31 | | NET ASSET
VALUE
BEGINNING
OF PERIOD | | NET
INVESTMENT
INCOME(a) | | NET REALIZED
AND
UNREALIZED
GAIN (LOSS) | | TOTAL FROM
INVESTMENT
OPERATIONS | | DIVIDENDS
TO
SHAREHOLDERS | | DISTRIBUTIONS
TO
SHAREHOLDERS | | TOTAL
DIVIDENDS
AND
DISTRIBUTIONS | |
MONEY MARKET
CLASS X SHARES | | | |
| 2008^ | | $ | 1.00 | | | $ | 0.020 | | | | — | | | $ | 0.020 | | | $ | (0.020 | ) | | | — | | | $ | (0.020 | ) | |
| 2009^ | | | 1.00 | | | | 0.000 | (d) | | | — | | | | 0.000 | (d) | | | (0.000 | )(d) | | | — | | | | (0.000 | )(d) | |
| 2010^ | | | 1.00 | | | | 0.000 | (d) | | | — | | | | 0.000 | (d) | | | (0.000 | )(d) | | | — | | | | (0.000 | )(d) | |
2011 | | | 1.00 | | | | 0.000 | (d) | | $ | (0.000 | )(d) | | | 0.000 | (d) | | | (0.000 | )(d) | | | — | | | | (0.000 | )(d) | |
2012 | | | 1.00 | | | | 0.000 | (d) | | | 0.000 | (d) | | | 0.000 | (d) | | | (0.000 | )(d) | | | — | | | | (0.000 | )(d) | |
| 2013^^ | | | 1.00 | | | | 0.000 | (d) | | | (0.000 | )(d) | | | 0.000 | (d) | | | (0.000 | )(d) | | | — | | | | (0.000 | )(d) | |
CLASS Y SHARES | | | |
| 2008^ | | | 1.00 | | | | 0.020 | | | | — | | | | 0.020 | | | | (0.020 | ) | | | — | | | | (0.020 | ) | |
| 2009^ | | | 1.00 | | | | 0.000 | (d) | | | — | | | | 0.000 | (d) | | | (0.000 | )(d) | | | — | | | | (0.000 | )(d) | |
| 2010^ | | | 1.00 | | | | 0.000 | (d) | | | — | | | | 0.000 | (d) | | | (0.000 | )(d) | | | — | | | | (0.000 | )(d) | |
2011 | | | 1.00 | | | | 0.000 | (d) | | | (0.000 | )(d) | | | 0.000 | (d) | | | (0.000 | )(d) | | | — | | | | (0.000 | )(d) | |
2012 | | | 1.00 | | | | 0.000 | (d) | | | 0.000 | (d) | | | 0.000 | (d) | | | (0.000 | )(d) | | | — | | | | (0.000 | )(d) | |
| 2013^^ | | | 1.00 | | | | 0.000 | (d) | | | (0.000 | )(d) | | | 0.000 | (d) | | | (0.000 | )(d) | | | — | | | | (0.000 | )(d) | |
LIMITED DURATION
CLASS X SHARES | | | |
| 2008^ | | | 9.27 | | | | 0.36 | | | | (1.72 | ) | | | (1.36 | ) | | | (0.15 | ) | | | — | | | | (0.15 | ) | |
| 2009^ | | | 7.76 | | | | 0.20 | | | | 0.24 | | | | 0.44 | | | | (0.36 | ) | | | — | | | | (0.36 | ) | |
| 2010^ | | | 7.84 | | | | 0.18 | | | | 0.00 | | | | 0.18 | | | | (0.28 | ) | | | — | | | | (0.28 | ) | |
2011 | | | 7.74 | | | | 0.17 | | | | 0.04 | | | | 0.21 | | | | (0.26 | ) | | | — | | | | (0.26 | ) | |
2012 | | | 7.69 | | | | 0.12 | | | | 0.13 | | | | 0.25 | | | | (0.23 | ) | | | — | | | | (0.23 | ) | |
| 2013^^ | | | 7.71 | | | | 0.05 | | | | (0.09 | ) | | | (0.04 | ) | | | (0.20 | ) | | | — | | | | (0.20 | ) | |
CLASS Y SHARES | | | |
| 2008^ | | | 9.26 | | | | 0.34 | | | | (1.73 | ) | | | (1.39 | ) | | | (0.14 | ) | | | — | | | | (0.14 | ) | |
| 2009^ | | | 7.73 | | | | 0.18 | | | | 0.24 | | | | 0.42 | | | | (0.34 | ) | | | — | | | | (0.34 | ) | |
| 2010^ | | | 7.81 | | | | 0.16 | | | | 0.01 | | | | 0.17 | | | | (0.26 | ) | | | — | | | | (0.26 | ) | |
2011 | | | 7.72 | | | | 0.15 | | | | 0.04 | | | | 0.19 | | | | (0.24 | ) | | | — | | | | (0.24 | ) | |
2012 | | | 7.67 | | | | 0.10 | | | | 0.13 | | | | 0.23 | | | | (0.21 | ) | | | — | | | | (0.21 | ) | |
| 2013^^ | | | 7.69 | | | | 0.05 | | | | (0.10 | ) | | | (0.05 | ) | | | (0.18 | ) | | | — | | | | (0.18 | ) | |
See Notes to Financial Statements
96
| | | | | | | | | RATIO TO AVERAGE
NET ASSETS(c) | | | | | |
FOR THE YEAR
ENDED
DECEMBER 31 | | NET ASSET
VALUE
END OF
PERIOD | | TOTAL
RETURN(b) | | NET ASSETS
END OF
PERIOD
(000'S) | | EXPENSES | | NET
INVESTMENT
INCOME | | REBATE FROM
MORGAN STANLEY
AFFILIATE | | PORTFOLIO
TURNOVER
RATE | |
MONEY MARKET
CLASS X SHARES | |
| 2008^ | | $ | 1.00 | | | | 2.45 | % | | $ | 115,415 | | | | 0.57 | % | | | 2.40 | % | | | — | | | | N/A | | |
| 2009^ | | | 1.00 | | | | 0.03 | | | | 84,486 | | | | 0.40 | (e)(f) | | | 0.03 | (e)(f) | | | — | | | | N/A | | |
| 2010^ | | | 1.00 | | | | 0.01 | | | | 59,932 | | | | 0.29 | (f) | | | 0.00 | (f)(g) | | | — | | | | N/A | | |
2011 | | | 1.00 | | | | 0.01 | | | | 51,431 | | | | 0.22 | (f) | | | 0.01 | (f) | | | — | | | | N/A | | |
2012 | | | 1.00 | | | | 0.01 | | | | 42,267 | | | | 0.27 | (f) | | | 0.01 | (f) | | | — | | | | N/A | | |
| 2013^^ | | | 1.00 | | | | 0.00 | (g)(k) | | | 39,288 | | | | 0.21 | (f)(l) | | | 0.01 | (f)(l) | | | — | | | | N/A | | |
CLASS Y SHARES | |
| 2008^ | | | 1.00 | | | | 2.19 | | | | 112,113 | | | | 0.82 | | | | 2.15 | | | | — | | | | N/A | | |
| 2009^ | | | 1.00 | | | | 0.01 | | | | 81,145 | | | | 0.41 | (e)(f) | | | 0.01 | (e)(f) | | | — | | | | N/A | | |
| 2010^ | | | 1.00 | | | | 0.01 | | | | 67,139 | | | | 0.29 | (f) | | | 0.00 | (f)(g) | | | — | | | | N/A | | |
2011 | | | 1.00 | | | | 0.01 | | | | 55,849 | | | | 0.22 | (f) | | | 0.01 | (f) | | | — | | | | N/A | | |
2012 | | | 1.00 | | | | 0.01 | | | | 48,565 | | | | 0.27 | (f) | | | 0.01 | (f) | | | — | | | | N/A | | |
| 2013^^ | | | 1.00 | | | | 0.00 | (g)(k) | | | 44,866 | | | | 0.21 | (f)(l) | | | 0.01 | (f)(l) | | | — | | | | N/A | | |
LIMITED DURATION
CLASS X SHARES | |
| 2008^ | | | 7.76 | | | | (14.91 | ) | | | 16,405 | | | | 0.48 | (h) | | | 4.27 | (h) | | | 0.01 | % | | | 54 | % | |
| 2009^ | | | 7.84 | | | | 5.76 | | | | 16,889 | | | | 0.49 | (h) | | | 2.61 | (h) | | | 0.00 | (g) | | | 105 | | |
| 2010^ | | | 7.74 | | | | 2.35 | | | | 14,921 | | | | 0.55 | (h) | | | 2.25 | (h) | | | 0.00 | (g) | | | 88 | | |
2011 | | | 7.69 | | | | 2.75 | | | | 12,693 | | | | 0.60 | (h) | | | 2.15 | (h) | | | 0.00 | (g) | | | 45 | | |
2012 | | | 7.71 | | | | 3.34 | | | | 10,628 | | | | 0.63 | (h) | | | 1.52 | (h) | | | 0.00 | (g) | | | 58 | | |
| 2013^^ | | | 7.47 | | | | (0.54 | )(k) | | | 9,637 | | | | 0.69 | (h)(l) | | | 1.43 | (h)(l) | | | 0.00 | (g)(l) | | | 25 | (k) | |
CLASS Y SHARES | |
| 2008^ | | | 7.73 | | | | (15.22 | ) | | | 63,223 | | | | 0.73 | (h) | | | 4.02 | (h) | | | 0.01 | | | | 54 | | |
| 2009^ | | | 7.81 | | | | 5.56 | | | | 60,753 | | | | 0.74 | (h) | | | 2.36 | (h) | | | 0.00 | (g) | | | 105 | | |
| 2010^ | | | 7.72 | | | | 2.22 | | | | 53,760 | | | | 0.80 | (h) | | | 2.00 | (h) | | | 0.00 | (g) | | | 88 | | |
2011 | | | 7.67 | | | | 2.45 | | | | 44,085 | | | | 0.85 | (h) | | | 1.90 | (h) | | | 0.00 | (g) | | | 45 | | |
2012 | | | 7.69 | | | | 3.05 | | | | 38,736 | | | | 0.88 | (h) | | | 1.27 | (h) | | | 0.00 | (g) | | | 58 | | |
| 2013^^ | | | 7.46 | | | | (0.71 | )(k) | | | 34,911 | | | | 0.94 | (h)(l) | | | 1.18 | (h)(l) | | | 0.00 | (g)(l) | | | 25 | (k) | |
97
Morgan Stanley Variable Investment Series
Financial Highlights continued
| | | | | | | | | | | | | | | | |
FOR THE YEAR
ENDED
DECEMBER 31 | | NET ASSET
VALUE
BEGINNING
OF PERIOD | | NET
INVESTMENT
INCOME(a) | | NET REALIZED
AND
UNREALIZED
GAIN (LOSS) | | TOTAL FROM
INVESTMENT
OPERATIONS | | DIVIDENDS
TO
SHAREHOLDERS | | DISTRIBUTIONS
TO
SHAREHOLDERS | | TOTAL
DIVIDENDS
AND
DISTRIBUTIONS | |
INCOME PLUS
CLASS X SHARES | | | |
| 2008^ | | $ | 10.56 | | | $ | 0.53 | | | $ | (1.46 | ) | | $ | (0.93 | ) | | $ | (0.18 | ) | | | — | | | $ | (0.18 | ) | |
| 2009^ | | | 9.45 | | | | 0.57 | | | | 1.50 | | | | 2.07 | | | | (0.53 | ) | | | — | | | | (0.53 | ) | |
| 2010^ | | | 10.99 | | | | 0.58 | | | | 0.39 | | | | 0.97 | | | | (0.70 | ) | | | — | | | | (0.70 | ) | |
2011 | | | 11.26 | | | | 0.57 | | | | (0.02 | ) | | | 0.55 | | | | (0.68 | ) | | | — | | | | (0.68 | ) | |
2012 | | | 11.13 | | | | 0.48 | | | | 1.04 | | | | 1.52 | | | | (0.68 | ) | | | — | | | | (0.68 | ) | |
| 2013^^ | | | 11.97 | | | | 0.25 | | | | (0.55 | ) | | | (0.30 | ) | | | (0.59 | ) | | | — | | | | (0.59 | ) | |
CLASS Y SHARES | | | |
| 2008^ | | | 10.54 | | | | 0.51 | | | | (1.45 | ) | | | (0.94 | ) | | | (0.18 | ) | | | — | | | | (0.18 | ) | |
| 2009^ | | | 9.42 | | | | 0.55 | | | | 1.49 | | | | 2.04 | | | | (0.51 | ) | | | — | | | | (0.51 | ) | |
| 2010^ | | | 10.95 | | | | 0.55 | | | | 0.39 | | | | 0.94 | | | | (0.67 | ) | | | — | | | | (0.67 | ) | |
2011 | | | 11.22 | | | | 0.54 | | | | (0.02 | ) | | | 0.52 | | | | (0.65 | ) | | | — | | | | (0.65 | ) | |
2012 | | | 11.09 | | | | 0.45 | | | | 1.04 | | | | 1.49 | | | | (0.65 | ) | | | — | | | | (0.65 | ) | |
| 2013^^ | | | 11.93 | | | | 0.23 | | | | (0.55 | ) | | | (0.32 | ) | | | (0.56 | ) | | | — | | | | (0.56 | ) | |
GLOBAL INFRASTRUCTURE
CLASS X SHARES | | | |
| 2008^ | | | 20.66 | | | | 0.40 | | | | (6.21 | ) | | | (5.81 | ) | | | (0.11 | ) | | $ | (3.44 | ) | | | (3.55 | ) | |
| 2009^ | | | 11.30 | | | | 0.31 | | | | 1.16 | | | | 1.47 | | | | (0.38 | ) | | | (3.71 | ) | | | (4.09 | ) | |
| 2010^ | | | 8.68 | | | | 0.21 | | | | 0.18 | | | | 0.39 | | | | (0.25 | ) | | | (0.69 | ) | | | (0.94 | ) | |
2011 | | | 8.13 | | | | 0.21 | | | | 1.07 | | | | 1.28 | | | | (0.23 | ) | | | (0.46 | ) | | | (0.69 | ) | |
2012 | | | 8.72 | | | | 0.22 | | | | 1.30 | | | | 1.52 | | | | (0.23 | ) | | | (0.82 | ) | | | (1.05 | ) | |
| 2013^^ | | | 9.19 | | | | 0.13 | | | | 0.35 | | | | 0.48 | | | | (0.26 | ) | | | (0.81 | ) | | | (1.07 | ) | |
CLASS Y SHARES | | | |
| 2008^ | | | 20.65 | | | | 0.35 | | | | (6.20 | ) | | | (5.85 | ) | | | (0.09 | ) | | | (3.44 | ) | | | (3.53 | ) | |
| 2009^ | | | 11.27 | | | | 0.28 | | | | 1.15 | | | | 1.43 | | | | (0.35 | ) | | | (3.71 | ) | | | (4.06 | ) | |
| 2010^ | | | 8.64 | | | | 0.19 | | | | 0.19 | | | | 0.38 | | | | (0.23 | ) | | | (0.69 | ) | | | (0.92 | ) | |
2011 | | | 8.10 | | | | 0.19 | | | | 1.06 | | | | 1.25 | | | | (0.20 | ) | | | (0.46 | ) | | | (0.66 | ) | |
2012 | | | 8.69 | | | | 0.20 | | | | 1.29 | | | | 1.49 | | | | (0.20 | ) | | | (0.82 | ) | | | (1.02 | ) | |
| 2013^^ | | | 9.16 | | | | 0.11 | | | | 0.35 | | | | 0.46 | | | | (0.24 | ) | | | (0.81 | ) | | | (1.05 | ) | |
See Notes to Financial Statements
98
| | | | | | | | | RATIO TO AVERAGE
NET ASSETS(c) | | | | | |
FOR THE YEAR
ENDED
DECEMBER 31 | | NET ASSET
VALUE
END OF
PERIOD | | TOTAL
RETURN(b) | | NET ASSETS
END OF
PERIOD
(000'S) | | EXPENSES | | NET
INVESTMENT
INCOME | | REBATE FROM
MORGAN STANLEY
AFFILIATE | | PORTFOLIO
TURNOVER
RATE | |
INCOME PLUS
CLASS X SHARES | |
| 2008^ | | $ | 9.45 | | | | (8.92 | )% | | $ | 109,833 | | | | 0.55 | %(h) | | | 5.34 | %(h) | | | 0.00 | %(g) | | | 55 | % | |
| 2009^ | | | 10.99 | | | | 22.57 | | | | 114,488 | | | | 0.56 | (h) | | | 5.64 | (h) | | | 0.00 | (g) | | | 75 | | |
| 2010^ | | | 11.26 | | | | 9.28 | | | | 106,363 | | | | 0.59 | (h) | | | 5.23 | (h) | | | 0.00 | (g) | | | 53 | | |
2011 | | | 11.13 | | | | 5.01 | | | | 90,876 | | | | 0.59 | (h) | | | 5.01 | (h) | | | 0.00 | (g) | | | 43 | | |
2012 | | | 11.97 | | | | 14.09 | | | | 86,765 | | | | 0.61 | (h) | | | 4.14 | (h) | | | 0.00 | (g) | | | 68 | | |
| 2013^^ | | | 11.08 | | | | (2.58 | )(k) | | | 77,213 | | | | 0.61 | (h)(l) | | | 4.11 | (h)(l) | | | 0.00 | (g)(l) | | | 32 | (k) | |
CLASS Y SHARES | |
| 2008^ | | | 9.42 | | | | (9.11 | ) | | | 135,850 | | | | 0.80 | (h) | | | 5.09 | (h) | | | 0.00 | (g) | | | 55 | | |
| 2009^ | | | 10.95 | | | | 22.29 | | | | 148,108 | | | | 0.81 | (h) | | | 5.39 | (h) | | | 0.00 | (g) | | | 75 | | |
| 2010^ | | | 11.22 | | | | 9.01 | | | | 124,322 | | | | 0.84 | (h) | | | 4.98 | (h) | | | 0.00 | (g) | | | 53 | | |
2011 | | | 11.09 | | | | 4.71 | | | | 102,948 | | | | 0.84 | (h) | | | 4.76 | (h) | | | 0.00 | (g) | | | 43 | | |
2012 | | | 11.93 | | | | 13.82 | | | | 97,579 | | | | 0.86 | (h) | | | 3.89 | (h) | | | 0.00 | (g) | | | 68 | | |
| 2013^^ | | | 11.05 | | | | (2.71 | )(k) | | | 86,392 | | | | 0.86 | (h)(l) | | | 3.86 | (h)(l) | | | 0.00 | (g)(l) | | | 32 | (k) | |
GLOBAL INFRASTRUCTURE
CLASS X SHARES | |
| 2008^ | | | 11.30 | | | | (33.27 | ) | | | 70,951 | | | | 0.74 | (h) | | | 2.46 | (h) | | | 0.00 | (g) | | | 76 | | |
| 2009^ | | | 8.68 | | | | 19.26 | | | | 68,748 | | | | 0.96 | (h) | | | 3.37 | (h) | | | 0.00 | (g) | | | 280 | | |
| 2010^ | | | 8.13 | | | | 6.93 | | | | 61,408 | | | | 0.87 | (h) | | | 2.71 | (h) | | | 0.00 | (g) | | | 148 | | |
2011 | | | 8.72 | | | | 16.07 | | | | 58,998 | | | | 0.86 | (h) | | | 2.48 | (h) | | | 0.00 | (g) | | | 36 | | |
2012 | | | 9.19 | | | | 18.69 | | | | 57,628 | | | | 0.87 | (h) | | | 2.51 | (h) | | | 0.00 | (g) | | | 28 | | |
| 2013^^ | | | 8.60 | | | | 5.19 | (k) | | | 56,249 | | | | 0.86 | (h)(l) | | | 2.61 | (h)(l) | | | 0.00 | (g)(l) | | | 15 | (k) | |
CLASS Y SHARES | |
| 2008^ | | | 11.27 | | | | (33.45 | ) | | | 16,545 | | | | 0.99 | (h) | | | 2.21 | (h) | | | 0.00 | (g) | | | 76 | | |
| 2009^ | | | 8.64 | | | | 18.83 | | | | 17,818 | | | | 1.21 | (h) | | | 3.12 | (h) | | | 0.00 | (g) | | | 280 | | |
| 2010^ | | | 8.10 | | | | 6.74 | | | | 15,789 | | | | 1.12 | (h) | | | 2.46 | (h) | | | 0.00 | (g) | | | 148 | | |
2011 | | | 8.69 | | | | 15.82 | | | | 14,472 | | | | 1.11 | (h) | | | 2.23 | (h) | | | 0.00 | (g) | | | 36 | | |
2012 | | | 9.16 | | | | 18.44 | | | | 14,506 | | | | 1.12 | (h) | | | 2.26 | (h) | | | 0.00 | (g) | | | 28 | | |
| 2013^^ | | | 8.57 | | | | 4.93 | (k) | | | 13,884 | | | | 1.11 | (h)(l) | | | 2.36 | (h)(l) | | | 0.00 | (g)(l) | | | 15 | (k) | |
99
Morgan Stanley Variable Investment Series
Financial Highlights continued
| | | | | | | | | | | | | | | |
FOR THE YEAR
ENDED
DECEMBER 31 | | NET ASSET
VALUE
BEGINNING
OF PERIOD | | NET
INVESTMENT
INCOME
(LOSS)(a) | | NET REALIZED
AND
UNREALIZED
GAIN (LOSS) | | TOTAL FROM
INVESTMENT
OPERATIONS | | DIVIDENDS
TO
SHAREHOLDERS | | DISTRIBUTIONS
TO
SHAREHOLDERS | | TOTAL
DIVIDENDS
AND
DISTRIBUTIONS | |
EUROPEAN EQUITY
CLASS X SHARES | | | |
| 2008^ | | $ | 28.83 | | | $ | 0.63 | | | $ | (11.31 | ) | | $ | (10.68 | ) | | $ | (0.61 | ) | | $ | (4.22 | ) | | $ | (4.83 | ) | |
| 2009^ | | | 13.32 | | | | 0.36 | | | | 3.01 | | | | 3.37 | | | | (0.56 | ) | | | (0.71 | ) | | | (1.27 | ) | |
| 2010^ | | | 15.42 | | | | 0.26 | | | | 0.76 | | | | 1.02 | | | | (0.39 | ) | | | — | | | | (0.39 | ) | |
2011 | | | 16.05 | | | | 0.41 | | | | (1.90 | ) | | | (1.49 | ) | | | (0.37 | ) | | | — | | | | (0.37 | ) | |
2012 | | | 14.19 | | | | 0.53 | | | | 2.03 | | | | 2.56 | | | | (0.43 | ) | | | — | | | | (0.43 | ) | |
| 2013^^ | | | 16.32 | | | | 0.36 | | | | 0.29 | | | | 0.65 | | | | (0.53 | ) | | | — | | | | (0.53 | ) | |
CLASS Y SHARES | | | |
| 2008^ | | | 28.65 | | | | 0.58 | | | | (11.25 | ) | | | (10.67 | ) | | | (0.52 | ) | | | (4.22 | ) | | | (4.74 | ) | |
| 2009^ | | | 13.24 | | | | 0.32 | | | | 3.00 | | | | 3.32 | | | | (0.50 | ) | | | (0.71 | ) | | | (1.21 | ) | |
| 2010^ | | | 15.35 | | | | 0.22 | | | | 0.76 | | | | 0.98 | | | | (0.35 | ) | | | — | | | | (0.35 | ) | |
2011 | | | 15.98 | | | | 0.37 | | | | (1.90 | ) | | | (1.53 | ) | | | (0.33 | ) | | | — | | | | (0.33 | ) | |
2012 | | | 14.12 | | | | 0.49 | | | | 2.03 | | | | 2.52 | | | | (0.38 | ) | | | — | | | | (0.38 | ) | |
| 2013^^ | | | 16.26 | | | | 0.33 | | | | 0.30 | | | | 0.63 | | | | (0.48 | ) | | | — | | | | (0.48 | ) | |
MULTI CAP GROWTH
CLASS X SHARES | | | |
| 2008^ | | | 35.23 | | | | 0.03 | | | | (16.78 | ) | | | (16.75 | ) | | | (0.07 | ) | | | — | | | | (0.07 | ) | |
| 2009^ | | | 18.41 | | | | 0.11 | | | | 12.99 | | | | 13.10 | | | | (0.09 | ) | | | — | | | | (0.09 | ) | |
| 2010^ | | | 31.42 | | | | 0.06 | | | | 8.65 | | | | 8.71 | | | | (0.06 | ) | | | — | | | | (0.06 | ) | |
2011 | | | 40.07 | | | | 0.01 | | | | (2.70 | ) | | | (2.69 | ) | | | (0.07 | ) | | | — | | | | (0.07 | ) | |
2012 | | | 37.31 | | | | 0.20 | | | | 4.40 | | | | 4.60 | | | | — | | | | (0.90 | ) | | | (0.90 | ) | |
| 2013^^ | | | 41.01 | | | | 0.02 | | | | 5.07 | | | | 5.09 | | | | (0.20 | ) | | | (0.66 | ) | | | (0.86 | ) | |
CLASS Y SHARES | | | |
| 2008^ | | | 35.06 | | | | (0.05 | ) | | | (16.67 | ) | | | (16.72 | ) | | | (0.05 | ) | | | — | | | | (0.05 | ) | |
| 2009^ | | | 18.29 | | | | 0.05 | | | | 12.90 | | | | 12.95 | | | | (0.03 | ) | | | — | | | | (0.03 | ) | |
| 2010^ | | | 31.21 | | | | (0.02 | ) | | | 8.58 | | | | 8.56 | | | | — | | | | — | | | | — | | |
2011 | | | 39.77 | | | | (0.09 | ) | | | (2.68 | ) | | | (2.77 | ) | | | — | | | | — | | | | — | | |
2012 | | | 37.00 | | | | 0.09 | | | | 4.37 | | | | 4.46 | | | | — | | | | (0.90 | ) | | | (0.90 | ) | |
| 2013^^ | | | 40.56 | | | | (0.04 | ) | | | 5.01 | | | | 4.97 | | | | (0.11 | ) | | | (0.66 | ) | | | (0.77 | ) | |
See Notes to Financial Statements
100
| | | | | | | | | RATIO TO AVERAGE
NET ASSETS(c) | | | | | |
FOR THE YEAR
ENDED
DECEMBER 31 | | NET ASSET
VALUE
END OF
PERIOD | | TOTAL
RETURN(b) | | NET ASSETS
END OF
PERIOD
(000'S) | | EXPENSES | | NET
INVESTMENT
INCOME (LOSS) | | REBATE FROM
MORGAN STANLEY
AFFILIATE | | PORTFOLIO
TURNOVER
RATE | |
EUROPEAN EQUITY
CLASS X SHARES | |
| 2008^ | | $ | 13.32 | | | | (42.70 | )% | | $ | 57,734 | | | | 1.00 | %(h)(i) | | | 3.01 | %(h)(i) | | | 0.00 | %(g) | | | 15 | % | |
| 2009^ | | | 15.42 | | | | 27.73 | | | | 61,197 | | | | 1.00 | (h)(i) | | | 2.67 | (h)(i) | | | 0.00 | (g) | | | 26 | | |
| 2010^ | | | 16.05 | | | | 7.23 | (j) | | | 54,824 | | | | 1.00 | (h)(i) | | | 1.81 | (h)(i) | | | 0.00 | (g) | | | 22 | | |
2011 | | | 14.19 | | | | (9.64 | ) | | | 41,181 | | | | 1.00 | (h)(i) | | | 2.56 | (h)(i) | | | 0.00 | (g) | | | 11 | | |
2012 | | | 16.32 | | | | 18.51 | | | | 40,141 | | | | 1.00 | (h)(i) | | | 3.50 | (h)(i) | | | 0.00 | (g) | | | 11 | | |
| 2013^^ | | | 16.44 | | | | 4.04 | (k) | | | 38,441 | | | | 1.00 | (h)(i)(l) | | | 4.19 | (h)(i)(l) | | | 0.00 | (g)(l) | | | 5 | (k) | |
CLASS Y SHARES | |
| 2008^ | | | 13.24 | | | | (42.84 | ) | | | 17,845 | | | | 1.25 | (h)(i) | | | 2.76 | (h)(i) | | | 0.00 | (g) | | | 15 | | |
| 2009^ | | | 15.35 | | | | 27.41 | | | | 19,323 | | | | 1.25 | (h)(i) | | | 2.42 | (h)(i) | | | 0.00 | (g) | | | 26 | | |
| 2010^ | | | 15.98 | | | | 6.96 | (j) | | | 17,821 | | | | 1.25 | (h)(i) | | | 1.56 | (h)(i) | | | 0.00 | (g) | | | 22 | | |
2011 | | | 14.12 | | | | (9.85 | ) | | | 11,668 | | | | 1.25 | (h)(i) | | | 2.31 | (h)(i) | | | 0.00 | (g) | | | 11 | | |
2012 | | | 16.26 | | | | 18.16 | | | | 11,773 | | | | 1.25 | (h)(i) | | | 3.25 | (h)(i) | | | 0.00 | (g) | | | 11 | | |
| 2013^^ | | | 16.41 | | | | 3.90 | (k) | | | 11,095 | | | | 1.25 | (h)(i)(l) | | | 3.94 | (h)(i)(l) | | | 0.00 | (g)(l) | | | 5 | (k) | |
MULTI CAP GROWTH
CLASS X SHARES | |
| 2008^ | | | 18.41 | | | | (47.62 | ) | | | 140,041 | | | | 0.55 | (h) | | | 0.08 | (h) | | | 0.01 | | | | 33 | | |
| 2009^ | | | 31.42 | | | | 71.32 | | | | 202,279 | | | | 0.55 | (h) | | | 0.44 | (h) | | | 0.00 | (g) | | | 23 | | |
| 2010^ | | | 40.07 | | | | 27.76 | | | | 220,553 | | | | 0.58 | (h) | | | 0.19 | (h) | | | 0.00 | (g) | | | 29 | | |
2011 | | | 37.31 | | | | (6.74 | ) | | | 173,284 | | | | 0.56 | (h) | | | 0.03 | (h) | | | 0.00 | (g) | | | 24 | | |
2012 | | | 41.01 | | | | 12.37 | | | | 164,917 | | | | 0.58 | (h) | | | 0.48 | (h) | | | 0.00 | (g) | | | 44 | | |
| 2013^^ | | | 45.24 | | | | 12.42 | (k) | | | 181,870 | | | | 0.57 | (h)(l) | | | 0.08 | (h)(l) | | | 0.00 | (g)(l) | | | 24 | (k) | |
CLASS Y SHARES | |
| 2008^ | | | 18.29 | | | | (47.75 | ) | | | 45,671 | | | | 0.80 | (h) | | | (0.17 | )(h) | | | 0.01 | | | | 33 | | |
| 2009^ | | | 31.21 | | | | 70.85 | | | | 64,122 | | | | 0.80 | (h) | | | 0.19 | (h) | | | 0.00 | (g) | | | 23 | | |
| 2010^ | | | 39.77 | | | | 27.43 | | | | 67,303 | | | | 0.83 | (h) | | | (0.06 | )(h) | | | 0.00 | (g) | | | 29 | | |
2011 | | | 37.00 | | | | (6.97 | ) | | | 49,678 | | | | 0.81 | (h) | | | (0.22 | )(h) | | | 0.00 | (g) | | | 24 | | |
2012 | | | 40.56 | | | | 12.09 | | | | 45,556 | | | | 0.83 | (h) | | | 0.23 | (h) | | | 0.00 | (g) | | | 44 | | |
| 2013^^ | | | 44.76 | | | | 12.28 | (k) | | | 60,750 | | | | 0.82 | (h)(l) | | | (0.17 | )(h)(l) | | | 0.00 | (g)(l) | | | 24 | (k) | |
101
Morgan Stanley Variable Investment Series
Financial Highlights continued
^^ For the six months ended June 30, 2013 (unaudited).
^ Beginning with the year ended December 31, 2011, the Fund was audited by Ernst & Young LLP. The previous years were audited by another independent registered public accounting firm.
(a) The per share amounts were computed using an average number of shares outstanding during the period.
(b) Calculated based on the net asset value as of the last business day of the period. Performance shown does not reflect fees and expenses imposed by your insurance company. If performance information included the effect of these additional charges, the total returns would be lower.
(c) Reflects overall Portfolio ratios for investment income and non-class specific expenses.
(d) Amount is less than $0.001.
(e) Reflects fees paid in connection with the U.S. Treasury's Temporary Guarantee Program for Money Market Funds. This fee had an effect of 0.04% for the year ended 2009.
(f) If the Portfolio had borne all of its expenses that were reimbursed or waived by the Distributor, Adviser, and Administrator, the annualized expense and net investment loss ratios, would have been as follows:
PERIOD ENDED | | EXPENSE
RATIO | | NET INVESTMENT LOSS
RATIO | |
June 30, 2013 | | | | | | | | | |
Class X | | | 0.66 | % | | | (0.44 | )% | |
Class Y | | | 0.91 | | | | (0.69 | ) | |
December 31, 2012 | | | | | | | | | |
Class X | | | 0.63 | | | | (0.35 | ) | |
Class Y | | | 0.88 | | | | (0.60 | ) | |
December 31, 2011 | | | | | | | | | |
Class X | | | 0.60 | | | | (0.37 | ) | |
Class Y | | | 0.85 | | | | (0.62 | ) | |
December 31, 2010 | | | | | | | | | |
Class X | | | 0.62 | | | | (0.33 | ) | |
Class Y | | | 0.87 | | | | (0.58 | ) | |
December 31, 2009 | | | | | | | | | |
Class X | | | 0.59 | | | | (0.16 | ) | |
Class Y | | | 0.84 | | | | (0.42 | ) | |
(g) Amount is less than 0.005%.
(h) The ratios reflect the rebate of certain Portfolio expenses in connection with investments in a Morgan Stanley affiliate during the period. The effect of the rebate on the ratios is disclosed in the above table as "Rebate from Morgan Stanley affiliate."
See Notes to Financial Statements
102
(i) If the Portfolio had borne all of its expenses that were reimbursed or waived by the Adviser and Administrator, the annualized expense and net investment income ratios, would have been as follows:
PERIOD ENDED | | EXPENSE
RATIO | | NET INVESTMENT INCOME
RATIO | |
June 30, 2013 | | | | | | | | | |
Class X | | | 1.20 | % | | | 3.98 | % | |
Class Y | | | 1.45 | | | | 3.73 | | |
December 31, 2012 | | | | | | | | | |
Class X | | | 1.22 | | | | 3.28 | | |
Class Y | | | 1.47 | | | | 3.03 | | |
December 31, 2011 | | | | | | | | | |
Class X | | | 1.17 | | | | 2.39 | | |
Class Y | | | 1.42 | | | | 2.14 | | |
December 31, 2010 | | | | | | | | | |
Class X | | | 1.16 | | | | 1.65 | | |
Class Y | | | 1.41 | | | | 1.40 | | |
December 31, 2009 | | | | | | | | | |
Class X | | | 1.12 | | | | 2.55 | | |
Class Y | | | 1.37 | | | | 2.30 | | |
December 31, 2008 | | | | | | | | | |
Class X | | | 1.08 | | | | 2.93 | | |
Class Y | | | 1.33 | | | | 2.68 | | |
(j) During the year ended December 31, 2010, the Portfolio received a regulatory settlement from an unaffiliated third party which had an impact of approximately 0.14% and 0.14% for Class X and Y, respectively, on the total return. This was a one-time settlement, and as a result, the impact on the NAV and consequently the performance will not likely be repeated in the future. Had this settlement not occurred, the total return for Class X and Y shares would have been approximately 7.09% and 6.82%, respectively.
(k) Not annualized.
(l) Annualized.
103
Morgan Stanley Variable Investment Series
Results of Special Shareholder Meetings (unaudited)
On May 31, 2013, a Special Meeting of Shareholders of Global Infrastructure Portfolio (the "Portfolio") was held in order to approve changing the Portfolio's fundamental investment restriction regarding industry concentration. The voting results were as follows:
| | | Number of Shares | |
| | | For | | Against | | Abstain | |
| | | | 1,701,579 | | | | 66,108 | | | | 145,445 | | |
On February 21, 2013, a Special Meeting of Shareholders was held for the following Portfolios to vote upon a proposal to approve an Agreement and Plan of Reorganization. The voting results were as follows: | |
| | Number of Shares | |
| | | For | | Against | | Abstain | |
Aggressive Equity Portfolio | | | 1,346,522 | | | | 25,938 | | | | 82,577 | | |
| | Number of Shares | |
| | | For | | Against | | Abstain | |
Strategist Portfolio | | | 10,081,114 | | | | 477,425 | | | | 794,846 | | |
104
Trustees | |
| Frank L. Bowman | | Joseph J. Kearns | |
| Michael Bozic | | Michael F. Klein | |
| Kathleen A. Dennis | | Michael E. Nugent | |
| James F. Higgins | | W. Allen Reed | |
| Dr. Manuel H. Johnson | | Fergus Reid | |
Officers | |
Michael E. Nugent
Chairperson of the Board | |
Arthur Lev
President and Principal Executive Officer | |
Mary Ann Picciotto
Chief Compliance Officer | |
Stefanie V. Chang Yu
Vice President | |
Francis J. Smith
Treasurer and Principal Financial Officer | |
Mary E. Mullin
Secretary | |
| Transfer Agent | | Custodian | |
Boston Financial Data Services, Inc.
2000 Crown Colony Drive
Quincy, Massachusetts 20169 | | State Street Bank and Trust Company
One Lincoln Street
Boston, Massachusetts 02111 | |
| Independent Registered Public Accounting Firm | | Legal Counsel | |
Ernst & Young LLP
200 Clarendon Street
Boston, Massachusetts 02116 | | Dechert LLP
1095 Avenue of the Americas
New York, New York 10036 | |
| Counsel to the Independent Trustees | | Adviser | |
Kramer Levin Naftalis & Frankel LLP
1177 Avenue of the Americas
New York, New York 10036 | | Morgan Stanley Investment Management Inc.
522 Fifth Avenue
New York, New York 10036 | |
Sub-Advisers | |
Morgan Stanley Investment Management Limited
25 Cabot Square, Canary Wharf
London, E14 4QA, England | |
Morgan Stanley Investment Management Company
23 Church Street
16-01 Capital Square 049481 Singapore | |
This report is submitted for the general information of shareholders of the Fund. For more detailed information about the Fund, its fees and expenses and other pertinent information, please read its Prospectus. The Fund's Statement of Additional Information contains additional information about the Fund, including its trustees. It is available without charge, by calling (800) 869-NEWS.
This report is not authorized for distribution to prospective investors in the Fund unless preceded or accompanied by an effective Prospectus. Read the Prospectus carefully before investing.
Morgan Stanley Distribution, Inc., member FINRA.
#40113A
VARINSAN
702450 EXP [08/31/14]
THE UNIVERSAL INSTITUTIONAL FUNDS, INC.
GLOBAL INFRASTRUCTURE PORTFOLIO
PART B
STATEMENT OF ADDITIONAL INFORMATION
This Statement of Additional Information (the “SAI”) relates to the shares of common stock (“shares”) of the Global Infrastructure Portfolio (the “Acquiring Fund”), a portfolio of The Universal Institutional Funds, Inc. (the “Company”), to be issued pursuant to (i) an Agreement and Plan of Reorganization, dated October 3, 2013, between the Company, on behalf of the Acquiring Fund, and Morgan Stanley Select Dimensions Investment Series (“Select Dimensions”), on behalf of the Global Infrastructure Portfolio (“SD Global Infrastructure”), in connection with the acquisition by the Acquiring Fund of all of the assets and the liabilities of SD Global Infrastructure (the “SD Reorganization”) and (ii) an Agreement and Plan of Reorganization, dated October 3, 2013, between the Company, on behalf of the Acquiring Fund, and Morgan Stanley Variable Investment Series (“Variable Investment” and, together with Select Dimensions, the “Trusts”), on behalf of the Global Infrastructure Portfolio (“VIS Global Infrastructure”), in connection with the acquisition by the Acquiring Fund of all of the assets and the liabilities of VIS Global Infrastructure (the “Variable Reorganization”).
SD Global Infrastructure and VIS Global Infrastructure are each referred to herein as an “Acquired Fund,” and together as the “Acquired Funds.” The SD Reorganization and the Variable Reorganization are each referred to herein as a “Reorganization,” and together as the “Reorganizations.”
This SAI does not constitute a prospectus. This SAI does not include all information that a shareholder should consider before voting on the proposals contained in the Joint Proxy Statement and Prospectus, and, therefore, should be read in conjunction with the related Joint Proxy Statement and Prospectus, dated January [ ], 2014. A copy of the Joint Proxy Statement and Prospectus may be obtained upon request and without charge by calling (800) 548-7786 (toll-free).
The date of this SAI is January [ ], 2014.
Table of Contents
| Page |
Introduction | B-1 |
Additional Information About the Acquiring Fund | B-2 |
Financial Statements | B-3 |
INTRODUCTION
This SAI is intended to supplement the information provided in the Joint Proxy Statement and Prospectus dated January [ ], 2014 (the “Joint Proxy Statement and Prospectus”). The Joint Proxy Statement and Prospectus has been sent to the Acquired Funds’ Shareholders in connection with the solicitation of proxies by the Board of Trustees of the Acquired Funds to be voted at the Special Meeting of Shareholders of the Acquired Funds to be held on March 17, 2014. The Company’s Statement of Additional Information, dated December 18, 2013, as it may be amended and supplemented from time to time (the “Company’s Statement of Additional Information”) and each Trust’s Statement of Additional Information, each dated April 30, 2013, as each may be amended from time to time, accompany, and are incorporated by reference in, this SAI.
B-1
ADDITIONAL INFORMATION ABOUT THE ACQUIRING FUND
Fund History
For additional information about the Acquiring Fund’s history, see “General Information—Fund History” in the Company’s Statement of Additional Information relating to the Acquiring Fund.
Investment Objectives and Policies
For additional information about the Acquiring Fund’s investment policies, see “Investment Policies and Strategies” in the Company’s Statement of Additional Information relating to the Acquiring Fund.
Fund Holdings
For additional information about the Acquiring Fund’s policies and procedures with respect to the disclosure of its portfolio securities to any person, see “Disclosure of Portfolio Holdings” in the Company’s Statement of Additional Information relating to the Acquiring Fund.
Management
For additional information about the Board of Directors, officers and management personnel of the Acquiring Fund, see “Management of the Fund” and “Investment Advisory and Other Services” in the Company’s Statement of Additional Information relating to the Acquiring Fund.
Investment Advisory and Other Services
For additional information about the Acquiring Fund’s investment adviser, the Acquiring Fund’s independent registered public accounting firm and other services provided to the Acquiring Fund, see “Investment Advisory and Other Services” and “General Information—Independent Registered Public Accounting Firm” in the Company’s Statement of Additional Information relating to the Acquiring Fund.
Codes of Ethics
For additional information about the Codes of Ethics adopted by the Acquiring Fund, the Acquiring Fund’s investment adviser and the Acquiring Fund’s distributor, see “Compensation—Code of Ethics” in the Company’s Statement of Additional Information relating to the Acquiring Fund.
Proxy Voting Policies
For additional information about the voting of proxies held by the Acquiring Fund, see “Investment Advisory and Other Services—Proxy Voting Policy and Proxy Voting Record” in the Company’s Statement of Additional Information relating to the Acquiring Fund.
Fund Managers
For additional information about the portfolio managers primarily responsible for the day-to-day management of the Acquiring Fund, their compensation structure and their holdings in the Acquiring Fund, see “Portfolio Managers” in the Company’s Statement of Additional Information relating to the Acquiring Fund.
Fund Transactions and Brokerage
For additional information about brokerage allocation practices, see “Brokerage Practices—Portfolio Transactions” in the Company’s Statement of Additional Information relating to the Acquiring Fund.
B-2
Description of Fund Shares
For additional information about the voting rights and other characteristics of the shares of the Acquiring Fund, see “General Information—Description of Shares and Voting Rights” in the Company’s Statement of Additional Information relating to the Acquiring Fund.
Purchase, Redemption and Pricing of Shares
For additional information about the purchase and redemption of the Acquiring Fund’s shares and the determination of net asset value (“NAV”), see “Purchase of Shares”, “Redemption of Shares” and “Net Asset Value” in the Company’s Statement of Additional Information relating to the Acquiring Fund.
Dividends, Distributions and Tax Status
For additional information about the Acquiring Fund’s policies regarding dividends and distributions and tax matters affecting the Acquiring Fund and its shareholders, see “General Information—Dividends and Capital Gains Distributions” and “Taxes” in the Company’s Statement of Additional Information relating to the Acquiring Fund.
Distribution of Shares
For additional information about the Acquiring Fund’s distributor and the distribution agreement between the Acquiring Fund and its distributor, see “Investment Advisory and Other Services—Principal Underwriter” and “Distribution of Shares (Applicable to Class II Shares Only)” in the Company’s Statement of Additional Information relating to the Acquiring Fund.
Performance Data
The Acquiring Fund is a newly created series of the Company and has not yet commenced operations. As a result, the Acquiring Fund has no performance data.
FINANCIAL STATEMENTS
1. The Acquiring Fund is a newly created series of the Company and has not yet commenced operations. As a result, the Acquiring Fund has no financial statements.
2. The most recent audited financial statements of each Acquired Fund, each for the fiscal year ended December 31, 2012, have been audited by Ernst & Young LLP, an independent registered public accounting firm. Ernst & Young LLP’s reports, along with the Acquired Funds’ audited financial statements, are included in each respective Fund’s Annual Report to Shareholders for the fiscal year ended December 31, 2012, each of which accompanies this SAI and is incorporated herein by reference. Each Acquired Fund’s most recent financial statements (unaudited) are set forth in each Acquired Fund’s Semi-Annual Report for the six-month period ended June 30, 2013, each of which accompanies this SAI and is incorporated herein by reference.
3. Shown below are Financial Statements for the Acquired Funds and Pro Forma Financial Statements for the Combined Fund as of June 30, 2013, as though the Reorganizations occurred as of that date. These financial statements set forth the unaudited pro forma condensed Statement of Assets and Liabilities as of June 30, 2013, the unaudited pro forma condensed Statement of Operations for the twelve-month period ended June 30, 2013 and the unaudited pro forma condensed Portfolio of Investments as of June 30, 2013. These statements have been derived from the books and records utilized in calculating daily NAV for each Fund.
B-3
Pro Forma Combined Condensed Statement of Assets and Liabilities
As of June 30, 2013 (Unaudited)
| | Select Dimension
Investment Series- Global
Infrastructure Portfolio
(000) | | Variable Investment Series-
Global Infrastructure
Portfolio
(000) | | Adjustments
(000) | | The Universal
Investment Funds, Inc.
Global Infrastructure
Portfolio
(000) | |
| | | | | | | | | |
Assets: | | | | | | | | | |
Investments in Securities of Unaffiliated Issuers, at Value (Cost $73,550) | | $ | 25,186 | | $ | 69,776 | | $ | — | | $ | 94,962 | |
Investments in Securities of Affiliated Issuers, at Value (Cost $5,916) | | 2,244 | | 3,672 | | — | | 5,916 | |
Total investments in Securities, at Value | | 27,430 | | 73,448 | | — | | 100,878 | |
Cash | | 261 | | 560 | | — | | 821 | |
Receivable for Investments Sold | | 327 | | 272 | | — | | 599 | |
Tax Reclaim Receivable | | 16 | | 35 | | — | | 51 | |
Dividends Receivable | | 153 | | 418 | | — | | 571 | |
Receivable for Portfolio Shares Sold | | — | | 2 | | — | | 2 | |
Receivable from Affiliates | | — | @ | — | @ | — | | — | @ |
Other assets | | 6 | | 5 | | — | | 11 | |
Total Assets | | 28,193 | | 74,740 | | — | | 102,933 | |
| | | | | | | | | |
Liabilities: | | | | | | | | | |
Collateral on Securities Loaned, at Value | | 2,843 | | 4,398 | | — | | 7,241 | |
Payable for Advisory Fees | | 12 | | 33 | | — | | 45 | |
Payable for Reorganization Expense | | — | | — | | 67 | (a) | 67 | |
Payable for Portfolio Shares Redeemed | | 12 | | 132 | | — | | 144 | |
Payable for Administration Fees | | 2 | | 5 | | — | | 7 | |
Payable for Transfer Agent Fees | | — | @ | — | @ | — | | — | @ |
Distribution Fees- Class Y Shares | | 1 | | 3 | | (4 | ) | — | |
Distribution Fees-Class II | | — | | — | | 4 | | 4 | |
Other Liabilities | | 21 | | 37 | | — | | 58 | |
Total Liabilities | | 2,891 | | 4,608 | | 67 | | 7,566 | |
Net Assets | | $ | 25,302 | | $ | 70,132 | | $ | (67 | ) | $ | 95,367 | |
| | | | | | | | | |
Net Assets Consist of: | | | | | | | | | |
Paid-in-capital | | $ | 17,836 | | $ | 50,180 | | $ | — | | $ | 68,016 | |
Accumulated Net Investment Income | | 284 | | 870 | | (67 | )(a) | 1,087 | |
Accumulated Net Realized Gain | | 1,575 | | 3,281 | | — | | 4,856 | |
Unrealized Appreciation (Depreciation) on: | | | | | | | | | |
Investments | | 5608 | | 15,805 | | — | | 21,413 | |
Foreign Currency Translations | | (1 | ) | (4 | ) | — | | (5 | ) |
Net Assets | | $ | 25,302 | | $ | 70,132 | | $ | (67 | ) | $ | 95,367 | |
| | | | | | | | | |
CLASS X Shares: | | | | | | | | | |
Net Assets | | $ | 18,230 | | $ | 56,248 | | $ | (74,478 | ) | $ | — | |
Shares Outstanding (not in 000’s) | | 790,653 | | 6,543,253 | | (7,333,906 | ) | $ | — | |
Net Asset Value, Offering and Redemption Price Per Share | | $ | 23.06 | | $ | 8.60 | | $ | — | | $ | — | |
| | | | | | | | | |
CLASS Y Shares: | | | | | | | | | |
Net Assets | | $ | 7,072 | | $ | 13,884 | | $ | (20,956 | ) | $ | — | |
Shares Outstanding (not in 000’s) | | 306,852 | | 1,619,419 | | (1,926,271 | ) | $ | — | |
Net Asset Value, Offering and Redemption Price Per Share | | $ | 23.05 | | $ | 8.57 | | $ | — | | $ | — | |
| | | | | | | | | |
CLASS I Shares: | | | | | | | | | |
Net Assets | | $ | — | | $ | — | | $ | 74,426 | (b) | $ | 74,426 | |
Shares Outstanding (not in 000’s) | | — | | — | | 8,656,876 | (c) | 8,656,876 | |
Net Asset Value, Offering and Redemption Price Per Share | | $ | — | | $ | — | | $ | 8.60 | | $ | 8.60 | |
| | | | | | | | | |
CLASS II Shares: | | | | | | | | | |
Net Assets | | $ | — | | $ | — | | $ | 20,941 | (b) | $ | 20,941 | |
Shares Outstanding (not in 000’s) | | — | | — | | 2,442,958 | (c) | 2,442,958 | |
Net Asset Value, Offering and Redemption Price Per Share | | $ | — | | $ | — | | $ | 8.57 | | $ | 8.57 | |
@ Amount is less than $500.
(a) — Reorganization Expenses.
(b) — Adjustment to net assets due to the reorganization.
(c) — Adjustment to the shares outstanding due to the reorganization.
PRO FORMA COMBINED CONDENSED STATEMENT OF OPERATIONS
FOR THE TWELVE MONTH PERIOD ENDED June 30, 2013 (Unaudited)
| | Select Dimension Investment
Series- Global Infrastructure
Portfolio
(000) | | MS Variable Investment
Series- Global Infrastructure
Portfolio
(000) | | Adjustments
(000) | | The Universal Investment
Funds, Inc. Global
Infrastructure Portfolio
(000) | |
| | | | | | | | | |
Net Investment Income: | | | | | | | | | |
Income | | | | | | | | | |
Dividends from Securities of Unaffiliated Issuers | | $ | 854 | | $ | 2,290 | | $ | — | | $ | 3,144 | |
Income from Securities Loaned - Net | | — | | 7 | | — | | $ | 7 | |
Total Income | | 854 | | 2,297 | | — | | 3,151 | |
+ Net of foreign withholding taxes | | $ | 57 | | $ | 155 | | $ | — | | $ | 212 | |
| | | | | | | | | |
Expenses | | | | | | | | | |
Advisory fee | | 153 | | 416 | | 288 | (a) | 857 | |
Administration Fees | | 22 | | 58 | | 172 | (a) | 252 | |
Custodian Fees | | 39 | | 44 | | (35 | )(b) | 48 | |
Professional Fees | | 70 | | 85 | | (85 | )(c) | 70 | |
Shareholder Reporting Fees | | 6 | | 21 | | — | | 27 | |
Distribution Fees - Class Y Shares | | 18 | | 36 | | (54 | )(d) | — | |
Distribution Fees - Class II Shares | | — | | — | | 77 | (d) | 77 | |
Trustees’/Directors Fees and Expenses | | — | @ | 2 | | 2 | (e) | 4 | |
Transfer Agent Fees and expenses | | 3 | | 2 | | (5 | )(f) | — | |
Other | | 15 | | 16 | | (15 | )(g) | 16 | |
Total Expenses | | 326 | | 680 | | 345 | | 1,351 | |
Less: Advisory Fees Waived | | — | | — | | (397 | )(h) | (397 | ) |
Less: Distribution Fees — Class II Shares Waived | | — | | — | | (23 | )(d) | (23 | ) |
Less: Rebate from Morgan Stanley Affiliate | | — | | (1 | ) | — | | (1 | ) |
Net Expenses | | 326 | | 679 | | (75 | ) | 930 | |
Net Investment Income (Loss) | | 528 | | 1,618 | | 75 | | 2,221 | |
| | | | | | | | | |
Realized and Unrealized Gain (Loss): | | | | | | | | | |
Realized Gain on: | | | | | | | | | |
Investments Sold | | 2,953 | | 6,843 | | — | | 9,796 | |
Foreign Currency Transactions | | 2 | | 6 | | — | | 8 | |
Net Realized Gain | | 2,955 | | 6,849 | | — | | 9,804 | |
| | | | | | | | | |
Change in Unrealized Appreciation/Depreciation: | | | | | | | | | |
Investments | | 650 | | 2,703 | | — | | 3,353 | |
Foreign currency translation | | (3 | ) | (8 | ) | — | | (11 | ) |
Net Change in Unrealized Appreciation/Depreciation | | 647 | | 2,695 | | — | | 3,342 | |
Net Realized Gain and Change in Unrealized Appreciation (Depreciation) | | 3,602 | | 9,544 | | — | | 13,146 | |
Net Increase in Net Assets Resulting from Operations | | $ | 4,130 | | $ | 11,162 | | $ | 75 | | $ | 15,367 | |
@ Amount is less than $500
(a) — Reflects an increase due to an overall higher contractual rates per the Registration Statement.
(b) — Reflects the elimination of transaction based fees for the Select Dimensions Global Infrastructure Portfolio.
(c) — Reflects the elimination of audit, tax, and legal fees for the Select Dimension Global Infrastructure Portfolio.
(d) — Reflects an increase due to higher contractual rate on the UIF Fund, the UIF Fund has a Distribution Fee Waiver on Class II.
(e) — Reflects the increased Trustees’ Fees due to increased net assets.
(f) — Reflects the elimination of Transfer Agent Fees, as these fees did not apply to the UIF Fund.
(g) — Reflects the elimination of miscellaneous invoices for NASDAQ, ITG, Insurance and Lipper for the Select Dimension Global Infrastructure Portfolio.
(h) — Reflects the waiver of Advisory Fees due to the implementation of the expense cap.
Pro Forma Portfolio of Investments as of June 30, 2013 (unaudited)
| | Morgan Stanley
Variable Investment
Series - Global
Infrastructure | | Morgan Stanley
Select Dimensions
Investment Series -
Global Infrastructure | | UIF Global
Infrastructure
Combined Pro-
Forma | | Morgan Stanley
Variable Investment
Series - Global
Infrastructure | | Morgan Stanley
Select Dimensions
Investment Series -
Global Infrastructure | | | | UIF Global
Infrastructure
Combined Pro-
Forma | |
| | Shares | | Shares | | Shares | | Value
(000) | | Value
(000) | | Adjustments
(000) | | Value
(000) | |
Common Stocks (98.8%) | | | | | | | | | | | | | | | |
Australia (4.1%) | | | | | | | | | | | | | | | |
Sydney Airport | | 43,546 | | 21,584 | | 65,130 | | $ | 135 | | $ | 67 | | $ | — | | $ | 202 | |
DUET Group (a) | | 221,026 | | 67,850 | | 288,876 | | 406 | | 125 | | — | | 531 | |
APA Group (a) | | 90,223 | | 21,186 | | 111,409 | | 494 | | 116 | | — | | 610 | |
Macquarie Atlas Roads Group | | 75,579 | | 28,213 | | 103,792 | | 134 | | 50 | | — | | 184 | |
Transurban Group (a) | | 257,687 | | 100,591 | | 358,278 | | 1,593 | | 622 | | — | | 2,215 | |
Spark Infrastructure Group (a) | | 67,443 | | 24,898 | | 92,341 | | 107 | | 40 | | — | | 147 | |
| | | | | | | | 2,869 | | 1,020 | | — | | 3,889 | |
Austria (0.6%) | | | | | | | | | | | | | | | |
Flughafen Wien AG | | 6,832 | | 2,528 | | 9,360 | | 391 | | 145 | | — | | 536 | |
Brazil (1.2%) | | | | | | | | | | | | | | | |
Cia de Saneamento Basico do Estado de Sao Paulo ADR | | 79,000 | | 30,110 | | 109,110 | | 822 | | 313 | | — | | 1,135 | |
Canada (12.1%) | | | | | | | | | | | | | | | |
Enbridge, Inc. | | 76,840 | | 25,320 | | 102,160 | | 3,230 | | 1,064 | | — | | 4,294 | |
TransCanada Corp. (a) | | 125,580 | | 43,800 | | 169,380 | | 5,407 | | 1,886 | | — | | 7,293 | |
| | | | | | | | 8,637 | | 2,950 | | — | | 11,587 | |
China (6.2%) | | | | | | | | | | | | | | | |
Beijing Enterprises Holdings Ltd. (b) | | 350,500 | | 122,500 | | 473,000 | | 2,524 | | 882 | | — | | 3,406 | |
China Gas Holdings Ltd. (b) | | 369,000 | | 106,000 | | 475,000 | | 377 | | 108 | | — | | 485 | |
ENN Energy Holdings Ltd. (b) | | 56,000 | | 24,000 | | 80,000 | | 299 | | 128 | | — | | 427 | |
China Merchants Holdings International Co., Ltd. (b) | | 154,293 | | 56,605 | | 210,898 | | 480 | | 176 | | — | | 656 | |
Jiangsu Expressway Co., Ltd., H Shares (b) | | 408,000 | | 128,000 | | 536,000 | | 421 | | 132 | | — | | 553 | |
Sichuan Expressway Co., Ltd., H Shares (b) | | 1,210,300 | | 449,700 | | 1,660,000 | | 325 | | 121 | | — | | 446 | |
| | | | | | | | 4,426 | | 1,547 | | — | | 5,973 | |
France (2.7%) | | | | | | | | | | | | | | | |
Eutelsat Communications SA | | 19,630 | | 6,675 | | 26,305 | | 557 | | 189 | | — | | 746 | |
SES SA | | 45,575 | | 16,944 | | 62,519 | | 1,305 | | 485 | | — | | 1,790 | |
| | | | | | | | 1,862 | | 674 | | — | | 2,536 | |
Germany (1.8%) | | | | | | | | | | | | | | | |
Fraport AG Frankfurt Airport Services Worldwide | | 19,865 | | 7,923 | | 27,788 | | 1,202 | | 479 | | — | | 1,681 | |
Italy (6.0%) | | | | | | | | | | | | | | | |
Snam SpA | | 428,036 | | 166,387 | | 594,423 | | 1,950 | | 758 | | — | | 2,708 | |
Atlantia SpA (a) | | 52,512 | | 18,817 | | 71,329 | | 857 | | 307 | | — | | 1,164 | |
Societa Iniziative Autostradali e Servizi SpA | | 53,155 | | 19,732 | | 72,887 | | 435 | | 161 | | — | | 596 | |
Terna Rete Elettrica Nazionale SpA (a) | | 210,360 | | 91,922 | | 302,282 | | 874 | | 382 | | — | | 1,256 | |
| | | | | | | | 4,116 | | 1,608 | | — | | 5,724 | |
Japan (1.4%) | | | | | | | | | | | | | | | |
Tokyo Gas Co., Ltd. | | 174,000 | | 64,000 | | 238,000 | | 961 | | 354 | | — | | 1,315 | |
Luxembourg (0.6%) | | | | | | | | | | | | | | | |
Intelsat SA (a)(c) | | 20,600 | | 7,650 | | 28,250 | | 412 | | 153 | | — | | 565 | |
Netherlands (1.4%) | | | | | | | | | | | | | | | |
Koninklijke Vopak N.V. | | 16,686 | | 6,384 | | 23,070 | | 984 | | 377 | | — | | 1,361 | |
Spain (1.3%) | | | | | | | | | | | | | | | |
Ferrovial SA | | 24,553 | | 9,065 | | 33,618 | | 392 | | 145 | | — | | 537 | |
Abertis Infraestructuras SA | | 28,113 | | 9,876 | | 37,989 | | 490 | | 172 | | — | | 662 | |
| | | | | | | | 882 | | 317 | | — | | 1,199 | |
| | | | | | | | | | | | | | | | | | | |
Switzerland (1.3%) | | | | | | | | | | | | | | | |
Flughafen Zuerich AG (Registered) | | 1,854 | | 689 | | 2,543 | | 931 | | 346 | | — | | 1,277 | |
United Kingdom (8.3%) | | | | | | | | | | | | | | | |
National Grid PLC | | 378,670 | | 135,599 | | 514,269 | | 4,296 | | 1,539 | | — | | 5,835 | |
Pennon Group PLC | | 10,820 | | 3,990 | | 14,810 | | 106 | | 39 | | — | | 145 | |
Severn Trent PLC | | 42,100 | | 14,796 | | 56,896 | | 1,066 | | 374 | | — | | 1,440 | |
United Utilities Group PLC | | 33,130 | | 12,602 | | 45,732 | | 345 | | 131 | | — | | 476 | |
| | | | | | | | 5,813 | | 2,083 | | — | | 7,896 | |
United States (49.8%) | | | | | | | | | | | | | | | |
American Tower Corp. REIT | | 45,680 | | 16,890 | | 62,570 | | 3,342 | | 1,236 | | — | | 4,578 | |
Crown Castle International Corp. (c) | | 28,220 | | 10,350 | | 38,570 | | 2,043 | | 749 | | — | | 2,792 | |
SBA Communications Corp., Class A (c) | | 42,400 | | 13,420 | | 55,820 | | 3,143 | | 995 | | — | | 4,138 | |
CenterPoint Energy, Inc. | | 95,960 | | 39,110 | | 135,070 | | 2,254 | | 919 | | — | | 3,173 | |
Atmos Energy Corp. | | 5,840 | | 2,280 | | 8,120 | | 240 | | 94 | | — | | 334 | |
Cheniere Energy, Inc. (c) | | 35,660 | | 13,030 | | 48,690 | | 990 | | 362 | | — | | 1,352 | |
Enbridge Energy Management LLC (a)(c) | | 55,865 | | 20,100 | | 75,965 | | 1,692 | | 609 | | — | | 2,301 | |
Kinder Morgan, Inc. | | 76,050 | | 25,660 | | 101,710 | | 2,901 | | 979 | | — | | 3,880 | |
NiSource, Inc. | | 38,940 | | 15,260 | | 54,200 | | 1,115 | | 437 | | — | | 1,552 | |
Oneok, Inc. | | 45,280 | | 15,630 | | 60,910 | | 1,871 | | 646 | | — | | 2,517 | |
PG&E Corp. | | 46,850 | | 18,410 | | 65,260 | | 2,142 | | 842 | | — | | 2,984 | |
Sempra Energy | | 36,030 | | 12,380 | | 48,410 | | 2,946 | | 1,012 | | — | | 3,958 | |
Spectra Energy Corp. | | 70,696 | | 24,385 | | 95,081 | | 2,436 | | 840 | | — | | 3,276 | |
Williams Cos., Inc. (The) | | 74,630 | | 25,970 | | 100,600 | | 2,423 | | 843 | | — | | 3,266 | |
ITC Holdings Corp. | | 25,810 | | 9,390 | | 35,200 | | 2,357 | | 857 | | — | | 3,214 | |
Northeast Utilities | | 44,978 | | 15,668 | | 60,646 | | 1,890 | | 658 | | — | | 2,548 | |
American Water Works Co., Inc. | | 26,380 | | 9,800 | | 36,180 | | 1,088 | | 404 | | — | | 1,492 | |
California Water Service Group | | 8,490 | | 3,090 | | 11,580 | | 166 | | 60 | | — | | 226 | |
| | | | | | | | 35,039 | | 12,542 | | — | | 47,581 | |
Total Common Stocks (Cost $72,843) | | | | | | | | 69,347 | | 24,908 | | — | | 94,255 | |
| | | | | | | | | | | | | | | |
Short-Term Investments (6.9%) | | | | | | | | | | | | | | | |
Securities held as Collateral on Loaned Securities (6.7%) | | | | | | | | | | | | | | | |
Investment Company (6.0%) | | | | | | | | | | | | | | | |
Morgan Stanley Institutional Liquidity Funds - Money Market Portfolio - Institutional Class (d) | | 3,472,839 | | 2,244,356 | | 5,717,356 | | 3,473 | | 2,244 | | — | | 5,717 | |
| | | | | | | | | | | | | | | |
| | Face Amount
(000) | | Face Amount
(000) | | Face Amount
(000) | | | | | | | | | |
Repurchase Agreements (0.7%) | | | | | | | | | | | | | | | |
HSBC Securities USA, Inc. (0.15%, dated 06/28/13, due 07/01/13; proceeds $455; fully collateralized by U.S. Government Agencies, 3.50%-5.00% due 12/01/26 - 05/01/38; valued at $464) | | $ | 276 | | $ | 179 | | $ | 455 | | 276 | | 179 | | — | | 455 | |
Merrill Lynch & Co., Inc. (0.18%, dated 06/28/13, due 07/01/13; proceeds $252; fully collateralized by Common Stock, a Convertible Preferred Stock, and Exchange Traded Funds; valued at $277) | | 153 | | 99 | | 252 | | 153 | | 99 | | — | | 252 | |
| | | | | | | | 429 | | 278 | | — | | 707 | |
Total Securities held as Collateral on Loaned Securities (Cost $6,424) | | | | | | | | 3,902 | | 2,522 | | — | | 6,424 | |
| | | | | | | | | | | | | | | |
| | Shares | | Shares | | Shares | | | | | | | | | |
Investment Company (0.2%) | | | | | | | | | | | | | | | |
Morgan Stanley Institutional Liquidity Funds - Treasury Portfolio - Institutional Class (d) (Cost $199) | | 198,967 | | — | | 198,967 | | 199 | | — | | — | | 199 | |
Total Short-Term Investments (Cost $6,623) | | | | | | | | 4,101 | | 2,522 | | — | | 6,623 | |
Total Investments (Cost $79,466) (105.7%) Including $11,691 of Securities Loaned | | | | | | | | 73,448 | | 27,430 | | — | | 100,878 | |
Liabilities in Excess of Other Assets (-5.7%) | | | | | | | | (3,316 | ) | (2,128 | ) | (67 | )(e) | (5,511 | ) |
Net Assets (100%) | | | | | | | | $ | 70,132 | | $ | 25,302 | | $ | (67 | ) | $ | 95,367 | |
| | | | | | | | | | | | | | | | | | | | | | |
(a) All or a portion of this security was on loan at June 30, 2013.
(b) Security trades on the Hong Kong exchange.
(c) Non-income producing security.
(d) Affiliated security.
(e) Reorganization expenses of approximately $67,000.
ADR American Depositary Receipt.
REIT Real Estate Investment Trust.
As of June 30, 2013, the gross unrealized appreciation (depreciation) of investments based on the aggregate cost of investments for federal income tax purposes was as follows:
| | Morgan Stanley Variable
Investment Series -
Global Infrastructure | | Morgan Stanley Select
Dimensions Investment
Series - Global
Infrastructure | | UIF Global
Infrastructure
Combined Pro-Forma | |
Aggregate gross unrealized appreciation | | $ | 16,197,000 | | $ | 5,743,000 | | $ | 21,940,000 | |
Aggregate gross unrealized depreciation | | (393,000 | ) | (135,000 | ) | (528,000 | ) |
Net unrealized appreciation | | $ | 15,804,000 | | $ | 5,608,000 | | $ | 21,412,000 | |
| | | | | | | |
Federal income tax cost of investments | | $ | 57,644,000 | | $ | 21,822,000 | | $ | 79,466,000 | |
Fair Valuation Measurements
Financial Accounting Standards Board (“FASB”) Accounting Standards Codification TM(“ASC”) 820, “Fair Value Measurements and Disclosures” (“ASC 820”), defines fair value as the value that the Fund would receive to sell an investment or pay to transfer a liability in a timely transaction with an independent buyer in the principal market, or in the absence of a principal market the most advantageous market for the investment or liability. ASC 820 establishes a three-tier hierarchy to distinguish between (1) inputs that reflect the assumptions market participants would use in valuing an asset or liability developed based on market data obtained from sources independent of the reporting entity (observable inputs); and (2) inputs that reflect the reporting entity’s own assumptions about the assumptions market participants would use in valuing an asset or liability developed based on the best information available in the circumstances (unobservable inputs) and to establish classification of fair value measurements for disclosure purposes. Various inputs are used in determining the value of the Fund’s investments. The inputs are summarized in the three broad levels listed below.
· Level 1 — unadjusted quoted prices in active markets for identical investments
· Level 2 — other significant observable inputs (including quoted prices for similar investments, interest rates, prepayment speeds, credit risk, etc.)
· Level 3 — significant unobservable inputs including the Fund’s own assumptions in determining the fair value of investments. Factors considered in making this determination may include, but are not limited to, information obtained by contacting the issuer, analysts, or the appropriate stock exchange (for exchange-traded securities), analysis of the issuer’s financial statements or other available documents and, if necessary, available information concerning other securities in similar circumstances
The inputs or methodology used for valuing securities are not necessarily an indication of the risk associated with investing in those securities and the determination of the significance of a particular input to the fair value measurement in its entirety requires judgment and considers factors specific to each security.
The following is a summary of the inputs used to value each Portfolio’s investments as of June 30, 2013.
Portfolios | | Morgan Stanley Variable
Investment Series - Global
Infrastructure | | Morgan Stanley Select
Dimensions Investment
Series - Global Infrastructure | | UIF Global Infrastructure
Combined Pro-Forma | |
Investments in Securities (Level 1) (000) | | $ | 73,019 | | $ | 27,152 | | $ | 100,171 | |
Investments in Securities (Level 2) (000) | | 429 | | 278 | | 707 | |
Investments in Securities (Level 3) (000) | | — | | — | | — | |
Total for Investments in Securities | | $ | 73,448 | | $ | 27,430 | | $ | 100,878 | |
Transfers between investment levels may occur as the markets fluctuate and/or the availability of data used in an investment’s valuation changes. The Portfolios recognize transfers between the levels as of the end of the period. As of June 30, 2013, securities in Morgan Stanley Variable Investment Series - Global Infrastructure with a total value of approximately $23,834,000 and securities in Morgan Stanley Select Dimensions Investment Series - Global Infrastructure with a total value of approximately $8,727,000 transferred from Level 2 to Level 1. At December 31, 2012, the fair value of certain securities were adjusted due to developments which occurred between the time of the close of the foreign markets on which they trade and the close of business on the NYSE which resulted in their Level 2 classification.
1. Security Valuation: (1) An equity portfolio security listed or traded on an exchange is valued at its latest reported sales price (or at the exchange official closing price if such exchange reports an official closing price), if there were no sales on a given day, the security is valued at the mean between the last reported bid and asked prices; (2) all other equity portfolio securities for which over-the-counter market quotations are readily available are valued at the mean between the last reported bid and asked prices. In cases where a security is traded on more than one exchange, the security is valued on the exchange designated as the primary market; (3) when market quotations are not readily available, including circumstances under which Morgan Stanley Investment Management Inc. (the “Adviser”) determines that the closing price, last sale price or the mean between the last reported bid and asked prices are not reflective of a security’s market value, portfolio securities are valued at their fair value as determined in good faith under procedures established by and under the general supervision of the Fund’s Board of Directors (the “Directors”). Occasionally, developments affecting the closing prices of securities and other assets may occur between the times at which valuations of such securities are determined (that is, close of the foreign market on which the securities trade) and the close of business of the New York Stock Exchange (“NYSE”). If developments occur during such periods that are expected to materially affect the value of such securities, such valuations may be adjusted to reflect the estimated fair value of such securities as of the close of the NYSE, as determined in good faith by the Directors or by the Adviser using a pricing service and/or procedures approved by the Directors; (4) quotations of foreign portfolio securities, other assets and liabilities and forward contracts stated in foreign currency are translated into U.S. dollar equivalents at the prevailing market rates prior to the close of the NYSE; (5) investments in mutual funds, including the Morgan Stanley Institutional Liquidity Funds, are valued at the net asset value as of the close of each business day; and (6) short-term debt securities with remaining maturities of 60 days or less at the time of purchase may be valued at amortized cost, unless the Adviser determines such valuation does not reflect the securities’ market value, in which case these securities will be valued at their fair market value determined by the Adviser.
Under procedures approved by the Directors, the Fund’s Adviser has formed a Valuation Committee. The Valuation Committee provides administration and oversight of the Fund’s valuation policies and procedures, which are reviewed at least annually by the Directors. These procedures allow the Fund to utilize independent pricing services, quotations from securities and financial instrument dealers, and other market sources to determine fair value.
The Fund has procedures to determine the fair value of securities and other financial instruments for which market prices are not readily available. Under these procedures, the Valuation Committee convenes on a regular and ad hoc basis to review such securities and considers a number of factors, including valuation methodologies and significant unobservable valuation inputs, when arriving at fair value. The Valuation Committee may employ a market-based approach which may use related or comparable assets or liabilities, recent transactions, market multiples, book values, and other relevant information for the investment to determine the fair value of the investment. An income-based valuation approach may also be used in which the anticipated future cash flows of the investment are discounted to calculate fair value. Discounts may also be applied due to the nature or duration of any restrictions on the disposition of the investments. Due to the inherent uncertainty of valuations of such investments, the fair values may differ significantly from the values that would have been used had an active market existed. The Valuation Committee employs various methods for calibrating these valuation approaches including a regular review of valuation methodologies, key inputs and assumptions, transactional back-testing or disposition analysis, and reviews of any related market activity.
Notes to Pro Forma Combined Financial Statements
The pro forma portfolio of investments, assets and liabilities and operations should be read in conjunction with the historical financial statements of the Funds included or incorporated by reference in the Statement of Additional Information of which the pro forma combined financial statements form a part. The preparation of financial statements in conformity with generally accepted accounting principles requires management to make estimates and assumptions that affect the reported amounts of assets and liabilities and disclosure of contingent assets and liabilities, if any, at the date of the financial statements and the reported amounts of increases and decreases in net assets from operations during the reporting period. Actual results could differ from those estimates. Following the Reorganization, Morgan Stanley Variable Investment Series - Global Infrastructure will be the accounting survivor.
UIF Global Infrastructure has elected to be taxed as a “regulated investment company” under the Internal Revenue Code. After the Reorganization, UIF Global Infrastructure intends to continue to qualify as a regulated investment company, if such qualification is in the best interests of its shareholders, by complying with the provisions available to certain investment companies, as defined in applicable sections of the Internal Revenue Code, and to make distributions of taxable income sufficient to relieve it from all, or substantially all, Federal income taxes, if it is in the best interests of its shareholders.
THE UNIVERSAL INSTITUTIONAL FUNDS, INC.
522 Fifth Avenue, New York, NY 10036
STATEMENT OF ADDITIONAL INFORMATION
December 18, 2013
The Universal Institutional Funds, Inc. (the "Fund") is a no-load, open-end management investment company consisting of 11 portfolios offering a broad range of investment choices. This Statement of Additional Information ("SAI") sets forth information about the Fund applicable to Class I and Class II shares of the Global Infrastructure Portfolio (the "Portfolio"). Shares of the Portfolio are offered with no sales charge or exchange or redemption fee.
| | | Share Class and Ticker Symbol | |
| | | CLASS I | | CLASS II | |
Global Infrastructure | | UPGIX | | UPIIX | |
Shares of the Portfolio may be purchased only by insurance companies for the purpose of funding variable annuity contracts and variable life insurance policies and by certain tax qualified investors. The variable annuity contract and variable life insurance policyholders incur fees and expenses separate from the fees and expenses charged by the Portfolio.
The Fund was incorporated under the laws of the State of Maryland on March 26, 1996. The Fund filed a registration statement with the United States Securities and Exchange Commission (the "SEC") registering itself as an open-end management investment company under the Investment Company Act of 1940, as amended (the "1940 Act"), and its shares under the Securities Act of 1933, as amended (the "1933 Act").
The Portfolio is managed by Morgan Stanley Investment Management Inc. (the "Adviser").
This SAI is not a prospectus, but should be read in conjunction with the prospectuses for the Portfolio, each dated December 18, 2013 (each a "Prospectus" and together the "Prospectuses"). This SAI is incorporated by reference into the Prospectuses in its entirety. To obtain a Prospectus, please contact the Fund or your insurance company.
The Portfolio is "non-diversified" and, as such, the Portfolio's investments are not required to meet certain diversification requirements under federal securities law. Compared with "diversified" funds or portfolios, the Portfolio may invest a greater percentage of its assets in the securities of an individual corporation or governmental entity. Thus, the Portfolio's assets may be focused in fewer securities than other funds. A decline in the value of those investments would cause the Portfolio's overall value to decline to a greater degree.
TABLE OF CONTENTS
| | | Page | |
| INVESTMENT POLICIES AND STRATEGIES | | | 3 | | |
| TAXES | | | 31 | | |
| PURCHASE OF SHARES | | | 34 | | |
| REDEMPTION OF SHARES | | | 34 | | |
| INVESTMENT LIMITATIONS | | | 35 | | |
| MANAGEMENT OF THE FUND | | | 37 | | |
| COMPENSATION | | | 50 | | |
| INVESTMENT ADVISORY AND OTHER SERVICES | | | 51 | | |
| DISTRIBUTION OF SHARES (APPLICABLE TO CLASS II SHARES ONLY) | | | 53 | | |
| PORTFOLIO MANAGERS | | | 54 | | |
| CONTROL PERSONS AND PRINCIPAL HOLDERS OF SECURITIES | | | 56 | | |
| NET ASSET VALUE | | | 56 | | |
| BROKERAGE PRACTICES | | | 58 | | |
| PERFORMANCE INFORMATION | | | 60 | | |
| DISCLOSURE OF PORTFOLIO HOLDINGS | | | 60 | | |
| GENERAL INFORMATION | | | 63 | | |
| FINANCIAL STATEMENTS | | | 64 | | |
APPENDIX A MORGAN STANLEY INVESTMENT MANAGEMENT PROXY VOTING
POLICY AND PROCEDURES | | | A-1 | | |
i
INVESTMENT POLICIES AND STRATEGIES
This SAI provides additional information about the investment policies and operations of the Fund and the Portfolio. Under the supervision of the Adviser, Morgan Stanley Investment Management Limited ("MSIM Limited") and Morgan Stanley Investment Management Company ("MSIM Company") each serve as an investment sub-adviser to the Portfolio (MSIM Limited and MSIM Company are each referred to individually as the "Sub-Adviser" and collectively as the "Sub-Advisers"). References to the Adviser, when used in connection with its activities as investment adviser, include any Sub-Adviser acting under the Adviser's supervision.
The following tables summarize the permissible investments for the Portfolio. This table should be used in conjunction with the investment summaries for the Portfolio contained in the Prospectus in order to provide a complete description of the Portfolio's investment policies.
| | | Global Infrastructure | |
Equity Securities: | |
Common Stocks | | | a | | |
Convertible Securities | | | a | | |
Depositary Receipts | | | a | | |
Investment Company Securities | | | a | | |
Exchange-Traded Funds | | | a | | |
Initial Public Offerings ("IPOs") | | | a | | |
Limited Partnership and Limited Liability Company Interests | | | a | | |
Preferred Stocks | | | a | | |
Private Investments in Public Equity | | | a | | |
Real Estate Investing | | | a | | |
–Real Estate Investment Trusts | | | a | | |
–Foreign Real Estate Companies | | | a | | |
| – Specialized Ownership Vehicles | | | a | | |
Rights | | | a | | |
Warrants | | | a | | |
3
| | | Global Infrastructure | |
Fixed Income Securities: | |
Agencies | | | a | | |
Asset-Backed Securities | | | a | | |
Cash Equivalents | | | a | | |
Commercial Paper | | | a | | |
Corporates | | | a | | |
High Yield Securities | | | a | | |
Investment Grade Securities | | | a | | |
Loan Participations and Assignments | | | a | | |
Money Market Instruments | | | a | | |
Mortgage Related Securities | | | a | | |
| – Mortgage-Backed Securities | | | a | | |
| – Collateralized Mortgage Obligations | | | a | | |
| – Stripped Mortgage-Backed Securities | | | a | | |
| – Commercial Mortgage-Backed Securities | | | a | | |
Municipals | | | a | | |
Repurchase Agreements | | | a | | |
Temporary Investments | | | a | | |
U.S. Treasury Securities | | | a | | |
Yankee Dollar Obligations | | | a | | |
Zero Coupons, Pay-In-Kind Securities or Deferred Payment Securities | | | a | | |
4
| | | Global Infrastructure | |
Foreign Investment: | |
Brady Bonds | | | a | | |
Emerging Market Securities | | | a | | |
Eurodollar Obligations | | | a | | |
Foreign Fixed Income Securities | | | a | | |
Foreign Currency Transactions | | | a | | |
Foreign Equity Securities | | | a | | |
Investment Funds | | | a | | |
Other Securities And Investment Techniques: | |
Loans of Portfolio Securities | | | a | | |
Non-Publicly Traded Securities, Private Placements and Restricted Securities | | | a | | |
Temporary Borrowing | | | a | | |
When-Issued and Delayed Delivery Securities | | | a | | |
Derivatives: | |
Forwards | | | a | | |
5
EQUITY SECURITIES
Equity securities generally represent an ownership interest in an issuer, or may be convertible into or represent a right to acquire an ownership interest in an issuer. While there are many types of equity securities, prices of all equity securities will fluctuate. Economic, political and other events may affect the prices of broad equity markets. For example, changes in inflation or consumer demand may affect the prices of equity securities generally in the United States. Similar events also may affect the prices of particular equity securities. For example, news about the success or failure of a new product may affect the price of a particular issuer's equity securities.
Common Stocks. Common stocks are equity securities representing an ownership interest in a corporation, entitling the stockholder to voting rights and receipt of dividends paid based on proportionate ownership.
Convertible Securities. A convertible security is a bond, debenture, note, preferred stock, right, warrant or other security that may be converted into or exchanged for a prescribed amount of common stock or other security of the same or a different issuer or into cash within a particular period of time at a specified price or formula. A convertible security generally entitles the holder to receive interest paid or accrued on debt securities or the dividend paid on preferred stock until the convertible security matures or is redeemed, converted or exchanged. Before conversion, convertible securities generally have characteristics similar to both debt and equity securities. The value of convertible securities tends to decline as interest rates rise and, because of the conversion feature, tends to vary with fluctuations in the market value of the underlying securities. Convertible securities ordinarily provide a stream of income with generally higher yields than those of common stock of the same or similar issuers. Convertible securities generally rank senior to common stock in a corporation's capital structure but are usually subordinated to comparable nonconvertible securities. Convertible securities generally do not participate directly in any dividend increases or decreases of the underlying securities although the market prices of convertible securities may be affected by any dividend changes or other changes in the underlying securities. Certain of the convertible securities in which the Portfolio may invest are rated below investment grade or are unrated. The prices of such securities are likely to be more sensitive to adverse economic changes than higher-rated securities, resulting in increased volatility of market prices of these securities during periods of economic uncertainty, or adverse individual corporate developments. In addition, during an economic downturn or substantial period of rising interest rates, lower rated issuers may experience financial stress.
Depositary Receipts. Depositary Receipts represent an ownership interest in securities of foreign companies (an "underlying issuer") that are deposited with a depositary. Depositary Receipts are not necessarily denominated in the same currency as the underlying securities. Depositary Receipts include American Depositary Receipts ("ADRs"), Global Depositary Receipts ("GDRs") and other types of Depositary Receipts (which, together with ADRs and GDRs, are hereinafter collectively referred to as "Depositary Receipts"). ADRs are dollar-denominated Depositary Receipts typically issued by a U.S. financial institution which evidence an ownership interest in a security or pool of securities issued by a foreign issuer. ADRs are listed and traded in the United States. GDRs and other types of Depositary Receipts are typically issued by foreign banks or trust companies, although they also may be issued by U.S. financial institutions and evidence ownership interests in a security or pool of securities issued by either a foreign or a U.S. corporation. Generally, Depositary Receipts in registered form are designed for use in the U.S. securities market and Depositary Receipts in bearer form are designed for use in securities markets outside the United States.
Depositary Receipts may be "sponsored" or "unsponsored." Sponsored Depositary Receipts are established jointly by a depositary and the underlying issuer, whereas unsponsored Depositary Receipts may be established by a depositary without participation by the underlying issuer. Holders of unsponsored Depositary Receipts generally bear all the costs associated with establishing unsponsored Depositary Receipts. In addition, the issuers of the securities underlying unsponsored Depository Receipts are not obligated to disclose material information in the United States and, therefore, there may be less information available regarding such issuers and there may not be a correlation between such information and the market value of the Depositary Receipts.
6
For purposes of the Portfolio's investment policies, the Portfolio's investments in Depositary Receipts will be deemed to be an investment in the underlying securities, except that ADRs may be deemed to be issued by a U.S. issuer.
Investment Company Securities. Investment company securities are securities of other open-end, closed-end or unregistered investment companies, including foreign investment companies and exchange-traded funds. The Portfolio may invest in investment company securities as may be permitted by (i) the 1940 Act; (ii) the rules and regulations promulgated by the SEC under the 1940 Act; or (iii) an exemption or other relief applicable to the Portfolio from provisions of the 1940 Act. The 1940 Act generally prohibits an investment company from acquiring more than 3% of the outstanding voting shares of an investment company and limits such investments to no more than 5% of the Portfolio's total assets in any one investment company, and no more than 10% in any combination of investment companies. The Portfolio may invest in investment company securities of investment companies managed by the Adviser or its affiliates to the extent permitted under the 1940 Act or as otherwise authorized by the SEC. To the extent the Portfolio invests a portion of its assets in investment company securities, those assets will be subject to the risks of the purchased investment company's portfolio securities, and a shareholder in the Portfolio will bear not only his proportionate share of the expenses of the Portfolio, but also, indirectly the expenses of the purchased investment company.
To the extent permitted by applicable law, the Portfolio may invest all or some of its short term cash investments in any money market fund advised or managed by the Adviser or its affiliates. In connection with any such investments, the Portfolio, to the extent permitted by the 1940 Act, will pay its share of all expenses (other than advisory and administrative fees) of a money market fund in which it invests which may result in the Portfolio bearing some additional expenses.
Exchange-Traded Funds ("ETFs"). The Portfolio may invest in ETFs. Investments in ETFs are subject to a variety of risks, including the risks of a direct investment in the underlying securities that the ETF holds. For example, the general level of stock prices may decline, thereby adversely affecting the value of the underlying investments of the ETF and, consequently, the value of the ETF. In addition, the market value of the ETF shares may differ from their net asset value ("NAV") because the supply and demand in the market for ETF shares at any point is not always identical to the supply and demand in the market for the underlying securities. Also, ETFs that track particular indices typically will be unable to match the performance of the index exactly due to the ETF's operating expenses and transaction costs. ETFs typically incur fees that are separate from those fees incurred directly by the Portfolio. Therefore, as a shareholder in an ETF (as with other investment companies), the Portfolio would bear its ratable share of that entity's expenses. At the same time, the Portfolio would continue to pay its own investment management fees and other expenses. As a result, the Portfolio and its shareholders, in effect, will be absorbing duplicate levels of fees with respect to investments in ETFs.
Initial Public Offerings ("IPOs"). The Portfolio may purchase shares issued as part of, or a short period after, companies' IPOs and may at times dispose of those shares shortly after their acquisition. The Portfolio's purchase of those shares issued in IPOs exposes it to the risks associated with companies that have little operating history as public companies, as well as to the risks inherent in those sectors of the market where these new issuers operate. The market for IPO issuers has been volatile and share prices of newly-priced companies have fluctuated in significant amounts over short periods of time.
Limited Partnership and Limited Liability Company Interests. A limited partnership interest entitles the Portfolio to participate in the investment return of the partnership's assets as defined by the agreement among the partners. As a limited partner, the Portfolio generally is not permitted to participate in the management of the partnership. However, unlike a general partner whose liability is not limited, a limited partner's liability generally is limited to the amount of its commitment to the partnership. The Portfolio may invest to the same extent in limited liability company interests. Limited liability company interests have similar characteristics as limited partnership interests.
7
Preferred Stocks. Preferred stocks are securities that evidence ownership in a corporation and pay a fixed or variable stream of dividends. Preferred stocks have a preference over common stocks in the event of the liquidation of an issuer and usually do not carry voting rights. Because preferred stocks pay a fixed or variable stream of dividends they have many of the characteristics of both equity securities and fixed income securities. Therefore, the Portfolio may purchase preferred stocks.
Private Investments in Public Equity. The Portfolio may purchase equity securities, in a private placement, that are issued by issuers who have outstanding, publicly-traded equity securities of the same class ("private investments in public equity" or "PIPES"). Shares in PIPES generally are not registered with the SEC until after a certain time period from the date the private sale is completed. This restricted period can last many months. Until the public registration process is completed, PIPES are restricted as to resale and the Portfolio cannot freely trade the securities. Generally, such restrictions cause the PIPES to be illiquid during this time. PIPES may contain provisions that the issuer will pay specified financial penalties to the holder if the issuer does not publicly register the restricted equity securities within a specified period of time, but there is no assurance that the restricted equity securities will be publicly registered, or that the registration will remain in effect.
Real Estate Investing. Investments in securities of issuers engaged in the real estate industry entail special risks and considerations. In particular, securities of such issuers may be subject to risks associated with the direct ownership of real estate. These risks include the cyclical nature of real estate values, risks related to general and local economic conditions, overbuilding and increased competition, increases in property taxes and operating expenses, demographic trends and variations in rental income, changes in zoning laws, casualty or condemnation losses, environmental risks, regulatory limitations on rents, changes in neighborhood values, changes in the appeal of properties to tenants, increases in interest rates and other real estate capital market influences. Generally, increases in interest rates will increase the costs of obtaining financing, which could directly and indirectly decrease the value of the Portfolio's investments.
Real Estate Investment Trusts ("REITs") and Foreign Real Estate Companies. The Portfolio may invest in REITs and/or foreign real estate companies, which are similar to entities organized and operated as REITs in the United States. REITs and foreign real estate companies pool investors' funds for investment primarily in real estate properties or real estate-related loans. REITs and foreign real estate companies generally derive their income from rents on the underlying properties or interest on the underlying loans, and their value is impacted by changes in the value of the underlying property or changes in interest rates affecting the underlying loans owned by the REITs and/or foreign real estate companies. REITs and foreign real estate companies are more susceptible to risks associated with the ownership of real estate and the real estate industry in general. These risks can include fluctuations in the value of underlying properties; defaults by borrowers or tenants; market saturation; changes in general and local economic conditions; decreases in market rates for rents; increases in competition, property taxes, capital expenditures or operating expenses; and other economic, political or regulatory occurrences affecting the real estate industry. In addition, REITs and foreign real estate companies depend upon specialized management skills, may not be diversified (which may increase the volatility of a REIT's and/or foreign real estate company's value), may have less trading volume and may be subject to more abrupt or erratic price movements than the overall securities market. Foreign real estate companies may be subject to laws, rules and regulations governing those entities and their failure to comply with those laws, rules and regulations could negatively impact the performance of those entities. Operating REITs and foreign real estate companies requires specialized management skills and a Portfolio indirectly bears REIT and foreign real estate company management expenses along with the direct expenses of the Portfolio. REITs are not taxed on income distributed to shareholders provided they comply with several requirements of the Internal Revenue Code of 1986, as amended (the "Code"). REITs are subject to the risk of failing to qualify for tax-free pass-through income under the Code.
Specialized Ownership Vehicles. Specialized ownership vehicles pool investors' funds for investment primarily in income-producing real estate or real estate related loans or interests. Such specialized ownership
8
vehicles in which the Portfolio may invest include property unit trusts, foreign real estate companies, REITs and other similar specialized investment vehicles. Investments in such specialized ownership vehicles may have favorable or unfavorable legal, regulatory or tax implications for the Portfolio and, to the extent such vehicles are structured similarly to investment funds, may cause the Portfolio's shareholders to indirectly bear certain additional operating expenses.
Rights. Rights represent the right, but not the obligation, for a fixed period of time to purchase additional shares of an issuer's common stock at the time of a new issuance, usually at a price below the initial offering price of the common stock and before the common stock is offered to the general public. Rights are usually freely transferable. The risk of investing in a right is that the right may expire prior to the market value of the common stock exceeding the price fixed by the right.
Warrants. Warrants give holders the right, but not the obligation, to buy common stock of an issuer at a given price, usually higher than the market price at the time of issuance, during a specified period. Warrants are usually freely transferable. The risk of investing in a warrant is that the warrant may expire prior to the market value of the common stock exceeding the price fixed by the warrant.
FIXED INCOME SECURITIES
Fixed income securities generally represent an issuer's obligation to repay to the investor (or lender) the amount borrowed plus interest over a specified time period. A typical fixed income security specifies a fixed date when the amount borrowed (principal) is due in full, known as the maturity date, and specifies dates when periodic interest (coupon) payments will be made over the life of the security.
Fixed income securities come in many varieties and may differ in the way that interest is calculated, the amount and frequency of payments, the type of collateral, if any, and the presence of special features (e.g., conversion rights). Prices of fixed income securities fluctuate and, in particular, are subject to several key risks including, but not limited to, interest-rate risk, credit risk, prepayment risk and spread risk.
Interest rate risk arises due to general changes in the level of market rates after the purchase of a fixed income security. Generally, the values of fixed income securities vary inversely with changes in interest rates. During periods of falling interest rates, the values of most outstanding fixed income securities generally rise and during periods of rising interest rates, the values of most fixed income securities generally decline. While fixed income securities with longer final maturities often have higher yields than those with shorter maturities, they usually possess greater price sensitivity to changes in interest rates and other factors. Traditionally, the remaining term to maturity has been used as a barometer of a fixed income security's sensitivity to interest rate changes. This measure, however, considers only the time until the final principal payment and takes no account of the pattern or amount of principal or interest payments prior to maturity. Duration combines consideration of yield, coupon, interest and principal payments, final maturity and call (prepayment) features. Duration measures the likely percentage change in a fixed income security's price for a small parallel shift in the general level of interest rates; it is also an estimate of the weighted average life of the remaining cash flows of a fixed income security. In almost all cases, the duration of a fixed income security is shorter than its term to maturity.
Credit risk, also known as default risk, represents the possibility that an issuer may be unable to meet scheduled interest and principal payment obligations. It is most often associated with corporate bonds, although it can be present in other fixed income securities as well (note that the market generally assumes that obligations of the U.S. Treasury are free from credit risk). Credit ratings and quantitative models attempt to measure the degree of credit risk in fixed income securities and provide insight as to whether prevailing yield spreads afford sufficient compensation for such risk. Other things being equal, fixed income securities with high degrees of credit risk should trade in the market at lower prices (and higher yields) than fixed income securities with low degrees of credit risk.
9
Prepayment risk, also known as call risk, arises due to the issuer's ability to prepay all or most of the fixed income security prior to the stated final maturity date. Prepayments generally rise in response to a decline in interest rates as debtors take advantage of the opportunity to refinance their obligations. This risk is often associated with mortgage securities where the underlying mortgage loans can be refinanced, although it can also be present in corporate or other types of bonds with call provisions. When a prepayment occurs, a Portfolio may be forced to reinvest in lower yielding fixed income securities. Quantitative models help assess the degree of prepayment risk and provide insight as to whether prevailing yield spreads afford sufficient compensation for such risk.
Spread risk is the potential for the value of the Portfolio's assets to fall due to the widening of spreads. Fixed income securities generally compensate for greater credit risk by paying interest at a higher rate. The difference (or "spread") between the yield of a security and the yield of a benchmark, such as a U.S. Treasury security with a comparable maturity, measures the additional interest paid for credit risk. As the spread on a security widens (or increases), the price (or value) of the security falls. Spread widening may occur, among other reasons, as a result of market concerns over the stability of the market, excess supply, general credit concerns in other markets, security- or market-specific credit concerns or general reductions in risk tolerance.
Economic, political and other events also may affect the prices of broad fixed income markets, although the risks associated with such events are transmitted to the market via changes in the prevailing levels of interest rates, credit risk, prepayment risk or spread risk.
Agencies. Agencies refer to fixed income securities issued or guaranteed by federal agencies and U.S. government sponsored instrumentalities. They may or may not be backed by the full faith and credit of the U.S. Government. If they are not backed by the full faith and credit of the United States, the investor must look principally to the agency or instrumentality issuing or guaranteeing the obligation for ultimate repayment, and may not be able to assert a claim against the United States itself in the event the agency or instrumentality does not meet its commitment. Agencies that are backed by the full faith and credit of the United States include the Export-Import Bank of the United States, Farmers Home Administration, Federal Financing Bank and others. Certain debt issued by Resolution Funding Corporation has both its principal and interest backed by the full faith and credit of the U.S. Treasury in that its principal is defeased by U.S. Treasury zero coupon issues, while the U.S. Treasury is explicitly required to advance funds sufficient to pay interest on it, if needed. Certain agencies and instrumentalities, such as the Government National Mortgage Association ("Ginnie Mae"), are, in effect, backed by the full faith and credit of the United States through provisions in their charters that they may make "indefinite and unlimited" drawings on the Treasury, if needed to service its debt. Debt from certain other agencies and instrumentalities, including the Federal Home Loan Bank, the Federal National Mortgage Association ("Fannie Mae") and the Federal Home Loan Mortgage Corporation ("Freddie Mac"), are not guaranteed by the United States, but those institutions are protected by the discretionary authority of the U.S. Treasury to purchase certain amounts of their securities to assist them in meeting their debt obligations. Finally, other agencies and instrumentalities, such as the Farm Credit System, are federally chartered institutions under U.S. Government supervision, but their debt securities are backed only by the credit worthiness of those institutions, not the U.S. Government. Some of the U.S. government agencies that issue or guarantee securities include the Export-Import Bank of the United States, Farmers Home Administration, Federal Housing Administration, Maritime Administration, Small Business Administration and The Tennessee Valley Authority ("TVA").
In September 2008, the U.S. Treasury Department announced that the government would be taking over Fannie Mae and Freddie Mac and placing the companies into a conservatorship. In addition, the U.S. Treasury Department announced additional steps that it intended to take with respect to the debt and mortgage-backed securities ("MBS") issued by Fannie Mae and Freddie Mac in order to support the conservatorship. Fannie Mae and Freddie Mac are continuing to operate as going concerns while in conservatorship and each remains liable for all of its respective obligations, including its guaranty obligations, associated with its MBS. No assurance can be given that these initiatives will be successful. The maximum potential liability of the issuers of some
10
U.S. government securities held by a Portfolio may greatly exceed their current resources, including their legal right to support from the U.S. Treasury. It is possible that these issuers will not have the funds to meet their payment obligations in the future.
An instrumentality of the U.S. Government is a government agency organized under federal charter with government supervision. Instrumentalities issuing or guaranteeing securities include, among others, Federal Home Loan Banks, the Federal Land Banks, Central Bank for Cooperatives, Federal Intermediate Credit Banks and Fannie Mae.
Asset-Backed Securities. The Portfolio may invest in asset-backed securities. Asset-backed securities utilize the securitization techniques used to develop mortgage-backed securities. These techniques are also applied to a broad range of other assets. Various types of assets, primarily automobile and credit card receivables and home equity loans, are being securitized in pass-through structures similar to the mortgage pass-through structures. These types of securities are known as asset-backed securities. The Portfolio may invest in any type of asset-backed security. Asset-backed securities have risk characteristics similar to mortgage-backed securities. Like mortgage-backed securities, they generally decrease in value as a result of interest rate increases, but may benefit less than other fixed income securities from declining interest rates, principally because of prepayments. Also, as in the case of mortgage-backed securities, prepayments generally increase during a period of declining interest rates although other factors, such as changes in credit use and payment patterns, may also influence prepayment rates. Asset-backed securities also involve the risk that various federal and state consumer laws and other legal, regulatory and economic factors may result in the collateral backing the securities being insufficient to support payment on the securities.
Cash Equivalents. Cash equivalents are short-term fixed income securities comprising:
(1) Time deposits, certificates of deposit (including marketable variable rate certificates of deposit) and bankers' acceptances issued by a commercial bank or savings and loan association. Time deposits are non-negotiable deposits maintained in a banking institution for a specified period of time at a stated interest rate. Certificates of deposit are negotiable short-term obligations issued by commercial banks or savings and loan associations against funds deposited in the issuing institution. Variable rate certificates of deposit are certificates of deposit on which the interest rate is periodically adjusted prior to their stated maturity based upon a specified market rate. A bankers' acceptance is a time draft drawn on a commercial bank by a borrower usually in connection with an international commercial transaction (to finance the import, export, transfer or storage of goods).
The Portfolio may invest in obligations of U.S. banks, of foreign branches of U.S. banks (Eurodollars) and of U.S. branches of foreign banks (Yankee dollars). Euro and Yankee dollar investments will involve some of the same risks of investing in international securities that are discussed in various foreign investing sections of this SAI.
The Portfolio will not invest in any security issued by a commercial bank unless (i) the bank has total assets of at least $1 billion, or the equivalent in other currencies, or, in the case of domestic banks which do not have total assets of at least $1 billion, the aggregate investment made in any one such bank is limited to $250,000 principal amount per certificate (a temporary increase from $100,000, which is due to expire on December 31, 2013) and the principal amount of such investment is insured in full by the Federal Deposit Insurance Corporation ("FDIC"), (ii) in the case of U.S. banks, it is a member of the FDIC, and (iii) in the case of foreign branches of U.S. banks, the security is deemed by the Adviser to be of an investment quality comparable with other fixed income securities which the Portfolio may purchase.
(2) The Portfolio may invest in commercial paper (see below) rated at time of purchase by one or more nationally recognized statistical rating organizations ("NRSRO") in one of their two highest categories, (e.g., A-l
11
or A-2 by Standard & Poor's Rating Group, a division of The McGraw-Hill Companies Inc. ("S&P") or Prime 1 or Prime 2 by Moody's Investors Services, Inc. ("Moody's")), or, if not rated, issued by a corporation having an outstanding unsecured debt issue rated high-grade by an NRSRO (e.g., A or better by Moody's, S&P or Fitch, Inc. ("Fitch"));
(3) Short-term corporate obligations rated high-grade at the time of purchase by an NRSRO (e.g., A or better by Moody's, S&P or Fitch);
(4) U.S. Government obligations including bills, notes, bonds and other debt securities issued by the U.S. Treasury. These are direct obligations of the U.S. Government and differ mainly in interest rates, maturities and dates of issue;
(5) Government agency securities issued or guaranteed by U.S. Government sponsored instrumentalities and Federal agencies. These include securities issued by the Federal Home Loan Banks, Federal Land Banks, Farmers Home Administration, Farm Credit Banks, Federal Intermediate Credit Banks, Fannie Mae, Federal Financing Bank, the TVA and others; and
(6) Repurchase agreements collateralized by securities listed above.
Commercial Paper. Commercial paper refers to short-term fixed income securities with maturities ranging from two to 270 days. They are primarily issued by corporations needing to finance large amounts of receivables, but may be issued by banks and other borrowers. Commercial paper is issued either directly or through broker-dealers and may be discounted or interest-bearing. Commercial paper is unsecured, but is almost always backed by bank lines of credit. Virtually all commercial paper is rated by Moody's or S&P.
Commercial paper rated A-1 by S&P has the following characteristics: (1) liquidity ratios are adequate to meet cash requirements; (2) long-term senior debt is rated "A" or better; (3) the issuer has access to at least two additional channels of borrowing; (4) basic earnings and cash flow have an upward trend with allowance made for unusual circumstances; (5) typically, the issuer's industry is well established and the issuer has a strong position within the industry; and (6) the reliability and quality of management are unquestioned. Relative strength or weakness of the above factors determines whether the issuer's commercial paper is A-1, A-2 or A-3.
The rating Prime-1 is the highest commercial paper rating assigned by Moody's. Among the factors considered by Moody's in assigning ratings are the following: (1) evaluation of the management of the issuer; (2) economic evaluation of the issuer's industry or industries and the appraisal of speculative-type risks which may be inherent in certain areas; (3) evaluation of the issuer's products in relation to competition and customer acceptance; (4) liquidity; (5) amount and quality of long-term debt; (6) trend of earnings over a period of ten years; (7) financial strength of a parent company and the relationships that exist with the issuer; and (8) recognition by the management of obligations which may be present or may arise as a result of public interest questions and preparations to meet such obligations.
Corporates. Corporates are fixed income securities issued by private businesses. Holders, as creditors, have a prior legal claim over holders of equity securities of the issuer as to both income and assets for the principal and interest due the holder.
High Yield Securities. High yield securities are generally considered to include fixed income securities rated below the four highest rating categories at the time of purchase (e.g., Ba through C by Moody's or BB through D by S&P or Fitch) and unrated fixed income securities considered to be of equivalent quality. High Yield Securities are not considered investment grade and are commonly referred to as "junk bonds" or high yield, high risk securities. Investment grade securities that the Portfolio holds may be downgraded to below investment grade by the rating agencies. If the Portfolio holds a security that is downgraded, the Portfolio may choose to retain the security.
12
While high yield securities offer higher yields, they also normally carry a high degree of credit risk and are considered speculative by the major credit rating agencies. High yield securities may be issued as a consequence of corporate restructuring or similar events. High yield securities are often issued by smaller, less creditworthy issuers, or by highly leveraged (indebted) issuers that are generally less able than more established or less leveraged issuers to make scheduled payments of interest and principal. In comparison to investment grade securities, the price movement of these securities is influenced less by changes in interest rates and more by the financial and business position of the issuer. The values of high yield securities are more volatile and may react with greater sensitivity to market changes.
Investment Grade Securities. Investment grade securities are fixed income securities rated by one or more of the rating agencies in one of the four highest rating categories at the time of purchase (e.g., AAA, AA, A or BBB by S&P or Fitch, or Aaa, Aa, A or Baa by Moody's) or determined to be of equivalent quality by the Adviser. Securities rated BBB or Baa represent the lowest of four levels of investment grade securities and are regarded as borderline between definitely sound obligations and those in which the speculative element begins to predominate. Ratings assigned to fixed income securities represent only the opinion of the rating agency assigning the rating and are not dispositive of the credit risk associated with the purchase of a particular fixed income security. Moreover, market risk also will affect the prices of even the highest rated fixed income securities so that their prices may rise or fall even if the issuer's capacity to repay its obligations remains unchanged.
Loan Participations and Assignments. Loan participations are interests in loans or other direct debt instruments ("Loans") relating to amounts owed by a corporate, governmental or other borrower to another party. Loans may represent amounts owed to lenders or lending syndicates, to suppliers of goods or services (trade claims or other receivables), or to other parties ("Lenders") and may be fixed rate or floating rate. Loans also may be arranged through private negotiations between an issuer of sovereign debt obligations and Lenders.
The Portfolio's investments in Loans may be in the form of a participation in Loans ("Participations") and assignments of all or a portion of Loans ("Assignments") from third-parties. In the case of a Participation, the Portfolio will have the right to receive payments of principal, interest and any fees to which it is entitled only from the Lender selling the Participation and only upon receipt by the Lender of the payments from the borrower. In the event of an insolvency of the Lender selling a Participation, the Portfolio may be treated as a general creditor of the Lender and may not benefit from any set-off between the Lender and the borrower. Certain Participations may be structured in a manner designed to avoid purchasers of Participations being subject to the credit risk of the Lender with respect to the Participation. Even under such a structure, in the event of a Lender's insolvency, the Lender's servicing of the Participation may be delayed and the assignability of the Participation may be impaired. The Portfolio will acquire Participations only if the Lender interpositioned between the Portfolio and the borrower is determined by the Adviser and/or Sub-Advisers to be creditworthy.
When the Portfolio purchases Assignments from Lenders it will acquire direct rights against the borrower on the Loan. However, because Assignments are arranged through private negotiations between potential assignees and potential assignors, the rights and obligations acquired by the Portfolio as the purchaser of an Assignment may differ from, and be more limited than, those held by the assigning Lender. Because there is no liquid market for such securities, it is likely that such securities could be sold only to a limited number of institutional investors. The lack of a liquid secondary market may have an adverse impact on the value of such securities and the Portfolio's ability to dispose of particular Assignments or Participations when necessary to meet the Portfolio's liquidity needs or in response to a specific economic event, such as a deterioration in the creditworthiness of the borrower. The lack of a liquid secondary market for Assignments and Participations also may make it more difficult for the Portfolio to assign a value to these securities for purposes of valuing a Portfolio's securities and calculating its NAV.
13
Loan Participations and Assignments involve a risk of loss in case of default or insolvency of the borrower. In addition, they may offer less legal protection to the Portfolio in the event of fraud or misrepresentation and may involve a risk of insolvency of the Lender. Certain Loan Participations and Assignments may also include standby financing commitments that obligate the investing Portfolio to supply additional cash to the borrower on demand. Participations involving emerging market issuers may relate to Loans as to which there has been or currently exists an event of default or other failure to make payment when due and may represent amounts owed to Lenders that are themselves subject to political and economic risks, including the risk of currency devaluation, expropriation or failure. Such Loan Participations and Assignments present additional risk of default or loss.
Money Market Instruments. Money market instruments are high quality short-term fixed income securities. Money market instruments may include obligations of governments, government agencies, banks, corporations and special purpose entities and repurchase agreements relating to these obligations. Certain money market instruments may be denominated in a foreign currency.
Mortgage Related Securities. Mortgage related securities are securities that, directly or indirectly, represent a participation in, or are secured by and payable from, mortgage loans on real property. Mortgage related securities include collateralized mortgage obligations and mortgage-backed securities issued or guaranteed by agencies or instrumentalities of the U.S. Government or by private sector entities.
Mortgage-Backed Securities. With MBS, many mortgagees' obligations to make monthly payments to their lending institution are pooled together and passed through to investors. The pools are assembled by various governmental, government-related and private organizations. The Portfolio may invest in securities issued or guaranteed by Ginnie Mae, Freddie Mac or Fannie Mae, private issuers and other government agencies. MBS issued by non-agency issuers, whether or not such securities are subject to guarantees, may entail greater risk, since private issuers may not be able to meet their obligations under the policies. If there is no guarantee provided by the issuer, the Portfolio will purchase only MBS that, at the time of purchase, are rated investment grade by one or more NRSROs or, if unrated, are deemed by the Adviser to be of comparable quality.
MBS are issued or guaranteed by private sector originators of or investors in mortgage loans and structured similarly to governmental pass-through securities. Because private pass-throughs typically lack a guarantee by an entity having the credit status of a governmental agency or instrumentality, however, they are generally structured with one or more of the types of credit enhancement described below. Fannie Mae and Freddie Mac obligations are not backed by the full faith and credit of the United States as Ginnie Mae certificates are. Freddie Mac securities are supported by Freddie Mac's right to borrow from the U.S. Treasury. Each of Ginnie Mae, Fannie Mae and Freddie Mac guarantees timely distributions of interest to certificate holders. Each of Ginnie Mae and Fannie Mae also guarantees timely distributions of scheduled principal. Although Freddie Mac has in the past guaranteed only the ultimate collection of principal of the underlying mortgage loan, Freddie Mac now issues MBS (Freddie Mac Gold PCS) that also guarantee timely payment of monthly principal reductions. Resolution Funding Corporation ("REFCORP") obligations are backed, as to principal payments, by zero coupon U.S. Treasury bonds and, as to interest payments, ultimately by the U.S. Treasury.
There are two methods of trading MBS. A specified pool transaction is a trade in which the pool number of the security to be delivered on the settlement date is known at the time the trade is made. This is in contrast with the typical MBS transaction, called a TBA ("To Be Announced") transaction, in which the type of MBS to be delivered is specified at the time of trade but the actual pool numbers of the securities that will be delivered are not known at the time of the trade. The pool numbers of the pools to be delivered at settlement are announced shortly before settlement takes place. The terms of the TBA trade may be made more specific if desired. Generally, agency pass-through MBS are traded on a TBA basis. Investments in TBAs may give rise to a form of leverage and may cause the Portfolio's portfolio turnover rate to appear higher. Leverage may cause the Portfolio to be more volatile than if the Portfolio had not been leveraged.
14
Like fixed income securities in general, MBS will generally decline in price when interest rates rise. Rising interest rates also tend to discourage refinancings of home mortgages, with the result that the average life of MBS held by the Portfolio may be lengthened. As average life extends, price volatility generally increases. This extension of average life causes the market price of the MBS to decrease further when interest rates rise than if their average lives were fixed. However, when interest rates fall, mortgages may not enjoy as large a gain in market value due to prepayment risk because additional mortgage prepayments must be reinvested at lower interest rates. Faster prepayment will shorten the average life and slower prepayments will lengthen it. However, it is possible to determine what the range of the average life movement could be and to calculate the effect that it will have on the price of the MBS. In selecting MBS, the Adviser looks for those that offer a higher yield to compensate for any variation in average maturity. If the underlying mortgage assets experience greater than anticipated prepayments of principal, the Portfolio may fail to fully recoup its initial investment in these securities, even if the security is in one of the highest rating categories. The Portfolio may invest, without limit, in MBS issued by private issuers when the Adviser deems that the quality of the investment, the quality of the issuer, and market conditions warrant such investments. The Portfolio will purchase securities issued by private issuers that are rated investment grade at the time of purchase by Moody's, Fitch or S&P or are deemed by the Adviser to be of comparable investment quality.
Fannie Mae Certificates. Fannie Mae is a federally chartered and privately owned corporation organized and existing under the Federal National Mortgage Association Charter Act of 1938. Each Fannie Mae certificate represents a pro rata interest in one or more pools of mortgage loans insured by the FHA under the Housing Act, or Title V of the Housing Act of 1949 ("FHA Loans"), or guaranteed by the Department of Veteran Affairs under the Servicemen's Readjustment Act of 1944, as amended ("VA Loans") or conventional mortgage loans (i.e., mortgage loans that are not insured or guaranteed by any governmental agency) of the following types: (i) fixed rate level payment mortgage loans; (ii) fixed rate growing equity mortgage loans; (iii) fixed rate graduated payment mortgage loans; (iv) variable rate California mortgage loans; (v) other adjustable rate mortgage loans; and (vi) fixed rate and adjustable mortgage loans secured by multi-family projects.
Freddie Mac Certificates. Freddie Mac is a corporate instrumentality of the United States created pursuant to the Emergency Home Finance Act of 1970, as amended (the "FHLMC Act"). Freddie Mac certificates represent a pro rata interest in a group of mortgage loans (a "Freddie Mac Certificate group") purchased by Freddie Mac. The mortgage loans underlying the Freddie Mac Certificates consist of fixed rate or adjustable rate mortgage loans with original terms to maturity of between ten and thirty years, substantially all of which are secured by first liens on one-to-four-family residential properties or multi-family projects. Each mortgage loan must meet the applicable standards set forth in the FHLMC Act. A Freddie Mac Certificate group may include whole loans, participation interests in whole loans and undivided interests in whole loans and participations comprising another Freddie Mac Certificate group.
In September 2008, the U.S. Treasury Department announced that the government would be taking over Fannie Mae and Freddie Mac and placing the companies into a conservatorship. In addition, the U.S. Treasury announced three additional steps that it intended to take with respect to Fannie Mae and Freddie Mac in order to support the conservatorship. First, the U.S. Treasury entered into "Preferred Stock Purchase Agreements" (PSPAs) under which, if the Federal Housing Finance Agency ("FHFA") determines that Fannie Mae's or Freddie Mac's liabilities exceed its assets under generally accepted accounting principles, the U.S. Treasury will contribute cash capital to the company in an amount equal to the difference between liabilities and assets. The PSPAs are designed to provide protection to the senior and subordinated debt and the mortgage-backed securities issued by Fannie Mae and Freddie Mac. Second, the U.S. Treasury established a new secured lending credit facility that was available to Fannie Mae and Freddie Mac until December 2009. Third, the U.S. Treasury initiated a temporary program to purchase Fannie Mae and Freddie Mac mortgage-backed securities, which terminated in December 2009. In addition, the Federal Reserve exercised its separate authority in 2009 to purchase mortgage-backed securities of Fannie Mae and Freddie Mac. While the U.S. Treasury is committed to
15
offset negative equity at Fannie Mae and Freddie Mac through its stock purchases, no assurance can be given that the Federal Reserve, U.S. Treasury, or FHFA initiatives discussed above will ensure that Fannie Mae and Freddie Mac will remain successful in meeting their obligations with respect to the debt and mortgage-backed securities they issue.
Ginnie Mae Certificates. Ginnie Mae is a wholly-owned corporate instrumentality of the United States within the Department of Housing and Urban Development. The National Housing Act of 1934, as amended (the "Housing Act"), authorizes Ginnie Mae to guarantee the timely payment of the principal and interest on certificates that are based on and backed by a pool of FHA Loans, VA Loans or by pools of other eligible mortgage loans. The Housing Act provides that the full faith and credit of the United States is pledged to the payment of all amounts that may be required to be paid under any guaranty. In order to meet its obligations under such guaranty, Ginnie Mae is authorized to borrow from the U.S. Treasury with no limitations as to amount.
Each Ginnie Mae certificate represents a pro rata interest in one or more of the following types of mortgage loans: (i) fixed rate level payment mortgage loans; (ii) fixed rate graduated payment mortgage loans; (iii) fixed rate growing equity mortgage loans; (iv) fixed rate mortgage loans secured by manufactured (mobile) homes; (v) mortgage loans on multi-family residential properties under construction; (vi) mortgage loans on completed multi-family projects; (vii) fixed rate mortgage loans as to which escrowed funds are used to reduce the borrower's monthly payments during the early years of the mortgage loans ("buydown" mortgage loans); (viii) mortgage loans that provide for adjustments in payments based on periodic changes in interest rates or in other payment terms of the mortgage loans; and (ix) mortgage-backed serial notes. All of these mortgage loans will be FHA Loans or VA loans and, except as otherwise specified above, will be fully-amortizing loans secured by first liens on one to four-family housing units.
Collateralized Mortgage Obligations. The Portfolio may invest in collateralized mortgage obligations ("CMOs"), which are mortgage-backed securities that are collateralized by mortgage loans or mortgage pass-through securities, and multi-class pass-through securities, which are equity interests in a trust composed of mortgage loans or other mortgage backed securities. Unless the context indicates otherwise, the discussion of CMOs below also applies to multi-class pass through securities.
CMOs may be issued by governmental or government-related entities or by private entities, such as banks, savings and loan institutions, private mortgage insurance companies, mortgage bankers and other secondary market traders. CMOs are issued in multiple classes, often referred to as "tranches," with each tranche having a specific fixed or floating coupon rate and stated maturity or final distribution date. Under the traditional CMO structure, the cash flows generated by the mortgages or mortgage pass-through securities in the collateral pool are used to first pay interest and then pay principal to the holders of the CMOs. Subject to the various provisions of individual CMO issues, the cash flow generated by the underlying collateral (to the extent it exceeds the amount required to pay the stated interest) is used to retire the bonds.
The principal and interest on the underlying collateral may be allocated among the several tranches of a CMO in innumerable ways. In a common CMO structure, the tranches are retired sequentially in the order of their respective stated maturities or final distribution dates (as opposed to the pro-rata return of principal found in traditional pass-through obligations). The fastest-pay tranches would initially receive all principal payments. When those tranches are retired, the next tranches in the sequence receive all of the principal payments until they are retired. The sequential retirement of bond groups continues until the last tranche is retired. Accordingly, the CMO structure allows the issuer to use cash flows of long maturity, monthly-pay collateral to formulate securities with short, intermediate, and long final maturities and expected average lives and risk characteristics.
The primary risk of CMOs is the uncertainty of the timing of cash flows that results from the rate of prepayments on the underlying mortgages serving as collateral and from the structure of the particular CMO
16
transaction (that is, the priority of the individual tranches). An increase or decrease in prepayment rates (resulting from a decrease or increase in mortgage interest rates) may cause the CMOs to be retired substantially earlier than their stated maturities or final distribution dates and will affect the yield and price of CMOs. In addition, the collateral securing CMOs or any third-party guarantees are insufficient to make payments, a Portfolio could sustain a loss. The prices of certain CMOs, depending on their structure and the rate of prepayments, can be volatile. Some CMOs may also not be as liquid as other types of mortgage securities. As a result, it may be difficult or impossible to sell the securities at an advantageous time or price.
Privately issued CMOs are arrangements in which the underlying mortgages are held by the issuer, which then issues debt collateralized by the underlying mortgage assets. Such securities may be backed by mortgage insurance, letters of credit, or other credit enhancing features. Although payment of the principal of, and interest on, the underlying collateral securing privately issued CMOs may be guaranteed by the U.S. Government or its agencies or instrumentalities, these CMOs represent obligations solely of the private issuer and are not insured or guaranteed by the U.S. Government, its agencies or instrumentalities or any other person or entity. Privately issued CMOs are subject to prepayment risk due to the possibility that prepayments on the underlying assets will alter the cash flow. Yields on privately issued CMOs have been historically higher than the yields on CMOs backed by mortgages guaranteed by U.S. government agencies or instrumentalities. The risk of loss due to default on privately issued CMOs, however, is historically higher since the U.S. Government has not guaranteed them.
New types of CMO tranches have evolved. These include floating rate CMOs, planned amortization classes, accrual bonds and CMO residuals. These newer structures affect the amount and timing of principal and interest received by each tranche from the underlying collateral. For example, an inverse interest-only class CMO entitles holders to receive no payments of principal and to receive interest at a rate that will vary inversely with a specified index or a multiple thereof. Under certain of these newer structures, given classes of CMOs have priority over others with respect to the receipt of prepayments on the mortgages. Therefore, depending on the type of CMOs in which a Portfolio invests, the investment may be subject to a greater or lesser risk of prepayment than other types of mortgage-backed securities.
CMOs may include real estate investment conduits ("REMICs"). REMICs, which were authorized under the Tax Reform Act of 1986, are private entities formed for the purpose of holding a fixed pool of mortgages secured by an interest in real property. A REMIC is a CMO that qualifies for special tax treatment under the Internal Revenue Code and invests in certain mortgages principally secured by interests in real property.
The Portfolio may invest in, among others, parallel pay CMOs and planned amortization class CMOs ("PAC Bonds"). Parallel pay CMOs are structured to provide payments of principal on each payment date to more than one tranche. These simultaneous payments are taken into account in calculating the stated maturity date or final distribution date of each tranche which, as with other CMO structures, must be retired by its stated maturity date or final distribution date but may be retired earlier. PAC Bonds are a form of parallel pay CMO, with the required principal payment on such securities having the highest priority after interest has been paid to all classes. PAC Bonds generally require payments of a specified amount of principal on each payment date.
Stripped Mortgage-Backed Securities. The Portfolio may invest in stripped mortgage-backed securities ("SMBS"). An SMBS is a derivative multi-class mortgage security. SMBS usually are structured with two classes that receive different proportions of the interest and principal distribution on a pool of mortgage assets. In the most extreme case, one class will receive all of the interest (the interest-only or "IO" class), while the other class will receive all of the principal (the principal-only or "PO" class). The yield to maturity on an IO class is extremely sensitive to the rate of principal payments (including prepayments) on the related underlying mortgage assets, and a rapid rate of principal payments may have a material adverse effect on such security's yield to maturity. If the underlying mortgage assets experience greater than anticipated prepayments of principal, a Portfolio may fail to fully recoup its initial investment in these securities. Conversely, if the underlying
17
mortgage assets experience less than anticipated prepayments of principal, the yield of POs could be materially adversely affected. The market values of IOs and POs are subject to greater risk of fluctuation in response to changes in market rates of interest than many other types of government securities. To the extent the Portfolio invests in IOs and POs, this increases the risk of fluctuations in the NAV of the Portfolio.
Commercial Mortgage-Backed Securities. The Portfolio may invest in commercial mortgage-backed securities ("CMBS"). CMBS are generally multi-class or pass-through securities issued by special purpose entities that represent an undivided interest in a portfolio of mortgage loans backed by commercial properties, including, but not limited to, industrial and warehouse properties, office buildings, retail space and shopping malls, hotels, healthcare facilities, multifamily properties and cooperative apartments. Private lenders, such as banks or insurance companies, originate these loans and then sell the loans directly into a CMBS trust or other entity. The commercial mortgage loans that underlie CMBS are generally not amortizing or not fully amortizing. That is, at their maturity date, repayment of the remaining principal balance or "balloon" is due and is repaid through the attainment of an additional loan or sale of this property. An extension of the final payment on commercial mortgages will increase the average life of the CMBS, generally resulting in a lower yield for discount bonds and a higher yield for premium bonds.
CMBS are subject to credit risk and prepayment risk. Although prepayment risk is present, it is of a lesser degree in the CMBS than in the residential mortgage market; commercial real estate property loans often contain provisions which substantially reduce the likelihood that such securities will be prepaid (e.g., significant prepayment penalties on loans and, in some cases, prohibition on principal payments for several years following origination).
Credit Enhancement. Mortgage related securities are often backed by a pool of assets representing the obligations of a number of parties. To lessen the effect of failure by obligors on underlying assets to make payments, these securities may have various types of credit support. Credit support falls into two primary categories: (i) liquidity protection, and (ii) protection against losses resulting from ultimate default by an obligor on the underlying assets. Liquidity protection generally refers to the provision of advances, typically by the entity administering the pool of assets, to ensure that the pass-through of payments due on the underlying pool occurs in a timely fashion. Protection against losses resulting from ultimate default enhances the likelihood of ultimate payment of the obligations on at least a portion of the assets in the pool. Such protection may be provided through guarantees, insurance policies or letters of credit obtained by the issuer or sponsor from third-parties (referred to herein as "third-party credit support"), through various means of structuring the transaction or through a combination of such approaches.
The ratings of mortgage related securities for which third-party credit enhancement provides liquidity protection or protection against losses from default are generally dependent upon the continued creditworthiness of the provider of the credit enhancement. The ratings of such securities could decline in the event of deterioration in the creditworthiness of the credit enhancement provider even in cases where the delinquency and loss experience on the underlying pool of assets is better than expected.
Examples of credit support arising out of the structure of the transaction include "senior-subordinated securities" (multiple class securities with one or more classes subordinate to other classes as to the payment of principal and interest thereon, with defaults on the underlying assets being borne first by the holders of the most subordinated class), creation of "reserve funds" (where cash or investments, sometimes funded from a portion of the payments on the underlying assets, are held in reserve against future losses) and "over-collateralization" (where the scheduled payments on, or the principal amount of, the underlying assets exceed those required to make payment of the securities and pay any servicing or other fees). The degree of credit support provided for each security is generally based on historical information with respect to the level of credit risk associated with the underlying assets. Delinquency or loss in excess of that which is anticipated could adversely affect the return on an investment in such a security.
18
Municipals. Municipal securities are fixed income securities issued by local, state and regional governments that provide interest income which is exempt from federal income taxes. Municipals include both municipal bonds (those securities with maturities of five years or more) and municipal notes (those with maturities of less than five years). Municipal bonds are issued for a wide variety of reasons: to construct public facilities, such as airports, highways, bridges, schools, hospitals, mass transportation, streets, water and sewer works; to obtain funds for operating expenses; to refund outstanding municipal obligations; and to loan funds to various public institutions and facilities. Certain industrial development bonds are also considered municipal bonds if their interest is exempt from federal income tax. Industrial development bonds are issued by, or on behalf of, public authorities to obtain funds for various privately-operated manufacturing facilities, housing, sports arenas, convention centers, airports, mass transportation systems and water, gas or sewage works. Industrial development bonds are ordinarily dependent on the credit quality of a private user, not the public issuer.
The two principal classifications of municipal bonds are "general obligation" and "revenue" or "special tax" bonds. General obligation bonds are secured by the issuer's pledge of its full faith, credit and taxing power for the payment of principal and interest. Revenue or special tax bonds are payable only from the revenues derived from a particular facility or class of facilities or, in some cases, from the proceeds of a special excise or other tax, but not from general tax revenues.
Industrial revenue bonds in most cases are revenue bonds and generally do not have the pledge of the credit of the issuer. The payment of the principal and interest on such industrial revenue bonds is dependent solely on the ability of the user of the facilities financed by the bonds to meet its financial obligations and the pledge, if any, of real and personal property so financed as security for such payment. Short-term municipal obligations issued by states, cities, municipalities or municipal agencies, include tax anticipation notes, revenue anticipation notes, bond anticipation notes, construction loan notes and short-term discount notes.
Municipal notes are issued to meet the short-term funding requirements of local, regional and state governments. Municipal notes include bond anticipation notes, revenue anticipation notes and tax and revenue anticipation notes. These are short-term debt obligations issued by state and local governments to aid cash flows while waiting for taxes or revenue to be collected, at which time the debt is retired. Other types of municipal notes in which the Portfolio may invest are construction loan notes, short-term discount notes, tax-exempt commercial paper, demand notes and similar instruments.
Municipal bonds generally include debt obligations issued by states and their political subdivisions and duly constituted authorities and corporations, to obtain funds to construct, repair or improve various public facilities such as airports, bridges, highways, hospitals, housing, schools, streets and water and sewer works. Municipal bonds may also be issued to refinance outstanding obligations as well as to obtain funds for general operating expenses and for loans to other public institutions and facilities.
Note obligations with demand or put options may have a stated maturity in excess of one year, but permit any holder to demand payment of principal plus accrued interest upon a specified number of days' notice. Frequently, such obligations are secured by letters of credit or other credit support arrangements provided by banks. The issuer of such notes normally has a corresponding right, after a given period, to repay at its discretion the outstanding principal of the note plus accrued interest upon a specific number of days' notice to the bondholders. The interest rate on a demand note may be based upon a known lending rate, such as the prime lending rate and be adjusted when such rate changes, or the interest rate on a demand note may be a market rate that is adjusted at specified intervals. Each note purchased by the Portfolio will meet the quality criteria set out in the Prospectuses for the Portfolio.
The yields of municipal bonds depend on, among other things, general money market conditions, conditions in the municipal bond market, the size of a particular offering, the maturity of the obligation and the rating of
19
the issue. The ratings of Moody's and S&P represent their opinions of the quality of the municipal bonds rated by them. It should be emphasized that such ratings are general and are not absolute standards of quality. Consequently, municipal bonds with the same maturity, coupon and rating may have different yields, while municipal bonds of the same maturity and coupon, but with different ratings may have the same yield. It will be the responsibility of the investment management staff to appraise independently the fundamental quality of the bonds held by the Portfolio.
Municipal bonds are sometimes purchased on a "when-issued" basis, meaning the Portfolio has committed to purchase certain specified securities at an agreed upon price when they are issued. The period between commitment date and issuance date can be a month or more. It is possible that the securities will never be issued and the commitment canceled.
From time to time proposals have been introduced before Congress to restrict or eliminate the federal income tax exemption for interest on municipal bonds. Similar proposals may be introduced in the future. If any such proposal were enacted, it might restrict or eliminate the ability of the Portfolio to achieve its investment objectives. In that event, the Fund's Directors and officers would reevaluate investment objectives and policies and consider recommending to shareholders changes in such objectives and policies.
Similarly, from time to time proposals have been introduced before state and local legislatures to restrict or eliminate the state and local income tax exemption for interest on municipal bonds. Similar proposals may be introduced in the future. If any such proposal were enacted, it might restrict or eliminate the ability of the Portfolio to achieve its investment objective. In that event, the Fund's Directors and officers would reevaluate investment objectives and policies and consider recommending to shareholders changes in such objectives and policies.
The Portfolio may also purchase bonds the income on which is subject to the alternative minimum tax ("AMT bonds"). AMT bonds are tax-exempt private activity bonds issued after August 7, 1986, the proceeds of which are directed, at least in part, to private, for-profit organizations. While the income from AMT bonds is exempt from regular federal income tax, it is a tax preference item in the calculation of the alternative minimum tax. The alternative minimum tax is a special separate tax that applies to some taxpayers who have certain adjustments to income or tax preference items.
Build America Bonds are taxable municipal securities on which the issuer receives federal support of the interest paid. Assuming certain specified conditions are satisfied, issuers of Build America Bonds may either (i) receive reimbursement from the U.S. Treasury with respect to a portion of its interest payments on the bonds ("direct pay" Build America Bonds) or (ii) provide tax credits to investors in the bonds ("tax credit" Build America Bonds). Unlike most other municipal securities, interest received on Build America Bonds is subject to federal and state income tax. Issuance of Build America Bonds ceased on December 31, 2010. The number of Build America Bonds available in the market is limited, which may negatively affect the value of the Build America Bonds.
Repurchase Agreements. Repurchase agreements are transactions in which the Portfolio purchases a security or basket of securities and simultaneously commits to resell that security or basket to the seller (a bank, broker or dealer) at a mutually agreed upon date and price. The resale price reflects the purchase price plus an agreed upon market rate of interest which is unrelated to the coupon rate or date of maturity of the purchased security. The term of these agreements is usually from overnight to one week and never exceeds one year. Repurchase Agreements with a term of over seven days are considered illiquid.
In these transactions, the Portfolio receives securities that have a market value at least equal to the purchase price (including accrued interest) of the repurchase agreement and this value is maintained during the term of the agreement. These securities are held by the Portfolio's Custodian or an approved third-party for the benefit
20
of the Portfolio until repurchased. Repurchase agreements permit the Portfolio to remain fully invested while retaining overnight flexibility to pursue investments of a longer-term nature. If the seller defaults and the value of the repurchased securities declines, the Portfolio might incur a loss. If bankruptcy proceedings are commenced with respect to the seller, the Portfolio's realization upon the collateral may be delayed.
While repurchase agreements involve certain risks not associated with direct investments in debt securities, the Portfolio follows procedures approved by the Directors that are designed to minimize such risks. These procedures include effecting repurchase transactions only with large, well-capitalized and well-established financial institutions whose financial condition will be continually monitored by the Adviser. In addition, as described above, the value of the collateral underlying the repurchase agreement will be at least equal to the repurchase price, including any accrued interest earned on the repurchase agreement. In the event of a default or bankruptcy by a selling financial institution, the Portfolio will seek to liquidate such collateral. However, the exercising of the Portfolio's right to liquidate such collateral could involve certain costs or delays and, to the extent that proceeds from any sale upon a default of the obligation to repurchase were less than the repurchase price, the Portfolio could suffer a loss.
Pursuant to an order issued by the SEC, the portfolios managed by the Adviser may pool their daily uninvested cash balances in order to invest in repurchase agreements on a joint basis with other investment companies advised by that Adviser. By entering into repurchase agreements on a joint basis, the portfolios expect to incur lower transaction costs and potentially obtain higher rates of interest on such repurchase agreements. Each portfolio's participation in the income from jointly purchased repurchase agreements will be based on that portfolio's percentage share in the total repurchase agreement.
Temporary Investments. When the Adviser believes that changes in market, economic, political or other conditions make it advisable, the Portfolio may invest up to 100% of its assets in cash, cash equivalents or other fixed income securities for temporary defensive purposes that may be inconsistent with the Portfolio's investment strategies. These temporary investments may consist of obligations of the U.S. or foreign governments, their agencies or instrumentalities; money market instruments; and instruments issued by international development agencies.
U.S. Treasury Securities. The U.S. Treasury securities that the Portfolio may purchase include U.S. Treasury bills, notes and bonds issued by the U.S. Treasury. These instruments are direct obligations of the U.S. Government and, as a result, are backed by the full faith and credit of the United States. They differ primarily in their interest rates, the lengths of their maturities and the dates of their issuances.
Yankee Dollar Obligations. Yankee dollar obligations are fixed income securities. Yankee bank obligations, which include time deposits and certificates of deposit, are U.S. dollar-denominated obligations issued in the U.S. capital markets by foreign banks. The Portfolio may consider Yankee dollar obligations to be domestic securities for purposes of their investment policies.
Yankee dollar obligations are subject to the same risks that pertain to domestic issues, notably credit risk, market risk and liquidity risk. However, to a limited extent, Yankee dollar obligations also are subject to certain sovereign risks. One such risk is the possibility that a sovereign country might prevent capital from flowing across its borders. Other risks include: adverse political and economic developments; the extent and quality of government regulation of financial markets and institutions; the imposition of foreign withholding taxes and the expropriation or nationalization of foreign issuers.
Zero Coupons, Pay-In-Kind Securities or Deferred Payment Securities. Zero coupon, pay-in-kind and deferred payment securities are all types of fixed income securities on which the holder does not receive periodic cash payments of interest or principal. Generally, these securities are subject to greater price volatility and lesser liquidity in the event of adverse market conditions than comparably rated securities paying cash interest at
21
regular intervals. Although the Portfolio will not receive cash periodic coupon payments on these securities, the Portfolio may be deemed to have received interest income, or "phantom income" during the life of the obligation. The Portfolio may have to pay taxes on this phantom income, although it has not received any cash payment.
Zero Coupons. Zero coupons are fixed income securities that do not make regular interest payments. Instead, zero coupons are sold at a discount from their face value. The difference between a zero coupon's issue or purchase price and its face value represents the imputed interest an investor will earn if the obligation is held until maturity. For tax purposes, a portion of this imputed interest is deemed as income received by zero coupon bondholders each year. The Portfolio intends to pass along such interest as a component of the Portfolio's distributions of net investment income.
Zero coupons may offer investors the opportunity to earn a higher yield than that available on ordinary interest-paying obligations of similar credit quality and maturity. However, zero coupon prices may also exhibit greater price volatility than ordinary fixed income securities because of the manner in which their principal and interest are returned to the investor.
Pay-In-Kind Securities. Pay-in-kind securities are securities that have interest payable by delivery of additional securities. Upon maturity, the holder is entitled to receive the aggregate par value of the securities.
Deferred Payment Securities. Deferred payment securities are securities that remain zero coupons until a predetermined date, at which time the stated coupon rate becomes effective and interest becomes payable at regular intervals.
FOREIGN INVESTMENT
Investing in foreign securities involves certain special considerations which are not typically associated with investments in the securities of U.S. issuers. Foreign issuers are not generally subject to uniform accounting, auditing and financial reporting standards and may have policies that are not comparable to those of domestic issuers. As a result, there may be less information available about foreign issuers than about domestic issuers. Securities of some foreign issuers may be less liquid and more volatile than securities of comparable domestic issuers. There is generally less government supervision and regulation of stock exchanges, brokers and listed issuers than in the United States. In addition, with respect to certain foreign countries, there is a possibility of expropriation or confiscatory taxation, political and social instability or diplomatic development which could affect U.S. investments in those countries. The costs of investing in foreign countries frequently are higher than the costs of investing in the United States. Although the Adviser endeavors to achieve the most favorable execution costs in portfolio transactions, fixed commissions on many foreign stock exchanges are generally higher than negotiated commissions on U.S. exchanges. In addition, investments in certain foreign markets which have historically been considered stable may become more volatile and subject to increased risk due to ongoing developments and changing conditions in such markets. Moreover, the growing interconnectivity of global economies and financial markets has increased the probability that adverse developments and conditions in one country or region will affect the stability of economies and financial markets in other countries or regions.
Investments in securities of foreign issuers may be denominated in foreign currencies. Accordingly, the value of the Portfolio's assets, as measured in U.S. dollars, may be affected favorably or unfavorably by changes in currency exchange rates and in exchange control regulations. The Portfolio may incur costs in connection with conversions between various currencies.
Certain foreign governments levy withholding or other taxes on dividend and interest income. Although in some countries a portion of these taxes are recoverable, the non-recovered portion of foreign withholding taxes
22
will reduce the income received from investments in such countries. The Portfolio may be able to claim a credit for U.S. tax purposes with respect to any such foreign taxes.
The Adviser may consider an issuer to be from a particular country (including the United States) or geographic region if (i) its principal securities trading market is in that country or geographic region; (ii) alone or on a consolidated basis it derives 50% or more of its annual revenue from goods produced, sales made or services performed in that country or geographic region; or (iii) it is organized under the laws of, or has a principal office in, that country or geographic region. By applying these tests, it is possible that a particular issuer could be deemed to be from more than one country or geographic region.
Brady Bonds. Brady Bonds are both emerging market securities and foreign fixed income securities. They are created through the exchange of existing commercial bank loans to foreign entities for new obligations in connection with debt restructuring under a plan introduced by Nicholas F. Brady when he was the U.S. Secretary of the Treasury. They may be collateralized or uncollateralized and issued in various currencies (although most are U.S. dollar-denominated) and they are actively traded in the over-the-counter ("OTC") secondary market. The Portfolio will invest in Brady Bonds only if they are consistent with the Portfolio's quality specifications.
Dollar-denominated, collateralized Brady Bonds may be fixed rate par bonds or floating rate discount bonds. Interest payments on Brady Bonds generally are collateralized by cash or securities in an amount that, in the case of fixed rate bonds, is equal to at least one year of rolling interest payments or, in the case of floating rate bonds, initially is equal to at least one year's rolling interest payments based on the applicable interest rate at that time and is adjusted at regular intervals thereafter. Certain Brady Bonds are entitled to "value recovery payments" in certain circumstances, which in effect constitute supplemental interest payments but generally are not collateralized.
Brady Bonds are often viewed as having three or four valuation components: (i) the collateralized repayment of principal at final maturity; (ii) the collateralized interest payments; (iii) the uncollateralized interest payments; and (iv) any uncollateralized repayment of principal at maturity (these uncollateralized amounts constitute the "residual risk"). In the event of a default with respect to collateralized Brady Bonds as a result of which the payment obligations of the issuer are accelerated, the U.S. Treasury zero coupon obligations held as collateral for the payment of principal will not be distributed to investors, nor will such obligations be sold and the proceeds distributed. The collateral will be held by the collateral agent to the scheduled maturity of the defaulted Brady Bonds, which will continue to be outstanding, at which time the face amount of the collateral will equal the principal payments due on the Brady Bonds in the normal course. However, Brady Bonds should be viewed as speculative in light of the history of defaults with respect to commercial bank loans by public and private entities of countries issuing Brady Bonds.
Emerging Market Securities. An emerging market security is one issued by a foreign government or private issuer that has one or more of the following characteristics: (i) its principal securities trading market is in an emerging market or developing country, (ii) alone or on a consolidated basis it derives 50% or more of its annual revenue from goods produced, sales made or services performed in emerging markets or (iii) it is organized under the laws of, or has a principal office in, an emerging market or developing country. Based on these criteria it is possible for a security to be considered issued by an issuer in more than one country. Therefore, it is possible for the securities of any issuer that has one or more of these characteristics in connection with any emerging market or developing country not to be considered an emerging market security if it has one or more of these characteristics in connection with a developed country.
Emerging market describes any country which is generally considered to be an emerging or developing country by major organizations in the international financial community, such as the International Bank for Reconstruction and Development (more commonly known as the World Bank) and the International Finance Corporation.
23
The economies of individual emerging market or developing countries may differ favorably or unfavorably from the U.S. economy in such respects as growth of gross domestic product, rate of inflation, currency depreciation, capital reinvestment, resource self-sufficiency and balance of payments position. Further, the economies of developing countries generally are heavily dependent upon international trade and, accordingly, have been, and may continue to be, adversely affected by trade barriers, exchange controls, managed adjustments in relative currency values and other protectionist measures. These economies also have been, and may continue to be, adversely effected by economic conditions in the countries with which they trade.
Prior governmental approval for foreign investments may be required under certain circumstances in some emerging market or developing countries, and the extent of foreign investment in certain fixed income securities and domestic companies may be subject to limitation in other emerging market or developing countries. Foreign ownership limitations also may be imposed by the charters of individual companies in emerging market or developing countries to prevent, among other concerns, violation of foreign investment limitations. Repatriation of investment income, capital and the proceeds of sales by foreign investors may require governmental registration and/or approval in some emerging countries. The Portfolio could be adversely affected by delays in, or a refusal to grant, any required governmental registration or approval for such repatriation. Any investment subject to such repatriation controls will be considered illiquid if it appears reasonably likely that this process will take more than seven days.
Investment in emerging market or developing countries may entail purchasing securities issued by or on behalf of entities that are insolvent, bankrupt, in default or otherwise engaged in an attempt to reorganize or reschedule their obligations and in entities that have little or no proven credit rating or credit history. In any such case, the issuer's poor or deteriorating financial condition may increase the likelihood that the investing Portfolio will experience losses or diminution in available gains due to bankruptcy, insolvency or fraud. Emerging market or developing countries also pose the risk of nationalization, expropriation or confiscatory taxation, political changes, government regulation, social instability or diplomatic development (including war) that could affect adversely the economies of such countries or the value of the Portfolio's investments in those countries. In addition, it may be difficult to obtain and enforce a judgment in a court outside the United States.
The Portfolio may also be exposed to an extra degree of custodial and/or market risk, especially where the securities purchased are not traded on an official exchange or where ownership records regarding the securities are maintained by an unregulated entity (or even the issuer itself).
Eurodollar Obligations. Eurodollar obligations may include bonds issued and denominated in euros. Eurodollar obligations may be issued by government and corporate issuers in Europe. Eurodollar bank obligations, which include time deposits and certificates of deposit, are U.S. dollar-denominated obligations issued outside the U.S. capital markets by foreign branches of U.S. banks and by foreign banks.
Eurodollar obligations are subject to the same risks that pertain to domestic issues, notably credit risk, market risk and liquidity risk. However, Eurodollar obligations also are subject to certain sovereign risks. One such risk is the possibility that a sovereign country might prevent capital from flowing across its borders. Other risks include: adverse political and economic developments; the extent and quality of government regulation of financial markets and institutions; the imposition of foreign withholding taxes and the expropriation or nationalization of foreign issuers.
Foreign Fixed Income Securities. Foreign fixed income securities are fixed income securities that may be denominated in foreign currency and traded primarily outside of the United States, which include: (1) obligations issued or guaranteed by foreign national governments, their agencies, instrumentalities, or political subdivisions ("sovereign debt"); (2) debt securities issued, guaranteed or sponsored by supranational organizations established or supported by several national governments, including the World Bank, the European
24
Community, the Asian Development Bank and others; (3) non-government foreign corporate debt securities; and (4) foreign mortgage securities and various other mortgages and asset-backed securities.
Certain emerging market countries are among the largest debtors to commercial banks and foreign governments. The issuer or governmental authority that controls the repayment of sovereign debt may not be willing or able to repay the principal and/or pay interest when due in accordance with the terms of such obligations.
A governmental entity's willingness or ability to repay principal and pay interest due in a timely manner may be affected by, among other factors, its cash flow situations, the extent of its foreign reserves, the availability of sufficient foreign exchange on the date a payment is due, the relative size of the debt service burden to the economy as a whole, the government's dependence on expected disbursements from third-parties, the government's policy toward the International Monetary Fund and the political constraints to which a government may be subject. Governmental entities may also be dependent on expected disbursements from foreign governments, multilateral agencies and others abroad to reduce principal and interest arrearages on their debt. The commitment on the part of these governments, agencies and others to make such disbursements may be conditioned on a debtor's implementation of economic reforms or economic performance and the timely service of such debtor's obligations. Failure to implement such reforms, achieve such levels of economic performance or repay principal or interest when due may result in the cancellation of such third-parties' commitments to lend funds to the government debtor, which may further impair such debtor's ability or willingness to timely service its debts. Holders of sovereign debt may be requested to participate in the rescheduling of such debt and to extend further loans to governmental entities. In addition, no assurance can be given that the holders of commercial bank debt will not contest payments to the holders of other foreign government debt obligations in the event of default under their commercial bank loan agreements. The issuers of the government debt securities in which a Portfolio may invest have in the past experienced substantial difficulties in servicing their external debt obligations, which led to defaults on certain obligations and the restructuring of certain indebtedness. Restructuring arrangements have included, among other things, reducing and rescheduling interest and principal payments by negotiating new or amended credit agreements or converting outstanding principal and unpaid interest to Brady Bonds, and obtaining new credit to finance interest payments. There can be no assurance that the Brady Bonds and other foreign governmental debt securities in which the Portfolio may invest will not be subject to similar restructuring arrangements or to requests for new credit, which may adversely affect the Portfolio's holdings. (See "Brady Bonds" above.) Furthermore, certain participants in the secondary market for such debt may be directly involved in negotiating the terms of these arrangements and may therefore have access to information not available to other market participants.
Foreign Currency Transactions. The U.S. dollar value of the assets of the Portfolio, to the extent it invests in securities denominated in foreign currencies, may be affected favorably or unfavorably by changes in foreign currency exchange rates and exchange control regulations, and the Portfolio may incur costs in connection with conversions between various currencies. The Portfolio may conduct its foreign currency exchange transactions on a spot (i.e., cash) basis at the spot rate prevailing in the foreign currency exchange market. The Portfolio also may manage its foreign currency transactions by entering into foreign currency forward contracts to purchase or sell foreign currencies, described under "Derivatives" below.
Foreign Equity Securities. Foreign equity securities are equity securities of a non-U.S. issuer.
Investment Funds. Some emerging market countries have laws and regulations that currently preclude direct investment or make it undesirable to invest directly in the securities of their companies. However, indirect investment in the securities of companies listed and traded on the stock exchanges in these countries is permitted by certain emerging market countries through investment funds that have been specifically authorized. The Portfolio may invest in these investment funds subject to the provisions of the 1940 Act, as applicable, and other applicable laws.
25
OTHER SECURITIES AND INVESTMENT STRATEGIES
Loans of Portfolio Securities. The Portfolio may lend its investment securities to brokers, dealers, banks and other institutional investors. By lending its investment securities, the Portfolio attempts to increase its net investment income through the receipt of interest on the cash collateral with respect to the loan or fees received from the borrower in connection with the loan. Any gain or loss in the market price of the securities loaned that might occur during the term of the loan would be for the account of the Portfolio. The Portfolio employs an agent to implement the securities lending program and the agent receives a fee from the Portfolio for its services. The Portfolio will not lend more than 331/3% of the value of its total assets.
The Portfolio may lend its portfolio securities so long as the terms, structure and the aggregate amount of such loans are not inconsistent with the 1940 Act or the rules and regulations or interpretations of the SEC thereunder, which currently require that (i) the borrower pledge and maintain with the Portfolio collateral consisting of liquid, unencumbered assets having a value at all times not less than 100% of the value of the securities loaned; (ii) the borrower add to such collateral whenever the price of the securities loaned rises (i.e., the borrower "marks to market" on a daily basis); (iii) the loan be made subject to termination by the Portfolio at any time; and (iv) the Portfolio receive reasonable interest on the loan (which may include the Portfolio investing any cash collateral in interest bearing short-term investments), any distributions on the loaned securities and any increase in their market value. In addition, voting rights may pass with the loaned securities, but the Portfolio will retain the right to call any security in anticipation of a vote that the Adviser deems material to the Security on loan.
There may be risks of delay in recovery of the securities or even loss of rights in the collateral should the borrower of the securities fail financially. However, loans will be made only to borrowers deemed by the Adviser to be of good standing and when, in the judgment of the Adviser, the consideration which can be earned currently from such securities loans justifies the attendant risk. All relevant facts and circumstances, including the creditworthiness of the broker, dealer or institution, will be considered in making decisions with respect to the lending of securities, subject to review by the Fund's Board of Directors. The Portfolio loaning securities also bears the risk that the reinvestment of collateral will result in a principal loss. Finally, there is the risk that the price of the securities will increase while they are on loan and the collateral will not be adequate to cover their value.
Non-Publicly Traded Securities, Private Placements and Restricted Securities. The Portfolio may invest in securities that are neither listed on a stock exchange nor traded over-the-counter, including privately placed and restricted securities. Such unlisted securities may involve a higher degree of business and financial risk that can result in substantial losses. As a result of the absence of a public trading market for these securities, they may be less liquid than publicly traded securities. Although these securities may be resold in privately negotiated transactions, the prices realized from these sales could be less than those originally paid by the Portfolio or less than what may be considered the fair value of such securities. Furthermore, companies whose securities are not publicly traded may not be subject to the disclosure and other investor protection requirements which might be applicable if their securities were publicly traded. The illiquidity of the market, as well as the lack of publicly available information regarding these securities, may also adversely affect the ability of the Portfolio to arrive at a fair value for certain securities at certain times and could make it difficult for the Portfolio to sell certain securities. If such securities are required to be registered under the securities laws of one or more jurisdictions before being sold, the Portfolio may be required to bear the expenses of registration.
As a general matter, the Portfolio may not invest more than 15% of its net assets, determined at the time of investment, in illiquid securities, such as securities for which there is not a readily available secondary market or securities that are restricted from sale to the public without registration. However, certain Restricted Securities can be offered and sold to qualified institutional buyers under Rule 144A under the 1933 Act ("Rule 144A Securities") and may be deemed to be liquid under guidelines adopted by the Fund's Board of Directors. The
26
Portfolio may invest without limit in liquid Rule 144A Securities. Rule 144A Securities may become illiquid if qualified institutional buyers are not interested in acquiring the securities.
Temporary Borrowing. The Portfolio is permitted to borrow from banks for extraordinary or emergency purposes. For example, the Portfolio may borrow for temporary defensive purposes or to meet shareholder redemptions when the Adviser believes that it would not be in the best interests of the Portfolio to liquidate portfolio holdings. The Portfolio will not purchase additional securities while temporary borrowings exceed 5% of its total assets.
The Board of Directors of the Fund has approved procedures whereby the Portfolio, together with other investment companies advised by the Adviser or its affiliates, may enter into a joint line of credit arrangement with a bank. The Portfolio would be liable only for its own temporary borrowings under the joint line of credit arrangements.
When-Issued and Delayed Delivery Securities. When-issued and delayed delivery securities are securities purchased with payment and delivery taking place in the future in order to secure what is considered to be an advantageous yield or price at the time of the transaction. Delivery of and payment for these securities may take as long as a month or more after the date of the purchase commitment, but will take place no more than 120 days after the trade date. The payment obligation and the interest rates that will be received are each fixed at the time the Portfolio enters into the commitment and no interest accrues to the Portfolio until settlement. Thus, it is possible that the market value at the time of settlement could be higher or lower than the purchase price if the general level of interest rates has changed. An increase in the percentage of the Portfolio's assets committed to the purchase of securities on a when-issued or delayed delivery basis may increase the volatility of its NAV. When the Portfolio agrees to purchase when-issued or delayed delivery securities, it will segregate or earmark cash or liquid securities in an amount equal to the Portfolio's commitment to purchase these securities.
DERIVATIVES
The Portfolio may, but is not required to, use derivatives and related investment strategies as described below. Derivatives may be used for a variety of purposes including hedging, risk management, portfolio management or to earn income. Any or all of the investment techniques described herein may be used at any time and there is no particular strategy that dictates the use of one technique rather than another, as the use of any derivative by the Portfolio is a function of numerous variables, including market conditions. The Portfolio complies with applicable regulatory requirements when using derivatives, including the segregation or earmarking of cash or liquid assets when mandated by the SEC rules or SEC staff positions. Although the Adviser seeks to use derivatives to further the Portfolio's investment objective, no assurance can be given that the use of derivatives will achieve this result.
General Risks of Derivatives. Derivatives utilized by the Portfolio may involve the purchase and sale of derivative instruments. A derivative is a financial instrument the value of which depends upon (or derives from) the value of another asset, security, interest rate or index. Derivatives may relate to a wide variety of underlying instruments, including equity and debt securities, indices, interest rates, currencies and other assets. The derivative instruments which the Portfolio may use and the risks of those instruments are described in further detail below. The Portfolio may in the future also utilize derivatives techniques, instruments and strategies that may be newly developed or permitted as a result of regulatory changes, consistent with the Portfolio's investment objective and policies. Such newly developed techniques, instruments and strategies may involve risks different than or in addition to those described herein. No assurance can be given that any derivatives strategy employed by the Portfolio will be successful.
27
The risks associated with the use of derivatives are different from, and possibly greater than, the risks associated with investing directly in the instruments underlying such derivatives. Derivatives are highly specialized instruments that require investment techniques and risk analyses different from other portfolio investments. The use of derivative instruments requires an understanding not only of the underlying instrument but also of the derivative itself. Certain risk factors generally applicable to derivative transactions are described below.
• Derivatives are subject to the risk that the market value of the derivative itself or the market value of underlying instruments will change in a way adverse to the Portfolio's interests. The Portfolio bears the risk that the Adviser and/or Sub-Adviser(s) may incorrectly forecast future market trends and other financial or economic factors or the value of the underlying security, index, interest rate or currency when establishing a derivatives position for the Portfolio.
• Derivatives may be subject to pricing risk, which exists when a derivative becomes extraordinarily expensive (or inexpensive) relative to historical prices or corresponding instruments. Under such market conditions, it may not be economically feasible to initiate a transaction or liquidate a position at an advantageous time or price.
• Many derivatives are complex and often valued subjectively. Improper valuations can result in increased payment requirements to counterparties or a loss of value to the Portfolio.
• Using derivatives as a hedge against the portfolio investment subjects the Portfolio to the risk that the derivative will have imperfect correlation with the portfolio investment, which could result in the Portfolio incurring substantial losses. This correlation risk may be greater in the case of derivatives based on an index or other basket of securities, as the portfolio securities being hedged may not duplicate the components of the underlying index or the basket may not be of exactly the same type of obligation as those underlying the derivative. The use of derivatives for "cross hedging" purposes (using a derivative based on one instrument as a hedge for a different instrument) may also involve greater correlation risks.
• While using derivatives for hedging purposes can reduce the Portfolio's risk of loss, it may also limit the Portfolio's opportunity for gains or result in losses by offsetting or limiting the Portfolio's ability to participate in favorable price movements in portfolio investments.
• Derivatives transactions for non-hedging purposes involve greater risks and may result in losses which would not be offset by increases in the value of portfolio securities or declines in the cost of securities to be acquired. In the event that the Portfolio enters into a derivatives transaction as an alternative to purchasing or selling the underlying instrument or in order to obtain desired exposure to an index or market, the Portfolio will be exposed to the same risks as are incurred in purchasing or selling the underlying instruments directly as well as additional risks associated with derivatives transactions.
• The use of certain derivatives transactions, including over-the-counter ("OTC") derivatives, involves the risk of loss resulting from the insolvency or bankruptcy of the counterparty to the contract or the failure by the counterparty to make required payments or otherwise comply with the terms of the contract. In the event of default by a counterparty, the Portfolio may have contractual remedies pursuant to the agreements related to the transaction.
• Liquidity risk exists when a particular derivative is difficult to purchase or sell. If a derivative transaction is particularly large or if the relevant market is illiquid, the Portfolio may be unable to initiate a transaction or liquidate a position at an advantageous time or price.
28
• While some derivatives are cleared through a regulated, central clearinghouse, many derivatives transactions are not entered into or traded on exchanges or in markets regulated by the U.S. Commodity Futures Trading Commission ("CFTC") or the SEC. Instead, such bi-lateral OTC derivatives are entered into directly by the Portfolio and a counterparty and may be traded only through financial institutions acting as market makers. OTC derivatives transactions can only be entered into with a willing counterparty that is approved by the Adviser and/or Sub-Adviser(s) in accordance with guidelines established by the Board. Where no such counterparty is available, the Portfolio will be unable to enter into a desired OTC transaction. There also may be greater risk that no liquid secondary market in the trading of OTC derivatives will exist, in which case the Portfolio may be required to hold such instruments until exercise, expiration or maturity. Many of the protections afforded to participants in the cleared derivatives markets are not available to participants in bi-lateral OTC derivatives transactions. Bi-lateral OTC derivatives transactions are not subject to the guarantee of a clearinghouse, and as a result the Portfolio would bear greater risk of default by the counterparties to such transactions.
• The Portfolio may be required to make physical delivery of portfolio securities underlying a derivative in order to close out a derivatives position or to sell portfolio securities at a time or price at which it may be disadvantageous to do so in order to obtain cash to close out or to maintain a derivatives position.
• As a result of the structure of certain derivatives, adverse changes in, among other things, interest rates, volatility or the value of the underlying instrument can result in losses substantially greater than the amount invested in the derivative itself. Certain derivatives have the potential for unlimited loss, regardless of the size of the initial investment.
• Certain derivatives may be considered illiquid and therefore subject to the Portfolio's limitation on investments in illiquid securities.
• Derivatives transactions conducted outside the United States may not be conducted in the same manner as those entered into on U.S. exchanges, and may be subject to different margin, exercise, settlement or expiration procedures. Brokerage commissions, clearing costs and other transaction costs may be higher on foreign exchanges. Many of the risks of OTC derivatives transactions are also applicable to derivatives transactions conducted outside the United States. Derivatives transactions conducted outside the United States are subject to the risk of governmental action affecting the trading in, or the prices of, foreign securities, currencies and other instruments. The value of such positions could be adversely affected by foreign political and economic factors; lesser availability of data on which to make trading decisions; delays on the Portfolio's ability to act upon economic events occurring in foreign markets; and less liquidity than U.S. markets.
• Currency derivatives are subject to additional risks. Currency derivatives transactions may be negatively affected by government exchange controls, blockages, and manipulations. Currency exchange rates may be influenced by factors extrinsic to a country's economy. There is no systematic reporting of last sale information with respect to foreign currencies. As a result, the available information on which trading in currency derivatives will be based may not be as complete as comparable data for other transactions. Events could occur in the foreign currency market which will not be reflected in currency derivatives until the following day, making it more difficult for the Portfolio to respond to such events in a timely manner.
Regulatory Matters. As described herein, the Portfolio may be required to cover its potential economic exposure to certain derivatives transactions by holding an offsetting financial position and/or segregating or earmarking cash or liquid assets equal in value to the Portfolio's potential economic exposure under the transaction. The Portfolio will cover such transactions as described herein or in such other manner in accordance
29
with applicable laws and regulations. Assets used to cover derivatives transactions cannot be sold while the derivatives position is open, unless they are replaced by other appropriate assets. Segregated or earmarked cash or liquid assets and assets held in margin accounts are not otherwise available to the Portfolio for investment purposes. If a large portion of the Portfolio's assets are used to cover derivatives transactions or are otherwise segregated or earmarked, it could affect portfolio management or the Portfolio's ability to meet redemption requests or other current obligations. With respect to derivatives which are cash settled (i.e., have no physical delivery requirement), the Portfolio is permitted to set aside liquid assets or earmark cash in an amount equal to the Portfolio's daily marked-to-market net obligations (i.e., the Portfolio's daily net liability) under the derivative, if any, rather than the derivative's full notional amount or the market value of the instrument underlying the derivative, as applicable. By earmarking cash or setting aside assets equal to only its net obligations under cash-settled derivatives, the Portfolio will have the ability to employ leverage to a greater extent than if the Portfolio were required to earmark cash or segregate assets equal to the full notional amount of the derivative or the market value of the underlying instrument, as applicable.
Regulatory developments affecting the exchange-traded and OTC derivatives markets may impair a Portfolio's ability to manage or hedge its investment portfolio through the use of derivatives. The Dodd-Frank Wall Street Reform and Consumer Protection Act (the "Dodd-Frank Act") and the rules promulgated thereunder may limit the ability of the Portfolio to enter into one or more exchange-traded or OTC derivatives transactions.
The Portfolio's use of derivatives may also be limited by the requirements of the Code for qualification as a regulated investment company for U.S. federal income tax purposes.
The Fund, on behalf of the Portfolio, has filed a notice of eligibility with the National Futures Association ("NFA") claiming an exclusion from the definition of the term "commodity pool operator" ("CPO") under the Commodity Exchange Act, as amended ("CEA"), and the rules of the CFTC promulgated thereunder, with respect to the Portfolio's operations. Therefore, neither the Portfolio nor the Adviser (with respect to the Portfolio) is subject to registration or regulation as a commodity pool or CPO under the CEA. If the Portfolio becomes subject to these requirements, as well as related NFA rules, the Portfolio may incur additional compliance and other expenses.
Forwards. A foreign currency forward exchange contract is a negotiated agreement between two parties to exchange specified amounts of two or more currencies at a specified future time at a specified rate. The rate specified by the foreign currency forward exchange contract can be higher or lower than the spot rate between the currencies that are the subject of the contract. Currency futures are similar to foreign currency forward exchange contracts, except that they are traded on an exchange and standardized as to contract size and delivery date. Most currency futures call for payment or delivery in U.S. dollars. Unanticipated changes in currency prices may result in losses to the Portfolio and poorer overall performance for the Portfolio than if it had not entered into foreign currency forward exchange contracts. The Portfolio may enter into foreign currency forward exchange contracts under various circumstances. The typical use of a foreign currency forward exchange contract is to "lock in" the price of a security in U.S. dollars or some other foreign currency, which the Portfolio is holding in its portfolio. By entering into a foreign currency forward exchange contract for the purchase or sale, for a fixed amount of dollars or other currency, of the amount of foreign currency involved in the underlying security transactions, the Portfolio may be able to protect itself against a possible loss resulting from an adverse change in the relationship between the U.S. dollar or other currency which is being used for the security purchase and the foreign currency in which the security is denominated during the period between the date on which the security is purchased or sold and the date on which payment is made or received. The Adviser also may from time to time utilize foreign currency forward exchange contracts for other purposes. For example, they may be used to hedge a foreign security held in the portfolio or a security which pays out principal tied to an exchange rate between the U.S. dollar and a foreign currency, against a decline in value of the applicable foreign currency. They also may be used to lock in the current exchange rate of the currency in which those securities anticipated
30
to be purchased are denominated. At times, the Portfolio may enter into "cross-currency" hedging transactions involving currencies other than those in which securities are held or proposed to be purchased are denominated.
The Portfolio will not enter into foreign currency forward exchange contracts or maintain a net exposure to these contracts where the consummation of the contracts would obligate the Portfolio to deliver an amount of foreign currency in excess of the value of the Portfolio's portfolio securities.
When required by law, the Portfolio will segregate or earmark cash, U.S. government securities or other appropriate liquid portfolio securities in an amount equal to the value of the Portfolio's total assets committed to the consummation of foreign currency forward exchange contracts entered into under the circumstances set forth above. If the value of the securities so earmarked declines, additional cash or securities will be segregated or earmarked on a daily basis so that the value of such securities will equal the amount of the Portfolio's commitments with respect to such contracts.
The Portfolio may be limited in its ability to enter into hedging transactions involving foreign currency forward exchange contracts by the Code requirements relating to qualification as a regulated investment company.
Foreign currency forward exchange contracts may limit gains on portfolio securities that could otherwise be realized had they not been utilized and could result in losses. The contracts also may increase the Portfolio's volatility and may involve a significant amount of risk relative to the investment of cash.
TAXES
The following is only a summary of certain additional federal income and excise tax considerations generally affecting the Portfolio and its shareholders that are not described in the Portfolio's prospectuses. No attempt is made to present a detailed explanation of the tax treatment of the Portfolio or its shareholders, and the discussion here and in the Portfolio's prospectuses is not intended as a substitute for careful tax planning. Shareholders are urged to consult their tax advisors with specific reference to their own tax situations, including their state and local tax liabilities.
The following general discussion of certain federal income and excise tax consequences is based on the Code, and the regulations issued thereunder as in effect on the date of this SAI. New legislation, as well as administrative changes or court decisions, may significantly change the conclusions expressed herein, and may have a retroactive effect with respect to the transactions contemplated herein.
Each Portfolio within the Fund is generally treated as a separate corporation for federal income tax purposes, and thus the provisions of the Code generally will be applied to each Portfolio separately, rather than to the Fund as a whole.
Federal Income Tax Treatment of Shareholders
Shares of the Portfolio will be purchased by life insurance companies for their separate accounts under variable annuity contracts and variable life insurance policies and by other entities under qualified pension and retirement plans. Under the provisions of the Code currently in effect, net income and net realized capital gains of the Portfolio are not currently taxable when distributed to and left to accumulate within a variable annuity contract or variable life insurance policy or under a qualified pension or retirement plan.
Section 817(h) of the Code provides that the investments of a separate account underlying a variable insurance contract (or the investments of a mutual fund, the shares of which are owned by the variable separate account) must be "adequately diversified" in order for the contract to be treated as an annuity or as life insurance
31
for federal income tax purposes. The Treasury Department has issued regulations explaining these diversification requirements. The Portfolio intends to continue to comply with such requirements.
For information on federal income taxation of a life insurance company with respect to its receipt of distributions from the Fund and federal income taxation of owners of the company's variable annuity contracts or variable life insurance policies, refer to the life insurance company's variable annuity contract or variable life insurance policy prospectus.
Qualification as a Regulated Investment Company
The Fund intends that the Portfolio elect and qualify to be treated for each taxable year as a regulated investment company ("RIC") under Subchapter M of the Code. Qualification as a regulated investment company requires, among other things, that (a) at least 90% of the Fund's gross income be derived from interest, dividends, payments with respect to securities loans, gains from the sale or other disposition of securities or options thereon or foreign currencies; and (b) the Fund diversify its holdings so that, at the end of each quarter of the taxable year, (i) at least 50% of the market value of the Fund's assets is represented by cash, U.S. Government securities, securities of other regulated investment companies and other securities limited, in respect of any one issuer to an amount not greater than 5% of the Fund's total assets and not more than 10% of the outstanding voting securities of such issuer, and (ii) not more than 25% of the value of the Fund's total assets is invested in the securities of any one issuer (other than Government securities or securities of other RICs) in two or more issuers that are controlled by the Fund and that are engaged in the same or similar trades or businesses or related trades or businesses. It is anticipated that any net gain realized from the closing out of futures contracts will be considered gain from the sale of securities and therefore be qualified income for purposes of the 90% gross income requirement described above. Net income derived from an interest in a "qualified publicly traded partnership," as defined in the Code, will be treated as qualified income for purposes of the 90% gross income requirement. For the purposes of the diversification requirements in clause (ii) above, the outstanding voting securities of any issuer includes the equity securities of a qualified publicly traded partnership. In addition, no more than 25% of the value of a regulated investment company's total assets may be invested in the securities of one or more qualified traded partnerships.
For purposes of the 90% of gross income requirement described above, the Code expressly provides the U.S. Treasury with authority to issue regulations that would exclude foreign currency gains from qualifying income if such gains are not directly related to the Portfolio's business of investing in stock or securities. While to date the U.S. Treasury has not exercised this regulatory authority, there can be no assurance that it will not issue regulations in the future (possibly with retroactive application) that would treat some or all of the Portfolio's foreign currency gains as non-qualifying income. For purposes of the diversification requirement described above, the Portfolio will not be treated as in violation of such requirement as a result of a discrepancy between the value of its various investments and the diversification percentages described above, unless such discrepancy exists immediately following the acquisition of any security or other property and is wholly or partly the result of such acquisition. Moreover, even in the event of noncompliance with the diversification requirement as of the end of any given quarter, the Portfolio is permitted to cure the violation by eliminating the discrepancy causing such noncompliance within a period of 30 days from the close of the relevant quarter.
In addition to the requirements described above, in order to qualify as a RIC, the Portfolio must distribute at least 90% of the Portfolio's net investment company taxable income (that generally includes dividends, taxable interest, currency gains, and the excess of net short-term capital gains over net long-term capital losses less operating expenses) and at least 90% of its net tax-exempt interest income, if any, to shareholders (the "Distribution Requirement"). If the Portfolio meets all of the RIC requirements, it will not be subject to federal income tax on any of its net investment income or net realized capital gains that it distributes to shareholders.
32
Although the Portfolio intends to distribute all or substantially all of its net investment income and may distribute its net realized capital gains for any taxable year, the Portfolio will be subject to federal income taxation to the extent any such income or gains are not distributed.
The Portfolio may make investments that cause the Portfolio to recognize income or gain prior to receiving cash with respect to such investments. For example, in the event that the Portfolio invests in securities (such as STRIPS) that bear "original issue discount" or "acquisition discount" (collectively, "OID Securities") they will be deemed to have received interest income even though no cash payments have been received. Accordingly, such investments may not produce sufficient current cash receipts to match the amount of net investment income the Portfolio must distribute to satisfy the Distribution Requirement. In some cases, the Portfolio may have to borrow money or dispose of other investments in order to make sufficient cash distributions to satisfy the Distribution Requirement.
If the Portfolio fails to qualify for any taxable year as a RIC, all of its taxable income will be subject to tax at regular corporate income tax rates without any deduction for distributions to shareholders.
Positions held by the Portfolio in certain regulated futures contracts and foreign currency contracts ("Section 1256 Contracts") will generally be marked-to-market (i.e., treated as though sold for fair market value) on the last business day of the Portfolio's taxable year and all gain or loss associated with such transactions (except certain currency gains covered by Section 988 of the Code) will generally be treated as 60% long-term capital gain or loss and 40% short-term capital gain or loss. The effect of the Section 1256 mark-to-market rules may be to accelerate income or to convert what otherwise would have been long-term capital gain into short-term capital gain or short-term capital losses into long-term capital losses within the Portfolio. The acceleration of income on Section 1256 Contracts may require the Portfolio to accrue taxable income without a corresponding receipt of cash. In order to generate enough cash to satisfy the Distribution Requirement, the Portfolio may be required to dispose of portfolio securities that it otherwise would have continued to hold or to use cash flows from other sources. Any or all of these rules may, therefore, affect the amount, character or timing of income earned and, in turn, affect the application of the Distribution Requirement to the Portfolio.
Federal Excise Tax
The Portfolio will not be subject to the 4% excise tax normally imposed on RICs that do not distribute substantially all of their income and gains each calendar year, because that tax does not apply to a RIC whose only shareholders are segregated asset accounts of life insurance companies held in connection with variable annuity accounts and/or variable life insurance policies and certain trusts under qualified pension and retirement plans.
Certain Tax Information Reporting Considerations
Because of the nature of the rules governing how REITs report their income and the timing of REIT's issuing year-end tax information, the Portfolio may need to estimate the character of distributions paid to its shareholders from REIT distributions. In addition, after the calendar year-end, REITs may recharacterize the nature of the distributions paid during that year, with the result that distributions previously identified as ordinary income are recharacterized as return of capital and/or capital gain. As a result, the composition of the Portfolio's distributions as reported initially may differ from the final composition determined after calendar year-end and reported to the Portfolio's shareholders on their year-end tax information statements.
Foreign Income Taxes
The Portfolio may be subject to foreign withholding taxes with respect to its dividend and interest income from foreign countries, thus reducing the net amount available for distribution to the Portfolio's shareholders.
33
The United States has entered into tax treaties with many foreign countries that may entitle the Portfolio to a reduced rate of, or exemption from, taxes on such income. It is impossible to determine the effective rate of foreign tax in advance because the amount of the Portfolio's assets to be invested within various countries is not known.
State and Local Tax Considerations
Rules of U.S. state and local taxation of dividend and capital gains distributions from regulated investment companies often differ from the rules for U.S. federal income taxation described above. Shareholders are urged to consult their tax advisers as to the consequences of these and other U.S. state and local tax rules regarding an investment in the Portfolio.
PURCHASE OF SHARES
The purchase price of the Portfolio is the NAV next determined after the order is received by the Fund or its designee. NAV for Class I and Class II shares will differ due to class specific expenses paid by each class, if any, and the 12b-1 fee charged to Class II shares. For the Portfolio, an order received prior to the close of the New York Stock Exchange (the "NYSE") (normally 4:00 p.m. Eastern Time) will be executed at the price computed on the date of receipt; and an order received after the close of the NYSE will be executed at the price computed on the next day the NYSE is open as long as the Fund's transfer agent receives payment by check or in Federal Funds. Shares of the Portfolio may be purchased on any day the NYSE is open.
Shares may, in the Fund's discretion, be purchased with investment securities (in lieu of or in conjunction with cash) acceptable to the Fund. The securities would be acceptable by the Fund at their market value in return for Portfolio Shares of equal value.
The Fund may accept orders from participating insurance companies after the close of the NYSE. In these cases, all orders received by a participating insurance company on a business day are aggregated and the insurance company places a net purchase or redemption order for shares of the Portfolio later that day or the morning of the next business day. These orders are normally executed at the NAV that was computed at the close of the day on which the insurance company received the order.
The Portfolio reserves the right in its sole discretion to suspend the offering of its shares and to reject purchase orders when in the judgment of management such rejection is in the best interest of the Portfolio.
REDEMPTION OF SHARES
The Fund normally makes payment for all shares redeemed within one business day of receipt of the request, and in no event more than seven days after receipt of a redemption request in good order. The Portfolio may suspend redemption privileges or postpone the date of payment (i) during any period that the NYSE is closed, or trading on the NYSE is restricted as determined by the SEC, (ii) during any period when an emergency exists as defined by the rules of the SEC as a result of which it is not reasonably practicable for the Portfolio to dispose of securities owned by it, or fairly to determine the value of its assets and (iii) for such other periods as the SEC may permit.
If the Adviser determines that it is in the best interest of the Fund or the Portfolio not to pay redemption proceeds in cash, and subject to applicable agreements with life insurance companies and other qualified investors, the Fund may distribute to you securities held by the Portfolio from which you are redeeming. If requested, the Portfolio will pay a portion of your redemption(s) in cash (during any 90 day period) up to the lesser of $250,000 or 1% of the net assets of the Portfolio at the beginning of such period. Such in-kind securities
34
may be illiquid and difficult or impossible for a shareholder to sell at a time and at a price that a shareholder would like. In addition, you may incur brokerage costs and a further gain or loss for income tax purposes when you ultimately sell the securities.
INVESTMENT LIMITATIONS
Fundamental Limitations
The Portfolio has adopted the following restrictions, which are fundamental policies and may not be changed without the approval of the lesser of: (1) at least 67% of the voting securities of the Portfolio present at a meeting if the holders of more than 50% of the outstanding voting securities of the Portfolio are present or represented by proxy, or (2) more than 50% of the outstanding voting securities of the Portfolio. The Portfolio may not:
(1) purchase or sell physical commodities unless acquired as a result of ownership of securities or other instruments; provided that this restriction shall not prohibit the Portfolio from purchasing or selling options, futures contracts and related options thereon, forward contracts, swaps, caps, floors, collars and any other financial instruments or from investing in securities or other instruments backed by physical commodities or as otherwise permitted by (i) the 1940 Act, (ii) the rules and regulations promulgated by the SEC under the 1940 Act, or (iii) an exemption or other relief applicable to the Portfolio from the provisions of the 1940 Act;
(2) purchase or sell real estate, although it may purchase and sell securities of companies that deal in real estate and may purchase and sell securities that are secured by interests in real estate;
(3) make loans of money or property to any person, except (a) to the extent that securities or interests in which the Portfolio may invest are considered to be loans, (b) through the loan of portfolio securities, (c) by engaging in repurchase agreements, or (d) as may otherwise be permitted by (i) the 1940 Act, (ii) the rules and regulations promulgated by the SEC under the 1940 Act, or (iii) an exemption or other relief applicable to the Fund from the provision of the 1940 Act;
(4) borrow money, except the Portfolio may borrow money to the extent permitted by (i) the 1940 Act, (ii) the rules and regulations promulgated by the SEC under the 1940 Act, or (iii) an exemption or other relief applicable to the Fund from the provisions of the 1940 Act;
(5) issue senior securities, except the Portfolio may issue senior securities to the extent permitted by (i) the 1940 Act, (ii) the rules and regulations promulgated by the SEC under the 1940 Act, or (iii) an exemption or other relief applicable to the Portfolio from the provisions of the 1940 Act;
(6) underwrite securities issued by others, except to the extent that the Portfolio may be considered an underwriter within the meaning of the 1933 Act in the disposition of restricted securities; and
(7) acquire any securities of companies within one industry if, as a result of such acquisition, 25% or more of the value of the Portfolio's total assets would be invested in securities of companies within such industry; provided, that there shall be no limitation on the purchase of obligations issued or guaranteed by the U.S. Government, its agencies or instrumentalities or instruments issued by U.S. banks; and provided further, that the Portfolio will invest 25% or more of its total assets in the infrastructure industry.
35
Non-Fundamental Limitations
In addition, the Portfolio has adopted the following non-fundamental investment limitations, which may be changed by the Board without shareholder approval. The Portfolio will not:
(1) sell short (other than "against the box") unless the Portfolio's obligation is covered by unencumbered liquid assets in a segregated account and by collateral held by the lending broker; provided that transactions in futures contracts and options are not deemed to constitute selling securities short;
(2) invest its assets in securities of any investment company except as may be permitted by the 1940 Act;
(3) invest more than an aggregate of 15% of the net assets of the Portfolio, determined at the time of investment, in illiquid securities;
(4) make loans except (i) by purchasing bonds, debentures or similar obligations (including repurchase agreements, subject to the limitations as described in the prospectus) that are publicly distributed and (ii) by lending its portfolio securities to banks, brokers, dealers and other financial institutions, so long as such loans are not inconsistent with the 1940 Act or the Rules and Regulations or interpretations of the SEC thereunder;
(5) purchase on margin, except for use of short-term credit as may be necessary for the clearance of purchases and sales of securities, but it may make margin deposits in connection with transactions in options, futures and options on futures; and
(6) borrow money, other than temporarily or for extraordinary or emergency purposes or purchase additional securities when borrowings exceed 5% of total (gross) assets.
The Portfolio will diversify its holdings so that, at the close of each quarter of its taxable year or within 30 days thereafter, (i) at least 50% of the market value of the Portfolio's total assets is represented by cash (including cash items and receivables), U.S. Government securities and other securities, with such other securities limited, in respect of any one issuer, for purposes of this calculation to an amount not greater than 5% of the value of the Portfolio's total assets and 10% of the outstanding voting securities of such issuer and (ii) not more than 25% of the value of its total assets is invested in the securities of any one issuer (other than U.S. Government securities). Prior to the close of each quarter (or within 30 days thereafter), the Portfolio's holdings may be less diversified and are not required to satisfy any diversification test.
The percentage limitations contained in these fundamental and non-fundamental limitations apply at the time of purchase of securities. A later change in percentage resulting from changes in the value of the Portfolio's assets or in total or net assets of the Portfolio will not be considered a violation of the restriction and the sale of securities will not be required. The foregoing does not apply to borrowings. Future portfolios of the Fund may adopt different limitations.
The investments of life insurance company separate accounts made under variable annuity contracts and variable life insurance policies are subject to state insurance laws and regulations. The Fund and the Portfolio will, when required, comply with investment restrictions imposed under such laws and regulations on life insurance company separate accounts investing in the Portfolio.
In addition, Section 817(h) of the Code requires that the assets of the Portfolio be adequately diversified so that insurance companies, and not variable contract owners, are considered the owners for federal income tax purposes of the assets held in the separate accounts. To meet the diversification requirements of regulations issued under Section 817(h), the Portfolio will meet the following test: no more than 55% of the assets will be invested in any one investment; no more than 70% of the assets will be invested in any two investments; no more than 80% of the assets will be invested in any three investments; and no more than 90% will be invested
36
in any four investments. The Portfolio must meet the above diversification requirements within 30 days of the end of each calendar quarter.
The investment policies, limitations or practices of the Portfolio may not apply during periods of unusual or adverse market, economic, political or other conditions. Such market, economic, political or other conditions may include periods of abnormal or heightened market volatility, strained credit and/or liquidity conditions or increased governmental intervention in the markets or industries. During such periods, the Portfolio may not invest according to its principal investment strategies or in the manner in which its name may suggest, and may be subject to different and/or heightened risks. It is possible that such unusual or adverse conditions may continue for extended periods of time. See "Investment Policies and Strategies — Fixed Income Securities — Temporary Investments."
MANAGEMENT OF THE FUND
General. The Directors supervise the Fund's affairs under the laws governing corporations in the State of Maryland. The Directors have approved contracts under which certain companies provide essential management, administrative and shareholder services to the Fund.
Officers and Directors. The Board of the Fund consists of 10 Directors. These same individuals also serve as directors or trustees for certain of the funds advised by the Adviser and Morgan Stanley AIP GP LP. Nine Directors have no affiliation or business connection with the Adviser or any of its affiliated persons and do not own any stock or other securities issued by the Adviser's parent company, Morgan Stanley. These Directors are the "non-interested" or "Independent" Directors. The other Director (the "Interested Director") is affiliated with the Adviser.
Board Structure and Oversight Function. The Board's leadership structure features an Independent Director serving as Chairperson and the Board Committees described below. The Chairperson participates in the preparation of the agenda for meetings of the Board and the preparation of information to be presented to the Board with respect to matters to be acted upon by the Board. The Chairperson also presides at all meetings of the Board and is involved in discussions regarding matters pertaining to the oversight of the management of the Fund between meetings.
The Board of Directors operates using a system of committees to facilitate the timely and efficient consideration of all matters of importance to the Directors, the Fund and Fund shareholders, and to facilitate compliance with legal and regulatory requirements and oversight of the Fund's activities and associated risks. The Board of Directors has established five standing committees: (1) Audit Committee, (2) Governance Committee, (3) Compliance and Insurance Committee, (4) Investment Committee and (5) Closed-End Fund Committee. The Audit Committee, the Governance Committee and the Closed-End Fund Committee are comprised exclusively of Independent Directors. Each committee charter governs the scope of the committee's responsibilities with respect to the oversight of the Fund. The responsibilities of each committee, including their oversight responsibilities, are described further under the caption "Independent Directors and the Committees."
The Fund is subject to a number of risks, including investment, compliance, operational and valuation risk, among others. The Board of Directors oversees these risks as part of its broader oversight of the Fund's affairs through various Board and committee activities. The Board has adopted, and periodically reviews, policies and procedures designed to address various risks to the Fund. In addition, appropriate personnel, including but not limited to the Fund's Chief Compliance Officer, members of the Fund's administration and accounting teams, representatives from the Fund's independent registered public accounting firm, the Fund's Treasurer, portfolio management personnel and independent valuation and brokerage evaluation service provider, make regular reports regarding the Fund's activities and related risks to the Board of Directors and the committees, as
37
appropriate. These reports include, among others, quarterly performance reports, quarterly derivatives activity and risk reports and discussions with members of the risk teams relating to each asset class. The Board's committee structure allows separate committees to focus on different aspects of risk and the potential impact of these risks on some or all of the funds in the complex and then report back to the full Board. In between regular meetings, Fund officers also communicate with the Directors regarding material exceptions and items relevant to the Board's risk oversight function. The Board recognizes that it is not possible to identify all of the risks that may affect the Fund, and that it is not possible to develop processes and controls to eliminate all of the risks that may affect the Fund. Moreover, the Board recognizes that it may be necessary for the Portfolio to bear certain risks (such as investment risk) to achieve its investment objective.
As needed between meetings of the Board, the Board or a specific committee receives and reviews reports relating to the Fund and engages in discussions with appropriate parties relating to the Fund's operations and related risks.
Independent Directors. The Fund seeks as Directors individuals of distinction and experience in business and finance, government service or academia. In determining that a particular Director was and continues to be qualified to serve as Director, the Board has considered a variety of criteria, none of which, in isolation, was controlling. Based on a review of the experience, qualifications, attributes or skills of each Director, including those enumerated in the table below, the Board has determined that each of the Directors is qualified to serve as a Director of the Fund. In addition, the Board believes that, collectively, the Directors have balanced and diverse experience, qualifications, attributes and skills that allow the Board to operate effectively in governing the Fund and protecting the interests of shareholders. Information about the Fund's Governance Committee and Board of Directors nomination process is provided below under the caption "Independent Directors and the Committees."
The Directors of the Fund, their ages, addresses, positions held, lengths of time served, their principal business occupations during the past five years, the number of portfolios in the Fund Complex (defined herein) overseen by each Director (as of December 31, 2012) and other directorships, if any, held by the Directors, are shown below. The Fund Complex includes all open-end and closed-end funds (including all of their portfolios) advised by the Adviser and any registered funds that have an adviser that is an affiliate of the Adviser (including, but not limited to, Morgan Stanley AIP GP LP ("Morgan Stanley AIP Funds")) (collectively, the "Morgan Stanley Funds").
38
Independent Directors:
Name, Age and Address of
Independent Director | | Position(s)
Held with
Registrant | | Length of
Time
Served(1) | | Principal Occupation(s)
During Past 5 Years | | Number of
Portfolios in
Fund Complex
Overseen by
Independent
Director | | Other Directorships
Held by
Independent Director(2) | |
Frank L. Bowman (69) c/o Kramer Levin Naftalis & Frankel LLP Counsel to the Independent Directors
1177 Avenue of the Americas
New York, NY 10036 | | Director | | Since August 2006 | | President, Strategic Decisions, LLC (consulting) (since February 2009); Director or Trustee of various Morgan Stanley Funds (since August 2006); Chairperson of the Insurance Sub-Committee of the Compliance and Insurance Committee (since February 2007); served as President and Chief Executive Officer of the Nuclear Energy Institute (policy organization) (February 2005-November 2008); retired as Admiral, U.S. Navy after serving over 38 years on active duty including 8 years as Director of the Naval Nuclear Propulsion Program in the Department of the Navy and the U.S. Department of Energy (1996-2004); served as Chief of Naval Personnel (July 1994-September 1996) and on the Joint Staff as Director of Political Military Affairs (June 1992-July 1994); knighted as Honorary Knight Commander of the Most Excellent Order of the British Empire; awarded the Officier de l'Orde National du Mérite by the French Government; elected to the National Academy of Engineering (2009). | | | 101 | | | Director of BP p.l.c.; Director of Naval and Nuclear Technologies LLP; Director of the Armed Services YMCA of the USA and the U.S. Naval Submarine League; Director of the American Shipbuilding Suppliers Association; Member of the National Security Advisory Council of the Center for U.S. Global Engagement and a member of the CNA Military Advisory Board. | |
(1) Each Director serves an indefinite term, until his or her successor is elected.
(2) This includes any directorships at public companies and registered investment companies held by the Directors at any time during the past five years.
39
Name, Age and Address of
Independent Director | | Position(s)
Held with
Registrant | | Length of
Time
Served(1) | | Principal Occupation(s)
During Past 5 Years | | Number of
Portfolios in
Fund Complex
Overseen by
Independent
Director | | Other Directorships
Held by
Independent Director(2) | |
Michael Bozic (72) c/o Kramer Levin Naftalis & Frankel LLP Counsel to the Independent Directors
1177 Avenue of the Americas New York, NY 10036 | | Director | | Since April 1994 | | Private investor and a member of the advisory board of American Road Group LLC (retail) (since June 2000); Chairperson of the Compliance and Insurance Committee (since October 2006); Director or Trustee of various Morgan Stanley Funds (since April 1994); formerly, Chairperson of the Insurance Committee (July 2006-September 2006); Vice Chairman of Kmart Corporation (December 1998-October 2000); Chairman and Chief Executive Officer of Levitz Furniture Corporation (November 1995-November 1998) and President and Chief Executive Officer of Hills Department Stores (May 1991-July 1995); variously Chairman, Chief Executive Officer, President and Chief Operating Officer (1987-1991) of the Sears Merchandise Group of Sears, Roebuck & Co. | | | 103 | | | Trustee and member of the Hillsdale College Board of Trustees. | |
Kathleen A. Dennis (60) c/o Kramer Levin Naftalis & Frankel LLP Counsel to the Independent Directors
1177 Avenue of the Americas New York, NY 10036 | | Director | | Since August 2006 | | President, Cedarwood Associates (mutual fund and investment management consulting) (since July 2006); Chairperson of the Money Market and Alternatives Sub-Committee of the Investment Committee (since October 2006) and Director or Trustee of various Morgan Stanley Funds (since August 2006); formerly, Senior Managing Director of Victory Capital Management (1993-2006). | | | 101 | | | Director of various non-profit organizations. | |
(1) Each Director serves an indefinite term, until his or her successor is elected.
(2) This includes any directorships at public companies and registered investment companies held by the Directors at any time during the past five years.
40
Name, Age and Address of
Independent Director | | Position(s)
Held with
Registrant | | Length of
Time
Served(1) | | Principal Occupation(s)
During Past 5 Years | | Number of
Portfolios in
Fund Complex
Overseen by
Independent
Director | | Other Directorships
Held by
Independent Director(2) | |
Dr. Manuel H. Johnson (64)
c/o Johnson Smick
Group, Inc.
888 16th Street, N.W.
Suite 740
Washington, D.C. 20006 | | Director | | Since July 1991 | | Senior Partner, Johnson Smick International, Inc. (consulting firm); Chairperson of the Investment Committee (since October 2006) and Director or Trustee of various Morgan Stanley Funds (since July 1991); Co-Chairman and a founder of the Group of Seven Council (G7C) (international economic commission); formerly, Chairperson of the Audit Committee (July 1991-September 2006); Vice Chairman of the Board of Governors of the Federal Reserve System and Assistant Secretary of the U.S. Treasury. | | | 103 | | | Director of NVR, Inc. (home construction). | |
Joseph J. Kearns (71)
c/o Kearns & Associates LLC
PMB754
22631 Pacific Coast Highway
Malibu, CA 90265 | | Director | | Since August 1994 | | President, Kearns & Associates LLC (investment consulting); Chairperson of the Audit Committee (since October 2006) and Director or Trustee of various Morgan Stanley Funds (since August 1994); formerly, Deputy Chairperson of the Audit Committee (July 2003-September 2006) and Chairperson of the Audit Committee of various Morgan Stanley Funds (since August 1994); CFO of the J. Paul Getty Trust. | | | 104 | | | Director of Electro Rent Corporation (equipment leasing) and The Ford Family Foundation. | |
(1) Each Director serves an indefinite term, until his or her successor is elected.
(2) This includes any directorships at public companies and registered investment companies held by the Directors at any time during the past five years.
41
Name, Age and Address of
Independent Director | | Position(s)
Held with
Registrant | | Length of
Time
Served(1) | | Principal Occupation(s)
During Past 5 Years | | Number of
Portfolios in
Fund Complex
Overseen by
Independent
Director | | Other Directorships
Held by
Independent Director(2) | |
Michael F. Klein (55)
c/o Kramer Levin Naftalis & Frankel LLP
Counsel to the Independent Directors
1177 Avenue of the Americas
New York, NY 10036 | | Director | | Since August 2006 | | Managing Director, Aetos Capital, LLC (since March 2000) and Co-President, Aetos Alternatives Management, LLC (since January 2004); Chairperson of the Fixed-Income Sub-Committee of the Investment Committee (since October 2006) and Director or Trustee of various Morgan Stanley Funds (since August 2006); formerly, Managing Director, Morgan Stanley & Co. Inc. and Morgan Stanley Dean Witter Investment Management, President, various Morgan Stanley Funds (June 1998-March 2000) and Principal, Morgan Stanley & Co. Inc. and Morgan Stanley Dean Witter Investment Management (August 1997-December 1999). | | 101 | | Director of certain investment funds managed or sponsored by Aetos Capital, LLC.; Director of Sanitized AG and Sanitized Marketing AG (specialty chemicals). | |
Michael E. Nugent (77)
522 Fifth Avenue
New York, NY 10036 | | Chairperson of the Board and Director | | Chairperson of the Boards since July 2006 and Director since July 2001 | | General Partner, Triumph Capital, L.P. (private investment partnership); Chairperson of the Boards of various Morgan Stanley Funds (since July 2006); Chairperson of the Closed-End Fund Committee (since June 2012) and Director or Trustee of various Morgan Stanley Funds (since July 1991); formerly, Chairperson of the Insurance Committee (until July 2006). | | 103 | | None. | |
(1) Each Director serves an indefinite term, until his or her successor is elected.
(2) This includes any directorships at public companies and registered investment companies held by the Directors at any time during the past five years.
42
Name, Age and Address of
Independent Director | | Position(s)
Held with
Registrant | | Length of
Time
Served(1) | | Principal Occupation(s)
During Past 5 Years | | Number of
Portfolios in
Fund Complex
Overseen by
Independent
Director | | Other Directorships
Held by
Independent Director(2) | |
W. Allen Reed (66)
c/o Kramer Levin Naftalis & Frankel LLP
Counsel to the Independent Directors
1177 Avenue of the Americas
New York, NY 10036 | | Director | | Since August 2006 | | Chairperson of the Equity Sub-Committee of the Investment Committee (since October 2006) and Director or Trustee of various Morgan Stanley Funds (since August 2006); formerly, President and CEO of General Motors Asset Management; Chairman and Chief Executive Officer of the GM Trust Bank and Corporate Vice President of General Motors Corporation (August 1994-December 2005). | | | 101 | | | Director of Temple-Inland Industries (packaging and forest products), Director of Legg Mason, Inc. and Director of the Auburn University Foundation. | |
Fergus Reid (81)
c/o Joe Pietryka, Inc.
85 Charles Colman Blvd.
Pawling, NY 12564 | | Director | | Since June 1992 | | Chairman, Joe Pietryka, Inc.; Chairperson of the Governance Committee and Director or Trustee of various Morgan Stanley Funds (since June 1992). | | | 104 | | | Through December 31, 2012, Trustee and Director of certain investment companies in the JP Morgan Funds complex. | |
Interested Director:
Name, Age and Address of
Interested Director | | Position(s)
Held with
Registrant | | Length of
Time
Served(1) | | Principal Occupation(s)
During Past 5 Years | | Number of
Portfolios in
Fund Complex
Overseen by
Interested
Director | | Other Directorships
Held by
Interested Director(2) | |
James F. Higgins (65)
One New York Plaza
New York, NY 10004 | | Director | | Since June 2000 | | Director or Trustee of various Morgan Stanley Funds (since June 2000); Senior Advisor of Morgan Stanley (since August 2000). | | | 102 | | | Director of AXA Financial, Inc. and The Equitable Life Assurance Society of the United States (financial services). | |
(1) Each Director serves an indefinite term, until his or her successor is elected.
(2) This includes any directorships at public companies and registered investment companies held by the Directors at any time during the past five years.
43
The executive officers of the Fund, their ages, addresses, positions held, lengths of time served and their principal business occupations during the past five years are shown below.
Executive Officers:
Name, Age and Address of
Executive Officer | | Position(s)
Held with
Registrant | | Length of
Time
Served(1) | | Principal Occupation(s) During Past 5 Years | |
John H. Gernon (50)
522 Fifth Avenue
New York, NY 10036 | | President and Principal Executive Officer—Equity, Fixed Income and AIP Funds | | Since September 2013 | | President and Principal Executive Officer of the Equity and Fixed Income Funds and the Morgan Stanley AIP Funds (since September 2013) in the Fund Complex. Managing Director of the Adviser. | |
Mary Ann Picciotto (40)
522 Fifth Avenue
New York, NY 10036 | | Chief Compliance Officer | | Since May 2010 | | Managing Director of the Adviser and various entities affiliated with the Adviser; Chief Compliance Officer of various Morgan Stanley Funds (since May 2010); Chief Compliance Officer of the Adviser (since April 2007). | |
Stefanie V. Chang Yu (47) 522 Fifth Avenue
New York, NY 10036 | | Vice President | | Since December 1997 | | Managing Director of the Adviser and various entities affiliated with the Adviser; Vice President of various Morgan Stanley Funds (since December 1997). | |
Francis J. Smith (48)
522 Fifth Avenue
New York, NY 10036 | | Treasurer and Principal Financial Officer | | Treasurer since July 2003 and Principal Financial Officer since September 2002 | | Executive Director of the Adviser and various entities affiliated with the Adviser; Treasurer and Principal Financial Officer of various Morgan Stanley Funds (since July 2003). | |
Mary E. Mullin (46)
522 Fifth Avenue
New York, NY 10036 | | Secretary | | Since June 1999 | | Executive Director of the Adviser and various entities affiliated with the Adviser; Secretary of various Morgan Stanley Funds (since June 1999). | |
(1) Each officer serves an indefinite term, until his or her successor is elected.
In addition, the following individuals who are officers of the Adviser or its affiliates serve as assistant secretaries of the Fund: Joanne Antico, Joseph C. Benedetti, Daniel E. Burton and Edward J. Meehan.
44
For each Director, the dollar range of equity securities beneficially owned by the Director in the Fund and in the Family of Investment Companies (Family of Investment Companies includes all of the registered investment companies advised by the Adviser and Morgan Stanley AIP GP LP) for the calendar year ended December 31, 2012, is set forth in the table below.
Name of Director | | Dollar Range of
Equity Securities
in the Fund
(As of December 31, 2012) | | Aggregate Dollar Range of
Equity Securities
in All Registered
Investment Companies
Overseen by Director in
Family of Investment
Companies (As of
December 31, 2012) | |
Independent: | |
Frank L. Bowman(1) | | | None | | | over $100,000 | |
Michael Bozic | | | None | | | over $100,000 | |
Kathleen A. Dennis | | | None | | | over $100,000 | |
Manuel H. Johnson | | | None | | | over $100,000 | |
Joseph J. Kearns(1) | | | None | | | over $100,000 | |
Michael F. Klein | | | None | | | over $100,000 | |
Michael E. Nugent | | | None | | | over $100,000 | |
W. Allen Reed(1) | | | None | | | over $100,000 | |
Fergus Reid(1) | | | None | | | over $100,000 | |
Interested: | |
James F. Higgins | | | None | | | over $100,000 | |
(1) Includes the total amount of compensation deferred by the Director at his election pursuant to a deferred compensation plan. Such deferred compensation is placed in a deferral account and deemed to be invested in one or more of the Morgan Stanley Funds (or portfolio thereof) that are offered as investment options under the plan.
As to each Independent Director and his or her immediate family members, no person owned beneficially or of record securities in an investment adviser or principal underwriter of the Fund, or a person (other than a registered investment company) directly or indirectly controlling, controlled by or under common control with an investment adviser or principal underwriter of the Fund.
As of the date of this SAI, the Directors and officers of the Fund, as a group, owned less than 1% of the outstanding common stock of the Portfolio.
Independent Directors and the Committees
Law and regulation establish both general guidelines and specific duties for the Independent Directors. The Board has five committees: (1) Audit Committee, (2) Governance Committee, (3) Compliance and Insurance Committee, (4) Investment Committee and (5) Closed-End Fund Committee.
The Independent Directors are charged with recommending to the full Board approval of management, advisory and administration contracts, Rule 12b-1 plans and distribution and underwriting agreements; continually reviewing fund performance; checking on the pricing of portfolio securities, brokerage commissions, transfer agent costs and performance and trading among funds in the same complex; and approving fidelity bond and related insurance coverage and allocations, as well as other matters that arise from time to time. The Independent Directors are required to select and nominate individuals to fill any Independent Director vacancy on the board of any fund that has a Rule 12b-1 plan of distribution.
The Board of Directors has a separately-designated standing Audit Committee established in accordance with Section 3(a)(58)(A) of the Securities Exchange Act of 1934, as amended. The Audit Committee is charged with recommending to the full Board the engagement or discharge of the Fund's independent registered public accounting firm; directing investigations into matters within the scope of the independent registered public accounting firm's duties, including the power to retain outside specialists; reviewing with the independent
45
registered public accounting firm the audit plan and results of the auditing engagement; approving professional services provided by the independent registered public accounting firm and other accounting firms prior to the performance of the services; reviewing the independence of the independent registered public accounting firm; considering the range of audit and non-audit fees; reviewing the adequacy of the Fund's system of internal controls; and reviewing the valuation process. The Fund has adopted a formal, written Audit Committee Charter.
The members of the Audit Committee of the Fund are Joseph J. Kearns, Michael F. Klein, Michael E. Nugent and W. Allen Reed. None of the members of the Fund's Audit Committee is an "interested person," as defined under the 1940 Act, of the Fund (with such disinterested Directors being "Independent Directors" or individually, "Independent Director"). Each Independent Director is also "independent" from the Fund under the listing standards of the NYSE. The Chairperson of the Audit Committee of the Fund is Joseph J. Kearns.
The Board of Directors of the Fund also has a Governance Committee. The Governance Committee identifies individuals qualified to serve as Independent Directors on the Fund's Board and on committees of such Board and recommends such qualified individuals for nomination by the Fund's Independent Directors as candidates for election as Independent Directors, advises the Fund's Board with respect to Board composition, procedures and committees, develops and recommends to the Fund's Board a set of corporate governance principles applicable to the Fund, monitors and makes recommendations on corporate governance matters and policies and procedures of the Fund's Board of Directors and any Board committees and oversees periodic evaluations of the Fund's Board and its committees. The members of the Governance Committee of the Fund are Kathleen A. Dennis and Fergus Reid, each of whom is an Independent Director. The Chairperson of the Governance Committee is Fergus Reid.
The Fund does not have a separate nominating committee. While the Fund's Governance Committee recommends qualified candidates for nominations as Independent Directors, the Board of Directors of the Fund believes that the task of nominating prospective Independent Directors is important enough to require the participation of all current Independent Directors, rather than a separate committee consisting of only certain Independent Directors. Accordingly, each Independent Director (Frank L. Bowman, Michael Bozic, Kathleen A. Dennis, Manuel H. Johnson, Joseph J. Kearns, Michael F. Klein, Michael E. Nugent, W. Allen Reed and Fergus Reid) participates in the election and nomination of candidates for election as Independent Directors for the Fund. Persons recommended by the Fund's Governance Committee as candidates for nomination as Independent Directors shall possess such experience, qualifications, attributes, skills and diversity so as to enhance the Board's ability to manage and direct the affairs and business of the Fund, including, when applicable, to enhance the ability of committees of the Board to fulfill their duties and/or to satisfy any independence requirements imposed by law, regulation or any listing requirements of the NYSE. While the Independent Directors of the Fund expect to be able to continue to identify from their own resources an ample number of qualified candidates for the Fund's Board as they deem appropriate, they will consider nominations from shareholders to the Board. Nominations from shareholders should be in writing and sent to the Independent Directors as described below under the caption "Shareholder Communications."
The Board formed the Compliance and Insurance Committee to address insurance coverage and oversee the compliance function for the Fund and the Board. The Compliance and Insurance Committee consists of Frank L. Bowman, Michael Bozic, James F. Higgins and Manuel H. Johnson. Frank L. Bowman, Michael Bozic and Manuel H. Johnson are Independent Directors. The Chairperson of the Compliance and Insurance Committee is Michael Bozic. The Compliance and Insurance Committee has an Insurance Sub-Committee to review and monitor the insurance coverage maintained by the Fund. The Chairperson of the Insurance Sub-Committee is Frank L. Bowman.
The Investment Committee oversees the portfolio investment process for and reviews the performance of the Fund. The Investment Committee also recommends to the Board to approve or renew the Fund's Investment Advisory, Sub-Advisory and Administration Agreements. The members of the Investment Committee are Frank
46
L. Bowman, Michael Bozic, Kathleen A. Dennis, James F. Higgins, Manuel H. Johnson, Joseph J. Kearns, Michael F. Klein, Michael E. Nugent, W. Allen Reed and Fergus Reid. The Chairperson of the Investment Committee is Manuel H. Johnson.
The Investment Committee has three Sub-Committees, each with its own Chairperson. Each Sub-Committee focuses on the portfolios' primary areas of investment, namely equities, fixed income and alternatives. The Sub-Committees and their members are as follows:
(1) Equity — W. Allen Reed (Chairperson), Frank L. Bowman and Michael E. Nugent.
(2) Fixed Income — Michael F. Klein (Chairperson), Michael Bozic and Fergus Reid.
(3) Money Market and Alternatives — Kathleen A. Dennis (Chairperson), James F. Higgins and Joseph J. Kearns.
The Board formed the Closed-End Fund Committee to consider a range of issues unique to closed-end funds. The Closed-End Fund Committee consists of Michael E. Nugent, W. Allen Reed and Fergus Reid, each of whom is an Independent Director. The Chairperson of the Closed-End Fund Committee is Michael E. Nugent.
During the fiscal year ended December 31, 2012, the Board of Directors held the following meetings:
Board of Directors | | | 8 | | |
Committee/Sub-Committee: | | Number of meetings: | |
Audit Committee | | | 4 | | |
Governance Committee | | | 4 | | |
Compliance and Insurance Committee | | | 4 | | |
Insurance Sub-Committee | | | 1 | | |
Investment Committee | | | 5 | | |
Equity Sub-Committee | | | 6 | | |
Fixed Income Sub-Committee | | | 6 | | |
Money Market and Alternatives Sub-Committee | | | 5 | | |
Closed-End Fund Committee | | | 2 | | |
Experience, Qualifications and Attributes
The Board has concluded, based on each Director's experience, qualifications and attributes that each Board member should serve as a Director. Following is a brief summary of the information that led to and/or supports this conclusion.
Mr. Bowman has experience in a variety of business and financial matters through his prior service as a Director or Trustee for various other funds in the Fund Complex, where he serves as Chairperson of the Insurance Sub-Committee of the Compliance and Insurance Committee, and as a Director of B.P. p.l.c. and Naval and Nuclear Technologies LLP. Mr. Bowman also serves as a Director for the Armed Services YMCA of the USA, the U.S. Naval Submarine League and the American Shipbuilding Suppliers Association. Mr. Bowman is also a member of the National Security Advisory Council of the Center for U.S. Global Engagement and a member of the CNA Military Advisory Board. Mr. Bowman retired as an Admiral in the U.S. Navy after serving over 38 years on active duty including eight years as Director of the Naval Nuclear Propulsion Program in the Department of the Navy and the Department of Energy (1996-2004). Additionally, Mr. Bowman served as the U.S. Navy's Chief of Naval Personnel (1994-1996) where he was responsible for the planning and programming of all manpower, personnel, training and education resources for the U.S. Navy, and on the Joint Staff as Director of Political Military Affairs (1992-1994). In addition, Mr. Bowman served as President and Chief Executive Officer of the Nuclear Energy Institute. Mr. Bowman has received such distinctions as a knighthood as Honorary
47
Knight Commander of the Most Excellent Order of the British Empire and the Officier de l'Orde National du Mérite from the French Government and was elected to the National Academy of Engineering (2009). He is President of the consulting firm Strategic Decisions, LLC.
With over 20 years of experience on the boards and in senior management of such companies as Kmart Corporation, Levitz Furniture Corporation, Hills Department Stores and Sears Merchandise Group of Sears, Roebuck & Co., where Mr. Bozic also served as Chief Financial Officer of the Merchandise Group, and with nearly 20 years of experience as a Director or Trustee of certain other funds in the Fund Complex, Mr. Bozic has experience with a variety of financial, management, regulatory and operational issues as well as experience with marketing and distribution. Mr. Bozic has served as the Chairperson of the Compliance and Insurance Committee since 2006.
Ms. Dennis has over 25 years of business experience in the financial services industry and related fields including serving as a Director or Trustee of various other funds in the Fund Complex, where she serves as Chairperson of the Money Market and Alternatives Sub-Committee of the Investment Committee. Ms. Dennis possesses a strong understanding of the regulatory framework under which investment companies must operate based on her years of service to this Board and her position as Senior Managing Director of Victory Capital Management.
In addition to his tenure as a Director or Trustee of various other funds in the Fund Complex, where he formerly served as Chairperson of the Audit Committee, Dr. Johnson has also served as an officer or a board member of numerous companies for over 20 years. These positions included Co-Chairman and a founder of the Group of Seven Council, Director of NVR, Inc., Director of Evergreen Energy and Director of Greenwich Capital Holdings. He also has served as Vice Chairman of the Board of Governors of the Federal Reserve System and Assistant Secretary of the U.S. Treasury. In addition, Dr. Johnson also served as Chairman of the Financial Accounting Foundation, which oversees the Financial Accounting Standards Board, for seven years.
Mr. Kearns gained extensive experience regarding accounting through his experience on the Audit Committees of the boards of other funds in the Funds Complex, including serving as either Chairperson or Deputy Chairperson of the Audit Committee for nearly 20 years, and through his position as Chief Financial Officer of the J. Paul Getty Trust. He also has experience in financial, accounting, investment and regulatory matters through his position as President and founder of Kearns & Associates LLC, a financial consulting company. Mr. Kearns also serves as a Director of Electro Rent Corporation and The Ford Family Foundation. The Board has determined that Mr. Kearns is an "audit committee financial expert" as defined by the SEC.
Through his prior positions as Managing Director of Morgan Stanley & Co. Inc. and Morgan Stanley Dean Witter Investment Management and as President of Morgan Stanley Institutional Funds, Mr. Klein has experience in the management and operation of registered investment companies, enabling him to provide management input and investment guidance to the Board. Mr. Klein also has extensive experience in the investment management industry based on his current positions as Managing Director of Aetos Capital, LLC and as Director of certain investment funds managed or sponsored by Aetos Capital, LLC. In addition, he also has experience as a member of the board of other funds in the Fund Complex.
Mr. Nugent has extensive experience with financial, accounting, investment and regulatory matters through his over 20 years of service on the boards of various funds in the Fund Complex, including time as the Chairperson of the Insurance Committee, Chairperson of the Closed-End Fund Committee and Chairman of the Morgan Stanley Funds. Mr. Nugent also has experience as a General Partner in Triumph Capital, L.P.
Mr. Reed has experience on investment company boards and is experienced with financial, accounting, investment and regulatory matters through his prior service as a Director of iShares, Inc. and his service as Trustee or Director of other funds in the Fund Complex. Mr. Reed also gained substantial experience in the
48
financial services industry through his position as Director of Legg Mason, Inc. and prior position as President and CEO of General Motors Asset Management.
Mr. Reid has served on a number of mutual fund boards, including as a Trustee or Director of certain investment companies in the JP Morgan Funds complex and as a Trustee or Director of other funds in the Fund Complex. Therefore, Mr. Reid is experienced with financial, accounting, investment and regulatory matters, enabling him to provide management input and investment guidance to the Board.
Mr. Higgins has over 30 years of experience in the financial services industry. Mr. Higgins has substantial mutual fund experience and is experienced with financial, accounting, investment and regulatory matters due to his experience on the boards of other funds in the Fund Complex. Mr. Higgins also serves on the boards of other companies in the financial services industry, including AXA Financial, Inc. and The Equitable Life Assurance Society of the United States.
The Directors' principal occupations during the past five years or more are shown in the above tables.
Advantages of Having the Same Individuals as Independent Directors for the Morgan Stanley Funds
The Independent Directors and the Fund's management believe that having the same Independent Directors for each of the Morgan Stanley Funds avoids the duplication of effort that would arise from having different groups of individuals serving as Independent Directors for each of the funds or even of sub-groups of funds. They believe that having the same individuals serve as Independent Directors of all the Morgan Stanley Funds tends to increase their knowledge and expertise regarding matters which affect the Fund Complex generally and enhances their ability to negotiate on behalf of each fund with the fund's service providers. This arrangement also precludes the possibility of separate groups of Independent Directors arriving at conflicting decisions regarding operations and management of the funds and avoids the cost and confusion that would likely ensue. Finally, having the same Independent Directors serve on all fund boards enhances the ability of each fund to obtain, at modest cost to each separate fund, the services of Independent Directors of the caliber, experience and business acumen of the individuals who serve as Independent Directors of the Morgan Stanley Funds.
Shareholder Communications
Shareholders may send communications to the Fund's Board of Directors. Shareholders should send communications intended for the Fund's Board by addressing the communications directly to the Board (or individual Board members) and/or otherwise clearly indicating in the salutation that the communication is for the Board (or individual Board members) and by sending the communication to either the Fund's office or directly to such Board member(s) at the address specified for each Director previously noted. Other shareholder communications received by the Fund not directly addressed and sent to the Board will be reviewed and generally responded to by management, and will be forwarded to the Board only at management's discretion based on the matters contained therein.
Compensation of Directors and Officers
Effective January 1, 2014 each Director (except for the Chairperson of the Boards) receives an annual retainer fee of $230,000 for serving as a Director of the Morgan Stanley Funds. Prior to January 1, 2014, each Director (except for the Chairperson of the Boards) received an annual retainer fee of $220,000 for serving as a Director of the Morgan Stanley Funds.
The Chairperson of the Audit Committee receives an additional annual retainer fee of $78,750 and the Investment Committee Chairperson receives an additional annual retainer fee of $63,000. Other Committee and Sub-Committee Chairpersons receive an additional annual retainer fee of $31,500. The aggregate
49
compensation paid to each Director is paid by the Morgan Stanley Funds, and is allocated on a pro rata basis among each of the operational funds/ portfolios of the Morgan Stanley Funds based on the relative net assets of each of the funds/ portfolios. Michael E. Nugent receives a total annual retainer fee of $460,000 ($440,000 prior to January 1, 2014) for his services as Chairperson of the Boards of the Morgan Stanley Funds and for administrative services provided to each Board.
The Fund also reimburses such Directors for travel and other out-of-pocket expenses incurred by them in connection with attending such meetings. Directors of the Fund who are employed by the Adviser receive no compensation or expense reimbursement from the Fund for their services as Director.
Effective April 1, 2004, the Fund began a Deferred Compensation Plan (the "DC Plan"), which allows each Director to defer payment of all, or a portion, of the fees he or she receives for serving on the Board of Directors throughout the year. Each eligible Director generally may elect to have the deferred amounts credited with a return equal to the total return on one or more of the Morgan Stanley Funds (or portfolios thereof) that are offered as investment options under the DC Plan. At the Director's election, distributions are either in one lump sum payment, or in the form of equal annual installments over a period of five years. The rights of an eligible Director and the beneficiaries to the amounts held under the DC Plan are unsecured and such amounts are subject to the claims of the creditors of the Fund.
Prior to April 1, 2004, certain Morgan Stanley Funds maintained a similar Deferred Compensation Plan (the "Prior DC Plan"), which also allowed each Independent Director to defer payment of all, or a portion, of the fees he or she received for serving on the Board of Directors throughout the year. Generally, the DC Plan amends and supersedes the Prior DC Plan and all amounts payable under the Prior DC Plan are now subject to the terms of the DC Plan (except for amounts paid during the calendar year 2004, which remain subject to the terms of the Prior DC Plan).
The following table shows aggregate compensation payable to each of the Fund's Directors from the Fund for the fiscal year ended December 31, 2012 and the aggregate compensation payable to each of the Fund's Directors by the Fund Complex (which includes all of the Morgan Stanley Funds) for the calendar year ended December 31, 2012.
COMPENSATION(1)
Name of Independent Director: | | Aggregate Compensation
from the Fund(2) | | Total Compensation
from Fund and Fund
Complex Paid to Director(3) | |
Frank L. Bowman | | $ | 4,959 | | | $ | 241,500 | | |
Michael Bozic | | $ | 4,882 | | | $ | 241,500 | | |
Kathleen A. Dennis | | $ | 4,959 | | | $ | 241,500 | | |
Dr. Manuel H. Johnson | | $ | 5,519 | | | $ | 273,000 | | |
Joseph J. Kearns(3) | | $ | 5,837 | | | $ | 312,000 | | |
Michael F. Klein | | $ | 4,959 | | | $ | 241,500 | | |
Michael Nugent | | $ | 8,490 | | | $ | 420,000 | | |
W. Allen Reed(2)(3) | | $ | 3,936 | | | $ | 181,125 | | |
Fergus Reid(3) | | $ | 4,882 | | | $ | 274,750 | | |
Name of Interested Director: | |
James F. Higgins | | $ | 4,252 | | | $ | 210,000 | | |
(1) Includes all amounts paid for serving as director/trustee of the funds, as well as serving as Chairperson of the Boards or a Chairperson of a Committee or Sub-Committee.
(2) The amounts shown in this column represent the aggregate compensation before deferral with respect to the Fund's fiscal year. The following Director deferred compensation from the Fund during the fiscal year ended December 31, 2012: Mr. Reed, $3,936.
50
(3) The amounts shown in this column represent the aggregate compensation paid by all of the funds in the Fund Complex as of December 31, 2011 before deferral by the Directors under the DC Plan. As of December 31, 2012, the value (including interest) of the deferral accounts across the Fund Complex for Messrs. Kearns, Reed and Reid pursuant to the deferred compensation plan was $594,589, $969,468 and $619,208, respectively. Because the funds in the Fund Complex have different fiscal year ends, the amounts shown in this column are presented on a calendar year basis.
Prior to December 31, 2003, 49 of the Morgan Stanley Funds (the "Adopting Funds"), not including the Fund, had adopted a retirement program under which an Independent Director who retired after serving for at least five years as an Independent Director of any such fund (an "Eligible Director") would have been entitled to retirement payments, based on factors such as length of service, upon reaching the eligible retirement age. On December 31, 2003, the amount of accrued retirement benefits for each Eligible Director was frozen, and will be payable, together with a return of 8% per annum, at or following each such Eligible Director's retirement as shown in the table below.
The following table illustrates the retirement benefits accrued to the Fund's Independent Directors by the Adopting Funds for the calendar year ended December 31, 2012, and the estimated retirement benefits for the Independent Directors from the Adopting Funds for each calendar year following retirement. Only the Directors listed below participated in the retirement program.
Name of Independent Director: | | Retirement Benefits
Accrued as Fund Expenses
By All Adopting Funds | | Estimated Annual
Benefits Upon Retirement(1)
From All Adopting Funds | |
Michael Bozic | | $ | 42,107 | | | $ | 43,940 | | |
Manuel H. Johnson | | $ | 30,211 | | | $ | 64,338 | | |
Michael E. Nugent | | $ | 6,804 | | | $ | 57,539 | | |
(1) Total compensation accrued under the retirement plan, together with a return of 8% per annum, will be paid annually commencing upon retirement and continuing for the remainder of the Director's life.
Code of Ethics
Pursuant to Rule 17j-1 under the 1940 Act, the Board of Directors has adopted a Code of Ethics for the Fund and approved Codes of Ethics adopted by the Adviser, the Sub-Advisers and Morgan Stanley Distribution, Inc. (the "Distributor") (collectively the "Codes"). The Codes are intended to ensure that the interests of shareholders and other clients are placed ahead of any personal interest, that no undue personal benefit is obtained from the person's employment activities and that actual and potential conflicts of interest are avoided.
The Codes are designed to detect and prevent improper personal trading. The Codes permit personnel subject to the Codes to invest in securities, including securities that may be purchased, sold or held by the Fund, subject to a number of restrictions and controls, including prohibitions against purchases of securities in an initial public offering and a pre-clearance requirement with respect to personal securities transactions.
INVESTMENT ADVISORY AND OTHER SERVICES
Adviser
The Adviser is a wholly owned subsidiary of Morgan Stanley (NYSE: "MS"), a preeminent global financial services firm engaged in securities trading and brokerage activities, as well as providing investment banking, research and analysis, financing and financial advisory services. The principal offices of Morgan Stanley are located at 1585 Broadway, New York, NY 10036 and the principal offices of the Adviser are located at 522 Fifth Avenue, New York, NY 10036. As of September 30, 2013, the Adviser, together with its affiliated asset management companies, had approximately $360 billion in assets under management or supervision.
Pursuant to the Investment Advisory Agreement, the Adviser is entitled to receive from each class of shares of the Portfolio an annual management fee, payable quarterly, equal to the percentage of average daily net assets
51
set forth in the table below. In managing the Portfolio, the Adviser may use the services of associated investment personnel employed by its affiliated institutional asset management companies. The Adviser has agreed to a reduction in the fees payable to it and/or to reimburse the Portfolio, if necessary, if such fees would cause the total annual operating expenses of the Portfolio to exceed the percentage of average daily net assets set forth in the table below. In determining the actual amount of fee waiver and/or expense reimbursement for a Portfolio, if any, the Adviser excludes from total annual operating expenses certain investment related expenses, taxes, interest and other extraordinary expenses (including litigation) (but includes any 12b-1 fee paid to the Distributor, as applicable). The fee waivers and/or expense reimbursements for the Portfolio will continue for at least two years or until such time as the Fund's Board of Directors acts to discontinue all or a portion of such waivers and/or reimbursements when it deems such action is appropriate.
The following table reflects the contractual advisory fee and the maximum expense ratios for the Portfolio.
Portfolio | | Contractual Rate of Advisory Fees | | Expense Cap
Class I | | Expense Cap
Class II | |
Global Infrastructure | | 0.85% of the average daily net assets. | | | 1.11 | % | | | 1.36 | % | |
Sub-Advisers
The Adviser has entered into Sub-Advisory Agreements with Morgan Stanley Investment Management Limited, located at 25 Cabot Square, Canary Wharf, London, E14 4QA, England, and Morgan Stanley Investment Management Company, located at 23 Church Street, 16-01 Capital Square, Singapore 049481. The Sub-Advisers are wholly owned subsidiaries of Morgan Stanley and provide the Portfolio with investment advisory services subject to the overall supervision of the Adviser and the Portfolio's officers and Directors. The Adviser pays the Sub-Advisers on a monthly basis a portion of the net advisory fees the Adviser receives from the Portfolio.
Fund Administration
The Adviser also provides administration services to the Fund pursuant to an Amended and Restated Administration Agreement (the "Administration Agreement"). The services provided under the Administration Agreement are subject to the supervision of the officers and the Board of Directors of the Fund and include day-to-day administration of matters related to the corporate existence of the Fund, maintenance of records, preparation of reports, supervision of the Fund's arrangements with its custodian, and assistance in the preparation of the Fund's registration statement under federal laws. Under the Administration Agreement, the Adviser receives an annual fee, accrued daily and payable monthly, of 0.25% of the Fund's average daily net assets, and is responsible for all fees payable under any sub-administration agreements.
Sub-Administrator. Under an agreement between the Administrator and State Street Bank and Trust Company ("State Street"), State Street provides certain administrative services to the Fund. For such services, the Administrator pays State Street a portion of the administrative fee the Administrator receives from the Fund. The Administrator supervises and monitors the administrative and accounting services provided by State Street. Their services are also subject to the supervision of the officers and Board of Directors of the Fund. State Street's business address is One Lincoln Street, Boston, Massachusetts 02111-2101.
Custodian
State Street, located at One Lincoln Street, Boston, Massachusetts 02111-2101, acts as the Fund's custodian. State Street is not an affiliate of the Adviser or the Distributor. In maintaining custody of foreign assets held outside the United States, State Street has contracted with various banks and depositaries in accordance with regulations of the SEC for the purpose of providing custodial services for such assets.
52
In the selection of foreign sub-custodians, the Directors or their delegates consider a number of factors, including, but not limited to, the reliability and financial stability of the institution, the ability of the institution to provide efficiently the custodial services required for the Funds, and the reputation of the institution in the particular country or region.
Principal Underwriter
Morgan Stanley Distribution, Inc., with principal offices at 522 Fifth Avenue, New York, NY 10036, is an indirect wholly owned subsidiary of Morgan Stanley and serves as principal underwriter to the Fund. For information relating to the services provided by Morgan Stanley Distribution, Inc., see "Distribution of Shares (Applicable to Class II Shares Only)."
Dividend Disbursing and Transfer Agent
Boston Financial Data Services, Inc., 2000 Crown Colony Drive, Quincy, MA 02169-0953, provides dividend disbursing and transfer agency services for the Fund.
Proxy Voting Policy and Proxy Voting Record
The Board of Directors believes that the voting of proxies on securities held by the Fund is an important element of the overall investment process. As such, the Board has delegated the responsibility to vote such proxies to Morgan Stanley Investment Management and its advisory affiliates ("MSIM").
A copy of MSIM's Proxy Voting Policy ("Proxy Policy") is attached hereto as Appendix A. In addition, a copy of the Proxy Policy, as well as the Fund's most recent proxy voting record for the 12-month period ended June 30, as filed with the SEC, are available without charge on our web site at www.morganstanley.com/im. The Fund's proxy voting record is also available without charge on the SEC's web site at www.sec.gov.
DISTRIBUTION OF SHARES (APPLICABLE TO CLASS II SHARES ONLY)
The Fund has adopted a Distribution Plan (the "Plan") in accordance with the provisions of Rule 12b-1 under the 1940 Act, which regulates circumstances under which an investment company may directly or indirectly bear expenses relating to the distribution of its shares. The Plan authorizes the Class II shares of the Portfolio to pay Morgan Stanley Distribution, Inc. a monthly 12b-1 fee at a rate of 0.35% of the Portfolio's average daily net assets attributable to Class II shares. Such amount shall be paid to compensate Morgan Stanley Distribution, Inc. for remittance to insurance companies which offer the Fund as an investment option. These payments are intended to compensate insurance companies for distribution and/or administrative related expenses incurred or paid in connection with the distribution of Class II shares of the Portfolio. Morgan Stanley Distribution, Inc. may retain any portion of the fees it does not expend in meeting its obligations to the Fund. The Distributor has agreed to waive 0.10% of the 0.35% 12b-1 fees that it is entitled to receive with respect to the Class II shares of the Portfolio. This waiver will continue for at least two years or until such time as the Fund's Board of Directors acts to discontinue all or a portion of the waiver when it deems such action is appropriate.
Since the 12b-1 fees associated with the Plan are paid out of the Portfolio's assets on an on-going basis, over time these fees will increase the cost of your investment and may cost you more than paying other types of sales charges.
Continuance of the Plan must be approved annually by a majority of the Directors of the Fund, including a majority of the Independent Directors. All material amendments of the Plan will require approval by a majority
53
of the Directors of the Fund, including a majority of the Independent Directors. The Plan was approved by the Fund's Board of Directors, including the Independent Directors, none of whom has a direct or indirect financial interest in the operation of a Plan or in any agreements related thereto.
Revenue Sharing
The Adviser and/or the Distributor may pay compensation, out of their own funds and not as an additional charge to the Portfolio, to certain insurance companies or their affiliates and/or other financial intermediaries ("Intermediaries") in connection with the sale, distribution, marketing and retention of shares of the Portfolio and/or shareholder servicing. For example, the Adviser or the Distributor may pay additional compensation to Intermediaries for, among other things, promoting the sale and distribution of Portfolio shares, furnishing marketing support, maintaining share balances and/or for sub-accounting, recordkeeping, administrative, shareholder or transaction processing services. Such payments are in addition to any distribution or shareholder servicing fees that may be payable by the Distributor. The additional payments may be based on various factors, including amount of assets invested by the Intermediary's customers, the Portfolio's advisory fees, some other agreed upon amount, or other measures as determined from time to time by the Adviser or Distributor (e.g. gross sales or number of accounts). The amount of these payments may be different for different Intermediaries.
The additional payments currently made to certain Intermediaries, which are made in accordance with the applicable compensation structure for each Intermediary, include an ongoing annual fee in an amount up to 0.45% of the total average daily NAV of shares of the Portfolio held in such Intermediaries' applicable accounts.
The prospect of receiving, or the receipt of, additional compensation, as described above, by Intermediaries may provide Intermediaries and/or their financial advisors or other salespersons with an incentive to favor sales of shares of one variable annuity contract over other contract options with respect to which an Intermediary does not receive additional compensation (or receives lower levels of additional compensation) or be a factor in an insurance company's decision to include the Portfolio as an underlying investment option in its variable insurance products. These payment arrangements, however, will not change the price that an investor pays for shares of the Portfolio or the amount that the Portfolio receives to invest on behalf of an investor. Investors may wish to take such payment arrangements into account when considering and evaluating any recommendations relating to Portfolio shares and should review carefully any disclosure provided by an Intermediary as to its compensation.
PORTFOLIO MANAGERS
Other Accounts Managed by the Portfolio Managers
Because the portfolio managers manage assets for other investment companies, pooled investment vehicles, and/or other accounts (including institutional clients, pension plans and certain high net worth individuals), there may be an incentive to favor one client over another resulting in conflicts of interest. For instance, the Adviser and/or Sub-Advisers may receive fees from certain accounts that are higher than the fee it receives from the Fund, or it may receive a performance-based fee on certain accounts. In those instances, the portfolio managers may have an incentive to favor the higher and/or performance-based fee accounts over the Fund. In addition, a conflict of interest could exist to the extent the Adviser and/or Sub-Advisers have proprietary investments in certain accounts, where portfolio managers have personal investments in certain accounts or when certain accounts are investment options in the Adviser's and/or Sub-Advisers' employee benefits and/or deferred compensation plans. The portfolio manager may have an incentive to favor these accounts over others. If the Adviser and/or Sub-Advisers manage accounts that engage in short sales of securities of the type in which the Fund invests, the Adviser and/or Sub-Advisers could be seen as harming the performance of the Fund for the benefit of the accounts engaging in short sales if the short sales cause the market value of the securities to
54
fall. The Adviser and/or Sub-Advisers have adopted trade allocation and other policies and procedures that it believes are reasonably designed to address these and other conflicts of interest.
Portfolio Manager Compensation Structure
Portfolio managers receive a combination of base compensation and discretionary compensation, comprising a cash bonus and several deferred compensation programs described below. The methodology used to determine portfolio manager compensation is applied across all funds/accounts managed by the portfolio managers.
Base Salary Compensation. Generally, the portfolio managers receive base salary compensation based on the level of their position with the Adviser and/or Sub-Advisers.
Discretionary Compensation. In addition to base compensation, the portfolio managers may receive discretionary compensation. Discretionary compensation can include:
• Cash Bonus.
• Morgan Stanley's Long Term Incentive Compensation awards — a mandatory program that defers a portion of discretionary year-end compensation into restricted stock units or other awards based on Morgan Stanley common stock or other plans that are subject to vesting and other conditions. All long-term incentive compensation awards are subject to clawback provisions where awards can be cancelled if an employee takes any action, or omits to take any action, which causes a restatement of Morgan Stanley's consolidated financial results, or constitutes a violation of Morgan Stanley's risk policies and standards.
• Investment Management Alignment Plan (IMAP) awards — a mandatory program that defers a portion of discretionary year-end compensation and notionally invests it in designated funds advised by the Adviser and/or Sub-Advisers or their affiliates. The award is subject to vesting and other conditions. Portfolio managers must notionally invest a minimum of 25% to a maximum of 100% of their IMAP deferral account into a combination of the designated funds they manage that are included in the IMAP fund menu, which may or may not include the Portfolio. In addition to the clawbacks listed above for long term incentive compensation awards, the provision on IMAP awards is further strengthened such that it may also be triggered if an employee's actions cause substantial financial loss on a trading strategy, investment, commitment or other holding provided that previous gains on those positions were relevant to the employees' prior year compensation decisions.
Several factors determine discretionary compensation, which can vary by portfolio management team and circumstances. These factors may include:
• Revenues generated by the investment companies, pooled investment vehicles and other accounts managed by the portfolio manager.
• The investment performance of the funds/accounts managed by the portfolio manager.
• Contribution to the business objectives of the Adviser and/or Sub-Advisers.
• The dollar amount of assets managed by the portfolio manager.
• Market compensation survey research by independent third-parties.
• Other qualitative factors, such as contributions to client objectives.
• Performance of Morgan Stanley and Morgan Stanley Investment Management, and the overall performance of the investment team(s) of which the portfolio manager is a member.
55
Other Accounts Managed by Portfolio Managers at October 31, 2013:
| | | Registered Investment
Companies | | Other Pooled Investment
Vehicles | | Other Accounts | |
Portfolio and Portfolio Managers | | Number
of
Accounts | | Total Assets
in the
Accounts | | Number
of
Accounts | | Total Assets
in the
Accounts | | Number
of
Accounts | | Total Assets
in the
Accounts | |
Global Infrastructure | |
| Theodore R. Bigman | | | 13 | | | $6.1 billion | | | 15 | | | $7.6 billion | | | 53 | * | | $7.0 billion* | |
| Matthew King | | | 4 | | | 491.7 million | | | 1 | | | 337.0 million | | | 0 | | | | 0 | | |
* Of these other accounts, 14 accounts with a total of approximately $1.2 billion in assets, had performance-based fees.
As of the date of this SAI, the portfolio managers do not own any shares of the Portfolio.
CONTROL PERSONS AND PRINCIPAL HOLDERS OF SECURITIES
Control Persons
As currently required under law, the insurance companies vote their shares of the Portfolio in accordance with instructions received from their variable annuity contract and variable life insurance policy owners. Morgan Stanley will vote the shares of the Portfolio that it owns in the same proportions as shares of the Portfolio are voted by the insurance companies. Accordingly, neither Morgan Stanley nor the insurance companies are deemed to control the Portfolio.
Principal Holders of Securities
As of the date of this SAI, no person was known by the Portfolio to own beneficially or of record 5% or more of the outstanding Class I or Class II shares of the Portfolio because the Portfolio had not commenced operations.
Shares of the Portfolio are sold to insurance companies for their variable annuity contracts and variable life insurance policies.
NET ASSET VALUE
The NAV per share of the Portfolio is determined by dividing the total market value of the Portfolio's investments and other assets, less the total market value of all liabilities attributable to such class, by the total number of outstanding shares of the Portfolio. NAV for Class I and Class II shares will differ due to class specific expenses paid by each class, and the 12b-1 fee charged to Class II shares. The NAV per share of the Portfolio is determined as of the close of the NYSE (normally 4:00 p.m. Eastern Time) on each day that the NYSE is open for business.
Price information on listed securities is taken from the exchange where the security is primarily traded. Portfolio securities generally are valued at their market value. In the calculation of the Portfolio's net asset value: (1) an equity portfolio security listed or traded on an exchange is valued at its latest reported sale price (or at the exchange official closing price if such exchange reports an official closing price), and if there were no sales on a given day, the security is valued at the mean between the last reported bid and asked prices; and (2) all other equity portfolio securities for which over-the-counter market quotations are readily available are valued at the mean between the last reported bid and asked prices. In cases where a security is traded on more than one exchange, the security is valued on the exchange designated as the primary market. When market quotations are not readily available, including circumstances under which it is determined by the Adviser and/or
56
Sub-Advisers that the closing price, the last sale price or the mean between the last reported bid and asked prices are not reflective of a security's market value, portfolio securities are valued at their fair value as determined in good faith under procedures established by and under the general supervision of the Fund's Board. For valuation purposes, quotations of foreign portfolio securities, other assets and liabilities and forward contracts stated in foreign currency are translated into U.S. dollar equivalents at the prevailing market rates prior to the close of the NYSE.
Bonds and other fixed income securities are valued according to the broadest and most representative market, which will ordinarily be the over-the-counter market. NAV includes interest on fixed income securities, which is accrued daily unless collection is in doubt. In addition, bonds and other fixed income securities may be valued on the basis of prices provided by a pricing service when such prices are believed to reflect the fair market value of such securities. The prices provided by a pricing service are determined without regard to bid or last sale prices, but take into account institutional-size trading in similar groups of securities and any developments related to the specific securities. Securities not priced in this manner are valued based on the mean of bid and ask prices (or a yield equivalent thereof), obtained from market makers or brokers or, when securities exchange valuations are used, at the latest quoted sale price on the day of valuation. If there is no such reported sale, the latest quoted bid price will be used. Short-term debt securities with remaining maturities of 60 days or less at the time of purchase may be valued at amortized cost, unless the Adviser or Sub-Advisers determine such valuation does not reflect the securities' market value, in which case these securities will be valued at their fair market value as determined by the Adviser or Sub-Advisers.
Certain of the Portfolio's securities may be valued by an outside pricing service approved by the Board. The pricing service may utilize a matrix system or other model incorporating attributes such as security quality, maturity and coupon as the evaluation model parameters, and/or research evaluations by its staff, including review of broker-dealer market price quotations in determining what it believes is the fair valuation of the portfolio securities valued by such pricing service.
Listed options are valued at the last reported sales price on the exchange on which they are listed (or at the exchange official closing price if such exchange reports an official closing price). If an official closing price or last reported sale price is unavailable, the listed option should be fair valued at the mean between its latest bid and asked prices. If an exchange closing price or bid and asked prices are not available from the exchange, then the quotes from one or more brokers or dealers may be used. Unlisted options and swaps are valued by an outside pricing service approved by the Board or quotes from a broker or dealer. Unlisted options and swaps cleared on a clearinghouse or exchange may be valued using the closing price provided by the clearinghouse or exchange. Futures are valued at the settlement price on the exchange on which they trade or, if a settlement price is unavailable, then at the last sale price on the exchange.
If the Adviser or Sub-Advisers determine that the valuation received from the outside pricing service or broker or dealer is not reflective of the security's market value, such security is valued at its fair value as determined in good faith under procedures established by and under the general supervision of the Board.
Generally, trading in foreign securities, as well as corporate bonds, U.S. government securities and money market instruments, is substantially completed each day at various times prior to the close of the NYSE. The values of such securities used in computing the NAV of the Fund's shares are determined as of such times. Foreign currency exchange rates are also generally determined prior to the close of the NYSE. Occasionally, events which may affect the values of such securities and such exchange rates may occur between the times at which they are determined and the close of the NYSE. If events that may affect the value of such securities occur during such period, then these securities may be valued at their fair value as determined in good faith under procedures established by and under the supervision of the Board.
57
BROKERAGE PRACTICES
Portfolio Transactions
The Adviser and/or Sub-Advisers are responsible for decisions to buy and sell securities for the Portfolio, for broker-dealer selection and for negotiation of commission rates. The Adviser and/or Sub-Advisers are prohibited from directing brokerage transactions on the basis of the referral of clients or the sale of shares of advised investment companies. Purchases and sales of securities on a stock exchange are effected through brokers who charge a commission for their services. In the OTC market, securities may be traded as agency transactions through broker dealers or traded on a "net" basis with dealers acting as principal for their own accounts without a stated commission, although the price of the security usually includes profit to the dealer. In underwritten offerings, securities are purchased at a fixed price which includes an amount of compensation to the underwriter, generally referred to as the underwriter's concession or discount. When securities are purchased or sold directly from or to an issuer, no commissions or discounts are paid.
On occasion, the Portfolio may purchase certain money market instruments directly from an issuer without payment of a commission or concession. Money market instruments are generally traded on a "net" basis with dealers acting as principal for their own accounts without a stated commission, although the price of the security usually includes a profit to the dealer.
The Fund anticipates that certain of its transactions involving foreign securities will be effected on securities exchanges. Fixed commissions on such transactions are generally higher than negotiated commissions on domestic transactions. There is also generally less government supervision and regulation of foreign securities exchanges and brokers than in the United States.
The Adviser and/or Sub-Advisers serve as investment adviser to a number of clients, including other investment companies. The Adviser and/or Sub-Advisers attempt to equitably allocate purchase and sale transactions among the Portfolio and other client accounts. To that end, the Adviser and/or Sub-Advisers consider various factors, including respective investment objectives, relative size of portfolio holdings of the same or comparable securities, availability of cash for investment, size of investment commitments generally held and the opinions of the persons responsible for managing the Portfolio and other client accounts.
The Adviser and/or Sub-Advisers select the brokers or dealers that will execute the purchases and sales of investment securities for the Portfolio. The Adviser and/or Sub-Advisers effect transactions with those broker-dealers that they believe provide prompt execution of orders in an effective manner at the most favorable prices. The Adviser and/or Sub-Advisers may place portfolio transactions with those brokers and dealers who also furnish research and other services to the Fund, the Adviser and/or the Sub-Advisers. Services provided may include certain research services (as described below), as well as effecting securities transactions and performing functions incidental thereto (such as clearance, settlement and custody).
The Adviser and its affiliated investment advisers have established commission sharing arrangements under a commission management program (the "Commission Management Program" or "CMP"), pursuant to which execution and research costs or a portion of those costs are decoupled in accordance with applicable laws, rules and regulations. Under the CMP, the Adviser and its affiliated investment advisers select approved equity brokers (which include the Adviser's affiliates) for execution services and after accumulation of commissions at such brokers, the Adviser and/or its affiliates instruct these approved equity brokers to pay for eligible research provided by executing brokers or third-party research providers, which are selected independently by a Research Services Committee of the Adviser and its affiliated investment advisers. Generally, the Adviser and its affiliated investment advisers will direct the approved equity broker to record research credits based upon a previously agreed-upon allocation and will periodically instruct the approved equity broker to direct specified dollar amounts from that pool to pay for eligible research services provided by third-party research providers and executing brokers. The research credits are pooled among the Adviser and its affiliated investment advisers and allocated on behalf of both the Adviser and its affiliated investment advisers. Likewise, the research services obtained under the CMP are shared among the Adviser and its affiliated investment advisers.
58
Selection of approved equity brokers for execution is based on three main criteria: access to liquidity, provision of capital and quality of execution. Under the CMP, each approved equity broker is responsible for the payment of fees for research services and obtains the research services pursuant to written agreements between the approved equity broker and the third-party research provider.
For those costs not decoupled, but retained by broker-dealers, the Adviser also effects transactions with brokers which directly pay for research services provided by those brokers in accordance with Section 28(e) of the Securities Exchange Act of 1934, as amended (the "1934 Act"). Such transactions include equity transactions and may include fixed-income transactions effected on an agency basis.
Transactions involving client accounts managed by two or more affiliated investment advisers may be aggregated and executed using the services of broker-dealers that provide third-party benefits/research so long as: (i) all client accounts involved in the transaction benefit from one or more of the services offered by such broker-dealer; and (ii) each affiliated investment adviser has approved the use of such broker-dealer and the services provided thereby.
The research services received include those of the nature described above and other services which aid the Adviser in fulfilling its investment decision-making responsibilities, including (a) furnishing advice as to the value of securities, the advisability of investing in, purchasing or selling securities, and the availability of securities or purchasers or sellers of securities; and (b) furnishing analyses and reports concerning issuers, industries, securities, economic factors and trends, portfolio strategy and the performance of accounts. Where a particular item (such as proxy services) has both research and non-research related uses, the Adviser will make a reasonable allocation of the cost of the item between research and non-research uses and will only pay for the portion of the cost allocated to research uses with client brokerage transactions. Research services furnished or paid for by brokers through whom the Adviser effects transactions for a particular account may be used by the Adviser or its affiliated investment advisers in servicing their other accounts, and not all such services may be used for the benefit of the client which pays the brokerage commission that results in the receipt of such research services. Commissions paid to brokers providing research services may be higher than those charged by brokers not providing services.
The Adviser and its affiliated investment advisers make a good faith determination of the value of research services in accordance with Section 28(e) of the 1934 Act, UK Financial Conduct Authority and Prudential Regulation Authority Rules and other relevant regulatory requirements.
Certain investment professionals and other employees of the Adviser are also officers of affiliated investment advisers and may provide investment advisory services to clients of such affiliated investment advisers. The Adviser's personnel also provide research and trading support to personnel of certain affiliated investment advisers. Research related costs may be shared by affiliated investment advisers and may benefit the clients of such affiliated investment advisers. Research services that benefit the Adviser may be received in connection with commissions generated by clients of its affiliated investment advisers. Similarly, research services received in connection with commissions generated by the Adviser's clients may benefit affiliated investment advisers and their clients. Moreover, research services provided by broker-dealers through which the Adviser effects transactions for a particular account may be used by the Adviser and/or an affiliated investment adviser in servicing its other accounts and not all such research services may be used for the benefit of the particular client, which pays the brokerage commission giving rise to the receipt of such research services.
The Adviser and certain of its affiliates currently serve as an investment adviser to a number of clients, including other investment companies, and may in the future act as investment adviser to others. It is the practice of the Adviser, and its affiliates, to cause purchase and sale transactions (including transactions in certain initial and secondary public offerings) to be allocated among clients whose assets they manage (including the Fund) in such manner they deem equitable. In making such allocations among the Fund and other client accounts, various factors may be considered, including the respective investment objectives, the relative size of portfolio
59
holdings of the same or comparable securities, the availability of cash for investment, the size of investment commitments generally held and the opinions of the persons responsible for managing the Portfolio and other client accounts. The Adviser and its affiliates may operate one or more order placement facilities and each facility will implement order allocation in accordance with the procedures described above. From time to time, each facility may transact in a security at the same time as other facilities are trading in that security.
Affiliated Brokers
Subject to the overriding objective of obtaining the best execution of orders, the Fund may use broker-dealer affiliates of the Adviser to effect Portfolio brokerage transactions, including transactions in futures contracts and options on futures contracts, under procedures adopted by the Fund's Board of Directors. In order to use such affiliates, the commission rates and other remuneration paid to the affiliates must be fair and reasonable in comparison to those of other broker-dealers for comparable transactions involving similar securities being purchased or sold during a comparable time period. This standard would allow the affiliated broker or dealer to receive no more than the remuneration which would be expected to be received by an unaffiliated broker.
Pursuant to orders issued by the SEC, the Fund is permitted to engage in principal transactions, subject to certain conditions, with Morgan Stanley & Co. LLC, a broker-dealer affiliated with the Fund's Adviser.
Portfolio Turnover
The Portfolio generally does not invest for short-term trading purposes; however, when circumstances warrant, the Portfolio may sell investment securities without regard to the length of time they have been held. Market conditions in a given year could result in a higher or lower portfolio turnover rate than expected and the Portfolio will not consider portfolio turnover rate a limiting factor in making investment decisions consistent with its investment objectives and policies. A high portfolio turnover rate (100% or more) increases the Portfolio's transaction costs (including brokerage commissions or dealer costs), which would adversely impact the Portfolio's performance. Higher portfolio turnover may result in the realization of more short-term capital gains than if the Portfolio had lower portfolio turnover.
PERFORMANCE INFORMATION
The Portfolio is newly organized. As a result, the Portfolio has no operating history or performance information to include.
DISCLOSURE OF PORTFOLIO HOLDINGS
The Fund's Board of Directors, the Adviser and the Sub-Advisers have adopted policies and procedures regarding disclosure of portfolio holdings (the "Policy"). Pursuant to the Policy, the Adviser and the Sub-Advisers may disclose information concerning Fund portfolio holdings only if such disclosure is consistent with the antifraud provisions of the federal securities laws and the Fund's, the Adviser's and the Sub-Advisers' fiduciary duties to Fund shareholders. In no instance may the Adviser and the Sub-Advisers or the Fund receive compensation or any other consideration in connection with the disclosure of information about the portfolio securities of the Fund. Consideration includes any agreement to maintain assets in the Fund or in other investment companies or accounts managed by the Adviser, the Sub-Advisers or by any affiliated person of the Adviser or the Sub-Advisers. Non-public information concerning portfolio holdings may be divulged to third-parties only when the Fund has a legitimate business purpose for doing so and the recipients of the information are subject to a duty of confidentiality. Under no circumstances shall current or prospective Fund shareholders receive non-public portfolio holdings information, except as described below.
60
The Fund makes available on its public website the following portfolio holdings information:
• complete portfolio holdings information monthly, at least 15 calendar days after the end of each month; and
• top 10 holdings monthly, at least 15 calendar days after the end of each month.
The Fund provides a complete schedule of portfolio holdings for the second and fourth fiscal quarters in its semiannual and annual reports, and for the first and third fiscal quarters in its filings with the SEC on Form N-Q.
All other portfolio holdings information that has not been disseminated in a manner making it available to investors generally as described above is non-public information for purposes of the Policy.
The Fund may make selective disclosure of non-public portfolio holdings information pursuant to certain exemptions set forth in the Policy. Third-parties eligible for exemptions under the Policy and therefore eligible to receive such disclosures currently include fund rating agencies, information exchange subscribers, consultants and analysts, portfolio analytics providers and service providers, provided that the third-party expressly agrees to maintain the disclosed information in confidence and not to trade portfolio securities or related derivative securities based on the non-public information. Non-public portfolio holdings information may not be disclosed to a third-party pursuant to an exemption unless and until the third-party recipient has entered into a non-disclosure agreement with the Fund and the arrangement has been reviewed and approved, as set forth in the Policy and discussed below. In addition, persons who owe a duty of trust or confidence to the Fund or the Adviser may receive non-public portfolio holdings information without entering into a non-disclosure agreement. Currently, these persons include (i) the Fund's independent registered public accounting firm (as of the Fund's fiscal year-end and on an as needed basis), (ii) counsel to the Fund (on an as needed basis), (iii) counsel to the independent Directors (on an as needed basis) and (iv) members of the Board of Directors (on an as needed basis). Subject to the terms and conditions of any agreement between the Adviser or the Fund and the third-party recipient, if these conditions for disclosure are satisfied, there shall be no restriction on the frequency with which Fund non-public portfolio holdings information is released, and no lag period shall apply (unless otherwise indicated below).
The Adviser and the Sub-Advisers may provide interest lists to broker-dealers who execute securities transactions for the Fund without entering into a non-disclosure agreement with the broker-dealers, provided that the interest list satisfies all of the following criteria: (1) the interest list must contain only the CUSIP numbers and/or ticker symbols of securities held in all registered management investment companies advised by the Adviser, the Sub-Advisers or any affiliate of the Adviser or the Sub-Advisers (the "MSIM Funds") on an aggregate, rather than a fund-by-fund basis; (2) the interest list must not contain information about the number or value of shares owned by a specified MSIM Fund; (3) the interest list may identify the investment strategy, but not the particular MSIM Funds, to which the list relates; and (4) the interest list may not identify the portfolio manager or team members responsible for managing the MSIM Funds.
Fund shareholders may elect in some circumstances to redeem their shares of the Fund in exchange for their pro rata share of the securities held by the Fund. Under such circumstances, Fund shareholders may receive a complete listing of the holdings of the Fund up to seven calendar days prior to making the redemption request provided that they represent in writing that they agree not to disclose or trade on the basis of the portfolio holdings information.
The Fund may discuss or otherwise disclose performance attribution analyses (i.e., mention the effects of having a particular security in the portfolio(s)) where such discussion is not contemporaneously made public, provided that the particular holding has been disclosed publicly. Additionally, any discussion of the analyses may not be more current than the date the holding was disclosed publicly.
61
The Fund may disclose portfolio holdings to transition managers, provided that the Fund has entered into a non-disclosure or confidentiality agreement with the party requesting that the information be provided to the transition manager and the party to the non-disclosure agreement has, in turn, entered into a non-disclosure or confidentiality agreement with the transition manager.
The Adviser, the Sub-Advisers and/or the Fund currently have entered into ongoing arrangements with the following parties:
Name | | Information Disclosed | | Frequency(1) | | Lag Time | |
Service Providers | |
RiskMetrics Group (proxy voting agent)(*) | | Complete portfolio holdings | | Daily basis | | | (2 | ) | |
State Street Bank and Trust Company(*) | | Complete portfolio holdings | | As needed | | | (2 | ) | |
Fund Rating Agencies | |
Lipper(*) | | Top ten and complete portfolio holdings | | Monthly basis | | Approximately six business days after month end | |
Consultants and Analysts | |
Citigroup(*) | | Complete portfolio holdings | | Quarterly basis(3) | | At least one day after quarter end | |
Credit Suisse First Boston(*) | | Top ten and complete portfolio holdings | | Monthly and quarterly basis, respectively | | Approximately 10-12 days after month/ quarter end | |
Evaluation Associates(*) | | Top ten and complete portfolio holdings | | Monthly and quarterly basis, respectively(3) | | Approximately 10-12 days after month/ quarter end | |
Merrill Lynch(*) | | Top ten and complete portfolio holdings | | Monthly and quarterly basis, respectively(3) | | Approximately 10-12 days after month/ quarter end | |
Portfolio Analytics Providers | |
Factset Research Systems, Inc.(*) | | Complete portfolio holdings | | Daily basis | | One day | |
(*) This entity has agreed to maintain Fund non-public portfolio holdings information in confidence and not to trade portfolio securities based on the non-public portfolio holdings information.
(1) Dissemination of portfolio holdings information to entities listed above may occur less frequently than indicated (or not at all). Information will typically be provided on a real time basis or as soon thereafter as possible.
(2) Information will typically be provided on a real time basis or as soon thereafter as possible.
(3) This information will also be provided upon request from time to time.
In addition, the following insurance companies, which are deemed service providers to the Fund, receive Top Ten portfolio holdings information, on a quarterly basis, approximately 15 days after quarter end: AG Life Insurance Company of Delaware (formerly AIG), Allstate Life Insurance Company, Allstate Life Insurance Company of New York, American General Life Insurance Company, Ameriprise Financial, Ameritas Life Insurance Corp, Ameritas Life Insurance Corp of New York, Annuity Investors Life Insurance Company, Columbus Life Insurance Company, Connecticut General Life Insurance Company (CIGNA), Continental Assurance Company, Continental Casualty Company, CUNA Mutual Insurance Society, Empire Fidelity Investments Life Insurance Company, Fidelity Insurance Life Insurance Company, Fidelity Investments Life Insurance Company, First MetLife Investors Insurance Company, First Security Benefit Life Insurance & Annuity Company of New York, General American Life Insurance Company, Great-West Life & Annuity Insurance Company, Hartford Life Insurance Company, Integrity Life Insurance Company, Kemper Investors Life Insurance Company, Lincoln Life & Annuity Company of New York, Metlife Insurance Company of Connecticut, MetLife Investors USA Insurance Company, Metropolitan Life Insurance Company, Midland National Life Insurance Company, Minnesota Life Insurance Company, MONY Life Insurance Company, National Integrity Life Insurance Company, National Life Insurance Company, National Security Life and Annuity Company, Nationwide Life Insurance Company, New York Life Insurance Company, Ohio National Life Assurance Corporation, Philadelphia Financial Life Assurance Company, Protective Life & Annuity Insurance Company, Protective Life Insurance Company, Security Benefit Life Insurance Company, Sun Life Assurance Company of Canada (U.S.), Sun Life Insurance and Annuity Company of New York, The Lincoln National Life Insurance Company, The Ohio National Life Insurance Company, The Prudential Insurance
62
Company of America, Transamerica Financial Life, Transamerica Life Insurance Company, Transamerica Occidental Life, United Life Annuity and Insurance Company (ING), Valley Forge Life Insurance Company and Western Reserve Life Insurance Company of Ohio. The Fund does not currently have non-disclosure agreements in place with these entities and therefore, these entities can only receive publicly available information.
All disclosures of non-public portfolio holdings information made to third-parties pursuant to the exemptions set forth in the Policy must be reviewed by MSIM's Legal and Compliance Division and approved by the Head of the Long-Only Business of MSIM. Disclosures made to third-parties in connection with (i) broker-dealer interest lists; (ii) shareholder in-kind distributions; (iii) attribution analyses; or (iv) transitions managers are pre-approved for purposes of the Policy. In addition, the following categories of third-parties that may receive non-public portfolio holdings information are also pre-approved provided that they enter into non-disclosure agreements (as discussed above): (i) fund rating agencies; (ii) information exchange subscribers; (iii) consultants and analysts (including defined benefit and defined contribution plan sponsors, and variable annuity providers); (iv) portfolio analytics providers; and (v) service providers.
The Adviser and/or the Sub-Advisers shall report quarterly to the Board of Directors (or a designated committee thereof) at the next regularly scheduled meeting (i) any material information concerning all parties receiving non-public portfolio holdings information pursuant to an exemption; and (ii) any new non-disclosure agreements entered into during the reporting period. Procedures to monitor the use of such non-public portfolio holdings information include requiring annual certifications that the recipients have utilized such information only pursuant to the terms of the agreement between the recipient and the Adviser and, for those recipients receiving information electronically, acceptance of the information will constitute reaffirmation that the third-party expressly agrees to maintain the disclosed information in confidence and not to trade portfolio securities based on the nonpublic information.
GENERAL INFORMATION
Fund History
The Fund was incorporated pursuant to the laws of the State of Maryland on March 26, 1996 under the name Morgan Stanley Universal Funds, Inc. The Fund filed a registration statement with the SEC registering itself as an open-end management investment company offering diversified and non-diversified series under the 1940 Act and its shares under the 1933 Act and commenced operations on September 16, 1996. On December 1, 1998, the Fund changed its name to Morgan Stanley Dean Witter Universal Funds, Inc. Effective May 1, 2000, the Fund changed its name to The Universal Institutional Funds, Inc.
Description of Shares and Voting Rights
The Fund's Articles of Incorporation, as amended, permit the Directors to issue 11.5 billion shares of common stock, par value $.001 per share, from an unlimited number of classes of shares. Currently the Fund consists of shares of 11 portfolios. Each portfolio (with the exception of the Global Franchise, Global Real Estate and Small Company Growth Portfolios) offers Class I shares. In addition, all portfolios offer Class II shares.
The shares of the Portfolio, upon issuance, are fully paid and nonassessable, and have no preference as to conversion, exchange, dividends, retirement or other features. The shares of the Portfolio have no pre-emptive rights. The shares of the Fund have non-cumulative voting rights, which means that the holders of more than 50% of the shares voting for the election of Directors can elect 100% of the Directors if they choose to do so. A shareholder is entitled to one vote for each full share held (and a fractional vote for each fractional share held), then standing in his name on the books of the Fund.
63
Shares of the Portfolio will be voted by the insurance company or qualified plans investing in the Portfolio based on instructions received from the contract holders having a voting interest in the underlying account. Shares for which timely instructions are not received generally will be voted by the insurance company or qualified plans in the same proportion as shares for which instructions have been timely received. Therefore, as a result of this proportional voting, the vote of a small number of contract holders could determine the outcome of a proposal subject to a shareholder vote.
Dividends and Capital Gains Distributions
The Fund's policy is to distribute at least annually substantially all of the Portfolio's net investment income, if any. The Fund may also distribute any net realized capital gains in the amount and at the times that are intended to eliminate income (including taxable gains) taxes imposed on the Portfolio (see discussion under "Taxes" in this SAI). However, the Fund may also choose to retain net realized capital gains and pay taxes on such gains. The amounts of any income dividends or capital gains distributions cannot be predicted. Any dividend or distribution paid shortly after the purchase of shares of the Portfolio by an investor may have the effect of reducing the per share NAV of the Portfolio by the per share amount of the dividend or distribution.
Independent Registered Public Accounting Firm
Ernst & Young LLP, located at 200 Clarendon Street, Boston, MA 02116-5021, serves as independent registered public accounting firm for the Fund and audits the annual financial statements of the Portfolio.
Legal Matters
Dechert LLP, located at 1095 Avenue of the Americas, New York, NY 10036-6797, acts as the Fund's legal counsel.
FINANCIAL STATEMENTS
No financial information is presented for the Portfolio because it has not commenced operations as of the date of this SAI.
64
APPENDIX A
MORGAN STANLEY INVESTMENT MANAGEMENT
PROXY VOTING POLICY AND PROCEDURES
I. POLICY STATEMENT
Morgan Stanley Investment Management's ("MSIM") policy and procedures for voting proxies ("Policy") with respect to securities held in the accounts of clients applies to those MSIM entities that provide discretionary investment management services and for which an MSIM entity has authority to vote proxies. This Policy is reviewed and updated as necessary to address new and evolving proxy voting issues and standards.
The MSIM entities covered by this Policy currently include the following: Morgan Stanley AIP GP LP, Morgan Stanley Investment Management Inc., Morgan Stanley Investment Management Limited, Morgan Stanley Investment Management Company, Morgan Stanley Asset & Investment Trust Management Co., Limited, Morgan Stanley Investment Management Private Limited and Private Investment Partners Inc. (each an "MSIM Affiliate" and collectively referred to as the "MSIM Affiliates" or as "we" below).
Each MSIM Affiliate will use its best efforts to vote proxies as part of its authority to manage, acquire and dispose of account assets. With respect to the MSIM registered management investment companies (the "MSIM Funds"), each MSIM Affiliate will vote proxies under this Policy pursuant to authority granted under its applicable investment advisory agreement or, in the absence of such authority, as authorized by the Board of Directors/Trustees of the MSIM Funds. A MSIM Affiliate will not vote proxies unless the investment management or investment advisory agreement explicitly authorizes the MSIM Affiliate to vote proxies. MSIM Affiliates will vote proxies in a prudent and diligent manner and in the best interests of clients, including beneficiaries of and participants in a client's benefit plan(s) for which the MSIM Affiliates manage assets, consistent with the objective of maximizing long-term investment returns ("Client Proxy Standard"). In certain situations, a client or its fiduciary may provide an MSIM Affiliate with a proxy voting policy. In these situations, the MSIM Affiliate will comply with the client's policy.
Proxy Research Services—ISS Governance Services ("ISS") and Glass Lewis (together with other proxy research providers as we may retain from time to time, the "Research Providers") are independent advisers that specialize in providing a variety of fiduciary-level proxy-related services to institutional investment managers, plan sponsors, custodians, consultants, and other institutional investors. The services provided include in-depth research, global issuer analysis, and voting recommendations. While we may review and utilize the recommendations of one or more Research Providers in making proxy voting decisions, we are in no way obligated to follow such recommendations. In addition to research, ISS provides vote execution, reporting, and recordkeeping services.
Voting Proxies for Certain Non-U.S. Companies—Voting proxies of companies located in some jurisdictions may involve several problems that can restrict or prevent the ability to vote such proxies or entail significant costs. These problems include, but are not limited to: (i) proxy statements and ballots being written in a language other than English; (ii) untimely and/or inadequate notice of shareholder meetings; (iii) restrictions on the ability of holders outside the issuer's jurisdiction of organization to exercise votes; (iv) requirements to vote proxies in person; (v) the imposition of restrictions on the sale of the securities for a period of time in proximity to the shareholder meeting; and (vi) requirements to provide local agents with power of attorney to facilitate our voting instructions. As a result, we vote clients' non-U.S. proxies on a best efforts basis only, after weighing the costs and benefits of voting such proxies, consistent with the Client Proxy Standard. ISS has been retained to provide assistance in connection with voting non-U.S. proxies.
II. GENERAL PROXY VOTING GUIDELINES
To promote consistency in voting proxies on behalf of its clients, we follow this Policy (subject to any exception set forth herein). The Policy addresses a broad range of issues, and provides general voting parameters on proposals that arise most frequently. However, details of specific proposals vary, and those details affect particular voting decisions, as do factors specific to a given company. Pursuant to the procedures set forth herein, we may vote in a manner that is not in accordance with the following general guidelines, provided the vote is approved by the Proxy Review Committee (see Section III for description) and is consistent with the Client Proxy Standard. Morgan Stanley AIP GP LP will follow the procedures as described in Appendix A.
A-1
We endeavor to integrate governance and proxy voting policy with investment goals, using the vote to encourage portfolio companies to enhance long-term shareholder value and to provide a high standard of transparency such that equity markets can value corporate assets appropriately.
We seek to follow the Client Proxy Standard for each client. At times, this may result in split votes, for example when different clients have varying economic interests in the outcome of a particular voting matter (such as a case in which varied ownership interests in two companies involved in a merger results in different stakes in the outcome). We also may split votes at times based on differing views of portfolio managers.
We may abstain on matters for which disclosure is inadequate.
A. Routine Matters.
We generally support routine management proposals. The following are examples of routine management proposals:
• Approval of financial statements and auditor reports if delivered with an unqualified auditor's opinion.
• General updating/corrective amendments to the charter, articles of association or bylaws, unless we believe that such amendments would diminish shareholder rights.
• Most proposals related to the conduct of the annual meeting, with the following exceptions. We generally oppose proposals that relate to "the transaction of such other business which may come before the meeting," and open-ended requests for adjournment. However, where management specifically states the reason for requesting an adjournment and the requested adjournment would facilitate passage of a proposal that would otherwise be supported under this Policy (i.e. an uncontested corporate transaction), the adjournment request will be supported.
We generally support shareholder proposals advocating confidential voting procedures and independent tabulation of voting results.
B. Board of Directors.
1. Election of directors: Votes on board nominees can involve balancing a variety of considerations. In vote decisions, we may take into consideration whether the company has a majority voting policy in place that we believe makes the director vote more meaningful. In the absence of a proxy contest, we generally support the board's nominees for director except as follows:
a. We consider withholding support from or voting against a nominee if we believe a direct conflict exists between the interests of the nominee and the public shareholders, including failure to meet fiduciary standards of care and/or loyalty. We may oppose directors where we conclude that actions of directors are unlawful, unethical or negligent. We consider opposing individual board members or an entire slate if we believe the board is entrenched and/or dealing inadequately with performance problems; if we believe the board is acting with insufficient independence between the board and management; or if we believe the board has not been sufficiently forthcoming with information on key governance or other material matters.
b. We consider withholding support from or voting against interested directors if the company's board does not meet market standards for director independence, or if otherwise we believe board independence is insufficient. We refer to prevalent market standards as promulgated by a stock exchange or other authority within a given market (e.g., New York Stock Exchange or Nasdaq rules for most U.S. companies, and The Combined Code on Corporate Governance in the United Kingdom). Thus, for an NYSE company with no controlling shareholder, we would expect that at a minimum a majority of directors should be independent as defined by NYSE. Where we view market standards as inadequate, we may withhold votes based on stronger independence standards. Market standards notwithstanding, we generally do not view long board tenure alone as a basis to classify a director as non-independent.
i. At a company with a shareholder or group that controls the company by virtue of a majority economic interest in the company, we have a reduced expectation for board independence, although we believe the presence of independent directors can be helpful, particularly in staffing the audit committee, and at times we may withhold support from or vote against a nominee on the view the
A-2
board or its committees are not sufficiently independent. In markets where board independence is not the norm (e.g. Japan), however, we consider factors including whether a board of a controlled company includes independent members who can be expected to look out for interests of minority holders.
ii. We consider withholding support from or voting against a nominee if he or she is affiliated with a major shareholder that has representation on a board disproportionate to its economic interest.
c. Depending on market standards, we consider withholding support from or voting against a nominee who is interested and who is standing for election as a member of the company's compensation/remuneration, nominating/governance or audit committee.
d. We consider withholding support or voting against nominees if the term for which they are nominated is excessive. We consider this issue on a market-specific basis.
e. We consider withholding support from or voting against nominees if, in our view, there has been insufficient board renewal (turnover), particularly in the context of extended poor company performance.
f. We consider withholding support from or voting against a nominee standing for election if the board has not taken action to implement generally accepted governance practices for which there is a "bright line" test. For example, in the context of the U.S. market, failure to eliminate a dead hand or slow hand poison pill would be seen as a basis for opposing one or more incumbent nominees.
g. In markets that encourage designated audit committee financial experts, we consider voting against members of an audit committee if no members are designated as such. We also consider voting against the audit committee members if the company has faced financial reporting issues and/or does not put the auditor up for ratification by shareholders.
h. We believe investors should have the ability to vote on individual nominees, and may abstain or vote against a slate of nominees where we are not given the opportunity to vote on individual nominees.
i. We consider withholding support from or voting against a nominee who has failed to attend at least 75% of the nominee's board and board committee meetings within a given year without a reasonable excuse. We also consider opposing nominees if the company does not meet market standards for disclosure on attendance.
j. We consider withholding support from or voting against a nominee who appears overcommitted, particularly through service on an excessive number of boards. Market expectations are incorporated into this analysis; for U.S. boards, we generally oppose election of a nominee who serves on more than six public company boards (excluding investment companies), although we may reference National Association of Corporate Directors guidance suggesting that public company CEOs, for example, should serve no more than two outside boards given the level of time commitment required in their primary job.
2. Discharge of directors' duties: In markets where an annual discharge of directors' responsibility is a routine agenda item, we generally support such discharge. However, we may vote against discharge or abstain from voting where there are serious findings of fraud or other unethical behavior for which the individual bears responsibility. The annual discharge of responsibility represents shareholder approval of disclosed actions taken by the board during the year and may make future shareholder action against the board difficult to pursue.
3. Board independence: We generally support U.S. shareholder proposals requiring that a certain percentage (up to 66 2/3%) of the company's board members be independent directors, and promoting all-independent audit, compensation and nominating/governance committees.
4. Board diversity: We consider on a case-by-case basis shareholder proposals urging diversity of board membership with respect to social, religious or ethnic group.
5. Majority voting: We generally support proposals requesting or requiring majority voting policies in election of directors, so long as there is a carve-out for plurality voting in the case of contested elections.
A-3
6. Proxy access: We consider on a case-by-case basis shareholder proposals on particular procedures for inclusion of shareholder nominees in company proxy statements.
7. Reimbursement for dissident nominees: We generally support well-crafted U.S. shareholder proposals that would provide for reimbursement of dissident nominees elected to a board, as the cost to shareholders in electing such nominees can be factored into the voting decision on those nominees.
8. Proposals to elect directors more frequently: In the U.S. public company context, we usually support shareholder and management proposals to elect all directors annually (to "declassify" the board), although we make an exception to this policy where we believe that long-term shareholder value may be harmed by this change given particular circumstances at the company at the time of the vote on such proposal. As indicated above, outside the U.S., we generally support greater accountability to shareholders that comes through more frequent director elections, but recognize that many markets embrace longer term lengths, sometimes for valid reasons given other aspects of the legal context in electing boards.
9. Cumulative voting: We generally support proposals to eliminate cumulative voting in the U.S. market context. (Cumulative voting provides that shareholders may concentrate their votes for one or a handful of candidates, a system that can enable a minority bloc to place representation on a board.) U.S. proposals to establish cumulative voting in the election of directors generally will not be supported.
10. Separation of Chairman and CEO positions: We vote on shareholder proposals to separate the Chairman and CEO positions and/or to appoint an independent Chairman based in part on prevailing practice in particular markets, since the context for such a practice varies. In many non-U.S. markets, we view separation of the roles as a market standard practice, and support division of the roles in that context. In the U.S., we consider such proposals on a case-by-case basis, considering, among other things, the existing board leadership structure, company performance, and any other evidence of entrenchment or perceived risk that power is overly concentrated in a single individual.
11. Director retirement age and term limits: Proposals setting or recommending director retirement ages or director term limits are voted on a case-by-case basis that includes consideration of company performance, the rate of board renewal, evidence of effective individual director evaluation processes, and any indications of entrenchment.
12. Proposals to limit directors' liability and/or broaden indemnification of officers and directors. Generally, we will support such proposals provided that an individual is eligible only if he or she has not acted in bad faith, with gross negligence or with reckless disregard of their duties.
C. Statutory auditor boards
The statutory auditor board, which is separate from the main board of directors, plays a role in corporate governance in several markets. These boards are elected by shareholders to provide assurance on compliance with legal and accounting standards and the company's articles of association. We generally vote for statutory auditor nominees if they meet independence standards. In markets that require disclosure on attendance by internal statutory auditors, however, we consider voting against nominees for these positions who failed to attend at least 75% of meetings in the previous year. We also consider opposing nominees if the company does not meet market standards for disclosure on attendance.
D. Corporate transactions and proxy fights.
We examine proposals relating to mergers, acquisitions and other special corporate transactions (i.e., takeovers, spin-offs, sales of assets, reorganizations, restructurings and recapitalizations) on a case-by-case basis in the interests of each fund or other account. Proposals for mergers or other significant transactions that are friendly and approved by the Research Providers usually are supported if there is no portfolio manager objection. We also analyze proxy contests on a case-by-case basis.
E. Changes in capital structure.
1. We generally support the following:
• Management and shareholder proposals aimed at eliminating unequal voting rights, assuming fair economic treatment of classes of shares we hold.
A-4
• U.S. management proposals to increase the authorization of existing classes of common stock (or securities convertible into common stock) if: (i) a clear business purpose is stated that we can support and the number of shares requested is reasonable in relation to the purpose for which authorization is requested; and/or (ii) the authorization does not exceed 100% of shares currently authorized and at least 30% of the total new authorization will be outstanding. (We consider proposals that do not meet these criteria on a case-by-case basis.)
• U.S. management proposals to create a new class of preferred stock or for issuances of preferred stock up to 50% of issued capital, unless we have concerns about use of the authority for anti-takeover purposes.
• Proposals in non-U.S. markets that in our view appropriately limit potential dilution of existing shareholders. A major consideration is whether existing shareholders would have preemptive rights for any issuance under a proposal for standing share issuance authority. We generally consider market-specific guidance in making these decisions; for example, in the U.K. market, we usually follow Association of British Insurers' ("ABI") guidance, although company-specific factors may be considered and for example, may sometimes lead us to voting against share authorization proposals even if they meet ABI guidance.
• Management proposals to authorize share repurchase plans, except in some cases in which we believe there are insufficient protections against use of an authorization for anti-takeover purposes.
• Management proposals to reduce the number of authorized shares of common or preferred stock, or to eliminate classes of preferred stock.
• Management proposals to effect stock splits.
• Management proposals to effect reverse stock splits if management proportionately reduces the authorized share amount set forth in the corporate charter. Reverse stock splits that do not adjust proportionately to the authorized share amount generally will be approved if the resulting increase in authorized shares coincides with the proxy guidelines set forth above for common stock increases.
• Management dividend payout proposals, except where we perceive company payouts to shareholders as inadequate.
2. We generally oppose the following (notwithstanding management support):
• Proposals to add classes of stock that would substantially dilute the voting interests of existing shareholders.
• Proposals to increase the authorized or issued number of shares of existing classes of stock that are unreasonably dilutive, particularly if there are no preemptive rights for existing shareholders. However, depending on market practices, we consider voting for proposals giving general authorization for issuance of shares not subject to pre-emptive rights if the authority is limited.
• Proposals that authorize share issuance at a discount to market rates, except where authority for such issuance is de minimis, or if there is a special situation that we believe justifies such authorization (as may be the case, for example, at a company under severe stress and risk of bankruptcy).
• Proposals relating to changes in capitalization by 100% or more.
We consider on a case-by-case basis shareholder proposals to increase dividend payout ratios, in light of market practice and perceived market weaknesses, as well as individual company payout history and current circumstances. For example, currently we perceive low payouts to shareholders as a concern at some Japanese companies, but may deem a low payout ratio as appropriate for a growth company making good use of its cash, notwithstanding the broader market concern.
F. Takeover Defenses and Shareholder Rights.
1. Shareholder rights plans: We generally support proposals to require shareholder approval or ratification of shareholder rights plans (poison pills). In voting on rights plans or similar takeover defenses, we consider on a case-by-case basis whether the company has demonstrated a need for the defense in the context of promoting long-term share value; whether provisions of the defense are in line with generally accepted governance principles in the market (and specifically the presence of an adequate qualified offer provision that would
A-5
exempt offers meeting certain conditions from the pill); and the specific context if the proposal is made in the midst of a takeover bid or contest for control.
2. Supermajority voting requirements: We generally oppose requirements for supermajority votes to amend the charter or bylaws, unless the provisions protect minority shareholders where there is a large shareholder. In line with this view, in the absence of a large shareholder we support reasonable shareholder proposals to limit such supermajority voting requirements.
3. Shareholder right to call a special meeting: We consider proposals to enhance a shareholder's right to call a special meeting on a case-by-case basis. At large-cap U.S. companies, we generally support efforts to establish the rights of holders of 10% or more of shares to call special meetings, unless the board or state law has a set policy or law establishing such rights at a threshold that we believe to be acceptable.
4. Written consent rights: In the U.S. context, we examine proposals for shareholder written consent rights on a case-by-case basis.
5. Reincorporation: We consider management and shareholder proposals to reincorporate to a different jurisdiction on a case-by-case basis. We oppose such proposals if we believe the main purpose is to take advantage of laws or judicial precedents that reduce shareholder rights.
6. Anti-greenmail provisions: Proposals relating to the adoption of anti-greenmail provisions will be supported, provided that the proposal: (i) defines greenmail; (ii) prohibits buyback offers to large block holders (holders of at least 1% of the outstanding shares and in certain cases, a greater amount) not made to all shareholders or not approved by disinterested shareholders; and (iii) contains no anti-takeover measures or other provisions restricting the rights of shareholders.
7. Bundled proposals: We may consider opposing or abstaining on proposals if disparate issues are "bundled" and presented for a single vote.
G. Auditors.
We generally support management proposals for selection or ratification of independent auditors. However, we may consider opposing such proposals with reference to incumbent audit firms if the company has suffered from serious accounting irregularities and we believe rotation of the audit firm is appropriate, or if fees paid to the auditor for non-audit-related services are excessive. Generally, to determine if non-audit fees are excessive, a 50% test will be applied (i.e., non-audit-related fees should be less than 50% of the total fees paid to the auditor). We generally vote against proposals to indemnify auditors.
H. Executive and Director Remuneration.
1. We generally support the following:
• Proposals for employee equity compensation plans and other employee ownership plans, provided that our research does not indicate that approval of the plan would be against shareholder interest. Such approval may be against shareholder interest if it authorizes excessive dilution and shareholder cost, particularly in the context of high usage ("run rate") of equity compensation in the recent past; or if there are objectionable plan design and provision.
• Proposals relating to fees to outside directors, provided the amounts are not excessive relative to other companies in the country or industry, and provided that the structure is appropriate within the market context. While stock-based compensation to outside directors is positive if moderate and appropriately structured, we are wary of significant stock option awards or other performance-based awards for outside directors, as well as provisions that could result in significant forfeiture of value on a director's decision to resign from a board (such forfeiture can undercut director independence).
• Proposals for employee stock purchase plans that permit discounts, but only for grants that are part of a broad-based employee plan, including all non-executive employees, and only if the discounts are limited to a reasonable market standard or less.
• Proposals for the establishment of employee retirement and severance plans, provided that our research does not indicate that approval of the plan would be against shareholder interest.
A-6
2. We generally oppose retirement plans and bonuses for non-executive directors and independent statutory auditors.
3. In the U.S. context, we generally vote against shareholder proposals requiring shareholder approval of all severance agreements, but proposals that require shareholder approval for agreements in excess of three times the annual compensation (salary and bonus) generally will be supported. We generally oppose shareholder proposals that would establish arbitrary caps on pay. We consider on a case-by-case basis shareholder proposals that seek to limit Supplemental Executive Retirement Plans (SERPs), but support such proposals where we consider SERPs to be excessive.
4. Shareholder proposals advocating stronger and/or particular pay-for-performance models will be evaluated on a case-by-case basis, with consideration of the merits of the individual proposal within the context of the particular company and its labor markets, and the company's current and past practices. While we generally support emphasis on long-term components of senior executive pay and strong linkage of pay to performance, we consider factors including whether a proposal may be overly prescriptive, and the impact of the proposal, if implemented as written, on recruitment and retention.
5. We generally support proposals advocating reasonable senior executive and director stock ownership guidelines and holding requirements for shares gained in executive equity compensation programs.
6. We generally support shareholder proposals for reasonable "claw-back" provisions that provide for company recovery of senior executive bonuses to the extent they were based on achieving financial benchmarks that were not actually met in light of subsequent restatements.
7. Management proposals effectively to re-price stock options are considered on a case-by-case basis. Considerations include the company's reasons and justifications for a re-pricing, the company's competitive position, whether senior executives and outside directors are excluded, potential cost to shareholders, whether the re-pricing or share exchange is on a value-for-value basis, and whether vesting requirements are extended.
8. Say-on-Pay: We consider proposals relating to an advisory vote on remuneration on a case-by-case basis. Considerations include a review of the relationship between executive remuneration and performance based on operating trends and total shareholder return over multiple performance periods. In addition, we review remuneration structures and potential poor pay practices, including relative magnitude of pay, discretionary bonus awards, tax gross ups, change-in-control features, internal pay equity and peer group construction. As long-term investors, we support remuneration policies that align with long-term shareholder returns.
I. Social, Political and Environmental Issues.
Shareholders in the U.S. and certain other markets submit proposals encouraging changes in company disclosure and practices related to particular corporate, social, political and environmental matters. We consider how to vote on the proposals on a case-by-case basis to determine likely impacts on shareholder value. We seek to balance concerns on reputational and other risks that lie behind a proposal against costs of implementation, while considering appropriate shareholder and management prerogatives. We may abstain from voting on proposals that do not have a readily determinable financial impact on shareholder value. We support proposals that, if implemented, would enhance useful disclosure, but we generally vote against proposals requesting reports that we believe are duplicative, related to matters not material to the business, or that would impose unnecessary or excessive costs. We believe that certain social and environmental shareholder proposals may intrude excessively on management prerogatives, which can lead us to oppose them.
J. Fund of Funds.
Certain Funds advised by an MSIM Affiliate invest only in other MSIM Funds. If an underlying fund has a shareholder meeting, in order to avoid any potential conflict of interest, such proposals will be voted in the same proportion as the votes of the other shareholders of the underlying fund, unless otherwise determined by the Proxy Review Committee.
III. ADMINISTRATION OF POLICY
The MSIM Proxy Review Committee (the "Committee") has overall responsibility for the Policy. The Committee, which is appointed by MSIM's Long-Only Executive Committee, consists of investment professionals who represent the different investment disciplines and geographic locations of the firm, and is chaired by the director
A-7
of the Corporate Governance Team ("CGT"). Because proxy voting is an investment responsibility and impacts shareholder value, and because of their knowledge of companies and markets, portfolio managers and other members of investment staff play a key role in proxy voting, although the Committee has final authority over proxy votes.
The CGT Director is responsible for identifying issues that require Committee deliberation or ratification. The CGT, working with advice of investment teams and the Committee, is responsible for voting on routine items and on matters that can be addressed in line with these Policy guidelines. The CGT has responsibility for voting case-by-case where guidelines and precedent provide adequate guidance.
The Committee will periodically review and have the authority to amend, as necessary, the Policy and establish and direct voting positions consistent with the Client Proxy Standard.
CGT and members of the Committee may take into account Research Providers' recommendations and research as well as any other relevant information they may request or receive, including portfolio manager and/or analyst comments and research, as applicable. Generally, proxies related to securities held in accounts that are managed pursuant to quantitative, index or index-like strategies ("Index Strategies") will be voted in the same manner as those held in actively managed accounts, unless economic interests of the accounts differ. Because accounts managed using Index Strategies are passively managed accounts, research from portfolio managers and/or analysts related to securities held in these accounts may not be available. If the affected securities are held only in accounts that are managed pursuant to Index Strategies, and the proxy relates to a matter that is not described in this Policy, the CGT will consider all available information from the Research Providers, and to the extent that the holdings are significant, from the portfolio managers and/or analysts.
A. Committee Procedures
The Committee meets at least quarterly and reviews and considers changes to the Policy at least annually. Through meetings and/or written communications, the Committee is responsible for monitoring and ratifying "split votes" (i.e., allowing certain shares of the same issuer that are the subject of the same proxy solicitation and held by one or more MSIM portfolios to be voted differently than other shares) and/or "override voting" (i.e., voting all MSIM portfolio shares in a manner contrary to the Policy). The Committee will review developing issues and approve upcoming votes, as appropriate, for matters as requested by CGT.
The Committee reserves the right to review voting decisions at any time and to make voting decisions as necessary to ensure the independence and integrity of the votes.
B. Material Conflicts of Interest
In addition to the procedures discussed above, if the CGT Director determines that an issue raises a material conflict of interest, the CGT Director may request a special committee to review, and recommend a course of action with respect to, the conflict(s) in question ("Special Committee").
A potential material conflict of interest could exist in the following situations, among others:
1. The issuer soliciting the vote is a client of MSIM or an affiliate of MSIM and the vote is on a matter that materially affects the issuer.
2. The proxy relates to Morgan Stanley common stock or any other security issued by Morgan Stanley or its affiliates except if echo voting is used, as with MSIM Funds, as described herein.
3. Morgan Stanley has a material pecuniary interest in the matter submitted for a vote (e.g., acting as a financial advisor to a party to a merger or acquisition for which Morgan Stanley will be paid a success fee if completed).
If the CGT Director determines that an issue raises a potential material conflict of interest, depending on the facts and circumstances, the issue will be addressed as follows:
1. If the matter relates to a topic that is discussed in this Policy, the proposal will be voted as per the Policy.
2. If the matter is not discussed in this Policy or the Policy indicates that the issue is to be decided case-by-case, the proposal will be voted in a manner consistent with the Research Providers, provided that all the Research Providers consulted have the same recommendation, no portfolio manager objects to that vote, and the vote is consistent with MSIM's Client Proxy Standard.
A-8
3. If the Research Providers' recommendations differ, the CGT Director will refer the matter to a Special Committee to vote on the proposal, as appropriate.
Any Special Committee shall be comprised of the CGT Director and at least two portfolio managers (preferably members of the Committee) as approved by the Committee. The CGT Director may request non-voting participation by MSIM's General Counsel or his/her designee and the Chief Compliance Officer or his/her designee. In addition to the research provided by Research Providers, the Special Committee may request analysis from MSIM Affiliate investment professionals and outside sources to the extent it deems appropriate.
C. Proxy Voting Reporting
The CGT will document in writing all Committee and Special Committee decisions and actions, which documentation will be maintained by the CGT for a period of at least six years. To the extent these decisions relate to a security held by an MSIM Fund, the CGT will report the decisions to each applicable Board of Trustees/Directors of those Funds at each Board's next regularly scheduled Board meeting. The report will contain information concerning decisions made during the most recently ended calendar quarter immediately preceding the Board meeting.
MSIM will promptly provide a copy of this Policy to any client requesting it. MSIM will also, upon client request, promptly provide a report indicating how each proxy was voted with respect to securities held in that client's account.
MSIM's Legal Department is responsible for filing an annual Form N-PX on behalf of each MSIM Fund for which such filing is required, indicating how all proxies were voted with respect to such Fund's holdings.
A-9
APPENDIX A
The following procedures apply to accounts managed by Morgan Stanley AIP GP LP and Private Investment Partners Inc. ("AIP").
Generally, AIP will follow the guidelines set forth in Section II of MSIM's Proxy Voting Policy and Procedures. To the extent that such guidelines do not provide specific direction, or AIP determines that consistent with the Client Proxy Standard, the guidelines should not be followed, the Proxy Review Committee has delegated the voting authority to vote securities held by accounts managed by AIP to the Fund of Hedge Funds investment team, the Private Equity Fund of Funds investment team or the Private Equity Real Estate Fund of Funds investment team of AIP. A summary of decisions made by the investment teams will be made available to the Proxy Review Committee for its information at the next scheduled meeting of the Proxy Review Committee.
In certain cases, AIP may determine to abstain from determining (or recommending) how a proxy should be voted (and therefore abstain from voting such proxy or recommending how such proxy should be voted), such as where the expected cost of giving due consideration to the proxy does not justify the potential benefits to the affected account(s) that might result from adopting or rejecting (as the case may be) the measure in question.
Waiver of Voting Rights
For regulatory reasons, AIP may either 1) invest in a class of securities of an underlying fund (the "Fund") that does not provide for voting rights; or 2) waive 100% of its voting rights with respect to the following:
1. Any rights with respect to the removal or replacement of a director, general partner, managing member or other person acting in a similar capacity for or on behalf of the Fund (each individually a "Designated Person," and collectively, the "Designated Persons"), which may include, but are not limited to, voting on the election or removal of a Designated Person in the event of such Designated Person's death, disability, insolvency, bankruptcy, incapacity, or other event requiring a vote of interest holders of the Fund to remove or replace a Designated Person; and
2. Any rights in connection with a determination to renew, dissolve, liquidate, or otherwise terminate or continue the Fund, which may include, but are not limited to, voting on the renewal, dissolution, liquidation, termination or continuance of the Fund upon the occurrence of an event described in the Fund's organizational documents; provided, however, that, if the Fund's organizational documents require the consent of the Fund's general partner or manager, as the case may be, for any such termination or continuation of the Fund to be effective, then AIP may exercise its voting rights with respect to such matter.
Approved by Morgan Stanley Funds Board on September 27-28, 2011
A-10

December 31, 2013
Supplement
SUPPLEMENT DATED DECEMBER 31, 2013 TO THE STATEMENT OF ADDITIONAL INFORMATION OF
Morgan Stanley Select Dimensions Investment Series, dated April 30, 2013
(the "Fund")
Effective January 1, 2014, the Board of Trustees of the Fund has approved changing the administrator of the Fund from Morgan Stanley Services Company Inc. to Morgan Stanley Investment Management Inc.
As a result, effective January 1, 2014, all references in the Fund's Statement of Additional Information ("SAI") to Morgan Stanley Services Company Inc., as administrator, are hereby deleted and replaced with Morgan Stanley Investment Management Inc.
PLEASE RETAIN THIS SUPPLEMENT FOR FUTURE REFERENCE.

October 11, 2013
Supplement
SUPPLEMENT DATED OCTOBER 11, 2013 TO THE STATEMENT OF ADDITIONAL INFORMATION OF
MORGAN STANLEY SELECT DIMENSIONS INVESTMENT SERIES
Dated April 30, 2013
The section of the Statement of Additional Information entitled "II. Description of the Fund and Its Investments and Risks—C. Investment Strategies and Risks—Repurchase Agreements" is hereby deleted and replaced with the following:
Repurchase Agreements. The Portfolios may invest in repurchase agreements. These agreements typically involve the acquisition by the Portfolios of debt securities from a selling financial institution (such as a bank or broker-dealer), coupled with an agreement that the institution will repurchase the underlying security, at a specified price and at a fixed time in the future (or on demand, if applicable). The underlying securities, which serve as collateral for the agreement, will be marked-to-market daily to determine that the value of the collateral, as specified in the agreement, does not decrease below the purchase price plus accrued interest. If such decrease occurs, additional collateral will be requested and, when received, will be added to the account to maintain full collateralization. The Portfolios will accrue interest from the institution until the time when the repurchase is to occur. Although this date is deemed by the Portfolio to be the maturity date of a repurchase agreement, the maturities of securities subject to repurchase agreements are not subject to any limits.
While repurchase agreements involve certain risks not associated with direct investments in debt securities, the Portfolios follow procedures approved by the Trustees that are designed to minimize such risks. These procedures include effecting repurchase transactions only with large, well-capitalized and well-established financial institutions whose financial condition will be continually monitored by the Adviser and/or Sub-Advisers. In addition, as described above, the value of the collateral underlying the repurchase agreement will be at least equal to the repurchase price which consists of the acquisition price paid to the seller of the securities plus the accrued resale premium, which is defined as the amount specified in the repurchase agreement or the daily amortization of the difference between the acquisition price and the resale price specified in the repurchase agreement. In the event of a default or bankruptcy by a selling financial institution, the Portfolios will seek to liquidate such collateral. However, the exercising of a Portfolio's right to liquidate such collateral could involve certain costs or delays and, to the extent that proceeds from any sale upon a default of the obligation to repurchase were less than the repurchase price, the Portfolios could suffer a loss. The Money Market Portfolio may invest in repurchase agreements backed by municipal securities and non-governmental collateral such as corporate debt obligations, convertible securities and common and preferred stock. Certain of these securities may be rated below investment grade. A Portfolio will not invest in repurchase agreements that do not mature within seven days if any such investment, together with any other illiquid assets held by that Portfolio, amounts to more than 5% of its net assets in the Money Market Portfolio, and 15% of its net assets in the case of each of the other Portfolios. A Portfolio's investments in repurchase agreements may at times be substantial when, in the view of the Portfolio's Adviser and/or Sub-Advisers, liquidity or other conditions warrant.
PLEASE RETAIN THIS SUPPLEMENT FOR FUTURE REFERENCE.

August 30, 2013
Supplement
SUPPLEMENT DATED AUGUST 30, 2013 TO THE STATEMENT OF ADDITIONAL INFORMATION OF
MORGAN STANLEY SELECT DIMENSIONS INVESTMENT SERIES
(the "Fund")
Dated April 30, 2013
Effective September 1, 2013, John Gernon will replace Arthur Lev as President and Principal Executive Officer of the Fund. As a result, effective September 1, 2013, the following information hereby replaces in its entirety the biographical information for Mr. Lev contained in the Fund's Statement of Additional Information:
Name, Age and
Address of
Executive Officer | | Position(s)
Held with
Registrant | | Length
of Time
Served* | | Principal Occupation(s) During Past 5 Years | |
John Gernon (50)
522 Fifth Avenue
New York, NY 10036 | | President and Principal Executive Officer—Equity, Fixed Income and AIP Funds | | Since September 2013 | | President and Principal Executive Officer of the Equity and Fixed Income Funds and the Morgan Stanley AIP Funds (since September 2013) in the Fund Complex. Managing Director of the Adviser. | |
* Each officer serves an indefinite term, until his or her successor is elected.
PLEASE RETAIN THIS SUPPLEMENT FOR FUTURE REFERENCE.

SUPPLEMENT DATED JUNE 28, 2013 TO THE STATEMENTS OF ADDITIONAL INFORMATION OF
Active Assets California Tax-Free Trust, dated October 31, 2012
Active Assets Government Securities Trust, dated October 31, 2012
Active Assets Institutional Government Securities Trust, dated October 31, 2012
Active Assets Institutional Money Trust, dated October 31, 2012
Active Assets Money Trust, dated October 31, 2012
Active Assets Tax-Free Trust, dated October 31, 2012
Morgan Stanley California Tax-Free Daily Income Trust, dated April 30, 2013
Morgan Stanley European Equity Fund Inc., dated February 28, 2013
Morgan Stanley Focus Growth Fund, Classes A, B, L and I, dated April 30, 2013
Morgan Stanley Focus Growth Fund, Class IS, dated June 13, 2013
Morgan Stanley Global Fixed Income Opportunities Fund, Classes A, B, L and I, dated February 28, 2013
Morgan Stanley Global Fixed Income Opportunities Fund, Class IS, dated June 13, 2013
Morgan Stanley Global Infrastructure Fund, Classes A, B, L and I, dated April 30, 2013
Morgan Stanley Global Infrastructure Fund, Class Q, dated April 30, 2013
Morgan Stanley Limited Duration U.S. Government Trust, dated May 14, 2013
Morgan Stanley Mortgage Securities Trust, dated February 28, 2013
Morgan Stanley Multi Cap Growth Trust, Classes A, B, L and I, dated March 29, 2013
Morgan Stanley Multi Cap Growth Trust, Class IS, dated June 13, 2013
Morgan Stanley New York Municipal Money Market Trust, dated April 30, 2013
Morgan Stanley Select Dimensions Investment Series, dated April 30 2013
Morgan Stanley Tax-Free Daily Income Trust, dated April 30, 2013
Morgan Stanley U.S. Government Money Market Trust, dated May 31, 2013
Morgan Stanley U.S. Government Securities Trust, dated April 30, 2013
Morgan Stanley Variable Investment Series, dated April 30, 2013
(collectively, the "Funds")
Effective July 1, 2013, the Board of Directors/Trustees of each Fund has approved changing the transfer agent of each Fund from Morgan Stanley Services Company Inc. to Boston Financial Data Services, Inc.
As a result, effective July 1, 2013, all references in each Fund's Statement of Additional Information ("SAI") to Morgan Stanley Services Company Inc., as transfer agent, are hereby deleted and replaced with Boston Financial Data Services, Inc.
***
The first sentence of the section of each Fund's SAI entitled "V. Investment Advisory and Other Services—E. Other Service Providers—(1) Transfer Agent/Dividend Disbursing Agent" is hereby deleted and replaced with the following:
Boston Financial Data Services, Inc., 2000 Crown Colony Drive, Quincy, Massachusetts 02169-0953, is the Transfer Agent for the Fund's shares and the Dividend Disbursing Agent for payment of dividends and distributions on Fund shares.
PLEASE RETAIN THIS SUPPLEMENT FOR FUTURE REFERENCE.

SUPPLEMENT DATED MAY 31, 2013 TO THE STATEMENT OF ADDITIONAL INFORMATION OF
MORGAN STANLEY SELECT DIMENSIONS INVESTMENT SERIES
(the "Fund")
Dated April 30, 2013
Fundamental investment restriction 2 under the section of the Statement of Additional Information entitled "II. Description of the Fund and Its Investments and Risks—D. Fund Policies/Investment Restrictions" is hereby deleted and replaced with the following:
2. With the exception of the Global Infrastructure Portfolio, which will invest 25% or more of the value of its total assets in the infrastructure industry, invest 25% or more of the value of its total assets in securities of issuers in any one industry. This restriction does not apply to obligations issued or guaranteed by the U.S. Government or its agencies or instrumentalities or, in the case of the Money Market Portfolio, to domestic bank obligations.
STATEMENT OF ADDITIONAL INFORMATION
Morgan Stanley
Select Dimensions
Investment
Series
April 30, 2013
Portfolios
Money Market Portfolio
Flexible Income Portfolio
Global Infrastructure Portfolio
Growth Portfolio
Focus Growth Portfolio
Multi Cap Growth Portfolio
Mid Cap Growth Portfolio
This Statement of Additional Information ("SAI") for Morgan Stanley Select Dimensions Investment Series (the "Fund") is not a prospectus. The Fund's Class X Prospectus and the Fund's Class Y Prospectus (each dated April 30, 2013) for each portfolio listed above, provide the basic information you should know before allocating your investment under your variable annuity contract or your variable life contract. Prospectuses may be obtained without charge from the Fund at its address or telephone number listed below.
The Fund's audited financial statements for the fiscal year ended December 31, 2012, including notes thereto, and the report of the Fund's independent registered public accounting firm, are herein incorporated by reference to the Fund's Annual Report to Shareholders. A copy of the Fund's Annual Report to Shareholders must accompany the delivery of this SAI.
Morgan Stanley
Select Dimensions Investment Series
522 Fifth Avenue
New York, NY 10036
(800) 869-NEWS
TABLE OF CONTENTS
I. | | Fund History | | | 4 | | |
II. | | Description of the Fund and Its Investments and Risks | | | 4 | | |
| | | | | A. Classification | | | 4 | | |
| | | | | B. Eligible Purchasers | | | 4 | | |
| | | | | C. Investment Strategies and Risks | | | 4 | | |
| | | | | D. Fund Policies/Investment Restrictions | | | 29 | | |
| | | | | E. Disclosure of Portfolio Holdings | | | 31 | | |
III. | | Management of the Fund | | | 33 | | |
| | | | | A. Board of Trustees | | | 33 | | |
| | | | | B. Management Information | | | 34 | | |
| | | | | C. Compensation | | | 43 | | |
IV. | | Control Persons and Principal Holders of Securities | | | 45 | | |
V. | | Investment Advisory and Other Services | | | 45 | | |
| | | | | A. Adviser, Sub-Advisers and Administrator | | | 45 | | |
| | | | | B. Principal Underwriter | | | 48 | | |
| | | | | C. Services Provided by the Adviser, Sub-Advisers and Administrator | | | 48 | | |
| | | | | D. Rule 12b-1 Plan | | | 49 | | |
| | | | | E. Other Service Providers | | | 50 | | |
| | | | | F. Fund Management | | | 51 | | |
| | | | | G. Codes of Ethics | | | 54 | | |
| | | | | H. Proxy Voting Policy and Proxy Voting Record | | | 54 | | |
| | | | | I. Revenue Sharing | | | 54 | | |
VI. | | Brokerage Allocation and Other Practices | | | 54 | | |
| | | | | A. Brokerage Transactions | | | 54 | | |
| | | | | B. Commissions | | | 55 | | |
| | | | | C. Brokerage Selection | | | 56 | | |
| | | | | D. Regular Broker-Dealers | | | 58 | | |
VII. | | Capital Stock and Other Securities | | | 58 | | |
VIII. | | Purchase, Redemption and Pricing of Shares | | | 60 | | |
| | | | | A. Purchase/Redemption of Shares | | | 60 | | |
| | | | | B. Offering Price | | | 60 | | |
IX. | | Taxation of the Portfolios and Shareholders | | | 63 | | |
X. | | Underwriters | | | 65 | | |
XI. | | Performance Data | | | 65 | | |
XII. | | Financial Statements | | | 67 | | |
XIII. | | Fund Counsel | | | 67 | | |
| | | Appendix A — Morgan Stanley Investment Management Proxy Voting Policy and Procedures | | | A-1 | | |
| | | Appendix B — Description of Ratings | | | B-1 | | |
2
Glossary of Selected Defined Terms
The terms defined in this glossary are frequently used in this SAI (other terms used occasionally are defined in the text of the document).
"Administrator" or "Morgan Stanley Services" — Morgan Stanley Services Company Inc., a wholly-owned fund services subsidiary of the Adviser.
"Adviser" — Morgan Stanley Investment Management Inc., a wholly-owned investment adviser subsidiary of Morgan Stanley.
"Contract" — Variable annuity contract and/or variable life insurance contract issued by Hartford Life Insurance Company and Hartford Life and Annuity Insurance Company.
"Contract Owners" — Owners of a Contract.
"Custodian" — State Street Bank and Trust Company.
"Distributor" — Morgan Stanley Distribution, Inc., a wholly-owned broker-dealer subsidiary of Morgan Stanley.
"Financial Advisors" — Morgan Stanley authorized financial services representatives.
"Fund" — Morgan Stanley Select Dimensions Investment Series, a registered open-end series investment company currently consisting of seven Portfolios.
"Independent Trustees" — Trustees who are not "interested persons" (as defined in the Investment Company Act of 1940, as amended ("Investment Company Act")) of the Fund.
"Morgan Stanley & Co." — Morgan Stanley & Co. LLC, a wholly-owned broker-dealer subsidiary of Morgan Stanley.
"Morgan Stanley Funds" — Registered investment companies for which the Adviser serves as the investment adviser and that hold themselves out to investors as related companies for investment and investor services.
"Portfolio(s)" — The separate investment portfolio(s) of the Fund.
"Sub-Advisers" — Morgan Stanley Investment Management Limited and Morgan Stanley Investment Management Company, each a wholly-owned subsidiary of Morgan Stanley (only applicable to the Global Infrastructure Portfolio).
"Transfer Agent" — Morgan Stanley Services Company Inc., a wholly-owned transfer agent subsidiary of Morgan Stanley.
"Trustees" — The Board of Trustees of the Fund.
3
I. FUND HISTORY
The Fund was organized as a Massachusetts business trust, under a Declaration of Trust, on June 2, 1994 with the name Dean Witter Select Dimensions Investment Series. Effective June 22, 1998, the Fund's name was changed to Morgan Stanley Dean Witter Select Dimensions Investment Series. Effective March 2, 1998, the name of the Core Equity Portfolio was changed to the Growth Portfolio. Effective April 26, 1999, the name of the American Value Portfolio was changed to the American Opportunities Portfolio. Effective June 18, 2001, the Fund's name was changed to Morgan Stanley Select Dimensions Investment Series. Effective May 1, 2002, the name of the Mid-Cap Equity Portfolio was changed to the Capital Opportunities Portfolio. Effective May 1, 2003, the name of the Diversified Income Portfolio was changed to the Flexible Income Portfolio. Effective July 3, 2006, the name of the American Opportunities Portfolio was changed to the Focus Growth Portfolio. Effective May 1, 2008, the name of the Developing Growth Portfolio was changed to the Mid Cap Growth Portfolio and the name of the Growth Portfolio was changed to the Capital Growth Portfolio. Effective November 3, 2008, the name of the Utilities Portfolio was changed to the Global Infrastructure Portfolio. Effective April 29, 2011, the name of the Capital Opportunities Portfolio was changed to the Multi Cap Growth Portfolio and the name of the Capital Growth Portfolio was changed to the Growth Portfolio.
II. DESCRIPTION OF THE FUND AND ITS INVESTMENTS AND RISKS
A. Classification
The Fund is an open-end management investment company which currently offers shares of seven separate portfolios (each a "Portfolio" and, collectively, the "Portfolios"). Each Portfolio (except the Focus Growth Portfolio) is "diversified" as defined in the Investment Company Act. The Focus Growth Portfolio is "non-diversified" and, as such, the Portfolio's investments are not required to meet certain diversification requirements under federal securities law. Compared with "diversified" funds, the Focus Growth Portfolio may invest a greater percentage of its assets in the securities of an individual corporation or governmental entity. Thus, the Focus Growth Portfolio's assets may be concentrated in fewer securities than other funds. A decline in the value of those investments would cause the Focus Growth Portfolio's overall value to decline to a greater degree.
B. Eligible Purchasers
As discussed in each of the Class X and Class Y Prospectuses, shares of the Portfolios are sold only to particular insurance companies in connection with variable annuity and/or variable life insurance contracts they issue. It is conceivable that in the future it may become disadvantageous for both variable life insurance and variable annuity contract separate accounts to invest in the same underlying funds. Although neither the various insurance companies nor the Fund currently foresee any such disadvantage, the Trustees intend to monitor events in order to identify any material irreconcilable conflict between the interest of variable annuity contract owners and variable life insurance contract owners and to determine what action, if any, should be taken in response thereto.
C. Investment Strategies and Risks
The following discussion of each Portfolio's investment strategies and risks should be read with the sections of the Class X and Class Y Prospectuses titled "Principal Investment Strategies," "Principal Risks" and "Additional Information about the Portfolio's Investment Objectives, Strategies and Risks." For purposes of this section, references to the Adviser, when used in connection with its activities as investment adviser to the sub-advised Portfolios, include any Sub-Advisers acting under the Adviser's supervision, as applicable.
Convertible Securities. Each Portfolio, other than the Money Market Portfolio, may invest in securities which are convertible into common stock or other securities of the same or a different issuer or into cash within a particular period of time at a specified price or formula ("convertible securities"). Convertible securities are generally fixed-income securities (that may include preferred stock) and generally rank senior to common stocks in a corporation's capital structure and, therefore, entail less risk than the corporation's common stock. The value of a convertible security is a function of its "investment value" (its value as if it did not have a conversion privilege), and its "conversion value" (the security's worth if it were to be exchanged for the underlying security, at market value, pursuant to its conversion privilege).
4
To the extent that a convertible security's investment value is greater than its conversion value, its price will be primarily a reflection of such investment value and its price will be likely to increase when interest rates fall and to decrease when interest rates rise, as with a fixed-income security (the credit standing of the issuer and other factors may also have an effect on the convertible security's value). If the conversion value exceeds the investment value, the price of the convertible security will rise above its investment value and, in addition, will sell at some premium over its conversion value. (This premium represents the price investors are willing to pay for the privilege of purchasing a fixed-income security with a possibility of capital appreciation due to the conversion privilege.) At such times, the price of the convertible security will tend to fluctuate directly with the price of the underlying equity security. Convertible securities may be purchased by a Portfolio at varying price levels above their investment values and/or their conversion values in keeping with the Portfolio's investment objective(s).
With respect to each Portfolio other than the Money Market Portfolio and the Flexible Income Portfolio, up to 5% of the Portfolio's net assets may be invested in convertible securities that are rated below investment grade. Debt securities rated below investment grade are commonly known as "junk bonds." Although the Portfolio selects these securities primarily on the basis of their equity characteristics, investors should be aware that convertible securities rated in these categories are considered high risk securities; the rating agencies consider them speculative with respect to the issuer's continuing ability to make timely payments of interest and principal. Thus, to the extent that such convertible securities are acquired by the Portfolio, there is a greater risk as to the timely repayment of the principal of, and timely payment of interest or dividends on, such securities than in the case of higher-rated convertible securities.
IPOs. The Portfolios may purchase equity securities issued as part of, or a short period after, a company's initial public offering ("IPOs"), and may at times dispose of those securities shortly after their acquisition. A Portfolio's purchase of securities issued in IPOs exposes it to the risks associated with companies that have little operating history as public companies, as well as to the risks inherent in those sectors of the market where these issuers operate. The market for IPO issuers has been volatile, and share prices of newly-public companies have fluctuated significantly over short periods of time.
Foreign Investment. The Portfolios may invest in foreign securities. Investing in foreign securities involves certain special considerations which are not typically associated with investments in the securities of U.S. issuers. Foreign issuers are not generally subject to uniform accounting, auditing and financial reporting standards and may have policies that are not comparable to those of domestic issuers. As a result, there may be less information available about foreign issuers than about domestic issuers. Securities of some foreign issuers may be less liquid and more volatile than securities of comparable domestic issuers. There is generally less government supervision and regulation of stock exchanges, brokers and listed issuers than in the United States. In addition, with respect to certain foreign countries, there is a possibility of expropriation or confiscatory taxation, political and social instability, or diplomatic development which could affect U.S. investments in those countries. The costs of investing in foreign countries frequently are higher than the costs of investing in the United States. Although the Adviser and Sub-Advisers endeavor to achieve the most favorable execution costs in portfolio transactions, fixed commissions on many foreign stock exchanges are generally higher than negotiated commissions on U.S. exchanges. In addition, investments in certain foreign markets which have historically been considered stable may become more volatile and subject to increased risk due to ongoing developments and changing conditions in such markets. Moreover, the growing interconnectivity of global economies and financial markets has increased the probability that adverse developments and conditions in one country or region will affect the stability of economies and financial markets in other countries or regions.
Investments in securities of foreign issuers may be denominated in foreign currencies. Accordingly, the value of a Portfolio's assets, as measured in U.S. dollars may be affected favorably or unfavorably by changes in currency exchange rates and in exchange control regulations. The Portfolios may incur costs in connection with conversions between various currencies.
Certain foreign governments levy withholding or other taxes on dividend and interest income. Although in some countries a portion of these taxes are recoverable, the non-recovered portion of foreign withholding taxes will reduce the income received from investments in such countries.
The Adviser and/or Sub-Advisers may consider an issuer to be from a particular country (including the United States) or geographic region if (i) its principal securities trading market is in that country or
5
geographic region; (ii) alone or on a consolidated basis it derives 50% or more of its annual revenue from goods produced, sales made or services performed in that country or geographic region; or (iii) it is organized under the laws of, or has a principal office in, that country or geographic region. By applying these tests, it is possible that a particular issuer could be deemed to be from more than one country or geographic region.
Emerging Market Securities. Each Portfolio, except the Money Market Portfolio, may invest in emerging market securities. An emerging market security is one issued by a foreign government or private issuer that has one or more of the following characteristics: (i) its principal securities trading market is in an emerging market or developing country, (ii) alone or on a consolidated basis it derives 50% or more of its annual revenue from goods produced, sales made or services performed in emerging markets, or (iii) it is organized under the laws of, or has a principal office in, an emerging market or developing country. Based on these criteria it is possible for a security to be considered issued by an issuer in more than one country. Therefore, it is possible for the securities of any issuer that has one or more of these characteristics in connection with any emerging market or developing country not to be considered an emerging market security if it has one or more of these characteristics in connection with a developed country.
Emerging market describes any country which is generally considered to be an emerging or developing country by major organizations in the international financial community, such as the International Bank for Reconstruction and Development (more commonly known as the World Bank) and the International Finance Corporation. Emerging markets can include every nation in the world except the United States, Canada, Japan, Australia, New Zealand and most nations located in Western Europe.
The economies of individual emerging market or developing countries may differ favorably or unfavorably from the U.S. economy in such respects as growth of gross domestic product, rate of inflation or deflation, currency depreciation, capital reinvestment, resource self-sufficiency and balance of payments position. Further, the economies of developing countries generally are heavily dependent upon international trade and, accordingly, have been, and may continue to be, adversely affected by trade barriers, exchange controls, managed adjustments in relative currency values and other protectionist measures. These economies also have been, and may continue to be, adversely effected by economic conditions in the countries with which they trade.
Prior governmental approval for foreign investments may be required under certain circumstances in some emerging market or developing countries, and the extent of foreign investment in certain fixed-income securities and domestic companies may be subject to limitation in other emerging market or developing countries. Foreign ownership limitations also may be imposed by the charters of individual companies in emerging market or developing countries to prevent, among other concerns, violation of foreign investment limitations. Repatriation of investment income, capital and the proceeds of sales by foreign investors may require governmental registration and/or approval in some emerging market or developing countries. The Fund could be adversely affected by delays in, or a refusal to grant, any required governmental registration or approval for such repatriation. Any investment subject to such repatriation controls will be considered illiquid if it appears reasonably likely that this process will take more than seven days.
Investment in emerging market or developing countries may entail purchasing securities issued by or on behalf of entities that are insolvent, bankrupt, in default or otherwise engaged in an attempt to reorganize or reschedule their obligations and in entities that have little or no proven credit rating or credit history. In any such case, the issuer's poor or deteriorating financial condition may increase the likelihood that a Portfolio will experience losses or diminution in available gains due to bankruptcy, insolvency or fraud. Emerging market or developing countries also pose the risk of nationalization, expropriation or confiscatory taxation, political changes, government regulation, social instability or diplomatic development (including war) that could affect adversely the economies of such countries or the value of a Portfolio's investments in those countries. In addition, it may be difficult to obtain and enforce a judgment in a court outside the United States.
Investments in emerging markets may also be exposed to an extra degree of custodial and/or market risk, especially where the securities purchased are not traded on an official exchange or where ownership records regarding the securities are maintained by an unregulated entity (or even the issuer itself).
Floating and Variable Rate Obligations. Certain Portfolios may purchase floating and variable rate obligations, including floating and variable rate municipal obligations. The value of these obligations
6
is generally more stable than that of a fixed rate obligation in response to changes in interest rate levels. Subject to the conditions for using amortized cost valuation under the Investment Company Act, a Portfolio may consider the maturity of a variable or floating rate obligation to be shorter than its ultimate stated maturity if the obligation is a U.S. Treasury Obligation or U.S. Government Security, if the obligation has a remaining maturity of 397 calendar days or less, or if the obligation has a demand feature that permits the Portfolio to receive payment at any time or at specified intervals not exceeding 397 calendar days. The issuers or financial intermediaries providing demand features may support their ability to purchase the obligations by obtaining credit with liquidity supports. These may include lines of credit, which are conditional commitments to lend, and letters of credit, which will ordinarily be irrevocable, both of which may be issued by domestic banks or foreign banks which have a branch, agency or subsidiary in the United States. A Portfolio may purchase variable or floating rate obligations from the issuers or may purchase certificates of participation, a type of floating or variable rate obligation, which are interests in a pool of debt obligations held by a bank or other financial institution. Certain of these obligations may be in the form of preferred shares of registered closed-end investment companies.
Brady Bonds. Brady Bonds are both emerging market securities and foreign fixed-income securities. They are created by exchanging existing commercial bank loans to foreign entities for new obligations for the purpose of restructuring the issuers' debts under a plan introduced by former U.S. Secretary of the Treasury, Nicholas F. Brady (the Brady Plan). They may be collateralized or uncollateralized and issued in various currencies (although most are dollar-denominated). They are actively traded in the over-the-counter secondary market. The Portfolios will only invest in Brady Bonds consistent with quality specifications.
Dollar-denominated, collateralized Brady Bonds may be fixed rate par bonds or floating rate discount bonds. These Brady Bonds are generally collateralized in full as to principal due at maturity by U.S. Treasury Zero Coupon Obligations having the same maturity as the Brady Bonds. Interest payments on these Brady Bonds generally are collateralized by cash or securities in an amount that, in the case of fixed rate bonds, is equal to at least one year of rolling interest payments or, in the case of floating rate bonds, initially is equal to at least one year's rolling interest payments based on the applicable interest rate at that time and is adjusted at regular intervals thereafter. Certain Brady Bonds are entitled to "value recovery payments" in certain circumstances, which in effect constitute supplemental interest payments but generally are not collateralized.
Brady Bonds are often viewed as having three or four valuation components: (i) the collateralized repayment of principal at final maturity; (ii) the collateralized interest payments; (iii) the uncollateralized interest payments; and (iv) any uncollateralized repayment of principal at maturity (these uncollateralized amounts constitute the "residual risk"). In the event of a default with respect to collateralized Brady Bonds as a result of which the payment obligations of the issuer are accelerated, the U.S. Treasury Zero Coupon Obligations held as collateral for the payment of principal will not be distributed to investors, nor will such obligations be sold and the proceeds distributed. The collateral will be held by the collateral agent to the scheduled maturity of the defaulted Brady Bonds, which will continue to be outstanding, at which time the face amount of the collateral will equal the principal payments due on the Brady Bonds in the normal course. However, Brady Bonds should be viewed as speculative in light of the history of default with respect to commercial bank loans by public and private entities of countries issuing Brady Bonds.
Sovereign Debt. Debt obligations known as "sovereign debt" are obligations of governmental issuers in emerging market or developing countries and industrialized countries. Certain emerging market or developing countries are among the largest debtors to commercial banks and foreign governments. The issuer or governmental authority that controls the repayment of sovereign debt may not be willing or able to repay the principal and/or pay interest when due in accordance with the terms of such obligations.
A governmental entity's willingness or ability to repay principal and pay interest due in a timely manner may be affected by, among other factors, its cash flow situation, the extent of its foreign reserves, the availability of sufficient foreign exchange on the date a payment is due, the relative size of the debt service burden to the economy as a whole, the government's dependence on expected disbursements from third-parties, the government's policy toward the International Monetary Fund and the political constraints to which a government may be subject. Governmental entities may also be dependent on expected disbursements from foreign governments, multilateral agencies and others abroad to reduce
7
principal and interest arrearages on their debt. The commitment on the part of these governments, agencies and others to make such disbursements may be conditioned on a debtor's implementation of economic reforms or economic performance and the timely service of such debtor's obligations. Failure to implement such reforms, achieve such levels of economic performance or repay principal or interest when due may result in the cancellation of such third-parties' commitments to lend funds to the government debtor, which may further impair such debtor's ability or willingness to timely service its debts. Holders of sovereign debt may be requested to participate in the rescheduling of such debt and to extend further loans to governmental entities. In addition, no assurance can be given that the holders of commercial bank debt will not contest payments to the holders of other foreign government debt obligations in the event of default under their commercial bank loan agreements. The issuers of the government debt securities in which a Portfolio may invest have in the past experienced substantial difficulties in servicing their external debt obligations, which led to defaults on certain obligations and the restructuring of certain indebtedness. Restructuring arrangements have included, among other things, reducing and rescheduling interest and principal payments by negotiating new or amended credit agreements or converting outstanding principal and unpaid interest to Brady Bonds, and obtaining new credit to finance interest payments. There can be no assurance that the Brady Bonds and other foreign government debt securities in which a Portfolio may invest will not be subject to similar restructuring arrangements or to requests for new credit, which may adversely affect the Portfolio's holdings. Furthermore, certain participants in the secondary market for such debt may be directly involved in negotiating the terms of these arrangements and may therefore have access to information not available to other market participants.
Depositary Receipts. Each Portfolio, except the Money Market Portfolio, may invest in depositary receipts. Depositary receipts represent an ownership interest in securities of foreign companies (an "underlying issuer") that are deposited with a depositary. Depositary receipts are not necessarily denominated in the same currency as the underlying securities. Depositary receipts include American Depositary Receipts ("ADRs"), Global Depositary Receipts ("GDRs") and other types of Depositary Receipts (which, together with ADRs and GDRs, are hereinafter collectively referred to as "Depositary Receipts"). ADRs are dollar-denominated Depositary Receipts typically issued by a U.S. financial institution which evidence an ownership interest in a security or pool of securities issued by a foreign issuer. ADRs are listed and traded in the United States. GDRs and other types of Depositary Receipts are typically issued by foreign banks or trust companies, although they also may be issued by U.S. financial institutions, and evidence ownership interests in a security or pool of securities issued by either a foreign or a U.S. corporation. Generally, Depositary Receipts in registered form are designed for use in the U.S. securities market and Depositary Receipts in bearer form are designed for use in securities markets outside the United States.
Depositary Receipts may be "sponsored" or "unsponsored." Sponsored Depositary Receipts are established jointly by a depositary and the underlying issuer, whereas unsponsored Depositary Receipts may be established by a depositary without participation by the underlying issuer. Holders of unsponsored Depositary Receipts generally bear all the costs associated with establishing unsponsored Depositary Receipts. In addition, the issuers of the securities underlying unsponsored Depositary Receipts are not obligated to disclose material information in the United States and, therefore, there may be less information available regarding such issuers and there may not be a correlation between such information and the market value of the Depositary Receipts. For purposes of the Portfolio's investment policies, the Portfolio's investments in Depositary Receipts will be deemed to be an investment in the underlying securities, except that ADRs may be deemed to be issued by a U.S. issuer.
Derivatives. Certain Portfolios may, but are not required to, use various derivatives and related investment strategies as described below. Derivatives may be used for a variety of purposes including hedging, risk management, portfolio management or to earn income. Any or all of the investment techniques described herein may be used at any time and there is no particular strategy that dictates the use of one technique rather than another, as the use of any derivative by a Portfolio is a function of numerous variables, including market conditions. The Portfolios comply with applicable regulatory requirements when using derivatives, including the segregation or earmarking of cash or liquid assets when mandated by U.S. Securities and Exchange Commission ("SEC") rules or SEC staff positions. Although the Adviser and/or Sub-Advisers seek to use derivatives to further a Portfolio's investment objective(s), no assurance can be given that the use of derivatives will achieve this result.
8
General Risks of Derivatives.
Derivatives utilized by the Portfolios may involve the purchase and sale of derivative instruments. A derivative is a financial instrument the value of which depends upon (or derives from) the value of another asset, security, interest rate or index. Derivatives may relate to a wide variety of underlying instruments, including equity and debt securities, indices, interest rates, currencies and other assets. Certain derivative instruments which the Portfolios may use and the risks of those instruments are described in further detail below. A Portfolio may in the future also utilize derivatives techniques, instruments and strategies that may be newly developed or permitted as a result of regulatory changes, consistent with the Portfolio's investment objective and policies. Such newly developed techniques, instruments and strategies may involve risks different than or in addition to those described herein. No assurance can be given that any derivatives strategy employed by a Portfolio will be successful.
The risks associated with the use of derivatives are different from, and possibly greater than, the risks associated with investing directly in the instruments underlying such derivatives. Derivatives are highly specialized instruments that require investment techniques and risk analyses different from other portfolio investments. The use of derivative instruments requires an understanding not only of the underlying instrument but also of the derivative itself. Certain risk factors generally applicable to derivative transactions are described below.
• Derivatives are subject to the risk that the market value of the derivative itself or the market value of underlying instruments will change in a way adverse to a Portfolio's interests. The Portfolio bears the risk that the Adviser and/or Sub-Advisers may incorrectly forecast future market trends and other financial or economic factors or the value of the underlying security, index, interest rate or currency when establishing a derivatives position for the Portfolio.
• Derivatives may be subject to pricing risk, which exists when a derivative becomes extraordinarily expensive (or inexpensive) relative to historical prices or corresponding instruments. Under such market conditions, it may not be economically feasible to initiate a transaction or liquidate a position at an advantageous time or price.
• Many derivatives are complex and often valued subjectively. Improper valuations can result in increased payment requirements to counterparties or a loss of value to the Portfolio.
• Using derivatives as a hedge against a portfolio investment subjects the Portfolio to the risk that the derivative will have imperfect correlation with the portfolio investment, which could result in the Portfolio incurring substantial losses. This correlation risk may be greater in the case of derivatives based on an index or other basket of securities, as the portfolio securities being hedged may not duplicate the components of the underlying index or the basket may not be of exactly the same type of obligation as those underlying the derivative. The use of derivatives for "cross hedging" purposes (using a derivative based on one instrument as a hedge for a different instrument) may also involve greater correlation risks.
• While using derivatives for hedging purposes can reduce the Portfolio's risk of loss, it may also limit the Portfolio's opportunity for gains or result in losses by offsetting or limiting the Portfolio's ability to participate in favorable price movements in portfolio investments.
• Derivatives transactions for non-hedging purposes involve greater risks and may result in losses which would not be offset by increases in the value of portfolio securities or declines in the cost of securities to be acquired. In the event that the Portfolio enters into a derivatives transaction as an alternative to purchasing or selling the underlying instrument or in order to obtain desired exposure to an index or market, the Portfolio will be exposed to the same risks as are incurred in purchasing or selling the underlying instruments directly as well as additional risks associated with derivatives transactions.
• The use of certain derivatives transactions involves the risk of loss resulting from the insolvency or bankruptcy of the counterparty to the contract or the failure by the counterparty to make required payments or otherwise comply with the terms of the contract. In the event of default by a counterparty, the Portfolio may have contractual remedies pursuant to the agreements related to the transaction.
9
• Liquidity risk exists when a particular derivative is difficult to purchase or sell. If a derivative transaction is particularly large or if the relevant market is illiquid, the Portfolio may be unable to initiate a transaction or liquidate a position at an advantageous time or price.
• Certain derivatives transactions are not entered into or traded on exchanges or in markets regulated by the U.S. Commodity Futures Trading Commission ("CFTC") or the SEC. Instead, such bi-lateral over-the-counter ("OTC") derivatives are entered into directly by a Portfolio and a counterparty and may be traded only through financial institutions acting as market makers. OTC derivatives transactions can only be entered into with a willing counterparty that is approved by the Adviser and/or Sub-Advisers in accordance with guidelines established by the Board. Where no such counterparty is available, the Portfolio will be unable to enter into a desired OTC transaction. There also may be greater risk that no liquid secondary market in the trading of OTC derivatives will exist, in which case the Portfolio may be required to hold such instruments until exercise, expiration or maturity. Many of the protections afforded to exchange participants are not available to participants in bi-lateral OTC derivatives transactions. Bi-lateral OTC derivatives transactions are not subject to the guarantee of an exchange or clearinghouse, and as a result, the Portfolio would bear greater risk of default by the counterparties to such transactions.
• The Portfolio may be required to make physical delivery of portfolio securities underlying a derivative in order to close out a derivatives position or to sell portfolio securities at a time or price at which it may be disadvantageous to do so in order to obtain cash to close out or to maintain a derivatives position.
• As a result of the structure of certain derivatives, adverse changes in the value of the underlying instrument can result in losses substantially greater than the amount invested in the derivative itself. Certain derivatives have the potential for unlimited loss, regardless of the size of the initial investment.
• Certain derivatives may be considered illiquid and therefore subject to the Portfolio's limitation on investments in illiquid securities.
• Derivatives transactions conducted outside the United States may not be conducted in the same manner as those entered into on U.S. exchanges, and may be subject to different margin, exercise, settlement or expiration procedures. Brokerage commissions, clearing costs and other transaction costs may be higher on foreign exchanges. Many of the risks of OTC derivatives transactions are also applicable to derivatives transactions conducted outside the United States. Derivatives transactions conducted outside the United States are subject to the risk of governmental action affecting the trading in, or the prices of, foreign securities, currencies and other instruments. The value of such positions could be adversely affected by foreign political and economic factors; lesser availability of data on which to make trading decisions; delays on the Portfolio's ability to act upon economic events occurring in foreign markets; and less liquidity than U.S. markets.
• Currency derivatives are subject to additional risks. Currency derivatives transactions may be negatively affected by government exchange controls, blockages and manipulations. Currency exchange rates may be influenced by factors extrinsic to a country's economy. There is no systematic reporting of last sale information with respect to foreign currencies. As a result, the available information on which trading in currency derivatives will be based may not be as complete as comparable data for other transactions. Events could occur in the foreign currency market which will not be reflected in currency derivatives until the following day, making it more difficult for the Portfolio to respond to such events in a timely manner.
Options
An option is a contract that gives the holder of the option the right, but not the obligation, to buy from (in the case of a call option) or sell to (in the case of a put option) the seller of the option (the "option writer") the underlying security at a specified fixed price (the "exercise price") on or prior to a specified date for American options or only at expiration for European options (the "expiration date"). The buyer of the option pays to the option writer the option premium, which is the purchase price of the option.
Exchange-traded options are issued by a regulated intermediary such as the Options Clearing Corporation ("OCC"), which guarantees the performance of the obligations of the parties to such options. OTC options are purchased from or sold to counterparties through direct bilateral agreements between
10
a Portfolio and the counterparties. Certain options, such as options on individual securities, may be settled through physical delivery of the underlying security, whereas other options, such as index options, are settled in cash in an amount based on the value of the underlying instrument multiplied by a specified multiplier.
Writing Options. Certain Portfolios may write call and put options. As the writer of a call option, the Portfolio receives the premium from the purchaser of the option and has the obligation, upon exercise of the option, to deliver the underlying security upon payment of the exercise price. If the option expires without being exercised the Portfolio is not required to deliver the underlying security but retains the premium received.
The Portfolios may only write call options that are "covered." A call option on a security is covered if (a) the Portfolio owns the security underlying the call or has an absolute and immediate right to acquire that security without additional cash consideration (or, if additional cash consideration is required, such amount is maintained by the Portfolio in segregated or earmarked cash or liquid assets) upon conversion or exchange of other securities held by the Portfolio; or (b) the Portfolio has purchased a call on the underlying security, the exercise price of which is (i) equal to or less than the exercise price of the call written, or (ii) greater than the exercise price of the call written, provided the difference is maintained by the Portfolio in segregated or earmarked cash or liquid assets.
Selling call options involves the risk that the Portfolio may be required to sell the underlying security at a disadvantageous price, below the market price of such security, at the time the option is exercised. As the writer of a covered call option, the Portfolio forgoes, during the option's life, the opportunity to profit from increases in the market value of the underlying security covering the option above the sum of the premium and the exercise price but retains the risk of loss should the price of the underlying security decline.
Certain Portfolios may write put options. As the writer of a put option, the Portfolio receives the premium from the purchaser of the option and has the obligation, upon exercise of the option, to pay the exercise price and receive delivery of the underlying security. If the option expires without being exercised, the Portfolio is not required to receive the underlying security in exchange for the exercise price but retains the option premium.
The Portfolios may only write put options that are "covered." A put option on a security is covered if (a) the Portfolio segregates or earmarks cash or liquid assets equal to the exercise price; or (b) the Portfolio has purchased a put on the same security as the put written, the exercise price of which is (i) equal to or greater than the exercise price of the put written, or (ii) less than the exercise price of the put written, provided the difference is maintained by the Portfolio in segregated or earmarked cash or liquid assets.
Selling put options involves the risk that the Portfolio may be required to buy the underlying security at a disadvantageous price, above the market price of such security, at the time the option is exercised. While the Portfolio's potential gain in writing a covered put option is limited to the premium received plus the interest earned on the liquid assets covering the put option, the Portfolio's risk of loss is equal to the entire value of the underlying security, offset only by the amount of the premium received.
The Portfolios may close out an options position which it has written through a closing purchase transaction. The Portfolio could execute a closing purchase transaction with respect to a written call option by purchasing a call option on the same underlying security and having the same exercise price and expiration date as the call option written by the Portfolio. The Portfolio could execute a closing purchase transaction with respect to a put option written by purchasing a put option on the same underlying security and having the same exercise price and expiration date as the put option written by the Portfolio. A closing purchase transaction may or may not result in a profit to a Portfolio. The Portfolio can close out its position as an option writer only if a liquid market exists for options on the same underlying security and having the same exercise date as the option written by the Portfolio. There is no assurance that such a market will exist with respect to any particular option.
The writer of an American option generally has no control over the time when the option is exercised, and the option writer is required to deliver or acquire the underlying security. Once an option writer has received an exercise notice, it cannot effect a closing purchase transaction in order to terminate its obligation under the option. Thus, the use of options may require the Portfolio to buy or sell portfolio securities
11
at inopportune times or for prices other than the current market values of such securities, may limit the amount of appreciation the Portfolio can realize on an investment, or may cause the Portfolio to hold a security that it might otherwise sell.
Purchasing Options. Certain Portfolios may purchase call and put options. As the buyer of a call option, the Portfolio pays the premium to the option writer and has the right to purchase the underlying security from the option writer at the exercise price. If the market price of the underlying security rises above the exercise price, the Portfolio could exercise the option and acquire the underlying security at a below-market price, which could result in a gain to the Portfolio, minus the premium paid. As the buyer of a put option, the Portfolio pays the premium to the option writer and has the right to sell the underlying security to the option writer at the exercise price. If the market price of the underlying security declines below the exercise price, the Portfolio could exercise the option and sell the underlying security at an above-market price, which could result in a gain to the Portfolio, minus the premium paid. The Portfolio may buy call and put options whether or not it holds the underlying securities.
As a buyer of a call or put option, the Portfolio may sell put or call options that it has purchased at any time prior to such option's expiration date through a closing sale transaction. The principal factors affecting the market value of a put or a call option include supply and demand, interest rates, the current market price of the underlying security in relation to the exercise price of the option, the volatility of the underlying security, the underlying security's dividend policy, and the time remaining until the expiration date. A closing sale transaction may or may not result in a profit to the Portfolio. The Portfolio's ability to initiate a closing sale transaction is dependent upon the liquidity of the options market and there is no assurance that such a market will exist with respect to any particular option. If the Portfolio does not exercise or sell an option prior to its expiration date, the option expires and becomes worthless.
OTC Options. Unlike exchange-traded options, which are standardized with respect to the underlying instrument, expiration date, contract size and strike price, the terms of OTC options generally are established through negotiation between the parties to the options contract. This type of arrangement allows the purchaser and writer greater flexibility to tailor the option to their needs. OTC options are available for a greater variety of securities or baskets of securities, and in a wider range of expiration dates and exercise prices than exchange-traded options. However, unlike exchange-traded options, which are issued and guaranteed by a regulated intermediary, such as the OCC, OTC options are entered into directly with the counterparty. Unless the counterparties provide for it, there is no central clearing or guaranty function for an OTC option. Therefore, OTC options are subject to the risk of default or non-performance by the counterparty. Accordingly, the Adviser and/or Sub-Advisers must assess the creditworthiness of the counterparty to determine the likelihood that the terms of the option will be satisfied. There can be no assurance that a continuous liquid secondary market will exist for any particular OTC option at any specific time. As a result, the Portfolio may be unable to enter into closing sale transactions with respect to OTC options.
Index Options. Call and put options on indices operate similarly to options on securities. Rather than the right to buy or sell a single security at a specified price, options on an index give the holder the right to receive, upon exercise of the option, an amount of cash determined by reference to the value of the underlying index. The underlying index may be a broad-based index or a narrower market index. Unlike many options on securities, all settlements are in cash. The settlement amount, which the writer of index option must pay to the holder of the option upon exercise, is generally equal to the difference between the fixed exercise price of the option and the value of the underlying index, multiplied by a specified multiplier. The multiplier determines the size of the investment position the option represents. Gain or loss to the Portfolio on index options transactions will depend, in part, on price movements of the underlying index generally or in a particular segment of the index rather than price movements of individual components of the index. As with other options, the Portfolio may close out its position in index options through closing purchase transactions and closing sale transactions provided that a liquid secondary market exists for such options.
Index options written by a Portfolio will generally be covered in a manner similar to the covering of other types of options, by holding an offsetting financial position and/or segregating or earmarking cash or liquid assets. The Portfolio may cover call options written on an index by owning securities whose price changes, in the opinion of the Adviser and/or Sub-Advisers, are expected to correlate to those of the underlying index.
12
Foreign Currency Options. Options on foreign currencies operate similarly to options on securities. Rather than the right to buy or sell a single security at a specified price, options on foreign currencies give the holder the right to buy or sell foreign currency for a fixed amount in U.S. dollars or other base currencies. Options on foreign currencies are traded primarily in the OTC market, but may also be traded on U.S. and foreign exchanges. The value of a foreign currency option is dependent upon the value of the underlying foreign currency relative to the U.S. dollar or other base currency. The price of the option may vary with changes in, among other things, the value of either or both currencies and has no relationship to the investment merits of a foreign security. Options on foreign currencies are affected by all of those factors which influence foreign exchange rates and foreign investment generally. As with other options, the Portfolio may close out its position in foreign currency options through closing purchase transactions and closing sale transactions provided that a liquid market exists for such options.
Foreign currency options written by a Portfolio will generally be covered in a manner similar to the covering of other types of options, by holding an offsetting financial position and/or segregating or earmarking cash or liquid assets.
Additional Risks of Options Transactions. The risks associated with options transactions are different from, and possibly greater than, the risks associated with investing directly in the underlying instruments. Options are highly specialized instruments that require investment techniques and risk analyses different from those associated with other portfolio investments. The use of options requires an understanding not only of the underlying instrument but also of the option itself. Options may be subject to the risk factors generally applicable to derivatives transactions described herein, and may also be subject to certain additional risk factors, including:
• The exercise of options written or purchased by a Portfolio could cause the Portfolio to sell portfolio securities, thus increasing the Portfolio's portfolio turnover.
• A Portfolio pays brokerage commissions each time it writes or purchases an option or buys or sells an underlying security in connection with the exercise of an option. Such brokerage commissions could be higher relative to the commissions for direct purchases of sales of the underlying securities.
• The Portfolio's options transactions may be limited by limitations on options positions established by the SEC, the CFTC or the exchanges on which such options are traded.
• The hours of trading for exchange listed options may not coincide with the hours during which the underlying securities are traded. To the extent that the options markets close before the markets for the underlying securities, significant price and rate movements can take place in the underlying securities that cannot be reflected in the options markets.
• Index options based upon a narrow index of securities or other assets may present greater risks than options based on broad market indices, as narrower indices are more susceptible to rapid and extreme fluctuations as a result of changes in the values of a smaller number of securities or other assets.
• The Portfolio is subject to the risk of market movements between the time that an option is exercised and the time of performance thereunder, which could increase the extent of any losses suffered by the Portfolio in connection with options transactions.
Futures Contracts
A futures contract is a standardized, exchange-traded agreement to buy or sell a specific quantity of a commodity at a specific price at a specific future time (the "settlement date"). Futures contracts may be based on, among other things, a specified equity security (securities futures), a specified debt security or reference rate (interest rate futures), the value of a specified securities index (index futures) or the value of a foreign currency (currency futures). The value of a futures contract tends to increase and decrease in tandem with the value of the underlying instrument. The buyer of a futures contract agrees to purchase the underlying instrument on the settlement date and is said to be "long" the contract. The seller of a futures contract agrees to sell the underlying instrument on the settlement date and is said to be "short" the contract. Futures contracts call for settlement only on the expiration date and cannot be "exercised" at any other time during their term.
13
Depending on the terms of the particular contract, futures contracts are settled through either physical delivery of the underlying instrument on the settlement date (such as in the case of securities futures based on a specified debt security) or by payment of a cash settlement amount on the settlement date (such as in the case of futures contracts relating to interest rates, foreign currencies and broad-based securities indices). In the case of cash settled futures contracts, the settlement amount is equal to the difference between the reference instrument's price on the last trading day of the contract and the reference instrument's price at the time the contract was entered into. Most futures contracts, particularly futures contracts requiring physical delivery, are not held until the settlement date, but instead are offset before the settlement date through the establishment of an opposite and equal futures position (buying a contract that had been sold, or selling a contract that had been purchased). All futures transactions are effected through a clearinghouse associated with the exchange on which the futures are traded.
The buyer and seller of a futures contract are not required to deliver or pay for the underlying commodity unless the contract is held until the settlement date. However, both the buyer and seller are required to deposit "initial margin" with a futures commission merchant when the futures contract is entered into. Initial margin deposits are typically calculated as a percentage of the contract's market value. If the value of either party's position declines, the party will be required to make additional "variation margin" payments to settle the change in value on a daily basis. The process is known as "marking-to-market." Upon the closing of a futures position through the establishment of an offsetting position, a final determination of variation margin will be made and additional cash will be paid by or released to the Portfolio.
In addition, the Portfolio may be required to maintain segregated cash or liquid assets in order to cover futures transactions. The Portfolio will segregate or earmark cash or liquid assets in an amount equal to the difference between the market value of a futures contract entered into by the Portfolio and the aggregate value of the initial and variation margin payments made by the Portfolio with respect to such contract or as otherwise permitted by SEC rules or SEC staff positions. See "Regulatory Matters" below.
Forwards. A foreign currency forward exchange contract is a negotiated agreement between two parties to exchange specified amounts of two or more currencies at a specified future time at a specified rate. The rate specified by the foreign currency forward exchange contract can be higher or lower than the spot rate between the currencies that are the subject of the contract. Currency futures are similar to foreign currency forward exchange contracts, except that they are traded on an exchange and standardized as to contract size and delivery date. Most currency futures call for payment or delivery in U.S. dollars. Unanticipated changes in currency prices may result in losses to the Portfolio and poorer overall performance for the Portfolio than if it had not entered into foreign currency forward exchange contracts. Certain Portfolios may enter into foreign currency forward exchange or futures contracts under various circumstances. The typical use of a foreign currency forward exchange or futures contract is to "lock in" the price of a security in U.S. dollars or some other foreign currency, which the Portfolio is holding in its portfolio. By entering into a foreign currency forward exchange contract for the purchase or sale, for a fixed amount of dollars or other currency, of the amount of foreign currency involved in the underlying security transactions, the Portfolio may be able to protect itself against a possible loss resulting from an adverse change in the relationship between the U.S. dollar or other currency which is being used for the security purchase and the foreign currency in which the security is denominated during the period between the date on which the security is purchased or sold and the date on which payment is made or received. The Adviser and/or Sub-Advisers also may from time to time utilize foreign currency forward exchange contracts for other purposes. For example, they may be used to hedge a foreign security held in the portfolio, against a decline in value of the applicable foreign currency. They also may be used to lock in the current exchange rate of the currency in which those securities anticipated to be purchased are denominated. At times, the Portfolio may enter into "cross-currency" hedging transactions involving currencies other than those in which securities are held or proposed to be purchased are denominated.
A Portfolio will not enter into foreign currency forward exchange contracts or maintain a net exposure to these contracts where the consummation of the contracts would obligate the Portfolio to deliver an amount of foreign currency in excess of the value of the Portfolio's portfolio securities.
When required by law, a Portfolio will segregate or earmark cash, U.S. government securities or other appropriate liquid portfolio securities in an amount equal to the value of the Portfolio's total assets committed to the consummation of foreign currency forward exchange contracts entered into under the circumstances set forth above. If the value of the securities so earmarked declines, additional cash or
14
securities will be segregated or earmarked on a daily basis so that the value of such securities will equal the amount of the Portfolio's commitments with respect to such contracts.
The Portfolio may be limited in its ability to enter into hedging transactions involving foreign currency forward exchange contracts by the Internal Revenue Code of 1986, as amended (the "Code"), requirements relating to qualification as a regulated investment company.
Foreign currency forward exchange contracts may limit gains on portfolio securities that could otherwise be realized had they not been utilized and could result in losses. The contracts also may increase the Portfolio's volatility and may involve a significant amount of risk relative to the investment of cash.
Options on Futures Contracts. Options on futures contracts are similar to options on securities except that options on futures contracts give the purchasers the right, in return for the premium paid, to assume a position in a futures contract (a long position in the case of a call option and a short position in the case of a put option) at a specified exercise price at any time prior to the expiration of the option. Upon exercise of the option, the parties will be subject to all of the risks associated with futures transactions and subject to margin requirements. As the writer of options on futures contracts, a Portfolio would also be subject to initial and variation margin requirements on the option position.
Options on futures contracts written by the Portfolio will generally be covered in a manner similar to the covering of other types of options, by holding an offsetting financial position and/or segregating or earmarking cash or liquid assets. The Portfolio may cover an option on a futures contract by purchasing or selling the underlying futures contract. In such instances the exercise of the option will serve to close out the Portfolio's futures position.
Additional Risks of Futures Transactions. The risks associated with futures contract transactions are different from, and possibly greater than, the risks associated with investing directly in the underlying instruments. Futures are highly specialized instruments that require investment techniques and risk analyses different from those associated with other portfolio investments. The use of futures requires an understanding not only of the underlying instrument but also of the futures contract itself. Futures may be subject to the risk factors generally applicable to derivatives transactions described herein, and may also be subject to certain additional risk factors, including:
• The risk of loss in buying and selling futures contracts can be substantial. Small price movements in the commodity underlying a futures position may result in immediate and substantial loss (or gain) to a Portfolio.
• Buying and selling futures contracts may result in losses in excess of the amount invested in the position in the form of initial margin. In the event of adverse price movements in the underlying commodity, security, index, currency or instrument, the Portfolio would be required to make daily cash payments to maintain its required margin. The Portfolio may be required to sell portfolio securities, or make or take delivery of the underlying securities in order to meet daily margin requirements at a time when it may be disadvantageous to do so. The Portfolio could lose margin payments deposited with a futures commission merchant if the futures commission merchant breaches its agreement with the Portfolio, becomes insolvent or declares bankruptcy.
• Most exchanges limit the amount of fluctuation permitted in futures contract prices during any single trading day. Once the daily limit has been reached in a particular futures contract, no trades may be made on that day at prices beyond that limit. If futures contract prices were to move to the daily limit for several trading days with little or no trading, the Portfolio could be prevented from prompt liquidation of a futures position and subject to substantial losses. The daily limit governs only price movements during a single trading day and therefore does not limit the Portfolio's potential losses.
• Index futures based upon a narrower index of securities may present greater risks than futures based on broad market indices, as narrower indices are more susceptible to rapid and extreme fluctuations as a result of changes in value of a small number of securities.
Swap Contracts and Related Derivative Instruments
An OTC swap contract is an agreement between two parties pursuant to which the parties exchange payments at specified dates on the basis of a specified notional amount, with the payments calculated by
15
reference to specified securities, indices, reference rates, currencies or other instruments. Most swap agreements provide that when the period payment dates for both parties are the same, the payments are made on a net basis (i.e., the two payment streams are netted out, with only the net amount paid by one party to the other). A Portfolio's obligations or rights under a swap contract entered into on a net basis will generally be equal only to the net amount to be paid or received under the agreement, based on the relative values of the positions held by each counterparty. Most swap agreements are generally not entered into or traded on exchanges and there is no central clearing or guaranty function for swaps. These OTC swaps are often subject to the risk of default or non-performance by the counterparty. Accordingly, the Adviser and/or Sub-Advisers must assess the creditworthiness of the counterparty to determine the likelihood that the terms of the swap will be satisfied.
Swap agreements allow for a wide variety of transactions. For example, fixed rate payments may be exchanged for floating rate payments, U.S. dollar denominated payments may be exchanged for payments denominated in foreign currencies, and payments tied to the price of one security, index, reference rate, currency or other instrument may be exchanged for payments tied to the price of a different security, index, reference rate, currency or other instrument. Swap contracts are typically individually negotiated and structured to provide exposure to a variety of particular types of investments or market factors. Swap contracts can take many different forms and are known by a variety of names. To the extent consistent with a Portfolio's investment objectives and policies, the Portfolio is not limited to any particular form or variety of swap contract. The Portfolio may utilize swaps to increase or decrease its exposure to the underlying instrument, reference rate, foreign currency, market index or other asset. The Portfolio may also enter into related derivative instruments including caps, floors and collars.
A Portfolio may be required to cover swap transactions. Obligations under swap agreements entered into on a net basis are generally accrued daily and any accrued but unpaid amounts owed by the Portfolio to the swap counterparty will be covered by segregating or earmarking cash or liquid assets. If the Portfolio enters into a swap agreement on other than a net basis, the Portfolio will segregate or earmark cash or liquid assets with a value equal to the full amount of the Portfolio's accrued obligations under the agreement.
The Dodd-Frank Wall Street Reform and Consumer Protection Act (the "Dodd-Frank Act") and related regulatory developments will require the clearing and exchange-trading of many OTC swap agreements. Mandatory exchange-trading and clearing will occur on a phased-in basis.
Interest Rate Swaps, Caps, Floors and Collars. Interest rate swaps consist of an agreement between two parties to exchange their respective commitments to pay or receive interest (e.g., an exchange of floating rate payments for fixed rate payments). Interest rate swaps are generally entered into on a net basis. Interest rate swaps do not involve the delivery of securities, other underlying assets, or principal. Accordingly, the risk of loss with respect to interest rate and total rate of return swaps is typically limited to the net amount of interest payments that a Portfolio is contractually obligated to make.
Certain Portfolios may also buy or sell interest rate caps, floors and collars. The purchase of an interest rate cap entitles the purchaser, to the extent that a specified interest rate exceeds a predetermined level, to receive payments of interest on a specified notional amount from the party selling the interest rate cap. The purchase of an interest rate floor entitles the purchaser, to the extent that a specified interest rate falls below a predetermined level, to receive payments of interest on a specified notional amount from the party selling the interest rate floor. A collar is a combination of a cap and a floor that preserves a certain return within a predetermined range of interest rates. Caps, floors and collars may be less liquid than other types of derivatives. If a Portfolio sells caps, floors and collars, it will segregate liquid assets with a value equal to the full amount, accrued daily, of the Portfolio's net obligations with respect to the caps, floors or collars.
Index Swaps. An index swap consists of an agreement between two parties in which a party exchanges a cash flow based on a notional amount of a reference index for a cash flow based on a different index or on another specified instrument or reference rate. Index swaps are generally entered into on a net basis.
Inflation Swaps. Inflation swap agreements are contracts in which one party agrees to pay the cumulative percentage increase in a price index, such as the Consumer Price Index, over the term of the swap (with some lag on the referenced inflation index), and the other party pays a compounded
16
fixed rate. Inflation swap agreements may be used to protect the net asset value of a Portfolio against an unexpected change in the rate of inflation measured by an inflation index. The value of inflation swap agreements is expected to change in response to changes in real interest rates. Real interest rates are tied to the relationship between nominal interest rates and the rate of inflation.
Currency Swaps. A currency swap consists of an agreement between two parties to exchange cash flows on a notional amount of two or more currencies based on the relative value differential among them, such as exchanging a right to receive a payment in a foreign currency for the right to receive U.S. dollars. Currency swap agreements may be entered into on a net basis or may involve the delivery of the entire principal value of one designated currency in exchange for the entire principal value of another designated currency. In such cases, the entire principal value of a currency swap is subject to the risk that the counterparty will default on its contractual delivery obligations.
Credit Default Swaps. A credit default swap consists of an agreement between two parties in which the "buyer" agrees to pay to the "seller" a periodic stream of payments over the term of the contract and the seller agrees to pay the buyer the par (or other agreed-upon) value of that referenced debt obligation upon the occurrence of a credit event with respect to the issuer of that referenced debt obligation. Generally, a credit event means a bankruptcy, failure to pay or a restructuring. A Portfolio may be either the buyer or seller in a credit default swap. As the buyer in a credit default swap, the Portfolio would pay to the counterparty the periodic stream of payments. If no default occurs, the Portfolio would receive no benefit from the contract. As the seller in a credit default swap, the Portfolio would receive the stream of payments but would be subject to exposure on the notional amount of the swap, which it would be required to pay in the event of default. The Portfolio will generally segregate or earmark cash or liquid assets to cover any potential obligation under a credit default swap sold by the Portfolio. The use of credit default swaps could result in losses to the Portfolio if the Adviser and/or Sub-Advisers fail to correctly evaluate the creditworthiness of the issuer of the referenced debt obligation.
Swaptions. An option on a swap agreement, also called a "swaption," is an option that gives the buyer the right, but not the obligation, to enter into a swap on a future date in exchange for paying a market based "premium." A receiver swaption gives the owner the right to receive the total return of a specified asset, reference rate, or index. A payer swaption gives the owner the right to pay the total return of a specified asset, reference rate, or index. Swaptions also include options that allow an existing swap to be terminated or extended by one of the counterparties.
General Risks of Swaps. The risks associated with swap transactions are different from, and possibly greater than, the risks associated with investing directly in the underlying instruments. Swaps are highly specialized instruments that require investment techniques and risk analyses different from those associated with other portfolio investments. The use of swaps requires an understanding not only of the underlying instrument but also of the swap contract itself. Swap transactions may be subject to the risk factors generally applicable to derivatives transactions described above, and may also be subject to certain additional risk factors, including:
• OTC swap agreements are not traded on exchanges and may be subject to liquidity risks, which exist when a particular swap is difficult to purchase or sell.
• In addition to the risk of default by the counterparty, if the creditworthiness of a counterparty to a swap agreement declines, the value of the swap agreement would be likely to decline, potentially resulting in losses.
• The swaps market is subject to extensive regulation under the Dodd-Frank Act and certain CFTC and SEC rules promulgated thereunder. It is possible that further developments in the swaps market, including new and additional governmental regulation, could result in higher Portfolio costs and expenses and could adversely affect the Portfolio's ability to utilize swaps, terminate existing swap agreements or realize amounts to be received under such agreements.
Structured Investments
Certain Portfolios also may invest a portion of its assets in structured investments. A structured investment is a derivative security designed to offer a return linked to a particular underlying security, currency, commodity or market, for which the amount of principal repayment and/or interest payments is based on the change in value of such underlying security, currency, commodity or market, including, among others, currency exchange rates, interest rates (such as the prime lending rate or LIBOR), referenced bonds and
17
stock indices or other financial references. Structured investments may come in various forms, including notes, warrants and options to purchase securities and may be listed and traded on an exchange or otherwise traded in the OTC market.
A Portfolio will typically use structured investments to gain exposure to a permitted underlying security, currency, commodity or market when direct access to such security, currency, commodity or market is limited or inefficient from a tax, cost or regulatory standpoint. Investments in structured investments involve risks including counterparty risk and market risk. Holders of structured investments bear risks of the underlying investment and are subject to counterparty risk because the Portfolio is relying on the creditworthiness of such counterparty and has no rights with respect to the issuer of the underlying investment. Certain structured investments may be thinly traded or have a limited trading market and may have the effect of increasing the Portfolio's illiquidity to the extent that the Portfolio, at a particular point in time, may be unable to find qualified buyers for these investments.
A structured investment may be linked either positively or negatively to an underlying security, currency, commodity, index or market and a change in interest rates, principal amount, volatility, currency values or other factors, depending on the structured investment's design, may result in a gain or loss that is a multiple of the movement of such interest rates, principal amount, volatility, currency values or other factors. Application of a multiplier is comparable to the use of financial leverage, a speculative technique. Leverage magnifies the potential for gain and the risk of loss. As a result, a relatively small decline in the value of the referenced factor could result in a relatively large loss in the value of a structured investment.
Other types of structured investments include interests in entities organized and operated for the purpose of restructuring the investment characteristics of underlying investment interests or securities. This type of securitization or restructuring usually involves the deposit or purchase of an underlying security by a U.S. or foreign entity, such as a corporation or trust of specified instruments, and the issuance by that entity of one or more classes of securities backed by, or representing an interest in, the underlying instruments.
The cash flow or rate of return on the underlying investments may be apportioned among the newly issued securities to create different investment characteristics, such as varying maturities, credit quality, payment priorities and interest rate provisions. Structured investments which are subordinated, for example, in payment priority often offer higher returns, but may result in increased risks compared to other investments.
Combined Transactions
Combined transactions involve entering into multiple derivatives transactions (such as multiple options transactions, including purchasing and writing options in combination with each other; multiple futures transactions; and combinations of options, futures, forward and swap transactions) instead of a single derivatives transaction in order to customize the risk and return characteristics of the overall position. Combined transactions typically contain elements of risk that are present in each of the component transactions. Certain Portfolios may enter into a combined transaction instead of a single derivatives transaction when, in the opinion of the Adviser and/or Sub-Advisers, it is in the best interest of the Portfolio to do so. Because combined transactions involve multiple transactions, they may result in higher transaction costs and may be more difficult to close out.
Regulatory Matters
As described herein, a Portfolio may be required to cover its potential economic exposure to certain derivatives transactions by holding an offsetting financial position and/or segregating or earmarking cash or liquid assets equal in value to the Portfolio's potential economic exposure under the transaction. The Portfolio will cover such transactions as described herein or in such other manner in accordance with applicable laws and regulations. Assets used to cover derivatives transactions cannot be sold while the derivatives position is open, unless they are replaced by other appropriate assets. Segregated or earmarked cash or liquid assets and assets held in margin accounts are not otherwise available to the Portfolio for investment purposes. If a large portion of the Portfolio's assets are used to cover derivatives transactions or are otherwise segregated or earmarked, it could affect portfolio management or the Portfolio's ability to meet redemption requests or other current obligations. With respect to derivatives which are cash-settled (i.e., have no physical delivery requirement), the Portfolio is permitted to earmark cash or set aside liquid assets in an amount equal to the Portfolio's daily marked-to-market net obligations
18
(i.e., the Portfolio's daily net liability) under the derivative, if any, rather than the derivative's full notional value or the market value of the instrument underlying the derivative, as applicable. By earmarking cash or setting aside assets equal to only its net obligations under cash-settled derivatives, the Portfolio will have the ability to employ leverage to a greater extent than if the Portfolio were required to earmark cash or segregate assets equal to the full notional amount of the derivative or the market value of the underlying instrument, as applicable.
Regulatory developments affecting the exchange-traded and OTC derivatives markets may impair a Portfolio's ability to manage or hedge its investment portfolio through the use of derivatives. The Dodd-Frank Act and the rules promulgated thereunder may limit the ability of a Portfolio to enter into one or more exchange-traded or OTC derivatives transactions.
A Portfolios' use of derivatives may also be limited by the requirements of the Code, for qualification as a regulated investment company for U.S. federal income tax purposes.
The Fund has filed with the National Futures Association ("NFA"), a notice claiming an exclusion from the definition of the term "commodity pool operator" ("CPO") under the Commodity Exchange Act, as amended ("CEA") and the rules of the CFTC promulgated thereunder, with respect to the Portfolios' operations. Therefore, neither the Fund nor the Adviser (with respect to the Fund) is subject to registration or regulation as a commodity pool or CPO under the CEA. If the Fund becomes subject to these requirements, as well as related NFA rules, the Fund may incur additional compliance and other expenses.
Money Market Securities. In addition to the short-term fixed-income securities in which the Portfolios may otherwise invest, the Portfolios may invest in various money market securities for cash management purposes or when assuming a temporary defensive position, which among others may include commercial paper, bankers' acceptances, bank obligations, corporate debt securities, certificates of deposit, U.S. government securities, obligations of savings institutions and repurchase agreements. (This section does not apply to the Money Market Portfolio (other than with respect to European certificates of deposit and repurchase agreements), whose money market instruments are described in its Prospectus.) Such securities are limited to:
U.S. Government Securities. Obligations issued or guaranteed as to principal and interest by the United States or its agencies (such as the Export-Import Bank of the United States, Federal Housing Administration and Government National Mortgage Association) or its instrumentalities (such as the Federal Home Loan Bank), including Treasury bills, notes and bonds;
Bank Obligations. Obligations (including certificates of deposit, time deposits and bankers' acceptances) of banks subject to regulation by the U.S. Government and having total assets of $1 billion or more, and instruments secured by such obligations, not including obligations of foreign branches of domestic banks except to the extent below;
Eurodollar Certificates of Deposit. Eurodollar certificates of deposit issued by foreign branches of domestic banks having total assets of $1 billion or more;
Obligations of Savings Institutions. Certificates of deposit of savings banks and savings and loan associations, having total assets of $1 billion or more;
Fully Insured Certificates of Deposit. Certificates of deposit of banks and savings institutions, having total assets of less than $1 billion, if the principal amount of the obligation is federally insured by the Bank Insurance Fund or the Savings Association Insurance Fund (each of which is administered by the FDIC), limited to $250,000 principal amount per certificate (a temporary increase from $100,000, which is due to expire on December 31, 2013), and to 10% or less of each Portfolio's (other than the Money Market Portfolio's) total assets in all such obligations and in all illiquid assets, in the aggregate, and to 5% or less of the Money Market Portfolio's total assets in all such obligations and in all illiquid assets, in the aggregate;
Commercial Paper. Commercial paper rated within the two highest grades by Standard & Poor's Ratings Services, a division of The McGraw-Hill Companies, Inc. ("S&P"), or by Moody's Investors Service, Inc. ("Moody's") or, if not rated, issued by a company having an outstanding debt issue rated at least AA by S&P or Aa by Moody's; and
19
Repurchase Agreements. The Portfolios may invest in repurchase agreements. For certain Portfolios, when cash may be available for only a few days, it may be invested by the Portfolios in repurchase agreements until such time as it may otherwise be invested or used for payments of obligations of the Portfolios. These agreements typically involve the acquisition by the Portfolios of debt securities from a selling financial institution such as a bank, savings and loan association or broker-dealer. The agreement provides that the Portfolio will sell back to the institution, and that the institution will repurchase, the underlying securities serving as collateral, at a specified price and at a fixed time in the future, usually not more than seven days from the date of purchase. The collateral will be marked-to-market daily to determine that the value of the collateral, as specified in the agreement, does not decrease below the purchase price plus accrued interest. If such decrease occurs, additional collateral will be requested and, when received, added to the account to maintain full collateralization. The Portfolios will accrue interest from the institution until the time when the repurchase is to occur. Although this date is deemed by the Portfolios to be the maturity date of a repurchase agreement, the maturities of securities subject to repurchase agreements are not subject to any limits.
While repurchase agreements involve certain risks not associated with direct investments in debt securities, the Portfolios follow procedures approved by the Trustees that are designed to minimize such risks. These procedures include effecting repurchase transactions only with large, well-capitalized and well-established financial institutions whose financial condition will be continually monitored by the Adviser and/or Sub-Advisers. In addition, as described above, the value of the collateral underlying the repurchase agreement will be at least equal to the repurchase price, including any accrued interest earned on the repurchase agreement. In the event of a default or bankruptcy by a selling financial institution, the Portfolios will seek to liquidate such collateral. However, the exercising of the Portfolios' right to liquidate such collateral could involve certain costs or delays and, to the extent that proceeds from any sale upon a default of the obligation to repurchase were less than the repurchase price, the Portfolios could suffer a loss. The Money Market Portfolio may invest in repurchase agreements backed by non-governmental collateral. Such collateral will be, at the time the repurchase agreement is entered into, rated investment grade. A Portfolio will not invest in repurchase agreements that do not mature within seven days if any such investment, together with any other illiquid assets held by that Portfolio, amounts to more than 5% of its net assets in the Money Market Portfolio, and 15% of its net assets in the case of each of the other Portfolios. The Portfolios' investments in repurchase agreements may at times be substantial when, in the view of the Portfolios' Adviser and/or Sub-Advisers, liquidity or other conditions warrant.
Zero Coupon Securities. A portion of the fixed-income securities purchased by the Portfolio may be "zero coupon" securities. Such securities are purchased at a discount from their face amount, giving the purchaser the right to receive their full value at maturity. The interest earned on such securities is, implicitly, automatically compounded and paid out at maturity. While such compounding at a constant rate eliminates the risk of receiving lower yields upon reinvestment of interest if prevailing interest rates decline, the owner of a zero coupon security will be unable to participate in higher yields upon reinvestment of interest received if prevailing interest rates rise.
A zero coupon security pays no interest to its holder during its life. Therefore, to the extent the Portfolios invest in zero coupon securities, they will not receive current cash available for distribution to shareholders. In addition, zero coupon securities are subject to substantially greater market price fluctuations during periods of changing prevailing interest rates than are comparable debt securities which make current distributions of interest. Current federal tax law requires that a holder (such as a Portfolio) of a zero coupon security accrue a portion of the discount at which the security was purchased as income each year even though the Portfolio receives no interest payments in cash on the security during the year.
Public Bank Loans. The Flexible Income Portfolio may invest in public loans made by banks or other financial institutions, which may be rated investment grade (Baa or higher by Moody's, BBB or higher by S&P) or below investment grade (below Baa by Moody's or below BBB by S&P). Public bank loans are privately negotiated loans for which information about the issuer has been made publicly available. However, public bank loans are not registered under the Securities Act of 1933, as amended (the "Securities Act"), and are not publicly traded. They usually are second lien loans normally lower in priority of payment to senior loans, but have seniority in a company's capital structure to other claims, such as subordinated corporate bonds or publicly-issued equity so that in the event of bankruptcy or liquidation, the company is required to pay down these second lien loans prior to such other lower-ranked claims on
20
their assets. Bank loans normally pay floating rates that reset frequently, and as a result, protect investors from increases in interest rates.
Bank loans generally are negotiated between a borrower and several financial institutional lenders represented by one or more lenders acting as agent of all the lenders. The agent is responsible for negotiating the loan agreement that establishes the terms and conditions of the loan and the rights of the borrower and the lenders, monitoring any collateral, and collecting principal and interest on the loan. By investing in a loan, the Flexible Income Portfolio becomes a member of a syndicate of lenders. Certain bank loans are illiquid, meaning the Flexible Income Portfolio may not be able to sell them quickly at a fair price. Illiquid securities are also difficult to value. To the extent a bank loan has been deemed illiquid, it will be subject to the Flexible Income Portfolio's restrictions on investment in illiquid securities. The secondary market for bank loans may be subject to irregular trading activity, wide bid/ask spreads and extended trade settlement periods.
Bank loans are subject to the risk of default. Default in the payment of interest or principal on a loan will result in a reduction of income to the Flexible Income Portfolio, a reduction in the value of the loan, and a potential decrease in the Flexible Income Portfolio's net asset value. The risk of default will increase in the event of an economic downturn or a substantial increase in interest rates. Bank loans are subject to the risk that the cash flow of the borrower and property securing the loan or debt, if any, may be insufficient to meet scheduled payments. As discussed above, however, because bank loans reside higher in the capital structure than high yield bonds, default losses have been historically lower in the bank loan market. Bank loans that are rated below investment grade share the same risks of other below investment grade securities.
Reverse Repurchase Agreements and Dollar Rolls. Each of the Money Market Portfolio and the Flexible Income Portfolio may use reverse repurchase agreements for purposes of meeting redemptions or as part of its investment strategy. The Flexible Income Portfolio may also use dollar rolls as part of its investment strategy.
Reverse repurchase agreements involve sales by a Portfolio of assets concurrently with an agreement by the Portfolio to repurchase the same assets at a later date at a fixed price. Reverse repurchase agreements involve the risk that the market value of the securities a Portfolio is obligated to purchase under the agreement may decline below the repurchase price. These transactions are only advantageous if the interest cost to the Fund of the reverse repurchase transaction is less than the cost of obtaining the cash otherwise. Opportunities to achieve this advantage may not always be available, and the Portfolios intend to use the reverse repurchase technique only when it will be to its advantage to do so.
The Portfolios will earmark cash or liquid assets or establish a segregated account in which it will maintain cash, U.S. government securities or other appropriate liquidity portfolio securities equal in value to its obligations in respect of reverse repurchase agreements. In the event the buyer of securities under a reverse repurchase agreement files for bankruptcy or becomes insolvent, a Portfolio's use of the proceeds of the agreement may be restricted pending a determination by the other party, or its trustee or receiver, whether to enforce the Portfolio's obligation to repurchase the securities.
Dollar rolls involve a Portfolio selling securities for delivery in the current month and simultaneously contracting to repurchase substantially similar (same type and coupon) securities on a specified future date. During the roll period, a Portfolio will forgo principal and interest paid on the securities. A Portfolio is compensated by the difference between the current sales price and the lower forward price for the future purchase (often referred to as the "drop") as well as by the interest earned on the cash proceeds of the initial sale.
Reverse repurchase agreements and dollar rolls are speculative techniques involving leverage and are considered borrowings by a Portfolio. With respect to the Flexible Income Portfolio, reverse repurchase agreements and dollar rolls are not expected to exceed 25% of this Portfolio's total assets. With respect to the Money Market Portfolio, reverse repurchase agreements (other than for purposes of meeting redemptions) may not exceed 5% of the Portfolio's total assets.
Real Estate Investment Trusts ("REITs") and Foreign Real Estate Companies. Certain Portfolios may invest in REITs and foreign real estate companies, which are similar to entities organized and operated as REITs in the United States. REITs and foreign real estate companies pool investors'
21
funds for investment primarily in real estate properties or real estate-related loans. REITs and foreign real estate companies generally derive their income from rents on the underlying properties or interest on the underlying loans, and their value is impacted by changes in the value of the underlying property or changes in interest rates affecting the underlying loans owned by the REITs and/or foreign real estate companies. REITs and foreign real estate companies are more susceptible to risks associated with the ownership of real estate and the real estate industry in general. These risks can include fluctuations in the value of underlying properties; defaults by borrowers or tenants; market saturation; changes in general and local economic conditions; decreases in market rates for rents; increases in competition, property taxes, capital expenditures or operating expenses; and other economic, political or regulatory occurrences affecting the real estate industry. In addition, REITs and foreign real estate companies depend upon specialized management skills, may not be diversified (which may increase the volatility of a REIT's and/or a foreign real estate company's value), may have less trading volume and may be subject to more abrupt or erratic price movements than the overall securities market. Foreign real estate companies may be subject to laws, rules and regulations governing those entities and their failure to comply with those laws, rules and regulations could negatively impact the performance of those entities. Operating REITs and foreign real estate companies require specialized management skills and the Fund indirectly bears REIT and foreign real estate company management expenses along with the direct expenses of the Fund. REITs are not taxed on income distributed to shareholders provided they comply with several requirements of the Code. REITs are subject to the risk of failing to qualify for tax-free pass-through income under the Code.
Borrowing. Each Portfolio has an operating policy, which may be changed by the Fund's Board of Trustees, not to borrow except from a bank for temporary or emergency purposes in amounts not exceeding 5% (taken at the lower of cost or current value) of its total assets (not including the amount borrowed). Should the Board of Trustees remove this operating policy, each Portfolio would be permitted to borrow money from banks in accordance with the Investment Company Act or the rules and regulations promulgated by the SEC thereunder. Currently, the Investment Company Act permits a fund to borrow money from banks in an amount up to 331/3% of its total assets (including the amount borrowed) less its liabilities (not including any borrowings but including the fair market value at the time of computation of any other senior securities then outstanding). Each Portfolio may also borrow an additional 5% of its total assets without regard to the foregoing limitation for temporary purposes such as clearance of portfolio transactions. Each Portfolio will only borrow when the Adviser and/or Sub-Advisers believe that such borrowings will benefit the Portfolio after taking into account considerations such as interest income and possible gains or losses upon liquidation. Each Portfolio will maintain asset coverage in accordance with the Investment Company Act.
Borrowing by a Portfolio creates an opportunity for increased net income but, at the same time, creates special risks. For example, leveraging may exaggerate changes in and increase the volatility of the net asset value of Portfolio shares. This is because leverage tends to exaggerate the effect of any increase or decrease in the value of a Portfolio's portfolio securities. The use of leverage also may cause a Portfolio to liquidate portfolio positions when it may not be advantageous to do so in order to satisfy its obligations or to maintain asset coverage.
In general, a Portfolio may not issue any class of senior security, except that the Portfolio may (i) borrow from banks, provided that immediately following any such borrowing there is an asset coverage of at least 300% for all Portfolio borrowings and in the event such asset coverage falls below 300% the Portfolio will within three days or such longer period as the SEC may prescribe by rules and regulations, reduce the amount of its borrowings to an extent that the asset coverage of such borrowings shall be at least 300%, and (ii) engage in trading practices which could be deemed to involve the issuance of a senior security, including but not limited to options, futures, forward contracts and reverse repurchase agreements, provided that a Portfolio segregates or earmarks cash or liquid assets in accordance with applicable SEC regulations and interpretations.
Loans of Portfolio Securities. Each Portfolio may lend its portfolio securities to brokers, dealers, banks and other institutional investors. By lending its portfolio securities, a Portfolio attempts to increase its net investment income through the receipt of interest on the cash collateral with respect to the loan or fees received from the borrower in connection with the loan. Any gain or loss in the market price of the securities loaned that might occur during the term of the loan would be for the account of a Portfolio. The
22
Portfolios employ an agent to implement the securities lending program and the agent receives a fee from the Portfolios for its services. No Portfolio will lend more than 331/3% of the value of its total assets.
Each Portfolio may lend its portfolio securities so long as the terms, structure and the aggregate amount of such loans are not inconsistent with the Investment Company Act or the rules and regulations or interpretations of the SEC thereunder, which currently require that (i) the borrower pledge and maintain with the Portfolio collateral consisting of liquid, unencumbered assets having a value at all times not less than 100% of the value of the securities loaned; (ii) the borrower add to such collateral whenever the price of the securities loaned rises (i.e., the borrower "marks-to-market" on a daily basis); (iii) the loan be made subject to termination by the Portfolio at any time; and (iv) the Portfolio receives a reasonable return on the loan (which may include the Portfolio investing any cash collateral in interest bearing short-term investments), any distributions on the loaned securities, and any increase in their market value. In addition, voting rights may pass with the loaned securities, but a Portfolio will retain the right to call any security in anticipation of a vote that the Adviser and/or Sub-Advisers deem material to the security on loan.
There may be risks of delay and costs involved in recovery of securities or even loss of rights in the collateral should the borrower of the securities fail financially. These delays and costs could be greater for foreign securities. However, loans will be made only to borrowers deemed by the Adviser and/or Sub-Advisers to be creditworthy and when, in the judgment of the Adviser and/or Sub-Advisers, the income which can be earned from such securities loans justifies the attendant risk. All relevant facts and circumstances, including the creditworthiness of the broker, dealer, bank or institution, will be considered in making decisions with respect to the lending of securities, subject to review by the Fund's Board of Trustees. A Portfolio also bears the risk that the reinvestment of collateral will result in a principal loss. Finally, there is the risk that the price of the securities will increase while they are on loan and the collateral will not be adequate to cover their value.
When-Issued and Delayed Delivery Securities and Forward Commitments. From time to time, each Portfolio may purchase securities on a when-issued or delayed delivery basis or may purchase or sell securities on a forward commitment basis. When these transactions are negotiated, the price is fixed at the time of the commitment, but delivery and payment may take place a month or more after the date of commitment. While a Portfolio will only purchase securities on a when-issued, delayed delivery or forward commitment basis with the intention of acquiring the securities, the Portfolio may sell the securities before the settlement date, if it is deemed advisable. The securities so purchased or sold are subject to market fluctuation and no interest or dividends accrue to the purchaser prior to the settlement date.
At the time a Portfolio makes the commitment to purchase or sell securities on a when-issued, delayed delivery or forward commitment basis, it will record the transaction and thereafter reflect the value, each day, of such security purchased, or if a sale, the proceeds to be received, in determining its net asset value. At the time of delivery of the securities, their value may be more or less than the purchase or sale price. An increase in the percentage of a Portfolio's assets committed to the purchase of securities on a when-issued, delayed delivery or forward commitment basis may increase the volatility of its net asset value. A Portfolio will also earmark cash or liquid assets or establish a segregated account on its books in which it will continually maintain cash or cash equivalents or other liquid portfolio securities equal in value to commitments to purchase securities on a when-issued, delayed delivery or forward commitment basis.
When, As and If Issued Securities. Each Portfolio, other than the Money Market Portfolio, may purchase securities on a "when, as and if issued" basis, under which the issuance of the security depends upon the occurrence of a subsequent event, such as approval of a merger, corporate reorganization or debt restructuring. The commitment for the purchase of any such security will not be recognized in a Portfolio until the Adviser and/or Sub-Advisers determine that issuance of the security is probable. At that time, the Portfolio will record the transaction and, in determining its net asset value, will reflect the value of the security daily. At that time, the Portfolio will also earmark cash or liquid assets or establish a segregated account on the Portfolio's books in which it will maintain cash, cash equivalents or other liquid portfolio securities equal in value to recognized commitments for such securities.
An increase in the percentage of the Portfolio assets committed to the purchase of securities on a "when, as and if issued" basis may increase the volatility of its net asset value. A Portfolio may also sell securities on a "when, as and if issued" basis provided that the issuance of the security will result automatically from the exchange or conversion of a security owned by the Portfolio at the time of sale.
23
Private Placements and Restricted Securities. The Money Market Portfolio may invest up to 5% of its total assets in securities which are subject to restrictions on resale because they have not been registered under the Securities Act of 1933, as amended (the "Securities Act"), or which are otherwise not readily marketable. Each Portfolio (except the Money Market Portfolio) may invest up to 15% of its total assets in securities which are subject to restrictions on resale because they have not been registered under the Securities Act or which are otherwise not readily marketable. (With respect to these Portfolios, securities eligible for resale pursuant to Rule 144A under the Securities Act, and determined to be liquid pursuant to the procedures discussed in the following paragraph, are not subject to the foregoing restriction.) These securities are generally referred to as private placements or restricted securities. Such securities may involve a higher degree of business and financial risk that can result in substantial losses. As a result of the absence of a public trading market for these securities, they may be less liquid than publicly traded securities. To the extent these securities may be resold in privately negotiated transactions, the prices realized from these sales could be less than those originally paid by a Portfolio or less than what may be considered the fair value of such securities. Furthermore, companies whose securities are not publicly traded may not be subject to the disclosure and other investor protection requirements which might be applicable if their securities were publicly traded. The illiquidity of the market, as well as the lack of publicly available information regarding these securities, may also adversely affect the ability to arrive at a fair value for certain securities at certain times and could make it difficult for the Portfolios to sell certain securities. If such securities are required to be registered under the securities laws of one or more jurisdictions before being sold, the Portfolios may be required to bear the expenses of registration.
Rule 144A permits the above-listed Portfolios to sell restricted securities to qualified institutional buyers without limitation. The Adviser and/or Sub-Advisers, pursuant to procedures adopted by the Trustees, will make a determination as to the liquidity of each restricted security purchased by a Portfolio. If a restricted security is determined to be "liquid," the security will not be included within the category "illiquid securities," which may not exceed, as to each Portfolio (other than the Money Market Portfolio), 15% of the Portfolio's total assets and, as to the Money Market Portfolio, 5% of the Portfolio's net assets, as more fully described under "Fund Policies/Investment Restrictions" below. However, investing in Rule 144A securities could have the effect of increasing the level of Portfolio illiquidity to the extent a Portfolio, at a particular point in time, may be unable to find qualified institutional buyers interested in purchasing such securities.
Warrants and Subscription Rights. Each Portfolio, other than the Money Market Portfolio, may acquire warrants and subscription rights attached to other securities. In addition, each Portfolio, other than the Money Market Portfolio, the Flexible Income Portfolio and the Global Infrastructure Portfolio, may invest up to 5% of its assets in warrants not attached to other securities with a limit of up to 2% of its total assets in warrants that are not listed on the New York Stock Exchange ("NYSE") or other exchange. A warrant is, in effect, an option to purchase equity securities at a specific price, generally valid for a specific period of time, and has no voting rights, pays no dividends and has no rights with respect to the corporation issuing it.
A subscription right is a privilege granted to existing shareholders of a corporation to subscribe to shares of a new issue of common stock before it is offered to the public. A subscription right normally has a life of two to four weeks and a subscription price lower than the current market value of the common stock.
Private Investments in Public Equity. Each Portfolio, other than the Money Market Portfolio and the Flexible Income Portfolio, may purchase equity securities in a private placement that are issued by issuers who have outstanding, publicly-traded equity securities of the same class ("private investments in public equity" or "PIPES"). Shares in PIPES generally are not registered with the SEC until after a certain time period from the date the private sale is completed. This restricted period can last many months. Until the public registration process is completed, PIPES are restricted as to resale and a Portfolio cannot freely trade the securities. Generally such restrictions cause the PIPES to be illiquid during this time. PIPES may contain provisions that the issuer will pay specified financial penalties to the holder if the issuer does not publicly register the restricted equity securities within a specified period of time, but there is no assurance that the restricted equity securities will be publicly registered, or that the registration will remain in effect.
Limited Partnership Interests. Each Portfolio, other than the Money Market Portfolio and the Flexible Income Portfolio, may purchase limited partnerships. A limited partnership interest entitles a Portfolio to participate in the investment return of the partnership's assets as defined by the agreement
24
among the partners. As a limited partner, a Portfolio generally is not permitted to participate in the management of the partnership. However, unlike a general partner whose liability is not limited, a limited partner's liability generally is limited to the amount of its commitment to the partnership. A Portfolio that invests in limited partnership interests may invest to the same extent in limited liability company interests. Limited liability company interests have similar characteristics as limited partnership interests.
Investment Company Securities. Investment company securities are securities of other open-end, closed-end and unregistered investment companies, including foreign investment companies and exchange-traded funds. The Portfolios may invest in investment company securities as may be permitted by (i) the Investment Company Act; (ii) the rules and regulations promulgated by the SEC under the Investment Company Act; or (iii) an exemption or other relief applicable to the Fund from provisions of the Investment Company Act. The Investment Company Act generally prohibits an investment company from acquiring more than 3% of the outstanding voting shares of an investment company and limits such investments to no more than 5% of a portfolio's total assets in any one investment company, and no more than 10% in any combination of investment companies. Each Portfolio may invest in investment company securities of investment companies managed by the Adviser or its affiliates to the extent permitted under the Investment Company Act or as otherwise authorized by the SEC. To the extent the Portfolios invest a portion of their assets in investment company securities, those assets will be subject to the risks of the purchased investment company's portfolio securities, and a shareholder in the Fund will bear not only his proportionate share of the expenses of the Portfolios, but also, indirectly the expenses of the purchased investment company.
To the extent permitted by applicable law, the Portfolios may invest all or some of their short term cash investments in any money market fund advised or managed by the Adviser or its affiliates. In connection with any such investments, a Portfolio, to the extent permitted by the Investment Company Act, will pay its share of all expenses (other than advisory and administrative fees) of a money market fund in which it invests which may result in the Portfolio bearing some additional expenses.
Exchange Traded Funds ("ETFs"). Each Portfolio may invest in shares of various ETFs. Investments in ETFs are subject to a variety of risks, including the risks of a direct investment in the underlying securities that the ETF holds. For example, the general level of stock prices may decline, thereby adversely affecting the value of the underlying investments of the ETF and, consequently, the value of the ETF. In addition, the market value of the ETF shares may differ from their net asset value because the supply and demand in the market for ETF shares at any point is not always identical to the supply and demand in the market for the underlying securities. Also, ETFs that track particular indices typically will be unable to match the performance of the index exactly due to the ETF's operating expenses and transaction costs. ETFs typically incur fees that are separate from those fees incurred directly by the Portfolios. Therefore, as a shareholder in an ETF (as with other investment companies), a Portfolio would bear its ratable share of that entity's expenses. At the same time, the Portfolio would continue to pay its own investment management fees and other expenses. As a result, a Portfolio and its shareholders, in effect, will be absorbing duplicate levels of fees with respect to investments in ETFs.
Contracts for Difference ("CFDs"). Certain Portfolios may purchase CFDs. A CFD is a privately negotiated contract between two parties, buyer and seller, stipulating that the seller will pay to or receive from the buyer the difference between the nominal value of the underlying instrument at the opening of the contract and that instrument's value at the end of the contract. The underlying instrument may be a single security, stock basket or index. A CFD can be set up to take either a short or long position on the underlying instrument. The buyer and seller are both required to post margin, which is adjusted daily. The buyer will also pay to the seller a financing rate on the notional amount of the capital employed by the seller less the margin deposit. A CFD is usually terminated at the buyer's initiative. The seller of the CFD will simply match the exposure of the underlying instrument in the open market and the parties will exchange whatever payment is due.
As is the case with owning any financial instrument, there is the risk of loss associated with buying a CFD. For example, if the Portfolio buys a long CFD and the underlying security is worth less at the end of the contract, the Portfolio would be required to make a payment to the seller and would suffer a loss. Also, there may be liquidity risk if the underlying instrument is illiquid because the liquidity of a CFD is based on the liquidity of the underlying instrument. A further risk is that adverse movements in the underlying security will require the buyer to post additional margin. CFDs also carry counterparty risk, i.e., the risk that the counterparty to the CFD transaction may be unable or unwilling to make payments or to otherwise honor
25
its financial obligations under the terms of the contract. If the counterparty were to do so, the value of the contract, and of the Portfolio's shares, may be reduced.
To the extent that there is an imperfect correlation between the return on the Portfolio's obligation to its counterparty under the CFDs and the return on related assets in its portfolio, the CFD transaction may increase the Portfolio's financial risk. The Portfolio will not enter into a CFD transaction that is inconsistent with its investment objective, policies and strategies.
Municipal Obligations. Municipal obligations are securities issued by state and local governments and their agencies. These securities typically are "general obligation" or "revenue" bonds, notes or commercial paper, including participations in lease obligations and installment purchase contracts of municipalities. These obligations may have fixed, variable or floating rates. To the extent a Portfolio invests in municipal obligations issued by state and local governments and their agencies, the Portfolio may be susceptible to political, economic, regulatory or other factors affecting issuers of these municipal obligations.
Mortgage-Backed Securities ("MBS"). Certain Portfolios may invest in mortgage pass-through securities. These securities represent a participation interest in a pool of residential mortgage loans originated by U.S. governmental or private lenders such as banks. They differ from conventional debt securities, which provide for periodic payment of interest in fixed amounts and principal payments at maturity or on specified call dates. Mortgage pass-through securities provide for monthly payments that are a "pass-through" of the monthly interest and principal payments made by the individual borrowers on the pooled mortgage loans. Mortgage pass-through securities may be collateralized by mortgages with fixed rates of interest or adjustable rates. The Portfolio may invest in mortgage pass-through securities that are issued or guaranteed by the U.S. Government. These securities are either direct obligations of the U.S. Government or the issuing agency or instrumentality has the right to borrow from the U.S. Treasury to meet its obligations although the U.S. Treasury is not legally required to extend credit to the agency or instrumentality. Certain of the U.S. government securities purchased by the Portfolio, such as those issued by the Federal National Mortgage Association ("Fannie Mae") and Federal Home Loan Mortgage Corporation ("Freddie Mac"), are not backed by the full faith and credit of the United States and there is a risk that the U.S. Government will not provide financial support to these agencies if it is not obligated to do so by law. In September 2008, the U.S. Treasury Department announced that the U.S. Government would be taking over Freddie Mac and Fannie Mae and placing the companies into a conservatorship. In addition, the U.S. Treasury announced additional steps that it intended to take with respect to the debt and mortgage-backed securities issued by Fannie Mae and Freddie Mac in order to support the conservatorship. No assurance can be given that these initiatives will be successful. The maximum potential liability of the issuers of some U.S. government securities held by the Portfolio may greatly exceed their current resources, including their legal right to support from the U.S. Treasury. It is possible that these issuers will not have the funds to meet their payment obligations in the future.
To the extent the Portfolio invests in mortgage pass-through securities offered by non-governmental issuers, such as commercial banks, savings and loan institutions, private mortgage insurance companies, mortgage bankers and other secondary market issuers, the Portfolio may be subject to additional risks. Timely payment of interest and principal of non-governmental issuers are supported by various forms of private insurance or guarantees, including individual loan, title, pool and hazard insurance purchased by the issuer. There can be no assurance that the private insurers can meet their obligations under the policies. An unexpectedly high rate of defaults on the mortgages held by a mortgage pool may adversely affect the value of a MBS and could result in losses to the Portfolio. The risk of such defaults is generally higher in the case of mortgage pools that include subprime mortgages. Subprime mortgages refer to loans made to borrowers with weakened credit histories or with a lower capacity to make timely payments on their mortgages.
Collateralized Mortgage Obligations ("CMOs"). The Flexible Income Portfolio may invest in collateralized mortgage obligations ("CMOs"), which are mortgage-backed securities that are collateralized by mortgage loans or mortgage pass-through securities, and multi-class pass-through securities, which are equity interests in a trust composed of mortgage loans or other mortgage-backed securities. Unless the context indicates otherwise, the discussion of CMOs below also applies to multi-class pass through securities.
CMOs may be issued by governmental or government-related entities or by private entities, such as banks, savings and loan institutions, private mortgage insurance companies, mortgage bankers and other
26
secondary market traders. CMOs are issued in multiple classes, often referred to as "tranches," with each tranche having a specific fixed or floating coupon rate and stated maturity or final distribution date. Under the traditional CMO structure, the cash flows generated by the mortgages or mortgage pass-through securities in the collateral pool are used to first pay interest and then pay principal to the holders of the CMOs. Subject to the various provisions of individual CMO issues, the cash flow generated by the underlying collateral (to the extent it exceeds the amount required to pay the stated interest) is used to retire the bonds.
The principal and interest on the underlying collateral may be allocated among the several tranches of a CMO in innumerable ways. In a common CMO structure, the tranches are retired sequentially in the order of their respective stated maturities or final distribution dates (as opposed to the pro-rata return of principal found in traditional pass-through obligations). The fastest-pay tranches would initially receive all principal payments. When those tranches are retired, the next tranches in the sequence receive all of the principal payments until they are retired. The sequential retirement of bond groups continues until the last tranche is retired. Accordingly, the CMO structure allows the issuer to use cash flows of long maturity, monthly-pay collateral to formulate securities with short, intermediate, and long final maturities and expected average lives and risk characteristics.
The primary risk of CMOs is the uncertainty of the timing of cash flows that results from the rate of prepayments on the underlying mortgages serving as collateral and from the structure of the particular CMO transaction (that is, the priority of the individual tranches). An increase or decrease in prepayment rates (resulting from a decrease or increase in mortgage interest rates) may cause the CMOs to be retired substantially earlier than their stated maturities or final distribution dates and will affect the yield and price of CMOs. In addition, if the collateral securing CMOs or any third-party guarantees are insufficient to make payments, the Portfolio could sustain a loss. The prices of certain CMOs, depending on their structure and the rate of prepayments, can be volatile. Some CMOs may also not be as liquid as other types of mortgage securities. As a result, it may be difficult or impossible to sell the securities at an advantageous time or price.
Privately issued CMOs are arrangements in which the underlying mortgages are held by the issuer, which then issues debt collateralized by the underlying mortgage assets. Such securities may be backed by mortgage insurance, letters of credit, or other credit enhancing features. Although payment of the principal of, and interest on, the underlying collateral securing privately issued CMOs may be guaranteed by the U.S. Government or its agencies or instrumentalities, these CMOs represent obligations solely of the private issuer and are not insured or guaranteed by the U.S. Government, its agencies or instrumentalities or any other person or entity. Privately issued CMOs are subject to prepayment risk due to the possibility that prepayments on the underlying assets will alter the cash flow. Yields on privately issued CMOs have been historically higher than the yields on CMOs backed by mortgages guaranteed by U.S. government agencies or instrumentalities. The risk of loss due to default on privately issued CMOs, however, is historically higher since the U.S. Government has not guaranteed them.
New types of CMO tranches have evolved. These include floating rate CMOs, planned amortization classes, accrual bonds and CMO residuals. These newer structures affect the amount and timing of principal and interest received by each tranche from the underlying collateral. For example, an inverse interest-only class CMO entitles holders to receive no payments of principal and to receive interest at a rate that will vary inversely with a specified index or a multiple thereof. Under certain of these newer structures, given classes of CMOs have priority over others with respect to the receipt of prepayments on the mortgages. Therefore, depending on the type of CMOs in which the Portfolio invests, the investment may be subject to a greater or lesser risk of prepayment than other types of mortgage-backed securities.
CMOs may include real estate investment conduits ("REMICs"). REMICs, which were authorized under the Tax Reform Act of 1986, are private entities formed for the purpose of holding a fixed pool of mortgages secured by an interest in real property. A REMIC is a CMO that qualifies for special tax treatment under the Code and invests in certain mortgages principally secured by interests in real property.
Certain Portfolios may invest in, among others, parallel pay CMOs and Planned Amortization Class CMOs ("PAC Bonds"). Parallel pay CMOs are structured to provide payments of principal on each payment date to more than one tranche. These simultaneous payments are taken into account in calculating the stated maturity date or final distribution date of each tranche which, as with other CMO
27
structures, must be retired by its stated maturity date or final distribution date but may be retired earlier. PAC Bonds are a form of parallel pay CMO, with the required principal payment on such securities having the highest priority after interest has been paid to all classes. PAC Bonds generally require payments of a specified amount of principal on each payment date.
Stripped Mortgage-Backed Securities. Certain Portfolios may invest in stripped mortgage-backed securities ("SMBS"). An SMBS is a derivative multi-class mortgage security. SMBS usually are structured with two classes that receive different proportions of the interest and principal distribution on a pool of mortgage assets. In the most extreme case, one class will receive all of the interest (the interest-only or "IO" class), while the other class will receive all of the principal (the principal-only or "PO" class). The yield to maturity on an IO class is extremely sensitive to the rate of principal payments (including prepayments) on the related underlying mortgage assets, and a rapid rate of principal payments may have a material adverse effect on such security's yield to maturity. If the underlying mortgage assets experience greater than anticipated prepayments of principal, the Portfolio may fail to fully recoup its initial investment in these securities. Conversely, if the underlying mortgage assets experience less than anticipated prepayments of principal, the yield of POs could be materially adversely affected. The market values of IOs and POs are subject to greater risk of fluctuation in response to changes in market rates of interest than many other types of government securities. To the extent the Portfolio invests in IOs and POs, this increases the risk of fluctuations in the net asset value of the Portfolio.
Inverse Floaters. Certain Portfolios may invest in inverse floaters. Inverse floating rate obligations are obligations which pay interest at rates that vary inversely with changes in market rates of interest. Because the interest rate paid to holders of such obligations is generally determined by subtracting a variable or floating rate from a predetermined amount, the interest rate paid to holders of such obligations will decrease as such variable or floating rate increases and increase as such variable or floating rate decreases. Like most other fixed-income securities, the value of inverse floaters will decrease as interest rates increase. They are more volatile, however, than most other fixed-income securities because the coupon rate on an inverse floater typically changes at a multiple of the change in the relevant index rate. Thus, any rise in the index rate (as a consequence of an increase in interest rates) causes a correspondingly greater drop in the coupon rate of an inverse floater, while a drop in the index rate causes a correspondingly greater increase in the coupon of an inverse floater. Some inverse floaters may also increase or decrease substantially because of changes in the rate of prepayments.
Commercial Mortgage-Backed Securities ("CMBS"). Certain Portfolios may invest in CMBS. CMBS are generally multi-class or pass-through securities issued by special purpose entities that represent an undivided interest in a portfolio of mortgage loans backed by commercial properties, including, but not limited to, industrial and warehouse properties, office buildings, retail space and shopping malls, hotels, healthcare facilities, multifamily properties and cooperative apartments. Private lenders, such as banks or insurance companies, originate these loans and then sell the loans directly into a CMBS trust or other entity. The commercial mortgage loans that underlie CMBS are generally not amortizing or not fully amortizing. That is, at their maturity date, repayment of the remaining principal balance or "balloon" is due and is repaid through the attainment of an additional loan or sale of this property. An extension of the final payment on commercial mortgages will increase the average life of the CMBS, generally resulting in a lower yield for discount bonds and a higher yield for premium bonds.
CMBS are subject to credit risk and prepayment risk. Although prepayment risk is present, it is of a lesser degree in the CMBS than in the residential mortgage market; commercial real estate property loans often contain provisions which substantially reduce the likelihood that such securities will be prepaid (e.g., significant prepayment penalties on loans and, in some cases, prohibition on principal payments for several years following origination).
Asset-Backed Securities. Certain Portfolios may invest in asset-backed securities. Asset-backed securities utilize the securitization techniques used to develop MBS. These techniques are also applied to a broad range of other assets. Various types of assets, primarily automobile and credit card receivables and home equity loans, are being securitized in pass-through structures similar to the mortgage pass-through structures. These types of securities are known as asset-backed securities. The Portfolio may invest in any type of asset-backed security. Asset-backed securities have risk characteristics similar to MBS. Like MBS, they generally decrease in value as a result of interest rate increases, but may benefit less than other fixed-income securities from declining interest rates, principally because of prepayments.
28
Also, as in the case of MBS, prepayments generally increase during a period of declining interest rates although other factors, such as changes in credit use and payment patterns, may also influence prepayment rates. Asset-backed securities also involve the risk that various federal and state consumer laws and other legal, regulatory and economic factors may result in the collateral backing the securities being insufficient to support payment on the securities.
D. Fund Policies/Investment Restrictions
The investment objectives, policies and restrictions listed below have been adopted by the Fund as fundamental policies of the Portfolios, except as otherwise indicated. Under the Investment Company Act, a fundamental policy of a Portfolio may not be changed without the vote of a majority of the outstanding voting securities of the Portfolio. The Investment Company Act defines a majority as the lesser of (a) 67% or more of the shares of a Portfolio present at a meeting of Portfolio shareholders, if the holders of 50% of the outstanding shares of the Portfolio are present or represented by proxy; or (b) more than 50% of the outstanding shares of the Portfolio. For purposes of the following restrictions: (i) all percentage limitations apply immediately after a purchase or initial investment, and (ii) any subsequent change in any applicable percentage resulting from market fluctuations or other changes in total or net assets does not require elimination of any security from a portfolio, except in the case of borrowing and investments in illiquid securities.
Investment Objectives
The investment objective of each Portfolio is a fundamental policy, which may not be changed without approval of shareholders of that Portfolio.
Restrictions Applicable to All Portfolios
Each Portfolio will not:
1. With the exception of the Focus Growth Portfolio, invest in a manner inconsistent with its classification as a "diversified company" as provided by (i) the Investment Company Act, as amended from time to time, (ii) the rules and regulations promulgated by the SEC under the Investment Company Act, as amended from time to time, or (iii) an exemption or other relief applicable to the Portfolio from the provisions of the Investment Company Act, as amended from time to time.
2. With the exception of the Global Infrastructure Portfolio, which will invest 25% or more of the value of its total assets in the utilities industry, invest 25% or more of the value of its total assets in securities of issuers in any one industry. This restriction does not apply to obligations issued or guaranteed by the U.S. Government or its agencies or instrumentalities or, in the case of the Money Market Portfolio, to domestic bank obligations.
3. Borrow money, except the Portfolio may borrow money to the extent permitted by (i) the Investment Company Act, as amended from time to time, (ii) the rules and regulations promulgated by the SEC under the Investment Company Act, as amended from time to time, or (iii) an exemption or other relief applicable to the Portfolio from the provisions of the Investment Company Act, as amended from time to time.
4. Purchase or sell real estate or interests therein (including limited partnership interests), although the Portfolio(s) may purchase securities of issuers which engage in real estate operations and securities secured by real estate or interests therein (as such, in the case of default of such securities, a Portfolio may hold the real estate securing such security).
5. Issue senior securities, except a Portfolio may issue senior securities to the extent permitted by (i) the Investment Company Act, as amended from time to time, (ii) the rules and regulations promulgated by the SEC under the Investment Company Act, as amended from time to time, or (iii) an exemption or other relief applicable to the Portfolio from the provisions of the Investment Company Act, as amended from time to time.
6. Make loans of money or property to any person, except (a) to the extent that securities or interests in which the Portfolio may invest are considered to be loans, (b) through the loan of portfolio securities, (c) by engaging in repurchase agreements or (d) as may otherwise be permitted by (i) the Investment Company Act, as amended from time to time, (ii) the rules and regulations promulgated by the SEC under the Investment Company Act, as amended from time to time, or (iii) an exemption or other relief applicable to the Portfolio from the provisions of the Investment Company Act, as amended from time to time.
29
7. Purchase or sell physical commodities unless acquired as a result of ownership of securities or other instruments; provided that this restriction shall not prohibit the Portfolio from purchasing or selling options, futures contracts and related options thereon, forward contracts, swaps, caps, floors, collars and any other financial instrument or from investing in securities or other instruments backed by physical commodities or as otherwise permitted by (i) the Investment Company Act, as amended from time to time, (ii) the rules and regulations promulgated by the SEC under the Investment Company Act, as amended from time to time, or (iii) an exemption or other relief applicable to the Portfolio from the provisions of the Investment Company Act, as amended from time to time.
8. Engage in the underwriting of securities, except insofar as a Portfolio may be deemed an underwriter under the Securities Act in disposing of a portfolio security.
Restrictions Applicable to the Money Market Portfolio Only
As a fundamental policy, the Money Market Portfolio may not purchase any securities, other than obligations of domestic banks or of the U.S. Government, or its agencies or instrumentalities, if, immediately after such purchase, more than 25% of the value of the Money Market Portfolio's total assets would be invested in the securities of issuers in the same industry; however, there is no limitation as to investments in domestic bank obligations or in obligations issued or guaranteed by the U.S. Government or its agencies or instrumentalities.
As a non-fundamental policy, the Money Market Portfolio will not invest more than 10% of its total assets in the securities of any one issuer. Furthermore, pursuant to current regulatory requirements, the Money Market Portfolio may only invest more than 5% of its total assets in the securities of a single issuer (and only with respect to one issuer at a time) for period of not more than three business days and only if the securities have received the highest quality rating by at least two NRSROs).
Non-Fundamental Policies
In addition, as non-fundamental policies, which can be changed with Board approval and without shareholder vote, each Portfolio will not:
1. Invest more than 15% (5% in the case of the Money Market Portfolio) of its total assets in "illiquid securities" (securities for which market quotations are not readily available) and repurchase agreements which have a maturity of longer than seven days. For purposes of this policy, securities eligible for sale pursuant to Rule 144A under the Securities Act are not considered illiquid if they are determined to be liquid under procedures adopted by the Trustees of the Fund.
2. Purchase securities of other investment companies, except in connection with a merger, consolidation, reorganization or acquisition of assets or, in the case of the Global Infrastructure Portfolio, in accordance with the provisions of Section 12(d) of the Investment Company Act and any rules promulgated thereunder (e.g., the Portfolio may not invest in more than 3% of the outstanding voting securities of any investment company). For this purpose, mortgage-backed securities and asset-backed securities are not deemed to be investment companies. Notwithstanding the foregoing, to the extent permitted by applicable law, each Portfolio of the Fund may invest all or some of its short term cash investments in any money market fund advised or managed by the Adviser or its affiliates.
3. Make short sales of securities, except short sales against the box.
Each Portfolio has an operating policy, which may be changed by the Fund's Board of Trustees, not to borrow except from a bank for temporary or emergency purposes in amounts not exceeding 5% (taken at the lower of cost or current value) of its total assets (not including the amount borrowed).
The investment policies, limitations or practices of the Portfolios may not apply during periods of unusual or adverse market, economic, political or other conditions. Such market, economic, political or other conditions may include periods of abnormal or heightened market volatility, strained credit and/or liquidity conditions or increased governmental intervention in the markets or industries. During such periods, a Portfolio may not invest according to its principal investment strategies or in the manner in which its name may suggest, and may be subject to different and/or heightened risks. It is possible that such unusual or adverse conditions may continue for extended periods of time.
30
E. Disclosure of Portfolio Holdings
The Fund's Board of Trustees, the Adviser and the Sub-Advisers have adopted policies and procedures regarding disclosure of portfolio holdings (the "Policy"). Pursuant to the Policy, the Adviser and the Sub-Advisers may disclose information concerning Fund portfolio holdings only if such disclosure is consistent with the antifraud provisions of the federal securities laws and the Fund's, the Adviser's and the Sub-Advisers' fiduciary duties to Fund shareholders. In no instance may the Adviser, the Sub-Advisers or the Fund receive compensation or any other consideration in connection with the disclosure of information about the portfolio securities of the Fund. Consideration includes any agreement to maintain assets in the Fund or in other investment companies or accounts managed by the Adviser, Sub-Advisers or by any affiliated person of the Adviser or the Sub-Advisers. Non-public information concerning portfolio holdings may be divulged to third-parties only when the Fund has a legitimate business purpose for doing so and the recipients of the information are subject to a duty of confidentiality. Under no circumstances shall current or prospective Fund shareholders receive non-public portfolio holdings information, except as described below.
The Fund makes available on its public website the following portfolio holdings information:
• complete portfolio holdings information monthly, at least 15 calendar days after the end of each month (except the Money Market Portfolio); and
• top 10 holdings monthly, at least 15 calendar days after the end of each month (except the Money Market Portfolio).
In order to comply with amendments to Rule 2a-7, information concerning the Money Market Portfolio's portfolio holdings, as well as its daily weighted average portfolio maturity and weighted average life, is posted on its public website no later than five business days after the end of each month. It is also the current policy of the Portfolio to post this information on its website on a weekly basis. Also, the Money Market Portfolio provides more detailed portfolio holdings information to the SEC on Form N-MFP within five business days after the end of each month. The SEC makes Form N-MFP filings publicly available on its website two months after the filing and a link to the SEC filing is posted on the Fund's website.
The Fund provides a complete schedule of portfolio holdings for the second and fourth fiscal quarters in its semiannual and annual reports, and for the first and third fiscal quarters in its filings with the SEC on Form N-Q.
All other portfolio holdings information that has not been disseminated in a manner making it available to investors generally as described above is non-public information for purposes of the Policy.
The Fund may make selective disclosure of non-public portfolio holdings information pursuant to certain exemptions set forth in the Policy. Third-parties eligible for exemptions under the Policy and therefore eligible to receive such disclosures currently include fund rating agencies, information exchange subscribers, consultants and analysts, portfolio analytics providers and service providers, provided that the third-party expressly agrees to maintain the disclosed information in confidence and not to trade portfolio securities or related derivative securities based on the non-public information. Non-public portfolio holdings information may not be disclosed to a third-party pursuant to an exemption unless and until the third-party recipient has entered into a non-disclosure agreement with the Fund and the arrangement has been reviewed and approved, as set forth in the Policy and discussed below. In addition, persons who owe a duty of trust or confidence to the Fund, the Adviser or Sub-Advisers may receive non-public portfolio holdings information without entering into a non-disclosure agreement. Currently, these persons include (i) the Fund's independent registered public accounting firm (as of the Fund's fiscal year-end and on an as needed basis), (ii) counsel to the Fund (on an as-needed basis), (iii) counsel to the independent Trustees (on an as-needed basis) and (iv) members of the Board of Trustees (on an as-needed basis). Subject to the terms and conditions of any agreement between the Adviser, the Sub-Advisers or the Fund and the third-party recipient, if these conditions for disclosure are satisfied, there shall be no restriction on the frequency with which Fund non-public portfolio holdings information is released, and no lag period shall apply (unless otherwise indicated below).
The Adviser and Sub-Advisers may provide interest lists to broker-dealers who execute securities transactions for the Fund without entering into a non-disclosure agreement with the broker-dealers, provided that the interest list satisfies all of the following criteria: (1) the interest list must contain only
31
the CUSIP numbers and/or ticker symbols of securities held in all registered management investment companies advised by the Adviser and Sub-Advisers or any affiliate of the Adviser or Sub-Advisers (the "MSIM Funds") on an aggregate, rather than a fund-by-fund basis; (2) the interest list must not contain information about the number or value of shares owned by a specified MSIM Fund; (3) the interest list may identify the investment strategy, but not the particular MSIM Funds, to which the list relates; and (4) the interest list may not identify the portfolio manager or team members responsible for managing the MSIM Funds.
Fund shareholders may elect in some circumstances to redeem their shares of the Fund in exchange for their pro rata share of the securities held by the Fund. Under such circumstances, Fund shareholders may receive a complete listing of the holdings of the Fund up to seven calendar days prior to making the redemption request provided that they represent in writing that they agree not to disclose or trade on the basis of the portfolio holdings information.
The Fund may discuss or otherwise disclose performance attribution analyses (i.e., mention the effects of having a particular security in the portfolio(s)) where such discussion is not contemporaneously made public, provided that the particular holding has been disclosed publicly. Additionally, any discussion of the analyses may not be more current than the date the holding was disclosed publicly.
The Fund may disclose portfolio holdings to transition managers, provided that the Fund has entered into a non-disclosure or confidentiality agreement with the party requesting that the information be provided to the transition manager and the party to the non-disclosure agreement has, in turn, entered into a non-disclosure or confidentiality agreement with the transition manager.
The Adviser and/or the Fund currently have entered into ongoing arrangements with the following parties:
Name | | Information Disclosed | | Frequency(1) | | Lag Time | |
Service Providers | |
RiskMetrics Group
(proxy voting agent)(*) | | Complete portfolio holdings | | Daily basis | | (2) | |
| State Street Bank and Trust Company(*) | | Complete portfolio holdings | | As needed | | (2) | |
| Blackrock Financial Management Inc.(*)(4) | | Complete portfolio holdings | | Daily basis | | (2) | |
Fund Rating Agencies | |
| Lipper(*) | | Top ten and complete portfolio holdings | | Monthly basis | | Approximately six business days after month end | |
Consultants and Analysts | |
| Citigroup(*) | | Complete portfolio holdings | | Quarterly basis(3) | | At least one day after quarter end | |
| Credit Suisse First Boston(*) | | Top ten and complete portfolio holdings | | Monthly and quarterly basis, respectively | | Approximately 10-12 days after month/quarter end | |
| Evaluation Associates(*) | | Top ten and complete portfolio holdings | | Monthly and quarterly basis, respectively(3) | | Approximately 10-12 days after month/quarter end | |
| Merrill Lynch(*) | | Top ten and complete portfolio holdings | | Monthly and quarterly basis, respectively(3) | | Approximately 10-12 days after month/quarter end | |
Portfolio Analytics Providers | |
| FactSet Research Systems, Inc.(*) | | Complete portfolio holdings | | Daily basis | | One day | |
(*) This entity has agreed to maintain Fund non-public portfolio holdings information in confidence and not to trade portfolio securities based on the non-public portfolio holdings information.
(1) Dissemination of portfolio holdings information to entities listed above may occur less frequently than indicated (or not at all).
(2) Information will typically be provided on a real time basis or as soon thereafter as possible.
(3) This information will also be provided upon request from time to time.
(4) With respect to the Money Market and Flexible Income Portfolios, only.
In addition, the following insurance companies, which are deemed service providers to the Fund, receive top ten portfolio holdings information, on a quarterly basis, approximately 15 days after quarter
32
end: Hartford Insurance Company and Hartford Life and Annuity Insurance Company. The Fund does not currently have non-disclosure agreements in place with these entities and therefore, these entities can only receive publicly available information.
All disclosures of non-public portfolio holdings information made to third-parties pursuant to the exemptions set forth in the Policy must be reviewed by Morgan Stanley Investment Management's ("MSIM") Legal and Compliance Division and approved by the Head of the Long-Only Business of MSIM. Disclosures made to third-parties in connection with (i) broker-dealer interest lists; (ii) shareholder in-kind distributions; (iii) attribution analyses; or (iv) transitions managers are pre-approved for purposes of the Policy. In addition, the following categories of third-parties that may receive non-public portfolio holdings information are also pre-approved provided that they enter into non-disclosure agreements (as discussed above) (i) fund rating agencies; (ii) information exchange subscribers; (iii) consultants and analysts (including defined benefit and defined contribution plan sponsors, and variable annuity providers); (iv) portfolio analytics providers; and (v) service providers.
The Adviser and the Sub-Advisers shall report quarterly to the Board of Trustees (or a designated committee thereof) at the next regularly scheduled meeting: (i) any material information concerning all parties receiving non-public portfolio holdings information pursuant to an exemption; and (ii) any new non-disclosure agreements entered into during the reporting period. Procedures to monitor the use of such non-public portfolio holdings information may include requiring annual certifications that the recipients have utilized such information only pursuant to the terms of the agreement between the recipient and the Adviser and, for those recipients receiving information electronically, acceptance of the information will constitute reaffirmation that the third-party expressly agrees to maintain the disclosed information in confidence and not to trade portfolio securities based on the non-public information.
III. MANAGEMENT OF THE FUND
A. Board of Trustees
General. The Board of Trustees of the Fund oversees the management of the Portfolios, but does not itself manage each Portfolio. The Trustees review various services provided by or under the direction of the Adviser to ensure that each Portfolio's general investment policies and programs are properly carried out. The Trustees also conduct their review to ensure that administrative services are provided to each Portfolio in a satisfactory manner.
Under state law, the duties of the Trustees are generally characterized as a duty of loyalty and a duty of care. The duty of loyalty requires a Trustee to exercise his or her powers in the interest of the Fund and each Portfolio and not the Trustee's own interest or the interest of another person or organization. A Trustee satisfies his or her duty of care by acting in good faith with the care of an ordinarily prudent person and in a manner the Trustee reasonably believes to be in the best interest of the Fund and each Portfolio and its shareholders.
Trustees and Officers. The Board of the Fund consists of 10 Trustees. These same individuals also serve as directors or trustees for certain of the funds advised by the Adviser and Morgan Stanley AIP GP LP. Nine Trustees have no affiliation or business connection with the Adviser or any of its affiliated persons and do not own any stock or other securities issued by the Adviser's parent company, Morgan Stanley. These are the "non-interested" or "Independent Trustees." The other Trustee (the "Interested Trustee") is affiliated with the Adviser.
Board Structure and Oversight Function. The Board's leadership structure features an Independent Trustee serving as Chairperson and the Board Committees described below. The Chairperson participates in the preparation of the agenda for meetings of the Board and the preparation of information to be presented to the Board with respect to matters to be acted upon by the Board. The Chairperson also presides at all meetings of the Board and is involved in discussions regarding matters pertaining to the oversight of the management of the Fund between meetings.
The Board of Trustees operates using a system of committees to facilitate the timely and efficient consideration of all matters of importance to the Trustees, the Fund and Fund shareholders, and to facilitate compliance with legal and regulatory requirements and oversight of the Fund's activities and associated risks. The Board of Trustees has established five standing committees: (1) Audit Committee, (2) Governance Committee, (3) Compliance and Insurance Committee, (4) Investment Committee and
33
(5) Closed-End Fund Committee. The Audit Committee, the Governance Committee and the Closed-End Fund Committee are comprised exclusively of Independent Trustees. Each committee charter governs the scope of the committee's responsibilities with respect to the oversight of the Fund. The responsibilities of each committee, including their oversight responsibilities, are described further under the caption "Independent Trustees and the Committees."
The Fund is subject to a number of risks, including investment, compliance, operational and valuation risk, among others. The Board of Trustees oversees these risks as part of its broader oversight of the Fund's affairs through various Board and committee activities. The Board has adopted, and periodically reviews, policies and procedures designed to address various risks to the Fund. In addition, appropriate personnel, including but not limited to the Fund's Chief Compliance Officer, members of the Fund's administration and accounting teams, representatives from the Fund's independent registered public accounting firm, the Fund's Treasurer, portfolio management personnel and independent valuation and brokerage evaluation service providers, make regular reports regarding the Fund's activities and related risks to the Board of Trustees and the committees, as appropriate. These reports include, among others, quarterly performance reports, quarterly derivatives activity and risk reports and discussions with members of the risk teams relating to each asset class. The Board's committee structure allows separate committees to focus on different aspects of risk and the potential impact of these risks on some or all of the funds in the complex and then report back to the full Board. In between regular meetings, Fund officers also communicate with the Trustees regarding material exceptions and items relevant to the Board's risk oversight function. The Board recognizes that it is not possible to identify all of the risks that may affect the Fund, and that it is not possible to develop processes and controls to eliminate all of the risks that may affect the Fund. Moreover, the Board recognizes that it may be necessary for the Fund to bear certain risks (such as investment risks) to achieve its investment objective.
As needed between meetings of the Board, the Board or a specific committee receives and reviews reports relating to the Fund and engages in discussions with appropriate parties relating to the Fund's operations and related risks.
B. Management Information
Independent Trustees. The Fund seeks as Trustees individuals of distinction and experience in business and finance, government service or academia. In determining that a particular Trustee was and continues to be qualified to serve as Trustee, the Board has considered a variety of criteria, none of which, in isolation, was controlling. Based on a review of the experience, qualifications, attributes or skills of each Trustee, including those enumerated in the table below, the Board has determined that each of the Trustees is qualified to serve as a Trustee of the Fund. In addition, the Board believes that, collectively, the Trustees have balanced and diverse experience, qualifications, attributes and skills that allow the Board to operate effectively in governing the Fund and protecting the interests of shareholders. Information about the Fund's Governance Committee and Board of Trustees nomination process is provided below under the caption "Independent Trustees and the Committees."
The Trustees of the Fund, their ages, addresses, terms of office and lengths of time served, their principal business occupations during the past five years, the number of portfolios in the Fund Complex (defined below) overseen by each Independent Trustee (as of December 31, 2012) and other directorships, if any, held by the Trustees, are shown below. The Fund Complex includes all open-end and closed-end funds (including all of their portfolios) advised by the Adviser and any registered funds that have an investment adviser that is an affiliate of the Adviser (including, but not limited to, Morgan Stanley AIP GP LP ("Morgan Stanley AIP Funds")) (collectively, the "Morgan Stanley Funds").
34
Independent Trustees:
Name, Age and Address of
Independent Trustee | | Position(s)
Held with
Registrant | | Length of
Time
Served* | | Principal Occupation(s)
During Past 5 Years | | Number of
Portfolios
in Fund
Complex
Overseen by
Independent
Trustee | | Other Directorships Held
by Independent Trustee** | |
Frank L. Bowman (68)
c/o Kramer Levin Naftalis & Frankel LLP
Counsel to the Independent Trustees
1177 Avenue of the Americas
New York, NY 10036 | | Trustee | | Since August 2006 | | President, Strategic Decisions, LLC (consulting) (since February 2009); Director or Trustee of various Morgan Stanley Funds (since August 2006); Chairperson of the Insurance Sub-Committee of the Compliance and Insurance Committee (since February 2007); served as President and Chief Executive Officer of the Nuclear Energy Institute (policy organization) (February 2005-November 2008); retired as Admiral, U.S. Navy after serving over 38 years on active duty including 8 years as Director of the Naval Nuclear Propulsion Program in the Department of the Navy and the U.S. Department of Energy (1996-2004); served as Chief of Naval Personnel (July 1994-September 1996); and on the Joint Staff as Director of Politicial Military Affairs (June 1992-July 1994); knighted as Honorary Knight Commander of the Most Excellent Order of the British Empire; awarded the Officier de I'Orde National du Mérite by the French Government; elected to the National Academy of Engineering (2009). | | | 101 | | | Director BP p.l.c.; Director of Naval and Nuclear Technologies LLP; Director of the Armed Services YMCA of the USA and the U.S. Naval Submarine League; Director of the American Shipbuilding Suppliers Association; Member of the National Security Advisory Council of the Center for U.S. Global Engagement and a member of the CNA Military Advisory Board. | |
Michael Bozic (72)
c/o Kramer Levin Naftalis & Frankel LLP
Counsel to the Independent Trustees
1177 Avenue of the Americas
New York, NY 10036 | | Trustee | | Since April 1994 | | Private investor and a member of the advisory board of American Road Group LLC (retail) (since June 2000); Chairperson of the Compliance and Insurance Committee (since October 2006); Director or Trustee of various Morgan Stanley Funds (since April 1994); formerly, Chairperson of the Insurance Committee (July 2006-September 2006); Vice Chairman of Kmart Corporation (December 1998-October 2000), Chairman and Chief Executive Officer of Levitz Furniture Corporation (November 1995-November 1998) and President and Chief Executive Officer of Hills Department Stores (May 1991-July 1995); variously Chairman, Chief Executive Officer, President and Chief Operating Officer (1987-1991) of the Sears Merchandise Group of Sears, Roebuck & Co. | | | 103 | | | Trustee and member of the Hillsdale College Board of Trustees. | |
* Each Trustee serves an indefinite term, until his or her successor is elected.
** This includes any directorships at public companies and registered investment companies held by the Trustee at any time during the past five years.
35
Name, Age and Address of
Independent Trustee | | Position(s)
Held with
Registrant | | Length of
Time
Served* | | Principal Occupation(s)
During Past 5 Years | | Number of
Portfolios
in Fund
Complex
Overseen by
Independent
Trustee | | Other Directorships Held
by Independent Trustee** | |
Kathleen A. Dennis (59)
c/o Kramer Levin Naftalis & Frankel LLP
Counsel to the Independent Trustees
1177 Avenue of the Americas
New York, NY 10036 | | Trustee | | Since August 2006 | | President, Cedarwood Associates (mutual fund and investment management consulting) (since July 2006); Chairperson of the Money Market and Alternatives Sub-Committee of the Investment Committee (since October 2006) and Director or Trustee of various Morgan Stanley Funds (since August 2006); formerly, Senior Managing Director of Victory Capital Management (1993-2006). | | | 101 | | | Director of various
non-profit organizations. | |
Dr. Manuel H. Johnson (64)
c/o Johnson Smick Group, Inc.
888 16th Street, N.W. Suite 740
Washington, D.C. 20006 | | Trustee | | Since July 1991 | | Senior Partner, Johnson Smick International, Inc. (consulting firm); Chairperson of the Investment Committee (since October 2006) and Director or Trustee of various Morgan Stanley Funds (since July 1991); Co-Chairman and a founder of the Group of Seven Council (G7C) (international economic commission); formerly, Chairperson of the Audit Committee (July 1991-September 2006); Vice Chairman of the Board of Governors of the Federal Reserve System and Assistant Secretary of the U.S. Treasury. | | | 103 | | | Director of NVR, Inc. (home construction). | |
Joseph J. Kearns (70)
c/o Kearns & Associates LLC
PMB754
22631 Pacific Coast Highway
Malibu, CA 90265 | | Trustee | | Since August 1994 | | President, Kearns & Associates LLC (investment consulting); Chairperson of the Audit Committee (since October 2006) and Director or Trustee of various Morgan Stanley Funds (since August 1994); formerly, Deputy Chairperson of the Audit Committee (July 2003-September 2006) and Chairperson of the Audit Committee of various Morgan Stanley Funds (since August 1994); CFO of the J. Paul Getty Trust. | | | 104 | | | Director of Electro Rent Corporation (equipment leasing) and The Ford Family Foundation. | |
* Each Trustee serves an indefinite term, until his or her successor is elected.
** This includes any directorships at public companies and registered investment companies held by the Trustee at any time during the past five years.
36
Name, Age and Address of
Independent Trustee | | Position(s)
Held with
Registrant | | Length of
Time
Served* | | Principal Occupation(s)
During Past 5 Years | | Number of
Portfolios
in Fund
Complex
Overseen by
Independent
Trustee | | Other Directorships Held
by Independent Trustee** | |
Michael F. Klein (54)
c/o Kramer Levin Naftalis &
Frankel LLP
Counsel to the Independent Trustees
1177 Avenue of the Americas
New York, NY 10036 | | Trustee | | Since August 2006 | | Managing Director, Aetos Capital, LLC (since March 2000) and Co-President, Aetos Alternatives Management, LLC (since January 2004); Chairperson of the Fixed Income Sub-Committee of the Investment Committee (since October 2006) and Director or Trustee of various Morgan Stanley Funds (since August 2006); formerly, Managing Director, Morgan Stanley & Co. Inc. and Morgan Stanley Dean Witter Investment Management, President, various Morgan Stanley Funds (June 1998-March 2000) and Principal, Morgan Stanley & Co. Inc. and Morgan Stanley Dean Witter Investment Management (August 1997-December 1999). | | | 101 | | | Director of certain investment funds managed or sponsored by Aetos Capital, LLC; Director of Sanitized AG and Sanitized Marketing AG (specialty chemicals). | |
Michael E. Nugent (76)
522 Fifth Avenue
New York, NY 10036 | | Chairperson of the Board and Trustee | | Chairperson of the Boards since July 2006 and Trustee since July 1991 | | General Partner, Triumph Capital, L.P. (private investment partnership); Chairperson of the Boards of various Morgan Stanley Funds (since July 2006); Chairperson of the Closed-End Fund Committee (since June 2012) and Director or Trustee of various Morgan Stanley Funds (since July 1991); formerly, Chairperson of the Insurance Committee (until July 2006). | | | 103 | | | None. | |
W. Allen Reed (66)
c/o Kramer Levin Naftalis & Frankel LLP
Counsel to the Independent Trustees
1177 Avenue of the Americas
New York, NY 10036 | | Trustee | | Since August 2006 | | Chairperson of the Equity Sub-Committee of the Investment Committee (since October 2006) and Director or Trustee of various Morgan Stanley Funds (since August 2006); formerly, President and CEO of General Motors Asset Management; Chairman and Chief Executive Officer of the GM Trust Bank and Corporate Vice President of General Motors Corporation (August 1994-December 2005). | | | 101 | | | Director of Temple-Inland Industries (packaging and forest products), Director of Legg Mason, Inc. and Director of the Auburn University Foundation. | |
Fergus Reid (80)
c/o Joe Pietryka, Inc.
85 Charles Colman Blvd.
Pawling, NY 12564 | | Trustee | | Since June 1992 | | Chairman, Joe Pietryka, Inc.; Chairperson of the Governance Committee and Director or Trustee of various Morgan Stanley Funds (since June 1992). | | | 104 | | | Through December 31, 2012, Trustee and Director of certain investment companies in the JP Morgan Fund complex. | |
* Each Trustee serves an indefinite term, until his or her successor is elected.
** This includes any directorships at public companies and registered investment companies held by the Trustee at any time during the past five years.
37
Interested Trustee:
Name, Age and Address of
Interested Trustee | | Position(s)
Held with
Registrant | | Length of
Time
Served* | | Principal Occupation(s)
During Past 5 Years | | Number of
Portfolios
in Fund
Complex
Overseen by
Interested
Trustee | | Other Directorships Held
by Interested Trustee** | |
James F. Higgins (65)
c/o Morgan Stanley Services Company Inc.
Harborside Financial Center
201 Plaza Two
Jersey City, NJ 07311 | | Trustee | | Since June 2000 | | Director or Trustee of various Morgan Stanley Funds (since June 2000); Senior Advisor of Morgan Stanley (since August 2000). | | | 102 | | | Director of AXA Financial, Inc. and The Equitable Life Assurance Society of the United States (financial services). | |
* Each Trustee serves an indefinite term, until his or her successor is elected.
** This includes any directorships at public companies and registered investment companies held by the Trustee at any time during the past five years.
The executive officers of the Fund, their ages, addresses, positions held, terms of office and lengths of time served, and their principal business occupations during the past five years are shown below.
Executive Officers:
Name, Age and Address of
Executive Officer | | Position(s)
Held with
Registrant | | Length of
Time
Served* | | Principal Occupation(s)
During Past 5 Years | |
Arthur Lev (51)
522 Fifth Avenue
New York, NY 10036 | | President and Principal Executive Officer — Equity, Fixed Income and AIP Funds | | Since June 2011 | | President and Principal Executive Officer of the Equity and Fixed Income Funds (since June 2011) and the Morgan Stanley AIP Funds (since February 2013) in the Fund Complex; Head of the Long-Only Business of Morgan Stanley Investment Management (since February 2011) and Head of Morgan Stanley AIP (since February 2013); Managing Director of the Adviser and various entities affiliated with the Adviser (since December 2006) and Director of the Adviser and various entities affiliated with the Adviser (since March 2013). Formerly, Chief Strategy Officer of Morgan Stanley Investment Management's Traditional Asset Management business (November 2010-February 2011); General Counsel of Morgan Stanley Investment Management (December 2006-October 2010); Partner and General Counsel of FrontPoint Partners LLC (July 2002-December 2006); Managing Director and General Counsel of Morgan Stanley Investment Management (May 2000-June 2002). | |
Mary Ann Picciotto (40)
522 Fifth Avenue
New York, NY 10036 | | Chief Compliance Officer | | Since May 2010 | | Managing Director of the Adviser and various entities affiliated with the Adviser; Chief Compliance Officer of various Morgan Stanley Funds (since May 2010); Chief Compliance Officer of the Adviser (since April 2007). | |
Stefanie V. Chang Yu (46)
522 Fifth Avenue
New York, NY 10036 | | Vice President | | Since December 1997 | | Managing Director of the Adviser and various entities affiliated with the Adviser; Vice President of various Morgan Stanley Funds (since December 1997). | |
* Each Officer serves an indefinite term, until his or her successor is elected.
38
Name, Age and Address of
Executive Officer | | Position(s)
Held with
Registrant | | Length of
Time
Served* | | Principal Occupation(s)
During Past 5 Years | |
Francis J. Smith (47)
c/o Morgan Stanley Services Company Inc.
Harborside Financial Center
201 Plaza Two
Jersey City, NJ 07311 | | Treasurer and Principal Financial Officer | | Treasurer since July 2003 and Principal Financial Officer since September 2002 | | Executive Director of the Adviser and various entities affiliated with the Adviser; Treasurer and Principal Financial Officer of various Morgan Stanley Funds (since July 2003). | |
Mary E. Mullin (46)
522 Fifth Avenue
New York, NY 10036 | | Secretary | | Since June 1999 | | Executive Director of the Adviser and various entities affiliated with the Adviser; Secretary of various Morgan Stanley Funds (since June 1999). | |
* Each officer serves an indefinite term, until his or her successor is elected.
In addition, the following individuals who are officers of the Adviser or its affiliates serve as assistant secretaries of the Fund: Joanne Antico, Joseph C. Benedetti, Daniel E. Burton, Tara A. Farrelly and Edward J. Meehan.
For each Trustee, the dollar range of equity securities beneficially owned by the Trustee in the Fund and in the Family of Investment Companies (Family of Investment Companies includes all of the registered investment companies advised by the Adviser and Morgan Stanley AIP GP LP) for the calendar year ended December 31, 2012, is set forth in the table below.
Name of Trustee | | Dollar Range of Equity Securities in the Fund
(As of December 31, 2012) | | Aggregate Dollar Range of Equity Securities in
All Registered Investment Companies Overseen
by Trustee in Family of Investment Companies
(As of December 31, 2012) | |
Independent: | |
| Frank L. Bowman(1) | | None | | over $100,000 | |
Michael Bozic | | None | | over $100,000 | |
Kathleen A. Dennis | | None | | over $100,000 | |
Manuel H. Johnson | | None | | over $100,000 | |
| Joseph J. Kearns(1) | | None | | over $100,000 | |
Michael F. Klein | | None | | over $100,000 | |
Michael E. Nugent | | None | | over $100,000 | |
| W. Allen Reed(1) | | None | | over $100,000 | |
| Fergus Reid(1) | | None | | over $100,000 | |
Interested: | |
James F. Higgins | | None | | over $100,000 | |
(1) Includes the total amount of compensation deferred by the Trustee at his election pursuant to a deferred compensation plan. Such deferred compensation is placed in a deferral account and deemed to be invested in one or more of the Morgan Stanley Funds (or portfolio thereof) that are offered as investment options under the plan.
As to each Independent Trustee and his or her immediate family members, no person owned beneficially or of record securities of an investment adviser or principal underwriter of the Fund, or a person (other than a registered investment company) directly or indirectly controlling, controlled by or under common control with an investment adviser or principal underwriter of the Fund.
Independent Trustees and the Committees. Law and regulation establish both general guidelines and specific duties for the Independent Trustees. The Board has five committees: (1) Audit Committee, (2) Governance Committee, (3) Compliance and Insurance Committee, (4) Investment Committee and (5) Closed-End Fund Committee.
The Independent Trustees are charged with recommending to the full Board approval of management, advisory and administration contracts, Rule 12b-1 plans and distribution and underwriting agreements; continually reviewing fund performance; checking on the pricing of portfolio securities, brokerage commissions, transfer agent costs and performance, and trading among funds in the same complex; and approving fidelity bond and related insurance coverage and allocations, as well as other matters that arise from time to time. The Independent Trustees are required to select and nominate individuals to fill any Independent Trustee vacancy on the board of any fund that has a Rule 12b-1 plan of distribution.
39
The Board of Trustees has a separately-designated standing Audit Committee established in accordance with Section 3(a)(58)(A) of the Securities Exchange Act of 1934, as amended (the "1934 Act"). The Audit Committee is charged with recommending to the full Board the engagement or discharge of the Fund's independent registered public accounting firm; directing investigations into matters within the scope of the independent registered public accounting firm's duties, including the power to retain outside specialists; reviewing with the independent registered public accounting firm the audit plan and results of the auditing engagement; approving professional services provided by the independent registered public accounting firm and other accounting firms prior to the performance of the services; reviewing the independence of the independent registered public accounting firm; considering the range of audit and non-audit fees; reviewing the adequacy of the Fund's system of internal controls; and reviewing the valuation process. The Fund has adopted a formal, written Audit Committee Charter.
The members of the Audit Committee of the Fund are Joseph J. Kearns, Michael F. Klein, Michael E. Nugent and W. Allen Reed. None of the members of the Fund's Audit Committee is an "interested person," as defined under the Investment Company Act, of the Fund (with such disinterested Trustees being "Independent Trustees" or individually, an "Independent Trustee"). Each Independent Trustee is also "independent" from the Fund under the listing standards of the NYSE. The Chairperson of the Audit Committee of the Fund is Joseph J. Kearns.
The Board of Trustees of the Fund also has a Governance Committee. The Governance Committee identifies individuals qualified to serve as Independent Trustees on the Fund's Board and on committees of such Board and recommends such qualified individuals for nomination by the Fund's Independent Trustees as candidates for election as Independent Trustees, advises the Fund's Board with respect to Board composition, procedures and committees, develops and recommends to the Fund's Board a set of corporate governance principles applicable to the Fund, monitors and makes recommendations on corporate governance matters and policies and procedures of the Fund's Board of Trustees and any Board committees and oversees periodic evaluations of the Fund's Board and its committees. The members of the Governance Committee of the Fund are Kathleen A. Dennis and Fergus Reid, each of whom is an Independent Trustee. The Chairperson of the Governance Committee is Fergus Reid.
The Fund does not have a separate nominating committee. While the Fund's Governance Committee recommends qualified candidates for nominations as Independent Trustees, the Board of Trustees of the Fund believes that the task of nominating prospective Independent Trustees is important enough to require the participation of all current Independent Trustees, rather than a separate committee consisting of only certain Independent Trustees. Accordingly, each Independent Trustee (Frank L. Bowman, Michael Bozic, Kathleen A. Dennis, Manuel H. Johnson, Joseph J. Kearns, Michael F. Klein, Michael E. Nugent, W. Allen Reed and Fergus Reid) participates in the election and nomination of candidates for election as Independent Trustees for the Fund. Persons recommended by the Fund's Governance Committee as candidates for nomination as Independent Trustees shall possess such experience, qualifications, attributes, skills and diversity so as to enhance the Board's ability to manage and direct the affairs and business of the Fund, including, when applicable, to enhance the ability of committees of the Board to fulfill their duties and/or to satisfy any independence requirements imposed by law, regulation or any listing requirements of the NYSE. While the Independent Trustees of the Fund expect to be able to continue to identify from their own resources an ample number of qualified candidates for the Fund's Board as they deem appropriate, they will consider nominations from shareholders to the Board. Nominations from shareholders should be in writing and sent to the Independent Trustees as described below under the caption "Shareholder Communications."
The Board formed the Compliance and Insurance Committee to address insurance coverage and oversee the compliance function for the Fund and the Board. The Compliance and Insurance Committee consists of Frank L. Bowman, Michael Bozic, James F. Higgins and Manuel H. Johnson. Frank L. Bowman, Michael Bozic and Manuel H. Johnson are Independent Trustees. The Chairperson of the Compliance and Insurance Committee is Michael Bozic. The Compliance and Insurance Committee has an Insurance Sub-Committee to review and monitor the insurance coverage maintained by the Fund. The Chairperson of the Insurance Sub-Committee is Frank L. Bowman.
The Investment Committee oversees the portfolio investment process for and reviews the performance of the Fund. The Investment Committee also recommends to the Board to approve or renew the Fund's Investment Advisory, Sub-Advisory and Administration Agreements. The members of the Investment Committee are Frank L. Bowman, Michael Bozic, Kathleen A. Dennis, James F. Higgins, Manuel H. Johnson,
40
Joseph J. Kearns, Michael F. Klein, Michael E. Nugent, W. Allen Reed and Fergus Reid. The Chairperson of the Investment Committee is Manuel H. Johnson.
The Investment Committee has three Sub-Committees, each with its own Chairperson. Each Sub-Committee focuses on the funds' primary areas of investment, namely equities, fixed income and alternatives. The Sub-Committees and their members are as follows:
(1) Equity — W. Allen Reed (Chairperson), Frank L. Bowman and Michael E. Nugent.
(2) Fixed Income — Michael F. Klein (Chairperson), Michael Bozic and Fergus Reid.
(3) Money Market and Alternatives — Kathleen A. Dennis (Chairperson), James F. Higgins and Joseph J. Kearns.
The Board formed the Closed-End Fund Committee to consider a range of issues unique to closed-end funds. The Closed-End Fund Committee consists of Michael E. Nugent, W. Allen Reed and Fergus Reid, each of whom is an Independent Trustee. The Chairperson of the Closed-End Fund Committee is Michael E. Nugent.
During the Fund's fiscal year ended December 31, 2012, the Board of Trustees held the following meetings:
Board of Trustees | | | 8 | | |
Committee/Sub-Committee: | | Number of meetings: | |
Audit Committee | | | 4 | | |
Governance Committee | | | 4 | | |
Compliance and Insurance Committee | | | 4 | | |
Insurance Sub-Committee | | | 1 | | |
Investment Committee | | | 5 | | |
| Equity Sub-Committee | | | 6 | | |
| Fixed Income Sub-Committee | | | 6 | | |
| Money Market and Alternatives Sub-Committee | | | 5 | | |
Closed-End Fund Committee | | | 2 | | |
Experience, Qualifications and Attributes. The Board has concluded, based on each Trustee's experience, qualifications and attributes that each Board member should serve as a Trustee. Following is a brief summary of the information that led to and/or supports this conclusion.
Mr. Bowman has experience in a variety of business and financial matters through his prior service as a Director or Trustee for various other funds in the Fund Complex, where he serves as Chairperson of the Insurance Sub-Committee of the Compliance and Insurance Committee, and as a Director of B.P. p.l.c. and Naval and Nuclear Technologies LLP. Mr. Bowman also serves as a Director for the Armed Services YMCA of the USA, the U.S. Naval Submarine League and the American Shipbuilding Suppliers Association. Mr. Bowman is also a member of the National Security Advisory Council of the Center for U.S. Global Engagement and a member of the CNA Military Advisory Board. Mr. Bowman retired as an Admiral in the U.S. Navy after serving over 38 years on active duty including eight years as Director of the Naval Nuclear Propulsion Program in the Department of the Navy and the U.S. Department of Energy (1996-2004). Additionally, Mr. Bowman served as the U.S. Navy's Chief of Naval Personnel (1994-1996) where he was responsible for the planning and programming of all manpower, personnel, training and education resources for the U.S. Navy, and on the Joint Staff as Director of Political Military Affairs (1992-1994). In addition, Mr. Bowman served as President and Chief Executive Officer of the Nuclear Energy Institute. Mr. Bowman has received such distinctions as a knighthood as Honorary Knight Commander of the Most Excellent Order of the British Empire and the Officier de l'Orde National du Mérite from the French Government and was elected to the National Academy of Engineering (2009). He is President of the consulting firm Strategic Decisions, LLC.
41
With over 20 years of experience on the boards and in senior management of such companies as Kmart Corporation, Levitz Furniture Corporation, Hills Department Stores and Sears Merchandise Group of Sears, Roebuck & Co., where Mr. Bozic also served as Chief Financial Officer of the Merchandise Group, and with nearly 20 years of experience as a Director or Trustee of certain other funds in the Fund Complex, Mr. Bozic has experience with a variety of financial, management, regulatory and operational issues as well as experience with marketing and distribution. Mr. Bozic has served as the Chairperson of the Compliance and Insurance Committee since 2006.
Ms. Dennis has over 25 years of business experience in the financial services industry and related fields including serving as a Director or Trustee of various other funds in the Fund Complex, where she serves as Chairperson of the Money Market and Alternatives Sub-Committee of the Investment Committee. Ms. Dennis possesses a strong understanding of the regulatory framework under which investment companies must operate based on her years of service to this Board and her position as Senior Managing Director of Victory Capital Management.
In addition to his tenure as a Director or Trustee of various other funds in the Fund Complex, where he formerly served as Chairperson of the Audit Committee, Dr. Johnson has also served as an officer or a board member of numerous companies for over 20 years. These positions included Co-Chairman and a founder of the Group of Seven Council, Director of NVR, Inc., Director of Evergreen Energy and Director of Greenwich Capital Holdings. He also has served as Vice Chairman of the Board of Governors of the Federal Reserve System and Assistant Secretary of the U.S. Treasury. In addition, Dr. Johnson also served as Chairman of the Financial Accounting Foundation, which oversees the Financial Accounting Standards Board, for seven years.
Mr. Kearns gained extensive experience regarding accounting through his experience on the Audit Committees of the boards of other funds in the Funds Complex, including serving as either Chairperson or Deputy Chairperson of the Audit Committee for nearly 20 years, and through his position as Chief Financial Officer of the J. Paul Getty Trust. He also has experience in financial, accounting, investment and regulatory matters through his position as President and founder of Kearns & Associates LLC, a financial consulting company. Mr. Kearns also serves as a Director of Electro Rent Corporation and The Ford Family Foundation. The Board has determined that Mr. Kearns is an "audit committee financial expert" as defined by the SEC.
Through his prior positions as Managing Director of Morgan Stanley & Co. Inc. and Morgan Stanley Dean Witter Investment Management and as President of Morgan Stanley Institutional Funds, Mr. Klein has experience in the management and operation of registered investment companies, enabling him to provide management input and investment guidance to the Board. Mr. Klein also has extensive experience in the investment management industry based on his current positions as Managing Director of Aetos Capital, LLC and as Director of certain investment funds managed or sponsored by Aetos Capital, LLC. In addition, he also has experience as a member of the board of other funds in the Fund Complex.
Mr. Nugent has extensive experience with financial, accounting, investment and regulatory matters through his over 20 years of service on the boards of various funds in the Fund Complex, including time as the Chairperson of the Insurance Committee, Chairperson of the Closed-End Fund Committee and Chairperson of the Morgan Stanley Funds. Mr. Nugent also has experience as a General Partner in Triumph Capital, L.P.
Mr. Reed has experience on investment company boards and is experienced with financial, accounting, investment and regulatory matters through his prior service as a Director of iShares, Inc. and his service as Trustee or Director of other funds in the Fund Complex. Mr. Reed also gained substantial experience in the financial services industry through his position as Director of Legg Mason, Inc. and prior position as President and CEO of General Motors Asset Management.
Mr. Reid has served on a number of mutual fund boards, including as a Trustee or Director of certain investment companies in the JP Morgan Funds complex and as a Trustee or Director of other funds in the Fund Complex. Therefore, Mr. Reid is experienced with financial, accounting, investment and regulatory matters, enabling him to provide management input and investment guidance to the Board.
Mr. Higgins has over 30 years of experience in the financial services industry. Mr. Higgins has substantial mutual fund experience and is experienced with financial, accounting, investment and regulatory matters due to his experience on the boards of other funds in the Fund Complex. Mr. Higgins also serves on the boards of other companies in the financial services industry, including AXA Financial, Inc. and The Equitable Life Assurance Society of the United States.
42
The Trustees' principal occupations during the past five years or more are shown in the above tables.
Advantages of Having the Same Individuals as Trustees for the Morgan Stanley Funds. The Independent Trustees and the Fund's management believe that having the same Independent Trustees for each of the Morgan Stanley Funds avoids the duplication of effort that would arise from having different groups of individuals serving as Independent Trustees for each of the funds or even of sub-groups of funds. They believe that having the same individuals serve as Independent Trustees of all the Morgan Stanley Funds tends to increase their knowledge and expertise regarding matters which affect the Fund Complex generally and enhances their ability to negotiate on behalf of each fund with the fund's service providers. This arrangement also precludes the possibility of separate groups of Independent Trustees arriving at conflicting decisions regarding operations and management of the funds and avoids the cost and confusion that would likely ensue. Finally, having the same Independent Trustees serve on all fund boards enhances the ability of each fund to obtain, at modest cost to each separate fund, the services of Independent Trustees of the caliber, experience and business acumen of the individuals who serve as Independent Trustees of the Morgan Stanley Funds.
Trustee and Officer Indemnification. The Fund's Declaration of Trust provides that no Trustee, Officer, employee or agent of the Fund is liable to the Fund or to a shareholder, nor is any Trustee, Officer, employee or agent liable to any third persons in connection with the affairs of the Fund, except as such liability may arise from his/her or its own bad faith, willful misfeasance, gross negligence or reckless disregard of his/her or its duties. It also provides that all third persons shall look solely to Fund property for satisfaction of claims arising in connection with the affairs of the Fund. With the exceptions stated, the Declaration of Trust provides that a Trustee, officer, employee or agent is entitled to be indemnified against all liability in connection with the affairs of the Fund.
Shareholder Communications. Shareholders may send communications to the Fund's Board of Trustees. Shareholders should send communications intended for the Fund's Board by addressing the communications directly to the Board (or individual Board members) and/or otherwise clearly indicating in the salutation that the communication is for the Board (or individual Board members) and by sending the communication to either the Fund's office or directly to such Board member(s) at the address specified for each Trustee previously noted. Other shareholder communications received by the Fund not directly addressed and sent to the Board will be reviewed and generally responded to by management, and will be forwarded to the Board only at management's discretion based on the matters contained therein.
C. Compensation
Effective January 1, 2013, each Trustee (except for the chairperson of the Boards) receives an annual retainer fee of $220,000 for serving as a Trustee of the Morgan Stanley Funds. Prior to January 1, 2013, each Trustee (except for the Chairperson of the Boards) received an annual retainer fee of $210,000 for serving as a Trustee of the Morgan Stanley Funds.
The Chairperson of the Audit Committee receives an additional annual retainer fee of $78,750 and the Investment Committee Chairperson receives an additional annual retainer fee of $63,000. Other Committee and Sub-Committee Chairpersons receive an additional annual retainer fee of $31,500. The aggregate compensation paid to each Trustee is paid by the Morgan Stanley Funds, and is allocated on a pro rata basis among each of the operational funds/portfolios of the Morgan Stanley Funds based on the relative net assets of each of the funds/portfolios. Michael E. Nugent receives a total annual retainer fee of $440,000 ($420,000 prior to January 1, 2013) for his services as Chairperson of the Boards of the Morgan Stanley Funds and for administrative services provided to each Board.
The Fund also reimburses such Trustees for travel and other out-of-pocket expenses incurred by them in connection with attending such meetings. Trustees of the Fund who are employed by the Adviser receive no compensation or expense reimbursement from the Fund for their services as Trustee.
Effective April 1, 2004, the Fund began a Deferred Compensation Plan (the "DC Plan"), which allows each Trustee to defer payment of all, or a portion, of the fees he or she receives for serving on the Board of Trustees throughout the year. Each eligible Trustee generally may elect to have the deferred amounts credited with a return equal to the total return on one or more of the Morgan Stanley Funds (or portfolios thereof) that are offered as investment options under the DC Plan. At the Trustee's election, distributions are either in one lump sum payment, or in the form of equal annual installments over a period of five years. The rights of an eligible Trustee and the beneficiaries to the amounts held under the DC Plan are unsecured and such amounts are subject to the claims of the creditors of the Fund.
43
Prior to April 1, 2004, certain Morgan Stanley Funds maintained a similar Deferred Compensation Plan (the "Prior DC Plan"), which also allowed each Independent Trustee to defer payment of all, or a portion, of the fees he or she received for serving on the Board of Trustees throughout the year. Generally, the DC Plan amends and supersedes the Prior DC Plan and all amounts payable under the Prior DC Plan are now subject to the terms of the DC Plan (except for amounts paid during the calendar year 2004, which remain subject to the terms of the Prior DC Plan).
The following table shows aggregate compensation payable to each of the Fund's Trustees from the Fund for the fiscal year ended December 31, 2012 and the aggregate compensation payable to each of the funds' Trustees by the Fund Complex (which includes all of the Morgan Stanley Funds) for the calendar year ended December 31, 2012.
Compensation(1)
Name of Independent Trustee: | | Aggregate
Compensation
From the Fund(2) | | Total
Compensation
From Fund and Fund
Complex Paid to Trustee(3) | |
Frank L. Bowman | | $ | 625 | | | $ | 241,500 | | |
| Michael Bozic | | | 615 | | | | 241,500 | | |
| Kathleen A. Dennis | | | 625 | | | | 241,500 | | |
| Manuel H. Johnson | | | 695 | | | | 273,000 | | |
| Joseph J. Kearns(3) | | | 735 | | | | 312,000 | | |
| Michael F. Klein | | | 625 | | | | 241,500 | | |
| Michael E. Nugent | | | 1,070 | | | | 420,000 | | |
| W. Allen Reed(2)(3) | | | 499 | | | | 181,125 | | |
| Fergus Reid(3) | | | 615 | | | | 274,750 | | |
Name of Interested Trustee: | |
| James F. Higgins | | | 536 | | | | 210,000 | | |
(1) Includes all amounts paid for serving as director/trustee of the funds, as well as serving as Chairperson of the Boards or a Chairperson of a Committee or Sub-Committee.
(2) The amounts shown in this column represent the aggregate compensation before deferral with respect to the Fund's fiscal year. The following Trustee deferred compensation from the Fund during the fiscal year ended December 31, 2012: Mr. Reed, $499.
(3) The amounts shown in this column represent the aggregate compensation paid by all of the funds in the Fund Complex as of December 31, 2012 before deferral by the Trustees under the DC Plan. As of December 31, 2012, the value (including interest) of the deferral accounts across the Fund Complex for Messrs. Kearns, Reed and Reid pursuant to the deferred compensation plan was $594,589, $969,468 and $619,208, respectively. Because the funds in the Fund Complex have different fiscal year ends, the amounts shown in this column are presented on a calendar year basis.
Prior to December 31, 2003, 49 of the Morgan Stanley Funds (the "Adopting Funds"), not including the Fund, had adopted a retirement program under which an Independent Trustee who retired after serving for at least five years as an Independent Trustee of any such fund (an "Eligible Trustee") would have been entitled to retirement payments, based on factors such as length of service, upon reaching the eligible retirement age. On December 31, 2003, the amount of accrued retirement benefits for each Eligible Trustee was frozen, and will be payable, together with a return of 8% per annum, at or following each such Eligible Trustee's retirement as shown in the table below.
The following table illustrates the retirement benefits accrued to the Fund's Independent Trustees by the Adopting Funds for the fiscal year ended December 31, 2012, and the estimated retirement benefits for the Independent Trustees from the Adopting Funds for each fiscal year following retirement. Only the Trustees listed below participated in the retirement program.
| Name of Independent Trustee: | | Retirement Benefits Accrued as
Fund Expenses
By All Adopting
Funds | | Estimated Annual Benefits Upon
Retirement(1)
From All Adopting
Funds | |
Michael Bozic | | $ | 42,107 | | | $ | 43,940 | | |
Manuel H. Johnson | | | 30,211 | | | | 64,338 | | |
Michael E. Nugent | | | 6,804 | | | | 57,539 | | |
(1) Total compensation accrued under the retirement plan, together with a return of 8% per annum, will be paid annually commencing upon retirement and continuing for the remainder of the Trustee's life.
44
IV. CONTROL PERSONS AND PRINCIPAL HOLDERS OF SECURITIES
As of the date of this SAI, Hartford Life Insurance Company and Hartford Life and Annuity Insurance Company owned all of the outstanding shares of each Class of each Portfolio of the Fund for allocation to their respective separate accounts ("Accounts"), none of the Fund's Trustees was a Contract Owner under the Accounts and the aggregate number of shares of each Portfolio of the Fund allocated to Contracts owned by the Fund's officers as a group was less than one percent of each Portfolio's outstanding Class X or Class Y shares.
The address of Hartford Life Insurance Company ("Hartford Life") and Hartford Life and Annuity Insurance Company ("Hartford Life and Annuity") is 200 Hopmeadow Street, Simsbury, CT 06089.
Hartford Life and Hartford Life and Annuity owned the shares of each Class of each Portfolio of the Fund in the following percentages as of March 30, 2013:
Class/Portfolio | | Hartford Life | | Hartford Life
and Annuity | |
Class X: Money Market Portfolio | | | 12.34 | % | | | 86.25 | % | |
Class Y: Money Market Portfolio | | | 6.78 | % | | | 92.88 | % | |
Class X: Flexible Income Portfolio | | | 9.44 | % | | | 90.46 | % | |
Class Y: Flexible Income Portfolio | | | 6.18 | % | | | 93.63 | % | |
Class X: Global Infrastructure Portfolio | | | 9.61 | % | | | 89.68 | % | |
Class Y: Global Infrastructure Portfolio | | | 9.55 | % | | | 90.45 | % | |
Class X: Growth Portfolio | | | 11.85 | % | | | 86.94 | % | |
Class Y: Growth Portfolio | | | 0.00 | % | | | 97.54 | % | |
Class X: Focus Growth Portfolio | | | 9.97 | % | | | 88.15 | % | |
Class Y: Focus Growth Portfolio | | | 6.89 | % | | | 92.94 | % | |
Class X: Multi Cap Growth Portfolio | | | 13.57 | % | | | 84.61 | % | |
Class Y: Multi Cap Growth Portfolio | | | 10.72 | % | | | 89.28 | % | |
Class X: Mid Cap Growth Portfolio | | | 10.29 | % | | | 89.11 | % | |
Class Y: Mid Cap Growth Portfolio | | | 8.12 | % | | | 91.88 | % | |
V. INVESTMENT ADVISORY AND OTHER SERVICES
A. Adviser, Sub-Advisers and Administrator
The Adviser to each Portfolio is Morgan Stanley Investment Management Inc., a Delaware corporation, whose address is 522 Fifth Avenue, New York, NY 10036. The Adviser is a wholly-owned subsidiary of Morgan Stanley, a Delaware corporation traded on the NYSE under the symbol "MS." Morgan Stanley is a preeminent global financial services firm engaged in securities trading and brokerage activities, as well as providing investment banking, research and analysis, financing and financial advisory services.
The Sub-Advisers of the Global Infrastructure Portfolio are Morgan Stanley Investment Management Limited, located at 25 Cabot Square, Canary Wharf, London, E14 4QA, England and Morgan Stanley Investment Management Company, Located at 23 Church Street, 16-01 Capital Square, Singapore 049481. Each is a wholly owned subsidiary of Morgan Stanley.
Pursuant to an Investment Advisory Agreement (the "Investment Advisory Agreement") with the Adviser, the Fund has retained the Adviser to manage and/or oversee the investment of the Fund's assets, including the placing of orders for the purchase and sale of portfolio securities. The Fund pays the Adviser monthly compensation calculated daily by applying the following annual rates to the net assets of each Portfolio determined as of the close of each business day. The investment advisory fee is allocated among the Classes of each Portfolio pro rata based on the net assets of the Portfolio attributable to each Class.
45
Name of Portfolio | | Investment Advisory Fee Rates | |
Money Market
| | 0.45% of the portion of daily net assets not
exceeding $250 million; 0.375% of the portion of
daily net assets exceeding $250 million but not
exceeding $750 million; 0.325% of the portion of
the daily net assets exceeding $750 million but not
exceeding $1.25 billion; 0.30% of the portion of
daily net assets exceeding $1.25 billion but not
exceeding $1.5 billion; and 0.275% of the portion
of daily net assets exceeding $1.5 billion. | |
| | The Portfolio's Distributor, Adviser and the Administrator
have agreed to waive and/or reimburse all or a portion of
the Portfolio's distribution fee, advisory fee and
administration fee, respectively, to the extent that
total expenses exceed total income on a daily
basis. These fee waivers and/or expense
reimbursements will continue for at least one year
or until such time as the Fund's Board of Trustees
acts to discontinue all or a portion of such waivers
and/or reimbursements when it deems such action
is appropriate. | |
Flexible Income | | 0.32% of the daily net assets. | |
Global Infrastructure
| | 0.57% of the portion of daily net assets not
exceeding $500 million; 0.47% of the portion of
daily net assets exceeding $500 million but not
exceeding $1 billion; 0.445% of the portion of daily
net assets exceeding $1 billion but not exceeding
$1.5 billion; 0.42% of the portion of daily net
assets exceeding $1.5 billion but not exceeding
$2.5 billion; 0.395% of the portion of daily net assets
exceeding $2.5 billion but not exceeding $3.5 billion;
0.37% of the portion of daily net
assets exceeding $3.5 billion but not exceeding
$5 billion; and 0.345% of the portion of daily net
assets exceeding $5 billion. | |
Growth
| | 0.50% of the portion of daily net assets not
exceeding $1 billion; 0.45% of the portion of daily
net assets exceeding $1 billion but not exceeding
$2 billion; 0.40% of the portion of daily net assets
exceeding $2 billion but not exceeding $3 billion; and
0.35% of the portion of daily net assets
exceeding $3 billion. | |
Focus Growth
| | 0.545% of the portion of daily net assets not
exceeding $250 million; 0.42% of the portion of
the daily net assets exceeding $250 million but not
exceeding $2.5 billion; 0.395% of the daily net
assets exceeding $2.5 billion but not exceeding
$3.5 billion; 0.37% of the portion of daily net
assets exceeding $3.5 billion but not exceeding
$4.5 billion; and 0.345% of the portion of the daily
net assets exceeding $4.5 billion. | |
46
Name of Portfolio | | Investment Advisory Fee Rates | |
Multi Cap Growth
| | 0.67% of the portion of daily net assets not
exceeding $500 million; 0.645% of the portion of
daily net assets exceeding $500 million but not
exceeding $2 billion; 0.62% of the portion of daily
net assets exceeding $2 billion but not exceeding
$3 billion; and 0.595% of the portion of daily net
assets exceeding $3 billion. | |
Mid Cap Growth
| | 0.42% of the portion of daily net assets not
exceeding $500 million; and 0.395% of the portion
of daily net assets exceeding $500 million. | |
The following table reflects for each Portfolio (i) the advisory fee paid; and (ii) the advisory fee waived and/or affiliated rebates for each of the past three fiscal years ended December 31, 2010, 2011 and 2012.
| | Advisory Fees Paid
(After Fee Waivers and/or
Affiliated Rebates | | Advisory Fees Waived | | Affiliated Rebates | |
Name of Portfolio | | 2010 | | 2011 | | 2012 | | 2010 | | 2011 | | 2012 | | 2010 | | 2011 | | 2012 | |
| Money Market | | $ | 182,975 | | | $ | 78,122 | | | $ | 62,000 | | | $ | 353,882 | | | $ | 343,281 | | | $ | 274,295 | | | $ | 0 | | | $ | 0 | | | $ | 0 | | |
| Flexible Income | | | 92,428 | | | | 81,309 | | | | 73,948 | | | | 0 | | | | 0 | | | | 0 | | | | 577 | | | | 661 | | | | 883 | | |
| Global Infrastructure | | | 178,637 | | | | 164,331 | | | | 155,265 | | | | 0 | | | | 0 | | | | 0 | | | | 464 | | | | 461 | | | | 402 | | |
| Growth | | | 139,156 | | | | 131,697 | | | | 109,527 | | | | 0 | | | | 0 | | | | 0 | | | | 728 | | | | 777 | | | | 801 | | |
| Focus Growth | | | 476,898 | | | | 468,970 | | | | 395,036 | | | | 0 | | | | 0 | | | | 0 | | | | 2,141 | | | | 3,233 | | | | 2,572 | | |
| Multi Cap Growth | | | 141,205 | | | | 137,249 | | | | 112,727 | | | | 0 | | | | 0 | | | | 0 | | | | 627 | | | | 696 | | | | 778 | | |
| Mid Cap Growth | | | 128,522 | | | | 139,037 | | | | 108,890 | | | | 0 | | | | 0 | | | | 0 | | | | 1,297 | | | | 1,039 | | | | 1,285 | | |
Pursuant to sub-advisory agreements (each, a "Sub-Advisory Agreement") between the Adviser and each of the Sub-Advisers, the Sub-Advisers have been retained, subject to the overall supervision of the Adviser and the Trustees of the Global Infrastructure Portfolio, to, together with the Adviser, continuously furnish investment advice concerning individual security selections, asset allocations and economic trends and management of the Global Infrastructure Portfolio. The Adviser pays the Sub-Advisers on a monthly basis a portion of the net advisory fees the Adviser receives from the Global Infrastructure Portfolio.
Administration services are provided to the Fund by Morgan Stanley Services Company Inc. ("Administrator"), a wholly-owned subsidiary of the Adviser, pursuant to a separate administration agreement ("Administration Agreement") entered into by the Fund with the Administrator. The Fund pays the Administrator monthly compensation of 0.08% of daily net assets (0.05% with respect to the Money Market Portfolio).
For the fiscal years ended December 31, 2010, 2011 and 2012, the Fund paid compensation under the Administration Agreement as follows:
| | | Compensation Paid for the Fiscal Year
Ended December 31, | |
Name of Portfolio | | 2010 | | 2011 | | 2012 | |
| Money Market | | $ | 59,651 | (1) | | $ | 40,997 | (1) | | $ | 37,366 | (1) | |
| Flexible Income | | | 23,251 | | | | 20,493 | | | | 18,708 | | |
| Global Infrastructure | | | 25,137 | | | | 23,129 | | | | 21,848 | | |
| Growth | | | 22,381 | | | | 21,196 | | | | 17,652 | | |
| Focus Growth | | | 70,318 | | | | 69,314 | | | | 58,364 | | |
| Multi Cap Growth | | | 16,935 | | | | 16,471 | | | | 13,553 | | |
| Mid Cap Growth | | | 24,728 | | | | 26,681 | | | | 20,986 | | |
(1) For the fiscal years ended December 31, 2010, 2011 and 2012, the administration fees paid reflect a waiver of $0, $5,826 and $835, respectively.
Under a Sub-Administration Agreement between the Administrator and State Street Bank and Trust Company ("State Street"), State Street provides certain administrative services to the Fund. For such services, the Administrator pays State Street a portion of the fee the Administrator receives from the Fund.
47
B. Principal Underwriter
The Fund's principal underwriter is the Distributor (which has the same address as the Adviser). In this capacity, each Portfolio's shares are distributed by the Distributor. The Distributor has entered into a selected dealer agreement with Morgan Stanley Smith Barney LLC and Morgan Stanley & Co., which through their own sales organizations sell shares of the Fund. In addition, the Distributor may enter into similar agreements with other selected broker-dealers. The Distributor, a Delaware corporation, is a wholly-owned subsidiary of Morgan Stanley.
The Fund and the Distributor have agreed to indemnify each other against certain liabilities, including liabilities under the Securities Act. Under the Distribution Agreement, the Distributor uses its best efforts in rendering services to the Fund, but in the absence of willful misfeasance, bad faith, gross negligence or reckless disregard of its obligations, the Distributor is not liable to the Fund or any of its shareholders for any error of judgment or mistake of law or for any act or omission or for any losses sustained by the Portfolios or their shareholders.
C. Services Provided by the Adviser, Sub-Advisers and Administrator
The Adviser manages the investment of each Portfolio's assets (other than the Global Infrastructure Portfolio), including the placing of orders for the purchase and sale of portfolio securities. The Adviser obtains and evaluates the information and advice relating to the economy, securities markets and specific securities as it considers necessary or useful to continuously manage the assets of each Portfolio in a manner consistent with each Portfolio's respective investment objective.
Under the terms of the Administration Agreement, the Administrator maintains certain of the Fund's books and records and furnishes, at its own expense, the office space, facilities, equipment, clerical help and bookkeeping as the Fund may reasonably require in the conduct of its business. The Administrator also assists in the preparation of prospectuses, proxy statements and reports required to be filed with federal and state securities commissions (except insofar as the participation or assistance of the independent registered public accounting firm and attorneys is, in the opinion of the Administrator, necessary or desirable). The Administrator also bears the cost of telephone service, heat, light, power and other utilities provided to the Fund.
With respect to the Global Infrastructure Portfolio, the Sub-Advisers have been retained, subject to the overall supervision of the Adviser, to continuously furnish investment advice concerning individual security selections, asset allocations, overall economic trends and to manage the Portfolio's portfolio.
Expenses not expressly assumed by the Adviser under the Investment Advisory Agreement, by the Sub-Advisers for the Global Infrastructure Portfolio under the Sub-Advisory Agreements, or by the Administrator under the Administration Agreement or by the Distributor, will be paid by the Portfolios. Each Portfolio pays all expenses incurred in its operation and a portion of the Fund's general administration expenses allocated based on the asset sizes of the Portfolios. The Portfolios' direct expenses include, but are not limited to: expenses of the Plan of Distribution pursuant to Rule 12b-1; charges and expenses of any registrar, custodian, transfer and dividend disbursing agent; brokerage commissions; certain taxes; registration costs of the Fund under federal and state securities laws; shareholder servicing costs, charges and expenses of any outside service used for pricing of the Portfolios' shares; fees and expenses of legal counsel, including counsel to the Trustees who are not interested persons of the Fund or of the Adviser (or the Sub-Advisers) (not including compensation or expenses of attorneys who are employees of the Adviser (or the Sub-Advisers)); fees and expenses of the Fund's independent registered public accounting firm; interest on Portfolio borrowings; and all other expenses attributable to a particular Portfolio. The 12b-1 fees relating to Class Y will be allocated directly to Class Y. In addition, other expenses associated with a particular Class (except advisory or custodial fees) may be allocated directly to that Class, provided that such expenses are reasonably identified as specifically attributable to that Class and the direct allocation to that Class is approved by the Trustees.
Expenses which are allocated on the basis of size of the respective Portfolios include the costs and expenses of printing, including typesetting, and distributing prospectuses and statements of additional information of the Fund and supplements thereto to the Fund's shareholders; all expenses of shareholders' and Trustees' meetings and of preparing, printing and mailing proxy statements and reports to shareholders; fees and travel expenses of Trustees or members of any advisory board or committee who
48
are not employees of the Adviser (or the Sub-Advisers) or any corporate affiliate of the Adviser (or the Sub-Advisers); state franchise taxes; SEC fees; membership dues of industry associations; postage; insurance premiums on property or personnel (including officers and Trustees) of the Fund which inure to its benefit; and all other costs of the Fund's operations properly payable by the Fund and allocable on the basis of size to the respective Portfolios. Depending on the nature of a legal claim, liability or lawsuit, litigation costs, payment of legal claims or liabilities and any indemnification relating thereto may be directly applicable to the Portfolio or allocated on the basis of the size of the respective Portfolios. The Trustees have determined that this is an appropriate method of allocation of expenses.
The Investment Advisory Agreement and the Sub-Advisory Agreements provide that in the absence of willful misfeasance, bad faith, gross negligence or reckless disregard of their obligations thereunder, the Adviser and the Sub-Advisers, respectively, are not liable to the Fund or any of its investors (and, in the case of the Sub-Advisory Agreements, to the Adviser) for any act or omission by the Adviser or for any losses sustained by the Fund or its investors.
The Investment Advisory Agreement and Sub-Advisory Agreements will remain in effect from year to year provided continuance of the applicable Agreement is approved at least annually by the vote of the holders of a majority, as defined in the Investment Company Act, of the outstanding shares of each affected Portfolio, or by the Trustees; provided that in either event such continuance is approved annually by the vote of a majority of the Independent Trustees.
The Administration Agreement provides that in the absence of willful misfeasance, bad faith, gross negligence or reckless disregard of its obligations thereunder, the Administrator is not liable to the Fund or any of its investors for any act or omission by the Administrator or for any losses sustained by the Fund or its investors. The Administration Agreement will continue unless terminated by either party by written notice delivered to the other party within 30 days.
D. Rule 12b-1 Plan
The Fund has adopted a Plan of Distribution, effective July 31, 2011, pursuant to Rule 12b-1 under the Investment Company Act (the "Plan"). Under the Plan, Class Y shares of each Portfolio bear a distribution fee paid to the Distributor which is accrued daily and payable monthly at the annual rate of 0.25% of the average daily net assets of the Class.
Prior to July 31, 2011, in accordance with Rule 12b-1 under the Investment Company Act, the Fund had adopted a Plan of Distribution with respect to the Class Y shares between the Fund and Morgan Stanley Distributors Inc. (the "Prior Distributor"), pursuant to which the Prior Distributor provided certain services in connection with the promotion and sale of the Fund's Class Y shares (the "Prior Plan").
The Plan provides that each Portfolio's distribution fee shall compensate the Distributor, Morgan Stanley Smith Barney LLC and its affiliates, and other selected broker-dealers for expenses they incur in connection with the distribution of the Portfolio's Class Y shares. These expenses may include: (i) costs incurred in providing personal services to shareholders; (ii) overhead and other branch office distribution-related expenses including, but not limited to, expenses of operating the Distributor's or other broker-dealers' offices used for selling Portfolio shares (e.g, lease and utility costs, salaries and employee benefits of operations and sales support personnel, costs relating to client sales seminars and telephone expenses); (iii) printing and mailing costs relating to prospectuses and reports (for new shareholders); and (iv) costs incurred in connection with advertising materials and sales literature. In addition, payments to the Distributor may be used by the Distributor to compensate insurance companies for shareholder services, which include, but are not limited to, education of agents concerning the Portfolios, compensation of agents, and servicing contract owners.
Under the Plan and as required by Rule 12b-1 the Distributor provides the Fund, for review by the Trustees, and the Trustees review, promptly after the end of each calendar quarter, a written report regarding the distribution expenses incurred under the Plan on behalf of each Portfolio during such calendar quarter, which report includes (1) an itemization of the types of expenses and the purposes therefor; (2) the amounts of such expenses; and (3) a description of the benefits derived by the Fund.
49
For the fiscal year ended December 31, 2012, Class Y shares of the following Portfolios made payments under the Plan as follows:
Name of Portfolio: | | Compensation paid
for the fiscal year ended
December 31, 2012 | |
Money Market | | $ | 0 | (1) | |
| Flexible Income | | | 31,076 | | |
| Global Infrastructure | | | 19,181 | | |
| Growth | | | 30,842 | | |
| Focus Growth | | | 41,050 | | |
| Multi Cap Growth | | | 22,415 | | |
| Mid Cap Growth | | | 18,571 | | |
(1) The distribution fee of $123,507 was fully waived.
On an annual basis, the Trustees, including a majority of the Independent Trustees, consider whether the Plan should be continued. Prior to approving the last continuation of the Plan, the Trustees requested and received from the Distributor and reviewed all the information which they deemed necessary to arrive at an informed determination. In making their determination to continue the Plan, the Trustees considered: (1) the Portfolios' experience under the Plan and whether such experience indicates that the Plan is operating as anticipated; (2) the benefits each Portfolio had obtained, was obtaining and would be likely to obtain under the Plan, including that (a) the Plan is essential in order to give Portfolio investors a choice of alternatives for payment of distribution and service charges and to enable each Portfolio to continue to grow and avoid a pattern of net redemptions which, in turn, are essential for effective investment management; and (b) without the compensation to individual brokers and the reimbursement of distribution and account maintenance expenses of Morgan Stanley Smith Barney LLC branch offices made possible by the 12b-1 fees, Morgan Stanley Smith Barney LLC could not establish and maintain an effective system for distribution, servicing of Contract Owners and maintenance of their accounts; and (3) what services had been provided and were continuing to be provided under the Plan to each Portfolio and its respective Contract Owners. Based upon their review, the Trustees, including each of the Independent Trustees, determined that continuation of the Plan would be in the best interests of each Portfolio and would have a reasonable likelihood of continuing to benefit each Portfolio and its respective Contract Owners.
The Plan may not be amended to increase materially the amount to be spent for the services described therein without approval by the Class Y shareholders of each affected Portfolio, and all material amendments to the Plan must also be approved by the Trustees. The Plan may be terminated as to a Portfolio at any time, without payment of any penalty, by vote of a majority of the Independent Trustees or by a vote of a majority of the outstanding voting securities of the Portfolio (as defined in the Investment Company Act) on not more than 30 days' written notice to any other party to the Plan. So long as the Plan is in effect, the election and nomination of Independent Trustees shall be committed to the discretion of the Independent Trustees.
No interested person of the Fund nor any Independent Trustee has any direct financial interest in the operation of the Plan except to the extent that the Distributor, the Adviser, the Sub-Advisers Morgan Stanley, Morgan Stanley Smith Barney LLC, Morgan Stanley Services or certain of their employees may be deemed to have such an interest as a result of benefits derived from the successful operation of the Plan or as a result of receiving a portion of the amounts expended thereunder by the Portfolios.
E. Other Service Providers
(1) Transfer Agent/Dividend Disbursing Agent
Morgan Stanley Services Company Inc., P.O. Box 219886, Kansas City, MO 64121-9886, is the Transfer Agent for each Portfolio's shares and the Dividend Disbursing Agent for payment of dividends and distributions on Portfolio shares.
(2) Custodian and Independent Registered Public Accounting Firm
State Street Bank and Trust Company, One Lincoln Street, Boston, MA 02111, is the Custodian of each Portfolio's assets. Any Portfolio's cash balances with the Custodian in excess of $250,000 (a temporary
50
increase from $100,000, which is due to expire on December 31, 2013) are unprotected by federal deposit insurance. These balances may, at times, be substantial.
Ernst & Young LLP, located at 200 Clarendon Street, Boston, MA 02116-5021, is the independent registered public accounting firm of the Fund. The Fund's independent registered public accounting firm is responsible for auditing the annual financial statements.
(3) Affiliated Persons
The Transfer Agent is an affiliate of the Adviser, the Sub-Advisers and the Distributor. As Transfer Agent and Dividend Disbursing Agent, the Transfer Agent's responsibilities include maintaining shareholder accounts, reinvesting dividends, processing account registration changes, handling purchase and redemption transactions, tabulating proxies and maintaining shareholder records and lists. For these services, the Transfer Agent receives a per shareholder account fee from each Portfolio and is reimbursed for its out-of-pocket expenses in connection with such services.
F. Fund Management
Other Accounts Managed by Portfolio Managers at December 31, 2012 (unless otherwise indicated):
| | | Registered
Investment Companies | | Other Pooled
Investment Vehicles | | Other Accounts | |
Portfolio and
Portfolio Managers | | Number of
Accounts | | Total Assets
in the Accounts | | Number of
Accounts | | Total Assets
in the Accounts | | Number of
Accounts | | Total Assets
in the Accounts | |
Growth: | |
Sam G. Chainani | | | 32 | | | $16.9 billion | | | 4 | | | $5.4 billion | | | 11 | | | $1.0 billion | |
David S. Cohen | | | 32 | | | $16.9 billion | | | 4 | | | $5.4 billion | | | 11 | | | $1.0 billion | |
Dennis P. Lynch | | | 32 | | | $16.9 billion | | | 4 | | | $5.4 billion | | | 11 | | | $1.0 billion | |
Armistead B. Nash | | | 32 | | | $16.9 billion | | | 4 | | | $5.4 billion | | | 11 | | | $1.0 billion | |
Alexander T. Norton | | | 32 | | | $16.9 billion | | | 4 | | | $5.4 billion | | | 11 | | | $1.0 billion | |
Jason C. Yeung | | | 32 | | | $16.9 billion | | | 4 | | | $5.4 billion | | | 11 | | | $1.0 billion | |
Focus Growth | |
Sam G. Chainani | | | 32 | | | $16.8 billion | | | 4 | | | $5.4 billion | | | 11 | | | $1.0 billion | |
David S. Cohen | | | 32 | | | $16.8 billion | | | 4 | | | $5.4 billion | | | 11 | | | $1.0 billion | |
Dennis P. Lynch | | | 32 | | | $16.8 billion | | | 4 | | | $5.4 billion | | | 11 | | | $1.0 billion | |
Armistead B. Nash | | | 32 | | | $16.8 billion | | | 4 | | | $5.4 billion | | | 11 | | | $1.0 billion | |
Alexander T. Norton | | | 32 | | | $16.8 billion | | | 4 | | | $5.4 billion | | | 11 | | | $1.0 billion | |
Jason C. Yeung | | | 32 | | | $16.8 billion | | | 4 | | | $5.4 billion | | | 11 | | | $1.0 billion | |
Multi Cap Growth | |
Sam G. Chainani | | | 32 | | | $16.9 billion | | | 4 | | | $5.4 billion | | | 11 | | | $1.0 billion | |
David S. Cohen | | | 32 | | | $16.9 billion | | | 4 | | | $5.4 billion | | | 11 | | | $1.0 billion | |
Dennis P. Lynch | | | 32 | | | $16.9 billion | | | 4 | | | $5.4 billion | | | 11 | | | $1.0 billion | |
Armistead B. Nash | | | 32 | | | $16.9 billion | | | 4 | | | $5.4 billion | | | 11 | | | $1.0 billion | |
Alexander T. Norton | | | 32 | | | $16.9 billion | | | 4 | | | $5.4 billion | | | 11 | | | $1.0 billion | |
Jason C. Yeung | | | 32 | | | $16.9 billion | | | 4 | | | $5.4 billion | | | 11 | | | $1.0 billion | |
Mid Cap Growth | |
Sam G. Chainani | | | 32 | | | $16.9 billion | | | 4 | | | $5.4 billion | | | 11 | | | $1.0 billion | |
David S. Cohen | | | 32 | | | $16.9 billion | | | 4 | | | $5.4 billion | | | 11 | | | $1.0 billion | |
Dennis P. Lynch | | | 32 | | | $16.9 billion | | | 4 | | | $5.4 billion | | | 11 | | | $1.0 billion | |
Armistead B. Nash | | | 32 | | | $16.9 billion | | | 4 | | | $5.4 billion | | | 11 | | | $1.0 billion | |
Alexander T. Norton | | | 32 | | | $16.9 billion | | | 4 | | | $5.4 billion | | | 11 | | | $1.0 billion | |
Jason C. Yeung | | | 32 | | | $16.9 billion | | | 4 | | | $5.4 billion | | | 11 | | | $1.0 billion | |
Flexible Income | |
Eric J. Baurmeister | | | 7 | | | $2.7 billion | | | 10 | | | $2.6 billion | | | 10 | (1) | | $5.4 billion(1) | |
James Caron | | | 1 | | | $90.7 million | | | 0 | | | $0 | | | 0 | | | $0 | |
Michael Kushma | | | 2 | | | $159.2 million | | | 13 | | | $5.1 billion | | | 29 | (2) | | $12.5 billion(2) | |
Richard Lindquist | | | 2 | | | $102.0 million | | | 3 | | | $580.5 million | | | 1 | | | $58.7 million | |
Christian G. Roth | | | 7 | | | $670.7 million | | | 21 | | | $7.3 billion | | | 32 | (3) | | $13.9 billion(3) | |
Neil Stone | | | 9 | | | $2.0 billion | | | 0 | | | $0 | | | 67 | (4) | | $14.1 billion(4) | |
Global Infrastructure | |
Theodore R. Bigman | | | 13 | | | $6.3 billion | | | 15 | | | $7.0 billion | | | 59 | (5) | | $7.3 billion(5) | |
Matthew King | | | 3 | | | $447.0 million | | | 1 | | | $196.8 million | | | 0 | | | $0 | |
(1) Of these other accounts, one account with a total of approximately $300.0 million in assets, had performance-based fees.
(2) Of these other accounts, five accounts with a total of approximately $1.9 billion in assets, had performance-based fees.
51
(3) Of these other accounts, four accounts with a total of approximately $2.2 billion in assets, had performance-based fees.
(4) Of these other accounts, one account with a total of approximately $565.6 million in assets, had performance-based fees.
(5) Of these other accounts, 16 accounts with a total of approximately $934.8 million in assets, had performance-based fees.
Because the portfolio managers may manage assets for other investment companies, pooled investment vehicles, and/or other accounts (including institutional clients, pension plans and certain high net worth individuals), there may be an incentive to favor one client over another resulting in conflicts of interest. For instance, the Adviser and/or Sub-Advisers may receive fees from certain accounts that are higher than the fee it receives from the Portfolios, or it may receive a performance-based fee on certain accounts. In those instances, the portfolio managers may have an incentive to favor the higher and/or performance-based fee accounts over the Fund. In addition, a conflict of interest could exist to the extent the Adviser and/or Sub-Advisers have proprietary investments in certain accounts, where portfolio managers have personal investments in certain accounts or when certain accounts are investment options in the Adviser's and/or Sub-Advisers' employee benefits and/or deferred compensation plans. The portfolio manager may have an incentive to favor these accounts over others. If the Adviser and/or Sub-Advisers manages accounts that engage in short sales of securities of the type in which the Portfolio invests, the Adviser and/or Sub-Advisers could be seen as harming the performance of the Fund for the benefit of the accounts engaging in short sales if the short sales cause the market value of the securities to fall. The Adviser and/or Sub-Advisers have adopted trade allocation and other policies and procedures that it believes are reasonably designed to address these and other conflicts of interest.
Portfolio Manager Compensation Structure
Portfolio managers receive a combination of base compensation and discretionary compensation, comprising a cash bonus and several deferred compensation programs described below. The methodology used to determine portfolio manager compensation is applied across all funds/accounts managed by the portfolio managers.
Base salary compensation. Generally, portfolio managers receive base salary compensation based on the level of their position with the Adviser and/or Sub-Advisers.
Discretionary compensation. In addition to base compensation, portfolio managers may receive discretionary compensation.
Discretionary compensation can include:
• Cash Bonus.
• Morgan Stanley's Long Term Incentive Compensation awards — a mandatory program that defers a portion of discretionary year-end compensation into restricted stock units or other awards based on Morgan Stanley common stock or other plans that are subject to vesting and other conditions. All long-term incentive compensation awards are subject to clawback provisions where awards can be cancelled if an employee takes any action, or omits to take any action which causes a restatement of Morgan Stanley's consolidated financial results, or constitutes a violation of Morgan Stanley's risk policies and standards.
• Investment Management Alignment Plan (IMAP) awards — a mandatory program that defers a portion of discretionary year-end compensation and notionally invests it in designated funds advised by the Adviser and/or Sub-Advisers or their affiliates. The award is subject to vesting and other conditions. Portfolio managers must notionally invest a minimum of 25% to a maximum of 100% of their IMAP deferral account into a combination of the designated funds they manage that are included in the IMAP fund menu, which may or may not include the Fund. In addition to the clawbacks listed above for long-term incentive compensation awards, the provision on IMAP awards is further strengthened such that it may also be triggered if an employee's actions cause substantial financial loss on a trading strategy, investment, commitment or other holding provided that previous gains on those positions were relevant to the employees' prior year compensation decisions.
Several factors determine discretionary compensation, which can vary by portfolio management team and circumstances. These factors may include:
• Revenues generated by the investment companies, pooled investment vehicles and other accounts managed by the portfolio manager.
52
• The investment performance of the funds/accounts managed by the portfolio manager.
• Contribution to the business objectives of the Adviser and/or Sub-Advisers.
• The dollar amount of assets managed by the portfolio manager.
• Market compensation survey research by independent third-parties.
• Other qualitative factors, such as contributions to client objectives.
• Performance of Morgan Stanley and Morgan Stanley Investment Management, and the overall performance of the investment team(s) of which the portfolio manager is a member.
Securities Ownership of Portfolio Managers
As of December 31, 2012 (unless otherwise noted), the dollar range of securities beneficially owned by each portfolio manager in the Fund is shown below:
Growth | |
Sam G. Chainani | | none* | |
David S. Cohen | | none* | |
Dennis P. Lynch | | none* | |
Armistead B. Nash | | none* | |
Alexander T. Norton | | none* | |
Jason C. Yeung | | none* | |
Multi Cap Growth | |
Sam G. Chainani | | none* | |
David S. Cohen | | none* | |
Dennis P. Lynch | | none* | |
Armistead B. Nash | | none* | |
Alexander T. Norton | | none* | |
Jason C. Yeung | | none* | |
Focus Growth | |
Sam G. Chainani | | none* | |
David S. Cohen | | none* | |
Dennis P. Lynch | | none* | |
Armistead B. Nash | | none* | |
Alexander T. Norton | | none* | |
Jason C. Yeung | | none* | |
Flexible Income | |
Eric J. Baurmeister | | none* | |
James Caron | | none | |
Michael Kushma | | none | |
Richard Lindquist | | none | |
Christian G. Roth | | none* | |
Neil Stone | | none | |
Global Infrastructure | |
Theodore R. Bigman | | none* | |
Matthew King | | none* | |
Mid Cap Growth | |
Sam G. Chainani | | none* | |
David S. Cohen | | none* | |
Dennis P. Lynch | | none* | |
Armistead B. Nash | | none* | |
Alexander T. Norton | | none* | |
Jason C. Yeung | | none* | |
* Not included in the table above, the portfolio manager has made investments in one or more other mutual funds managed by the same portfolio management team pursuant to a similar strategy.
53
G. Codes of Ethics
The Fund, the Adviser, the Sub-Advisers and the Distributor have each adopted a Code of Ethics pursuant to Rule 17j-1 under the Investment Company Act. The Codes of Ethics are designed to detect and prevent improper personal trading. The Codes of Ethics permit personnel subject to the Codes to invest in securities, including securities that may be purchased sold or held by the Fund, subject to a number of restrictions and controls, including prohibitions against purchases of securities in an initial public offering and a preclearance requirement with respect to personal securities transactions.
H. Proxy Voting Policy and Proxy Voting Record
The Board of Trustees believes that the voting of proxies on securities held by the Fund is an important element of the overall investment process. As such, the Trustees have delegated the responsibility to vote such proxies to MSIM.
A copy of MSIM's Proxy Voting Policy ("Proxy Policy") is attached hereto as Appendix A. In addition, a copy of the Proxy Policy, as well as the Fund's most recent proxy voting record for the 12-month period ended June 30, as filed with the SEC, are available without charge on our web site at www.morganstanley.com/im. The Fund's proxy voting record is also available without charge on the SEC's web site at www.sec.gov.
I. Revenue Sharing
The Adviser and/or Distributor may pay compensation, out of their own funds and not as an expense of the Portfolios, to insurance companies or their affiliates and/or other financial intermediaries ("Intermediaries"), in connection with the sale, distribution, marketing and retention of Portfolio shares and/or shareholder servicing of shares of the Portfolios. For example, the Adviser or the Distributor may pay additional compensation to Intermediaries for, among other things promoting the sale and distribution of Portfolio shares, furnishing marketing support, maintaining share balances and/or for sub-accounting, administrative, shareholder or transaction processing services. Such payments are in addition to any distribution fees or shareholder service fees that may be payable by the Distributor. The additional payments may be based on various factors, including net sales or some specified minimum sales or some other similar criteria related to sales of a Portfolio, amount of assets invested by the Intermediary's customers, a Portfolio's advisory fees, some other agreed-upon amount, or other measures as determined from time to time by the Adviser and/or Distributor. The amount of these payments may be different for different Intermediaries.
Currently, these payments, which are made in accordance with the applicable compensation structure for each Intermediary, include an ongoing annual fee in an amount up to 0.15% of the average daily NAV of shares of each Portfolio held in the applicable accounts.
The prospect of receiving, or the receipt of, additional compensation, as described above, by Intermediaries may provide Intermediaries and/or their financial advisers or other salespersons with an incentive to favor sales of shares of one variable annuity contract over other contract options with respect to which the Intermediary does not receive additional compensation (or receives lower levels of additional compensation) or be a factor in an insurance company's decision to include the Portfolio as an underlying investment option in its variable insurance products. These payment arrangements, however, will not change the price that an investor pays for shares of a Portfolio or the amount that a Portfolio receives to invest on behalf of an investor. Investors may wish to take such payment arrangements into account when considering and evaluating any recommendations relating to Portfolio shares and should review carefully any disclosure provided by an Intermediary as to its compensation.
VI. BROKERAGE ALLOCATION AND OTHER PRACTICES
A. Brokerage Transactions
Subject to the general supervision of the Trustees, the Adviser and for the Global Infrastructure Portfolio, the Sub-Advisers, are responsible for decisions to buy and sell securities for each Portfolio, the selection of brokers and dealers to effect the transactions, and the negotiation of brokerage commissions, if any. Purchases and sales of securities on a stock exchange are effected through brokers who charge a commission for their services. In the OTC market, securities are generally traded on a "net" basis with dealers acting as principal for their own accounts without a stated commission, although the price of the security usually includes a
54
profit to the dealer. The Fund also expects that securities will be purchased at times in underwritten offerings where the price includes a fixed amount of compensation, generally referred to as the underwriter's concession or discount. Options and futures transactions will usually be effected through a broker and a commission will be charged. Certain securities (e.g., certain money market instruments) are purchased directly from an issuer, in which case no commissions or discounts are paid.
Pursuant to orders issued by the SEC, the Fund is permitted to engage in principal transactions, subject to certain conditions, with Morgan Stanley & Co. and with Citigroup, Inc. or its affiliates ("Citigroup"), each of which is, or may be deemed to be, a broker-dealer affiliated with the Fund's Adviser.
During the fiscal years ended December 31, 2010 and December 31, 2012, the Fund, on behalf of the Money Market Portfolio, effected principal transactions with Morgan Stanley & Co. During the fiscal year ended December 31, 2011, the Fund did not effect any principal transactions with Morgan Stanley & Co.
During the fiscal year ended December 31, 2010, the Fund, on behalf of the Flexible Income, Global Infrastructure and Mid Cap Growth Portfolios, effected principal transactions with Citigroup. During the fiscal year ended December 31, 2011, the Fund, on behalf of the Money Market, Flexible Income, Global Infrastructure, Focus Growth, Multi Cap Growth and Mid Cap Growth Portfolios, effected principal transactions with Citigroup. During the fiscal year ended December 31, 2012, the Fund on behalf of the Flexible Income Portfolio, effected principal transactions with Citigroup.
B. Commissions
Brokerage transactions in securities listed on exchanges or admitted to unlisted trading privileges may be effected through Morgan Stanley & Co., Citigroup, and other affiliated brokers and dealers. In order for an affiliated broker or dealer to effect any portfolio transactions on an exchange for the Portfolios, the commissions, fees or other remuneration received by the affiliated broker or dealer must be reasonable and fair compared to the commissions, fees or other remuneration paid to other brokers in connection with comparable transactions involving similar securities being purchased or sold on an exchange during a comparable period of time. This standard would allow the affiliated broker or dealer to receive no more than the remuneration which would be expected to be received by an unaffiliated broker in a commensurate arm's-length transaction. Furthermore, the Trustees, including the Independent Trustees, have adopted procedures which are reasonably designed to provide that any commissions, fees or other remuneration paid to an affiliated broker or dealer are consistent with the foregoing standard. The Fund does not reduce the management fee it pays to the Adviser by any amount of the brokerage commissions it may pay to an affiliated broker or dealer.
During the fiscal years ended December 31, 2010, 2011 and 2012, the Fund paid brokerage commissions of approximately $210,242, $109,120 and $112,773, respectively. During the fiscal years ended December 31, 2010, 2011 and 2012, the Fund paid in the aggregate $2,760, $3,261 and $91, respectively, in brokerage commissions to Morgan Stanley & Co. and/or its affiliated broker-dealers. During the fiscal year ended December 31, 2012, the brokerage commissions paid to Morgan Stanley & Co. and/or its affiliated broker-dealers represented approximately 0.08% of the total brokerage commissions paid by the Fund during the period and were paid on account of transactions having an aggregate dollar value equal to approximately 0.03% of the aggregate dollar value of all portfolio transactions of the Fund during the period for which commissions were paid.
During the fiscal years ended December 31, 2010, 2011 and 2012, the Fund paid in the aggregate $1,180, $4,817 and $1,062, respectively, in brokerage commissions to Citigroup. During the fiscal year ended December 31, 2012, the brokerage commissions paid to Citigroup represented approximately 0.94% of the total brokerage commissions paid by the Fund during the period and were paid on account of transactions having an aggregate dollar value equal to approximately 0.61% of the aggregate dollar value of all portfolio transactions of the Fund during the period for which commissions were paid.
55
For the fiscal year ended December 31, 2012, each Portfolio paid brokerage commissions, including brokerage commissions paid to affiliated broker-dealers, as follows:
| | Brokerage Commissions Paid During Fiscal Year Ended
December 31, 2012 | |
| | Commissions Paid to
Morgan Stanley & Co. and/or
its affiliated broker-dealers | | Commissions Paid to
Citigroup | |
| Name of Portfolio | | Total
Commissions
Paid | | Total
Commissions | | Percent of
Total
Commissions | | Percent of
Total
Brokered
Transactions | | Total
Commissions | | Percent of
Total
Commissions | | Percent of
Total
Brokered
Transactions | |
Money Market | | $ | 0 | | | $ | 0 | | | | 0.00 | % | | | 0.00 | % | | $ | 0 | | | | 0.00 | % | | | 0.00 | % | |
Flexible Income | | | 1,472 | | | | 0 | | | | 0.00 | % | | | 0.00 | % | | | 0 | | | | 0.00 | % | | | 0.00 | % | |
Global Infrastructure | | | 18,004 | | | | 0 | | | | 0.00 | % | | | 0.00 | % | | | 597 | | | | 3.32 | % | | | 1.63 | % | |
Growth | | | 16,715 | | | | 0 | | | | 0.00 | % | | | 0.00 | % | | | 86 | | | | 0.51 | % | | | 1.17 | % | |
Focus Growth | | | 49,052 | | | | 0 | | | | 0.00 | % | | | 0.00 | % | | | 192 | | | | 0.39 | % | | | 1.09 | % | |
Multi Cap Growth | | | 10,443 | | | | 0 | | | | 0.00 | % | | | 0.00 | % | | | 22 | | | | 0.21 | % | | | 0.34 | % | |
Mid Cap Growth | | | 17,087 | | | | 91 | | | | 0.53 | % | | | 0.40 | % | | | 165 | | | | 0.97 | % | | | 0.73 | % | |
During the fiscal years ended December 31, 2010 and December 31, 2011, each Portfolio paid brokerage commissions, including brokerage commissions paid to affiliated broker-dealers, as follows:
| | Brokerage Commissions Paid During Fiscal Years Ended
December 31, 2010 and 2011 | |
| | Fiscal Year Ended
December 31, 2010 | | Fiscal Year Ended
December 31, 2011 | |
| Name of Portfolio | | Total | | Morgan
Stanley &
Co. and/or
its affiliated
broker-
dealers | | Citigroup | | Total | | Morgan
Stanley &
Co. and/or
its affiliated
broker-
dealers | | Citigroup | |
Money Market | | $ | 0 | | | $ | 0 | | | $ | 0 | | | $ | 0 | | | $ | 0 | | | $ | 0 | | |
Flexible Income | | | 2,732 | | | | 0 | | | | 0 | | | | 1,629 | | | | 0 | | | | 0 | | |
Global Infrastructure | | | 85,961 | | | | 137 | | | | 83 | | | | 28,461 | | | | 274 | | | | 3,611 | | |
Growth | | | 18,386 | | | | 0 | | | | 136 | | | | 10,445 | | | | 0 | | | | 13 | | |
Focus Growth | | | 66,832 | | | | 1,782 | | | | 573 | | | | 40,046 | | | | 2,371 | | | | 1,105 | | |
Multi Cap Growth | | | 10,450 | | | | 235 | | | | 112 | | | | 10,823 | | | | 493 | | | | 51 | | |
Mid Cap Growth | | | 25,881 | | | | 606 | | | | 276 | | | | 17,716 | | | | 123 | | | | 37 | | |
C. Brokerage Selection
The policy of the Fund regarding purchases and sales of securities for the Portfolios is that primary consideration will be given to obtaining the most favorable prices and efficient executions of transactions. The Adviser and/or Sub-Advisers are prohibited from directing brokerage transactions on the basis of the referral of clients or the sale of shares of investment companies for which it acts as investment adviser. Consistent with this policy, when securities transactions are effected on a stock exchange, the Fund's policy is to pay commissions which are considered fair and reasonable without necessarily determining that the lowest possible commissions are paid in all circumstances. The Fund believes that a requirement always to seek the lowest possible commission cost could impede effective portfolio management and preclude the Fund and the Adviser and/or Sub-Advisers from obtaining a high quality of brokerage and research services. The Fund anticipates that certain of its transactions involving foreign securities will be effected on foreign securities exchanges. Fixed commissions on such transactions are generally higher than negotiated commissions on domestic transactions. There is also generally less government supervision and regulation of foreign securities exchanges and brokers than in the United States.
In seeking to implement each Portfolio's policies, the Adviser and/or Sub-Advisers effect transactions with those broker-dealers that the Adviser and/or Sub-Advisers believe provide prompt execution of orders in an effective manner and at the most favorable prices. The Adviser and/or Sub-Advisers may place portfolio transactions with those broker-dealers that also furnish research and other services to the Fund or the Adviser and/or Sub-Advisers. Services provided may include certain research services (as described below) as well as effecting securities transactions and performing functions incidental thereto (such as clearance, settlement and custody).
56
The Adviser and its affiliated investment advisers have established commission sharing arrangements under a commission management program (the "Commission Management Program" or "CMP"), pursuant to which execution and research costs or a portion of those costs are decoupled in accordance with applicable laws, rules and regulations. Under the CMP, the Adviser and its affiliated investment advisers select approved equity brokers (which include the Adviser's affiliates) for execution services, and after accumulation of commissions with such brokers, the Adviser and/or it affiliates instruct these approved equity brokers to pay for eligible research provided by executing brokers or third-party research providers, which are selected independently by a Research Services Committee of the Adviser and its affiliated investment advisers. Generally, the Adviser and its affiliated investment advisers will direct the approved equity broker to record research credits based upon a previously agreed-upon allocation and will periodically instruct the approved equity broker to direct specified dollar amounts from that pool to pay for eligible research services provided by third-party research providers and executing brokers. The research credits are pooled among the Adviser and its affiliated investment advisers and allocated on behalf of both the Adviser and its affiliated investment advisers. Likewise, the research services obtained under the CMP are shared among the Adviser and its affiliated investment advisers.
Selection of approved equity brokers for execution is based on three main criteria: access to liquidity, provision of capital and quality of execution. Under the CMP, each approved equity broker is responsible for the payment of fees for research services and obtains the research services pursuant to written agreements between the approved equity broker and the third-party research provider.
For those costs not decoupled, but retained by broker-dealers, the Adviser also effects transactions with brokers which directly pay for research services provided by those brokers in accordance with Section 28(e) of the 1934 Act. Such transactions include equity transactions and may include fixed-income transactions effected on an agency basis.
Transactions involving client accounts managed by two or more affiliated investment advisers may be aggregated and executed using the services of broker-dealers that provide third-party benefits/research so long as: (i) all client accounts involved in the transaction benefit from one or more of the services offered by such broker-dealer; and (ii) each affiliated investment adviser has approved the use of such broker-dealer and the services provided thereby.
The research services received include those of the nature described above and other services which aid the Adviser in fulfilling its investment decision making responsibilities, including (a) furnishing advice as to the value of securities, the advisability of investing in, purchasing or selling securities, and the availability of securities or purchasers or sellers of securities; and (b) furnishing analyses and reports concerning issuers, industries, securities, economic factors and trends, portfolio strategy and the performance of accounts. Where a particular item has both research and non-research related uses (such as proxy services where both research services and services relating to the administration of the proxy itself are provided), the Adviser will make a reasonable allocation of the cost of the item between research and non-research uses and will only pay for the portion of the cost allocated to research uses with client brokerage transactions. Research services furnished or paid for by brokers through whom the Adviser effects transactions for a particular account may be used by the Adviser or its affiliated investment advisers in servicing their other accounts, and not all such services may be used for the benefit of the client which pays the brokerage commission that results in the receipt of such research services. Commissions paid to brokers providing research services may be higher than those charged by brokers not providing such services.
The Adviser and its affiliated investment advisers make a good faith determination of the value of research services in accordance with Section 28(e) of the 1934 Act, UK Financial Services Authority Rules and other relevant regulatory requirements.
Certain investment professionals and other employees of the Adviser are also officers of affiliated investment advisers and may provide investment advisory services to clients of such affiliated investment advisers. The Adviser's personnel also provide research and trading support to personnel of certain affiliated investment advisers. Research related costs may be shared by affiliated investment advisers and may benefit the clients of such affiliated investment advisers. Research services that benefit the Adviser may be received in connection with commissions generated by clients of its affiliated investment advisers. Similarly, research services received in connection with commissions generated by the Adviser's clients may benefit affiliated investment advisers and their clients. Moreover, research services provided by
57
broker-dealers through which the Adviser effects transactions for a particular account may be used by the Adviser and/or an affiliated investment adviser in servicing its other accounts and not all such research services may be used for the benefit of the particular client, which pays the brokerage commission giving rise to the receipt of such research services.
The Adviser, the Sub-Advisers and certain of their affiliates currently serve as an investment adviser to a number of clients, including other investment companies, and may in the future act as investment adviser to others. It is the practice of the Adviser, the Sub-Advisers and their affiliates to cause purchase and sale transactions (including transactions in certain initial and secondary public offerings) to be allocated among the Portfolios and clients whose assets they manage (including the Portfolios) in such manner as they deem equitable. In making such allocations among the Portfolios and other client accounts, various factors may be considered, including the respective investment objectives, the relative size of portfolio holdings of the same or comparable securities, the availability of cash for investment, the size of investment commitments generally held and the opinions of the persons responsible for managing the Portfolios and other client accounts. The Adviser and/or Sub-Advisers and their affiliates may operate one or more order placement facilities and each facility will implement order allocation in accordance with the procedures described above. From time to time, each facility may transact in a security at the same time as other facilities are trading in that security.
D. Regular Broker-Dealers
During the fiscal year ended December 31, 2012, the Portfolios purchased securities issued by the following issuers, which issuers were among the ten brokers or ten dealers that executed transactions for or with the Fund or the Portfolio in the largest dollar amounts during the period:
Name of Portfolio: | | Issuer | |
| Money Market | | Barclays Bank PLC
Credit Suisse Group AG
Deutsche Bank AG | |
Flexible Income | | Bank of America Securities LLC
Credit Suisse Group AG
JP Morgan Securities LLC | |
| Global Infrastructure | | None | |
| Growth | | Goldman Sachs & Co. | |
| Focus Growth | | Goldman Sachs & Co. | |
| Multi Cap Growth | | None | |
| Mid Cap Growth | | None | |
At December 31, 2012, the Portfolios held securities issued by such brokers or dealers with the following market values:
Name of Portfolio: | | Issuer | | Market Value
at 12/31/12 | |
| Money Market | | Credit Suisse Group AG
Deutsche Bank AG | | $ | 2,997,963
2,000,000 | | |
Flexible Income | | JP Morgan Securities LLC
Bank of America Securities LLC
Credit Suisse Group AG | | | 429,742
166,984
84,579 | | |
VII. CAPITAL STOCK AND OTHER SECURITIES
The shareholders of each Portfolio are entitled to a full vote for each full share of beneficial interest held. The Fund is authorized to issue an unlimited number of shares of beneficial interest. The Fund's shares of beneficial interest are divided currently into seven Portfolios. All shares of beneficial interest of the Fund are of $0.01 par value and are equal as to earnings, assets and voting privileges except that each Class will have exclusive voting privileges with respect to matters relating to distribution expenses borne solely by such Class (if any) or any other matter in which the interests of one Class differ from the interests of the other Class.
58
The Fund's Declaration of Trust permits the Trustees to authorize the creation of additional Portfolios (the proceeds of which would be invested in separate, independently managed portfolios) and additional Classes of shares within any Portfolio. The Trustees have not presently authorized any such additional series or Classes of shares other than as set forth in the Prospectus for each Portfolio.
The Fund is not required to hold annual meetings of shareholders and in ordinary circumstances the Fund does not intend to hold such meetings. The Trustees may call special meetings of shareholders for action by shareholder vote as may be required by the Investment Company Act or the Declaration of Trust. Under certain circumstances, the Trustees may be removed by the actions of the Trustees. In addition, under certain circumstances, the shareholders may call a meeting to remove the Trustees and the Fund is required to provide assistance in communication with shareholders about such a meeting. The voting rights of shareholders are not cumulative, so that holders of more than 50% of the shares voting can, if they choose, elect all Trustees being selected, while the holders of the remaining shares would be unable to elect any Trustees.
Under Massachusetts law, shareholders of a business trust may, under certain limited circumstances, be held personally liable as partners for the obligations of the Fund. However, the Declaration of Trust contains an express disclaimer of shareholder liability for acts or obligations of the Fund, requires that notice of such Fund obligations include such disclaimer, and provides for indemnification out of the Fund's property for any shareholder held personally liable for the obligations of the Fund. Thus, the risk of a shareholder incurring financial loss on account of shareholder liability is limited to circumstances in which the Fund itself would be unable to meet its obligations. Given the above limitations on shareholder personal liability, and the nature of the Fund's assets and operations, the possibility of the Fund being unable to meet its obligations is remote and thus, in the opinion of Massachusetts counsel to the Fund, the risk to Fund shareholders of personal liability is remote.
Shareholders have the right to vote on the election of Trustees of the Fund and on any and all matters on which by law or the provisions of the Fund's By-Laws they may be entitled to vote. To the extent required by law, Hartford Life Insurance Company and Hartford Life and Annuity Insurance Company, which are the only shareholders of the Fund, will vote the shares of the Fund held in each Account established to fund the benefits under either a flexible premium deferred variable annuity Contract or a flexible premium variable life insurance Contract in accordance with instructions from the owners of such Contracts. Shareholders of all Portfolios vote for a single set of Trustees. Shares of each Portfolio will be voted by the insurance company investing in such Portfolio based on instructions received from the contract holders having a voting interest in the underlying account. Shares for which timely instructions are not received generally will be voted by the insurance company in the same proportion as shares for which instructions have been timely received. Therefore, as a result of this proportional voting, the vote of a small number of contract holders could determine the outcome of a proposal subject to a shareholder vote.
The Trustees themselves have the power to alter the number and the terms of office of the Trustees (as provided for in the Declaration of Trust), and they may at any time lengthen or shorten their own terms or make their terms of unlimited duration and appoint their own successors, provided that always at least a majority of the Trustees has been elected by the shareholders of the Fund.
On any matters affecting only one Portfolio, only the shareholders of that Portfolio are entitled to vote. On matters relating to all the Portfolios, but affecting the Portfolios differently, separate votes by each Portfolio are required. Approval of an Investment Advisory Agreement and a change in fundamental policy would be regarded as matters requiring separate voting by each Portfolio.
With respect to the submission to shareholder vote of a matter requiring separate voting by Portfolio, the matter shall have been effectively acted upon with respect to any Portfolio if a majority of the outstanding voting securities of that Portfolio votes for the approval of the matter, notwithstanding that: (1) the matter has not been approved by a majority of the outstanding voting securities of any other Portfolio; or (2) the matter has not been approved by a majority of the outstanding voting securities of the Fund.
59
VIII. PURCHASE, REDEMPTION AND PRICING OF SHARES
A. Purchase/Redemption of Shares
Information concerning how Portfolio shares are offered (and how they are redeemed) is provided in each of the Fund's Class X and Class Y Prospectuses.
B. Offering Price
The price of each Portfolio share, called "net asset value," is based on the value of the Portfolio's securities. Net asset value per share of each of Class X and Class Y shares is calculated by dividing the value of the portion of each Portfolio's securities and other assets attributable to each Class, respectively, less the total market value of the liabilities attributable to each Class, respectively, by the number of shares of the Class outstanding. The assets of each Class of shares are invested in a single portfolio. The net asset value of each Class, however, will differ because the Classes have different ongoing fees.
The Money Market Portfolio, however, utilizes the amortized cost method in valuing its portfolio securities for purposes of determining the net asset value of its shares. The Money Market Portfolio utilizes the amortized cost method in valuing its portfolio securities even though the portfolio securities may increase or decrease in market value, generally in connection with changes in interest rates. The amortized cost method of valuation involves valuing a security at its cost at the time of purchase adjusted by a constant amortization to maturity of any discount or premium, regardless of the impact of fluctuating interest rates on the market value of the instrument. While this method provides certainty in valuation, it may result in periods during which value, as determined by amortized cost, is higher or lower than the price the Money Market Portfolio would receive if it sold the investment. During such periods, the yield to investors in the Money Market Portfolio may differ somewhat from that obtained in a similar company which uses mark-to-market values for all of its portfolio securities. For example, if the use of amortized cost resulted in a lower (higher) aggregate portfolio value on a particular day, a prospective investor in the Money Market Portfolio would be able to obtain a somewhat higher (lower) yield than would result from investment in such a similar company and existing investors would receive less (more) investment income. The purpose of this method of calculation is to facilitate the maintenance of a constant net asset value per share of $1.00.
The use of the amortized cost method to value the portfolio securities of the Money Market Portfolio and the maintenance of the per share net asset value of $1.00 is permitted pursuant to Rule 2a-7 of the Investment Company Act (the "Rule") and is conditioned on its compliance with various conditions contained in the Rule including: (a) the Trustees are obligated, as a particular responsibility within the overall duty of care owed to the Portfolio's shareholders, to establish procedures reasonably designed, taking into account current market conditions and the Portfolio's investment objectives, to stabilize the net asset value per share as computed for the purpose of distribution and redemption at $1.00 per share; (b) the procedures include (i) calculation, at such intervals as the Trustees determine are appropriate and as are reasonable in light of current market conditions, of the deviation, if any, between net asset value per share using amortized cost to value portfolio securities and net asset value per share based upon available market quotations with respect to such portfolio securities; (ii) periodic review by the Trustees of the amount of deviation as well as methods used to calculate it; and (iii) maintenance of written records of the procedures, and the Trustees' considerations made pursuant to them and any actions taken upon such consideration; (c) the Trustees should consider what steps should be taken, if any, in the event of a difference of more than 1/2 of 1% between the two methods of valuation; and (d) the Trustees should take such action as they deem appropriate (such as shortening the average portfolio maturity, realizing gains or losses, withholding dividends or, as provided by the Declaration of Trust, reducing the number of outstanding shares of the Money Market Portfolio) to eliminate or reduce to the extent reasonably practicable material dilution or other unfair results to investors or existing shareholders which might arise from differences between the two methods of valuation. Any reduction of outstanding shares will be effected by having each shareholder proportionately contribute to the Money Market Portfolio's capital the necessary shares that represent the amount of excess upon such determination. Each Contract Owner will be deemed to have agreed to such contribution in these circumstances by allocating investment under his or her Contract to the Money Market Portfolio.
Generally, for purposes of the procedures adopted under the Rule, the maturity of a portfolio security is deemed to be the period remaining (calculated from the trade date or such other date on which the Money Market Portfolio's interest in the instrument is subject to market action) until the date on which in
60
accordance with the terms of the security the principal amount must unconditionally be paid, or in the case of a security called for redemption, the date on which the redemption payment must be made.
A variable rate security that is subject to a demand feature is deemed to have a maturity equal to the period remaining until the principal amount can be recovered through demand. A floating rate security that is subject to a demand feature is deemed to have a maturity equal to the period remaining until the principal amount can be recovered through demand.
An "NRSRO" is a nationally recognized statistical rating organization. At the time the Money Market Portfolio acquires its investments, they will be rated (or issued by an issuer that is rated with respect to a comparable class of short-term debt obligations) (i) in one of the two highest rating categories for short-term debt obligations assigned by at least two NRSROs; or (ii) if only one NRSRO has issued a rating with respect to such security or issuer at the time a fund purchases or rolls over the security, that NRSRO (the "Requisite NRSROs").
An Eligible Security is generally defined in the Rule to mean (i) a security with a remaining maturity of 397 calendar days or less that has received a short-term rating (or that has been issued by an issuer that has received a short-term rating with respect to a class of debt obligations, or any debt obligation within that class, that is comparable in priority and security with the security) by the Requisite NRSROs in one of the two highest short-term rating categories (within which there may be sub-categories or gradations indicating relative standing); or (ii) a security: (a) that at the time of issuance had a remaining maturity of more than 397 calendar days but that has a remaining maturity of 397 calendar days or less; and (b) whose issuer has received from the Requisite NRSROs a rating with respect to a class of debt obligations (or any debt obligations within that class) that is now comparable in priority and security with the security, in one of the two highest short-term rating categories (within which there may be subcategories or gradations indicating relative standing); or (iii) an unrated security that is of comparable quality to a security meeting the requirements of (i) or (ii) above, as determined by the Trustees. The Money Market Portfolio will limit its investments to securities that meet the requirements for Eligible Securities.
As permitted by the Rule, the Board has delegated to the Fund's Adviser, subject to the Board's oversight pursuant to guidelines and procedures adopted by the Board, the authority to determine which securities present minimal credit risks and which unrated securities are comparable in quality to rated securities.
Also, as required by the Rule, the Money Market Portfolio will limit its investments in securities, other than Government securities, so that, at the time of purchase: (a) except as further limited in (b) below with regard to certain securities, no more than 5% of its total assets will be invested in the securities of any one issuer; and (b) with respect to Eligible Securities that have received a rating in less than the highest category by an NRSROs, or that have been determined to be of comparable quality: (i) no more than 3% in the aggregate of the Money Market Portfolio's total assets in all such securities, (ii) no more than 0.5% of total assets in the securities on any one issuer, and (iii) the remaining maturity of any such securities must be 45 days or less.
The presence of a line of credit or other credit facility offered by a bank or other financial institution which guarantees the payment obligation of the issuer, in the event of a default in the payment of principal or interest of an obligation, may be taken into account in determining whether an investment is an Eligible Security, provided that the guarantee itself is an Eligible Security.
The Rule further requires that the Money Market Portfolio limit its investments to U.S. dollar-denominated instruments which the Trustees determine present minimal credit risks and which are Eligible Securities. The Rule also requires the Portfolio to maintain a dollar-weighted average portfolio maturity (not more than 60 days) appropriate to its objective of maintaining a stable net asset value of $1.00 per share and precludes the purchase of any instrument with a remaining maturity of more than 397 days. Should the disposition of a portfolio security result in a dollar-weighted average portfolio maturity of more than 60 days, the Portfolio will invest its available cash in such a manner as to reduce such maturity to 60 days or less as soon as is reasonably practicable.
In the unlikely event that the Fund's Board of Trustees are to determine pursuant to Rule 2a-7 that the extent of the deviation between the Money Market Portfolio's amortized cost per share and its market-based net asset value per share may result in material dilution or other unfair results to shareholders, the
61
Board will cause the Portfolio to take such action as it deems appropriate to eliminate or reduce to the extent practicable such dilution or unfair results, including, but not limited to, considering suspending redemption of shares and liquidating the Portfolio under Rule 22e-3 under the Investment Company Act.
If the Trustees determine that it is no longer in the best interests of the Money Market Portfolio and its shareholders to maintain a stable price of $1.00 per share or if the Trustees believe that maintaining such price no longer reflects a market-based net asset value per share, the Board has the right to change from an amortized cost basis of valuation to valuation based on market quotations. The Fund will notify shareholders of the Portfolio of any such change.
In the calculation of a Portfolio's net asset value (other than the Money Market Portfolio): (1) an equity portfolio security listed or traded on an exchange is valued at its latest reported sales price (or at the exchange official closing price if such exchange reports an official closing price), and if there were no sales on a given day, the security is valued at the mean between the last reported bid and asked prices; and (2) all other equity portfolio securities for which OTC market quotations are readily available are valued at the mean between the last reported bid and asked prices. In cases where a security is traded on more than one exchange, the security is valued on the exchange designated as the primary market. When market quotations are not readily available, including circumstances under which it is determined by the Adviser (or if applicable, the Sub-Advisers) that the closing price, last sale price or the mean between the last reported bid and asked prices are not reflective of a security's market value, portfolio securities are valued at their fair value as determined in good faith under procedures established by and under the general supervision of the Fund's Board. For valuation purposes, quotations of foreign portfolio securities, other assets and liabilities and forward contracts stated in foreign currency are translated into U.S. dollar equivalents at the prevailing market rates prior to the close of the NYSE.
Short-term debt securities with remaining maturities of 60 days or less at the time of purchase may be valued at amortized cost, unless the Adviser determines such valuation does not reflect the securities' market value, in which case these securities will be valued at their fair market value as determined by the Adviser.
Certain of the Portfolios' securities (other than securities of the Money Market Portfolio) may be valued by an outside pricing service approved by the Fund's Board. The pricing service may utilize a matrix system or other model incorporating attributes such as security quality, maturity and coupon as the evaluation model parameters, and/or research evaluations by its staff, including review of broker-dealer market price quotations in determining what it believes is the fair valuation of the portfolio securities valued by such pricing service.
Listed options are valued at the last reported sales price on the exchange on which they are listed (or at the exchange official closing price if such exchange reports an official closing price). If an official closing price or last reported sale price is unavailable, the listed option should be fair valued at the mean between its latest bid and ask prices. If an exchange closing price or bid and asked prices are not available from the exchange, then the quotes from one or more brokers or dealers may be used. Unlisted options and swaps are valued by an outside pricing service approved by the Board or quotes from a broker or dealer. Unlisted options and swaps cleared on a clearinghouse or exchange may be valued using the closing price provided by the clearinghouse or exchange. Futures are valued at the settlement price on the exchange on which they trade or, if a settlement price is unavailable, then at the last sale price on the exchange.
If the Adviser (or if applicable, the Sub-Advisers) determine that the valuation received from the outside pricing service or broker or dealer is not reflective of the security's market value, such security is valued at its fair value as determined in good faith under procedures established by and under the general supervision of the Board.
Generally, trading in foreign securities, as well as corporate bonds, U.S.government securities and money market instruments, is substantially completed each day at various times prior to the close of the NYSE. The values of such securities used in computing the net asset value of the Portfolios' shares are determined as of such times. Foreign currency exchange rates are also generally determined prior to the close of the NYSE. Occasionally, events which may affect the values of such securities and such exchange rates may occur between the times at which they are determined and the close of the NYSE. If events
62
that may affect the value of such securities occur during such period, then these securities may be valued at their fair value as determined in good faith under procedures established by and under the supervision of the Board.
IX. TAXATION OF THE PORTFOLIOS AND SHAREHOLDERS
The following is only a summary of certain federal income and excise tax considerations generally affecting the Portfolios and their shareholders. No attempt is made to present a detailed explanation of the tax treatment of the Portfolios or their shareholders, and the discussion here is not intended as a substitute for careful tax planning. Shareholders are urged to consult their tax advisors with specific reference to their own tax situations, including their state and local tax liabilities.
The following general discussion of certain federal income and excise tax consequences is based on the Code and the regulations issued thereunder as in effect on the date of this SAI. New legislation, as well as administrative changes or court decisions, may significantly change the conclusions expressed herein, and may have a retroactive effect with respect to the transactions contemplated herein.
Each Portfolio within the Fund is generally treated as a separate corporation for federal income tax purposes, and thus the provisions of the Code generally will be applied to each Portfolio separately, rather than to the Fund as a whole.
Federal Income Tax Treatment of Shareholders
Shares of the Portfolios will be purchased by life insurance companies for their separate accounts under variable annuity contracts and variable life insurance policies and by other entities under qualified pension and retirement plans. Under the provisions of the Code currently in effect, net income and net realized capital gains of Portfolios of the Fund are not currently taxable when distributed to and left to accumulate within a variable annuity contract or variable life insurance policy or under a qualified pension or retirement plan.
Section 817(h) of the Code provides that the investments of a separate account underlying a variable insurance contract (or the investments of a mutual fund, the shares of which are owned by the variable separate account) must be "adequately diversified" in order for the contract to be treated as an annuity or as life insurance for federal income tax purposes. The Treasury Department has issued regulations explaining these diversification requirements. Each Portfolio intends to continue to comply with such requirements.
For information on federal income taxation of a life insurance company with respect to its receipt of distributions from the Fund and federal income taxation of owners of the company's variable annuity contracts or variable life insurance policies, refer to the life insurance company's variable annuity contract or variable life insurance policy prospectus.
Qualification as a Regulated Investment Company
The Fund intends that each of its Portfolios elect and qualify to be treated for each taxable year as a regulated investment company ("RIC") under Subchapter M of the Code. Qualification as a regulated investment company requires, among other things, that (a) at least 90% of the Fund's annual gross income be derived from interest, dividends, payments with respect to certain securities loans, gains from the sale or other disposition of securities or options thereon or foreign currencies, or other income derived with respect to its business of investing in such securities or currencies; and (b) the Fund diversify its holdings so that, at the end of each quarter of the taxable year (i) at least 50% of the value of the Fund's assets is represented by cash, U.S. government securities, securities of other regulated investment companies and other securities limited in respect of any one issuer to an amount not greater than 5% of the value of the Fund's assets and not more than 10% of the outstanding voting securities of such issuer, and (ii) not more than 25% of the value of the Fund's assets is invested in the securities of any one issuer (other than U.S. government securities and securities of other regulated investment companies), in two or more issuers that are controlled by the Fund and that are engaged in the same or similar trades or business or related trades or businesses. It is anticipated that any net gain realized from the closing out of futures contracts will be considered gain from the sale of securities and therefore be qualifying income
63
for purposes of the 90% gross income requirement described above. Net income derived from an interest in a "qualified publicly traded partnership," as defined in the Code, will be treated as qualifying income for purposes of the 90% gross income requirement. For the purposes of the diversification requirements in clause (ii) above, the outstanding voting securities of any issuer includes the equity securities of a qualified publicly traded partnership. In addition, no more than 25% of the value of a regulated investment company's total assets may be invested in the securities of one or more qualified publicly traded partnerships.
For purposes of the 90% of gross income requirement described above, the Code expressly provides the U.S. Treasury with authority to issue regulations that would exclude foreign currency gains from qualifying income if such gains are not directly related to a Portfolio's business of investing in stock or securities. While to date the U.S. Treasury has not exercised this regulatory authority, there can be no assurance that it will not issue regulations in the future (possibly with retroactive application) that would treat some or all of a Portfolio's foreign currency gains as non-qualifying income. For purposes of the diversification requirement described above, a Portfolio will not be treated as in violation of such requirement as a result of a discrepancy between the value of its various investments and the diversification percentages described above, unless such discrepancy exists immediately following the acquisition of any security or other property and is wholly or partly the result of such acquisition. Moreover, even in the event of noncompliance with the diversification requirement as of the end of any given quarter, a Portfolio is permitted to cure the violation by eliminating the discrepancy causing such noncompliance within a period of 30 days from the close of the relevant quarter.
In addition to the requirements described above, in order to qualify as a RIC, each Portfolio must distribute at least 90% of each Portfolio's net investment company taxable income (that generally includes dividends, taxable interest, currency gains, and the excess of net short-term capital gains over net long-term capital losses less operating expenses) and at least 90% of its net tax-exempt interest income, if any, to shareholders (the "Distribution Requirement"). If a Portfolio meets all of the RIC requirements, it will not be subject to federal income tax on any of its net investment income or net realized capital gains that it distributes to shareholders.
Although each Portfolio intends to distribute all or substantially all of its net investment income and may distribute its net realized capital gains for any taxable year, a Portfolio will be subject to federal income taxation to the extent any such income or gains are not distributed.
Some of the Portfolios may make investments that cause the Portfolios to recognize income or gain prior to receiving cash with respect to such investments. For example, in the event that the Portfolios invest in securities (such as STRIPS) that bear "original issue discount" or "acquisition discount" (collectively, "OID Securities"), they will be deemed to have received interest income even though no cash payments have been received. Accordingly, such investments may not produce sufficient current cash receipts to match the amount of net investment income a Portfolio must distribute to satisfy the Distribution Requirement. In some cases, a Portfolio may have to borrow money or dispose of other investments in order to make sufficient cash distributions to satisfy the Distribution Requirement.
If a Portfolio fails to qualify for any taxable year as a RIC, all of its taxable income will be subject to tax at regular corporate income tax rates without any deduction for distributions to shareholders.
Positions held by a Portfolio in certain regulated futures contracts and foreign currency contracts ("Section 1256 Contracts") will generally be marked-to-market (i.e., treated as though sold for fair market value) on the last business day of the Portfolio's taxable year and all gain or loss associated with such transactions (except certain currency gains covered by Section 988 of the Code) will generally be treated as 60% long-term capital gain or loss and 40% short-term capital gain or loss. The effect of the Section 1256 mark-to-market rules may be to accelerate income or to convert what otherwise would have been long-term capital gain into short-term capital gain or short-term capital losses into long-term capital losses within a Portfolio. The acceleration of income on Section 1256 Contracts may require a Portfolio to accrue taxable income without a corresponding receipt of cash. In order to generate enough cash to satisfy the Distribution Requirement, a Portfolio may be required to dispose of portfolio securities that it otherwise would have continued to hold or to use cash flows from other sources. Any or all of these rules may, therefore, affect the amount, character or timing of income earned and, in turn, affect the application of the Distribution Requirement to a particular Portfolio.
64
Short sales engaged in by a Portfolio may reduce the holding period of property held by a Portfolio which is substantially identical to the property sold short. This rule may have the effect of converting capital gains recognized by the Portfolio from long-term to short-term as well as converting capital losses recognized by the Portfolio from short-term to long-term.
Federal Excise Tax
No Portfolio will be subject to the 4% excise tax normally imposed on RICs that do not distribute substantially all of their income and gains each calendar year, because that tax does not apply to a RIC whose only shareholders are segregated asset accounts of life insurance companies held in connection with variable annuity accounts and/or variable life insurance policies and certain trusts under qualified pension and retirement plans.
Certain Tax Information Reporting Considerations
Because of the nature of the rules governing how REITs report their income and the timing of REITs issuing year-end tax information, a Portfolio that invests in REITs may need to estimate the character of distributions paid to its shareholders from REIT distributions. In addition, after the calendar year-end, REITs may recharacterize the nature of the distributions paid during that year, with the result that distributions previously identified as ordinary income are recharacterized as return of capital and/or capital gain. As a result, the composition of a Portfolio's distributions as reported initially may differ from the final composition determined after calendar year-end and reported to a Portfolio's shareholders on their year-end tax information statements.
Foreign Income Taxes
Each Portfolio that invests in foreign securities may be subject to foreign withholding taxes with respect to its dividend and interest income from foreign countries, thus reducing the net amount available for distribution to a Portfolio's shareholders. The United States has entered into tax treaties with many foreign countries that may entitle a Portfolio to a reduced rate of, or exemption from, taxes on such income. It is impossible to determine the effective rate of foreign tax in advance because the amount of a Portfolio's assets to be invested within various countries is not known.
State and Local Tax Considerations
Rules of U.S. state and local taxation of dividend and capital gains distributions from regulated investment companies often differ from the rules for U.S. federal income taxation described above. Shareholders are urged to consult their tax advisers as to the consequences of these and other U.S. state and local tax rules regarding an investment in a Portfolio.
X. UNDERWRITERS
The Portfolios' shares are offered on a continuous basis. The Distributor, as the principal underwriter of the shares, has certain obligations under the Distribution Agreement concerning the distribution of the shares. These obligations and the compensation the Distributor receives are described above in the sections titled "Principal Underwriter" and "Rule 12b-1 Plan."
XI. PERFORMANCE DATA
The current yield of the Money Market Portfolio for the seven days ended December 31, 2012 was 0.01% for Class X shares and 0.01% for Class Y shares. The seven day effective yield on December 31, 2012 was 0.01% for Class X shares and 0.01% for Class Y shares, assuming daily compounding.
For the Flexible Income Portfolio, for the 30-day period ended December 31, 2012, the yield was 3.61% for Class X shares and 3.36% for Class Y shares.
The average annual total returns of the Class X and Class Y shares of each Portfolio for the one-year, five-year and ten-year periods ended December 31, 2012 and/or for the period from the date of commencement of the Portfolio's operations or from the date the shares of the Class were first offered through December 31, 2012, if shorter or longer than any of the foregoing (Class X shares of each
65
Portfolio commenced operations on 11/09/94, except the Multi Cap Growth Portfolio which commenced operations on 01/21/97; Class Y shares of each Portfolio were first offered on 7/24/00), were as follows:
Class X Shares
Name of Portfolio | | Total Return for
Fiscal Year Ended
December 31, 2012 | | Average Annual
Total Return for
Five Years Ended
December 31, 2012 | | Average Annual
Total Return for
Ten Years Ended
December 31, 2012 | | Average Annual
Total Return for
Period from
Commencement of
Operations
through
December 31, 2012 | |
| Money Market | | | 0.01 | % | | | 0.48 | % | | | 1.60 | % | | | 2.98 | % | |
| Flexible Income | | | 12.98 | % | | | 3.86 | % | | | 5.20 | % | | | 4.33 | % | |
| Global Infrastructure | | | 18.14 | % | | | 3.07 | % | | | 11.34 | % | | | 9.62 | % | |
| Growth | | | 14.50 | % | | | 3.13 | % | | | 8.84 | % | | | 7.05 | % | |
| Focus Growth | | | 14.10 | % | | | 2.72 | % | | | 7.73 | % | | | 8.94 | % | |
| Multi Cap Growth | | | 11.31 | % | | | 2.46 | % | | | 11.96 | % | | | 4.05 | % | |
| Mid Cap Growth | | | 8.51 | % | | | 2.24 | % | | | 12.05 | % | | | 9.81 | % | |
Class Y Shares
Name of Portfolio | | Total Return for
Fiscal Year Ended
December 31, 2012 | | Average Annual
Total Return for
Five Years Ended
December 31, 2012 | | Average Annual
Total Return for
Ten Years Ended
December 31, 2012 | | Average Annual
Total Return for
Period from
First Offering of
Class Y Shares
through
December 31, 2012 | |
| Money Market | | | 0.01 | % | | | 0.43 | % | | | 1.45 | % | | | 1.75 | % | |
| Flexible Income | | | 12.75 | % | | | 3.59 | % | | | 4.93 | % | | | 3.85 | % | |
| Global Infrastructure | | | 17.79 | % | | | 2.80 | % | | | 11.06 | % | | | 3.66 | % | |
| Growth | | | 14.18 | % | | | 2.87 | % | | | 8.57 | % | | | 0.94 | % | |
| Focus Growth | | | 13.83 | % | | | 2.46 | % | | | 7.45 | % | | | 0.61 | % | |
| Multi Cap Growth | | | 11.11 | % | | | 2.21 | % | | | 11.69 | % | | | –3.07 | % | |
| Mid Cap Growth | | | 8.24 | % | | | 1.99 | % | | | 11.78 | % | | | 2.85 | % | |
The total returns of the Class X and Class Y shares of each Portfolio for the one year, five year and ten year periods ended December 31, 2012 and/or for the period from the date of commencement of the Portfolio's operations or from the date the shares of the Class were first offered through December 31, 2012, if shorter or longer than any of the foregoing (Class X shares of each Portfolio commenced operations on 11/09/94, except the Multi Cap Growth Portfolio which commenced operations on 01/21/97; Class Y shares of each Portfolio were first offered on 7/24/00), were as follows:
Class X Shares
Name of Portfolio | | Total Return for
Fiscal Year Ended
December 31, 2012 | | Total Return for
Five Years Ended
December 31, 2012 | | Total Return for
Ten Years Ended
December 31, 2012 | | Total Return for
Period from
Commencement of
Operations
through
December 31, 2012 | |
| Money Market | | | 0.01 | % | | | 2.44 | % | | | 17.26 | % | | | 70.36 | % | |
| Flexible Income | | | 12.98 | % | | | 20.88 | % | | | 65.99 | % | | | 115.68 | % | |
| Global Infrastructure | | | 18.14 | % | | | 16.30 | % | | | 192.81 | % | | | 429.11 | % | |
| Growth | | | 14.50 | % | | | 16.66 | % | | | 133.35 | % | | | 244.33 | % | |
| Focus Growth | | | 14.10 | % | | | 14.34 | % | | | 110.47 | % | | | 372.80 | % | |
| Multi Cap Growth | | | 11.31 | % | | | 12.94 | % | | | 209.46 | % | | | 88.38 | % | |
| Mid Cap Growth | | | 8.51 | % | | | 11.71 | % | | | 212.07 | % | | | 445.99 | % | |
66
Class Y Shares
Name of Portfolio | | Total Return for
Fiscal Year Ended
December 31, 2012 | | Total Return
for Five
Years Ended
December 31, 2012 | | Total Return for
Ten Years Ended
December 31, 2012 | | Total Return for
Period from
First Offering of
Class Y Shares
through
December 31, 2012 | |
| Money Market | | | 0.01 | % | | | 2.17 | % | | | 15.51 | % | | | 24.12 | % | |
| Flexible Income | | | 12.75 | % | | | 19.31 | % | | | 61.77 | % | | | 60.07 | % | |
| Global Infrastructure | | | 17.79 | % | | | 14.80 | % | | | 185.58 | % | | | 56.29 | % | |
| Growth | | | 14.18 | % | | | 15.18 | % | | | 127.51 | % | | | 12.39 | % | |
| Focus Growth | | | 13.83 | % | | | 12.92 | % | | | 105.23 | % | | | 7.92 | % | |
| Multi Cap Growth | | | 11.11 | % | | | 11.56 | % | | | 202.18 | % | | | –32.19 | % | |
| Mid Cap Growth | | | 8.24 | % | | | 10.34 | % | | | 204.57 | % | | | 41.78 | % | |
XII. FINANCIAL STATEMENTS
The Fund's audited financial statements for the fiscal year ended December 31, 2012, including notes thereto, and the report of Ernst & Young LLP, an independent registered public accounting firm, are herein incorporated by reference to the Fund's Annual Report to Shareholders. A copy of the Fund's Annual Report to Shareholders must accompany the delivery of this SAI.
XIII. FUND COUNSEL
Dechert LLP, located at 1095 Avenue of the Americas, New York, NY 10036, acts as the Fund's legal counsel.
*****
This SAI and each of the Class X and Class Y Prospectuses do not contain all of the information set forth in the Registration Statement the Fund has filed with the SEC. The complete Registration Statement may be obtained from the SEC.
67
Appendix A
MORGAN STANLEY INVESTMENT MANAGEMENT
PROXY VOTING POLICY AND PROCEDURES
I. POLICY STATEMENT
Morgan Stanley Investment Management's ("MSIM") policy and procedures for voting proxies ("Policy") with respect to securities held in the accounts of clients applies to those MSIM entities that provide discretionary investment management services and for which an MSIM entity has authority to vote proxies. This Policy is reviewed and updated as necessary to address new and evolving proxy voting issues and standards.
The MSIM entities covered by this Policy currently include the following: Morgan Stanley AIP GP LP, Morgan Stanley Investment Management Inc., Morgan Stanley Investment Management Limited, Morgan Stanley Investment Management Company, Morgan Stanley Asset & Investment Trust Management Co., Limited, Morgan Stanley Investment Management Private Limited and Private Investment Partners Inc. (each an "MSIM Affiliate" and collectively referred to as the "MSIM Affiliates" or as "we" below).
Each MSIM Affiliate will use its best efforts to vote proxies as part of its authority to manage, acquire and dispose of account assets. With respect to the MSIM registered management investment companies (the "MSIM Funds"), each MSIM Affiliate will vote proxies under this Policy pursuant to authority granted under its applicable investment advisory agreement or, in the absence of such authority, as authorized by the Board of Directors/Trustees of the MSIM Funds. A MSIM Affiliate will not vote proxies unless the investment management or investment advisory agreement explicitly authorizes the MSIM Affiliate to vote proxies. MSIM Affiliates will vote proxies in a prudent and diligent manner and in the best interests of clients, including beneficiaries of and participants in a client's benefit plan(s) for which the MSIM Affiliates manage assets, consistent with the objective of maximizing long-term investment returns ("Client Proxy Standard"). In certain situations, a client or its fiduciary may provide an MSIM Affiliate with a proxy voting policy. In these situations, the MSIM Affiliate will comply with the client's policy.
Proxy Research Services — ISS Governance Services ("ISS") and Glass Lewis (together with other proxy research providers as we may retain from time to time, the "Research Providers") are independent advisers that specialize in providing a variety of fiduciary-level proxy-related services to institutional investment managers, plan sponsors, custodians, consultants, and other institutional investors. The services provided include in-depth research, global issuer analysis, and voting recommendations. While we may review and utilize the recommendations of one or more Research Providers in making proxy voting decisions, we are in no way obligated to follow such recommendations. In addition to research, ISS provides vote execution, reporting, and recordkeeping services.
Voting Proxies for Certain Non-U.S. Companies — Voting proxies of companies located in some jurisdictions may involve several problems that can restrict or prevent the ability to vote such proxies or entail significant costs. These problems include, but are not limited to: (i) proxy statements and ballots being written in a language other than English; (ii) untimely and/or inadequate notice of shareholder meetings; (iii) restrictions on the ability of holders outside the issuer's jurisdiction of organization to exercise votes; (iv) requirements to vote proxies in person; (v) the imposition of restrictions on the sale of the securities for a period of time in proximity to the shareholder meeting; and (vi) requirements to provide local agents with power of attorney to facilitate our voting instructions. As a result, we vote clients' non-U.S. proxies on a best efforts basis only, after weighing the costs and benefits of voting such proxies, consistent with the Client Proxy Standard. ISS has been retained to provide assistance in connection with voting non-U.S. proxies.
II. GENERAL PROXY VOTING GUIDELINES
To promote consistency in voting proxies on behalf of its clients, we follow this Policy (subject to any exception set forth herein). The Policy addresses a broad range of issues, and provides general voting parameters on proposals that arise most frequently. However, details of specific proposals vary, and those
A-1
details affect particular voting decisions, as do factors specific to a given company. Pursuant to the procedures set forth herein, we may vote in a manner that is not in accordance with the following general guidelines, provided the vote is approved by the Proxy Review Committee (see Section III for description) and is consistent with the Client Proxy Standard. Morgan Stanley AIP GP LP will follow the procedures as described in Appendix A.
We endeavor to integrate governance and proxy voting policy with investment goals, using the vote to encourage portfolio companies to enhance long-term shareholder value and to provide a high standard of transparency such that equity markets can value corporate assets appropriately.
We seek to follow the Client Proxy Standard for each client. At times, this may result in split votes, for example when different clients have varying economic interests in the outcome of a particular voting matter (such as a case in which varied ownership interests in two companies involved in a merger results in different stakes in the outcome). We also may split votes at times based on differing views of portfolio managers.
We may abstain on matters for which disclosure is inadequate.
A. Routine Matters.
We generally support routine management proposals. The following are examples of routine management proposals:
• Approval of financial statements and auditor reports if delivered with an unqualified auditor's opinion.
• General updating/corrective amendments to the charter, articles of association or bylaws, unless we believe that such amendments would diminish shareholder rights.
• Most proposals related to the conduct of the annual meeting, with the following exceptions. We generally oppose proposals that relate to "the transaction of such other business which may come before the meeting," and open-ended requests for adjournment. However, where management specifically states the reason for requesting an adjournment and the requested adjournment would facilitate passage of a proposal that would otherwise be supported under this Policy (i.e. an uncontested corporate transaction), the adjournment request will be supported.
We generally support shareholder proposals advocating confidential voting procedures and independent tabulation of voting results.
B. Board of Directors.
1. Election of directors: Votes on board nominees can involve balancing a variety of considerations. In vote decisions, we may take into consideration whether the company has a majority voting policy in place that we believe makes the director vote more meaningful. In the absence of a proxy contest, we generally support the board's nominees for director except as follows:
a. We consider withholding support from or voting against a nominee if we believe a direct conflict exists between the interests of the nominee and the public shareholders, including failure to meet fiduciary standards of care and/or loyalty. We may oppose directors where we conclude that actions of directors are unlawful, unethical or negligent. We consider opposing individual board members or an entire slate if we believe the board is entrenched and/or dealing inadequately with performance problems; if we believe the board is acting with insufficient independence between the board and management; or if we believe the board has not been sufficiently forthcoming with information on key governance or other material matters.
b. We consider witholding support from or voting against interested directors if the company's board does not meet market standards for director independence, or if otherwise we believe board independence is insufficient. We refer to prevalent market standards as promulgated by a stock exchange or other authority within a given market (e.g., New York Stock Exchange or Nasdaq rules for most U.S. companies, and The Combined Code on Corporate Governance in the United Kingdom). Thus, for an NYSE company with no controlling shareholder, we would expect that at a minimum a majority of directors should be independent as defined by NYSE. Where we view market standards as inadequate, we may withhold votes based on stronger
A-2
independence standards. Market standards notwithstanding, we generally do not view long board tenure alone as a basis to classify a director as non-independent.
i. At a company with a shareholder or group that controls the company by virtue of a majority economic interest in the company, we have a reduced expectation for board independence, although we believe the presence of independent directors can be helpful, particularly in staffing the audit committee, and at times we may withhold support from or vote against a nominee on the view the board or its committees are not sufficiently independent. In markets where board independence is not the norm (e.g. Japan), however, we consider factors including whether a board of a controlled company includes independent members who can be expected to look out for interests of minority holders.
ii. We consider withholding support from or voting against a nominee if he or she is affiliated with a major shareholder that has representation on a board disproportionate to its economic interest.
c. Depending on market standards, we consider withholding support from or voting against a nominee who is interested and who is standing for election as a member of the company's compensation/renumeration, nominating/governance or audit committee.
d. We consider withholding support or voting against nominees if the term for which they are nominated is excessive. We consider this issue on a market-specific basis.
e. We consider withholding support from or voting against nominees if, in our view, there has been insufficient board renewal (turnover), particularly in the context of extended poor company performance.
f. We consider withholding support from or voting against a nominee standing for election if the board has not taken action to implement generally accepted governance practices for which there is a "bright line" test. For example, in the context of the U.S. market, failure to eliminate a dead hand or slow hand poison pill would be seen as a basis for opposing one or more incumbent nominees.
g. In markets that encourage designated audit committee financial experts, we consider voting against members of an audit committee if no members are designated as such. We also consider voting against the audit committee members if the company has faced financial reporting issues and/or does not put the auditor up for ratification by shareholders.
h. We believe investors should have the ability to vote on individual nominees, and may abstain or vote against a slate of nominees where we are not given the opportunity to vote on individual nominees.
i. We consider withholding support from or voting against a nominee who has failed to attend at least 75% of the nominee's board and board committee meetings within a given year without a reasonable excuse. We also consider opposing nominees if the company does not meet market standards for disclosure on attendance.
j. We consider withholding support from or voting against a nominee who appears overcommitted, particularly through service on an excessive number of boards. Market expectations are incorporated into this analysis; for U.S. boards, we generally oppose election of a nominee who serves on more than six public company boards (excluding investment companies), although we may reference National Association of Corporate Directors guidance suggesting that public company CEOs, for example, should serve no more than two outside boards given the level of time commitment required in their primary job.
2. Discharge of directors' duties: In markets where an annual discharge of directors' responsibility is a routine agenda item, we generally support such discharge. However, we may vote against discharge or abstain from voting where there are serious findings of fraud or other unethical behavior for which the individual bears responsibility. The annual discharge of responsibility represents shareholder approval of disclosed actions taken by the board during the year and may make future shareholder action against the board difficult to pursue.
A-3
3. Board independence: We generally support U.S. shareholder proposals requiring that a certain percentage (up to 66 2/3%) of the company's board members be independent directors, and promoting all-independent audit, compensation and nominating/governance committees.
4. Board diversity: We consider on a case-by-case basis shareholder proposals urging diversity of board membership with respect to social, religious or ethnic group.
5. Majority voting: We generally support proposals requesting or requiring majority voting policies in election of directors, so long as there is a carve-out for plurality voting in the case of contested elections.
6. Proxy access: We consider on a case-by-case basis shareholder proposals on particular procedures for inclusion of shareholder nominees in company proxy statements.
7. Reimbursement for dissident nominees: We generally support well-crafted U.S. shareholder proposals that would provide for reimbursement of dissident nominees elected to a board, as the cost to shareholders in electing such nominees can be factored into the voting decision on those nominees.
8. Proposals to elect directors more frequently: In the U.S. public company context, we usually support shareholder and management proposals to elect all directors annually (to "declassify" the board), although we make an exception to this policy where we believe that long-term shareholder value may be harmed by this change given particular circumstances at the company at the time of the vote on such proposal. As indicated above, outside the U.S., we generally support greater accountability to shareholders that comes through more frequent director elections, but recognize that many markets embrace longer term lengths, sometimes for valid reasons given other aspects of the legal context in electing boards.
9. Cumulative voting: We generally support proposals to eliminate cumulative voting in the U.S. market context. (Cumulative voting provides that shareholders may concentrate their votes for one or a handful of candidates, a system that can enable a minority bloc to place representation on a board.) U.S. proposals to establish cumulative voting in the election of directors generally will not be supported.
10. Separation of Chairman and CEO positions: We vote on shareholder proposals to separate the Chairman and CEO positions and/or to appoint an independent Chairman based in part on prevailing practice in particular markets, since the context for such a practice varies. In many non-U.S. markets, we view separation of the roles as a market standard practice, and support division of the roles in that context. In the U.S., we consider such proposals on a case-by-case basis, considering, among other things, the existing board leadership structure, company performance, and any other evidence of entrenchment or perceived risk that power is overly concentrated in a single individual.
11. Director retirement age and term limits: Proposals setting or recommending director retirement ages or director term limits are voted on a case-by-case basis that includes consideration of company performance, the rate of board renewal, evidence of effective individual director evaluation processes, and any indications of entrenchment.
12. Proposals to limit directors' liability and/or broaden indemnification of officers and directors. Generally, we will support such proposals provided that an individual is eligible only if he or she has not acted in bad faith, with gross negligence or with reckless disregard of his or her duties.
C. Statutory Auditor Boards.
The statutory auditor board, which is separate from the main board of directors, plays a role in corporate governance in several markets. These boards are elected by shareholders to provide assurance on compliance with legal and accounting standards and the company's articles of association. We generally vote for statutory auditor nominees if they meet independence standards. In markets that require disclosure on attendance by internal statutory auditors, however, we consider voting against nominees for these positions who failed to attend at least 75% of meetings in the previous year. We also consider opposing nominees if the company does not meet market standards for disclosure on attendance.
A-4
D. Corporate Transactions and Proxy Fights.
We examine proposals relating to mergers, acquisitions and other special corporate transactions (i.e., takeovers, spin-offs, sales of assets, reorganizations, restructurings and recapitalizations) on a case-by-case basis in the interests of each fund or other account. Proposals for mergers or other significant transactions that are friendly and approved by the Research Providers usually are supported if there is no portfolio manager objection. We also analyze proxy contests on a case-by-case basis.
E. Changes in Capital Structure.
1. We generally support the following:
• Management and shareholder proposals aimed at eliminating unequal voting rights, assuming fair economic treatment of classes of shares we hold.
• U.S. management proposals to increase the authorization of existing classes of common stock (or securities convertible into common stock) if: (i) a clear business purpose is stated that we can support and the number of shares requested is reasonable in relation to the purpose for which authorization is requested; and/or (ii) the authorization does not exceed 100% of shares currently authorized and at least 30% of the total new authorization will be outstanding. (We consider proposals that do not meet these criteria on a case-by-case basis.)
• U.S. management proposals to create a new class of preferred stock or for issuances of preferred stock up to 50% of issued capital, unless we have concerns about use of the authority for anti-takeover purposes.
• Proposals in non-U.S. markets that in our view appropriately limit potential dilution of existing shareholders. A major consideration is whether existing shareholders would have preemptive rights for any issuance under a proposal for standing share issuance authority. We generally consider market-specific guidance in making these decisions; for example, in the U.K. market, we usually follow Association of British Insurers' ("ABI") guidance, although company-specific factors may be considered and for example, may sometimes lead us to voting against share authorization proposals even if they meet ABI guidance.
• Management proposals to authorize share repurchase plans, except in some cases in which we believe there are insufficient protections against use of an authorization for anti-takeover purposes.
• Management proposals to reduce the number of authorized shares of common or preferred stock, or to eliminate classes of preferred stock.
• Management proposals to effect stock splits.
• Management proposals to effect reverse stock splits if management proportionately reduces the authorized share amount set forth in the corporate charter. Reverse stock splits that do not adjust proportionately to the authorized share amount generally will be approved if the resulting increase in authorized shares coincides with the proxy guidelines set forth above for common stock increases.
• Management dividend payout proposals, except where we perceive company payouts to shareholders as inadequate.
2. We generally oppose the following (notwithstanding management support):
• Proposals to add classes of stock that would substantially dilute the voting interests of existing shareholders.
• Proposals to increase the authorized or issued number of shares of existing classes of stock that are unreasonably dilutive, particularly if there are no preemptive rights for existing shareholders. However, depending on market practices, we consider voting for proposals giving general authorization for issuance of shares not subject to pre-emptive rights if the authority is limited.
• Proposals that authorize share issuance at a discount to market rates, except where authority for such issuance is de minimis, or if there is a special situation that we believe justifies such
A-5
authorization (as may be the case, for example, at a company under severe stress and risk of bankruptcy).
• Proposals relating to changes in capitalization by 100% or more.
We consider on a case-by-case basis shareholder proposals to increase dividend payout ratios, in light of market practice and perceived market weaknesses, as well as individual company payout history and current circumstances. For example, currently we perceive low payouts to shareholders as a concern at some Japanese companies, but may deem a low payout ratio as appropriate for a growth company making good use of its cash, notwithstanding the broader market concern.
F. Takeover Defenses and Shareholder Rights.
1. Shareholder rights plans: We generally support proposals to require shareholder approval or ratification of shareholder rights plans (poison pills). In voting on rights plans or similar takeover defenses, we consider on a case-by-case basis whether the company has demonstrated a need for the defense in the context of promoting long-term share value; whether provisions of the defense are in line with generally accepted governance principles in the market (and specifically the presence of an adequate qualified offer provision that would exempt offers meeting certain conditions from the pill); and the specific context if the proposal is made in the midst of a takeover bid or contest for control.
2. Supermajority voting requirements: We generally oppose requirements for supermajority votes to amend the charter or bylaws, unless the provisions protect minority shareholders where there is a large shareholder. In line with this view, in the absence of a large shareholder we support reasonable shareholder proposals to limit such supermajority voting requirements.
3. Shareholder right to call a special meeting: We consider proposals to enhance a shareholder's rights to call a special meeting on a case-by-case basis. At large-cap U.S. companies, we generally support efforts to establish the rights of holders of 10% or more of shares to call special meetings, unless the board or state law has a set policy or law establishing such rights at a threshold that we believe to be acceptable.
4. Written consent rights: In the U.S. context, we examine proposals for shareholder written consent rights on a case-by-case basis.
5. Reincorporation: We consider management and shareholder proposals to reincorporate to a different jurisdiction on a case-by-case basis. We oppose such proposals if we believe the main purpose is to take advantage of laws or judicial precedents that reduce shareholder rights.
6. Anti-greenmail provisions: Proposals relating to the adoption of anti-greenmail provisions will be supported, provided that the proposal: (i) defines greenmail; (ii) prohibits buyback offers to large block holders (holders of at least 1% of the outstanding shares and in certain cases, a greater amount) not made to all shareholders or not approved by disinterested shareholders; and (iii) contains no anti-takeover measures or other provisions restricting the rights of shareholders.
7. Bundled proposals: We may consider opposing or abstaining on proposals if disparate issues are "bundled" and presented for a single vote.
G. Auditors.
We generally support management proposals for selection or ratification of independent auditors. However, we may consider opposing such proposals with reference to incumbent audit firms if the company has suffered from serious accounting irregularities and we believe rotation of the audit firm is appropriate, or if fees paid to the auditor for non-audit-related services are excessive. Generally, to determine if non-audit fees are excessive, a 50% test will be applied (i.e., non-audit-related fees should be less than 50% of the total fees paid to the auditor). We generally vote against proposals to indemnify auditors.
A-6
H. Executive and Director Remuneration.
1. We generally support the following:
• Proposals for employee equity compensation plans and other employee ownership plans, provided that our research does not indicate that approval of the plan would be against shareholder interest. Such approval may be against shareholder interest if it authorizes excessive dilution and shareholder cost, particularly in the context of high usage ("run rate") of equity compensation in the recent past; or if there are objectionable plan design and provision.
• Proposals relating to fees to outside directors, provided the amounts are not excessive relative to other companies in the country or industry, and provided that the structure is appropriate within the market context. While stock-based compensation to outside directors is positive if moderate and appropriately structured, we are wary of significant stock option awards or other performance-based awards for outside directors, as well as provisions that could result in significant forfeiture of value on a director's decision to resign from a board (such forfeiture can undercut director independence).
• Proposals for employee stock purchase plans that permit discounts, but only for grants that are part of a broad-based employee plan, including all non-executive employees, and only if the discounts are limited to a reasonable market standard or less.
• Proposals for the establishment of employee retirement and severance plans, provided that our research does not indicate that approval of the plan would be against shareholder interest.
2. We generally oppose retirement plans and bonuses for non-executive directors and independent statutory auditors.
3. In the U.S. context, we generally vote against shareholder proposals requiring shareholder approval of all severance agreements, but proposals that require shareholder approval for agreements in excess of three times the annual compensation (salary and bonus) generally will be supported. We generally oppose shareholder proposals that would establish arbitrary caps on pay. We consider on a case-by-case basis shareholder proposals that seek to limit Supplemental Executive Retirement Plans (SERPs), but support such proposals where we consider SERPs to be excessive.
4. Shareholder proposals advocating stronger and/or particular pay-for-performance models will be evaluated on a case-by-case basis, with consideration of the merits of the individual proposal within the context of the particular company and its labor markets, and the company's current and past practices. While we generally support emphasis on long-term components of senior executive pay and strong linkage of pay to performance, we consider factors including whether a proposal may be overly prescriptive, and the impact of the proposal, if implemented as written, on recruitment and retention.
5. We generally support proposals advocating reasonable senior executive and director stock ownership guidelines and holding requirements for shares gained in executive equity compensation programs
6. We generally support shareholder proposals for reasonable "claw-back" provisions that provide for company recovery of senior executive bonuses to the extent they were based on achieving financial benchmarks that were not actually met in light of subsequent restatements.
7. Management proposals effectively to re-price stock options are considered on a case-by-case basis. Considerations include the company's reasons and justifications for a re-pricing, the company's competitive position, whether senior executives and outside directors are excluded, potential cost to shareholders, whether the re-pricing or share exchange is on a value-for-value basis, and whether vesting requirements are extended.
8. Say-on-Pay: We consider proposals relating to an advisory vote on remuneration on a case-by-case basis. Considerations include a review of the relationship between executive remuneration and performance based on operating trends and total shareholder return over multiple performance periods. In addition, we review remuneration structures and potential poor pay practices, including relative magnitude of pay, discretionary bonus awards, tax gross ups, change-in-control features, internal pay equity and peer group construction. As long-term investors, we support remuneration policies that align with long-term shareholder returns.
A-7
I. Social, Political and Environmental Issues.
Shareholders in the U.S. and certain other markets submit proposals encouraging changes in company disclosure and practices related to particular corporate, social, political and environmental matters. We consider how to vote on the proposals on a case-by-case basis to determine likely impacts on shareholder value. We seek to balance concerns on reputational and other risks that lie behind a proposal against costs of implementation, while considering appropriate shareholder and management prerogatives. We may abstain from voting on proposals that do not have a readily determinable financial impact on shareholder value. We support proposals that, if implemented, would enhance useful disclosure, but we generally vote against proposals requesting reports that we believe are duplicative, related to matters not material to the business, or that would impose unnecessary or excessive costs. We believe that certain social and environmental shareholder proposals may intrude excessively on management prerogatives, which can lead us to oppose them.
J. Fund of Funds.
Certain Funds advised by an MSIM Affiliate invest only in other MSIM Funds. If an underlying fund has a shareholder meeting, in order to avoid any potential conflict of interest, such proposals will be voted in the same proportion as the votes of the other shareholders of the underlying fund, unless otherwise determined by the Proxy Review Committee.
III. ADMINISTRATION OF POLICY
The MSIM Proxy Review Committee (the "Committee") has overall responsibility for the Policy. The Committee, which is appointed by MSIM's Long-Only Executive Committee, consists of investment professionals who represent the different investment disciplines and geographic locations of the firm, and is chaired by the director of the Corporate Governance Team ("CGT"). Because proxy voting is an investment responsibility and impacts shareholder value, and because of their knowledge of companies and markets, portfolio managers and other members of investment staff play a key role in proxy voting, although the Committee has final authority over proxy votes.
The CGT Director is responsible for identifying issues that require Committee deliberation or ratification. The CGT, working with advice of investment teams and the Committee, is responsible for voting on routine items and on matters that can be addressed in line with these Policy guidelines. The CGT has responsibility for voting case-by-case where guidelines and precedent provide adequate guidance.
The Committee will periodically review and have the authority to amend, as necessary, the Policy and establish and direct voting positions consistent with the Client Proxy Standard.
CGT and members of the Committee may take into account Research Providers' recommendations and research as well as any other relevant information they may request or receive, including portfolio manager and/or analyst comments and research, as applicable. Generally, proxies related to securities held in accounts that are managed pursuant to quantitative, index or index-like strategies ("Index Strategies") will be voted in the same manner as those held in actively managed accounts, unless economic interests of the accounts differ. Because accounts managed using Index Strategies are passively managed accounts, research from portfolio managers and/or analysts related to securities held in these accounts may not be available. If the affected securities are held only in accounts that are managed pursuant to Index Strategies, and the proxy relates to a matter that is not described in this Policy, the CGT will consider all available information from the Research Providers, and to the extent that the holdings are significant, from the portfolio managers and/or analysts.
A. Committee Procedures
The Committee meets at least quarterly and reviews and considers changes to the Policy at least annually. Through meetings and/or written communications, the Committee is responsible for monitoring and ratifying "split votes" (i.e., allowing certain shares of the same issuer that are the subject of the same proxy solicitation and held by one or more MSIM portfolios to be voted differently than other shares) and/or "override voting" (i.e., voting all MSIM portfolio shares in a manner contrary to the Policy). The Committee will review developing issues and approve upcoming votes, as appropriate, for matters as requested by CGT.
The Committee reserves the right to review voting decisions at any time and to make voting decisions as necessary to ensure the independence and integrity of the votes.
A-8
B. Material Conflicts of Interest
In addition to the procedures discussed above, if the CGT Director determines that an issue raises a material conflict of interest, the CGT Director may request a special committee to review, and recommend a course of action with respect to, the conflict(s) in question ("Special Committee").
A potential material conflict of interest could exist in the following situations, among others:
1. The issuer soliciting the vote is a client of MSIM or an affiliate of MSIM and the vote is on a matter that materially affects the issuer.
2. The proxy relates to Morgan Stanley common stock or any other security issued by Morgan Stanley or its affiliates except if echo voting is used, as with MSIM Funds, as described herein.
3. Morgan Stanley has a material pecuniary interest in the matter submitted for a vote (e.g., acting as a financial advisor to a party to a merger or acquisition for which Morgan Stanley will be paid a success fee if completed).
If the CGT Director determines that an issue raises a potential material conflict of interest, depending on the facts and circumstances, the issue will be addressed as follows:
1. If the matter relates to a topic that is discussed in this Policy, the proposal will be voted as per the Policy.
2. If the matter is not discussed in this Policy or the Policy indicates that the issue is to be decided case-by-case, the proposal will be voted in a manner consistent with the Research Providers, provided that all the Research Providers consulted have the same recommendation, no portfolio manager objects to that vote, and the vote is consistent with MSIM's Client Proxy Standard.
3. If the Research Providers' recommendations differ, the CGT Director will refer the matter to a Special Committee to vote on the proposal, as appropriate.
Any Special Committee shall be comprised of the CGT Director and at least two portfolio managers (preferably members of the Committee) as approved by the Committee. The CGT Director may request non-voting participation by MSIM's General Counsel or his/her designee and the Chief Compliance Officer or his/her designee. In addition to the research provided by Research Providers, the Special Committee may request analysis from MSIM Affiliate investment professionals and outside sources to the extent it deems appropriate.
C. Proxy Voting Reporting
The CGT will document in writing all Committee and Special Committee decisions and actions, which documentation will be maintained by the CGT for a period of at least six years. To the extent these decisions relate to a security held by an MSIM Fund, the CGT will report the decisions to each applicable Board of Trustees/Directors of those Funds at each Board's next regularly scheduled Board meeting. The report will contain information concerning decisions made during the most recently ended calendar quarter immediately preceding the Board meeting.
MSIM will promptly provide a copy of this Policy to any client requesting it. MSIM will also, upon client request, promptly provide a report indicating how each proxy was voted with respect to securities held in that client's account.
MSIM's Legal Department is responsible for filing an annual Form N-PX on behalf of each MSIM Fund for which such filing is required, indicating how all proxies were voted with respect to such Fund's holdings.
A-9
APPENDIX A
The following procedures apply to accounts managed by Morgan Stanley AIP GP LP and Private Investment Partners Inc. ("AIP").
Generally, AIP will follow the guidelines set forth in Section II of MSIM's Proxy Voting Policy and Procedures. To the extent that such guidelines do not provide specific direction, or AIP determines that consistent with the Client Proxy Standard, the guidelines should not be followed, the Proxy Review Committee has delegated the voting authority to vote securities held by accounts managed by AIP to the Fund of Hedge Funds investment team, the Private Equity Fund of Funds investment team or the Private Equity Real Estate Fund of Funds investment team of AIP. A summary of decisions made by the investment teams will be made available to the Proxy Review Committee for its information at the next scheduled meeting of the Proxy Review Committee.
In certain cases, AIP may determine to abstain from determining (or recommending) how a proxy should be voted (and therefore abstain from voting such proxy or recommending how such proxy should be voted), such as where the expected cost of giving due consideration to the proxy does not justify the potential benefits to the affected account(s) that might result from adopting or rejecting (as the case may be) the measure in question.
Waiver of Voting Rights
For regulatory reasons, AIP may either 1) invest in a class of securities of an underlying fund (the "Fund") that does not provide for voting rights; or 2) waive 100% of its voting rights with respect to the following:
1. Any rights with respect to the removal or replacement of a director, general partner, managing member or other person acting in a similar capacity for or on behalf of the Fund (each individually a "Designated Person," and collectively, the "Designated Persons"), which may include, but are not limited to, voting on the election or removal of a Designated Person in the event of such Designated Person's death, disability, insolvency, bankruptcy, incapacity, or other event requiring a vote of interest holders of the Fund to remove or replace a Designated Person; and
2. Any rights in connection with a determination to renew, dissolve, liquidate, or otherwise terminate or continue the Fund, which may include, but are not limited to, voting on the renewal, dissolution, liquidation, termination or continuance of the Fund upon the occurrence of an event described in the Fund's organizational documents; provided, however, that, if the Fund's organizational documents require the consent of the Fund's general partner or manager, as the case may be, for any such termination or continuation of the Fund to be effective, then AIP may exercise its voting rights with respect to such matter.
Approved by Morgan Stanley Funds Board on September 27-28, 2011
A-10
APPENDIX B
DESCRIPTION OF RATINGS
I. Excerpts from Moody's Investors Service, Inc.'s Corporate Bond Ratings:
Aaa: Judged to be of the best quality; carry the smallest degree of investment risk;
Aa: judged to be of high quality by all standards;
A: possess many favorable investment attributes and are to be considered upper medium grade obligations;
Baa: considered as medium grade obligations; i.e., they are neither highly protected nor poorly secured;
Ba: judged to have speculative elements; their future cannot be considered well-assured;
B: considered speculative, assurance of interest and principal payments or of maintenance of other terms of the contract over any long period of time may be small.
Caa: Bonds which are rated Caa are of poor standing. Such issues may be in default or there may be present elements of danger with respect to principal or interest.
Ca: Bonds which are rated Ca represent obligations which are speculative in a high degree. Such issues are often in default or have other marked shortcomings with some prospect of recovery of principal and interest.
C: Bonds which are rated C are lowest rated class of bonds and issues so rated can be regarded as having extremely poor prospects of ever attaining any real investment standing with little prospect for recovery of principal or interest.
Note: Moody's applies numerical modifiers, 1, 2 and 3 in each generic rating classification from Aa through Caa in its corporate bond rating system. The modifier 1 indicates that the obligation ranks in the higher end of its generic rating category; the modifier 2 indicates a mid-range ranking; and the modifier 3 indicates that the issue ranks in the lower end of its generic rating category.
II. Excerpts from Standard & Poor's Rating Group's Corporate Bond Ratings:
AAA: Highest rating assigned for an obligation; obligor has extremely strong capacity to meet its financial commitments;
AA: obligation differs from the highest-rated obligations only in small degree; obligor's capacity to meet its financial commitment on the obligation is very strong;
A: obligation is somewhat more susceptible to the adverse effects of changes in circumstances and economic conditions than obligations in higher-rated categories; obligor's capacity to meet its financial commitment on the obligation is still strong;
BBB: obligation exhibits adequate protection parameters; adverse economic conditions or changing circumstances are more likely to lead to a weakened capacity of the obligor to meet its financial commitment on the obligation.
BB, B, CCC, CC, C: Obligations rated BB, B, CCC, CC and C are regarded as having significant speculative characteristics. BB indicates the least degree of speculation and C the highest. While such obligations will likely have some quality and protective characteristics, these may be outweighed by large uncertainties or major exposures to adverse conditions. The C rating may be used to cover a situation where a bankruptcy petition has been filed or similar action has been taken, but payments on this obligation are being continued.
D: An obligation rated D is in payment default. The D rating category is used when payments on an obligation are not made on the date due even if the applicable grace period has not expired, unless Standard & Poor's believes that such payments will be made within five business days. The D rating also will be used upon the filing of a bankruptcy petition or the taking of a similar action if payments on an obligation are jeopardized.
Plus (+) or minus (-): The ratings from AA to CCC may be modified by the addition of a plus or minus sign to show relative standing within the major rating categories.
B-1
III. Excerpts from Fitch, Inc.'s Corporate Bond Ratings:
AAA: Highest credit quality; denotes the lowest expectation of credit risk; assigned only in case of exceptionally strong capacity for timely payment of financial commitments. This capacity is highly unlikely to be adversely affected by foreseeable events.
AA: Very high credit quality; denote expectations of very low credit risk; indicate very strong capacity for timely payment of financial commitments. This capacity is not significantly vulnerable to foreseeable events.
A: High credit quality; denote expectations of low credit risk. The capacity for timely payment of financial commitments is considered strong. This capacity may, nevertheless, be more vulnerable to changes in circumstances or in economic conditions than is the case for higher ratings.
BBB: Good credit quality; indicates that there is currently expectations of low credit risk. The capacity for timely payment of financial commitments is considered adequate but adverse changes in circumstances and economic conditions are more likely to impair this capacity. This is the lowest investment grade category.
BB: Speculative; indicates that there is a possibility of credit risk developing, particularly as the result of adverse economic change over time; however, business or financial alternatives may be available to allow financial commitments to be met. Securities rated in this category are not investment grade.
B: Highly speculative; indicates that significant credit risk is present, but a limited margin of safety remains. Financial commitments are currently being met; however, capacity for continued payment is contingent upon a sustained, favorable business and economic environment.
CCC: Default is a real possibility. Capacity for meeting financial commitments is solely reliant upon sustained, favorable business or economic conditions.
CC: Default of some kind appears probable.
C: Default is imminent.
RD: Indicates an entity that has failed to make due payments (within the applicable grace period) on some but not all material financial obligations, but continues to honor other classes of obligations.
D: Default indicates an issuer that in Fitch Ratings' opinion has entered into bankruptcy filings, administration, receivership, liquidation or other formal winding-up procedure, or which has otherwise ceased business.
The modifiers "+" or "-" may be appended to a rating to denote relative status within major rating categories. Such suffixes are not added to the AAA Long-term rating category or to categories below CCC.
IV. Excerpts from Moody's Investors Service, Inc.'s Preferred Stock Ratings:
aaa: An issue which is rated aaa is considered to be a top-quality preferred stock. This rating indicates good asset protection and the least risk of dividend impairment within the universe of preferred stocks.
aa: An issue which is rated aa is considered a high-grade preferred stock. This rating indicates that there is reasonable assurance that earnings and asset protection will remain relatively well maintained in the foreseeable future.
a: An issue which is rated a is considered to be an upper medium grade preferred stock. While risks are judged to be somewhat greater than in the aaa and aa classifications, earnings and asset protection are, nevertheless expected to be maintained at adequate levels.
baa: An issue which is rated baa is considered to be medium grade preferred stock, neither highly protected nor poorly secured. Earnings and asset protection appear adequate at present but may be questionable over any great length of time.
ba: an issue which is rated ba is considered to have speculative elements and its future cannot be considered well assured. Earnings and asset protection may be very moderate and not well safeguarded during adverse periods. Uncertainty of position characterizes preferred stocks in this class.
b: An issue which is rated b generally lacks the characteristics of a desirable investment. Assurance of dividend payments and maintenance of other terms of the issue over any long period of time may be small.
B-2
caa: An issue which is rated caa is likely to be in arrears on dividend payments. This rating designation does not purport to indicate the future status of payment.
ca: An issue which is rated ca is speculative in a high degree and is likely to be in arrears on dividends with little likelihood of eventual payment.
c: This is the lowest rated class of preferred or preference stock. Issues so rated can be regarded as having extremely poor prospects of ever attaining any real investment standing.
Note: Moody's may apply numerical modifiers 1, 2 and 3 in each rating classification. The modifier 1 indicated that the security ranks in the higher end of its generic rating category; the modifier 2 indicates a mid-range ranking; and the modifier 3 indicates that the issue ranks in the lower end of its generic rating category.
V. Excerpts from Standard & Poor's Rating Group's Preferred Stock Ratings:
AAA: This is the highest rating that may be assigned by S&P's to a preferred stock issue and indicates an extremely strong capacity to pay the preferred stock obligations.
AA: A preferred stock issue rated AA also qualifies as a high-quality fixed-income security. The capacity to pay preferred stock obligations is very strong, although not as overwhelming as for issues rated AAA.
A: An issue rated A is backed by a sound capacity to pay the preferred stock obligations, although it is somewhat more susceptible to the adverse effect of the changes in circumstances and economic conditions.
BBB: An issue rated BBB is regarded as backed by an adequate capacity to pay the preferred stock obligations. Whereas it normally exhibits adequate protection parameter, adverse economic conditions or changing circumstances are more likely to lead to a weakened capacity to make payments for a preferred stock in this category than for issues in the A category.
BB, B, CCC: Preferred stock rated BB, B, and CCC are regarded, on balance, as predominantly speculative with respect to the issuer's capacity to pay preferred stock obligations. BB indicates the lowest degree of speculation and CCC the highest degree of speculation. While such issues will likely have some quality and protective characteristics, these are outweighed by large uncertainties of major risk exposures to adverse conditions.
CC: The rating CC is reserved for a preferred stock in arrears on dividends or sinking fund payments but that is currently paying.
C: A preferred stock rated C is a non-paying issue.
D: A preferred stock rated D is a non-paying issue with the issuer in default on debt instruments.
Plus (+) or Minus (-): The ratings from AA for CCC may be modified by the addition of a plus or minus sign to show relative standing within the major rating categories.
VI. Excerpts from Fitch, Inc's Preferred Stock Ratings:
AAA: These preferred stocks are considered to be investment grade and of the highest credit quality. The obligor has an exceptionally strong ability to pay, which is unlikely to be affected by reasonably foreseeable events.
AA: These preferred stocks are considered to be investment grade and of very high credit quality. The obligor's ability to pay is very strong, although not quite as strong as preferred stocks rated "AAA".
A: These preferred stocks are considered to be investment grade and of high credit quality. The obligor's ability to pay is considered to be strong, but may be more vulnerable to adverse changes in economic conditions and circumstances than preferred stocks with higher ratings.
BBB: These preferred stocks are considered to be investment grade and of satisfactory credit quality. The obligor's ability to pay interest and repay principal is considered to be adequate. Adverse changes in economic conditions and circumstances, however, are more likely to have adverse impact on these preferred stocks, and therefore, impair timely payment. The likelihood that the ratings of these preferred stocks will fall below investment grade is higher than for preferred stocks with higher ratings.
B-3
BB: These preferred stocks are considered speculative. The obligor's ability to pay may be affected over time by adverse economic changes. However, business and financial alternatives can be identified that could assist the obligor in satisfying its dividend payment requirements.
B: These preferred stocks are considered highly speculative. While preferred in this class are currently meeting dividend payment requirements, the probability of continued timely payment reflects the obligor's limited margin of safety and the need for reasonable business and economic activity throughout the life of the issue.
CCC: These preferred stocks have certain identifiable characteristics which, if not remedied, may lead to non-payment. The ability to meet obligations requires an advantageous business and economic environment.
CC: These preferred stocks are minimally protected. Non-payment seems probable over time.
C: These preferred stocks are in imminent non-payment.
DDD, DD AND D: These preferred stocks are in non-payment. Such preferred stocks are extremely speculative and should be valued on the basis of their ultimate recovery value in liquidation or reorganization of the obligor. DDD represents the highest potential for recovery and D represents the lowest potential for recovery.
PLUS (+) OR MINUS (-): The ratings from AA to C may be modified by the addition of a plus or minus sign to indicate the relative position of a credit within the rating category.
B-4

December 31, 2013
Supplement
SUPPLEMENT DATED DECEMBER 31, 2013 TO THE STATEMENT OF ADDITIONAL INFORMATION OF
Morgan Stanley Variable Investment Series, dated April 30, 2013
(the "Fund")
Effective January 1, 2014, the Board of Trustees of the Fund has approved changing the administrator of the Fund from Morgan Stanley Services Company Inc. to Morgan Stanley Investment Management Inc.
As a result, effective January 1, 2014, all references in the Fund's Statement of Additional Information ("SAI") to Morgan Stanley Services Company Inc., as administrator, are hereby deleted and replaced with Morgan Stanley Investment Management Inc.
PLEASE RETAIN THIS SUPPLEMENT FOR FUTURE REFERENCE.

October 11, 2013
Supplement
SUPPLEMENT DATED OCTOBER 11, 2013 TO THE STATEMENT OF ADDITIONAL INFORMATION OF
MORGAN STANLEY VARIABLE INVESTMENT SERIES
Dated April 30, 2013
The section of the Statement of Additional Information entitled "II. Description of the Fund and Its Investments and Risks—C. Investment Strategies and Risks—Repurchase Agreements" is hereby deleted and replaced with the following:
Repurchase Agreements. The Portfolios may invest in repurchase agreements. These agreements typically involve the acquisition by the Portfolios of debt securities from a selling financial institution (such as a bank or broker-dealer), coupled with an agreement that the institution will repurchase the underlying security, at a specified price and at a fixed time in the future (or on demand, if applicable). The underlying securities, which serve as collateral for the agreement, will be marked-to-market daily to determine that the value of the collateral, as specified in the agreement, does not decrease below the purchase price plus accrued interest. If such decrease occurs, additional collateral will be requested and, when received, will be added to the account to maintain full collateralization. The Portfolios will accrue interest from the institution until the time when the repurchase is to occur. Although this date is deemed by the Portfolio to be the maturity date of a repurchase agreement, the maturities of securities subject to repurchase agreements are not subject to any limits.
While repurchase agreements involve certain risks not associated with direct investments in debt securities, the Portfolios follow procedures approved by the Trustees that are designed to minimize such risks. These procedures include effecting repurchase transactions only with large, well-capitalized and well-established financial institutions whose financial condition will be continually monitored by the Adviser and/or Sub-Advisers. In addition, as described above, the value of the collateral underlying the repurchase agreement will be at least equal to the repurchase price which consists of the acquisition price paid to the seller of the securities plus the accrued resale premium, which is defined as the amount specified in the repurchase agreement or the daily amortization of the difference between the acquisition price and the resale price specified in the repurchase agreement. In the event of a default or bankruptcy by a selling financial institution, the Portfolios will seek to liquidate such collateral. However, the exercising of a Portfolio's right to liquidate such collateral could involve certain costs or delays and, to the extent that proceeds from any sale upon a default of the obligation to repurchase were less than the repurchase price, the Portfolios could suffer a loss. The Money Market Portfolio may invest in repurchase agreements backed by municipal securities and non-governmental collateral such as corporate debt obligations, convertible securities and common and preferred stock. Certain of these securities may be rated below investment grade. A Portfolio will not invest in repurchase agreements that do not mature within seven days if any such investment, together with any other illiquid assets held by that Portfolio, amounts to more than 5% of its net assets in the Money Market Portfolio, and 15% of its net assets in the case of each of the other Portfolios. A Portfolio's investments in repurchase agreements may at times be substantial when, in the view of the Portfolio's Adviser and/or Sub-Advisers, liquidity or other conditions warrant.
PLEASE RETAIN THIS SUPPLEMENT FOR FUTURE REFERENCE.

August 30, 2013
Supplement
SUPPLEMENT DATED AUGUST 30, 2013 TO THE STATEMENT OF ADDITIONAL INFORMATION OF
MORGAN STANLEY VARIABLE INVESTMENT SERIES
(the "Fund")
Dated April 30, 2013
Effective September 1, 2013, John Gernon will replace Arthur Lev as President and Principal Executive Officer of the Fund. As a result, effective September 1, 2013, the following information hereby replaces in its entirety the biographical information for Mr. Lev contained in the Fund's Statement of Additional Information:
Name, Age and
Address of
Executive Officer | | Position(s)
Held with
Registrant | | Length
of Time
Served* | | Principal Occupation(s) During Past 5 Years | |
John Gernon (50)
522 Fifth Avenue
New York, NY 10036 | | President and Principal Executive Officer—Equity, Fixed Income and AIP Funds | | Since September 2013 | | President and Principal Executive Officer of the Equity and Fixed Income Funds and the Morgan Stanley AIP Funds (since September 2013) in the Fund Complex. Managing Director of the Adviser. | |
* Each officer serves an indefinite term, until his or her successor is elected.
PLEASE RETAIN THIS SUPPLEMENT FOR FUTURE REFERENCE.
SUPPLEMENT DATED JUNE 28, 2013 TO THE STATEMENTS OF ADDITIONAL INFORMATION OF
Active Assets California Tax-Free Trust, dated October 31, 2012
Active Assets Government Securities Trust, dated October 31, 2012
Active Assets Institutional Government Securities Trust, dated October 31, 2012
Active Assets Institutional Money Trust, dated October 31, 2012
Active Assets Money Trust, dated October 31, 2012
Active Assets Tax-Free Trust, dated October 31, 2012
Morgan Stanley California Tax-Free Daily Income Trust, dated April 30, 2013
Morgan Stanley European Equity Fund Inc., dated February 28, 2013
Morgan Stanley Focus Growth Fund, Classes A, B, L and I, dated April 30, 2013
Morgan Stanley Focus Growth Fund, Class IS, dated June 13, 2013
Morgan Stanley Global Fixed Income Opportunities Fund, Classes A, B, L and I, dated February 28, 2013
Morgan Stanley Global Fixed Income Opportunities Fund, Class IS, dated June 13, 2013
Morgan Stanley Global Infrastructure Fund, Classes A, B, L and I, dated April 30, 2013
Morgan Stanley Global Infrastructure Fund, Class Q, dated April 30, 2013
Morgan Stanley Limited Duration U.S. Government Trust, dated May 14, 2013
Morgan Stanley Mortgage Securities Trust, dated February 28, 2013
Morgan Stanley Multi Cap Growth Trust, Classes A, B, L and I, dated March 29, 2013
Morgan Stanley Multi Cap Growth Trust, Class IS, dated June 13, 2013
Morgan Stanley New York Municipal Money Market Trust, dated April 30, 2013
Morgan Stanley Select Dimensions Investment Series, dated April 30 2013
Morgan Stanley Tax-Free Daily Income Trust, dated April 30, 2013
Morgan Stanley U.S. Government Money Market Trust, dated May 31, 2013
Morgan Stanley U.S. Government Securities Trust, dated April 30, 2013
Morgan Stanley Variable Investment Series, dated April 30, 2013
(collectively, the "Funds")
Effective July 1, 2013, the Board of Directors/Trustees of each Fund has approved changing the transfer agent of each Fund from Morgan Stanley Services Company Inc. to Boston Financial Data Services, Inc.
As a result, effective July 1, 2013, all references in each Fund's Statement of Additional Information ("SAI") to Morgan Stanley Services Company Inc., as transfer agent, are hereby deleted and replaced with Boston Financial Data Services, Inc.
***
The first sentence of the section of each Fund's SAI entitled "V. Investment Advisory and Other Services—E. Other Service Providers—(1) Transfer Agent/Dividend Disbursing Agent" is hereby deleted and replaced with the following:
Boston Financial Data Services, Inc., 2000 Crown Colony Drive, Quincy, Massachusetts 02169-0953, is the Transfer Agent for the Fund's shares and the Dividend Disbursing Agent for payment of dividends and distributions on Fund shares.
PLEASE RETAIN THIS SUPPLEMENT FOR FUTURE REFERENCE.

SUPPLEMENT DATED MAY 31, 2013 TO THE STATEMENT OF ADDITIONAL INFORMATION OF
MORGAN STANLEY VARIABLE INVESTMENT SERIES
(the "Fund")
Dated April 30, 2013
Fundamental investment restriction 2 under the section of the Statement of Additional Information entitled "II. Description of the Fund and Its Investments and Risks—D. Fund Policies/Investment Restrictions" is hereby deleted and replaced with the following:
2. Concentrate its investments in any particular industry, but if deemed appropriate for attainment of its investment objective, a Portfolio may invest up to 25% of its total assets (valued at the time of investment) in any one industry classification used by that Portfolio for investment purposes. The restriction does not apply to obligations issued or guaranteed by the United States Government or its agencies or instrumentalities, or, in the case of the Money Market Portfolio, to domestic bank obligations (not including obligations issued by foreign branches of such banks). This restriction does not apply, in the case of the Global Infrastructure Portfolio, to the infrastructure industry in which industry the Portfolio will concentrate.
STATEMENT OF ADDITIONAL INFORMATION
Morgan Stanley
Variable Investment Series
April 30, 2013
Portfolios
Money Market Portfolio
Limited Duration Portfolio
Income Plus Portfolio
Global Infrastructure Portfolio
European Equity Portfolio
Multi Cap Growth Portfolio
This Statement of Additional Information ("SAI") for Morgan Stanley Variable Investment Series (the "Fund") is not a prospectus. The Fund's Class X Prospectus and the Class Y Prospectus (each dated April 30, 2013) for each portfolio listed above provide the basic information you should know before allocating your investment under your variable annuity contract or your variable life contract. Prospectuses may be obtained without charge from the Fund at its address or telephone number listed below.
The Fund's audited financial statements for the fiscal year ended December 31, 2012, including notes thereto, and the report of the Fund's independent registered public accounting firm, are herein incorporated by reference to the Fund's Annual Report to Shareholders. A copy of the Fund's Annual Report to Shareholders must accompany the delivery of this SAI.
Morgan Stanley
Variable Investment Series
522 Fifth Avenue
New York, NY 10036
(800) 869-NEWS
TABLE OF CONTENTS
I. | | Fund History | | | 4 | | |
II. | | Description of the Fund and Its Investments and Risks | | | 4 | | |
| | | | | A. Classification | | | 4 | | |
| | | | | B. Eligible Purchasers | | | 4 | | |
| | | | | C. Investment Strategies and Risks | | | 4 | | |
| | | | | D. Fund Policies/Investment Restrictions | | | 28 | | |
| | | | | E. Disclosure of Portfolio Holdings | | | 30 | | |
III. | | Management of the Fund | | | 32 | | |
| | | | | A. Board of Trustees | | | 32 | | |
| | | | | B. Management Information | | | 33 | | |
| | | | | C. Compensation | | | 42 | | |
IV. | | Control Persons and Principal Holders of Securities | | | 44 | | |
V. | | Investment Advisory and Other Services | | | 44 | | |
| | | | | A. Adviser, Sub-Advisers and Administrator | | | 44 | | |
| | | | | B. Principal Underwriter | | | 47 | | |
| | | | | C. Services Provided by the Adviser, Sub-Advisers and Administrator | | | 47 | | |
| | | | | D. Rule 12b-1 Plan | | | 48 | | |
| | | | | E. Other Service Providers | | | 50 | | |
| | | | | F. Fund Management | | | 50 | | |
| | | | | G. Codes of Ethics | | | 52 | | |
| | | | | H. Proxy Voting Policy and Proxy Voting Record | | | 52 | | |
| | | | | I. Revenue Sharing | | | 52 | | |
VI. | | Brokerage Allocation and Other Practices | | | 53 | | |
| | | | | A. Brokerage Transactions | | | 53 | | |
| | | | | B. Commissions | | | 54 | | |
| | | | | C. Brokerage Selection | | | 55 | | |
| | | | | D. Regular Broker-Dealers | | | 57 | | |
VII. | | Capital Stock and Other Securities | | | 57 | | |
VIII. | | Purchase, Redemption and Pricing of Shares | | | 58 | | |
| | | | | A. Purchase/Redemption of Shares | | | 58 | | |
| | | | | B. Offering Price | | | 58 | | |
IX. | | Taxation of the Portfolios and Shareholders | | | 61 | | |
X. | | Underwriters | | | 64 | | |
XI. | | Performance Data | | | 64 | | |
XII. | | Financial Statements | | | 66 | | |
XIII. | | Fund Counsel | | | 66 | | |
| | | Appendix A — Morgan Stanley Investment Management Proxy Voting Policy and Procedures | | | A-1 | | |
| | | Appendix B — Description of Ratings | | | B-1 | | |
2
Glossary of Selected Defined Terms
The terms defined in this glossary are frequently used in this SAI (other terms used occasionally are defined in the text of the document).
"Administrator" or "Morgan Stanley Services" — Morgan Stanley Services Company Inc., a wholly-owned fund services subsidiary of the Adviser.
"Adviser" — Morgan Stanley Investment Management Inc., a wholly-owned investment adviser subsidiary of Morgan Stanley.
"Contract" — Variable annuity contract and/or variable life insurance contract issued by the insurance company.
"Contract Owners" — Owners of a Contract.
"Custodian" — State Street Bank and Trust Company.
"Distributor" — Morgan Stanley Distribution, Inc., a wholly-owned broker-dealer subsidiary of Morgan Stanley.
"Financial Advisors" — Morgan Stanley authorized financial services representatives.
"Fund" — Morgan Stanley Variable Investment Series, a registered open-end series investment company currently consisting of six Portfolios.
"Independent Trustees" — Trustees who are not "interested persons" (as defined in the Investment Company Act of 1940, as amended ("Investment Company Act")) of the Fund.
"Morgan Stanley & Co." — Morgan Stanley & Co. LLC, a wholly-owned broker-dealer subsidiary of Morgan Stanley.
"Morgan Stanley Funds" — Registered investment companies for which the Adviser serves as the investment adviser and that hold themselves out to investors as related companies for investment and investor services.
"Portfolio(s)" — The separate investment portfolio(s) of the Fund.
"Sub-Advisers" — Morgan Stanley Investment Management Limited (only applicable to the European Equity Portfolio and the Global Infrastructure Portfolio) and Morgan Stanley Investment Management Company (only applicable to the Global Infrastructure Portfolio), each a wholly-owned subsidiary of Morgan Stanley.
"Transfer Agent" — Morgan Stanley Services Company Inc., a wholly-owned transfer agent subsidiary of Morgan Stanley.
"Trustees" — The Board of Trustees of the Fund.
3
I. FUND HISTORY
The Fund was organized as a Massachusetts business trust, under a Declaration of Trust, on February 25, 1983 under the name Dean Witter Variable Annuity Investment Series. Effective February 23, 1988, the Fund's name was changed to Dean Witter Variable Investment Series. Effective June 22, 1998, the Fund's name was changed to Morgan Stanley Dean Witter Variable Investment Series. Effective June 18, 2001, the Fund's name was changed to Morgan Stanley Variable Investment Series. Effective May 1, 2002, the name of the Short-Term Bond Portfolio was changed to the Limited Duration Portfolio. Effective December 30, 2004, the name of the European Growth Portfolio was changed to the European Equity Portfolio. Effective April 29, 2005, the name of the Quality Income Plus Portfolio was changed to the Income Plus Portfolio. Effective May 1, 2008, the name of the Equity Portfolio was changed to the Capital Opportunities Portfolio. Effective November 3, 2008, the name of the Utilities Portfolio was changed to the Global Infrastructure Portfolio. Effective April 29, 2011, the name of the Capital Opportunities Portfolio was changed to the Multi Cap Growth Portfolio.
II. DESCRIPTION OF THE FUND AND ITS INVESTMENTS AND RISKS
A. Classification
The Fund is an open-end management investment company which currently offers shares of six separate portfolios (each a "Portfolio" and, collectively, the "Portfolios"). Each Portfolio is "diversified" as defined in the Investment Company Act.
B. Eligible Purchasers
As discussed in each of the Class X and Class Y Prospectuses, shares of the Portfolios are sold only to particular insurance companies in connection with variable annuity and/or variable life insurance contracts they issue. It is conceivable that in the future it may become disadvantageous for both variable life insurance and variable annuity contract separate accounts to invest in the same underlying funds. Although neither the various insurance companies nor the Fund currently foresee any such disadvantage, the Trustees intend to monitor events in order to identify any material irreconcilable conflict between the interest of variable annuity contract owners and variable life insurance contract owners and to determine what action, if any, should be taken in response thereto.
C. Investment Strategies and Risks
The following discussion of each Portfolio's investment strategies and risks should be read with the sections of the Class X and Class Y Prospectuses titled "Principal Investment Strategies," "Principal Risks" and "Additional Information about the Portfolio's Investment Objectives, Strategies and Risks." For purposes of this section, references to the Adviser, when used in connection with its activities as adviser to the sub-advised Portfolios, include any Sub-Advisers acting under the Adviser's supervision, as applicable.
Convertible Securities. Each Portfolio, other than the Money Market Portfolio, may invest in securities which are convertible into common stock or other securities of the same or a different issuer or into cash within a particular period of time at a specified price or formula ("convertible securities"). Convertible securities are generally fixed-income securities (but may include preferred stock) and generally rank senior to the common stocks in a corporation's capital structure and, therefore, entail less risk than the corporation's common stock. The value of a convertible security is a function of its "investment value" (its value as if it did not have a conversion privilege), and its "conversion value" (the security's worth if it were to be exchanged for the underlying security, at market value, pursuant to its conversion privilege).
To the extent that a convertible security's investment value is greater than its conversion value, its price will be primarily a reflection of such investment value and its price will be likely to increase when interest rates fall and decrease when interest rates rise, as with a fixed-income security (the credit standing of the issuer and other factors may also have an effect on the convertible security's value). If the conversion value exceeds the investment value, the price of the convertible security will rise above its investment value and, in addition, will sell at some premium over its conversion value. (This premium represents the price investors are willing to pay for the privilege of purchasing a fixed-income security with a possibility of capital appreciation due to the conversion privilege.) At such times the price of the convertible security will tend to fluctuate directly with the price of the underlying equity security. Convertible securities may be purchased by a Portfolio at varying price levels above their investment values and/or their conversion values in keeping with the Portfolio's investment objective(s).
4
With respect to each Portfolio other than the Money Market Portfolio, the Limited Duration Portfolio and the Income Plus Portfolio, up to 5% of the Portfolio's net assets may be invested in convertible securities that are below investment grade. Debt securities rated below investment grade are commonly known as "junk bonds." Although the Portfolio selects these securities primarily on the basis of their equity characteristics, investors should be aware that convertible securities rated in these categories are considered high risk securities; the rating agencies consider them speculative with respect to the issuer's continuing ability to make timely payments of interest and principal. Thus, to the extent that such convertible securities are acquired by the Portfolio, there is a greater risk as to the timely repayment of the principal of, and timely payment of interest or dividends on, such securities than in the case of higher-rated convertible securities.
Limited Partnership Interests. Each Portfolio, other than the Money Market Portfolio, the Limited Duration Portfolio and the Income Plus Portfolio, may purchase limited partnerships. A limited partnership interest entitles a Portfolio to participate in the investment return of the partnership's assets as defined by the agreement among the partners. As a limited partner, a Portfolio generally is not permitted to participate in the management of the partnership. However, unlike a general partner whose liability is not limited, a limited partner's liability generally is limited to the amount of its commitment to the partnership. A Portfolio that invests in limited partnership interests may invest to the same extent in limited liability company interests. Limited liability company interests have similar characteristics as limited partnership interests.
Derivatives. Certain Portfolios may, but are not required to, use various derivatives and related investment strategies as described below. Derivatives may be used for a variety of purposes including hedging, risk management, portfolio management or to earn income. Any or all of the investment techniques described herein may be used at any time and there is no particular strategy that dictates the use of one technique rather than another, as the use of any derivative by a Portfolio is a function of numerous variables, including market conditions. The Portfolios comply with applicable regulatory requirements when using derivatives, including the segregation or earmarking of cash or liquid assets when mandated by U.S. Securities and Exchange Commission ("SEC") rules or SEC staff positions. Although the Adviser and/or Sub-Advisers seek to use derivatives to further a Portfolio's investment objective(s), no assurance can be given that the use of derivatives will achieve this result.
General Risks of Derivatives.
Derivatives utilized by the Portfolios may involve the purchase and sale of derivative instruments. A derivative is a financial instrument the value of which depends upon (or derives from) the value of another asset, security, interest rate or index. Derivatives may relate to a wide variety of underlying instruments, including equity and debt securities, indices, interest rates, currencies and other assets. Certain derivative instruments which the Portfolios may use and the risks of those instruments are described in further detail below. A Portfolio may in the future also utilize derivatives techniques, instruments and strategies that may be newly developed or permitted as a result of regulatory changes, consistent with the Portfolio's investment objective(s) and policies. Such newly developed techniques, instruments and strategies may involve risks different than or in addition to those described herein. No assurance can be given that any derivatives strategy employed by a Portfolio will be successful.
The risks associated with the use of derivatives are different from, and possibly greater than, the risks associated with investing directly in the instruments underlying such derivatives. Derivatives are highly specialized instruments that require investment techniques and risk analyses different from other portfolio investments. The use of derivative instruments requires an understanding not only of the underlying instrument but also of the derivative itself. Certain risk factors generally applicable to derivative transactions are described below.
• Derivatives are subject to the risk that the market value of the derivative itself or the market value of underlying instruments will change in a way adverse to a Portfolio's interests. The Portfolio bears the risk that the Adviser and/or Sub-Advisers may incorrectly forecast future market trends and other financial or economic factors or the value of the underlying security, index, interest rate or currency when establishing a derivatives position for the Portfolio.
• Derivatives may be subject to pricing risk, which exists when a derivative becomes extraordinarily expensive (or inexpensive) relative to historical prices or corresponding instruments. Under such market conditions, it may not be economically feasible to initiate a transaction or liquidate a position at an advantageous time or price.
• Many derivatives are complex and often valued subjectively. Improper valuations can result in increased payment requirements to counterparties or a loss of value to the Portfolio.
5
• Using derivatives as a hedge against a portfolio investment subjects the Portfolio to the risk that the derivative will have imperfect correlation with the portfolio investment, which could result in the Portfolio incurring substantial losses. This correlation risk may be greater in the case of derivatives based on an index or other basket of securities, as the portfolio securities being hedged may not duplicate the components of the underlying index or the basket may not be of exactly the same type of obligation as those underlying the derivative. The use of derivatives for "cross hedging" purposes (using a derivative based on one instrument as a hedge for a different instrument) may also involve greater correlation risks.
• While using derivatives for hedging purposes can reduce the Portfolio's risk of loss, it may also limit the Portfolio's opportunity for gains or result in losses by offsetting or limiting the Portfolio's ability to participate in favorable price movements in portfolio investments.
• Derivatives transactions for non-hedging purposes involve greater risks and may result in losses which would not be offset by increases in the value of portfolio securities or declines in the cost of securities to be acquired. In the event that the Portfolio enters into a derivatives transaction as an alternative to purchasing or selling the underlying instrument or in order to obtain desired exposure to an index or market, the Portfolio will be exposed to the same risks as are incurred in purchasing or selling the underlying instruments directly as well as additional risks associated with derivatives transactions.
• The use of certain derivatives transactions involves the risk of loss resulting from the insolvency or bankruptcy of the counterparty to the contract or the failure by the counterparty to make required payments or otherwise comply with the terms of the contract. In the event of default by a counterparty, the Portfolio may have contractual remedies pursuant to the agreements related to the transaction.
• Liquidity risk exists when a particular derivative is difficult to purchase or sell. If a derivative transaction is particularly large or if the relevant market is illiquid, the Portfolio may be unable to initiate a transaction or liquidate a position at an advantageous time or price.
• Certain derivatives transactions are not entered into or traded on exchanges or in markets regulated by the U.S. Commodity Futures Trading Commission ("CFTC") or the SEC. Instead, such bi-lateral over-the-counter ("OTC") derivatives are entered into directly by a Portfolio and a counterparty and may be traded only through financial institutions acting as market makers. OTC derivatives transactions can only be entered into with a willing counterparty that is approved by the Adviser and/or Sub-Advisers in accordance with guidelines established by the Board. Where no such counterparty is available, the Portfolio will be unable to enter into a desired OTC transaction. There also may be greater risk that no liquid secondary market in the trading of OTC derivatives will exist, in which case the Portfolio may be required to hold such instruments until exercise, expiration or maturity. Many of the protections afforded to exchange participants are not available to participants in bi-lateral OTC derivatives transactions. Bi-lateral OTC derivatives transactions are not subject to the guarantee of an exchange or clearinghouse and, as a result, the Portfolio would bear greater risk of default by the counterparties to such transactions.
• The Portfolio may be required to make physical delivery of portfolio securities underlying a derivative in order to close out a derivatives position or to sell portfolio securities at a time or price at which it may be disadvantageous to do so in order to obtain cash to close out or to maintain a derivatives position.
• As a result of the structure of certain derivatives, adverse changes in the value of the underlying instrument can result in losses substantially greater than the amount invested in the derivative itself. Certain derivatives have the potential for unlimited loss, regardless of the size of the initial investment.
• Certain derivatives may be considered illiquid and therefore subject to the Portfolio's limitation on investments in illiquid securities.
• Derivatives transactions conducted outside the United States may not be conducted in the same manner as those entered into on U.S. exchanges, and may be subject to different margin, exercise, settlement or expiration procedures. Brokerage commissions, clearing costs and other transaction costs may be higher on foreign exchanges. Many of the risks of OTC derivatives transactions are also applicable to derivatives transactions conducted outside the United States. Derivatives transactions conducted outside the United States are subject to the risk of governmental action
6
affecting the trading in, or the prices of, foreign securities, currencies and other instruments. The value of such positions could be adversely affected by foreign political and economic factors; lesser availability of data on which to make trading decisions; delays on the Portfolio's ability to act upon economic events occurring in foreign markets; and less liquidity than U.S. markets.
• Currency derivatives are subject to additional risks. Currency derivatives transactions may be negatively affected by government exchange controls, blockages and manipulations. Currency exchange rates may be influenced by factors extrinsic to a country's economy. There is no systematic reporting of last sale information with respect to foreign currencies. As a result, the available information on which trading in currency derivatives will be based may not be as complete as comparable data for other transactions. Events could occur in the foreign currency market which will not be reflected in currency derivatives until the following day, making it more difficult for the Portfolio to respond to such events in a timely manner.
Options
An option is a contract that gives the holder of the option the right, but not the obligation, to buy from (in the case of a call option) or sell to (in the case of a put option) the seller of the option (the "option writer") the underlying security at a specified fixed price (the "exercise price") on or prior to a specified date for American options or only at expiration for European options (the "expiration date"). The buyer of the option pays to the option writer the option premium, which is the purchase price of the option.
Exchange-traded options are issued by a regulated intermediary such as the Options Clearing Corporation ("OCC"), which guarantees the performance of the obligations of the parties to such options. OTC options are purchased from or sold to counterparties through direct bilateral agreements between a Portfolio and its counterparties. Certain options, such as options on individual securities, may be settled through physical delivery of the underlying security, whereas other options, such as index options, are settled in cash in an amount based on the value of the underlying instrument multiplied by a specified multiplier.
Writing Options. Certain Portfolios may write call and put options. As the writer of a call option, the Portfolio receives the premium from the purchaser of the option and has the obligation, upon exercise of the option, to deliver the underlying security upon payment of the exercise price. If the option expires without being exercised the Portfolio is not required to deliver the underlying security but retains the premium received.
The Portfolios may only write call options that are "covered." A call option on a security is covered if (a) the Portfolio owns the security underlying the call or has an absolute and immediate right to acquire that security without additional cash consideration (or, if additional cash consideration is required, such amount is maintained by the Portfolio in segregated or earmarked cash or liquid assets) upon conversion or exchange of other securities held by the Portfolio; or (b) the Portfolio has purchased a call on the underlying security, the exercise price of which is (i) equal to or less than the exercise price of the call written, or (ii) greater than the exercise price of the call written, provided the difference is maintained by the Portfolio in segregated or earmarked cash or liquid assets.
Selling call options involves the risk that the Portfolio may be required to sell the underlying security at a disadvantageous price, below the market price of such security, at the time the option is exercised. As the writer of a covered call option, the Portfolio forgoes, during the option's life, the opportunity to profit from increases in the market value of the underlying security covering the option above the sum of the premium and the exercise price but retains the risk of loss should the price of the underlying security decline.
Certain Portfolios may write put options. As the writer of a put option, the Portfolio receives the premium from the purchaser of the option and has the obligation, upon exercise of the option, to pay the exercise price and receive delivery of the underlying security. If the option expires without being exercised, the Portfolio is not required to receive the underlying security in exchange for the exercise price but retains the option premium.
The Portfolios may only write put options that are "covered." A put option on a security is covered if (a) the Portfolio segregates or earmarks cash or liquid assets equal to the exercise price; or (b) the Portfolio has purchased a put on the same security as the put written, the exercise price of which is
7
(i) equal to or greater than the exercise price of the put written, or (ii) less than the exercise price of the put written, provided the difference is maintained by the Portfolio in segregated or earmarked cash or liquid assets.
Selling put options involves the risk that the Portfolio may be required to buy the underlying security at a disadvantageous price, above the market price of such security, at the time the option is exercised. While the Portfolio's potential gain in writing a covered put option is limited to the premium received plus the interest earned on the liquid assets covering the put option, the Portfolio's risk of loss is equal to the entire value of the underlying security, offset only by the amount of the premium received.
The Portfolios may close out an options position which it has written through a closing purchase transaction. The Portfolio could execute a closing purchase transaction with respect to a written call option by purchasing a call option on the same underlying security and having the same exercise price and expiration date as the call option written by the Portfolio. The Portfolio could execute a closing purchase transaction with respect to a put option written by purchasing a put option on the same underlying security and having the same exercise price and expiration date as the put option written by the Portfolio. A closing purchase transaction may or may not result in a profit to a Portfolio. The Portfolio can close out its position as an option writer only if a liquid market exists for options on the same underlying security and having the same exercise date as the option written by the Portfolio. There is no assurance that such a market will exist with respect to any particular option.
The writer of an American option generally has no control over the time when the option is exercised and the option writer is required to deliver or acquire the underlying security. Once an option writer has received an exercise notice, it cannot effect a closing purchase transaction in order to terminate its obligation under the option. Thus, the use of options may require the Portfolio to buy or sell portfolio securities at inopportune times or for prices other than the current market values of such securities, may limit the amount of appreciation the Portfolio can realize on an investment, or may cause the Portfolio to hold a security that it might otherwise sell.
Purchasing Options. Certain Portfolios may purchase call and put options. As the buyer of a call option, the Portfolio pays the premium to the option writer and has the right to purchase the underlying security from the option writer at the exercise price. If the market price of the underlying security rises above the exercise price, the Portfolio could exercise the option and acquire the underlying security at a below-market price, which could result in a gain to the Portfolio, minus the premium paid. As the buyer of a put option, the Portfolio pays the premium to the option writer and has the right to sell the underlying security to the option writer at the exercise price. If the market price of the underlying security declines below the exercise price, the Portfolio could exercise the option and sell the underlying security at an above-market price, which could result in a gain to the Portfolio, minus the premium paid. The Portfolio may buy call and put options whether or not it holds the underlying securities.
As a buyer of a call or put option, the Portfolio may sell put or call options that it has purchased at any time prior to such option's expiration date through a closing sale transaction. The principal factors affecting the market value of a put or a call option include supply and demand, interest rates, the current market price of the underlying security in relation to the exercise price of the option, the volatility of the underlying security, the underlying security's dividend policy, and the time remaining until the expiration date. A closing sale transaction may or may not result in a profit to the Portfolio. The Portfolio's ability to initiate a closing sale transaction is dependent upon the liquidity of the options market and there is no assurance that such a market will exist with respect to any particular option. If the Portfolio does not exercise or sell an option prior to its expiration date, the option expires and becomes worthless.
OTC Options. Unlike exchange-traded options, which are standardized with respect to the underlying instrument, expiration date, contract size and strike price, the terms of OTC options generally are established through negotiation between the parties to the options contract. This type of arrangement allows the purchaser and writer greater flexibility to tailor the option to their needs. OTC options are available for a greater variety of securities or other assets, and in a wider range of expiration dates and exercise prices, than exchange-traded options. However, unlike exchange-traded options, which are issued and guaranteed by a regulated intermediary, such as the OCC, OTC options are entered into directly with the counterparty. Unless the counterparties provide for it, there is no central clearing or guaranty function for an OTC option. Therefore, OTC options are subject to the risk of default or non-performance by the counterparty. Accordingly, the Adviser and/or Sub-Advisers must assess the
8
creditworthiness of the counterparty to determine the likelihood that the terms of the option will be satisfied. There can be no assurance that a continuous liquid secondary market will exist for any particular OTC option at any specific time. As a result, the Portfolio may be unable to enter into closing sale transactions with respect to OTC options.
Index Options. Call and put options on indices operate similarly to options on securities. Rather than the right to buy or sell a single security at a specified price, options on an index give the holder the right to receive, upon exercise of the option, an amount of cash determined by reference to the value of the underlying index. The underlying index may be a broad-based index or a narrower market index. Unlike many options on securities, all settlements are in cash. The settlement amount, which the writer of an index option must pay to the holder of the option upon exercise, is generally equal to the difference between the fixed exercise price of the option and the value of the underlying index, multiplied by a specified multiplier. The multiplier determines the size of the investment position the option represents. Gain or loss to the Portfolio on index options transactions will depend, in part, on price movements of the underlying index generally or in a particular segment of the index, in part, rather than price movements of individual components of the index. As with other options, the Portfolio may close out its position in index options through closing purchase transactions and closing sale transactions provided that a liquid secondary market exists for such options.
Index options written by a Portfolio will generally be covered in a manner similar to the covering of other types of options, by holding an offsetting financial position and/or segregating or earmarking cash or liquid assets. The Portfolio may cover call options written on an index by owning securities or other assets whose price changes, in the opinion of the Adviser and/or Sub-Advisers, are expected to correlate to those of the underlying index.
Foreign Currency Options. Options on foreign currencies operate similarly to options on securities. Rather than the right to buy or sell a single security at a specified price, options on foreign currencies give the holder the right to buy or sell foreign currency for a fixed amount in U.S. dollars or other base currencies. Options on foreign currencies are traded primarily in the OTC market, but may also be traded on U.S. and foreign exchanges. The value of a foreign currency option is dependent upon the value of the underlying foreign currency relative to the U.S. dollar or other base currency. The price of the option may vary with changes in, among other things, the value of either or both currencies and has no relationship to the investment merits of a foreign security. Options on foreign currencies are affected by all of those factors which influence foreign exchange rates and foreign investment generally. As with other options, the Portfolio may close out its position in foreign currency options through closing purchase transactions and closing sale transactions provided that a liquid market exists for such options.
Foreign currency options written by a Portfolio will generally be covered in a manner similar to the covering of other types of options, by holding an offsetting financial position and/or segregating or earmarking cash or liquid assets.
Additional Risks of Options Transactions. The risks associated with options transactions are different from, and possibly greater than, the risks associated with investing directly in the underlying instruments. Options are highly specialized instruments that require investment techniques and risk analyses different from those associated with other portfolio investments. The use of options requires an understanding not only of the underlying instrument but also of the option itself. Options may be subject to the risk factors generally applicable to derivatives transactions described herein, and may also be subject to certain additional risk factors, including:
• The exercise of options written or purchased by a Portfolio could cause the Portfolio to sell portfolio securities, thus increasing the Portfolio's portfolio turnover.
• A Portfolio pays brokerage commissions each time it writes or purchases an option or buys or sells an underlying security in connection with the exercise of an option. Such brokerage commissions could be higher relative to the commissions for direct purchases of sales of the underlying securities.
• The Portfolio's options transactions may be limited by limitations on options positions established by the SEC, the CFTC or the exchanges on which such options are traded.
• The hours of trading for exchange listed options may not coincide with the hours during which the underlying securities are traded. To the extent that the options markets close before the
9
markets for the underlying securities, significant price and rate movements can take place in the underlying securities that cannot be reflected in the options markets.
• Index options based upon a narrow index of securities or other assets may present greater risks than options based on broad market indices, as narrower indices are more susceptible to rapid and extreme fluctuations as a result of changes in the values of a smaller number of securities or other assets.
• The Portfolio is subject to the risk of market movements between the time that an option is exercised and the time of performance thereunder, which could increase the extent of any losses suffered by the Portfolio in connection with options transactions.
Futures Contracts
A futures contract is a standardized, exchange-traded agreement to buy or sell a specific quantity of a commodity at a specific price at a specific future time (the "settlement date"). Futures contracts may be based on, among other things, a specified equity security (securities futures), a specified debt security or reference rate (interest rate futures), the value of a specified securities index (index futures) or the value of a foreign currency (currency futures). The value of a futures contract tends to increase and decrease in tandem with the value of the underlying instrument. The buyer of a futures contract agrees to purchase the underlying instrument on the settlement date and is said to be "long" the contract. The seller of a futures contract agrees to sell the underlying instrument on the settlement date and is said to be "short" the contract. Futures contracts call for settlement only on the expiration date and cannot be "exercised" at any other time during their term.
Depending on the terms of the particular contract, futures contracts are settled through either physical delivery of the underlying instrument on the settlement date (such as in the case of securities futures based on a specified debt security) or by payment of a cash settlement amount on the settlement date (such as in the case of futures contracts relating to interest rates, foreign currencies and broad-based securities indices). In the case of cash settled futures contracts, the settlement amount is equal to the difference between the reference instrument's price on the last trading day of the contract and the reference instrument's price at the time the contract was entered into. Most futures contracts, particularly futures contracts requiring physical delivery, are not held until the settlement date, but instead are offset before the settlement date through the establishment of an opposite and equal futures position (buying a contract that had been sold, or selling a contract that had been purchased). All futures transactions are effected through a clearinghouse associated with the exchange on which the futures are traded.
The buyer and seller of a futures contract are not required to deliver or pay for the underlying commodity unless the contract is held until the settlement date. However, both the buyer and seller are required to deposit "initial margin" with a futures commission merchant when the futures contract is entered into. Initial margin deposits are typically calculated as a percentage of the contract's market value. If the value of either party's position declines, the party will be required to make additional "variation margin" payments to settle the change in value on a daily basis. The process is known as "marking-to-market." Upon the closing of a futures position through the establishment of an offsetting position, a final determination of variation margin will be made and additional cash will be paid by or released to the Portfolio.
In addition, the Portfolio may be required to maintain segregated cash or liquid assets in order to cover futures transactions. The Portfolio will segregate or earmark cash or liquid assets in an amount equal to the difference between the market value of a futures contract entered into by the Portfolio and the aggregate value of the initial and variation margin payments made by the Portfolio with respect to such contract or as otherwise permitted by SEC rules or SEC staff positions. See "Regulatory Matters" below.
Forwards. A foreign currency forward exchange contract is a negotiated agreement between two parties to exchange specified amounts of two or more currencies at a specified future time at a specified rate. The rate specified by the foreign currency forward exchange contract can be higher or lower than the spot rate between the currencies that are the subject of the contract. Currency futures are similar to foreign currency forward exchange contracts, except that they are traded on an exchange and standardized as to contract size and delivery date. Most currency futures call for payment or delivery in U.S. dollars. Unanticipated changes in currency prices may result in losses to the Portfolio and poorer overall performance for the Portfolio than if it had not entered into foreign currency forward exchange contracts. Certain Portfolios may enter into foreign currency forward exchange or futures contracts under various circumstances. The typical use of a foreign currency forward exchange contract is to "lock in" the price of a
10
security in U.S. dollars or some other foreign currency, which the Portfolio is holding in its portfolio. By entering into a foreign currency forward exchange contract for the purchase or sale, for a fixed amount of dollars or other currency, of the amount of foreign currency involved in the underlying security transactions, the Portfolio may be able to protect itself against a possible loss resulting from an adverse change in the relationship between the U.S. dollar or other currency which is being used for the security purchase and the foreign currency in which the security is denominated during the period between the date on which the security is purchased or sold and the date on which payment is made or received. The Adviser and/or Sub-Advisers also may from time to time utilize foreign currency forward exchange contracts for other purposes. For example, they may be used to hedge a foreign security held in the portfolio against a decline in value of the applicable foreign currency. They also may be used to lock in the current exchange rate of the currency in which those securities anticipated to be purchased are denominated. At times, the Portfolio may enter into "cross-currency" hedging transactions involving currencies other than those in which securities are held or proposed to be purchased are denominated.
A Portfolio will not enter into foreign currency forward exchange contracts or maintain a net exposure to these contracts where the consummation of the contracts would obligate the Portfolio to deliver an amount of foreign currency in excess of the value of the Portfolio's portfolio securities.
When required by law, a Portfolio will segregate or earmark cash, U.S. government securities or other appropriate liquid portfolio securities in an amount equal to the value of the Portfolio's total assets committed to the consummation of foreign currency forward exchange contracts entered into under the circumstances set forth above. If the value of the securities so earmarked declines, additional cash or securities will be segregated or earmarked on a daily basis so that the value of such securities will equal the amount of the Portfolio's commitments with respect to such contracts.
The Portfolio may be limited in its ability to enter into hedging transactions involving foreign currency forward exchange contracts by the Internal Revenue Code of 1986, as amended (the "Code"), requirements relating to qualification as a regulated investment company.
Foreign currency forward exchange contracts may limit gains on portfolio securities that could otherwise be realized had they not been utilized and could result in losses. The contracts also may increase the Portfolio's volatility and may involve a significant amount of risk relative to the investment of cash.
Options on Futures Contracts. Options on futures contracts are similar to options on securities except that options on futures contracts give the purchasers the right, in return for the premium paid, to assume a position in a futures contract (a long position in the case of a call option and a short position in the case of a put option) at a specified exercise price at any time prior to the expiration of the option. Upon exercise of the option, the parties will be subject to all of the risks associated with futures transactions and subject to margin requirements. As the writer of options on futures contracts, a Portfolio would also be subject to initial and variation margin requirements on the option position.
Options on futures contracts written by the Portfolio will generally be covered in a manner similar to the covering of other types of options, by holding an offsetting financial position and/or segregating or earmarking cash or liquid assets. The Portfolio may cover an option on a futures contract by purchasing or selling the underlying futures contract. In such instances the exercise of the option will serve to close out the Portfolio's futures position.
Additional Risks of Futures Transactions. The risks associated with futures contract transactions are different from, and possibly greater than, the risks associated with investing directly in the underlying instruments. Futures are highly specialized instruments that require investment techniques and risk analyses different from those associated with other portfolio investments. The use of futures requires an understanding not only of the underlying instrument but also of the futures contract itself. Futures may be subject to the risk factors generally applicable to derivatives transactions described herein, and may also be subject to certain additional risk factors, including:
• The risk of loss in buying and selling futures contracts can be substantial. Small price movements in the commodity underlying a futures position may result in immediate and substantial loss (or gain) to a Portfolio.
• Buying and selling futures contracts may result in losses in excess of the amount invested in the position in the form of initial margin. In the event of adverse price movements in the underlying commodity, security, index, currency or instrument, the Portfolio would be required to make daily
11
cash payments to maintain its required margin. The Portfolio may be required to sell portfolio securities, or make or take delivery of the underlying securities in order to meet daily margin requirements at a time when it may be disadvantageous to do so. The Portfolio could lose margin payments deposited with a futures commission merchant if the futures commission merchant breaches its agreement with the Portfolio, becomes insolvent or declares bankruptcy.
• Most exchanges limit the amount of fluctuation permitted in futures contract prices during any single trading day. Once the daily limit has been reached in a particular futures contract, no trades may be made on that day at prices beyond that limit. If futures contract prices were to move to the daily limit for several trading days with little or no trading, the Portfolio could be prevented from prompt liquidation of a futures position and subject to substantial losses. The daily limit governs only price movements during a single trading day and therefore does not limit the Portfolio's potential losses.
• Index futures based upon a narrower index of securities may present greater risks than futures based on broad market indices, as narrower indices are more susceptible to rapid and extreme fluctuations as a result of changes in value of a small number of securities.
Swap Contracts and Related Derivative Instruments
An OTC swap contract is an agreement between two parties pursuant to which the parties exchange payments at specified dates on the basis of a specified notional amount, with the payments calculated by reference to specified securities, indices, reference rates, currencies or other instruments. Most swap agreements provide that when the period payment dates for both parties are the same, the payments are made on a net basis (i.e., the two payment streams are netted out, with only the net amount paid by one party to the other). A Portfolio's obligations or rights under a swap contract entered into on a net basis will generally be equal only to the net amount to be paid or received under the agreement, based on the relative values of the positions held by each counterparty. Most swap agreements are generally not entered into or traded on exchanges and there is no central clearing or guaranty function for swaps. These OTC swaps are often subject to the risk of default or non-performance by the counterparty. Accordingly, the Adviser and/or Sub-Advisers must assess the creditworthiness of the counterparty to determine the likelihood that the terms of the swap will be satisfied.
Swap agreements allow for a wide variety of transactions. For example, fixed rate payments may be exchanged for floating rate payments, U.S. dollar denominated payments may be exchanged for payments denominated in foreign currencies, and payments tied to the price of one security, index, reference rate, currency or other instrument may be exchanged for payments tied to the price of a different security, index, reference rate, currency or other instrument. Swap contracts are typically individually negotiated and structured to provide exposure to a variety of particular types of investments or market factors. Swap contracts can take many different forms and are known by a variety of names. To the extent consistent with a Portfolio's investment objectives and policies, the Portfolio is not limited to any particular form or variety of swap contract. The Portfolio may utilize swaps to increase or decrease its exposure to the underlying instrument, reference rate, foreign currency, market index or other asset. The Portfolio may also enter into related derivative instruments including caps, floors and collars.
A Portfolio may be required to cover swap transactions. Obligations under swap agreements entered into on a net basis are generally accrued daily and any accrued but unpaid amounts owed by the Portfolio to the swap counterparty will be covered by segregating or earmarking cash or liquid assets. If the Portfolio enters into a swap agreement on other than a net basis, the Portfolio will segregate or earmark cash or liquid assets with a value equal to the full amount of the Portfolio's accrued obligations under the agreement.
The Dodd-Frank Wall Street Reform and Consumer Protection Act (the "Dodd-Frank Act") and related regulatory developments will require the clearing and exchange-trading of many OTC swap agreements. Mandatory exchange-trading and clearing will occur on a phased-in basis.
Interest Rate Swaps, Caps, Floors and Collars. Interest rate swaps consist of an agreement between two parties to exchange their respective commitments to pay or receive interest (e.g., an exchange of floating rate payments for fixed rate payments). Interest rate swaps are generally entered into on a net basis. Interest rate swaps do not involve the delivery of securities, other underlying assets, or principal. Accordingly, the risk of loss with respect to interest rate and total rate of return swaps is typically limited to the net amount of interest payments that a Portfolio is contractually obligated to make.
12
Certain Portfolios may also buy or sell interest rate caps, floors and collars. The purchase of an interest rate cap entitles the purchaser, to the extent that a specified interest rate exceeds a predetermined level, to receive payments of interest on a specified notional amount from the party selling the interest rate cap. The purchase of an interest rate floor entitles the purchaser, to the extent that a specified interest rate falls below a predetermined level, to receive payments of interest on a specified notional amount from the party selling the interest rate floor. A collar is a combination of a cap and a floor that preserves a certain return within a predetermined range of interest rates. Caps, floors and collars may be less liquid than other types of derivatives. If a Portfolio sells caps, floors and collars, it will segregate liquid assets with a value equal to the full amount, accrued daily, of the Portfolio's net obligations with respect to the caps, floors or collars.
Index Swaps. An index swap consists of an agreement between two parties in which a party exchanges a cash flow based on a notional amount of a reference index for a cash flow based on a different index or on another specified instrument or reference rate. Index swaps are generally entered into on a net basis.
Inflation Swaps. Inflation swap agreements are contracts in which one party agrees to pay the cumulative percentage increase in a price index, such as the Consumer Price Index, over the term of the swap (with some lag on the referenced inflation index), and the other party pays a compounded fixed rate. Inflation swap agreements may be used to protect the net asset value of a Portfolio against an unexpected change in the rate of inflation measured by an inflation index. The value of inflation swap agreements is expected to change in response to changes in real interest rates. Real interest rates are tied to the relationship between nominal interest rates and the rate of inflation.
Currency Swaps. A currency swap consists of an agreement between two parties to exchange cash flows on a notional amount of two or more currencies based on the relative value differential among them, such as exchanging a right to receive a payment in a foreign currency for the right to receive U.S. dollars. Currency swap agreements may be entered into on a net basis or may involve the delivery of the entire principal value of one designated currency in exchange for the entire principal value of another designated currency. In such cases, the entire principal value of a currency swap is subject to the risk that the counterparty will default on its contractual delivery obligations.
Credit Default Swaps. A credit default swap consists of an agreement between two parties in which the "buyer" agrees to pay to the "seller" a periodic stream of payments over the term of the contract and the seller agrees to pay the buyer the par (or other agreed-upon) value of that referenced debt obligation upon the occurrence of a credit event with respect to the issuer of that referenced debt obligation. Generally, a credit event means a bankruptcy, failure to pay or a restructuring. A Portfolio may be either the buyer or seller in a credit default swap. As the buyer in a credit default swap, the Portfolio would pay to the counterparty the periodic stream of payments. If no default occurs, the Portfolio would receive no benefit from the contract. As the seller in a credit default swap, the Portfolio would receive the stream of payments but would be subject to exposure on the notional amount of the swap, which it would be required to pay in the event of default. The Portfolio will generally earmark or segregate cash or liquid assets to cover any potential obligation under a credit default swap sold by the Portfolio. The use of credit default swaps could result in losses to the Portfolio if the Adviser and/or Sub-Advisers fail to correctly evaluate the creditworthiness of the issuer of the referenced debt obligation.
Swaptions. An option on a swap agreement, also called a "swaption," is an option that gives the buyer the right, but not the obligation, to enter into a swap on a future date in exchange for paying a market based "premium." A receiver swaption gives the owner the right to receive the total return of a specified asset, reference rate, or index. A payer swaption gives the owner the right to pay the total return of a specified asset, reference rate, or index. Swaptions also include options that allow an existing swap to be terminated or extended by one of the counterparties.
General Risks of Swaps. The risks associated with swap transactions are different from, and possibly greater than, the risks associated with investing directly in the underlying instruments. Swaps are highly specialized instruments that require investment techniques and risk analyses different from those associated with other portfolio investments. The use of swaps requires an understanding not only of the underlying instrument but also of the swap contract itself. Swap transactions may be subject to the risk
13
factors generally applicable to derivatives transactions described above, and may also be subject to certain additional risk factors, including:
• OTC swap agreements are not traded on exchanges and may be subject to liquidity risks, which exist when a particular swap is difficult to purchase or sell.
• In addition to the risk of default by the counterparty, if the creditworthiness of a counterparty to a swap agreement declines, the value of the swap agreement would be likely to decline, potentially resulting in losses.
• The swaps market is subject to extensive regulation under the Dodd-Frank Act and certain CFTC and SEC rules promulgated thereunder. It is possible that further developments in the swaps market, including new and additional governmental regulation, could result in higher Portfolio costs and expenses and could adversely affect the Portfolio's ability to utilize swaps, terminate existing swap agreements or realize amounts to be received under such agreements.
Structured Investments
Certain Portfolios also may invest a portion of its assets in structured investments. A structured investment is a derivative security designed to offer a return linked to a particular underlying security, currency, commodity or market, for which the amount of principal repayment and/or interest payments is based on the change in value of such underlying security, currency, commodity or market, including, among others, currency exchange rates, interest rates (such as the prime lending rate or LIBOR), referenced bonds and stock indices or other financial references. Structured investments may come in various forms, including notes, warrants and options to purchase securities and may be listed and traded on an exchange or otherwise traded in the OTC market.
A Portfolio will typically use structured investments to gain exposure to a permitted underlying security, currency, commodity or market when direct access to such security, currency, commodity or market is limited or inefficient from a tax, cost or regulatory standpoint. Investments in structured investments involve risks including counterparty risk and market risk. Holders of structured investments bear risks of the underlying investment and are subject to counterparty risk because the Portfolio is relying on the creditworthiness of such counterparty and has no rights with respect to the issuer of the underlying investment. Certain structured investments may be thinly traded or have a limited trading market and may have the effect of increasing the Portfolio's illiquidity to the extent that the Portfolio, at a particular point in time, may be unable to find qualified buyers for these investments.
A structured investment may be linked either positively or negatively to an underlying security, currency, commodity, index or market and a change in interest rates, principal amount, volatility, currency values or other factors, depending on the structured investment's design, may result in a gain or loss that is a multiple of the movement of such interest rates, principal amount, volatility, currency values or other factors. Application of a multiplier is comparable to the use of financial leverage, a speculative technique. Leverage magnifies the potential for gain and the risk of loss. As a result, a relatively small decline in the value of the referenced factor could result in a relatively large loss in the value of a structured investment.
Other types of structured investments include interests in entities organized and operated for the purpose of restructuring the investment characteristics of underlying investment interests or securities. This type of securitization or restructuring usually involves the deposit or purchase of an underlying security by a U.S. or foreign entity, such as a corporation or trust of specified instruments, and the issuance by that entity of one or more classes of securities backed by, or representing an interest in, the underlying instruments.
The cash flow or rate of return on the underlying investments may be apportioned among the newly issued securities to create different investment characteristics, such as varying maturities, credit quality, payment priorities and interest rate provisions. Structured investments which are subordinated, for example, in payment priority often offer higher returns, but may result in increased risks compared to other investments.
Combined Transactions
Combined transactions involve entering into multiple derivatives transactions (such as multiple options transactions, including purchasing and writing options in combination with each other; multiple futures
14
transactions; and combinations of options, futures, forward and swap transactions) instead of a single derivatives transaction in order to customize the risk and return characteristics of the overall position. Combined transactions typically contain elements of risk that are present in each of the component transactions. Certain Portfolios may enter into a combined transaction instead of a single derivatives transaction when, in the opinion of the Adviser and/or Sub-Advisers, it is in the best interest of the Portfolio to do so. Because combined transactions involve multiple transactions, they may result in higher transaction costs and may be more difficult to close out.
Regulatory Matters
As described herein, a Portfolio may be required to cover its potential economic exposure to certain derivatives transactions by holding an offsetting financial position and/or segregating or earmarking cash or liquid assets equal in value to the Portfolio's potential economic exposure under the transaction. The Portfolio will cover such transactions as described herein or in such other manner in accordance with applicable laws and regulations. Assets used to cover derivatives transactions cannot be sold while the derivatives position is open, unless they are replaced by other appropriate assets. Segregated or earmarked cash or liquid assets and assets held in margin accounts are not otherwise available to the Portfolio for investment purposes. If a large portion of the Portfolio's assets are used to cover derivatives transactions or are otherwise segregated or earmarked, it could affect portfolio management or the Portfolio's ability to meet redemption requests or other current obligations. With respect to derivatives which are cash-settled (i.e., have no physical delivery requirement), the Portfolio is permitted to earmark cash or set aside liquid assets in an amount equal to the Portfolio's daily marked-to-market net obligations (i.e., the Portfolio's daily net liability) under the derivative, if any, rather than the derivative's full notional value or the market value of the instrument underlying the derivative, as applicable. By earmarking cash or setting aside assets equal to only its net obligations under cash-settled derivatives, the Portfolio will have the ability to employ leverage to a greater extent than if the Portfolio were required to earmark cash or segregate assets equal to the full notional amount of the derivative or the market value of the underlying instrument, as applicable.
Regulatory developments affecting the exchange-traded and OTC derivatives markets may impair the Portfolios' ability to manage or hedge their investment portfolio through the use of derivatives. The Dodd-Frank Act and the rules promulgated thereunder may limit the ability of the Portfolios to enter into one or more exchange-traded or OTC derivatives transactions.
The Portfolios' use of derivatives may also be limited by the requirements of the Code for qualification as a regulated investment company for U.S. federal income tax purposes.
The Fund has filed with the National Futures Association ("NFA"), a notice claiming an exclusion from the definition of the term "commodity pool operator" ("CPO") under the Commodity Exchange Act, as amended ("CEA") and the rules of the CFTC promulgated thereunder, with respect to the Portfolios' operations. Therefore, neither the Fund nor the Adviser (with respect to the Fund) is subject to registration or regulation as a commodity pool or CPO under the CEA. If the Fund becomes subject to these requirements, as well as related NFA rules, the Fund may incur additional compliance and other expenses.
Mortgage-Backed Securities ("MBS"). Certain Portfolios may invest in mortgage pass-through securities. These securities represent a participation interest in a pool of residential mortgage loans originated by U.S. governmental or private lenders such as banks. They differ from conventional debt securities, which provide for periodic payment of interest in fixed amounts and principal payments at maturity or on specified call dates. Mortgage pass-through securities provide for monthly payments that are a "pass-through" of the monthly interest and principal payments made by the individual borrowers on the pooled mortgage loans. Mortgage pass-through securities may be collateralized by mortgages with fixed rates of interest or adjustable rates. The Portfolios may invest in mortgage pass-through securities that are issued or guaranteed by the U.S. Government. These securities are either direct obligations of the U.S. Government or the issuing agency or instrumentality has the right to borrow from the U.S. Treasury to meet its obligations although the U.S. Treasury is not legally required to extend credit to the agency or instrumentality. Certain of the U.S. government securities purchased by the Portfolios, such as those issued by the Federal National Mortgage Association ("Fannie Mae") and Federal Home Loan Mortgage Corporation ("Freddie Mac"), are not backed by the full faith and credit of the United States and there is a risk that the U.S. Government will not provide financial support to these agencies if it is not obligated to do so by law. In September 2008, the U.S. Treasury Department announced that the U.S. Government
15
would be taking over Freddie Mac and Fannie Mae and placing the companies into a conservatorship. In addition, the U.S. Treasury announced additional steps that it intended to take with respect to the debt and mortgage-backed securities issued by Fannie Mae and Freddie Mac in order to support the conservatorship. No assurance can be given that these initiatives will be successful. The maximum potential liability of the issuers of some U.S. government securities held by the Portfolios may greatly exceed their current resources, including their legal right to support from the U.S. Treasury. It is possible that these issuers will not have the funds to meet their payment obligations in the future.
To the extent the Portfolios invest in mortgage pass-through securities offered by non-governmental issuers, such as commercial banks, savings and loan institutions, private mortgage insurance companies, mortgage bankers and other secondary market issuers, the Portfolios may be subject to additional risks. Timely payment of interest and principal of non-governmental issuers are supported by various forms of private insurance or guarantees, including individual loan, title, pool and hazard insurance purchased by the issuer. There can be no assurance that the private insurers can meet their obligations under the policies. An unexpectedly high rate of defaults on the mortgages held by a mortgage pool may adversely affect the value of a MBS and could result in losses to the Portfolios. The risk of such defaults is generally higher in the case of mortgage pools that include subprime mortgages. Subprime mortgages refer to loans made to borrowers with weakened credit histories or with a lower capacity to make timely payments on their mortgages.
Collateralized Mortgage Obligations ("CMOs"). Certain Portfolios may invest in collateralized mortgage obligations ("CMOs"), which are mortgage-backed securities that are collateralized by mortgage loans or mortgage pass-through securities, and multi-class pass-through securities, which are equity interests in a trust composed of mortgage loans or other mortgage-backed securities. Unless the context indicates otherwise, the discussion of CMOs below also applies to multi-class pass through securities.
CMOs may be issued by governmental or government-related entities or by private entities, such as banks, savings and loan institutions, private mortgage insurance companies, mortgage bankers and other secondary market traders. CMOs are issued in multiple classes, often referred to as "tranches," with each tranche having a specific fixed or floating coupon rate and stated maturity or final distribution date. Under the traditional CMO structure, the cash flows generated by the mortgages or mortgage pass-through securities in the collateral pool are used to first pay interest and then pay principal to the holders of the CMOs. Subject to the various provisions of individual CMO issues, the cash flow generated by the underlying collateral (to the extent it exceeds the amount required to pay the stated interest) is used to retire the bonds.
The principal and interest on the underlying collateral may be allocated among the several tranches of a CMO in innumerable ways. In a common CMO structure, the tranches are retired sequentially in the order of their respective stated maturities or final distribution dates (as opposed to the pro-rata return of principal found in traditional pass-through obligations). The fastest-pay tranches would initially receive all principal payments. When those tranches are retired, the next tranches in the sequence receive all of the principal payments until they are retired. The sequential retirement of bond groups continues until the last tranche is retired. Accordingly, the CMO structure allows the issuer to use cash flows of long maturity, monthly-pay collateral to formulate securities with short, intermediate, and long final maturities and expected average lives and risk characteristics.
The primary risk of CMOs is the uncertainty of the timing of cash flows that results from the rate of prepayments on the underlying mortgages serving as collateral and from the structure of the particular CMO transaction (that is, the priority of the individual tranches). An increase or decrease in prepayment rates (resulting from a decrease or increase in mortgage interest rates) may cause the CMOs to be retired substantially earlier than their stated maturities or final distribution dates and will affect the yield and price of CMOs. In addition, if the collateral securing CMOs or any third-party guarantees are insufficient to make payments, the Portfolio could sustain a loss. The prices of certain CMOs, depending on their structure and the rate of prepayments, can be volatile. Some CMOs may also not be as liquid as other types of mortgage securities. As a result, it may be difficult or impossible to sell the securities at an advantageous time or price.
Privately issued CMOs are arrangements in which the underlying mortgages are held by the issuer, which then issues debt collateralized by the underlying mortgage assets. Such securities may be backed by mortgage insurance, letters of credit, or other credit enhancing features. Although payment of the
16
principal of, and interest on, the underlying collateral securing privately issued CMOs may be guaranteed by the U.S. Government or its agencies or instrumentalities, these CMOs represent obligations solely of the private issuer and are not insured or guaranteed by the U.S. Government, its agencies or instrumentalities or any other person or entity. Privately issued CMOs are subject to prepayment risk due to the possibility that prepayments on the underlying assets will alter the cash flow. Yields on privately issued CMOs have been historically higher than the yields on CMOs backed by mortgages guaranteed by U.S. government agencies or instrumentalities. The risk of loss due to default on privately issued CMOs, however, is historically higher since the U.S. Government has not guaranteed them.
New types of CMO tranches have evolved. These include floating rate CMOs, planned amortization classes, accrual bonds and CMO residuals. These newer structures affect the amount and timing of principal and interest received by each tranche from the underlying collateral. For example, an inverse interest-only class CMO entitles holders to receive no payments of principal and to receive interest at a rate that will vary inversely with a specified index or a multiple thereof. Under certain of these newer structures, given classes of CMOs have priority over others with respect to the receipt of prepayments on the mortgages. Therefore, depending on the type of CMOs in which a Portfolio invests, the investment may be subject to a greater or lesser risk of prepayment than other types of mortgage-backed securities.
CMOs may include real estate investment conduits ("REMICs"). REMICs, which were authorized under the Tax Reform Act of 1986, are private entities formed for the purpose of holding a fixed pool of mortgages secured by an interest in real property. A REMIC is a CMO that qualifies for special tax treatment under the Code and invests in certain mortgages principally secured by interests in real property.
The Portfolios may invest in, among others, parallel pay CMOs and Planned Amortization Class CMOs ("PAC Bonds"). Parallel pay CMOs are structured to provide payments of principal on each payment date to more than one tranche. These simultaneous payments are taken into account in calculating the stated maturity date or final distribution date of each tranche which, as with other CMO structures, must be retired by its stated maturity date or final distribution date but may be retired earlier. PAC Bonds are a form of parallel pay CMO, with the required principal payment on such securities having the highest priority after interest has been paid to all classes. PAC Bonds generally require payments of a specified amount of principal on each payment date.
Stripped Mortgage-Backed Securities. Certain Portfolios may invest in stripped mortgage-backed securities ("SMBS"). An SMBS is a derivative multi-class mortgage security. SMBS usually are structured with two classes that receive different proportions of the interest and principal distribution on a pool of mortgage assets. In the most extreme case, one class will receive all of the interest (the interest-only or "IO" class), while the other class will receive all of the principal (the principal-only or "PO" class). The yield to maturity on an IO class is extremely sensitive to the rate of principal payments (including prepayments) on the related underlying mortgage assets, and a rapid rate of principal payments may have a material adverse effect on such security's yield to maturity. If the underlying mortgage assets experience greater than anticipated prepayments of principal, the Portfolio may fail to fully recoup its initial investment in these securities. Conversely, if the underlying mortgage assets experience less than anticipated prepayments of principal, the yield of POs could be materially adversely affected. The market values of IOs and POs are subject to greater risk of fluctuation in response to changes in market rates of interest than many other types of government securities. To the extent the Portfolio invests in IOs and POs, this increases the risk of fluctuations in the net asset value of the Portfolio.
Inverse Floaters. Certain Portfolios may invest in inverse floaters. Inverse floating rate obligations are obligations which pay interest at rates that vary inversely with changes in market rates of interest. Because the interest rate paid to holders of such obligations is generally determined by subtracting a variable or floating rate from a predetermined amount, the interest rate paid to holders of such obligations will decrease as such variable or floating rate increases and increase as such variable or floating rate decreases. Like most other fixed-income securities, the value of inverse floaters will decrease as interest rates increase. They are more volatile, however, than most other fixed-income securities because the coupon rate on an inverse floater typically changes at a multiple of the change in the relevant index rate. Thus, any rise in the index rate (as a consequence of an increase in interest rates) causes a correspondingly greater drop in the coupon rate of an inverse floater, while a drop in the index rate causes a correspondingly greater increase in the coupon of an inverse floater. Some inverse floaters may also increase or decrease substantially because of changes in the rate of prepayments.
17
Asset-Backed Securities. Certain Portfolios may invest in asset-backed securities. Asset-backed securities utilize the securitization techniques used to develop MBS. These techniques are also applied to a broad range of other assets. Various types of assets, primarily automobile and credit card receivables and home equity loans, are being securitized in pass-through structures similar to the mortgage pass-through structures. These types of securities are known as asset-backed securities. The Portfolio may invest in any type of asset-backed security. Asset-backed securities have risk characteristics similar to MBS. Like MBS, they generally decrease in value as a result of interest rate increases, but may benefit less than other fixed-income securities from declining interest rates, principally because of prepayments. Also, as in the case of MBS, prepayments generally increase during a period of declining interest rates although other factors, such as changes in credit use and payment patterns, may also influence prepayment rates. Asset-backed securities also involve the risk that various federal and state consumer laws and other legal, regulatory and economic factors may result in the collateral backing the securities being insufficient to support payment on the securities.
Commercial Mortgage-Backed Securities ("CMBS"). Certain Portfolios may invest in CMBS. CMBS are generally multi-class or pass-through securities issued by special purpose entities that represent an undivided interest in a portfolio of mortgage loans backed by commercial properties, including, but not limited to, industrial and warehouse properties, office buildings, retail space and shopping malls, hotels, healthcare facilities, multifamily properties and cooperative apartments. Private lenders, such as banks or insurance companies, originate these loans and then sell the loans directly into a CMBS trust or other entity. The commercial mortgage loans that underlie CMBS are generally not amortizing or not fully amortizing. That is, at their maturity date, repayment of the remaining principal balance or "balloon" is due and is repaid through the attainment of an additional loan or sale of this property. An extension of the final payment on commercial mortgages will increase the average life of the CMBS, generally resulting in a lower yield for discount bonds and a higher yield for premium bonds.
CMBS are subject to credit risk and prepayment risk. Although prepayment risk is present, it is of a lesser degree in the CMBS than in the residential mortgage market; commercial real estate property loans often contain provisions which substantially reduce the likelihood that such securities will be prepaid (e.g. significant prepayment penalties on loans and, in some cases, prohibition on principal payments for several years following origination).
Money Market Securities. In addition to the short-term fixed-income securities in which the Portfolios may otherwise invest, the Portfolios may invest in various money market securities for cash management purposes or when assuming a temporary defensive position, which among others may include commercial paper, bankers' acceptances, bank obligations, corporate debt securities, certificates of deposit, U.S. government securities, obligations of savings institutions and repurchase agreements. (This section does not apply to the Money Market Portfolio (other than with respect to European certificates of deposit and repurchase agreements), whose money market instruments are described in its Prospectus.) Such securities are limited to:
U.S. Government Securities. Obligations issued or guaranteed as to principal and interest by the United States or its agencies (such as the Export-Import Bank of the United States, Federal Housing Administration and Government National Mortgage Association) or its instrumentalities (such as the Federal Home Loan Bank), including Treasury bills, notes and bonds;
Bank Obligations. Obligations (including certificates of deposit, time deposits and bankers' acceptances) of banks subject to regulation by the U.S. Government and having total assets of $1 billion or more, and instruments secured by such obligations, not including obligations of foreign branches of domestic banks except to the extent below;
Eurodollar Certificates of Deposit. Eurodollar certificates of deposit issued by foreign branches of domestic banks having total assets of $1 billion or more;
Obligations of Savings Institutions. Certificates of deposit of savings banks and savings and loan associations, having total assets of $1 billion or more;
Fully Insured Certificates of Deposit. Certificates of deposit of banks and savings institutions, having total assets of less than $1 billion, if the principal amount of the obligation is federally insured by the Bank Insurance Fund or the Savings Association Insurance Fund (each of which is administered by the FDIC), limited to $250,000 principal amount per certificate (a temporary increase from $100,000, which is due to expire on December 31, 2013), and to 10% or less of each Portfolio's (other than the
18
Money Market Portfolio's) total assets in all such obligations and in all illiquid assets, in the aggregate, and to 5% or less of the Money Market Portfolio's total assets in all such obligations and in all illiquid assets, in the aggregate;
Commercial Paper. Commercial paper rated within the two highest grades by Standard & Poor's Ratings Services, a division of The McGraw-Hill Companies, Inc. ("S&P"), or by Moody's Investors Service, Inc. ("Moody's") or, if not rated, issued by a company having an outstanding debt issue rated at least AA by S&P or Aa by Moody's; and
Repurchase Agreements. The Portfolios may invest in repurchase agreements. For certain Portfolios when cash may be available for only a few days, it may be invested by the Portfolios in repurchase agreements until such time as it may otherwise be invested or used for payments of obligations of the Portfolios. These agreements typically involve the acquisition by the Portfolios of debt securities from a selling financial institution such as a bank, savings and loan association or broker-dealer. The agreement provides that the Portfolio will sell back to the institution, and that the institution will repurchase, the underlying securities serving as collateral, at a specified price and at a fixed time in the future, usually not more than seven days from the date of purchase. The collateral will be marked-to-market daily to determine that the value of the collateral, as specified in the agreement, does not decrease below the purchase price plus accrued interest. If such decrease occurs, additional collateral will be requested and, when received, added to the account to maintain full collateralization. The Portfolios will accrue interest from the institution until the time when the repurchase is to occur. Although this date is deemed by the Portfolios to be the maturity date of a repurchase agreement, the maturities of securities subject to repurchase agreements are not subject to any limits.
While repurchase agreements involve certain risks not associated with direct investments in debt securities, the Portfolios follow procedures approved by the Trustees that are designed to minimize such risks. These procedures include effecting repurchase transactions only with large, well-capitalized and well-established financial institutions whose financial condition will be continually monitored by the Adviser and/or Sub-Advisers. In addition, as described above, the value of the collateral underlying the repurchase agreement will be at least equal to the repurchase price including any accrued interest earned on the repurchase agreement or the daily amortization of the difference between the acquisition price and the resale price specified in the repurchase agreement. In the event of a default or bankruptcy by a selling financial institution, the Portfolios will seek to liquidate such collateral. However, the exercising of the Portfolios' right to liquidate such collateral could involve certain costs or delays and, to the extent that proceeds from any sale upon a default of the obligation to repurchase were less than the repurchase price, the Portfolios could suffer a loss. The Money Market Portfolio may invest in repurchase agreements backed by non-governmental collateral. Such collateral will be, at the time the repurchase agreement is entered into, rated investment grade. A Portfolio will not invest in repurchase agreements that do not mature within seven days if any such investment, together with any other illiquid assets held by that Portfolio, amounts to more than 5% of its net assets in the case of the Money Market Portfolio, and 15% of its net assets in the case of each of the other Portfolios. The Portfolios' investments in repurchase agreements may at times be substantial when, in the view of the Portfolios' Adviser and/or Sub-Advisers, liquidity or other conditions warrant.
Zero Coupon Securities. A portion of the fixed-income securities purchased by the Portfolios may be "zero coupon" securities. Such securities are purchased at a discount from their face amount, giving the purchaser the right to receive their full value at maturity. The interest earned on such securities is, implicitly, automatically compounded and paid out at maturity. While such compounding at a constant rate eliminates the risk of receiving lower yields upon reinvestment of interest if prevailing interest rates decline, the owner of a zero coupon security will be unable to participate in higher yields upon reinvestment of interest received if prevailing interest rates rise.
A zero coupon security pays no interest to its holder during its life. Therefore, to the extent the Portfolios invest in zero coupon securities, they will not receive current cash available for distribution to shareholders. In addition, zero coupon securities are subject to substantially greater market price fluctuations during periods of changing prevailing interest rates than are comparable debt securities which make current distributions of interest. Current federal tax law requires that a holder (such as a Portfolio) of a zero coupon security accrue a portion of the discount at which the security was purchased as income each year even though the Portfolio receives no interest payments in cash on the security during the year.
19
Reverse Repurchase Agreements and Dollar Rolls. Each of the Limited Duration Portfolio, the Income Plus Portfolio and the European Equity Portfolio may use reverse repurchase agreements for purposes of meeting redemptions or as part of its investment strategy. The Limited Duration Portfolio may also use dollar rolls as part of its investment strategy.
Reverse repurchase agreements involve sales by a Portfolio of assets concurrently with an agreement by the Portfolio to repurchase the same assets at a later date at a fixed price. Reverse repurchase agreements involve the risk that the market value of the securities a Portfolio is obligated to purchase under the agreement may decline below the repurchase price. These transactions are only advantageous if the interest cost to the Fund of the reverse repurchase transaction is less than the cost of obtaining the cash otherwise. Opportunities to achieve this advantage may not always be available, and the Portfolios intend to use the reverse repurchase technique only when it will be to its advantage to do so.
The Portfolios will earmark cash or liquid assets or establish a segregated account in which it will maintain cash, U.S. government securities or other appropriate liquidity portfolio securities equal in value to its obligations in respect of reverse repurchase agreements. In the event the buyer of securities under a reverse repurchase agreement files for bankruptcy or becomes insolvent, a Portfolio's use of the proceeds of the agreement may be restricted pending a determination by the other party, or its trustee or receiver, whether to enforce the Portfolio's obligation to repurchase the securities.
Dollar rolls involve a Portfolio selling securities for delivery in the current month and simultaneously contracting to repurchase substantially similar (same type and coupon) securities on a specified future date. During the roll period, a Portfolio will forgo principal and interest paid on the securities. A Portfolio is compensated by the difference between the current sales price and the lower forward price for the future purchase (often referred to as the "drop") as well as by the interest earned on the cash proceeds of the initial sale.
Reverse repurchase agreements and dollar rolls are speculative techniques involving leverage and are considered borrowings by a Portfolio. With respect to each of the Income Plus Portfolio and the European Equity Portfolio, reverse repurchase agreements may not exceed 10% of those Portfolio's total assets.
Real Estate Investment Trusts ("REITs") and Foreign Real Estate Companies. Certain Portfolios may invest in REITs and foreign real estate companies, which are similar to entities organized and operated as REITs in the United States. REITs and foreign real estate companies pool investors' funds for investment primarily in real estate properties or real estate-related loans. REITs and foreign real estate companies generally derive their income from rents on the underlying properties or interest on the underlying loans, and their value is impacted by changes in the value of the underlying property or changes in interest rates affecting the underlying loans owned by the REITs and/or foreign real estate companies. REITs and foreign real estate companies are more susceptible to risks associated with the ownership of real estate and the real estate industry in general. These risks can include fluctuations in the value of underlying properties; defaults by borrowers or tenants; market saturation; changes in general and local economic conditions; decreases in market rates for rents; increases in competition, property taxes, capital expenditures or operating expenses; and other economic, political or regulatory occurrences affecting the real estate industry. In addition, REITs and foreign real estate companies depend upon specialized management skills, may not be diversified (which may increase the volatility of a REIT's and/or a foreign real estate company's value), may have less trading volume and may be subject to more abrupt or erratic price movements than the overall securities market. Foreign real estate companies may be subject to laws, rules and regulations governing those entities and their failure to comply with those laws, rules and regulations could negatively impact the performance of those entities. Operating REITs and foreign real estate companies requires specialized management skills and a Portfolio indirectly bears REIT and foreign real estate company management expenses along with the direct expenses of the Portfolio. REITs are not taxed on income distributed to shareholders provided they comply with several requirements of the Code. REITs are subject to the risk of failing to qualify for tax-free pass-through income under the Code.
Loans of Portfolio Securities. Each Portfolio may lend its portfolio securities to brokers, dealers, banks and other institutional investors. By lending its portfolio securities, the Portfolio attempts to increase its net investment income through the receipt of interest on the cash collateral with respect to the loan or fees received from the borrower in connection with the loan. Any gain or loss in the market price of the securities loaned that might occur during the term of the loan would be for the account of a Portfolio. The
20
Portfolios employ an agent to implement the securities lending program and the agent receives a fee from the Portfolio for its services. No Portfolio will lend more than 331/3% of the value of its total assets.
Each Portfolio may lend its portfolio securities so long as the terms, structure and the aggregate amount of such loans are not inconsistent with the Investment Company Act or the rules and regulations or interpretations of the SEC thereunder, which currently require that (i) the borrower pledge and maintain with the Portfolio collateral consisting of liquid, unencumbered assets having a value at all times not less than 100% of the value of the securities loaned; (ii) the borrower add to such collateral whenever the price of the securities loaned rises (i.e., the borrower "marks-to-market" on a daily basis); (iii) the loan be made subject to termination by the Portfolio at any time; and (iv) the Portfolio receives a reasonable return on the loan (which may include the Portfolio investing any cash collateral in interest bearing short-term investments), any distributions on the loaned securities and any increase in their market value. In addition, voting rights may pass with the loaned securities, but a Portfolio will retain the right to call any security in anticipation of a vote that its Adviser and/or Sub-Advisers deem material to the security on loan.
There may be risks of delay and costs involved in recovery of securities or even loss of rights in the collateral should the borrower of the securities fail financially. These delays and costs could be greater for foreign securities. However, loans will be made only to borrowers deemed by the Adviser or Sub-Advisers to be creditworthy and when, in the judgment of the Adviser and/or Sub-Advisers, the income which can be earned from such securities loans justifies the attendant risk. All relevant facts and circumstances, including the creditworthiness of the broker, dealer, bank or institution, will be considered in making decisions with respect to the lending of securities, subject to review by the Fund's Board of Trustees. A Portfolio also bears the risk that the reinvestment of collateral will result in a principal loss. Finally, there is the risk that the price of the securities will increase while they are on loan and the collateral will not be adequate to cover their value.
When-Issued and Delayed Delivery Securities and Forward Commitments. From time to time, each Portfolio may purchase securities on a when-issued or delayed delivery basis or may purchase or sell securities on a forward commitment basis. When these transactions are negotiated, the price is fixed at the time of the commitment, but delivery and payment may take place a month or more after the date of commitment. While a Portfolio will only purchase securities on a when-issued, delayed delivery or forward commitment basis with the intention of acquiring the securities, the Portfolio may sell the securities before the settlement date, if it is deemed advisable. The securities so purchased or sold are subject to market fluctuation and no interest or dividends accrue to the purchaser prior to the settlement date.
At the time a Portfolio makes the commitment to purchase or sell securities on a when-issued, delayed delivery or forward commitment basis, it will record the transaction and thereafter reflect the value, each day, of such security purchased, or if a sale, the proceeds to be received, in determining its net asset value. At the time of delivery of the securities, their value may be more or less than the purchase or sale price. An increase in the percentage of a Portfolio's assets committed to the purchase of securities on a when-issued, delayed delivery or forward commitment basis may increase the volatility of its net asset value. A Portfolio will also earmark cash or liquid assets or establish a segregated account on the Portfolio's books in which it will continually maintain cash or cash equivalents or other liquid portfolio securities equal in value to commitments to purchase securities on a when-issued, delayed delivery or forward commitment basis.
When, As and If Issued Securities. Each Portfolio, other than the Money Market Portfolio, may purchase securities on a "when, as and if issued" basis, under which the issuance of the security depends upon the occurrence of a subsequent event, such as approval of a merger, corporate reorganization or debt restructuring. The commitment for the purchase of any such security will not be recognized in a Portfolio until the Adviser and/or Sub-Advisers determine that issuance of the security is probable. At that time, the Portfolio will record the transaction and, in determining its net asset value, will reflect the value of the security daily. At that time, the Portfolio will also earmark cash or liquid assets or establish a segregated account on the Portfolio's books in which it will maintain cash, cash equivalents or other liquid portfolio securities equal in value to recognized commitments for such securities.
An increase in the percentage of the Portfolio assets committed to the purchase of securities on a "when, as and if issued" basis may increase the volatility of its net asset value. A Portfolio may also sell securities on a "when, as and if issued" basis, provided that the issuance of the security will result automatically from the exchange or conversion of a security owned by the Portfolio at the time of sale.
21
Private Placements and Restricted Securities. The Money Market Portfolio may invest up to 5% of its net assets in securities which are subject to restrictions on resale because they have not been registered under the Securities Act of 1933, as amended (the "Securities Act"), or which are otherwise not readily marketable; each of the Income Plus Portfolio, the Multi Cap Growth Portfolio, the European Equity Portfolio, the Limited Duration Portfolio and the Global Infrastructure Portfolio may invest up to 15% of its net assets in such restricted securities. (With respect to these Portfolios, securities eligible for resale pursuant to Rule 144A under the Securities Act, and determined to be liquid pursuant to the procedures discussed in the following paragraph, are not subject to the foregoing restriction.) These securities are generally referred to as private placements or restricted securities. Such securities may involve a higher degree of business and financial risk that can result in substantial losses. As a result of the absence of a public trading market for these securities, they may be less liquid than publicly traded securities. To the extent these securities may be resold in privately negotiated transactions, the prices realized from these sales could be less than those originally paid by the Portfolios or less than what may be considered the fair value of such securities. Furthermore, companies whose securities are not publicly traded may not be subject to the disclosure and other investor protection requirements which might be applicable if their securities were publicly traded. The illiquidity of the market, as well as the lack of publicly available information regarding these securities, may also adversely affect the ability to arrive at a fair value for certain securities at certain times and could make it difficult for the Fund to sell certain securities. If such securities are required to be registered under the securities laws of one or more jurisdictions before being sold, the Portfolios may be required to bear the expenses of registration.
Rule 144A permits the above-listed Portfolios to sell restricted securities to qualified institutional buyers without limitation. The Adviser and/or Sub-Advisers, pursuant to procedures adopted by the Trustees, will make a determination as to the liquidity of each restricted security purchased by a Portfolio. If a restricted security is determined to be "liquid," the security will not be included within the category "illiquid securities," which may not exceed, as to the Money Market Portfolio, 5% of the Portfolio's net assets and, as to each of the other Portfolios listed above, 15% of the Portfolio's net assets, as more fully described under "Fund Policies/Investment Restrictions" below. However, investing in Rule 144A securities could have the effect of increasing the level of Portfolio illiquidity to the extent a Portfolio, at a particular point in time, may be unable to find qualified institutional buyers interested in purchasing such securities.
Private Investments in Public Equity. Each Portfolio, other than the Money Market Portfolio, the Limited Duration Portfolio and the Income Plus Portfolio, may purchase equity securities in a private placement that are issued by issuers who have outstanding, publicly-traded equity securities of the same class ("private investments in public equity" or "PIPES"). Shares in PIPES generally are not registered with the SEC until after a certain time period from the date the private sale is completed. This restricted period can last many months. Until the public registration process is completed, PIPES are restricted as to resale and a Portfolio cannot freely trade the securities. Generally such restrictions cause the PIPES to be illiquid during this time. PIPES may contain provisions that the issuer will pay specified financial penalties to the holder if the issuer does not publicly register the restricted equity securities within a specified period of time, but there is no assurance that the restricted equity securities will be publicly registered, or that the registration will remain in effect.
Warrants and Subscription Rights. Each Portfolio, other than the Money Market Portfolio and the Income Plus Portfolio, may acquire warrants and subscription rights attached to other securities. In addition, each of the European Equity Portfolio and the Multi Cap Growth Portfolio may invest up to 5% of its assets in warrants not attached to other securities, with a limit of up to 2% of its total assets in warrants that are not listed on the New York Stock Exchange, Inc. ("NYSE") or other exchange. A warrant is, in effect, an option to purchase equity securities at a specific price, generally valid for a specific period of time, and has no voting rights, pays no dividends and has no rights with respect to the corporation issuing it.
A subscription right is a privilege granted to existing shareholders of a corporation to subscribe to shares of a new issue of common stock before it is offered to the public. A subscription right normally has a life of two to four weeks and a subscription price lower than the current market value of the common stock.
Public Bank Loans. The Income Plus Portfolio may invest in public loans made by banks or other financial institutions, which may be rated investment grade (Baa or higher by Moody's, or BBB or higher by S&P) or below investment grade (below Baa by Moody's or below BBB by S&P). Public bank loans are
22
privately negotiated loans for which information about the issuer has been made publicly available. However, public bank loans are not registered under the Securities Act and are not publicly traded. They usually are second lien loans normally lower in priority of payment to senior loans, but have seniority in a company's capital structure to other claims, such as subordinated corporate bonds or publicly-issued equity so that in the event of bankruptcy or liquidation, the company is required to pay down these second lien loans prior to such other lower-ranked claims on their assets. Bank loans normally pay floating rates that reset frequently, and as a result, protect investors from increases in interest rates.
Bank loans generally are negotiated between a borrower and several financial institutional lenders represented by one or more lenders acting as agent of all the lenders. The agent is responsible for negotiating the loan agreement that establishes the terms and conditions of the loan and the rights of the borrower and the lenders, monitoring any collateral, and collecting principal and interest on the loan. By investing in a loan, the Portfolio becomes a member of a syndicate of lenders. Certain bank loans are illiquid, meaning that the Portfolio may not be able to sell them quickly at a fair price. Illiquid securities are also difficult to value. To the extent a bank loan has been deemed illiquid, it will be subject to the Portfolio's restriction on investments in illiquid securities. The secondary market for bank loans may be subject to irregular trading activity, wide bid/ask spreads and extended trade settlement periods.
Bank loans are subject to the risk of default. Default in the payment of interest or principal on a loan will result in a reduction of income to the Portfolio, a reduction in the value of the loan, and a potential decrease in the Portfolio's net asset value. The risk of default will increase in the event of an economic downturn or a substantial increase in interest rates. Bank loans are subject to the risk that the cash flow of the borrower and property securing the loan or debt, if any, may be insufficient to meet scheduled payments. As discussed above, however, because bank loans reside higher in the capital structure than high yield bonds, default losses have been historically lower in the bank loan market. Bank loans that are rated below investment grade share the same risks of other below investment grade securities.
Foreign Investment. The Portfolios may invest in foreign securities. Investing in foreign securities involves certain special considerations which are not typically associated with investments in the securities of U.S. issuers. Foreign issuers are not generally subject to uniform accounting, auditing and financial reporting standards and may have policies that are not comparable to those of domestic issuers. As a result, there may be less information available about foreign issuers than about domestic issuers. Securities of some foreign issuers may be less liquid and more volatile than securities of comparable domestic issuers. There is generally less government supervision and regulation of stock exchanges, brokers and listed issuers than in the United States. In addition, with respect to certain foreign countries, there is a possibility of expropriation or confiscatory taxation, political and social instability, or diplomatic development which could affect U.S. investments in those countries. The costs of investing in foreign countries frequently are higher than the costs of investing in the United States. Although the Adviser and Sub-Advisers endeavor to achieve the most favorable execution costs in portfolio transactions, fixed commissions on many foreign stock exchanges are generally higher than negotiated commissions on U.S. exchanges. In addition, investments in certain foreign markets which have historically been considered stable may become more volatile and subject to increased risk due to ongoing developments and changing conditions in such markets. Moreover, the growing interconnectivity of global economies and financial markets has increased the probability that adverse developments and conditions in one country or region will affect the stability of economies and financial markets in other countries or regions.
Investments in securities of foreign issuers may be denominated in foreign currencies. Accordingly, the value of a Portfolio's assets, as measured in U.S. dollars, may be affected favorably or unfavorably by changes in currency exchange rates and in exchange control regulations. A Portfolio may incur costs in connection with conversions between various currencies.
Certain foreign governments levy withholding or other taxes on dividend and interest income. Although in some countries a portion of these taxes are recoverable, the non-recovered portion of foreign withholding taxes will reduce the income received from investments in such countries.
The Adviser and/or Sub-Advisers may consider an issuer to be from a particular country (including the United States) or geographic region if (i) its principal securities trading market is in that country or geographic region; (ii) alone or on a consolidated basis it derives 50% or more of its annual revenue from goods produced, sales made or services performed in that country or geographic region; or (iii) it is organized under the laws of, or has a principal office in that country or geographic region. By applying these tests, it is possible that a particular issuer could be deemed to be from more than one country or geographic region.
Emerging Market Securities. Each Portfolio, except the Money Market Portfolio, may invest in emerging market securities. An emerging market security is one issued by a foreign government or private
23
issuer that has one or more of the following characteristics: (i) its principal securities trading market is in an emerging market or developing country, (ii) alone or on a consolidated basis it derives 50% or more of its annual revenue from goods produced, sales made or services performed in emerging markets, or (iii) it is organized under the laws of, or has a principal office in, an emerging market or developing country. Based on these criteria it is possible for a security to be considered issued by an issuer in more than one country. Therefore, it is possible for the securities of any issuer that has one or more of these characteristics in connection with any emerging market or developing country not to be considered an emerging market security if it has one or more of these characteristics in connection with a developed country.
Emerging market describes any country which is generally considered to be an emerging or developing country by major organizations in the international financial community, such as the International Bank for Reconstruction and Development (more commonly known as the World Bank) and the International Finance Corporation. Emerging markets can include every nation in the world except the United States, Canada, Japan, Australia, New Zealand and most nations located in Western Europe.
The economies of individual emerging market or developing countries may differ favorably or unfavorably from the U.S. economy in such respects as growth of gross domestic product, rate of inflation or deflation, currency depreciation, capital reinvestment, resource self-sufficiency and balance of payments position. Further, the economies of developing countries generally are heavily dependent upon international trade and, accordingly, have been, and may continue to be, adversely affected by trade barriers, exchange controls, managed adjustments in relative currency values and other protectionist measures. These economies also have been, and may continue to be, adversely effected by economic conditions in the countries with which they trade.
Prior governmental approval for foreign investments may be required under certain circumstances in some emerging market or developing countries, and the extent of foreign investment in certain fixed-income securities and domestic companies may be subject to limitation in other emerging market or developing countries. Foreign ownership limitations also may be imposed by the charters of individual companies in emerging market or developing countries to prevent, among other concerns, violation of foreign investment limitations. Repatriation of investment income, capital and the proceeds of sales by foreign investors may require governmental registration and/or approval in some emerging market or developing countries. A Portfolio could be adversely affected by delays in, or a refusal to grant, any required governmental registration or approval for such repatriation. Any investment subject to such repatriation controls will be considered illiquid if it appears reasonably likely that this process will take more than seven days.
Investment in emerging market or developing countries may entail purchasing securities issued by or on behalf of entities that are insolvent, bankrupt, in default or otherwise engaged in an attempt to reorganize or reschedule their obligations and in entities that have little or no proven credit rating or credit history. In any such case, the issuer's poor or deteriorating financial condition may increase the likelihood that a Portfolio will experience losses or diminution in available gains due to bankruptcy, insolvency or fraud. Emerging market or developing countries also pose the risk of nationalization, expropriation or confiscatory taxation, political changes, government regulation, social instability or diplomatic development (including war) that could affect adversely the economies of such countries or the value of a Portfolio's investments in those countries. In addition, it may be difficult to obtain and enforce a judgment in a court outside the United States.
Investments in emerging markets may also be exposed to an extra degree of custodial and/or market risk, especially where the securities purchased are not traded on an official exchange or where ownership records regarding the securities are maintained by an unregulated entity (or even the issuer itself).
European Investments. A principal risk factor associated with investment in the European Equity Portfolio relates to the Portfolio's investments in Europe. In particular, adverse political, social or economic developments in Europe, or in a particular European country, could cause a substantial decline in the value of the Portfolio. European countries include both developed and emerging markets and these risks are heightened with respect to the Portfolio's investments in less developed European markets. In addition, because the Portfolio's investments are concentrated in Europe, the Portfolio's performance may be more volatile than if the Portfolio held a more geographically diversified set of investments.
The economies of European countries have become increasingly interconnected due to, among other things, the membership of many European countries in the European Union ("EU") and/or the European Economic and Monetary Union ("EMU"). The EU and EMU have worked to establish a single European
24
market with a common trade policy and a single currency. Many member states have adopted the Euro as their single currency and no longer control their own monetary policy. As a result, governments of such countries have less flexibility in the face of economic downturns in their local economies. In addition, the Portfolio's investments could be adversely affected in the event that one or more countries were to abandon the Euro, which could cause a decline in the value of the Euro and investments tied to those countries.
These concerns have increased in light of the recent global economic crisis that resulted in severe recessions in many European countries and pushed several smaller European economies toward bankruptcy. As a result of the crisis, some European countries may be dependent on assistance from other European governments and institutions or multilateral agencies and offices for continued financing of their economies. Such assistance may be dependent on a country's implementation of reforms or reaching a certain level of performance and failure of a country to reach those objectives or an insufficient level of assistance could adversely affect the Portfolio's investments. While certain of the larger European countries have shown signs of recovery, significant risks to growth continue to threaten a potential recovery. These factors include high levels of government debt and deficits, over-regulation and aging populations. Many countries in Europe have adopted measures and are working on regulatory initiatives aimed at increasing the liquidity and stability of financial markets. There is no guarantee that such initiatives will be successful and additional regulation will likely result in increased costs for European market participants.
Brady Bonds. Brady Bonds are both emerging market securities and foreign fixed-income securities. They are created by exchanging existing commercial bank loans to foreign entities for new obligations for the purpose of restructuring the issuers' debts under a plan introduced by former U.S. Secretary of the Treasury, Nicholas F. Brady (the Brady Plan). They may be collateralized or uncollateralized and issued in various currencies (although most are dollar-denominated). They are actively traded in the OTC secondary market. The Portfolios will only invest in Brady Bonds consistent with quality specifications.
Dollar-denominated, collateralized Brady Bonds may be fixed rate par bonds or floating rate discount bonds. These Brady Bonds are generally collateralized in full as to principal due at maturity by U.S. Treasury Zero Coupon Obligations having the same maturity as the Brady Bonds. Interest payments on these Brady Bonds generally are collateralized by cash or securities in an amount that, in the case of fixed rate bonds, is equal to at least one year of rolling interest payments or, in the case of floating rate bonds, initially is equal to at least one year's rolling interest payments based on the applicable interest rate at that time and is adjusted at regular intervals thereafter. Certain Brady Bonds are entitled to "value recovery payments" in certain circumstances, which in effect constitute supplemental interest payments but generally are not collateralized.
Brady Bonds are often viewed as having three or four valuation components: (i) the collateralized repayment of principal at final maturity; (ii) the collateralized interest payments; (iii) the uncollateralized interest payments; and (iv) any uncollateralized repayment of principal at maturity (these uncollateralized amounts constitute the "residual risk"). In the event of a default with respect to collateralized Brady Bonds as a result of which the payment obligations of the issuer are accelerated, the U.S. Treasury Zero Coupon Obligations held as collateral for the payment of principal will not be distributed to investors, nor will such obligations be sold and the proceeds distributed. The collateral will be held by the collateral agent to the scheduled maturity of the defaulted Brady Bonds, which will continue to be outstanding, at which time the face amount of the collateral will equal the principal payments due on the Brady Bonds in the normal course. However, Brady Bonds should be viewed as speculative in light of the history of default with respect to commercial bank loans by public and private entities of countries issuing Brady Bonds.
Floating and Variable Rate Obligations. Certain Portfolios may purchase floating and variable rate obligations, including floating and variable rate municipal obligations. The value of these obligations is generally more stable than that of a fixed rate obligation in response to changes in interest rate levels. Subject to the conditions for using amortized cost valuation under the Investment Company Act, a Portfolio may consider the maturity of a variable or floating rate obligation to be shorter than its ultimate stated maturity if the obligation is a U.S. Treasury Obligation or U.S. Government Security, if the obligation has a remaining maturity of 397 calendar days or less, or if the obligation has a demand feature that permits the Portfolio to receive payment at any time or at specified intervals not exceeding 397 calendar days. The issuers or financial intermediaries providing demand features may support their ability to purchase the obligations by obtaining credit with liquidity supports. These may include lines of credit, which are conditional commitments to lend, and letters of credit, which will ordinarily be irrevocable, both of which may be issued by domestic banks or foreign banks which have a branch, agency or subsidiary in the United States. A Portfolio may purchase variable or floating rate obligations from the issuers or may purchase certificates of participation, a type of floating or variable rate obligation, which are interests in a
25
pool of debt obligations held by a bank or other financial institution. Certain of these obligations may be in the form of preferred shares of registered closed-end investment companies.
Sovereign Debt. Debt obligations known as "sovereign debt" are obligations of governmental issuers in emerging market countries and industrialized countries. Certain emerging market or developing countries are among the largest debtors to commercial banks and foreign governments. The issuer or governmental authority that controls the repayment of sovereign debt may not be willing or able to repay the principal and/or pay interest when due in accordance with the terms of such obligations.
A governmental entity's willingness or ability to repay principal and pay interest due in a timely manner may be affected by, among other factors, its cash flow situation, the extent of its foreign reserves, the availability of sufficient foreign exchange on the date a payment is due, the relative size of the debt service burden to the economy as a whole, the government's dependence on expected disbursements from third-parties, the government's policy toward the International Monetary Fund and the political constraints to which a government may be subject. Governmental entities may also be dependent on expected disbursements from foreign governments, multilateral agencies and others abroad to reduce principal and interest arrearages on their debt. The commitment on the part of these governments, agencies and others to make such disbursements may be conditioned on a debtor's implementation of economic reforms or economic performance and the timely service of such debtor's obligations. Failure to implement such reforms, achieve such levels of economic performance or repay principal or interest when due may result in the cancellation of such third-parties' commitments to lend funds to the government debtor, which may further impair such debtor's ability or willingness to timely service its debts. Holders of sovereign debt may be requested to participate in the rescheduling of such debt and to extend further loans to governmental entities. In addition, no assurance can be given that the holders of commercial bank debt will not contest payments to the holders of other foreign government debt obligations in the event of default under their commercial bank loan agreements. The issuers of the government debt securities in which a Portfolio may invest have in the past experienced substantial difficulties in servicing their external debt obligations, which led to defaults on certain obligations and the restructuring of certain indebtedness. Restructuring arrangements have included, among other things, reducing and rescheduling interest and principal payments by negotiating new or amended credit agreements or converting outstanding principal and unpaid interest to Brady Bonds, and obtaining new credit to finance interest payments. There can be no assurance that the Brady Bonds and other foreign government debt securities in which a Portfolio may invest will not be subject to similar restructuring arrangements or to requests for new credit, which may adversely affect the Portfolio's holdings. Furthermore, certain participants in the secondary market for such debt may be directly involved in negotiating the terms of these arrangements and may therefore have access to information not available to other market participants.
Depositary Receipts. Each Portfolio, except the Money Market Portfolio, may invest in depositary receipts. Depositary receipts represent an ownership interest in securities of foreign companies (an "underlying issuer") that are deposited with a depositary. Depositary receipts are not necessarily denominated in the same currency as the underlying securities. Depositary receipts include American Depositary Receipts ("ADRs"), Global Depositary Receipts ("GDRs") and other types of Depositary Receipts (which, together with ADRs and GDRs, are hereinafter collectively referred to as "Depositary Receipts"). ADRs are dollar-denominated Depositary Receipts typically issued by a U.S. financial institution which evidence an ownership interest in a security or pool of securities issued by a foreign issuer. ADRs are listed and traded in the United States. GDRs and other types of Depositary Receipts are typically issued by foreign banks or trust companies, although they also may be issued by U.S. financial institutions, and evidence ownership interests in a security or pool of securities issued by either a foreign or a U.S. corporation. Generally, Depositary Receipts in registered form are designed for use in the U.S. securities market and Depositary Receipts in bearer form are designed for use in securities markets outside the United States.
Depositary Receipts may be "sponsored" or "unsponsored." Sponsored Depositary Receipts are established jointly by a depositary and the underlying issuer, whereas unsponsored Depositary Receipts may be established by a depositary without participation by the underlying issuer. Holders of unsponsored Depositary Receipts generally bear all the costs associated with establishing unsponsored Depositary Receipts. In addition, the issuers of the securities underlying unsponsored Depositary Receipts are not obligated to disclose material information in the United States and, therefore, there may be less information available regarding such issuers and there may not be a correlation between such information and the market value of the Depositary Receipts. For purposes of a Portfolio's investment policies, the Portfolio's investments in Depositary Receipts will be deemed to be an investment in the underlying securities, except that ADRs may be deemed to be issued by a U.S. issuer.
26
Investment Company Securities. Investment company securities are securities of other open-end, closed-end and unregistered investment companies, including foreign investment companies and exchange-traded funds. Each Portfolio may invest in investment company securities as may be permitted by (i) the Investment Company Act; (ii) the rules and regulations promulgated by the SEC under the Investment Company Act; or (iii) an exemption or other relief applicable to the Portfolio from provisions of the Investment Company Act. The Investment Company Act generally prohibits an investment company from acquiring more than 3% of the outstanding voting shares of an investment company and limits such investments to no more than 5% of a Portfolio's total assets in any one investment company, and no more than 10% in any combination of investment companies. Each Portfolio may invest in investment company securities of investment companies managed by the Adviser or its affiliates to the extent permitted under the Investment Company Act or as otherwise authorized by the SEC. To the extent a Portfolio invests a portion of its assets in investment company securities, those assets will be subject to the risks of the purchased investment company's portfolio securities, and a shareholder in the Portfolio will bear not only his proportionate share of the expenses of the Portfolio, but also, indirectly the expenses of the purchased investment company.
To the extent permitted by applicable law, the Portfolios may invest all or some of its short term cash investments in any money market fund advised or managed by the Adviser or its affiliates. In connection with any such investments, a Portfolio, to the extent permitted by the Investment Company Act, will pay its share of all expenses (other than advisory and administrative fees) of a money market fund in which it invests which may result in the Portfolio bearing some additional expenses.
Exchange Traded Funds ("ETFs"). Each Portfolio may invest in shares of various ETFs. Investments in ETFs are subject to a variety of risks, including the risks of a direct investment in the underlying securities that the ETF holds. For example, the general level of stock prices may decline, thereby adversely affecting the value of the underlying investments of the ETF and, consequently, the value of the ETF. In addition, the market value of the ETF shares may differ from their net asset value because the supply and demand in the market for ETF shares at any point is not always identical to the supply and demand in the market for the underlying securities. Also, ETFs that track particular indices typically will be unable to match the performance of the index exactly due to the ETF's operating expenses and transaction costs. ETFs typically incur fees that are separate from those fees incurred directly by the Portfolios. Therefore, as a shareholder in an ETF (as with other investment companies), a Portfolio would bear its ratable share of that entity's expenses. At the same time, the Portfolio would continue to pay its own investment management fees and other expenses. As a result, a Portfolio and its shareholders, in effect, will be absorbing duplicate levels of fees with respect to investments in ETFs.
Borrowing. In seeking to increase income, the Income Plus Portfolio may borrow to purchase securities. Such borrowing may not exceed 25% of the Portfolio's assets. Each Portfolio, except the Income Plus Portfolio, has an operating policy, which may be changed by the Fund's Board of Trustees, not to borrow except from a bank for temporary or emergency purposes in amounts not exceeding 5% (taken at the lower of cost or current value) of its total assets (not including the amount borrowed). Should the Board of Trustees remove this operating policy, the Portfolios would be permitted to borrow money from banks in accordance with the Investment Company Act or the rules and regulations promulgated by the SEC thereunder. Currently, the Investment Company Act permits a fund to borrow money from banks in an amount up to 331/3% of its total assets (including the amount borrowed) less its liabilities (not including any borrowings but including the fair market value at the time of computation of any other senior securities then outstanding). The Portfolios may also borrow an additional 5% of their total assets without regard to the foregoing limitation for temporary purposes such as clearance of portfolio transactions. The Portfolios will only borrow when the Adviser and/or Sub-Advisers believe that such borrowings will benefit the Portfolios after taking into account considerations such as interest income and possible gains or losses upon liquidation. The Portfolios will maintain asset coverage in accordance with the Investment Company Act.
Borrowing by a Portfolio creates an opportunity for increased net income but, at the same time, creates special risks. For example, leveraging may exaggerate changes in and increase the volatility of the net asset value of Portfolio shares. This is because leverage tends to exaggerate the effect of any increase or decrease in the value of a Portfolio's portfolio securities. The use of leverage also may cause a Portfolio to liquidate portfolio positions when it may not be advantageous to do so in order to satisfy its obligations or to maintain asset coverage.
In general, a Portfolio may not issue any class of senior security, except that the Portfolio may (i) borrow from banks, provided that immediately following any such borrowing there is an asset coverage of at least 300% for all Portfolio borrowings and in the event such asset coverage falls below 300% the
27
Portfolio will within three days or such longer period as the SEC may prescribe by rules and regulations, reduce the amount of its borrowings to an extent that the asset coverage of such borrowings shall be at least 300%, and (ii) engage in trading practices which could be deemed to involve the issuance of a senior security, including but not limited to options, futures, forward contracts and reverse repurchase agreements, provided that the Portfolio earmarks or segregates liquid assets in accordance with applicable SEC regulations and interpretations.
Contracts for Difference ("CFDs"). Certain Portfolios may purchase CFDs. A CFD is a privately negotiated contract between two parties, buyer and seller, stipulating that the seller will pay to or receive from the buyer the difference between the nominal value of the underlying instrument at the opening of the contract and that instrument's value at the end of the contract. The underlying instrument may be a single security, stock basket or index. A CFD can be set up to take either a short or long position on the underlying instrument. The buyer and seller are both required to post margin, which is adjusted daily. The buyer will also pay to the seller a financing rate on the notional amount of the capital employed by the seller less the margin deposit. A CFD is usually terminated at the buyer's initiative. The seller of the CFD will simply match the exposure of the underlying instrument in the open market and the parties will exchange whatever payment is due.
As is the case with owning any financial instrument, there is the risk of loss associated with buying a CFD. For example, if the Portfolio buys a long CFD and the underlying security is worth less at the end of the contract, the Portfolio would be required to make a payment to the seller and would suffer a loss. Also, there may be liquidity risk if the underlying instrument is illiquid because the liquidity of a CFD is based on the liquidity of the underlying instrument. A further risk is that adverse movements in the underlying security will require the buyer to post additional margin. CFDs also carry counterparty risk, i.e., the risk that the counterparty to the CFD transaction may be unable or unwilling to make payments or to otherwise honor its financial obligations under the terms of the contract. If the counterparty were to do so, the value of the contract, and of the Portfolio's shares, may be reduced.
To the extent that there is an imperfect correlation between the return on the Portfolio's obligation to its counterparty under the CFDs and the return on related assets in its portfolio, the CFD transaction may increase the Portfolio's financial risk. The Portfolio will not enter into a CFD transaction that is inconsistent with its investment objective, policies and strategies.
Municipal Obligations. Municipal obligations are securities issued by state and local governments and their agencies. These securities typically are "general obligation" or "revenue" bonds, notes or commercial paper, including participations in lease obligations and installment purchase contracts of municipalities. These obligations may have fixed, variable or floating rates. To the extent a Portfolio invests in municipal obligations issued by state and local governments and their agencies, the Portfolio may be susceptible to political, economic, regulatory or other factors affecting issuers of these municipal obligations.
Additional Information Concerning the Limited Duration Portfolio. The Limited Duration Portfolio's investments in preferred stocks are limited to those rated in one of the four highest categories by a nationally recognized statistical rating organization ("NRSRO"), including Moody's, S&P and Fitch Ratings. Investments in securities rated within the four highest rating categories by a NRSRO are considered "investment grade." However, such securities rated within the fourth highest rating category by a NRSRO may have speculative characteristics and, therefore, changes in economic conditions or other circumstances are more likely to weaken their capacity to make principal and interest payments than would be the case with investments in securities with higher credit ratings.
D. Fund Policies/Investment Restrictions
The investment objectives, policies and restrictions listed below have been adopted by the Fund as fundamental policies of the Portfolios except as otherwise indicated. Under the Investment Company Act, a fundamental policy of a Portfolio may not be changed without the vote of a majority of the outstanding voting securities of the Portfolio. The Investment Company Act defines a majority as the lesser of (a) 67% or more of the shares of a Portfolio present at a meeting of Portfolio shareholders, if the holders of 50% of the outstanding shares of the Portfolio are present or represented by proxy; or (b) more than 50% of the outstanding shares of the Portfolio. For purposes of the following restrictions: (i) all percentage limitations apply immediately after a purchase or initial investment, and (ii) any subsequent change in any applicable percentage resulting from market fluctuations or other changes in total or net assets does not require elimination of any security from a portfolio, except in the case of borrowing and investments in illiquid securities.
28
Investment Objectives
The investment objective of each Portfolio is a fundamental policy which may not be changed without the approval of the shareholders of that Portfolio.
Restrictions Applicable to All Portfolios
Each Portfolio will not:
1. Invest in a manner inconsistent with its classification as a "diversified company" as provided by (i) the Investment Company Act, as amended from time to time, (ii) the rules and regulations promulgated by the SEC under the Investment Company Act, as amended from time to time, or (iii) an exemption or other relief applicable to the Portfolio from the provisions of the Investment Company Act, as amended from time to time.
2. Concentrate its investments in any particular industry, but if deemed appropriate for attainment of its investment objective, a Portfolio may invest up to 25% of its total assets (valued at the time of investment) in any one industry classification used by that Portfolio for investment purposes. The restriction does not apply to obligations issued or guaranteed by the United States Government or its agencies or instrumentalities, or, in the case of the Money Market Portfolio, to domestic bank obligations (not including obligations issued by foreign branches of such banks). This restriction does not apply, in the case of the Global Infrastructure Portfolio, to the utilities industry in which industry the Portfolio will concentrate.
3. Purchase or sell physical commodities unless acquired as a result of ownership of securities or other instruments; provided that this restriction shall not prohibit the Portfolio from purchasing or selling options, futures contracts and related options thereon, forward contracts, swaps, caps, floors, collars and any other financial instruments or from investing in securities or other instruments backed by physical commodities or as otherwise permitted by (i) the Investment Company Act, as amended from time to time, (ii) the rules and regulations promulgated by the SEC under the Investment Company Act, as amended from time to time, or (iii) an exemption or other relief applicable to the Portfolio from the provisions of the Investment Company Act, as amended from time to time.
4. Borrow money, except the Portfolio may borrow money to the extent permitted by (i) the Investment Company Act, as amended from time to time, (ii) the rules and regulations promulgated by the SEC under the Investment Company Act, as amended from time to time, or (iii) an exemption or other relief applicable to the Portfolio from the provisions of the Investment Company Act, as amended from time to time.
5. Make loans of money or property to any person, except (a) to the extent that securities or interests in which the Portfolio may invest are considered to be loans, (b) through the loan of portfolio securities, (c) by engaging in repurchase agreements or (d) as may otherwise be permitted by (i) the Investment Company Act, as amended from time to time, (ii) the rules and regulations promulgated by the SEC under the Investment Company Act, as amended from time to time, or (iii) an exemption or other relief applicable to the Portfolio from the provision of the Investment Company Act, as amended from time to time.
6. Purchase or sell real estate; however, the Portfolio may purchase marketable securities of issuers which engage in real estate operations or which invest in real estate or interests therein, including real estate investment trusts and securities which are secured by real estate or interests therein.
7. Engage in the underwriting of securities, except insofar as the Portfolio may be deemed an underwriter under the Securities Act in disposing of a portfolio security.
8. Issue senior securities, except a Portfolio may issue senior securities to the extent permitted by (i) the Investment Company Act, as amended from time to time, (ii) the rules and regulations promulgated by the SEC under the Investment Company Act, as amended from time to time, or (iii) an exemption or other relief applicable to the Portfolio from the provisions of the Investment Company Act, as amended from time to time.
Restrictions Applicable to the Multi Cap Growth Portfolio Only
The Multi Cap Growth Portfolio will not:
1. Purchase non-convertible corporate bonds unless rated at the time of purchase Aa or better by Moody's or AA or better by S&P, or purchase commercial paper unless issued by a U.S. corporation and rated at the time of purchase Prime-1 by Moody's or A-1 by S&P, although it may continue to hold a security if its quality rating is reduced by a rating service below those specified.
29
Non-Fundamental Restrictions
In addition, as non-fundamental policies, which can be changed with Board approval and without a shareholder vote:
1. Each Portfolio may not invest its assets in the securities of any investment company except as may be permitted by (i) the Investment Company Act, as amended from time to time; (ii) the rules and regulations promulgated by the SEC under the Investment Company Act, as amended from time to time; or (iii) an exemption or other relief applicable to the Portfolio from provisions of the Investment Company Act, as amended from time to time.
2. Each of the Multi Cap Growth Portfolio, the European Equity Portfolio, the Income Plus Portfolio and the Global Infrastructure Portfolio may not invest more than 15% (5% with respect to the Money Market Portfolio) of its net assets or such other amount as may be permitted by SEC guidelines in illiquid securities, including restricted securities that have been deemed illiquid.
3. The Money Market Portfolio may not write, purchase or sell puts, calls or combinations, thereof.
Each Portfolio, except the Income Plus Portfolio, has an operating policy, which may be changed by the Fund's Board of Trustees, not to borrow except from a bank for temporary or emergency purposes in amounts not exceeding 5% (taken at the lower of cost or current value) of its total assets (not including the amount borrowed).
The investment policies, limitations or practices of the Portfolios may not apply during periods of unusual or adverse market, economic, political or other conditions. Such market, economic, political or other conditions may include periods of abnormal or heightened market volatility, strained credit and/or liquidity conditions or increased governmental intervention in the markets or industries. During such periods, a Portfolio may not invest according to its principal investment strategies or in the manner in which its name may suggest, and may be subject to different and/or heightened risks. It is possible that such unusual or adverse conditions may continue for extended periods of time.
E. Disclosure of Portfolio Holdings
The Fund's Board of Trustees, the Adviser and the Sub-Advisers have adopted policies and procedures regarding disclosure of portfolio holdings (the "Policy"). Pursuant to the Policy, the Adviser and the Sub-Advisers may disclose information concerning Fund portfolio holdings only if such disclosure is consistent with the antifraud provisions of the federal securities laws and the Fund's, the Adviser's and the Sub-Advisers' fiduciary duties to Fund shareholders. In no instance may the Adviser, Sub-Advisers or the Fund receive compensation or any other consideration in connection with the disclosure of information about the portfolio securities of the Fund. Consideration includes any agreement to maintain assets in the Fund or in other investment companies or accounts managed by the Adviser, Sub-Advisers or by any affiliated person of the Adviser or Sub-Advisers. Non-public information concerning portfolio holdings may be divulged to third-parties only when the Fund has a legitimate business purpose for doing so and the recipients of the information are subject to a duty of confidentiality. Under no circumstances shall current or prospective Fund shareholders receive non-public portfolio holdings information, except as described below.
The Fund makes available on its public website the following portfolio holdings information:
• complete portfolio holdings information monthly, at least 15 calendar days after the end of each month (except the Money Market Portfolio); and
• top 10 holdings monthly, at least 15 calendar days after the end of each month (except the Money Market Portfolio).
In order to comply with amendments to Rule 2a-7, information concerning the Money Market Portfolio's portfolio holdings, as well as its daily weighted average portfolio maturity and weighted average life, is posted on its public website no later than five business days after the end of each month. It is also the current policy of the Portfolio to post this information on its website on a weekly basis. Also, the Money Market Portfolio provides more detailed portfolio holdings information to the SEC on Form N-MFP within five business days after the end of each month. The SEC makes Form N-MFP filings publicly available on its website two months after the filing and a link to the SEC filing is posted on the Fund's website.
30
The Fund provides a complete schedule of portfolio holdings for the second and fourth fiscal quarters in its semiannual and annual reports, and for the first and third fiscal quarters in its filings with the SEC on Form N-Q.
All other portfolio holdings information that has not been disseminated in a manner making it available to investors generally as described above is non-public information for purposes of the Policy.
The Fund may make selective disclosure of non-public portfolio holdings information pursuant to certain exemptions set forth in the Policy. Third-parties eligible for exemptions under the Policy and therefore eligible to receive such disclosures currently include fund rating agencies, information exchange subscribers, consultants and analysts, portfolio analytics providers and service providers, provided that the third-party expressly agrees to maintain the disclosed information in confidence and not to trade portfolio securities or related derivative securities based on the non-public information. Non-public portfolio holdings information may not be disclosed to a third-party pursuant to an exemption unless and until the third-party recipient has entered into a non-disclosure agreement with the Fund and the arrangement has been reviewed and approved, as set forth in the Policy and discussed below. In addition, persons who owe a duty of trust or confidence to the Fund, the Adviser or the Sub-Advisers may receive non-public portfolio holdings information without entering into a non-disclosure agreement. Currently, these persons include (i) the Fund's independent registered public accounting firm (as of the Fund's fiscal year-end and on an as-needed basis), (ii) counsel to the Fund (on an as-needed basis), (iii) counsel to the independent Trustees (on an as-needed basis) and (iv) members of the Board of Trustees (on an as needed basis). Subject to the terms and conditions of any agreement between the Adviser, the Sub-Advisers or the Fund and the third-party recipient, if these conditions for disclosure are satisfied, there shall be no restriction on the frequency with which Fund non-public portfolio holdings information is released, and no lag period shall apply (unless otherwise indicated below).
The Adviser and Sub-Advisers may provide interest lists to broker-dealers who execute securities transactions for the Fund without entering into a non-disclosure agreement with the broker-dealers, provided that the interest list satisfies all of the following criteria: (1) the interest list must contain only the CUSIP numbers and/or ticker symbols of securities held in all registered management investment companies advised by the Adviser and Sub-Advisers or any affiliate of the Adviser or Sub-Advisers (the "MSIM Funds") on an aggregate, rather than a fund-by-fund basis; (2) the interest list must not contain information about the number or value of shares owned by a specified MSIM Fund; (3) the interest list may identify the investment strategy, but not the particular MSIM Funds, to which the list relates; and (4) the interest list may not identify the portfolio manager or team members responsible for managing the MSIM Funds.
Fund shareholders may elect in some circumstances to redeem their shares of the Fund in exchange for their pro rata share of the securities held by the Fund. Under such circumstances, Fund shareholders may receive a complete listing of the holdings of the Fund up to seven calendar days prior to making the redemption request provided that they represent in writing that they agree not to disclose or trade on the basis of the portfolio holdings information.
The Fund may discuss or otherwise disclose performance attribution analyses (i.e., mention the effects of having a particular security in the portfolio(s)) where such discussion is not contemporaneously made public, provided that the particular holding has been disclosed publicly. Additionally, any discussion of the analyses may not be more current than the date the holding was disclosed publicly.
The Fund may disclose portfolio holdings to transition managers, provided that the Fund has entered into a non-disclosure or confidentiality agreement with the party requesting that the information be provided to the transition manager and the party to the non-disclosure agreement has, in turn, entered into a non-disclosure or confidentiality agreement with the transition manager.
The Adviser and/or the Fund currently have entered into ongoing arrangements with the following parties:
Name | | Information Disclosed | | Frequency(1) | | Lag Time | |
Service Providers | |
RiskMetrics Group
(proxy voting agent)(*) | | Complete portfolio holdings | | Daily basis | | | (2) | | |
| State Street Bank and Trust Company(*) | | Complete portfolio holdings | | As needed | | | (2) | | |
| BlackRock Financial Management Inc.(*)(4) | | Complete portfolio holdings | | Daily basis | | | (2) | | |
31
Name | | Information Disclosed | | Frequency(1) | | Lag Time | |
Fund Rating Agencies | |
| Lipper(*) | | Top ten and complete portfolio holdings | | Monthly basis | | Approximately six business days after month end | |
Consultants and Analysts | |
| Citigroup(*) | | Complete portfolio holdings | | Quarterly basis(3) | | At least one day after quarter end | |
| Credit Suisse First Boston(*) | | Top ten and complete portfolio holdings | | Monthly and quarterly basis, respectively | | Approximately 10-12 days after month/quarter end | |
| Evaluation Associates(*) | | Top ten and complete portfolio holdings | | Monthly and quarterly basis, respectively(3) | | Approximately 10-12 days after month/quarter end | |
| Merrill Lynch(*) | | Top ten and complete portfolio holdings | | Monthly and quarterly basis, respectively(3) | | Approximately 10-12 days after month/quarter end | |
Portfolio Analystics Providers | |
| FactSet Research Systems, Inc.(*) | | Complete portfolio holdings | | Daily basis | | One day | |
(*) This entity has agreed to maintain Fund non-public portfolio holdings information in confidence and not to trade portfolio securities based on the non-public portfolio holdings information.
(1) Dissemination of portfolio holdings information to entities listed above may occur less frequently than indicated (or not at all).
(2) Information will typically be provided on a real time basis or as soon thereafter as possible.
(3) This information will also be provided upon request from time to time.
(4) With respect to the Money Market, Limited Duration and Income Plus Portfolios, only.
In addition, the following insurance companies, which are deemed service providers to the Fund, receive top ten portfolio holdings information, on a quarterly basis, approximately 15 days after quarter end: Allstate Life Insurance Company, Allstate Life Insurance Company of New York, MetLife Life and Annuity Company of Connecticut, Metropolitan Life Insurance Company and Metropolitan Life Insurance Company of Connecticut. The Fund does not currently have non-disclosure agreements in place with these entities and therefore, these entities can only receive publicly available information.
All disclosures of non-public portfolio holdings information made to third-parties pursuant to the exemptions set forth in the Policy must be reviewed by Morgan Stanley Investment Management's ("MSIM") Legal and Compliance Division and approved by the Head of the Long-Only Business of MSIM. Disclosures made to third-parties in connection with (i) broker-dealer interest lists; (ii) shareholder in-kind distributions; (iii) attribution analyses; or (iv) transitions managers are pre-approved for purposes of the Policy. In addition, the following categories of third-parties that may receive non-public portfolio holdings information are also pre-approved provided that they enter into non-disclosure agreements (as discussed above) (i) fund rating agencies; (ii) information exchange subscribers; (iii) consultants and analysts (including defined benefit and defined contribution plan sponsors, and variable annuity providers); (iv) portfolio analytics providers; and (v) service providers.
The Adviser and the Sub-Advisers shall report quarterly to the Board of Trustees (or a designated committee thereof) at the next regularly scheduled meeting: (i) any material information concerning all parties receiving non-public portfolio holdings information pursuant to an exemption; and (ii) any new non-disclosure agreements entered into during the reporting period. Procedures to monitor the use of such non-public portfolio holdings information may include requiring annual certifications that the recipients have utilized such information only pursuant to the terms of the agreement between the recipient and the Adviser and, for those recipients receiving information electronically, acceptance of the information will constitute reaffirmation that the third-party expressly agrees to maintain the disclosed information in confidence and not to trade portfolio securities based on the non-public information.
III. MANAGEMENT OF THE FUND
A. Board of Trustees
General. The Board of Trustees of the Fund oversees the management of the Portfolios, but does not itself manage each Portfolio. The Trustees review various services provided by or under the direction of
32
the Adviser to ensure that each Portfolio's general investment policies and programs are properly carried out. The Trustees also conduct their review to ensure that administrative services are provided to each Portfolio in a satisfactory manner.
Under state law, the duties of the Trustees are generally characterized as a duty of loyalty and a duty of care. The duty of loyalty requires a Trustee to exercise his or her powers in the interest of the Fund and each Portfolio and not the Trustee's own interest or the interest of another person or organization. A Trustee satisfies his or her duty of care by acting in good faith with the care of an ordinarily prudent person and in a manner the Trustee reasonably believes to be in the best interest of the Fund and each Portfolio and its shareholders.
Trustees and Officers. The Board of the Fund consists of 10 Trustees. These same individuals also serve as directors or trustees for certain of the funds advised by the Adviser and Morgan Stanley AIP GP LP. Nine Trustees have no affiliation or business connection with the Adviser or any of its affiliated persons and do not own any stock or other securities issued by the Adviser's parent company, Morgan Stanley. These are the "non-interested" or "Independent" Trustees. The other Trustee (the "Interested Trustee") is affiliated with the Adviser.
Board Structure and Oversight Function. The Board's leadership structure features an Independent Trustee serving as Chairperson and the Board Committees described below. The Chairperson participates in the preparation of the agenda for meetings of the Board and the preparation of information to be presented to the Board with respect to matters to be acted upon by the Board. The Chairperson also presides at all meetings of the Board and is involved in discussions regarding matters pertaining to the oversight of the management of the Fund between meetings.
The Board of Trustees operates using a system of committees to facilitate the timely and efficient consideration of all matters of importance to the Trustees, the Fund and Fund shareholders, and to facilitate compliance with legal and regulatory requirements and oversight of the Fund's activities and associated risks. The Board of Trustees has established five standing committees: (1) Audit Committee, (2) Governance Committee, (3) Compliance and Insurance Committee, (4) Investment Committee and (5) Closed-End Fund Committee. The Audit Committee, the Governance Committee and the Closed-End Fund Committee are comprised exclusively of Independent Trustees. Each committee charter governs the scope of the committee's responsibilities with respect to the oversight of the Fund. The responsibilities of each committee, including their oversight responsibilities, are described further under the caption "Independent Trustees and the Committees."
The Fund is subject to a number of risks, including investment, compliance, operational and valuation risk, among others. The Board of Trustees oversees these risks as part of its broader oversight of the Fund's affairs through various Board and committee activities. The Board has adopted, and periodically reviews, policies and procedures designed to address various risks to the Fund. In addition, appropriate personnel, including but not limited to the Fund's Chief Compliance Officer, members of the Fund's administration and accounting teams, representatives from the Fund's independent registered public accounting firm, the Fund's Treasurer, portfolio management personnel and independent valuation and brokerage evaluation service providers, make regular reports regarding the Fund's activities and related risks to the Board of Trustees and the committees, as appropriate. These reports include, among others, quarterly performance reports, quarterly derivatives activity and risk reports and discussions with members of the risk teams relating to each asset class. The Board's committee structure allows separate committees to focus on different aspects of risk and the potential impact of these risks on some or all of the funds in the complex and then report back to the full Board. In between regular meetings, Fund officers also communicate with the Trustees regarding material exceptions and items relevant to the Board's risk oversight function. The Board recognizes that it is not possible to identify all of the risks that may affect the Fund, and that it is not possible to develop processes and controls to eliminate all of the risks that may affect the Fund. Moreover, the Board recognizes that it may be necessary for the Fund to bear certain risks (such as investment risks) to achieve its investment objective.
As needed between meetings of the Board, the Board or a specific committee receives and reviews reports relating to the Fund and engages in discussions with appropriate parties relating to the Fund's operations and related risks.
B. Management Information
Independent Trustees. The Fund seeks as Trustees individuals of distinction and experience in business and finance, government service or academia. In determining that a particular Trustee was and
33
continues to be qualified to serve as Trustee, the Board has considered a variety of criteria, none of which, in isolation, was controlling. Based on a review of the experience, qualifications, attributes or skills of each Trustee, including those enumerated in the table below, the Board has determined that each of the Trustees is qualified to serve as a Trustee of the Fund. In addition, the Board believes that, collectively, the Trustees have balanced and diverse experience, qualifications, attributes and skills that allow the Board to operate effectively in governing the Fund and protecting the interests of shareholders. Information about the Fund's Governance Committee and Board of Trustees nomination process is provided below under the caption "Independent Trustees and the Committees."
The Trustees of the Fund, their ages, addresses, terms of office and lengths of time served, their principal business occupations during the past five years, the number of portfolios in the Fund Complex (defined below) overseen by each Independent Trustee (as of December 31, 2012) and other directorships, if any, held by the Trustees, are shown below. The Fund Complex includes all open-end and closed-end funds (including all of their portfolios) advised by the Adviser and any registered funds that have an adviser that is an affiliate of the Adviser (including, but not limited to, Morgan Stanley AIP GP LP ("Morgan Stanley AIP Funds")) (collectively, the "Morgan Stanley Funds").
Independent Trustee:
Name, Age and Address of
Independent Trustee | | Position(s)
Held with
Registrant | | Length of
Time
Served* | | Principal Occupation(s)
During Past 5 Years | | Number of
Portfolios
in Fund
Complex
Overseen by
Independent
Trustee | | Other Directorships Held
by Independent Trustee** | |
Frank L. Bowman (68)
c/o Kramer Levin Naftalis & Frankel LLP
Counsel to the Independent Trustees
1177 Avenue of the Americas
New York, NY 10036 | | Trustee | | Since August 2006 | | President, Strategic Decisions, LLC (consulting) (since February 2009); Director or Trustee of various Morgan Stanley Funds (since August 2006); Chairperson of the Insurance Sub-Committee of the Compliance and Insurance Committee (since February 2007); served as President and Chief Executive Officer of the Nuclear Energy Institute (policy organization) (February 2005-November 2008); retired as Admiral, U.S. Navy after serving over 38 years on active duty including 8 years as Director of the Naval Nuclear Propulsion Program in the Department of the Navy and the U.S. Department of Energy (1996-2004); served as Chief of Naval Personnel (July 1994-September 1996); and on the Joint Staff as Director of Political Military Affairs (June 1992-July 1994); knighted as Honorary Knight Commander of the Most Excellent Order of the British Empire; awarded the Officier de I'Orde National du Mérite by the French Government; elected to the National Academy of Engineering (2009). | | | 101 | | | Director of BP p.l.c.; Director of Naval and Nuclear Technologies LLP; Director of the Armed Services YMCA of the USA and the U.S. Naval Submarine League; Director of the American Shipbuilding Suppliers Association; Member of the National Security Advisory Council of the Center for U.S. Global Engagement and a member of the CNA Military Advisory Board. | |
34
Name, Age and Address of
Independent Trustee | | Position(s)
Held with
Registrant | | Length of
Time
Served* | | Principal Occupation(s)
During Past 5 Years | | Number of
Portfolios
in Fund
Complex
Overseen by
Independent
Trustee | | Other Directorships Held
by Independent Trustee** | |
Michael Bozic (72)
c/o Kramer Levin Naftalis & Frankel LLP
Counsel to the Independent Trustees
1177 Avenue of the Americas
New York, NY 10036 | | Trustee | | Since April 1994 | | Private investor and a member of the advisory board of American Road Group LLC (retail) (since June 2000); Chairperson of the Compliance and Insurance Committee (since October 2006); Director or Trustee of various Morgan Stanley Funds (since April 1994); formerly, Chairperson of the Insurance Committee (July 2006-September 2006); Vice Chairman of Kmart Corporation (December 1998-October 2000), Chairman and Chief Executive Officer of Levitz Furniture Corporation (November 1995-November 1998) and President and Chief Executive Officer of Hills Department Stores (May 1991-July 1995); variously Chairman, Chief Executive Officer, President and Chief Operating Officer (1987-1991) of the Sears Merchandise Group of Sears, Roebuck & Co. | | | 103 | | | Trustee and member of the Hillsdale College Board of Trustees. | |
Kathleen A. Dennis (59)
c/o Kramer Levin Naftalis & Frankel LLP
Counsel to the Independent Trustees
1177 Avenue of the Americas
New York, NY 10036 | | Trustee | | Since August 2006 | | President, Cedarwood Associates (mutual fund and investment management consulting) (since July 2006); Chairperson of the Money Market and Alternatives Sub-Committee of the Investment Committee (since October 2006) and Director or Trustee of various Morgan Stanley Funds (since August 2006); formerly, Senior Managing Director of Victory Capital Management (1993-2006). | | | 101 | | | Director of various
non-profit organizations. | |
Dr. Manuel H. Johnson (64)
c/o Johnson Smick Group, Inc.
888 16th Street, N.W. Suite 740
Washington, D.C. 20006 | | Trustee | | Since July 1991 | | Senior Partner, Johnson Smick International, Inc. (consulting firm); Chairperson of the Investment Committee (since October 2006) and Director or Trustee of various Morgan Stanley Funds (since July 1991); Co-Chairman and a founder of the Group of Seven Council (G7C) (international economic commission); formerly, Chairperson of the Audit Committee (July 1991-September 2006); Vice Chairman of the Board of Governors of the Federal Reserve System and Assistant Secretary of the U.S. Treasury. | | | 103 | | | Director of NVR, Inc. (home construction). | |
* Each Trustee serves an indefinite term, until his or her successor is elected.
** This includes any directorships at public companies and registered investment companies held by the Trustee at any time during the past five years.
35
Name, Age and Address of
Independent Trustee | | Position(s)
Held with
Registrant | | Length of
Time
Served* | | Principal Occupation(s)
During Past 5 Years | | Number of
Portfolios
in Fund
Complex
Overseen by
Independent
Trustee | | Other Directorships Held
by Independent Trustee** | |
Joseph J. Kearns (70)
c/o Kearns & Associates LLC
PMB754
22631 Pacific Coast Highway
Malibu, CA 90265 | | Trustee | | Since August 1994 | | President, Kearns & Associates LLC (investment consulting); Chairperson of the Audit Committee (since October 2006) and Director or Trustee of various Morgan Stanley Funds (since August 1994); formerly, Deputy Chairperson of the Audit Committee (July 2003-September 2006) and Chairperson of the Audit Committee of various Morgan Stanley Funds (since August 1994); CFO of the J. Paul Getty Trust. | | | 104 | | | Director of Electro Rent Corporation (equipment leasing) and The Ford Family Foundation. | |
Michael F. Klein (54)
c/o Kramer Levin Naftalis &
Frankel LLP
Counsel to the Independent Trustees
1177 Avenue of the Americas
New York, NY 10036 | | Trustee | | Since August 2006 | | Managing Director, Aetos Capital, LLC (since March 2000) and Co-President, Aetos Alternatives Management, LLC (since January 2004); Chairperson of the Fixed Income Sub-Committee of the Investment Committee (since October 2006) and Director or Trustee of various Morgan Stanley Funds (since August 2006); formerly, Managing Director, Morgan Stanley & Co. Inc. and Morgan Stanley Dean Witter Investment Management, President, various Morgan Stanley Funds (June 1998-March 2000) and Principal, Morgan Stanley & Co. Inc. and Morgan Stanley Dean Witter Investment Management (August 1997-December 1999). | | | 101 | | | Director of certain investment funds managed or sponsored by Aetos Capital, LLC.; Director of Sanitized AG and Sanitized Marketing AG (specialty chemicals). | |
Michael E. Nugent (76)
522 Fifth Avenue
New York, NY 10036 | | Chair-person of the Board and Trustee | | Chair-person of the Boards since July 2006 and Trustee since July 1991 | | General Partner, Triumph Capital, L.P., (private investment partnership); Chairperson of the Boards of various Morgan Stanley Funds (since July 2006); Chairperson of the Closed-End Fund Committee (since June 2012) and Director or Trustee of various Morgan Stanley Funds (since July 1991); formerly, Chairperson of the Insurance Committee (until July 2006). | | | 103 | | | None. | |
W. Allen Reed (66)
c/o Kramer Levin Naftalis & Frankel LLP
Counsel to the Independent Trustees
1177 Avenue of the Americas
New York, NY 10036 | | Trustee | | Since August 2006 | | Chairperson of the Equity Sub-Committee of the Investment Committee (since October 2006) and Director or Trustee of various Morgan Stanley Funds (since August 2006); formerly, President and CEO of General Motors Asset Management; Chairman and Chief Executive Officer of the GM Trust Bank and Corporate Vice President of General Motors Corporation (August 1994-December 2005). | | | 101 | | | Director of Temple-Inland Industries (packaging and forest products), Director of Legg Mason, Inc. and Director of the Auburn University Foundation. | |
* Each Trustee serves an indefinite term, until his or her successor is elected.
** This includes any directorships at public companies and registered investment companies held by the Trustee at any time during the past five years.
36
Name, Age and Address of
Independent Trustee | | Position(s)
Held with
Registrant | | Length of
Time
Served* | | Principal Occupation(s)
During Past 5 Years | | Number of
Portfolios
in Fund
Complex
Overseen by
Independent
Trustee | | Other Directorships Held
by Independent Trustee** | |
Fergus Reid (80)
c/o Joe Pietryka, Inc.
85 Charles Colman Blvd.
Pawling, NY 12564 | | Trustee | | Since June 1992 | | Chairman, Joe Pietryka, Inc.; Chairperson of the Governance Committee and Director or Trustee of various Morgan Stanley Funds (since June 1992). | | | 104 | | | Through December 31, 2012, Trustee and Director of certain investment companies in the JP Morgan Fund complex. | |
Interested Trustee:
Name, Age and Address of
Interested Trustee | | Position(s)
Held with
Registrant | | Length of
Time
Served* | | Principal Occupation(s)
During Past 5 Years | | Number of
Portfolios
in Fund
Complex
Overseen by
Interested
Trustee | | Other Directorships Held
by Interested Trustee** | |
James F. Higgins (65)
c/o Morgan Stanley Trust Harborside Financial Center
201 Plaza Two
Jersey City, NJ 07311 | | Trustee | | Since June 2000 | | Director or Trustee of various Morgan Stanley Funds (since June 2000); Senior Advisor of Morgan Stanley (since August 2000). | | | 102 | | | Director of AXA Financial, Inc. and The Equitable Life Assurance Society of the United States (financial services). | |
* Each Trustee serves an indefinite term, until his or her successor is elected.
** This includes any directorships at public companies and registered investment companies held by the Trustee at any time during the past five years.
The executive officers of the Fund, their ages, addresses, positions held, terms of office and lengths of time served, and their principal business occupations during the past five years are shown below.
Executive Officers:
Name, Age and Address of
Executive Officer | | Position(s)
Held with
Registrant | | Length of
Time
Served* | | Principal Occupation(s)
During Past 5 Years | |
Arthur Lev (51)
522 Fifth Avenue
New York, NY 10036 | | President and Principal Executive Officer — Equity, Fixed Income and AIP Funds | | Since June 2011 | | President and Principal Executive Officer of the Equity and Fixed Income Funds (since June 2011) and the Morgan Stanley AIP Funds (since February 2013) in the Fund Complex; Head of the Long-Only Business of Morgan Stanley Investment Management (since February 2011) and Head of Morgan Stanley AIP (since February 2013); Managing Director of the Adviser and various entities affiliated with the Adviser (since December 2006) and Director of the Adviser and various entities affiliated with the Adviser (since March 2013). Formerly, Chief Strategy Officer of Morgan Stanley Investment Management's Traditional Asset Management business (November 2010-February 2011); General Counsel of Morgan Stanley Investment Management (December 2006-October 2010); Partner and General Counsel of FrontPoint Partners LLC (July 2002-December 2006); Managing Director and General Counsel of Morgan Stanley Investment Management (May 2000-June 2002). | |
* Each officer serves an indefinite term, until his or her successor is elected.
37
Name, Age and Address of
Executive Officer | | Position(s)
Held with
Registrant | | Length of
Time
Served* | | Principal Occupation(s)
During Past 5 Years | |
Mary Ann Picciotto (40)
522 Fifth Avenue
New York, NY 10036 | | Chief Compliance Officer | | Since May 2010 | | Managing Director of the Adviser and various entities affiliated with the Adviser; Chief Compliance Officer of various Morgan Stanley Funds (since May 2010); Chief Compliance Officer of the Adviser (since April 2007). | |
Stefanie V. Chang Yu (46)
522 Fifth Avenue
New York, NY 10036 | | Vice President | | Since December 1997 | | Managing Director of the Adviser and various entities affiliated with the Adviser; Vice President of various Morgan Stanley Funds (since December 1997). | |
Francis J. Smith (47)
c/o Morgan Stanley
Services Company Inc.
Harborside Financial Center
201 Plaza Two
Jersey City, NJ 07311 | | Treasurer and Principal Financial Officer | | Treasurer since July 2003 and Principal Financial Officer since September 2002 | | Executive Director of the Adviser and various entities affiliated with the Adviser; Treasurer and Principal Financial Officer of various Morgan Stanley Funds (since July 2003). | |
Mary E. Mullin (46)
522 Fifth Avenue
New York, NY 10036 | | Secretary | | Since June 1999 | | Executive Director of the Adviser and various entities affiliated with the Adviser; Secretary of various Morgan Stanley Funds (since June 1999). | |
* Each officer serves an indefinite term, until his or her successor is elected.
In addition, the following individuals who are officers of the Adviser or its affiliates serve as assistant secretaries of the Fund: Joanne Antico, Joseph C. Benedetti, Daniel E. Burton, Tara A. Farrelly and Edward J. Meehan.
For each Trustee, the dollar range of equity securities beneficially owned by the Trustee in the Fund and in the Family of Investment Companies (Family of Investment Companies includes all of the registered investment companies advised by the Adviser and Morgan Stanley AIP GP LP) for the calendar year ended December 31, 2012, is set forth in the table below.
Name of Trustee | | Dollar Range of Equity Securities in the Fund
(As of December 31, 2012) | | Aggregate Dollar Range of Equity Securities in
All Registered Investment Companies Overseen
by Trustee in Family of Investment Companies
(As of December 31, 2012) | |
Independent: | | | | | | | |
| Frank L. Bowman(1) | | | None | | | over $100,000 | |
Michael Bozic | | | None | | | over $100,000 | |
Kathleen A. Dennis | | | None | | | over $100,000 | |
Manuel H. Johnson | | | None | | | over $100,000 | |
| Joseph J. Kearns(1) | | | None | | | over $100,000 | |
Michael F. Klein | | | None | | | over $100,000 | |
Michael E. Nugent | | | None | | | over $100,000 | |
| W. Allen Reed(1) | | | None | | | over $100,000 | |
| Fergus Reid(1) | | | None | | | over $100,000 | |
Interested: | | | | | | | |
James F. Higgins | | | None | | | over $100,000 | |
(1) Includes the total amount of compensation deferred by the Trustee at his election pursuant to a deferred compensation plan. Such deferred compensation is placed in a deferral account and deemed to be invested in one or more of the Morgan Stanley Funds (or portfolio thereof) that are offered as investment options under the plan.
As to each Independent Trustee and his or her immediate family members, no person owned beneficially or of record securities of an investment adviser or principal underwriter of the Fund, or a person (other than a registered investment company) directly or indirectly controlling, controlled by or under common control with an investment adviser or principal underwriter of the Fund.
Independent Trustees and the Committees. Law and regulation establish both general guidelines and specific duties for the Independent Trustees. The Board has five committees: (1) Audit Committee, (2) Governance Committee, (3) Compliance and Insurance Committee, (4) Investment Committee and (5) Closed-End Fund Committee.
38
The Independent Trustees are charged with recommending to the full Board approval of management, advisory and administration contracts, Rule 12b-1 plans and distribution and underwriting agreements; continually reviewing fund performance; checking on the pricing of portfolio securities, brokerage commissions, transfer agent costs and performance and trading among funds in the same complex; and approving fidelity bond and related insurance coverage and allocations, as well as other matters that arise from time to time. The Independent Trustees are required to select and nominate individuals to fill any Independent Trustee vacancy on the board of any fund that has a Rule 12b-1 plan of distribution.
The Board of Trustees has a separately-designated standing Audit Committee established in accordance with Section 3(a)(58)(A) of the Securities Exchange Act of 1934, as amended (the "Exchange Act"). The Audit Committee is charged with recommending to the full Board the engagement or discharge of the Fund's independent registered public accounting firm; directing investigations into matters within the scope of the independent registered public accounting firm's duties, including the power to retain outside specialists; reviewing with the independent registered public accounting firm the audit plan and results of the auditing engagement; approving professional services provided by the independent registered public accounting firm and other accounting firms prior to the performance of the services; reviewing the independence of the independent registered public accounting firm; considering the range of audit and non-audit fees; reviewing the adequacy of the Fund's system of internal controls; and reviewing the valuation process. The Fund has adopted a formal, written Audit Committee Charter.
The members of the Audit Committee of the Fund are Joseph J. Kearns, Michael F. Klein, Michael E. Nugent and W. Allen Reed. None of the members of the Fund's Audit Committee is an "interested person," as defined under the Investment Company Act, of the Fund (with such disinterested Trustees being "Independent Trustees" or individually, an "Independent Trustee"). Each Independent Trustee is also "independent" from the Fund under the listing standards of the NYSE. The Chairperson of the Audit Committee of the Fund is Joseph J. Kearns.
The Board of Trustees of the Fund also has a Governance Committee. The Governance Committee identifies individuals qualified to serve as Independent Trustees on the Fund's Board and on committees of such Board and recommends such qualified individuals for nomination by the Fund's Independent Trustees as candidates for election as Independent Trustees, advises the Fund's Board with respect to Board composition, procedures and committees, develops and recommends to the Fund's Board a set of corporate governance principles applicable to the Fund, monitors and makes recommendations on corporate governance matters and policies and procedures of the Fund's Board of Trustees and any Board committees and oversees periodic evaluations of the Fund's Board and its committees. The members of the Governance Committee of the Fund are Kathleen A. Dennis and Fergus Reid, each of whom is an Independent Trustee. The Chairperson of the Governance Committee is Fergus Reid.
The Fund does not have a separate nominating committee. While the Fund's Governance Committee recommends qualified candidates for nominations as Independent Trustees, the Board of Trustees of the Fund believes that the task of nominating prospective Independent Trustees is important enough to require the participation of all current Independent Trustees, rather than a separate committee consisting of only certain Independent Trustees. Accordingly, each Independent Trustee (Frank L. Bowman, Michael Bozic, Kathleen A. Dennis, Manuel H. Johnson, Joseph J. Kearns, Michael F. Klein, Michael E. Nugent, W. Allen Reed and Fergus Reid) participates in the election and nomination of candidates for election as Independent Trustees for the Fund. Persons recommended by the Fund's Governance Committee as candidates for nomination as Independent Trustees shall possess such experience, qualifications, attributes, skills and diversity so as to enhance the Board's ability to manage and direct the affairs and business of the Fund, including, when applicable, to enhance the ability of committees of the Board to fulfill their duties and/or to satisfy any independence requirements imposed by law, regulation or any listing requirements of the NYSE. While the Independent Trustees of the Fund expect to be able to continue to identify from their own resources an ample number of qualified candidates for the Fund's Board as they deem appropriate, they will consider nominations from shareholders to the Board. Nominations from shareholders should be in writing and sent to the Independent Trustees as described below under the caption "Shareholder Communications."
The Board formed the Compliance and Insurance Committee to address insurance coverage and oversee the compliance function for the Fund and the Board. The Compliance and Insurance Committee
39
consists of Frank L. Bowman, Michael Bozic, James F. Higgins and Manuel H. Johnson. Frank L. Bowman, Michael Bozic and Manuel H. Johnson are Independent Trustees. The Chairperson of the Compliance and Insurance Committee is Michael Bozic. The Compliance and Insurance Committee has an Insurance Sub-Committee to review and monitor the insurance coverage maintained by the Fund. The Chairperson of the Insurance Sub-Committee is Frank L. Bowman.
The Investment Committee oversees the portfolio investment process for and reviews the performance of the Fund. The Investment Committee also recommends to the Board to approve or renew the Fund's Investment Advisory, Sub-Advisory and Administration Agreements. The members of the Investment Committee are Frank L. Bowman, Michael Bozic, Kathleen A. Dennis, James F. Higgins, Manuel H. Johnson, Joseph J. Kearns, Michael F. Klein, Michael E. Nugent, W. Allen Reed and Fergus Reid. The Chairperson of the Investment Committee is Manuel H. Johnson.
The Investment Committee has three Sub-Committees, each with its own Chairperson. Each Sub-Committee focuses on the funds' primary areas of investment, namely equities, fixed income and alternatives. The Sub-Committees and their members are as follows:
(1) Equity — W. Allen Reed (Chairperson), Frank L. Bowman and Michael E. Nugent.
(2) Fixed Income — Michael F. Klein (Chairperson), Michael Bozic and Fergus Reid.
(3) Money Market and Alternatives — Kathleen A. Dennis (Chairperson), James F. Higgins and Joseph J. Kearns.
The Board formed the Closed-End Fund Committee to consider a range of issues unique to closed-end funds. The Closed-End Fund Committee consists of Michael E. Nugent, W. Allen Reed and Fergus Reid, each of whom is an Independent Trustee. The Chairperson of the Closed-End Fund Committee is Michael E. Nugent.
During the Fund's fiscal year ended December 31, 2012, the Board of Trustees held the following meetings:
Board of Trustees | | | 8 | | |
Committee/Sub-Committee: | | Number of meetings: | |
Audit Committee | | | 4 | | |
Governance Committee | | | 4 | | |
Compliance and Insurance Committee | | | 4 | | |
Insurance Sub-Committee | | | 1 | | |
Investment Committee | | | 5 | | |
Equity Sub-Committee | | | 6 | | |
Fixed Income Sub-Committee | | | 6 | | |
Money Market and Alternatives Sub-Committee | | | 5 | | |
Closed-End Fund Committee | | | 2 | | |
Experience, Qualifications and Attributes. The Board has concluded, based on each Trustee's experience, qualifications and attributes that each Board member should serve as a Trustee. Following is a brief summary of the information that led to and/or supports this conclusion.
Mr. Bowman has experience in a variety of business and financial matters through his prior service as a Director or Trustee for various other funds in the Fund Complex, where he serves as Chairperson of the Insurance Sub-Committee of the Compliance and Insurance Committee, and as a Director of B.P. p.l.c. and Naval and Nuclear Technologies LLP. Mr. Bowman also serves as a Director for the Armed Services YMCA of the USA, the U.S. Naval Submarine League and the American Shipbuilding Suppliers Association. Mr. Bowman is also a member of the National Securities Advisory Council of the Center for U.S. Global Engagement and a member of the CNA Military Advisory Board. Mr. Bowman retired as an Admiral in the U.S. Navy after serving over 38 years on active duty including 8 years as Director of the Naval Nuclear Propulsion Program in the Department of the Navy and the U.S. Department of Energy
40
(1996-2004). Additionally, Mr. Bowman served as the U.S. Navy's Chief of Naval Personnel (1994-1996) where he was responsible for the planning and programming of all manpower, personnel, training and education resources for the U.S. Navy, and on the Joint Staff as Director of Political Military Affairs (1992-1994). In addition, Mr. Bowman served as President and Chief Executive Officer of the Nuclear Energy Institute. Mr. Bowman has received such distinctions as a knighthood as Honorary Knight Commander of the Most Excellent Order of the British Empire and the Officier de l'Orde National du Mérite from the French Government and was elected to the National Academy of Engineering (2009). He is President of the consulting firm Strategic Decisions, LLC.
With over 20 years of experience on the boards and in senior management of such companies as Kmart Corporation, Levitz Furniture Corporation, Hills Department Stores and Sears Merchandise Group of Sears, Roebuck & Co., where Mr. Bozic also served as Chief Financial Officer of the Merchandise Group, and with nearly 20 years of experience as a Director or Trustee of certain other funds in the Fund Complex, Mr. Bozic has experience with a variety of financial, management, regulatory and operational issues as well as experience with marketing and distribution. Mr. Bozic has served as the Chairperson of the Compliance and Insurance Committee since 2006.
Ms. Dennis has over 25 years of business experience in the financial services industry and related fields including serving as a Director or Trustee of various other funds in the Fund Complex, where she serves as Chairperson of the Money Market and Alternatives Sub-Committee of the Investment Committee. Ms. Dennis possesses a strong understanding of the regulatory framework under which investment companies must operate based on her years of service to this Board and her position as Senior Managing Director of Victory Capital Management.
In addition to his tenure as a Director or Trustee of various other funds in the Fund Complex, where he formerly served as Chairperson of the Audit Committee, Dr. Johnson has also served as an officer or a board member of numerous companies for over 20 years. These positions included Co-Chairman and a founder of the Group of Seven Council, Director of NVR, Inc., Director of Evergreen Energy and Director of Greenwich Capital Holdings. He also has served as Vice Chairman of the Board of Governors of the Federal Reserve System and Assistant Secretary of the U.S. Treasury. In addition, Dr. Johnson also served as Chairman of the Financial Accounting Foundation, which oversees the Financial Accounting Standards Board, for seven years.
Mr. Kearns gained extensive experience regarding accounting through his experience on the Audit Committees of the boards of other funds in the Funds Complex, including serving as either Chairperson or Deputy Chairperson of the Audit Committee for nearly 20 years, and through his position as Chief Financial Officer of the J. Paul Getty Trust. He also has experience in financial, accounting, investment and regulatory matters through his position as President and founder of Kearns & Associates LLC, a financial consulting company. Mr. Kearns also serves as a Director of Electro Rent Corporation and The Ford Family Foundation. The Board has determined that Mr. Kearns is an "audit committee financial expert" as defined by the SEC.
Through his prior positions as Managing Director of Morgan Stanley & Co. Inc. and Morgan Stanley Dean Witter Investment Management and as President of Morgan Stanley Institutional Funds, Mr. Klein has experience in the management and operation of registered investment companies, enabling him to provide management input and investment guidance to the Board. Mr. Klein also has extensive experience in the investment management industry based on his current positions as Managing Director of Aetos Capital, LLC and as Director of certain investment funds managed or sponsored by Aetos Capital, LLC. In addition, he also has experience as a member of the board of other funds in the Fund Complex.
Mr. Nugent has extensive experience with financial, accounting, investment and regulatory matters through his over 20 years of service on the boards of various funds in the Fund Complex, including time as the Chairperson of the Insurance Committee, Chairperson of the Closed-End Fund Committee and Chairman of the Morgan Stanley Funds. Mr. Nugent also has experience as a General Partner in Triumph Capital, L.P.
Mr. Reed has experience on investment company boards and is experienced with financial, accounting, investment and regulatory matters through his prior service as a Director of iShares, Inc. and his service as Trustee or Director of other funds in the Fund Complex. Mr. Reed also gained substantial experience in the financial services industry through his position as Director of Legg Mason, Inc. and prior position as President and CEO of General Motors Asset Management.
41
Mr. Reid has served on a number of mutual fund boards, including as a Director or Trustee of certain investment companies in the JP Morgan Funds complex and as a Trustee or Director of other funds in the Fund Complex. Therefore, Mr. Reid is experienced with financial, accounting, investment and regulatory matters, enabling him to provide management input and investment guidance to the Board.
Mr. Higgins has over 30 years of experience in the financial services industry. Mr. Higgins has substantial mutual fund experience and is experienced with financial, accounting, investment and regulatory matters due to his experience on the boards of other funds in the Fund Complex. Mr. Higgins also serves on the boards of other companies in the financial services industry, including AXA Financial, Inc. and The Equitable Life Assurance Society of the United States.
The Trustees' principal occupations during the past five years or more are shown in the above tables.
Advantages of Having the Same Individuals as Trustees for the Morgan Stanley Funds. The Independent Trustees and the Fund's management believe that having the same Independent Trustees for each of the Morgan Stanley Funds avoids the duplication of effort that would arise from having different groups of individuals serving as Independent Trustees for each of the funds or even of sub-groups of funds. They believe that having the same individuals serve as Independent Trustees of all the Morgan Stanley Funds tends to increase their knowledge and expertise regarding matters which affect the Fund Complex generally and enhances their ability to negotiate on behalf of each fund with the fund's service providers. This arrangement also precludes the possibility of separate groups of Independent Trustees arriving at conflicting decisions regarding operations and management of the funds and avoids the cost and confusion that would likely ensue. Finally, having the same Independent Trustees serve on all fund boards enhances the ability of each fund to obtain, at modest cost to each separate fund, the services of Independent Trustees of the caliber, experience and business acumen of the individuals who serve as Independent Trustees of the Morgan Stanley Funds.
Trustee and Officer Indemnification. The Fund's Declaration of Trust provides that no Trustee, Officer, employee or agent of the Fund is liable to the Fund or to a shareholder, nor is any Trustee, Officer, employee or agent liable to any third persons in connection with the affairs of the Fund, except as such liability may arise from his/her or its own bad faith, willful misfeasance, gross negligence or reckless disregard of his/her or its duties. It also provides that all third persons shall look solely to Fund property for satisfaction of claims arising in connection with the affairs of the Fund. With the exceptions stated, the Declaration of Trust provides that a Trustee, officer, employee or agent is entitled to be indemnified against all liability in connection with the affairs of the Fund.
Shareholder Communications. Shareholders may send communications to the Fund's Board of Trustees. Shareholders should send communications intended for the Fund's Board by addressing the communications directly to the Board (or individual Board members) and/or otherwise clearly indicating in the salutation that the communication is for the Board (or individual Board members) and by sending the communication to either the Fund's office or directly to such Board member(s) at the address specified for each Trustee previously noted. Other shareholder communications received by the Fund not directly addressed and sent to the Board will be reviewed and generally responded to by management, and will be forwarded to the Board only at management's discretion based on the matters contained therein.
C. Compensation
Effective January 1, 2013, each Trustee (except for the Chairperson of the Boards) receives an annual retainer fee of $220,000 for serving as a Trustee of the Morgan Stanley Funds. Prior to January 1, 2013, each Trustee (except for the Chairperson of the Boards) received an annual retainer fee of $210,000 for serving as a Trustee of the Morgan Stanley Funds.
The Chairperson of the Audit Committee receives an additional annual retainer fee of $78,750 and the Investment Committee Chairperson receives an additional annual retainer fee of $63,000. Other Committee and Sub-Committee Chairpersons receive an additional annual retainer fee of $31,500. The aggregate compensation paid to each Trustee is paid by the Morgan Stanley Funds, and is allocated on a pro rata basis among each of the operational funds/portfolios of the Morgan Stanley Funds based on the relative net assets of each of the funds/portfolios. Michael E. Nugent receives a total annual retainer fee of $440,000 ($420,000 prior to January 1, 2013) for his services as Chairperson of the Boards of the Morgan Stanley Funds and for administrative services provided to each Board.
42
The Fund also reimburses such Trustees for travel and other out-of-pocket expenses incurred by them in connection with attending such meetings. Trustees of the Fund who are employed by the Adviser receive no compensation or expense reimbursement from the Fund for their services as Trustee.
Effective April 1, 2004, the Fund began a Deferred Compensation Plan (the "DC Plan"), which allows each Trustee to defer payment of all, or a portion, of the fees he or she receives for serving on the Board of Trustees throughout the year. Each eligible Trustee generally may elect to have the deferred amounts credited with a return equal to the total return on one or more of the Morgan Stanley Funds (or portfolios thereof) that are offered as investment options under the DC Plan. At the Trustee's election, distributions are either in one lump sum payment, or in the form of equal annual installments over a period of five years. The rights of an eligible Trustee and the beneficiaries to the amounts held under the DC Plan are unsecured and such amounts are subject to the claims of the creditors of the Fund.
Prior to April 1, 2004, certain Morgan Stanley Funds maintained a similar Deferred Compensation Plan (the "Prior DC Plan"), which also allowed each Independent Trustee to defer payment of all, or a portion, of the fees he or she received for serving on the Board of Trustees throughout the year. Generally, the DC Plan amends and supersedes the Prior DC Plan and all amounts payable under the Prior DC Plan are now subject to the terms of the DC Plan (except for amounts paid during the calendar year 2004, which remain subject to the terms of the Prior DC Plan).
The following table shows aggregate compensation payable to each of the Fund's Trustees from the Fund for the fiscal year ended December 31, 2012 and the aggregate compensation payable to each of the funds' Trustees by the Fund Complex (which includes all of the Morgan Stanley Funds) for the calendar year ended December 31, 2012.
Compensation(1)
Name of Independent Trustee: | | Aggregate
compensation
from the Fund(2) | | Total
Compensation
from Fund and
Fund Complex
Paid to Trustee(3) | |
Frank L. Bowman | | $ | 1,997 | | | $ | 241,500 | | |
Michael Bozic | | | 1,966 | | | | 241,500 | | |
Kathleen A. Dennis | | | 1,997 | | | | 241,500 | | |
Manuel H. Johnson | | | 2,223 | | | | 273,000 | | |
Joseph J. Kearns(3) | | | 2,351 | | | | 312,000 | | |
Michael F. Klein | | | 1,997 | | | | 241,500 | | |
Michael E. Nugent | | | 3,419 | | | | 420,000 | | |
W. Allen Reed(2)(3) | | | 1,581 | | | | 181,125 | | |
Fergus Reid(3) | | | 1,966 | | | | 274,750 | | |
Name of Interested Trustee: | |
James F. Higgins | | | 1,712 | | | | 210,000 | | |
(1) Includes all amounts paid for serving as director/trustee of the funds, as well as serving as Chairperson of the Boards or a Chairperson of a Committee or Sub-Committee.
(2) The amounts shown in this column represent the aggregate compensation before deferral with respect to the Fund's fiscal year. The following Trustee deferred compensation from the Fund during the fiscal year ended December 31, 2012: Mr. Reed, $1,581.
(3) The amounts shown in this column represent the aggregate compensation paid by all of the funds in the Fund Complex as of December 31, 2012 before deferral by the Trustees under the DC Plan. As of December 31, 2012, the value (including interest) of the deferral accounts across the Fund Complex for Messrs. Kearns, Reed and Reid pursuant to the deferred compensation plan was $594,589, $969,468 and $619,208, respectively. Because the funds in the Fund Complex have different fiscal year ends, the amounts shown in this column are presented on a calendar year basis.
Prior to December 31, 2003, 49 of the Morgan Stanley Funds (the "Adopting Funds"), including the Fund, had adopted a retirement program under which an Independent Trustee who retired after serving for at least five years as an Independent Trustee of any such fund (an "Eligible Trustee") would have been entitled to retirement payments, based on factors such as length of service, upon reaching the eligible retirement age. On December 31, 2003, the amount of accrued retirement benefits for each Eligible Trustee was frozen, and will be payable, together with a return of 8% per annum, at or following each such Eligible Trustee's retirement as shown in the table below.
The following table illustrates the retirement benefits accrued to the Fund's Independent Trustees by the Fund for the fiscal year ended December 31, 2012 and by the Adopting Funds for the calendar year ended December 31, 2012, and the estimated retirement benefits for the Independent Trustees from the
43
Fund for the fiscal year ended December 31, 2012 and from the Adopting Funds for each calendar year following retirement. Only the Trustees listed below participated in the retirement program.
Name of Independent Trustee: | | Retirement Benefits Accrued as
Fund Expenses | | Estimated Annual Benefits Upon
Retirement(1) | |
| | | By the
Fund | | By All Adopting
Funds | | From the
Fund | | From All Adopting
Funds | |
Michael Bozic | | $ | 910 | | | $ | 42,107 | | | $ | 967 | | | $ | 43,940 | | |
Manuel H. Johnson | | | 651 | | | | 30,211 | | | | 1,420 | | | | 64,338 | | |
Michael E. Nugent | | | 145 | | | | 6,804 | | | | 1,269 | | | | 57,539 | | |
(1) Total compensation accrued under the retirement plan, together with a return of 8% per annum, will be paid annually commencing upon retirement and continuing for the remainder of the Trustee's life.
IV. CONTROL PERSONS AND PRINCIPAL HOLDERS OF SECURITIES
As of the date of this SAI, Allstate Life Insurance Company ("Allstate") and Allstate Life Insurance Company of New York ("Allstate NY") owned 5% or more of the Class of each Portfolio of the Fund listed below for allocation to their respective separate accounts ("Accounts"), none of the Fund's Trustees was a Contract Owner under the Accounts, and the aggregate number of shares of each Portfolio of the Fund allocated to Contracts owned by the Fund's officers as a group was less than one percent of each Portfolio's outstanding Class X or Class Y shares.
The address of Allstate is 3100 Sanders Road, Northbrook, IL 60062. The address of Allstate NY is 100 Motor Parkway, Suite 132, Hauppauge, NY 11788-5107.
Allstate and/or Allstate NY owned 5% or more of the shares of each Class of each Portfolio of the Fund as of March 30, 2013:
Class/Portfolio | | Allstate | | Allstate NY | |
Class X: Money Market Portfolio | | | 92.75 | % | | | 0.00 | % | |
Class Y: Money Market Portfolio | | | 96.14 | % | | | 0.00 | % | |
Class X: Limited Duration Portfolio | | | 91.78 | % | | | 0.00 | % | |
Class Y: Limited Duration Portfolio | | | 96.64 | % | | | 0.00 | % | |
Class X: Income Plus Portfolio | | | 91.76 | % | | | 5.71 | % | |
Class Y: Income Plus Portfolio | | | 97.73 | % | | | 0.00 | % | |
Class X: Global Infrastructure Portfolio | | | 93.07 | % | | | 5.66 | % | |
Class Y: Global Infrastructure Portfolio | | | 98.05 | % | | | 0.00 | % | |
Class X: European Equity Portfolio | | | 91.99 | % | | | 6.01 | % | |
Class Y: European Equity Portfolio | | | 96.39 | % | | | 0.00 | % | |
Class X: Multi Cap Growth Portfolio | | | 94.44 | % | | | 0.00 | % | |
Class Y: Multi Cap Growth Portfolio | | | 96.11 | % | | | 0.00 | % | |
V. INVESTMENT ADVISORY AND OTHER SERVICES
A. Adviser, Sub-Advisers and Administrator
The Adviser to each Portfolio is Morgan Stanley Investment Management Inc., a Delaware corporation, whose address is 522 Fifth Avenue, New York, NY 10036. The Adviser is a wholly-owned subsidiary of Morgan Stanley, a Delaware corporation traded on the NYSE under the symbol "MS." Morgan Stanley is a preeminent global financial services firm engaged in securities trading and brokerage activities, as well as providing investment banking, research and analysis, financing and financial advisory services.
With respect to the Global Infrastructure Portfolio, the Sub-Advisers are Morgan Stanley Investment Management Limited, located at 25 Cabot Square, Canary Wharf, London, E14 4QA, England and Morgan Stanley Investment Management Company, located at 23 Church Street, 16-01 Capital Square, Singapore 049481. Each is a wholly-owned subsidiary of Morgan Stanley.
With respect to the European Equity Portfolio, the Sub-Adviser is Morgan Stanley Investment Management Limited, located at 25 Cabot Square, Canary Wharf, London, E14 4QA, England. The Sub-Adviser is a wholly-owned subsidiary of Morgan Stanley.
44
Pursuant to an Amended and Restated Investment Advisory Agreement (the "Investment Advisory Agreement") with the Adviser, the Fund has retained the Adviser to manage and/or oversee the investment of the Fund's assets, including the placing of orders for the purchase and sale of portfolio securities. The Fund pays the Adviser monthly compensation calculated daily by applying the following annual rates to the net assets of each Portfolio determined as of the close of each business day. The investment advisory fee is allocated among the Classes of each Portfolio pro rata based on the net assets of the Portfolio attributable to each Class.
Name of Portfolio | | Investment Advisory Fee Rates | |
Money Market
| | 0.45% of the portion of daily net assets not
exceeding $250 million; 0.375% of the portion of
daily net assets exceeding $250 million but not
exceeding $750 million; 0.325% of the portion of
daily net assets exceeding $750 million but not
exceeding $1.25 billion; 0.30% of the portion of
daily net assets exceeding $1.25 billion but not
exceeding $1.5 billion; and 0.275% of the portion
of daily net assets exceeding $1.5 billion. | |
| | The Portfolio's Distributor, Adviser and Administrator
have agreed to waive and/or reimburse all or a portion
of the Portfolio's distribution fee, advisory fee and
administration fee, respectively, to the extent that total
expenses exceed total income on a daily basis. These
fee waivers and/or expense reimbursements will
continue for at least one year or until such time as the
Fund's Board of Trustees acts to discontinue all or a
portion of such waivers and/or reimbursements when it
deems such action is appropriate. | |
Limited Duration | | 0.30% of the daily net assets | |
Income Plus
| | 0.42% of the portion of the daily net assets not
exceeding $500 million; 0.35% of the portion of
the daily net assets exceeding $500 million but not
exceeding $1.25 billion; and 0.22% of the portion
of the daily net assets exceeding $1.25 billion. | |
Global Infrastructure
| | 0.57% of the portion of daily net assets not
exceeding $500 million; 0.47% of the portion of
daily net assets exceeding $500 million but not
exceeding $1 billion; 0.445% of the portion of
daily net assets exceeding $1 billion but not
exceeding $1.5 billion; 0.42% of the portion of
daily net assets exceeding $1.5 billion but not
exceeding $2.5 billion; 0.395% of the portion of
daily net assets exceeding $2.5 billion but not
exceeding $3.5 billion; 0.37% of the portion of
daily net assets exceeding $3.5 billion but not
exceeding $5 billion; and 0.345% of the portion of
daily net assets exceeding $5 billion. | |
45
Name of Portfolio | | Investment Advisory Fee Rates | |
European Equity
| | 0.87% of the portion of daily net assets not
exceeding $500 million; 0.82% of the portion of
daily net assets exceeding $500 million but not
exceeding $2 billion; 0.77% of the portion of daily
net assets exceeding $2 billion but not exceeding
$3 billion; and 0.745% of the portion of daily net
assets exceeding $3 billion. | |
| | The Portfolio's Adviser and Administrator have
agreed to reduce its advisory fee, its administration
fee and/or reimburse the Portfolio so that Total
Annual Portfolio Operating Expenses, excluding certain
investment related expenses, 12b-1 fees, taxes, interest
and other extraordinary expenses (including litigation),
will not exceed1.00%. The fee waivers and/or expense
reimbursements will continue for at least one year or
until such time as the Fund's Board of Trustees acts to
discontinue all or a portion of such waivers and/or
reimbursements when it deems such action is
appropriate. | |
Multi Cap Growth
| | 0.42% of the portion of the daily net assets not
exceeding $1 billion; 0.395% of the portion of the
daily net assets exceeding $1 billion but not
exceeding $2 billion; and 0.37% of the portion of
the daily net assets exceeding $2 billion. | |
| | The Portfolio's Adviser and Administrator have
agreed to reduce its advisory fee, its administration
fee and/or reimburse the Portfolio so that Total
Annual Portfolio Operating Expenses, excluding certain
investment related expenses, 12b-1 fees, taxes, interest
and other extraordinary expenses (including litigation),
will not exceed 0.57%. The fee waivers and/or expense
reimbursements will continue for at least two years from
the date of the applicable reorganization or until such
time as the Fund's Board of Trustees acts to discontinue
all or a portion of such waivers and/or reimbursements
when it deems such action is appropriate. | |
The following table reflects for each Portfolio (i) the advisory fee paid; and (ii) the advisory fee waived and/or affiliated rebates for each of the past three fiscal years ended December 31, 2010, 2011 and 2012.
| | | Advisory Fees Paid
(After Fee Waivers and/or
Affiliated Rebates) | | Advisory Fees Waived | | Affiliated Rebates | |
Name of Portfolio | | 2010 | | 2011 | | 2012 | | 2010 | | 2011 | | 2012 | | 2010 | | 2011 | | 2012 | |
Money Market | | $ | 169,394 | | | $ | 90,371 | | | $ | 95,066 | | | $ | 468,863 | | | $ | 434,703 | | | $ | 349,556 | | | $ | 0 | | | $ | 0 | | | $ | 0 | | |
Limited Duration | | | 218,203 | | | | 186,121 | | | | 160,019 | | | | 0 | | | | 0 | | | | 0 | | | | 2,541 | | | | 1,009 | | | | 1,369 | | |
Income Plus | | | 1,017,890 | | | | 891,861 | | | | 797,005 | | | | 0 | | | | 0 | | | | 0 | | | | 5,649 | | | | 1,719 | | | | 8,989 | | |
Global Infrastructure | | | 441,973 | | | | 425,321 | | | | 411,887 | | | | 0 | | | | 0 | | | | 0 | | | | 1,951 | | | | 1,419 | | | | 1,179 | | |
European Equity | | | 503,811 | | | | 456,178 | | | | 335,983 | | | | 115,288 | | | | 112,937 | | | | 114,369 | | | | 1,506 | | | | 1,140 | | | | 871 | | |
Multi Cap Growth | | | 1,082,731 | | | | 1,093,594 | | | | 936,787 | | | | 0 | | | | 0 | | | | 0 | | | | 7,364 | | | | 11,007 | | | | 9,118 | | |
Pursuant to sub-advisory agreements (each, a "Sub-Advisory Agreement") between the Adviser and each of the Sub-Advisers with respect to the Global Infrastructure Portfolio and the European Equity Portfolio, the Sub-Advisers have been retained, subject to the overall supervision of the Adviser and the Trustees of the applicable Portfolios, to, together with the Adviser, continuously furnish investment advice concerning individual security selections, asset allocations and economic trends and management of the applicable Portfolios. The Adviser pays the Sub-Advisers on a monthly basis a portion of the net advisory fees the Adviser receives from the applicable Portfolios.
46
Administration services are provided to the Fund by Morgan Stanley Services Company Inc. ("Administrator"), a wholly-owned subsidiary of the Adviser, pursuant to a separate administration agreement ("Administration Agreement") entered into by the Fund with the Administrator. The Fund pays the Administrator monthly compensation of 0.08% of daily net assets (0.05% with respect to the Money Market Portfolio).
For the fiscal years ended December 31, 2010, 2011 and 2012, the Fund paid compensation under the Administration Agreement as follows:
| | | Compensation Paid for the Fiscal Year
Ended December 31, | |
Name of Portfolio | | 2010 | | 2011 | | 2012 | |
Money Market | | $ | 70,918 | (1) | | $ | 51,730 | (1) | | $ | 49,403 | (1) | |
Limited Duration | | | 58,865 | | | | 49,901 | | | | 43,037 | | |
Income Plus | | | 194,960 | | | | 170,205 | | | | 153,523 | | |
Global Infrastructure | | | 62,305 | | | | 59,893 | | | | 57,974 | | |
European Equity | | | 57,067 | | | | 52,437 | | | | 41,492 | | |
Multi Cap Growth | | | 207,637 | | | | 210,400 | | | | 180,172 | | |
(1) For the fiscal years ended December 31, 2010, 2011 and 2012, the administration fees paid reflect a waiver of $0, $6,612 and $0, respectively.
Under a Sub-Administration Agreement between the Administrator and State Street Bank and Trust Company ("State Street"), State Street provides certain administrative services to the Fund. For such services, the Administrator pays State Street a portion of the fee the Administrator receives from the Fund.
B. Principal Underwriter
The Fund's principal underwriter is the Distributor (which has the same address as the Adviser). In this capacity, each Portfolio's shares are distributed by the Distributor. The Distributor has entered into a selected dealer agreement with Morgan Stanley Smith Barney LLC and Morgan Stanley & Co., which through their own sales organizations sell shares of the Fund. In addition, the Distributor may enter into similar agreements with other selected broker-dealers. The Distributor, a Delaware corporation, is a wholly-owned subsidiary of Morgan Stanley.
The Fund and the Distributor have agreed to indemnify each other against certain liabilities, including liabilities under the Securities Act. Under the Distribution Agreement, the Distributor uses its best efforts in rendering services to the Fund, but in the absence of willful misfeasance, bad faith, gross negligence or reckless disregard of its obligations, the Distributor is not liable to the Fund or any of its shareholders for any error of judgment or mistake of law or for any act or omission or for any losses sustained by the Portfolios or their shareholders.
C. Services Provided by the Adviser, Sub-Advisers and Administrator
The Adviser manages the investment of each Portfolio's assets (other than the European Equity Portfolio and the Global Infrastructure Portfolio), including the placing of orders for the purchase and sale of portfolio securities. The Adviser obtains and evaluates the information and advice relating to the economy, securities markets and specific securities as it considers necessary or useful to continuously manage the assets of each Portfolio in a manner consistent with its investment objective.
Under the terms of the Administration Agreement, the Administrator maintains certain of the Fund's books and records and furnishes, at its own expense, the office space, facilities, equipment, clerical help and bookkeeping as the Fund may reasonably require in the conduct of its business. The Administrator also assists in the preparation of prospectuses, proxy statements and reports required to be filed with federal and state securities commissions (except insofar as the participation or assistance of the independent registered public accounting firm and attorneys is, in the opinion of the Administrator, necessary or desirable). The Administrator also bears the cost of telephone service, heat, light, power and other utilities provided to the Fund.
With respect to the European Equity Portfolio and the Global Infrastructure Portfolio, the Sub-Advisers have been retained, subject to the overall supervision of the Adviser, to continuously furnish investment advice concerning individual security selections, asset allocations, overall economic trends and to manage the Portfolios' portfolios.
47
Expenses not expressly assumed by the Adviser under the Investment Advisory Agreement or by the Administrator under the Administration Agreement or by the Sub-Advisers for the European Equity Portfolio and the Global Infrastructure Portfolio under the Sub-Advisory Agreements or by the Distributor, will be paid by the Portfolios. Each Portfolio pays all expenses incurred in its operation and a portion of the Fund's general administration expenses allocated based on the asset sizes of the Portfolios. The Portfolios' direct expenses include, but are not limited to: expenses of the Plan of Distribution pursuant to Rule 12b-1; charges and expenses of any registrar, custodian, transfer and dividend disbursing agent; brokerage commissions; certain taxes; registration costs of the Fund under federal and state securities laws; shareholder servicing costs, charges and expenses of any outside service used for pricing of the Portfolios' shares; fees and expenses of legal counsel, including counsel to the Trustees who are not interested persons of the Fund or of the Adviser (or the Sub-Advisers) (not including compensation or expenses of attorneys who are employees of the Adviser (or the Sub-Advisers)); fees and expenses of the Fund's independent registered public accounting firm; interest on Portfolio borrowings; and all other expenses attributable to a particular Portfolio. The 12b-1 fees relating to Class Y will be allocated directly to Class Y. In addition, other expenses associated with a particular Class (except advisory or custodial fees) may be allocated directly to that Class, provided that such expenses are reasonably identified as specifically attributable to that Class and the direct allocation to that Class is approved by the Trustees.
Expenses which are allocated on the basis of size of the respective Portfolios include the costs and expenses of printing, including typesetting, and distributing prospectuses and statements of additional information of the Fund and supplements thereto to the Fund's shareholders; all expenses of shareholders' and Trustees' meetings and of preparing, printing and mailing proxy statements and reports to shareholders; fees and travel expenses of Trustees or members of any advisory board or committee who are not employees of the Adviser (or the Sub-Advisers) or any corporate affiliate of the Adviser (or the Sub-Advisers); state franchise taxes; SEC fees; membership dues of industry associations; postage; insurance premiums on property or personnel (including officers and Trustees) of the Fund which inure to its benefit; and all other costs of the Fund's operations properly payable by the Fund and allocable on the basis of size to the respective Portfolios. Depending on the nature of a legal claim, liability or lawsuit, litigation costs, payment of legal claims or liabilities and any indemnification relating thereto may be directly applicable to the Portfolio or allocated on the basis of the size of the respective Portfolios. The Trustees have determined that this is an appropriate method of allocation of expenses.
Each of the Investment Advisory Agreement and the Sub-Advisory Agreements provides that in the absence of willful misfeasance, bad faith, gross negligence or reckless disregard of their obligations thereunder, the Adviser and the Sub-Advisers, respectively, are not liable to the Fund or any of its investors (and, in the case of the Sub-Advisory Agreements, to the Adviser) for any act or omission by the Adviser or for any losses sustained by the Fund or its investors.
Each of the Investment Advisory Agreement and the Sub-Advisory Agreements will remain in effect from year to year provided continuance of the applicable Agreement is approved at least annually by the vote of the holders of a majority, as defined in the Investment Company Act, of the outstanding shares of each affected Portfolio, or by the Trustees; provided that in either event such continuance is approved annually by the vote of a majority of the Independent Trustees.
The Administration Agreement provides that in the absence of willful misfeasance, bad faith, gross negligence or reckless disregard of its obligations thereunder, the Administrator is not liable to the Fund or any of its investors for any act or omission by the Administrator or for any losses sustained by the Fund or its investors. The Administration Agreement will continue unless terminated by either party by written notice delivered to the other party within 30 days.
D. Rule 12b-1 Plan
The Fund has adopted a Plan of Distribution, effective July 31, 2011, pursuant to Rule 12b-1 under the Investment Company Act (the "Plan"). Under the Plan, Class Y shares of each Portfolio bear a distribution fee paid to the Distributor which is accrued daily and payable monthly at the annual rate of 0.25% of the average daily net assets of the Class.
Prior to July 31, 2011, in accordance with Rule 12b-1 under the Investment Company Act, the Fund had adopted a Plan of Distribution with respect to the Class Y shares between the Fund and Morgan Stanley Distributors Inc. (the "Prior Distributor"), pursuant to which the Prior Distributor provided certain services in connection with the promotion and sale of the Fund's Class Y shares (the "Prior Plan").
48
The Plan provides that each Portfolio's distribution fee shall compensate the Distributor, Morgan Stanley Smith Barney LLC and its affiliates, and other selected broker-dealers for expenses they incur in connection with the distribution of the Portfolio's Class Y shares. These expenses may include: (i) cost incurred in providing personal services to shareholders; (ii) overhead and other branch office distribution-related expenses including, but not limited to, expenses of operating the Distributor's or other broker-dealers' offices used for selling Portfolio shares (e.g., lease and utility costs, salaries and employee benefits of operations and sales support personnel, costs related to client sales seminars and telephone expenses); (iii) printing and mailing costs relating to prospectuses and reports (for new shareholders); and (iv) costs incurred in connection with advertising materials and sales literature. In addition, payments to the Distributor may be used by the Distributor to compensate insurance companies for shareholder services, which include, but are not limited to, education of agents concerning the Portfolios, compensation of agents and servicing contract owners.
Under the Plan and as required by Rule 12b-1, the Distributor provides the Fund, for review by the Trustees, and the Trustees review promptly after the end of each calendar quarter, a written report regarding the distribution expenses incurred under the Plan on behalf of each Portfolio during such calendar quarter, which report includes (1) an itemization of the types of expenses and the purposes therefor; (2) the amounts of such expenses; and (3) a description of the benefits derived by the Fund.
For the fiscal year ended December 31, 2012, Class Y shares of the following Portfolios made payments under the Plan as follows:
Name of Portfolio: | | Compensation paid for
the fiscal year ended
December 31, 2012 | |
Money Market | | $ | 0 | (1) | |
Limited Duration | | | 105,473 | | |
Income Plus | | | 255,476 | | |
Global Infrastructure | | | 36,232 | | |
European Equity | | | 29,225 | | |
Multi Cap Growth | | | 123,379 | | |
(1) The distribution fee of $129,903 was fully waived.
On an annual basis, the Trustees, including a majority of the Independent Trustees, consider whether the Plan should be continued. Prior to approving the last continuation of the Plan, the Trustees requested and received from the Distributor and reviewed all the information which they deemed necessary to arrive at an informed determination. In making their determination to continue the Plan, the Trustees considered: (1) the Portfolios' experience under the Plan and whether such experience indicates that the Plan is operating as anticipated; (2) the benefits each Portfolio had obtained, was obtaining and would be likely to obtain under the Plan, including that (a) the Plan is essential in order to give Portfolio investors a choice of alternatives for payment of distribution and service charges and to enable each Portfolio to continue to grow and avoid a pattern of net redemptions which, in turn, are essential for effective investment management; and (b) without the compensation to individual brokers and the reimbursement of distribution and account maintenance expenses of Morgan Stanley Smith Barney LLC branch offices made possible by the 12b-1 fees, Morgan Stanley Smith Barney LLC could not establish and maintain an effective system for distribution, servicing of Contract Owners and maintenance of their accounts; and (3) what services had been and were continuing to be provided under the Plan to each Portfolio and its respective Contract Owners. Based upon their review, the Trustees, including each of the Independent Trustees, determined that continuation of the Plan would be in the best interests of each Portfolio and would have a reasonable likelihood of continuing to benefit each Portfolio and its respective Contract Owners.
The Plan may not be amended to increase materially the amount to be spent for the services described therein without approval by the Class Y shareholders of each affected Portfolio, and all material amendments to the Plan must also be approved by the Trustees. The Plan may be terminated as to a Portfolio at any time, without payment of any penalty, by vote of a majority of the Independent Trustees or by a vote of a majority of the outstanding voting securities of the Portfolio (as defined in the Investment Company Act) on not more than 30 days' written notice to any other party to the Plan. So long as the Plan is in effect, the election and nomination of Independent Trustees shall be committed to the discretion of the Independent Trustees.
49
No interested person of the Fund nor any Independent Trustee has any direct financial interest in the operation of the Plan, except to the extent that the Distributor, the Adviser, the Sub-Advisers, Morgan Stanley, Morgan Stanley Smith Barney LLC, Morgan Stanley Services or certain of their employees may be deemed to have such an interest as a result of benefits derived from the successful operation of the Plan or as a result of receiving a portion of the amounts expended thereunder by the Portfolios.
E. Other Service Providers
(1) Transfer Agent/Dividend Disbursing Agent
Morgan Stanley Services Company Inc., P.O. Box 219886, Kansas City, MO 64121-9886, is the Transfer Agent for each Portfolio's shares and the Dividend Disbursing Agent for payment of dividends and distributions on Portfolio shares.
(2) Custodian and Independent Registered Public Accounting Firm
State Street Bank and Trust Company, One Lincoln Street, Boston, MA 02111, is the Custodian of each Portfolio's assets. Any Portfolio's cash balances with the Custodian in excess of $250,000 (a temporary increase from $100,000, which is due to expire on December 31, 2013), are unprotected by federal deposit insurance. These balances may, at times, be substantial.
Ernst & Young LLP, located at 200 Clarendon Street, Boston, MA 02116-5021, is the independent registered public accounting firm of the Fund. The Fund's independent registered public accounting firm is responsible for auditing the annual financial statements.
(3) Affiliated Persons
The Transfer Agent is an affiliate of the Adviser, the Sub-Advisers and the Distributor. As Transfer Agent and Dividend Disbursing Agent, the Transfer Agent's responsibilities include maintaining shareholder accounts, reinvesting dividends, processing account registration changes, handling purchase and redemption transactions, tabulating proxies and maintaining shareholder records and lists. For these services, the Transfer Agent receives a per shareholder account fee from each Portfolio and is reimbursed for its out-of-pocket expenses in connection with such services.
F. Fund Management
Other Accounts Managed by Portfolio Managers at December 31, 2012 (unless otherwise indicated):
| | | Registered
Investment Companies | | Other Pooled
Investment Vehicles | | Other Accounts | |
Portfolio and
Portfolio Managers | | Number of
Accounts | | Total Assets
in the Accounts | | Number of
Accounts | | Total Assets
in the Accounts | | Number of
Accounts | | Total Assets
in the Accounts | |
Multi Cap Growth | |
Sam G. Chainani | | | 32 | | | $16.7 billion | | | 4 | | | $5.4 billion | | | 11 | | | $1.0 billion | |
David S. Cohen | | | 32 | | | $16.7 billion | | | 4 | | | $5.4 billion | | | 11 | | | $1.0 billion | |
Dennis P. Lynch | | | 32 | | | $16.7 billion | | | 4 | | | $5.4 billion | | | 11 | | | $1.0 billion | |
Armistead B. Nash | | | 32 | | | $16.7 billion | | | 4 | | | $5.4 billion | | | 11 | | | $1.0 billion | |
Alexander T. Norton | | | 32 | | | $16.7 billion | | | 4 | | | $5.4 billion | | | 11 | | | $1.0 billion | |
Jason C. Yeung | | | 32 | | | $16.7 billion | | | 4 | | | $5.4 billion | | | 11 | | | $1.0 billion | |
European Equity | |
Riccardo Bindi | | | 1 | | | $166.1 million | | | 3 | | | $803.9 million | | | 4 | (1) | | $740.2 million(1) | |
Jonathan Day | | | 1 | | | $166.1 million | | | 3 | | | $803.9 million | | | 4 | (1) | | $740.2 million(1) | |
Matthew Leeman | | | 1 | | | $166.1 million | | | 3 | | | $803.9 million | | | 4 | (1) | | $740.2 million(1) | |
Jaymeen Patel | | | 1 | | | $166.1 million | | | 3 | | | $803.9 million | | | 4 | (1) | | $740.2 million(1) | |
Global Infrastructure | |
Theodore R. Bigman | | | 13 | | | $6.2 billion | | | 15 | | | $7.0 billion | | | 59 | (2) | | $7.3 billion(2) | |
Matthew King | | | 3 | | | $401.5 million | | | 1 | | | $196.8 million | | | 0 | | | $0 | |
Income Plus | |
Joseph Mehlman | | | 4 | | | $413.6 million | | | 0 | | | $0 | | | 53 | | | $11.8 billion | |
Christian G. Roth | | | 7 | | | $508.7 million | | | 21 | | | $7.3 billion | | | 32 | (3) | | $13.9 billion(3) | |
Limited Duration | |
Divya Chhibba | | | 3 | | | $1.3 billion | | | 0 | | | $0 | | | 1 | | | $308.1 million | |
Joseph Mehlman | | | 4 | | | $548.7 million | | | 0 | | | $0 | | | 53 | | | $11.8 billion | |
Neil Stone | | | 9 | | | $2.0 billion | | | 0 | | | $0 | | | 67 | (4) | | $14.1 billion(4) | |
(1) Of these other accounts, three accounts with a total of approximately $1.8 billion in assets, had performance-based fees.
(2) Of these other accounts, 16 accounts with a total of approximately $934.8 million in assets, had performance-based fees.
(3) Of these other accounts, four accounts with a total of approximately $2.2 billion in assets, had performance-based fees.
(4) Of these other accounts, one account with a total of approximately $565.6 million in assets, had performance-based fees.
50
Because the portfolio managers may manage assets for other investment companies, pooled investment vehicles, and/or other accounts (including institutional clients, pension plans and certain high net worth individuals), there may be an incentive to favor one client over another resulting in conflicts of interest. For instance, the Adviser and/or Sub-Advisers may receive fees from certain accounts that are higher than the fee it receives from the Portfolios, or it may receive a performance-based fee on certain accounts. In those instances, the portfolio managers may have an incentive to favor the higher and/or performance-based fee accounts over the Portfolios. In addition, a conflict of interest could exist to the extent the Adviser and/or Sub-Advisers have proprietary investments in certain accounts, where portfolio managers have personal investments in certain accounts or when certain accounts are investment options in the Adviser's and/or Sub-Advisers' employee benefits and/or deferred compensation plans. The portfolio manager may have an incentive to favor these accounts over others. If the Adviser and/or Sub-Advisers manage accounts that engage in short sales of securities of the type in which the Portfolios invest, the Adviser and/or Sub-Advisers could be seen as harming the performance of the Portfolios for the benefit of the accounts engaging in short sales if the short sales cause the market value of the securities to fall. The Adviser and/or Sub-Advisers have adopted trade allocation and other policies and procedures that it believes are reasonably designed to address these and other conflicts of interest.
Portfolio Manager Compensation Structure
Portfolio managers receive a combination of base compensation and discretionary compensation, comprising a cash bonus and several deferred compensation programs described below. The methodology used to determine portfolio manager compensation is applied across all funds/accounts managed by the portfolio managers.
Base salary compensation. Generally, portfolio managers receive base salary compensation based on the level of their position with the Adviser and/or Sub-Advisers.
Discretionary compensation. In addition to base compensation, portfolio managers may receive discretionary compensation.
Discretionary compensation can include:
• Cash Bonus.
• Morgan Stanley's Long Term Incentive Compensation awards—a mandatory program that defers a portion of discretionary year-end compensation into restricted stock units or other awards based on Morgan Stanley common stock or other plans that are subject to vesting and other conditions. All long-term incentive compensation awards are subject to clawback provisions where awards can be cancelled if an employee takes any action, or omits to take any action, which causes a restatement of Morgan Stanley's consolidated financial results, or constitutes a violation of Morgan Stanley's risk policies and standards.
• Investment Management Alignment Plan (IMAP) awards—a mandatory program that defers a portion of discretionary year-end compensation and notionally invests it in designated funds advised by the Adviser and/or Sub-Advisers or their affiliates. The award is subject to vesting and other conditions. Portfolio managers must notionally invest a minimum of 25% to a maximum of 100% of their IMAP deferral account into a combination of the designated funds they manage that are included in the IMAP fund menu, which may or may not include the Portfolios. In addition to the clawbacks listed above for long-term incentive compensation awards, the provision on IMAP awards is further strengthened such that it may also be triggered if an employee's actions cause substantial financial loss on a trading strategy, investment, commitment or other holding provided that previous gains on those positions were relevant to the employees' prior year compensation decisions.
Several factors determine discretionary compensation, which can vary by portfolio management team and circumstances. In order of relative importance, these factors may include:
• Revenues generated by the investment companies, pooled investment vehicles and other accounts managed by the portfolio manager.
• The investment performance of the funds/accounts managed by the portfolio manager.
• Contribution to the business objectives of the Adviser and/or Sub-Advisers.
• The dollar amount of assets managed by the portfolio manager.
• Market compensation survey research by independent third-parties.
51
• Other qualitative factors, such as contributions to client objectives.
• Performance of Morgan Stanley and Morgan Stanley Investment Management, and the overall performance of the investment team(s) of which the portfolio manager is a member.
Securities Ownership of Portfolio Managers
As of December 31, 2012 (unless otherwise noted), the dollar range of securities beneficially owned by each portfolio manager in the Portfolio is shown below:
Multi Cap Growth
Sam G. Chainani | | | none* | | |
David S. Cohen | | | none* | | |
Dennis P. Lynch | | | none* | | |
Armistead B. Nash | | | none* | | |
Alexander T. Norton | | | none* | | |
Jason C. Yeung | | | none* | | |
European Equity
Riccardo Bindi | | | none* | | |
Jonathan Day | | | none* | | |
Matthew Leeman | | | none* | | |
Jaymeen Patel | | | none* | | |
Global Infrastructure
Theodore R. Bigman | | | none* | | |
Matthew King | | | none* | | |
Income Plus
Joseph Mehlman | | | none | | |
Christian G. Roth | | | none | | |
Limited Duration
Divya Chhibba | | | none | | |
Joseph Mehlman | | | none* | | |
Neil Stone | | | none | | |
* Not included in the table above, the portfolio manager has made investments in one or more other mutual funds managed by the same portfolio management team pursuant to a similar strategy.
G. Codes of Ethics
The Fund, the Adviser, the Sub-Advisers and the Distributor have each adopted a Code of Ethics pursuant to Rule 17j-1 under the Investment Company Act. The Codes of Ethics are designed to detect and prevent improper personal trading. The Codes of Ethics permit personnel subject to the Codes to invest in securities, including securities that may be purchased, sold or held by the Fund, subject to a number of restrictions and controls, including prohibitions against purchases of securities in an initial public offering and a preclearance requirement with respect to personal securities transactions.
H. Proxy Voting Policy and Proxy Voting Record
The Board of Trustees believes that the voting of proxies on securities held by the Fund is an important element of the overall investment process. As such, the Trustees have delegated the responsibility to vote such proxies to MSIM.
A copy of MSIM's Proxy Voting Policy ("Proxy Policy") is attached hereto as Appendix A. In addition, a copy of the Proxy Policy, as well as the Fund's most recent proxy voting record for the 12-month period ended June 30, as filed with the SEC, are available without charge on our web site at www.morganstanley.com/im. The Fund's proxy voting record is also available without charge on the SEC's web site at www.sec.gov.
I. Revenue Sharing
The Adviser and/or Distributor may pay compensation, out of their own funds and not as an expense of the Portfolios, to insurance companies or their affiliates and/or other financial intermediaries
52
("Intermediaries"), in connection with the sale, distribution, marketing and retention of Portfolio shares and/or shareholder servicing of shares of the Portfolios. For example, the Adviser or the Distributor may pay additional compensation to Intermediaries for, among other things, promoting the sale and distribution of Portfolio shares, furnishing marketing support, maintaining share balances, and/or for sub-accounting, administrative, shareholder or transaction processing services. Such payments are in addition to any distribution fees or shareholder service fees that may be payable by the Distributor. The additional payments may be based on various factors, including net sales or some specified minimum sales or some other similar criteria related to sales of a Portfolio, amount of assets invested by the Intermediary's customers, a Portfolio's advisory fees, some other agreed-upon amount, or other measures as determined from time to time by the Adviser and/or Distributor. The amount of these payments may be different for different Intermediaries.
Currently, these payments, which are made in accordance with the applicable compensation structure for each Intermediary, include an ongoing annual fee in an amount up to 0.10% of the average daily NAV of shares of each Portfolio held in the applicable accounts.
The prospect of receiving, or the receipt of, additional compensation, as described above, by Intermediaries may provide Intermediaries and/or their financial advisers or other salespersons with an incentive to favor sales of shares of one variable annuity contract over other contract options with respect to which the Intermediary does not receive additional compensation (or receives lower levels of additional compensation) or be a factor in an insurance company's decision to include the Portfolio as an underlying investment option in its variable insurance products. These payment arrangements, however, will not change the price that an investor pays for shares of a Portfolio or the amount that a Portfolio receives to invest on behalf of an investor. Investors may wish to take such payment arrangements into account when considering and evaluating any recommendations relating to Portfolio shares and should review carefully any disclosure provided by an Intermediary as to its compensation.
VI. BROKERAGE ALLOCATION AND OTHER PRACTICES
A. Brokerage Transactions
Subject to the general supervision of the Trustees, the Adviser and for the European Equity Portfolio and Global Infrastructure Portfolio, the Sub-Advisers, are responsible for decisions to buy and sell securities for each Portfolio, the selection of brokers and dealers to effect the transactions and the negotiation of brokerage commissions, if any. Purchases and sales of securities on a stock exchange are effected through brokers who charge a commission for their services. In the OTC market, securities are generally traded on a "net" basis with dealers acting as principal for their own accounts without a stated commission, although the price of the security usually includes a profit to the dealer. The Fund also expects that securities will be purchased at times in underwritten offerings where the price includes a fixed amount of compensation, generally referred to as the underwriter's concession or discount. Options and futures transactions will usually be effected through a broker and a commission will be charged. Certain securities (e.g., certain money market instruments) are purchased directly from an issuer, in which case no commissions or discounts are paid.
Pursuant to orders issued by the SEC, the Fund is permitted to engage in principal transactions, subject to certain conditions, with Morgan Stanley & Co., and with Citigroup, Inc. or its affiliates ("Citigroup"), each of which is, or may be deemed to be, a broker-dealer affiliated with the Fund's Adviser.
During the fiscal years ended December 31, 2010 and December 31, 2012, the Fund, on behalf of the Money Market Portfolio, effected principal transactions with Morgan Stanley & Co. During the fiscal year ended December 31, 2011, the Fund did not effect any principal transactions with Morgan Stanley & Co.
During the fiscal year ended December 31, 2010, the Fund, on behalf of the Limited Duration, Income Plus, Global Infrastructure, European Equity and Multi Cap Growth Portfolios, effected principal transactions with Citigroup. During the fiscal year ended December 31, 2011, the Fund, on behalf of the Money Market, Income Plus, Global Infrastructure, European Equity and Multi Cap Growth Portfolios, effected principal transactions with Citigroup. During the fiscal year ended December 31, 2012, the Fund, on behalf of the Limited Duration and Income Plus Portfolios, effected principal transactions with Citigroup.
53
B. Commissions
Brokerage transactions in securities listed on exchanges or admitted to unlisted trading privileges may be effected through Morgan Stanley & Co., Citigroup and other affiliated brokers and dealers. In order for an affiliated broker or dealer to effect any portfolio transactions on an exchange for the Portfolios, the commissions, fees or other remuneration received by the affiliated broker or dealer must be reasonable and fair compared to the commissions, fees or other remuneration paid to other brokers in connection with comparable transactions involving similar securities being purchased or sold on an exchange during a comparable period of time. This standard would allow the affiliated broker or dealer to receive no more than the remuneration which would be expected to be received by an unaffiliated broker in a commensurate arm's-length transaction. Furthermore, the Trustees, including the Independent Trustees, have adopted procedures which are reasonably designed to provide that any commissions, fees or other remuneration paid to an affiliated broker or dealer are consistent with the foregoing standard. The Fund does not reduce the management fee it pays to the Adviser by any amount of the brokerage commissions it may pay to an affiliated broker or dealer.
During the fiscal years ended December 31, 2010, 2011 and 2012, the Fund paid brokerage commissions of approximately $423,545, $239,561 and $223,644, respectively. During the fiscal years ended December 31, 2010, 2011 and 2012, the Fund paid in the aggregate $3,653, $5,865 and $325, respectively, in brokerage commissions to Morgan Stanley & Co. and/or its affiliated broker-dealers. During the fiscal year ended December 31, 2012, the brokerage commissions paid to Morgan Stanley & Co. and/or its affiliated broker-dealers represented approximately 0.15% of the total brokerage commissions paid by the Fund during the period and were paid on account of transactions having an aggregate dollar value equal to approximately 0.01% of the aggregate dollar value of all portfolio transactions of the Fund during the period for which commissions were paid.
During the fiscal years ended December 31, 2010, 2011 and 2012, the Fund paid in the aggregate $2,009, $10,444 and $3,904, respectively, in brokerage commissions to Citigroup. During the fiscal year ended December 31, 2012, the brokerage commissions paid to Citigroup represented approximately 1.75% of the total brokerage commissions paid by the Fund during the period and were paid on account of transactions having an aggregate dollar value equal to approximately 0.21% of the aggregate dollar value of all portfolio transactions of the Fund during the period for which commissions were paid.
For the fiscal year ended December 31, 2012, each Portfolio paid brokerage commissions, including brokerage commissions paid to affiliated broker-dealers, as follows:
| | | Brokerage Commissions Paid During Fiscal Year Ended
December 31, 2012 | |
| | | | | Commissions Paid to
Morgan Stanley & Co. and/or
its affiliated broker-dealers | | Commissions Paid to
Citigroup | |
Name of Portfolio | | Total
Commissions
Paid | | Total
Commissions | | Percent of
Total
Commissions | | Percent of
Total
Brokered
Transactions | | Total
Commissions | | Percent of
Total
Commissions | | Percent of
Total
Brokered
Transactions | |
Money Market | | $ | 0 | | | $ | 0 | | | | 0.00 | % | | | 0.00 | % | | $ | 0 | | | | 0.00 | % | | | 0.00 | % | |
Limited Duration | | | 2,142 | | | | 0 | | | | 0.00 | % | | | 0.00 | % | | | 0 | | | | 0.00 | % | | | 0.00 | % | |
Income Plus | | | 17,622 | | | | 0 | | | | 0.00 | % | | | 0.00 | % | | | 0 | | | | 0.00 | % | | | 0.00 | % | |
Global Infrastructure | | | 46,472 | | | | 0 | | | | 0.00 | % | | | 0.00 | % | | | 1,461 | | | | 3.14 | % | | | 1.56 | % | |
European Equity | | | 21,113 | | | | 325 | | | | 1.54 | % | | | 1.08 | % | | | 2,085 | | | | 9.88 | % | | | 10.15 | % | |
Multi Cap Growth | | | 136,295 | | | | 0 | | | | 0.00 | % | | | 0.00 | % | | | 358 | | | | 0.26 | % | | | 0.38 | % | |
54
During the fiscal years ended December 31, 2010 and December 31, 2011, each Portfolio paid brokerage commissions, including brokerage commissions paid to affiliated broker-dealers, as follows:
| | | Brokerage Commissions Paid During Fiscal Years Ended
December 31, 2010 and 2011 | |
| | | Fiscal Year Ended
December 31, 2010 | | Fiscal Year Ended
December 31, 2011 | |
Name of Portfolio | | Total | | Morgan
Stanley &
Co.
and/or its
affiliated
broker-
dealers | | Citigroup | | Total | | Morgan
Stanley &
Co.
and/or its
affiliated
broker
dealers | | Citigroup | |
Money Market | | $ | 0 | | | $ | 0 | | | $ | 0 | | | $ | 0 | | | $ | 0 | | | $ | 0 | | |
Limited Duration | | | 5,930 | | | | 0 | | | | 0 | | | | 2,419 | | | | 0 | | | | 0 | | |
Income Plus | | | 23,024 | | | | 0 | | | | 0 | | | | 17,923 | | | | 0 | | | | 0 | | |
Global Infrastructure | | | 213,759 | | | | 344 | | | | 65 | | | | 71,838 | | | | 246 | | | | 9,358 | | |
European Equity | | | 49,936 | | | | 433 | | | | 846 | | | | 23,083 | | | | 0 | | | | 721 | | |
Multi Cap Growth | | | 130,896 | | | | 2,876 | | | | 1,098 | | | | 124,298 | | | | 5,619 | | | | 365 | | |
C. Brokerage Selection
The policy of the Fund regarding purchases and sales of securities for the Portfolios is that primary consideration will be given to obtaining the most favorable prices and efficient executions of transactions. The Adviser (and, if applicable, the Sub-Advisers) are prohibited from directing brokerage transactions on the basis of the referral of clients or the sale of shares of investment companies for which it acts as investment adviser (and, if applicable, Sub-Advisers). Consistent with this policy, when securities transactions are effected on a stock exchange, the Fund's policy is to pay commissions which are considered fair and reasonable without necessarily determining that the lowest possible commissions are paid in all circumstances. The Fund believes that a requirement always to seek the lowest possible commission cost could impede effective portfolio management and preclude the Fund and the Investment (or, if applicable, the Sub-Advisers) from obtaining a high quality of brokerage and research services. The Fund anticipates that certain of its transactions involving foreign securities will be effected on foreign securities exchanges. Fixed commissions on such transactions are generally higher than negotiated commissions on domestic transactions. There is also generally less government supervision and regulation of foreign securities exchanges and brokers than in the United States.
In seeking to implement each Portfolio's policies, the Adviser and/or Sub-Advisers effect transactions with those broker-dealers that the Adviser and/or Sub-Advisers believe provide prompt execution of orders in an effective manner at the most favorable prices. The Adviser and/or Sub-Advisers may place portfolio transactions with those broker-dealers that also furnish research and other services to the Fund or the Adviser and/or Sub-Advisers. Services provided may include certain research services (as described below) as well as effecting securities transactions and performing functions incidental thereto (such as clearance, settlement and custody).
The Adviser and its affiliated investment advisers have established commission sharing arrangements under a commission management program (the "Commission Management Program" or "CMP"), pursuant to which execution and research costs or a portion of those costs are decoupled in accordance with applicable laws, rules and regulations. Under the CMP, the Adviser and its affiliated investment advisers select approved equity brokers (which include the Adviser's affiliates) for execution services, and after accumulation of commissions with such brokers, the Adviser and/or its affiliates instruct these approved equity brokers to pay for eligible research provided by executing brokers or third-party research providers, which are selected independently by a Research Services Committee of the Adviser and its affiliated investment advisers. Generally, the Adviser and its affiliated investment advisers will direct the approved equity broker to record research credits based upon a previously agreed-upon allocation and will periodically instruct the approved equity broker to direct specified dollar amounts from that pool to pay for eligible research services provided by third-party research providers and executing brokers. The research credits are pooled among the Adviser and its affiliated investment advisers and allocated on behalf of both the Adviser and its affiliated investment advisers. Likewise, the research services obtained under the CMP are shared among the Adviser and its affiliated investment advisers.
55
Selection of approved equity brokers for execution is based on three main criteria: access to liquidity, provision of capital and quality of execution. Under the CMP, each approved equity broker is responsible for the payment of fees for research services and obtains the research services pursuant to written agreements between the approved equity broker and the third-party research provider.
For those costs not decoupled, but retained by broker-dealers, the Adviser also effects transactions with brokers which directly pay for research services provided by those brokers in accordance with Section 28(e) of the Exchange Act. Such transactions include equity transactions and may include fixed-income transactions effected on an agency basis.
Transactions involving client accounts managed by two or more affiliated investment advisers may be aggregated and executed using the services of broker-dealers that provide third-party benefits/research so long as: (i) all client accounts involved in the transaction benefit from one or more of the services offered by such broker-dealer; and (ii) each affiliated investment adviser has approved the use of such broker-dealer and the services provided thereby.
The research services received include those of the nature described above and other services which aid the Adviser in fulfilling its investment decision making responsibilities, including (a) furnishing advice as to the value of securities, the advisability of investing in, purchasing or selling securities, and the availability of securities or purchasers or sellers of securities; and (b) furnishing analyses and reports concerning issuers, industries, securities, economic factors and trends, portfolio strategy and the performance of accounts. Where a particular item has both research and non-research related uses (such as proxy services where both research services and services relating to the administration of the proxy itself are provided), the Adviser will make a reasonable allocation of the cost of the item between research and non-research uses and will only pay for the portion of the cost allocated to research uses with client brokerage transactions. Research services furnished or paid for by brokers through whom the Adviser effects transactions for a particular account may be used by the Adviser or its affiliated investment advisers in servicing their other accounts, and not all such services may be used for the benefit of the client which pays the brokerage commission that results in the receipt of such research services. Commissions paid to brokers providing research services may be higher than those charged by brokers not providing such services.
The Adviser and its affiliated investment advisers make a good faith determination of the value of research services in accordance with Section 28(e) of the Exchange Act, UK Financial Services Authority Rules and other relevant regulatory requirements.
Certain investment professionals and other employees of the Adviser are also officers of affiliated investment advisers and may provide investment advisory services to clients of such affiliated investment advisers. The Adviser's personnel also provide research and trading support to personnel of certain affiliated investment advisers. Research related costs may be shared by affiliated investment advisers and may benefit the clients of such affiliated investment advisers. Research services that benefit the Adviser may be received in connection with commissions generated by clients of its affiliated investment advisers. Similarly, research services received in connection with commissions generated by the Adviser's clients may benefit affiliated investment advisers and their clients. Moreover, research services provided by broker-dealers through which the Adviser effects transactions for a particular account may be used by the Adviser and/or an affiliated investment adviser in servicing its other accounts and not all such research services may be used for the benefit of the particular client, which pays the brokerage commission giving rise to the receipt of such research services.
The Adviser, the Sub-Advisers and certain of their affiliates currently serve as investment advisers to a number of clients, including other investment companies, and may in the future act as investment advisers to others. It is the practice of the Adviser, the Sub-Advisers (if applicable) and their affiliates to cause purchase and sale transactions (including transactions in certain initial and secondary public offerings) to be allocated among the Portfolios and clients whose assets they manage in such manner as they deem equitable. In making such allocations among the Portfolios and other client accounts, various factors may be considered, including the respective investment objectives, the relative size of portfolio holdings of the same or comparable securities, the availability of cash for investment, the size of investment commitments generally held and the opinions of the persons responsible for managing the Portfolios and other client accounts. The Adviser, the Sub-Advisers and their affiliates may operate one or more
56
order placement facilities, and each facility will implement order allocation in accordance with the procedures described above. From time to time, each facility may transact in a security at the same time as other facilities are trading in that security.
D. Regular Broker-Dealers
During the fiscal year ended December 31, 2012, the Portfolios purchased securities issued by the following issuers, which issuers were among the ten brokers or ten dealers that executed transactions for or with the Fund or the Portfolio in the largest dollar amounts during the period:
Name of Portfolio: | | Issuer | |
Money Market | | Barclays Bank PLC
Credit Suisse Group AG
Deutsche Bank AG | |
Limited Duration | | Barclays Bank PLC
J.P. Morgan Securities LLC | |
Income Plus | | Barclays Bank PLC
Goldman Sachs & Co.
HSBC Holdings PLC
JP Morgan Securities LLC | |
Global Infrastructure | | None | |
European Equity | | Barclays Bank PLC | |
Multi Cap Growth | | None | |
At December 31, 2012, the Portfolios held securities issued by such brokers or dealers with the following market values:
Name of Portfolio: | | Issuer | | Market Value
at 12/31/12 | |
Money Market | | Credit Suisse Group AG
Deutsche Bank AG | | $ | 3,997,284
3,000,000 | | |
Limited Duration | | J.P. Morgan Securities LLC
Barclays Bank PLC | | | 1,574,135
319,323 | | |
Income Plus
| | Goldman Sachs & Co.
JP Morgan Securities LLC
Barclays Bank PLC
HSBC Holdings PLC | | | 4,279,421
3,677,792
2,144,502
1,942,706 | | |
European Equity | | Barclays Bank PLC | | | 1,410,587 | | |
VII. CAPITAL STOCK AND OTHER SECURITIES
The shareholders of each Portfolio are entitled to a full vote for each full share of beneficial interest held. The Fund is authorized to issue an unlimited number of shares of beneficial interest. The Fund's shares of beneficial interest are divided currently into eight Portfolios. All shares of beneficial interest of the Fund are of $0.01 par value and are equal as to earnings, assets and voting privileges except that each Class will have exclusive voting privileges with respect to matters relating to distribution expenses borne solely by such Class (if any) or any other matter in which the interests of one Class differ from the interests of the other Class.
The Fund's Declaration of Trust permits the Trustees to authorize the creation of additional Portfolios (the proceeds of which would be invested in separate, independently managed portfolios) and additional Classes of shares within any Portfolio. The Trustees have not presently authorized any such additional series or Classes of shares other than as set forth in the Prospectus for each Portfolio.
The Fund is not required to hold annual meetings of shareholders and in ordinary circumstances the Fund does not intend to hold such meetings. The Trustees may call special meetings of shareholders for action by shareholder vote as may be required by the Investment Company Act or the Declaration of
57
Trust. Under certain circumstances, the Trustees may be removed by the actions of the Trustees. In addition, under certain circumstances, the shareholders may call a meeting to remove the Trustees and the Fund is required to provide assistance in communication with shareholders about such a meeting. The voting rights of shareholders are not cumulative, so that holders of more than 50% of the shares voting can, if they choose, elect all Trustees being selected, while the holders of the remaining shares would be unable to elect any Trustees.
Under Massachusetts law, shareholders of a business trust may, under certain limited circumstances, be held personally liable as partners for the obligations of the Fund. However, the Declaration of Trust contains an express disclaimer of shareholder liability for acts or obligations of the Fund, requires that notice of such Fund obligations include such disclaimer, and provides for indemnification out of the Fund's property for any shareholder held personally liable for the obligations of the Fund. Thus, the risk of a shareholder incurring financial loss on account of shareholder liability is limited to circumstances in which the Fund itself would be unable to meet its obligations. Given the above limitations on shareholder personal liability, and the nature of the Fund's assets and operations, the possibility of the Fund being unable to meet its obligations is remote and thus, in the opinion of Massachusetts counsel to the Fund, the risk to Fund shareholders of personal liability is remote.
Shareholders have the right to vote on the election of Trustees of the Fund and on any and all matters on which by law or the provisions of the Fund's By-Laws they may be entitled to vote. To the extent required by law, insurance companies, which are the only shareholders of the Fund, will vote the shares of the Fund held in each Account established to fund the benefits under either a flexible premium deferred variable annuity Contract or a flexible premium variable life insurance Contract in accordance with instructions from the owners of such Contracts. Shares of each Portfolio will be voted by the insurance company investing in such Portfolio based on instructions received from the contract holders having a voting interest in the underlying account. Shares for which timely instructions are not received generally will be voted by the insurance company in the same proportion as shares for which instructions have been timely received. Therefore, as a result of this proportional voting, the vote of a small number of contract holders could determine the outcome of a proposal subject to a shareholder vote.
The Trustees themselves have the power to alter the number and the terms of office of the Trustees (as provided for in the Declaration of Trust), and they may at any time lengthen or shorten their own terms or make their terms of unlimited duration and appoint their own successors, provided that always at least a majority of the Trustees has been elected by the shareholders of the Fund.
Shareholders of all Portfolios vote for a single set of Trustees. On any matters affecting only one Portfolio, only the shareholders of that Portfolio are entitled to vote. On matters relating to all the Portfolios, but affecting the Portfolios differently, separate votes by each Portfolio are required. Approval of an Investment Advisory Agreement and a change in fundamental policy would be regarded as matters requiring separate voting by each Portfolio.
With respect to the submission to shareholder vote of a matter requiring separate voting by each Portfolio, the matter shall have been effectively acted upon with respect to any Portfolio if a majority of the outstanding voting securities of that Portfolio votes for the approval of the matter, notwithstanding that: (1) the matter has not been approved by a majority of the outstanding voting securities of any other Portfolio; or (2) the matter has not been approved by a majority of the outstanding voting securities of the Fund.
VIII. PURCHASE, REDEMPTION AND PRICING OF SHARES
A. Purchase/Redemption of Shares
Information concerning how Portfolio shares are offered (and how they are redeemed) is provided in each of the Fund's Class X and Class Y Prospectuses.
B. Offering Price
The price of each Portfolio share, called "net asset value," is based on the value of the Portfolio's securities. Net asset value per share of each of Class X and Class Y shares is calculated by dividing the value of the portion of each Portfolio's securities and other assets attributable to each Class, respectively, less the total market value of the liabilities attributable to each Class, respectively, by the number of shares of
58
the Class outstanding. The assets of each Class of shares are invested in a single portfolio. The net asset value of each Class, however, will differ because the Classes have different ongoing fees.
The Money Market Portfolio, however, utilizes the amortized cost method in valuing its portfolio securities for purposes of determining the net asset value of its shares. The Money Market Portfolio utilizes this method in valuing its portfolio securities even though the portfolio securities may increase or decrease in market value, generally in connection with changes in interest rates. The amortized cost method of valuation involves valuing a security at its cost at the time of purchase adjusted by a constant amortization to maturity of any discount or premium, regardless of the impact of fluctuating interest rates on the market value of the instrument. While this method provides certainty in valuation, it may result in periods during which value, as determined by amortized cost, is higher or lower than the price the Money Market Portfolio would receive if it sold the investment. During such periods, the yield to investors in the Money Market Portfolio may differ somewhat from that obtained in a similar company which uses mark-to-market values for all of its portfolio securities. For example, if the use of amortized cost resulted in a lower (higher) aggregate portfolio value on a particular day, a prospective investor in the Money Market Portfolio would be able to obtain a somewhat higher (lower) yield than would result from investment in such a similar company and existing investors would receive less (more) investment income. The purpose of this method of calculation is to facilitate the maintenance of a constant net asset value per share of $1.00.
The use of the amortized cost method to value the portfolio securities of the Money Market Portfolio and the maintenance of the per share net asset value of $1.00 is permitted pursuant to Rule 2a-7 of the Investment Company Act (the "Rule") and is conditioned on its compliance with various conditions contained in the Rule including: (a) the Trustees are obligated, as a particular responsibility within the overall duty of care owed to the Portfolio's shareholders, to establish procedures reasonably designed, taking into account current market conditions and the Portfolio's investment objectives, to stabilize the net asset value per share as computed for the purpose of distribution and redemption at $1.00 per share; (b) the procedures include (i) calculation, at such intervals as the Trustees determine are appropriate and as are reasonable in light of current market conditions, of the deviation, if any, between net asset value per share using amortized cost to value portfolio securities and net asset value per share based upon available market quotations with respect to such portfolio securities; (ii) periodic review by the Trustees of the amount of deviation as well as methods used to calculate it; and (iii) maintenance of written records of the procedures, and the Trustees' considerations made pursuant to them and any actions taken upon such consideration; (c) the Trustees should consider what steps should be taken, if any, in the event of a difference of more than 1/2 of 1% between the two methods of valuation; and (d) the Trustees should take such action as they deem appropriate (such as shortening the average portfolio maturity, realizing gains or losses, withholding dividends or, as provided by the Declaration of Trust, reducing the number of outstanding shares of the Money Market Portfolio) to eliminate or reduce to the extent reasonably practicable material dilution or other unfair results to investors or existing shareholders which might arise from differences between the two methods of valuation. Any reduction of outstanding shares will be effected by having each shareholder proportionately contribute to the Money Market Portfolio's capital the necessary shares that represent the amount of excess upon such determination. Each Contract Owner will be deemed to have agreed to such contribution in these circumstances by allocating investment under his or her Contract to the Money Market Portfolio.
Generally, for purposes of the procedures adopted under the Rule, the maturity of a portfolio security is deemed to be the period remaining (calculated from the trade date or such other date on which the Money Market Portfolio's interest in the instrument is subject to market action) until the date on which in accordance with the terms of the security, the principal amount must unconditionally be paid, or in the case of a security called for redemption, the date on which the redemption payment must be made.
A variable rate security that is subject to a demand feature is deemed to have a maturity equal to the period remaining until the principal amount can be recovered through demand. A floating rate security that is subject to a demand feature is deemed to have a maturity equal to the period remaining until the principal amount can be recovered through demand.
An "NRSRO" is a nationally recognized statistical rating organization. At the time the Money Market Portfolio acquires its investments, they will be rated (or issued by an issuer that is rated with respect to a comparable class of short-term debt obligations) (i) in one of the two highest rating categories for short-term debt obligations assigned by at least two NRSROs; or (ii) if only one NRSRO has issued a rating
59
with respect to such security or issuer at the time a fund purchases or rolls over the security, that NRSRO (the "Requisite NRSROs").
An Eligible Security is generally defined in the Rule to mean (i) a security with a remaining maturity of 397 calendar days or less that has received a short-term rating (or that has been issued by an issuer that has received a short-term rating with respect to a class of debt obligations, or any debt obligation within that class, that is comparable in priority and security with the security) by the Requisite NRSROs in one of the two highest short-term rating categories (within which there may be sub-categories or gradations indicating relative standing); or (ii) a security: (a) that at the time of issuance had a remaining maturity of more than 397 calendar days but that has a remaining maturity of 397 calendar days or less; and (b) whose issuer has received from the Requisite NRSROs a rating with respect to a class of debt obligations (or any debt obligations within that class) that is now comparable in priority and security with the security, in one of the two highest short-term rating categories (within which there may be subcategories or gradations indicating relative standing); or (iii) an unrated security that is of comparable quality to a security meeting the requirements of (i) or (ii) above, as determined by the Trustees. The Money Market Portfolio will limit its investments to securities that meet the requirements for Eligible Securities.
As permitted by the Rule, the Board has delegated to the Fund's Adviser, subject to the Board's oversight pursuant to guidelines and procedures adopted by the Board, the authority to determine which securities present minimal credit risks and which unrated securities are comparable in quality to rated securities.
Also, as required by the Rule, the Money Market Portfolio will limit its investments in securities, other than Government securities, so that, at the time of purchase: (a) except as further limited in (b) below with regard to certain securities, no more than 5% of its total assets will be invested in the securities of any one issuer; and (b) with respect to Eligible Securities that have received a rating in less than the highest category by an NRSRO, or that have been determined to be of comparable quality: (i) no more than 3% in the aggregate of the Money Market Portfolio's total assets in all such securities, (ii) no more than 0.5% of total assets in the securities of any one issuer, and (iii) the remaining maturity of any such securities must be 45 days or less.
The presence of a line of credit or other credit facility offered by a bank or other financial institution, which guarantees the payment obligation of the issuer, in the event of a default in the payment of principal or interest of an obligation, may be taken into account in determining whether an investment is an Eligible Security, provided that the guarantee itself is an Eligible Security.
The Rule further requires that the Money Market Portfolio limit its investments to U.S. dollar-denominated instruments which the Trustees determine present minimal credit risks and which are Eligible Securities. The Rule also requires the Money Market Portfolio to maintain a dollar-weighted average portfolio maturity (not more than 60 days) appropriate to its objective of maintaining a stable net asset value of $1.00 per share and precludes the purchase of any instrument with a remaining maturity of more than 397 days. Should the disposition of a portfolio security result in a dollar-weighted average portfolio maturity of more than 60 days, the Portfolio will invest its available cash in such a manner as to reduce such maturity to 60 days or less as soon as is reasonably practicable.
In the unlikely event that the Fund's Board of Trustees are to determine pursuant to Rule 2a-7 that the extent of the deviation between the Money Market Portfolio's amortized cost per share and its market-based net asset value per share may result in material dilution or other unfair results to shareholders, the Board will cause the Portfolio to take such action as it deems appropriate to eliminate or reduce to the extent practicable such dilution or unfair results, including, but not limited to, considering suspending redemption of shares and liquidating the Portfolio under Rule 22e-3 under the Investment Company Act.
If the Trustees determine that it is no longer in the best interests of the Money Market Portfolio and its shareholders to maintain a stable price of $1.00 per share or if the Trustees believe that maintaining such price no longer reflects a market-based net asset value per share, the Board has the right to change from an amortized cost basis of valuation to valuation based on market quotations. The Fund will notify shareholders of the Portfolio of any such change.
60
In the calculation of a Portfolio's net asset value (other than the Money Market Portfolio): (1) an equity portfolio security listed or traded on an exchange is valued at its latest reported sales price (or at the exchange official closing price if such exchange reports an official closing price), and if there were no sales on a given day, the security is valued at the mean between the last reported bid and asked prices; and (2) all other equity portfolio securities for which OTC market quotations are readily available are valued at the mean between the last reported bid and asked prices. In cases where a security is traded on more than one exchange, the security is valued on the exchange designated as the primary market. When market quotations are not readily available, including circumstances under which it is determined by the Adviser (or if applicable, the Sub-Advisers) that the closing price, last sale price or the mean between the last reported bid and asked prices are not reflective of a security's market value, portfolio securities are valued at their fair value as determined in good faith under procedures established by and under the general supervision of the Fund's Board. For valuation purposes, quotations of foreign portfolio securities, other assets and liabilities and forward contracts stated in foreign currency are translated into U.S. dollar equivalents at the prevailing market rates prior to the close of the NYSE.
Short-term debt securities with remaining maturities of 60 days or less at the time of purchase may be valued at amortized cost, unless the Adviser determines such valuation does not reflect the securities' market value, in which case these securities will be valued at their fair market value as determined by the Adviser.
Certain of the Portfolios' securities (other than securities of the Money Market Portfolio) may be valued by an outside pricing service approved by the Fund's Board. The pricing service may utilize a matrix system or other model incorporating attributes such as security quality, maturity and coupon as the evaluation model parameters, and/or research evaluations by its staff, including review of broker-dealer market price quotations in determining what it believes is the fair valuation of the portfolio securities valued by such pricing service.
Listed options are valued at the last reported sales price on the exchange on which they are listed (or at the exchange official closing price if such exchange reports an official closing price). If an official closing price or last reported sale price is unavailable, the listed option should be fair valued at the mean between its latest bid and ask prices. If an exchange closing price or bid and asked prices are not available from the exchange, then the quotes from one or more brokers or dealers may be used. Unlisted options and swaps are valued by an outside pricing service approved by the Board or quotes from a broker or dealer. Unlisted options and swaps cleared on a clearinghouse or exchange may be valued using the closing price provided by the clearinghouse or exchange. Futures are valued at the settlement price on the exchange on which they trade or, if a settlement price is unavailable, then at the last sale price on the exchange.
If the Adviser (or if applicable, the Sub-Advisers) determine that the valuation received from the outside pricing service or broker or dealer is not reflective of the security's market value, such security is valued at its fair value as determined in good faith under procedures established by and under the general supervision of the Board.
Generally, trading in foreign securities, as well as corporate bonds, U.S. government securities and money market instruments, is substantially completed each day at various times prior to the close of the NYSE. The values of such securities used in computing the net asset value of a Portfolio's shares are determined as of such times. Foreign currency exchange rates are also generally determined prior to the close of the NYSE. Occasionally, events which may affect the values of such securities and such exchange rates may occur between the times at which they are determined and the close of the NYSE. If events that may affect the value of such securities occur during such period, then these securities may be valued at their fair value as determined in good faith under procedures established by and under the supervision of the Board.
IX. TAXATION OF THE PORTFOLIOS AND SHAREHOLDERS
The following is only a summary of certain federal income and excise tax considerations generally affecting the Portfolios and their shareholders. No attempt is made to present a detailed explanation of the tax treatment of the Portfolios or their shareholders, and the discussion here is not intended as a
61
substitute for careful tax planning. Shareholders are urged to consult their tax advisors with specific reference to their own tax situations, including their state and local tax liabilities.
The following general discussion of certain federal income and excise tax consequences is based on the Code, and the regulations issued thereunder as in effect on the date of this SAI. New legislation, as well as administrative changes or court decisions, may significantly change the conclusions expressed herein, and may have a retroactive effect with respect to the transactions contemplated herein.
Each Portfolio within the Fund is generally treated as a separate corporation for federal income tax purposes, and thus the provisions of the Code generally will be applied to each Portfolio separately, rather than to the Fund as a whole.
Federal Income Tax Treatment of Shareholders
Shares of the Portfolios will be purchased by life insurance companies for their separate accounts under variable annuity contracts and variable life insurance policies and by other entities under qualified pension and retirement plans. Under the provisions of the Code currently in effect, net income and net realized capital gains of Portfolios of the Fund are not currently taxable when distributed to and left to accumulate within a variable annuity contract or variable life insurance policy or under a qualified pension or retirement plan.
Section 817(h) of the Code provides that the investments of a separate account underlying a variable insurance contract (or the investments of a mutual fund, the shares of which are owned by the variable separate account) must be "adequately diversified" in order for the contract to be treated as an annuity or as life insurance for federal income tax purposes. The Treasury Department has issued regulations explaining these diversification requirements. Each Portfolio intends to continue to comply with such requirements.
For information on federal income taxation of a life insurance company with respect to its receipt of distributions from the Fund and federal income taxation of owners of the company's variable annuity contracts or variable life insurance policies, refer to the life insurance company's variable annuity contract or variable life insurance policy prospectus.
Qualification as a Regulated Investment Company
The Fund intends that each of its Portfolios elect and qualify to be treated for each taxable year as a regulated investment company ("RIC") under Subchapter M of the Code. Qualification as a regulated investment company requires, among other things, that (a) at least 90% of the Fund's annual gross income be derived from interest, dividends, payments with respect to certain securities loans, gains from the sale or other disposition of securities or options thereon or foreign currencies, or other income derived with respect to its business of investing in such securities or currencies; and (b) the Fund diversify its holdings so that, at the end of each quarter of the taxable year (i) at least 50% of the value of the Fund's assets is represented by cash, U.S. government securities, securities of other regulated investment companies and other securities limited in respect of any one issuer to an amount not greater than 5% of the value of the Fund's assets and not more than 10% of the outstanding voting securities of such issuer, and (ii) not more than 25% of the value of the Fund's assets is invested in the securities of any one issuer (other than U.S. government securities and securities of other regulated investment companies), in two or more issuers that are controlled by the Fund and that are engaged in the same or similar trades or business or related trades or businesses. It is anticipated that any net gain realized from the closing out of futures contracts will be considered gain from the sale of securities and therefore be qualifying income for purposes of the 90% gross income requirement described above. Net income derived from an interest in a "qualified publicly traded partnership," as defined in the Code, will be treated as qualifying income for purposes of the 90% gross income requirement. For the purposes of the diversification requirements in clause (ii) above, the outstanding voting securities of any issuer includes the equity securities of a qualified publicly traded partnership. In addition, no more than 25% of the value of a regulated investment company's total assets may be invested in the securities of one or more qualified publicly traded partnerships.
For purposes of the 90% of gross income requirement described above, the Code expressly provides the U.S. Treasury with authority to issue regulations that would exclude foreign currency gains from qualifying income if such gains are not directly related to a Portfolio's business of investing in stock or securities. While to date the U.S. Treasury has not exercised this regulatory authority, there can be no
62
assurance that it will not issue regulations in the future (possibly with retroactive application) that would treat some or all of a Portfolio's foreign currency gains as non-qualifying income. For purposes of the diversification requirement described above, a Portfolio will not be treated as in violation of such requirement as a result of a discrepancy between the value of its various investments and the diversification percentages described above, unless such discrepancy exists immediately following the acquisition of any security or other property and is wholly or partly the result of such acquisition. Moreover, even in the event of noncompliance with the diversification requirement as of the end of any given quarter, a Portfolio is permitted to cure the violation by eliminating the discrepancy causing such noncompliance within a period of 30 days from the close of the relevant quarter.
In addition to the requirements described above, in order to qualify as a RIC, each Portfolio must distribute at least 90% of each Portfolio's net investment company taxable income (that generally includes dividends, taxable interest, currency gains, and the excess of net short-term capital gains over net long-term capital losses less operating expenses) and at least 90% of its net tax-exempt interest income, if any, to shareholders (the "Distribution Requirement"). If a Portfolio meets all of the RIC requirements, it will not be subject to federal income tax on any of its net investment income or net realized capital gains that it distributes to shareholders.
Although each Portfolio intends to distribute all or substantially all of its net investment income and may distribute its net realized capital gains for any taxable year, a Portfolio will be subject to federal income taxation to the extent any such income or gains are not distributed.
Some of the Portfolios may make investments that cause the Portfolios to recognize income or gain prior to receiving cash with respect to such investments. For example, in the event that the Portfolios invest in securities (such as STRIPS) that bear "original issue discount" or "acquisition discount" (collectively, "OID Securities"), they will be deemed to have received interest income even though no cash payments have been received. Accordingly, such investments may not produce sufficient current cash receipts to match the amount of net investment income a Portfolio must distribute to satisfy the Distribution Requirement. In some cases, a Portfolio may have to borrow money or dispose of other investments in order to make sufficient cash distributions to satisfy the Distribution Requirement.
If a Portfolio fails to qualify for any taxable year as a RIC, all of its taxable income will be subject to tax at regular corporate income tax rates without any deduction for distributions to shareholders.
Positions held by a Portfolio in certain regulated futures contracts and foreign currency contracts ("Section 1256 Contracts") will generally be marked-to-market (i.e., treated as though sold for fair market value) on the last business day of the Portfolio's taxable year and all gain or loss associated with such transactions (except certain currency gains covered by Section 988 of the Code) will generally be treated as 60% long-term capital gain or loss and 40% short-term capital gain or loss. The effect of the Section 1256 mark-to-market rules may be to accelerate income or to convert what otherwise would have been long-term capital gain into short-term capital gain or short-term capital losses into long-term capital losses within a Portfolio. The acceleration of income on Section 1256 Contracts may require a Portfolio to accrue taxable income without a corresponding receipt of cash. In order to generate enough cash to satisfy the Distribution Requirement, a Portfolio may be required to dispose of portfolio securities that it otherwise would have continued to hold or to use cash flows from other sources. Any or all of these rules may, therefore, affect the amount, character or timing of income earned and, in turn, affect the application of the Distribution Requirement to a particular Portfolio.
Short sales engaged in by a Portfolio may reduce the holding period of property held by a Portfolio which is substantially identical to the property sold short. This rule may have the effect of converting capital gains recognized by the Portfolio from long-term to short-term as well as converting capital losses recognized by the Portfolio from short-term to long-term.
Federal Excise Tax
No Portfolio will be subject to the 4% excise tax normally imposed on RICs that do not distribute substantially all of their income and gains each calendar year, because that tax does not apply to a RIC whose only shareholders are segregated asset accounts of life insurance companies held in connection
63
with variable annuity accounts and/or variable life insurance policies and certain trusts under qualified pension and retirement plans.
Certain Tax Information Reporting Considerations
Because of the nature of the rules governing how REITs report their income and the timing of REITs' issuing year-end tax information, a Portfolio that invests in REITs may need to estimate the character of distributions paid to its shareholders from REIT distributions. In addition, after the calendar year-end, REITs may recharacterize the nature of the distributions paid during that year, with the result that distributions previously identified as ordinary income are recharacterized as return of capital and/or capital gain. As a result, the composition of a Portfolio's distributions as reported initially may differ from the final composition determined after calendar year-end and reported to a Portfolio's shareholders on their year-end tax information statements.
Foreign Income Taxes
Each Portfolio that invests in foreign securities may be subject to foreign withholding taxes with respect to its dividend and interest income from foreign countries, thus reducing the net amount available for distribution to a Portfolio's shareholders. The United States has entered into tax treaties with many foreign countries that may entitle a Portfolio to a reduced rate of, or exemption from, taxes on such income. It is impossible to determine the effective rate of foreign tax in advance because the amount of a Portfolio's assets to be invested within various countries is not known.
State and Local Tax Considerations
Rules of U.S. state and local taxation of dividend and capital gains distributions from regulated investment companies often differ from the rules for U.S. federal income taxation described above. Shareholders are urged to consult their tax advisers as to the consequences of these and other U.S. state and local tax rules regarding an investment in a Portfolio.
X. UNDERWRITERS
The Portfolios' shares are offered on a continuous basis. The Distributor, as the principal underwriter of the shares, has certain obligations under the Distribution Agreement concerning the distribution of the shares. These obligations and the compensation the Distributor receives are described above in the sections titled "Principal Underwriter" and "Rule 12b-1 Plan."
XI. PERFORMANCE DATA
The current yield of the Money Market Portfolio for the seven days ended December 31, 2012 was 0.01% for Class X shares and 0.01% for Class Y shares. The seven day effective yield on December 31, 2012 was 0.01% for Class X shares and 0.01% for Class Y shares, assuming daily compounding.
For the 30-day period ended December 31, 2012, the yield of the Limited Duration Portfolio was 0.11% for Class X shares and –0.14% for Class Y shares; and the yield of the Income Plus Portfolio was 3.31% for Class X shares and 3.05% for Class Y shares.
64
The average annual total returns of the Class X and Class Y shares of each Portfolio for the one year, five year and ten year periods ended December 31, 2012 and/or for the period from the date of commencement of the Portfolio's operations or from the date the shares of the Class were first offered through December 31, 2012, if shorter or longer than any of the foregoing were as follows:
Class X Shares
Name of Portfolio: | | Date of Inception | | Total Return for
Fiscal Year Ended
December 31, 2012 | | Average Annual
Total Return for
Five Years Ended
December 31, 2012 | | Average Annual
Total Return for
Ten Years Ended
December 31, 2012 | | Average Annual
Total Return for
Period from
Commencement
of Operations
through
December 31, 2012 | |
Money Market | | 03/09/84 | | | 0.01 | % | | | 0.50 | % | | | 1.62 | % | | | 4.19 | % | |
Limited Duration | | 05/04/99 | | | 3.34 | % | | | –0.44 | % | | | 1.04 | % | | | 2.07 | % | |
Income Plus | | 03/01/87 | | | 14.09 | % | | | 7.89 | % | | | 6.80 | % | | | 7.52 | % | |
Global Infrastructure | | 03/01/90 | | | 18.69 | % | | | 3.23 | % | | | 10.66 | % | | | 8.18 | % | |
European Equity | | 03/01/91 | | | 18.51 | % | | | –3.42 | % | | | 7.18 | % | | | 8.56 | % | |
Multi Cap Growth | | 03/09/84 | | | 12.37 | % | | | 3.74 | % | | | 9.21 | % | | | 10.77 | % | |
Class Y Shares
Name of Portfolio: | | Date of Inception
or First Offering
of Shares
of the Class | | Total Return for
Fiscal Year Ended
December 31, 2012 | | Average Annual
Total Return for
Five Years Ended
December 31, 2012 | | Average Annual
Total Return for
Ten Years Ended
December 31, 2012 | | Average Annual
Total Return for
Period from First
Offering of
Class Y Shares
through
December 31, 2012 | |
Money Market | | 06/05/00 | | | 0.01 | % | | | 0.44 | % | | | 1.47 | % | | | 1.81 | % | |
Limited Duration | | 06/05/00 | | | 3.05 | % | | | –0.69 | % | | | 0.79 | % | | | 1.74 | % | |
Income Plus | | 06/05/00 | | | 13.82 | % | | | 7.63 | % | | | 6.53 | % | | | 7.02 | % | |
Global Infrastructure | | 06/05/00 | | | 18.44 | % | | | 2.98 | % | | | 10.40 | % | | | 3.61 | % | |
European Equity | | 06/05/00 | | | 18.16 | % | | | –3.66 | % | | | 6.90 | % | | | 1.21 | % | |
Multi Cap Growth | | 06/05/00 | | | 12.09 | % | | | 3.48 | % | | | 8.94 | % | | | 2.08 | % | |
The total returns of the Class X and Class Y shares of each Portfolio for the one year, five year and ten year periods ended December 31, 2012 and/or for the period from the date of commencement of the Portfolio's operations or from the date the shares of the Class were first offered through December 31, 2012, if shorter or longer than any of the foregoing were as follows:
Class X Shares
Name of Portfolio: | | Date of Inception | | Total Return for
Fiscal Year Ended
December 31, 2012 | | Total Return for
Five Years Ended
December 31, 2012 | | Total Return for
Ten Years Ended
December 31, 2012 | | Total Return for
Period from
Commencement
of Operations
through
December 31, 2012 | |
Money Market | | 03/09/84 | | | 0.01 | % | | | 2.51 | % | | | 17.45 | % | | | 226.47 | % | |
Limited Duration | | 05/04/99 | | | 3.34 | % | | | –2.19 | % | | | 10.90 | % | | | 32.38 | % | |
Income Plus | | 03/01/87 | | | 14.09 | % | | | 46.15 | % | | | 93.05 | % | | | 550.72 | % | |
Global Infrastructure | | 03/01/90 | | | 18.69 | % | | | 17.23 | % | | | 175.43 | % | | | 502.22 | % | |
European Equity | | 03/01/91 | | | 18.51 | % | | | –15.97 | % | | | 99.98 | % | | | 501.51 | % | |
Multi Cap Growth | | 03/09/84 | | | 12.37 | % | | | 20.13 | % | | | 141.28 | % | | | 1,806.31 | % | |
65
Class Y Shares
Name of Portfolio: | | Date of Inception
or First Offering
of Shares
of the Class | | Total Return for
Fiscal Year Ended
December 31, 2012 | | Total Return for
Five Years Ended
December 31, 2012 | | Total Return for
Ten Years Ended
December 31, 2012 | | Total Return for
Period from First
Offering of
Class Y Shares
through
December 31, 2012 | |
Money Market | | 06/05/00 | | | 0.01 | % | | | 2.24 | % | | | 15.69 | % | | | 25.33 | % | |
Limited Duration | | 06/05/00 | | | 3.05 | % | | | –3.42 | % | | | 8.17 | % | | | 24.14 | % | |
Income Plus | | 06/05/00 | | | 13.82 | % | | | 44.41 | % | | | 88.29 | % | | | 134.69 | % | |
Global Infrastructure | | 06/05/00 | | | 18.44 | % | | | 15.80 | % | | | 168.90 | % | | | 56.27 | % | |
European Equity | | 06/05/00 | | | 18.16 | % | | | –17.03 | % | | | 94.97 | % | | | 16.30 | % | |
Multi Cap Growth | | 06/05/00 | | | 12.09 | % | | | 18.64 | % | | | 135.46 | % | | | 29.51 | % | |
XII. FINANCIAL STATEMENTS
The Fund's audited financial statements for the fiscal year ended December 31, 2012, including notes thereto, and the report of Ernst & Young LLP, an independent registered public accounting firm, are herein incorporated by reference to the Fund's Annual Report to Shareholders. A copy of the Fund's Annual Report to Shareholders must accompany the delivery of this SAI.
XIII. FUND COUNSEL
Dechert LLP, located at 1095 Avenue of the Americas, New York, NY 10036, acts as the Fund's legal counsel.
*****
This SAI and each of the Class X and Class Y Prospectuses do not contain all of the information set forth in the Registration Statement the Fund has filed with the SEC. The complete Registration Statement may be obtained from the SEC.
66
Appendix A
MORGAN STANLEY INVESTMENT MANAGEMENT
PROXY VOTING POLICY AND PROCEDURES
I. POLICY STATEMENT
Morgan Stanley Investment Management's ("MSIM") policy and procedures for voting proxies ("Policy") with respect to securities held in the accounts of clients applies to those MSIM entities that provide discretionary investment management services and for which an MSIM entity has authority to vote proxies. This Policy is reviewed and updated as necessary to address new and evolving proxy voting issues and standards.
The MSIM entities covered by this Policy currently include the following: Morgan Stanley AIP GP LP, Morgan Stanley Investment Management Inc., Morgan Stanley Investment Management Limited, Morgan Stanley Investment Management Company, Morgan Stanley Asset & Investment Trust Management Co., Limited, Morgan Stanley Investment Management Private Limited and Private Investment Partners Inc. (each an "MSIM Affiliate" and collectively referred to as the "MSIM Affiliates" or as "we" below).
Each MSIM Affiliate will use its best efforts to vote proxies as part of its authority to manage, acquire and dispose of account assets. With respect to the MSIM registered management investment companies (the "MSIM Funds"), each MSIM Affiliate will vote proxies under this Policy pursuant to authority granted under its applicable investment advisory agreement or, in the absence of such authority, as authorized by the Board of Directors/Trustees of the MSIM Funds. A MSIM Affiliate will not vote proxies unless the investment management or investment advisory agreement explicitly authorizes the MSIM Affiliate to vote proxies. MSIM Affiliates will vote proxies in a prudent and diligent manner and in the best interests of clients, including beneficiaries of and participants in a client's benefit plan(s) for which the MSIM Affiliates manage assets, consistent with the objective of maximizing long-term investment returns ("Client Proxy Standard"). In certain situations, a client or its fiduciary may provide an MSIM Affiliate with a proxy voting policy. In these situations, the MSIM Affiliate will comply with the client's policy.
Proxy Research Services — ISS Governance Services ("ISS") and Glass Lewis (together with other proxy research providers as we may retain from time to time, the "Research Providers") are independent advisers that specialize in providing a variety of fiduciary-level proxy-related services to institutional investment managers, plan sponsors, custodians, consultants, and other institutional investors. The services provided include in-depth research, global issuer analysis, and voting recommendations. While we may review and utilize the recommendations of one or more Research Providers in making proxy voting decisions, we are in no way obligated to follow such recommendations. In addition to research, ISS provides vote execution, reporting, and recordkeeping services.
Voting Proxies for Certain Non-U.S. Companies — Voting proxies of companies located in some jurisdictions may involve several problems that can restrict or prevent the ability to vote such proxies or entail significant costs. These problems include, but are not limited to: (i) proxy statements and ballots being written in a language other than English; (ii) untimely and/or inadequate notice of shareholder meetings; (iii) restrictions on the ability of holders outside the issuer's jurisdiction of organization to exercise votes; (iv) requirements to vote proxies in person; (v) the imposition of restrictions on the sale of the securities for a period of time in proximity to the shareholder meeting; and (vi) requirements to provide local agents with power of attorney to facilitate our voting instructions. As a result, we vote clients' non-U.S. proxies on a best efforts basis only, after weighing the costs and benefits of voting such proxies, consistent with the Client Proxy Standard. ISS has been retained to provide assistance in connection with voting non-U.S. proxies.
II. GENERAL PROXY VOTING GUIDELINES
To promote consistency in voting proxies on behalf of its clients, we follow this Policy (subject to any exception set forth herein). The Policy addresses a broad range of issues, and provides general voting parameters on proposals that arise most frequently. However, details of specific proposals vary, and those
A-1
details affect particular voting decisions, as do factors specific to a given company. Pursuant to the procedures set forth herein, we may vote in a manner that is not in accordance with the following general guidelines, provided the vote is approved by the Proxy Review Committee (see Section III for description) and is consistent with the Client Proxy Standard. Morgan Stanley AIP GP LP will follow the procedures as described in Appendix A.
We endeavor to integrate governance and proxy voting policy with investment goals, using the vote to encourage portfolio companies to enhance long-term shareholder value and to provide a high standard of transparency such that equity markets can value corporate assets appropriately.
We seek to follow the Client Proxy Standard for each client. At times, this may result in split votes, for example when different clients have varying economic interests in the outcome of a particular voting matter (such as a case in which varied ownership interests in two companies involved in a merger results in different stakes in the outcome). We also may split votes at times based on differing views of portfolio managers.
We may abstain on matters for which disclosure is inadequate.
A. Routine Matters.
We generally support routine management proposals. The following are examples of routine management proposals:
• Approval of financial statements and auditor reports if delivered with an unqualified auditor's opinion.
• General updating/corrective amendments to the charter, articles of association or bylaws, unless we believe that such amendments would diminish shareholder rights.
• Most proposals related to the conduct of the annual meeting, with the following exceptions. We generally oppose proposals that relate to "the transaction of such other business which may come before the meeting," and open-ended requests for adjournment. However, where management specifically states the reason for requesting an adjournment and the requested adjournment would facilitate passage of a proposal that would otherwise be supported under this Policy (i.e. an uncontested corporate transaction), the adjournment request will be supported.
We generally support shareholder proposals advocating confidential voting procedures and independent tabulation of voting results.
B. Board of Directors.
1. Election of directors: Votes on board nominees can involve balancing a variety of considerations. In vote decisions, we may take into consideration whether the company has a majority voting policy in place that we believe makes the director vote more meaningful. In the absence of a proxy contest, we generally support the board's nominees for director except as follows:
a. We consider withholding support from or voting against a nominee if we believe a direct conflict exists between the interests of the nominee and the public shareholders, including failure to meet fiduciary standards of care and/or loyalty. We may oppose directors where we conclude that actions of directors are unlawful, unethical or negligent. We consider opposing individual board members or an entire slate if we believe the board is entrenched and/or dealing inadequately with performance problems; if we believe the board is acting with insufficient independence between the board and management; or if we believe the board has not been sufficiently forthcoming with information on key governance or other material matters.
b. We consider witholding support from or voting against interested directors if the company's board does not meet market standards for director independence, or if otherwise we believe board independence is insufficient. We refer to prevalent market standards as promulgated by a stock exchange or other authority within a given market (e.g., New York Stock Exchange or Nasdaq rules for most U.S. companies, and The Combined Code on Corporate Governance in the United Kingdom). Thus, for an NYSE company with no controlling shareholder, we would expect that at a minimum a majority of directors should be independent as defined by NYSE. Where we view market standards as inadequate, we may withhold votes based on stronger
A-2
independence standards. Market standards notwithstanding, we generally do not view long board tenure alone as a basis to classify a director as non-independent.
i. At a company with a shareholder or group that controls the company by virtue of a majority economic interest in the company, we have a reduced expectation for board independence, although we believe the presence of independent directors can be helpful, particularly in staffing the audit committee, and at times we may withhold support from or vote against a nominee on the view the board or its committees are not sufficiently independent. In markets where board independence is not the norm (e.g. Japan), however, we consider factors including whether a board of a controlled company includes independent members who can be expected to look out for interests of minority holders.
ii. We consider withholding support from or voting against a nominee if he or she is affiliated with a major shareholder that has representation on a board disproportionate to its economic interest.
c. Depending on market standards, we consider withholding support from or voting against a nominee who is interested and who is standing for election as a member of the company's compensation/renumeration, nominating/governance or audit committee.
d. We consider withholding support or voting against nominees if the term for which they are nominated is excessive. We consider this issue on a market-specific basis.
e. We consider withholding support from or voting against nominees if, in our view, there has been insufficient board renewal (turnover), particularly in the context of extended poor company performance.
f. We consider withholding support from or voting against a nominee standing for election if the board has not taken action to implement generally accepted governance practices for which there is a "bright line" test. For example, in the context of the U.S. market, failure to eliminate a dead hand or slow hand poison pill would be seen as a basis for opposing one or more incumbent nominees.
g. In markets that encourage designated audit committee financial experts, we consider voting against members of an audit committee if no members are designated as such. We also consider voting against the audit committee members if the company has faced financial reporting issues and/or does not put the auditor up for ratification by shareholders.
h. We believe investors should have the ability to vote on individual nominees, and may abstain or vote against a slate of nominees where we are not given the opportunity to vote on individual nominees.
i. We consider withholding support from or voting against a nominee who has failed to attend at least 75% of the nominee's board and board committee meetings within a given year without a reasonable excuse. We also consider opposing nominees if the company does not meet market standards for disclosure on attendance.
j. We consider withholding support from or voting against a nominee who appears overcommitted, particularly through service on an excessive number of boards. Market expectations are incorporated into this analysis; for U.S. boards, we generally oppose election of a nominee who serves on more than six public company boards (excluding investment companies), although we may reference National Association of Corporate Directors guidance suggesting that public company CEOs, for example, should serve no more than two outside boards given the level of time commitment required in their primary job.
2. Discharge of directors' duties: In markets where an annual discharge of directors' responsibility is a routine agenda item, we generally support such discharge. However, we may vote against discharge or abstain from voting where there are serious findings of fraud or other unethical behavior for which the individual bears responsibility. The annual discharge of responsibility represents shareholder approval of disclosed actions taken by the board during the year and may make future shareholder action against the board difficult to pursue.
A-3
3. Board independence: We generally support U.S. shareholder proposals requiring that a certain percentage (up to 662/3%) of the company's board members be independent directors, and promoting all-independent audit, compensation and nominating/governance committees.
4. Board diversity: We consider on a case-by-case basis shareholder proposals urging diversity of board membership with respect to social, religious or ethnic group.
5. Majority voting: We generally support proposals requesting or requiring majority voting policies in election of directors, so long as there is a carve-out for plurality voting in the case of contested elections.
6. Proxy access: We consider on a case-by-case basis shareholder proposals on particular procedures for inclusion of shareholder nominees in company proxy statements.
7. Reimbursement for dissident nominees: We generally support well-crafted U.S. shareholder proposals that would provide for reimbursement of dissident nominees elected to a board, as the cost to shareholders in electing such nominees can be factored into the voting decision on those nominees.
8. Proposals to elect directors more frequently: In the U.S. public company context, we usually support shareholder and management proposals to elect all directors annually (to "declassify" the board), although we make an exception to this policy where we believe that long-term shareholder value may be harmed by this change given particular circumstances at the company at the time of the vote on such proposal. As indicated above, outside the U.S., we generally support greater accountability to shareholders that comes through more frequent director elections, but recognize that many markets embrace longer term lengths, sometimes for valid reasons given other aspects of the legal context in electing boards.
9. Cumulative voting: We generally support proposals to eliminate cumulative voting in the U.S. market context. (Cumulative voting provides that shareholders may concentrate their votes for one or a handful of candidates, a system that can enable a minority bloc to place representation on a board.) U.S. proposals to establish cumulative voting in the election of directors generally will not be supported.
10. Separation of Chairman and CEO positions: We vote on shareholder proposals to separate the Chairman and CEO positions and/or to appoint an independent Chairman based in part on prevailing practice in particular markets, since the context for such a practice varies. In many non-U.S. markets, we view separation of the roles as a market standard practice, and support division of the roles in that context. In the U.S., we consider such proposals on a case-by-case basis, considering, among other things, the existing board leadership structure, company performance, and any other evidence of entrenchment or perceived risk that power is overly concentrated in a single individual.
11. Director retirement age and term limits: Proposals setting or recommending director retirement ages or director term limits are voted on a case-by-case basis that includes consideration of company performance, the rate of board renewal, evidence of effective individual director evaluation processes, and any indications of entrenchment.
12. Proposals to limit directors' liability and/or broaden indemnification of officers and directors. Generally, we will support such proposals provided that an individual is eligible only if he or she has not acted in bad faith, with gross negligence or with reckless disregard of his or her duties.
C. Statutory Auditor Boards.
The statutory auditor board, which is separate from the main board of directors, plays a role in corporate governance in several markets. These boards are elected by shareholders to provide assurance on compliance with legal and accounting standards and the company's articles of association. We generally vote for statutory auditor nominees if they meet independence standards. In markets that require disclosure on attendance by internal statutory auditors, however, we consider voting against nominees for these positions who failed to attend at least 75% of meetings in the previous year. We also consider opposing nominees if the company does not meet market standards for disclosure on attendance.
A-4
D. Corporate Transactions and Proxy Fights.
We examine proposals relating to mergers, acquisitions and other special corporate transactions (i.e., takeovers, spin-offs, sales of assets, reorganizations, restructurings and recapitalizations) on a case-by-case basis in the interests of each fund or other account. Proposals for mergers or other significant transactions that are friendly and approved by the Research Providers usually are supported if there is no portfolio manager objection. We also analyze proxy contests on a case-by-case basis.
E. Changes in Capital Structure.
1. We generally support the following:
• Management and shareholder proposals aimed at eliminating unequal voting rights, assuming fair economic treatment of classes of shares we hold.
• U.S. management proposals to increase the authorization of existing classes of common stock (or securities convertible into common stock) if: (i) a clear business purpose is stated that we can support and the number of shares requested is reasonable in relation to the purpose for which authorization is requested; and/or (ii) the authorization does not exceed 100% of shares currently authorized and at least 30% of the total new authorization will be outstanding. (We consider proposals that do not meet these criteria on a case-by-case basis.)
• U.S. management proposals to create a new class of preferred stock or for issuances of preferred stock up to 50% of issued capital, unless we have concerns about use of the authority for anti-takeover purposes.
• Proposals in non-U.S. markets that in our view appropriately limit potential dilution of existing shareholders. A major consideration is whether existing shareholders would have preemptive rights for any issuance under a proposal for standing share issuance authority. We generally consider market-specific guidance in making these decisions; for example, in the U.K. market, we usually follow Association of British Insurers' ("ABI") guidance, although company-specific factors may be considered and for example, may sometimes lead us to voting against share authorization proposals even if they meet ABI guidance.
• Management proposals to authorize share repurchase plans, except in some cases in which we believe there are insufficient protections against use of an authorization for anti-takeover purposes.
• Management proposals to reduce the number of authorized shares of common or preferred stock, or to eliminate classes of preferred stock.
• Management proposals to effect stock splits.
• Management proposals to effect reverse stock splits if management proportionately reduces the authorized share amount set forth in the corporate charter. Reverse stock splits that do not adjust proportionately to the authorized share amount generally will be approved if the resulting increase in authorized shares coincides with the proxy guidelines set forth above for common stock increases.
• Management dividend payout proposals, except where we perceive company payouts to shareholders as inadequate.
2. We generally oppose the following (notwithstanding management support):
• Proposals to add classes of stock that would substantially dilute the voting interests of existing shareholders.
• Proposals to increase the authorized or issued number of shares of existing classes of stock that are unreasonably dilutive, particularly if there are no preemptive rights for existing shareholders. However, depending on market practices, we consider voting for proposals giving general authorization for issuance of shares not subject to pre-emptive rights if the authority is limited.
• Proposals that authorize share issuance at a discount to market rates, except where authority for such issuance is de minimis, or if there is a special situation that we believe justifies such
A-5
authorization (as may be the case, for example, at a company under severe stress and risk of bankruptcy).
• Proposals relating to changes in capitalization by 100% or more.
We consider on a case-by-case basis shareholder proposals to increase dividend payout ratios, in light of market practice and perceived market weaknesses, as well as individual company payout history and current circumstances. For example, currently we perceive low payouts to shareholders as a concern at some Japanese companies, but may deem a low payout ratio as appropriate for a growth company making good use of its cash, notwithstanding the broader market concern.
F. Takeover Defenses and Shareholder Rights.
1. Shareholder rights plans: We generally support proposals to require shareholder approval or ratification of shareholder rights plans (poison pills). In voting on rights plans or similar takeover defenses, we consider on a case-by-case basis whether the company has demonstrated a need for the defense in the context of promoting long-term share value; whether provisions of the defense are in line with generally accepted governance principles in the market (and specifically the presence of an adequate qualified offer provision that would exempt offers meeting certain conditions from the pill); and the specific context if the proposal is made in the midst of a takeover bid or contest for control.
2. Supermajority voting requirements: We generally oppose requirements for supermajority votes to amend the charter or bylaws, unless the provisions protect minority shareholders where there is a large shareholder. In line with this view, in the absence of a large shareholder we support reasonable shareholder proposals to limit such supermajority voting requirements.
3. Shareholder right to call a special meeting: We consider proposals to enhance a shareholder's rights to call a special meeting on a case-by-case basis. At large-cap U.S. companies, we generally support efforts to establish the rights of holders of 10% or more of shares to call special meetings, unless the board or state law has a set policy or law establishing such rights at a threshold that we believe to be acceptable.
4. Written consent rights: In the U.S. context, we examine proposals for shareholder written consent rights on a case-by-case basis.
5. Reincorporation: We consider management and shareholder proposals to reincorporate to a different jurisdiction on a case-by-case basis. We oppose such proposals if we believe the main purpose is to take advantage of laws or judicial precedents that reduce shareholder rights.
6. Anti-greenmail provisions: Proposals relating to the adoption of anti-greenmail provisions will be supported, provided that the proposal: (i) defines greenmail; (ii) prohibits buyback offers to large block holders (holders of at least 1% of the outstanding shares and in certain cases, a greater amount) not made to all shareholders or not approved by disinterested shareholders; and (iii) contains no anti-takeover measures or other provisions restricting the rights of shareholders.
7. Bundled proposals: We may consider opposing or abstaining on proposals if disparate issues are "bundled" and presented for a single vote.
G. Auditors.
We generally support management proposals for selection or ratification of independent auditors. However, we may consider opposing such proposals with reference to incumbent audit firms if the company has suffered from serious accounting irregularities and we believe rotation of the audit firm is appropriate, or if fees paid to the auditor for non-audit-related services are excessive. Generally, to determine if non-audit fees are excessive, a 50% test will be applied (i.e., non-audit-related fees should be less than 50% of the total fees paid to the auditor). We generally vote against proposals to indemnify auditors.
A-6
H. Executive and Director Remuneration.
1. We generally support the following:
• Proposals for employee equity compensation plans and other employee ownership plans, provided that our research does not indicate that approval of the plan would be against shareholder interest. Such approval may be against shareholder interest if it authorizes excessive dilution and shareholder cost, particularly in the context of high usage ("run rate") of equity compensation in the recent past; or if there are objectionable plan design and provision.
• Proposals relating to fees to outside directors, provided the amounts are not excessive relative to other companies in the country or industry, and provided that the structure is appropriate within the market context. While stock-based compensation to outside directors is positive if moderate and appropriately structured, we are wary of significant stock option awards or other performance-based awards for outside directors, as well as provisions that could result in significant forfeiture of value on a director's decision to resign from a board (such forfeiture can undercut director independence).
• Proposals for employee stock purchase plans that permit discounts, but only for grants that are part of a broad-based employee plan, including all non-executive employees, and only if the discounts are limited to a reasonable market standard or less.
• Proposals for the establishment of employee retirement and severance plans, provided that our research does not indicate that approval of the plan would be against shareholder interest.
2. We generally oppose retirement plans and bonuses for non-executive directors and independent statutory auditors.
3. In the U.S. context, we generally vote against shareholder proposals requiring shareholder approval of all severance agreements, but proposals that require shareholder approval for agreements in excess of three times the annual compensation (salary and bonus) generally will be supported. We generally oppose shareholder proposals that would establish arbitrary caps on pay. We consider on a case-by-case basis shareholder proposals that seek to limit Supplemental Executive Retirement Plans (SERPs), but support such proposals where we consider SERPs to be excessive.
4. Shareholder proposals advocating stronger and/or particular pay-for-performance models will be evaluated on a case-by-case basis, with consideration of the merits of the individual proposal within the context of the particular company and its labor markets, and the company's current and past practices. While we generally support emphasis on long-term components of senior executive pay and strong linkage of pay to performance, we consider factors including whether a proposal may be overly prescriptive, and the impact of the proposal, if implemented as written, on recruitment and retention.
5. We generally support proposals advocating reasonable senior executive and director stock ownership guidelines and holding requirements for shares gained in executive equity compensation programs
6. We generally support shareholder proposals for reasonable "claw-back" provisions that provide for company recovery of senior executive bonuses to the extent they were based on achieving financial benchmarks that were not actually met in light of subsequent restatements.
7. Management proposals effectively to re-price stock options are considered on a case-by-case basis. Considerations include the company's reasons and justifications for a re-pricing, the company's competitive position, whether senior executives and outside directors are excluded, potential cost to shareholders, whether the re-pricing or share exchange is on a value-for-value basis, and whether vesting requirements are extended.
8. Say-on-Pay: We consider proposals relating to an advisory vote on remuneration on a case-by-case basis. Considerations include a review of the relationship between executive remuneration and performance based on operating trends and total shareholder return over multiple performance periods. In addition, we review remuneration structures and potential poor pay practices, including relative magnitude of pay, discretionary bonus awards, tax gross ups, change-in-control features, internal pay equity and peer group construction. As long-term investors, we support remuneration policies that align with long-term shareholder returns.
A-7
I. Social, Political and Environmental Issues.
Shareholders in the U.S. and certain other markets submit proposals encouraging changes in company disclosure and practices related to particular corporate, social, political and environmental matters. We consider how to vote on the proposals on a case-by-case basis to determine likely impacts on shareholder value. We seek to balance concerns on reputational and other risks that lie behind a proposal against costs of implementation, while considering appropriate shareholder and management prerogatives. We may abstain from voting on proposals that do not have a readily determinable financial impact on shareholder value. We support proposals that, if implemented, would enhance useful disclosure, but we generally vote against proposals requesting reports that we believe are duplicative, related to matters not material to the business, or that would impose unnecessary or excessive costs. We believe that certain social and environmental shareholder proposals may intrude excessively on management prerogatives, which can lead us to oppose them.
J. Fund of Funds.
Certain Funds advised by an MSIM Affiliate invest only in other MSIM Funds. If an underlying fund has a shareholder meeting, in order to avoid any potential conflict of interest, such proposals will be voted in the same proportion as the votes of the other shareholders of the underlying fund, unless otherwise determined by the Proxy Review Committee.
III. ADMINISTRATION OF POLICY
The MSIM Proxy Review Committee (the "Committee") has overall responsibility for the Policy. The Committee, which is appointed by MSIM's Long-Only Executive Committee, consists of investment professionals who represent the different investment disciplines and geographic locations of the firm, and is chaired by the director of the Corporate Governance Team ("CGT"). Because proxy voting is an investment responsibility and impacts shareholder value, and because of their knowledge of companies and markets, portfolio managers and other members of investment staff play a key role in proxy voting, although the Committee has final authority over proxy votes.
The CGT Director is responsible for identifying issues that require Committee deliberation or ratification. The CGT, working with advice of investment teams and the Committee, is responsible for voting on routine items and on matters that can be addressed in line with these Policy guidelines. The CGT has responsibility for voting case-by-case where guidelines and precedent provide adequate guidance.
The Committee will periodically review and have the authority to amend, as necessary, the Policy and establish and direct voting positions consistent with the Client Proxy Standard.
CGT and members of the Committee may take into account Research Providers' recommendations and research as well as any other relevant information they may request or receive, including portfolio manager and/or analyst comments and research, as applicable. Generally, proxies related to securities held in accounts that are managed pursuant to quantitative, index or index-like strategies ("Index Strategies") will be voted in the same manner as those held in actively managed accounts, unless economic interests of the accounts differ. Because accounts managed using Index Strategies are passively managed accounts, research from portfolio managers and/or analysts related to securities held in these accounts may not be available. If the affected securities are held only in accounts that are managed pursuant to Index Strategies, and the proxy relates to a matter that is not described in this Policy, the CGT will consider all available information from the Research Providers, and to the extent that the holdings are significant, from the portfolio managers and/or analysts.
A. Committee Procedures
The Committee meets at least quarterly and reviews and considers changes to the Policy at least annually. Through meetings and/or written communications, the Committee is responsible for monitoring and ratifying "split votes" (i.e., allowing certain shares of the same issuer that are the subject of the same proxy solicitation and held by one or more MSIM portfolios to be voted differently than other shares) and/or "override voting" (i.e., voting all MSIM portfolio shares in a manner contrary to the Policy). The Committee will review developing issues and approve upcoming votes, as appropriate, for matters as requested by CGT.
The Committee reserves the right to review voting decisions at any time and to make voting decisions as necessary to ensure the independence and integrity of the votes.
A-8
B. Material Conflicts of Interest
In addition to the procedures discussed above, if the CGT Director determines that an issue raises a material conflict of interest, the CGT Director may request a special committee to review, and recommend a course of action with respect to, the conflict(s) in question ("Special Committee").
A potential material conflict of interest could exist in the following situations, among others:
1. The issuer soliciting the vote is a client of MSIM or an affiliate of MSIM and the vote is on a matter that materially affects the issuer.
2. The proxy relates to Morgan Stanley common stock or any other security issued by Morgan Stanley or its affiliates except if echo voting is used, as with MSIM Funds, as described herein.
3. Morgan Stanley has a material pecuniary interest in the matter submitted for a vote (e.g., acting as a financial advisor to a party to a merger or acquisition for which Morgan Stanley will be paid a success fee if completed).
If the CGT Director determines that an issue raises a potential material conflict of interest, depending on the facts and circumstances, the issue will be addressed as follows:
1. If the matter relates to a topic that is discussed in this Policy, the proposal will be voted as per the Policy.
2. If the matter is not discussed in this Policy or the Policy indicates that the issue is to be decided case-by-case, the proposal will be voted in a manner consistent with the Research Providers, provided that all the Research Providers consulted have the same recommendation, no portfolio manager objects to that vote, and the vote is consistent with MSIM's Client Proxy Standard.
3. If the Research Providers' recommendations differ, the CGT Director will refer the matter to a Special Committee to vote on the proposal, as appropriate.
Any Special Committee shall be comprised of the CGT Director and at least two portfolio managers (preferably members of the Committee) as approved by the Committee. The CGT Director may request non-voting participation by MSIM's General Counsel or his/her designee and the Chief Compliance Officer or his/her designee. In addition to the research provided by Research Providers, the Special Committee may request analysis from MSIM Affiliate investment professionals and outside sources to the extent it deems appropriate.
C. Proxy Voting Reporting
The CGT will document in writing all Committee and Special Committee decisions and actions, which documentation will be maintained by the CGT for a period of at least six years. To the extent these decisions relate to a security held by an MSIM Fund, the CGT will report the decisions to each applicable Board of Trustees/Directors of those Funds at each Board's next regularly scheduled Board meeting. The report will contain information concerning decisions made during the most recently ended calendar quarter immediately preceding the Board meeting.
MSIM will promptly provide a copy of this Policy to any client requesting it. MSIM will also, upon client request, promptly provide a report indicating how each proxy was voted with respect to securities held in that client's account.
MSIM's Legal Department is responsible for filing an annual Form N-PX on behalf of each MSIM Fund for which such filing is required, indicating how all proxies were voted with respect to such Fund's holdings.
APPENDIX A
The following procedures apply to accounts managed by Morgan Stanley AIP GP LP and Private Investment Partners Inc. ("AIP").
Generally, AIP will follow the guidelines set forth in Section II of MSIM's Proxy Voting Policy and Procedures. To the extent that such guidelines do not provide specific direction, or AIP determines that consistent with the Client Proxy Standard, the guidelines should not be followed, the Proxy Review Committee has delegated the voting authority to vote securities held by accounts managed by AIP to the Fund of Hedge Funds investment team, the Private Equity Fund of Funds investment team or the Private
A-9
Equity Real Estate Fund of Funds investment team of AIP. A summary of decisions made by the investment teams will be made available to the Proxy Review Committee for its information at the next scheduled meeting of the Proxy Review Committee.
In certain cases, AIP may determine to abstain from determining (or recommending) how a proxy should be voted (and therefore abstain from voting such proxy or recommending how such proxy should be voted), such as where the expected cost of giving due consideration to the proxy does not justify the potential benefits to the affected account(s) that might result from adopting or rejecting (as the case may be) the measure in question.
Waiver of Voting Rights
For regulatory reasons, AIP may either 1) invest in a class of securities of an underlying fund (the "Fund") that does not provide for voting rights; or 2) waive 100% of its voting rights with respect to the following:
1. Any rights with respect to the removal or replacement of a director, general partner, managing member or other person acting in a similar capacity for or on behalf of the Fund (each individually a "Designated Person," and collectively, the "Designated Persons"), which may include, but are not limited to, voting on the election or removal of a Designated Person in the event of such Designated Person's death, disability, insolvency, bankruptcy, incapacity, or other event requiring a vote of interest holders of the Fund to remove or replace a Designated Person; and
2. Any rights in connection with a determination to renew, dissolve, liquidate, or otherwise terminate or continue the Fund, which may include, but are not limited to, voting on the renewal, dissolution, liquidation, termination or continuance of the Fund upon the occurrence of an event described in the Fund's organizational documents; provided, however, that, if the Fund's organizational documents require the consent of the Fund's general partner or manager, as the case may be, for any such termination or continuation of the Fund to be effective, then AIP may exercise its voting rights with respect to such matter.
Approved by Morgan Stanley Funds Board on September 27-28, 2011
A-10
APPENDIX B
DESCRIPTION OF RATINGS
I. Excerpts from Moody's Investors Service, Inc.'s Corporate Bond Ratings:
Aaa: Judged to be of the best quality; carry the smallest degree of investment risk;
Aa: judged to be of high quality by all standards;
A: possess many favorable investment attributes and are to be considered upper medium grade obligations;
Baa: considered as medium grade obligations; i.e., they are neither highly protected nor poorly secured;
Ba: judged to have speculative elements; their future cannot be considered well-assured;
B: considered speculative, assurance of interest and principal payments or of maintenance of other terms of the contract over any long period of time may be small.
Caa: Bonds which are rated Caa are of poor standing. Such issues may be in default or there may be present elements of danger with respect to principal or interest.
Ca: Bonds which are rated Ca represent obligations which are speculative in a high degree. Such issues are often in default or have other marked shortcomings with some prospect of recovery of principal and interest.
C: Bonds which are rated C are lowest rated class of bonds and issues so rated can be regarded as having extremely poor prospects of ever attaining any real investment standing with little prospect for recovery of principal or interest.
Note: Moody's applies numerical modifiers, 1, 2 and 3 in each generic rating classification from Aa through Caa in its corporate bond rating system. The modifier 1 indicates that the obligation ranks in the higher end of its generic rating category; the modifier 2 indicates a mid-range ranking; and the modifier 3 indicates that the issue ranks in the lower end of its generic rating category.
II. Excerpts from Standard & Poor's Rating Group's Corporate Bond Ratings:
AAA: Highest rating assigned for an obligation; obligor has extremely strong capacity to meet its financial commitments;
AA: obligation differs from the highest-rated obligations only in small degree; obligor's capacity to meet its financial commitment on the obligation is very strong;
A: obligation is somewhat more susceptible to the adverse effects of changes in circumstances and economic conditions than obligations in higher-rated categories; obligor's capacity to meet its financial commitment on the obligation is still strong;
BBB: obligation exhibits adequate protection parameters; adverse economic conditions or changing circumstances are more likely to lead to a weakened capacity of the obligor to meet its financial commitment on the obligation.
BB, B, CCC, CC, C: Obligations rated BB, B, CCC, CC and C are regarded as having significant speculative characteristics. BB indicates the least degree of speculation and C the highest. While such obligations will likely have some quality and protective characteristics, these may be outweighed by large uncertainties or major exposures to adverse conditions. The C rating may be used to cover a situation where a bankruptcy petition has been filed or similar action has been taken, but payments on this obligation are being continued.
D: An obligation rated D is in payment default. The D rating category is used when payments on an obligation are not made on the date due even if the applicable grace period has not expired, unless Standard & Poor's believes that such payments will be made within five business days. The D rating also will be used upon the filing of a bankruptcy petition or the taking of a similar action if payments on an obligation are jeopardized.
B-1
Plus (+) or minus (-): The ratings from AA to CCC may be modified by the addition of a plus or minus sign to show relative standing within the major rating categories.
III. Excerpts from Fitch, Inc.'s Corporate Bond Ratings:
AAA: Highest credit quality; denotes the lowest expectation of credit risk; assigned only in case of exceptionally strong capacity for timely payment of financial commitments. This capacity is highly unlikely to be adversely affected by foreseeable events.
AA: Very high credit quality; denote expectations of very low credit risk; indicate very strong capacity for timely payment of financial commitments. This capacity is not significantly vulnerable to foreseeable events.
A: High credit quality; denote expectations of low credit risk. The capacity for timely payment of financial commitments is considered strong. This capacity may, nevertheless, be more vulnerable to changes in circumstances or in economic conditions than is the case for higher ratings.
BBB: Good credit quality; indicates that there is currently expectations of low credit risk. The capacity for timely payment of financial commitments is considered adequate but adverse changes in circumstances and economic conditions are more likely to impair this capacity. This is the lowest investment grade category.
BB: Speculative; indicates that there is a possibility of credit risk developing, particularly as the result of adverse economic change over time; however, business or financial alternatives may be available to allow financial commitments to be met. Securities rated in this category are not investment grade.
B: Highly speculative; indicates that significant credit risk is present, but a limited margin of safety remains. Financial commitments are currently being met; however, capacity for continued payment is contingent upon a sustained, favorable business and economic environment.
CCC: Default is a real possibility. Capacity for meeting financial commitments is solely reliant upon sustained, favorable business or economic conditions.
CC: Default of some kind appears probable.
C: Default is imminent.
RD: Indicates an entity that has failed to make due payments (within the applicable grace period) on some but not all material financial obligations, but continues to honor other classes of obligations.
D: Default indicates an issuer that in Fitch Ratings' opinion has entered into bankruptcy filings, administration, receivership, liquidation or other formal winding-up procedure, or which has otherwise ceased business.
The modifiers "+" or "-" may be appended to a rating to denote relative status within major rating categories. Such suffixes are not added to the AAA Long-term rating category or to categories below CCC.
IV. Excerpts from Moody's Investors Service, Inc.'s Preferred Stock Ratings:
aaa: An issue which is rated aaa is considered to be a top-quality preferred stock. This rating indicates good asset protection and the least risk of dividend impairment within the universe of preferred stocks.
aa: An issue which is rated aa is considered a high-grade preferred stock. This rating indicates that there is reasonable assurance that earnings and asset protection will remain relatively well maintained in the foreseeable future.
a: An issue which is rated a is considered to be an upper medium grade preferred stock. While risks are judged to be somewhat greater than in the aaa and aa classifications, earnings and asset protection are, nevertheless expected to be maintained at adequate levels.
baa: An issue which is rated baa is considered to be medium grade preferred stock, neither highly protected nor poorly secured. Earnings and asset protection appear adequate at present but may be questionable over any great length of time.
ba: an issue which is rated ba is considered to have speculative elements and its future cannot be considered well assured. Earnings and asset protection may be very moderate and not well safeguarded during adverse periods. Uncertainty of position characterizes preferred stocks in this class.
B-2
b: An issue which is rated b generally lacks the characteristics of a desirable investment. Assurance of dividend payments and maintenance of other terms of the issue over any long period of time may be small.
caa: An issue which is rated caa is likely to be in arrears on dividend payments. This rating designation does not purport to indicate the future status of payment.
ca: An issue which is rated ca is speculative in a high degree and is likely to be in arrears on dividends with little likelihood of eventual payment.
c: This is the lowest rated class of preferred or preference stock. Issues so rated can be regarded as having extremely poor prospects of ever attaining any real investment standing.
Note: Moody's may apply numerical modifiers 1, 2 and 3 in each rating classification. The modifier 1 indicated that the security ranks in the higher end of its generic rating category; the modifier 2 indicates a mid-range ranking; and the modifier 3 indicates that the issue ranks in the lower end of its generic rating category.
V. Excerpts from Standard & Poor's Rating Group's Preferred Stock Ratings:
AAA: This is the highest rating that may be assigned by S&P's to a preferred stock issue and indicates an extremely strong capacity to pay the preferred stock obligations.
AA: A preferred stock issue rated AA also qualifies as a high-quality fixed-income security. The capacity to pay preferred stock obligations is very strong, although not as overwhelming as for issues rated AAA.
A: An issue rated A is backed by a sound capacity to pay the preferred stock obligations, although it is somewhat more susceptible to the adverse effect of the changes in circumstances and economic conditions.
BBB: An issue rated BBB is regarded as backed by an adequate capacity to pay the preferred stock obligations. Whereas it normally exhibits adequate protection parameter, adverse economic conditions or changing circumstances are more likely to lead to a weakened capacity to make payments for a preferred stock in this category than for issues in the A category.
BB, B, CCC: Preferred stock rated BB, B, and CCC are regarded, on balance, as predominantly speculative with respect to the issuer's capacity to pay preferred stock obligations. BB indicates the lowest degree of speculation and CCC the highest degree of speculation. While such issues will likely have some quality and protective characteristics, these are outweighed by large uncertainties of major risk exposures to adverse conditions.
CC: The rating CC is reserved for a preferred stock in arrears on dividends or sinking fund payments but that is currently paying.
C: A preferred stock rated C is a non-paying issue.
D: A preferred stock rated D is a non-paying issue with the issuer in default on debt instruments.
Plus (+) or Minus (-): The ratings from AA for CCC may be modified by the addition of a plus or minus sign to show relative standing within the major rating categories.
VI. Excerpts from Fitch, Inc's Preferred Stock Ratings:
AAA: These preferred stocks are considered to be investment grade and of the highest credit quality. The obligor has an exceptionally strong ability to pay, which is unlikely to be affected by reasonably foreseeable events.
AA: These preferred stocks are considered to be investment grade and of very high credit quality. The obligor's ability to pay is very strong, although not quite as strong as preferred stocks rated "AAA".
A: These preferred stocks are considered to be investment grade and of high credit quality. The obligor's ability to pay is considered to be strong, but may be more vulnerable to adverse changes in economic conditions and circumstances than preferred stocks with higher ratings.
BBB: These preferred stocks are considered to be investment grade and of satisfactory credit quality. The obligor's ability to pay interest and repay principal is considered to be adequate. Adverse changes in economic conditions and circumstances, however, are more likely to have adverse impact on these preferred stocks, and
B-3
therefore, impair timely payment. The likelihood that the ratings of these preferred stocks will fall below investment grade is higher than for preferred stocks with higher ratings.
BB: These preferred stocks are considered speculative. The obligor's ability to pay may be affected over time by adverse economic changes. However, business and financial alternatives can be identified that could assist the obligor in satisfying its dividend payment requirements.
B: These preferred stocks are considered highly speculative. While preferred in this class are currently meeting dividend payment requirements, the probability of continued timely payment reflects the obligor's limited margin of safety and the need for reasonable business and economic activity throughout the life of the issue.
CCC: These preferred stocks have certain identifiable characteristics which, if not remedied, may lead to non-payment. The ability to meet obligations requires an advantageous business and economic environment.
CC: These preferred stocks are minimally protected. Non-payment seems probable over time.
C: These preferred stocks are in imminent non-payment.
DDD, DD AND D: These preferred stocks are in non-payment. Such preferred stocks are extremely speculative and should be valued on the basis of their ultimate recovery value in liquidation or reorganization of the obligor. DDD represents the highest potential for recovery and D represents the lowest potential for recovery.
PLUS (+) OR MINUS (-): The ratings from AA to C may be modified by the addition of a plus or minus sign to indicate the relative position of a credit within the rating category.
B-4
EVERY SHAREHOLDER’S VOTE IS IMPORTANT
| EASY VOTING OPTIONS: |
| |
| 
| VOTE ON THE INTERNET Log on to: www.proxy-direct.com or scan the QR code Follow the on-screen instructions available 24 hours |
| | |
| 
| VOTE BY TELEPHONE Call 1-866-298-8476 Follow the recorded instructions available 24 hours |
| | |
| 
| VOTE BY MAIL Vote, sign and date your Voting Instruction Card and return it in the postage-paid envelope |
YOU MAY RECEIVE MULTIPLE PROXY KITS IN SEPARATE ENVELOPES OR SEVERAL CARDS WITHIN ONE ENVELOPE. IT IS IMPORTANT THAT YOU RECORD A SEPARATE VOTE FOR EACH VOTING INSTRUCTION CARD.
Please detach at perforation before mailing.
VOTING INSTRUCTION CARD | MORGAN STANLEY VARIABLE INVESTMENT SERIES | VOTING INSTRUCTION CARD |
| GLOBAL INFRASTRUCTURE PORTFOLIO | |
| NOTICE OF SPECIAL MEETING OF SHAREHOLDERS | |
| TO BE HELD ON MARCH 17, 2014 | |
[INSURANCE COMPANY NAME DROP-IN]
This Instruction Card is solicited by the above named insurance company seeking voting instructions with respect to shares of Morgan Stanley Variable Investment Series - Global Infrastructure Portfolio (the “Acquired Fund”), for which it is the record or beneficial owner on your behalf.
The undersigned contract/policy owner hereby instructs that the votes attributable to the undersigned’s shares with respect to the Acquired Fund be cast as directed on the reverse side at the Special Meeting of Shareholders to be held at 522 Fifth Avenue, 3rd Floor, New York, New York 10036 in Conference Room C, on March 17, 2014 at 9:00 a.m., New York Time, and at any adjournments or postponements thereof (the “Meeting”). The undersigned, by completing this Instruction Card, does hereby authorize the above named insurance company to exercise its discretion in voting upon such other business as may properly come before the Meeting or any adjournments or postponements thereof.
The Voting Instruction Card, when properly executed, will be voted in the manner directed herein by the undersigned. If no direction is made, the votes attributable to this Voting Instruction Card will be voted FOR the proposal listed on the reverse side. Shares of the Acquired Fund for which no instructions are received will be voted by in the same proportion as votes for which instructions are received for the Acquired Fund.
| VOTE VIA THE INTERNET: www.proxy-direct.com |
| VOTE VIA THE TELEPHONE: 1-866-298-8476 |
| |
| | | |
| Note: Please sign exactly as your name appears on this Voting Instruction Card. All joint owners should sign. When signing as executor, administrator, attorney, trustee or guardian or as custodian for a minor please sign full title as such. If a corporation, please sign in full corporate name and indicate the signer’s office or position held. If a partner, sign in the partnership name. |
| |
| Signature |
| |
| Signature (if held jointly) |
| |
| Date | FLEX_24569_VI_042213 |
| | | | |
EVERY SHAREHOLDER’S VOTE IS IMPORTANT
Important Notice Regarding the Availability of Proxy Materials for the
Shareholder Meeting to Be Held on March 17, 2014.
The Proxy Statement for this meeting is available at: https://www.proxy-direct.com/TBD
Please detach at perforation before mailing.
THE BOARD RECOMMENDS THAT YOU CAST YOUR VOTE “FOR” THE PROPOSAL AS DESCRIBED IN THE PROXY STATEMENT.
TO VOTE, MARK BLOCK BELOW IN BLUE OR BLACK INK AS IN THIS EXAMPLE:  |
| | | | FOR | AGAINST | ABSTAIN |
| | | | | | |
| 1. | To consider and vote upon a proposal to approve the actions and transactions described in that certain Agreement and Plan of Reorganization, dated October 3, 2013, between Morgan Stanley Variable Investment Series, on behalf of the Global Infrastructure Portfolio (the “Acquired Fund”) and The Universal Institutional Funds, Inc., on behalf of the Global Infrastructure Portfolio (the “Acquiring Fund”), pursuant to which substantially all of the assets and liabilities of the Acquired Fund will be transferred to the Acquiring Fund in exchange for shares of the corresponding class of the Acquiring Fund and pursuant to which the Acquired Fund will be liquidated and terminated. | | o | o | o |
| | | | |
| 2. | To act upon such other matters as may properly come before the Meeting. | | |
PLEASE VOTE, SIGN AND DATE THIS VOTING INSTRUCTION CARD AND RETURN IT PROMPTLY IN THE ENCLOSED ENVELOPE.
EVERY SHAREHOLDER’S VOTE IS IMPORTANT
| EASY VOTING OPTIONS: |
| |
| 
| VOTE ON THE INTERNET Log on to: www.proxy-direct.com or scan the QR code Follow the on-screen instructions available 24 hours |
| | |
| 
| VOTE BY TELEPHONE Call 1-866-298-8476 Follow the recorded instructions available 24 hours |
| | |
| 
| VOTE BY MAIL Vote, sign and date your Voting Instruction Card and return it in the postage-paid envelope |
YOU MAY RECEIVE MULTIPLE PROXY KITS IN SEPARATE ENVELOPES OR SEVERAL CARDS WITHIN ONE ENVELOPE. IT IS IMPORTANT THAT YOU RECORD A SEPARATE VOTE FOR EACH VOTING INSTRUCTION CARD.
Please detach at perforation before mailing.
VOTING INSTRUCTION CARD | MORGAN STANLEY SELECT DIMENSIONS INVESTMENT SERIES | VOTING INSTRUCTION CARD |
| GLOBAL INFRASTRUCTURE PORTFOLIO | |
| NOTICE OF SPECIAL MEETING OF SHAREHOLDERS | |
| TO BE HELD ON MARCH 17, 2014 | |
[INSURANCE COMPANY NAME DROP-IN]
This Instruction Card is solicited by the above named insurance company seeking voting instructions with respect to shares of Morgan Stanley Select Dimensions Investment Series - Global Infrastructure Portfolio (the “Acquired Fund”), for which it is the record or beneficial owner on your behalf.
The undersigned contract/policy owner hereby instructs that the votes attributable to the undersigned’s shares with respect to the Acquired Fund be cast as directed on the reverse side at the Special Meeting of Shareholders to be held at 522 Fifth Avenue, 3rd Floor, New York, New York 10036 in Conference Room C, on March 17, 2014 at 9:00 a.m., New York Time, and at any adjournments or postponements thereof (the “Meeting”). The undersigned, by completing this Instruction Card, does hereby authorize the above named insurance company to exercise its discretion in voting upon such other business as may properly come before the Meeting or any adjournments or postponements thereof.
The Voting Instruction Card, when properly executed, will be voted in the manner directed herein by the undersigned. If no direction is made, the votes attributable to this Voting Instruction Card will be voted FOR the proposal listed on the reverse side. Shares of the Acquired Fund for which no instructions are received will be voted by in the same proportion as votes for which instructions are received for the Acquired Fund.
| VOTE VIA THE INTERNET: www.proxy-direct.com |
| VOTE VIA THE TELEPHONE: 1-866-298-8476 |
| |
| | | |
| Note: Please sign exactly as your name appears on this Voting Instruction Card. All joint owners should sign. When signing as executor, administrator, attorney, trustee or guardian or as custodian for a minor please sign full title as such. If a corporation, please sign in full corporate name and indicate the signer’s office or position held. If a partner, sign in the partnership name. |
| |
| Signature |
| |
| Signature (if held jointly) |
| |
| Date | FLEX_24569_VI_042213 |
| | | | |
EVERY SHAREHOLDER’S VOTE IS IMPORTANT
Important Notice Regarding the Availability of Proxy Materials for the
Shareholder Meeting to Be Held on March 17, 2014.
The Proxy Statement for this meeting is available at: https://www.proxy-direct.com/TBD
Please detach at perforation before mailing.
THE BOARD RECOMMENDS THAT YOU CAST YOUR VOTE “FOR” THE PROPOSAL AS DESCRIBED IN THE PROXY STATEMENT.
TO VOTE, MARK BLOCK BELOW IN BLUE OR BLACK INK AS IN THIS EXAMPLE:  |
| | | | FOR | AGAINST | ABSTAIN |
| | | | | | |
| 1. | To consider and vote upon a proposal to approve the actions and transactions described in that certain Agreement and Plan of Reorganization, dated October 3, 2013, between Morgan Stanley Select Dimensions Investment Series, on behalf of the Global Infrastructure Portfolio (the “Acquired Fund”) and The Universal Institutional Funds, Inc., on behalf of the Global Infrastructure Portfolio (the “Acquiring Fund”), pursuant to which substantially all of the assets and liabilities of the Acquired Fund will be transferred to the Acquiring Fund in exchange for shares of the corresponding class of the Acquiring Fund and pursuant to which the Acquired Fund will be liquidated and terminated. | | o | o | o |
| | | | |
| 2. | To act upon such other matters as may properly come before the Meeting. | | |
PLEASE VOTE, SIGN AND DATE THIS VOTING INSTRUCTION CARD AND RETURN IT PROMPTLY IN THE ENCLOSED ENVELOPE.
PART C. OTHER INFORMATION
ITEM 15. INDEMNIFICATION
The response to this item is incorporated herein by reference to Exhibits 1 and 2 under Item 16 below and by reference to Item 30 of the Company’s Post-Effective Amendment No. 53 to its Registration Statement on Form N-1A dated December 17, 2013 (File Nos. 333-03013; 811-07607).
ITEM 16. EXHIBITS
(1) (a) | | Articles of Restatement, dated February 20, 2007, are incorporated by reference to Exhibit (a) of Post-Effective Amendment No. 31 to the Registration Statement on Form N-1A, filed on April 13, 2007. |
| | |
(b) | | Articles Supplementary (terminating the Money Market Portfolio and the Technology Portfolio), dated April 10, 2008, are incorporated by reference to Exhibit (a)(2) to Post-Effective Amendment No. 32 to the Registration Statement on Form N-1A, filed on April 11, 2008. |
| | |
(c) | | Articles of Amendment (renaming the Fixed Income Portfolio), dated April 10, 2008, are incorporated by reference to Exhibit (a)(3) to Post-Effective Amendment No. 32 to the Registration Statement on Form N-1A, filed on April 11, 2008. |
| | |
(d) | | Articles of Amendment (renaming the Equity Growth Portfolio), dated April 10, 2008, are incorporated by reference to Exhibit (a)(4) to Post-Effective Amendment No. 32 to the Registration Statement on Form N-1A, filed on April 11, 2008. |
| | |
(e) | | Articles Supplementary (terminating the International Fixed Income Portfolio, Balanced Portfolio, Multi-Asset Class Portfolio, Core Equity Portfolio, Asian Equity Portfolio, Targeted Duration Portfolio and Investment Grade Fixed Income Portfolio), dated May 27, 2009, are incorporated by reference to Exhibit (a)(5) to Post-Effective Amendment No. 34 to the Registration Statement on Form N-1A, filed on February 5, 2010. |
| | |
(f) | | Certificate of Correction (correcting typographical errors, errors of transcription or other errors with respect to the Equity Growth Portfolio and Capital Growth Portfolio), dated July 28, 2010, is incorporated by reference to Exhibit (a)(6) to Post-Effective Amendment No. 41 to the Registration Statement on Form N-1A, filed on October 29, 2010. |
| | |
(g) | | Articles Supplementary (terminating the Equity and Income Portfolio, Global Value Equity Portfolio, High Yield Portfolio, International Growth Equity Portfolio, U.S. Mid Cap Value Portfolio and Value Portfolio), dated July 28, 2010, are incorporated by reference to Exhibit (a)(7) to Post-Effective Amendment No. 41 to the Registration Statement on Form N-1A, filed on October 29, 2010. |
| | |
(h) | | Articles of Amendment (renaming the International Magnum Portfolio), dated October 13, 2010, are incorporated by reference to Exhibit (a)(8) to Post-Effective Amendment No. 41 to the Registration Statement on Form N-1A, filed on October 29, 2010. |
| | |
(i) | | Articles of Amendment (renaming the Capital Growth Portfolio), dated April 5, 2011, are incorporated by reference to Exhibit (a)(9) to Post-Effective Amendment No. 46 to the Registration Statement on Form N-1A, filed on April 13, 2011. |
| | |
(j) | | Articles Supplementary (adding the Global Infrastructure Portfolio), dated October 3, 2013, are incorporated by reference to Exhibit (a)(10) to Post-Effective Amendment No. 52 to the Registration Statement on Form N-1A, filed on October 4, 2013. |
| | |
(2) | | Amended and Restated By-Laws, dated June 20, 2007, are incorporated by reference to Exhibit (b) to Post-Effective Amendment No. 32 to the Registration Statement on Form N-1A, filed on April 11, 2008. |
| | |
(3) | | Not applicable. |
| | |
(4) | | Copies of each Agreement and Plan of Reorganization (filed as Exhibits A-1 and A-2 to the Joint Proxy Statement and Prospectus). |
| | |
(5) | | Not applicable. |
| | |
(6) (a) | | Amended and Restated Investment Advisory Agreement between Registrant and Morgan Stanley Investment Management Inc., dated June 30, 2009, is incorporated by reference to Exhibit (d)(1) to Post-Effective Amendment |
| | No. 53 to the Registration Statement on Form N-1A, filed on December 17, 2013. |
| | |
(b) | | Amended and Restated Sub-Advisory Agreement between Morgan Stanley Investment Management Inc. and Morgan Stanley Investment Management Limited (relating to the Emerging Markets Equity Portfolio, Global Franchise Portfolio, Global Infrastructure Portfolio and Global Real Estate Portfolio), dated as of May 30, 2013, is incorporated by reference to Exhibit (d)(2) to Post-Effective Amendment No. 53 to the Registration Statement on Form N-1A, filed on December 17, 2013. |
| | |
(c) | | Amended and Restated Sub-Advisory Agreement between Morgan Stanley Investment Management Inc. and Morgan Stanley Investment Management Company (relating to the Emerging Markets Equity Portfolio, Global Franchise Portfolio, Global Infrastructure Portfolio and Global Real Estate Portfolio), dated as of June 30, 2009, is incorporated by reference to Exhibit (d)(3) to Post-Effective Amendment No. 53 to the Registration Statement on Form N-1A, filed on December 17, 2013. |
| | |
(7) (a) | | Distribution Agreement between Registrant and Morgan Stanley Distribution, Inc., dated as of April 29, 2005, is incorporated by reference to Exhibit (e) to Post-Effective Amendment No. 27 to the Registration Statement on Form N-1A, filed on December 16, 2005. |
| | |
(b) | | Form of Participation Agreement is incorporated by reference to Exhibit (e)(2) to Post-Effective Amendment No. 33 to the Registration Statement on Form N-1A, filed on April 7, 2009. |
| | |
(8) | | Not applicable. |
| | |
(9) | | Custodian Agreement between Registrant and State Street Bank and Trust Company, dated March 7, 2008, is incorporated by reference to Exhibit (g) to Post-Effective Amendment No. 53 to the Registration Statement on Form N-1A, filed on December 17, 2013. |
| | |
(10) (a) | | Amended and Restated 12b-1 Distribution Plan (with respect to “Class II” shares of each Portfolio), is incorporated by reference to Exhibit (m) to Post-Effective Amendment No. 27 to the Registration Statement on Form N-1A, filed on December 16, 2005. |
| | |
(b) | | 18f-3 Multi-Class Plan, is incorporated by reference to Exhibit (o) to Post-Effective Amendment No. 25 to the Registration Statement on Form N-1A, filed on February 17, 2005. |
| | |
(11) (a) | | Opinion and Consent of Dechert LLP, is filed herewith. |
| | |
(b) | | Opinion of Ballard Spahr LLP, is filed herewith. |
| | |
(12) (a) | | Form of opinion (with respect to SD Global Infrastructure) of Dechert LLP (as to tax matters), is filed herewith. |
| | |
(b) | | Form of opinion (with respect to VIS Global Infrastructure) of Dechert LLP (as to tax matters), is filed herewith. |
| | |
(13) (a) | | Administration Agreement between Registrant and Morgan Stanley Investment Management Inc. is incorporated by reference to Exhibit h(1) to Post-Effective Amendment No. 8 to the Registration Statement on Form N-1A, filed on April 1, 1999. |
| | |
(b) | | Schedule A to Administration Agreement between Registrant and Morgan Stanley Investment Management Inc., is incorporated by reference to Exhibit (h)(2) to Post-Effective Amendment No. 41 to the Registration Statement on Form N-1A, filed on October 29, 2010. |
| | |
(14) | | Consent of Ernst & Young LLP (with respect to Form N-14), is filed herewith. |
| | |
(15) | | Not applicable. |
(16) | | Powers of Attorney of Directors, dated October 2, 2013, are incorporated by reference to Exhibit (q) to Post-Effective Amendment No. 52 to the Registration Statement on Form N-1A, filed on October 4, 2013. |
ITEM 17. UNDERTAKINGS
(1) The undersigned registrant agrees that prior to any public reoffering of the securities registered through the use of a prospectus which is a part of this registration statement on Form N-14 by any person or party who is deemed to be an underwriter within the meaning of Rule 145(c) of the Securities Act, the reoffering prospectus will contain the information called for by the applicable registration form for the reofferings by persons who may be deemed underwriters, in addition to the information called for by the other items of the applicable form.
(2) The undersigned registrant agrees that every prospectus that is filed under paragraph (1) above will be filed as a part of an amendment to this registration statement on Form N-14 and will not be used until the amendment is effective, and that, in determining any liability under the Securities Act, each post-effective amendment shall be deemed to be a new registration statement for the securities offered therein, and the offering of the securities at that time shall be deemed to be the initial bona fide offering of them.
(3) The undersigned registrant undertakes to file a post-effective amendment to this registration statement upon the closing of the Reorganizations described in this registration statement that contains opinions of counsel supporting the tax matters discussed in this registration statement.
SIGNATURES
As required by the Securities Act of 1933, this registration statement has been signed on behalf of the registrant, in the City of New York and State of New York on this 14th day of January, 2014.
| THE UNIVERSAL INSTITUTIONAL FUNDS, INC. |
| | |
| By: | /s/ John H. Gernon |
| | John H. Gernon |
| | President and Principal Executive Officer |
As required by the Securities Act of 1933, this registration statement has been signed below by the following persons in the capacities and on the dates indicated.
Signatures | | Title | | Date |
(1) Principal Executive Officer | | President and Principal Executive Officer | | |
| | | | |
By: | /s/ John H. Gernon | | | | January 14, 2014 |
| John H. Gernon | | | | |
| | | | |
(2) Principal Financial Officer | | Principal Financial Officer | | |
| | | | |
By: | /s/ Francis J. Smith | | | | January 14, 2014 |
| Francis J. Smith | | | | |
| | | | |
(3) Majority of the Directors | | | | |
| | | | |
INDEPENDENT DIRECTORS | | | | |
Frank L. Bowman | | Michael F. Klein | | |
Michael Bozic | | Michael E. Nugent | | |
Kathleen A. Dennis | | W. Allen Reed | | |
Dr. Manuel H. Johnson | | Fergus Reid | | |
Joseph J. Kearns | | | | |
| | | | |
By: | /s/ Carl Frischling | | | | January 14, 2014 |
| Carl Frischling | | | | |
| Attorney-in-Fact for the Independent Directors | | | | |
| | | | |
INTERESTED DIRECTOR | | | | |
James F. Higgins | | | | |
| | | | |
By: | /s/ Mary E. Mullin | | | | January 14, 2014 |
| Mary E. Mullin | | | | |
| Attorney-in-Fact for the Interested Director | | | | |
Exhibit Index
(11) | (a) | Opinion and Consent of Dechert LLP. |
| (b) | Opinion of Ballard Spahr LLP. |
(12) | (a) | Form of opinion (with respect to SD Global Infrastructure) of Dechert LLP (as to tax matters). |
(12) | (b) | Form of opinion (with respect to VIS Global Infrastructure) of Dechert LLP (as to tax matters). |
(14) | | Consent of Ernst & Young LLP (with respect to Form N-14). |