UNITED STATES SECURITIES AND EXCHANGE COMMISSION
Washington, D.C. 20549
Form N-CSR
CERTIFIED SHAREHOLDER REPORT OF REGISTERED
MANAGEMENT INVESTMENT COMPANIES
Investment Company Act File Number: 811-07607
Morgan Stanley Variable Insurance Fund, Inc.
(Exact Name of Registrant as Specified in Charter)
1585 Broadway, New York, New York 10036
(Address of Principal Executive Offices)
John H. Gernon
1585 Broadway, New York, New York 10036
(Name and Address of Agent for Services)
(212) 762-1886
(Registrant’s Telephone Number)
December 31
Date of Fiscal Year End
June 30, 2024
Date of Reporting Period
Item 1. Reports to Stockholders
(a)
TABLE OF CONTENTS
Morgan Stanley Variable Insurance Fund, Inc. - Discovery Portfolio
I - MMGPX |
| | |
Morgan Stanley Variable Insurance Fund, Inc. - Discovery Portfolio
II - MMGTX |
| | |
Morgan Stanley Variable Insurance Fund, Inc. - Emerging Markets Equity Portfolio
I - MEMEX |
| | |
Morgan Stanley Variable Insurance Fund, Inc. - Emerging Markets Equity Portfolio
II - MSMBX |
| | |
Morgan Stanley Variable Insurance Fund, Inc. - Global Infrastructure Portfolio
I - MBGIX |
| | |
Morgan Stanley Variable Insurance Fund, Inc. - Global Infrastructure Portfolio
II - MPIIX |
| | |
Morgan Stanley Variable Insurance Fund, Inc. - Global Real Estate Portfolio
II - MGETX |
| | |
Morgan Stanley Variable Insurance Fund, Inc. - Global Strategist Portfolio
I - MIMPX |
| | |
Morgan Stanley Variable Insurance Fund, Inc. - Global Strategist Portfolio
II - MGTPX |
| | |
Morgan Stanley Variable Insurance Fund, Inc. - Growth Portfolio
I - MEGIX |
| | |
Morgan Stanley Variable Insurance Fund, Inc. - Growth Portfolio
II - MEGTX |
| | |
Morgan Stanley Variable Insurance Fund, Inc. - U.S. Real Estate Portfolio
I - MUSRX |
| | |
Morgan Stanley Variable Insurance Fund, Inc. - U.S. Real Estate Portfolio
II - MSRBX |
| | |
Morgan Stanley Variable Insurance Fund, Inc. - Emerging Markets Debt Portfolio
I - MEMNX |
| | |
Morgan Stanley Variable Insurance Fund, Inc. - Emerging Markets Debt Portfolio
II - MBDBX |
| | |
Morgan Stanley Variable Insurance Fund, Inc. - Discovery Portfolio
Semi-Annual Shareholder Report June 30, 2024
This semi-annual shareholder report contains important information about Morgan Stanley Variable Insurance Fund, Inc. - Discovery Portfolio for the period of January 1, 2024 to June 30, 2024. You can find additional information about the Fund at www.morganstanley.com/im/shareholderreports. You can also request this information by contacting us at 1-800-869-6397.
What were the Fund costs for the last six months?Footnote Reference1
(based on a hypothetical $10,000 investment)
| Class Name | Costs of a $10,000 investment | Costs paid as a percentage of a $10,000 investment |
|---|
| Class I | $47 | 0.94% |
| Footnote | Description |
Footnote1 | Does not reflect fees and expenses imposed by your insurance company. You may pay fees other than the fees and expenses of the Fund, such as brokerage commissions and other fees charged by financial intermediaries. |
| Total Net Assets | $154,397,055 |
| # of Portfolio Holdings | 44 |
| Portfolio Turnover Rate | 31% |
What did the Fund invest in?
The following tables reflect what the Fund invested in as of the report date.
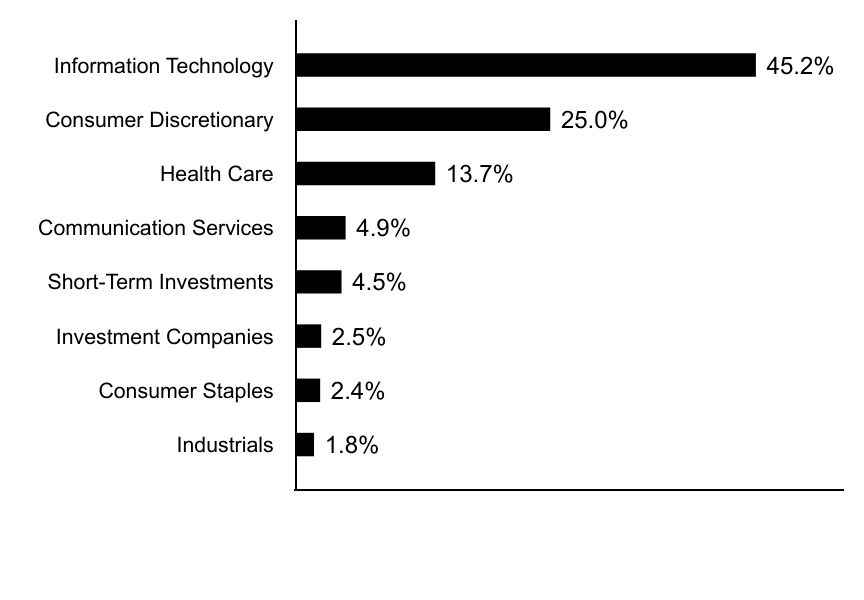
Sector Allocation (% of total investments)
| Value | Value |
|---|
| Industrials | 1.8% |
| Consumer Staples | 2.4% |
| Investment Companies | 2.5% |
| Short-Term Investments | 4.5% |
| Communication Services | 4.9% |
| Health Care | 13.7% |
| Consumer Discretionary | 25.0% |
| Information Technology | 45.2% |
Top Ten Holdings (% of total investments)Footnote Referencea
| Cloudflare, Inc. | 8.2% |
| Trade Desk, Inc. | 7.4% |
| DoorDash, Inc. | 6.9% |
| Global-e Online Ltd. | 5.3% |
| Affirm Holdings, Inc. | 5.3% |
| Samsara, Inc. | 5.2% |
| ROBLOX Corp. | 4.9% |
| Royalty Pharma PLC | 4.5% |
| Carvana Co. | 4.1% |
| Adyen NV | 3.5% |
| Total | 55.3% |
| Footnote | Description |
Footnotea | Excluding cash equivalents. |
If you wish to view additional information about the Fund, including the prospectus, statement of additional information, financial statements and holdings, please scan the QR code or visit www.morganstanley.com/im/shareholderreports. For proxy information, please visit www.morganstanley.com/im/en-us/institutional-investor/about-us/proxy-voting/vote-summary-report.desktop.html.
The Funds may deliver a single copy of certain required shareholder documents (including prospectuses, shareholder reports, and proxy materials) to investors with the same last name and the same address. Your participation will continue indefinitely unless you instruct otherwise by contacting your financial intermediary.
The Fund is intended to be a funding vehicle for variable annuity contracts and variable life insurance policies offered by the separate accounts of certain life insurance companies.
Not FDIC Insured | May Lose Value | No Bank Guarantee
Semi-Annual Shareholder Report June 30, 2024
Morgan Stanley Variable Insurance Fund, Inc. - Discovery Portfolio
Semi-Annual Shareholder Report June 30, 2024
This semi-annual shareholder report contains important information about Morgan Stanley Variable Insurance Fund, Inc. - Discovery Portfolio for the period of January 1, 2024 to June 30, 2024. You can find additional information about the Fund at www.morganstanley.com/im/shareholderreports. You can also request this information by contacting us at 1-800-869-6397.
What were the Fund costs for the last six months?Footnote Reference1
(based on a hypothetical $10,000 investment)
| Class Name | Costs of a $10,000 investment | Costs paid as a percentage of a $10,000 investment |
|---|
| Class II | $52 | 1.04% |
| Footnote | Description |
Footnote1 | Does not reflect fees and expenses imposed by your insurance company. You may pay fees other than the fees and expenses of the Fund, such as brokerage commissions and other fees charged by financial intermediaries. |
| Total Net Assets | $154,397,055 |
| # of Portfolio Holdings | 44 |
| Portfolio Turnover Rate | 31% |
What did the Fund invest in?
The following tables reflect what the Fund invested in as of the report date.
Sector Allocation (% of total investments)
| Value | Value |
|---|
| Industrials | 1.8% |
| Consumer Staples | 2.4% |
| Investment Companies | 2.5% |
| Short-Term Investments | 4.5% |
| Communication Services | 4.9% |
| Health Care | 13.7% |
| Consumer Discretionary | 25.0% |
| Information Technology | 45.2% |
Top Ten Holdings (% of total investments)Footnote Referencea
| Cloudflare, Inc. | 8.2% |
| Trade Desk, Inc. | 7.4% |
| DoorDash, Inc. | 6.9% |
| Global-e Online Ltd. | 5.3% |
| Affirm Holdings, Inc. | 5.3% |
| Samsara, Inc. | 5.2% |
| ROBLOX Corp. | 4.9% |
| Royalty Pharma PLC | 4.5% |
| Carvana Co. | 4.1% |
| Adyen NV | 3.5% |
| Total | 55.3% |
| Footnote | Description |
Footnotea | Excluding cash equivalents. |
If you wish to view additional information about the Fund, including the prospectus, statement of additional information, financial statements and holdings, please scan the QR code or visit www.morganstanley.com/im/shareholderreports. For proxy information, please visit www.morganstanley.com/im/en-us/institutional-investor/about-us/proxy-voting/vote-summary-report.desktop.html.
The Funds may deliver a single copy of certain required shareholder documents (including prospectuses, shareholder reports, and proxy materials) to investors with the same last name and the same address. Your participation will continue indefinitely unless you instruct otherwise by contacting your financial intermediary.
The Fund is intended to be a funding vehicle for variable annuity contracts and variable life insurance policies offered by the separate accounts of certain life insurance companies.
Not FDIC Insured | May Lose Value | No Bank Guarantee
Semi-Annual Shareholder Report June 30, 2024
Morgan Stanley Variable Insurance Fund, Inc. - Emerging Markets Equity Portfolio
Semi-Annual Shareholder Report June 30, 2024
This semi-annual shareholder report contains important information about Morgan Stanley Variable Insurance Fund, Inc. - Emerging Markets Equity Portfolio for the period of January 1, 2024 to June 30, 2024. You can find additional information about the Fund at www.morganstanley.com/im/shareholderreports. You can also request this information by contacting us at 1-800-869-6397.
What were the Fund costs for the last six months?Footnote Reference1
(based on a hypothetical $10,000 investment)
| Class Name | Costs of a $10,000 investment | Costs paid as a percentage of a $10,000 investment |
|---|
| Class I | $65 | 1.24% |
| Footnote | Description |
Footnote1 | Does not reflect fees and expenses imposed by your insurance company. You may pay fees other than the fees and expenses of the Fund, such as brokerage commissions and other fees charged by financial intermediaries. |
| Total Net Assets | $167,178,355 |
| # of Portfolio Holdings | 99 |
| Portfolio Turnover Rate | 21% |
What did the Fund invest in?
The following tables reflect what the Fund invested in as of the report date.
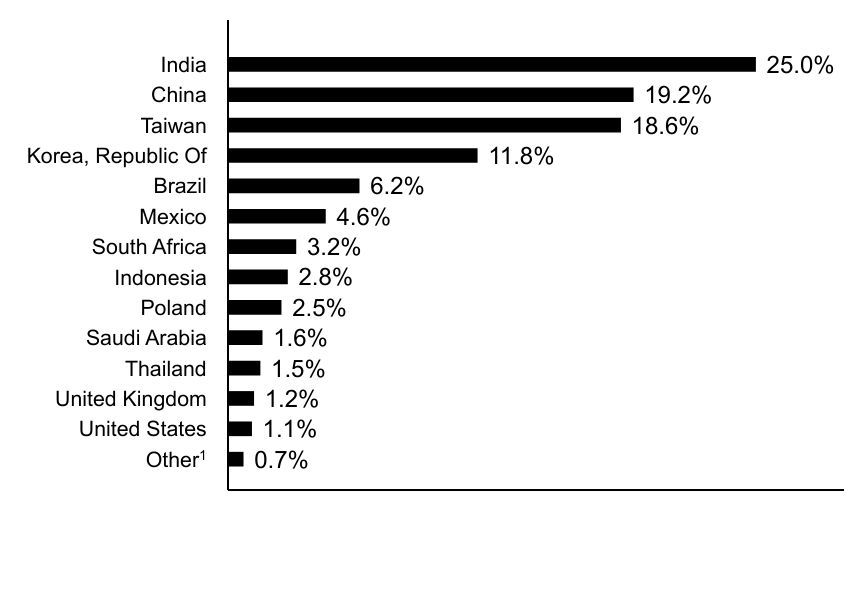
Country Weightings (% of total investments)
| Value | Value |
|---|
OtherFootnote Reference1 | 0.7% |
| United States | 1.1% |
| United Kingdom | 1.2% |
| Thailand | 1.5% |
| Saudi Arabia | 1.6% |
| Poland | 2.5% |
| Indonesia | 2.8% |
| South Africa | 3.2% |
| Mexico | 4.6% |
| Brazil | 6.2% |
| Korea, Republic Of | 11.8% |
| Taiwan | 18.6% |
| China | 19.2% |
| India | 25.0% |
| Footnote | Description |
Footnote1 | Represents investments in countries less than 1% of total investments. |
Top Ten Holdings (% of total investments)
| Taiwan Semiconductor Manufacturing Co. Ltd. | 10.5% |
| Tencent Holdings Ltd. | 4.2% |
| Samsung Electronics Co. Ltd. | 4.1% |
| SK Hynix, Inc. | 3.5% |
| Mahindra & Mahindra Ltd. | 2.8% |
| ICICI Bank Ltd. | 2.5% |
| Reliance Industries Ltd. | 2.5% |
| Alibaba Group Holding Ltd. | 2.0% |
| China Construction Bank Corp. | 2.0% |
| Hon Hai Precision Industry Co. Ltd. | 1.9% |
| Total | 36.0% |
If you wish to view additional information about the Fund, including the prospectus, statement of additional information, financial statements and holdings, please scan the QR code or visit www.morganstanley.com/im/shareholderreports. For proxy information, please visit www.morganstanley.com/im/en-us/institutional-investor/about-us/proxy-voting/vote-summary-report.desktop.html.
The Funds may deliver a single copy of certain required shareholder documents (including prospectuses, shareholder reports, and proxy materials) to investors with the same last name and the same address. Your participation will continue indefinitely unless you instruct otherwise by contacting your financial intermediary.
The Fund is intended to be a funding vehicle for variable annuity contracts and variable life insurance policies offered by the separate accounts of certain life insurance companies.
Not FDIC Insured | May Lose Value | No Bank Guarantee
Semi-Annual Shareholder Report June 30, 2024
Morgan Stanley Variable Insurance Fund, Inc. - Emerging Markets Equity Portfolio
Semi-Annual Shareholder Report June 30, 2024
This semi-annual shareholder report contains important information about Morgan Stanley Variable Insurance Fund, Inc. - Emerging Markets Equity Portfolio for the period of January 1, 2024 to June 30, 2024. You can find additional information about the Fund at www.morganstanley.com/im/shareholderreports. You can also request this information by contacting us at 1-800-869-6397.
What were the Fund costs for the last six months?Footnote Reference1
(based on a hypothetical $10,000 investment)
| Class Name | Costs of a $10,000 investment | Costs paid as a percentage of a $10,000 investment |
|---|
| Class II | $68 | 1.29% |
| Footnote | Description |
Footnote1 | Does not reflect fees and expenses imposed by your insurance company. You may pay fees other than the fees and expenses of the Fund, such as brokerage commissions and other fees charged by financial intermediaries. |
| Total Net Assets | $167,178,355 |
| # of Portfolio Holdings | 99 |
| Portfolio Turnover Rate | 21% |
What did the Fund invest in?
The following tables reflect what the Fund invested in as of the report date.
Country Weightings (% of total investments)
| Value | Value |
|---|
OtherFootnote Reference1 | 0.7% |
| United States | 1.1% |
| United Kingdom | 1.2% |
| Thailand | 1.5% |
| Saudi Arabia | 1.6% |
| Poland | 2.5% |
| Indonesia | 2.8% |
| South Africa | 3.2% |
| Mexico | 4.6% |
| Brazil | 6.2% |
| Korea, Republic Of | 11.8% |
| Taiwan | 18.6% |
| China | 19.2% |
| India | 25.0% |
| Footnote | Description |
Footnote1 | Represents investments in countries less than 1% of total investments. |
Top Ten Holdings (% of total investments)
| Taiwan Semiconductor Manufacturing Co. Ltd. | 10.5% |
| Tencent Holdings Ltd. | 4.2% |
| Samsung Electronics Co. Ltd. | 4.1% |
| SK Hynix, Inc. | 3.5% |
| Mahindra & Mahindra Ltd. | 2.8% |
| ICICI Bank Ltd. | 2.5% |
| Reliance Industries Ltd. | 2.5% |
| Alibaba Group Holding Ltd. | 2.0% |
| China Construction Bank Corp. | 2.0% |
| Hon Hai Precision Industry Co. Ltd. | 1.9% |
| Total | 36.0% |
If you wish to view additional information about the Fund, including the prospectus, statement of additional information, financial statements and holdings, please scan the QR code or visit www.morganstanley.com/im/shareholderreports. For proxy information, please visit www.morganstanley.com/im/en-us/institutional-investor/about-us/proxy-voting/vote-summary-report.desktop.html.
The Funds may deliver a single copy of certain required shareholder documents (including prospectuses, shareholder reports, and proxy materials) to investors with the same last name and the same address. Your participation will continue indefinitely unless you instruct otherwise by contacting your financial intermediary.
The Fund is intended to be a funding vehicle for variable annuity contracts and variable life insurance policies offered by the separate accounts of certain life insurance companies.
Not FDIC Insured | May Lose Value | No Bank Guarantee
Semi-Annual Shareholder Report June 30, 2024
Morgan Stanley Variable Insurance Fund, Inc. - Global Infrastructure Portfolio
Semi-Annual Shareholder Report June 30, 2024
This semi-annual shareholder report contains important information about Morgan Stanley Variable Insurance Fund, Inc. - Global Infrastructure Portfolio for the period of January 1, 2024 to June 30, 2024. You can find additional information about the Fund at www.morganstanley.com/im/shareholderreports. You can also request this information by contacting us at 1-800-869-6397.
What were the Fund costs for the last six months?Footnote Reference1
(based on a hypothetical $10,000 investment)
| Class Name | Costs of a $10,000 investment | Costs paid as a percentage of a $10,000 investment |
|---|
| Class I | $43 | 0.87% |
| Footnote | Description |
Footnote1 | Does not reflect fees and expenses imposed by your insurance company. You may pay fees other than the fees and expenses of the Fund, such as brokerage commissions and other fees charged by financial intermediaries. |
| Total Net Assets | $67,772,326 |
| # of Portfolio Holdings | 58 |
| Portfolio Turnover Rate | 24% |
What did the Fund invest in?
The following tables reflect what the Fund invested in as of the report date.
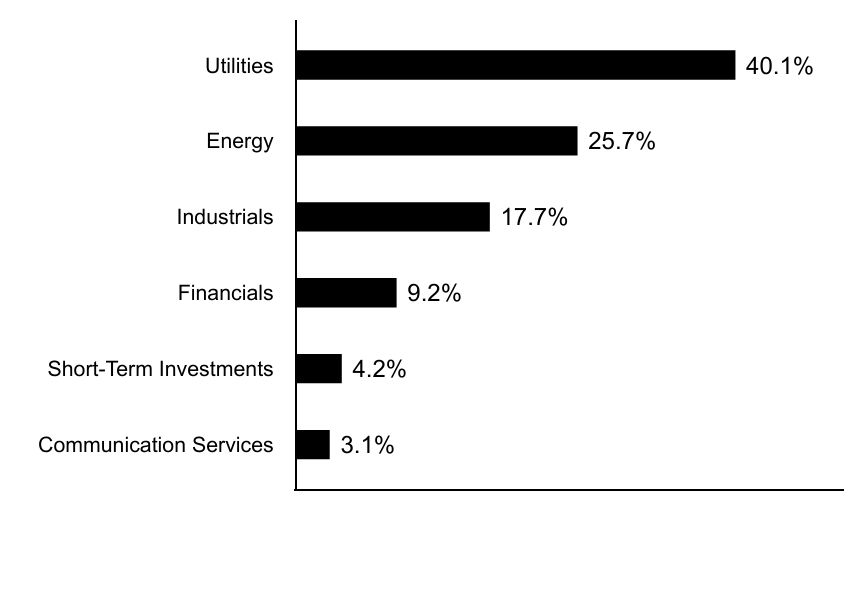
Sector Allocation (% of total investments)
| Value | Value |
|---|
| Communication Services | 3.1% |
| Short-Term Investments | 4.2% |
| Financials | 9.2% |
| Industrials | 17.7% |
| Energy | 25.7% |
| Utilities | 40.1% |
Top Ten Holdings (% of total investments)Footnote Referencea
| National Grid PLC | 7.5% |
| American Tower Corp. | 7.1% |
| GFL Environmental, Inc. | 5.4% |
| Enbridge, Inc. | 5.0% |
| ONEOK, Inc. | 4.0% |
| Pembina Pipeline Corp. | 3.7% |
| Sempra | 3.6% |
| Targa Resources Corp. | 3.6% |
| Grupo Aeroportuario del Pacifico SAB de CV | 3.2% |
| Cheniere Energy, Inc. | 2.8% |
| Total | 45.9% |
| Footnote | Description |
Footnotea | Excluding cash equivalents. |
If you wish to view additional information about the Fund, including the prospectus, statement of additional information, financial statements and holdings, please scan the QR code or visit www.morganstanley.com/im/shareholderreports. For proxy information, please visit www.morganstanley.com/im/en-us/institutional-investor/about-us/proxy-voting/vote-summary-report.desktop.html.
The Funds may deliver a single copy of certain required shareholder documents (including prospectuses, shareholder reports, and proxy materials) to investors with the same last name and the same address. Your participation will continue indefinitely unless you instruct otherwise by contacting your financial intermediary.
The Fund is intended to be a funding vehicle for variable annuity contracts and variable life insurance policies offered by the separate accounts of certain life insurance companies.
Not FDIC Insured | May Lose Value | No Bank Guarantee
Semi-Annual Shareholder Report June 30, 2024
Morgan Stanley Variable Insurance Fund, Inc. - Global Infrastructure Portfolio
Semi-Annual Shareholder Report June 30, 2024
This semi-annual shareholder report contains important information about Morgan Stanley Variable Insurance Fund, Inc. - Global Infrastructure Portfolio for the period of January 1, 2024 to June 30, 2024. You can find additional information about the Fund at www.morganstanley.com/im/shareholderreports. You can also request this information by contacting us at 1-800-869-6397.
What were the Fund costs for the last six months?Footnote Reference1
(based on a hypothetical $10,000 investment)
| Class Name | Costs of a $10,000 investment | Costs paid as a percentage of a $10,000 investment |
|---|
| Class II | $56 | 1.12% |
| Footnote | Description |
Footnote1 | Does not reflect fees and expenses imposed by your insurance company. You may pay fees other than the fees and expenses of the Fund, such as brokerage commissions and other fees charged by financial intermediaries. |
| Total Net Assets | $67,772,326 |
| # of Portfolio Holdings | 58 |
| Portfolio Turnover Rate | 24% |
What did the Fund invest in?
The following tables reflect what the Fund invested in as of the report date.
Sector Allocation (% of total investments)
| Value | Value |
|---|
| Communication Services | 3.1% |
| Short-Term Investments | 4.2% |
| Financials | 9.2% |
| Industrials | 17.7% |
| Energy | 25.7% |
| Utilities | 40.1% |
Top Ten Holdings (% of total investments)Footnote Referencea
| National Grid PLC | 7.5% |
| American Tower Corp. | 7.1% |
| GFL Environmental, Inc. | 5.4% |
| Enbridge, Inc. | 5.0% |
| ONEOK, Inc. | 4.0% |
| Pembina Pipeline Corp. | 3.7% |
| Sempra | 3.6% |
| Targa Resources Corp. | 3.6% |
| Grupo Aeroportuario del Pacifico SAB de CV | 3.2% |
| Cheniere Energy, Inc. | 2.8% |
| Total | 45.9% |
| Footnote | Description |
Footnotea | Excluding cash equivalents. |
If you wish to view additional information about the Fund, including the prospectus, statement of additional information, financial statements and holdings, please scan the QR code or visit www.morganstanley.com/im/shareholderreports. For proxy information, please visit www.morganstanley.com/im/en-us/institutional-investor/about-us/proxy-voting/vote-summary-report.desktop.html.
The Funds may deliver a single copy of certain required shareholder documents (including prospectuses, shareholder reports, and proxy materials) to investors with the same last name and the same address. Your participation will continue indefinitely unless you instruct otherwise by contacting your financial intermediary.
The Fund is intended to be a funding vehicle for variable annuity contracts and variable life insurance policies offered by the separate accounts of certain life insurance companies.
Not FDIC Insured | May Lose Value | No Bank Guarantee
Semi-Annual Shareholder Report June 30, 2024
Morgan Stanley Variable Insurance Fund, Inc. - Global Real Estate Portfolio
Semi-Annual Shareholder Report June 30, 2024
This semi-annual shareholder report contains important information about Morgan Stanley Variable Insurance Fund, Inc. - Global Real Estate Portfolio for the period of January 1, 2024 to June 30, 2024. You can find additional information about the Fund at www.morganstanley.com/im/shareholderreports. You can also request this information by contacting us at 1-800-869-6397.
What were the Fund costs for the last six months?Footnote Reference1
(based on a hypothetical $10,000 investment)
| Class Name | Costs of a $10,000 investment | Costs paid as a percentage of a $10,000 investment |
|---|
| Class II | $54 | 1.10% |
| Footnote | Description |
Footnote1 | Does not reflect fees and expenses imposed by your insurance company. You may pay fees other than the fees and expenses of the Fund, such as brokerage commissions and other fees charged by financial intermediaries. |
| Total Net Assets | $32,876,582 |
| # of Portfolio Holdings | 81 |
| Portfolio Turnover Rate | 26% |
What did the Fund invest in?
The following tables reflect what the Fund invested in as of the report date.
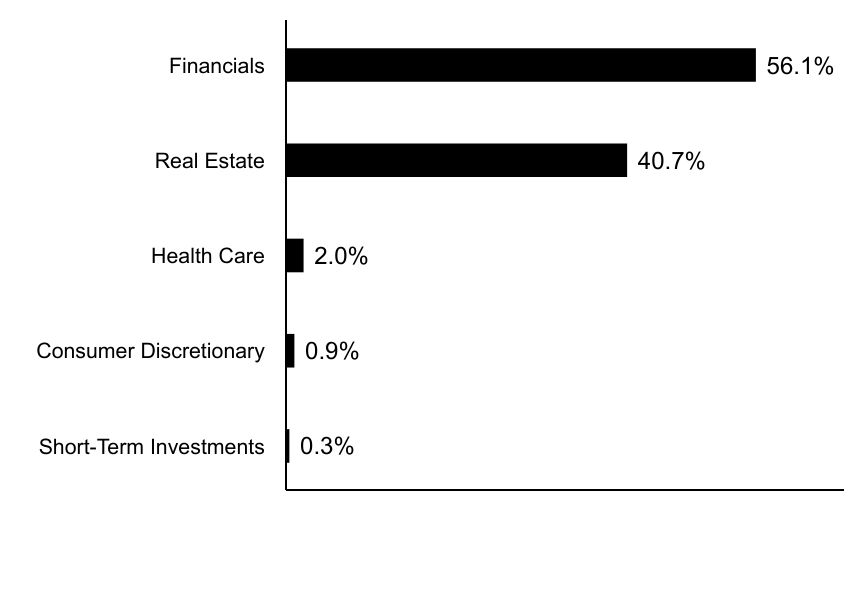
Sector Allocation (% of total investments)
| Value | Value |
|---|
| Short-Term Investments | 0.3% |
| Consumer Discretionary | 0.9% |
| Health Care | 2.0% |
| Real Estate | 40.7% |
| Financials | 56.1% |
Top Ten Holdings (% of total investments)
| Welltower, Inc. | 6.6% |
| Equinix, Inc. | 5.5% |
| AvalonBay Communities, Inc. | 4.7% |
| Prologis, Inc. | 4.5% |
| Digital Realty Trust, Inc. | 3.9% |
| Goodman Group | 3.6% |
| Public Storage | 3.5% |
| Simon Property Group, Inc. | 3.4% |
| Extra Space Storage, Inc. | 2.7% |
| American Homes 4 Rent | 2.6% |
| Total | 41.0% |
If you wish to view additional information about the Fund, including the prospectus, statement of additional information, financial statements and holdings, please scan the QR code or visit www.morganstanley.com/im/shareholderreports. For proxy information, please visit www.morganstanley.com/im/en-us/institutional-investor/about-us/proxy-voting/vote-summary-report.desktop.html.
The Funds may deliver a single copy of certain required shareholder documents (including prospectuses, shareholder reports, and proxy materials) to investors with the same last name and the same address. Your participation will continue indefinitely unless you instruct otherwise by contacting your financial intermediary.
The Fund is intended to be a funding vehicle for variable annuity contracts and variable life insurance policies offered by the separate accounts of certain life insurance companies.
Not FDIC Insured | May Lose Value | No Bank Guarantee
Semi-Annual Shareholder Report June 30, 2024
Morgan Stanley Variable Insurance Fund, Inc. - Global Strategist Portfolio
Semi-Annual Shareholder Report June 30, 2024
This semi-annual shareholder report contains important information about Morgan Stanley Variable Insurance Fund, Inc. - Global Strategist Portfolio for the period of January 1, 2024 to June 30, 2024. You can find additional information about the Fund at www.morganstanley.com/im/shareholderreports. You can also request this information by contacting us at 1-800-869-6397.
What were the Fund costs for the last six months?Footnote Reference1
(based on a hypothetical $10,000 investment)
| Class Name | Costs of a $10,000 investment | Costs paid as a percentage of a $10,000 investment |
|---|
| Class I | $45 | 0.88% |
| Footnote | Description |
Footnote1 | Does not reflect fees and expenses imposed by your insurance company. You may pay fees other than the fees and expenses of the Fund, such as brokerage commissions and other fees charged by financial intermediaries. |
| Total Net Assets | $83,537,235 |
| # of Portfolio Holdings | 1,484 |
| Portfolio Turnover Rate | 49% |
What did the Fund invest in?
The following tables reflect what the Fund invested in as of the report date.
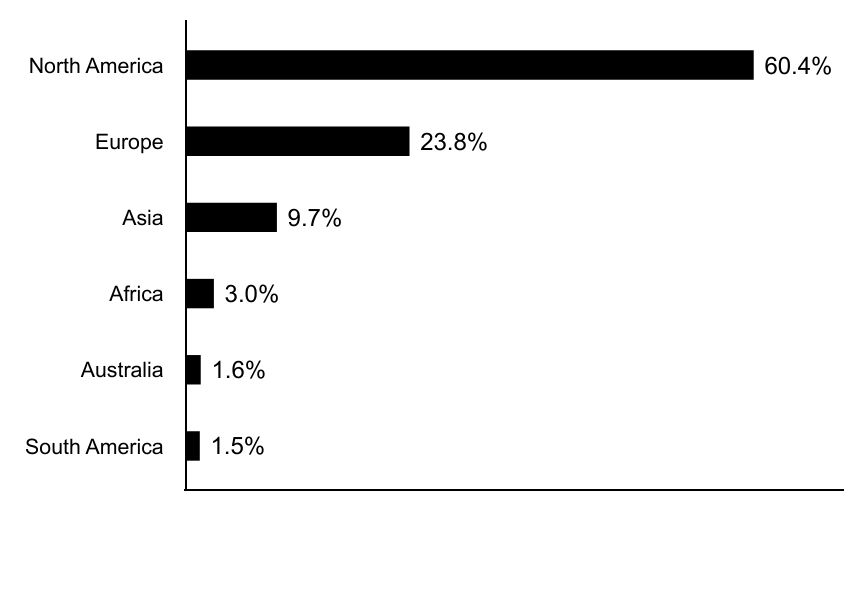
Geographic Allocation (% of total investments)
| Value | Value |
|---|
| South America | 1.5% |
| Australia | 1.6% |
| Africa | 3.0% |
| Asia | 9.7% |
| Europe | 23.8% |
| North America | 60.4% |
Top Ten Holdings (% of total investments)Footnote Referencea
| China Government Bond | 5.9% |
| U.S. Treasury Notes | 3.9% |
| Federal National Mortgage Association | 3.1% |
| Republic of South Africa Government Bond | 2.2% |
| Bundesrepublik Deutschland Bundesanleihe | 2.1% |
| Microsoft Corp. | 1.5% |
| NVIDIA Corp. | 1.5% |
| Apple, Inc. | 1.4% |
| United Kingdom Gilt | 1.2% |
| Brazil Notas do Tesouro Nacional | 1.2% |
| Total | 24.0% |
| Footnote | Description |
Footnotea | Excluding cash equivalents. |
If you wish to view additional information about the Fund, including the prospectus, statement of additional information, financial statements and holdings, please scan the QR code or visit www.morganstanley.com/im/shareholderreports. For proxy information, please visit www.morganstanley.com/im/en-us/institutional-investor/about-us/proxy-voting/vote-summary-report.desktop.html.
The Funds may deliver a single copy of certain required shareholder documents (including prospectuses, shareholder reports, and proxy materials) to investors with the same last name and the same address. Your participation will continue indefinitely unless you instruct otherwise by contacting your financial intermediary.
The Fund is intended to be a funding vehicle for variable annuity contracts and variable life insurance policies offered by the separate accounts of certain life insurance companies.
Not FDIC Insured | May Lose Value | No Bank Guarantee
Semi-Annual Shareholder Report June 30, 2024
Morgan Stanley Variable Insurance Fund, Inc. - Global Strategist Portfolio
Semi-Annual Shareholder Report June 30, 2024
This semi-annual shareholder report contains important information about Morgan Stanley Variable Insurance Fund, Inc. - Global Strategist Portfolio for the period of January 1, 2024 to June 30, 2024. You can find additional information about the Fund at www.morganstanley.com/im/shareholderreports. You can also request this information by contacting us at 1-800-869-6397.
What were the Fund costs for the last six months?Footnote Reference1
(based on a hypothetical $10,000 investment)
| Class Name | Costs of a $10,000 investment | Costs paid as a percentage of a $10,000 investment |
|---|
| Class II | $50 | 0.98% |
| Footnote | Description |
Footnote1 | Does not reflect fees and expenses imposed by your insurance company. You may pay fees other than the fees and expenses of the Fund, such as brokerage commissions and other fees charged by financial intermediaries. |
| Total Net Assets | $83,537,235 |
| # of Portfolio Holdings | 1,484 |
| Portfolio Turnover Rate | 49% |
What did the Fund invest in?
The following tables reflect what the Fund invested in as of the report date.
Geographic Allocation (% of total investments)
| Value | Value |
|---|
| South America | 1.5% |
| Australia | 1.6% |
| Africa | 3.0% |
| Asia | 9.7% |
| Europe | 23.8% |
| North America | 60.4% |
Top Ten Holdings (% of total investments)Footnote Referencea
| China Government Bond | 5.9% |
| U.S. Treasury Notes | 3.9% |
| Federal National Mortgage Association | 3.1% |
| Republic of South Africa Government Bond | 2.2% |
| Bundesrepublik Deutschland Bundesanleihe | 2.1% |
| Microsoft Corp. | 1.5% |
| NVIDIA Corp. | 1.5% |
| Apple, Inc. | 1.4% |
| United Kingdom Gilt | 1.2% |
| Brazil Notas do Tesouro Nacional | 1.2% |
| Total | 24.0% |
| Footnote | Description |
Footnotea | Excluding cash equivalents. |
If you wish to view additional information about the Fund, including the prospectus, statement of additional information, financial statements and holdings, please scan the QR code or visit www.morganstanley.com/im/shareholderreports. For proxy information, please visit www.morganstanley.com/im/en-us/institutional-investor/about-us/proxy-voting/vote-summary-report.desktop.html.
The Funds may deliver a single copy of certain required shareholder documents (including prospectuses, shareholder reports, and proxy materials) to investors with the same last name and the same address. Your participation will continue indefinitely unless you instruct otherwise by contacting your financial intermediary.
The Fund is intended to be a funding vehicle for variable annuity contracts and variable life insurance policies offered by the separate accounts of certain life insurance companies.
Not FDIC Insured | May Lose Value | No Bank Guarantee
Semi-Annual Shareholder Report June 30, 2024
Morgan Stanley Variable Insurance Fund, Inc. - Growth Portfolio
Semi-Annual Shareholder Report June 30, 2024
This semi-annual shareholder report contains important information about Morgan Stanley Variable Insurance Fund, Inc. - Growth Portfolio for the period of January 1, 2024 to June 30, 2024. You can find additional information about the Fund at www.morganstanley.com/im/shareholderreports. You can also request this information by contacting us at 1-800-869-6397.
What were the Fund costs for the last six months?Footnote Reference1
(based on a hypothetical $10,000 investment)
| Class Name | Costs of a $10,000 investment | Costs paid as a percentage of a $10,000 investment |
|---|
| Class I | $28 | 0.56% |
| Footnote | Description |
Footnote1 | Does not reflect fees and expenses imposed by your insurance company. You may pay fees other than the fees and expenses of the Fund, such as brokerage commissions and other fees charged by financial intermediaries. |
| Total Net Assets | $482,128,873 |
| # of Portfolio Holdings | 42 |
| Portfolio Turnover Rate | 18% |
What did the Fund invest in?
The following tables reflect what the Fund invested in as of the report date.
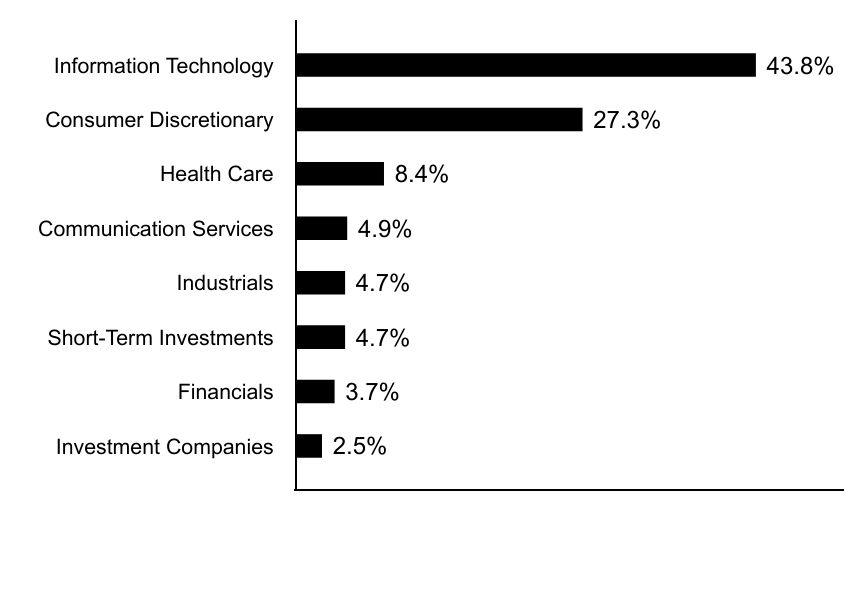
Sector Allocation (% of total investments)
| Value | Value |
|---|
| Investment Companies | 2.5% |
| Financials | 3.7% |
| Short-Term Investments | 4.7% |
| Industrials | 4.7% |
| Communication Services | 4.9% |
| Health Care | 8.4% |
| Consumer Discretionary | 27.3% |
| Information Technology | 43.8% |
Top Ten Holdings (% of total investments)Footnote Referencea
| Cloudflare, Inc. | 8.3% |
| Trade Desk, Inc. | 7.5% |
| DoorDash, Inc. | 7.0% |
| Shopify, Inc. | 6.0% |
| Tesla, Inc. | 5.6% |
| ROBLOX Corp. | 4.9% |
| Snowflake, Inc. | 4.8% |
| Airbnb, Inc. | 4.7% |
| Affirm Holdings, Inc. | 4.7% |
| Royalty Pharma PLC | 4.6% |
| Total | 58.1% |
| Footnote | Description |
Footnotea | Excluding cash equivalents. |
If you wish to view additional information about the Fund, including the prospectus, statement of additional information, financial statements and holdings, please scan the QR code or visit www.morganstanley.com/im/shareholderreports. For proxy information, please visit www.morganstanley.com/im/en-us/institutional-investor/about-us/proxy-voting/vote-summary-report.desktop.html.
The Funds may deliver a single copy of certain required shareholder documents (including prospectuses, shareholder reports, and proxy materials) to investors with the same last name and the same address. Your participation will continue indefinitely unless you instruct otherwise by contacting your financial intermediary.
The Fund is intended to be a funding vehicle for variable annuity contracts and variable life insurance policies offered by the separate accounts of certain life insurance companies.
Not FDIC Insured | May Lose Value | No Bank Guarantee
Semi-Annual Shareholder Report June 30, 2024
Morgan Stanley Variable Insurance Fund, Inc. - Growth Portfolio
Semi-Annual Shareholder Report June 30, 2024
This semi-annual shareholder report contains important information about Morgan Stanley Variable Insurance Fund, Inc. - Growth Portfolio for the period of January 1, 2024 to June 30, 2024. You can find additional information about the Fund at www.morganstanley.com/im/shareholderreports. You can also request this information by contacting us at 1-800-869-6397.
What were the Fund costs for the last six months?Footnote Reference1
(based on a hypothetical $10,000 investment)
| Class Name | Costs of a $10,000 investment | Costs paid as a percentage of a $10,000 investment |
|---|
| Class II | $40 | 0.81% |
| Footnote | Description |
Footnote1 | Does not reflect fees and expenses imposed by your insurance company. You may pay fees other than the fees and expenses of the Fund, such as brokerage commissions and other fees charged by financial intermediaries. |
| Total Net Assets | $482,128,873 |
| # of Portfolio Holdings | 42 |
| Portfolio Turnover Rate | 18% |
What did the Fund invest in?
The following tables reflect what the Fund invested in as of the report date.
Sector Allocation (% of total investments)
| Value | Value |
|---|
| Investment Companies | 2.5% |
| Financials | 3.7% |
| Short-Term Investments | 4.7% |
| Industrials | 4.7% |
| Communication Services | 4.9% |
| Health Care | 8.4% |
| Consumer Discretionary | 27.3% |
| Information Technology | 43.8% |
Top Ten Holdings (% of total investments)Footnote Referencea
| Cloudflare, Inc. | 8.3% |
| Trade Desk, Inc. | 7.5% |
| DoorDash, Inc. | 7.0% |
| Shopify, Inc. | 6.0% |
| Tesla, Inc. | 5.6% |
| ROBLOX Corp. | 4.9% |
| Snowflake, Inc. | 4.8% |
| Airbnb, Inc. | 4.7% |
| Affirm Holdings, Inc. | 4.7% |
| Royalty Pharma PLC | 4.6% |
| Total | 58.1% |
| Footnote | Description |
Footnotea | Excluding cash equivalents. |
If you wish to view additional information about the Fund, including the prospectus, statement of additional information, financial statements and holdings, please scan the QR code or visit www.morganstanley.com/im/shareholderreports. For proxy information, please visit www.morganstanley.com/im/en-us/institutional-investor/about-us/proxy-voting/vote-summary-report.desktop.html.
The Funds may deliver a single copy of certain required shareholder documents (including prospectuses, shareholder reports, and proxy materials) to investors with the same last name and the same address. Your participation will continue indefinitely unless you instruct otherwise by contacting your financial intermediary.
The Fund is intended to be a funding vehicle for variable annuity contracts and variable life insurance policies offered by the separate accounts of certain life insurance companies.
Not FDIC Insured | May Lose Value | No Bank Guarantee
Semi-Annual Shareholder Report June 30, 2024
Morgan Stanley Variable Insurance Fund, Inc. - U.S. Real Estate Portfolio
Semi-Annual Shareholder Report June 30, 2024
This semi-annual shareholder report contains important information about Morgan Stanley Variable Insurance Fund, Inc. - U.S. Real Estate Portfolio for the period of January 1, 2024 to June 30, 2024. You can find additional information about the Fund at www.morganstanley.com/im/shareholderreports. You can also request this information by contacting us at 1-800-869-6397.
What were the Fund costs for the last six months?Footnote Reference1
(based on a hypothetical $10,000 investment)
| Class Name | Costs of a $10,000 investment | Costs paid as a percentage of a $10,000 investment |
|---|
| Class I | $40 | 0.80% |
| Footnote | Description |
Footnote1 | Does not reflect fees and expenses imposed by your insurance company. You may pay fees other than the fees and expenses of the Fund, such as brokerage commissions and other fees charged by financial intermediaries. |
| Total Net Assets | $253,059,781 |
| # of Portfolio Holdings | 35 |
| Portfolio Turnover Rate | 23% |
What did the Fund invest in?
The following tables reflect what the Fund invested in as of the report date.
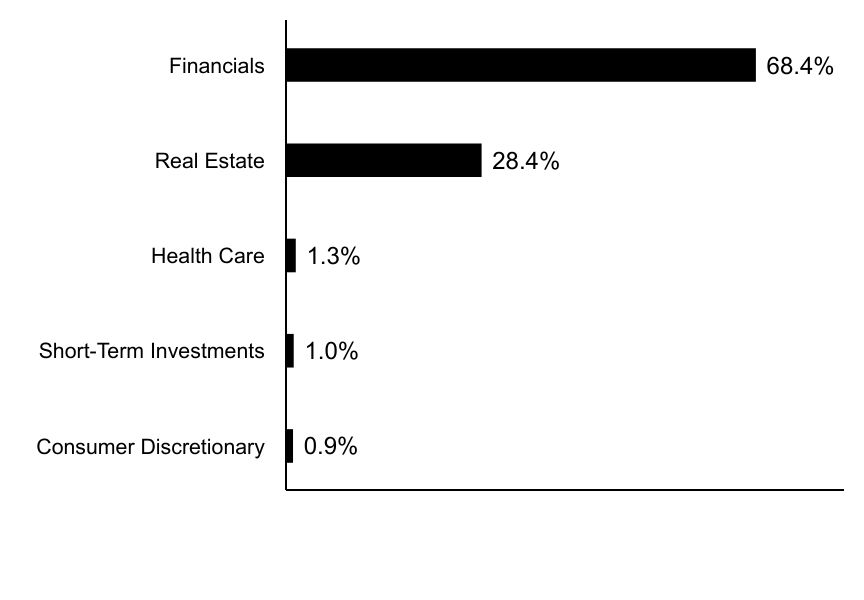
Sector Allocation (% of total investments)
| Value | Value |
|---|
| Consumer Discretionary | 0.9% |
| Short-Term Investments | 1.0% |
| Health Care | 1.3% |
| Real Estate | 28.4% |
| Financials | 68.4% |
Top Ten Holdings (% of total investments)
| Equinix, Inc. | 8.5% |
| Welltower, Inc. | 8.3% |
| Prologis, Inc. | 7.4% |
| AvalonBay Communities, Inc. | 6.4% |
| Digital Realty Trust, Inc. | 5.6% |
| Simon Property Group, Inc. | 4.8% |
| Extra Space Storage, Inc. | 4.7% |
| Public Storage | 4.7% |
| Iron Mountain, Inc. | 4.0% |
| American Homes 4 Rent | 3.9% |
| Total | 58.3% |
If you wish to view additional information about the Fund, including the prospectus, statement of additional information, financial statements and holdings, please scan the QR code or visit www.morganstanley.com/im/shareholderreports. For proxy information, please visit www.morganstanley.com/im/en-us/institutional-investor/about-us/proxy-voting/vote-summary-report.desktop.html.
The Funds may deliver a single copy of certain required shareholder documents (including prospectuses, shareholder reports, and proxy materials) to investors with the same last name and the same address. Your participation will continue indefinitely unless you instruct otherwise by contacting your financial intermediary.
The Fund is intended to be a funding vehicle for variable annuity contracts and variable life insurance policies offered by the separate accounts of certain life insurance companies.
Not FDIC Insured | May Lose Value | No Bank Guarantee
Semi-Annual Shareholder Report June 30, 2024
Morgan Stanley Variable Insurance Fund, Inc. - U.S. Real Estate Portfolio
Semi-Annual Shareholder Report June 30, 2024
This semi-annual shareholder report contains important information about Morgan Stanley Variable Insurance Fund, Inc. - U.S. Real Estate Portfolio for the period of January 1, 2024 to June 30, 2024. You can find additional information about the Fund at www.morganstanley.com/im/shareholderreports. You can also request this information by contacting us at 1-800-869-6397.
What were the Fund costs for the last six months?Footnote Reference1
(based on a hypothetical $10,000 investment)
| Class Name | Costs of a $10,000 investment | Costs paid as a percentage of a $10,000 investment |
|---|
| Class II | $52 | 1.05% |
| Footnote | Description |
Footnote1 | Does not reflect fees and expenses imposed by your insurance company. You may pay fees other than the fees and expenses of the Fund, such as brokerage commissions and other fees charged by financial intermediaries. |
| Total Net Assets | $253,059,781 |
| # of Portfolio Holdings | 35 |
| Portfolio Turnover Rate | 23% |
What did the Fund invest in?
The following tables reflect what the Fund invested in as of the report date.
Sector Allocation (% of total investments)
| Value | Value |
|---|
| Consumer Discretionary | 0.9% |
| Short-Term Investments | 1.0% |
| Health Care | 1.3% |
| Real Estate | 28.4% |
| Financials | 68.4% |
Top Ten Holdings (% of total investments)
| Equinix, Inc. | 8.5% |
| Welltower, Inc. | 8.3% |
| Prologis, Inc. | 7.4% |
| AvalonBay Communities, Inc. | 6.4% |
| Digital Realty Trust, Inc. | 5.6% |
| Simon Property Group, Inc. | 4.8% |
| Extra Space Storage, Inc. | 4.7% |
| Public Storage | 4.7% |
| Iron Mountain, Inc. | 4.0% |
| American Homes 4 Rent | 3.9% |
| Total | 58.3% |
If you wish to view additional information about the Fund, including the prospectus, statement of additional information, financial statements and holdings, please scan the QR code or visit www.morganstanley.com/im/shareholderreports. For proxy information, please visit www.morganstanley.com/im/en-us/institutional-investor/about-us/proxy-voting/vote-summary-report.desktop.html.
The Funds may deliver a single copy of certain required shareholder documents (including prospectuses, shareholder reports, and proxy materials) to investors with the same last name and the same address. Your participation will continue indefinitely unless you instruct otherwise by contacting your financial intermediary.
The Fund is intended to be a funding vehicle for variable annuity contracts and variable life insurance policies offered by the separate accounts of certain life insurance companies.
Not FDIC Insured | May Lose Value | No Bank Guarantee
Semi-Annual Shareholder Report June 30, 2024
Morgan Stanley Variable Insurance Fund, Inc. - Emerging Markets Debt Portfolio
Semi-Annual Shareholder Report June 30, 2024
This semi-annual shareholder report contains important information about Morgan Stanley Variable Insurance Fund, Inc. - Emerging Markets Debt Portfolio for the period of January 1, 2024 to June 30, 2024. You can find additional information about the Fund at www.morganstanley.com/im/shareholderreports. You can also request this information by contacting us at 1-800-869-6397.
What were the Fund costs for the last six months?Footnote Reference1
(based on a hypothetical $10,000 investment)
| Class Name | Cost of a $10,000 investment | Costs paid as a percentage of a $10,000 investment |
|---|
| Class I | $56 | 1.09% |
| Footnote | Description |
Footnote1 | Does not reflect fees and expenses imposed by your insurance company. You may pay fees other than the fees and expenses of the Fund, such as brokerage commissions and other fees charged by financial intermediaries. |
| Total Net Assets | $103,551,756 |
| # of Portfolio Holdings | 240 |
| Portfolio Turnover Rate | 89% |
What did the Fund invest in?
The following tables reflect what the Fund invested in as of the report date.
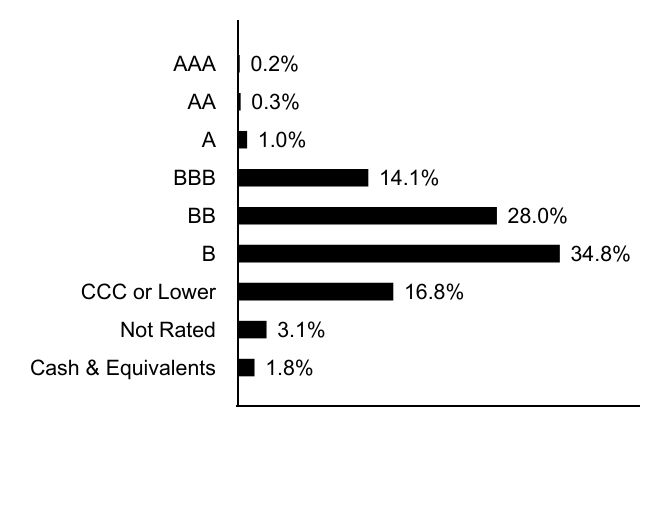
Credit Quality (% of net assets)Footnote Reference*
| Value | Value |
|---|
| Cash & Equivalents | 1.8% |
| Not Rated | 3.1% |
| CCC or Lower | 16.8% |
| B | 34.8% |
| BB | 28.0% |
| BBB | 14.1% |
| A | 1.0% |
| AA | 0.3% |
| AAA | 0.2% |
| Footnote | Description |
Footnote* | Security ratings disclosed with the exception for those labeled “not rated” is an aggregation of the highest security level rating amongst S&P Global Ratings, Moody’s Investors Services, Inc., and Fitch Ratings, each a Nationally Recognized Statistical Ratings Organization (“NRSRO”). |
Asset Allocation (% of total investments)
| Value | Value |
|---|
| Warrants | 0.0%Footnote Reference† |
| U.S. Treasury Securities | 0.2% |
| Senior Loan Interest | 4.8% |
| Corporate Bonds | 25.8% |
| Sovereign | 69.2% |
| Footnote | Description |
Footnote† | Amount is less than 0.05% |
If you wish to view additional information about the Fund, including the prospectus, statement of additional information, financial statements and holdings, please scan the QR code or visit www.morganstanley.com/im/shareholderreports. For proxy information, please visit www.morganstanley.com/im/en-us/institutional-investor/about-us/proxy-voting/vote-summary-report.desktop.html.
The Funds may deliver a single copy of certain required shareholder documents (including prospectuses, shareholder reports, and proxy materials) to investors with the same last name and the same address. Your participation will continue indefinitely unless you instruct otherwise by contacting your financial intermediary.
The Fund is intended to be a funding vehicle for variable annuity contracts and variable life insurance policies offered by the separate accounts of certain life insurance companies.
Not FDIC Insured | May Lose Value | No Bank Guarantee
Semi-Annual Shareholder Report June 30, 2024
Morgan Stanley Variable Insurance Fund, Inc. - Emerging Markets Debt Portfolio
Semi-Annual Shareholder Report June 30, 2024
This semi-annual shareholder report contains important information about Morgan Stanley Variable Insurance Fund, Inc. - Emerging Markets Debt Portfolio for the period of January 1, 2024 to June 30, 2024. You can find additional information about the Fund at www.morganstanley.com/im/shareholderreports. You can also request this information by contacting us at 1-800-869-6397.
What were the Fund costs for the last six months?Footnote Reference1
(based on a hypothetical $10,000 investment)
| Class Name | Cost of a $10,000 investment | Costs paid as a percentage of a $10,000 investment |
|---|
| Class II | $58 | 1.14% |
| Footnote | Description |
Footnote1 | Does not reflect fees and expenses imposed by your insurance company. You may pay fees other than the fees and expenses of the Fund, such as brokerage commissions and other fees charged by financial intermediaries. |
| Total Net Assets | $103,551,756 |
| # of Portfolio Holdings | 240 |
| Portfolio Turnover Rate | 89% |
What did the Fund invest in?
The following tables reflect what the Fund invested in as of the report date.
Credit Quality (% of net assets)Footnote Reference*
| Value | Value |
|---|
| Cash & Equivalents | 1.8% |
| Not Rated | 3.1% |
| CCC or Lower | 16.8% |
| B | 34.8% |
| BB | 28.0% |
| BBB | 14.1% |
| A | 1.0% |
| AA | 0.3% |
| AAA | 0.2% |
| Footnote | Description |
Footnote* | Security ratings disclosed with the exception for those labeled “not rated” is an aggregation of the highest security level rating amongst S&P Global Ratings, Moody’s Investors Services, Inc., and Fitch Ratings, each a Nationally Recognized Statistical Ratings Organization (“NRSRO”). |
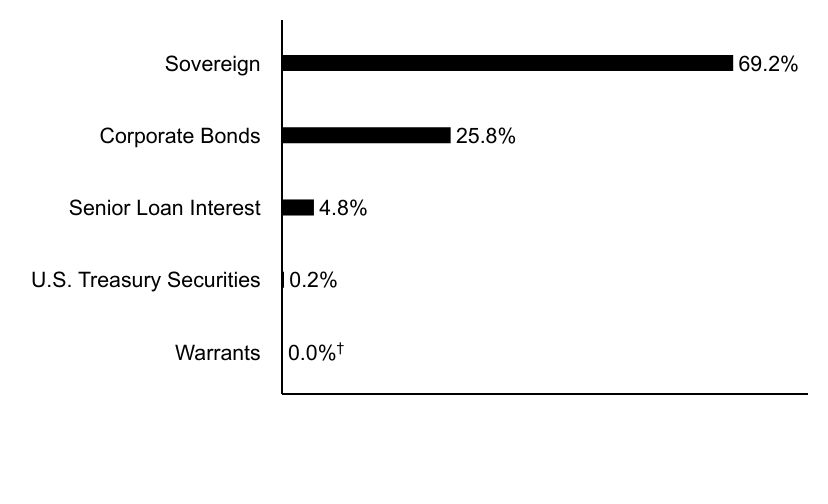
Asset Allocation (% of total investments)
| Value | Value |
|---|
| Warrants | 0.0%Footnote Reference† |
| U.S. Treasury Securities | 0.2% |
| Senior Loan Interest | 4.8% |
| Corporate Bonds | 25.8% |
| Sovereign | 69.2% |
| Footnote | Description |
Footnote† | Amount is less than 0.05% |
If you wish to view additional information about the Fund, including the prospectus, statement of additional information, financial statements and holdings, please scan the QR code or visit www.morganstanley.com/im/shareholderreports. For proxy information, please visit www.morganstanley.com/im/en-us/institutional-investor/about-us/proxy-voting/vote-summary-report.desktop.html.
The Funds may deliver a single copy of certain required shareholder documents (including prospectuses, shareholder reports, and proxy materials) to investors with the same last name and the same address. Your participation will continue indefinitely unless you instruct otherwise by contacting your financial intermediary.
The Fund is intended to be a funding vehicle for variable annuity contracts and variable life insurance policies offered by the separate accounts of certain life insurance companies.
Not FDIC Insured | May Lose Value | No Bank Guarantee
Semi-Annual Shareholder Report June 30, 2024
(b) Not applicable.
Item 2. Code of Ethics
Not required in this filing.
Item 3. Audit Committee Financial Expert
Not required in this filing.
Item 4. Principal Accountant Fees and Services
Not required in this filing.
Item 5. Audit Committee of Listed Registrants
Not applicable.
Item 6. Schedule of Investments
| (a) | Please see schedule of investments contained in the Financial Statements and Financial Highlights included under Item 7 of this Form N-CSR. |
Item 7. Financial Statements and Financial Highlights for Open-End Management Investment Companies

Morgan Stanley Variable Insurance Fund, Inc.
Semi-Annual Financial Statements and Additional Information
June 30, 2024 (unaudited)
The Fund is intended to be a funding vehicle for variable annuity contracts and variable life insurance policies offered by the separate accounts of certain life insurance companies.
Morgan Stanley Variable Insurance Fund, Inc.
June 30, 2024 (unaudited)
1
Morgan Stanley Variable Insurance Fund, Inc.
June 30, 2024 (unaudited)
Consolidated Portfolio of Investments
Discovery Portfolio
| | | Shares | | Value
(000) | |
Common Stocks (92.0%) | |
Automobiles (0.2%) | |
Rivian Automotive, Inc., Class A (a) | | | 25,992 | | | $ | 349 | | |
Biotechnology (2.6%) | |
Alnylam Pharmaceuticals, Inc. (a) | | | 1,597 | | | | 388 | | |
Argenx SE ADR (Belgium) (a) | | | 995 | | | | 428 | | |
Intellia Therapeutics, Inc. (a) | | | 17,585 | | | | 393 | | |
ProKidney Corp. (a) | | | 126,796 | | | | 312 | | |
Roivant Sciences Ltd. (a) | | | 240,294 | | | | 2,540 | | |
| | | | 4,061 | | |
Broadline Retail (6.8%) | |
Coupang, Inc. (Korea, Republic of) (a) | | | 106,541 | | | | 2,232 | | |
Global-e Online Ltd. (Israel) (a) | | | 228,952 | | | | 8,304 | | |
| | | | 10,536 | | |
Consumer Staples Distribution & Retail (2.4%) | |
Maplebear, Inc. (a) | | | 116,082 | | | | 3,731 | | |
Entertainment (5.0%) | |
ROBLOX Corp., Class A (a) | | | 205,968 | | | | 7,664 | | |
Financial Services (8.8%) | |
Adyen NV (Netherlands) (a) | | | 4,587 | | | | 5,448 | | |
Affirm Holdings, Inc. (a) | | | 271,527 | | | | 8,203 | | |
| | | | 13,651 | | |
Ground Transportation (1.9%) | |
Grab Holdings Ltd., Class A (Singapore) (a) | | | 833,227 | | | | 2,958 | | |
Health Care Equipment & Supplies (0.8%) | |
Dexcom, Inc. (a) | | | 4,174 | | | | 473 | | |
Penumbra, Inc. (a) | | | 3,851 | | | | 693 | | |
| | | | 1,166 | | |
Health Care Providers & Services (3.3%) | |
Agilon Health, Inc. (a) | | | 778,177 | | | | 5,089 | | |
Health Care Technology (1.7%) | |
Doximity, Inc., Class A (a) | | | 95,044 | | | | 2,658 | | |
Hotels, Restaurants & Leisure (7.0%) | |
DoorDash, Inc., Class A (a) | | | 98,858 | | | | 10,754 | | |
Information Technology Services (11.0%) | |
Cloudflare, Inc., Class A (a) | | | 154,815 | | | | 12,825 | | |
Fastly, Inc., Class A (a) | | | 195,285 | | | | 1,439 | | |
MongoDB, Inc. (a) | | | 4,250 | | | | 1,063 | | |
Snowflake, Inc., Class A (a) | | | 12,046 | | | | 1,627 | | |
| | | | 16,954 | | |
Leisure Products (1.0%) | |
Peloton Interactive, Inc., Class A (a) | | | 447,993 | | | | 1,514 | | |
Life Sciences Tools & Services (0.9%) | |
10X Genomics, Inc., Class A (a) | | | 70,178 | | | | 1,365 | | |
Machinery (0.4%) | |
Symbotic, Inc. (a) | | | 16,232 | | | | 571 | | |
Media (7.5%) | |
Trade Desk, Inc., Class A (a) | | | 118,787 | | | | 11,602 | | |
| | | Shares | | Value
(000) | |
Pharmaceuticals (4.6%) | |
Royalty Pharma PLC, Class A | | | 268,105 | | | $ | 7,070 | | |
Software (17.7%) | |
Aurora Innovation, Inc. (a) | | | 835,691 | | | | 2,315 | | |
Bill Holdings, Inc. (a) | | | 66,563 | | | | 3,503 | | |
Gitlab, Inc., Class A (a) | | | 35,113 | | | | 1,746 | | |
MicroStrategy, Inc., Class A (a) | | | 3,622 | | | | 4,989 | | |
Procore Technologies, Inc. (a) | | | 80,111 | | | | 5,312 | | |
QXO, Inc. (a)(b) | | | 159,538 | | | | 1,458 | | |
Samsara, Inc., Class A (a) | | | 239,779 | | | | 8,081 | | |
| | | | 27,404 | | |
Specialty Retail (5.9%) | |
Carvana Co. (a) | | | 49,140 | | | | 6,325 | | |
Chewy, Inc., Class A (a) | | | 100,872 | | | | 2,748 | | |
| | | | 9,073 | | |
Textiles, Apparel & Luxury Goods (2.5%) | |
On Holding AG, Class A (Switzerland) (a) | | | 98,801 | | | | 3,834 | | |
Total Common Stocks (Cost $154,722) | | | 142,004 | | |
Preferred Stocks (2.1%) | |
Software (2.1%) | |
Databricks, Inc., Series H (a)(c)(d) (acquisition
cost — $2,666; acquired 8/31/21) | | | 36,279 | | | | 2,618 | | |
Databricks, Inc., Series I (a)(c)(d) (acquisition
cost — $709; acquired 9/15/23) | | | 9,645 | | | | 696 | | |
Total Preferred Stocks (Cost $3,375) | | | 3,314 | | |
Investment Company (2.5%) | |
| iShares Bitcoin Trust (a) (Cost $4,346) | | | 112,303 | | | | 3,834 | | |
Short-Term Investment (4.4%) | |
Investment Company (4.4%) | |
Morgan Stanley Institutional Liquidity Funds —
Treasury Securities Portfolio — Institutional
Class, 5.14% (See Note H) (Cost $6,786) | | | 6,786,438 | | | | 6,786 | | |
Total Investments Excluding Purchased
Options (101.0%) (Cost $169,229) | | | | | 155,938 | | |
Total Purchased Options Outstanding (0.1%)
(Cost $473) | | | 151 | | |
| Total Investments (101.1%) (Cost $169,702) (e)(f)(g) | | | 156,089 | | |
Liabilities in Excess of Other Assets (–1.1%) | | | (1,692 | ) | |
Net Assets (100.0%) | | $ | 154,397 | | |
(a) Non-income producing security.
(b) Security cannot be offered for public resale without first being registered under the Securities Act of 1933 and related rules ("restricted security"). The aggregate value of restricted securities (excluding 144A holdings) at June 30, 2024 amounts to approximately $1,458,000 and represents 0.9% of net assets.
(c) Security cannot be offered for public resale without first being registered under the Securities Act of 1933 and related rules ("restricted security"). Acquisition date represents the day on which an enforceable right to acquire such security is obtained and is presented along with related cost in the security description. The Fund has registration rights for certain restricted securities. Any costs related to such registration are borne by the issuer. The aggregate value of restricted securities (excluding 144A holdings) at June 30, 2024 amounts to approximately $3,314,000 and represents 2.1% of net assets.
The accompanying notes are an integral part of the consolidated financial statements.
2
Morgan Stanley Variable Insurance Fund, Inc.
June 30, 2024 (unaudited)
Consolidated Portfolio of Investments (cont'd)
Discovery Portfolio
(d) At June 30, 2024, the Fund held fair valued securities valued at approximately $3,314,000, representing 2.1% of net assets. These securities have been fair valued using significant unobservable inputs as determined in good faith under procedures established by and under the general supervision of the Company's (as defined herein) Directors.
(e) The approximate fair value and percentage of net assets, $5,448,000 and 3.5%, respectively, represent the securities that have been fair valued under the fair valuation policy for international investments as described in Note A-1 within the Notes to Consolidated Financial Statements.
(f) Securities are available for collateral in connection with purchased options.
(g) At June 30, 2024, the aggregate cost for federal income tax purposes approximates the aggregate cost for book purposes. The aggregate gross unrealized appreciation is approximately $29,584,000 and the aggregate gross unrealized depreciation is approximately $43,197,000, resulting in net unrealized depreciation of approximately $13,613,000.
ADR American Depositary Receipt.
Call Options Purchased:
The Fund had the following call options purchased open at June 30, 2024:
Counterparty | | Description | | Strike
Price | | Expiration
Date | | Number of
Contracts | | Notional
Amount
(000) | | Value
(000) | | Premiums
Paid
(000) | | Unrealized
Depreciation
(000) | |
Goldman Sachs & Co. LLC | | USD/CNH | | CNH | 7.68 | | | Jan-25 | | | 40,809,074 | | | $ | 40,809 | | | $ | 66 | | | $ | 154 | | | $ | (88 | ) | |
JPMorgan Chase Bank NA | | USD/CNH | | CNH | 7.78 | | | Mar-25 | | | 40,113,584 | | | | 40,114 | | | | 84 | | | | 170 | | | | (86 | ) | |
JPMorgan Chase Bank NA | | USD/CNH | | CNH | 7.79 | | | Aug-24 | | | 36,061,106 | | | | 36,061 | | | | 1 | | | | 149 | | | | (148 | ) | |
| | | | | | | | | | | | | $ | 151 | | | $ | 473 | | | $ | (322 | ) | |
CNH — Chinese Yuan Renminbi Offshore
USD — United States Dollar
Portfolio Composition
Classification | | Percentage of
Total Investments | |
Other* | | | 33.9 | % | |
Software | | | 19.7 | | |
Information Technology Services | | | 10.9 | | |
Financial Services | | | 8.7 | | |
Media | | | 7.4 | | |
Hotels, Restaurants & Leisure | | | 6.9 | | |
Broadline Retail | | | 6.7 | | |
Specialty Retail | | | 5.8 | | |
Total Investments | | | 100.0 | % | |
* Industries and/or investment types representing less than 5% of total investments.
The accompanying notes are an integral part of the consolidated financial statements.
3
Morgan Stanley Variable Insurance Fund, Inc.
June 30, 2024 (unaudited)
Consolidated Statement of Assets and Liabilities | | June 30, 2024
(000) | |
Assets: | |
Investments in Securities of Unaffiliated Issuers, at Value (Cost $162,916) | | $ | 149,303 | | |
Investment in Security of Affiliated Issuer, at Value (Cost $6,786) | | | 6,786 | | |
Total Investments in Securities, at Value (Cost $169,702) | | | 156,089 | | |
Foreign Currency, at Value (Cost $1) | | | 1 | | |
Receivable for Investments Sold | | | 102 | | |
Receivable for Fund Shares Sold | | | 47 | | |
Receivable from Affiliate | | | 32 | | |
Receivable from Securities Lending Income | | | 1 | | |
Other Assets | | | 18 | | |
Total Assets | | | 156,290 | | |
Liabilities: | |
Payable for Investments Purchased | | | 1,458 | | |
Payable for Advisory Fees | | | 205 | | |
Payable for Fund Shares Redeemed | | | 69 | | |
Payable for Servicing Fees | | | 60 | | |
Payable for Professional Fees | | | 54 | | |
Payable for Administration Fees | | | 10 | | |
Payable for Distribution Fees — Class II Shares | | | 10 | | |
Payable for Custodian Fees | | | 7 | | |
Payable for Transfer Agency Fees | | | 2 | | |
Other Liabilities | | | 18 | | |
Total Liabilities | | | 1,893 | | |
NET ASSETS | | $ | 154,397 | | |
Net Assets Consist of: | |
Paid-in-Capital | | $ | 296,121 | | |
Total Accumulated Loss | | | (141,724 | ) | |
Net Assets | | $ | 154,397 | | |
CLASS I: | |
Net Assets | | $ | 29,803 | | |
Net Asset Value, Offering and Redemption Price Per Share Applicable to 6,484,794 Outstanding
$0.001 Par Value Shares (Authorized 500,000,000 Shares) | | $ | 4.60 | | |
CLASS II: | |
Net Assets | | $ | 124,594 | | |
Net Asset Value, Offering and Redemption Price Per Share Applicable to 30,738,877 Outstanding
$0.001 Par Value Shares (Authorized 500,000,000 Shares) | | $ | 4.05 | | |
The accompanying notes are an integral part of the consolidated financial statements.
4
Morgan Stanley Variable Insurance Fund, Inc.
June 30, 2024 (unaudited)
Consolidated Statement of Operations | | Six Months Ended
June 30, 2024
(000) | |
Investment Income: | |
Dividends from Security of Affiliated Issuer (Note H) | | $ | 131 | | |
Dividends from Securities of Unaffiliated Issuers | | | 104 | | |
Income from Securities Loaned — Net | | | 3 | | |
Total Investment Income | | | 238 | | |
Expenses: | |
Advisory Fees (Note B) | | | 594 | | |
Distribution Fees — Class II Shares (Note E) | | | 160 | | |
Servicing Fees (Note D) | | | 122 | | |
Professional Fees | | | 91 | | |
Administration Fees (Note C) | | | 63 | | |
Shareholder Reporting Fees | | | 13 | | |
Custodian Fees (Note G) | | | 9 | | |
Transfer Agency Fees (Note F) | | | 6 | | |
Pricing Fees | | | 2 | | |
Directors' Fees and Expenses | | | 1 | | |
Other Expenses | | | 11 | | |
Total Expenses | | | 1,072 | | |
Waiver of Advisory Fees (Note B) | | | (160 | ) | |
Waiver of Distribution Fees — Class II Shares (Note E) | | | (96 | ) | |
Rebate from Morgan Stanley Affiliate (Note H) | | | (5 | ) | |
Net Expenses | | | 811 | | |
Net Investment Loss | | | (573 | ) | |
Realized Gain: | |
Investments Sold | | | 11,715 | | |
Foreign Currency Translation | | | 1 | | |
Net Realized Gain | | | 11,716 | | |
Change in Unrealized Appreciation (Depreciation): | |
Investments | | | (11,006 | ) | |
Foreign Currency Translation | | | — | @ | |
Net Change in Unrealized Appreciation (Depreciation) | | | (11,006 | ) | |
Net Realized Gain and Change in Unrealized Appreciation (Depreciation) | | | 710 | | |
Net Increase in Net Assets Resulting from Operations | | $ | 137 | | |
@ Amount is less than $500.
The accompanying notes are an integral part of the consolidated financial statements.
5
Morgan Stanley Variable Insurance Fund, Inc.
June 30, 2024
Consolidated Statements of Changes in Net Assets | | Six Months Ended
June 30, 2024
(unaudited)
(000) | | Year Ended
December 31, 2023
(000) | |
Increase (Decrease) in Net Assets: | |
Operations: | |
Net Investment Loss | | $ | (573 | ) | | $ | (916 | ) | |
Net Realized Gain (Loss) | | | 11,716 | | | | (40,661 | ) | |
Net Change in Unrealized Appreciation (Depreciation) | | | (11,006 | ) | | | 94,770 | | |
Net Increase in Net Assets Resulting from Operations | | | 137 | | | | 53,193 | | |
Capital Share Transactions:(1) | |
Class I: | |
Subscribed | | | 3,893 | | | | 10,366 | | |
Redeemed | | | (4,782 | ) | | | (11,848 | ) | |
Class II: | |
Subscribed | | | 1,503 | | | | 9,207 | | |
Redeemed | | | (12,026 | ) | | | (17,173 | ) | |
Net Decrease in Net Assets Resulting from Capital Share Transactions | | | (11,412 | ) | | | (9,448 | ) | |
Total Increase (Decrease) in Net Assets | | | (11,275 | ) | | | 43,745 | | |
Net Assets: | |
Beginning of Period | | | 165,672 | | | | 121,927 | | |
End of Period | | $ | 154,397 | | | $ | 165,672 | | |
(1) Capital Share Transactions: | |
Class I: | |
Shares Subscribed | | | 857 | | | | 2,803 | | |
Shares Redeemed | | | (1,041 | ) | | | (3,165 | ) | |
Net Decrease in Class I Shares Outstanding | | | (184 | ) | | | (362 | ) | |
Class II: | |
Shares Subscribed | | | 379 | | | | 2,883 | | |
Shares Redeemed | | | (2,985 | ) | | | (5,044 | ) | |
Net Decrease in Class II Shares Outstanding | | | (2,606 | ) | | | (2,161 | ) | |
The accompanying notes are an integral part of the consolidated financial statements.
6
Morgan Stanley Variable Insurance Fund, Inc.
June 30, 2024
Consolidated Financial Highlights
Discovery Portfolio
| | | Class I | |
| | | Six Months Ended
June 30, 2024 | | Year Ended December 31, | |
Selected Per Share Data and Ratios | | (unaudited) | | 2023 | | 2022 | | 2021 | | 2020(1) | | 2019(1) | |
Net Asset Value, Beginning of Period | | $ | 4.59 | | | $ | 3.18 | | | $ | 17.04 | | | $ | 29.50 | | | $ | 13.05 | | | $ | 10.71 | | |
Income (Loss) from Investment Operations: | |
Net Investment Loss(2) | | | (0.01 | ) | | | (0.02 | ) | | | (0.04 | ) | | | (0.19 | ) | | | (0.17 | ) | | | (0.07 | ) | |
Net Realized and Unrealized Gain (Loss) | | | 0.02 | | | | 1.43 | | | | (9.83 | ) | | | (1.27 | ) | | | 18.96 | | | | 4.45 | | |
Total from Investment Operations | | | 0.01 | | | | 1.41 | | | | (9.87 | ) | | | (1.46 | ) | | | 18.79 | | | | 4.38 | | |
Distributions from and/or in Excess of: | |
Net Realized Gain | | | — | | | | — | | | | (3.99 | ) | | | (11.00 | ) | | | (2.34 | ) | | | (2.04 | ) | |
Net Asset Value, End of Period | | $ | 4.60 | | | $ | 4.59 | | | $ | 3.18 | | | $ | 17.04 | | | $ | 29.50 | | | $ | 13.05 | | |
Total Return(3) | | | 0.22 | %(4) | | | 44.34 | %(5) | | | (62.96 | )% | | | (11.06 | )% | | | 152.30 | % | | | 40.11 | % | |
Ratios to Average Net Assets and Supplemental Data: | |
Net Assets, End of Period (Thousands) | | $ | 29,803 | | | $ | 30,613 | | | $ | 22,330 | | | $ | 56,135 | | | $ | 68,299 | | | $ | 30,739 | | |
Ratio of Expenses Before Expense Limitation | | | 1.15 | %(6) | | | 1.16 | % | | | 1.15 | % | | | 1.06 | % | | | 1.08 | % | | | 1.11 | % | |
Ratio of Expenses After Expense Limitation | | | 0.94 | %(6)(7) | | | 0.94 | %(7) | | | 0.94 | %(7) | | | 0.95 | %(7) | | | 0.95 | %(7) | | | 0.94 | %(7) | |
Ratio of Expenses After Expense Limitation Excluding Interest Expenses | | | N/A | | | | N/A | | | | N/A | | | | 0.95 | %(7) | | | N/A | | | | N/A | | |
Ratio of Net Investment Loss | | | (0.64 | )%(6)(7) | | | (0.56 | )%(7) | | | (0.68 | )%(7) | | | (0.78 | )%(7) | | | (0.86 | )%(7) | | | (0.49 | )%(7) | |
Ratio of Rebate from Morgan Stanley Affiliates | | | 0.01 | %(6) | | | 0.01 | % | | | 0.01 | % | | | 0.00 | %(8) | | | 0.00 | %(8) | | | 0.01 | % | |
Portfolio Turnover Rate | | | 31 | %(4) | | | 60 | % | | | 49 | % | | | 95 | % | | | 112 | % | | | 101 | % | |
(1) Not consolidated.
(2) Per share amount is based on average shares outstanding.
(3) Calculated based on the net asset value as of the last business day of the period. Performance does not reflect fees and expenses imposed by your insurance company's separate account. If performance information included the effect of these additional charges, the total return would be lower.
(4) Not annualized.
(5) Reflects prior period transfer agency fees that were reimbursed in 2023. The amount of the reimbursement was immaterial on a per share basis and the impact was less than 0.005% to the total return of Class I shares.
(6) Annualized.
(7) The Ratio of Expenses After Expense Limitation and Ratio of Net Investment Loss reflect the rebate of certain Fund expenses in connection with the investments in Morgan Stanley affiliates during the period. The effect of the rebate on the ratios is disclosed in the above table as "Ratio of Rebate from Morgan Stanley Affiliates."
(8) Amount is less than 0.005%.
The accompanying notes are an integral part of the consolidated financial statements.
7
Morgan Stanley Variable Insurance Fund, Inc.
June 30, 2024
Consolidated Financial Highlights
Discovery Portfolio
| | | Class II | |
| | | Six Months Ended
June 30, 2024 | | Year Ended December 31, | |
Selected Per Share Data and Ratios | | (unaudited) | | 2023 | | 2022 | | 2021 | | 2020(1) | | 2019(1) | |
Net Asset Value, Beginning of Period | | $ | 4.05 | | | $ | 2.81 | | | $ | 16.04 | | | $ | 28.41 | | | $ | 12.63 | | | $ | 10.42 | | |
Income (Loss) from Investment Operations: | |
Net Investment Loss(2) | | | (0.01 | ) | | | (0.02 | ) | | | (0.04 | ) | | | (0.20 | ) | | | (0.18 | ) | | | (0.08 | ) | |
Net Realized and Unrealized Gain (Loss) | | | 0.01 | | | | 1.26 | | | | (9.20 | ) | | | (1.17 | ) | | | 18.30 | | | | 4.33 | | |
Total from Investment Operations | | | 0.00 | (9) | | | 1.24 | | | | (9.24 | ) | | | (1.37 | ) | | | 18.12 | | | | 4.25 | | |
Distributions from and/or in Excess of: | |
Net Realized Gain | | | — | | | | — | | | | (3.99 | ) | | | (11.00 | ) | | | (2.34 | ) | | | (2.04 | ) | |
Net Asset Value, End of Period | | $ | 4.05 | | | $ | 4.05 | | | $ | 2.81 | | | $ | 16.04 | | | $ | 28.41 | | | $ | 12.63 | | |
Total Return(3) | | | 0.00 | %(4)(5) | | | 44.13 | %(6) | | | (62.97 | )% | | | (11.19 | )% | | | 152.04 | % | | | 39.97 | % | |
Ratios to Average Net Assets and Supplemental Data: | |
Net Assets, End of Period (Thousands) | | $ | 124,594 | | | $ | 135,059 | | | $ | 99,597 | | | $ | 267,182 | | | $ | 332,541 | | | $ | 133,224 | | |
Ratio of Expenses Before Expense Limitation | | | 1.40 | %(7) | | | 1.41 | % | | | 1.40 | % | | | 1.31 | % | | | 1.33 | % | | | 1.36 | % | |
Ratio of Expenses After Expense Limitation | | | 1.04 | %(7)(8) | | | 1.04 | %(8) | | | 1.04 | %(8) | | | 1.05 | %(8) | | | 1.05 | %(8) | | | 1.04 | %(8) | |
Ratio of Expenses After Expense Limitation Excluding Interest Expenses | | | N/A | | | | N/A | | | | N/A | | | | 1.05 | %(8) | | | N/A | | | | N/A | | |
Ratio of Net Investment Loss | | | (0.74 | )%(7)(8) | | | (0.66 | )%(8) | | | (0.78 | )%(8) | | | (0.88 | )%(8) | | | (0.96 | )%(8) | | | (0.59 | )%(8) | |
Ratio of Rebate from Morgan Stanley Affiliates | | | 0.01 | %(7) | | | 0.01 | % | | | 0.01 | % | | | 0.00 | %(4) | | | 0.00 | %(4) | | | 0.01 | % | |
Portfolio Turnover Rate | | | 31 | %(5) | | | 60 | % | | | 49 | % | | | 95 | % | | | 112 | % | | | 101 | % | |
(1) Not consolidated.
(2) Per share amount is based on average shares outstanding.
(3) Calculated based on the net asset value as of the last business day of the period. Performance does not reflect fees and expenses imposed by your insurance company's separate account. If performance information included the effect of these additional charges, the total return would be lower.
(4) Amount is less than 0.005%.
(5) Not annualized.
(6) Reflects prior period transfer agency fees that were reimbursed in 2023. The amount of the reimbursement was immaterial on a per share basis and the impact was less than 0.005% to the total return of Class II shares.
(7) Annualized.
(8) The Ratio of Expenses After Expense Limitation and Ratio of Net Investment Loss reflect the rebate of certain Fund expenses in connection with the investments in Morgan Stanley affiliates during the period. The effect of the rebate on the ratios is disclosed in the above table as "Ratio of Rebate from Morgan Stanley Affiliates."
(9) Amount is less than $0.005 per share.
The accompanying notes are an integral part of the consolidated financial statements.
8
Morgan Stanley Variable Insurance Fund, Inc.
June 30, 2024 (unaudited)
Notes to Consolidated Financial Statements
Morgan Stanley Variable Insurance Fund, Inc. (the "Company") is registered under the Investment Company Act of 1940, as amended (the "Act"), as an open-end management investment company. The Company is comprised of eight separate active, diversified and non-diversified funds (individually referred to as a "Fund," collectively as the "Funds").
The Company applies investment company accounting and reporting guidance Accounting Standards Codification ("ASC") Topic 946. In the preparation of these financial statements, management has evaluated subsequent events occurring after the date of the Fund's Consolidated Statement of Assets and Liabilities through the date that the financial statements were issued.
The accompanying consolidated financial statements relates to the Discovery Portfolio. The Fund seeks long-term capital growth by investing primarily in common stocks and other equity securities. The Fund has issued two classes of shares — Class I and Class II. Both classes of shares have identical voting rights (except that shareholders of a Class have exclusive voting rights regarding any matter relating solely to that Class of shares), dividend, liquidation and other rights.
The Company is intended to be a funding vehicle for variable annuity contracts and variable life insurance policies offered by the separate accounts of certain life insurance companies.
A. Significant Accounting Policies: The following significant accounting policies are in conformity with U.S. generally accepted accounting principles ("GAAP"). Such policies are consistently followed by the Company in the preparation of its consolidated financial statements. GAAP may require management to make estimates and assumptions that affect the reported amounts and disclosures in the consolidated financial statements. Actual results may differ from those estimates.
The Fund may invest up to 25% of its total assets in a wholly-owned subsidiary of the Fund organized as a company under the laws of the Cayman Islands, VIF Discovery Cayman Portfolio, Ltd. (the "Subsidiary"). The Subsidiary may invest in bitcoin indirectly through cash settled futures or indirectly through investments in pooled investment vehicles and exchange-traded products that invest in bitcoin ("bitcoin ETFs"). The Fund is the sole shareholder of the Subsidiary, and it is not currently expected that shares of the Subsidiary will be sold or offered to other investors. The consolidated portfolio of investments and consolidated financial statements include the positions and accounts of the Fund and the Subsidiary. All intercompany accounts and transactions of the Fund and the Subsidiary have been eliminated in consolidation and all accounting policies of the Subsidiary are consistent with those of the Fund. As of June 30, 2024, the
Subsidiary represented approximately $3,833,000 or approximately 2.48% of the net assets of the Fund.
Investments in the Subsidiary are expected to provide the Fund with exposure to bitcoin within the limitations of Subchapter M of the Code and recent Internal Revenue Service ("IRS") revenue rulings, which require that a mutual fund receive no more than ten percent of its gross income from such investments in order to receive favorable tax treatment as a regulated investment company ("RIC"). Tax treatment of the income received from the Subsidiary may potentially be affected by changes in legislation, regulations or other legally binding authority, which could affect the character, timing and amount of the Fund's taxable income and distributions. If such changes occur, the Fund may need to significantly change its investment strategy and recognize unrealized gains in order to remain qualified for taxation as a RIC, which could adversely affect the Fund.
1. Security Valuation: (1) An equity portfolio security listed or traded on an exchange is valued at its latest reported sales price (or at the exchange official closing price if such exchange reports an official closing price), and if there were no sales on a given day and if there is no official exchange closing price for that day, the security is valued at the mean between the last reported bid and asked prices if such bid and asked prices are available on the relevant exchanges. If only bid prices are available then the latest bid price may be used. Listed equity securities not traded on the valuation date with no reported bid and asked prices available on the exchange are valued at the mean between the current bid and asked prices obtained from one or more reputable brokers/dealers. In cases where a security is traded on more than one exchange, the security is valued on the exchange designated as the primary market; (2) all other equity portfolio securities for which over-the-counter ("OTC") market quotations are readily available are valued at the latest reported sales price (or at the market official closing price if such market reports an official closing price), and if there was no trading in the security on a given day and if there is no official closing price from relevant markets for that day, the security is valued at the mean between the last reported bid and asked prices if such bid and asked prices are available on the relevant markets. An unlisted equity security that does not trade on the valuation date and for which bid and asked prices from the relevant markets are unavailable is valued at the mean between the current bid and asked prices obtained from one or more reputable brokers/dealers; (3) listed options are valued at the last reported sales price on the exchange on which they are listed (or at the exchange official closing price if such
9
Morgan Stanley Variable Insurance Fund, Inc.
June 30, 2024 (unaudited)
Notes to Consolidated Financial Statements (cont'd)
exchange reports an official closing price). If an official closing price or last reported sales price is unavailable, the listed option should be fair valued at the mean between its latest bid and ask prices. Unlisted options are valued at the mean between their latest bid and ask prices from a reputable broker/dealer or valued by a pricing service/vendor; (4) fixed income securities may be valued by an outside pricing service/vendor approved by the Company's Board of Directors (the "Directors"). The pricing service/vendor may employ a pricing model that takes into account, among other things, bids, yield spreads and/or other market data and specific security characteristics. If Morgan Stanley Investment Management Inc. (the "Adviser"), a wholly-owned subsidiary of Morgan Stanley, determines that the price provided by the outside pricing service/vendor does not reflect the security's fair value or is unable to provide a price, prices from reputable brokers/dealers may also be utilized. In these circumstances, the value of the security will be the mean of bid and asked prices obtained from reputable brokers/dealers; (5) when market quotations are not readily available, as defined by Rule 2a-5 under the Act, including circumstances under which the Adviser determines that the closing price, last sale price or the mean between the last reported bid and asked prices are not reflective of a security's market value, portfolio securities are valued at their fair value as determined in good faith under procedures approved by and under the general supervision of the Directors. Each business day, the Fund uses a third-party pricing service approved by the Directors to assist with the valuation of foreign equity securities. Events occurring after the close of trading on foreign exchanges may result in adjustments to the valuation of foreign securities to reflect market trading that occurs after the close of the applicable foreign markets of comparable securities or other instruments that have a strong correlation to the fair-valued securities to more accurately reflect their fair value as of the close of regular trading on the NYSE; and (6) investments in mutual funds, including the Morgan Stanley Institutional Liquidity Funds, are valued at the net asset value ("NAV") as of the close of each business day.
In connection with Rule 2a-5 of the Act, the Directors have designated the Company's Adviser as its valuation designee. The valuation designee has responsibility for determining fair value and to make the actual calculations pursuant to the fair valuation methodologies previously approved by the Directors. Under procedures approved by the Directors, the Company's Adviser, as valuation designee, has formed a Valuation Committee
whose members are approved by the Directors. The Valuation Committee provides administration and oversight of the Company's valuation policies and procedures, which are reviewed at least annually by the Directors. These procedures allow the Company to utilize independent pricing services, quotations from securities and financial instrument dealers and other market sources to determine fair value.
2. Fair Value Measurement: Financial Accounting Standards Board ("FASB") ASC 820, "Fair Value Measurement" ("ASC 820"), defines fair value as the price that would be received to sell an asset or pay to transfer a liability in an orderly transaction between market participants at the measurement date. ASC 820 establishes a three-tier hierarchy to distinguish between (1) inputs that reflect the assumptions market participants would use in valuing an asset or liability developed based on market data obtained from sources independent of the reporting entity (observable inputs); and (2) inputs that reflect the reporting entity's own assumptions about the assumptions market participants would use in valuing an asset or liability developed based on the best information available in the circumstances (unobservable inputs) and to establish classification of fair value measurements for disclosure purposes. Various inputs are used in determining the value of the Fund's investments. The inputs are summarized in the three broad levels listed below:
• Level 1 – unadjusted quoted prices in active markets for identical investments
• Level 2 – other significant observable inputs (including quoted prices for similar investments, interest rates, prepayment speeds, credit risk, etc.)
• Level 3 – significant unobservable inputs including the Fund's own assumptions in determining the fair value of investments. Factors considered in making this determination may include, but are not limited to, information obtained by contacting the issuer, analysts, or the appropriate stock exchange (for exchange-traded securities), analysis of the issuer's financial statements or other available documents and, if necessary, available information concerning other securities in similar circumstances.
The inputs or methodology used for valuing securities are not necessarily an indication of the risk associated with investing in those securities and the determination of the significance of a particular input to the fair value measurement in its entirety requires judgment and considers factors specific to each security.
10
Morgan Stanley Variable Insurance Fund, Inc.
June 30, 2024 (unaudited)
Notes to Consolidated Financial Statements (cont'd)
The following is a summary of the inputs used to value the Fund's investments as of June 30, 2024:
Investment Type | | Level 1
Unadjusted
quoted
prices
(000) | | Level 2
Other
significant
observable
inputs
(000) | | Level 3
Significant
unobservable
inputs
(000) | | Total
(000) | |
Assets: | |
Common Stocks | |
Automobiles | | $ | 349 | | | $ | — | | | $ | — | | | $ | 349 | | |
Biotechnology | | | 4,061 | | | | — | | | | — | | | | 4,061 | | |
Broadline Retail | | | 10,536 | | | | — | | | | — | | | | 10,536 | | |
Consumer Staples
Distribution & Retail | | | 3,731 | | | | — | | | | — | | | | 3,731 | | |
Entertainment | | | 7,664 | | | | — | | | | — | | | | 7,664 | | |
Financial Services | | | 8,203 | | | | 5,448 | | | | — | | | | 13,651 | | |
Ground Transportation | | | 2,958 | | | | — | | | | — | | | | 2,958 | | |
Health Care Equipment &
Supplies | | | 1,166 | | | | — | | | | — | | | | 1,166 | | |
Health Care Providers &
Services | | | 5,089 | | | | — | | | | — | | | | 5,089 | | |
Health Care Technology | | | 2,658 | | | | — | | | | — | | | | 2,658 | | |
Hotels, Restaurants &
Leisure | | | 10,754 | | | | — | | | | — | | | | 10,754 | | |
Information Technology
Services | | | 16,954 | | | | — | | | | — | | | | 16,954 | | |
Leisure Products | | | 1,514 | | | | — | | | | — | | | | 1,514 | | |
Life Sciences Tools &
Services | | | 1,365 | | | | — | | | | — | | | | 1,365 | | |
Machinery | | | 571 | | | | — | | | | — | | | | 571 | | |
Media | | | 11,602 | | | | — | | | | — | | | | 11,602 | | |
Pharmaceuticals | | | 7,070 | | | | — | | | | — | | | | 7,070 | | |
Software | | | 25,946 | | | | 1,458 | | | | — | | | | 27,404 | | |
Specialty Retail | | | 9,073 | | | | — | | | | — | | | | 9,073 | | |
Textiles, Apparel &
Luxury Goods | | | 3,834 | | | | — | | | | — | | | | 3,834 | | |
Total Common Stocks | | | 135,098 | | | | 6,906 | | | | — | | | | 142,004 | | |
Investment Type | | Level 1
Unadjusted
quoted
prices
(000) | | Level 2
Other
significant
observable
inputs
(000) | | Level 3
Significant
unobservable
inputs
(000) | | Total
(000) | |
Preferred Stocks | |
Software | | $ | — | | | $ | — | | | $ | 3,314 | | | $ | 3,314 | | |
Investment Company | | | 3,834 | | | | — | | | | — | | | | 3,834 | | |
Call Options Purchased | | | — | | | | 151 | | | | — | | | | 151 | | |
Short-Term Investment | |
Investment Company | | | 6,786 | | | | — | | | | — | | | | 6,786 | | |
Total Assets | | $ | 145,718 | | | $ | 7,057 | | | $ | 3,314 | | | $ | 156,089 | | |
Transfers between investment levels may occur as the markets fluctuate and/or the availability of data used in an investment's valuation changes.
Following is a reconciliation of investments in which significant unobservable inputs (Level 3) were used in determining fair value:
| | | Preferred
Stocks
(000) | |
Beginning Balance | | $ | 3,278 | | |
Purchases | | | — | | |
Sales | | | — | | |
Transfers in | | | — | | |
Transfers out | | | — | | |
Corporate actions | | | — | | |
Change in unrealized appreciation (depreciation) | | | 36 | | |
Realized gains (losses) | | | — | | |
Ending Balance | | $ | 3,314 | | |
Net change in unrealized appreciation (depreciation) from
investments still held as of June 30, 2024 | | $ | 36 | | |
The following table presents additional information about valuation techniques and inputs used for investments that are measured at fair value and categorized within Level 3 as of June 30, 2024. Various valuation techniques were used in the valuation of certain investments and weighted based on the level of significance. The Fund calculated the weighted averages of the unobservable inputs relative to each investment's fair value as of June 30, 2024:
| | | Fair Value at
June 30, 2024
(000) | | Valuation
Technique | | Unobservable
Input | | Amount* | | Impact to
Valuation from an
Increase in Input** | |
Preferred Stocks | | $ | 3,314 | | | Market Transaction
Method | |
Precedent Transaction | | $ | 65.00 | | |
Increase | |
| | | | | Discounted Cash
Flow | | Weighted Average
Cost of Capital | | | 15.0 | % | |
Decrease | |
| | | | | | | Perpetual Growth
Rate | | | 3.5 | % | | Increase | |
| | | | | Market Comparable
Companies | | Enterprise
Value/Revenue | | | 14.0 | % | |
Increase | |
| | | | | | | Discount for
Lack of Marketability | | | 11.0 | % | |
Decrease | |
* Amount is indicative of the weighted average.
** Represents the expected directional change in the fair value of the Level 3 investments that would result from an increase in the corresponding input. A decrease to the unobservable input would have the opposite effect. Significant changes in these inputs could result in significantly higher or lower fair value measurements.
11
Morgan Stanley Variable Insurance Fund, Inc.
June 30, 2024 (unaudited)
Notes to Consolidated Financial Statements (cont'd)
3. Repurchase Agreements: The Fund may enter into repurchase agreements under which the Fund lends cash and takes possession of securities with an agreement that the counterparty will repurchase such securities. In connection with transactions in repurchase agreements, a bank as custodian for the Fund takes possession of the underlying securities which are held as collateral, with a market value at least equal to the amount of the repurchase transaction, including principal and accrued interest. To the extent that any repurchase transaction exceeds one business day, the value of the collateral is marked-to-market on a daily basis to determine that the value of the collateral does not decrease below the repurchase price plus accrued interest as earned. If such a decrease occurs, additional collateral will be requested and, when received, will be added to the account to maintain full collateralization. In the event of default on the obligation to repurchase, the Fund has the right to liquidate the collateral and apply the proceeds in satisfaction of the obligation. In the event of default or bankruptcy by the counterparty to the agreement, realization of the collateral proceeds may be subject to cost and delays. The Fund, along with other affiliated investment companies, may utilize a joint trading account for the purpose of entering into repurchase agreements.
4. Foreign Currency Translation and Foreign Investments: The books and records of the Fund are maintained in U.S. dollars. Foreign currency amounts are translated into U.S. dollars as follows:
— investments, other assets and liabilities at the prevailing rate of exchange on the valuation date;
— investment transactions and investment income at the prevailing rates of exchange on the dates of such transactions.
Although the net assets of the Fund are presented at the foreign exchange rates and market values at the close of the period, the Fund does not isolate that portion of the results of operations arising as a result of changes in the foreign exchange rates from the fluctuations arising from changes in the market prices of securities held at period end. Similarly, the Fund does not isolate the effect of changes in foreign exchange rates from the fluctuations arising from changes in the market prices of securities sold during the period. Accordingly, realized and unrealized foreign currency gains (losses) on investments in securities are included in the reported net realized and unrealized gains (losses) on investment transactions and balances. However, pursuant to U.S. federal income tax regulations, gains and losses from certain foreign currency transactions and the foreign currency portion of gains and losses realized on sales and maturities of
foreign denominated debt securities are treated as ordinary income for U.S. federal income tax purposes.
Net realized gains (losses) on foreign currency transactions represent net foreign exchange gains (losses) from foreign currency forward exchange contracts, disposition of foreign currencies, currency gains (losses) realized between the trade and settlement dates on securities transactions, and the difference between the amount of investment income and foreign withholding taxes recorded on the Fund's books and the U.S. dollar equivalent amounts actually received or paid. The change in unrealized currency gains (losses) on foreign currency transactions for the period is reflected in the Consolidated Statement of Operations.
Foreign security and currency transactions may involve certain considerations and risks not typically associated with those of U.S. dollar denominated transactions as a result of, among other factors, fluctuations of exchange rates in relation to the U.S. dollar, the possibility of lower levels of governmental supervision and regulation of foreign securities markets and the possibility of political or economic instability.
Governmental approval for foreign investments may be required in advance of making an investment under certain circumstances in some countries, and the extent of foreign investments in U.S. companies may be subject to limitation in other countries. Foreign ownership limitations also may be imposed by the charters of individual companies to prevent, among other concerns, violations of foreign investment limitations. As a result, an additional class of shares (identified as "Foreign" in the Consolidated Portfolio of Investments) may be created and offered for investment. The "local" and "foreign shares" market values may differ. In the absence of trading of the foreign shares in such markets, the Fund values the foreign shares at the closing exchange price of the local shares.
5. Derivatives: The Fund may, but is not required to, use derivative instruments for a variety of purposes, including hedging, risk management, portfolio management or to earn income. Derivatives are financial instruments whose value is based, in part, on the value of an underlying asset, interest rate, index or financial instrument. Prevailing interest rates and volatility levels, among other things, also affect the value of derivative instruments. A derivative instrument often has risks similar to its underlying asset and may have additional risks, including imperfect correlation between the value of the derivative and the underlying asset, risks of default by the counterparty to certain transactions, magnification of losses incurred due to changes in the market value of the securities, instruments,
12
Morgan Stanley Variable Insurance Fund, Inc.
June 30, 2024 (unaudited)
Notes to Consolidated Financial Statements (cont'd)
indices or interest rates to which the derivative instrument relates, risks that the transactions may not be liquid, risks arising from margin and payment requirements, risks arising from mispricing or valuation complexity and operational and legal risks. The use of derivatives involves risks that are different from, and possibly greater than, the risks associated with other portfolio investments. Derivatives may involve the use of highly specialized instruments that require investment techniques and risk analyses different from those associated with other portfolio investments. All of the Fund's holdings, including derivative instruments, are marked-to-market each day with the change in value reflected in unrealized appreciation (depreciation). Upon disposition, a realized gain or loss is recognized.
Certain derivative transactions may give rise to a form of leverage. Leverage magnifies the potential for gain and the risk of loss. Leverage associated with derivative transactions may cause the Fund to liquidate portfolio positions when it may not be advantageous to do so to satisfy its obligations or may cause the Fund to be more volatile than if the Fund had not been leveraged. Although the Adviser seeks to use derivatives to further the Fund's investment objectives, there is no assurance that the use of derivatives will achieve this result.
Following is a description of the derivative instruments and techniques that the Fund used during the period and their associated risks:
Options: With respect to options, the Fund is subject to equity risk, interest rate risk and foreign currency ex-change risk in the normal course of pursuing its investment objectives. If the Fund buys an option, it buys a legal contract giving it the right to buy or sell a specific amount of the underlying instrument or foreign currency, or futures contract on the underlying instrument or foreign currency, at an agreed-upon price during a period of time or on a specified date typically in exchange for a premium paid by the Fund. The Fund may purchase and/or sell put and call options. Purchasing call options tends to increase the Fund's exposure to the underlying (or similar) instrument. Purchasing put options tends to decrease the Fund's exposure to the underlying (or similar) instrument. When entering into purchased option contracts, the Fund bears the risk of interest or exchange rates or securities prices moving unexpectedly, in which case, the Fund may not achieve the anticipated benefits of the purchased option contracts; however the risk of loss is limited to the premium paid. Purchased options are reported as part of "Total Investments in Securities" in the Consolidated Statement of
Assets and Liabilities. Premiums paid for purchasing options which expired are treated as realized losses. If the Fund sells an option, it sells to another party the right to buy from or sell to the Fund a specific amount of the underlying instrument or foreign currency, or futures contract on the underlying instrument or foreign currency, at an agreed-upon price during a period of time or on a specified date typically in exchange for a premium received by the Fund. When options are purchased OTC, the Fund bears the risk that the counterparty that wrote the option will be unable or unwilling to perform its obligations under the option contract. Options may also be illiquid and the Fund may have difficulty closing out its position. A decision as to whether, when and how to use options involves the exercise of skill and judgment and even a well-conceived option transaction may be unsuccessful because of market behavior or unexpected events. The prices of options can be highly volatile and the use of options can lower total returns.
FASB ASC 815, "Derivatives and Hedging" ("ASC 815"), is intended to improve financial reporting about derivative instruments by requiring enhanced disclosures to enable investors to better understand how and why the Fund uses derivative instruments, how these derivative instruments are accounted for and their effects on the Fund's financial position and results of operations.
The following table sets forth the fair value of the Fund's derivative contracts by primary risk exposure as of June 30, 2024:
| | | Asset Derivatives
Consolidated
Statement of Assets
and Liabilities
Location | | Primary Risk
Exposure | | Value
(000) | |
Purchased Options | | Investments, at Value
(Purchased Options) | | Currency Risk | | $ | 151 | (a) | |
(a) Amounts are included in Investments in Securities in the Consolidated Statement of Assets and Liabilities.
The following tables set forth by primary risk exposure the Fund's realized gains (losses) and change in unrealized appreciation (depreciation) by type of derivative contract for the six months ended June 30, 2024 in accordance with ASC 815:
Realized Gain (Loss) | |
Primary Risk Exposure | | Derivative
Type | | Value
(000) | |
Currency Risk | | Investments
(Purchased Options) | | $ | (269 | )(a) | |
(a) Amounts are included in Realized Gain on Investments Sold in the Consolidated Statement of Operations.
13
Morgan Stanley Variable Insurance Fund, Inc.
June 30, 2024 (unaudited)
Notes to Consolidated Financial Statements (cont'd)
Change in Unrealized Appreciation (Depreciation) | |
Primary Risk Exposure | | Derivative
Type | | Value
(000) | |
Currency Risk | | Investments
(Purchased Options) | | $ | 22 | (a) | |
(a) Amounts are included in Change in Unrealized Appreciation (Depreciation) on Investments in the Consolidated Statement of Operations.
At June 30, 2024, the Fund's derivative assets and liabilities are as follows:
Gross Amounts of Assets and Liabilities Presented in the
Consolidated Statement of Assets and Liabilities | |
Derivatives | | Assets(b)
(000) | | Liabilities(b)
(000) | |
Purchased Options | | $ | 151 | (a) | | $ | — | | |
(a) Amounts are included in Investments in Securities in the Consolidated Statement of Assets and Liabilities.
(b) Absent an event of default or early termination, OTC derivative assets and liabilities are presented gross and not offset in the Consolidated Statement of Assets and Liabilities.
The Fund typically enters into International Swaps and Derivatives Association, Inc. Master Agreements ("ISDA Master Agreements") or similar master agreements (collectively, "Master Agreements") with its contract counterparties for certain OTC derivatives in order to, among other things, reduce its credit risk to counterparties. ISDA Master Agreements include provisions for general obligations, representations, collateral and events of default or termination. Under an ISDA Master Agreement, the Fund typically may offset with the counterparty certain OTC derivative financial instruments' payables and/or receivables with collateral held and/or posted and create one single net payment (close-out netting) in the event of default, termination and/or potential deterioration in the credit quality of the counterparty. Various Master Agreements govern the terms of certain transactions with counterparties, including transactions such as swap, forward, repurchase and reverse repurchase agreements. These Master Agreements typically attempt to reduce the counterparty risk associated with such transactions by specifying credit protection mechanisms and providing standardization that improves legal certainty. Cross-termination provisions under Master Agreements typically provide that a default in connection with one transaction between the Fund and a counterparty gives the non-defaulting party the right to terminate any other transactions in place with the defaulting party to create one single net payment due to/due from the defaulting party and may be a feature in certain Master Agreements. In the event the Fund exercises its right to terminate a Master Agreement after a counterparty experiences a termination event as defined in the Master
Agreement, the return of collateral with market value in excess of the Fund's net liability may be delayed or denied.
The following table presents derivative financial instruments that are subject to enforceable netting arrangements as of June 30, 2024:
Gross Amounts Not Offset in the Consolidated Statement of
Assets and Liabilities | |
Counterparty | | Gross Asset
Derivatives
Presented
in the
Consolidated
Statement of
Assets and
Liabilities(a)
(000) | | Financial
Instrument
(000) | | Collateral
Received
(000) | | Net
Amount
(not less
than $0)
(000) | |
Goldman
Sachs &
Co. LLC | | $ | 66 | | | $ | — | | | $ | — | | | $ | 66 | | |
JPMorgan
Chase Bank
NA | | | 85 | | | | — | | | | — | | | | 85 | | |
Total | | $ | 151 | | | $ | — | | | $ | — | | | $ | 151 | | |
(a) Amounts are included in Investments in Securities in the Consolidated Statement of Assets and Liabilities.
For the six months ended June 30, 2024, the approximate average monthly amount outstanding for each derivative type is as follows:
Purchased Options: | |
Average monthly notional amount | | | 125,875,000 | | |
6. Securities Lending: The Fund lends securities to qualified financial institutions, such as broker/dealers, to earn additional income. Any increase or decrease in the fair value of the securities loaned that might occur and any interest earned or dividends declared on those securities during the term of the loan would remain in the Fund. The Fund would receive cash or securities as collateral in an amount equal to or exceeding 100% of the current fair value of the loaned securities. The collateral is marked-to-market daily by State Street Bank and Trust Company ("State Street"), the securities lending agent, to ensure that a minimum of 100% collateral coverage is maintained.
Based on pre-established guidelines, the securities lending agent invests any cash collateral that is received in an affiliated money market portfolio and repurchase agreements. Securities lending income is generated from the earnings on the invested collateral and borrowing fees, less any rebates owed to the borrowers and compensation to the lending agent, and is recorded as "Income from Securities Loaned — Net" in the Fund's Consolidated Statement of Operations. Risks in securities lending
14
Morgan Stanley Variable Insurance Fund, Inc.
June 30, 2024 (unaudited)
Notes to Consolidated Financial Statements (cont'd)
transactions are that a borrower may not provide additional collateral when required or return the securities when due, and that the value of the short-term investments will be less than the amount of cash collateral plus any rebate that is required to be returned to the borrower.
The Fund has the right under the securities lending agreement to recover the securities from the borrower on demand.
At June 30, 2024, the Fund did not have any outstanding securities on loan.
7. Restricted Securities: The Fund invests in unregistered or otherwise restricted securities. The term "restricted securities" refers to securities that are unregistered or are held by control persons of the issuer and securities that are subject to contractual restrictions on their resale. As a result, restricted securities may be more difficult to value and the Fund may have difficulty disposing of such assets either in a timely manner or for a reasonable price. In order to dispose of an unregistered security, the Fund, where it has contractual rights to do so, may have to cause such security to be registered. A considerable period may elapse between the time the decision is made to sell the security and the time the security is registered so that the Fund can sell it. Contractual restrictions on the resale of securities vary in length and scope and are generally the result of a negotiation between the issuer and the acquirer of the securities. The Fund would, in either case, bear market risks during that period. Restricted securities are identified in the Consolidated Portfolio of Investments.
8. Indemnifications: The Company enters into contracts that contain a variety of indemnification clauses. The Company's maximum exposure under these arrangements is unknown as this would involve future claims that may be made against the Fund that have not yet occurred.
9. Security Transactions, Income and Expenses: Security transactions are accounted for on the trade date (date the order to buy or sell is executed). Realized gains and losses on the sale of investment securities are determined on the specific identified cost method. Dividend income and other distributions are recorded on the ex-dividend date (except for certain foreign dividends which may be recorded as soon as the Fund is informed of such dividends) net of applicable withholding taxes. Non-cash dividends received in the form of stock, if any, are recognized on the ex-dividend date and recorded as non-cash dividend income at fair value. Interest income is recognized on the accrual basis (except where collection is in doubt) net of applicable withholding taxes. Discounts are accreted and premiums are amortized over the
life of the respective securities. Most expenses of the Company can be directly attributed to a particular Fund. Expenses which cannot be directly attributed are apportioned among the Funds based upon relative net assets or other appropriate methods. Income, expenses (other than class specific expenses) and realized and unrealized gains or losses are allocated to each class of shares based upon their relative net assets.
10. Dividends and Distributions to Shareholders: Dividends and distributions to shareholders are recorded on the ex-dividend date. Dividends from net investment income, if any, are declared and paid annually. Net realized capital gains, if any, are distributed at least annually.
B. Advisory Fees: The Adviser, a wholly-owned subsidiary of Morgan Stanley, provides the Fund with advisory services under the terms of an Investment Advisory Agreement, paid quarterly, at the annual rate based on the daily net assets as follows:
First $500
million | | Next $500
million | | Over $1
billion | |
| | 0.75 | % | | | 0.70 | % | | | 0.65 | % | |
For the six months ended June 30, 2024, the advisory fee rate (net of waiver/rebate) was equivalent to an annual effective rate of 0.54% of the Fund's average daily net assets.
The Adviser has agreed to reduce its advisory fee and/or reimburse the Fund so that total annual Fund operating expenses, excluding certain investment related expenses, taxes, interest and other extraordinary expenses (including litigation), will not exceed 0.95% for Class I shares and 1.05% for Class II shares. The fee waivers and/or expense reimbursements will continue for at least one year from the date of the Fund's prospectus or until such time as the Directors act to discontinue all or a portion of such waivers and/or reimbursements when they deem such action is appropriate. For the six months ended June 30, 2024, approximately $160,000 of advisory fees were waived pursuant to this arrangement.
The Adviser provides investment advisory services to the Subsidiary pursuant to the Subsidiary Investment Management Agreement (the "Agreement"). Under the Agreement, the Subsidiary will pay the Adviser at the end of each fiscal quarter, calculated by applying a quarterly rate, based on the annual rate of 0.05%, to the average daily net assets of the Subsidiary.
The Adviser has agreed to waive its advisory fees by the amount of advisory fees it receives from the Subsidiary.
C. Administration Fees: The Adviser also serves as Administrator to the Company and provides administrative services pursuant to an Administration Agreement for an annual
15
Morgan Stanley Variable Insurance Fund, Inc.
June 30, 2024 (unaudited)
Notes to Consolidated Financial Statements (cont'd)
fee, accrued daily and paid monthly, of 0.08% of the Fund's average daily net assets.
Under a Sub-Administration Agreement between the Administrator and State Street, State Street provides certain administrative services to the Company. For such services, the Administrator pays State Street a portion of the fee the Administrator receives from the Fund.
D. Servicing Fees: The Company accrues daily and pays quarterly a servicing fee of up to 0.17% of the average daily value of shares of the Fund held in an insurance company's account. Certain insurance companies have entered into a servicing agreement with the Company to provide administrative and other contract-owner related services on behalf of the Fund.
E. Distribution Fees: Morgan Stanley Distribution, Inc. ("MSDI" or the "Distributor"), a wholly-owned subsidiary of the Adviser and an indirect subsidiary of Morgan Stanley, serves as the Distributor of the Fund and provides the Fund's Class II shareholders with distribution services pursuant to a Distribution Plan (the "Plan") in accordance with Rule 12b-1 under the Act. Under the Plan, the Fund is authorized to pay the Distributor a distribution fee, which is accrued daily and paid monthly, at an annual rate of 0.25% of the Fund's average daily net assets attributable to Class II shares. The Distributor has agreed to waive 0.15% of the 0.25% distribution fee that it may receive. This fee waiver will continue for at least one year from the date of the Fund's prospectus or until such time as the Directors act to discontinue all or a portion of such waiver when they deem such action is appropriate. For the six months ended June 30, 2024, this waiver amounted to approximately $96,000.
F. Dividend Disbursing and Transfer/Co-Transfer Agent: The Company's dividend disbursing and transfer agent is SS&C Global Investor & Distribution Solutions, Inc. ("SS&C GIDS"). Pursuant to a Transfer Agency Agreement, the Company pays SS&C GIDS a fee based on the number of classes, accounts and transactions relating to the Funds of the Company.
Eaton Vance Management ("EVM"), an affiliate of Morgan Stanley, provides co-transfer agency and related services to the Fund pursuant to a Co-Transfer Agency Services Agreement. For the six months ended June 30, 2024, co-transfer agency fees and expenses incurred to EVM, included in "Transfer Agency Fees" in the Consolidated Statement of Operations, amounted to less than $500.
G. Custodian Fees: State Street (the "Custodian") also serves as Custodian for the Company in accordance with a Custodian Agreement. The Custodian holds cash, securities and other assets of the Company as required by the Act.
Custody fees are payable monthly based on assets held in custody, investment purchases and sales activity and account maintenance fees, plus reimbursement for certain out-of-pocket expenses.
H. Security Transactions and Transactions with Affiliates: For the six months ended June 30, 2024, purchases and sales of investment securities for the Fund, other than long-term U.S. Government securities and short-term investments were approximately $47,135,000 and $56,539,000, respectively. There were no purchases and sales of long-term U.S. Government securities for the six months ended June 30, 2024.
The Fund invests in the Institutional Class of the Morgan Stanley Institutional Liquidity Funds — Treasury Securities Portfolio (the "Liquidity Fund"), an open-end management investment company managed by the Adviser, both directly and as a portion of the securities held as collateral on loaned securities. Advisory fees paid by the Fund are reduced by an amount equal to its pro-rata share of the advisory and administration fees paid by the Fund due to its investment in the Liquidity Fund. For the six months ended June 30, 2024, advisory fees paid were reduced by approximately $5,000 relating to the Fund's investment in the Liquidity Fund.
A summary of the Fund's transactions in shares of affiliated investments during the six months ended June 30, 2024 is as follows:
Affiliated
Investment
Company | | Value
December 31,
2023
(000) | | Purchases
at Cost
(000) | | Proceeds
from Sales
(000) | | Dividend
Income
(000) | |
Liquidity Fund | | $ | 8,386 | | | $ | 27,683 | | | $ | 29,283 | | | $ | 131 | | |
Affiliated
Investment
Company (cont'd) | | Realized
Gain (Loss)
(000) | | Change in
Unrealized
Appreciation
(Depreciation)
(000) | | Value
June 30,
2024
(000) | |
Liquidity Fund | | $ | — | | | $ | — | | | $ | 6,786 | | |
During the six months ended June 30, 2024, the Fund incurred approximately $1,000 in brokerage commissions with Morgan Stanley & Co. LLC, an affiliate of the Adviser/Administrator and Distributor, for portfolio transactions executed on behalf of the Fund.
The Fund is permitted to purchase and sell securities ("cross-trade") from and to other Morgan Stanley funds as well as other funds and client accounts for which the Adviser or an affiliate of the Adviser serves as investment adviser, pursuant to procedures approved by the Directors in compliance with Rule 17a-7 under the Act (the "Rule"). Each cross-trade is executed at the current market price in compliance with
16
Morgan Stanley Variable Insurance Fund, Inc.
June 30, 2024 (unaudited)
Notes to Consolidated Financial Statements (cont'd)
provisions of the Rule. For the six months ended June 30, 2024, the Fund did not engage in any cross-trade transactions.
Each Director receives an annual retainer fee for serving as a Director of the Morgan Stanley Funds. The aggregate compensation paid to each Director is paid by the Morgan Stanley Funds, and is allocated on a pro rata basis among each of the operational funds of the Morgan Stanley Funds based on the relative net assets of each of the funds. The Company also reimburses such Directors for travel and other out-of-pocket expenses incurred by them in connection with attending such meetings.
The Fund has an unfunded Deferred Compensation Plan (the "Compensation Plan"), which allows each independent Director to defer payment of all, or a portion, of the fees he or she receives for serving on the Board of Directors. Each eligible Director generally may elect to have the deferred amounts credited with a return equal to the total return on one or more of the Morgan Stanley funds that are offered as investment options under the Compensation Plan. Appreciation/depreciation and distributions received from these investments are recorded with an offsetting increase/decrease in the deferred compensation obligation and do not affect the NAV of the Fund.
I. Federal Income Taxes: It is the Fund's intention to continue to qualify as a RIC and distribute all of its taxable and tax-exempt income. Accordingly, no provision for federal income taxes is required in the consolidated financial statements.
The Fund may be subject to taxes imposed by countries in which it invests. Such taxes are generally based on income and/or capital gains earned or repatriated. Taxes are accrued based on net investment income, net realized gains and net unrealized appreciation as such income and/or gains are earned. Taxes may also be based on transactions in foreign currency and are accrued based on the value of investments denominated in such currency.
FASB ASC 740-10, "Income Taxes — Overall", sets forth a minimum threshold for consolidated financial statement recognition of the benefit of a tax position taken or expected to be taken in a tax return. Management has concluded there are no significant uncertain tax positions that would require recognition in the consolidated financial statements. If applicable, the Fund recognizes interest accrued related to unrecognized tax benefits in "Interest Expense" and penalties in "Other Expenses" in the Consolidated Statement of Operations. The Fund files tax returns with the U.S. Internal Revenue Service, New York and various states. Generally, each of the tax years in the four-year period ended December 31, 2023 remains subject to examination by taxing authorities.
The tax character of distributions paid may differ from the character of distributions shown for GAAP purposes due to
short-term capital gains being treated as ordinary income for tax purposes. The tax character of distributions paid during fiscal years 2023 and 2022 was as follows:
2023 Distributions
Paid From: | | 2022 Distributions
Paid From: | |
Ordinary
Income
(000) | | Long-Term
Capital Gain
(000) | | Ordinary
Income
(000) | | Long-Term
Capital Gain
(000) | |
| $ | — | | | $ | — | | | $ | 5,485 | | | $ | 77,635 | | |
The amount and character of income and gains to be distributed are determined in accordance with income tax regulations which may differ from GAAP. These book/tax differences are either considered temporary or permanent in nature.
Temporary differences are attributable to differing book and tax treatments for the timing of the recognition of gains (losses) on certain investment transactions and the timing of the deductibility of certain expenses.
Permanent differences, due to a net operating loss, resulted in the following reclassifications among the components of net assets at December 31, 2023:
Total
Accumulated
Loss
(000) | | Paid-in-
Capital
(000) | |
$ | 1,222 | | | $ | (1,222 | ) | |
At December 31, 2023, the Fund had no distributable earnings on a tax basis.
At December 31, 2023, the Fund had available for federal income tax purposes unused short-term and long-term capital losses of approximately $41,913,000 and $94,658,000, respectively, that do not have an expiration date.
To the extent that capital loss carryforwards are used to offset any future capital gains realized, no capital gains tax liability will be incurred by the Fund for gains realized and not distributed. To the extent that capital gains are offset, such gains will not be distributed to the shareholders.
J. Credit Facility: The Company and other Morgan Stanley funds participated in a $500,000,000 committed, unsecured revolving line of credit facility (the "Facility") with State Street. This Facility is to be used for temporary emergency purposes or funding of shareholder redemption requests. The interest rate for any funds drawn will be based on the federal funds rate or overnight bank funding rate plus a spread. The Facility also has a commitment fee of 0.25% per annum based on the unused portion of the Facility, which is allocated among participating funds based on relative net assets. During the six months ended June 30, 2024, the Fund did not have any borrowings under the Facility.
17
Morgan Stanley Variable Insurance Fund, Inc.
June 30, 2024 (unaudited)
Notes to Consolidated Financial Statements (cont'd)
K. Other: At June 30, 2024, the Fund had record owners of 10% or greater. Investment activities of these shareholders could have a material impact on the Fund. The aggregate percentage of such owners was 81.6%.
L. Market Risk and Risks Relating to Certain Financial Instruments:
Bitcoin: The Fund may have exposure to cryptocurrencies indirectly through cash settled futures bitcoin exposure or indirectly through bitcoin ETFs. Cryptocurrencies (also referred to as "virtual currencies" and "digital currencies") are digital assets designed to act as a medium of exchange. Although cryptocurrency is an emerging asset class, there are thousands of cryptocurrencies, the most well-known of which is bitcoin. Cryptocurrency facilitates decentralized, peer-to-peer financial exchange and value storage that is used like money, without the oversight of a central authority or banks. The value of cryptocurrency is not backed by any government, corporation, or other identified body. Similar to fiat currencies (i.e., a currency that is backed by a central bank or a national, supra-national or quasi-national organization), cryptocurrencies are susceptible to theft, loss and destruction. For example, the bitcoin held by bitcoin ETFs (and the Fund's indirect exposure to such bitcoin) is also susceptible to these risks. The value of the bitcoin ETFs investments in cryptocurrency is subject to fluctuations in the value of the cryptocurrency, which have been and may in the future be highly volatile and subject to sharp declines. The value of cryptocurrencies is determined by the supply and demand for cryptocurrency in the global market for the trading of cryptocurrency, which consists primarily of transactions on electronic exchanges. The price of bitcoin could drop precipitously (including to zero) for a variety of reasons, including, but not limited to, regulatory changes, a crisis of confidence, flaw or operational issue in the bitcoin network or a change in user preference to competing cryptocurrencies. The Bitcoin ETF exposure could result in substantial losses to the Fund.
Market: The value of an investment in the Fund is based on the values of the Fund's investments, which change due to economic and other events that affect markets generally, as well as those that affect particular regions, countries, industries, companies or governments. The risks associated with these developments may be magnified if certain social, political, economic and other conditions and events adversely interrupt the global economy and financial markets. Securities in the Fund's portfolio may underperform due to inflation (or expectations for inflation), interest rates, global demand for particular products or resources, natural disasters and extreme weather events, health emergencies (such as epidemics and pandemics), terrorism, regulatory events and governmental or
quasi-governmental actions. The occurrence of global events similar to those in recent years, such as terrorist attacks around the world, natural disasters, health emergencies, social and political (including geopolitical) discord and tensions or debt crises and downgrades, among others, may result in market volatility and may have long term effects on both the U.S. and global financial markets. The occurrence of such events may be sudden and unexpected, and it is difficult to predict when similar events affecting the U.S. or global financial markets may occur, the effects that such events may have and the duration of those effects (which may last for extended periods). Any such event(s) could have a significant adverse impact on the value, liquidity and risk profile of the Fund's portfolio, as well as its ability to sell securities and/or meet redemptions. Any such event(s) or similar types of factors and developments may also adversely affect the financial performance of the Fund's investments (and, in turn, the Fund's investment results) and/or negatively impact broad segments of businesses and populations and have a significant and rapid negative impact on the performance of the Fund's investments, and exacerbate preexisting risks to the Fund.
18
Morgan Stanley Variable Insurance Fund, Inc.
June 30, 2024 (unaudited)
Investment Advisory Agreement Approval
Nature, Extent and Quality of Services
The Board reviewed and considered the nature and extent of the investment advisory services provided by the Adviser under the advisory agreement, including portfolio management, investment research and equity and fixed income securities trading. The Board also reviewed and considered the nature and extent of the non-advisory, administrative services provided by the Administrator under the administration agreement, including accounting, operations, clerical, bookkeeping, compliance, business management and planning, legal services and the provision of supplies, office space and utilities at the Adviser's expense. The Board also considered the Adviser's investment in personnel and infrastructure that benefits the Fund. (The Adviser and Administrator together are referred to as the "Adviser" and the advisory and administration agreements together are referred to as the "Management Agreement.") The Board also considered that the Adviser serves a variety of other investment advisory clients and has experience overseeing service providers. The Board also compared the nature of the services provided by the Adviser with similar services provided by non-affiliated advisers as prepared by Broadridge Financial Solutions, Inc. ("Broadridge").
The Board reviewed and considered the qualifications of the portfolio managers, the senior administrative managers and other key personnel of the Adviser who provide the advisory and administrative services to the Fund. The Board determined that the Adviser's portfolio managers and key personnel are well qualified by education and/or training and experience to perform the services in an efficient and professional manner. The Board concluded that the nature and extent of the advisory and administrative services provided were necessary and appropriate for the conduct of the business and investment activities of the Fund and supported its decision to approve the Management Agreement.
Performance, Fees and Expenses of the Fund
The Board reviewed the performance, fees and expenses of the Fund compared to its peers, as prepared by Broadridge, and to appropriate benchmarks where applicable. The Board discussed with the Adviser the performance goals and the actual results achieved in managing the Fund. When considering a fund's performance, the Board and the Adviser place emphasis on trends and longer-term returns (focusing on one-year, three-year and five-year performance, as of December 31, 2023, or since inception, as applicable). When a fund underperforms its benchmark and/or its peer group average, the Board and the Adviser discuss the causes of such underperformance and, where necessary, they discuss specific changes to investment strategy or investment personnel. The Board noted that the Fund's performance was better than its peer group average for the one-year period but below its peer group average for the three- and five-year periods. The Board discussed with the Adviser the level of the advisory and administration fees (together, the "management fee") for this Fund relative to comparable funds and/or other accounts advised by the Adviser and/or compared to its peers as prepared by Broadridge. In addition to the management fee, the Board also reviewed the Fund's total expense ratio. The Board noted that the Fund's contractual management fee was higher than but close to its peer group average and the actual management fee and total expense ratio were lower than its peer group averages. After discussion, the Board concluded that the Fund's (i) performance was acceptable; and (ii) management fee and total expense ratio were competitive with its peer group averages.
Economies of Scale
The Board considered the size and growth prospects of the Fund and how that relates to the Fund's total expense ratio and particularly the Fund's management fee rate, which includes breakpoints. In conjunction with its review of the Adviser's profitability, the Board discussed with the Adviser how a change in assets can affect the efficiency or effectiveness of managing the Fund and whether the management fee level is appropriate relative to current and projected asset levels and/or whether the management fee structure reflects economies of scale as asset levels change. The Board has determined that its review of the actual and/or potential economies of scale of the Fund supports its decision to approve the Management Agreement.
Profitability of the Adviser and Affiliates
The Board considered information concerning the costs incurred and profits realized by the Adviser and its affiliates during the last year from their relationship with the Fund and during the last two years from their relationship with the Morgan Stanley Fund Complex and reviewed with the Adviser the cost allocation methodology used to determine the profitability of the Adviser
19
Morgan Stanley Variable Insurance Fund, Inc.
June 30, 2024 (unaudited)
Investment Advisory Agreement Approval (cont'd)
and affiliates. The Board has determined that its review of the analysis of the Adviser's expenses and profitability supports its decision to approve the Management Agreement.
Other Benefits of the Relationship
The Board considered other direct and indirect benefits to the Adviser and/or its affiliates derived from their relationship with the Fund and other funds advised by the Adviser. These benefits may include, among other things, fees for trading, distribution and/or shareholder servicing and for transaction processing and reporting platforms used by securities lending agents, and research received by the Adviser generated from commission dollars spent on funds' portfolio trading. The Board reviewed with the Adviser these arrangements and the reasonableness of the Adviser's costs relative to the services performed. The Board has determined that its review of the other benefits received by the Adviser or its affiliates supports its decision to approve the Management Agreement.
Resources of the Adviser and Historical Relationship Between the Fund and the Adviser
The Board considered whether the Adviser is financially sound and has the resources necessary to perform its obligations under the Management Agreement. The Board also reviewed and considered the historical relationship between the Fund and the Adviser, including the organizational structure of the Adviser, the policies and procedures formulated and adopted by the Adviser for managing the Fund's operations and the Board's confidence in the competence and integrity of the senior managers and key personnel of the Adviser. The Board concluded that the Adviser has the financial resources necessary to fulfill its obligations under the Management Agreement and that it is beneficial for the Fund to continue its relationship with the Adviser.
Other Factors and Current Trends
The Board considered the controls and procedures adopted and implemented by the Adviser and monitored by the Fund's Chief Compliance Officer and concluded that the conduct of business by the Adviser indicates a good faith effort on its part to adhere to high ethical standards in the conduct of the Fund's business.
General Conclusion
After considering and weighing all of the above factors, with various written materials and verbal information presented by the Adviser, the Board concluded that it would be in the best interest of the Fund and its shareholders to approve renewal of the Management Agreement for another year. In reaching this conclusion the Board did not give particular weight to any single piece of information or factor referenced above. The Board considered these factors and information over the course of the year and in numerous meetings, some of which were in executive session with only the independent Board members and their counsel present. It is possible that individual Board members may have weighed these factors, and the information presented, differently in reaching their individual decisions to approve the Management Agreement.
20
Morgan Stanley Variable Insurance Fund, Inc.
June 30, 2024 (unaudited)
This report is not authorized for distribution to prospective investors in the Fund unless preceded or accompanied by an effective Prospectus. Read the Prospectus carefully before investing

Morgan Stanley Variable Insurance Fund, Inc.
Semi-Annual Financial Statements and Additional Information
June 30, 2024 (unaudited)
Emerging Markets Debt Portfolio
The Fund is intended to be a funding vehicle for variable annuity contracts and variable life insurance policies offered by the separate accounts of certain life insurance companies.
Morgan Stanley Variable Insurance Fund, Inc.
June 30, 2024 (unaudited)
1
Morgan Stanley Variable Insurance Fund, Inc.
June 30, 2024 (unaudited)
Portfolio of Investments
Emerging Markets Debt Portfolio
| | | Face Amount
(000) | | Value
(000) | |
Fixed Income Securities (96.8%) | |
Albania (1.7%) | |
Sovereign (1.7%) | |
Albania Government International Bond,
3.50%, 11/23/31 | | EUR | 335 | | | $ | 324 | | |
5.90%, 6/9/28 | | | 1,264 | | | | 1,397 | | |
| | | | 1,721 | | |
Angola (3.0%) | |
Sovereign (3.0%) | |
Angolan Government International Bond,
8.75%, 4/14/32 | | $ | 1,703 | | | | 1,511 | | |
9.13%, 11/26/49 | | | 820 | | | | 675 | | |
9.38%, 5/8/48 | | | 1,118 | | | | 938 | | |
| | | | 3,124 | | |
Argentina (1.3%) | |
Corporate Bonds (0.8%) | |
Generacion Mediterranea SA/
Central Termica Roca SA,
12.50%, 5/28/27 (a) | | | 368 | | | | 363 | | |
Pan American Energy LLC,
8.50%, 4/30/32 (a) | | | 419 | | | | 439 | | |
| | | | 802 | | |
Sovereign (0.5%) | |
Argentine Republic Government
International Bond,
3.50%, 7/9/41 (b) | | | 300 | | | | 117 | | |
3.63%, 7/9/35 (b) | | | 400 | | | | 168 | | |
4.25%, 1/9/38 (b) | | | 500 | | | | 230 | | |
| | | | 515 | | |
| | | | 1,317 | | |
Bahamas (0.5%) | |
Sovereign (0.5%) | |
Bahamas Government International Bond,
6.00%, 11/21/28 | | | 357 | | | | 313 | | |
8.95%, 10/15/32 | | | 200 | | | | 188 | | |
| | | | 501 | | |
Bahrain (1.7%) | |
Sovereign (1.7%) | |
Bahrain Government International Bond,
5.45%, 9/16/32 | | | 600 | | | | 553 | | |
5.63%, 5/18/34 | | | 900 | | | | 811 | | |
7.00%, 10/12/28 | | | 400 | | | | 413 | | |
| | | | 1,777 | | |
Barbados (0.7%) | |
Sovereign (0.7%) | |
Barbados Government International Bond,
6.50%, 10/1/29 | | | 708 | | | | 676 | | |
| | | Face Amount
(000) | | Value
(000) | |
Benin (2.7%) | |
Sovereign (2.7%) | |
Benin Government International Bond,
4.88%, 1/19/32 | | EUR | 250 | | | $ | 225 | | |
4.95%, 1/22/35 | | | 810 | | | | 688 | | |
6.88%, 1/19/52 | | | 1,970 | | | | 1,669 | | |
7.96%, 2/13/38 | | $ | 200 | | | | 186 | | |
| | | | 2,768 | | |
Brazil (4.7%) | |
Corporate Bonds (4.0%) | |
Braskem Netherlands Finance BV,
8.50%, 1/23/81 | | | 678 | | | | 679 | | |
Coruripe Netherlands BV,
10.00%, 2/10/27 | | | 430 | | | | 378 | | |
FORESEA Holding SA,
7.50%, 6/15/30 | | | 660 | | | | 615 | | |
Gol Finance SA 1 Month Term
SOFR + 10.50%,
15.84%, 1/29/25 (a)(c) | | | 157 | | | | 170 | | |
MC Brazil Downstream Trading SARL,
7.25%, 6/30/31 | | | 456 | | | | 405 | | |
MV24 Capital BV,
6.75%, 6/1/34 | | | 227 | | | | 217 | | |
Samarco Mineracao SA, PIK
9.00%, 6/30/31 (d)(e)(f) | | | 1,108 | | | | 1,031 | | |
Yinson Boronia Production BV,
8.95%, 7/31/42 (a) | | | 601 | | | | 607 | | |
| | | | 4,102 | | |
Sovereign (0.7%) | |
Brazilian Government International Bond,
6.13%, 1/22/32 | | | 741 | | | | 733 | | |
| | | | 4,835 | | |
Cameroon (0.6%) | |
Sovereign (0.6%) | |
Republic of Cameroon International Bond,
5.95%, 7/7/32 | | EUR | 760 | | | | 634 | | |
Chile (1.2%) | |
Corporate Bond (0.2%) | |
Liberty Latin America Ltd.,
2.00%, 7/15/24 | | $ | 257 | | | | 256 | | |
Sovereign (1.0%) | |
Chile Government International Bond,
2.55%, 7/27/33 | | | 800 | | | | 650 | | |
3.50%, 1/25/50 | | | 500 | | | | 361 | | |
| | | | 1,011 | | |
| | | | 1,267 | | |
China (1.5%) | |
Corporate Bonds (1.5%) | |
China Oil & Gas Group Ltd.,
4.70%, 6/30/26 | | | 590 | | | | 544 | | |
KWG Group Holdings Ltd.,
7.88%, 8/30/24 (e)(f) | | | 450 | | | | 26 | | |
The accompanying notes are an integral part of the financial statements.
2
Morgan Stanley Variable Insurance Fund, Inc.
June 30, 2024 (unaudited)
Portfolio of Investments (cont'd)
Emerging Markets Debt Portfolio
| | | Face Amount
(000) | | Value
(000) | |
Corporate Bonds (cont'd) | |
Longfor Group Holdings Ltd.,
3.85%, 1/13/32 | | $ | 231 | | | $ | 153 | | |
Shimao Group Holdings Ltd.,
5.60%, 7/15/26 (e)(f) | | | 1,218 | | | | 63 | | |
Sunac China Holdings Ltd.,
PIK
1.00%, 9/30/32 (d)(e)(f) | | | 85 | | | | 6 | | |
6.00%, 9/30/26 (d)(e)(f) | | | 70 | | | | 9 | | |
6.25%, 9/30/27 (d)(e)(f) | | | 70 | | | | 8 | | |
6.50%, 9/30/27 (d)(e)(f) | | | 140 | | | | 15 | | |
6.75%, 9/30/28 (d)(e)(f) | | | 211 | | | | 22 | | |
7.00%, 9/30/29 (d)(e)(f) | | | 211 | | | | 20 | | |
7.25%, 9/30/30 (d)(e)(f) | | | 99 | | | | 9 | | |
Times China Holdings Ltd.,
5.55%, 6/4/24 (e)(f) | | | 1,376 | | | | 34 | | |
6.75%, 7/16/23 (e)(f) | | | 280 | | | | 7 | | |
Yuexiu Co. Ltd., REIT MTN
2.65%, 2/2/26 | | | 700 | | | | 619 | | |
| | | | 1,535 | | |
Colombia (3.3%) | |
Corporate Bonds (3.3%) | |
ABRA Global Finance
6.00% Cash, 5.50% PIK,
11.50%, 3/2/28 (a)(d) | | | 240 | | | | 235 | | |
Aris Mining Corp.,
6.88%, 8/9/26 | | | 200 | | | | 188 | | |
Avianca Midco 2 PLC,
9.00%, 12/1/28 | | | 789 | | | | 763 | | |
Banco Davivienda SA,
6.65%, 4/22/31 (g) | | | 208 | | | | 154 | | |
Banco de Occidente SA,
10.88%, 8/13/34 | | | 780 | | | | 833 | | |
Bancolombia SA,
8.63%, 12/24/34 | | | 737 | | | | 753 | | |
Canacol Energy Ltd.,
5.75%, 11/24/28 | | | 972 | | | | 515 | | |
| | | | 3,441 | | |
Costa Rica (0.7%) | |
Sovereign (0.7%) | |
Costa Rica Government International Bond,
6.55%, 4/3/34 | | | 700 | | | | 722 | | |
Dominican Republic (1.8%) | |
Sovereign (1.8%) | |
Dominican Republic International Bond,
4.88%, 9/23/32 | | | 800 | | | | 718 | | |
5.95%, 1/25/27 | | | 250 | | | | 248 | | |
6.00%, 7/19/28 | | | 500 | | | | 496 | | |
6.85%, 1/27/45 (a) | | | 200 | | | | 198 | | |
7.45%, 4/30/44 (a) | | | 200 | | | | 210 | | |
| | | | 1,870 | | |
| | | Face Amount
(000) | | Value
(000) | |
Ecuador (1.9%) | |
Sovereign (1.9%) | |
Ecuador Government International Bond,
0.00%, 7/31/30 | | $ | 2,077 | | | $ | 997 | | |
3.50%, 7/31/35 (b) | | | 1,397 | | | | 699 | | |
6.00%, 7/31/30 (b) | | | 446 | | | | 284 | | |
| | | | 1,980 | | |
Egypt (6.8%) | |
Sovereign (6.8%) | |
Egypt Government International Bond,
5.25%, 10/6/25 (a) | | | 500 | | | | 484 | | |
5.63%, 4/16/30 | | EUR | 1,184 | | | | 1,019 | | |
6.38%, 4/11/31 (a) | | | 500 | | | | 427 | | |
6.38%, 4/11/31 | | | 629 | | | | 537 | | |
6.88%, 4/30/40 | | $ | 104 | | | | 72 | | |
7.05%, 1/15/32 | | | 488 | | | | 391 | | |
7.50%, 2/16/61 | | | 370 | | | | 249 | | |
7.63%, 5/29/32 | | | 200 | | | | 164 | | |
7.90%, 2/21/48 | | | 718 | | | | 506 | | |
8.15%, 11/20/59 | | | 200 | | | | 143 | | |
8.50%, 1/31/47 | | | 1,689 | | | | 1,255 | | |
8.70%, 3/1/49 | | | 617 | | | | 465 | | |
8.75%, 9/30/51 | | | 216 | | | | 163 | | |
8.88%, 5/29/50 | | | 1,544 | | | | 1,179 | | |
| | | | 7,054 | | |
El Salvador (0.4%) | |
Sovereign (0.4%) | |
El Salvador Government International Bond,
8.25%, 4/10/32 | | | 500 | | | | 395 | | |
9.25%, 4/17/30 (a) | | | 2 | | | | 2 | | |
| | | | 397 | | |
Ethiopia (1.9%) | |
Sovereign (1.9%) | |
Ethiopia International Bond,
6.63%, 12/11/24 (e)(f) | | | 2,712 | | | | 1,966 | | |
Gabon (0.3%) | |
Sovereign (0.3%) | |
Gabon Government International Bond,
6.95%, 6/16/25 (a) | | | 300 | | | | 276 | | |
Georgia (2.0%) | |
Corporate Bonds (2.0%) | |
Bank of Georgia JSC,
9.50%, 7/16/29 (g) | | | 690 | | | | 673 | | |
TBC Bank JSC,
10.25%, 7/30/29 (g) | | | 1,040 | | | | 1,021 | | |
10.78%, 10/3/24 (g) | | | 370 | | | | 370 | | |
| | | | 2,064 | | |
Ghana (2.9%) | |
Corporate Bonds (0.7%) | |
Puma International Financing SA,
7.75%, 4/25/29 (a) | | | 338 | | | | 341 | | |
Tullow Oil PLC,
10.25%, 5/15/26 | | | 369 | | | | 351 | | |
| | | | 692 | | |
The accompanying notes are an integral part of the financial statements.
3
Morgan Stanley Variable Insurance Fund, Inc.
June 30, 2024 (unaudited)
Portfolio of Investments (cont'd)
Emerging Markets Debt Portfolio
| | | Face Amount
(000) | | Value
(000) | |
Sovereign (2.2%) | |
Ghana Government International Bond,
6.38%, 2/11/27 (e)(f) | | $ | 808 | | | $ | 410 | | |
7.75%, 4/7/29 (e)(f) | | | 716 | | | | 367 | | |
7.88%, 3/26/27 - 2/11/35 (e)(f) | | | 516 | | | | 264 | | |
8.13%, 1/18/26 - 3/26/32 (e)(f) | | | 601 | | | | 311 | | |
8.63%, 4/7/34 - 6/16/49 (e)(f) | | | 1,124 | | | | 572 | | |
8.75%, 3/11/61 (e)(f) | | | 200 | | | | 103 | | |
8.88%, 5/7/42 (e)(f) | | | 233 | | | | 119 | | |
8.95%, 3/26/51 (e)(f) | | | 245 | | | | 126 | | |
| | | | 2,272 | | |
| | | | 2,964 | | |
Greece (1.4%) | |
Corporate Bonds (1.4%) | |
Alpha Services & Holdings SA,
5.50%, 6/11/31 | | EUR | 230 | | | | 245 | | |
Piraeus Financial Holdings SA,
5.50%, 2/19/30 | | | 140 | | | | 149 | | |
7.25%, 4/17/34 | | | 280 | | | | 312 | | |
8.75%, 6/16/26 (g) | | | 722 | | | | 776 | | |
| | | | 1,482 | | |
Guatemala (0.5%) | |
Sovereign (0.5%) | |
Guatemala Government Bond,
3.70%, 10/7/33 | | $ | 300 | | | | 246 | | |
4.65%, 10/7/41 (a) | | | 310 | | | | 246 | | |
| | | | 492 | | |
Honduras (0.1%) | |
Sovereign (0.1%) | |
Honduras Government International Bond,
6.25%, 1/19/27 | | | 150 | | | | 143 | | |
Hungary (1.6%) | |
Corporate Bonds (0.6%) | |
MBH Bank Nyrt,
8.63%, 10/19/27 | | EUR | 338 | | | | 382 | | |
OTP Bank Nyrt,
8.75%, 5/15/33 | | $ | 254 | | | | 267 | | |
| | | | 649 | | |
Sovereign (1.0%) | |
Hungary Government International Bond,
5.50%, 3/26/36 | | | 500 | | | | 481 | | |
6.25%, 9/22/32 (a) | | | 500 | | | | 516 | | |
| | | | 997 | | |
| | | | 1,646 | | |
India (1.8%) | |
Corporate Bonds (1.8%) | |
Indiabulls Housing Finance Ltd.,
4.50%, 9/28/26 | | | 387 | | | | 381 | | |
Vedanta Resources Finance II PLC,
13.88%, 1/21/27 - 12/9/28 | | | 1,518 | | | | 1,471 | | |
| | | | 1,852 | | |
| | | Face Amount
(000) | | Value
(000) | |
Indonesia (2.1%) | |
Corporate Bonds (1.1%) | |
Indika Energy Tbk. PT,
8.75%, 5/7/29 (a) | | $ | 660 | | | $ | 660 | | |
LLPL Capital Pte. Ltd.,
6.88%, 2/4/39 | | | 503 | | | | 507 | | |
| | | | 1,167 | | |
Sovereign (1.0%) | |
Indonesia Government International Bond,
4.70%, 2/10/34 | | | 680 | | | | 657 | | |
5.10%, 2/10/54 | | | 400 | | | | 377 | | |
| | | | 1,034 | | |
| | | | 2,201 | | |
Iraq (0.1%) | |
Sovereign (0.1%) | |
Iraq International Bond,
5.80%, 1/15/28 | | | 140 | | | | 131 | | |
Ivory Coast (2.6%) | |
Sovereign (2.6%) | |
Ivory Coast Government International
Bond,
4.88%, 1/30/32 | | EUR | 300 | | | | 270 | | |
5.25%, 3/22/30 | | | 520 | | | | 508 | | |
6.63%, 3/22/48 | | | 977 | | | | 817 | | |
6.88%, 10/17/40 | | | 591 | | | | 531 | | |
8.25%, 1/30/37 | | $ | 632 | | | | 613 | | |
| | | | 2,739 | | |
Jamaica (1.1%) | |
Corporate Bond (0.9%) | |
Digicel Intermediate Holdings Ltd./Digicel
International Finance Ltd./Difl U.S., PIK
12.00%, 5/25/27 (d) | | | 886 | | | | 878 | | |
Senior Loan Interest (0.2%) | |
Digicel International Finance Ltd.,
3 Month SOFR + 6.75%,
12.07%, 5/25/27 (c) | | | 251 | | | | 244 | | |
| | | | 1,122 | | |
Jordan (0.7%) | |
Sovereign (0.7%) | |
Jordan Government International Bond,
5.85%, 7/7/30 | | | 227 | | | | 204 | | |
7.38%, 10/10/47 | | | 200 | | | | 171 | | |
7.50%, 1/13/29 | | | 400 | | | | 392 | | |
| | | | 767 | | |
Kazakhstan (0.3%) | |
Sovereign (0.3%) | |
Kazakhstan Government International
Bond,
6.50%, 7/21/45 | | | 300 | | | | 347 | | |
The accompanying notes are an integral part of the financial statements.
4
Morgan Stanley Variable Insurance Fund, Inc.
June 30, 2024 (unaudited)
Portfolio of Investments (cont'd)
Emerging Markets Debt Portfolio
| | | Face Amount
(000) | | Value
(000) | |
Kenya (2.5%) | |
Sovereign (2.5%) | |
Republic of Kenya Government
International Bond,
8.00%, 5/22/32 | | $ | 801 | | | $ | 698 | | |
9.75%, 2/16/31 | | | 1,960 | | | | 1,882 | | |
| | | | 2,580 | | |
Kuwait (0.3%) | |
Sovereign (0.3%) | |
Kuwait International Government Bond,
3.50%, 3/20/27 | | | 300 | | | | 288 | | |
Latvia (0.3%) | |
Corporate Bond (0.3%) | |
Air Baltic Corp. AS,
14.50%, 8/14/29 (a) | | EUR | 240 | | | | 280 | | |
Lebanon (0.1%) | |
Sovereign (0.1%) | |
Lebanon Government International Bond,
6.85%, 3/23/27 (e)(f) | | $ | 1,210 | | | | 85 | | |
Macedonia (1.8%) | |
Sovereign (1.8%) | |
North Macedonia Government
International Bond,
1.63%, 3/10/28 | | EUR | 1,554 | | | | 1,452 | | |
6.96%, 3/13/27 | | | 383 | | | | 426 | | |
| | | | 1,878 | | |
Mexico (3.1%) | |
Corporate Bonds (1.1%) | |
BBVA Bancomer SA,
5.13%, 1/18/33 | | $ | 465 | | | | 424 | | |
Total Play Telecomunicaciones SA de CV,
10.50%, 12/31/28 (a) | | | 860 | | | | 706 | | |
| | | | 1,130 | | |
Sovereign (2.0%) | |
Mexico Government International Bond,
3.50%, 2/12/34 | | | 560 | | | | 457 | | |
Petroleos Mexicanos,
6.75%, 9/21/47 | | | 453 | | | | 298 | | |
6.84%, 1/23/30 | | | 679 | | | | 598 | | |
6.88%, 8/4/26 | | | 757 | | | | 742 | | |
| | | | 2,095 | | |
| | | | 3,225 | | |
Moldova (0.4%) | |
Corporate Bond (0.4%) | |
Aragvi Finance International DAC,
8.45%, 4/29/26 | | | 450 | | | | 380 | | |
Mongolia (0.2%) | |
Sovereign (0.2%) | |
Mongolia Government International Bond,
7.88%, 6/5/29 | | | 200 | | | | 205 | | |
| | | Face Amount
(000) | | Value
(000) | |
Montenegro (0.8%) | |
Sovereign (0.8%) | |
Montenegro Government International
Bond,
2.88%, 12/16/27 | | EUR | 112 | | | $ | 110 | | |
7.25%, 3/12/31 | | $ | 751 | | | | 755 | | |
| | | | 865 | | |
Morocco (0.4%) | |
Sovereign (0.4%) | |
Morocco Government International Bond,
3.00%, 12/15/32 | | | 300 | | | | 242 | | |
4.00%, 12/15/50 (a) | | | 300 | | | | 206 | | |
| | | | 448 | | |
Nigeria (1.1%) | |
Corporate Bond (0.4%) | |
Access Bank PLC,
6.13%, 9/21/26 | | | 483 | | | | 460 | | |
Sovereign (0.7%) | |
Nigeria Government International Bond,
7.38%, 9/28/33 | | | 454 | | | | 372 | | |
8.25%, 9/28/51 | | | 433 | | | | 332 | | |
| | | | 704 | | |
| | | | 1,164 | | |
Oman (1.8%) | |
Sovereign (1.8%) | |
Oman Government International Bond,
5.38%, 3/8/27 | | | 200 | | | | 198 | | |
6.25%, 1/25/31 | | | 1,000 | | | | 1,031 | | |
6.75%, 1/17/48 | | | 440 | | | | 449 | | |
7.38%, 10/28/32 | | | 200 | | | | 222 | | |
| | | | 1,900 | | |
Pakistan (0.4%) | |
Sovereign (0.4%) | |
Pakistan Government International Bond,
6.88%, 12/5/27 | | | 267 | | | | 232 | | |
7.38%, 4/8/31 | | | 281 | | | | 226 | | |
| | | | 458 | | |
Panama (1.8%) | |
Corporate Bonds (0.7%) | |
AES Panama Generation Holdings SRL,
4.38%, 5/31/30 | | | 569 | | | | 496 | | |
Multibank, Inc.,
7.75%, 2/3/28 (a) | | | 250 | | | | 250 | | |
| | | | 746 | | |
Sovereign (1.1%) | |
Panama Government International Bond,
2.25%, 9/29/32 | | | 200 | | | | 144 | | |
3.16%, 1/23/30 | | | 500 | | | | 423 | | |
3.30%, 1/19/33 | | | 500 | | | | 389 | | |
4.50%, 4/1/56 | | | 200 | | | | 130 | | |
| | | | 1,086 | | |
| | | | 1,832 | | |
The accompanying notes are an integral part of the financial statements.
5
Morgan Stanley Variable Insurance Fund, Inc.
June 30, 2024 (unaudited)
Portfolio of Investments (cont'd)
Emerging Markets Debt Portfolio
| | | Face Amount
(000) | | Value
(000) | |
Paraguay (1.3%) | |
Corporate Bond (0.5%) | |
Frigorifico Concepcion SA,
7.70%, 7/21/28 | | $ | 786 | | | $ | 535 | | |
Senior Loan Interest (0.8%) | |
Frigorifico Concepcion SA,
3 Month SOFR + 5.50%,
10.83%, 12/8/26 (c) | | | 780 | | | | 787 | | |
| | | | 1,322 | | |
Peru (1.3%) | |
Corporate Bonds (1.3%) | |
Auna SAA,
10.00%, 12/15/29 (a) | | | 957 | | | | 978 | | |
Peru LNG Srl,
5.38%, 3/22/30 | | | 416 | | | | 359 | | |
| | | | 1,337 | | |
Philippines (1.5%) | |
Sovereign (1.5%) | |
Philippine Government International Bond,
5.00%, 7/17/33 | | | 1,040 | | | | 1,028 | | |
5.50%, 1/17/48 | | | 520 | | | | 527 | | |
| | | | 1,555 | | |
Romania (1.6%) | |
Sovereign (1.6%) | |
Romanian Government International Bond,
1.75%, 7/13/30 | | EUR | 800 | | | | 701 | | |
2.00%, 4/14/33 | | | 232 | | | | 187 | | |
6.38%, 1/30/34 | | $ | 400 | | | | 404 | | |
6.63%, 9/27/29 | | EUR | 300 | | | | 344 | | |
| | | | 1,636 | | |
Serbia (1.0%) | |
Sovereign (1.0%) | |
Serbia International Bond,
2.05%, 9/23/36 | | | 270 | | | | 206 | | |
2.13%, 12/1/30 | | $ | 720 | | | | 576 | | |
6.50%, 9/26/33 | | | 200 | | | | 203 | | |
| | | | 985 | | |
Sri Lanka (2.6%) | |
Sovereign (2.6%) | |
Sri Lanka Government International Bond,
5.75%, 4/18/23 (e)(f) | | | 200 | | | | 115 | | |
6.20%, 5/11/27 (e)(f) | | | 2,106 | | | | 1,241 | | |
6.35%, 6/28/24 (e)(f) | | | 200 | | | | 115 | | |
6.83%, 7/18/26 (e)(f) | | | 200 | | | | 119 | | |
6.85%, 11/3/25 (e)(f) | | | 1,928 | | | | 1,143 | | |
| | | | 2,733 | | |
Suriname (2.8%) | |
Sovereign (2.8%) | |
Suriname Government International
Bond,
9.00%, 12/31/50 (a)(c)(e)(f) | | | 1,553 | | | | 1,246 | | |
PIK
7.95%, 7/15/33 (a)(d)(e)(f) | | | 1,801 | | | | 1,684 | | |
| | | | 2,930 | | |
| | | Face Amount
(000) | | Value
(000) | |
Tanzania, United Republic Of (3.7%) | |
Corporate Bond (0.2%) | |
HTA Group Ltd.,
2.88%, 3/18/27 | | $ | 200 | | | $ | 181 | | |
Senior Loan Interest (3.5%) | |
Tanzania,
3 Month SOFR + 5.45%,
10.70%, 2/27/31 (c) | | | 3,700 | | | | 3,672 | | |
| | | | 3,853 | | |
Trinidad And Tobago (0.3%) | |
Sovereign (0.3%) | |
Trinidad & Tobago Government
International Bond,
4.50%, 6/26/30 | | | 350 | | | | 322 | | |
Tunisia (0.8%) | |
Sovereign (0.8%) | |
Tunisian Republic,
5.75%, 1/30/25 | | | 220 | | | | 210 | | |
6.38%, 7/15/26 | | EUR | 645 | | | | 598 | | |
| | | | 808 | | |
Turkey (2.6%) | |
Corporate Bonds (1.0%) | |
Limak Iskenderun Uluslararasi Liman
Isletmeciligi AS,
9.50%, 7/10/36 | | $ | 461 | | | | 427 | | |
WE Soda Investments Holding PLC,
9.50%, 10/6/28 | | | 582 | | | | 597 | | |
| | | | 1,024 | | |
Sovereign (1.6%) | |
Turkiye Government International Bond,
4.88%, 4/16/43 | | | 370 | | | | 262 | | |
6.13%, 10/24/28 | | | 900 | | | | 880 | | |
7.63%, 5/15/34 | | | 530 | | | | 535 | | |
| | | | 1,677 | | |
| | | | 2,701 | | |
Ukraine (1.2%) | |
Sovereign (1.2%) | |
Ukraine Government International Bond,
6.88%, 5/21/31 (e)(f) | | | 600 | | | | 172 | | |
7.38%, 9/25/34 (e)(f) | | | 757 | | | | 219 | | |
7.75%, 9/1/24 - 9/1/29 (e)(f) | | | 471 | | | | 148 | | |
7.75%, 9/1/25 - 9/1/28 (e)(f) | | | 1,600 | | | | 510 | | |
7.75%, 8/1/41 (c)(e)(f) | | | 300 | | | | 148 | | |
9.75%, 11/1/30 (e)(f) | | | 200 | | | | 64 | | |
| | | | 1,261 | | |
United Arab Emirates (3.1%) | |
Corporate Bond (0.5%) | |
Ittihad International Ltd.,
9.75%, 11/9/28 | | | 531 | | | | 531 | | |
The accompanying notes are an integral part of the financial statements.
6
Morgan Stanley Variable Insurance Fund, Inc.
June 30, 2024 (unaudited)
Portfolio of Investments (cont'd)
Emerging Markets Debt Portfolio
| | | Face Amount
(000) | | Value
(000) | |
Sovereign (2.6%) | |
Finance Department Government of
Sharjah,
4.00%, 7/28/50 | | $ | 400 | | | $ | 262 | | |
4.38%, 3/10/51 | | | 200 | | | | 139 | | |
6.50%, 11/23/32 (a) | | | 600 | | | | 622 | | |
6.50%, 11/23/32 | | | 1,600 | | | | 1,659 | | |
| | | | 2,682 | | |
| | | | 3,213 | | |
Uruguay (1.0%) | |
Sovereign (1.0%) | |
Uruguay Government International Bond,
4.38%, 1/23/31 | | | 300 | | | | 292 | | |
5.10%, 6/18/50 | | | 550 | | | | 519 | | |
5.75%, 10/28/34 | | | 200 | | | | 209 | | |
| | | | 1,020 | | |
Uzbekistan (1.3%) | |
Corporate Bond (0.2%) | |
Uzbek Industrial and Construction
Bank ATB,
5.75%, 12/2/24 | | | 200 | | | | 198 | | |
Sovereign (1.1%) | |
National Bank of Uzbekistan,
8.50%, 7/5/29 (h) | | | 740 | | | | 732 | | |
Republic of Uzbekistan International Bond,
5.38%, 5/29/27 | | EUR | 115 | | | | 123 | | |
6.90%, 2/28/32 | | $ | 332 | | | | 322 | | |
| | | | 1,177 | | |
| | | | 1,375 | | |
Venezuela (1.2%) | |
Sovereign (1.2%) | |
Petroleos de Venezuela SA,
5.38%, 4/12/27 (e)(f) | | | 372 | | | | 45 | | |
5.50%, 4/12/37 (e)(f) | | | 245 | | | | 30 | | |
6.00%, 10/28/22 - 11/15/26 (e)(f) | | | 4,633 | | | | 566 | | |
9.00%, 11/17/21 (e)(f) | | | 570 | | | | 75 | | |
9.75%, 5/17/35 (e)(f) | | | 238 | | | | 34 | | |
12.75%, 2/17/22 (e)(f) | | | 100 | | | | 15 | | |
Venezuela Government International Bond,
6.00%, 12/9/20 (e)(f) | | | 192 | | | | 28 | | |
7.00%, 3/31/38 (e)(f) | | | 84 | | | | 13 | | |
7.65%, 4/21/25 (e)(f) | | | 686 | | | | 110 | | |
7.75%, 10/13/19 (e)(f) | | | 51 | | | | 8 | | |
8.25%, 10/13/24 (e)(f) | | | 25 | | | | 4 | | |
9.00%, 5/7/23 (e)(f) | | | 76 | | | | 13 | | |
9.25%, 9/15/27 - 5/7/28 (e)(f) | | | 1,200 | | | | 224 | | |
9.38%, 1/13/34 (e)(f) | | | 25 | | | | 5 | | |
11.75%, 10/21/26 (e)(f) | | | 145 | | | | 28 | | |
11.95%, 8/5/31 (e)(f) | | | 99 | | | | 19 | | |
12.75%, 8/23/22 (e)(f) | | | 60 | | | | 11 | | |
| | | | 1,228 | | |
| | | Face Amount
(000) | | Value
(000) | |
Vietnam (0.3%) | |
Corporate Bond (0.3%) | |
Mong Duong Finance Holdings BV,
5.13%, 5/7/29 | | $ | 275 | | | $ | 262 | | |
Zambia (0.3%) | |
Sovereign (0.3%) | |
Zambia Government International Bond,
0.50%, 12/31/53 (e)(f) | | | 186 | | | | 88 | | |
5.75%, 6/30/33 (b)(e)(f) | | | 199 | | | | 175 | | |
| | | | 263 | | |
Total Fixed Income Securities (Cost $105,609) | | | 100,203 | | |
| | | No. of
Warrants | | | |
Warrants (0.0%)‡ | |
Venezuela (0.0%)‡ | |
Venezuela Government International Bond,
Oil-Linked Payment Obligation
expires 4/15/20 (i)(j) (Cost $—) | | | 3,750 | | | | 26 | | |
| | | Face Amount
(000) | | | |
Short-Term Investment (0.2%) | |
United States (0.2%) | |
U.S. Treasury Security (0.2%) | |
U.S. Treasury Bill,
5.31%, 8/1/24 (k)(l) (Cost $239) | | $ | 240 | | | | 239 | | |
Total Investments (97.0%) (Cost $105,848) (m)(n) | | | 100,468 | | |
Other Assets in Excess of Liabilities (3.0%) | | | 3,084 | | |
Net Assets (100.0%) | | $ | 103,552 | | |
Country assignments and aggregations are based generally on third party vendor classifications and information, and may be different from the assignments and aggregations under the policies set forth in the Fund's prospectus and/or statement of additional information relating to geographic classifications.
‡ Amount is less than 0.05%.
(a) 144A security — Certain conditions for public sale may exist. Unless otherwise noted, these securities are deemed to be liquid.
(b) Multi-step — Coupon rate changes in predetermined increments to maturity. Rate disclosed is as of June 30, 2024. Maturity date disclosed is the ultimate maturity date.
(c) Floating or variable rate securities: The rates disclosed are as of June 30, 2024. For securities based on a published reference rate and spread, the reference rate and spread are indicated in the description in the Portfolio of Investments. Certain variable rate securities may not be based on a published reference rate and spread but are determined by the issuer or agent and are based on current market conditions. These securities do not indicate a reference rate and spread in their description in the Portfolio of Investments.
(d) Income may be paid in additional securities and/or cash at the discretion of the issuer.
(e) Issuer in bankruptcy.
(f) Non-income producing security; bond in default.
(g) Perpetual — One or more securities do not have a predetermined maturity date. Rates for these securities are fixed for a period of time after which they revert to a floating rate. Interest rates in effect are as of June 30, 2024.
The accompanying notes are an integral part of the financial statements.
7
Morgan Stanley Variable Insurance Fund, Inc.
June 30, 2024 (unaudited)
Portfolio of Investments (cont'd)
Emerging Markets Debt Portfolio
(h) When-issued security.
(i) Perpetual maturity date. Date disclosed is the last expiration date.
(j) Non-income producing security.
(k) Rate shown is the yield to maturity at June 30, 2024.
(l) All or a portion of the security was pledged to cover margin requirements for swap agreements.
(m) Securities are available for collateral in connection with purchase of when-issued security, open foreign currency forward exchange contracts, futures contracts and swap agreements.
(n) At June 30, 2024, the aggregate cost for federal income tax purposes approximates the aggregate cost for book purposes. The aggregate gross unrealized appreciation is approximately $4,833,000 and the aggregate gross unrealized depreciation is approximately $9,828,000, resulting in net unrealized depreciation of approximately $4,995,000.
DAC Designated Activity Company.
MTN Medium Term Note.
PIK Payment-in-Kind.
REIT Real Estate Investment Trust.
SOFR Secured Overnight Financing Rate.
USD — United States Dollar
Foreign Currency Forward Exchange Contracts:
The Fund had the following foreign currency forward exchange contracts open at June 30, 2024:
Counterparty | | Contracts
to
Deliver
(000) | | In
Exchange
For
(000) | | Delivery
Date | | Unrealized
Appreciation
(Depreciation)
(000) | |
Goldman Sachs International | | $ | 319 | | | EUR | 297 | | | 9/18/24 | | $ | 1 | | |
HSBC Bank PLC | | EUR | 272 | | | $ | 296 | | | 7/5/24 | | | 5 | | |
HSBC Bank PLC | | EUR | 168 | | | $ | 183 | | | 7/5/24 | | | 3 | | |
HSBC Bank PLC | | EUR | 369 | | | $ | 402 | | | 7/5/24 | | | 6 | | |
HSBC Bank PLC | | EUR | 50 | | | $ | 55 | | | 7/5/24 | | | 1 | | |
HSBC Bank PLC | | EUR | 254 | | | $ | 277 | | | 7/5/24 | | | 4 | | |
HSBC Bank PLC | | EUR | 931 | | | $ | 1,014 | | | 7/5/24 | | | 16 | | |
HSBC Bank PLC | | EUR | 213 | | | $ | 232 | | | 7/5/24 | | | 4 | | |
HSBC Bank PLC | | EUR | 407 | | | $ | 443 | | | 7/5/24 | | | 7 | | |
HSBC Bank PLC | | EUR | 836 | | | $ | 910 | | | 7/5/24 | | | 14 | | |
HSBC Bank PLC | | EUR | 1,042 | | | $ | 1,134 | | | 7/5/24 | | | 18 | | |
HSBC Bank PLC | | EUR | 158 | | | $ | 172 | | | 7/5/24 | | | 3 | | |
HSBC Bank PLC | | EUR | 185 | | | $ | 202 | | | 7/5/24 | | | 3 | | |
HSBC Bank PLC | | EUR | 834 | | | $ | 908 | | | 7/5/24 | | | 14 | | |
HSBC Bank PLC | | EUR | 576 | | | $ | 627 | | | 7/5/24 | | | 10 | | |
HSBC Bank PLC | | EUR | 1,585 | | | $ | 1,725 | | | 7/5/24 | | | 27 | | |
HSBC Bank PLC | | $ | 12 | | | EUR | 11 | | | 7/5/24 | | | (— | @) | |
HSBC Bank PLC | | $ | 113 | | | EUR | 104 | | | 7/5/24 | | | (2 | ) | |
State Street Bank and Trust Co. | | EUR | 274 | | | $ | 298 | | | 7/5/24 | | | 5 | | |
State Street Bank and Trust Co. | | EUR | 409 | | | $ | 445 | | | 7/5/24 | | | 7 | | |
State Street Bank and Trust Co. | | EUR | 841 | | | $ | 915 | | | 7/5/24 | | | 14 | | |
State Street Bank and Trust Co. | | EUR | 1,595 | | | $ | 1,736 | | | 7/5/24 | | | 27 | | |
State Street Bank and Trust Co. | | EUR | 50 | | | $ | 55 | | | 7/5/24 | | | 1 | | |
State Street Bank and Trust Co. | | EUR | 1,049 | | | $ | 1,141 | | | 7/5/24 | | | 18 | | |
State Street Bank and Trust Co. | | EUR | 371 | | | $ | 404 | | | 7/5/24 | | | 6 | | |
State Street Bank and Trust Co. | | EUR | 256 | | | $ | 278 | | | 7/5/24 | | | 4 | | |
State Street Bank and Trust Co. | | EUR | 937 | | | $ | 1,020 | | | 7/5/24 | | | 16 | | |
State Street Bank and Trust Co. | | EUR | 840 | | | $ | 914 | | | 7/5/24 | | | 14 | | |
State Street Bank and Trust Co. | | EUR | 170 | | | $ | 184 | | | 7/5/24 | | | 3 | | |
State Street Bank and Trust Co. | | EUR | 160 | | | $ | 174 | | | 7/5/24 | | | 3 | | |
State Street Bank and Trust Co. | | EUR | 186 | | | $ | 203 | | | 7/5/24 | | | 3 | | |
State Street Bank and Trust Co. | | EUR | 215 | | | $ | 234 | | | 7/5/24 | | | 4 | | |
State Street Bank and Trust Co. | | EUR | 579 | | | $ | 630 | | | 7/5/24 | | | 10 | | |
State Street Bank and Trust Co. | | $ | 114 | | | EUR | 104 | | | 7/5/24 | | | (2 | ) | |
State Street Bank and Trust Co. | | $ | 12 | | | EUR | 11 | | | 7/5/24 | | | (— | @) | |
| | | | | $ | 267 | | |
The accompanying notes are an integral part of the financial statements.
8
Morgan Stanley Variable Insurance Fund, Inc.
June 30, 2024 (unaudited)
Portfolio of Investments (cont'd)
Emerging Markets Debt Portfolio
Futures Contracts:
The Fund had the following futures contracts open at June 30, 2024:
| | | Number
of
Contracts | | Expiration
Date | | Notional
Amount
(000) | | Value
(000) | | Unrealized
Appreciation
(Depreciation)
(000) | |
Long: | |
U.S. Treasury 10 yr. Note (United States) | | | 11 | | | Sep-24 | | $ | 1,100 | | | $ | 1,210 | | | $ | — | @ | |
U.S. Treasury 10 yr. Ultra Note (United States) | | | 39 | | | Sep-24 | | | 3,900 | | | | 4,428 | | | | 44 | | |
U.S. Treasury 2 yr. Note (United States) | | | 1 | | | Sep-24 | | | 200 | | | | 204 | | | | — | @ | |
U.S. Treasury 5 yr. Note (United States) | | | 59 | | | Sep-24 | | | 5,900 | | | | 6,288 | | | | 25 | | |
U.S. Treasury Long Bond (United States) | | | 36 | | | Sep-24 | | | 3,600 | | | | 4,259 | | | | 49 | | |
U.S. Treasury Ultra Long Bond (United States) | | | 90 | | | Sep-24 | | | 9,000 | | | | 11,281 | | | | 128 | | |
Short: | |
Euro-Buxl 30 yr. Bond Index (Germany) | | | 6 | | | Sep-24 | | EUR | (600 | ) | | | (837 | ) | | | (21 | ) | |
German Euro-Bobl Index (Germany) | | | 41 | | | Sep-24 | | | (4,100 | ) | | | (5,113 | ) | | | (43 | ) | |
German Euro-Bund Index (Germany) | | | 32 | | | Sep-24 | | | (3,200 | ) | | | (4,511 | ) | | | (66 | ) | |
German Euro-Schatz Index (Germany) | | | 32 | | | Sep-24 | | | (3,200 | ) | | | (3,622 | ) | | | (17 | ) | |
| | | $ | 99 | | |
Credit Default Swap Agreements:
The Fund had the following credit default swap agreements open at June 30, 2024:
Swap Counterparty
and
Reference Obligation | | Credit
Rating of
Reference
Obligation† | | Buy/Sell
Protection | | Pay/
Received
Fixed Rate | | Payment
Frequency | | Maturity
Date | | Notional
Amount
(000) | | Value
(000) | | Upfront
Payment
Paid
(Received)
(000) | | Unrealized
Appreciation
(Depreciation)
(000) | |
Goldman Sachs International
Vietnam Government
International Bonds | | NR | | Sell | | | 1.00 | % | | Quarterly | | 6/20/29 | | $ | 400 | | | $ | (3 | ) | | $ | (4 | ) | | $ | 1 | | |
Morgan Stanley & Co. LLC*
Egypt Government
International Bonds | | NR | | Sell | | | 1.00 | | | Quarterly | | 12/20/28 | | | 188 | | | | (35 | ) | | | (56 | ) | | | 21 | | |
Goldman Sachs International
Vietnam Government
International Bonds | | NR | | Sell | | | 1.00 | | | Quarterly | | 6/20/29 | | | 500 | | | | (3 | ) | | | (4 | ) | | | 1 | | |
Goldman Sachs International
Indonesia Government
International Bonds | | NR | | Sell | | | 1.00 | | | Quarterly | | 6/20/29 | | | 3,420 | | | | 33 | | | | 42 | | | | (9 | ) | |
Goldman Sachs International
Philippines Government
International Bonds | | NR | | Buy | | | 1.00 | | | Quarterly | | 6/20/29 | | | 3,390 | | | | (46 | ) | | | (51 | ) | | | 5 | | |
| | | | | | | | | | | | | | | $ | (54 | ) | | $ | (73 | ) | | $ | 19 | | |
@ Value is less than $500.
† Credit rating as issued by Standard & Poor's.
* Cleared swap agreement, the broker is Morgan Stanley & Co. LLC.
NR Not rated.
EUR — Euro
The accompanying notes are an integral part of the financial statements.
9
Morgan Stanley Variable Insurance Fund, Inc.
June 30, 2024 (unaudited)
Portfolio of Investments (cont'd)
Emerging Markets Debt Portfolio
Portfolio Composition
Classification | | Percentage of
Total Investments | |
Sovereign | | | 69.2 | % | |
Corporate Bonds | | | 25.8 | | |
Other* | | | 5.0 | | |
Total Investments | | | 100.0 | %** | |
* Industries and/or investment types representing less than 5% of total investments.
** Does not include open futures contracts with a value of approximately $41,753,000 and net unrealized appreciation of approximately $99,000. Does not include open foreign currency forward exchange contracts with net unrealized appreciation of approximately $267,000. Also does not include open swap agreements with net unrealized appreciation of approximately $19,000.
The accompanying notes are an integral part of the financial statements.
10
Morgan Stanley Variable Insurance Fund, Inc.
June 30, 2024 (unaudited)
Emerging Markets Debt Portfolio
Statement of Assets and Liabilities | | June 30, 2024
(000) | |
Assets: | |
Investments in Securities of Unaffiliated Issuers, at Value (Cost $105,848) | | $ | 100,468 | | |
Foreign Currency, at Value (Cost $752) | | | 742 | | |
Cash | | | 408 | | |
Interest Receivable | | | 1,950 | | |
Receivable for Variation Margin on Futures Contracts | | | 964 | | |
Receivable for Investments Sold | | | 730 | | |
Unrealized Appreciation on Foreign Currency Forward Exchange Contracts | | | 271 | | |
Upfront Payment Paid on Open Swap Agreements | | | 42 | | |
Receivable from Affiliate | | | 13 | | |
Unrealized Appreciation on Swap Agreements | | | 7 | | |
Receivable for Fund Shares Sold | | | 3 | | |
Other Assets | | | 16 | | |
Total Assets | | | 105,614 | | |
Liabilities: | |
Payable for Investments Purchased | | | 1,315 | | |
Deferred Capital Gain Country Tax | | | 350 | | |
Payable for Advisory Fees | | | 148 | | |
Payable for Fund Shares Redeemed | | | 72 | | |
Upfront Payment Received on Open Swap Agreements | | | 59 | | |
Payable for Professional Fees | | | 35 | | |
Payable for Servicing Fees | | | 24 | | |
Payable for Custodian Fees | | | 12 | | |
Unrealized Depreciation on Swap Agreements | | | 9 | | |
Payable for Administration Fees | | | 7 | | |
Unrealized Depreciation on Foreign Currency Forward Exchange Contracts | | | 4 | | |
Payable for Variation Margin on Swap Agreements | | | 1 | | |
Payable for Transfer Agency Fees | | | 1 | | |
Payable for Distribution Fees — Class II Shares | | | — | @ | |
Other Liabilities | | | 25 | | |
Total Liabilities | | | 2,062 | | |
NET ASSETS | | $ | 103,552 | | |
Net Assets Consist of: | |
Paid-in-Capital | | $ | 158,083 | | |
Total Accumulated Loss | | | (54,531 | ) | |
Net Assets | | $ | 103,552 | | |
CLASS I: | |
Net Assets | | $ | 92,480 | | |
Net Asset Value, Offering and Redemption Price Per Share Applicable to 16,010,028 Outstanding
$0.001 Par Value Shares (Authorized 500,000,000 Shares) | | $ | 5.78 | | |
CLASS II: | |
Net Assets | | $ | 11,072 | | |
Net Asset Value, Offering and Redemption Price Per Share Applicable to 1,937,010 Outstanding
$0.001 Par Value Shares (Authorized 500,000,000 Shares) | | $ | 5.72 | | |
@ Amount is less than $500.
The accompanying notes are an integral part of the financial statements.
11
Morgan Stanley Variable Insurance Fund, Inc.
June 30, 2024 (unaudited)
Emerging Markets Debt Portfolio
Statement of Operations | | Six Months Ended
June 30, 2024
(000) | |
Investment Income: | |
Interest from Securities of Unaffiliated Issuers (Net of $1 of Foreign Taxes Withheld) | | $ | 6,215 | | |
Dividends from Security of Affiliated Issuer (Note H) | | | 94 | | |
Dividends from Securities of Unaffiliated Issuers | | | 1 | | |
Total Investment Income | | | 6,310 | | |
Expenses: | |
Advisory Fees (Note B) | | | 388 | | |
Servicing Fees (Note D) | | | 87 | | |
Professional Fees | | | 82 | | |
Administration Fees (Note C) | | | 41 | | |
Custodian Fees (Note G) | | | 32 | | |
Distribution Fees — Class II Shares (Note E) | | | 14 | | |
Shareholder Reporting Fees | | | 11 | | |
Transfer Agency Fees (Note F) | | | 6 | | |
Pricing Fees | | | 3 | | |
Directors' Fees and Expenses | | | 2 | | |
Other Expenses | | | 9 | | |
Total Expenses | | | 675 | | |
Waiver of Advisory Fees (Note B) | | | (92 | ) | |
Waiver of Distribution Fees — Class II Shares (Note E) | | | (11 | ) | |
Rebate from Morgan Stanley Affiliate (Note H) | | | (4 | ) | |
Net Expenses | | | 568 | | |
Net Investment Income | | | 5,742 | | |
Realized Gain (Loss): | |
Investments Sold (Net of $8 of Capital Gain Country Tax) | | | (233 | ) | |
Foreign Currency Forward Exchange Contracts | | | 184 | | |
Foreign Currency Translation | | | (158 | ) | |
Futures Contracts | | | 574 | | |
Swap Agreements | | | 13 | | |
Net Realized Gain | | | 380 | | |
Change in Unrealized Appreciation (Depreciation): | |
Investments (Net of Decrease in Deferred Capital Gain Country Tax of $53) | | | (78 | ) | |
Foreign Currency Forward Exchange Contracts | | | 541 | | |
Foreign Currency Translation | | | (46 | ) | |
Futures Contracts | | | (1,623 | ) | |
Swap Agreements | | | 18 | | |
Net Change in Unrealized Appreciation (Depreciation) | | | (1,188 | ) | |
Net Realized Gain and Change in Unrealized Appreciation (Depreciation) | | | (808 | ) | |
Net Increase in Net Assets Resulting from Operations | | $ | 4,934 | | |
The accompanying notes are an integral part of the financial statements.
12
Morgan Stanley Variable Insurance Fund, Inc.
June 30, 2024
Emerging Markets Debt Portfolio
Statements of Changes in Net Assets | | Six Months Ended
June 30, 2024
(unaudited)
(000) | | Year Ended
December 31, 2023
(000) | |
Increase (Decrease) in Net Assets: | |
Operations: | |
Net Investment Income | | $ | 5,742 | | | $ | 9,416 | | |
Net Realized Gain (Loss) | | | 380 | | | | (22,171 | ) | |
Net Change in Unrealized Appreciation (Depreciation) | | | (1,188 | ) | | | 24,104 | | |
Net Increase in Net Assets Resulting from Operations | | | 4,934 | | | | 11,349 | | |
Dividends and Distributions to Shareholders: | |
Class I | | | — | | | | (8,015 | ) | |
Class II | | | — | | | | (1,005 | ) | |
Total Dividends and Distributions to Shareholders | | | — | | | | (9,020 | ) | |
Capital Share Transactions:(1) | |
Class I: | |
Subscribed | | | 2,927 | | | | 9,670 | | |
Distributions Reinvested | | | — | | | | 8,015 | | |
Redeemed | | | (8,326 | ) | | | (18,088 | ) | |
Class II: | |
Subscribed | | | 411 | | | | 397 | | |
Distributions Reinvested | | | — | | | | 1,005 | | |
Redeemed | | | (1,288 | ) | | | (2,355 | ) | |
Net Decrease in Net Assets Resulting from Capital Share Transactions | | | (6,276 | ) | | | (1,356 | ) | |
Total Increase (Decrease) in Net Assets | | | (1,342 | ) | | | 973 | | |
Net Assets: | |
Beginning of Period | | | 104,894 | | | | 103,921 | | |
End of Period | | $ | 103,552 | | | $ | 104,894 | | |
(1) Capital Share Transactions: | |
Class I: | |
Shares Subscribed | | | 516 | | | | 1,765 | | |
Shares Issued on Distributions Reinvested | | | — | | | | 1,581 | | |
Shares Redeemed | | | (1,480 | ) | | | (3,433 | ) | |
Net Decrease in Class I Shares Outstanding | | | (964 | ) | | | (87 | ) | |
Class II: | |
Shares Subscribed | | | 75 | | | | 76 | | |
Shares Issued on Distributions Reinvested | | | — | | | | 200 | | |
Shares Redeemed | | | (231 | ) | | | (451 | ) | |
Net Decrease in Class II Shares Outstanding | | | (156 | ) | | | (175 | ) | |
The accompanying notes are an integral part of the financial statements.
13
Morgan Stanley Variable Insurance Fund, Inc.
June 30, 2024
Financial Highlights
Emerging Markets Debt Portfolio
| | | Class I | |
| | | Six Months Ended
June 30, 2024 | | Year Ended December 31, | |
Selected Per Share Data and Ratios | | (unaudited) | | 2023 | | 2022 | | 2021 | | 2020 | | 2019 | |
Net Asset Value, Beginning of Period | | $ | 5.51 | | | $ | 5.38 | | | $ | 7.20 | | | $ | 7.74 | | | $ | 7.68 | | | $ | 7.09 | | |
Income (Loss) from Investment Operations: | |
Net Investment Income(1) | | | 0.31 | | | | 0.48 | | | | 0.41 | | | | 0.34 | | | | 0.32 | | | | 0.38 | | |
Net Realized and Unrealized Gain (Loss) | | | (0.04 | ) | | | 0.13 | | | | (1.78 | ) | | | (0.49 | ) | | | 0.08 | | | | 0.62 | | |
Total from Investment Operations | | | 0.27 | | | | 0.61 | | | | (1.37 | ) | | | (0.15 | ) | | | 0.40 | | | | 1.00 | | |
Distributions from and/or in Excess of: | |
Net Investment Income | | | — | | | | (0.48 | ) | | | (0.45 | ) | | | (0.39 | ) | | | (0.34 | ) | | | (0.41 | ) | |
Net Asset Value, End of Period | | $ | 5.78 | | | $ | 5.51 | | | $ | 5.38 | | | $ | 7.20 | | | $ | 7.74 | | | $ | 7.68 | | |
Total Return(2) | | | 5.09 | %(3) | | | 11.84 | %(4) | | | (18.74 | )% | | | (2.02 | )% | | | 5.55 | % | | | 14.25 | % | |
Ratios to Average Net Assets and Supplemental Data: | |
Net Assets, End of Period (Thousands) | | $ | 92,480 | | | $ | 93,484 | | | $ | 91,828 | | | $ | 133,413 | | | $ | 145,312 | | | $ | 170,382 | | |
Ratio of Expenses Before Expense Limitation | | | 1.28 | %(5) | | | 1.32 | % | | | 1.24 | % | | | 1.17 | % | | | N/A | | | | N/A | | |
Ratio of Expenses After Expense Limitation | | | 1.09 | %(5)(6) | | | 1.09 | %(6) | | | 1.10 | %(6) | | | 1.12 | %(6)(7) | | | 1.15 | %(6) | | | 1.11 | %(6) | |
Ratio of Net Investment Income | | | 11.11 | %(5)(6) | | | 9.07 | %(6) | | | 6.96 | %(6) | | | 4.59 | %(6) | | | 4.34 | %(6) | | | 5.04 | %(6) | |
Ratio of Rebate from Morgan Stanley Affiliates | | | 0.01 | %(5) | | | 0.01 | % | | | 0.00 | %(8) | | | 0.00 | %(8) | | | 0.00 | %(8) | | | 0.01 | % | |
Portfolio Turnover Rate | | | 89 | %(3) | | | 117 | % | | | 75 | % | | | 28 | % | | | 40 | % | | | 40 | % | |
(1) Per share amount is based on average shares outstanding.
(2) Calculated based on the net asset value as of the last business day of the period. Performance does not reflect fees and expenses imposed by your insurance company's separate account. If performance information included the effect of these additional charges, the total return would be lower.
(3) Not annualized.
(4) Reflects prior period transfer agency fees that were reimbursed in 2023. The amount of the reimbursement was immaterial on a per share basis and the impact was less than 0.005% to the total return of Class I shares.
(5) Annualized.
(6) The Ratio of Expenses After Expense Limitation and Ratio of Net Investment Income reflect the rebate of certain Fund expenses in connection with the investments in Morgan Stanley affiliates during the period. The effect of the rebate on the ratios is disclosed in the above table as "Ratio of Rebate from Morgan Stanley Affiliates."
(7) Effective July 1, 2021, the Adviser has agreed to limit the ratio of expenses to average net assets to the maximum ratio of 1.10% for Class I shares. Prior to July 1, 2021, the maximum ratio was 1.30% for Class I shares.
(8) Amount is less than 0.005%.
The accompanying notes are an integral part of the financial statements.
14
Morgan Stanley Variable Insurance Fund, Inc.
June 30, 2024
Financial Highlights
Emerging Markets Debt Portfolio
| | | Class II | |
| | | Six Months Ended
June 30, 2024 | | Year Ended December 31, | |
Selected Per Share Data and Ratios | | (unaudited) | | 2023 | | 2022 | | 2021 | | 2020 | | 2019 | |
Net Asset Value, Beginning of Period | | $ | 5.45 | | | $ | 5.33 | | | $ | 7.14 | | | $ | 7.67 | | | $ | 7.61 | | | $ | 7.03 | | |
Income (Loss) from Investment Operations: | |
Net Investment Income(1) | | | 0.31 | | | | 0.47 | | | | 0.40 | | | | 0.34 | | | | 0.31 | | | | 0.37 | | |
Net Realized and Unrealized Gain (Loss) | | | (0.04 | ) | | | 0.12 | | | | (1.76 | ) | | | (0.48 | ) | | | 0.08 | | | | 0.62 | | |
Total from Investment Operations | | | 0.27 | | | | 0.59 | | | | (1.36 | ) | | | (0.14 | ) | | | 0.39 | | | | 0.99 | | |
Distributions from and/or in Excess of: | |
Net Investment Income | | | — | | | | (0.47 | ) | | | (0.45 | ) | | | (0.39 | ) | | | (0.33 | ) | | | (0.41 | ) | |
Net Asset Value, End of Period | | $ | 5.72 | | | $ | 5.45 | | | $ | 5.33 | | | $ | 7.14 | | | $ | 7.67 | | | $ | 7.61 | | |
Total Return(2) | | | 5.15 | %(3) | | | 11.69 | %(4) | | | (18.81 | )% | | | (1.96 | )% | | | 5.53 | % | | | 14.17 | % | |
Ratios to Average Net Assets and Supplemental Data: | |
Net Assets, End of Period (Thousands) | | $ | 11,072 | | | $ | 11,410 | | | $ | 12,093 | | | $ | 16,181 | | | $ | 17,762 | | | $ | 21,163 | | |
Ratio of Expenses Before Expense Limitation | | | 1.53 | %(5) | | | 1.57 | % | | | 1.49 | % | | | 1.42 | % | | | 1.40 | % | | | 1.37 | % | |
Ratio of Expenses After Expense Limitation | | | 1.14 | %(5)(6) | | | 1.14 | %(6) | | | 1.15 | %(6) | | | 1.17 | %(6)(7) | | | 1.20 | %(6) | | | 1.16 | %(6) | |
Ratio of Net Investment Income | | | 11.06 | %(5)(6) | | | 9.02 | %(6) | | | 6.91 | %(6) | | | 4.54 | %(6) | | | 4.29 | %(6) | | | 4.99 | %(6) | |
Ratio of Rebate from Morgan Stanley Affiliates | | | 0.01 | %(5) | | | 0.01 | % | | | 0.00 | %(8) | | | 0.00 | %(8) | | | 0.00 | %(8) | | | 0.01 | % | |
Portfolio Turnover Rate | | | 89 | %(3) | | | 117 | % | | | 75 | % | | | 28 | % | | | 40 | % | | | 40 | % | |
(1) Per share amount is based on average shares outstanding.
(2) Calculated based on the net asset value as of the last business day of the period. Performance does not reflect fees and expenses imposed by your insurance company's separate account. If performance information included the effect of these additional charges, the total return would be lower.
(3) Not annualized.
(4) Reflects prior period transfer agency fees that were reimbursed in 2023. The amount of the reimbursement was immaterial on a per share basis and the impact was less than 0.005% to the total return of Class II shares.
(5) Annualized.
(6) The Ratio of Expenses After Expense Limitation and Ratio of Net Investment Income reflect the rebate of certain Fund expenses in connection with the investments in Morgan Stanley affiliates during the period. The effect of the rebate on the ratios is disclosed in the above table as "Ratio of Rebate from Morgan Stanley Affiliates."
(7) Effective July 1, 2021, the Adviser has agreed to limit the ratio of expenses to average net assets to the maximum ratio of 1.15% for Class II shares. Prior to July 1, 2021, the maximum ratio was 1.35% for Class II shares.
(8) Amount is less than 0.005%.
The accompanying notes are an integral part of the financial statements.
15
Morgan Stanley Variable Insurance Fund, Inc.
June 30, 2024 (unaudited)
Notes to Financial Statements
Morgan Stanley Variable Insurance Fund, Inc. (the "Company") is registered under the Investment Company Act of 1940, as amended (the "Act"), as an open-end management investment company. The Company is comprised of eight separate active, diversified and non-diversified funds (individually referred to as a "Fund," collectively as the "Funds").
The Company applies investment company accounting and reporting guidance Accounting Standards Codification ("ASC") Topic 946. In the preparation of these financial statements, management has evaluated subsequent events occurring after the date of the Fund's Statement of Assets and Liabilities through the date that the financial statements were issued.
The accompanying financial statements relates to the Emerging Markets Debt Portfolio. The Fund seeks high total return by investing primarily in fixed income securities of government and government-related issuers and, to a lesser extent, of corporate issuers in emerging market countries. The Fund has issued two classes of shares — Class I and Class II. Both classes of shares have identical voting rights (except that shareholders of a Class have exclusive voting rights regarding any matter relating solely to that Class of shares), dividend, liquidation and other rights.
The Company is intended to be a funding vehicle for variable annuity contracts and variable life insurance policies offered by the separate accounts of certain life insurance companies.
A. Significant Accounting Policies: The following significant accounting policies are in conformity with U.S. generally accepted accounting principles ("GAAP"). Such policies are consistently followed by the Company in the preparation of its financial statements. GAAP may require management to make estimates and assumptions that affect the reported amounts and disclosures in the financial statements. Actual results may differ from those estimates.
1. Security Valuation: (1) Fixed income securities may be valued by an outside pricing service/vendor approved by the Company's Board of Directors (the "Directors"). The pricing service/vendor may employ a pricing model that takes into account, among other things, bids, yield spreads and/or other market data and specific security characteristics. If Morgan Stanley Investment Management Inc. (the "Adviser") or Morgan Stanley Investment Management Limited ("MSIM Limited") (the "Sub-Adviser"), each a wholly-owned subsidiary of Morgan Stanley, determines that the price provided by the outside pricing service/vendor does not reflect the security's fair value or is unable to provide a price, prices from reputable brokers/dealers may also be utilized. In these
circumstances, the value of the security will be the mean of bid and asked prices obtained from reputable brokers/dealers; (2) when market quotations are not readily available, as defined by Rule 2a-5 under the Act, including circumstances under which the Adviser or the Sub-Adviser determines that the closing price, last sale price or the mean between the last reported bid and asked prices are not reflective of a security's market value, portfolio securities are valued at their fair value as determined in good faith under procedures approved by and under the general supervision of the Directors. Each business day, the Fund uses a third-party pricing service approved by the Directors to assist with the valuation of foreign equity securities. Events occurring after the close of trading on foreign exchanges may result in adjustments to the valuation of foreign securities to reflect market trading that occurs after the close of the applicable foreign markets of comparable securities or other instruments that have a strong correlation to the fair-valued securities to more accurately reflect their fair value as of the close of regular trading on the NYSE; (3) futures are valued at the settlement price on the exchange on which they trade or, if a settlement price is unavailable, at the last sale price on the exchange; (4) over-the-counter ("OTC") swaps may be valued by an outside pricing service approved by the Directors or quotes from a reputable broker/dealer. Swaps cleared on a clearinghouse or exchange may be valued using the closing price provided by the clearinghouse or exchange; (5) foreign exchange transactions ("spot contracts") and foreign exchange forward contracts ("forward contracts") are valued daily using an independent pricing vendor at the spot and forward rates, respectively, as of the close of the NYSE; and (6) investments in mutual funds, including the Morgan Stanley Institutional Liquidity Funds, are valued at the net asset value ("NAV") as of the close of each business day.
In connection with Rule 2a-5 of the Act, the Directors have designated the Company's Adviser as its valuation designee. The valuation designee has responsibility for determining fair value and to make the actual calculations pursuant to the fair valuation methodologies previously approved by the Directors. Under procedures approved by the Directors, the Company's Adviser, as valuation designee, has formed a Valuation Committee whose members are approved by the Directors. The Valuation Committee provides administration and oversight of the Company's valuation policies and procedures, which are reviewed at least annually by the
16
Morgan Stanley Variable Insurance Fund, Inc.
June 30, 2024 (unaudited)
Notes to Financial Statements (cont'd)
Directors. These procedures allow the Company to utilize independent pricing services, quotations from securities and financial instrument dealers and other market sources to determine fair value.
2. Fair Value Measurement: Financial Accounting Standards Board ("FASB") ASC 820, "Fair Value Measurement" ("ASC 820"), defines fair value as the price that would be received to sell an asset or pay to transfer a liability in an orderly transaction between market participants at the measurement date. ASC 820 establishes a three-tier hierarchy to distinguish between (1) inputs that reflect the assumptions market participants would use in valuing an asset or liability developed based on market data obtained from sources independent of the reporting entity (observable inputs); and (2) inputs that reflect the reporting entity's own assumptions about the assumptions market participants would use in valuing an asset or liability developed based on the best information available in the circumstances (unobservable inputs) and to establish classification of fair value measurements for disclosure purposes. Various inputs are used in determining the value of the Fund's investments. The inputs are summarized in the three broad levels listed below:
• Level 1 – unadjusted quoted prices in active markets for identical investments
• Level 2 – other significant observable inputs (including quoted prices for similar investments, interest rates, prepayment speeds, credit risk, etc.)
• Level 3 – significant unobservable inputs including the Fund's own assumptions in determining the fair value of investments. Factors considered in making this determination may include, but are not limited to, information obtained by contacting the issuer, analysts, or the appropriate stock exchange (for exchange-traded securities), analysis of the issuer's financial statements or other available documents and, if necessary, available information concerning other securities in similar circumstances.
The inputs or methodology used for valuing securities are not necessarily an indication of the risk associated with investing in those securities and the determination of the significance of a particular input to the fair value measurement in its entirety requires judgment and considers factors specific to each security.
The following is a summary of the inputs used to value the Fund's investments as of June 30, 2024:
Investment Type | | Level 1
Unadjusted
quoted
prices
(000) | | Level 2
Other
significant
observable
inputs
(000) | | Level 3
Significant
unobservable
inputs
(000) | | Total
(000) | |
Assets: | |
Fixed Income Securities | |
Corporate Bonds | | $ | — | | | $ | 25,984 | | | $ | — | | | $ | 25,984 | | |
Sovereign | | | — | | | | 69,516 | | | | — | | | | 69,516 | | |
Senior Loan Interest | | | — | | | | 4,703 | | | | — | | | | 4,703 | | |
Total Fixed Income
Securities | | | — | | | | 100,203 | | | | — | | | | 100,203 | | |
Warrants | | | — | | | | 26 | | | | — | | | | 26 | | |
Short-Term Investment | |
U.S. Treasury Security | | | — | | | | 239 | | | | — | | | | 239 | | |
Foreign Currency Forward
Exchange Contracts | | | — | | | | 271 | | | | — | | | | 271 | | |
Futures Contracts | | | 246 | | | | — | | | | — | | | | 246 | | |
Credit Default Swap
Agreements | | | — | | | | 28 | | | | — | | | | 28 | | |
Total Assets | | | 246 | | | | 100,767 | | | | — | | | | 101,013 | | |
Liabilities: | |
Foreign Currency
Forward Exchange
Contracts | | | — | | | | (4 | ) | | | — | | | | (4 | ) | |
Futures Contracts | | | (147 | ) | | | — | | | | — | | | | (147 | ) | |
Credit Default Swap
Agreement | | | — | | | | (9 | ) | | | — | | | | (9 | ) | |
Total Liabilities | | | (147 | ) | | | (13 | ) | | | — | | | | (160 | ) | |
Total | | $ | 99 | | | $ | 100,754 | | | $ | — | | | $ | 100,853 | | |
Transfers between investment levels may occur as the markets fluctuate and/or the availability of data used in an investment's valuation changes.
3. Foreign Currency Translation and Foreign Investments: The books and records of the Fund are maintained in U.S. dollars. Foreign currency amounts are translated into U.S. dollars as follows:
— investments, other assets and liabilities at the prevailing rate of exchange on the valuation date;
— investment transactions and investment income at the prevailing rates of exchange on the dates of such transactions.
Although the net assets of the Fund are presented at the foreign exchange rates and market values at the close of the period, the Fund does not isolate that portion of the results of operations arising as a result of changes in the
17
Morgan Stanley Variable Insurance Fund, Inc.
June 30, 2024 (unaudited)
Notes to Financial Statements (cont'd)
foreign exchange rates from the fluctuations arising from changes in the market prices of securities held at period end. Similarly, the Fund does not isolate the effect of changes in foreign exchange rates from the fluctuations arising from changes in the market prices of securities sold during the period. Accordingly, realized and unrealized foreign currency gains (losses) on investments in securities are included in the reported net realized and unrealized gains (losses) on investment transactions and balances. However, pursuant to U.S. federal income tax regulations, gains and losses from certain foreign currency transactions and the foreign currency portion of gains and losses realized on sales and maturities of foreign denominated debt securities are treated as ordinary income for U.S. federal income tax purposes.
Net realized gains (losses) on foreign currency transactions represent net foreign exchange gains (losses) from foreign currency forward exchange contracts, disposition of foreign currencies, currency gains (losses) realized between the trade and settlement dates on securities transactions, and the difference between the amount of investment income and foreign withholding taxes recorded on the Fund's books and the U.S. dollar equivalent amounts actually received or paid. The change in unrealized currency gains (losses) on foreign currency transactions for the period is reflected in the Statement of Operations.
Foreign security and currency transactions may involve certain considerations and risks not typically associated with those of U.S. dollar denominated transactions as a result of, among other factors, fluctuations of exchange rates in relation to the U.S. dollar, the possibility of lower levels of governmental supervision and regulation of foreign securities markets and the possibility of political or economic instability.
Governmental approval for foreign investments may be required in advance of making an investment under certain circumstances in some countries, and the extent of foreign investments in U.S. companies may be subject to limitation in other countries. Foreign ownership limitations also may be imposed by the charters of individual companies to prevent, among other concerns, violations of foreign investment limitations. As a result, an additional class of shares (identified as "Foreign" in the Portfolio of Investments) may be created and offered for investment. The "local" and "foreign shares" market values may differ. In the absence of trading of the foreign shares in such markets, the Fund values the foreign shares at the closing exchange price of the local shares.
4. Structured Investments: The Fund invested a portion of its assets in structured investments. A structured investment is a derivative security designed to offer a return linked to a particular underlying security, currency, commodity or market. Structured investments may come in various forms including notes (such as exchange-traded notes), warrants and options to purchase securities. The Fund will typically use structured investments to gain exposure to a permitted underlying security, currency, commodity or market when direct access to a market is limited or inefficient from a tax or cost standpoint. There can be no assurance that structured investments will trade at the same price or have the same value as the underlying security, currency, commodity or market. Investments in structured investments involve risks including issuer risk, counterparty risk and market risk. Holders of structured investments bear risks of the underlying investment and are subject to issuer or counterparty risk because the Fund is relying on the creditworthiness of such issuer or counterparty and has no rights with respect to the underlying investment. Certain structured investments may be thinly traded or have a limited trading market and may have the effect of increasing the Fund's illiquidity to the extent that the Fund, at a particular time, may be unable to find qualified buyers for these securities.
5. Derivatives: The Fund may, but is not required to, use derivative instruments for a variety of purposes, including hedging, risk management, portfolio management or to earn income. Derivatives are financial instruments whose value is based, in part, on the value of an underlying asset, interest rate, index or financial instrument. Prevailing interest rates and volatility levels, among other things, also affect the value of derivative instruments. A derivative instrument often has risks similar to its underlying asset and may have additional risks, including imperfect correlation between the value of the derivative and the underlying asset, risks of default by the counterparty to certain transactions, magnification of losses incurred due to changes in the market value of the securities, instruments, indices or interest rates to which the derivative instrument relates, risks that the transactions may not be liquid, risks arising from margin and payment requirements, risks arising from mispricing or valuation complexity and operational and legal risks. The use of derivatives involves risks that are different from, and possibly greater than, the risks associated with other portfolio investments. Derivatives may involve the use of highly specialized instruments that require investment techniques and risk analyses different from those associated with other portfolio investments.
18
Morgan Stanley Variable Insurance Fund, Inc.
June 30, 2024 (unaudited)
Notes to Financial Statements (cont'd)
All of the Fund's holdings, including derivative instruments, are marked-to-market each day with the change in value reflected in unrealized appreciation (depreciation). Upon disposition, a realized gain or loss is recognized.
Certain derivative transactions may give rise to a form of leverage. Leverage magnifies the potential for gain and the risk of loss. Leverage associated with derivative transactions may cause the Fund to liquidate portfolio positions when it may not be advantageous to do so to satisfy its obligations or may cause the Fund to be more volatile than if the Fund had not been leveraged. Although the Adviser seeks to use derivatives to further the Fund's investment objectives, there is no assurance that the use of derivatives will achieve this result.
Following is a description of the derivative instruments and techniques that the Fund used during the period and their associated risks:
Foreign Currency Forward Exchange Contracts: In connection with its investments in foreign securities, the Fund also entered into contracts with banks, brokers/dealers to purchase or sell foreign currencies at a future date. A foreign currency forward exchange contract ("currency contract") is a negotiated agreement between the contracting parties to exchange a specified amount of currency at a specified future time at a specified rate. The rate can be higher or lower than the spot rate between the currencies that are the subject of the contract. Currency contracts may be used to protect against uncertainty in the level of future foreign currency exchange rates or to gain or modify exposure to a particular currency. To the extent hedged by the use of currency contracts, the precise matching of the currency contract amounts and the value of the securities involved will not generally be possible because the future value of such securities in foreign currencies will change as a consequence of market movements in the value of those securities between the date on which the contract is entered into and the date it matures. Furthermore, such transactions may reduce or preclude the opportunity for gain if the value of the currency should move in the direction opposite to the position taken. There is additional risk to the extent that currency contracts create exposure to currencies in which the Fund's securities are not denominated. Unanticipated changes in currency prices may result in poorer overall performance for the Fund than if it had not entered into such contracts. The use of currency contracts involves the risk of loss from the insolvency or bankruptcy of the counterparty to the contract or the failure of the counterparty to make payments or otherwise comply
with the terms of the contract. A currency contract is marked-to-market daily and the change in market value is recorded by the Fund as unrealized gain or loss. The Fund records realized gains (losses) when the currency contract is closed equal to the difference between the value of the currency contract at the time it was opened and the value at the time it was closed.
Futures: A futures contract is a standardized, exchange-traded agreement to buy or sell a specific quantity of an underlying asset, reference rate or index at a specific price at a specific future time. The value of a futures contract tends to increase and decrease in tandem with the value of the underlying instrument. Depending on the terms of the particular contract, futures contracts are settled through either physical delivery of the underlying instrument on the settlement date or by payment of a cash settlement amount on the settlement date. During the period the futures contract is open, payments are received from or made to the broker based upon changes in the value of the contract (the variation margin). A decision as to whether, when and how to use futures contracts involves the exercise of skill and judgment and even a well-conceived futures transaction may be unsuccessful because of market behavior or unexpected events. In addition to the derivatives risks discussed above, the prices of futures contracts can be highly volatile, using futures contracts can lower total return and the potential loss from futures contracts can exceed the Fund's initial investment in such contracts. No assurance can be given that a liquid market will exist for any particular futures contract at any particular time.
Swaps: The Fund may enter into OTC swap contracts or cleared swap transactions. A swap contract is an agreement between two parties pursuant to which the parties exchange payments at specified dates on the basis of a specified notional amount, with the payments calculated by reference to specified securities, indices, reference rates, currencies or other instruments. Typically swap agreements provide that when the period payment dates for both parties are the same, the payments are made on a net basis (i.e., the two payment streams are netted out, with only the net amount paid by one party to the other). The Fund's obligations or rights under a swap contract entered into on a net basis will generally be equal only to the net amount to be paid or received under the agreement, based on the relative values of the positions held by each party. Cleared swap transactions may help reduce counterparty credit risk. In a cleared swap, the Fund's ultimate counterparty is a clearinghouse rather than a swap
19
Morgan Stanley Variable Insurance Fund, Inc.
June 30, 2024 (unaudited)
Notes to Financial Statements (cont'd)
dealer, bank or other financial institution. OTC swap agreements are not entered into or traded on exchanges and often there is no central clearing or guaranty function for OTC swaps. These OTC swaps are often subject to credit risk or the risk of default or non-performance by the counterparty. Both OTC and cleared swaps could result in losses if interest rates, foreign currency exchange rates or other factors are not correctly anticipated by the Fund or if the reference index, security or investments do not perform as expected. During the period swap agreements are open, payments are received from or made to the counterparty or clearing-house based on changes in the value of the contract or variation margin, respectively. The Dodd-Frank Wall Street Reform and Consumer Protection Act and related regulatory developments require the clearing and exchange-trading of certain standardized swap transactions. Mandatory exchange-trading and clearing is occurring on a phased-in basis based on the type of market participant and U.S. Commodities Futures Trading Commission ("CFTC") approval of contracts for central clearing and exchange trading.
The Fund's use of swaps during the period included those based on the credit of an underlying security commonly referred to as "credit default swaps." The Fund may be either the buyer or seller in a credit default swap. Where the Fund is the buyer of a credit default swap contract, it would typically be entitled to receive the par (or other agreed-upon) value of a referenced debt obligation from the counterparty to the contract only in the event of a default or similar event by the issuer of the debt obligation. If no default occurs, the Fund would have paid to the counterparty a periodic stream of payments over the term of the contract and received no benefit from the contract. When the Fund is the seller of a credit default swap contract, it typically receives the stream of payments but is obligated to pay an amount equal to the par (or other agreed-upon) value of a referenced debt obligation upon the default or similar event by the issuer of the referenced debt obligation. The use of credit default swaps could result in losses to the Fund if the Adviser fails to correctly evaluate the creditworthiness of the issuer of the referenced debt obligation.
If the Fund is a seller of protection and a credit event occurs, as defined under the terms of that particular swap agreement, the Fund will either (i) pay to the buyer of protection an amount equal to the notional amount of the swap agreement and take delivery of the referenced
obligation, other deliverable obligations or underlying securities comprising the referenced index or (ii) pay a net settlement amount in the form of cash or securities equal to the notional amount of the swap agreement less the recovery value of the referenced obligation or underlying securities comprising the referenced index. If the Fund is a buyer of protection and a credit event occurs, as defined under the terms of that particular swap agreement, the Fund will either (i) receive from the seller of protection an amount equal to the notional amount of the swap agreement and deliver the referenced obligation, other deliverable obligations or underlying securities comprising the referenced index or (ii) receive a net settlement amount in the form of cash or securities equal to the notional amount of the swap agreement less the recovery value of the referenced obligation or underlying securities comprising the referenced index. Recovery values are estimated by market makers considering either industry standard recovery rates or entity specific factors and considerations until a credit event occurs. If a credit event has occurred, the recovery value is determined by a facilitated auction whereby a minimum number of allowable broker bids, together with a specified valuation method, are used to calculate the settlement value. The Fund's maximum risk of loss from counterparty risk, either as the protection seller or as the protection buyer, is the fair value of the swap agreement.
When the Fund has an unrealized loss on a swap agreement, the Fund has instructed the custodian to pledge cash or liquid securities as collateral with a value approximately equal to the amount of the unrealized loss. Collateral pledges are monitored and subsequently adjusted if and when the swap valuations fluctuate. If applicable, cash collateral is included with "Due from (to) Broker" in the Statement of Assets and Liabilities.
Upfront payments paid or received by the Fund will be reflected as an asset or liability, respectively, in the Statement of Assets and Liabilities.
FASB ASC 815, "Derivatives and Hedging" ("ASC 815"), is intended to improve financial reporting about derivative instruments by requiring enhanced disclosures to enable investors to better understand how and why the Fund uses derivative instruments, how these derivative instruments are accounted for and their effects on the Fund's financial position and results of operations.
20
Morgan Stanley Variable Insurance Fund, Inc.
June 30, 2024 (unaudited)
Notes to Financial Statements (cont'd)
The following tables set forth the fair value of the Fund's derivative contracts by primary risk exposure as of June 30, 2024:
| | | Asset Derivatives
Statement of Assets
and Liabilities
Location | | Primary Risk
Exposure | | Value
(000) | |
Foreign Currency
Forward
Exchange
Contracts | | Unrealized Appreciation
on Foreign Currency
Forward Exchange
Contracts | | Currency Risk | | $ | 271 | | |
Futures Contracts | | Variation Margin on
Futures Contracts | | Interest
Rate Risk | | | 246 | (a) | |
Swap Agreement | | Variation Margin on
Swap Agreement | | Credit Risk | | | 21 | (a) | |
Swap Agreements | | Unrealized Appreciation
on Swap Agreements | | Credit Risk | | | 7 | | |
Total | | | | | | $ | 545 | | |
| | | Liability Derivatives
Statement of Assets
and Liabilities
Location | | Primary Risk
Exposure | | Value
(000) | |
Foreign Currency
Forward
Exchange
Contracts | | Unrealized Depreciation
on Foreign Currency
Forward Exchange
Contracts | | Currency Risk | | $ | (4 | ) | |
Futures Contracts | | Variation Margin on
Futures Contracts | | Interest
Rate Risk | | | (147 | )(a) | |
Swap Agreement | | Unrealized Depreciation
on Swap Agreement | | Credit Risk | | | (9 | ) | |
Total | | | | | | $ | (160 | ) | |
(a) This amount represents the cumulative appreciation (depreciation) as reported in the Portfolio of Investments. The Statement of Assets and Liabilities only reflects the current day's net variation margin.
The following tables set forth by primary risk exposure the Fund's realized gains (losses) and change in unrealized appreciation (depreciation) by type of derivative contract for the six months ended June 30, 2024 in accordance with ASC 815:
Realized Gain (Loss) | |
Primary Risk Exposure | | Derivative
Type | | Value
(000) | |
Currency Risk | | Foreign Currency
Forward Exchange
Contracts | | $ | 184 | | |
Interest Rate Risk | | Futures Contracts | | | 574 | | |
Credit Risk | | Swap Agreements | | | 13 | | |
Total | | | | $ | 771 | | |
Change in Unrealized Appreciation (Depreciation) | |
Primary Risk Exposure | | Derivative
Type | | Value
(000) | |
Currency Risk | | Foreign Currency
Forward Exchange
Contracts | | $ | 541 | | |
Interest Rate Risk | | Futures Contracts | | | (1,623 | ) | |
Credit Risk | | Swap Agreements | | | 18 | | |
Total | | | | $ | (1,064 | ) | |
At June 30, 2024, the Fund's derivative assets and liabilities are as follows:
Gross Amounts of Assets and Liabilities Presented in the
Statement of Assets and Liabilities | |
Derivatives(a) | | Assets(b)
(000) | | Liabilities(b)
(000) | |
Foreign Currency Forward Exchange
Contracts | | $ | 271 | | | $ | (4 | ) | |
Swap Agreements | | | 7 | | | | (9 | ) | |
Total | | $ | 278 | | | $ | (13 | ) | |
(a) Excludes exchange-traded derivatives.
(b) Absent an event of default or early termination, OTC derivative assets and liabilities are presented gross and not offset in the Statement of Assets and Liabilities.
The Fund typically enters into International Swaps and Derivatives Association, Inc. Master Agreements ("ISDA Master Agreements") or similar master agreements (collectively, "Master Agreements") with its contract counterparties for certain OTC derivatives in order to, among other things, reduce its credit risk to counterparties. ISDA Master Agreements include provisions for general obligations, representations, collateral and events of default or termination. Under an ISDA Master Agreement, the Fund typically may offset with the counterparty certain OTC derivative financial instruments' payables and/or receivables with collateral held and/or posted and create one single net payment (close-out netting) in the event of default, termination and/or potential deterioration in the credit quality of the counterparty. Various Master Agreements govern the terms of certain transactions with counterparties, including transactions such as swap, forward, repurchase and reverse repurchase agreements. These Master Agreements typically attempt to reduce the counterparty risk associated with such transactions by specifying credit protection mechanisms and providing standardization that improves legal certainty. Cross-termination provisions under Master Agreements typically provide that a default in connection with one transaction between the Fund and a counterparty gives the non-defaulting party the right to terminate any other transactions in place with the defaulting party to create one single net payment due to/due from the defaulting party and may be a feature in certain Master Agreements. In the event the Fund exercises its right to terminate a Master Agreement after a counterparty experiences a termination event as defined in the Master Agreement, the return of collateral with market value in excess of the Fund's net liability may be delayed or denied.
21
Morgan Stanley Variable Insurance Fund, Inc.
June 30, 2024 (unaudited)
Notes to Financial Statements (cont'd)
The following tables present derivative financial instruments that are subject to enforceable netting arrangements as of June 30, 2024:
Gross Amounts Not Offset in the Statement of
Assets and Liabilities | |
Counterparty | | Gross Asset
Derivatives
Presented in the
Statement of
Assets and
Liabilities
(000) | | Financial
Instrument
(000) | | Collateral
Received
(000) | | Net
Amount
(not less
than $0)
(000) | |
Goldman Sachs
International | | $ | 8 | | | $ | (7 | ) | | $ | — | | | $ | 1 | | |
HSBC Bank PLC | | | 135 | | | | (2 | ) | | | — | | | | 133 | | |
State Street Bank
and Trust Co. | | | 135 | | | | (2 | ) | | | — | | | | 133 | | |
Total | | $ | 278 | | | $ | (11 | ) | | $ | — | | | $ | 267 | | |
Gross Amounts Not Offset in the Statement of
Assets and Liabilities | |
Counterparty | | Gross Liability
Derivatives
Presented in the
Statement of
Assets and
Liabilities
(000) | | Financial
Instrument
(000) | | Collateral
Pledged
(000) | | Net
Amount
(not less
than $0)
(000) | |
Goldman Sachs
International | | $ | 9 | | | $ | (7 | ) | | $ | — | | | $ | 2 | | |
HSBC Bank PLC | | | 2 | | | | (2 | ) | | | — | | | | 0 | | |
State Street Bank
and Trust Co. | | | 2 | | | | (2 | ) | | | — | | | | 0 | | |
Total | | $ | 13 | | | $ | (11 | ) | | $ | — | | | $ | 2 | | |
For the six months ended June 30, 2024, the approximate average monthly amount outstanding for each derivative type is as follows:
Foreign Currency Forward Exchange Contracts: | |
Average monthly principal amount | | $ | 17,666,000 | | |
Futures Contracts: | |
Average monthly notional value | | $ | 79,237,000 | | |
Swap Agreements: | |
Average monthly notional amount | | $ | 3,300,000 | | |
6. When-Issued/Delayed Delivery Securities: The Fund purchases and sells when-issued and delayed delivery securities. Securities purchased on a when-issued or delayed delivery basis are purchased for delivery beyond the normal settlement date at a stated price and yield, and no income accrues to the Fund on such securities prior to delivery date. Payment and delivery for when-issued and delayed delivery securities can take place a month or more after the date of the transaction. When the Fund enters into a purchase transaction on a when-issued or delayed delivery basis, securities are available for collateral in an amount at least equal in value to
the Fund's commitments to purchase such securities. Purchasing securities on a when- issued or delayed delivery basis may involve a risk that the market price at the time of delivery may be lower than the agreed upon purchase price, in which case there could be an unrealized loss at the time of delivery. Purchasing investments on a when-issued or delayed delivery basis may be considered a form of leverage which may increase the impact that gains (losses) may have on the Fund.
7. Senior Loans : Senior Loans are typically structured by a syndicate of lenders ("Lenders"), one or more of which administers the Senior Loan on behalf of the Lenders ("Agent"). Lenders may sell interests in Senior Loans to third parties ("Participations") or may assign all or a portion of their interest in a Senior Loan to third parties ("Assignments"). Senior Loans are exempt from registration under the Securities Act of 1933. Presently, Senior Loans are not readily marketable and are often subject to restrictions on resale.
8. Indemnifications: The Company enters into contracts that contain a variety of indemnification clauses. The Company's maximum exposure under these arrangements is unknown as this would involve future claims that may be made against the Fund that have not yet occurred.
9. Security Transactions, Income and Expenses: Security transactions are accounted for on the trade date (date the order to buy or sell is executed). Realized gains and losses on the sale of investment securities are determined on the specific identified cost method. Dividend income and other distributions are recorded on the ex-dividend date (except for certain foreign dividends which may be recorded as soon as the Fund is informed of such dividends) net of applicable withholding taxes. Non-cash dividends received in the form of stock, if any, are recognized on the ex-dividend date and recorded as non-cash dividend income at fair value. Interest income is recognized on the accrual basis (except where collection is in doubt) net of applicable withholding taxes. Discounts are accreted and premiums are amortized over the life of the respective securities. Most expenses of the Company can be directly attributed to a particular Fund. Expenses which cannot be directly attributed are apportioned among the Funds based upon relative net assets or other appropriate methods. Income, expenses (other than class specific expenses) and realized and unrealized gains or losses are allocated to each class of shares based upon their relative net assets.
Settlement and registration of foreign securities transactions may be subject to significant risks not normally
22
Morgan Stanley Variable Insurance Fund, Inc.
June 30, 2024 (unaudited)
Notes to Financial Statements (cont'd)
associated with investments in the United States. In certain markets, ownership of shares is defined according to entries in the issuer's share register. It is possible that a Fund holding these securities could lose its share registration through fraud, negligence or even mere oversight. In addition, shares being delivered for sales and cash being paid for purchases may be delivered before the exchange is complete. This may subject the Fund to further risk of loss in the event of a failure to complete the transaction by the counterparty.
10. Dividends and Distributions to Shareholders: Dividends and distributions to shareholders are recorded on the ex-dividend date. Dividends from net investment income, if any, are declared and paid annually. Net realized capital gains, if any, are distributed at least annually.
B. Advisory/Sub-Advisory Fees: The Adviser, a wholly-owned subsidiary of Morgan Stanley, provides the Fund with advisory services under the terms of an Investment Advisory Agreement, paid quarterly, at the annual rate based on the daily net assets as follows:
First $500
million | | Next $500
million | | Over $1
billion | |
| | 0.75 | % | | | 0.70 | % | | | 0.65 | % | |
For the six months ended June 30, 2024, the advisory fee rate (net of waiver/rebate) was equivalent to an annual effective rate of 0.56% of the Fund's average daily net assets.
The Adviser has agreed to reduce its advisory fee and/or reimburse the Fund so that total annual Fund operating expenses, excluding certain investment related expenses, taxes, interest and other extraordinary expenses (including litigation), will not exceed 1.10% for Class I shares and 1.15% for Class II shares. The fee waivers and/or expense reimbursements will continue for at least one year from the date of the Fund's prospectus or until such time as the Directors act to discontinue all or a portion of such waivers and/or reimbursements when they deem such action is appropriate. For the six months ended June 30, 2024, approximately $92,000 of advisory fees were waived pursuant to this arrangement.
The Adviser has entered into a Sub-Advisory Agreement with the Sub-Adviser, a wholly-owned subsidiary of Morgan Stanley. The Sub-Adviser provides the Fund with advisory services subject to the overall supervision of the Adviser and the Fund's Officers and Directors. The Adviser pays the Sub-Adviser on a monthly basis a portion of the net advisory fees the Adviser receives from the Fund.
C. Administration Fees: The Adviser also serves as Administrator to the Company and provides administrative services pursuant to an Administration Agreement for an
annual fee, accrued daily and paid monthly, of 0.08% of the Fund's average daily net assets.
Under a Sub-Administration Agreement between the Administrator and State Street, State Street provides certain administrative services to the Company. For such services, the Administrator pays State Street a portion of the fee the Administrator receives from the Fund.
D. Servicing Fees: The Company accrues daily and pays quarterly a servicing fee of up to 0.17% of the average daily value of shares of the Fund held in an insurance company's account. Certain insurance companies have entered into a servicing agreement with the Company to provide administrative and other contract-owner related services on behalf of the Fund.
E. Distribution Fees: Morgan Stanley Distribution, Inc. ("MSDI" or the "Distributor"), a wholly-owned subsidiary of the Adviser and an indirect subsidiary of Morgan Stanley, serves as the Distributor of the Fund and provides the Fund's Class II shareholders with distribution services pursuant to a Distribution Plan (the "Plan") in accordance with Rule 12b-1 under the Act. Under the Plan, the Fund is authorized to pay the Distributor a distribution fee, which is accrued daily and paid monthly, at an annual rate of 0.25% of the Fund's average daily net assets attributable to Class II shares. The Distributor has agreed to waive 0.20% of the 0.25% distribution fee that it may receive. This fee waiver will continue for at least one year from the date of the Fund's prospectus or until such time as the Directors act to discontinue all or a portion of such waiver when they deem such action is appropriate. For the six months ended June 30, 2024, this waiver amounted to approximately $11,000.
F. Dividend Disbursing and Transfer/Co-Transfer Agent: The Company's dividend disbursing and transfer agent is SS&C Global Investor & Distribution Solutions, Inc. ("SS&C GIDS"). Pursuant to a Transfer Agency Agreement, the Company pays SS&C GIDS a fee based on the number of classes, accounts and transactions relating to the Funds of the Company.
Eaton Vance Management ("EVM"), an affiliate of Morgan Stanley, provides co-transfer agency and related services to the Fund pursuant to a Co-Transfer Agency Services Agreement. For the six months ended June 30, 2024, co-transfer agency fees and expenses incurred to EVM, included in "Transfer Agency Fees" in the Statement of Operations, amounted to less than $500.
G. Custodian Fees: State Street (the "Custodian") also serves as Custodian for the Company in accordance with a Custodian Agreement. The Custodian holds cash, securities and other assets of the Company as required by the Act. Custody fees are
23
Morgan Stanley Variable Insurance Fund, Inc.
June 30, 2024 (unaudited)
Notes to Financial Statements (cont'd)
payable monthly based on assets held in custody, investment purchases and sales activity and account maintenance fees, plus reimbursement for certain out-of-pocket expenses.
H. Security Transactions and Transactions with Affiliates: For the six months ended June 30, 2024, purchases and sales of investment securities for the Fund, other than long-term U.S. Government securities and short-term investments were approximately $85,100,000 and $85,442,000, respectively. There were no purchases and sales of long-term U.S. Government securities for the six months ended June 30, 2024.
The Fund invests in the Institutional Class of the Morgan Stanley Institutional Liquidity Funds — Treasury Securities Portfolio (the "Liquidity Fund"), an open-end management investment company managed by the Adviser. Advisory fees paid by the Fund are reduced by an amount equal to its pro-rata share of the advisory and administration fees paid by the Fund due to its investment in the Liquidity Fund. For the six months ended June 30, 2024, advisory fees paid were reduced by approximately $4,000 relating to the Fund's investment in the Liquidity Fund.
A summary of the Fund's transactions in shares of affiliated investments during the six months ended June 30, 2024 is as follows:
Affiliated
Investment
Company | | Value
December 31,
2023
(000) | | Purchases
at Cost
(000) | | Proceeds
from Sales
(000) | | Dividend
Income
(000) | |
Liquidity Fund | | $ | 5,015 | | | $ | 43,551 | | | $ | 48,566 | | | $ | 94 | | |
Affiliated
Investment
Company (cont'd) | | Realized
Gain (Loss)
(000) | | Change in
Unrealized
Appreciation
(Depreciation)
(000) | | Value
June 30,
2024
(000) | |
Liquidity Fund | | $ | — | | | $ | — | | | $ | — | | |
Each Director receives an annual retainer fee for serving as a Director of the Morgan Stanley Funds. The aggregate compensation paid to each Director is paid by the Morgan Stanley Funds, and is allocated on a pro rata basis among each of the operational funds of the Morgan Stanley Funds based on the relative net assets of each of the funds. The Company also reimburses such Directors for travel and other out-of-pocket expenses incurred by them in connection with attending such meetings.
The Fund has an unfunded Deferred Compensation Plan (the "Compensation Plan"), which allows each independent Director to defer payment of all, or a portion, of the fees he or she receives for serving on the Board of Directors. Each eligible
Director generally may elect to have the deferred amounts credited with a return equal to the total return on one or more of the Morgan Stanley funds that are offered as investment options under the Compensation Plan. Appreciation/depreciation and distributions received from these investments are recorded with an offsetting increase/decrease in the deferred compensation obligation and do not affect the NAV of the Fund.
I. Federal Income Taxes: It is the Fund's intention to continue to qualify as a regulated investment company and distribute all of its taxable and tax-exempt income. Accordingly, no provision for federal income taxes is required in the financial statements.
The Fund may be subject to taxes imposed by countries in which it invests. Such taxes are generally based on income and/or capital gains earned or repatriated. Taxes are accrued based on net investment income, net realized gains and net unrealized appreciation as such income and/or gains are earned. Taxes may also be based on transactions in foreign currency and are accrued based on the value of investments denominated in such currency.
FASB ASC 740-10, "Income Taxes — Overall", sets forth a minimum threshold for financial statement recognition of the benefit of a tax position taken or expected to be taken in a tax return. Management has concluded there are no significant uncertain tax positions that would require recognition in the financial statements. If applicable, the Fund recognizes interest accrued related to unrecognized tax benefits in "Interest Expense" and penalties in "Other Expenses" in the Statement of Operations. The Fund files tax returns with the U.S. Internal Revenue Service, New York and various states. Generally, each of the tax years in the four-year period ended December 31, 2023 remains subject to examination by taxing authorities.
The tax character of distributions paid may differ from the character of distributions shown for GAAP purposes due to short-term capital gains being treated as ordinary income for tax purposes. The tax character of distributions paid during fiscal years 2023 and 2022 was as follows:
2023 Distributions
Paid From: | | 2022 Distributions
Paid From: | |
Ordinary
Income
(000) | | Ordinary
Income
(000) | |
$ | 9,020 | | | $ | 8,543 | | |
The amount and character of income and gains to be distributed are determined in accordance with income tax regulations which may differ from GAAP. These book/tax differences are either considered temporary or permanent in nature.
24
Morgan Stanley Variable Insurance Fund, Inc.
June 30, 2024 (unaudited)
Notes to Financial Statements (cont'd)
Temporary differences are attributable to differing book and tax treatments for the timing of the recognition of gains (losses) on certain investment transactions and the timing of the deductibility of certain expenses.
The Fund had no permanent differences causing reclassifications among the components of net assets for the year ended December 31, 2023.
At December 31, 2023, the components of distributable earnings for the Fund on a tax basis were as follows:
Undistributed
Ordinary
Income
(000) | | Undistributed
Long-Term
Capital Gain
(000) | |
| $ | 10,468 | | | $ | — | | |
At December 31, 2023, the Fund had available for federal income tax purposes unused short-term and long-term capital losses of approximately $5,461,000 and $56,461,000, respectively, that do not have an expiration date.
To the extent that capital loss carryforwards are used to offset any future capital gains realized, no capital gains tax liability will be incurred by the Fund for gains realized and not distributed. To the extent that capital gains are offset, such gains will not be distributed to the shareholders.
J. Credit Facility: The Company and other Morgan Stanley funds participated in a $500,000,000 committed, unsecured revolving line of credit facility (the "Facility") with State Street. This Facility is to be used for temporary emergency purposes or funding of shareholder redemption requests. The interest rate for any funds drawn will be based on the federal funds rate or overnight bank funding rate plus a spread. The Facility also has a commitment fee of 0.25% per annum based on the unused portion of the Facility, which is allocated among participating funds based on relative net assets. During the six months ended June 30, 2024, the Fund did not have any borrowings under the Facility.
K. Other: At June 30, 2024, the Fund had record owners of 10% or greater. Investment activities of these shareholders could have a material impact on the Fund. The aggregate percentage of such owners was 81.8%.
L. Market Risk: The value of an investment in the Fund is based on the values of the Fund's investments, which change due to economic and other events that affect markets generally, as well as those that affect particular regions, countries, industries, companies or governments. The risks associated with these developments may be magnified if certain social, political, economic and other conditions and events adversely interrupt the global economy and financial markets. Securities in the Fund's portfolio may underperform due to inflation (or expectations for inflation), interest rates, global demand for
particular products or resources, natural disasters and extreme weather events, health emergencies (such as epidemics and pandemics), terrorism, regulatory events and governmental or quasi-governmental actions. The occurrence of global events similar to those in recent years, such as terrorist attacks around the world, natural disasters, health emergencies, social and political (including geopolitical) discord and tensions or debt crises and downgrades, among others, may result in market volatility and may have long term effects on both the U.S. and global financial markets. The occurrence of such events may be sudden and unexpected, and it is difficult to predict when similar events affecting the U.S. or global financial markets may occur, the effects that such events may have and the duration of those effects (which may last for extended periods). Any such event(s) could have a significant adverse impact on the value, liquidity and risk profile of the Fund's portfolio, as well as its ability to sell securities and/or meet redemptions. Any such event(s) or similar types of factors and developments may also adversely affect the financial performance of the Fund's investments (and, in turn, the Fund's investment results) and/or negatively impact broad segments of businesses and populations and have a significant and rapid negative impact on the performance of the Fund's investments, and exacerbate preexisting risks to the Fund.
25
Morgan Stanley Variable Insurance Fund, Inc.
June 30, 2024 (unaudited)
Investment Advisory Agreement Approval
Nature, Extent and Quality of Services
The Board reviewed and considered the nature and extent of the investment advisory services provided by the Adviser under the advisory agreement, including portfolio management, investment research and equity and fixed income securities trading. The Board reviewed similar information and factors regarding the Sub-Adviser, to the extent applicable. The Board also reviewed and considered the nature and extent of the non-advisory, administrative services provided by the Administrator under the administration agreement, including accounting, operations, clerical, bookkeeping, compliance, business management and planning, legal services and the provision of supplies, office space and utilities at the Adviser's expense. The Board also considered the Adviser's investment in personnel and infrastructure that benefits the Fund. (The Adviser, Sub-Adviser and Administrator together are referred to as the "Adviser" and the advisory, sub-advisory and administration agreements together are referred to as the "Management Agreement.") The Board also considered that the Adviser serves a variety of other investment advisory clients and has experience overseeing service providers. The Board also compared the nature of the services provided by the Adviser with similar services provided by non-affiliated advisers as prepared by Broadridge Financial Solutions, Inc. ("Broadridge").
The Board reviewed and considered the qualifications of the portfolio managers, the senior administrative managers and other key personnel of the Adviser who provide the advisory and administrative services to the Fund. The Board determined that the Adviser's portfolio managers and key personnel are well qualified by education and/or training and experience to perform the services in an efficient and professional manner. The Board concluded that the nature and extent of the advisory and administrative services provided were necessary and appropriate for the conduct of the business and investment activities of the Fund and supported its decision to approve the Management Agreement.
Performance, Fees and Expenses of the Fund
The Board reviewed the performance, fees and expenses of the Fund compared to its peers, as prepared by Broadridge, and to appropriate benchmarks where applicable. The Board discussed with the Adviser the performance goals and the actual results achieved in managing the Fund. When considering a fund's performance, the Board and the Adviser place emphasis on trends and longer-term returns (focusing on one-year, three-year and five-year performance, as of December 31, 2023, or since inception, as applicable). When a fund underperforms its benchmark and/or its peer group average, the Board and the Adviser discuss the causes of such underperformance and, where necessary, they discuss specific changes to investment strategy or investment personnel. The Board noted that the Fund's performance was better than its peer group average for the one-year period but below its peer group average for the three- and five-year periods. The Board discussed with the Adviser the level of the advisory and administration fees (together, the "management fee") for this Fund relative to comparable funds and/or other accounts advised by the Adviser and/or compared to its peers as prepared by Broadridge. In addition to the management fee, the Board also reviewed the Fund's total expense ratio. The Board noted that the Fund's contractual management fee and total expense ratio were higher than but close to its peer group averages and the actual management fee was lower than its peer group average. After discussion, the Board concluded that the Fund's (i) performance was acceptable and (ii) management fee and total expense ratio were competitive with its peer group averages.
Economies of Scale
The Board considered the size and growth prospects of the Fund and how that relates to the Fund's total expense ratio and particularly the Fund's management fee rate, which includes breakpoints. In conjunction with its review of the Adviser's profitability, the Board discussed with the Adviser how a change in assets can affect the efficiency or effectiveness of managing the Fund and whether the management fee level is appropriate relative to current and projected asset levels and/or whether the management fee structure reflects economies of scale as asset levels change. The Board has determined that its review of the actual and/or potential economies of scale of the Fund supports its decision to approve the Management Agreement.
Profitability of the Adviser and Affiliates
The Board considered information concerning the costs incurred and profits realized by the Adviser and its affiliates during the last year from their relationship with the Fund and during the last two years from their relationship with the Morgan Stanley
26
Morgan Stanley Variable Insurance Fund, Inc.
June 30, 2024 (unaudited)
Investment Advisory Agreement Approval (cont'd)
Fund Complex and reviewed with the Adviser the cost allocation methodology used to determine the profitability of the Adviser and affiliates. The Board has determined that its review of the analysis of the Adviser's expenses and profitability supports its decision to approve the Management Agreement.
Other Benefits of the Relationship
The Board considered other direct and indirect benefits to the Adviser and/or its affiliates derived from their relationship with the Fund and other funds advised by the Adviser. These benefits may include, among other things, fees for trading, distribution and/or shareholder servicing and for transaction processing and reporting platforms used by securities lending agents, and research received by the Adviser generated from commission dollars spent on funds' portfolio trading. The Board reviewed with the Adviser these arrangements and the reasonableness of the Adviser's costs relative to the services performed. The Board has determined that its review of the other benefits received by the Adviser or its affiliates supports its decision to approve the Management Agreement.
Resources of the Adviser and Historical Relationship Between the Fund and the Adviser
The Board considered whether the Adviser is financially sound and has the resources necessary to perform its obligations under the Management Agreement. The Board also reviewed and considered the historical relationship between the Fund and the Adviser, including the organizational structure of the Adviser, the policies and procedures formulated and adopted by the Adviser for managing the Fund's operations and the Board's confidence in the competence and integrity of the senior managers and key personnel of the Adviser. The Board concluded that the Adviser has the financial resources necessary to fulfill its obligations under the Management Agreement and that it is beneficial for the Fund to continue its relationship with the Adviser.
Other Factors and Current Trends
The Board considered the controls and procedures adopted and implemented by the Adviser and monitored by the Fund's Chief Compliance Officer and concluded that the conduct of business by the Adviser indicates a good faith effort on its part to adhere to high ethical standards in the conduct of the Fund's business.
General Conclusion
After considering and weighing all of the above factors, with various written materials and verbal information presented by the Adviser, the Board concluded that it would be in the best interest of the Fund and its shareholders to approve renewal of the Management Agreement for another year. In reaching this conclusion the Board did not give particular weight to any single piece of information or factor referenced above. The Board considered these factors and information over the course of the year and in numerous meetings, some of which were in executive session with only the independent Board members and their counsel present. It is possible that individual Board members may have weighed these factors, and the information presented, differently in reaching their individual decisions to approve the Management Agreement.
27
Morgan Stanley Variable Insurance Fund, Inc.
June 30, 2024 (unaudited)
This report is not authorized for distribution to prospective investors in the Fund unless preceded or accompanied by an effective Prospectus. Read the Prospectus carefully before investing.

Morgan Stanley Variable Insurance Fund, Inc.
Semi-Annual Financial Statements and Additional Information
June 30, 2024 (unaudited)
Emerging Markets Equity Portfolio
The Fund is intended to be a funding vehicle for variable annuity contracts and variable life insurance policies offered by the separate accounts of certain life insurance companies.
Morgan Stanley Variable Insurance Fund, Inc.
June 30, 2024 (unaudited)
1
Morgan Stanley Variable Insurance Fund, Inc.
June 30, 2024 (unaudited)
Portfolio of Investments
Emerging Markets Equity Portfolio
| | | Shares | | Value
(000) | |
Common Stocks (100.5%) | |
Brazil (6.3%) | |
Itau Unibanco Holding SA (Preference) | | | 369,770 | | | $ | 2,144 | | |
Localiza Rent a Car SA | | | 238,437 | | | | 1,791 | | |
NU Holdings Ltd., Class A (a) | | | 82,787 | | | | 1,067 | | |
Raia Drogasil SA | | | 301,475 | | | | 1,385 | | |
Vale SA | | | 100,739 | | | | 1,121 | | |
WEG SA | | | 397,883 | | | | 3,003 | | |
| | | | 10,511 | | |
China (19.5%) | |
Alibaba Group Holding Ltd. (b) | | | 384,700 | | | | 3,467 | | |
Baidu, Inc. ADR (a) | | | 4,834 | | | | 418 | | |
Bank of Ningbo Co. Ltd., Class A | | | 206,500 | | | | 625 | | |
BYD Co. Ltd., H Shares (b) | | | 75,000 | | | | 2,227 | | |
China Construction Bank Corp., H Shares (b) | | | 4,558,230 | | | | 3,370 | | |
China Mengniu Dairy Co. Ltd. (b) | | | 417,000 | | | | 746 | | |
China Merchants Bank Co. Ltd., H Shares (b) | | | 425,500 | | | | 1,934 | | |
China Resources Beer Holdings Co. Ltd. (b) | | | 179,500 | | | | 604 | | |
JD.com, Inc., Class A (b) | | | 29,280 | | | | 380 | | |
Jiangsu Hengrui Pharmaceuticals Co. Ltd.,
Class A (a) | | | 146,209 | | | | 773 | | |
KE Holdings, Inc. ADR | | | 22,755 | | | | 322 | | |
Kweichow Moutai Co. Ltd., Class A | | | 5,991 | | | | 1,207 | | |
Li Auto, Inc., Class A (a)(b) | | | 22,400 | | | | 201 | | |
Li Ning Co. Ltd. (b) | | | 160,500 | | | | 346 | | |
Meituan, Class B (a)(b) | | | 55,380 | | | | 787 | | |
NARI Technology Co. Ltd., Class A | | | 280,600 | | | | 962 | | |
NetEase, Inc. (b) | | | 54,900 | | | | 1,048 | | |
Ping An Insurance Group Co. of China Ltd.,
Class H (b) | | | 137,000 | | | | 621 | | |
Postal Savings Bank of China Co. Ltd. (b) | | | 1,195,000 | | | | 700 | | |
Proya Cosmetics Co. Ltd., Class A | | | 58,448 | | | | 891 | | |
Shenzhen Inovance Technology Co. Ltd.,
Class A | | | 124,400 | | | | 877 | | |
Shenzhou International Group Holdings Ltd. (b) | | | 104,700 | | | | 1,023 | | |
Tencent Holdings Ltd. (b) | | | 151,100 | | | | 7,168 | | |
Trip.com Group Ltd. ADR (a) | | | 31,194 | | | | 1,466 | | |
Yum China Holdings, Inc. | | | 16,379 | | | | 505 | | |
| | | | 32,668 | | |
India (25.7%) | |
Axis Bank Ltd. | | | 86,413 | | | | 1,310 | | |
Bajaj Auto Ltd. | | | 21,009 | | | | 2,393 | | |
Bajaj Finance Ltd. | | | 17,378 | | | | 1,481 | | |
CG Power & Industrial Solutions Ltd. | | | 75,500 | | | | 637 | | |
Coforge Ltd. | | | 3,513 | | | | 229 | | |
Delhivery Ltd. (a) | | | 181,978 | | | | 873 | | |
HDFC Asset Management Co. Ltd. | | | 30,291 | | | | 1,449 | | |
HDFC Bank Ltd. | | | 135,706 | | | | 2,741 | | |
Hindalco Industries Ltd. | | | 193,794 | | | | 1,606 | | |
Hitachi Energy India Ltd. | | | 10,580 | | | | 1,636 | | |
ICICI Bank Ltd. | | | 298,607 | | | | 4,298 | | |
Infosys Ltd. | | | 113,031 | | | | 2,121 | | |
| | | Shares | | Value
(000) | |
Infosys Ltd. ADR (c) | | | 33,980 | | | $ | 633 | | |
Larsen & Toubro Ltd. | | | 39,739 | | | | 1,688 | | |
Macrotech Developers Ltd. | | | 97,835 | | | | 1,764 | | |
Mahindra & Mahindra Ltd. | | | 140,331 | | | | 4,817 | | |
MakeMyTrip Ltd. (a) | | | 12,566 | | | | 1,057 | | |
Max Healthcare Institute Ltd. | | | 130,668 | | | | 1,472 | | |
Pidilite Industries Ltd. | | | 37,399 | | | | 1,415 | | |
Reliance Industries Ltd. | | | 113,754 | | | | 4,264 | | |
Star Health & Allied Insurance Co. Ltd. (a) | | | 132,075 | | | | 885 | | |
State Bank of India | | | 306,434 | | | | 3,113 | | |
United Breweries Ltd. | | | 43,655 | | | | 1,039 | | |
| | | | 42,921 | | |
Indonesia (2.9%) | |
Bank Central Asia Tbk. PT | | | 2,601,500 | | | | 1,574 | | |
Bank Mandiri Persero Tbk. PT | | | 3,025,100 | | | | 1,132 | | |
Bank Rakyat Indonesia Persero Tbk. PT | | | 4,475,300 | | | | 1,255 | | |
Cisarua Mountain Dairy Tbk. PT | | | 2,771,400 | | | | 846 | | |
| | | | 4,807 | | |
Korea, Republic of (11.8%) | |
DB Insurance Co. Ltd. | | | 8,441 | | | | 699 | | |
HYBE Co. Ltd. | | | 2,632 | | | | 386 | | |
Hyundai Marine & Fire Insurance Co. Ltd. | | | 24,640 | | | | 616 | | |
Hyundai Motor Co. | | | 4,152 | | | | 885 | | |
KB Financial Group, Inc. | | | 23,141 | | | | 1,316 | | |
Kia Corp. | | | 14,309 | | | | 1,339 | | |
Korea Zinc Co. Ltd. | | | 2,600 | | | | 969 | | |
NAVER Corp. | | | 6,170 | | | | 742 | | |
Samsung Electronics Co. Ltd. | | | 118,140 | | | | 6,953 | | |
SK Hynix, Inc. | | | 34,693 | | | | 5,888 | | |
| | | | 19,793 | | |
Mexico (4.6%) | |
Gruma SAB de CV, Class B | | | 134,327 | | | | 2,460 | | |
Grupo Financiero Banorte SAB de CV Series O | | | 194,113 | | | | 1,513 | | |
Qualitas Controladora SAB de CV | | | 182,319 | | | | 1,853 | | |
Wal-Mart de Mexico SAB de CV | | | 537,708 | | | | 1,837 | | |
| | | | 7,663 | | |
Poland (2.5%) | |
Allegro.eu SA (a) | | | 235,986 | | | | 2,206 | | |
Powszechny Zaklad Ubezpieczen SA | | | 157,762 | | | | 2,014 | | |
| | | | 4,220 | | |
Saudi Arabia (1.6%) | |
Alinma Bank | | | 169,753 | | | | 1,415 | | |
Bupa Arabia for Cooperative Insurance Co. | | | 19,570 | | | | 1,344 | | |
| | | | 2,759 | | |
South Africa (3.3%) | |
Anglo American PLC | | | 72,246 | | | | 2,288 | | |
AVI Ltd. | | | 192,074 | | | | 998 | | |
Capitec Bank Holdings Ltd. | | | 14,984 | | | | 2,176 | | |
| | | | 5,462 | | |
The accompanying notes are an integral part of the financial statements.
2
Morgan Stanley Variable Insurance Fund, Inc.
June 30, 2024 (unaudited)
Portfolio of Investments (cont'd)
Emerging Markets Equity Portfolio
| | | Shares | | Value
(000) | |
Taiwan (18.9%) | |
Advantech Co. Ltd. | | | 67,000 | | | $ | 763 | | |
Airtac International Group | | | 29,901 | | | | 907 | | |
Chailease Holding Co. Ltd. | | | 117,940 | | | | 557 | | |
CTBC Financial Holding Co. Ltd. | | | 368,000 | | | | 429 | | |
Delta Electronics, Inc. | | | 84,000 | | | | 1,002 | | |
E Ink Holdings, Inc. | | | 168,000 | | | | 1,301 | | |
Hon Hai Precision Industry Co. Ltd. | | | 499,000 | | | | 3,285 | | |
Taiwan Semiconductor Manufacturing Co. Ltd. | | | 601,000 | | | | 17,806 | | |
Unimicron Technology Corp. | | | 281,000 | | | | 1,555 | | |
United Microelectronics Corp. (a) | | | 1,244,000 | | | | 2,151 | | |
Wiwynn Corp. | | | 22,000 | | | | 1,782 | | |
| | | | 31,538 | | |
Thailand (1.5%) | |
Central Retail Corp. PCL | | | 351,200 | | | | 293 | | |
| CP ALL PCL | | | 219,200 | | | | 328 | | |
Kasikornbank PCL | | | 275,500 | | | | 940 | | |
Tisco Financial Group PCL | | | 386,000 | | | | 1,004 | | |
| | | | 2,565 | | |
United Arab Emirates (0.7%) | |
Americana Restaurants International PLC | | | 1,321,066 | | | | 1,127 | | |
United Kingdom (1.2%) | |
Antofagasta PLC | | | 74,986 | | | | 1,993 | | |
Total Common Stocks (Cost $122,047) | | | 168,027 | | |
| | | No. of
Rights | | | |
Rights (0.0%)‡ | |
Brazil (0.0%)‡ | |
Localiza Rent a Car SA, expires 08/06/24 (a)
(Cost $—) | | | 2,409 | | | | 4 | | |
| | | Shares | | | |
Short-Term Investments (1.2%) | |
Investment Company (0.8%) | |
Morgan Stanley Institutional Liquidity
Funds — Government Portfolio —
Institutional Class, 5.22% (See Note H)
(Cost $1,285) | | | 1,284,858 | | | | 1,285 | | |
Securities held as Collateral on Loaned Securities (0.4%) | |
Investment Company (0.4%) | |
Morgan Stanley Institutional Liquidity
Funds — Government Portfolio —
Institutional Class, 5.22% (See Note H)
(Cost $654) | | | 654,115 | | | | 654 | | |
Total Short-Term Investments (Cost $1,939) | | | 1,939 | | |
Total Investments (101.7%) (Cost $123,986)
including $633 of Securities Loaned (d)(e) | | | 169,970 | | |
Liabilities in Excess of Other Assets (–1.7%) | | | (2,792 | ) | |
Net Assets (100.0%) | | $ | 167,178 | | |
Country assignments and aggregations are based generally on third party vendor classifications and information, and may be different from the assignments and aggregations under the policies set forth in the Fund's prospectus and/or statement of additional information relating to geographic classifications.
‡ Amount is less than 0.05%.
(a) Non-income producing security.
(b) Security trades on the Hong Kong exchange.
(c) All or a portion of this security was on loan at June 30, 2024.
(d) The approximate fair value and percentage of net assets, $145,452,000 and 87.0%, respectively, represent the securities that have been fair valued under the fair valuation policy for international investments as described in Note A-1 within the Notes to Financial Statements.
(e) At June 30, 2024, the aggregate cost for federal income tax purposes approximates the aggregate cost for book purposes. The aggregate gross unrealized appreciation is approximately $54,296,000 and the aggregate gross unrealized depreciation is approximately $8,312,000, resulting in net unrealized appreciation of approximately $45,984,000.
ADR American Depositary Receipt.
Portfolio Composition**
Classification | | Percentage of
Total Investments | |
Other* | | | 52.2 | % | |
Banks | | | 20.0 | | |
Semiconductors & Semiconductor Equipment | | | 15.2 | | |
Automobiles | | | 7.0 | | |
Tech Hardware, Storage & Peripherals | | | 5.6 | | |
Total Investments | | | 100.0 | % | |
* Industries and/or investment types representing less than 5% of total investments.
** Percentages indicated are based upon total investments (excluding Securities held as Collateral on Loaned Securities) as of June 30, 2024.
The accompanying notes are an integral part of the financial statements.
3
Morgan Stanley Variable Insurance Fund, Inc.
June 30, 2024 (unaudited)
Emerging Markets Equity Portfolio
Statement of Assets and Liabilities | | June 30, 2024
(000) | |
Assets: | |
Investments in Securities of Unaffiliated Issuers, at Value(1) (Cost $122,047) | | $ | 168,031 | | |
Investment in Security of Affiliated Issuer, at Value (Cost $1,939) | | | 1,939 | | |
Total Investments in Securities, at Value (Cost $123,986) | | | 169,970 | | |
Foreign Currency, at Value (Cost $136) | | | 132 | | |
Dividends Receivable | | | 511 | | |
Receivable for Fund Shares Sold | | | 49 | | |
Tax Reclaim Receivable | | | 22 | | |
Receivable from Affiliate | | | 5 | | |
Receivable from Securities Lending Income | | | — | @ | |
Other Assets | | | 21 | | |
Total Assets | | | 170,710 | | |
Liabilities: | |
Deferred Capital Gain Country Tax | | | 2,181 | | |
Collateral on Securities Loaned, at Value | | | 654 | | |
Payable for Advisory Fees | | | 302 | | |
Payable for Fund Shares Redeemed | | | 207 | | |
Payable for Professional Fees | | | 60 | | |
Payable for Servicing Fees | | | 53 | | |
Payable for Custodian Fees | | | 39 | | |
Payable for Administration Fees | | | 11 | | |
Payable for Transfer Agency Fees | | | 2 | | |
Payable for Investments Purchased | | | — | @ | |
Payable for Distribution Fees — Class II Shares | | | — | @ | |
Other Liabilities | | | 23 | | |
Total Liabilities | | | 3,532 | | |
NET ASSETS | | $ | 167,178 | | |
Net Assets Consist of: | |
Paid-in-Capital | | $ | 119,181 | | |
Total Distributable Earnings | | | 47,997 | | |
Net Assets | | $ | 167,178 | | |
CLASS I: | |
Net Assets | | $ | 116,842 | | |
Net Asset Value, Offering and Redemption Price Per Share Applicable to 8,138,132 Outstanding
$0.001 Par Value Shares (Authorized 500,000,000 Shares) | | $ | 14.36 | | |
CLASS II: | |
Net Assets | | $ | 50,336 | | |
Net Asset Value, Offering and Redemption Price Per Share Applicable to 3,521,297 Outstanding
$0.001 Par Value Shares (Authorized 500,000,000 Shares) | | $ | 14.29 | | |
| (1) Including: | | | | | |
Securities on Loan, at Value: | | $ | 633 | | |
@ Amount is less than $500.
The accompanying notes are an integral part of the financial statements.
4
Morgan Stanley Variable Insurance Fund, Inc.
June 30, 2024 (unaudited)
Emerging Markets Equity Portfolio
Statement of Operations | | Six Months Ended
June 30, 2024
(000) | |
Investment Income: | |
Dividends from Securities of Unaffiliated Issuers (Net of $264 of Foreign Taxes Withheld) | | $ | 1,829 | | |
Dividends from Security of Affiliated Issuer (Note H) | | | 52 | | |
Income from Securities Loaned — Net | | | 2 | | |
Total Investment Income | | | 1,883 | | |
Expenses: | |
Advisory Fees (Note B) | | | 603 | | |
Servicing Fees (Note D) | | | 129 | | |
Professional Fees | | | 95 | | |
Custodian Fees (Note G) | | | 65 | | |
Administration Fees (Note C) | | | 64 | | |
Distribution Fees — Class II Shares (Note E) | | | 61 | | |
Shareholder Reporting Fees | | | 13 | | |
Transfer Agency Fees (Note F) | | | 10 | | |
Pricing Fees | | | 3 | | |
Directors' Fees and Expenses | | | 1 | | |
Other Expenses | | | 12 | | |
Total Expenses | | | 1,056 | | |
Waiver of Distribution Fees — Class II Shares (Note E) | | | (49 | ) | |
Rebate from Morgan Stanley Affiliate (Note H) | | | (2 | ) | |
Net Expenses | | | 1,005 | | |
Net Investment Income | | | 878 | | |
Realized Gain (Loss): | |
Investments Sold (Net of $154 of Capital Gain Country Tax) | | | 5,202 | | |
Foreign Currency Translation | | | (51 | ) | |
Net Realized Gain | | | 5,151 | | |
Change in Unrealized Appreciation (Depreciation): | |
Investments (Net of Increase in Deferred Capital Gain Country Tax of $249) | | | 11,381 | | |
Foreign Currency Translation | | | (8 | ) | |
Net Change in Unrealized Appreciation (Depreciation) | | | 11,373 | | |
Net Realized Gain and Change in Unrealized Appreciation (Depreciation) | | | 16,524 | | |
Net Increase in Net Assets Resulting from Operations | | $ | 17,402 | | |
The accompanying notes are an integral part of the financial statements.
5
Morgan Stanley Variable Insurance Fund, Inc.
June 30, 2024
Emerging Markets Equity Portfolio
Statements of Changes in Net Assets | | Six Months Ended
June 30, 2024
(unaudited)
(000) | | Year Ended
December 31, 2023
(000) | |
Increase (Decrease) in Net Assets: | |
Operations: | |
Net Investment Income | | $ | 878 | | | $ | 2,415 | | |
Net Realized Gain (Loss) | | | 5,151 | | | | (3,677 | ) | |
Net Change in Unrealized Appreciation (Depreciation) | | | 11,373 | | | | 19,370 | | |
Net Increase in Net Assets Resulting from Operations | | | 17,402 | | | | 18,108 | | |
Dividends and Distributions to Shareholders: | |
Class I | | | — | | | | (3,804 | ) | |
Class II | | | — | | | | (1,628 | ) | |
Total Dividends and Distributions to Shareholders | | | — | | | | (5,432 | ) | |
Capital Share Transactions:(1) | |
Class I: | |
Subscribed | | | 2,649 | | | | 6,955 | | |
Distributions Reinvested | | | — | | | | 3,804 | | |
Redeemed | | | (10,071 | ) | | | (18,499 | ) | |
Class II: | |
Subscribed | | | 1,295 | | | | 2,840 | | |
Distributions Reinvested | | | — | | | | 1,628 | | |
Redeemed | | | (5,260 | ) | | | (8,000 | ) | |
Net Decrease in Net Assets Resulting from Capital Share Transactions | | | (11,387 | ) | | | (11,272 | ) | |
Total Increase in Net Assets | | | 6,015 | | | | 1,404 | | |
Net Assets: | |
Beginning of Period | | | 161,163 | | | | 159,759 | | |
End of Period | | $ | 167,178 | | | $ | 161,163 | | |
(1) Capital Share Transactions: | |
Class I: | |
Shares Subscribed | | | 198 | | | | 561 | | |
Shares Issued on Distributions Reinvested | | | — | | | | 313 | | |
Shares Redeemed | | | (752 | ) | | | (1,502 | ) | |
Net Decrease in Class I Shares Outstanding | | | (554 | ) | | | (628 | ) | |
Class II: | |
Shares Subscribed | | | 98 | | | | 231 | | |
Shares Issued on Distributions Reinvested | | | — | | | | 134 | | |
Shares Redeemed | | | (394 | ) | | | (652 | ) | |
Net Decrease in Class II Shares Outstanding | | | (296 | ) | | | (287 | ) | |
The accompanying notes are an integral part of the financial statements.
6
Morgan Stanley Variable Insurance Fund, Inc.
June 30, 2024
Financial Highlights
Emerging Markets Equity Portfolio
| | | Class I | |
| | | Six Months Ended
June 30, 2024 | | Year Ended December 31, | |
Selected Per Share Data and Ratios | | (unaudited) | | 2023 | | 2022 | | 2021 | | 2020 | | 2019 | |
Net Asset Value, Beginning of Period | | $ | 12.90 | | | $ | 11.92 | | | $ | 18.11 | | | $ | 17.73 | | | $ | 15.99 | | | $ | 14.48 | | |
Income (Loss) from Investment Operations: | |
Net Investment Income(1) | | | 0.07 | | | | 0.19 | | | | 0.19 | | | | 0.08 | | | | 0.05 | | | | 0.20 | | |
Net Realized and Unrealized Gain (Loss) | | | 1.39 | | | | 1.21 | | | | (4.81 | ) | | | 0.46 | | | | 2.15 | | | | 2.56 | | |
Total from Investment Operations | | | 1.46 | | | | 1.40 | | | | (4.62 | ) | | | 0.54 | | | | 2.20 | | | | 2.76 | | |
Distributions from and/or in Excess of: | |
Net Investment Income | | | — | | | | (0.20 | ) | | | (0.06 | ) | | | (0.16 | ) | | | (0.21 | ) | | | (0.17 | ) | |
Net Realized Gain | | | — | | | | (0.22 | ) | | | (1.51 | ) | | | — | | | | (0.25 | ) | | | (1.08 | ) | |
Total Distributions | | | — | | | | (0.42 | ) | | | (1.57 | ) | | | (0.16 | ) | | | (0.46 | ) | | | (1.25 | ) | |
Net Asset Value, End of Period | | $ | 14.36 | | | $ | 12.90 | | | $ | 11.92 | | | $ | 18.11 | | | $ | 17.73 | | | $ | 15.99 | | |
Total Return(2) | | | 11.32 | %(3) | | | 11.97 | %(4) | | | (25.08 | )% | | | 2.99 | % | | | 14.44 | % | | | 19.59 | % | |
Ratios to Average Net Assets and Supplemental Data: | |
Net Assets, End of Period (Thousands) | | $ | 116,842 | | | $ | 112,121 | | | $ | 111,050 | | | $ | 160,661 | | | $ | 166,989 | | | $ | 163,794 | | |
Ratio of Expenses Before Expense Limitation | | | 1.24 | %(5) | | | 1.28 | % | | | 1.32 | % | | | 1.25 | % | | | 1.30 | % | | | 1.27 | % | |
Ratio of Expenses After Expense Limitation | | | 1.24 | %(5)(6) | | | 1.24 | %(6)(7) | | | 1.25 | %(6) | | | 1.25 | %(6) | | | 1.25 | %(6) | | | 1.25 | %(6) | |
Ratio of Expenses After Expense Limitation Excluding
Interest Expenses | | | N/A | | | | N/A | | | | 1.25 | %(6) | | | N/A | | | | 1.25 | %(6) | | | 1.25 | %(6) | |
Ratio of Net Investment Income | | | 1.11 | %(5)(6) | | | 1.52 | %(6)(7) | | | 1.41 | %(6) | | | 0.44 | %(6) | | | 0.35 | %(6) | | | 1.33 | %(6) | |
Ratio of Rebate from Morgan Stanley Affiliates | | | 0.00 | %(5)(8) | | | 0.00 | %(8) | | | 0.00 | %(8) | | | 0.00 | %(8) | | | 0.00 | %(8) | | | 0.00 | %(8) | |
Portfolio Turnover Rate | | | 21 | %(3) | | | 33 | % | | | 38 | % | | | 39 | % | | | 52 | % | | | 36 | % | |
(1) Per share amount is based on average shares outstanding.
(2) Calculated based on the net asset value as of the last business day of the period. Performance does not reflect fees and expenses imposed by your insurance company's separate account. If performance information included the effect of these additional charges, the total return would be lower.
(3) Not annualized.
(4) Reflects prior period transfer agency fees that were reimbursed in 2023. The amount of the reimbursement was immaterial on a per share basis and the impact was less than 0.005% to the total return of Class I shares.
(5) Annualized.
(6) The Ratio of Expenses After Expense Limitation and Ratio of Net Investment Income reflect the rebate of certain Fund expenses in connection with the investments in Morgan Stanley affiliates during the period. The effect of the rebate on the ratios is disclosed in the above table as "Ratio of Rebate from Morgan Stanley Affiliates."
(7) If the Fund had not received the reimbursement of transfer agency fees from the Adviser, the Ratio of Expenses After Expense Limitation and Ratio of Net Investment Income, would have been as follows for Class I shares:
Period Ended | | Expense
Ratio | | Net Investment
Income Ratio | |
December 31, 2023 | | | 1.25 | % | | | 1.51 | % | |
(8) Amount is less than 0.005%.
The accompanying notes are an integral part of the financial statements.
7
Morgan Stanley Variable Insurance Fund, Inc.
June 30, 2024
Financial Highlights
Emerging Markets Equity Portfolio
| | | Class II | |
| | | Six Months Ended
June 30, 2024 | | Year Ended December 31, | |
Selected Per Share Data and Ratios | | (unaudited) | | 2023 | | 2022 | | 2021 | | 2020 | | 2019 | |
Net Asset Value, Beginning of Period | | $ | 12.85 | | | $ | 11.87 | | | $ | 18.04 | | | $ | 17.66 | | | $ | 15.93 | | | $ | 14.44 | | |
Income (Loss) from Investment Operations: | |
Net Investment Income(1) | | | 0.07 | | | | 0.18 | | | | 0.18 | | | | 0.07 | | | | 0.04 | | | | 0.19 | | |
Net Realized and Unrealized Gain (Loss) | | | 1.37 | | | | 1.22 | | | | (4.79 | ) | | | 0.46 | | | | 2.14 | | | | 2.54 | | |
Total from Investment Operations | | | 1.44 | | | | 1.40 | | | | (4.61 | ) | | | 0.53 | | | | 2.18 | | | | 2.73 | | |
Distributions from and/or in Excess of: | |
Net Investment Income | | | — | | | | (0.20 | ) | | | (0.05 | ) | | | (0.15 | ) | | | (0.20 | ) | | | (0.16 | ) | |
Net Realized Gain | | | — | | | | (0.22 | ) | | | (1.51 | ) | | | — | | | | (0.25 | ) | | | (1.08 | ) | |
Total Distributions | | | — | | | | (0.42 | ) | | | (1.56 | ) | | | (0.15 | ) | | | (0.45 | ) | | | (1.24 | ) | |
Net Asset Value, End of Period | | $ | 14.29 | | | $ | 12.85 | | | $ | 11.87 | | | $ | 18.04 | | | $ | 17.66 | | | $ | 15.93 | | |
Total Return(2) | | | 11.21 | %(3) | | | 11.96 | %(4) | | | (25.13 | )% | | | 2.95 | % | | | 14.36 | % | | | 19.51 | % | |
Ratios to Average Net Assets and Supplemental Data: | |
Net Assets, End of Period (Thousands) | | $ | 50,336 | | | $ | 49,042 | | | $ | 48,709 | | | $ | 67,300 | | | $ | 73,286 | | | $ | 71,662 | | |
Ratio of Expenses Before Expense Limitation | | | 1.49 | %(5) | | | 1.53 | % | | | 1.57 | % | | | 1.50 | % | | | 1.55 | % | | | 1.52 | % | |
Ratio of Expenses After Expense Limitation | | | 1.29 | %(5)(6) | | | 1.29 | %(6)(7) | | | 1.30 | %(6) | | | 1.30 | %(6) | | | 1.30 | %(6) | | | 1.30 | %(6) | |
Ratio of Expenses After Expense Limitation Excluding
Interest Expenses | | | N/A | | | | N/A | | | | 1.30 | %(6) | | | N/A | | | | 1.30 | %(6) | | | 1.30 | %(6) | |
Ratio of Net Investment Income | | | 1.06 | %(5)(6) | | | 1.47 | %(6)(7) | | | 1.36 | %(6) | | | 0.39 | %(6) | | | 0.30 | %(6) | | | 1.28 | %(6) | |
Ratio of Rebate from Morgan Stanley Affiliates | | | 0.00 | %(5)(8) | | | 0.00 | %(8) | | | 0.00 | %(8) | | | 0.00 | %(8) | | | 0.00 | %(8) | | | 0.00 | %(8) | |
Portfolio Turnover Rate | | | 21 | %(3) | | | 33 | % | | | 38 | % | | | 39 | % | | | 52 | % | | | 36 | % | |
(1) Per share amount is based on average shares outstanding.
(2) Calculated based on the net asset value as of the last business day of the period. Performance does not reflect fees and expenses imposed by your insurance company's separate account. If performance information included the effect of these additional charges, the total return would be lower.
(3) Not annualized.
(4) Reflects prior period transfer agency fees that were reimbursed in 2023. The amount of the reimbursement was immaterial on a per share basis and the impact was less than 0.005% to the total return of Class II shares.
(5) Annualized.
(6) The Ratio of Expenses After Expense Limitation and Ratio of Net Investment Income reflect the rebate of certain Fund expenses in connection with the investments in Morgan Stanley affiliates during the period. The effect of the rebate on the ratios is disclosed in the above table as "Ratio of Rebate from Morgan Stanley Affiliates."
(7) If the Fund had not received the reimbursement of transfer agency fees from the Adviser, the Ratio of Expenses After Expense Limitation and Ratio of Net Investment Income, would have been as follows for Class II shares:
Period Ended | | Expense
Ratio | | Net Investment
Income Ratio | |
December 31, 2023 | | | 1.30 | % | | | 1.46 | % | |
(8) Amount is less than 0.005%.
The accompanying notes are an integral part of the financial statements.
8
Morgan Stanley Variable Insurance Fund, Inc.
June 30, 2024 (unaudited)
Notes to Financial Statements
Morgan Stanley Variable Insurance Fund, Inc. (the "Company") is registered under the Investment Company Act of 1940, as amended (the "Act"), as an open-end management investment company. The Company is comprised of eight separate active, diversified and non-diversified funds (individually referred to as a "Fund," collectively as the "Funds").
The Company applies investment company accounting and reporting guidance Accounting Standards Codification ("ASC") Topic 946. In the preparation of these financial statements, management has evaluated subsequent events occurring after the date of the Fund's Statement of Assets and Liabilities through the date that the financial statements were issued.
The accompanying financial statements relates to the Emerging Markets Equity Portfolio. The Fund seeks long-term capital appreciation by investing primarily in growth-oriented equity securities of issuers in emerging market countries. The Fund has issued two classes of shares — Class I and Class II. Both classes of shares have identical voting rights (except that shareholders of a Class have exclusive voting rights regarding any matter relating solely to that Class of shares), dividend, liquidation and other rights.
The Company is intended to be a funding vehicle for variable annuity contracts and variable life insurance policies offered by the separate accounts of certain life insurance companies.
A. Significant Accounting Policies: The following significant accounting policies are in conformity with U.S. generally accepted accounting principles ("GAAP"). Such policies are consistently followed by the Company in the preparation of its financial statements. GAAP may require management to make estimates and assumptions that affect the reported amounts and disclosures in the financial statements. Actual results may differ from those estimates.
1. Security Valuation: (1) An equity portfolio security listed or traded on an exchange is valued at its latest reported sales price (or at the exchange official closing price if such exchange reports an official closing price), and if there were no sales on a given day and if there is no official exchange closing price for that day, the security is valued at the mean between the last reported bid and asked prices if such bid and asked prices are available on the relevant exchanges. If only bid prices are available then the latest bid price may be used. Listed equity securities not traded on the valuation date with no reported bid and asked prices available on the exchange are valued at the mean between the current bid and asked prices obtained from one or more reputable brokers/dealers. In cases where a security is traded on more than one exchange, the security is valued on the exchange designated as the
primary market; (2) all other equity portfolio securities for which over-the-counter ("OTC") market quotations are readily available are valued at the latest reported sales price (or at the market official closing price if such market reports an official closing price), and if there was no trading in the security on a given day and if there is no official closing price from relevant markets for that day, the security is valued at the mean between the last reported bid and asked prices if such bid and asked prices are available on the relevant markets. An unlisted equity security that does not trade on the valuation date and for which bid and asked prices from the relevant markets are unavailable is valued at the mean between the current bid and asked prices obtained from one or more reputable brokers/dealers; (3) fixed income securities may be valued by an outside pricing service/vendor approved by the Company's Board of Directors (the "Directors"). The pricing service/vendor may employ a pricing model that takes into account, among other things, bids, yield spreads and/or other market data and specific security characteristics. If Morgan Stanley Investment Management Inc. (the "Adviser") or Morgan Stanley Investment Management Company ("MSIM Company") (the "Sub- Adviser"), each a wholly-owned subsidiary of Morgan Stanley, determines that the price provided by the outside pricing service/vendor does not reflect the security's fair value or is unable to provide a price, prices from reputable brokers/dealers may also be utilized. In these circumstances, the value of the security will be the mean of bid and asked prices obtained from reputable brokers/dealers; (4) when market quotations are not readily available, as defined by Rule 2a-5 under the Act, including circumstances under which the Adviser or the Sub-Adviser determines that the closing price, last sale price or the mean between the last reported bid and asked prices are not reflective of a security's market value, portfolio securities are valued at their fair value as determined in good faith under procedures approved by and under the general supervision of the Directors. Each business day, the Fund uses a third-party pricing service approved by the Directors to assist with the valuation of foreign equity securities. Events occurring after the close of trading on foreign exchanges may result in adjustments to the valuation of foreign securities to reflect market trading that occurs after the close of the applicable foreign markets of comparable securities or other instruments that have a strong correlation to the fair-valued securities to more accurately reflect their fair value as of the close of regular trading on the NYSE; (5) foreign exchange transactions ("spot contracts") and foreign exchange forward contracts ("forward contracts") are valued
9
Morgan Stanley Variable Insurance Fund, Inc.
June 30, 2024 (unaudited)
Notes to Financial Statements (cont'd)
daily using an independent pricing vendor at the spot and forward rates, respectively, as of the close of the NYSE; and (6) investments in mutual funds, including the Morgan Stanley Institutional Liquidity Funds, are valued at the net asset value ("NAV") as of the close of each business day.
In connection with Rule 2a-5 of the Act, the Directors have designated the Company's Adviser as its valuation designee. The valuation designee has responsibility for determining fair value and to make the actual calculations pursuant to the fair valuation methodologies previously approved by the Directors. Under procedures approved by the Directors, the Company's Adviser, as valuation designee, has formed a Valuation Committee whose members are approved by the Directors. The Valuation Committee provides administration and oversight of the Company's valuation policies and procedures, which are reviewed at least annually by the Directors. These procedures allow the Company to utilize independent pricing services, quotations from securities and financial instrument dealers and other market sources to determine fair value.
2. Fair Value Measurement: Financial Accounting Standards Board ("FASB") ASC 820, "Fair Value Measurement" ("ASC 820"), defines fair value as the price that would be received to sell an asset or pay to transfer a liability in an orderly transaction between market participants at the measurement date. ASC 820 establishes a three-tier hierarchy to distinguish between (1) inputs that reflect the assumptions market participants would use in valuing an asset or liability developed based on market data obtained from sources independent of the reporting entity (observable inputs); and (2) inputs that reflect the reporting entity's own assumptions about the assumptions market participants would use in valuing an asset or liability developed based on the best information available in the circumstances (unobservable inputs) and to establish classification of fair value measurements for disclosure purposes. Various inputs are used in determining the value of the Fund's investments. The inputs are summarized in the three broad levels listed below:
• Level 1 – unadjusted quoted prices in active markets for identical investments
• Level 2 – other significant observable inputs (including quoted prices for similar investments, interest rates, prepayment speeds, credit risk, etc.)
• Level 3 – significant unobservable inputs including the Fund's own assumptions in determining the fair value of investments. Factors considered in making
this determination may include, but are not limited to, information obtained by contacting the issuer, analysts, or the appropriate stock exchange (for exchange-traded securities), analysis of the issuer's financial statements or other available documents and, if necessary, available information concerning other securities in similar circumstances.
The inputs or methodology used for valuing securities are not necessarily an indication of the risk associated with investing in those securities and the determination of the significance of a particular input to the fair value measurement in its entirety requires judgment and considers factors specific to each security.
The following is a summary of the inputs used to value the Fund's investments as of June 30, 2024:
Investment Type | | Level 1
Unadjusted
quoted
prices
(000) | | Level 2
Other
significant
observable
inputs
(000) | | Level 3
Significant
unobservable
inputs
(000) | | Total
(000) | |
Assets: | |
Common Stocks | |
Air Freight & Logistics | | $ | — | | | $ | 873 | | | $ | — | | | $ | 873 | | |
Automobiles | | | — | | | | 11,863 | | | | — | | | | 11,863 | | |
Banks | | | 4,724 | | | | 29,330 | | | | — | | | | 34,054 | | |
Beverages | | | — | | | | 2,850 | | | | — | | | | 2,850 | | |
Broadline Retail | | | — | | | | 6,346 | | | | — | | | | 6,346 | | |
Capital Markets | | | — | | | | 1,449 | | | | — | | | | 1,449 | | |
Chemicals | | | — | | | | 1,415 | | | | — | | | | 1,415 | | |
Construction &
Engineering | | | — | | | | 1,688 | | | | — | | | | 1,688 | | |
Consumer Finance | | | — | | | | 1,481 | | | | — | | | | 1,481 | | |
Consumer Staples
Distribution & Retail | | | 3,221 | | | | 328 | | | | — | | | | 3,549 | | |
Electrical Equipment | | | 3,003 | | | | 3,235 | | | | — | | | | 6,238 | | |
Electronic Equipment,
Instruments &
Components | | | — | | | | 7,143 | | | | — | | | | 7,143 | | |
Entertainment | | | — | | | | 1,434 | | | | — | | | | 1,434 | | |
Financial Services | | | — | | | | 557 | | | | — | | | | 557 | | |
Food Products | | | 2,461 | | | | 2,590 | | | | — | | | | 5,051 | | |
Ground Transportation | | | 1,791 | | | | — | | | | — | | | | 1,791 | | |
Health Care Providers &
Services | | | — | | | | 1,472 | | | | — | | | | 1,472 | | |
Hotels, Restaurants &
Leisure | | | 3,028 | | | | 1,914 | | | | — | | | | 4,942 | | |
Information Technology
Services | | | 633 | | | | 2,350 | | | | — | | | | 2,983 | | |
Insurance | | | 1,853 | | | | 6,178 | | | | — | | | | 8,031 | | |
Interactive Media &
Services | | | 418 | | | | 7,911 | | | | — | | | | 8,329 | | |
Machinery | | | — | | | | 1,785 | | | | — | | | | 1,785 | | |
Metals & Mining | | | 1,121 | | | | 6,856 | | | | — | | | | 7,977 | | |
10
Morgan Stanley Variable Insurance Fund, Inc.
June 30, 2024 (unaudited)
Notes to Financial Statements (cont'd)
Investment Type | | Level 1
Unadjusted
quoted
prices
(000) | | Level 2
Other
significant
observable
inputs
(000) | | Level 3
Significant
unobservable
inputs
(000) | | Total
(000) | |
Common Stocks (cont'd) | |
Oil, Gas & Consumable
Fuels | | $ | — | | | $ | 4,264 | | | $ | — | | | $ | 4,264 | | |
Personal Care Products | | | — | | | | 891 | | | | — | | | | 891 | | |
Pharmaceuticals | | | — | | | | 773 | | | | — | | | | 773 | | |
Real Estate
Management &
Development | | | 322 | | | | 1,764 | | | | — | | | | 2,086 | | |
Semiconductors &
Semiconductor
Equipment | | | — | | | | 25,845 | | | | — | | | | 25,845 | | |
Tech Hardware,
Storage &
Peripherals | | | — | | | | 9,498 | | | | — | | | | 9,498 | | |
Textiles, Apparel &
Luxury Goods | | | — | | | | 1,369 | | | | — | | | | 1,369 | | |
Total Common Stocks | | | 22,575 | | | | 145,452 | | | | — | | | | 168,027 | | |
Rights | | | 4 | | | | — | | | | — | | | | 4 | | |
Short-Term Investments | |
Investment Company | | | 1,939 | | | | — | | | | — | | | | 1,939 | | |
Total Assets | | $ | 24,518 | | | $ | 145,452 | | | $ | — | | | $ | 169,970 | | |
Transfers between investment levels may occur as the markets fluctuate and/or the availability of data used in an investment's valuation changes.
3. Foreign Currency Translation and Foreign Investments: The books and records of the Fund are maintained in U.S. dollars. Foreign currency amounts are translated into U.S. dollars as follows:
— investments, other assets and liabilities at the prevailing rate of exchange on the valuation date;
— investment transactions and investment income at the prevailing rates of exchange on the dates of such transactions.
Although the net assets of the Fund are presented at the foreign exchange rates and market values at the close of the period, the Fund does not isolate that portion of the results of operations arising as a result of changes in the foreign exchange rates from the fluctuations arising from changes in the market prices of securities held at period end. Similarly, the Fund does not isolate the effect of changes in foreign exchange rates from the fluctuations arising from changes in the market prices of securities sold during the period. Accordingly, realized and unrealized foreign currency gains (losses) on investments in securities are included in the reported net realized and unrealized gains (losses) on investment transactions and balances. However, pursuant to U.S. federal income tax
regulations, gains and losses from certain foreign currency transactions and the foreign currency portion of gains and losses realized on sales and maturities of foreign denominated debt securities are treated as ordinary income for U.S. federal income tax purposes.
Net realized gains (losses) on foreign currency transactions represent net foreign exchange gains (losses) from foreign currency forward exchange contracts, disposition of foreign currencies, currency gains (losses) realized between the trade and settlement dates on securities transactions, and the difference between the amount of investment income and foreign withholding taxes recorded on the Fund's books and the U.S. dollar equivalent amounts actually received or paid. The change in unrealized currency gains (losses) on foreign currency transactions for the period is reflected in the Statement of Operations.
Foreign security and currency transactions may involve certain considerations and risks not typically associated with those of U.S. dollar denominated transactions as a result of, among other factors, fluctuations of exchange rates in relation to the U.S. dollar, the possibility of lower levels of governmental supervision and regulation of foreign securities markets and the possibility of political or economic instability.
Governmental approval for foreign investments may be required in advance of making an investment under certain circumstances in some countries, and the extent of foreign investments in U.S. companies may be subject to limitation in other countries. Foreign ownership limitations also may be imposed by the charters of individual companies to prevent, among other concerns, violations of foreign investment limitations. As a result, an additional class of shares (identified as "Foreign" in the Portfolio of Investments) may be created and offered for investment. The "local" and "foreign shares" market values may differ. In the absence of trading of the foreign shares in such markets, the Fund values the foreign shares at the closing exchange price of the local shares.
4. Securities Lending: The Fund lends securities to qualified financial institutions, such as broker/dealers, to earn additional income. Any increase or decrease in the fair value of the securities loaned that might occur and any interest earned or dividends declared on those securities during the term of the loan would remain in the Fund. The Fund would receive cash or securities as collateral in an amount equal to or exceeding 100% of the current fair value of the loaned securities. The collateral is marked-to-market daily by State Street Bank and Trust
11
Morgan Stanley Variable Insurance Fund, Inc.
June 30, 2024 (unaudited)
Notes to Financial Statements (cont'd)
Company ("State Street"), the securities lending agent, to ensure that a minimum of 100% collateral coverage is maintained.
Based on pre-established guidelines, the securities lending agent invests any cash collateral that is received in an affiliated money market portfolio and repurchase agreements. Securities lending income is generated from the earnings on the invested collateral and borrowing fees, less any rebates owed to the borrowers and compensation to the lending agent, and is recorded as "Income from Securities Loaned — Net" in the Fund's Statement of Operations. Risks in securities lending transactions are that a borrower may not provide additional collateral when required or return the securities when due, and that the value of the short-term investments will be less than the amount of cash collateral plus any rebate that is required to be returned to the borrower.
The Fund has the right under the securities lending agreement to recover the securities from the borrower on demand.
The following table presents financial instruments that are subject to enforceable netting arrangements as of June 30, 2024:
Gross Amount Not Offset in the Statement of Assets and Liabilities | |
Gross Asset
Amount
Presented in the
Statement of
Assets and
Liabilities
(000) | | Financial
Instrument
(000) | | Collateral
Received
(000) | | Net Amount
(not less
than $0)
(000) | |
| $ | 633 | (a) | | $ | — | | | $ | (633 | )(b)(c) | | $ | 0 | | |
(a) Represents market value of loaned securities at period end.
(b) The Fund received cash collateral of approximately $654,000, which was subsequently invested in Morgan Stanley Institutional Liquidity Funds as reported in the Portfolio of Investments.
(c) The actual collateral received is greater than the amount shown here due to overcollateralization.
FASB ASC 860, "Transfers & Servicing: Repurchase-to-Maturity Transactions, Repurchase Financings, and Disclosures", is intended to provide increased transparency about the types of collateral pledged in securities lending transactions and other similar transactions that are accounted for as secured borrowings.
The following table displays a breakdown of transactions accounted for as secured borrowings, the gross obligations by class of collateral pledged and the remaining
contractual maturity of those transactions as of June 30, 2024:
Remaining Contractual Maturity of the Agreements | |
| | | Overnight and
Continuous
(000) | | <30 days
(000) | | Between
30 &
90 days
(000) | | >90 Days
(000) | | Total
(000) | |
Securities Lending
Transactions | |
Common Stocks | | $ | 654 | | | $ | — | | | $ | — | | | $ | — | | | $ | 654 | | |
Total Borrowings | | $ | 654 | | | $ | — | | | $ | — | | | $ | — | | | $ | 654 | | |
Gross amount of
recognized liabilities
for securities lending
transactions | | $ | 654 | | |
5. Indemnifications: The Company enters into contracts that contain a variety of indemnification clauses. The Company's maximum exposure under these arrangements is unknown as this would involve future claims that may be made against the Fund that have not yet occurred.
6. Security Transactions, Income and Expenses: Security transactions are accounted for on the trade date (date the order to buy or sell is executed). Realized gains and losses on the sale of investment securities are determined on the specific identified cost method. Dividend income and other distributions are recorded on the ex-dividend date (except for certain foreign dividends which may be recorded as soon as the Fund is informed of such dividends) net of applicable withholding taxes. Non-cash dividends received in the form of stock, if any, are recognized on the ex-dividend date and recorded as non-cash dividend income at fair value. Interest income is recognized on the accrual basis (except where collection is in doubt) net of applicable withholding taxes. Discounts are accreted and premiums are amortized over the life of the respective securities. Most expenses of the Company can be directly attributed to a particular Fund. Expenses which cannot be directly attributed are apportioned among the Funds based upon relative net assets or other appropriate methods. Income, expenses (other than class specific expenses) and realized and unrealized gains or losses are allocated to each class of shares based upon their relative net assets.
Settlement and registration of foreign securities transactions may be subject to significant risks not normally associated with investments in the United States. In certain markets, ownership of shares is defined according to entries in the issuer's share register. It is possible that a Fund holding these securities could lose its share registration
12
Morgan Stanley Variable Insurance Fund, Inc.
June 30, 2024 (unaudited)
Notes to Financial Statements (cont'd)
through fraud, negligence or even mere oversight. In addition, shares being delivered for sales and cash being paid for purchases may be delivered before the exchange is complete. This may subject the Fund to further risk of loss in the event of a failure to complete the transaction by the counterparty.
7. Dividends and Distributions to Shareholders: Dividends and distributions to shareholders are recorded on the ex-dividend date. Dividends from net investment income, if any, are declared and paid annually. Net realized capital gains, if any, are distributed at least annually.
B. Advisory/Sub-Advisory Fees: The Adviser, a wholly-owned subsidiary of Morgan Stanley, provides the Fund with advisory services under the terms of an Investment Advisory Agreement, paid quarterly, at the annual rate based on the daily net assets as follows:
First $1
billion | | Next $1.5
billion | | Over $2.5
billion | |
| | 0.75 | % | | | 0.70 | % | | | 0.65 | % | |
For the six months ended June 30, 2024, the advisory fee rate (net of waiver/rebate) was equivalent to an annual effective rate of 0.75% of the Fund's average daily net assets.
The Adviser has agreed to reduce its advisory fee and/or reimburse the Fund so that total annual Fund operating expenses, excluding certain investment related expenses, taxes, interest and other extraordinary expenses (including litigation), will not exceed 1.25% for Class I shares and 1.30% for Class II shares. The fee waivers and/or expense reimbursements will continue for at least one year from the date of the Fund's prospectus or until such time as the Directors act to discontinue all or a portion of such waivers and/or reimbursements when they deem such action is appropriate. This arrangement had no effect for the six months ended June 30, 2024.
The Adviser has entered into a Sub-Advisory Agreement with the Sub-Adviser, a wholly-owned subsidiary of Morgan Stanley. The Sub-Adviser provides the Fund with advisory services subject to the overall supervision of the Adviser and the Fund's Officers and Directors. The Adviser pays the Sub-Adviser on a monthly basis a portion of the net advisory fees the Adviser receives from the Fund.
C. Administration Fees: The Adviser also serves as Administrator to the Company and provides administrative services pursuant to an Administration Agreement for an annual fee, accrued daily and paid monthly, of 0.08% of the Fund's average daily net assets.
Under a Sub-Administration Agreement between the Administrator and State Street, State Street provides certain administrative services to the Company. For such services, the
Administrator pays State Street a portion of the fee the Administrator receives from the Fund.
D. Servicing Fees: The Company accrues daily and pays quarterly a servicing fee of up to 0.17% of the average daily value of shares of the Fund held in an insurance company's account. Certain insurance companies have entered into a servicing agreement with the Company to provide administrative and other contract-owner related services on behalf of the Fund.
E. Distribution Fees: Morgan Stanley Distribution, Inc. ("MSDI" or the "Distributor"), a wholly-owned subsidiary of the Adviser and an indirect subsidiary of Morgan Stanley, serves as the Distributor of the Fund and provides the Fund's Class II shareholders with distribution services pursuant to a Distribution Plan (the "Plan") in accordance with Rule 12b-1 under the Act. Under the Plan, the Fund is authorized to pay the Distributor a distribution fee, which is accrued daily and paid monthly, at an annual rate of 0.25% of the Fund's average daily net assets attributable to Class II shares. The Distributor has agreed to waive 0.20% of the 0.25% distribution fee that it may receive. This fee waiver will continue for at least one year from the date of the Fund's prospectus or until such time as the Directors act to discontinue all or a portion of such waiver when they deem such action is appropriate. For the six months ended June 30, 2024, this waiver amounted to approximately $49,000.
F. Dividend Disbursing and Transfer/Co-Transfer Agent: The Company's dividend disbursing and transfer agent is SS&C Global Investor & Distribution Solutions, Inc. ("SS&C GIDS"). Pursuant to a Transfer Agency Agreement, the Company pays SS&C GIDS a fee based on the number of classes, accounts and transactions relating to the Funds of the Company.
Eaton Vance Management ("EVM"), an affiliate of Morgan Stanley, provides co-transfer agency and related services to the Fund pursuant to a Co-Transfer Agency Services Agreement. For the six months ended June 30, 2024, co-transfer agency fees and expenses incurred to EVM, included in "Transfer Agency Fees" in the Statement of Operations, amounted to less than $500.
G. Custodian Fees: State Street (the "Custodian") also serves as Custodian for the Company in accordance with a Custodian Agreement. The Custodian holds cash, securities and other assets of the Company as required by the Act. Custody fees are payable monthly based on assets held in custody, investment purchases and sales activity and account
13
Morgan Stanley Variable Insurance Fund, Inc.
June 30, 2024 (unaudited)
Notes to Financial Statements (cont'd)
maintenance fees, plus reimbursement for certain out-of-pocket expenses.
H. Security Transactions and Transactions with Affiliates: For the six months ended June 30, 2024, purchases and sales of investment securities for the Fund, other than long-term U.S. Government securities and short-term investments were approximately $33,267,000 and $42,836,000, respectively. There were no purchases and sales of long-term U.S. Government securities for the six months ended June 30, 2024.
The Fund invests in the Institutional Class of the Morgan Stanley Institutional Liquidity Funds — Government Portfolio (the "Liquidity Fund"), an open-end management investment company managed by the Adviser, both directly and as a portion of the securities held as collateral on loaned securities. Advisory fees paid by the Fund are reduced by an amount equal to its pro-rata share of the advisory and administration fees paid by the Fund due to its investment in the Liquidity Fund. For the six months ended June 30, 2024, advisory fees paid were reduced by approximately $2,000 relating to the Fund's investment in the Liquidity Fund.
A summary of the Fund's transactions in shares of affiliated investments during the six months ended June 30, 2024 is as follows:
Affiliated
Investment
Company | | Value
December 31,
2023
(000) | | Purchases
at Cost
(000) | | Proceeds
from Sales
(000) | | Dividend
Income
(000) | |
Liquidity Fund | | $ | 1,890 | | | $ | 20,072 | | | $ | 20,023 | | | $ | 52 | | |
Affiliated
Investment
Company (cont'd) | | Realized
Gain (Loss)
(000) | | Change in
Unrealized
Appreciation
(Depreciation)
(000) | | Value
June 30,
2024
(000) | |
Liquidity Fund | | $ | — | | | $ | — | | | $ | 1,939 | | |
The Fund is permitted to purchase and sell securities ("cross-trade") from and to other Morgan Stanley funds as well as other funds and client accounts for which the Adviser or an affiliate of the Adviser serves as investment adviser, pursuant to procedures approved by the Directors in compliance with Rule 17a-7 under the Act (the "Rule"). Each cross-trade is executed at the current market price in compliance with provisions of the Rule. For the six months ended June 30, 2024, the Fund did not engage in any cross-trade transactions.
Each Director receives an annual retainer fee for serving as a Director of the Morgan Stanley Funds. The aggregate compensation paid to each Director is paid by the Morgan Stanley
Funds, and is allocated on a pro rata basis among each of the operational funds of the Morgan Stanley Funds based on the relative net assets of each of the funds. The Company also reimburses such Directors for travel and other out-of-pocket expenses incurred by them in connection with attending such meetings.
The Fund has an unfunded Deferred Compensation Plan (the "Compensation Plan"), which allows each independent Director to defer payment of all, or a portion, of the fees he or she receives for serving on the Board of Directors. Each eligible Director generally may elect to have the deferred amounts credited with a return equal to the total return on one or more of the Morgan Stanley funds that are offered as investment options under the Compensation Plan. Appreciation/depreciation and distributions received from these investments are recorded with an offsetting increase/decrease in the deferred compensation obligation and do not affect the NAV of the Fund.
I. Federal Income Taxes: It is the Fund's intention to continue to qualify as a regulated investment company and distribute all of its taxable and tax-exempt income. Accordingly, no provision for federal income taxes is required in the financial statements.
The Fund may be subject to taxes imposed by countries in which it invests. Such taxes are generally based on income and/or capital gains earned or repatriated. Taxes are accrued based on net investment income, net realized gains and net unrealized appreciation as such income and/or gains are earned. Taxes may also be based on transactions in foreign currency and are accrued based on the value of investments denominated in such currency.
FASB ASC 740-10, "Income Taxes — Overall", sets forth a minimum threshold for financial statement recognition of the benefit of a tax position taken or expected to be taken in a tax return. Management has concluded that there are no significant uncertain tax positions that would require recognition in the financial statements. If applicable, the Fund recognizes interest accrued related to unrecognized tax benefits in "Interest Expense" and penalties in "Other Expenses" in the Statement of Operations. The Fund files tax returns with the U.S. Internal Revenue Service, New York and various states. Generally, each of the tax years in the four-year period ended December 31, 2023 remains subject to examination by taxing authorities.
The tax character of distributions paid may differ from the character of distributions shown for GAAP purposes due to short-term capital gains being treated as ordinary income for
14
Morgan Stanley Variable Insurance Fund, Inc.
June 30, 2024 (unaudited)
Notes to Financial Statements (cont'd)
tax purposes. The tax character of distributions paid during fiscal years 2023 and 2022 was as follows:
2023 Distributions
Paid From: | | 2022 Distributions
Paid From: | |
Ordinary
Income
(000) | | Long-Term
Capital Gain
(000) | | Ordinary
Income
(000) | | Long-Term
Capital Gain
(000) | |
| $ | 2,595 | | | $ | 2,837 | | | $ | 731 | | | $ | 18,524 | | |
The amount and character of income and gains to be distributed are determined in accordance with income tax regulations which may differ from GAAP. These book/tax differences are either considered temporary or permanent in nature.
Temporary differences are attributable to differing book and tax treatments for the timing of the recognition of gains (losses) on certain investment transactions and the timing of the deductibility of certain expenses.
The Fund had no permanent differences causing reclassifications among the components of net assets for the year ended December 31, 2023.
At December 31, 2023, the components of distributable earnings for the Fund on a tax basis were as follows:
Undistributed
Ordinary
Income
(000) | | Undistributed
Long-Term
Capital Gain
(000) | |
| $ | 2,175 | | | $ | — | | |
At December 31, 2023, the Fund had available for federal income tax purposes unused short-term and long-term capital losses of approximately $307,000 and $3,194,000, respectively,that do not have an expiration date.
To the extent that capital loss carryforwards are used to offset any future capital gains realized, no capital gains tax liability will be incurred by the Fund for gains realized and not distributed. To the extent that capital gains are offset, such gains will not be distributed to the shareholders.
J. Credit Facility: The Company and other Morgan Stanley funds participated in a $500,000,000 committed, unsecured revolving line of credit facility (the "Facility") with State Street. This Facility is to be used for temporary emergency purposes or funding of shareholder redemption requests. The interest rate for any funds drawn will be based on the federal funds rate or overnight bank funding rate plus a spread. The Facility also has a commitment fee of 0.25% per annum based on the unused portion of the Facility, which is allocated among participating funds based on relative net assets. During the six months ended June 30, 2024, the Fund did not have any borrowings under the Facility.
K. Other: At June 30, 2024, the Fund had record owners of 10% or greater. Investment activities of these shareholders could have a material impact on the Fund. The aggregate percentage of such owners was 66.7%.
L. Market Risk: The value of an investment in the Fund is based on the values of the Fund's investments, which change due to economic and other events that affect markets generally, as well as those that affect particular regions, countries, industries, companies or governments. The risks associated with these developments may be magnified if certain social, political, economic and other conditions and events adversely interrupt the global economy and financial markets. Securities in the Fund's portfolio may underperform due to inflation (or expectations for inflation), interest rates, global demand for particular products or resources, natural disasters and extreme weather events, health emergencies (such as epidemics and pandemics), terrorism, regulatory events and governmental or quasi-governmental actions. The occurrence of global events similar to those in recent years, such as terrorist attacks around the world, natural disasters, health emergencies, social and political (including geopolitical) discord and tensions or debt crises and downgrades, among others, may result in market volatility and may have long term effects on both the U.S. and global financial markets. The occurrence of such events may be sudden and unexpected, and it is difficult to predict when similar events affecting the U.S. or global financial markets may occur, the effects that such events may have and the duration of those effects (which may last for extended periods). Any such event(s) could have a significant adverse impact on the value, liquidity and risk profile of the Fund's portfolio, as well as its ability to sell securities and/or meet redemptions. Any such event(s) or similar types of factors and developments may also adversely affect the financial performance of the Fund's investments (and, in turn, the Fund's investment results) and/or negatively impact broad segments of businesses and populations and have a significant and rapid negative impact on the performance of the Fund's investments, and exacerbate preexisting risks to the Fund.
15
Morgan Stanley Variable Insurance Fund, Inc.
June 30, 2024 (unaudited)
Investment Advisory Agreement Approval
Nature, Extent and Quality of Services
The Board reviewed and considered the nature and extent of the investment advisory services provided by the Adviser under the advisory agreement, including portfolio management, investment research and equity and fixed income securities trading. The Board reviewed similar information and factors regarding the Sub-Adviser, to the extent applicable. The Board also reviewed and considered the nature and extent of the non-advisory, administrative services provided by the Administrator under the administration agreement, including accounting, operations, clerical, bookkeeping, compliance, business management and planning, legal services and the provision of supplies, office space and utilities at the Adviser's expense. The Board also considered the Adviser's investment in personnel and infrastructure that benefits the Fund. (The Adviser, Sub-Adviser and Administrator together are referred to as the "Adviser" and the advisory, sub-advisory and administration agreements together are referred to as the "Management Agreement.") The Board also considered that the Adviser serves a variety of other investment advisory clients and has experience overseeing service providers. The Board also compared the nature of the services provided by the Adviser with similar services provided by non-affiliated advisers as prepared by Broadridge Financial Solutions, Inc. ("Broadridge").
The Board reviewed and considered the qualifications of the portfolio managers, the senior administrative managers and other key personnel of the Adviser who provide the advisory and administrative services to the Fund. The Board determined that the Adviser's portfolio managers and key personnel are well qualified by education and/or training and experience to perform the services in an efficient and professional manner. The Board concluded that the nature and extent of the advisory and administrative services provided were necessary and appropriate for the conduct of the business and investment activities of the Fund and supported its decision to approve the Management Agreement.
Performance, Fees and Expenses of the Fund
The Board reviewed the performance, fees and expenses of the Fund compared to its peers, as prepared by Broadridge, and to appropriate benchmarks where applicable. The Board discussed with the Adviser the performance goals and the actual results achieved in managing the Fund. When considering a fund's performance, the Board and the Adviser place emphasis on trends and longer-term returns (focusing on one-year, three-year and five-year performance, as of December 31, 2023, or since inception, as applicable). When a fund underperforms its benchmark and/or its peer group average, the Board and the Adviser discuss the causes of such underperformance and, where necessary, they discuss specific changes to investment strategy or investment personnel. The Board noted that the Fund's performance was better than its peer group average for the one- and three-year periods but below its peer group average for the five-year period. The Board discussed with the Adviser the level of the advisory and administration fees (together, the "management fee") for this Fund relative to comparable funds and/or other accounts advised by the Adviser and/or compared to its peers as prepared by Broadridge. In addition to the management fee, the Board also reviewed the Fund's total expense ratio. The Board noted that the Fund's management fee and total expense ratio were lower than its peer group averages. After discussion, the Board concluded that the Fund's performance, management fee and total expense ratio were competitive with its peer group averages.
Economies of Scale
The Board considered the size and growth prospects of the Fund and how that relates to the Fund's total expense ratio and particularly the Fund's management fee rate, which includes breakpoints. In conjunction with its review of the Adviser's profitability, the Board discussed with the Adviser how a change in assets can affect the efficiency or effectiveness of managing the Fund and whether the management fee level is appropriate relative to current and projected asset levels and/or whether the management fee structure reflects economies of scale as asset levels change. The Board has determined that its review of the actual and/or potential economies of scale of the Fund supports its decision to approve the Management Agreement.
Profitability of the Adviser and Affiliates
The Board considered information concerning the costs incurred and profits realized by the Adviser and its affiliates during the last year from their relationship with the Fund and during the last two years from their relationship with the Morgan Stanley Fund Complex and reviewed with the Adviser the cost allocation methodology used to determine the profitability of the Adviser and affiliates. The Board has determined that its review of the analysis of the Adviser's expenses and profitability supports its decision to approve the Management Agreement.
16
Morgan Stanley Variable Insurance Fund, Inc.
June 30, 2024 (unaudited)
Investment Advisory Agreement Approval (cont'd)
Other Benefits of the Relationship
The Board considered other direct and indirect benefits to the Adviser and/or its affiliates derived from their relationship with the Fund and other funds advised by the Adviser. These benefits may include, among other things, fees for trading, distribution and/or shareholder servicing and for transaction processing and reporting platforms used by securities lending agents, and research received by the Adviser generated from commission dollars spent on funds' portfolio trading. The Board reviewed with the Adviser these arrangements and the reasonableness of the Adviser's costs relative to the services performed. The Board has determined that its review of the other benefits received by the Adviser or its affiliates supports its decision to approve the Management Agreement.
Resources of the Adviser and Historical Relationship Between the Fund and the Adviser
The Board considered whether the Adviser is financially sound and has the resources necessary to perform its obligations under the Management Agreement. The Board also reviewed and considered the historical relationship between the Fund and the Adviser, including the organizational structure of the Adviser, the policies and procedures formulated and adopted by the Adviser for managing the Fund's operations and the Board's confidence in the competence and integrity of the senior managers and key personnel of the Adviser. The Board concluded that the Adviser has the financial resources necessary to fulfill its obligations under the Management Agreement and that it is beneficial for the Fund to continue its relationship with the Adviser.
Other Factors and Current Trends
The Board considered the controls and procedures adopted and implemented by the Adviser and monitored by the Fund's Chief Compliance Officer and concluded that the conduct of business by the Adviser indicates a good faith effort on its part to adhere to high ethical standards in the conduct of the Fund's business.
General Conclusion
After considering and weighing all of the above factors, with various written materials and verbal information presented by the Adviser, the Board concluded that it would be in the best interest of the Fund and its shareholders to approve renewal of the Management Agreement for another year. In reaching this conclusion the Board did not give particular weight to any single piece of information or factor referenced above. The Board considered these factors and information over the course of the year and in numerous meetings, some of which were in executive session with only the independent Board members and their counsel present. It is possible that individual Board members may have weighed these factors, and the information presented, differently in reaching their individual decisions to approve the Management Agreement.
17
Morgan Stanley Variable Insurance Fund, Inc.
June 30, 2024 (unaudited)
This report is not authorized for distribution to prospective investors in the Fund unless preceded or accompanied by an effective Prospectus. Read the Prospectus carefully before investing.

Morgan Stanley Variable Insurance Fund, Inc.
Semi-Annual Financial Statements and Additional Information
June 30, 2024 (unaudited)
Global Real Estate Portfolio
The Fund is intended to be a funding vehicle for variable annuity contracts and variable life insurance policies offered by the separate accounts of certain life insurance companies.
Morgan Stanley Variable Insurance Fund, Inc.
June 30, 2024 (unaudited)
1
Morgan Stanley Variable Insurance Fund, Inc.
June 30, 2024 (unaudited)
Portfolio of Investments
Global Real Estate Portfolio
| | | Shares | | Value
(000) | |
Common Stocks (99.1%) | |
Australia (6.0%) | |
Goodman Group REIT | | | 51,046 | | | $ | 1,178 | | |
National Storage REIT | | | 121,699 | | | | 186 | | |
Region Group REIT | | | 178,349 | | | | 249 | | |
Stockland REIT | | | 123,735 | | | | 343 | | |
| | | | 1,956 | | |
Belgium (1.0%) | |
Montea NV REIT | | | 2,795 | | | | 237 | | |
Shurgard Self Storage Ltd. REIT | | | 2,411 | | | | 93 | | |
| | | | 330 | | |
Canada (2.8%) | |
Boardwalk REIT | | | 5,826 | | | | 300 | | |
Chartwell Retirement Residences (Units) (a) | | | 38,317 | | | | 360 | | |
InterRent REIT | | | 29,439 | | | | 256 | | |
| | | | 916 | | |
France (2.1%) | |
Carmila SA REIT | | | 10,520 | | | | 177 | | |
Klepierre SA REIT | | | 4,641 | | | | 124 | | |
Unibail-Rodamco-Westfield REIT | | | 4,800 | | | | 379 | | |
| | | | 680 | | |
Germany (2.2%) | |
LEG Immobilien SE | | | 3,856 | | | | 315 | | |
Vonovia SE | | | 14,844 | | | | 422 | | |
| | | | 737 | | |
Hong Kong (1.6%) | |
Link REIT | | | 38,127 | | | | 148 | | |
Sun Hung Kai Properties Ltd. | | | 29,393 | | | | 255 | | |
Wharf Real Estate Investment Co. Ltd. | | | 43,420 | | | | 115 | | |
| | | | 518 | | |
Japan (9.9%) | |
Comforia Residential, Inc. REIT | | | 101 | | | | 200 | | |
Heiwa Real Estate, Inc. REIT | | | 144 | | | | 118 | | |
Hulic Co. Ltd. (c) | | | 15,000 | | | | 133 | | |
Invincible Investment Corp. REIT | | | 1,056 | | | | 429 | | |
Japan Hotel REIT Investment Corp. | | | 784 | | | | 378 | | |
Japan Metropolitan Fund Invest REIT | | | 176 | | | | 99 | | |
Mitsubishi Estate Co. Ltd. | | | 8,000 | | | | 126 | | |
Mitsui Fudosan Co. Ltd. | | | 76,400 | | | | 703 | | |
Mitsui Fudosan Logistics Park, Inc. REIT | | | 44 | | | | 119 | | |
Nippon Building Fund, Inc. REIT (c) | | | 71 | | | | 249 | | |
Nippon Prologis, Inc. REIT | | | 92 | | | | 144 | | |
Star Asia Investment Corp. REIT | | | 311 | | | | 116 | | |
Sumitomo Realty & Development Co. Ltd. | | | 15,000 | | | | 443 | | |
| | | | 3,257 | | |
Netherlands (0.6%) | |
CTP NV | | | 12,397 | | | | 212 | | |
| | | Shares | | Value
(000) | |
Singapore (1.6%) | |
CapitaLand Integrated Commercial Trust REIT | | | 139,019 | | | $ | 202 | | |
Frasers Centrepoint Trust REIT | | | 139,500 | | | | 219 | | |
Mapletree Industrial Trust REIT | | | 69,000 | | | | 107 | | |
| | | | 528 | | |
Spain (0.7%) | |
Merlin Properties Socimi SA REIT | | | 20,893 | | | | 233 | | |
Sweden (1.4%) | |
Castellum AB (b) | | | 22,251 | | | | 272 | | |
Pandox AB | | | 9,655 | | | | 172 | | |
| | | | 444 | | |
Switzerland (0.4%) | |
PSP Swiss Property AG (Registered) | | | 988 | | | | 127 | | |
United Kingdom (4.6%) | |
Derwent London PLC REIT | | | 6,031 | | | | 172 | | |
Hammerson PLC REIT | | | 302,522 | | | | 106 | | |
Impact Healthcare PLC REIT | | | 97,094 | | | | 105 | | |
LondonMetric Property PLC REIT | | | 69,565 | | | | 170 | | |
Segro PLC REIT | | | 40,546 | | | | 459 | | |
Sirius Real Estate Ltd. REIT | | | 123,692 | | | | 146 | | |
UNITE Group PLC REIT | | | 13,043 | | | | 147 | | |
Workspace Group PLC REIT | | | 29,613 | | | | 222 | | |
| | | | 1,527 | | |
United States (64.2%) | |
Agree Realty Corp. REIT | | | 7,066 | | | | 438 | | |
Alexandria Real Estate Equities, Inc. REIT | | | 4,783 | | | | 559 | | |
American Homes 4 Rent, Class A REIT | | | 22,761 | | | | 846 | | |
Americold Realty Trust, Inc. REIT | | | 10,335 | | | | 264 | | |
AvalonBay Communities, Inc. REIT | | | 7,427 | | | | 1,537 | | |
Boston Properties, Inc. REIT | | | 5,355 | | | | 330 | | |
CareTrust REIT, Inc. | | | 18,983 | | | | 476 | | |
Digital Realty Trust, Inc. REIT | | | 8,471 | | | | 1,288 | | |
EastGroup Properties, Inc. REIT | | | 2,093 | | | | 356 | | |
Equinix, Inc. REIT | | | 2,359 | | | | 1,785 | | |
Essential Properties Realty Trust, Inc. REIT | | | 8,470 | | | | 235 | | |
Essex Property Trust, Inc. REIT | | | 2,615 | | | | 712 | | |
Extra Space Storage, Inc. REIT | | | 5,728 | | | | 890 | | |
Federal Realty Investment Trust REIT | | | 4,240 | | | | 428 | | |
Hilton Worldwide Holdings, Inc. | | | 1,313 | | | | 286 | | |
Host Hotels & Resorts, Inc. REIT | | | 18,522 | | | | 333 | | |
Iron Mountain, Inc. REIT | | | 7,467 | | | | 669 | | |
Kilroy Realty Corp. REIT | | | 4,290 | | | | 134 | | |
Kite Realty Group Trust REIT | | | 11,257 | | | | 252 | | |
Lamar Advertising Co., Class A REIT | | | 1,390 | | | | 166 | | |
Mid-America Apartment Communities, Inc. REIT | | | 4,004 | | | | 571 | | |
PACS Group, Inc. (b) | | | 10,498 | | | | 310 | | |
Prologis, Inc. REIT | | | 13,092 | | | | 1,470 | | |
Public Storage REIT | | | 3,954 | | | | 1,137 | | |
The accompanying notes are an integral part of the financial statements.
2
Morgan Stanley Variable Insurance Fund, Inc.
June 30, 2024 (unaudited)
Portfolio of Investments (cont'd)
Global Real Estate Portfolio
| | | Shares | | Value
(000) | |
United States (cont'd) | |
Realty Income Corp. REIT | | | 6,150 | | | $ | 325 | | |
Rexford Industrial Realty, Inc. REIT | | | 10,499 | | | | 468 | | |
Simon Property Group, Inc. REIT | | | 7,334 | | | | 1,113 | | |
Sun Communities, Inc. REIT | | | 3,572 | | | | 430 | | |
Tanger, Inc. REIT | | | 6,163 | | | | 167 | | |
Urban Edge Properties REIT | | | 11,624 | | | | 215 | | |
VICI Properties, Inc. REIT | | | 26,284 | | | | 753 | | |
Welltower, Inc. REIT | | | 20,835 | | | | 2,172 | | |
| | | | 21,115 | | |
Total Common Stocks (Cost $29,247) | | | 32,580 | | |
Short-Term Investment (0.3%) | |
Investment Company (0.3%) | |
Morgan Stanley Institutional Liquidity Funds —
Treasury Portfolio — Institutional Class,
5.14% (See Note H) (Cost $104) | | | 104,381 | | | | 104 | | |
Total Investments (99.4%) (Cost $29,351)
Including $372 of Securities Loaned (d)(e) | | | 32,684 | | |
Other Assets in Excess of Liabilities (0.6%) | | | 193 | | |
Net Assets (100.0%) | | $ | 32,877 | | |
Country assignments and aggregations are based generally on third party vendor classifications and information, and may be different from the assignments and aggregations under the policies set forth in the Fund's prospectus and/or statement of additional information relating to geographic classifications.
(a) Consists of one or more classes of securities traded together as a unit; stocks with attached warrants.
(b) Non-income producing security.
(c) All or a portion of this security was on loan at June 30, 2024.
(d) The approximate fair value and percentage of net assets, $10,549,000 and 32.1%, respectively, represent the securities that have been fair valued under the fair valuation policy for international investments as described in Note A-1 within the Notes to Financial Statements.
(e) At June 30, 2024, the aggregate cost for federal income tax purposes approximates the aggregate cost for book purposes. The aggregate gross unrealized appreciation is approximately $4,556,000 and the aggregate gross unrealized depreciation is approximately $1,223,000, resulting in net unrealized appreciation of approximately $3,333,000.
REIT Real Estate Investment Trust.
Portfolio Composition
Classification | | Percentage of
Total Investments | |
Residential | | | 17.5 | % | |
Other* | | | 15.3 | | |
Diversified | | | 13.6 | | |
Retail | | | 13.5 | | |
Health Care | | | 12.2 | | |
Industrial | | | 11.4 | | |
Data Centers | | | 9.4 | | |
Self Storage | | | 7.1 | | |
Total Investments | | | 100.0 | % | |
* Industries and/or investment types representing less than 5% of total investments.
The accompanying notes are an integral part of the financial statements.
3
Morgan Stanley Variable Insurance Fund, Inc.
June 30, 2024 (unaudited)
Global Real Estate Portfolio
Statement of Assets and Liabilities | | June 30, 2024
(000) | |
Assets: | |
Investments in Securities of Unaffiliated Issuers, at Value(1) (Cost $29,247) | | $ | 32,580 | | |
Investment in Security of Affiliated Issuer, at Value (Cost $104) | | | 104 | | |
Total Investments in Securities, at Value (Cost $29,351) | | | 32,684 | | |
Foreign Currency, at Value (Cost $143) | | | 143 | | |
Dividends Receivable | | | 134 | | |
Receivable for Fund Shares Sold | | | 40 | | |
Tax Reclaim Receivable | | | 25 | | |
Due from Adviser | | | 11 | | |
Receivable from Affiliate | | | — | @ | |
Other Assets | | | 10 | | |
Total Assets | | | 33,047 | | |
Liabilities: | |
Payable for Professional Fees | | | 50 | | |
Deferred Capital Gain Country Tax | | | 30 | | |
Payable for Fund Shares Redeemed | | | 28 | | |
Payable for Investments Purchased | | | 26 | | |
Payable for Servicing Fees | | | 10 | | |
Payable for Custodian Fees | | | 9 | | |
Payable for Distribution Fees — Class II Shares | | | 7 | | |
Payable for Administration Fees | | | 2 | | |
Payable for Transfer Agency Fees | | | 1 | | |
Other Liabilities | | | 7 | | |
Total Liabilities | | | 170 | | |
NET ASSETS | | $ | 32,877 | | |
Net Assets Consist of: | |
Paid-in-Capital | | $ | 36,808 | | |
Total Accumulated Loss | | | (3,931 | ) | |
Net Assets | | $ | 32,877 | | |
CLASS II: | |
Net Asset Value, Offering and Redemption Price Per Share Applicable to 4,410,860 Outstanding
$0.001 Par Value Shares (Authorized 500,000,000 Shares) | | $ | 7.45 | | |
(1) Including: | |
Securities on Loan, at Value: | | $ | 372 | | |
@ Amount is less than $500.
The accompanying notes are an integral part of the financial statements.
4
Morgan Stanley Variable Insurance Fund, Inc.
June 30, 2024 (unaudited)
Global Real Estate Portfolio
Statement of Operations | | Six Months Ended
June 30, 2024
(000) | |
Investment Income: | |
Dividends from Securities of Unaffiliated Issuers (Net of $24 of Foreign Taxes Withheld) | | $ | 615 | | |
Dividends from Security of Affiliated Issuer (Note H) | | | 5 | | |
Income from Securities Loaned — Net | | | — | @ | |
Total Investment Income | | | 620 | | |
Expenses: | |
Advisory Fees (Note B) | | | 108 | | |
Professional Fees | | | 76 | | |
Distribution Fees — Class II Shares (Note E) | | | 41 | | |
Servicing Fees (Note D) | | | 28 | | |
Custodian Fees (Note G) | | | 14 | | |
Administration Fees (Note C) | | | 13 | | |
Shareholder Reporting Fees | | | 9 | | |
Transfer Agency Fees (Note F) | | | 3 | | |
Pricing Fees | | | 2 | | |
Directors' Fees and Expenses | | | 1 | | |
Other Expenses | | | 5 | | |
Total Expenses | | | 300 | | |
Waiver of Advisory Fees (Note B) | | | (108 | ) | |
Expenses Reimbursed by Adviser (Note B) | | | (11 | ) | |
Rebate from Morgan Stanley Affiliate (Note H) | | | (— | @) | |
Net Expenses | | | 181 | | |
Net Investment Income | | | 439 | | |
Realized Loss: | |
Investments Sold | | | (440 | ) | |
Foreign Currency Translation | | | (2 | ) | |
Net Realized Loss | | | (442 | ) | |
Change in Unrealized Appreciation (Depreciation): | |
Investments | | | (417 | ) | |
Foreign Currency Translation | | | (2 | ) | |
Net Change in Unrealized Appreciation (Depreciation) | | | (419 | ) | |
Net Realized Loss and Change in Unrealized Appreciation (Depreciation) | | | (861 | ) | |
Net Decrease in Net Assets Resulting from Operations | | $ | (422 | ) | |
@ Amount is less than $500.
The accompanying notes are an integral part of the financial statements.
5
Morgan Stanley Variable Insurance Fund, Inc.
June 30, 2024
Global Real Estate Portfolio
Statements of Changes in Net Assets | | Six Months Ended
June 30, 2024
(unaudited)
(000) | | Year Ended
December 31, 2023
(000) | |
Increase (Decrease) in Net Assets: | |
Operations: | |
Net Investment Income | | $ | 439 | | | $ | 806 | | |
Net Realized Loss | | | (442 | ) | | | (3,202 | ) | |
Net Change in Unrealized Appreciation (Depreciation) | | | (419 | ) | | | 5,825 | | |
Net Increase (Decrease) in Net Assets Resulting from Operations | | | (422 | ) | | | 3,429 | | |
Dividends and Distributions to Shareholders: | |
Class II | | | — | | | | (689 | ) | |
Capital Share Transactions:(1) | |
Class II: | |
Subscribed | | | 927 | | | | 2,137 | | |
Distributions Reinvested | | | — | | | | 689 | | |
Redeemed | | | (3,139 | ) | | | (7,294 | ) | |
Net Decrease in Net Assets Resulting from Capital Share Transactions | | | (2,212 | ) | | | (4,468 | ) | |
Total Decrease in Net Assets | | | (2,634 | ) | | | (1,728 | ) | |
Net Assets: | |
Beginning of Period | | | 35,511 | | | | 37,239 | | |
End of Period | | $ | 32,877 | | | $ | 35,511 | | |
(1) Capital Share Transactions: | |
Class II: | |
Shares Subscribed | | | 126 | | | | 305 | | |
Shares Issued on Distributions Reinvested | | | — | | | | 99 | | |
Shares Redeemed | | | (427 | ) | | | (1,040 | ) | |
Net Decrease in Class II Shares Outstanding | | | (301 | ) | | | (636 | ) | |
The accompanying notes are an integral part of the financial statements.
6
Morgan Stanley Variable Insurance Fund, Inc.
June 30, 2024
Financial Highlights
Global Real Estate Portfolio
| | | Class II | |
| | | Six Months Ended
June 30, 2024 | | Year Ended December 31, | |
Selected Per Share Data and Ratios | | (unaudited) | | 2023 | | 2022 | | 2021 | | 2020 | | 2019 | |
Net Asset Value, Beginning of Period | | $ | 7.54 | | | $ | 6.96 | | | $ | 10.36 | | | $ | 8.56 | | | $ | 10.80 | | | $ | 9.87 | | |
Income (Loss) from Investment Operations: | |
Net Investment Income(1) | | | 0.10 | | | | 0.16 | | | | 0.14 | | | | 0.18 | | | | 0.16 | | | | 0.18 | | |
Net Realized and Unrealized Gain (Loss) | | | (0.19 | ) | | | 0.56 | | | | (2.81 | ) | | | 1.85 | | | | (1.86 | ) | | | 1.58 | | |
Total from Investment Operations | | | (0.09 | ) | | | 0.72 | | | | (2.67 | ) | | | 2.03 | | | | (1.70 | ) | | | 1.76 | | |
Distributions from and/or in Excess of: | |
Net Investment Income | | | — | | | | (0.14 | ) | | | (0.39 | ) | | | (0.23 | ) | | | (0.37 | ) | | | (0.29 | ) | |
Net Realized Gain | | | — | | | | — | | | | (0.34 | ) | | | — | | | | (0.17 | ) | | | (0.54 | ) | |
Total Distributions | | | — | | | | (0.14 | ) | | | (0.73 | ) | | | (0.23 | ) | | | (0.54 | ) | | | (0.83 | ) | |
Net Asset Value, End of Period | | $ | 7.45 | | | $ | 7.54 | | | $ | 6.96 | | | $ | 10.36 | | | $ | 8.56 | | | $ | 10.80 | | |
Total Return(2) | | | (1.19 | )%(3) | | | 10.47 | %(4) | | | (26.20 | )% | | | 23.83 | % | | | (14.85 | )% | | | 18.06 | % | |
Ratios to Average Net Assets and Supplemental Data: | |
Net Assets, End of Period (Thousands) | | $ | 32,877 | | | $ | 35,511 | | | $ | 37,239 | | | $ | 58,277 | | | $ | 53,254 | | | $ | 70,426 | | |
Ratio of Expenses Before Expense Limitation | | | 1.81 | %(5) | | | 1.88 | % | | | 1.80 | % | | | 1.81 | % | | | 1.81 | % | | | 1.64 | % | |
Ratio of Expenses After Expense Limitation | | | 1.10 | %(5)(6) | | | 1.23 | %(6)(7)(8) | | | 1.25 | %(6) | | | 1.25 | %(6) | | | 1.25 | %(6) | | | 1.25 | %(6) | |
Ratio of Net Investment Income | | | 2.64 | %(5)(6) | | | 2.27 | %(6)(8) | | | 1.65 | %(6) | | | 1.89 | %(6) | | | 1.89 | %(6) | | | 1.67 | %(6) | |
Ratio of Rebate from Morgan Stanley Affiliates | | | 0.00 | %(5)(9) | | | 0.00 | %(9) | | | 0.00 | %(9) | | | 0.00 | %(9) | | | 0.00 | %(9) | | | 0.00 | %(9) | |
Portfolio Turnover Rate | | | 26 | %(3) | | | 73 | % | | | 88 | % | | | 123 | % | | | 53 | % | | | 24 | % | |
(1) Per share amount is based on average shares outstanding.
(2) Calculated based on the net asset value as of the last business day of the period. Performance does not reflect fees and expenses imposed by your insurance company's separate account. If performance information included the effect of these additional charges, the total return would be lower.
(3) Not annualized.
(4) Reflects prior period transfer agency fees that were reimbursed in 2023. The amount of the reimbursement was immaterial on a per share basis and the impact was less than 0.005% to the total return of Class II shares.
(5) Annualized.
(6) The Ratio of Expenses After Expense Limitation and Ratio of Net Investment Income reflect the rebate of certain Fund expenses in connection with the investments in Morgan Stanley affiliates during the period. The effect of the rebate on the ratios is disclosed in the above table as "Ratio of Rebate from Morgan Stanley Affiliates."
(7) Effective December 11, 2023, the Adviser has agreed to limit the ratio of expenses to average net assets to the maximum ratio of 1.10% for Class II shares. Prior to December 11, 2023, the maximum ratio was 1.25% for Class II shares.
(8) If the Fund had not received the reimbursement of transfer agency fees from the Adviser, the Ratio of Expenses After Expense Limitation and Ratio of Net Investment Income, would have been as follows for Class II shares:
Period Ended | | Expense
Ratio | | Net Investment
Income Ratio | |
December 31, 2023 | | | 1.24 | % | | | 2.26 | % | |
(9) Amount is less than 0.005%.
The accompanying notes are an integral part of the financial statements.
7
Morgan Stanley Variable Insurance Fund, Inc.
June 30, 2024 (unaudited)
Notes to Financial Statements
Morgan Stanley Variable Insurance Fund, Inc. (the "Company") is registered under the Investment Company Act of 1940, as amended (the "Act"), as an open-end management investment company. The Company is comprised of eight separate active, diversified and non-diversified funds (individually referred to as a "Fund," collectively as the "Funds").
The Company applies investment company accounting and reporting guidance Accounting Standards Codification ("ASC") Topic 946. In the preparation of these financial statements, management has evaluated subsequent events occurring after the date of the Fund's Statement of Assets and Liabilities through the date that the financial statements were issued.
The accompanying financial statements relates to the Global Real Estate Portfolio. The Fund seeks to provide current income and capital appreciation. The Fund currently offers Class II shares only, although Class I shares may be offered in the future.
The Company is intended to be a funding vehicle for variable annuity contracts and variable life insurance policies offered by the separate accounts of certain life insurance companies.
A. Significant Accounting Policies: The following significant accounting policies are in conformity with U.S. generally accepted accounting principles ("GAAP"). Such policies are consistently followed by the Company in the preparation of its financial statements. GAAP may require management to make estimates and assumptions that affect the reported amounts and disclosures in the financial statements. Actual results may differ from those estimates.
1. Security Valuation: (1) An equity portfolio security listed or traded on an exchange is valued at its latest reported sales price (or at the exchange official closing price if such exchange reports an official closing price), and if there were no sales on a given day and if there is no official exchange closing price for that day, the security is valued at the mean between the last reported bid and asked prices if such bid and asked prices are available on the relevant exchanges. If only bid prices are available then the latest bid price may be used. Listed equity securities not traded on the valuation date with no reported bid and asked prices available on the exchange are valued at the mean between the current bid and asked prices obtained from one or more reputable brokers/dealers. In cases where a security is traded on more than one exchange, the security is valued on the exchange designated as the primary market; (2) all other equity portfolio securities for which over-the-counter ("OTC") market quotations are readily available are valued at the latest reported sales price (or at the market official closing price if such
market reports an official closing price), and if there was no trading in the security on a given day and if there is no official closing price from relevant markets for that day, the security is valued at the mean between the last reported bid and asked prices if such bid and asked prices are available on the relevant markets. An unlisted equity security that does not trade on the valuation date and for which bid and asked prices from the relevant markets are unavailable is valued at the mean between the current bid and asked prices obtained from one or more reputable brokers/dealers; (3) fixed income securities may be valued by an outside pricing service/vendor approved by the Company's Board of Directors (the "Directors"). The pricing service/vendor may employ a pricing model that takes into account, among other things, bids, yield spreads and/or other market data and specific security characteristics. If Morgan Stanley Investment Management Inc. (the "Adviser") or Morgan Stanley Investment Management Limited ("MSIM Limited") and Morgan Stanley Investment Management Company ("MSIM Company") (together, the "Sub-Advisers"), each a wholly-owned subsidiary of Morgan Stanley, determines that the price provided by the outside pricing service/vendor does not reflect the security's fair value or is unable to provide a price, prices from reputable brokers/dealers may also be utilized. In these circumstances, the value of the security will be the mean of bid and asked prices obtained from reputable brokers/dealers; (4) when market quotations are not readily available, as defined by Rule 2a-5 under the Act, including circumstances under which the Adviser or the Sub-Advisers determine that the closing price, last sale price or the mean between the last reported bid and asked prices are not reflective of a security's market value, portfolio securities are valued at their fair value as determined in good faith under procedures approved by and under the general supervision of the Directors. Each business day, the Fund uses a third-party pricing service approved by the Directors to assist with the valuation of foreign equity securities. Events occurring after the close of trading on foreign exchanges may result in adjustments to the valuation of foreign securities to reflect market trading that occurs after the close of the applicable foreign markets of comparable securities or other instruments that have a strong correlation to the fair-valued securities to more accurately reflect their fair value as of the close of regular trading on the NYSE; (5) foreign exchange transactions ("spot contracts") and foreign exchange forward contracts ("forward contracts") are valued daily using an independent pricing vendor at the spot and forward rates, respectively, as of the close of the NYSE; and (6) investments in mutual funds,
8
Morgan Stanley Variable Insurance Fund, Inc.
June 30, 2024 (unaudited)
Notes to Financial Statements (cont'd)
including the Morgan Stanley Institutional Liquidity Funds, are valued at the net asset value ("NAV") as of the close of each business day.
In connection with Rule 2a-5 of the Act, the Directors have designated the Company's Adviser as its valuation designee. The valuation designee has responsibility for determining fair value and to make the actual calculations pursuant to the fair valuation methodologies previously approved by the Directors. Under procedures approved by the Directors, the Company's Adviser, as valuation designee, has formed a Valuation Committee whose members are approved by the Directors. The Valuation Committee provides administration and oversight of the Company's valuation policies and procedures, which are reviewed at least annually by the Directors. These procedures allow the Company to utilize independent pricing services, quotations from securities and financial instrument dealers and other market sources to determine fair value.
The Fund invests a significant portion of its assets in securities of REITs. The market's perception of prospective declines in private real estate values and other financial assets may result in increased volatility of market prices that can negatively impact the valuation of certain issuers held by the Fund.
2. Fair Value Measurement: Financial Accounting Standards Board ("FASB") ASC 820, "Fair Value Measurement" ("ASC 820"), defines fair value as the price that would be received to sell an asset or pay to transfer a liability in an orderly transaction between market participants at the measurement date. ASC 820 establishes a three-tier hierarchy to distinguish between (1) inputs that reflect the assumptions market participants would use in valuing an asset or liability developed based on market data obtained from sources independent of the reporting entity (observable inputs); and (2) inputs that reflect the reporting entity's own assumptions about the assumptions market participants would use in valuing an asset or liability developed based on the best information available in the circumstances (unobservable inputs) and to establish classification of fair value measurements for disclosure purposes. Various inputs are used in determining the value of the Fund's investments. The inputs are summarized in the three broad levels listed below:
• Level 1 – unadjusted quoted prices in active markets for identical investments
• Level 2 – other significant observable inputs (including quoted prices for similar investments, interest rates, prepayment speeds, credit risk, etc.)
• Level 3 – significant unobservable inputs including the Fund's own assumptions in determining the fair value of investments. Factors considered in making this determination may include, but are not limited to, information obtained by contacting the issuer, analysts, or the appropriate stock exchange (for exchange-traded securities), analysis of the issuer's financial statements or other available documents and, if necessary, available information concerning other securities in similar circumstances.
The inputs or methodology used for valuing securities are not necessarily an indication of the risk associated with investing in those securities and the determination of the significance of a particular input to the fair value measurement in its entirety requires judgment and considers factors specific to each security.
The following is a summary of the inputs used to value the Fund's investments as of June 30, 2024:
Investment Type | | Level 1
Unadjusted
quoted
prices
(000) | | Level 2
Other
significant
observable
inputs
(000) | | Level 3
Significant
unobservable
inputs
(000) | | Total
(000) | |
Assets: | |
Common Stocks | |
Data Centers | | $ | 3,073 | | | $ | — | | | $ | — | | | $ | 3,073 | | |
Diversified | | | — | | | | 4,446 | | | | — | | | | 4,446 | | |
Health Care | | | 3,877 | | | | 105 | | | | — | | | | 3,982 | | |
Industrial | | | 2,558 | | | | 1,171 | | | | — | | | | 3,729 | | |
Industrial/Office Mixed | | | — | | | | 588 | | | | — | | | | 588 | | |
Lodging/Resorts | | | 619 | | | | 979 | | | | — | | | | 1,598 | | |
Office | | | 464 | | | | 643 | | | | — | | | | 1,107 | | |
Residential | | | 4,652 | | | | 1,084 | | | | — | | | | 5,736 | | |
Retail | | | 3,173 | | | | 1,254 | | | | — | | | | 4,427 | | |
Self Storage | | | 2,027 | | | | 279 | | | | — | | | | 2,306 | | |
Specialty | | | 1,588 | | | | — | | | | — | | | | 1,588 | | |
Total Common Stocks | | | 22,031 | | | | 10,549 | | | | — | | | | 32,580 | | |
Short-Term Investment | |
Investment Company | | | 104 | | | | — | | | | — | | | | 104 | | |
Total Assets | | $ | 22,135 | | | $ | 10,549 | | | $ | — | | | $ | 32,684 | | |
Transfers between investment levels may occur as the markets fluctuate and/or the availability of data used in an investment's valuation changes.
9
Morgan Stanley Variable Insurance Fund, Inc.
June 30, 2024 (unaudited)
Notes to Financial Statements (cont'd)
3. Foreign Currency Translation and Foreign Investments: The books and records of the Fund are maintained in U.S. dollars. Foreign currency amounts are translated into U.S. dollars as follows:
— investments, other assets and liabilities at the prevailing rate of exchange on the valuation date;
— investment transactions and investment income at the prevailing rates of exchange on the dates of such transactions.
Although the net assets of the Fund are presented at the foreign exchange rates and market values at the close of the period, the Fund does not isolate that portion of the results of operations arising as a result of changes in the foreign exchange rates from the fluctuations arising from changes in the market prices of securities held at period end. Similarly, the Fund does not isolate the effect of changes in foreign exchange rates from the fluctuations arising from changes in the market prices of securities sold during the period. Accordingly, realized and unrealized foreign currency gains (losses) on investments in securities are included in the reported net realized and unrealized gains (losses) on investment transactions and balances. However, pursuant to U.S. federal income tax regulations, gains and losses from certain foreign currency transactions and the foreign currency portion of gains and losses realized on sales and maturities of foreign denominated debt securities are treated as ordinary income for U.S. federal income tax purposes.
Net realized gains (losses) on foreign currency transactions represent net foreign exchange gains (losses) from foreign currency forward exchange contracts, disposition of foreign currencies, currency gains (losses) realized between the trade and settlement dates on securities transactions, and the difference between the amount of investment income and foreign withholding taxes recorded on the Fund's books and the U.S. dollar equivalent amounts actually received or paid. The change in unrealized currency gains (losses) on foreign currency transactions for the period is reflected in the Statement of Operations.
Foreign security and currency transactions may involve certain considerations and risks not typically associated with those of U.S. dollar denominated transactions as a result of, among other factors, fluctuations of exchange rates in relation to the U.S. dollar, the possibility of lower levels of governmental supervision and regulation of foreign securities markets and the possibility of political or economic instability.
Governmental approval for foreign investments may be required in advance of making an investment under certain circumstances in some countries, and the extent of foreign investments in U.S. companies may be subject to limitation in other countries. Foreign ownership limitations also may be imposed by the charters of individual companies to prevent, among other concerns, violations of foreign investment limitations. As a result, an additional class of shares (identified as "Foreign" in the Portfolio of Investments) may be created and offered for investment. The "local" and "foreign shares" market values may differ. In the absence of trading of the foreign shares in such markets, the Fund values the foreign shares at the closing exchange price of the local shares.
4. Securities Lending: The Fund lends securities to qualified financial institutions, such as broker/dealers, to earn additional income. Any increase or decrease in the fair value of the securities loaned that might occur and any interest earned or dividends declared on those securities during the term of the loan would remain in the Fund. The Fund would receive cash or securities as collateral in an amount equal to or exceeding 100% of the current fair value of the loaned securities. The collateral is marked-to-market daily by State Street Bank and Trust Company ("State Street"), the securities lending agent, to ensure that a minimum of 100% collateral coverage is maintained.
Based on pre-established guidelines, the securities lending agent invests any cash collateral that is received in an affiliated money market portfolio and repurchase agreements. Securities lending income is generated from the earnings on the invested collateral and borrowing fees, less any rebates owed to the borrowers and compensation to the lending agent, and is recorded as "Income from Securities Loaned — Net" in the Fund's Statement of Operations. Risks in securities lending transactions are that a borrower may not provide additional collateral when required or return the securities when due, and that the value of the short-term investments will be less than the amount of cash collateral plus any rebate that is required to be returned to the borrower.
The Fund has the right under the securities lending agreement to recover the securities from the borrower on demand.
10
Morgan Stanley Variable Insurance Fund, Inc.
June 30, 2024 (unaudited)
Notes to Financial Statements (cont'd)
The following table presents financial instruments that are subject to enforceable netting arrangements as of June 30, 2024:
Gross Amount Not Offset in the Statement of Assets and Liabilities | |
Gross Asset
Amount
Presented in
the Statement
of Assets and
Liabilities
(000) | | Financial
Instrument
(000) | | Collateral
Received
(000) | | Net Amount
(not less
than $0)
(000) | |
| $ | 372 | (a) | | $ | — | | | $ | (372 | )(b)(c) | | $ | 0 | | |
(a) Represents market value of loaned securities at period end.
(b) The Fund received non-cash collateral of approximately $392,000 in the form of U.S. Government obligations, which the Fund cannot sell or repledge, and accordingly are not reflected in the Portfolio of Investments.
(c) The actual collateral received is greater than the amount shown here due to overcollateralization.
5. Indemnifications: The Company enters into contracts that contain a variety of indemnification clauses. The Company's maximum exposure under these arrangements is unknown as this would involve future claims that may be made against the Fund that have not yet occurred.
6. Security Transactions, Income and Expenses: Security transactions are accounted for on the trade date (date the order to buy or sell is executed). Realized gains and losses on the sale of investment securities are determined on the specific identified cost method. Dividend income and other distributions are recorded on the ex-dividend date (except for certain foreign dividends which may be recorded as soon as the Fund is informed of such dividends) net of applicable withholding taxes. Non-cash dividends received in the form of stock, if any, are recognized on the ex-dividend date and recorded as non-cash dividend income at fair value. Interest income is recognized on the accrual basis (except where collection is in doubt) net of applicable withholding taxes. Discounts are accreted and premiums are amortized over the life of the respective securities. Most expenses of the Company can be directly attributed to a particular Fund. Expenses which cannot be directly attributed are apportioned among the Funds based upon relative net assets or other appropriate methods. Income, expenses (other than class specific expenses) and realized and unrealized gains or losses are allocated to each class of shares based upon their relative net assets.
The Fund owns shares of REITs which report information on the source of their distributions annually in the following calendar year. A portion of distributions received from REITs during the year is estimated to be a return of capital and is recorded as a reduction of their cost.
Settlement and registration of foreign securities transactions may be subject to significant risks not normally associated with investments in the United States. In certain markets, ownership of shares is defined according to entries in the issuer's share register. It is possible that a Fund holding these securities could lose its share registration through fraud, negligence or even mere oversight. In addition, shares being delivered for sales and cash being paid for purchases may be delivered before the exchange is complete. This may subject the Fund to further risk of loss in the event of a failure to complete the transaction by the counterparty.
7. Dividends and Distributions to Shareholders: Dividends and distributions to shareholders are recorded on the ex-dividend date. Dividends from net investment income, if any, are declared and paid annually. Net realized capital gains, if any, are distributed at least annually.
B. Advisory/Sub-Advisory Fees: The Adviser, a wholly-owned subsidiary of Morgan Stanley, provides the Fund with advisory services under the terms of an Investment Advisory Agreement, paid quarterly, at the annual rate based on the daily net assets as follows:
First $2
billion | | Over $2
billion | |
| | 0.65 | % | | | 0.60 | % | |
For the six months ended June 30, 2024, the advisory fee rate (net of waiver/rebate) was equivalent to an annual effective rate of 0.00% of the Fund's average daily net assets.
The Adviser has agreed to reduce its advisory fee and/or reimburse the Fund so that total annual Fund operating expenses, excluding certain investment related expenses, taxes, interest and other extraordinary expenses (including litigation), will not exceed 1.10% for Class II shares. The fee waivers and/or expense reimbursements will continue for at least one year from the date of the Fund's prospectus or until such time as the Directors act to discontinue all or a portion of such waivers and/or reimbursements when they deem such action is appropriate. For the six months ended June 30, 2024, approximately $108,000 of advisory fees were waived and approximately $11,000 of other expenses were reimbursed by the Adviser pursuant to this arrangement.
The Adviser has entered into Sub-Advisory Agreements with the Sub-Advisers, each a wholly-owned subsidiary of Morgan Stanley. The Sub-Advisers provide the Fund with advisory services subject to the overall supervision of the Adviser and the Company's Officers and Directors. The Adviser pays the Sub-Advisers on a monthly basis a portion of the net advisory fees the Adviser receives from the Fund.
11
Morgan Stanley Variable Insurance Fund, Inc.
June 30, 2024 (unaudited)
Notes to Financial Statements (cont'd)
C. Administration Fees: The Adviser also serves as Administrator to the Company and provides administrative services pursuant to an Administration Agreement for an annual fee, accrued daily and paid monthly, of 0.08% of the Fund's average daily net assets.
Under a Sub-Administration Agreement between the Administrator and State Street, State Street provides certain administrative services to the Company. For such services, the Administrator pays State Street a portion of the fee the Administrator receives from the Fund.
D. Servicing Fees: The Company accrues daily and pays quarterly a servicing fee of up to 0.17% of the average daily value of shares of the Fund held in an insurance company's account. Certain insurance companies have entered into a servicing agreement with the Company to provide administrative and other contract-owner related services on behalf of the Fund.
E. Distribution Fees: Morgan Stanley Distribution, Inc. ("MSDI" or the "Distributor"), a wholly-owned subsidiary of the Adviser and an indirect subsidiary of Morgan Stanley, serves as the Distributor of the Fund and provides the Fund's Class II shareholders with distribution services pursuant to a Distribution Plan (the "Plan") in accordance with Rule 12b-1 under the Act. Under the Plan, the Fund is authorized to pay the Distributor a distribution fee, which is accrued daily and paid monthly, at an annual rate of 0.25% of the Fund's average daily net assets attributable to Class II shares.
F. Dividend Disbursing and Transfer/Co-Transfer Agent: The Company's dividend disbursing and transfer agent is SS&C Global Investor & Distribution Solutions, Inc. ("SS&C GIDS"). Pursuant to a Transfer Agency Agreement, the Company pays SS&C GIDS a fee based on the number of classes, accounts and transactions relating to the Funds of the Company.
Eaton Vance Management ("EVM"), an affiliate of Morgan Stanley, provides co-transfer agency and related services to the Fund pursuant to a Co-Transfer Agency Services Agreement. For the six months ended June 30, 2024, co-transfer agency fees and expenses incurred to EVM, included in "Transfer Agency Fees" in the Statement of Operations, amounted to less than $500.
G. Custodian Fees: State Street (the "Custodian") also serves as Custodian for the Company in accordance with a Custodian Agreement. The Custodian holds cash, securities and other assets of the Company as required by the Act. Custody fees are payable monthly based on assets held in custody, investment purchases and sales activity and account maintenance fees, plus reimbursement for certain out-of-pocket expenses.
H. Security Transactions and Transactions with Affiliates: For the six months ended June 30, 2024, purchases and sales of investment securities for the Fund, other than long-term U.S. Government securities and short-term investments were approximately $8,640,000 and $10,257,000, respectively. There were no purchases and sales of long-term U.S. Government securities for the six months ended June 30, 2024.
The Fund invests in the Institutional Class of the Morgan Stanley Institutional Liquidity Funds — Treasury Portfolio (the "Liquidity Fund"), an open-end management investment company managed by the Adviser. Advisory fees paid by the Fund are reduced by an amount equal to its pro-rata share of the advisory and administration fees paid by the Fund due to its investment in the Liquidity Fund. For the six months ended June 30, 2024, advisory fees paid were reduced by less than $500 relating to the Fund's investment in the Liquidity Fund.
A summary of the Fund's transactions in shares of affiliated investments during the six months ended June 30, 2024 is as follows:
Affiliated
Investment
Company | | Value
December 31,
2023
(000) | | Purchases
at Cost
(000) | | Proceeds
from Sales
(000) | | Dividend
Income
(000) | |
Liquidity Fund | | $ | 389 | | | $ | 3,317 | | | $ | 3,602 | | | $ | 5 | | |
Affiliated
Investment
Company (cont'd) | | Realized
Gain (Loss)
(000) | | Change in
Unrealized
Appreciation
(Depreciation)
(000) | | Value
June 30,
2024
(000) | |
Liquidity Fund | | $ | — | | | $ | — | | | $ | 104 | | |
The Fund is permitted to purchase and sell securities ("cross-trade") from and to other Morgan Stanley funds as well as other funds and client accounts for which the Adviser or an affiliate of the Adviser serves as investment adviser, pursuant to procedures approved by the Directors in compliance with Rule 17a-7 under the Act (the "Rule"). Each cross-trade is executed at the current market price in compliance with provisions of the Rule. For the six months ended June 30, 2024, the Fund did not engage in any cross-trade transactions.
Each Director receives an annual retainer fee for serving as a Director of the Morgan Stanley Funds. The aggregate compensation paid to each Director is paid by the Morgan Stanley Funds, and is allocated on a pro rata basis among each of the operational funds of the Morgan Stanley Funds based on the relative net assets of each of the funds. The Company also reimburses such Directors for travel and other out-of-pocket expenses incurred by them in connection with attending such meetings.
12
Morgan Stanley Variable Insurance Fund, Inc.
June 30, 2024 (unaudited)
Notes to Financial Statements (cont'd)
The Fund has an unfunded Deferred Compensation Plan (the "Compensation Plan"), which allows each independent Director to defer payment of all, or a portion, of the fees he or she receives for serving on the Board of Directors. Each eligible Director generally may elect to have the deferred amounts credited with a return equal to the total return on one or more of the Morgan Stanley funds that are offered as investment options under the Compensation Plan. Appreciation/depreciation and distributions received from these investments are recorded with an offsetting increase/decrease in the deferred compensation obligation and do not affect the NAV of the Fund.
I. Federal Income Taxes: It is the Fund's intention to continue to qualify as a regulated investment company and distribute all of its taxable and tax-exempt income. Accordingly, no provision for federal income taxes is required in the financial statements.
The Fund may be subject to taxes imposed by countries in which it invests. Such taxes are generally based on income and/or capital gains earned or repatriated. Taxes are accrued based on net investment income, net realized gains and net unrealized appreciation as such income and/or gains are earned. Taxes may also be based on transactions in foreign currency and are accrued based on the value of investments denominated in such currency.
FASB ASC 740-10, "Income Taxes — Overall", sets forth a minimum threshold for financial statement recognition of the benefit of a tax position taken or expected to be taken in a tax return. Management has concluded there are no significant uncertain tax positions that would require recognition in the financial statements. If applicable, the Fund recognizes interest accrued related to unrecognized tax benefits in "Interest Expense" and penalties in "Other Expenses" in the Statement of Operations. The Fund files tax returns with the U.S. Internal Revenue Service, New York and various states. Generally, each of the tax years in the four-year period ended December 31, 2023 remains subject to examination by taxing authorities.
The tax character of distributions paid may differ from the character of distributions shown for GAAP purposes due to short-term capital gains being treated as ordinary income for tax purposes. The tax character of distributions paid during fiscal years 2023 and 2022 was as follows:
2023 Distributions
Paid From: | | 2022 Distributions
Paid From: | |
Ordinary
Income
(000) | | Long-Term
Capital Gain
(000) | | Ordinary
Income
(000) | | Long-Term
Capital Gain
(000) | |
| $ | 689 | | | $ | — | | | $ | 3,531 | | | $ | 205 | | |
The amount and character of income and gains to be distributed are determined in accordance with income tax regulations which may differ from GAAP. These book/tax differences are either considered temporary or permanent in nature.
Temporary differences are attributable to differing book and tax treatments for the timing of the recognition of gains (losses) on certain investment transactions and the timing of the deductibility of certain expenses.
The Fund had no permanent differences causing reclassifications among the components of net assets for the year ended December 31, 2023.
At December 31, 2023, the components of distributable earnings for the Fund on a tax basis were as follows:
Undistributed
Ordinary
Income
(000) | | Undistributed
Long-Term
Capital Gain
(000) | |
| $ | 669 | | | $ | — | | |
At December 31, 2023, the Fund had available for federal income tax purposes unused short-term and long-term capital losses of approximately $4,564,000 and $2,738,000, respectively, that do not have an expiration date.
To the extent that capital loss carryforwards are used to offset any future capital gains realized, no capital gains tax liability will be incurred by the Fund for gains realized and not distributed. To the extent that capital gains are offset, such gains will not be distributed to the shareholders.
J. Credit Facility: The Company and other Morgan Stanley funds participated in a $500,000,000 committed, unsecured revolving line of credit facility (the "Facility") with State Street. This Facility is to be used for temporary emergency purposes or funding of shareholder redemption requests. The interest rate for any funds drawn will be based on the federal funds rate or overnight bank funding rate plus a spread. The Facility also has a commitment fee of 0.25% per annum based on the unused portion of the Facility, which is allocated among participating funds based on relative net assets. During the six months ended June 30, 2024, the Fund did not have any borrowings under the Facility.
K. Other: At June 30, 2024, the Fund had record owners of 10% or greater. Investment activities of these shareholders could have a material impact on the Fund. The aggregate percentage of such owners was 96.5%.
L. Market Risk: The value of an investment in the Fund is based on the values of the Fund's investments, which change due to economic and other events that affect markets generally, as well as those that affect particular regions, countries, industries, companies or governments. The risks associated with these developments may be magnified if certain social,
13
Morgan Stanley Variable Insurance Fund, Inc.
June 30, 2024 (unaudited)
Notes to Financial Statements (cont'd)
political, economic and other conditions and events adversely interrupt the global economy and financial markets. Securities in the Fund's portfolio may underperform due to inflation (or expectations for inflation), interest rates, global demand for particular products or resources, natural disasters and extreme weather events, health emergencies (such as epidemics and pandemics), terrorism, regulatory events and governmental or quasi-governmental actions. The occurrence of global events similar to those in recent years, such as terrorist attacks around the world, natural disasters, health emergencies, social and political (including geopolitical) discord and tensions or debt crises and downgrades, among others, may result in market volatility and may have long term effects on both the U.S. and global financial markets. The occurrence of such events may be sudden and unexpected, and it is difficult to predict when similar events affecting the U.S. or global financial markets may occur, the effects that such events may have and the duration of those effects (which may last for extended periods). Any such event(s) could have a significant adverse impact on the value, liquidity and risk profile of the Fund's portfolio, as well as its ability to sell securities and/or meet redemptions. Any such event(s) or similar types of factors and developments may also adversely affect the financial performance of the Fund's investments (and, in turn, the Fund's investment results) and/or negatively impact broad segments of businesses and populations and have a significant and rapid negative impact on the performance of the Fund's investments, and exacerbate preexisting risks to the Fund.
14
Morgan Stanley Variable Insurance Fund, Inc.
June 30, 2024 (unaudited)
Investment Advisory Agreement Approval
Nature, Extent and Quality of Services
The Board reviewed and considered the nature and extent of the investment advisory services provided by the Adviser under the advisory agreement, including portfolio management, investment research and equity and fixed income securities trading. The Board reviewed similar information and factors regarding the Sub-Advisers, to the extent applicable. The Board also reviewed and considered the nature and extent of the non-advisory, administrative services provided by the Administrator under the administration agreement, including accounting, operations, clerical, bookkeeping, compliance, business management and planning, legal services and the provision of supplies, office space and utilities at the Adviser's expense. The Board also considered the Adviser's investment in personnel and infrastructure that benefits the Fund. (The Adviser, Sub-Advisers and Administrator together are referred to as the "Adviser" and the advisory, sub-advisory and administration agreements together are referred to as the "Management Agreement.") The Board also considered that the Adviser serves a variety of other investment advisory clients and has experience overseeing service providers. The Board also compared the nature of the services provided by the Adviser with similar services provided by non-affiliated advisers as prepared by Broadridge Financial Solutions, Inc. ("Broadridge").
The Board reviewed and considered the qualifications of the portfolio managers, the senior administrative managers and other key personnel of the Adviser who provide the advisory and administrative services to the Fund. The Board determined that the Adviser's portfolio managers and key personnel are well qualified by education and/or training and experience to perform the services in an efficient and professional manner. The Board concluded that the nature and extent of the advisory and administrative services provided were necessary and appropriate for the conduct of the business and investment activities of the Fund and supported its decision to approve the Management Agreement.
Performance, Fees and Expenses of the Fund
The Board reviewed the performance, fees and expenses of the Fund compared to its peers, as prepared by Broadridge, and to appropriate benchmarks where applicable. The Board discussed with the Adviser the performance goals and the actual results achieved in managing the Fund. When considering a fund's performance, the Board and the Adviser place emphasis on trends and longer-term returns (focusing on one-year, three-year and five-year performance, as of December 31, 2023, or since inception, as applicable). When a fund underperforms its benchmark and/or its peer group average, the Board and the Adviser discuss the causes of such underperformance and, where necessary, they discuss specific changes to investment strategy or investment personnel. The Board noted that the Fund's performance was below its peer group average for the one-, three- and five-year periods. The Board discussed with the Adviser the level of the advisory and administration fees (together, the "management fee") for this Fund relative to comparable funds and/or other accounts advised by the Adviser and/or compared to its peers as prepared by Broadridge. In addition to the management fee, the Board also reviewed the Fund's total expense ratio. The Board noted that the Fund's management fee was lower than its peer group average and total expense ratio was higher than but close to its peer group average. After discussion, the Board concluded that the Fund's (i) performance was acceptable; and (ii) management fee and total expense ratio were competitive with its peer group averages.
Economies of Scale
The Board considered the size and growth prospects of the Fund and how that relates to the Fund's total expense ratio and particularly the Fund's management fee rate, which includes breakpoints. In conjunction with its review of the Adviser's profitability, the Board discussed with the Adviser how a change in assets can affect the efficiency or effectiveness of managing the Fund and whether the management fee level is appropriate relative to current and projected asset levels and/or whether the management fee structure reflects economies of scale as asset levels change. The Board has determined that its review of the actual and/or potential economies of scale of the Fund supports its decision to approve the Management Agreement.
Profitability of the Adviser and Affiliates
The Board considered information concerning the costs incurred and profits realized by the Adviser and its affiliates during the last year from their relationship with the Fund and during the last two years from their relationship with the Morgan Stanley Fund Complex and reviewed with the Adviser the cost allocation methodology used to determine the profitability of the Adviser
15
Morgan Stanley Variable Insurance Fund, Inc.
June 30, 2024 (unaudited)
Investment Advisory Agreement Approval (cont'd)
and affiliates. The Board has determined that its review of the analysis of the Adviser's expenses and profitability supports its decision to approve the Management Agreement.
Other Benefits of the Relationship
The Board considered other direct and indirect benefits to the Adviser and/or its affiliates derived from their relationship with the Fund and other funds advised by the Adviser. These benefits may include, among other things, fees for trading, distribution and/or shareholder servicing and for transaction processing and reporting platforms used by securities lending agents, and research received by the Adviser generated from commission dollars spent on funds' portfolio trading. The Board reviewed with the Adviser these arrangements and the reasonableness of the Adviser's costs relative to the services performed. The Board has determined that its review of the other benefits received by the Adviser or its affiliates supports its decision to approve the Management Agreement.
Resources of the Adviser and Historical Relationship Between the Fund and the Adviser
The Board considered whether the Adviser is financially sound and has the resources necessary to perform its obligations under the Management Agreement. The Board also reviewed and considered the historical relationship between the Fund and the Adviser, including the organizational structure of the Adviser, the policies and procedures formulated and adopted by the Adviser for managing the Fund's operations and the Board's confidence in the competence and integrity of the senior managers and key personnel of the Adviser. The Board concluded that the Adviser has the financial resources necessary to fulfill its obligations under the Management Agreement and that it is beneficial for the Fund to continue its relationship with the Adviser.
Other Factors and Current Trends
The Board considered the controls and procedures adopted and implemented by the Adviser and monitored by the Fund's Chief Compliance Officer and concluded that the conduct of business by the Adviser indicates a good faith effort on its part to adhere to high ethical standards in the conduct of the Fund's business.
General Conclusion
After considering and weighing all of the above factors, with various written materials and verbal information presented by the Adviser, the Board concluded that it would be in the best interest of the Fund and its shareholders to approve renewal of the Management Agreement for another year. In reaching this conclusion the Board did not give particular weight to any single piece of information or factor referenced above. The Board considered these factors and information over the course of the year and in numerous meetings, some of which were in executive session with only the independent Board members and their counsel present. It is possible that individual Board members may have weighed these factors, and the information presented, differently in reaching their individual decisions to approve the Management Agreement.
16
(This page has been left blank intentionally.)
Morgan Stanley Variable Insurance Fund, Inc.
June 30, 2024 (unaudited)
This report is not authorized for distribution to prospective investors in the Fund unless preceded or accompanied by an effective Prospectus. Read the Prospectus carefully before investing.

Morgan Stanley Variable Insurance Fund, Inc.
Semi-Annual Financial Statements and Additional Information
June 30, 2024 (unaudited)
Global Strategist Portfolio
The Fund is intended to be a funding vehicle for variable annuity contracts and variable life insurance policies offered by the separate accounts of certain life insurance companies.
Morgan Stanley Variable Insurance Fund, Inc.
June 30, 2024 (unaudited)
1
Morgan Stanley Variable Insurance Fund, Inc.
June 30, 2024 (unaudited)
Consolidated Portfolio of Investments
Global Strategist Portfolio
| | | Face Amount
(000) | | Value
(000) | |
Fixed Income Securities (45.8%) | |
Agency Fixed Rate Mortgages (3.9%) | |
United States (3.9%) | |
Federal Home Loan Mortgage Corporation,
Conventional Pools:
2.00%, 6/1/52 | | $ | 606 | | | $ | 475 | | |
3.00%, 11/1/52 | | | 97 | | | | 83 | | |
4.50%, 1/1/49 | | | 12 | | | | 11 | | |
Gold Pools:
3.50%, 2/1/45 - 6/1/45 | | | 154 | | | | 138 | | |
4.50%, 1/1/49 | | | 8 | | | | 7 | | |
Federal National Mortgage Association,
Conventional Pools:
2.50%, 10/1/51 | | | 285 | | | | 233 | | |
3.00%, 4/1/52 | | | 380 | | | | 324 | | |
3.50%, 1/1/51 | | | 395 | | | | 354 | | |
4.00%, 11/1/41 - 1/1/46 | | | 156 | | | | 147 | | |
4.50%, 3/1/41 - 11/1/44 | | | 63 | | | | 61 | | |
5.00%, 1/1/41 - 3/1/41 | | | 23 | | | | 23 | | |
6.00%, 1/1/38 | | | 4 | | | | 4 | | |
6.50%, 10/1/53 | | | 24 | | | | 24 | | |
July TBA:
2.50%, 7/1/54 (a) | | | 500 | | | | 408 | | |
3.00%, 7/1/54 (a) | | | 100 | | | | 85 | | |
4.00%, 7/1/54 (a) | | | 70 | | | | 64 | | |
4.50%, 7/1/54 (a) | | | 100 | | | | 94 | | |
5.00%, 7/1/54 (a) | | | 270 | | | | 261 | | |
5.50%, 7/1/54 (a) | | | 250 | | | | 247 | | |
6.00%, 7/1/54 (a) | | | 220 | | | | 221 | | |
Government National Mortgage Association,
Various Pools:
4.00%, 7/15/44 | | | 9 | | | | 9 | | |
5.00%, 2/20/49 | | | 3 | | | | 3 | | |
Total Agency Fixed Rate Mortgages (Cost $3,460) | | | 3,276 | | |
Asset-Backed Securities (0.4%) | |
Ireland (0.1%) | |
European Residential Loan Securitisation
2019-NPL1 DAC, Class A
1 Month EURIBOR + 3.25%,
6.85%, 7/24/54 (b) | | EUR | 74 | | | | 78 | | |
United States (0.3%) | |
Renaissance Home Equity Loan Trust,
1 Month Term SOFR + 0.87%,
6.22%, 12/25/32 (b) | | $ | 77 | | | | 70 | | |
Retained Vantage Data Centers Issuer
LLC, Class A2A
5.00%, 9/15/48 (c) | | | 100 | | | | 97 | | |
SLM Student Loan Trust,
3 Month EURIBOR + 0.55%,
4.43%, 7/25/39 (b) | | EUR | 56 | | | | 56 | | |
| | | | 223 | | |
Total Asset-Backed Securities (Cost $301) | | | 301 | | |
| | | Face Amount
(000) | | Value
(000) | |
Commercial Mortgage-Backed Securities (0.6%) | |
United States (0.6%) | |
BPR Trust,
1 Month Term SOFR + 1.90%,
7.23%, 4/15/37 (b)(c) | | $ | 100 | | | $ | 100 | | |
1 Month Term SOFR + 3.00%,
8.33%, 5/15/39 (b)(c) | | | 100 | | | | 101 | | |
Commercial Mortgage Trust,
4.88%, 7/15/47 (b)(c) | | | 100 | | | | 91 | | |
Credit Suisse Mortgage Trust,
1 Month Term SOFR + 3.14%,
8.47%, 9/9/24 (b)(c) | | | 100 | | | | 100 | | |
JW Commercial Mortgage Trust,
1 Month Term SOFR + 1.62%,
6.94%, 6/15/39 (b)(c) | | | 100 | | | | 100 | | |
Total Commercial Mortgage-Backed Securities (Cost $493) | | | 492 | | |
Corporate Bonds (10.3%) | |
Australia (0.5%) | |
NBN Co. Ltd.,
2.63%, 5/5/31 (c) | | | 200 | | | | 172 | | |
Transurban Finance Co. Pty. Ltd.,
2.00%, 8/28/25 | | EUR | 100 | | | | 105 | | |
Westpac Banking Corp.,
2.67%, 11/15/35 | | $ | 125 | | | | 104 | | |
| | | | 381 | | |
Brazil (0.3%) | |
JBS USA LUX SA/JBS USA Food
Co./JBS USA Finance, Inc.,
2.50%, 1/15/27 | | | 225 | | | | 210 | | |
Canada (0.6%) | |
Algonquin Power & Utilities Corp.,
5.37%, 6/15/26 (d) | | | 50 | | | | 50 | | |
Province of Ontario Canada,
4.10%, 3/4/33 | | CAD | 200 | | | | 146 | | |
Province of Quebec Canada,
0.00%, 10/29/30 | | EUR | 210 | | | | 185 | | |
Rogers Communications, Inc.,
3.80%, 3/15/32 | | $ | 100 | | | | 89 | | |
| | | | 470 | | |
France (1.0%) | |
AXA SA,
3.25%, 5/28/49 | | EUR | 100 | | | | 102 | | |
Banque Federative du Credit Mutuel SA,
1.25%, 12/5/25 | | GBP | 100 | | | | 119 | | |
BNP Paribas SA,
1.13%, 6/11/26 | | EUR | 225 | | | | 230 | | |
BPCE SA,
5.15%, 7/21/24 (c) | | $ | 200 | | | | 200 | | |
5.75%, 6/1/33 | | EUR | 100 | | | | 112 | | |
Orange SA,
5.00%, 10/1/26 (e) | | | 100 | | | | 109 | | |
| | | | 872 | | |
The accompanying notes are an integral part of the consolidated financial statements.
2
Morgan Stanley Variable Insurance Fund, Inc.
June 30, 2024 (unaudited)
Consolidated Portfolio of Investments (cont'd)
Global Strategist Portfolio
| | | Face Amount
(000) | | Value
(000) | |
Germany (0.7%) | |
Kreditanstalt fuer Wiederaufbau,
0.38%, 4/23/30 | | EUR | 340 | | | $ | 316 | | |
RWE AG,
3.63%, 1/10/32 | | | 100 | | | | 106 | | |
Volkswagen International Finance NV,
Series 10Y
1.88%, 3/30/27 | | | 200 | | | | 205 | | |
| | | | 627 | | |
Italy (0.1%) | |
Assicurazioni Generali SpA,
5.50%, 10/27/47 | | | 100 | | | | 111 | | |
Japan (0.2%) | |
NTT Finance Corp.,
1.59%, 4/3/28 (c) | | $ | 200 | | | | 176 | | |
Korea, Republic of (0.2%) | |
Korea Southern Power Co. Ltd.,
0.75%, 1/27/26 (c) | | | 200 | | | | 186 | | |
Luxembourg (0.1%) | |
Blackstone Property Partners Europe
Holdings SARL,
1.25%, 4/26/27 | | EUR | 100 | | | | 98 | | |
Macau (0.0%)‡ | |
Las Vegas Sands Corp.,
6.00%, 8/15/29 | | $ | 35 | | | | 35 | | |
Netherlands (0.1%) | |
Alliander NV,
4.50%, 3/27/32 (e) | | EUR | 100 | | | | 107 | | |
Spain (0.4%) | |
Banco Santander SA,
3.13%, 1/19/27 | | | 100 | | | | 106 | | |
5.18%, 11/19/25 | | $ | 200 | | | | 198 | | |
| | | | 304 | | |
Sweden (0.1%) | |
Akelius Residential Property
Financing BV,
1.13%, 1/11/29 | | EUR | 100 | | | | 93 | | |
United Arab Emirates (0.2%) | |
Galaxy Pipeline Assets Bidco Ltd.,
2.63%, 3/31/36 (c) | | $ | 225 | | | | 183 | | |
United Kingdom (0.9%) | |
BAT Capital Corp.,
3.56%, 8/15/27 | | | 58 | | | | 55 | | |
HSBC Holdings PLC,
2.26%, 11/13/26 | | GBP | 100 | | | | 121 | | |
5.73%, 5/17/32 | | $ | 200 | | | | 201 | | |
Lloyds Banking Group PLC,
2.00%, 4/12/28 | | GBP | 100 | | | | 115 | | |
2.25%, 10/16/24 | | | 100 | | | | 125 | | |
NGG Finance PLC,
5.63%, 6/18/73 | | | 100 | | | | 126 | | |
| | | | 743 | | |
| | | Face Amount
(000) | | Value
(000) | |
United States (4.9%) | |
Air Lease Corp.,
3.13%, 12/1/30 | | $ | 75 | | | $ | 66 | | |
Amazon.com, Inc.,
3.88%, 8/22/37 | | | 75 | | | | 66 | | |
Aon North America, Inc.,
5.45%, 3/1/34 | | | 100 | | | | 100 | | |
AT&T, Inc.,
1.80%, 9/5/26 | | EUR | 100 | | | | 103 | | |
2.90%, 12/4/26 | | GBP | 100 | | | | 120 | | |
3.65%, 6/1/51 | | $ | 75 | | | | 53 | | |
Bank of New York Mellon Corp.,
MTN
5.19%, 3/14/35 | | | 75 | | | | 74 | | |
Boeing Co.,
6.26%, 5/1/27 (c) | | | 25 | | | | 25 | | |
6.30%, 5/1/29 (c) | | | 25 | | | | 25 | | |
Bristol-Myers Squibb Co.,
5.65%, 2/22/64 | | | 25 | | | | 24 | | |
Celanese U.S. Holdings LLC,
6.17%, 7/15/27 | | | 75 | | | | 76 | | |
Centene Corp.,
2.50%, 3/1/31 | | | 175 | | | | 144 | | |
Charles Schwab Corp.,
5.85%, 5/19/34 | | | 65 | | | | 66 | | |
Charter Communications Operating
LLC/Charter Communications
Operating Capital,
4.80%, 3/1/50 | | | 100 | | | | 73 | | |
6.38%, 10/23/35 | | | 25 | | | | 24 | | |
Citigroup, Inc.,
3.06%, 1/25/33 | | | 275 | | | | 234 | | |
Comcast Corp.,
2.89%, 11/1/51 | | | 50 | | | | 31 | | |
3.75%, 4/1/40 | | | 50 | | | | 41 | | |
CVS Health Corp.,
1.75%, 8/21/30 | | | 150 | | | | 122 | | |
Diamondback Energy, Inc.,
3.13%, 3/24/31 | | | 50 | | | | 44 | | |
Energy Transfer LP,
2.90%, 5/15/25 | | | 150 | | | | 146 | | |
Enterprise Products Operating LLC,
3.95%, 1/31/60 | | | 50 | | | | 37 | | |
4.85%, 1/31/34 | | | 25 | | | | 24 | | |
Georgia-Pacific LLC,
2.30%, 4/30/30 (c) | | | 175 | | | | 151 | | |
Global Payments, Inc.,
4.45%, 6/1/28 | | | 100 | | | | 97 | | |
Goldman Sachs Group, Inc.,
0.75%, 3/23/32 | | EUR | 90 | | | | 78 | | |
5.85%, 4/25/35 | | $ | 100 | | | | 102 | | |
JPMorgan Chase & Co.,
5.04%, 1/23/28 | | | 100 | | | | 100 | | |
6.25%, 10/23/34 | | | 175 | | | | 186 | | |
Las Vegas Sands Corp.,
5.90%, 6/1/27 | | | 50 | | | | 50 | | |
The accompanying notes are an integral part of the consolidated financial statements.
3
Morgan Stanley Variable Insurance Fund, Inc.
June 30, 2024 (unaudited)
Consolidated Portfolio of Investments (cont'd)
Global Strategist Portfolio
| | | Face Amount
(000) | | Value
(000) | |
United States (cont'd) | |
Medtronic Global Holdings SCA,
1.00%, 7/2/31 | | EUR | 100 | | | $ | 91 | | |
Metropolitan Life Global Funding I,
2.95%, 4/9/30 (c) | | $ | 150 | | | | 134 | | |
NextEra Energy Capital Holdings, Inc.,
2.75%, 11/1/29 | | | 175 | | | | 156 | | |
Nuveen LLC,
5.55%, 1/15/30 (c) | | | 50 | | | | 50 | | |
ONEOK, Inc.,
6.05%, 9/1/33 | | | 25 | | | | 26 | | |
Oracle Corp.,
2.88%, 3/25/31 | | | 175 | | | | 151 | | |
Pfizer Investment Enterprises Pte. Ltd.,
5.34%, 5/19/63 | | | 25 | | | | 24 | | |
PNC Financial Services Group, Inc.,
6.88%, 10/20/34 | | | 125 | | | | 136 | | |
Prologis Euro Finance LLC,
1.88%, 1/5/29 | | EUR | 100 | | | | 99 | | |
Republic Services, Inc.,
5.00%, 4/1/34 | | $ | 50 | | | | 49 | | |
Thermo Fisher Scientific, Inc.,
0.88%, 10/1/31 | | EUR | 100 | | | | 90 | | |
U.S. Bancorp,
5.38%, 1/23/30 | | $ | 75 | | | | 75 | | |
5.84%, 6/12/34 | | | 75 | | | | 76 | | |
Upjohn Finance BV,
1.91%, 6/23/32 | | EUR | 100 | | | | 90 | | |
Verizon Communications, Inc.,
1.13%, 11/3/28 | | GBP | 100 | | | | 109 | | |
2.55%, 3/21/31 | | $ | 50 | | | | 43 | | |
Vontier Corp.,
2.40%, 4/1/28 | | | 50 | | | | 44 | | |
Warnermedia Holdings, Inc.,
5.05%, 3/15/42 | | | 25 | | | | 20 | | |
Williams Cos., Inc.,
4.85%, 3/1/48 | | | 125 | | | | 108 | | |
| | | | 4,053 | | |
Total Corporate Bonds (Cost $9,223) | | | 8,649 | | |
Mortgages — Other (1.3%) | |
Germany (0.0%)‡ | |
Berg Finance DAC,
3 Month EURIBOR + 1.05%,
4.95%, 4/22/33 (b) | | EUR | 15 | | | | 16 | | |
United Kingdom (0.1%) | |
Landmark Mortgage Securities
No. 3 PLC,
3 Month GBP SONIA + 2.22%,
7.45%, 4/17/44 (b) | | GBP | 51 | | | | 62 | | |
United States (1.2%) | |
Bayview Opportunity Master Fund VIA
Trust,
3.00%, 1/25/52 (b)(c) | | $ | 88 | | | | 73 | | |
Federal Home Loan Mortgage Corp.
Seasoned Credit Risk Transfer Trust,
3.00%, 11/25/57 | | | 76 | | | | 65 | | |
3.00%, 7/25/58 | | | 81 | | | | 70 | | |
| | | Face Amount
(000) | | Value
(000) | |
3.00%, 10/25/58 | | $ | 12 | | | $ | 10 | | |
4.00%, 10/25/58 | | | 11 | | | | 10 | | |
Federal Home Loan Mortgage Corp.
Whole Loan Securities Trust,
3.00%, 9/25/45 | | | 16 | | | | 14 | | |
3.00%, 7/25/46 | | | 8 | | | | 6 | | |
3.00%, 12/25/46 | | | 28 | | | | 24 | | |
3.00%, 5/25/47 | | | 34 | | | | 29 | | |
3.50%, 5/25/45 | | | 7 | | | | 6 | | |
3.50%, 9/25/45 | | | 16 | | | | 14 | | |
3.50%, 7/25/46 | | | 10 | | | | 8 | | |
4.00%, 5/25/45 | | | 2 | | | | 2 | | |
GCAT Trust, Class 2A2
6.50%, 1/25/54 (b)(c) | | | 138 | | | | 139 | | |
Hundred Acre Wood Trust,
2.50%, 12/25/51 (b)(c) | | | 84 | | | | 67 | | |
JP Morgan Mortgage Trust,
3.00%, 4/25/52 (b)(c) | | | 155 | | | | 129 | | |
3.00%, 9/25/52 (b)(c) | | | 166 | | | | 138 | | |
3.25%, 7/25/52 (b)(c) | | | 83 | | | | 70 | | |
PRKCM 2023-AFC1 Trust, Class A1
6.60%, 2/25/58 (c) | | | 73 | | | | 73 | | |
PRMI Securitization Trust,
2.50%, 4/25/51 (b)(c) | | | 81 | | | | 65 | | |
| | | | 1,012 | | |
Total Mortgages — Other (Cost $1,233) | | | 1,090 | | |
Sovereign (22.7%) | |
Australia (0.3%) | |
Australia Government Bond,
1.25%, 5/21/32 | | AUD | 160 | | | | 86 | | |
Treasury Corp. of Victoria,
MTN
5.25%, 9/15/38 | | | 300 | | | | 195 | | |
| | | | 281 | | |
Austria (0.1%) | |
Republic of Austria Government Bond,
0.00%, 2/20/30 | | EUR | 70 | | | | 64 | | |
Belgium (0.2%) | |
Kingdom of Belgium Government Bond,
0.90%, 6/22/29 | | | 30 | | | | 29 | | |
1.70%, 6/22/50 | | | 90 | | | | 66 | | |
3.45%, 6/22/43 | | | 100 | | | | 107 | | |
| | | | 202 | | |
Brazil (1.2%) | |
Brazil Notas do Tesouro Nacional,
10.00%, 1/1/29 | | BRL | 5,960 | | | | 992 | | |
Canada (1.0%) | |
Canadian Government Bond,
2.00%, 12/1/51 | | CAD | 20 | | | | 11 | | |
3.25%, 12/1/33 | | | 910 | | | | 652 | | |
Province of British Columbia,
4.75%, 6/12/34 | | $ | 160 | | | | 159 | | |
| | | | 822 | | |
The accompanying notes are an integral part of the consolidated financial statements.
4
Morgan Stanley Variable Insurance Fund, Inc.
June 30, 2024 (unaudited)
Consolidated Portfolio of Investments (cont'd)
Global Strategist Portfolio
| | | Face Amount
(000) | | Value
(000) | |
China (6.3%) | |
Agricultural Development Bank of China,
2.25%, 4/22/25 | | CNY | 770 | | | $ | 106 | | |
China Development Bank,
3.34%, 7/14/25 | | | 740 | | | | 104 | | |
China Government Bond,
2.37%, 1/20/27 | | | 1,700 | | | | 237 | | |
2.40%, 7/15/28 | | | 1,000 | | | | 140 | | |
2.69%, 8/15/32 | | | 1,700 | | | | 242 | | |
2.76%, 5/15/32 | | | 17,180 | | | | 2,457 | | |
2.80%, 11/15/32 | | | 2,200 | | | | 316 | | |
3.12%, 10/25/52 | | | 400 | | | | 62 | | |
3.13%, 11/21/29 | | | 5,390 | | | | 785 | | |
3.27%, 11/19/30 | | | 2,140 | | | | 316 | | |
3.52%, 4/25/46 | | | 410 | | | | 67 | | |
3.53%, 10/18/51 | | | 200 | | | | 33 | | |
3.81%, 9/14/50 | | | 300 | | | | 52 | | |
3.86%, 7/22/49 | | | 1,270 | | | | 220 | | |
Export-Import Bank of China,
2.93%, 3/2/25 | | | 740 | | | | 103 | | |
| | | | 5,240 | | |
Colombia (0.1%) | |
Colombian TES,
7.00%, 3/26/31 | | COP | 268,000 | | | | 54 | | |
Czech Republic (0.1%) | |
Czech Republic Government Bond,
1.20%, 3/13/31 | | CZK | 1,200 | | | | 43 | | |
Denmark (0.1%) | |
Denmark Government Bond,
0.50%, 11/15/27 | | DKK | 630 | | | | 85 | | |
Estonia (0.1%) | |
Estonia Government International Bond,
3.25%, 1/17/34 | | EUR | 60 | | | | 63 | | |
Finland (0.2%) | |
Finland Government Bond,
1.13%, 4/15/34 | | | 70 | | | | 63 | | |
3.00%, 9/15/34 | | | 60 | | | | 64 | | |
| | | | 127 | | |
France (1.1%) | |
Agence Francaise de Developpement
EPIC,
1.50%, 10/31/34 | | | 100 | | | | 89 | | |
French Republic Government Bond OAT,
0.00%, 11/25/29 | | | 680 | | | | 620 | | |
2.00%, 5/25/48 | | | 200 | | | | 159 | | |
SNCF Reseau,
1.88%, 3/30/34 | | | 100 | | | | 92 | | |
| | | | 960 | | |
Germany (2.5%) | |
Bundesrepublik Deutschland
Bundesanleihe,
0.00%, 8/15/31 - 8/15/50 | | | 558 | | | | 482 | | |
0.25%, 2/15/29 | | | 530 | | | | 515 | | |
1.70%, 8/15/32 | | | 540 | | | | 548 | | |
1.80%, 8/15/53 | | | 58 | | | | 51 | | |
| | | Face Amount
(000) | | Value
(000) | |
2.20%, 2/15/34 | | EUR | 40 | | | $ | 42 | | |
4.25%, 7/4/39 | | | 120 | | | | 153 | | |
State of North Rhine-Westphalia
Germany,
1.65%, 2/22/38 | | | 290 | | | | 259 | | |
| | | | 2,050 | | |
Greece (1.0%) | |
Hellenic Republic Government Bond,
3.38%, 6/15/34 | | | 150 | | | | 156 | | |
4.25%, 6/15/33 | | | 592 | | | | 665 | | |
| | | | 821 | | |
Hungary (0.1%) | |
Hungary Government Bond,
3.00%, 8/21/30 | | HUF | 8,480 | | | | 19 | | |
Hungary Government International
Bond,
4.00%, 7/25/29 | | EUR | 34 | | | | 36 | | |
| | | | 55 | | |
Indonesia (0.1%) | |
Indonesia Treasury Bond,
8.38%, 3/15/34 | | IDR | 1,792,000 | | | | 120 | | |
Italy (0.7%) | |
Italy Buoni Poliennali Del Tesoro,
0.45%, 2/15/29 | | EUR | 50 | | | | 47 | | |
2.50%, 12/1/32 | | | 90 | | | | 87 | | |
4.00%, 11/15/30 | | | 240 | | | | 261 | | |
4.45%, 9/1/43 | | | 68 | | | | 73 | | |
4.50%, 10/1/53 | | | 110 | | | | 117 | | |
| | | | 585 | | |
Japan (1.7%) | |
Japan Government Ten Year Bond,
0.10%, 6/20/31 | | JPY | 42,800 | | | | 254 | | |
0.80%, 3/20/34 | | | 74,000 | | | | 450 | | |
Japan Government Thirty Year Bond,
0.30%, 6/20/46 | | | 34,300 | | | | 151 | | |
0.40%, 9/20/49 | | | 47,900 | | | | 202 | | |
Japan Government Twenty Year Bond,
0.40%, 6/20/41 | | | 77,000 | | | | 389 | | |
| | | | 1,446 | | |
Korea, Republic of (0.4%) | |
Export-Import Bank of Korea,
0.63%, 2/9/26 | | $ | 200 | | | | 186 | | |
Korea Development Bank,
0.80%, 7/19/26 | | | 200 | | | | 184 | | |
| | | | 370 | | |
Lithuania (0.1%) | |
Republic of Lithuania,
3.50%, 7/3/31 (f) | | EUR | 40 | | | | 42 | | |
Malaysia (0.2%) | |
Malaysia Government Bond,
3.58%, 7/15/32 | | MYR | 200 | | | | 42 | | |
3.89%, 8/15/29 | | | 440 | | | | 94 | | |
| | | | 136 | | |
The accompanying notes are an integral part of the consolidated financial statements.
5
Morgan Stanley Variable Insurance Fund, Inc.
June 30, 2024 (unaudited)
Consolidated Portfolio of Investments (cont'd)
Global Strategist Portfolio
| | | Face Amount
(000) | | Value
(000) | |
Mexico (0.2%) | |
Mexican Bonos,
7.50%, 6/3/27 | | MXN | 1,700 | | | $ | 87 | | |
8.50%, 5/31/29 | | | 800 | | | | 41 | | |
| | | | 128 | | |
Netherlands (0.2%) | |
Netherlands Government Bond,
0.00%, 7/15/30 | | EUR | 190 | | | | 173 | | |
2.75%, 1/15/47 | | | 20 | | | | 21 | | |
| | | | 194 | | |
Norway (0.0%)‡ | |
Norway Government Bond,
3.63%, 5/31/39 | | NOK | 110 | | | | 10 | | |
Poland (0.0%)‡ | |
Republic of Poland Government Bond,
1.75%, 4/25/32 | | PLN | 200 | | | | 38 | | |
Portugal (0.0%)‡ | |
Portugal Obrigacoes do Tesouro OT,
3.63%, 6/12/54 | | EUR | 30 | | | | 31 | | |
Singapore (0.1%) | |
Singapore Government Bond,
2.63%, 8/1/32 | | SGD | 70 | | | | 49 | | |
Slovenia (0.2%) | |
Slovenia Government International Bond,
5.00%, 9/19/33 (c) | | $ | 200 | | | | 199 | | |
South Africa (2.2%) | |
Republic of South Africa Government
Bond,
8.88%, 2/28/35 | | ZAR | 39,958 | | | | 1,860 | | |
Spain (0.9%) | |
Spain Government Bond,
0.00%, 1/31/28 | | EUR | 50 | | | | 48 | | |
2.70%, 10/31/48 | | | 40 | | | | 35 | | |
3.45%, 10/31/34 - 7/30/66 | | | 481 | | | | 514 | | |
3.50%, 5/31/29 | | | 170 | | | | 186 | | |
| | | | 783 | | |
Thailand (0.1%) | |
Thailand Government Bond,
2.00%, 12/17/31 | | THB | 4,000 | | | | 105 | | |
United Kingdom (1.2%) | |
United Kingdom Gilt,
0.63%, 10/22/50 | | GBP | 350 | | | | 177 | | |
0.88%, 7/31/33 | | | 230 | | | | 219 | | |
3.50%, 10/22/25 - 1/22/45 | | | 480 | | | | 582 | | |
| | | | 978 | | |
Total Sovereign (Cost $20,567) | | | 18,933 | | |
Supranational (0.6%) | |
Asian Development Bank,
MTN
2.13%, 5/19/31 | | NZD | 60 | | | | 31 | | |
Corp. Andina de Fomento,
5.00%, 1/24/29 | | $ | 100 | | | | 100 | | |
MTN
5.30%, 2/19/29 | | AUD | 160 | | | | 105 | | |
| | | Face Amount
(000) | | Value
(000) | |
European Financial Stability Facility,
3.00%, 9/4/34 | | EUR | 110 | | | $ | 117 | | |
European Investment Bank,
0.00%, 1/14/31 | | | 180 | | | | 160 | | |
Total Supranational (Cost $512) | | | 513 | | |
U.S. Treasury Securities (6.0%) | |
United States (6.0%) | |
U.S. Treasury Bonds,
1.13%, 5/15/40 | | | 790 | | | | 486 | | |
1.75%, 8/15/41 | | | 670 | | | | 443 | | |
U.S. Treasury Inflation-Indexed Notes,
1.75%, 1/15/34 | | | 889 | | | | 863 | | |
U.S. Treasury Notes,
0.38%, 12/31/25 | | | 1,800 | | | | 1,683 | | |
1.13%, 10/31/26 | | | 720 | | | | 665 | | |
1.50%, 2/15/30 | | | 30 | | | | 26 | | |
1.88%, 2/15/32 | | | 200 | | | | 168 | | |
3.38%, 5/15/33 | | | 690 | | | | 640 | | |
4.00%, 2/15/34 | | | 40 | | | | 39 | | |
Total U.S. Treasury Securities (Cost $5,229) | | | 5,013 | | |
Total Fixed Income Securities (Cost $41,018) | | | 38,267 | | |
| | | Shares | | | |
Common Stocks (35.5%) | |
Australia (0.9%) | |
Ampol Ltd. | | | 140 | | | | 3 | | |
ANZ Group Holdings Ltd. | | | 1,778 | | | | 33 | | |
APA Group | | | 750 | | | | 4 | | |
Aristocrat Leisure Ltd. | | | 336 | | | | 11 | | |
ASX Ltd. | | | 114 | | | | 5 | | |
Aurizon Holdings Ltd. | | | 1,079 | | | | 3 | | |
BHP Group Ltd. | | | 2,993 | | | | 86 | | |
BlueScope Steel Ltd. | | | 265 | | | | 4 | | |
Brambles Ltd. | | | 809 | | | | 8 | | |
CAR Group Ltd. | | | 210 | | | | 5 | | |
Cochlear Ltd. | | | 38 | | | | 8 | | |
Coles Group Ltd. | | | 784 | | | | 9 | | |
Commonwealth Bank of Australia | | | 986 | | | | 83 | | |
Computershare Ltd. | | | 311 | | | | 5 | | |
CSL Ltd. | | | 284 | | | | 56 | | |
Dexus REIT | | | 621 | | | | 3 | | |
Endeavour Group Ltd. | | | 887 | | | | 3 | | |
Fortescue Ltd. | | | 1,012 | | | | 14 | | |
Goodman Group REIT | | | 1,020 | | | | 24 | | |
GPT Group REIT | | | 1,102 | | | | 3 | | |
Insurance Australia Group Ltd. | | | 1,407 | | | | 7 | | |
James Hardie Industries PLC (g) | | | 252 | | | | 8 | | |
Lottery Corp. Ltd. | | | 1,302 | | | | 4 | | |
Macquarie Group Ltd. | | | 213 | | | | 29 | | |
Medibank Pvt Ltd. | | | 1,614 | | | | 4 | | |
Mineral Resources Ltd. | | | 104 | | | | 4 | | |
Mirvac Group REIT | | | 2,370 | | | | 3 | | |
National Australia Bank Ltd. | | | 1,826 | | | | 44 | | |
Northern Star Resources Ltd. | | | 686 | | | | 6 | | |
The accompanying notes are an integral part of the consolidated financial statements.
6
Morgan Stanley Variable Insurance Fund, Inc.
June 30, 2024 (unaudited)
Consolidated Portfolio of Investments (cont'd)
Global Strategist Portfolio
| | | Shares | | Value
(000) | |
Australia (cont'd) | |
Orica Ltd. | | | 282 | | | $ | 3 | | |
Origin Energy Ltd. | | | 1,018 | | | | 7 | | |
Pilbara Minerals Ltd. | | | 1,673 | | | | 3 | | |
Pro Medicus Ltd. | | | 33 | | | | 3 | | |
Qantas Airways Ltd. (g) | | | 470 | | | | 2 | | |
QBE Insurance Group Ltd. | | | 903 | | | | 10 | | |
Ramsay Health Care Ltd. | | | 109 | | | | 3 | | |
REA Group Ltd. | | | 31 | | | | 4 | | |
Reece Ltd. | | | 132 | | | | 2 | | |
Rio Tinto Ltd. | | | 220 | | | | 17 | | |
Santos Ltd. | | | 1,931 | | | | 10 | | |
Scentre Group REIT | | | 3,031 | | | | 6 | | |
SEEK Ltd. | | | 209 | | | | 3 | | |
Seven Group Holdings Ltd. | | | 115 | | | | 3 | | |
Sonic Healthcare Ltd. | | | 273 | | | | 5 | | |
South32 Ltd. | | | 2,709 | | | | 7 | | |
Stockland REIT | | | 1,400 | | | | 4 | | |
Suncorp Group Ltd. | | | 747 | | | | 9 | | |
Telstra Group Ltd. | | | 2,383 | | | | 6 | | |
Transurban Group (Units) | | | 1,791 | | | | 15 | | |
Treasury Wine Estates Ltd. | | | 478 | | | | 4 | | |
Vicinity Ltd. REIT | | | 2,268 | | | | 3 | | |
Washington H Soul Pattinson & Co. Ltd. | | | 137 | | | | 3 | | |
Wesfarmers Ltd. | | | 680 | | | | 29 | | |
Westpac Banking Corp. | | | 2,040 | | | | 37 | | |
WiseTech Global Ltd. | | | 97 | | | | 6 | | |
Woodside Energy Group Ltd. | | | 1,134 | | | | 21 | | |
Woolworths Group Ltd. | | | 719 | | | | 16 | | |
Xero Ltd. (g) | | | 85 | | | | 8 | | |
| | | | 728 | | |
Austria (0.0%)‡ | |
Erste Group Bank AG | | | 697 | | | | 33 | | |
OMV AG | | | 81 | | | | 3 | | |
Verbund AG | | | 38 | | | | 3 | | |
Voestalpine AG | | | 58 | | | | 2 | | |
| | | | 41 | | |
Belgium (0.2%) | |
Ageas SA | | | 111 | | | | 5 | | |
Anheuser-Busch InBev SA | | | 606 | | | | 35 | | |
Argenx SE (g) | | | 39 | | | | 17 | | |
D'ieteren Group | | | 15 | | | | 3 | | |
Elia Group SA | | | 20 | | | | 2 | | |
Groupe Bruxelles Lambert NV | | | 61 | | | | 4 | | |
KBC Group NV | | | 546 | | | | 38 | | |
Sofina SA | | | 11 | | | | 3 | | |
Syensqo SA | | | 51 | | | | 5 | | |
UCB SA | | | 88 | | | | 13 | | |
Umicore SA | | | 138 | | | | 2 | | |
Warehouses De Pauw CVA REIT | | | 121 | | | | 3 | | |
| | | | 130 | | |
| | | Shares | | Value
(000) | |
Canada (1.6%) | |
Agnico Eagle Mines Ltd. | | | 342 | | | $ | 22 | | |
Air Canada (g) | | | 123 | | | | 2 | | |
Alimentation Couche-Tard, Inc. | | | 523 | | | | 29 | | |
AltaGas Ltd. | | | 201 | | | | 5 | | |
ARC Resources Ltd. | | | 403 | | | | 7 | | |
Bank of Montreal | | | 498 | | | | 42 | | |
Bank of Nova Scotia | | | 832 | | | | 38 | | |
Barrick Gold Corp. (LSE) | | | 1,149 | | | | 19 | | |
Barrick Gold Corp. (NYSE) | | | 57 | | | | 1 | | |
BCE, Inc. | | | 51 | | | | 2 | | |
Brookfield Asset Management Ltd., Class A | | | 241 | | | | 9 | | |
Brookfield Corp. | | | 923 | | | | 38 | | |
Brookfield Renewable Corp., Class A | | | 91 | | | | 3 | | |
BRP, Inc. | | | 24 | | | | 2 | | |
CAE, Inc. (g) | | | 218 | | | | 4 | | |
Cameco Corp. | | | 299 | | | | 15 | | |
Canadian Apartment Properties REIT | | | 57 | | | | 2 | | |
Canadian Imperial Bank of Commerce | | | 639 | | | | 30 | | |
Canadian National Railway Co. | | | 371 | | | | 44 | | |
Canadian Natural Resources Ltd. | | | 1,447 | | | | 52 | | |
Canadian Pacific Kansas City Ltd. | | | 633 | | | | 50 | | |
Canadian Tire Corp. Ltd., Class A | | | 35 | | | | 3 | | |
Canadian Utilities Ltd., Class A | | | 92 | | | | 2 | | |
CCL Industries, Inc., Class B | | | 102 | | | | 5 | | |
Cenovus Energy, Inc. | | | 948 | | | | 19 | | |
CGI, Inc. (g) | | | 142 | | | | 14 | | |
Constellation Software, Inc. | | | 14 | | | | 40 | | |
Descartes Systems Group, Inc. (g) | | | 58 | | | | 6 | | |
Dollarama, Inc. | | | 189 | | | | 17 | | |
Element Fleet Management Corp. | | | 266 | | | | 5 | | |
Emera, Inc. | | | 195 | | | | 6 | | |
Empire Co. Ltd., Class A | | | 94 | | | | 2 | | |
Enbridge, Inc. | | | 1,455 | | | | 52 | | |
Fairfax Financial Holdings Ltd. | | | 14 | | | | 16 | | |
First Quantum Minerals Ltd. | | | 479 | | | | 6 | | |
FirstService Corp. | | | 28 | | | | 4 | | |
Fortis, Inc. | | | 336 | | | | 13 | | |
Franco-Nevada Corp. | | | 131 | | | | 16 | | |
George Weston Ltd. | | | 41 | | | | 6 | | |
GFL Environmental, Inc. | | | 150 | | | | 6 | | |
Gildan Activewear, Inc. | | | 105 | | | | 4 | | |
Great-West Lifeco, Inc. | | | 192 | | | | 6 | | |
Hydro One Ltd. | | | 224 | | | | 6 | | |
iA Financial Corp., Inc. | | | 67 | | | | 4 | | |
IGM Financial, Inc. | | | 58 | | | | 2 | | |
Imperial Oil Ltd. | | | 127 | | | | 9 | | |
Intact Financial Corp. | | | 121 | | | | 20 | | |
Ivanhoe Mines Ltd., Class A (g) | | | 425 | | | | 5 | | |
Keyera Corp. | | | 157 | | | | 4 | | |
Kinross Gold Corp. | | | 844 | | | | 7 | | |
Loblaw Cos. Ltd. | | | 106 | | | | 12 | | |
Lundin Mining Corp. | | | 439 | | | | 5 | | |
The accompanying notes are an integral part of the consolidated financial statements.
7
Morgan Stanley Variable Insurance Fund, Inc.
June 30, 2024 (unaudited)
Consolidated Portfolio of Investments (cont'd)
Global Strategist Portfolio
| | | Shares | | Value
(000) | |
Canada (cont'd) | |
Magna International, Inc. | | | 185 | | | $ | 8 | | |
Manulife Financial Corp. | | | 1,220 | | | | 32 | | |
MEG Energy Corp. (g) | | | 184 | | | | 4 | | |
Metro, Inc. | | | 154 | | | | 9 | | |
National Bank of Canada | | | 234 | | | | 19 | | |
Northland Power, Inc. | | | 174 | | | | 3 | | |
Nutrien Ltd. | | | 338 | | | | 17 | | |
Onex Corp. | | | 45 | | | | 3 | | |
Open Text Corp. | | | 188 | | | | 6 | | |
Pan American Silver Corp. | | | 252 | | | | 5 | | |
Parkland Corp. | | | 96 | | | | 3 | | |
Pembina Pipeline Corp. | | | 394 | | | | 15 | | |
Power Corp. of Canada | | | 383 | | | | 11 | | |
Quebecor, Inc., Class B | | | 104 | | | | 2 | | |
RB Global, Inc. | | | 125 | | | | 10 | | |
Restaurant Brands International, Inc. | | | 206 | | | | 14 | | |
RioCan Real Estate Investment Trust REIT | | | 103 | | | | 1 | | |
Rogers Communications, Inc., Class B | | | 245 | | | | 9 | | |
Royal Bank of Canada | | | 955 | | | | 102 | | |
Saputo, Inc. | | | 172 | | | | 4 | | |
Shopify, Inc., Class A (g) | | | 833 | | | | 55 | | |
Stantec, Inc. | | | 79 | | | | 7 | | |
Sun Life Financial, Inc. | | | 397 | | | | 19 | | |
Suncor Energy, Inc. | | | 870 | | | | 33 | | |
TC Energy Corp. | | | 706 | | | | 27 | | |
Teck Resources Ltd., Class B | | | 309 | | | | 15 | | |
TELUS Corp. | | | 334 | | | | 5 | | |
TFI International, Inc. | | | 55 | | | | 8 | | |
Thomson Reuters Corp. | | | 109 | | | | 18 | | |
TMX Group Ltd. | | | 190 | | | | 5 | | |
Toromont Industries Ltd. | | | 57 | | | | 5 | | |
Toronto-Dominion Bank | | | 1,206 | | | | 66 | | |
Tourmaline Oil Corp. | | | 225 | | | | 10 | | |
West Fraser Timber Co. Ltd. | | | 38 | | | | 3 | | |
Wheaton Precious Metals Corp. | | | 310 | | | | 16 | | |
WSP Global, Inc. | | | 85 | | | | 13 | | |
| | | | 1,320 | | |
China (0.0%) | |
China Common Rich Renewable Energy
Investments Ltd. (g)(h) | | | 18,000 | | | | — | | |
Denmark (0.5%) | |
AP Moller — Maersk AS Series B | | | 5 | | | | 8 | | |
Carlsberg AS Series B | | | 66 | | | | 8 | | |
Coloplast AS Series B | | | 86 | | | | 10 | | |
Danske Bank AS | | | 464 | | | | 14 | | |
Demant AS (g) | | | 67 | | | | 3 | | |
DSV AS | | | 116 | | | | 18 | | |
Genmab AS (g) | | | 45 | | | | 11 | | |
Novo Nordisk AS, Class B | | | 2,231 | | | | 319 | | |
Novozymes AS Series B | | | 255 | | | | 16 | | |
Orsted AS (g) | | | 128 | | | | 7 | | |
Pandora AS | | | 56 | | | | 8 | | |
| | | Shares | | Value
(000) | |
Rockwool AS, Class B | | | 6 | | | $ | 3 | | |
Tryg AS | | | 236 | | | | 5 | | |
Vestas Wind Systems AS (g) | | | 681 | | | | 16 | | |
| | | | 446 | | |
Finland (0.2%) | |
Elisa OYJ | | | 101 | | | | 5 | | |
Fortum OYJ | | | 319 | | | | 5 | | |
Kesko OYJ, Class B | | | 189 | | | | 3 | | |
Kone OYJ, Class B | | | 236 | | | | 12 | | |
Metso OYJ | | | 431 | | | | 5 | | |
Neste OYJ | | | 299 | | | | 5 | | |
Nokia OYJ | | | 3,605 | | | | 14 | | |
Nordea Bank Abp | | | 6,969 | | | | 83 | | |
Orion OYJ, Class B | | | 75 | | | | 3 | | |
Sampo OYJ, Class A | | | 317 | | | | 14 | | |
Stora Enso OYJ, Class R | | | 407 | | | | 5 | | |
UPM-Kymmene OYJ | | | 383 | | | | 13 | | |
Wartsila OYJ Abp | | | 350 | | | | 7 | | |
| | | | 174 | | |
France (1.6%) | |
Accor SA | | | 123 | | | | 5 | | |
Aeroports de Paris | | | 22 | | | | 3 | | |
Air Liquide SA | | | 369 | | | | 64 | | |
Airbus SE | | | 381 | | | | 52 | | |
Alstom SA | | | 223 | | | | 4 | | |
Amundi SA | | | 39 | | | | 2 | | |
ArcelorMittal SA | | | 297 | | | | 7 | | |
Arkema SA | | | 38 | | | | 3 | | |
AXA SA | | | 1,160 | | | | 38 | | |
BioMerieux | | | 26 | | | | 2 | | |
BNP Paribas SA | | | 2,211 | | | | 141 | | |
Bollore SE | | | 457 | | | | 3 | | |
Bouygues SA | | | 121 | | | | 4 | | |
Bureau Veritas SA | | | 203 | | | | 6 | | |
Capgemini SE | | | 100 | | | | 20 | | |
Carrefour SA | | | 363 | | | | 5 | | |
Cie de Saint-Gobain SA | | | 292 | | | | 23 | | |
Cie Generale des Etablissements Michelin SCA | | | 432 | | | | 17 | | |
Covivio SA REIT | | | 33 | | | | 2 | | |
Credit Agricole SA | | | 2,261 | | | | 31 | | |
Danone SA | | | 411 | | | | 25 | | |
Dassault Aviation SA | | | 13 | | | | 2 | | |
Dassault Systemes SE | | | 429 | | | | 16 | | |
Edenred SE | | | 157 | | | | 7 | | |
Eiffage SA | | | 47 | | | | 4 | | |
Engie SA | | | 1,174 | | | | 17 | | |
EssilorLuxottica SA | | | 190 | | | | 41 | | |
Eurazeo SE | | | 29 | | | | 2 | | |
Eurofins Scientific SE | | | 107 | | | | 5 | | |
Euronext NV | | | 52 | | | | 5 | | |
Gecina SA REIT | | | 29 | | | | 3 | | |
Getlink SE | | | 195 | | | | 3 | | |
Hermes International | | | 20 | | | | 46 | | |
The accompanying notes are an integral part of the consolidated financial statements.
8
Morgan Stanley Variable Insurance Fund, Inc.
June 30, 2024 (unaudited)
Consolidated Portfolio of Investments (cont'd)
Global Strategist Portfolio
| | | Shares | | Value
(000) | |
France (cont'd) | |
Ipsen SA | | | 24 | | | $ | 3 | | |
Kering SA | | | 47 | | | | 17 | | |
Klepierre SA REIT | | | 138 | | | | 4 | | |
La Francaise des Jeux SAEM | | | 67 | | | | 2 | | |
Legrand SA | | | 168 | | | | 17 | | |
L'Oreal SA | | | 155 | | | | 68 | | |
LVMH Moet Hennessy Louis Vuitton SE | | | 176 | | | | 135 | | |
Orange SA | | | 1,201 | | | | 12 | | |
Pernod Ricard SA | | | 129 | | | | 18 | | |
Publicis Groupe SA | | | 145 | | | | 15 | | |
Remy Cointreau SA | | | 14 | | | | 1 | | |
Renault SA | | | 122 | | | | 6 | | |
Rexel SA | | | 143 | | | | 4 | | |
Safran SA | | | 216 | | | | 45 | | |
Sanofi SA | | | 713 | | | | 69 | | |
Sartorius Stedim Biotech | | | 19 | | | | 3 | | |
Schneider Electric SE | | | 347 | | | | 83 | | |
SEB SA | | | 16 | | | | 2 | | |
Societe Generale SA | | | 1,555 | | | | 37 | | |
Sodexo SA | | | 56 | | | | 5 | | |
STMicroelectronics NV | | | 434 | | | | 17 | | |
Teleperformance SE | | | 34 | | | | 4 | | |
Thales SA | | | 60 | | | | 10 | | |
TotalEnergies SE | | | 1,377 | | | | 92 | | |
Unibail-Rodamco-Westfield REIT | | | 75 | | | | 6 | | |
Veolia Environnement SA | | | 441 | | | | 13 | | |
Vinci SA | | | 318 | | | | 33 | | |
Vivendi SE | | | 461 | | | | 5 | | |
| | | | 1,334 | | |
Germany (1.2%) | |
adidas AG | | | 111 | | | | 27 | | |
Allianz SE (Registered) | | | 267 | | | | 74 | | |
BASF SE | | | 601 | | | | 29 | | |
Bayer AG (Registered) | | | 661 | | | | 19 | | |
Bayerische Motoren Werke AG | | | 211 | | | | 20 | | |
Bayerische Motoren Werke AG (Preference) | | | 39 | | | | 3 | | |
Bechtle AG | | | 56 | | | | 3 | | |
Beiersdorf AG | | | 69 | | | | 10 | | |
Brenntag SE | | | 88 | | | | 6 | | |
Carl Zeiss Meditec AG | | | 27 | | | | 2 | | |
Commerzbank AG | | | 2,287 | | | | 35 | | |
Continental AG | | | 75 | | | | 4 | | |
Covestro AG (g) | | | 122 | | | | 7 | | |
CTS Eventim AG & Co. KGaA | | | 43 | | | | 4 | | |
Daimler Truck Holding AG | | | 361 | | | | 14 | | |
Delivery Hero SE (g) | | | 129 | | | | 3 | | |
Deutsche Bank AG (Registered) | | | 1,275 | | | | 20 | | |
Deutsche Boerse AG | | | 130 | | | | 27 | | |
Deutsche Lufthansa AG (Registered) | | | 401 | | | | 2 | | |
Deutsche Post AG (Registered) | | | 672 | | | | 27 | | |
Deutsche Telekom AG (Registered) | | | 2,199 | | | | 55 | | |
Dr Ing hc F Porsche AG (Preference) | | | 75 | | | | 6 | | |
| | | Shares | | Value
(000) | |
E.ON SE | | | 1,546 | | | $ | 20 | | |
Evonik Industries AG | | | 174 | | | | 4 | | |
Fresenius Medical Care AG | | | 138 | | | | 5 | | |
Fresenius SE & Co. KGaA (g) | | | 288 | | | | 9 | | |
GEA Group AG | | | 105 | | | | 4 | | |
Hannover Rueck SE (Registered) | | | 41 | | | | 10 | | |
Heidelberg Materials AG | | | 92 | | | | 10 | | |
Henkel AG & Co. KGaA | | | 71 | | | | 6 | | |
Henkel AG & Co. KGaA (Preference) | | | 115 | | | | 10 | | |
Infineon Technologies AG | | | 885 | | | | 32 | | |
Knorr-Bremse AG | | | 49 | | | | 4 | | |
LEG Immobilien SE | | | 51 | | | | 4 | | |
Mercedes-Benz Group AG (Registered) | | | 536 | | | | 37 | | |
Merck KGaA | | | 89 | | | | 15 | | |
MTU Aero Engines AG | | | 37 | | | | 9 | | |
Muenchener Rueckversicherungs-Gesellschaft
AG in Muenchen (Registered) | | | 93 | | | | 47 | | |
Nemetschek SE | | | 40 | | | | 4 | | |
Porsche Automobil Holding SE (Preference) | | | 103 | | | | 5 | | |
Puma SE | | | 71 | | | | 3 | | |
QIAGEN NV (g) | | | 153 | | | | 6 | | |
Rational AG | | | 3 | | | | 3 | | |
Rheinmetall AG | | | 29 | | | | 15 | | |
RWE AG | | | 433 | | | | 15 | | |
SAP SE | | | 726 | | | | 146 | | |
Sartorius AG (Preference) | | | 18 | | | | 4 | | |
Scout24 SE | | | 51 | | | | 4 | | |
Siemens AG (Registered) | | | 514 | | | | 96 | | |
Siemens Energy AG (g) | | | 394 | | | | 10 | | |
Siemens Healthineers AG | | | 193 | | | | 11 | | |
Symrise AG | | | 90 | | | | 11 | | |
Talanx AG | | | 44 | | | | 4 | | |
Volkswagen AG | | | 20 | | | | 2 | | |
Volkswagen AG (Preference) | | | 137 | | | | 15 | | |
Vonovia SE | | | 497 | | | | 14 | | |
Zalando SE (g) | | | 164 | | | | 4 | | |
| | | | 995 | | |
Hong Kong (0.1%) | |
AIA Group Ltd. | | | 3,508 | | | | 24 | | |
BOC Hong Kong Holdings Ltd. | | | 1,153 | | | | 4 | | |
CK Asset Holdings Ltd. | | | 597 | | | | 2 | | |
CK Hutchison Holdings Ltd. | | | 827 | | | | 4 | | |
CK Infrastructure Holdings Ltd. | | | 194 | | | | 1 | | |
CLP Holdings Ltd. | | | 510 | | | | 4 | | |
Futu Holdings Ltd. ADR (g) | | | 17 | | | | 1 | | |
Galaxy Entertainment Group Ltd. | | | 692 | | | | 3 | | |
Hang Seng Bank Ltd. | | | 236 | | | | 3 | | |
Henderson Land Development Co. Ltd. | | | 444 | | | | 1 | | |
HKT Trust & HKT Ltd. | | | 1,181 | | | | 1 | | |
Hong Kong & China Gas Co. Ltd. | | | 3,414 | | | | 3 | | |
Hong Kong Exchanges & Clearing Ltd. | | | 373 | | | | 12 | | |
Hongkong Land Holdings Ltd. | | | 348 | | | | 1 | | |
Jardine Matheson Holdings Ltd. | | | 49 | | | | 2 | | |
The accompanying notes are an integral part of the consolidated financial statements.
9
Morgan Stanley Variable Insurance Fund, Inc.
June 30, 2024 (unaudited)
Consolidated Portfolio of Investments (cont'd)
Global Strategist Portfolio
| | | Shares | | Value
(000) | |
Hong Kong (cont'd) | |
Link REIT | | | 796 | | | $ | 3 | | |
MTR Corp. Ltd. | | | 482 | | | | 1 | | |
Power Assets Holdings Ltd. | | | 424 | | | | 2 | | |
Sands China Ltd. (g) | | | 758 | | | | 2 | | |
Sino Land Co. Ltd. | | | 1,215 | | | | 1 | | |
SITC International Holdings Co. Ltd. | | | 414 | | | | 1 | | |
Sun Hung Kai Properties Ltd. | | | 453 | | | | 4 | | |
Swire Pacific Ltd., Class A | | | 128 | | | | 1 | | |
Swire Properties Ltd. | | | 386 | | | | 1 | | |
Techtronic Industries Co. Ltd. | | | 424 | | | | 5 | | |
WH Group Ltd. | | | 2,513 | | | | 2 | | |
Wharf Holdings Ltd. | | | 331 | | | | 1 | | |
Wharf Real Estate Investment Co. Ltd. | | | 519 | | | | 1 | | |
| | | | 91 | | |
Ireland (0.1%) | |
AIB Group PLC | | | 3,572 | | | | 19 | | |
Bank of Ireland Group PLC | | | 2,312 | | | | 24 | | |
Kerry Group PLC, Class A | | | 113 | | | | 9 | | |
Kingspan Group PLC | | | 114 | | | | 10 | | |
Smurfit Kappa Group PLC | | | 194 | | | | 9 | | |
| | | | 71 | | |
Israel (0.1%) | |
Azrieli Group Ltd. | | | 30 | | | | 2 | | |
Bank Hapoalim BM | | | 875 | | | | 8 | | |
Bank Leumi Le-Israel BM | | | 1,050 | | | | 9 | | |
Check Point Software Technologies Ltd. (g) | | | 64 | | | | 11 | | |
CyberArk Software Ltd. (g) | | | 30 | | | | 8 | | |
Elbit Systems Ltd. | | | 19 | | | | 3 | | |
Global-e Online Ltd. (g) | | | 69 | | | | 2 | | |
ICL Group Ltd. | | | 538 | | | | 2 | | |
Israel Discount Bank Ltd., Class A | | | 860 | | | | 4 | | |
Mizrahi Tefahot Bank Ltd. | | | 108 | | | | 4 | | |
Monday.com Ltd. (g) | | | 26 | | | | 6 | | |
Nice Ltd. (g) | | | 42 | | | | 7 | | |
Teva Pharmaceutical Industries Ltd. ADR (g) | | | 789 | | | | 13 | | |
Wix.com Ltd. (g) | | | 37 | | | | 6 | | |
| | | | 85 | | |
Italy (0.6%) | |
Amplifon SpA | | | 85 | | | | 3 | | |
Assicurazioni Generali SpA | | | 699 | | | | 17 | | |
Banco BPM SpA | | | 2,676 | | | | 17 | | |
Davide Campari-Milano NV | | | 428 | | | | 4 | | |
DiaSorin SpA | | | 16 | | | | 2 | | |
Enel SpA | | | 5,631 | | | | 39 | | |
Eni SpA | | | 1,471 | | | | 23 | | |
EXOR NV | | | 160 | | | | 17 | | |
Ferrari NV | | | 86 | | | | 35 | | |
FinecoBank Banca Fineco SpA | | | 1,334 | | | | 20 | | |
Infrastrutture Wireless Italiane SpA | | | 232 | | | | 2 | | |
Intesa Sanpaolo SpA | | | 33,137 | | | | 123 | | |
| | | Shares | | Value
(000) | |
Leonardo SpA | | | 283 | | | $ | 7 | | |
Mediobanca Banca di Credito Finanziario SpA | | | 1,173 | | | | 17 | | |
Moncler SpA | | | 151 | | | | 9 | | |
Nexi SpA (g) | | | 411 | | | | 2 | | |
Poste Italiane SpA | | | 332 | | | | 4 | | |
Prysmian SpA | | | 180 | | | | 11 | | |
Recordati Industria Chimica e Farmaceutica SpA | | | 72 | | | | 4 | | |
Snam SpA | | | 1,453 | | | | 6 | | |
Stellantis NV | | | 1,512 | | | | 30 | | |
Telecom Italia SpA (Milano) (g) | | | 6,927 | | | | 2 | | |
Tenaris SA | | | 326 | | | | 5 | | |
Terna — Rete Elettrica Nazionale | | | 1,003 | | | | 8 | | |
UniCredit SpA | | | 3,405 | | | | 126 | | |
| | | | 533 | | |
Netherlands (0.9%) | |
ABN AMRO Bank NV CVA | | | 1,004 | | | | 17 | | |
Adyen NV (g) | | | 15 | | | | 18 | | |
Aegon Ltd. | | | 923 | | | | 6 | | |
AerCap Holdings NV | | | 141 | | | | 13 | | |
Akzo Nobel NV | | | 116 | | | | 7 | | |
ASM International NV | | | 32 | | | | 25 | | |
| ASML Holding NV | | | 273 | | | | 278 | | |
| ASR Nederland NV | | | 106 | | | | 5 | | |
Basic-Fit NV (g) | | | 788 | | | | 17 | | |
BE Semiconductor Industries NV | | | 53 | | | | 9 | | |
Coca-Cola Europacific Partners PLC | | | 142 | | | | 10 | | |
DSM BV (g) | | | 148 | | | | 15 | | |
DSM-Firmenich AG | | | 125 | | | | 14 | | |
Heineken Holding NV | | | 89 | | | | 7 | | |
Heineken NV | | | 198 | | | | 19 | | |
IMCD NV | | | 39 | | | | 5 | | |
ING Groep NV | | | 7,631 | | | | 131 | | |
InPost SA (g) | | | 138 | | | | 2 | | |
JDE Peet's NV | | | 83 | | | | 2 | | |
Koninklijke Ahold Delhaize NV | | | 644 | | | | 19 | | |
Koninklijke KPN NV | | | 2,693 | | | | 10 | | |
Koninklijke Philips NV (g) | | | 552 | | | | 14 | | |
NN Group NV | | | 183 | | | | 9 | | |
OCI NV | | | 73 | | | | 2 | | |
Prosus NV (g) | | | 962 | | | | 34 | | |
Randstad NV | | | 74 | | | | 3 | | |
Universal Music Group NV | | | 558 | | | | 17 | | |
Wolters Kluwer NV | | | 169 | | | | 28 | | |
| | | | 736 | | |
New Zealand (0.0%)‡ | |
Auckland International Airport Ltd. | | | 775 | | | | 3 | | |
Fisher & Paykel Healthcare Corp. Ltd. | | | 342 | | | | 6 | | |
Mercury NZ Ltd. | | | 405 | | | | 2 | | |
Meridian Energy Ltd. | | | 738 | | | | 3 | | |
Spark New Zealand Ltd. | | | 1,064 | | | | 3 | | |
| | | | 17 | | |
The accompanying notes are an integral part of the consolidated financial statements.
10
Morgan Stanley Variable Insurance Fund, Inc.
June 30, 2024 (unaudited)
Consolidated Portfolio of Investments (cont'd)
Global Strategist Portfolio
| | | Shares | | Value
(000) | |
Norway (0.1%) | |
Aker BP ASA | | | 216 | | | $ | 6 | | |
DNB Bank ASA | | | 578 | | | | 11 | | |
Equinor ASA | | | 615 | | | | 18 | | |
Gjensidige Forsikring ASA | | | 138 | | | | 2 | | |
Kongsberg Gruppen ASA | | | 61 | | | | 5 | | |
Mowi ASA | | | 320 | | | | 5 | | |
Norsk Hydro ASA | | | 894 | | | | 6 | | |
Orkla ASA | | | 482 | | | | 4 | | |
Salmar ASA | | | 46 | | | | 2 | | |
Telenor ASA | | | 431 | | | | 5 | | |
Yara International ASA | | | 112 | | | | 3 | | |
| | | | 67 | | |
Portugal (0.0%)‡ | |
EDP — Energias de Portugal SA | | | 2,481 | | | | 9 | | |
EDP Renovaveis SA | | | 244 | | | | 4 | | |
Galp Energia SGPS SA | | | 365 | | | | 8 | | |
Jeronimo Martins SGPS SA | | | 222 | | | | 4 | | |
| | | | 25 | | |
Singapore (0.2%) | |
CapitaLand Ascendas REIT | | | 2,202 | | | | 4 | | |
CapitaLand Integrated Commercial Trust REIT | | | 3,169 | | | | 5 | | |
CapitaLand Investment Ltd. | | | 1,561 | | | | 3 | | |
DBS Group Holdings Ltd. | | | 1,168 | | | | 31 | | |
Genting Singapore Ltd. | | | 3,598 | | | | 2 | | |
Grab Holdings Ltd., Class A (g) | | | 1,239 | | | | 4 | | |
Keppel Ltd. | | | 853 | | | | 4 | | |
Oversea-Chinese Banking Corp. Ltd. | | | 1,969 | | | | 21 | | |
Sea Ltd. ADR (g) | | | 214 | | | | 15 | | |
Sembcorp Industries Ltd. | | | 543 | | | | 2 | | |
Singapore Airlines Ltd. | | | 874 | | | | 4 | | |
Singapore Exchange Ltd. | | | 509 | | | | 4 | | |
Singapore Technologies Engineering Ltd. | | | 904 | | | | 3 | | |
Singapore Telecommunications Ltd. | | | 4,835 | | | | 10 | | |
United Overseas Bank Ltd. | | | 744 | | | | 17 | | |
Wilmar International Ltd. | | | 1,122 | | | | 3 | | |
| | | | 132 | | |
South Africa (0.7%) | |
Absa Group Ltd. | | | 12,324 | | | | 107 | | |
Capitec Bank Holdings Ltd. | | | 1,263 | | | | 183 | | |
Nedbank Group Ltd. | | | 6,371 | | | | 90 | | |
Standard Bank Group Ltd. | | | 19,447 | | | | 227 | | |
| | | 607 | | |
Spain (0.5%) | |
Acciona SA | | | 10 | | | | 1 | | |
ACS Actividades de Construccion y Servicios SA | | | 83 | | | | 4 | | |
Aena SME SA | | | 32 | | | | 6 | | |
Amadeus IT Group SA | | | 188 | | | | 13 | | |
Banco Bilbao Vizcaya Argentaria SA | | | 11,274 | | | | 113 | | |
Banco de Sabadell SA | | | 2,248 | | | | 4 | | |
Banco Santander SA | | | 30,518 | | | | 142 | | |
| | | Shares | | Value
(000) | |
CaixaBank SA | | | 7,698 | | | $ | 41 | | |
Cellnex Telecom SA (g) | | | 205 | | | | 7 | | |
Endesa SA | | | 132 | | | | 3 | | |
Ferrovial SE | | | 214 | | | | 8 | | |
Grifols SA (g) | | | 123 | | | | 1 | | |
Iberdrola SA | | | 2,411 | | | | 31 | | |
Industria de Diseno Textil SA | | | 458 | | | | 23 | | |
Redeia Corp. SA | | | 170 | | | | 3 | | |
Repsol SA | | | 508 | | | | 8 | | |
Telefonica SA | | | 1,934 | | | | 8 | | |
| | | | 416 | | |
Sweden (0.4%) | |
Alfa Laval AB | | | 197 | | | | 9 | | |
Assa Abloy AB, Class B | | | 691 | | | | 19 | | |
Atlas Copco AB, Class A | | | 2,875 | | | | 51 | | |
Beijer Ref AB | | | 246 | | | | 4 | | |
Boliden AB | | | 188 | | | | 6 | | |
Epiroc AB, Class A | | | 725 | | | | 14 | | |
EQT AB | | | 251 | | | | 7 | | |
Essity AB, Class B | | | 418 | | | | 11 | | |
Evolution AB | | | 124 | | | | 13 | | |
Fastighets AB Balder, Class B (g) | | | 456 | | | | 3 | | |
Getinge AB, Class B | | | 155 | | | | 3 | | |
H & M Hennes & Mauritz AB, Class B | | | 399 | | | | 6 | | |
Hexagon AB, Class B | | | 1,438 | | | | 16 | | |
Holmen AB, Class B | | | 54 | | | | 2 | | |
Husqvarna AB, Class B | | | 241 | | | | 2 | | |
Industrivarden AB, Class A | | | 193 | | | | 7 | | |
Indutrade AB | | | 189 | | | | 5 | | |
Investment AB Latour, Class B | | | 104 | | | | 3 | | |
Investor AB, Class B | | | 1,191 | | | | 33 | | |
L E Lundbergforetagen AB, Class B | | | 52 | | | | 3 | | |
Lifco AB, Class B | | | 160 | | | | 4 | | |
Nibe Industrier AB, Class B | | | 1,064 | | | | 4 | | |
Saab AB, Class B | | | 218 | | | | 5 | | |
Sagax AB, Class B | | | 150 | | | | 4 | | |
Sandvik AB | | | 735 | | | | 15 | | |
Securitas AB, Class B | | | 338 | | | | 3 | | |
Skandinaviska Enskilda Banken AB, Class A | | | 1,096 | | | | 16 | | |
Skanska AB, Class B | | | 235 | | | | 4 | | |
| SKF AB, Class B | | | 235 | | | | 5 | | |
Svenska Cellulosa AB SCA, Class B | | | 418 | | | | 6 | | |
Svenska Handelsbanken AB, Class A | | | 1,001 | | | | 9 | | |
Swedbank AB, Class A | | | 579 | | | | 12 | | |
Swedish Orphan Biovitrum AB (g) | | | 135 | | | | 4 | | |
Tele2 AB, Class B | | | 369 | | | | 4 | | |
Telefonaktiebolaget LM Ericsson, Class B | | | 1,870 | | | | 12 | | |
Telia Co. AB | | | 1,602 | | | | 4 | | |
Trelleborg AB, Class B | | | 147 | | | | 6 | | |
Volvo AB, Class A | | | 1,221 | | | | 32 | | |
Volvo Car AB, Class B (g) | | | 483 | | | | 1 | | |
| | | | 367 | | |
The accompanying notes are an integral part of the consolidated financial statements.
11
Morgan Stanley Variable Insurance Fund, Inc.
June 30, 2024 (unaudited)
Consolidated Portfolio of Investments (cont'd)
Global Strategist Portfolio
| | | Shares | | Value
(000) | |
Switzerland (1.3%) | |
ABB Ltd. (Registered) | | | 1,095 | | | $ | 61 | | |
Adecco Group AG (Registered) | | | 115 | | | | 4 | | |
Alcon, Inc. | | | 344 | | | | 31 | | |
Avolta AG (Registered) | | | 63 | | | | 2 | | |
Bachem Holding AG | | | 23 | | | | 2 | | |
Baloise Holding AG (Registered) | | | 32 | | | | 6 | | |
Banque Cantonale Vaudoise (Registered) | | | 21 | | | | 2 | | |
Barry Callebaut AG (Registered) | | | 2 | | | | 3 | | |
BKW AG | | | 15 | | | | 2 | | |
Chocoladefabriken Lindt & Spruengli AG | | | 1 | | | | 12 | | |
Cie Financiere Richemont SA, Class A (Registered) | | | 370 | | | | 58 | | |
Clariant AG (Registered) (g) | | | 148 | | | | 2 | | |
EMS-Chemie Holding AG (Registered) | | | 5 | | | | 4 | | |
Geberit AG (Registered) | | | 23 | | | | 14 | | |
Givaudan SA (Registered) | | | 6 | | | | 28 | | |
Helvetia Holding AG (Registered) | | | 26 | | | | 4 | | |
Holcim AG (g) | | | 358 | | | | 32 | | |
Julius Baer Group Ltd. | | | 141 | | | | 8 | | |
Kuehne & Nagel International AG (Registered) | | | 33 | | | | 9 | | |
Logitech International SA (Registered) | | | 107 | | | | 10 | | |
Lonza Group AG (Registered) | | | 52 | | | | 28 | | |
Nestle SA (Registered) | | | 1,829 | | | | 187 | | |
Novartis AG (Registered) | | | 1,341 | | | | 143 | | |
Partners Group Holding AG | | | 16 | | | | 20 | | |
Roche Holding AG | | | 22 | | | | 7 | | |
Roche Holding AG (Genusschein) | | | 485 | | | | 134 | | |
Sandoz Group AG | | | 282 | | | | 10 | | |
Schindler Holding AG | | | 28 | | | | 7 | | |
Schindler Holding AG (Registered) | | | 16 | | | | 4 | | |
SGS SA (Registered) | | | 105 | | | | 9 | | |
SIG Group AG (g) | | | 209 | | | | 4 | | |
Sika AG (Registered) | | | 105 | | | | 30 | | |
Sonova Holding AG (Registered) | | | 35 | | | | 11 | | |
Straumann Holding AG (Registered) | | | 77 | | | | 9 | | |
Swatch Group AG | | | 20 | | | | 4 | | |
Swatch Group AG (Registered) | | | 37 | | | | 2 | | |
Swiss Life Holding AG (Registered) | | | 20 | | | | 15 | | |
Swiss Prime Site AG (Registered) | | | 53 | | | | 5 | | |
Swiss Re AG | | | 209 | | | | 26 | | |
Swisscom AG (Registered) | | | 18 | | | | 10 | | |
Temenos AG (Registered) | | | 44 | | | | 3 | | |
UBS Group AG (Registered) (g) | | | 2,243 | | | | 66 | | |
VAT Group AG | | | 19 | | | | 11 | | |
Zurich Insurance Group AG | | | 101 | | | | 54 | | |
| | | | 1,093 | | |
United Kingdom (2.1%) | |
| 3i Group PLC | | | 671 | | | | 26 | | |
Admiral Group PLC | | | 180 | | | | 6 | | |
Anglo American PLC | | | 874 | | | | 28 | | |
Antofagasta PLC | | | 267 | | | | 7 | | |
Ashtead Group PLC | | | 296 | | | | 20 | | |
Associated British Foods PLC | | | 228 | | | | 7 | | |
| | | Shares | | Value
(000) | |
AstraZeneca PLC | | | 1,073 | | | $ | 167 | | |
Auto Trader Group PLC | | | 622 | | | | 6 | | |
Aviva PLC | | | 1,858 | | | | 11 | | |
BAE Systems PLC | | | 2,079 | | | | 35 | | |
Barclays PLC | | | 10,260 | | | | 27 | | |
Barratt Developments PLC | | | 672 | | | | 4 | | |
Berkeley Group Holdings PLC | | | 74 | | | | 4 | | |
| BP PLC | | | 11,597 | | | | 70 | | |
British American Tobacco PLC | | | 1,366 | | | | 42 | | |
BT Group PLC | | | 4,400 | | | | 8 | | |
Bunzl PLC | | | 231 | | | | 9 | | |
Burberry Group PLC | | | 242 | | | | 3 | | |
Centrica PLC | | | 3,675 | | | | 6 | | |
Coca-Cola HBC AG (g) | | | 150 | | | | 5 | | |
Compass Group PLC | | | 1,171 | | | | 32 | | |
Croda International PLC | | | 91 | | | | 4 | | |
DCC PLC | | | 68 | | | | 5 | | |
Diageo PLC | | | 1,534 | | | | 48 | | |
Endeavour Mining PLC | | | 127 | | | | 3 | | |
Entain PLC | | | 436 | | | | 3 | | |
Evraz PLC (g)(h) | | | 464 | | | | — | | |
Experian PLC | | | 632 | | | | 29 | | |
Flutter Entertainment PLC (g) | | | 126 | | | | 23 | | |
G4S Ltd. (g) | | | 2,164 | | | | 7 | | |
Glencore PLC | | | 7,091 | | | | 40 | | |
GSK PLC | | | 2,837 | | | | 55 | | |
Haleon PLC | | | 4,745 | | | | 19 | | |
Halma PLC | | | 260 | | | | 9 | | |
Hargreaves Lansdown PLC | | | 245 | | | | 3 | | |
Hikma Pharmaceuticals PLC | | | 115 | | | | 3 | | |
HSBC Holdings PLC | | | 12,861 | | | | 111 | | |
Imperial Brands PLC | | | 560 | | | | 14 | | |
Informa PLC | | | 930 | | | | 10 | | |
InterContinental Hotels Group PLC | | | 112 | | | | 12 | | |
Intertek Group PLC | | | 111 | | | | 7 | | |
J Sainsbury PLC | | | 1,153 | | | | 4 | | |
JD Sports Fashion PLC | | | 1,728 | | | | 3 | | |
Kingfisher PLC | | | 1,294 | | | | 4 | | |
Land Securities Group PLC REIT | | | 486 | | | | 4 | | |
Legal & General Group PLC | | | 4,125 | | | | 12 | | |
Lloyds Banking Group PLC | | | 43,438 | | | | 30 | | |
London Stock Exchange Group PLC | | | 314 | | | | 37 | | |
M&G PLC | | | 1,546 | | | | 4 | | |
Melrose Industries PLC | | | 899 | | | | 6 | | |
Mondi PLC | | | 306 | | | | 6 | | |
National Grid PLC | | | 3,342 | | | | 37 | | |
NatWest Group PLC | | | 4,454 | | | | 17 | | |
Next PLC | | | 83 | | | | 9 | | |
Paragon Offshore PLC (g)(h) | | | 67 | | | | — | | |
Pearson PLC | | | 422 | | | | 5 | | |
Persimmon PLC | | | 219 | | | | 4 | | |
Phoenix Group Holdings PLC | | | 476 | | | | 3 | | |
Prudential PLC | | | 1,785 | | | | 16 | | |
Reckitt Benckiser Group PLC | | | 485 | | | | 26 | | |
The accompanying notes are an integral part of the consolidated financial statements.
12
Morgan Stanley Variable Insurance Fund, Inc.
June 30, 2024 (unaudited)
Consolidated Portfolio of Investments (cont'd)
Global Strategist Portfolio
| | | Shares | | Value
(000) | |
United Kingdom (cont'd) | |
RELX PLC (LSE) | | | 1,292 | | | $ | 59 | | |
Rentokil Initial PLC | | | 1,736 | | | | 10 | | |
Rio Tinto PLC | | | 780 | | | | 51 | | |
Rolls-Royce Holdings PLC (g) | | | 5,749 | | | | 33 | | |
Sage Group PLC | | | 697 | | | | 10 | | |
Schroders PLC | | | 553 | | | | 2 | | |
Segro PLC REIT | | | 873 | | | | 10 | | |
Severn Trent PLC | | | 186 | | | | 6 | | |
Shell PLC | | | 4,405 | | | | 158 | | |
Smith & Nephew PLC | | | 608 | | | | 8 | | |
Smiths Group PLC | | | 238 | | | | 5 | | |
Spirax Group PLC | | | 51 | | | | 5 | | |
SSE PLC | | | 753 | | | | 17 | | |
Standard Chartered PLC | | | 1,504 | | | | 14 | | |
Taylor Wimpey PLC | | | 2,436 | | | | 4 | | |
Tesco PLC | | | 4,835 | | | | 19 | | |
Unilever PLC CVA | | | 1,732 | | | | 95 | | |
United Utilities Group PLC | | | 473 | | | | 6 | | |
Vodafone Group PLC | | | 15,784 | | | | 14 | | |
Whitbread PLC | | | 126 | | | | 5 | | |
Wise PLC Class A (g) | | | 432 | | | | 4 | | |
WPP PLC | | | 728 | | | | 7 | | |
| | | 1,697 | | |
United States (22.2%) | |
3M Co. | | | 214 | | | | 22 | | |
A O Smith Corp. | | | 47 | | | | 4 | | |
Abbott Laboratories | | | 678 | | | | 70 | | |
AbbVie, Inc. | | | 681 | | | | 117 | | |
Accenture PLC, Class A | | | 245 | | | | 74 | | |
Adobe, Inc. (g) | | | 175 | | | | 97 | | |
Advanced Micro Devices, Inc. (g) | | | 636 | | | | 103 | | |
AECOM | | | 52 | | | | 5 | | |
AES Corp. | | | 269 | | | | 5 | | |
Aflac, Inc. | | | 211 | | | | 19 | | |
Agilent Technologies, Inc. | | | 112 | | | | 15 | | |
Air Products & Chemicals, Inc. | | | 87 | | | | 22 | | |
Airbnb, Inc., Class A (g) | | | 174 | | | | 26 | | |
Akamai Technologies, Inc. (g) | | | 59 | | | | 5 | | |
Albemarle Corp. | | | 46 | | | | 4 | | |
Albertsons Cos., Inc., Class A | | | 134 | | | | 3 | | |
Alexandria Real Estate Equities, Inc. REIT | | | 61 | | | | 7 | | |
Align Technology, Inc. (g) | | | 28 | | | | 7 | | |
Allegion PLC | | | 33 | | | | 4 | | |
Alliant Energy Corp. | | | 100 | | | | 5 | | |
Allstate Corp. | | | 102 | | | | 16 | | |
Ally Financial, Inc. | | | 105 | | | | 4 | | |
Alnylam Pharmaceuticals, Inc. (g) | | | 37 | | | | 9 | | |
Alphabet, Inc., Class A | | | 4,279 | | | | 782 | | |
Altria Group, Inc. | | | 663 | | | | 30 | | |
Amazon.com, Inc. (g) | | | 3,634 | | | | 702 | | |
Amcor PLC | | | 563 | | | | 6 | | |
Ameren Corp. | | | 103 | | | | 7 | | |
| | | Shares | | Value
(000) | |
American Electric Power Co., Inc. | | | 204 | | | $ | 18 | | |
American Express Co. | | | 222 | | | | 51 | | |
American Financial Group, Inc. | | | 28 | | | | 3 | | |
American Homes 4 Rent, Class A REIT | | | 127 | | | | 5 | | |
American International Group, Inc. | | | 260 | | | | 19 | | |
American Tower Corp. REIT | | | 181 | | | | 35 | | |
American Water Works Co., Inc. | | | 75 | | | | 10 | | |
Ameriprise Financial, Inc. | | | 39 | | | | 17 | | |
AMETEK, Inc. | | | 89 | | | | 15 | | |
Amgen, Inc. | | | 207 | | | | 65 | | |
Amphenol Corp., Class A | | | 473 | | | | 32 | | |
Analog Devices, Inc. | | | 194 | | | | 44 | | |
Annaly Capital Management, Inc. REIT | | | 192 | | | | 4 | | |
ANSYS, Inc. (g) | | | 34 | | | | 11 | | |
Aon PLC, Class A | | | 78 | | | | 23 | | |
APA Corp. | | | 141 | | | | 4 | | |
Apollo Global Management, Inc. | | | 155 | | | | 18 | | |
Apple, Inc. | | | 5,680 | | | | 1,196 | | |
Applied Materials, Inc. | | | 328 | | | | 77 | | |
AppLovin Corp., Class A (g) | | | 71 | | | | 6 | | |
Aptiv PLC (g) | | | 105 | | | | 7 | | |
Arch Capital Group Ltd. (g) | | | 146 | | | | 15 | | |
Archer-Daniels-Midland Co. | | | 195 | | | | 12 | | |
Ares Management Corp., Class A | | | 69 | | | | 9 | | |
Arista Networks, Inc. (g) | | | 106 | | | | 37 | | |
Arthur J Gallagher & Co. | | | 85 | | | | 22 | | |
Aspen Technology, Inc. (g) | | | 11 | | | | 2 | | |
Assurant, Inc. | | | 20 | | | | 3 | | |
AT&T, Inc. | | | 2,765 | | | | 53 | | |
Atlassian Corp., Class A (g) | | | 61 | | | | 11 | | |
Atmos Energy Corp. | | | 58 | | | | 7 | | |
Autodesk, Inc. (g) | | | 84 | | | | 21 | | |
Automatic Data Processing, Inc. | | | 160 | | | | 38 | | |
AutoZone, Inc. (g) | | | 7 | | | | 21 | | |
AvalonBay Communities, Inc. REIT | | | 55 | | | | 11 | | |
Avantor, Inc. (g) | | | 260 | | | | 6 | | |
Avery Dennison Corp. | | | 31 | | | | 7 | | |
Axon Enterprise, Inc. (g) | | | 28 | | | | 8 | | |
Baker Hughes Co. | | | 383 | | | | 13 | | |
Ball Corp. | | | 121 | | | | 7 | | |
Bank of America Corp. | | | 2,729 | | | | 109 | | |
Bank of New York Mellon Corp. | | | 291 | | | | 17 | | |
Bath & Body Works, Inc. | | | 83 | | | | 3 | | |
Baxter International, Inc. | | | 200 | | | | 7 | | |
Becton Dickinson & Co. | | | 113 | | | | 26 | | |
Bentley Systems, Inc., Class B | | | 62 | | | | 3 | | |
Berkshire Hathaway, Inc., Class B (g) | | | 507 | | | | 206 | | |
Best Buy Co., Inc. | | | 76 | | | | 6 | | |
Biogen, Inc. (g) | | | 56 | | | | 13 | | |
BioMarin Pharmaceutical, Inc. (g) | | | 73 | | | | 6 | | |
Bio-Rad Laboratories, Inc., Class A (g) | | | 8 | | | | 2 | | |
Bio-Techne Corp. | | | 61 | | | | 4 | | |
BlackRock, Inc. | | | 58 | | | | 46 | | |
The accompanying notes are an integral part of the consolidated financial statements.
13
Morgan Stanley Variable Insurance Fund, Inc.
June 30, 2024 (unaudited)
Consolidated Portfolio of Investments (cont'd)
Global Strategist Portfolio
| | | Shares | | Value
(000) | |
United States (cont'd) | |
Blackstone, Inc. | | | 275 | | | $ | 34 | | |
Block, Inc., Class A (g) | | | 211 | | | | 14 | | |
Boeing Co. (g) | | | 224 | | | | 41 | | |
Booking Holdings, Inc. | | | 13 | | | | 51 | | |
Booz Allen Hamilton Holding Corp. | | | 50 | | | | 8 | | |
Boston Properties, Inc. REIT | | | 57 | | | | 4 | | |
Boston Scientific Corp. (g) | | | 576 | | | | 44 | | |
Bristol-Myers Squibb Co. | | | 792 | | | | 33 | | |
Broadcom, Inc. | | | 174 | | | | 279 | | |
Broadridge Financial Solutions, Inc. | | | 46 | | | | 9 | | |
Brown & Brown, Inc. | | | 95 | | | | 8 | | |
Brown-Forman Corp., Class B | | | 71 | | | | 3 | | |
Builders FirstSource, Inc. (g) | | | 47 | | | | 7 | | |
Bunge Global SA | | | 55 | | | | 6 | | |
Burlington Stores, Inc. (g) | | | 25 | | | | 6 | | |
Cadence Design Systems, Inc. (g) | | | 108 | | | | 33 | | |
Caesars Entertainment, Inc. (g) | | | 84 | | | | 3 | | |
Camden Property Trust REIT | | | 41 | | | | 4 | | |
Campbell Soup Co. | | | 73 | | | | 3 | | |
Capital One Financial Corp. | | | 148 | | | | 20 | | |
Cardinal Health, Inc. | | | 94 | | | | 9 | | |
Carlisle Cos., Inc. | | | 18 | | | | 7 | | |
Carlyle Group, Inc. | | | 91 | | | | 4 | | |
CarMax, Inc. (g) | | | 61 | | | | 4 | | |
Carnival Corp. (g) | | | 390 | | | | 7 | | |
Carrier Global Corp. | | | 305 | | | | 19 | | |
Catalent, Inc. (g) | | | 70 | | | | 4 | | |
Caterpillar, Inc. | | | 192 | | | | 64 | | |
Cboe Global Markets, Inc. | | | 42 | | | | 7 | | |
CBRE Group, Inc., Class A (g) | | | 119 | | | | 11 | | |
CDW Corp. | | | 52 | | | | 12 | | |
Celanese Corp. | | | 43 | | | | 6 | | |
Celsius Holdings, Inc. (g) | | | 61 | | | | 3 | | |
Cencora, Inc. | | | 69 | | | | 16 | | |
Centene Corp. (g) | | | 206 | | | | 14 | | |
CenterPoint Energy, Inc. | | | 245 | | | | 8 | | |
CF Industries Holdings, Inc. | | | 71 | | | | 5 | | |
CH Robinson Worldwide, Inc. | | | 44 | | | | 4 | | |
Charles River Laboratories International, Inc. (g) | | | 20 | | | | 4 | | |
Charles Schwab Corp. | | | 581 | | | | 43 | | |
Charter Communications, Inc., Class A (g) | | | 37 | | | | 11 | | |
Cheniere Energy, Inc. | | | 89 | | | | 16 | | |
Chesapeake Energy Corp. | | | 42 | | | | 3 | | |
Chevron Corp. | | | 675 | | | | 106 | | |
Chipotle Mexican Grill, Inc. (g) | | | 550 | | | | 34 | | |
Chord Energy Corp. | | | 24 | | | | 4 | | |
Chubb Ltd. | | | 158 | | | | 40 | | |
Church & Dwight Co., Inc. | | | 96 | | | | 10 | | |
Cigna Group | | | 109 | | | | 36 | | |
Cincinnati Financial Corp. | | | 60 | | | | 7 | | |
Cintas Corp. | | | 36 | | | | 25 | | |
Cisco Systems, Inc. | | | 1,569 | | | | 75 | | |
| | | Shares | | Value
(000) | |
Citigroup, Inc. | | | 738 | | | $ | 47 | | |
Citizens Financial Group, Inc. | | | 176 | | | | 6 | | |
Cleveland-Cliffs, Inc. (g) | | | 194 | | | | 3 | | |
Clorox Co. | | | 48 | | | | 7 | | |
Cloudflare, Inc., Class A (g) | | | 116 | | | | 10 | | |
CME Group, Inc. | | | 139 | | | | 27 | | |
CMS Energy Corp. | | | 115 | | | | 7 | | |
| CNH Industrial NV | | | 335 | | | | 3 | | |
Coca-Cola Co. | | | 1,576 | | | | 100 | | |
Cognizant Technology Solutions Corp., Class A | | | 193 | | | | 13 | | |
Coinbase Global, Inc., Class A (g) | | | 75 | | | | 17 | | |
Colgate-Palmolive Co. | | | 302 | | | | 29 | | |
Comcast Corp., Class A | | | 1,545 | | | | 60 | | |
Conagra Brands, Inc. | | | 183 | | | | 5 | | |
Confluent, Inc., Class A (g) | | | 79 | | | | 2 | | |
ConocoPhillips | | | 450 | | | | 51 | | |
Consolidated Edison, Inc. | | | 133 | | | | 12 | | |
Constellation Brands, Inc., Class A | | | 64 | | | | 16 | | |
Constellation Energy Corp. | | | 122 | | | | 24 | | |
Cooper Cos., Inc. | | | 78 | | | | 7 | | |
Copart, Inc. (g) | | | 335 | | | | 18 | | |
Corebridge Financial, Inc. | | | 97 | | | | 3 | | |
Corning, Inc. | | | 315 | | | | 12 | | |
Corpay, Inc. (g) | | | 26 | | | | 7 | | |
Corteva, Inc. | | | 272 | | | | 15 | | |
CoStar Group, Inc. (g) | | | 159 | | | | 12 | | |
Costco Wholesale Corp. | | | 174 | | | | 148 | | |
Coterra Energy, Inc. | | | 286 | | | | 8 | | |
CRH PLC ADR | | | 269 | | | | 20 | | |
Crowdstrike Holdings, Inc., Class A (g) | | | 90 | | | | 34 | | |
Crown Castle, Inc. REIT | | | 169 | | | | 17 | | |
Crown Holdings, Inc. | | | 46 | | | | 3 | | |
CSX Corp. | | | 762 | | | | 25 | | |
Cummins, Inc. | | | 52 | | | | 14 | | |
CVS Health Corp. | | | 490 | | | | 29 | | |
Danaher Corp. | | | 272 | | | | 68 | | |
Darden Restaurants, Inc. | | | 47 | | | | 7 | | |
Datadog, Inc., Class A (g) | | | 107 | | | | 14 | | |
DaVita, Inc. (g) | | | 21 | | | | 3 | | |
Dayforce, Inc. (g) | | | 58 | | | | 3 | | |
Deckers Outdoor Corp. (g) | | | 10 | | | | 10 | | |
Deere & Co. | | | 102 | | | | 38 | | |
Dell Technologies, Inc., Class C | | | 106 | | | | 15 | | |
Delta Air Lines, Inc. | | | 61 | | | | 3 | | |
Devon Energy Corp. | | | 244 | | | | 12 | | |
Dexcom, Inc. (g) | | | 155 | | | | 18 | | |
Diamondback Energy, Inc. | | | 65 | | | | 13 | | |
Dick's Sporting Goods, Inc. | | | 23 | | | | 5 | | |
Digital Realty Trust, Inc. REIT | | | 121 | | | | 18 | | |
Discover Financial Services | | | 98 | | | | 13 | | |
DocuSign, Inc. (g) | | | 80 | | | | 4 | | |
Dollar General Corp. | | | 85 | | | | 11 | | |
Dollar Tree, Inc. (g) | | | 80 | | | | 9 | | |
The accompanying notes are an integral part of the consolidated financial statements.
14
Morgan Stanley Variable Insurance Fund, Inc.
June 30, 2024 (unaudited)
Consolidated Portfolio of Investments (cont'd)
Global Strategist Portfolio
| | | Shares | | Value
(000) | |
United States (cont'd) | |
Dominion Energy, Inc. | | | 325 | | | $ | 16 | | |
Domino's Pizza, Inc. | | | 13 | | | | 7 | | |
DoorDash, Inc., Class A (g) | | | 111 | | | | 12 | | |
Dover Corp. | | | 53 | | | | 10 | | |
Dow, Inc. | | | 272 | | | | 14 | | |
DR Horton, Inc. | | | 115 | | | | 16 | | |
DraftKings, Inc., Class A (g) | | | 170 | | | | 6 | | |
DTE Energy Co. | | | 80 | | | | 9 | | |
Duke Energy Corp. | | | 298 | | | | 30 | | |
DuPont de Nemours, Inc. | | | 161 | | | | 13 | | |
Dynatrace, Inc. (g) | | | 106 | | | | 5 | | |
Eastman Chemical Co. | | | 45 | | | | 4 | | |
Eaton Corp. PLC | | | 155 | | | | 49 | | |
eBay, Inc. | | | 200 | | | | 11 | | |
Ecolab, Inc. | | | 100 | | | | 24 | | |
Edison International | | | 149 | | | | 11 | | |
Edwards Lifesciences Corp. (g) | | | 234 | | | | 22 | | |
Electronic Arts, Inc. | | | 98 | | | | 14 | | |
Elevance Health, Inc. | | | 90 | | | | 49 | | |
Eli Lilly & Co. | | | 314 | | | | 284 | | |
EMCOR Group, Inc. | | | 19 | | | | 7 | | |
Emerson Electric Co. | | | 221 | | | | 24 | | |
Enphase Energy, Inc. (g) | | | 53 | | | | 5 | | |
Entegris, Inc. | | | 59 | | | | 8 | | |
Entergy Corp. | | | 82 | | | | 9 | | |
EOG Resources, Inc. | | | 223 | | | | 28 | | |
EPAM Systems, Inc. (g) | | | 22 | | | | 4 | | |
EQT Corp. | | | 159 | | | | 6 | | |
Equifax, Inc. | | | 49 | | | | 12 | | |
Equinix, Inc. REIT | | | 37 | | | | 28 | | |
Equitable Holdings, Inc. | | | 127 | | | | 5 | | |
Equity Lifestyle Properties, Inc. REIT | | | 68 | | | | 4 | | |
Equity Residential REIT | | | 132 | | | | 9 | | |
Erie Indemnity Co., Class A | | | 10 | | | | 4 | | |
Essential Utilities, Inc. | | | 100 | | | | 4 | | |
Essex Property Trust, Inc. REIT | | | 25 | | | | 7 | | |
Estee Lauder Cos., Inc., Class A | | | 90 | | | | 10 | | |
Etsy, Inc. (g) | | | 47 | | | | 3 | | |
Everest Group Ltd. | | | 17 | | | | 6 | | |
Evergy, Inc. | | | 89 | | | | 5 | | |
Eversource Energy | | | 135 | | | | 8 | | |
Exact Sciences Corp. (g) | | | 73 | | | | 3 | | |
Exelon Corp. | | | 388 | | | | 13 | | |
Expedia Group, Inc. (g) | | | 51 | | | | 6 | | |
Expeditors International of Washington, Inc. | | | 55 | | | | 7 | | |
Extra Space Storage, Inc. REIT | | | 82 | | | | 13 | | |
Exxon Mobil Corp. | | | 1,721 | | | | 198 | | |
F5, Inc. (g) | | | 23 | | | | 4 | | |
FactSet Research Systems, Inc. | | | 15 | | | | 6 | | |
Fair Isaac Corp. (g) | | | 10 | | | | 15 | | |
Fastenal Co. | | | 223 | | | | 14 | | |
FedEx Corp. | | | 91 | | | | 27 | | |
| | | Shares | | Value
(000) | |
Ferguson PLC | | | 79 | | | $ | 15 | | |
Fidelity National Financial, Inc. | | | 101 | | | | 5 | | |
Fidelity National Information Services, Inc. | | | 223 | | | | 17 | | |
Fifth Third Bancorp | | | 262 | | | | 10 | | |
First Citizens BancShares, Inc., Class A | | | 4 | | | | 7 | | |
First Republic Bank (g) | | | 76 | | | | — | @ | |
First Solar, Inc. (g) | | | 39 | | | | 9 | | |
FirstEnergy Corp. | | | 212 | | | | 8 | | |
Fiserv, Inc. (g) | | | 228 | | | | 34 | | |
Ford Motor Co. | | | 1,486 | | | | 19 | | |
Fortinet, Inc. (g) | | | 252 | | | | 15 | | |
Fortive Corp. | | | 136 | | | | 10 | | |
Fortune Brands Innovations, Inc. | | | 48 | | | | 3 | | |
Fox Corp., Class A | | | 148 | | | | 5 | | |
Franklin Resources, Inc. | | | 114 | | | | 3 | | |
Freeport-McMoRan, Inc. | | | 549 | | | | 27 | | |
Gaming and Leisure Properties, Inc. REIT | | | 105 | | | | 5 | | |
Garmin Ltd. | | | 59 | | | | 10 | | |
Gartner, Inc. (g) | | | 31 | | | | 14 | | |
GE HealthCare Technologies, Inc. | | | 169 | | | | 13 | | |
GE Vernova, Inc. (g) | | | 106 | | | | 18 | | |
Gen Digital, Inc. | | | 224 | | | | 6 | | |
General Dynamics Corp. | | | 90 | | | | 26 | | |
General Electric Co. | | | 429 | | | | 68 | | |
General Mills, Inc. | | | 218 | | | | 14 | | |
General Motors Co. | | | 443 | | | | 21 | | |
Genuine Parts Co. | | | 54 | | | | 7 | | |
Gilead Sciences, Inc. | | | 480 | | | | 33 | | |
Global Payments, Inc. | | | 99 | | | | 10 | | |
GoDaddy, Inc., Class A (g) | | | 53 | | | | 7 | | |
Goldman Sachs Group, Inc. | | | 125 | | | | 57 | | |
Graco, Inc. | | | 65 | | | | 5 | | |
GRAIL, Inc. (g) | | | 10 | | | | — | @ | |
Halliburton Co. | | | 342 | | | | 12 | | |
Hartford Financial Services Group, Inc. | | | 115 | | | | 12 | | |
HCA Healthcare, Inc. | | | 77 | | | | 25 | | |
Healthpeak Properties, Inc. REIT | | | 273 | | | | 5 | | |
HEICO Corp. | | | 46 | | | | 9 | | |
Henry Schein, Inc. (g) | | | 50 | | | | 3 | | |
Hershey Co. | | | 57 | | | | 10 | | |
Hess Corp. | | | 106 | | | | 16 | | |
Hewlett Packard Enterprise Co. | | | 507 | | | | 11 | | |
HF Sinclair Corp. | | | 63 | | | | 3 | | |
Hilton Worldwide Holdings, Inc. | | | 98 | | | | 21 | | |
Hologic, Inc. (g) | | | 92 | | | | 7 | | |
Home Depot, Inc. | | | 387 | | | | 133 | | |
Honeywell International, Inc. | | | 252 | | | | 54 | | |
Hormel Foods Corp. | | | 117 | | | | 4 | | |
Host Hotels & Resorts, Inc. REIT | | | 275 | | | | 5 | | |
Howmet Aerospace, Inc. | | | 150 | | | | 12 | | |
HP, Inc. | | | 380 | | | | 13 | | |
Hubbell, Inc. | | | 21 | | | | 8 | | |
HubSpot, Inc. (g) | | | 19 | | | | 11 | | |
The accompanying notes are an integral part of the consolidated financial statements.
15
Morgan Stanley Variable Insurance Fund, Inc.
June 30, 2024 (unaudited)
Consolidated Portfolio of Investments (cont'd)
Global Strategist Portfolio
| | | Shares | | Value
(000) | |
United States (cont'd) | |
Humana, Inc. | | | 47 | | | $ | 18 | | |
Huntington Bancshares, Inc. | | | 558 | | | | 7 | | |
Huntington Ingalls Industries, Inc. | | | 15 | | | | 4 | | |
Hyatt Hotels Corp., Class A | | | 18 | | | | 3 | | |
IDEX Corp. | | | 29 | | | | 6 | | |
IDEXX Laboratories, Inc. (g) | | | 33 | | | | 16 | | |
Illinois Tool Works, Inc. | | | 115 | | | | 27 | | |
Illumina, Inc. (g) | | | 61 | | | | 6 | | |
Incyte Corp. (g) | | | 61 | | | | 4 | | |
Ingersoll Rand, Inc. | | | 157 | | | | 14 | | |
Insulet Corp. (g) | | | 27 | | | | 5 | | |
Intel Corp. | | | 1,672 | | | | 52 | | |
Intercontinental Exchange, Inc. | | | 222 | | | | 30 | | |
International Business Machines Corp. | | | 347 | | | | 60 | | |
International Flavors & Fragrances, Inc. | | | 99 | | | | 9 | | |
International Paper Co. | | | 126 | | | | 5 | | |
Interpublic Group of Cos., Inc. | | | 148 | | | | 4 | | |
Intuit, Inc. | | | 110 | | | | 72 | | |
Intuitive Surgical, Inc. (g) | | | 139 | | | | 62 | | |
Invitation Homes, Inc. REIT | | | 236 | | | | 8 | | |
IQVIA Holdings, Inc. (g) | | | 71 | | | | 15 | | |
Iron Mountain, Inc. REIT | | | 114 | | | | 10 | | |
J M Smucker Co. | | | 41 | | | | 4 | | |
Jabil, Inc. | | | 46 | | | | 5 | | |
Jack Henry & Associates, Inc. | | | 28 | | | | 5 | | |
Jacobs Solutions, Inc. | | | 49 | | | | 7 | | |
JB Hunt Transport Services, Inc. | | | 32 | | | | 5 | | |
Johnson & Johnson | | | 943 | | | | 138 | | |
Johnson Controls International PLC | | | 262 | | | | 17 | | |
JPMorgan Chase & Co. | | | 1,110 | | | | 225 | | |
Juniper Networks, Inc. | | | 126 | | | | 5 | | |
Kellanova | | | 105 | | | | 6 | | |
Kenvue, Inc. | | | 735 | | | | 13 | | |
Keurig Dr Pepper, Inc. | | | 422 | | | | 14 | | |
KeyCorp | | | 357 | | | | 5 | | |
Keysight Technologies, Inc. (g) | | | 68 | | | | 9 | | |
Kimberly-Clark Corp. | | | 131 | | | | 18 | | |
Kimco Realty Corp. REIT | | | 262 | | | | 5 | | |
Kinder Morgan, Inc. | | | 772 | | | | 15 | | |
KKR & Co., Inc. | | | 239 | | | | 25 | | |
KLA Corp. | | | 53 | | | | 44 | | |
Knight-Swift Transportation Holdings, Inc. | | | 62 | | | | 3 | | |
Kraft Heinz Co. | | | 352 | | | | 11 | | |
Kroger Co. | | | 268 | | | | 13 | | |
L3Harris Technologies, Inc. | | | 74 | | | | 17 | | |
Labcorp Holdings, Inc. | | | 32 | | | | 7 | | |
Lam Research Corp. | | | 52 | | | | 55 | | |
Lamb Weston Holdings, Inc. | | | 56 | | | | 5 | | |
Las Vegas Sands Corp. | | | 148 | | | | 7 | | |
Lattice Semiconductor Corp. (g) | | | 54 | | | | 3 | | |
Leidos Holdings, Inc. | | | 49 | | | | 7 | | |
Lennar Corp., Class A | | | 95 | | | | 14 | | |
| | | Shares | | Value
(000) | |
Lennox International, Inc. | | | 12 | | | $ | 6 | | |
Liberty Media Corp.-Liberty Formula One,
Class C (g) | | | 77 | | | | 6 | | |
Linde PLC | | | 187 | | | | 82 | | |
Live Nation Entertainment, Inc. (g) | | | 63 | | | | 6 | | |
LKQ Corp. | | | 102 | | | | 4 | | |
Lockheed Martin Corp. | | | 84 | | | | 39 | | |
Loews Corp. | | | 73 | | | | 5 | | |
Lowe's Cos., Inc. | | | 223 | | | | 49 | | |
LPL Financial Holdings, Inc. | | | 29 | | | | 8 | | |
Lululemon Athletica, Inc. (g) | | | 45 | | | | 13 | | |
LyondellBasell Industries NV, Class A | | | 100 | | | | 10 | | |
M&T Bank Corp. | | | 65 | | | | 10 | | |
Manhattan Associates, Inc. (g) | | | 24 | | | | 6 | | |
Marathon Oil Corp. | | | 220 | | | | 6 | | |
Marathon Petroleum Corp. | | | 140 | | | | 24 | | |
Markel Group, Inc. (g) | | | 5 | | | | 8 | | |
MarketAxess Holdings, Inc. | | | 14 | | | | 3 | | |
Marriott International, Inc., Class A | | | 95 | | | | 23 | | |
Marsh & McLennan Cos., Inc. | | | 191 | | | | 40 | | |
Martin Marietta Materials, Inc. | | | 24 | | | | 13 | | |
Marvell Technology, Inc. | | | 345 | | | | 24 | | |
Masco Corp. | | | 85 | | | | 6 | | |
Mastercard, Inc., Class A | | | 322 | | | | 142 | | |
Match Group, Inc. (g) | | | 104 | | | | 3 | | |
McCormick & Co., Inc. | | | 97 | | | | 7 | | |
McDonald's Corp. | | | 280 | | | | 71 | | |
McKesson Corp. | | | 51 | | | | 30 | | |
Medtronic PLC | | | 519 | | | | 41 | | |
MercadoLibre, Inc. (g) | | | 18 | | | | 30 | | |
Merck & Co., Inc. | | | 981 | | | | 121 | | |
Meta Platforms, Inc., Class A | | | 840 | | | | 424 | | |
MetLife, Inc. | | | 237 | | | | 17 | | |
Mettler-Toledo International, Inc. (g) | | | 8 | | | | 11 | | |
MGM Resorts International (g) | | | 92 | | | | 4 | | |
Microchip Technology, Inc. | | | 212 | | | | 19 | | |
Micron Technology, Inc. | | | 427 | | | | 56 | | |
Microsoft Corp. | | | 2,746 | | | | 1,227 | | |
MicroStrategy, Inc., Class A (g) | | | 18 | | | | 25 | | |
Mid-America Apartment Communities, Inc. REIT | | | 45 | | | | 6 | | |
Moderna, Inc. (g) | | | 125 | | | | 15 | | |
Molina Healthcare, Inc. (g) | | | 23 | | | | 7 | | |
Molson Coors Beverage Co., Class B | | | 72 | | | | 4 | | |
Mondelez International, Inc., Class A | | | 517 | | | | 34 | | |
MongoDB, Inc. (g) | | | 28 | | | | 7 | | |
Monolithic Power Systems, Inc. | | | 19 | | | | 16 | | |
Monster Beverage Corp. (g) | | | 285 | | | | 14 | | |
Moody's Corp. | | | 64 | | | | 27 | | |
Mosaic Co. | | | 123 | | | | 4 | | |
Motorola Solutions, Inc. | | | 65 | | | | 25 | | |
MSCI, Inc. | | | 31 | | | | 15 | | |
Nasdaq, Inc. | | | 156 | | | | 9 | | |
NetApp, Inc. | | | 80 | | | | 10 | | |
The accompanying notes are an integral part of the consolidated financial statements.
16
Morgan Stanley Variable Insurance Fund, Inc.
June 30, 2024 (unaudited)
Consolidated Portfolio of Investments (cont'd)
Global Strategist Portfolio
| | | Shares | | Value
(000) | |
United States (cont'd) | |
Netflix, Inc. (g) | | | 172 | | | $ | 116 | | |
Neurocrine Biosciences, Inc. (g) | | | 39 | | | | 5 | | |
Newmont Corp. (TSX) | | | 443 | | | | 19 | | |
News Corp., Class A | | | 146 | | | | 4 | | |
NextEra Energy, Inc. | | | 796 | | | | 56 | | |
NIKE, Inc., Class B | | | 473 | | | | 36 | | |
NiSource, Inc. | | | 172 | | | | 5 | | |
Nordson Corp. | | | 21 | | | | 5 | | |
Norfolk Southern Corp. | | | 87 | | | | 19 | | |
Northern Trust Corp. | | | 79 | | | | 7 | | |
Northrop Grumman Corp. | | | 54 | | | | 24 | | |
NRG Energy, Inc. | | | 82 | | | | 6 | | |
Nucor Corp. | | | 94 | | | | 15 | | |
NVIDIA Corp. | | | 10,103 | | | | 1,248 | | |
NVR, Inc. (g) | | | 1 | | | | 8 | | |
NXP Semiconductors NV | | | 100 | | | | 27 | | |
Occidental Petroleum Corp. | | | 254 | | | | 16 | | |
Okta, Inc. (g) | | | 62 | | | | 6 | | |
Old Dominion Freight Line, Inc. | | | 75 | | | | 13 | | |
Omnicom Group, Inc. | | | 76 | | | | 7 | | |
ON Semiconductor Corp. (g) | | | 166 | | | | 11 | | |
ONEOK, Inc. | | | 225 | | | | 18 | | |
Oracle Corp. | | | 647 | | | | 91 | | |
O'Reilly Automotive, Inc. (g) | | | 23 | | | | 24 | | |
Otis Worldwide Corp. | | | 157 | | | | 15 | | |
Ovintiv, Inc. | | | 103 | | | | 5 | | |
Owens Corning | | | 34 | | | | 6 | | |
PACCAR, Inc. | | | 201 | | | | 21 | | |
Packaging Corp. of America | | | 34 | | | | 6 | | |
Palantir Technologies, Inc., Class A (g) | | | 740 | | | | 19 | | |
Palo Alto Networks, Inc. (g) | | | 124 | | | | 42 | | |
Paramount Global, Class B | | | 209 | | | | 2 | | |
Parker-Hannifin Corp. | | | 49 | | | | 25 | | |
Paychex, Inc. | | | 126 | | | | 15 | | |
Paycom Software, Inc. | | | 21 | | | | 3 | | |
Paylocity Holding Corp. (g) | | | 18 | | | | 2 | | |
PayPal Holdings, Inc. (g) | | | 392 | | | | 23 | | |
Pentair PLC | | | 64 | | | | 5 | | |
PepsiCo, Inc. | | | 533 | | | | 88 | | |
Pfizer, Inc. | | | 2,198 | | | | 61 | | |
PG&E Corp. | | | 787 | | | | 14 | | |
Philip Morris International, Inc. | | | 601 | | | | 61 | | |
Phillips 66 | | | 166 | | | | 23 | | |
Pinterest, Inc., Class A (g) | | | 232 | | | | 10 | | |
PNC Financial Services Group, Inc. | | | 153 | | | | 24 | | |
Pool Corp. | | | 15 | | | | 5 | | |
PPG Industries, Inc. | | | 91 | | | | 11 | | |
PPL Corp. | | | 285 | | | | 8 | | |
Principal Financial Group, Inc. | | | 91 | | | | 7 | | |
Procter & Gamble Co. | | | 919 | | | | 152 | | |
Progressive Corp. | | | 227 | | | | 47 | | |
Prologis, Inc. REIT | | | 355 | | | | 40 | | |
| | | Shares | | Value
(000) | |
Prudential Financial, Inc. | | | 139 | | | $ | 16 | | |
PTC, Inc. (g) | | | 46 | | | | 8 | | |
Public Service Enterprise Group, Inc. | | | 192 | | | | 14 | | |
Public Storage REIT | | | 61 | | | | 18 | | |
PulteGroup, Inc. | | | 82 | | | | 9 | | |
Pure Storage, Inc., Class A (g) | | | 123 | | | | 8 | | |
Qorvo, Inc. (g) | | | 37 | | | | 4 | | |
QUALCOMM, Inc. | | | 450 | | | | 90 | | |
Quanta Services, Inc. | | | 57 | | | | 14 | | |
Quest Diagnostics, Inc. | | | 43 | | | | 6 | | |
Raymond James Financial, Inc. | | | 77 | | | | 10 | | |
Realty Income Corp. REIT | | | 333 | | | | 18 | | |
Regency Centers Corp. REIT | | | 68 | | | | 4 | | |
Regeneron Pharmaceuticals, Inc. (g) | | | 42 | | | | 44 | | |
Regions Financial Corp. | | | 356 | | | | 7 | | |
Reliance, Inc. | | | 22 | | | | 6 | | |
Repligen Corp. (g) | | | 20 | | | | 3 | | |
Republic Services, Inc. | | | 85 | | | | 17 | | |
ResMed, Inc. | | | 64 | | | | 12 | | |
Revvity, Inc. | | | 48 | | | | 5 | | |
Riot Platforms, Inc. (g) | | | 1,695 | | | | 15 | | |
Rivian Automotive, Inc., Class A (g) | | | 271 | | | | 4 | | |
Robinhood Markets, Inc., Class A (g) | | | 207 | | | | 5 | | |
ROBLOX Corp., Class A (g) | | | 184 | | | | 7 | | |
Rockwell Automation, Inc. | | | 44 | | | | 12 | | |
Roku, Inc. (g) | | | 49 | | | | 3 | | |
Rollins, Inc. | | | 113 | | | | 6 | | |
Roper Technologies, Inc. | | | 41 | | | | 23 | | |
Ross Stores, Inc. | | | 131 | | | | 19 | | |
Royal Caribbean Cruises Ltd. (g) | | | 93 | | | | 15 | | |
Royalty Pharma PLC, Class A | | | 145 | | | | 4 | | |
RPM International, Inc. | | | 51 | | | | 5 | | |
RTX Corp. | | | 513 | | | | 51 | | |
S&P Global, Inc. | | | 124 | | | | 55 | | |
Salesforce, Inc. | | | 381 | | | | 98 | | |
Samsara, Inc., Class A (g) | | | 80 | | | | 3 | | |
SBA Communications Corp. REIT | | | 42 | | | | 8 | | |
Schlumberger NV | | | 540 | | | | 25 | | |
Seagate Technology Holdings PLC | | | 78 | | | | 8 | | |
SEI Investments Co. | | | 43 | | | | 3 | | |
Sempra | | | 243 | | | | 18 | | |
ServiceNow, Inc. (g) | | | 81 | | | | 64 | | |
Sherwin-Williams Co. | | | 94 | | | | 28 | | |
Simon Property Group, Inc. REIT | | | 126 | | | | 19 | | |
Skyworks Solutions, Inc. | | | 62 | | | | 7 | | |
Snap, Inc., Class A (g) | | | 408 | | | | 7 | | |
Snap-on, Inc. | | | 20 | | | | 5 | | |
Snowflake, Inc., Class A (g) | | | 119 | | | | 16 | | |
Solventum Corp. (g) | | | 57 | | | | 3 | | |
Southern Co. | | | 422 | | | | 33 | | |
Southwest Airlines Co. | | | 58 | | | | 2 | | |
SS&C Technologies Holdings, Inc. | | | 86 | | | | 5 | | |
Stanley Black & Decker, Inc. | | | 59 | | | | 5 | | |
The accompanying notes are an integral part of the consolidated financial statements.
17
Morgan Stanley Variable Insurance Fund, Inc.
June 30, 2024 (unaudited)
Consolidated Portfolio of Investments (cont'd)
Global Strategist Portfolio
| | | Shares | | Value
(000) | |
United States (cont'd) | |
Starbucks Corp. | | | 444 | | | $ | 35 | | |
State Street Corp. | | | 117 | | | | 9 | | |
Steel Dynamics, Inc. | | | 59 | | | | 8 | | |
Steris PLC | | | 39 | | | | 9 | | |
Stryker Corp. | | | 134 | | | | 46 | | |
Sun Communities, Inc. REIT | | | 48 | | | | 6 | | |
Super Micro Computer, Inc. (g) | | | 22 | | | | 18 | | |
Synchrony Financial | | | 157 | | | | 7 | | |
Synopsys, Inc. (g) | | | 60 | | | | 36 | | |
Sysco Corp. | | | 192 | | | | 14 | | |
T Rowe Price Group, Inc. | | | 87 | | | | 10 | | |
Take-Two Interactive Software, Inc. (g) | | | 63 | | | | 10 | | |
Targa Resources Corp. | | | 82 | | | | 11 | | |
Target Corp. | | | 175 | | | | 26 | | |
TE Connectivity Ltd. | | | 120 | | | | 18 | | |
Teledyne Technologies, Inc. (g) | | | 19 | | | | 7 | | |
Teleflex, Inc. | | | 18 | | | | 4 | | |
Teradyne, Inc. | | | 60 | | | | 9 | | |
Tesla, Inc. (g) | | | 1,105 | | | | 219 | | |
Texas Instruments, Inc. | | | 355 | | | | 69 | | |
Texas Pacific Land Corp. | | | 8 | | | | 6 | | |
Textron, Inc. | | | 74 | | | | 6 | | |
Thermo Fisher Scientific, Inc. | | | 148 | | | | 82 | | |
TJX Cos., Inc. | | | 441 | | | | 49 | | |
T-Mobile U.S., Inc. | | | 207 | | | | 36 | | |
Toast, Inc., Class A (g) | | | 136 | | | | 4 | | |
Toro Co. | | | 41 | | | | 4 | | |
Tractor Supply Co. | | | 42 | | | | 11 | | |
Trade Desk, Inc., Class A (g) | | | 175 | | | | 17 | | |
Tradeweb Markets, Inc., Class A | | | 45 | | | | 5 | | |
Trane Technologies PLC | | | 88 | | | | 29 | | |
TransDigm Group, Inc. | | | 22 | | | | 28 | | |
TransUnion | | | 75 | | | | 6 | | |
Travelers Cos., Inc. | | | 89 | | | | 18 | | |
Trimble, Inc. (g) | | | 95 | | | | 5 | | |
Truist Financial Corp. | | | 513 | | | | 20 | | |
Twilio, Inc., Class A (g) | | | 67 | | | | 4 | | |
Tyler Technologies, Inc. (g) | | | 16 | | | | 8 | | |
Tyson Foods, Inc., Class A | | | 110 | | | | 6 | | |
Uber Technologies, Inc. (g) | | | 729 | | | | 53 | | |
UDR, Inc. REIT | | | 120 | | | | 5 | | |
U-Haul Holding Co. | | | 38 | | | | 2 | | |
UiPath, Inc., Class A (g) | | | 171 | | | | 2 | | |
Ulta Beauty, Inc. (g) | | | 19 | | | | 7 | | |
Union Pacific Corp. | | | 237 | | | | 54 | | |
United Parcel Service, Inc., Class B | | | 280 | | | | 38 | | |
United Rentals, Inc. | | | 26 | | | | 17 | | |
United Therapeutics Corp. (g) | | | 18 | | | | 6 | | |
UnitedHealth Group, Inc. | | | 358 | | | | 182 | | |
Unity Software, Inc. (g) | | | 104 | | | | 2 | | |
Universal Health Services, Inc., Class B | | | 23 | | | | 4 | | |
US Bancorp | | | 601 | | | | 24 | | |
| | | Shares | | Value
(000) | |
Valero Energy Corp. | | | 127 | | | $ | 20 | | |
Veeva Systems, Inc., Class A (g) | | | 59 | | | | 11 | | |
Ventas, Inc. REIT | | | 157 | | | | 8 | | |
Veralto Corp. | | | 95 | | | | 9 | | |
VeriSign, Inc. (g) | | | 35 | | | | 6 | | |
Verisk Analytics, Inc. | | | 55 | | | | 15 | | |
Verizon Communications, Inc. | | | 1,622 | | | | 67 | | |
Vertex Pharmaceuticals, Inc. (g) | | | 101 | | | | 47 | | |
Vertiv Holdings Co., Class A | | | 144 | | | | 12 | | |
Viatris, Inc. | | | 457 | | | | 5 | | |
VICI Properties, Inc. REIT | | | 403 | | | | 12 | | |
Visa, Inc., Class A | | | 610 | | | | 160 | | |
Vistra Corp. | | | 134 | | | | 12 | | |
Vulcan Materials Co. | | | 52 | | | | 13 | | |
W R Berkley Corp. | | | 80 | | | | 6 | | |
Walgreens Boots Alliance, Inc. | | | 282 | | | | 3 | | |
Walmart, Inc. | | | 1,713 | | | | 116 | | |
Walt Disney Co. | | | 714 | | | | 71 | | |
Warner Bros Discovery, Inc. (g) | | | 902 | | | | 7 | | |
Waste Connections, Inc. | | | 100 | | | | 18 | | |
Waste Management, Inc. | | | 156 | | | | 33 | | |
Waters Corp. (g) | | | 23 | | | | 7 | | |
Watsco, Inc. | | | 13 | | | | 6 | | |
WEC Energy Group, Inc. | | | 122 | | | | 10 | | |
Wells Fargo & Co. | | | 1,357 | | | | 81 | | |
Welltower, Inc. REIT | | | 221 | | | | 23 | | |
West Pharmaceutical Services, Inc. | | | 29 | | | | 10 | | |
Western Digital Corp. (g) | | | 127 | | | | 10 | | |
Westinghouse Air Brake Technologies Corp. | | | 68 | | | | 11 | | |
Westlake Corp. | | | 15 | | | | 2 | | |
Westrock Co. | | | 101 | | | | 5 | | |
Weyerhaeuser Co. REIT | | | 283 | | | | 8 | | |
Williams Cos., Inc. | | | 468 | | | | 20 | | |
Williams-Sonoma, Inc. | | | 24 | | | | 7 | | |
Willis Towers Watson PLC | | | 40 | | | | 10 | | |
Workday, Inc., Class A (g) | | | 82 | | | | 18 | | |
WP Carey, Inc. REIT | | | 84 | | | | 5 | | |
WW Grainger, Inc. | | | 17 | | | | 15 | | |
Wynn Resorts Ltd. | | | 39 | | | | 3 | | |
Xcel Energy, Inc. | | | 214 | | | | 11 | | |
Xylem, Inc. | | | 94 | | | | 13 | | |
Yum! Brands, Inc. | | | 110 | | | | 15 | | |
Zebra Technologies Corp., Class A (g) | | | 20 | | | | 6 | | |
Zillow Group, Inc., Class C (g) | | | 62 | | | | 3 | | |
Zimmer Biomet Holdings, Inc. | | | 80 | | | | 9 | | |
Zoetis, Inc. | | | 177 | | | | 31 | | |
Zoom Video Communications, Inc., Class A (g) | | | 98 | | | | 6 | | |
Zscaler, Inc. (g) | | | 35 | | | | 7 | | |
| | | | 18,557 | | |
Total Common Stocks (Cost $21,936) | | | 29,662 | | |
The accompanying notes are an integral part of the consolidated financial statements.
18
Morgan Stanley Variable Insurance Fund, Inc.
June 30, 2024 (unaudited)
Consolidated Portfolio of Investments (cont'd)
Global Strategist Portfolio
| | | No. of
Rights | | Value
(000) | |
Rights (0.0%)‡ | |
Italy (0.0%) | |
Amplifon SpA,
expires 07/09/24 (g) | | | 37 | | | $ | — | | |
United States (0.0%)‡ | |
Contra Abiomed, Inc.,
expires 12/22/28 (g) | | | 14 | | | | — | @ | |
Total Rights (Cost $—@) | | | — | @ | |
| | | No. of
Warrants | | | |
Warrants (0.0%) | |
Canada (0.0%) | |
Constellation Software, Inc.
expires 3/31/40 (g) (Cost $—) | | | 16 | | | | — | | |
| | | Face
Amount
(000) | | | |
Short-Term Investments (18.5%) | |
U.S. Treasury Securities (2.0%) | |
U.S. Treasury Bill,
5.31%, 8/1/24 (i)(j) | | $ | 1,170 | | | | 1,165 | | |
5.32%, 8/22/24 (i)(j) | | | 490 | | | | 486 | | |
Total U.S. Treasury Securities (Cost $1,651) | | | 1,651 | | |
| | | Shares | | | |
Investment Company (16.5%) | |
Morgan Stanley Institutional Liquidity
Funds — Government Portfolio —
Institutional Class, 5.22% (See Note H)
(Cost $13,759) | | | 13,759,048 | | | | 13,759 | | |
Total Short-Term Investments (Cost $15,410) | | | 15,410 | | |
Total Investments (99.8%) (Cost $78,364) (k)(l)(m) | | | 83,339 | | |
Other Assets in Excess of Liabilities (0.2%) | | | 198 | | |
Net Assets (100.0%) | | $ | 83,537 | | |
Country assignments and aggregations are based generally on third party vendor classifications and information, and may be different from the assignments and aggregations under the policies set forth in the Fund's prospectus and/or statement of additional information relating to geographic classifications.
@ Value is less than $500.
‡ Amount is less than 0.05%.
(a) Security is subject to delayed delivery.
(b) Floating or variable rate securities: The rates disclosed are as of June 30, 2024. For securities based on a published reference rate and spread, the reference rate and spread are indicated in the description in the Consolidated Portfolio of Investments. Certain variable rate securities may not be based on a published reference rate and spread but are determined by the issuer or agent and are based on current market conditions. These securities do not indicate a reference rate and spread in their description in the Consolidated Portfolio of Investments.
(c) 144A security — Certain conditions for public sale may exist. Unless otherwise noted, these securities are deemed to be liquid.
(d) Multi-step — Coupon rate changes in predetermined increments to maturity. Rate disclosed is as of June 30, 2024. Maturity date disclosed is the ultimate maturity date.
(e) Perpetual — One or more securities do not have a predetermined maturity date. Rates for these securities are fixed for a period of time after which they revert to a floating rate. Interest rates in effect are as of June 30, 2024.
(f) When-issued security.
(g) Non-income producing security.
(h) At June 30, 2024, the Fund held a fair valued security at $0, representing 0.0% of net assets. This security has been fair valued using significant unobservable inputs as determined in good faith under procedures established by and under the general supervision of the Company's (as defined herein) Directors.
(i) Rate shown is the yield to maturity at June 30, 2024.
(j) All or a portion of the security was pledged to cover margin requirements for swap agreements.
(k) The approximate fair value and percentage of net assets, $9,673,000 and 11.6%, respectively, represent the securities that have been fair valued under the fair valuation policy for international investments as described in Note A-1 within the Notes to Consolidated Financial Statements.
(l) Securities are available for collateral in connection with purchase of when-issued security, securities purchased on a forward commitment basis, open foreign currency forward exchange contracts, futures contracts and swap agreements.
(m) At June 30, 2024, the aggregate cost for federal income tax purposes approximates the aggregate cost for book purposes. The aggregate gross unrealized appreciation is approximately $9,855,000 and the aggregate gross unrealized depreciation is approximately $4,586,000, resulting in net unrealized appreciation of approximately $5,269,000.
ADR American Depositary Receipt.
CVA Certificaten Van Aandelen.
DAC Designated Activity Company.
EURIBOR Euro Interbank Offered Rate.
LSE London Stock Exchange.
MTN Medium Term Note.
NYSE New York Stock Exchange.
OAT Obligations Assimilables du Trésor (French Treasury Obligation).
REIT Real Estate Investment Trust.
SOFR Secured Overnight Financing Rate.
SONIA Sterling Overnight Index Average.
TBA To Be Announced.
TSX Toronto Stock Exchange.
The accompanying notes are an integral part of the consolidated financial statements.
19
Morgan Stanley Variable Insurance Fund, Inc.
June 30, 2024 (unaudited)
Consolidated Portfolio of Investments (cont'd)
Global Strategist Portfolio
Foreign Currency Forward Exchange Contracts:
The Fund had the following foreign currency forward exchange contracts open at June 30, 2024:
Counterparty | | Contracts
to
Deliver
(000) | | In
Exchange
For
(000) | | Delivery
Date | | Unrealized
Appreciation
(Depreciation)
(000) | |
Bank of America NA | | CNH | 2,334 | | | $ | 323 | | | 9/19/24 | | $ | 2 | | |
Bank of America NA | | GBP | 448 | | | $ | 558 | | | 7/24/24 | | | (9 | ) | |
Bank of America NA | | PLN | 67 | | | $ | 16 | | | 9/19/24 | | | (— | @) | |
Bank of America NA | | $ | 23 | | | CAD | 32 | | | 7/24/24 | | | — | @ | |
Bank of America NA | | $ | 6 | | | ILS | 22 | | | 9/19/24 | | | (— | @) | |
Bank of America NA | | $ | 2 | | | ZAR | 34 | | | 9/19/24 | | | (— | @) | |
Barclays Bank PLC | | EUR | 54 | | | $ | 58 | | | 7/24/24 | | | (— | @) | |
Barclays Bank PLC | | EUR | 30 | | | $ | 33 | | | 7/24/24 | | | — | @ | |
Barclays Bank PLC | | MYR | 120 | | | $ | 25 | | | 7/24/24 | | | (— | @) | |
Barclays Bank PLC | | TRY | 1,826 | | | $ | 34 | | | 4/6/26 | | | 1 | | |
Barclays Bank PLC | | $ | 371 | | | EUR | 344 | | | 9/19/24 | | | (1 | ) | |
Barclays Bank PLC | | $ | 106 | | | EUR | 98 | | | 9/19/24 | | | (— | @) | |
Barclays Bank PLC | | $ | 3 | | | ILS | 10 | | | 9/19/24 | | | (— | @) | |
Barclays Bank PLC | | $ | 6 | | | MXN | 99 | | | 7/24/24 | | | (— | @) | |
Barclays Bank PLC | | $ | 62 | | | MXN | 1,169 | | | 9/19/24 | | | 1 | | |
Barclays Bank PLC | | $ | 1 | | | PLN | 4 | | | 7/24/24 | | | — | @ | |
Barclays Bank PLC | | $ | 70 | | | SEK | 758 | | | 7/24/24 | | | 2 | | |
Barclays Bank PLC | | $ | 297 | | | TRY | 17,232 | | | 4/6/26 | | | 13 | | |
BNP Paribas SA | | BRL | 4,916 | | | $ | 900 | | | 9/19/24 | | | 28 | | |
BNP Paribas SA | | DKK | 105 | | | $ | 15 | | | 9/19/24 | | | — | @ | |
BNP Paribas SA | | EUR | 110 | | | $ | 119 | | | 7/24/24 | | | 2 | | |
BNP Paribas SA | | GBP | 19 | | | $ | 25 | | | 9/19/24 | | | — | @ | |
BNP Paribas SA | | HUF | 11,025 | | | $ | 30 | | | 7/24/24 | | | — | @ | |
BNP Paribas SA | | IDR | 1,814,535 | | | $ | 111 | | | 7/24/24 | | | 1 | | |
BNP Paribas SA | | INR | 2,748 | | | $ | 33 | | | 9/19/24 | | | — | @ | |
BNP Paribas SA | | THB | 285 | | | $ | 8 | | | 7/24/24 | | | (— | @) | |
BNP Paribas SA | | $ | 77 | | | AUD | 119 | | | 7/24/24 | | | 2 | | |
BNP Paribas SA | | $ | 15 | | | AUD | 23 | | | 9/19/24 | | | — | @ | |
BNP Paribas SA | | $ | 47 | | | BRL | 263 | | | 9/19/24 | | | (— | @) | |
BNP Paribas SA | | $ | 92 | | | CHF | 82 | | | 7/24/24 | | | — | @ | |
BNP Paribas SA | | $ | 15 | | | CLP | 13,453 | | | 9/17/24 | | | (— | @) | |
BNP Paribas SA | | $ | 5 | | | COP | 18,760 | | | 7/24/24 | | | (— | @) | |
BNP Paribas SA | | $ | 12 | | | COP | 50,392 | | | 9/19/24 | | | (— | @) | |
BNP Paribas SA | | $ | 126 | | | EUR | 118 | | | 7/24/24 | | | — | @ | |
BNP Paribas SA | | $ | 734 | | | EUR | 681 | | | 9/19/24 | | | (2 | ) | |
BNP Paribas SA | | $ | 58 | | | EUR | 54 | | | 9/19/24 | | | — | @ | |
BNP Paribas SA | | $ | 14 | | | HKD | 108 | | | 9/19/24 | | | (— | @) | |
BNP Paribas SA | | $ | 43 | | | HUF | 15,997 | | | 7/24/24 | | | (— | @) | |
BNP Paribas SA | | $ | 6 | | | IDR | 102,824 | | | 9/19/24 | | | (— | @) | |
BNP Paribas SA | | $ | 126 | | | IDR | 2,074,069 | | | 7/24/24 | | | — | @ | |
BNP Paribas SA | | $ | 425 | | | INR | 35,638 | | | 9/19/24 | | | 1 | | |
BNP Paribas SA | | $ | 703 | | | MXN | 13,171 | | | 9/19/24 | | | 8 | | |
BNP Paribas SA | | $ | 37 | | | PEN | 135 | | | 7/24/24 | | | (1 | ) | |
Canadian Imperial Bank of Commerce | | $ | 77 | | | CHF | 70 | | | 7/24/24 | | | 1 | | |
Citibank NA | | $ | 7 | | | CZK | 168 | | | 9/19/24 | | | (— | @) | |
Citibank NA | | $ | 21 | | | ILS | 78 | | | 9/19/24 | | | (— | @) | |
Citibank NA | | $ | 13 | | | NOK | 145 | | | 7/24/24 | | | — | @ | |
Goldman Sachs International | | DKK | 10 | | | $ | 1 | | | 9/19/24 | | | — | @ | |
Goldman Sachs International | | MXN | 237 | | | $ | 14 | | | 7/24/24 | | | 1 | | |
The accompanying notes are an integral part of the consolidated financial statements.
20
Morgan Stanley Variable Insurance Fund, Inc.
June 30, 2024 (unaudited)
Consolidated Portfolio of Investments (cont'd)
Global Strategist Portfolio
Foreign Currency Forward Exchange Contracts (cont'd):
Counterparty | | Contracts
to
Deliver
(000) | | In
Exchange
For
(000) | | Delivery
Date | | Unrealized
Appreciation
(Depreciation)
(000) | |
Goldman Sachs International | | MYR | 38 | | | $ | 8 | | | 9/19/24 | | $ | — | @ | |
Goldman Sachs International | | NOK | 6 | | | $ | 1 | | | 9/19/24 | | | — | @ | |
Goldman Sachs International | | TRY | 15,162 | | | $ | 358 | | | 12/23/24 | | | (29 | ) | |
Goldman Sachs International | | TWD | 1,225 | | | $ | 38 | | | 9/19/24 | | | (— | @) | |
Goldman Sachs International | | $ | 29 | | | AUD | 44 | | | 9/19/24 | | | — | @ | |
Goldman Sachs International | | $ | 112 | | | GBP | 89 | | | 9/19/24 | | | (— | @) | |
Goldman Sachs International | | $ | 3 | | | HKD | 25 | | | 9/19/24 | | | (— | @) | |
Goldman Sachs International | | $ | 2,003 | | | JPY | 305,714 | | | 7/24/24 | | | (97 | ) | |
Goldman Sachs International | | $ | 63 | | | JPY | 9,903 | | | 9/19/24 | | | (1 | ) | |
Goldman Sachs International | | $ | 336 | | | MXN | 6,284 | | | 9/19/24 | | | 4 | | |
Goldman Sachs International | | $ | 23 | | | PLN | 94 | | | 7/24/24 | | | — | @ | |
Goldman Sachs International | | $ | 1 | | | SEK | 14 | | | 9/19/24 | | | (— | @) | |
Goldman Sachs International | | $ | — | @ | | SGD | 1 | | | 9/19/24 | | | (— | @) | |
Goldman Sachs International | | $ | 387 | | | TRY | 15,162 | | | 12/23/24 | | | — | @ | |
Goldman Sachs International | | $ | 320 | | | TRY | 18,398 | | | 4/6/26 | | | 11 | | |
Goldman Sachs International | | $ | 309 | | | TRY | 16,846 | | | 4/6/26 | | | (6 | ) | |
Goldman Sachs International | | $ | 379 | | | TRY | 21,090 | | | 4/6/26 | | | — | @ | |
Goldman Sachs International | | $ | 22 | | | TWD | 719 | | | 9/19/24 | | | (— | @) | |
Goldman Sachs International | | $ | 24 | | | ZAR | 442 | | | 9/19/24 | | | (— | @) | |
HSBC Bank PLC | | CNY | 760 | | | $ | 107 | | | 7/24/24 | | | 2 | | |
HSBC Bank PLC | | GBP | 37 | | | $ | 48 | | | 7/24/24 | | | — | @ | |
JPMorgan Chase Bank NA | | CAD | 11 | | | $ | 8 | | | 9/19/24 | | | (— | @) | |
JPMorgan Chase Bank NA | | CNH | 683 | | | $ | 95 | | | 9/19/24 | | | — | @ | |
JPMorgan Chase Bank NA | | DKK | 138 | | | $ | 20 | | | 7/24/24 | | | — | @ | |
JPMorgan Chase Bank NA | | GBP | 13 | | | $ | 17 | | | 9/19/24 | | | — | @ | |
JPMorgan Chase Bank NA | | JPY | 1,055 | | | $ | 7 | | | 9/19/24 | | | — | @ | |
JPMorgan Chase Bank NA | | NZD | 29 | | | $ | 18 | | | 9/19/24 | | | — | @ | |
JPMorgan Chase Bank NA | | $ | 75 | | | CAD | 103 | | | 7/24/24 | | | — | @ | |
JPMorgan Chase Bank NA | | $ | 17 | | | CLP | 15,810 | | | 7/24/24 | | | — | @ | |
JPMorgan Chase Bank NA | | $ | 242 | | | CNY | 1,727 | | | 7/24/24 | | | (4 | ) | |
JPMorgan Chase Bank NA | | $ | 16 | | | GBP | 13 | | | 7/24/24 | | | — | @ | |
JPMorgan Chase Bank NA | | $ | 24 | | | HKD | 185 | | | 9/19/24 | | | (— | @) | |
JPMorgan Chase Bank NA | | $ | 3 | | | ILS | 11 | | | 9/19/24 | | | (— | @) | |
JPMorgan Chase Bank NA | | $ | 217 | | | MXN | 4,067 | | | 9/19/24 | | | 3 | | |
JPMorgan Chase Bank NA | | $ | 38 | | | MXN | 699 | | | 9/19/24 | | | — | @ | |
JPMorgan Chase Bank NA | | $ | 26 | | | RON | 122 | | | 7/24/24 | | | — | @ | |
JPMorgan Chase Bank NA | | $ | 65 | | | SEK | 696 | | | 7/24/24 | | | 1 | | |
JPMorgan Chase Bank NA | | $ | 24 | | | SGD | 33 | | | 7/24/24 | | | — | @ | |
JPMorgan Chase Bank NA | | $ | 2 | | | THB | 80 | | | 7/24/24 | | | — | @ | |
State Street Bank and Trust Co. | | $ | 27 | | | EUR | 25 | | | 9/19/24 | | | — | @ | |
State Street Bank and Trust Co. | | $ | — | @ | | HKD | — | @ | | 9/19/24 | | | — | @ | |
UBS AG | | CHF | 32 | | | $ | 36 | | | 9/19/24 | | | 1 | | |
UBS AG | | CNY | 1,750 | | | $ | 246 | | | 7/24/24 | | | 5 | | |
UBS AG | | CNY | 3,527 | | | $ | 496 | | | 9/19/24 | | | 2 | | |
UBS AG | | CNY | 9,638 | | | $ | 1,350 | | | 9/19/24 | | | (— | @) | |
UBS AG | | COP | 98,575 | | | $ | 25 | | | 7/24/24 | | | 1 | | |
UBS AG | | EUR | 843 | | | $ | 904 | | | 7/24/24 | | | 1 | | |
UBS AG | | EUR | 62 | | | $ | 67 | | | 7/24/24 | | | 1 | | |
UBS AG | | EUR | 35 | | | $ | 38 | | | 7/24/24 | | | — | @ | |
UBS AG | | EUR | 76 | | | $ | 82 | | | 7/24/24 | | | — | @ | |
The accompanying notes are an integral part of the consolidated financial statements.
21
Morgan Stanley Variable Insurance Fund, Inc.
June 30, 2024 (unaudited)
Consolidated Portfolio of Investments (cont'd)
Global Strategist Portfolio
Foreign Currency Forward Exchange Contracts (cont'd):
Counterparty | | Contracts
to
Deliver
(000) | | In
Exchange
For
(000) | | Delivery
Date | | Unrealized
Appreciation
(Depreciation)
(000) | |
UBS AG | | JPY | 20,858 | | | $ | 136 | | | 7/24/24 | | $ | 6 | | |
UBS AG | | JPY | 31,369 | | | $ | 201 | | | 7/24/24 | | | 6 | | |
UBS AG | | JPY | 16,638 | | | $ | 107 | | | 9/19/24 | | | 2 | | |
UBS AG | | KRW | 478,335 | | | $ | 350 | | | 9/19/24 | | | 1 | | |
UBS AG | | NOK | 285 | | | $ | 27 | | | 9/19/24 | | | — | @ | |
UBS AG | | THB | 641 | | | $ | 18 | | | 9/19/24 | | | — | @ | |
UBS AG | | $ | 5 | | | AUD | 8 | | | 7/24/24 | | | — | @ | |
UBS AG | | $ | 31 | | | AUD | 47 | | | 9/19/24 | | | — | @ | |
UBS AG | | $ | 41 | | | CHF | 37 | | | 9/19/24 | | | — | @ | |
UBS AG | | $ | 332 | | | CNY | 2,360 | | | 7/24/24 | | | (7 | ) | |
UBS AG | | $ | 326 | | | EUR | 303 | | | 9/19/24 | | | (— | @) | |
UBS AG | | $ | 1 | | | HUF | 419 | | | 9/19/24 | | | (— | @) | |
UBS AG | | $ | 34 | | | JPY | 5,469 | | | 9/19/24 | | | (— | @) | |
UBS AG | | $ | 69 | | | JPY | 10,999 | | | 9/19/24 | | | (— | @) | |
UBS AG | | $ | 339 | | | KRW | 464,944 | | | 7/24/24 | | | (1 | ) | |
UBS AG | | $ | 259 | | | MXN | 4,846 | | | 9/19/24 | | | 3 | | |
UBS AG | | $ | 26 | | | NZD | 44 | | | 7/24/24 | | | 1 | | |
UBS AG | | $ | 2 | | | TRY | 62 | | | 9/19/24 | | | — | @ | |
| | | | | | | | | $ | (44 | ) | |
Futures Contracts:
The Fund had the following futures contracts open at June 30, 2024:
| | | Number
of
Contracts | | Expiration
Date | | Notional
Amount
(000) | | Value
(000) | | Unrealized
Appreciation
(Depreciation)
(000) | |
Long: | |
CAC 40 Index (France) | | | 1 | | | Jul-24 | | EUR | — | @ | | $ | 80 | | | $ | — | @ | |
FTSE MIB Index (Italy) | | | 1 | | | Sep-24 | | | — | @ | | | 179 | | | | 3 | | |
German Euro-Schatz Index (Germany) | | | 12 | | | Sep-24 | | | 1,200 | | | | 1,358 | | | | 6 | | |
Hang Seng Index (Hong Kong) | | | 1 | | | Jul-24 | | HKD | — | @ | | | 113 | | | | (2 | ) | |
IBEX 35 Index (Spain) | | | 1 | | | Jul-24 | | EUR | — | @ | | | 117 | | | | — | @ | |
ICE Brent Crude Oil Index (United States) | | | 3 | | | Jul-24 | | $ | 3 | | | | 255 | | | | 2 | | |
IFSC NIFTY 50 Index (India) | | | 8 | | | Jul-24 | | | — | @ | | | 386 | | | | 6 | | |
KFE 10 yr. Treasury Bond Index (Korea, Republic of) | | | 5 | | | Sep-24 | | KRW | 500,000 | | | | 416 | | | | 2 | | |
Long Gilt Index (United Kingdom) | | | 1 | | | Sep-24 | | GBP | 100 | | | | 123 | | | | 1 | | |
S&P 500 E Mini Index (United States) | | | 1 | | | Sep-24 | | $ | — | @ | | | 276 | | | | (1 | ) | |
SFE 10 yr. Australian Bond Index (Australia) | | | 2 | | | Sep-24 | | AUD | 200 | | | | 152 | | | | 1 | | |
SFE S&P ASX Share Price Index (Australia) | | | 1 | | | Sep-24 | | | — | @ | | | 130 | | | | — | @ | |
SGX MSCI Singapore Index (Singapore) | | | 1 | | | Jul-24 | | SGD | — | @ | | | 23 | | | | — | @ | |
U.S. Treasury 10 yr. Note (United States) | | | 10 | | | Sep-24 | | $ | 1,000 | | | | 1,100 | | | | 4 | | |
U.S. Treasury 10 yr. Ultra Note (United States) | | | 18 | | | Sep-24 | | | 1,800 | | | | 2,044 | | | | 20 | | |
U.S. Treasury 5 yr. Note (United States) | | | 22 | | | Sep-24 | | | 2,200 | | | | 2,345 | | | | 18 | | |
U.S. Treasury Long Bond (United States) | | | 1 | | | Sep-24 | | | 100 | | | | 118 | | | | 2 | | |
Short: | |
COMEX Gold 100 OZ (United States) | | | 3 | | | Aug-24 | | | (— | @) | | | (702 | ) | | | 9 | | |
Euro Stoxx 50 Index (Germany) | | | 18 | | | Sep-24 | | EUR | (— | @) | | | (949 | ) | | | 4 | | |
German Euro-Bobl Index (Germany) | | | 1 | | | Sep-24 | | | (100 | ) | | | (125 | ) | | | (1 | ) | |
German Euro-BTP Index (Germany) | | | 6 | | | Sep-24 | | | (600 | ) | | | (741 | ) | | | 11 | | |
German Euro-Bund Index (Germany) | | | 12 | | | Sep-24 | | | (1,200 | ) | | | (1,691 | ) | | | (20 | ) | |
The accompanying notes are an integral part of the consolidated financial statements.
22
Morgan Stanley Variable Insurance Fund, Inc.
June 30, 2024 (unaudited)
Consolidated Portfolio of Investments (cont'd)
Global Strategist Portfolio
Futures Contracts (cont'd):
| | | Number
of
Contracts | | Expiration
Date | | Notional
Amount
(000) | | Value
(000) | | Unrealized
Appreciation
(Depreciation)
(000) | |
Hang Seng China Enterprises Index (Hong Kong) | | | 16 | | | Jul-24 | | HKD | (1 | ) | | $ | (642 | ) | | $ | 11 | | |
KFE KOSPI 200 Index (Korea, Republic of) | | | 5 | | | Sep-24 | | KRW | (1,250 | ) | | | (351 | ) | | | (15 | ) | |
MSCI Emerging Market EMEA Index (United States) | | | 13 | | | Sep-24 | | $ | (1 | ) | | | (707 | ) | | | 6 | | |
Nikkei 225 Index (Japan) | | | 1 | | | Sep-24 | | JPY | (1 | ) | | | (124 | ) | | | (1 | ) | |
SFE 10 yr. Australian Bond Index (Australia) | | | 3 | | | Sep-24 | | AUD | (300 | ) | | | (227 | ) | | | (— | @) | |
TSE Japanese 10 yr. Bond Index (Japan) | | | 4 | | | Sep-24 | | JPY | (400,000 | ) | | | (3,552 | ) | | | 2 | | |
U.S. Treasury 10 yr. Ultra Note (United States) | | | 5 | | | Sep-24 | | $ | (500 | ) | | | (568 | ) | | | (2 | ) | |
U.S. Treasury 5 yr. Note (United States) | | | 2 | | | Sep-24 | | | (200 | ) | | | (213 | ) | | | (1 | ) | |
U.S. Treasury Ultra Long Bond (United States) | | | 2 | | | Sep-24 | | | (200 | ) | | | (251 | ) | | | (7 | ) | |
| | | $ | 58 | | |
Centrally Cleared Interest Rate Swap Agreements:
The Fund had the following centrally cleared interest rate swap agreements open at June 30, 2024:
Swap Counterparty | | Floating
Rate
Index | | Pay/
Receive
Floating
Rate | | Fixed Rate | | Payment
Frequency
Paid/
Received | | Maturity
Date | | Notional
Amount
(000) | | Value
(000) | | Upfront
Payment
Paid
(000) | | Unrealized
Appreciation
(Depreciation)
(000) | |
Morgan Stanley & Co. LLC
| | 1 Month CNRR | | Pay | | | 2.38 | % | | Quarterly/
Quarterly | | 11/3/28 | | | 913 | | | $ | 2 | | | $ | — | | | $ | 2 | | |
Morgan Stanley & Co. LLC
| | 1 Month CNRR | | Pay | | | 2.38 | | | Quarterly/
Quarterly | | 11/3/28 | | | 7,219 | | | | 20 | | | | — | | | | 20 | | |
Morgan Stanley & Co. LLC
| | Euro-stat Eurozone HICP
ex Tobacco Index | | Pay | | | 2.17 | | | Maturity/
Maturity | | 1/15/34 | | | 648 | | | | (1 | ) | | | — | | | | (1 | ) | |
Morgan Stanley & Co. LLC
| | Euro-stat Eurozone HICP
ex Tobacco Index | | Pay | | | 2.17 | | | Maturity/
Maturity | | 1/15/34 | | | 701 | | | | (1 | ) | | | — | | | | (1 | ) | |
Morgan Stanley & Co. LLC
| | Euro-stat Eurozone HICP
ex Tobacco Index | | Pay | | | 2.17 | | | Maturity/
Maturity | | 1/15/34 | | | 648 | | | | (1 | ) | | | — | | | | (1 | ) | |
Morgan Stanley & Co. LLC
| | Euro-stat Eurozone HICP
ex Tobacco Index | | Pay | | | 2.17 | | | Maturity/
Maturity | | 1/15/34 | | | 518 | | | | (1 | ) | | | — | | | | (1 | ) | |
Morgan Stanley & Co. LLC
| | Euro-stat Eurozone HICP
ex Tobacco Index | | Pay | | | 2.17 | | | Maturity/
Maturity | | 1/15/34 | | | 648 | | | | (1 | ) | | | — | | | | (1 | ) | |
Morgan Stanley & Co. LLC
| | Euro-stat Eurozone HICP
ex Tobacco Index | | Pay | | | 2.18 | | | Maturity/
Maturity | | 1/15/34 | | | 648 | | | | (1 | ) | | | — | | | | (1 | ) | |
Morgan Stanley & Co. LLC
| | Euro-stat Eurozone HICP
ex Tobacco Index | | Pay | | | 2.42 | | | Maturity/
Maturity | | 1/15/54 | | | 233 | | | | (4 | ) | | | — | | | | (4 | ) | |
Morgan Stanley & Co. LLC
| | Euro-stat Eurozone HICP
ex Tobacco Index | | Pay | | | 2.42 | | | Maturity/
Maturity | | 1/15/54 | | | 233 | | | | (4 | ) | | | — | | | | (4 | ) | |
Morgan Stanley & Co. LLC
| | Euro-stat Eurozone HICP
ex Tobacco Index | | Pay | | | 2.42 | | | Maturity/
Maturity | | 1/15/54 | | | 230 | | | | (4 | ) | | | — | | | | (4 | ) | |
| | | | | | | | | | | | | | | $ | 4 | | | $ | — | | | $ | 4 | | |
Total Return Swap Agreements:
The Fund had the following total return swap agreements open at June 30, 2024:
Swap Counterparty | | Index | | Pay/
Receive
Total Return
of Reference
Index | | Floating Rate | | Payment
Frequency | | Maturity
Date | | Notional
Amount
(000) | | Value
(000) | | Upfront
Payment
Paid
(000) | | Unrealized
Appreciation
(Depreciation)
(000) | |
Bank of America NA | | MSCI USA Index | | Pay | | SOFR + 0.45% | | Quarterly | | 7/16/24 | | $ | 2,288 | | | $ | 125 | | | $ | — | | | $ | 125 | | |
Barclays Bank PLC
| | MSCI Emerging Markets ex
China Gross Return USD Index | | Receive | | SOFR + 0.56% | | Quarterly | | 5/29/25 | | | 1,679 | | | | (29 | ) | | | — | | | | (29 | ) | |
Barclays Bank PLC
| | MSCI Japan Net Total Return
USD Index | | Pay | | SOFR + 0.14% | | Quarterly | | 2/11/25 | | | 2,745 | | | | 6 | | | | — | | | | 6 | | |
The accompanying notes are an integral part of the consolidated financial statements.
23
Morgan Stanley Variable Insurance Fund, Inc.
June 30, 2024 (unaudited)
Consolidated Portfolio of Investments (cont'd)
Global Strategist Portfolio
Total Return Swap Agreements (cont'd):
Swap Counterparty | | Index | | Pay/
Receive
Total Return
of Reference
Index | | Floating Rate | | Payment
Frequency | | Maturity
Date | | Notional
Amount
(000) | | Value
(000) | | Upfront
Payment
Paid
(000) | | Unrealized
Appreciation
(Depreciation)
(000) | |
BNP Paribas SA | | BNP EM Value Index†† | | Pay | | SOFR + 0.55% | | Quarterly | | 5/22/25 | | $ | 1,290 | | | $ | 9 | | | $ | — | | | $ | 9 | | |
BNP Paribas SA
| | BNP EMU Anti Value Quality
Index†† | | Receive | | ESTR + 0.02% | | Quarterly | | 9/18/24 | | EUR | 1,471 | | | | 46 | | | | — | | | | 46 | | |
BNP Paribas SA
| | BNP EMU Anti-Value
Index†† | | Receive | | ESTR + 0.02% | | Quarterly | | 9/18/24 | | | 1,113 | | | | 39 | | | | — | | | | 39 | | |
BNP Paribas SA | | BNP EMU Value Index†† | | Pay | | ESTR + 0.35% | | Quarterly | | 9/18/24 | | | 1,106 | | | | (36 | ) | | | — | | | | (36 | ) | |
BNP Paribas SA
| | BNP EMU Value Quality
Index†† | | Pay | | ESTR + 0.35% | | Quarterly | | 9/18/24 | | | 1,463 | | | | (40 | ) | | | — | | | | (40 | ) | |
BNP Paribas SA | | EMU Domestics Index†† | | Pay | | ESTR + 0.21% | | Quarterly | | 1/15/25 | | | 513 | | | | (28 | ) | | | — | | | | (28 | ) | |
BNP Paribas SA | | EMU Domestics Index†† | | Pay | | ESTR + 0.21% | | Quarterly | | 1/15/25 | | | 449 | | | | (24 | ) | | | — | | | | (24 | ) | |
BNP Paribas SA | | EMU Domestics Index†† | | Pay | | ESTR + 0.21% | | Quarterly | | 1/15/25 | | | 407 | | | | (19 | ) | | | — | | | | (19 | ) | |
BNP Paribas SA | | U.S. Domestics Index†† | | Receive | | SOFR + 0.38% | | Quarterly | | 1/15/25 | | $ | 420 | | | | 2 | | | | — | | | | 2 | | |
BNP Paribas SA | | U.S. Domestics Index†† | | Receive | | SOFR + 0.38% | | Quarterly | | 1/15/25 | | | 455 | | | | 6 | | | | — | | | | 6 | | |
BNP Paribas SA | | U.S. Domestics Index†† | | Receive | | SOFR + 0.38% | | Quarterly | | 1/15/25 | | | 539 | | | | 1 | | | | — | | | | 1 | | |
Goldman Sachs
International | | MSCI Emerging Markets
Net Total Return Index | | Pay | | SOFR + 0.00% | | Quarterly | | 1/28/25 | | | 5,139 | | | | 243 | | | | — | | | | 243 | | |
JPMorgan Chase Bank NA | | Japan Growth Index†† | | Receive | | SOFR + 0.19% | | Quarterly | | 6/17/25 | | | 648 | | | | 8 | | | | — | | | | 8 | | |
JPMorgan Chase Bank NA | | Japan Value Index†† | | Pay | | SOFR + 0.00% | | Quarterly | | 6/17/25 | | | 634 | | | | (5 | ) | | | — | | | | (5 | ) | |
JPMorgan Chase Bank NA | | Korea Value Index | | Pay | | SOFR + 0.16% | | Quarterly | | 6/17/25 | | | 324 | | | | 8 | | | | — | | | | 8 | | |
UBS AG | | MSCI USA Index | | Pay | | SOFR + 0.46% | | Quarterly | | 9/24/24 | | | 11,797 | | | | (36 | ) | | | — | | | | (36 | ) | |
| | | | | | | | | | | | | | | $ | 276 | | | $ | — | | | $ | 276 | | |
†† See tables below for details of the equity basket holdings underlying the swaps.
The following table represents the equity basket top 50 individual holdings underlying the total return swap with BNP EM Value Index as of June 30, 2024:
Security Description | | Shares | | Value
(000) | | Percentage of
Net Assets | |
BNP EM Value Index | |
Absa Group Ltd. | | | 1,395 | | | $ | 12 | | | | 0.01 | % | |
Akbank T.A.S. | | | 4,919 | | | | 10 | | | | 0.01 | | |
Alpha Services and Holdings | | | 3,793 | | | | 6 | | | | 0.01 | | |
Ambev SA | | | 7,346 | | | | 15 | | | | 0.02 | | |
Arca Continental SAB de CV | | | 802 | | | | 8 | | | | 0.01 | | |
ASE Technology Holding Co. Ltd. | | | 7,963 | | | | 41 | | | | 0.05 | | |
Astra International Tbk. PT | | | 26,231 | | | | 7 | | | | 0.01 | | |
Banco Do Brasil SA | | | 2,888 | | | | 14 | | | | 0.02 | | |
Bancolombia SA — Pref | | | 787 | | | | 6 | | | | 0.01 | | |
Bank Pekao SA | | | 304 | | | | 13 | | | | 0.02 | | |
Bidvest Group Ltd. | | | 374 | | | | 6 | | | | 0.01 | | |
Cemex SAB-CPO | | | 15,551 | | | | 10 | | | | 0.01 | | |
Cia Energetica Minas Ger — Prf | | | 3,584 | | | | 6 | | | | 0.01 | | |
Commercial Bank PSQC | | | 5,285 | | | | 6 | | | | 0.01 | | |
Compal Electronics | | | 10,892 | | | | 12 | | | | 0.01 | | |
DB Insurance Co. Ltd. | | | 85 | | | | 7 | | | | 0.01 | | |
Dubai Islamic Bank | | | 5,947 | | | | 9 | | | | 0.01 | | |
Emaar Properties PJSC | | | 3,523 | | | | 8 | | | | 0.01 | | |
Emirates NBD PJSC | | | 2,649 | | | | 12 | | | | 0.01 | | |
Eurobank Ergasias Services
and Holdings SA | | | 4,360 | | | | 9 | | | | 0.01 | | |
Security Description | | Shares | | Value
(000) | | Percentage of
Net Assets | |
BNP EM Value Index (cont'd) | |
Globalwafers Co. Ltd. | | | 715 | | | $ | 12 | | | | 0.01 | % | |
Hana Financial Group | | | 498 | | | | 22 | | | | 0.03 | | |
Hon Hai Precision Industry | | | 32,361 | | | | 213 | | | | 0.26 | | |
Hyundai Mobis Co. Ltd. | | | 57 | | | | 10 | | | | 0.01 | | |
Itausa SA | | | 9,035 | | | | 16 | | | | 0.02 | | |
Kia Corp. | | | 229 | | | | 21 | | | | 0.03 | | |
Koc Holding AS | | | 970 | | | | 7 | | | | 0.01 | | |
Largan Precision Co. Ltd. | | | 291 | | | | 25 | | | | 0.03 | | |
LG Electronics, Inc. | | | 101 | | | | 8 | | | | 0.01 | | |
LG Innotek Co. Ltd. | | | 39 | | | | 8 | | | | 0.01 | | |
Lite-On Technology Corp. | | | 4,785 | | | | 16 | | | | 0.02 | | |
Micro-Star International Co. | | | 1,764 | | | | 10 | | | | 0.01 | | |
National Bank of Greece | | | 1,295 | | | | 11 | | | | 0.01 | | |
Nedbank Group Ltd. | | | 721 | | | | 10 | | | | 0.01 | | |
OTP Bank PLC | | | 366 | | | | 18 | | | | 0.02 | | |
Pegatron Corp. | | | 5,369 | | | | 17 | | | | 0.02 | | |
Petroleo Brasileiro SA | | | 4,041 | | | | 29 | | | | 0.04 | | |
Richter Gedeon Nyrt | | | 276 | | | | 7 | | | | 0.01 | | |
Samsung C&T Corp. | | | 118 | | | | 12 | | | | 0.01 | | |
Samsung Electro-Mechanics Co. | | | 152 | | | | 17 | | | | 0.02 | | |
Samsung SDS Co. Ltd. | | | 100 | | | | 11 | | | | 0.01 | | |
Shinhan Financial Group Ltd. | | | 728 | | | | 25 | | | | 0.03 | | |
The accompanying notes are an integral part of the consolidated financial statements.
24
Morgan Stanley Variable Insurance Fund, Inc.
June 30, 2024 (unaudited)
Consolidated Portfolio of Investments (cont'd)
Global Strategist Portfolio
Security Description | | Shares | | Value
(000) | | Percentage of
Net Assets | |
BNP EM Value Index (cont'd) | |
Suzano SA | | | 835 | | | $ | 9 | | | | 0.01 | % | |
Telefonica Brasil SA | | | 754 | | | | 6 | | | | 0.01 | | |
Telkom Indonesia Persero Tbk. PT | | | 91,692 | | | | 18 | | | | 0.02 | | |
Turk Hava Yollari AO | | | 722 | | | | 7 | | | | 0.01 | | |
Turkiye Is Bankasi — Class C | | | 14,091 | | | | 7 | | | | 0.01 | | |
Vale SA | | | 3,488 | | | | 39 | | | | 0.05 | | |
Woori Financial Group, Inc. | | | 1,007 | | | | 11 | | | | 0.01 | | |
Zhen Ding Technology Holding Ltd. | | | 1,799 | | | | 7 | | | | 0.01 | | |
The following table represents the equity basket holdings underlying the total return swap with BNP EMU Anti Value Quality Index as of June 30, 2024:
Security Description | | Shares | | Value
(000) | | Percentage of
Net Assets | |
BNP EMU Anti Value Quality Index | |
Accor SA | | | 572 | | | $ | 22 | | | | 0.03 | % | |
Adidas AG | | | 97 | | | | 22 | | | | 0.03 | | |
ADP | | | 138 | | | | 16 | | | | 0.02 | | |
Adyen NV | | | 21 | | | | 24 | | | | 0.03 | | |
Airbus SE | | | 6 | | | | 1 | | | | 0.00 | | |
Argenx SE | | | 62 | | | | 25 | | | | 0.03 | | |
Asm International NV | | | 32 | | | | 23 | | | | 0.03 | | |
BE Semiconductor Industries NV | | | 138 | | | | 22 | | | | 0.03 | | |
Beiersdorf AG | | | 235 | | | | 32 | | | | 0.04 | | |
Bollore SE | | | 1,054 | | | | 6 | | | | 0.01 | | |
CTS Eventim AG & Co. KgaA | | | 172 | | | | 13 | | | | 0.02 | | |
Davide Campari-Milano NV | | | 3,501 | | | | 31 | | | | 0.04 | | |
Delivery Hero SE | | | 772 | | | | 17 | | | | 0.02 | | |
Deutsche Boerse AG | | | 142 | | | | 27 | | | | 0.03 | | |
Edenred | | | 614 | | | | 24 | | | | 0.03 | | |
EDP Renovaveis SA | | | 1,460 | | | | 19 | | | | 0.02 | | |
EDP-Energias De Portugal SA | | | 9,757 | | | | 34 | | | | 0.04 | | |
Elia Group SA | | | 107 | | | | 9 | | | | 0.01 | | |
Eurazeo SE | | | 29 | | | | 2 | | | | 0.00 | | |
Euronext NV | | | 257 | | | | 22 | | | | 0.03 | | |
Ferrari NV | | | 57 | | | | 22 | | | | 0.03 | | |
Ferrovial SE | | | 730 | | | | 26 | | | | 0.03 | | |
Galp Energia SGPS SA | | | 1,170 | | | | 23 | | | | 0.03 | | |
Gecina SA | | | 158 | | | | 14 | | | | 0.02 | | |
Getlink SE | | | 1,291 | | | | 20 | | | | 0.02 | | |
Groupe Bruxelles Lambert NV | | | 157 | | | | 10 | | | | 0.01 | | |
Hannover Rueck SE | | | 112 | | | | 26 | | | | 0.03 | | |
Hermes International | | | 10 | | | | 22 | | | | 0.03 | | |
Infrastrutture Wireless Italiane SpA | | | 2,020 | | | | 20 | | | | 0.02 | | |
Inpost SA | | | 1,507 | | | | 25 | | | | 0.03 | | |
LEG Immobilien SE | | | 93 | | | | 7 | | | | 0.01 | | |
Lotus Bakeries | | | 1 | | | | 8 | | | | 0.01 | | |
MTU Aero Engines AG | | | 115 | | | | 27 | | | | 0.03 | | |
Nexi SpA | | | 4,354 | | | | 25 | | | | 0.03 | | |
OCI NV | | | 474 | | | | 11 | | | | 0.01 | | |
Prosus NV | | | 640 | | | | 21 | | | | 0.03 | | |
Security Description | | Shares | | Value
(000) | | Percentage of
Net Assets | |
BNP EMU Anti Value Quality Index (cont'd) | |
Rational AG | | | 9 | | | $ | 7 | | | | 0.01 | % | |
Remy Cointreau SA | | | 145 | | | | 11 | | | | 0.01 | | |
Rheinmetall AG | | | 52 | | | | 25 | | | | 0.03 | | |
Sampo OYJ — Class A | | | 653 | | | | 26 | | | | 0.03 | | |
Sartorius AG | | | 91 | | | | 20 | | | | 0.02 | | |
Sartorius Stedim Biotech | | | 122 | | | | 19 | | | | 0.02 | | |
Scout24 SE | | | 178 | | | | 13 | | | | 0.02 | | |
Siemens Energy AG | | | 1,120 | | | | 27 | | | | 0.03 | | |
Sofina SA | | | 31 | | | | 7 | | | | 0.01 | | |
Stora Enso OYJ — Class R | | | 2,156 | | | | 28 | | | | 0.03 | | |
Symrise AG | | | 247 | | | | 28 | | | | 0.03 | | |
UCB SA | | | 163 | | | | 23 | | | | 0.03 | | |
Vivendi SE | | | 1,398 | | | | 14 | | | | 0.02 | | |
The following table represents the equity basket holdings underlying the total return swap with BNP EMU Anti-Value Index as of June 30, 2024:
Security Description | | Shares | | Value
(000) | | Percentage of
Net Assets | |
BNP EMU Anti-Value Index | |
Adidas AG | | | 100 | | | $ | 22 | | | | 0.03 | % | |
Adyen NV | | | 20 | | | | 22 | | | | 0.03 | | |
Air Liquide SA | | | 162 | | | | 26 | | | | 0.03 | | |
Amplifon SpA | | | 666 | | | | 22 | | | | 0.03 | | |
Argenx SE | | | 64 | | | | 26 | | | | 0.03 | | |
ASM International NV | | | 33 | | | | 23 | | | | 0.03 | | |
BE Semiconductor Industries NV | | | 142 | | | | 22 | | | | 0.03 | | |
Beiersdorf AG | | | 183 | | | | 25 | | | | 0.03 | | |
CTS Eventim AG & Co. KGaA | | | 321 | | | | 25 | | | | 0.03 | | |
Davide Campari-Milano NV | | | 2,734 | | | | 24 | | | | 0.03 | | |
Delivery Hero SE | | | 794 | | | | 18 | | | | 0.02 | | |
Deutsche Boerse AG | | | 134 | | | | 26 | | | | 0.03 | | |
Edenred | | | 579 | | | | 23 | | | | 0.03 | | |
EDP Renovaveis SA | | | 1,641 | | | | 21 | | | | 0.03 | | |
Euronext NV | | | 265 | | | | 23 | | | | 0.03 | | |
Ferrari NV | | | 59 | | | | 22 | | | | 0.03 | | |
Ferrovial SE | | | 679 | | | | 25 | | | | 0.03 | | |
Finecobank SpA | | | 1,704 | | | | 24 | | | | 0.03 | | |
Gecina SA | | | 207 | | | | 18 | | | | 0.02 | | |
Getlink SE | | | 1,530 | | | | 24 | | | | 0.03 | | |
Hannover Rueck SE | | | 106 | | | | 25 | | | | 0.03 | | |
Hermes International | | | 10 | | | | 22 | | | | 0.03 | | |
Inpost SA | | | 1,450 | | | | 24 | | | | 0.03 | | |
L'Oreal | | | 59 | | | | 24 | | | | 0.03 | | |
Lotus Bakeries | | | 1 | | | | 10 | | | | 0.01 | | |
Moncler SpA | | | 381 | | | | 22 | | | | 0.03 | | |
MTU Aero Engines AG | | | 107 | | | | 25 | | | | 0.03 | | |
Muenchener Rueckver AG — Reg | | | 53 | | | | 25 | | | | 0.03 | | |
OCI NV | | | 622 | | | | 14 | | | | 0.02 | | |
Prosus NV | | | 658 | | | | 22 | | | | 0.03 | | |
Rational AG | | | 12 | | | | 9 | | | | 0.01 | | |
The accompanying notes are an integral part of the consolidated financial statements.
25
Morgan Stanley Variable Insurance Fund, Inc.
June 30, 2024 (unaudited)
Consolidated Portfolio of Investments (cont'd)
Global Strategist Portfolio
Security Description | | Shares | | Value
(000) | | Percentage of
Net Assets | |
BNP EMU Anti-Value Index (cont'd) | |
Redeia Corp SA | | | 1,347 | | | $ | 22 | | | | 0.03 | % | |
Rheinmetall AG | | | 48 | | | | 23 | | | | 0.03 | | |
Sampo OYJ — Class A | | | 616 | | | | 25 | | | | 0.03 | | |
Sartorius AG | | | 94 | | | | 21 | | | | 0.02 | | |
Sartorius Stedim Biotech | | | 126 | | | | 19 | | | | 0.02 | | |
Schneider Electric SE | | | 106 | | | | 24 | | | | 0.03 | | |
Scout24 SE | | | 233 | | | | 17 | | | | 0.02 | | |
Sofina SA | | | 40 | | | | 9 | | | | 0.01 | | |
Symrise AG | | | 240 | | | | 27 | | | | 0.03 | | |
Terna-Rete Elettrica Naziona | | | 2,988 | | | | 22 | | | | 0.03 | | |
Universal Music Group NV | | | 889 | | | | 25 | | | | 0.03 | | |
Warehouses De Pauw SCA | | | 118 | | | | 3 | | | | 0.00 | | |
Wolters Kluwer NV | | | 162 | | | | 25 | | | | 0.03 | | |
The following table represents the equity basket holdings underlying the total return swap with BNP EMU Value Index as of June 30, 2024:
Security Description | | Shares | | Value
(000) | | Percentage of
Net Assets | |
BNP EMU Value Index | |
ABN AMRO Bank NV — CVA | | | 1,400 | | | $ | 21 | | | | 0.03 | % | |
AIB Group PLC | | | 4,476 | | | | 22 | | | | 0.03 | | |
ArcelorMittal SA | | | 1,199 | | | | 26 | | | | 0.03 | | |
Banco BPM SpA | | | 3,561 | | | | 21 | | | | 0.03 | | |
Banco Santander SA | | | 4,862 | | | | 21 | | | | 0.03 | | |
Bank Of Ireland Group PLC | | | 2,213 | | | | 22 | | | | 0.03 | | |
Bayer AG — Reg | | | 797 | | | | 21 | | | | 0.03 | | |
Bayerische Motoren Werke AG | | | 288 | | | | 25 | | | | 0.03 | | |
Bayerische Motoren Werke AG (Preference) | | | 209 | | | | 17 | | | | 0.02 | | |
Bouygues SA | | | 693 | | | | 21 | | | | 0.02 | | |
Carrefour SA | | | 2,034 | | | | 27 | | | | 0.03 | | |
Commerzbank AG | | | 1,500 | | | | 21 | | | | 0.03 | | |
Covivio | | | 304 | | | | 13 | | | | 0.02 | | |
Daimler Truck Holding AG | | | 577 | | | | 21 | | | | 0.03 | | |
Deutsche Bank AG — Registered | | | 1,485 | | | | 22 | | | | 0.03 | | |
Deutsche Lufthansa — Reg | | | 3,647 | | | | 21 | | | | 0.02 | | |
Deutsche Telekom AG — Reg | | | 964 | | | | 23 | | | | 0.03 | | |
DHL Group | | | 562 | | | | 21 | | | | 0.03 | | |
Eiffage | | | 244 | | | | 21 | | | | 0.03 | | |
Enel SpA | | | 3,306 | | | | 21 | | | | 0.03 | | |
Engie SA | | | 1,591 | | | | 21 | | | | 0.03 | | |
Erste Group Bank AG | | | 496 | | | | 22 | | | | 0.03 | | |
Fortum OYJ | | | 1,536 | | | | 21 | | | | 0.03 | | |
Fresenius Medical Care AG | | | 559 | | | | 20 | | | | 0.02 | | |
Fresenius SE & Co. KGaA | | | 727 | | | | 20 | | | | 0.02 | | |
Grifols SA | | | 2,350 | | | | 18 | | | | 0.02 | | |
Heidelberg Materials AG | | | 274 | | | | 27 | | | | 0.03 | | |
JDE Peet's NV | | | 537 | | | | 10 | | | | 0.01 | | |
Kesko OYJ — Class B | | | 1,045 | | | | 17 | | | | 0.02 | | |
Klepierre SA | | | 288 | | | | 7 | | | | 0.01 | | |
Koninklijke Ahold Delhaize NV | | | 1,064 | | | | 29 | | | | 0.04 | | |
Security Description | | Shares | | Value
(000) | | Percentage of
Net Assets | |
BNP EMU Value Index (cont'd) | |
Mercedes-Benz Group AG | | | 400 | | | $ | 26 | | | | 0.03 | % | |
Nokia OYJ | | | 6,209 | | | | 22 | | | | 0.03 | | |
Orange SA | | | 2,302 | | | | 22 | | | | 0.03 | | |
Randstad NV | | | 470 | | | | 20 | | | | 0.02 | | |
Rexel SA | | | 822 | | | | 20 | | | | 0.02 | | |
Stellantis NV | | | 1,292 | | | | 24 | | | | 0.03 | | |
Stmicroelectronics NV | | | 531 | | | | 20 | | | | 0.02 | | |
Telefonica SA | | | 5,250 | | | | 21 | | | | 0.02 | | |
Teleperformance | | | 221 | | | | 22 | | | | 0.03 | | |
Unicredit SpA | | | 621 | | | | 21 | | | | 0.03 | | |
Voestalpine AG | | | 469 | | | | 12 | | | | 0.01 | | |
Volkswagen AG | | | 96 | | | | 11 | | | | 0.01 | | |
Volkswagen AG — Pref | | | 241 | | | | 25 | | | | 0.03 | | |
The following table represents the equity basket holdings underlying the total return swap with BNP EMU Value Quality Index as of June 30, 2024:
Security Description | | Shares | | Value
(000) | | Percentage of
Net Assets | |
BNP EMU Value Quality Index | |
ABN AMRO Bank NV — CVA | | | 1,383 | | | $ | 21 | | | | 0.03 | % | |
Agea SA | | | 500 | | | | 21 | | | | 0.03 | | |
AIB Group PLC | | | 4,421 | | | | 22 | | | | 0.03 | | |
ArcelorMittal SA | | | 965 | | | | 21 | | | | 0.02 | | |
Banco Bilbao Vizcaya Argenta | | | 2,340 | | | | 22 | | | | 0.03 | | |
Banco Santander SA | | | 4,803 | | | | 21 | | | | 0.02 | | |
Bank Of Ireland Group PLC | | | 2,186 | | | | 21 | | | | 0.03 | | |
Bayer AG — Reg | | | 787 | | | | 21 | | | | 0.02 | | |
Bayerische Motoren Werke AG | | | 272 | | | | 24 | | | | 0.03 | | |
Bouygues SA | | | 684 | | | | 21 | | | | 0.02 | | |
Capgemini SE | | | 114 | | | | 21 | | | | 0.03 | | |
Carrefour SA | | | 1,659 | | | | 22 | | | | 0.03 | | |
Compagnie De Saint Gobain | | | 282 | | | | 20 | | | | 0.02 | | |
Covivio | | | 236 | | | | 10 | | | | 0.01 | | |
Daimler Truck Holding AG | | | 570 | | | | 21 | | | | 0.03 | | |
Deutsche Bank AG — Registered | | | 1,467 | | | | 22 | | | | 0.03 | | |
Deutsche Telekom AG — Reg | | | 952 | | | | 22 | | | | 0.03 | | |
Eiffage | | | 241 | | | | 21 | | | | 0.02 | | |
Enel SpA | | | 3,266 | | | | 21 | | | | 0.03 | | |
Engie | | | 1,571 | | | | 21 | | | | 0.03 | | |
Erste Group Bank AG | | | 490 | | | | 22 | | | | 0.03 | | |
Fortum OYJ | | | 1,517 | | | | 21 | | | | 0.02 | | |
Fresenius Medical Care AG | | | 552 | | | | 20 | | | | 0.02 | | |
Fresenius SE & Co. KGaA | | | 718 | | | | 20 | | | | 0.02 | | |
Heidelberg Materials AG | | | 220 | | | | 21 | | | | 0.03 | | |
Jeronimo Martins | | | 1,239 | | | | 23 | | | | 0.03 | | |
Kesko OYJ — Class B | | | 810 | | | | 13 | | | | 0.02 | | |
Klepierre | | | 399 | | | | 10 | | | | 0.01 | | |
Koninklijke Ahold Delhaize NV | | | 868 | | | | 24 | | | | 0.03 | | |
Mercedes-Benz Group AG | | | 377 | | | | 24 | | | | 0.03 | | |
Michelin | | | 630 | | | | 23 | | | | 0.03 | | |
Nokia OYJ | | | 6,134 | | | | 22 | | | | 0.03 | | |
The accompanying notes are an integral part of the consolidated financial statements.
26
Morgan Stanley Variable Insurance Fund, Inc.
June 30, 2024 (unaudited)
Consolidated Portfolio of Investments (cont'd)
Global Strategist Portfolio
Security Description | | Shares | | Value
(000) | | Percentage of
Net Assets | |
BNP EMU Value Quality Index (cont'd) | |
Orange SA | | | 2,274 | | | $ | 21 | | | | 0.03 | % | |
Publicis Groupe SA | | | 212 | | | | 21 | | | | 0.03 | | |
Randstad NV | | | 464 | | | | 20 | | | | 0.02 | | |
Rexel SA | | | 812 | | | | 20 | | | | 0.02 | | |
Sanofi SA | | | 244 | | | | 22 | | | | 0.03 | | |
Smurfit Kappa Group PLC | | | 510 | | | | 21 | | | | 0.03 | | |
Stellantis NV | | | 1,220 | | | | 23 | | | | 0.03 | | |
Teleperformance | | | 218 | | | | 21 | | | | 0.03 | | |
Tenaris SA | | | 1,469 | | | | 21 | | | | 0.03 | | |
Unicredit SpA | | | 614 | | | | 21 | | | | 0.03 | | |
Vinci SA | | | 213 | | | | 21 | | | | 0.03 | | |
Volkswagen AG | | | 75 | | | | 8 | | | | 0.01 | | |
Volkswagen AG — Pref | | | 227 | | | | 24 | | | | 0.03 | | |
The following table represents the equity basket holdings underlying the total return swap with EMU Domestics Index as of June 30, 2024:
Security Description | | Shares | | Value
(000) | | Percentage of
Net Assets | |
EMU Domestics Index | |
ADP | | | 249 | | | $ | 28 | | | | 0.03 | % | |
Aena SME SA | | | 263 | | | | 49 | | | | 0.06 | | |
Basic-Fit NV | | | 326 | | | | 7 | | | | 0.01 | | |
Bechtle AG | | | 477 | | | | 21 | | | | 0.03 | | |
Bouygues SA | | | 957 | | | | 29 | | | | 0.03 | | |
Capgemini SE | | | 406 | | | | 75 | | | | 0.09 | | |
Compagnie De Saint Gobain | | | 1,181 | | | | 86 | | | | 0.10 | | |
Deutsche Lufthansa — Reg | | | 3,894 | | | | 22 | | | | 0.03 | | |
D'Ieteren Group | | | 134 | | | | 27 | | | | 0.03 | | |
Eiffage | | | 356 | | | | 31 | | | | 0.04 | | |
Exclusive Networks SA | | | 89 | | | | 2 | | | | 0.00 | | |
Fraport Ag Frankfurt Airport | | | 313 | | | | 15 | | | | 0.02 | | |
Getlink SE | | | 1,986 | | | | 31 | | | | 0.04 | | |
Indra Sistemas SA | | | 958 | | | | 18 | | | | 0.02 | | |
Industria de Diseno Textil SA | | | 2,512 | | | | 116 | | | | 0.14 | | |
Iveco Group NV | | | 2,828 | | | | 30 | | | | 0.04 | | |
Kingspan Group PLC | | | 577 | | | | 46 | | | | 0.05 | | |
La Francaise des Jeux SAEM | | | 504 | | | | 16 | | | | 0.02 | | |
Prosiebensat.1 Media SE | | | 1,885 | | | | 12 | | | | 0.01 | | |
Randstad NV | | | 627 | | | | 27 | | | | 0.03 | | |
Rheinmetall AG | | | 150 | | | | 71 | | | | 0.09 | | |
Scout24 SE | | | 461 | | | | 33 | | | | 0.04 | | |
Smurfit Kappa Group PLC | | | 1,090 | | | | 45 | | | | 0.05 | | |
Stora Enso OYJ — Class R | | | 2,879 | | | | 37 | | | | 0.04 | | |
Vinci SA | | | 1,089 | | | | 107 | | | | 0.13 | | |
Vivendi SE | | | 3,420 | | | | 33 | | | | 0.04 | | |
Zalando SE | | | 1,570 | | | | 34 | | | | 0.04 | | |
The following table represents the equity basket top 50 individual holdings underlying the total return swap with U.S. Domestics Index as of June 30, 2024:
Security Description | | Shares | | Value
(000) | | Percentage of
Net Assets | |
U.S. Domestics Index | |
Arista Networks, Inc. | | | 66 | | | $ | 23 | | | | 0.03 | % | |
Automatic Data Processing | | | 105 | | | | 25 | | | | 0.03 | | |
Autozone, Inc. | | | 5 | | | | 13 | | | | 0.02 | | |
CDW Corp. | | | 34 | | | | 8 | | | | 0.01 | | |
Charter Communications, Inc. — Class A | | | 25 | | | | 8 | | | | 0.01 | | |
Cintas Corp. | | | 23 | | | | 16 | | | | 0.02 | | |
Cognizant Tech Solutions — Class A | | | 128 | | | | 9 | | | | 0.01 | | |
Comcast Corp. — Class A | | | 1,047 | | | | 41 | | | | 0.05 | | |
Copart, Inc. | | | 215 | | | | 12 | | | | 0.01 | | |
Crowdstrike Holdings, Inc. — Class A | | | 53 | | | | 20 | | | | 0.02 | | |
CSX Corp. | | | 507 | | | | 17 | | | | 0.02 | | |
Datadog, Inc. — Class A | | | 64 | | | | 8 | | | | 0.01 | | |
Doordash, Inc. — Class A | | | 61 | | | | 7 | | | | 0.01 | | |
DR Horton, Inc. | | | 76 | | | | 11 | | | | 0.01 | | |
Equifax, Inc. | | | 31 | | | | 8 | | | | 0.01 | | |
Fair Isaac Corp. | | | 6 | | | | 9 | | | | 0.01 | | |
Fastenal Co. | | | 143 | | | | 9 | | | | 0.01 | | |
Fedex Corp. | | | 60 | | | | 18 | | | | 0.02 | | |
Hilton Worldwide Holdings, Inc. | | | 66 | | | | 14 | | | | 0.02 | | |
Home Depot, Inc. | | | 247 | | | | 85 | | | | 0.10 | | |
Lennar Corp. — Class A | | | 61 | | | | 9 | | | | 0.01 | | |
Lowe's Cos, Inc. | | | 144 | | | | 32 | | | | 0.04 | | |
Lululemon Athletica, Inc. | | | 30 | | | | 9 | | | | 0.01 | | |
Marriott International — Class A | | | 64 | | | | 16 | | | | 0.02 | | |
Martin Marietta Materials | | | 16 | | | | 8 | | | | 0.01 | | |
Norfolk Southern Corp. | | | 58 | | | | 12 | | | | 0.01 | | |
NVR, Inc. | | | 1 | | | | 6 | | | | 0.01 | | |
Old Dominion Freight Line | | | 50 | | | | 9 | | | | 0.01 | | |
O'Reilly Automotive, Inc. | | | 15 | | | | 16 | | | | 0.02 | | |
Pinterest Inc- Class A | | | 146 | | | | 6 | | | | 0.01 | | |
Quanta Services, Inc. | | | 37 | | | | 9 | | | | 0.01 | | |
Republic Services, Inc. | | | 56 | | | | 11 | | | | 0.01 | | |
Roper Technologies, Inc. | | | 27 | | | | 15 | | | | 0.02 | | |
Ross Stores, Inc. | | | 85 | | | | 12 | | | | 0.01 | | |
Sherwin-Williams Co. | | | 62 | | | | 18 | | | | 0.02 | | |
Snowflake, Inc. — Class A | | | 70 | | | | 10 | | | | 0.01 | | |
Starbucks Corp. | | | 292 | | | | 23 | | | | 0.03 | | |
TJX Companies, Inc. | | | 286 | | | | 31 | | | | 0.04 | | |
Tractor Supply Company | | | 28 | | | | 8 | | | | 0.01 | | |
Trane Technologies PLC | | | 57 | | | | 19 | | | | 0.02 | | |
Union Pacific Corp. | | | 155 | | | | 35 | | | | 0.04 | | |
United Parcel Service — Class B | | | 182 | | | | 25 | | | | 0.03 | | |
United Rentals, Inc. | | | 17 | | | | 11 | | | | 0.01 | | |
Verisk Analytics, Inc. | | | 36 | | | | 10 | | | | 0.01 | | |
Vulcan Materials Co. | | | 33 | | | | 8 | | | | 0.01 | | |
Walt Disney Co. | | | 475 | | | | 47 | | | | 0.06 | | |
Waste Connections, Inc. | | | 65 | | | | 11 | | | | 0.01 | | |
Waste Management, Inc. | | | 102 | | | | 22 | | | | 0.03 | | |
Workday, Inc. — Class A | | | 52 | | | | 12 | | | | 0.01 | | |
WW Grainger, Inc. | | | 11 | | | | 10 | | | | 0.01 | | |
The accompanying notes are an integral part of the consolidated financial statements.
27
Morgan Stanley Variable Insurance Fund, Inc.
June 30, 2024 (unaudited)
Consolidated Portfolio of Investments (cont'd)
Global Strategist Portfolio
The following table represents the equity basket holdings underlying the total return swap with Japan Growth Index as of June 30, 2024:
Security Description | | Shares | | Value
(000) | | Percentage of
Net Assets | |
Japan Growth Index | |
Advantest Corp. | | | 74,913 | | | $ | 2,992 | | | | 3.58 | % | |
ASICS Corp. | | | 177,889 | | | | 2,722 | | | | 3.26 | | |
Capcom Co. Ltd. | | | 144,032 | | | | 2,716 | | | | 3.25 | | |
Daiichi Sankyo Co. Ltd. | | | 72,510 | | | | 2,490 | | | | 2.98 | | |
Daikin Industries Ltd. | | | 18,130 | | | | 2,521 | | | | 3.02 | | |
Disco Corp. | | | 6,722 | | | | 2,551 | | | | 3.05 | | |
Fanuc Corp. | | | 91,998 | | | | 2,522 | | | | 3.02 | | |
Fast Retailing Co. Ltd. | | | 10,091 | | | | 2,545 | | | | 3.05 | | |
Hitachi Ltd. | | | 119,733 | | | | 2,680 | | | | 3.21 | | |
Hoshizaki Corp. | | | 76,186 | | | | 2,417 | | | | 2.89 | | |
Hoya Corp. | | | 21,752 | | | | 2,530 | | | | 3.03 | | |
Japan Exchange Group, Inc. | | | 109,976 | | | | 2,565 | | | | 3.07 | | |
Keisei Electric Railway Co. | | | 74,456 | | | | 2,396 | | | | 2.87 | | |
Keyence Corp. | | | 5,932 | | | | 2,602 | | | | 3.11 | | |
Kikkoman Corp. | | | 221,239 | | | | 2,563 | | | | 3.07 | | |
Lasertec Corp. | | | 11,063 | | | | 2,482 | | | | 2.97 | | |
Mcdonald's Holdings Co. | | | 63,584 | | | | 2,506 | | | | 3.00 | | |
Monotaro Co. Ltd. | | | 239,829 | | | | 2,819 | | | | 3.38 | | |
MS&AD Insurance Group Holdings, Inc. | | | 128,562 | | | | 2,857 | | | | 3.42 | | |
Nidec Corp. | | | 58,056 | | | | 2,593 | | | | 3.10 | | |
Nintendo Co. Ltd. | | | 47,731 | | | | 2,539 | | | | 3.04 | | |
Nippon Building Fund, Inc. | | | 831 | | | | 2,908 | | | | 3.48 | | |
Nippon Paint Holdings Co. Ltd. | | | 380,529 | | | | 2,479 | | | | 2.97 | | |
Nippon Prologis REIT, Inc. | | | 1,653 | | | | 2,580 | | | | 3.09 | | |
Obic Co. Ltd. | | | 20,507 | | | | 2,644 | | | | 3.17 | | |
Oriental Land Co. Ltd. | | | 93,216 | | | | 2,597 | | | | 3.11 | | |
Osaka Gas Co. Ltd. | | | 113,136 | | | | 2,492 | | | | 2.98 | | |
Recruit Holdings Co. Ltd. | | | 52,938 | | | | 2,833 | | | | 3.39 | | |
Shimano, Inc. | | | 15,321 | | | | 2,367 | | | | 2.83 | | |
Shin-Etsu Chemical Co. Ltd. | | | 66,106 | | | | 2,564 | | | | 3.07 | | |
Shiseido Co. Ltd. | | | 81,298 | | | | 2,319 | | | | 2.78 | | |
SMC Corp. | | | 5,337 | | | | 2,533 | | | | 3.03 | | |
Sumitomo Mitsui Trust Holdings, Inc | | | 114,299 | | | | 2,608 | | | | 3.12 | | |
Terumo Corp. | | | 151,527 | | | | 2,499 | | | | 2.99 | | |
Tokio Marine Holdings, Inc. | | | 72,890 | | | | 2,721 | | | | 3.26 | | |
Tokyo Electron Ltd. | | | 11,495 | | | | 2,494 | | | | 2.99 | | |
Unicharm Corp. | | | 79,233 | | | | 2,545 | | | | 3.05 | | |
Yaskawa Electric Corp. | | | 67,781 | | | | 2,434 | | | | 2.91 | | |
Zozo, Inc. | | | 107,669 | | | | 2,696 | | | | 3.23 | | |
The following table represents the equity basket holdings underlying the total return swap with Japan Value Index as of June 30, 2024:
Security Description | | Shares | | Value
(000) | | Percentage of
Net Assets | |
Japan Value Index | |
AGC, Inc. | | | 72,955 | | | $ | 2,361 | | | | 2.83 | % | |
Ana Holdings, Inc. | | | 133,955 | | | | 2,473 | | | | 2.96 | | |
Asahi Group Holdings Ltd. | | | 67,561 | | | | 2,384 | | | | 2.85 | | |
Brother Industries Ltd. | | | 133,934 | | | | 2,357 | | | | 2.82 | | |
Security Description | | Shares | | Value
(000) | | Percentage of
Net Assets | |
Japan Value Index (cont'd) | |
Canon, Inc. | | | 86,955 | | | $ | 2,354 | | | | 2.82 | % | |
Chubu Electric Power Co., Inc. | | | 194,063 | | | | 2,294 | | | | 2.75 | | |
Daiwa House Industry Co. Ltd. | | | 95,419 | | | | 2,419 | | | | 2.90 | | |
Fujitsu Limited | | | 162,132 | | | | 2,537 | | | | 3.04 | | |
Hitachi Construction Machine | | | 94,154 | | | | 2,522 | | | | 3.02 | | |
Honda Motor Co. Ltd. | | | 229,069 | | | | 2,449 | | | | 2.93 | | |
Isuzu Motors Ltd. | | | 190,764 | | | | 2,527 | | | | 3.03 | | |
Japan Airlines Co. Ltd. | | | 152,382 | | | | 2,405 | | | | 2.88 | | |
JFE Holdings, Inc. | | | 169,668 | | | | 2,442 | | | | 2.92 | | |
KDDI Corp. | | | 91,406 | | | | 2,417 | | | | 2.89 | | |
Kintetsu Group Holdings Co. Ltd. | | | 115,560 | | | | 2,516 | | | | 3.01 | | |
Kirin Holdings Co. Ltd. | | | 179,057 | | | | 2,308 | | | | 2.76 | | |
Kubota Corp. | | | 175,897 | | | | 2,460 | | | | 2.95 | | |
Mazda Motor Corp. | | | 256,377 | | | | 2,480 | | | | 2.97 | | |
Mitsui Osk Lines Ltd. | | | 80,427 | | | | 2,409 | | | | 2.88 | | |
Mizuho Financial Group, Inc. | | | 125,748 | | | | 2,625 | | | | 3.14 | | |
Nippon Express Holdings, Inc. | | | 51,898 | | | | 2,392 | | | | 2.86 | | |
Nippon Steel Corp. | | | 115,316 | | | | 2,438 | | | | 2.92 | | |
Nippon Telegraph & Telephone | | | 2,644,715 | | | | 2,496 | | | | 2.99 | | |
Nippon Yusen Kabushiki Kaisha | | | 82,506 | | | | 2,402 | | | | 2.87 | | |
Nissan Motor Co. Ltd. | | | 717,659 | | | | 2,436 | | | | 2.92 | | |
Nomura Real Estate Holdings | | | 97,573 | | | | 2,445 | | | | 2.93 | | |
Ono Pharmaceutical Co. Ltd. | | | 181,148 | | | | 2,474 | | | | 2.96 | | |
Orix Corp. | | | 113,753 | | | | 2,512 | | | | 3.01 | | |
Otsuka Holdings Co. Ltd. | | | 59,657 | | | | 2,511 | | | | 3.01 | | |
Panasonic Holdings Corp. | | | 296,959 | | | | 2,431 | | | | 2.91 | | |
Ricoh Co. Ltd. | | | 267,186 | | | | 2,285 | | | | 2.74 | | |
Rohm Co. Ltd. | | | 186,112 | | | | 2,488 | | | | 2.98 | | |
SBI Holdings, Inc. | | | 97,860 | | | | 2,474 | | | | 2.96 | | |
Seiko Epson Corp. | | | 157,664 | | | | 2,450 | | | | 2.93 | | |
Seven & I Holdings Co. Ltd. | | | 192,173 | | | | 2,342 | | | | 2.80 | | |
Shionogi & Co. Ltd. | | | 64,157 | | | | 2,504 | | | | 3.00 | | |
Shizuoka Financial Group, Inc. | | | 259,527 | | | | 2,491 | | | | 2.98 | | |
Subaru Corp. | | | 115,155 | | | | 2,441 | | | | 2.92 | | |
Toyota Tsusho Corp. | | | 126,961 | | | | 2,472 | | | | 2.96 | | |
@ Value/Notional amount is less than $500.
AGC Assured Guaranty Corporation.
CAC Cotation Assistée en Continu.
CVA Certificaten Van Aandelen.
EMU European Economic and Monetary Union.
ESTR Euro Short-Term Rate
Euronext NV Euronext Amsterdam Stock Market.
FTSE Financial Times Stock Exchange.
IBEX Índice Bursátil Español.
ICE Intercontinental Exchange.
KFE Korean Futures Exchange.
MIB Milano Indice di Borsa.
MSCI Morgan Stanley Capital International.
PJSC Public Joint Stock Company.
REIT Real Estate Investment Trust.
The accompanying notes are an integral part of the consolidated financial statements.
28
Morgan Stanley Variable Insurance Fund, Inc.
June 30, 2024 (unaudited)
Consolidated Portfolio of Investments (cont'd)
Global Strategist Portfolio
SFE Sydney Futures Exchange.
SGX Singapore Exchange Ltd.
SOFR Secured Overnight Financing Rate.
TSE Toronto Stock Exchange.
AUD — Australian Dollar
BRL — Brazilian Real
CAD — Canadian Dollar
CNY — Chinese Yuan Renminbi
COP — Colombian Peso
CZK — Czech Koruna
DKK — Danish Krone
EUR — Euro
GBP — British Pound
HKD — Hong Kong Dollar
HUF — Hungarian Forint
IDR — Indonesian Rupiah
JPY — Japanese Yen
KRW — South Korean Won
MXN — Mexican Peso
MYR — Malaysian Ringgit
NOK — Norwegian Krone
NZD — New Zealand Dollar
PLN — Polish Zloty
SGD — Singapore Dollar
THB — Thai Baht
USD — United States Dollar
ZAR — South African Rand
Portfolio Composition
Classification | | Percentage of
Total Investments | |
Fixed Income Securities | | | 45.9 | % | |
Common Stocks | | | 35.6 | | |
Short-Term Investments | | | 18.5 | | |
Total Investments | | | 100.0 | %* | |
* Does not include open futures contracts with a value of approximately $20,058,000 and net unrealized appreciation of approximately $58,000. Does not include open foreign currency forward exchange contracts with net unrealized depreciation of approximately $44,000. Also does not include open swap agreements with net unrealized appreciation of approximately $280,000.
The accompanying notes are an integral part of the consolidated financial statements.
29
Morgan Stanley Variable Insurance Fund, Inc.
June 30, 2024 (unaudited)
Global Strategist Portfolio
Consolidated Statement of Assets and Liabilities | | June 30, 2024
(000) | |
Assets: | |
Investments in Securities of Unaffiliated Issuers, at Value (Cost $64,605) | | $ | 69,580 | | |
Investment in Security of Affiliated Issuer, at Value (Cost $13,759) | | | 13,759 | | |
Total Investments in Securities, at Value (Cost $78,364) | | | 83,339 | | |
Foreign Currency, at Value (Cost $425) | | | 450 | | |
Receivable for Variation Margin on Futures Contracts | | | 579 | | |
Unrealized Appreciation on Swap Agreements | | | 493 | | |
Due from Broker | | | 440 | | |
Interest Receivable | | | 334 | | |
Unrealized Appreciation on Foreign Currency Forward Exchange Contracts | | | 114 | | |
Receivable for Investments Sold | | | 93 | | |
Receivable from Affiliate | | | 61 | | |
Tax Reclaim Receivable | | | 46 | | |
Due from Adviser | | | 45 | | |
Dividends Receivable | | | 23 | | |
Other Assets | | | 13 | | |
Total Assets | | | 86,030 | | |
Liabilities: | |
Payable for Investments Purchased | | | 1,469 | | |
Due to Broker | | | 260 | | |
Unrealized Depreciation on Swap Agreements | | | 217 | | |
Unrealized Depreciation on Foreign Currency Forward Exchange Contracts | | | 158 | | |
Payable for Fund Shares Redeemed | | | 83 | | |
Payable for Professional Fees | | | 56 | | |
Payable for Custodian Fees | | | 50 | | |
Payable for Variation Margin on Swap Agreements | | | 44 | | |
Payable for Servicing Fees | | | 26 | | |
Payable for Administration Fees | | | 5 | | |
Payable to Bank | | | 2 | | |
Payable for Transfer Agency Fees | | | 2 | | |
Payable for Distribution Fees — Class II Shares | | | 1 | | |
Other Liabilities | | | 120 | | |
Total Liabilities | | | 2,493 | | |
NET ASSETS | | $ | 83,537 | | |
Net Assets Consist of: | |
Paid-in-Capital | | $ | 79,560 | | |
Total Distributable Earnings | | | 3,977 | | |
Net Assets | | $ | 83,537 | | |
CLASS I: | |
Net Assets | | $ | 69,629 | | |
Net Asset Value, Offering and Redemption Price Per Share Applicable to 7,788,209 Outstanding
$0.001 Par Value Shares (Authorized 500,000,000 Shares) | | $ | 8.94 | | |
CLASS II: | |
Net Assets | | $ | 13,908 | | |
Net Asset Value, Offering and Redemption Price Per Share Applicable to 1,570,175 Outstanding
$0.001 Par Value Shares (Authorized 500,000,000 Shares) | | $ | 8.86 | | |
The accompanying notes are an integral part of the consolidated financial statements.
30
Morgan Stanley Variable Insurance Fund, Inc.
June 30, 2024 (unaudited)
Global Strategist Portfolio
Consolidated Statement of Operations | | Six Months Ended
June 30, 2024
(000) | |
Investment Income: | |
Interest from Securities of Unaffiliated Issuers (Net of $7 of Foreign Taxes Withheld) | | $ | 698 | | |
Dividends from Securities of Unaffiliated Issuers (Net of $38 of Foreign Taxes Withheld) | | | 403 | | |
Dividends from Security of Affiliated Issuer (Note H) | | | 314 | | |
Total Investment Income | | | 1,415 | | |
Expenses: | |
Advisory Fees (Note B) | | | 305 | | |
Custodian Fees (Note G) | | | 138 | | |
Professional Fees | | | 106 | | |
Servicing Fees (Note D) | | | 63 | | |
Pricing Fees | | | 58 | | |
Administration Fees (Note C) | | | 33 | | |
Distribution Fees — Class II Shares (Note E) | | | 17 | | |
Shareholder Reporting Fees | | | 12 | | |
Transfer Agency Fees (Note F) | | | 7 | | |
Directors' Fees and Expenses | | | 1 | | |
Other Expenses | | | 6 | | |
Total Expenses | | | 746 | | |
Waiver of Advisory Fees (Note B) | | | (305 | ) | |
Expenses Reimbursed by Adviser (Note B) | | | (57 | ) | |
Waiver of Distribution Fees — Class II Shares (Note E) | | | (10 | ) | |
Rebate from Morgan Stanley Affiliate (Note H) | | | (9 | ) | |
Net Expenses | | | 365 | | |
Net Investment Income | | | 1,050 | | |
Realized Gain (Loss): | |
Investments Sold | | | 1,267 | | |
Foreign Currency Forward Exchange Contracts | | | (164 | ) | |
Foreign Currency Translation | | | (11 | ) | |
Futures Contracts | | | (332 | ) | |
Swap Agreements | | | 1,899 | | |
Net Realized Gain | | | 2,659 | | |
Change in Unrealized Appreciation (Depreciation): | |
Investments (Net of Decrease in Deferred Capital Gain Country Tax of $—@) | | | 323 | | |
Foreign Currency Forward Exchange Contracts | | | (78 | ) | |
Foreign Currency Translation | | | 113 | | |
Futures Contracts | | | 92 | | |
Swap Agreements | | | (705 | ) | |
Net Change in Unrealized Appreciation (Depreciation) | | | (255 | ) | |
Net Realized Gain and Change in Unrealized Appreciation (Depreciation) | | | 2,404 | | |
Net Increase in Net Assets Resulting from Operations | | $ | 3,454 | | |
@ Amount is less than $500.
The accompanying notes are an integral part of the consolidated financial statements.
31
Morgan Stanley Variable Insurance Fund, Inc.
June 30, 2024
Global Strategist Portfolio
Consolidated Statements of Changes in Net Assets | | Six Months Ended
June 30, 2024
(unaudited)
(000) | | Year Ended
December 31, 2023
(000) | |
Increase (Decrease) in Net Assets: | |
Operations: | |
Net Investment Income | | $ | 1,050 | | | $ | 1,651 | | |
Net Realized Gain (Loss) | | | 2,659 | | | | (172 | ) | |
Net Change in Unrealized Appreciation (Depreciation) | | | (255 | ) | | | 9,102 | | |
Net Increase in Net Assets Resulting from Operations | | | 3,454 | | | | 10,581 | | |
Dividends and Distributions to Shareholders: | |
Class I | | | — | | | | (1,125 | ) | |
Class II | | | — | | | | (214 | ) | |
Total Dividends and Distributions to Shareholders | | | — | | | | (1,339 | ) | |
Capital Share Transactions:(1) | |
Class I: | |
Subscribed | | | 1,924 | | | | 2,265 | | |
Distributions Reinvested | | | — | | | | 1,125 | | |
Redeemed | | | (3,723 | ) | | | (8,572 | ) | |
Class II: | |
Subscribed | | | 625 | | | | 951 | | |
Distributions Reinvested | | | — | | | | 214 | | |
Redeemed | | | (1,110 | ) | | | (2,478 | ) | |
Net Decrease in Net Assets Resulting from Capital Share Transactions | | | (2,284 | ) | | | (6,495 | ) | |
Total Increase in Net Assets | | | 1,170 | | | | 2,747 | | |
Net Assets: | |
Beginning of Period | | | 82,367 | | | | 79,620 | | |
End of Period | | $ | 83,537 | | | $ | 82,367 | | |
(1) Capital Share Transactions: | |
Class I: | |
Shares Subscribed | | | 216 | | | | 280 | | |
Shares Issued on Distributions Reinvested | | | — | | | | 141 | | |
Shares Redeemed | | | (428 | ) | | | (1,067 | ) | |
Net Decrease in Class I Shares Outstanding | | | (212 | ) | | | (646 | ) | |
Class II: | |
Shares Subscribed | | | 73 | | | | 120 | | |
Shares Issued on Distributions Reinvested | | | — | | | | 27 | | |
Shares Redeemed | | | (129 | ) | | | (310 | ) | |
Net Decrease in Class II Shares Outstanding | | | (56 | ) | | | (163 | ) | |
The accompanying notes are an integral part of the consolidated financial statements.
32
Morgan Stanley Variable Insurance Fund, Inc.
June 30, 2024
Consolidated Financial Highlights
Global Strategist Portfolio
| | | Class I | |
| | | Six Months Ended
June 30, 2024 | | Year Ended December 31, | |
Selected Per Share Data and Ratios | | (unaudited) | | 2023 | | 2022 | | 2021 | | 2020 | | 2019 | |
Net Asset Value, Beginning of Period | | $ | 8.57 | | | $ | 7.64 | | | $ | 11.30 | | | $ | 10.99 | | | $ | 10.91 | | | $ | 9.85 | | |
Income (Loss) from Investment Operations: | |
Net Investment Income(1) | | | 0.11 | | | | 0.17 | | | | 0.14 | | | | 0.10 | | | | 0.09 | | | | 0.16 | | |
Net Realized and Unrealized Gain (Loss) | | | 0.26 | | | | 0.89 | | | | (2.07 | ) | | | 0.81 | | | | 0.95 | | | | 1.56 | | |
Total from Investment Operations | | | 0.37 | | | | 1.06 | | | | (1.93 | ) | | | 0.91 | | | | 1.04 | | | | 1.72 | | |
Distributions from and/or in Excess of: | |
Net Investment Income | | | — | | | | (0.13 | ) | | | — | | | | (0.21 | ) | | | (0.16 | ) | | | (0.20 | ) | |
Net Realized Gain | | | — | | | | — | | | | (1.73 | ) | | | (0.39 | ) | | | (0.80 | ) | | | (0.46 | ) | |
Total Distributions | | | — | | | | (0.13 | ) | | | (1.73 | ) | | | (0.60 | ) | | | (0.96 | ) | | | (0.66 | ) | |
Net Asset Value, End of Period | | $ | 8.94 | | | $ | 8.57 | | | $ | 7.64 | | | $ | 11.30 | | | $ | 10.99 | | | $ | 10.91 | | |
Total Return(2) | | | 4.32 | %(3) | | | 14.07 | %(4) | | | (16.94 | )% | | | 8.37 | % | | | 10.92 | % | | | 17.77 | % | |
Ratios to Average Net Assets and Supplemental Data: | |
Net Assets, End of Period (Thousands) | | $ | 69,629 | | | $ | 68,557 | | | $ | 66,072 | | | $ | 88,704 | | | $ | 88,563 | | | $ | 89,575 | | |
Ratio of Expenses Before Expense Limitation | | | 1.79 | %(5) | | | 1.69 | % | | | 1.77 | % | | | 1.52 | % | | | 1.59 | % | | | 1.49 | % | |
Ratio of Expenses After Expense Limitation | | | 0.88 | %(5)(6) | | | 0.87 | %(6)(7) | | | 0.88 | %(6) | | | 0.90 | %(6) | | | 0.88 | %(6) | | | 0.88 | %(6) | |
Ratio of Net Investment Income | | | 2.60 | %(5)(6) | | | 2.06 | %(6)(7) | | | 1.59 | %(6) | | | 0.89 | %(6) | | | 0.89 | %(6) | | | 1.55 | %(6) | |
Ratio of Rebate from Morgan Stanley Affiliates | | | 0.02 | %(5) | | | 0.02 | % | | | 0.02 | % | | | 0.00 | %(8) | | | 0.02 | % | | | 0.02 | % | |
Portfolio Turnover Rate | | | 49 | %(3) | | | 102 | % | | | 99 | % | | | 111 | % | | | 114 | % | | | 124 | % | |
(1) Per share amount is based on average shares outstanding.
(2) Calculated based on the net asset value as of the last business day of the period. Performance does not reflect fees and expenses imposed by your insurance company's separate account. If performance information included the effect of these additional charges, the total return would be lower.
(3) Not annualized.
(4) Reflects prior period transfer agency fees that were reimbursed in 2023. The amount of the reimbursement was immaterial on a per share basis and the impact was less than 0.005% to the total return of Class I shares.
(5) Annualized.
(6) The Ratio of Expenses After Expense Limitation and Ratio of Net Investment Income reflect the rebate of certain Fund expenses in connection with the investments in Morgan Stanley affiliates during the period. The effect of the rebate on the ratios is disclosed in the above table as "Ratio of Rebate from Morgan Stanley Affiliates."
(7) If the Fund had not received the reimbursement of transfer agency fees from the Adviser, the Ratio of Expenses After Expense Limitation and Ratio of Net Investment Income, would have been as follows for Class I shares:
Period Ended | | Expense
Ratio | | Net Investment
Income Ratio | |
December 31, 2023 | | | 0.88 | % | | | 2.05 | % | |
(8) Amount is less than 0.005%.
The accompanying notes are an integral part of the consolidated financial statements.
33
Morgan Stanley Variable Insurance Fund, Inc.
June 30, 2024
Consolidated Financial Highlights
Global Strategist Portfolio
| | | Class II | |
| | | Six Months Ended
June 30, 2024 | | Year Ended December 31, | |
Selected Per Share Data and Ratios | | (unaudited) | | 2023 | | 2022 | | 2021 | | 2020 | | 2019 | |
Net Asset Value, Beginning of Period | | $ | 8.49 | | | $ | 7.58 | | | $ | 11.23 | | | $ | 10.93 | | | $ | 10.85 | | | $ | 9.79 | | |
Income (Loss) from Investment Operations: | |
Net Investment Income(1) | | | 0.11 | | | | 0.16 | | | | 0.13 | | | | 0.09 | | | | 0.08 | | | | 0.15 | | |
Net Realized and Unrealized Gain (Loss) | | | 0.26 | | | | 0.88 | | | | (2.05 | ) | | | 0.80 | | | | 0.94 | | | | 1.56 | | |
Total from Investment Operations | | | 0.37 | | | | 1.04 | | | | (1.92 | ) | | | 0.89 | | | | 1.02 | | | | 1.71 | | |
Distributions from and/or in Excess of: | |
Net Investment Income | | | — | | | | (0.13 | ) | | | — | | | | (0.20 | ) | | | (0.14 | ) | | | (0.19 | ) | |
Net Realized Gain | | | — | | | | — | | | | (1.73 | ) | | | (0.39 | ) | | | (0.80 | ) | | | (0.46 | ) | |
Total Distributions | | | — | | | | (0.13 | ) | | | (1.73 | ) | | | (0.59 | ) | | | (0.94 | ) | | | (0.65 | ) | |
Net Asset Value, End of Period | | $ | 8.86 | | | $ | 8.49 | | | $ | 7.58 | | | $ | 11.23 | | | $ | 10.93 | | | $ | 10.85 | | |
Total Return(2) | | | 4.36 | %(3) | | | 13.94 | %(4) | | | (17.07 | )% | | | 8.22 | % | | | 10.85 | % | | | 17.74 | % | |
Ratios to Average Net Assets and Supplemental Data: | |
Net Assets, End of Period (Thousands) | | $ | 13,908 | | | $ | 13,810 | | | $ | 13,548 | | | $ | 16,785 | | | $ | 16,204 | | | $ | 16,589 | | |
Ratio of Expenses Before Expense Limitation | | | 2.04 | %(5) | | | 1.94 | % | | | 2.02 | % | | | 1.77 | % | | | 1.84 | % | | | 1.74 | % | |
Ratio of Expenses After Expense Limitation | | | 0.98 | %(5)(6) | | | 0.97 | %(6)(7) | | | 0.98 | %(6) | | | 1.00 | %(6) | | | 0.98 | %(6) | | | 0.98 | %(6) | |
Ratio of Net Investment Income | | | 2.50 | %(5)(6) | | | 1.96 | %(6)(7) | | | 1.49 | %(6) | | | 0.79 | %(6) | | | 0.79 | %(6) | | | 1.45 | %(6) | |
Ratio of Rebate from Morgan Stanley Affiliates | | | 0.02 | %(5) | | | 0.02 | % | | | 0.02 | % | | | 0.00 | %(8) | | | 0.02 | % | | | 0.02 | % | |
Portfolio Turnover Rate | | | 49 | %(3) | | | 102 | % | | | 99 | % | | | 111 | % | | | 114 | % | | | 124 | % | |
(1) Per share amount is based on average shares outstanding.
(2) Calculated based on the net asset value as of the last business day of the period. Performance does not reflect fees and expenses imposed by your insurance company's separate account. If performance information included the effect of these additional charges, the total return would be lower.
(3) Not annualized.
(4) Reflects prior period transfer agency fees that were reimbursed in 2023. The amount of the reimbursement was immaterial on a per share basis and the impact was less than 0.005% to the total return of Class II shares.
(5) Annualized.
(6) The Ratio of Expenses After Expense Limitation and Ratio of Net Investment Income reflect the rebate of certain Fund expenses in connection with the investments in Morgan Stanley affiliates during the period. The effect of the rebate on the ratios is disclosed in the above table as "Ratio of Rebate from Morgan Stanley Affiliates."
(7) If the Fund had not received the reimbursement of transfer agency fees from the Adviser, the Ratio of Expenses After Expense Limitation and Ratio of Net Investment Income, would have been as follows for Class II shares:
Period Ended | | Expense
Ratio | | Net Investment
Income Ratio | |
December 31, 2023 | | | 0.98 | % | | | 1.95 | % | |
(8) Amount is less than 0.005%.
The accompanying notes are an integral part of the consolidated financial statements.
34
Morgan Stanley Variable Insurance Fund, Inc.
June 30, 2024 (unaudited)
Notes to Consolidated Financial Statements
Morgan Stanley Variable Insurance Fund, Inc. (the "Company") is registered under the Investment Company Act of 1940, as amended (the "Act"), as an open-end management investment company. The Company is comprised of eight separate active, diversified and non-diversified funds (individually referred to as a "Fund," collectively as the "Funds").
The Company applies investment company accounting and reporting guidance Accounting Standards Codification ("ASC") Topic 946. In the preparation of these financial statements, management has evaluated subsequent events occurring after the date of the Fund's Consolidated Statement of Assets and Liabilities through the date that the financial statements were issued.
The accompanying consolidated financial statements relates to the Global Strategist Portfolio. The Fund seeks total return and has issued two classes of shares — Class I and Class II. Both classes of shares have identical voting rights (except that shareholders of a Class have exclusive voting rights regarding any matter relating solely to that Class of shares), dividend, liquidation and other rights.
The Company is intended to be a funding vehicle for variable annuity contracts and variable life insurance policies offered by the separate accounts of certain life insurance companies.
A. Significant Accounting Policies: The following significant accounting policies are in conformity with U.S. generally accepted accounting principles ("GAAP"). Such policies are consistently followed by the Company in the preparation of its consolidated financial statements. GAAP may require management to make estimates and assumptions that affect the reported amounts and disclosures in the consolidated financial statements. Actual results may differ from those estimates.
The Fund may invest up to 25% of its total assets in a wholly-owned subsidiary of the Fund organized as a company under the laws of the Cayman Islands, VIF Global Strategist Cayman Portfolio, Ltd. (the "Subsidiary"). The Subsidiary may invest, directly or indirectly through the use of derivatives, in securities, commodities, commodity-related instruments and other investments, primarily futures, swaps and notes. The Fund is the sole shareholder of the Subsidiary, and it is not currently expected that shares of the Subsidiary will be sold or offered to other investors. The consolidated portfolio of investments and consolidated financial statements include the positions and accounts of the Fund and the Subsidiary. All intercompany accounts and transactions of the Fund and the Subsidiary have been eliminated in consolidation and all accounting policies of the Subsidiary are consistent with those of the Fund. As of June 30, 2024, the Subsidiary represented
approximately $9,274,000 or approximately 11.10% of the net assets of the Fund.
Investments in the Subsidiary are expected to provide the Fund with exposure to the commodity markets within the limitations of Subchapter M of the Code and recent Internal Revenue Service ("IRS") revenue rulings, which require that a mutual fund receive no more than ten percent of its gross income from such investments in order to receive favorable tax treatment as a regulated investment company ("RIC"). Tax treatment of the income received from the Subsidiary may potentially be affected by changes in legislation, regulations or other legally binding authority, which could affect the character, timing and amount of the Fund's taxable income and distributions. If such changes occur, the Fund may need to significantly change its investment strategy and recognize unrealized gains in order to remain qualified for taxation as a RIC, which could adversely affect the Fund.
1. Security Valuation: (1) An equity portfolio security listed or traded on an exchange is valued at its latest reported sales price (or at the exchange official closing price if such exchange reports an official closing price), and if there were no sales on a given day and if there is no official exchange closing price for that day, the security is valued at the mean between the last reported bid and asked prices if such bid and asked prices are available on the relevant exchanges. If only bid prices are available then the latest bid price may be used. Listed equity securities not traded on the valuation date with no reported bid and asked prices available on the exchange are valued at the mean between the current bid and asked prices obtained from one or more reputable brokers/dealers. In cases where a security is traded on more than one exchange, the security is valued on the exchange designated as the primary market; (2) all other equity portfolio securities for which over-the-counter ("OTC") market quotations are readily available are valued at the latest reported sales price (or at the market official closing price if such market reports an official closing price), and if there was no trading in the security on a given day and if there is no official closing price from relevant markets for that day, the security is valued at the mean between the last reported bid and asked prices if such bid and asked prices are available on the relevant markets. An unlisted equity security that does not trade on the valuation date and for which bid and asked prices from the relevant markets are unavailable is valued at the mean between the current bid and asked prices obtained from one or more reputable brokers/dealers; (3) fixed income securities may be valued by an outside pricing service/vendor approved by the
35
Morgan Stanley Variable Insurance Fund, Inc.
June 30, 2024 (unaudited)
Notes to Consolidated Financial Statements (cont'd)
Company's Board of Directors (the "Directors"). The pricing service/vendor may employ a pricing model that takes into account, among other things, bids, yield spreads and/or other market data and specific security characteristics. If Morgan Stanley Investment Management Inc. (the "Adviser") or Morgan Stanley Investment Management Limited ("MSIM Limited") (the "Sub-Adviser"), each a wholly-owned subsidiary of Morgan Stanley, determines that the price provided by the outside pricing service/vendor does not reflect the security's fair value or is unable to provide a price, prices from reputable brokers/dealers may also be utilized. In these circumstances, the value of the security will be the mean of bid and asked prices obtained from reputable brokers/dealers; (4) futures are valued at the settlement price on the exchange on which they trade or, if a settlement price is unavailable, at the last sale price on the exchange; (5) OTC swaps may be valued by an outside pricing service approved by the Directors or quotes from a reputable broker/dealer. Swaps cleared on a clearinghouse or exchange may be valued using the closing price provided by the clearinghouse or exchange. Total return swaps may also be fair valued using direct accrual/return calculations if prices on the reference asset on the total return leg of the swap are available from a pricing service/vendor for such instrument. In the event that the reference asset on the total return leg of the swap is a benchmark index, then price of such reference asset may be obtained from a pricing service provider or from the benchmark index sponsor; (6) when market quotations are not readily available, as defined by Rule 2a-5 under the Act, including circumstances under which the Adviser or the Sub-Adviser determines that the closing price, last sale price or the mean between the last reported bid and asked prices are not reflective of a security's market value, portfolio securities are valued at their fair value as determined in good faith under procedures approved by and under the general supervision of the Directors. Each business day, the Fund uses a third-party pricing service approved by the Directors to assist with the valuation of foreign equity securities. Events occurring after the close of trading on foreign exchanges may result in adjustments to the valuation of foreign securities to reflect market trading that occurs after the close of the applicable foreign markets of comparable securities or other instruments that have a strong correlation to the fair-valued securities to more accurately reflect their fair value as of the close of regular trading on the NYSE; (7) foreign exchange transactions ("spot contracts") and foreign exchange forward contracts ("forward contracts") are valued
daily using an independent pricing vendor at the spot and forward rates, respectively, as of the close of the NYSE; and (8) investments in mutual funds, including the Morgan Stanley Institutional Liquidity Funds, are valued at the net asset value ("NAV") as of the close of each business day.
In connection with Rule 2a-5 of the Act, the Directors have designated the Company's Adviser as its valuation designee. The valuation designee has responsibility for determining fair value and to make the actual calculations pursuant to the fair valuation methodologies previously approved by the Directors. Under procedures approved by the Directors, the Company's Adviser, as valuation designee, has formed a Valuation Committee whose members are approved by the Directors. The Valuation Committee provides administration and oversight of the Company's valuation policies and procedures, which are reviewed at least annually by the Directors. These procedures allow the Company to utilize independent pricing services, quotations from securities and financial instrument dealers and other market sources to determine fair value.
2. Fair Value Measurement: Financial Accounting Standards Board ("FASB") ASC 820, "Fair Value Measurement" ("ASC 820"), defines fair value as the price that would be received to sell an asset or pay to transfer a liability in an orderly transaction between market participants at the measurement date. ASC 820 establishes a three-tier hierarchy to distinguish between (1) inputs that reflect the assumptions market participants would use in valuing an asset or liability developed based on market data obtained from sources independent of the reporting entity (observable inputs); and (2) inputs that reflect the reporting entity's own assumptions about the assumptions market participants would use in valuing an asset or liability developed based on the best information available in the circumstances (unobservable inputs) and to establish classification of fair value measurements for disclosure purposes. Various inputs are used in determining the value of the Fund's investments. The inputs are summarized in the three broad levels listed below:
• Level 1 – unadjusted quoted prices in active markets for identical investments
• Level 2 – other significant observable inputs (including quoted prices for similar investments, interest rates, prepayment speeds, credit risk, etc.)
• Level 3 – significant unobservable inputs including the Fund's own assumptions in determining the fair
36
Morgan Stanley Variable Insurance Fund, Inc.
June 30, 2024 (unaudited)
Notes to Consolidated Financial Statements (cont'd)
value of investments. Factors considered in making this determination may include, but are not limited to, information obtained by contacting the issuer, analysts, or the appropriate stock exchange (for exchange-traded securities), analysis of the issuer's financial statements or other available documents and, if necessary, available information concerning other securities in similar circumstances.
The inputs or methodology used for valuing securities are not necessarily an indication of the risk associated with investing in those securities and the determination of the significance of a particular input to the fair value measurement in its entirety requires judgment and considers factors specific to each security.
The following is a summary of the inputs used to value the Fund's investments as of June 30, 2024:
Investment Type | | Level 1
Unadjusted
quoted
prices
(000) | | Level 2
Other
significant
observable
inputs
(000) | | Level 3
Significant
unobservable
inputs
(000) | | Total
(000) | |
Assets: | |
Fixed Income Securities | |
Agency Fixed Rate
Mortgages | | $ | — | | | $ | 3,276 | | | $ | — | | | $ | 3,276 | | |
Asset-Backed Securities | | | — | | | | 301 | | | | — | | | | 301 | | |
Commercial Mortgage -
Backed Securities | | | — | | | | 492 | | | | — | | | | 492 | | |
Corporate Bonds | | | — | | | | 8,649 | | | | — | | | | 8,649 | | |
Mortgages - Other | | | — | | | | 1,090 | | | | — | | | | 1,090 | | |
Sovereign | | | — | | | | 18,933 | | | | — | | | | 18,933 | | |
Supranational | | | — | | | | 513 | | | | — | | | | 513 | | |
U.S. Treasury Securities | | | — | | | | 5,013 | | | | — | | | | 5,013 | | |
Total Fixed Income
Securities | | | — | | | | 38,267 | | | | — | | | | 38,267 | | |
Common Stocks | |
Aerospace & Defense | | | 337 | | | | 230 | | | | — | | | | 567 | | |
Air Freight & Logistics | | | 76 | | | | 47 | | | | — | | | | 123 | | |
Automobile Components | | | 15 | | | | 21 | | | | — | | | | 36 | | |
Automobiles | | | 263 | | | | 160 | | | | — | | | | 423 | | |
Banks | | | 879 | | | | 2,360 | | | | — | | | | 3,239 | | |
Beverages | | | 252 | | | | 149 | | | | — | | | | 401 | | |
Biotechnology | | | 367 | | | | 89 | | | | — | | | | 456 | | |
Broadline Retail | | | 768 | | | | 72 | | | | — | | | | 840 | | |
Building Products | | | 108 | | | | 73 | | | | — | | | | 181 | | |
Capital Markets | | | 566 | | | | 273 | | | | — | | | | 839 | | |
Chemicals | | | 275 | | | | 255 | | | | — | | | | 530 | | |
Commercial Services &
Supplies | | | 147 | | | | 28 | | | | — | | | | 175 | | |
Communications
Equipment | | | 146 | | | | 26 | | | | — | | | | 172 | | |
Construction &
Engineering | | | 46 | | | | 57 | | | | — | | | | 103 | | |
Construction Materials | | | 46 | | | | 50 | | | | — | | | | 96 | | |
Consumer Finance | | | 95 | | | | — | | | | — | | | | 95 | | |
Investment Type | | Level 1
Unadjusted
quoted
prices
(000) | | Level 2
Other
significant
observable
inputs
(000) | | Level 3
Significant
unobservable
inputs
(000) | | Total
(000) | |
Common Stocks (cont'd) | |
Consumer Staples
Distribution & Retail | | $ | 401 | | | $ | 82 | | | $ | — | | | $ | 483 | | |
Containers & Packaging | | | 44 | | | | 13 | | | | — | | | | 57 | | |
Distributors | | | 16 | | | | 3 | | | | — | | | | 19 | | |
Diversified Consumer
Services | | | — | | | | 5 | | | | — | | | | 5 | | |
Diversified REITs | | | 5 | | | | 40 | | | | — | | | | 45 | | |
Diversified
Telecommunication
Services | | | 129 | | | | 148 | | | | — | | | | 277 | | |
Electric Utilities | | | 284 | | | | 146 | | | | — | | | | 430 | | |
Electrical Equipment | | | 138 | | | | 198 | | | | — | | | | 336 | | |
Electronic Equipment,
Instruments &
Components | | | 106 | | | | 25 | | | | — | | | | 131 | | |
Energy Equipment &
Services | | | 50 | | | | 5 | | | | — | † | | | 55 | † | |
Entertainment | | | 255 | | | | 24 | | | | — | | | | 279 | | |
Financial Services | | | 648 | | | | 107 | | | | — | | | | 755 | | |
Food Products | | | 131 | | | | 261 | | | | — | | | | 392 | | |
Gas Utilities | | | 12 | | | | 13 | | | | — | | | | 25 | | |
Ground Transportation | | | 280 | | | | 4 | | | | — | | | | 284 | | |
Health Care
Equipment & Supplies | | | 428 | | | | 161 | | | | — | | | | 589 | | |
Health Care Providers &
Services | | | 438 | | | | 25 | | | | — | | | | 463 | | |
Health Care REITs | | | 36 | | | | — | | | | — | | | | 36 | | |
Health Care Technology | | | 11 | | | | 3 | | | | — | | | | 14 | | |
Hotel & Resort REITs | | | 5 | | | | — | | | | — | | | | 5 | | |
Hotels, Restaurants &
Leisure | | | 370 | | | | 155 | | | | — | | | | 525 | | |
Household Durables | | | 57 | | | | 18 | | | | — | | | | 75 | | |
Household Products | | | 216 | | | | 53 | | | | — | | | | 269 | | |
Independent Power &
Renewable Electricity
Producers | | | 23 | | | | 22 | | | | — | | | | 45 | | |
Industrial Conglomerates | | | 76 | | | | 123 | | | | — | | | | 199 | | |
Industrial REITs | | | 40 | | | | 17 | | | | — | | | | 57 | | |
Information Technology
Services | | | 301 | | | | 23 | | | | — | | | | 324 | | |
Insurance | | | 484 | | | | 447 | | | | — | | | | 931 | | |
Interactive Media &
Services | | | 1,226 | | | | 22 | | | | — | | | | 1,248 | | |
Investment Company | | | — | | | | — | | | | — | † | | | — | † | |
Leisure Products | | | 2 | | | | — | | | | — | | | | 2 | | |
Life Sciences Tools &
Services | | | 238 | | | | 48 | | | | — | | | | 286 | | |
Machinery | | | 300 | | | | 224 | | | | — | | | | 524 | | |
Marine Transportation | | | — | | | | 18 | | | | — | | | | 18 | | |
Media | | | 110 | | | | 37 | | | | — | | | | 147 | | |
Metals & Mining | | | 194 | | | | 292 | | | | — | † | | | 486 | † | |
Mortgage Real Estate
Investment | | | 4 | | | | — | | | | — | | | | 4 | | |
Multi-Utilities | | | 108 | | | | 95 | | | | — | | | | 203 | | |
37
Morgan Stanley Variable Insurance Fund, Inc.
June 30, 2024 (unaudited)
Notes to Consolidated Financial Statements (cont'd)
Investment Type | | Level 1
Unadjusted
quoted
prices
(000) | | Level 2
Other
significant
observable
inputs
(000) | | Level 3
Significant
unobservable
inputs
(000) | | Total
(000) | |
Common Stocks (cont'd) | |
Office REITs | | $ | 11 | | | $ | 6 | | | $ | — | | | $ | 17 | | |
Oil, Gas & Consumable
Fuels | | | 882 | | | | 425 | | | | — | | | | 1,307 | | |
Paper & Forest Products | | | 3 | | | | 32 | | | | — | | | | 35 | | |
Passenger Airlines | | | 7 | | | | 8 | | | | — | | | | 15 | | |
Personal Care Products | | | 23 | | | | 192 | | | | — | | | | 215 | | |
Pharmaceuticals | | | 694 | | | | 964 | | | | — | | | | 1,658 | | |
Professional Services | | | 148 | | | | 154 | | | | — | | | | 302 | | |
Real Estate
Management &
Development | | | 30 | | | | 48 | | | | — | | | | 78 | | |
Residential REITs | | | 67 | | | | — | | | | — | | | | 67 | | |
Retail REITs | | | 47 | | | | 27 | | | | — | | | | 74 | | |
Semiconductors &
Semiconductor
Equipment | | | 2,259 | | | | 361 | | | | — | | | | 2,620 | | |
Software | | | 2,139 | | | | 200 | | | | — | | | | 2,339 | | |
Specialized REITs | | | 172 | | | | — | | | | — | | | | 172 | | |
Specialty Retail | | | 344 | | | | 42 | | | | — | | | | 386 | | |
Tech Hardware,
Storage & Peripherals | | | 1,289 | | | | 10 | | | | — | | | | 1,299 | | |
Textiles, Apparel &
Luxury Goods | | | 63 | | | | 312 | | | | — | | | | 375 | | |
Tobacco | | | 91 | | | | 56 | | | | — | | | | 147 | | |
Trading Companies &
Distributors | | | 85 | | | | 53 | | | | — | | | | 138 | | |
Transportation
Infrastructure | | | — | | | | 30 | | | | — | | | | 30 | | |
Water Utilities | | | 14 | | | | 12 | | | | — | | | | 26 | | |
Wireless
Telecommunication
Services | | | 45 | | | | 18 | | | | — | | | | 63 | | |
Total Common Stocks | | | 19,965 | | | | 9,697 | | | | — | † | | | 29,662 | † | |
Rights | | | — | † | | | — | @ | | | — | | | | — | @† | |
Warrants | | | — | | | | — | † | | | — | | | | — | † | |
Short-Term Investments | |
Investment Company | | | 13,759 | | | | — | | | | — | | | | 13,759 | | |
U.S. Treasury Securities | | | — | | | | 1,651 | | | | — | | | | 1,651 | | |
Total Short-Term
Investments | | | 13,759 | | | | 1,651 | | | | — | | | | 15,410 | | |
Foreign Currency
Forward Exchange
Contracts | | | — | | | | 114 | | | | — | | | | 114 | | |
Futures Contracts | | | 108 | | | | — | | | | — | | | | 108 | | |
Centrally Cleared
Interest Rate Swap
Agreements | | | — | | | | 22 | | | | — | | | | 22 | | |
Total Return Swap
Agreements | | | — | | | | 493 | | | | — | | | | 493 | | |
Total Assets | | | 33,832 | † | | | 50,244 | † | | | — | † | | | 84,076 | † | |
Investment Type | | Level 1
Unadjusted
quoted
prices
(000) | | Level 2
Other
significant
observable
inputs
(000) | | Level 3
Significant
unobservable
inputs
(000) | | Total
(000) | |
Liabilities: | |
Foreign Currency
Forward Exchange
Contracts | | $ | — | | | $ | (158 | ) | | $ | — | | | $ | (158 | ) | |
Futures Contracts | | | (50 | ) | | | — | | | | — | | | | (50 | ) | |
Centrally Cleared
Interest Rate Swap
Agreements | | | — | | | | (18 | ) | | | — | | | | (18 | ) | |
Total Return Swap
Agreements | | | — | | | | (217 | ) | | | — | | | | (217 | ) | |
Total Liabilities | | | (50 | ) | | | (393 | ) | | | — | | | | (443 | ) | |
Total | | $ | 33,782 | † | | $ | 49,851 | † | | $ | — | † | | $ | 83,633 | † | |
† Includes one or more securities valued at zero.
@ Value is less than $500.
Transfers between investment levels may occur as the markets fluctuate and/or the availability of data used in an investment's valuation changes.
Following is a reconciliation of investments in which significant unobservable inputs (Level 3) were used in determining fair value:
| | | Common
Stock
(000) | |
Beginning Balance | | $ | — | †† | |
Purchases | | | — | | |
Sales | | | — | | |
Transfers in | | | — | | |
Transfers out | | | — | | |
Corporate actions | | | — | | |
Change in unrealized
appreciation (depreciation) | | | — | | |
Realized gains (losses) | | | — | | |
Ending Balance | | $ | — | †† | |
Net change in unrealized appreciation
(depreciation) from investments still
held as of June 30, 2024 | | $ | — | | |
†† Includes one or more securities valued at zero.
3. Foreign Currency Translation and Foreign Investments: The books and records of the Fund are maintained in U.S. dollars. Foreign currency amounts are translated into U.S. dollars as follows:
— investments, other assets and liabilities at the prevailing rate of exchange on the valuation date;
— investment transactions and investment income at the prevailing rates of exchange on the dates of such transactions.
38
Morgan Stanley Variable Insurance Fund, Inc.
June 30, 2024 (unaudited)
Notes to Consolidated Financial Statements (cont'd)
Although the net assets of the Fund are presented at the foreign exchange rates and market values at the close of the period, the Fund does not isolate that portion of the results of operations arising as a result of changes in the foreign exchange rates from the fluctuations arising from changes in the market prices of securities held at period end. Similarly, the Fund does not isolate the effect of changes in foreign exchange rates from the fluctuations arising from changes in the market prices of securities sold during the period. Accordingly, realized and unrealized foreign currency gains (losses) on investments in securities are included in the reported net realized and unrealized gains (losses) on investment transactions and balances. However, pursuant to U.S. federal income tax regulations, gains and losses from certain foreign currency transactions and the foreign currency portion of gains and losses realized on sales and maturities of foreign denominated debt securities are treated as ordinary income for U.S. federal income tax purposes.
Net realized gains (losses) on foreign currency transactions represent net foreign exchange gains (losses) from foreign currency forward exchange contracts, disposition of foreign currencies, currency gains (losses) realized between the trade and settlement dates on securities transactions, and the difference between the amount of investment income and foreign withholding taxes recorded on the Fund's books and the U.S. dollar equivalent amounts actually received or paid. The change in unrealized currency gains (losses) on foreign currency transactions for the period is reflected in the Consolidated Statement of Operations.
Foreign security and currency transactions may involve certain considerations and risks not typically associated with those of U.S. dollar denominated transactions as a result of, among other factors, fluctuations of exchange rates in relation to the U.S. dollar, the possibility of lower levels of governmental supervision and regulation of foreign securities markets and the possibility of political or economic instability.
Governmental approval for foreign investments may be required in advance of making an investment under certain circumstances in some countries, and the extent of foreign investments in U.S. companies may be subject to limitation in other countries. Foreign ownership limitations also may be imposed by the charters of individual companies to prevent, among other concerns, violations of foreign investment limitations. As a result, an additional class of shares (identified as "Foreign" in the Consolidated Portfolio of Investments) may be created and offered for investment. The "local" and "foreign shares"
market values may differ. In the absence of trading of the foreign shares in such markets, the Fund values the foreign shares at the closing exchange price of the local shares.
4. Treasury Inflation-Protected Securities: The Fund may invest in Treasury Inflation-Protected Securities ("TIPS"), including structured bonds in which the principal amount is adjusted daily to keep pace with inflation, as measured by the U.S. Consumer Pricing Index for Urban Consumers. The adjustments to principal due to inflation/deflation are reflected as increases/decreases to interest income with a corresponding adjustment to cost. Such adjustments may have a significant impact on the Fund's distributions and may result in a return of capital to shareholders. The repayment of the original bond principal upon maturity is guaranteed by the full faith and credit of the U.S. Government.
5. Derivatives: The Fund may, but is not required to, use derivative instruments for a variety of purposes, including hedging, risk management, portfolio management or to earn income. Derivatives are financial instruments whose value is based, in part, on the value of an underlying asset, interest rate, index or financial instrument. Prevailing interest rates and volatility levels, among other things, also affect the value of derivative instruments. A derivative instrument often has risks similar to its underlying asset and may have additional risks, including imperfect correlation between the value of the derivative and the underlying asset, risks of default by the counterparty to certain transactions, magnification of losses incurred due to changes in the market value of the securities, instruments, indices or interest rates to which the derivative instrument relates, risks that the transactions may not be liquid, risks arising from margin and payment requirements, risks arising from mispricing or valuation complexity and operational and legal risks. The use of derivatives involves risks that are different from, and possibly greater than, the risks associated with other portfolio investments. Derivatives may involve the use of highly specialized instruments that require investment techniques and risk analyses different from those associated with other portfolio investments. All of the Fund's holdings, including derivative instruments, are marked-to-market each day with the change in value reflected in unrealized appreciation (depreciation). Upon disposition, a realized gain or loss is recognized.
Certain derivative transactions may give rise to a form of leverage. Leverage magnifies the potential for gain and the risk of loss. Leverage associated with derivative transactions may cause the Fund to liquidate portfolio positions when it may not be advantageous to do so to
39
Morgan Stanley Variable Insurance Fund, Inc.
June 30, 2024 (unaudited)
Notes to Consolidated Financial Statements (cont'd)
satisfy its obligations or may cause the Fund to be more volatile than if the Fund had not been leveraged. Although the Adviser and/or Sub-Adviser seek to use derivatives to further the Fund's investment objectives, there is no assurance that the use of derivatives will achieve this result.
Following is a description of the derivative instruments and techniques that the Fund used during the period and their associated risks:
Foreign Currency Forward Exchange Contracts: In connection with its investments in foreign securities, the Fund also entered into contracts with banks, brokers/dealers to purchase or sell foreign currencies at a future date. A foreign currency forward exchange contract ("currency contract") is a negotiated agreement between the contracting parties to exchange a specified amount of currency at a specified future time at a specified rate. The rate can be higher or lower than the spot rate between the currencies that are the subject of the contract. Currency contracts may be used to protect against uncertainty in the level of future foreign currency exchange rates or to gain or modify exposure to a particular currency. In addition, the Fund may use cross currency hedging or proxy hedging with respect to currencies in which the Fund has or expects to have portfolio or currency exposure. Cross currency hedges involve the sale of one currency against the positive exposure to a different currency and may be used for hedging purposes or to establish an active exposure to the exchange rate between any two currencies. To the extent hedged by the use of currency contracts, the precise matching of the currency contract amounts and the value of the securities involved will not generally be possible because the future value of such securities in foreign currencies will change as a consequence of market movements in the value of those securities between the date on which the contract is entered into and the date it matures. Furthermore, such transactions may reduce or preclude the opportunity for gain if the value of the currency should move in the direction opposite to the position taken. There is additional risk to the extent that currency contracts create exposure to currencies in which the Fund's securities are not denominated. Unanticipated changes in currency prices may result in poorer overall performance for the Fund than if it had not entered into such contracts. The use of currency contracts involves the risk of loss from the insolvency or bankruptcy of the counterparty to the contract or the failure of the counterparty to make payments or otherwise comply with the terms of the contract. A currency contract is marked-to-market daily and the change in market value is recorded by the Fund as unrealized gain or loss. The Fund records realized gains (losses)
when the currency contract is closed equal to the difference between the value of the currency contract at the time it was opened and the value at the time it was closed.
Futures: A futures contract is a standardized, exchange-traded agreement to buy or sell a specific quantity of an underlying asset, reference rate or index at a specific price at a specific future time. The value of a futures contract tends to increase and decrease in tandem with the value of the underlying instrument. Depending on the terms of the particular contract, futures contracts are settled through either physical delivery of the underlying instrument on the settlement date or by payment of a cash settlement amount on the settlement date. During the period the futures contract is open, payments are received from or made to the broker based upon changes in the value of the contract (the variation margin). A decision as to whether, when and how to use futures contracts involves the exercise of skill and judgment and even a well-conceived futures transaction may be unsuccessful because of market behavior or unexpected events. In addition to the derivatives risks discussed above, the prices of futures contracts can be highly volatile, using futures contracts can lower total return and the potential loss from futures contracts can exceed the Fund's initial investment in such contracts. No assurance can be given that a liquid market will exist for any particular futures contract at any particular time.
Swaps: The Fund may enter into OTC swap contracts or cleared swap transactions. A swap contract is an agreement between two parties pursuant to which the parties exchange payments at specified dates on the basis of a specified notional amount, with the payments calculated by reference to specified securities, indices, reference rates, currencies or other instruments. Typically swap agreements provide that when the period payment dates for both parties are the same, the payments are made on a net basis (i.e., the two payment streams are netted out, with only the net amount paid by one party to the other). The Fund's obligations or rights under a swap contract entered into on a net basis will generally be equal only to the net amount to be paid or received under the agreement, based on the relative values of the positions held by each party. Cleared swap transactions may help reduce counterparty credit risk. In a cleared swap, the Fund's ultimate counterparty is a clearinghouse rather than a swap dealer, bank or other financial institution. OTC swap agreements are not entered into or traded on exchanges and often there is no central clearing or guaranty function for OTC swaps. These OTC swaps are often subject to credit risk or the risk of default or non-performance by the counterparty. Both
40
Morgan Stanley Variable Insurance Fund, Inc.
June 30, 2024 (unaudited)
Notes to Consolidated Financial Statements (cont'd)
OTC and cleared swaps could result in losses if interest rates, foreign currency exchange rates or other factors are not correctly anticipated by the Fund or if the reference index, security or investments do not perform as expected. During the period swap agreements are open, payments are received from or made to the counterparty or clearing-house based on changes in the value of the contract or variation margin, respectively. The Dodd-Frank Wall Street Reform and Consumer Protection Act and related regulatory developments require the clearing and exchange-trading of certain standardized swap transactions. Mandatory exchange-trading and clearing is occurring on a phased-in basis based on the type of market participant and U.S. Commodities Futures Trading Commission ("CFTC") approval of contracts for central clearing and exchange trading.
The Fund may enter into total return swaps in which one party agrees to make periodic payments to another party based on the change in market value of the assets underlying the contract, which may include, but not be limited to, a specified security, basket of securities or securities indices during the specified period, in return for periodic payments based on a fixed or variable interest rate or the total return from other underlying assets. Total return swaps may be used to obtain long or short exposure to a security or market without owning or taking physical custody of such security or investing directly in such market. Total return swaps may effectively add leverage to the Fund's portfolio because, in addition to its total net assets, the Fund would be subject to investment exposure on the notional amount of the swap. Total return swaps are subject to the risk that a counterparty will default on its payment obligations to the Fund thereunder, and conversely, that the Fund will not be able to meet its obligation to the counterparty.
The Fund may enter into interest rate swaps which is an agreement between two parties to exchange their respective commitments to pay or receive interest. Interest rate swaps are generally entered into on a net basis. Interest rate swaps do not involve the delivery of securities, other underlying assets, or principal. Accordingly, the risk of market loss with respect to interest rate swaps is typically limited to the net amount of interest payments that the Fund is contractually obligated to make.
When the Fund has an unrealized loss on a swap agreement, the Fund has instructed the custodian to pledge cash or liquid securities as collateral with a value approximately equal to the amount of the unrealized loss. Collateral pledges are monitored and subsequently adjusted if and when the swap valuations fluctuate. If applicable,
cash collateral is included with "Due from (to) Broker" in the Consolidated Statement of Assets and Liabilities.
Upfront payments paid or received by the Fund will be reflected as an asset or liability, respectively, in the Consolidated Statement of Assets and Liabilities.
FASB ASC 815, "Derivatives and Hedging" ("ASC 815"), is intended to improve financial reporting about derivative instruments by requiring enhanced disclosures to enable investors to better understand how and why the Fund uses derivative instruments, how these derivative instruments are accounted for and their effects on the Fund's financial position and results of operations.
The following tables set forth the fair value of the Fund's derivative contracts by primary risk exposure as of June 30, 2024:
| | | Asset Derivatives
Consolidated
Statement of Assets
and Liabilities
Location | | Primary Risk
Exposure | | Value
(000) | |
Foreign Currency
Forward
Exchange
Contracts | | Unrealized Appreciation
on Foreign Currency
Forward Exchange
Contracts | | Currency Risk | | $ | 114 | | |
Futures Contracts | | Variation Margin on
Futures Contracts | | Commodity
Risk | | | 11 | (a) | |
Futures Contracts | | Variation Margin on
Futures Contracts | | Equity Risk | | | 30 | (a) | |
Futures Contracts | | Variation Margin on
Futures Contracts | | Interest
Rate Risk | | | 67 | (a) | |
Swap Agreements | | Variation Margin on
Swap Agreements | | Interest
Rate Risk | | | 22 | (a) | |
Swap Agreements | | Unrealized Appreciation
on Swap Agreements | | Equity Risk | | | 493 | | |
Total | | | | | | $ | 737 | | |
| | | Liability Derivatives
Consolidated
Statement of Assets
and Liabilities
Location | | Primary Risk
Exposure | | Value
(000) | |
Foreign Currency
Forward
Exchange
Contracts | | Unrealized Depreciation
on Foreign Currency
Forward Exchange
Contracts | | Currency Risk | | $ | (158 | ) | |
Futures Contracts | | Variation Margin on
Futures Contracts | | Equity Risk | | | (19 | )(a) | |
Futures Contracts | | Variation Margin on
Futures Contracts | | Interest
Rate Risk | | | (31 | )(a) | |
Swap Agreements | | Variation Margin on
Swap Agreements | | Interest
Rate Risk | | | (18 | )(a) | |
Swap Agreements | | Unrealized Depreciation
on Swap Agreements | | Equity Risk | | | (217 | ) | |
Total | | | | | | $ | (443 | ) | |
(a) This amount represents the cumulative appreciation (depreciation) as reported in the Consolidated Portfolio of Investments. The Consolidated Statement of Assets and Liabilities only reflects the current day's net variation margin.
41
Morgan Stanley Variable Insurance Fund, Inc.
June 30, 2024 (unaudited)
Notes to Consolidated Financial Statements (cont'd)
The following tables set forth by primary risk exposure the Fund's realized gains (losses) and change in unrealized appreciation (depreciation) by type of derivative contract for the six months ended June 30, 2024 in accordance with ASC 815:
Realized Gain (Loss) | |
Primary Risk Exposure | | Derivative
Type | | Value
(000) | |
Currency Risk
| | Foreign Currency Forward
Exchange Contracts | | | $(164) | | |
Commodity Risk | | Futures Contracts | | | (2 | ) | |
Equity Risk | | Futures Contracts | | | (149 | ) | |
Interest Rate Risk | | Futures Contracts | | | (181 | ) | |
Equity Risk | | Swap Agreements | | | 2,812 | | |
Interest Rate Risk | | Swap Agreements | | | (913 | ) | |
Total | | | | $ | 1,403 | | |
Change in Unrealized Appreciation (Depreciation) | |
Primary Risk Exposure | | Derivative
Type | | Value
(000) | |
Currency Risk | | Foreign Currency Forward
Exchange Contracts | | | $(78) | | |
Commodity Risk | | Futures Contracts | | | 11 | | |
Equity Risk | | Futures Contracts | | | 35 | | |
Interest Rate Risk | | Futures Contracts | | | 46 | | |
Equity Risk | | Swap Agreements | | | (650 | ) | |
Interest Rate Risk | | Swap Agreements | | | (55 | ) | |
Total | | | | $ | (691 | ) | |
At June 30, 2024, the Fund's derivative assets and liabilities are as follows:
Gross Amounts of Assets and Liabilities Presented in the Consolidated Statement of Assets and Liabilities | |
Derivatives(a) | | Assets(b)
(000) | | Liabilities(b)
(000) | |
Foreign Currency Forward Exchange
Contracts | | $ | 114 | | | $ | (158 | ) | |
Swap Agreements | | | 493 | | | | (217 | ) | |
Total | | $ | 607 | | | $ | (375 | ) | |
(a) Excludes exchange-traded derivatives.
(b) Absent an event of default or early termination, OTC derivative assets and liabilities are presented gross and not offset in the Consolidated Statement of Assets and Liabilities.
The Fund typically enters into International Swaps and Derivatives Association, Inc. Master Agreements ("ISDA Master Agreements") or similar master agreements (collectively, "Master Agreements") with its contract counterparties for certain OTC derivatives in order to, among other things, reduce its credit risk to counterparties. ISDA Master Agreements include provisions for general obligations, representations, collateral and events of default or termination. Under an ISDA Master Agreement, the Fund typically may offset with the counterparty certain OTC derivative financial instruments' payables and/or receivables with collateral held and/or posted and create one single net payment (close-out netting) in the
event of default, termination and/or potential deterioration in the credit quality of the counterparty. Various Master Agreements govern the terms of certain transactions with counterparties, including transactions such as swap, forward, repurchase and reverse repurchase agreements. These Master Agreements typically attempt to reduce the counterparty risk associated with such transactions by specifying credit protection mechanisms and providing standardization that improves legal certainty. Cross-termination provisions under Master Agreements typically provide that a default in connection with one transaction between the Fund and a counterparty gives the non-defaulting party the right to terminate any other transactions in place with the defaulting party to create one single net payment due to/due from the defaulting party and may be a feature in certain Master Agreements. In the event the Fund exercises its right to terminate a Master Agreement after a counterparty experiences a termination event as defined in the Master Agreement, the return of collateral with market value in excess of the Fund's net liability may be delayed or denied.
The following tables present derivative financial instruments that are subject to enforceable netting arrangements as of June 30, 2024:
Gross Amounts Not Offset in the Consolidated Statement of
Assets and Liabilities | |
Counterparty | | Gross Asset
Derivatives
Presented
in the
Consolidated
Statement of
Assets and
Liabilities
(000) | | Financial
Instrument
(000) | | Collateral
Received(a)
(000) | | Net
Amount
(not less
than $0)
(000) | |
Bank of
America NA | | $ | 127 | | | $ | (2 | ) | | $ | — | | | $ | 125 | | |
Barclays Bank
PLC | | | 23 | | | | (7 | ) | | | — | | | | 16 | | |
BNP Paribas SA | | | 145 | | | | (106 | ) | | | — | | | | 39 | | |
Canadian
Imperial Bank
of Commerce | | | 1 | | | | — | | | | — | | | | 1 | | |
Citibank NA | | | — | @ | | | (— | @) | | | — | | | | 0 | | |
Goldman Sachs
International | | | 259 | | | | (16 | ) | | | (243 | ) | | | 0 | | |
HSBC Bank PLC | | | 2 | | | | — | | | | — | | | | 2 | | |
JPMorgan
Chase Bank
NA | | | 20 | | | | (9 | ) | | | — | | | | 11 | | |
State Street
Bank and
Trust Co. | | | — | @ | | | — | | | | — | | | | — | @ | |
UBS AG | | | 30 | | | | (8 | ) | | | (22 | ) | | | 0 | | |
Total | | $ | 607 | | | $ | (148 | ) | | $ | (265 | ) | | $ | 194 | | |
42
Morgan Stanley Variable Insurance Fund, Inc.
June 30, 2024 (unaudited)
Notes to Consolidated Financial Statements (cont'd)
Gross Amounts Not Offset in the Consolidated Statement of Assets and Liabilities | |
Counterparty | | Gross Liability
Derivatives
Presented
in the
Consolidated
Statement of
Assets and
Liabilities
(000) | | Financial
Instrument
(000) | | Collateral
Pledged(a)
(000) | | Net
Amount
(not less
than $0)
(000) | |
Bank of
America NA | | $ | 9 | | | $ | (2 | ) | | $ | — | | | $ | 7 | | |
Barclays Bank
PLC | | | 30 | | | | (7 | ) | | | — | | | | 23 | | |
BNP Paribas SA | | | 150 | | | | (106 | ) | | | — | | | | 44 | | |
Citibank NA | | | — | @ | | | (— | @) | | | — | | | | 0 | | |
Goldman Sachs
International | | | 133 | | | | (16 | ) | | | — | | | | 117 | | |
JPMorgan
Chase Bank
NA | | | 9 | | | | (9 | ) | | | — | | | | 0 | | |
UBS AG | | | 44 | | | | (8 | ) | | | (36 | ) | | | 0 | | |
Total | | $ | 375 | | | $ | (148 | ) | | $ | (36 | ) | | $ | 191 | | |
@ Value is less than $500.
(a) In some instances, the actual collateral received or pledged may be more than the amount shown here due to overcollateralization.
For the six months ended June 30, 2024, the approximate average monthly amount outstanding for each derivative type is as follows:
Foreign Currency Forward Exchange Contracts: | |
Average monthly principal amount | | $ | 23,752,000 | | |
Futures Contracts: | |
Average monthly notional value | | $ | 25,109,000 | | |
Swap Agreements: | |
Average monthly notional amount | | $ | 16,633,000 | | |
6. When-Issued/Delayed Delivery Securities: The Fund purchases and sells when-issued and delayed delivery securities. Securities purchased on a when-issued or delayed delivery basis are purchased for delivery beyond the normal settlement date at a stated price and yield, and no income accrues to the Fund on such securities prior to delivery date. Payment and delivery for when-issued and delayed delivery securities can take place a month or more after the date of the transaction. When the Fund enters into a purchase transaction on a when-issued or delayed delivery basis, securities are available for collateral in an amount at least equal in value to the Fund's commitments to purchase such securities. Purchasing securities on a when-issued or delayed delivery basis may involve a risk that the market price at the time of delivery may be lower than the agreed upon purchase price, in which case there could be an unrealized loss at
the time of delivery. Purchasing investments on a when-issued or delayed delivery basis may be considered a form of leverage which may increase the impact that gains (losses) may have on the Fund.
7. Indemnifications: The Company enters into contracts that contain a variety of indemnification clauses. The Company's maximum exposure under these arrangements is unknown as this would involve future claims that may be made against the Fund that have not yet occurred.
8. Security Transactions, Income and Expenses: Security transactions are accounted for on the trade date (date the order to buy or sell is executed). Realized gains and losses on the sale of investment securities are determined on the specific identified cost method. Dividend income and other distributions are recorded on the ex-dividend date (except for certain foreign dividends which may be recorded as soon as the Fund is informed of such dividends) net of applicable withholding taxes. Non-cash dividends received in the form of stock, if any, are recognized on the ex-dividend date and recorded as non-cash dividend income at fair value. Interest income is recognized on the accrual basis (except where collection is in doubt) net of applicable withholding taxes. Discounts are accreted and premiums are amortized over the life of the respective securities. Most expenses of the Company can be directly attributed to a particular Fund. Expenses which cannot be directly attributed are apportioned among the Funds based upon relative net assets or other appropriate methods. Income, expenses (other than class specific expenses) and realized and unrealized gains or losses are allocated to each class of shares based upon their relative net assets.
Settlement and registration of foreign securities transactions may be subject to significant risks not normally associated with investments in the United States. In certain markets, ownership of shares is defined according to entries in the issuer's share register. It is possible that a Fund holding these securities could lose its share registration through fraud, negligence or even mere oversight. In addition, shares being delivered for sales and cash being paid for purchases may be delivered before the exchange is complete. This may subject the Fund to further risk of loss in the event of a failure to complete the transaction by the counterparty.
9. Dividends and Distributions to Shareholders: Dividends and distributions to shareholders are recorded on the ex-dividend date. Dividends from net investment
43
Morgan Stanley Variable Insurance Fund, Inc.
June 30, 2024 (unaudited)
Notes to Consolidated Financial Statements (cont'd)
income, if any, are declared and paid annually. Net realized capital gains, if any, are distributed at least annually.
B. Advisory/Sub-Advisory Fees: The Adviser, a wholly-owned subsidiary of Morgan Stanley, provides the Fund with advisory services under the terms of an Investment Advisory Agreement, paid quarterly, at the annual rate based on the daily net assets as follows:
First $500
million | | Next $500
million | | Over $1
billion | |
| | 0.75 | % | | | 0.70 | % | | | 0.65 | % | |
For the six months ended June 30, 2024, the advisory fee rate (net of waiver/rebate) was equivalent to an annual effective rate of 0.00% of the Fund's average daily net assets.
The Adviser has agreed to reduce its advisory fee and/or reimburse the Fund so that total annual Fund operating expenses, excluding certain investment related expenses, taxes, interest and other extraordinary expenses (including litigation), will not exceed 0.90% for Class I shares and 1.00% for Class II shares. The fee waivers and/or expense reimbursements will continue for at least one year from the date of the Fund's prospectus or until such time as the Directors act to discontinue all or a portion of such waivers and/or reimbursements when they deem such action is appropriate. For the six months ended June 30, 2024, approximately $305,000 of advisory fees were waived and approximately $57,000 of other expenses were reimbursed by the Adviser pursuant to this arrangement.
The Adviser has entered into a Sub-Advisory Agreement with the Sub-Adviser, a wholly-owned subsidiary of Morgan Stanley. The Sub-Adviser provides the Fund with advisory services subject to the overall supervision of the Adviser and the Fund's Officers and Directors. The Adviser pays the Sub-Adviser on a monthly basis a portion of the net advisory fees the Adviser receives from the Fund.
The Adviser provides investment advisory services to the Subsidiary pursuant to the Subsidiary Investment Management Agreement (the "Agreement"). Under the Agreement, the Subsidiary will pay the Adviser at the end of each fiscal quarter, calculated by applying a quarterly rate, based on the annual rate of 0.05%, to the average daily net assets of the Subsidiary.
The Adviser has agreed to waive its advisory fees by the amount of advisory fees it receives from the Subsidiary.
C. Administration Fees: The Adviser also serves as Administrator to the Company and provides administrative services pursuant to an Administration Agreement for an annual fee, accrued daily and paid monthly, of 0.08% of the Fund's average daily net assets.
Under a Sub-Administration Agreement between the Administrator and State Street Bank and Trust Company ("State Street"), State Street provides certain administrative services to the Company. For such services, the Administrator pays State Street a portion of the fee the Administrator receives from the Fund.
D. Servicing Fees: The Company accrues daily and pays quarterly a servicing fee of up to 0.17% of the average daily value of shares of the Fund held in an insurance company's account. Certain insurance companies have entered into a servicing agreement with the Company to provide administrative and other contract-owner related services on behalf of the Fund.
E. Distribution Fees: Morgan Stanley Distribution, Inc. ("MSDI" or the "Distributor"), a wholly-owned subsidiary of the Adviser and an indirect subsidiary of Morgan Stanley, serves as the Distributor of the Fund and provides the Fund's Class II shareholders with distribution services pursuant to a Distribution Plan (the "Plan") in accordance with Rule 12b-1 under the Act. Under the Plan, the Fund is authorized to pay the Distributor a distribution fee, which is accrued daily and paid monthly, at an annual rate of 0.25% of the Fund's average daily net assets attributable to Class II shares. The Distributor has agreed to waive 0.15% of the 0.25% distribution fee that it may receive. This fee waiver will continue for at least one year from the date of the Fund's prospectus or until such time as the Directors act to discontinue all or a portion of such waiver when they deem such action is appropriate. For the six months ended June 30, 2024, this waiver amounted to approximately $10,000.
F. Dividend Disbursing and Transfer/Co-Transfer Agent: The Company's dividend disbursing and transfer agent is SS&C Global Investor & Distribution Solutions, Inc. ("SS&C GIDS"). Pursuant to a Transfer Agency Agreement, the Company pays SS&C GIDS a fee based on the number of classes, accounts and transactions relating to the Funds of the Company.
Eaton Vance Management ("EVM"), an affiliate of Morgan Stanley, provides co-transfer agency and related services to the Fund pursuant to a Co-Transfer Agency Services Agreement. For the six months ended June 30, 2024, co-transfer agency fees and expenses incurred to EVM, included in "Transfer Agency Fees" in the Consolidated Statement of Operations, amounted to less than $500.
G. Custodian Fees: State Street (the "Custodian") also serves as Custodian for the Company in accordance with a Custodian Agreement. The Custodian holds cash, securities and other assets of the Company as required by the Act. Custody fees are payable monthly based on assets held in custody,
44
Morgan Stanley Variable Insurance Fund, Inc.
June 30, 2024 (unaudited)
Notes to Consolidated Financial Statements (cont'd)
investment purchases and sales activity and account maintenance fees, plus reimbursement for certain out-of-pocket expenses.
H. Security Transactions and Transactions with Affiliates: For the six months ended June 30, 2024, purchases and sales of investment securities for the Fund, other than long-term U.S. Government securities and short-term investments were approximately $19,772,000 and $24,706,000, respectively. For the six months ended June 30, 2024, purchases and sales of long-term U.S. Government securities were approximately $13,366,000 and $12,632,000, respectively.
The Fund invests in the Institutional Class of the Morgan Stanley Institutional Liquidity Funds — Government Portfolio (the "Liquidity Fund"), an open-end management investment company managed by the Adviser. Advisory fees paid by the Fund are reduced by an amount equal to its pro-rata share of the advisory and administration fees paid by the Fund due to its investment in the Liquidity Fund. For the six months ended June 30, 2024, advisory fees paid were reduced by approximately $9,000 relating to the Fund's investment in the Liquidity Fund.
A summary of the Fund's transactions in shares of affiliated investments during the six months ended June 30, 2024 is as follows:
Affiliated
Investment
Company | | Value
December 31,
2023
(000) | | Purchases
at Cost
(000) | | Proceeds
from Sales
(000) | | Dividend
Income
(000) | |
Liquidity Fund | | $ | 9,089 | | | $ | 18,564 | | | $ | 13,894 | | | $ | 314 | | |
Affiliated
Investment
Company (cont'd) | | Realized
Gain (Loss)
(000) | | Change in
Unrealized
Appreciation
(Depreciation)
(000) | | Value
June 30,
2024
(000) | |
Liquidity Fund | | $ | — | | | $ | — | | | $ | 13,759 | | |
The Fund is permitted to purchase and sell securities ("cross-trade") from and to other Morgan Stanley funds as well as other funds and client accounts for which the Adviser or an affiliate of the Adviser serves as investment adviser, pursuant to procedures approved by the Directors in compliance with Rule 17a-7 under the Act (the "Rule"). Each cross-trade is executed at the current market price in compliance with provisions of the Rule. For the six months ended June 30, 2024, the Fund did not engage in any cross-trade transactions.
Each Director receives an annual retainer fee for serving as a Director of the Morgan Stanley Funds. The aggregate compensation paid to each Director is paid by the Morgan Stanley
Funds, and is allocated on a pro rata basis among each of the operational funds of the Morgan Stanley Funds based on the relative net assets of each of the funds. The Company also reimburses such Directors for travel and other out-of-pocket expenses incurred by them in connection with attending such meetings.
The Fund has an unfunded Deferred Compensation Plan (the "Compensation Plan"), which allows each independent Director to defer payment of all, or a portion, of the fees he or she receives for serving on the Board of Directors. Each eligible Director generally may elect to have the deferred amounts credited with a return equal to the total return on one or more of the Morgan Stanley funds that are offered as investment options under the Compensation Plan. Appreciation/depreciation and distributions received from these investments are recorded with an offsetting increase/decrease in the deferred compensation obligation and do not affect the NAV of the Fund.
I. Federal Income Taxes: It is the Fund's intention to continue to qualify as a RIC and distribute all of its taxable and tax-exempt income. Accordingly, no provision for federal income taxes is required in the consolidated financial statements.
The Fund may be subject to taxes imposed by countries in which it invests. Such taxes are generally based on income and/or capital gains earned or repatriated. Taxes are accrued based on net investment income, net realized gains and net unrealized appreciation as such income and/or gains are earned. Taxes may also be based on transactions in foreign currency and are accrued based on the value of investments denominated in such currency.
FASB ASC 740-10, "Income Taxes — Overall", sets forth a minimum threshold for consolidated financial statement recognition of the benefit of a tax position taken or expected to be taken in a tax return. Management has concluded there are no significant uncertain tax positions that would require recognition in the consolidated financial statements. If applicable, the Fund recognizes interest accrued related to unrecognized tax benefits in "Interest Expense" and penalties in "Other Expenses" in the Consolidated Statement of Operations. The Fund files tax returns with the U.S. Internal Revenue Service, New York and various states. Generally, each of the tax years in the four-year period ended December 31, 2023 remains subject to examination by taxing authorities.
The tax character of distributions paid may differ from the character of distributions shown for GAAP purposes due to short-term capital gains being treated as ordinary income for
45
Morgan Stanley Variable Insurance Fund, Inc.
June 30, 2024 (unaudited)
Notes to Consolidated Financial Statements (cont'd)
tax purposes. The tax character of distributions paid during fiscal years 2023 and 2022 was as follows:
2023 Distributions
Paid From: | | 2022 Distributions
Paid From: | |
Ordinary
Income
(000) | | Long-Term
Capital Gain
(000) | | Ordinary
Income
(000) | | Long-Term
Capital Gain
(000) | |
| $ | 1,339 | | | $ | — | | | $ | 5,286 | | | $ | 9,929 | | |
The amount and character of income and gains to be distributed are determined in accordance with income tax regulations which may differ from GAAP. These book/tax differences are either considered temporary or permanent in nature.
Temporary differences are attributable to differing book and tax treatments for the timing of the recognition of gains (losses) on certain investment transactions and the timing of the deductibility of certain expenses.
Permanent differences, primarily due to a net operating loss, resulted in the following reclassifications among the components of net assets at December 31, 2023:
Total
Distributable
Earnings
(000) | | Paid-in-
Capital
(000) | |
| $ | 1,225 | | | $ | (1,225 | ) | |
At December 31, 2023, the Fund had no distributable earnings on a tax basis.
At December 31, 2023, the Fund had available for federal income tax purposes unused short-term and long-term capital losses of approximately $385,000 and $1,091,000, respectively, that do not have an expiration date.
To the extent that capital loss carryforwards are used to offset any future capital gains realized, no capital gains tax liability will be incurred by the Fund for gains realized and not distributed. To the extent that capital gains are offset, such gains will not be distributed to the shareholders. During the year ended December 31, 2023, the Fund utilized capital loss carryforwards for U.S. federal income tax purposes of approximately $3,398,000.
J. Credit Facility: The Company and other Morgan Stanley funds participated in a $500,000,000 committed, unsecured revolving line of credit facility (the "Facility") with State Street. This Facility is to be used for temporary emergency purposes or funding of shareholder redemption requests. The interest rate for any funds drawn will be based on the federal funds rate or overnight bank funding rate plus a spread. The Facility also has a commitment fee of 0.25% per annum based on the unused portion of the Facility, which is allocated among participating funds based on relative net assets. During the six months ended June 30, 2024, the Fund did not have any borrowings under the Facility.
K. Other: At June 30, 2024, the Fund had record owners of 10% or greater. Investment activities of these shareholders could have a material impact on the Fund. The aggregate percentage of such owners was 78.6%.
L. Market Risk: The value of an investment in the Fund is based on the values of the Fund's investments, which change due to economic and other events that affect markets generally, as well as those that affect particular regions, countries, industries, companies or governments. The risks associated with these developments may be magnified if certain social, political, economic and other conditions and events adversely interrupt the global economy and financial markets. Securities in the Fund's portfolio may underperform due to inflation (or expectations for inflation), interest rates, global demand for particular products or resources, natural disasters and extreme weather events, health emergencies (such as epidemics and pandemics), terrorism, regulatory events and governmental or quasi-governmental actions. The occurrence of global events similar to those in recent years, such as terrorist attacks around the world, natural disasters, health emergencies, social and political (including geopolitical) discord and tensions or debt crises and downgrades, among others, may result in market volatility and may have long term effects on both the U.S. and global financial markets. The occurrence of such events may be sudden and unexpected, and it is difficult to predict when similar events affecting the U.S. or global financial markets may occur, the effects that such events may have and the duration of those effects (which may last for extended periods). Any such event(s) could have a significant adverse impact on the value, liquidity and risk profile of the Fund's portfolio, as well as its ability to sell securities and/or meet redemptions. Any such event(s) or similar types of factors and developments may also adversely affect the financial performance of the Fund's investments (and, in turn, the Fund's investment results) and/or negatively impact broad segments of businesses and populations and have a significant and rapid negative impact on the performance of the Fund's investments, and exacerbate preexisting risks to the Fund.
46
Morgan Stanley Variable Insurance Fund, Inc.
June 30, 2024 (unaudited)
Investment Advisory Agreement Approval
Nature, Extent and Quality of Services
The Board reviewed and considered the nature and extent of the investment advisory services provided by the Adviser under the advisory agreement, including portfolio management, investment research and equity and fixed income securities trading. The Board reviewed similar information and factors regarding the Sub-Adviser, to the extent applicable. The Board also reviewed and considered the nature and extent of the non-advisory, administrative services provided by the Administrator under the administration agreement, including accounting, operations, clerical, bookkeeping, compliance, business management and planning, legal services and the provision of supplies, office space and utilities at the Adviser's expense. The Board also considered the Adviser's investment in personnel and infrastructure that benefits the Fund. (The Adviser, Sub-Adviser and Administrator together are referred to as the "Adviser" and the advisory, sub-advisory and administration agreements together are referred to as the "Management Agreement.") The Board also considered that the Adviser serves a variety of other investment advisory clients and has experience overseeing service providers. The Board also compared the nature of the services provided by the Adviser with similar services provided by non-affiliated advisers as prepared by Broadridge Financial Solutions, Inc. ("Broadridge").
The Board reviewed and considered the qualifications of the portfolio managers, the senior administrative managers and other key personnel of the Adviser who provide the advisory and administrative services to the Fund. The Board determined that the Adviser's portfolio managers and key personnel are well qualified by education and/or training and experience to perform the services in an efficient and professional manner. The Board concluded that the nature and extent of the advisory and administrative services provided were necessary and appropriate for the conduct of the business and investment activities of the Fund and supported its decision to approve the Management Agreement.
Performance, Fees and Expenses of the Fund
The Board reviewed the performance, fees and expenses of the Fund compared to its peers, as prepared by Broadridge, and to appropriate benchmarks where applicable. The Board discussed with the Adviser the performance goals and the actual results achieved in managing the Fund. When considering a fund's performance, the Board and the Adviser place emphasis on trends and longer-term returns (focusing on one-year, three-year and five-year performance, as of December 31, 2023, or since inception, as applicable). When a fund underperforms its benchmark and/or its peer group average, the Board and the Adviser discuss the causes of such underperformance and, where necessary, they discuss specific changes to investment strategy or investment personnel. The Board noted that the Fund's performance was better than its peer group average for the one-year period and below its peer group average for the three- and five-year periods. The Board discussed with the Adviser the level of the advisory and administration fees (together, the "management fee") for this Fund relative to comparable funds and/or other accounts advised by the Adviser and/or compared to its peers as prepared by Broadridge. In addition to the management fee, the Board also reviewed the Fund's total expense ratio. When a fund's management fee and/or its total expense ratio are higher than its peers, the Board and the Adviser discuss the reasons for this and, where appropriate, they discuss possible waivers and/or caps. The Board noted that the Fund's contractual management fee was higher than its peer group average, the actual management fee was lower than its peer group average, and the total expense ratio was higher than but close to its peer group average. After discussion, the Board concluded that the Fund's (i) performance was acceptable; and (ii) management fee and total expense ratio were competitive with its peer group averages.
Economies of Scale
The Board considered the size and growth prospects of the Fund and how that relates to the Fund's total expense ratio and particularly the Fund's management fee rate, which includes breakpoints. In conjunction with its review of the Adviser's profitability, the Board discussed with the Adviser how a change in assets can affect the efficiency or effectiveness of managing the Fund and whether the management fee level is appropriate relative to current and projected asset levels and/or whether the management fee structure reflects economies of scale as asset levels change. The Board has determined that its review of the actual and/or potential economies of scale of the Fund supports its decision to approve the Management Agreement.
47
Morgan Stanley Variable Insurance Fund, Inc.
June 30, 2024 (unaudited)
Investment Advisory Agreement Approval (cont'd)
Profitability of the Adviser and Affiliates
The Board considered information concerning the costs incurred and profits realized by the Adviser and its affiliates during the last year from their relationship with the Fund and during the last two years from their relationship with the Morgan Stanley Fund Complex and reviewed with the Adviser the cost allocation methodology used to determine the profitability of the Adviser and affiliates. The Board has determined that its review of the analysis of the Adviser's expenses and profitability supports its decision to approve the Management Agreement.
Other Benefits of the Relationship
The Board considered other direct and indirect benefits to the Adviser and/or its affiliates derived from their relationship with the Fund and other funds advised by the Adviser. These benefits may include, among other things, fees for trading, distribution and/or shareholder servicing and for transaction processing and reporting platforms used by securities lending agents, and research received by the Adviser generated from commission dollars spent on funds' portfolio trading. The Board reviewed with the Adviser these arrangements and the reasonableness of the Adviser's costs relative to the services performed. The Board has determined that its review of the other benefits received by the Adviser or its affiliates supports its decision to approve the Management Agreement.
Resources of the Adviser and Historical Relationship Between the Fund and the Adviser
The Board considered whether the Adviser is financially sound and has the resources necessary to perform its obligations under the Management Agreement. The Board also reviewed and considered the historical relationship between the Fund and the Adviser, including the organizational structure of the Adviser, the policies and procedures formulated and adopted by the Adviser for managing the Fund's operations and the Board's confidence in the competence and integrity of the senior managers and key personnel of the Adviser. The Board concluded that the Adviser has the financial resources necessary to fulfill its obligations under the Management Agreement and that it is beneficial for the Fund to continue its relationship with the Adviser.
Other Factors and Current Trends
The Board considered the controls and procedures adopted and implemented by the Adviser and monitored by the Fund's Chief Compliance Officer and concluded that the conduct of business by the Adviser indicates a good faith effort on its part to adhere to high ethical standards in the conduct of the Fund's business.
General Conclusion
After considering and weighing all of the above factors, with various written materials and verbal information presented by the Adviser, the Board concluded that it would be in the best interest of the Fund and its shareholders to approve renewal of the Management Agreement for another year. In reaching this conclusion the Board did not give particular weight to any single piece of information or factor referenced above. The Board considered these factors and information over the course of the year and in numerous meetings, some of which were in executive session with only the independent Board members and their counsel present. It is possible that individual Board members may have weighed these factors, and the information presented, differently in reaching their individual decisions to approve the Management Agreement.
48
Morgan Stanley Variable Insurance Fund, Inc.
June 30, 2024 (unaudited)
This report is not authorized for distribution to prospective investors in the Fund unless preceded or accompanied by an effective Prospectus. Read the Prospectus carefully before investing.

Morgan Stanley Variable Insurance Fund, Inc.
Semi-Annual Financial Statements and Additional Information
June 30, 2024 (unaudited)
The Fund is intended to be a funding vehicle for variable annuity contracts and variable life insurance policies offered by the separate accounts of certain life insurance companies.
Morgan Stanley Variable Insurance Fund, Inc.
June 30, 2024 (unaudited)
1
Morgan Stanley Variable Insurance Fund, Inc.
June 30, 2024 (unaudited)
Consolidated Portfolio of Investments
Growth Portfolio
| | | Shares | | Value
(000) | |
Common Stocks (90.5%) | |
Automobiles (5.9%) | |
Rivian Automotive, Inc., Class A (a) | | | 81,386 | | | $ | 1,092 | | |
Tesla, Inc. (a) | | | 137,413 | | | | 27,191 | | |
| | | | 28,283 | | |
Biotechnology (1.3%) | |
ProKidney Corp. (a)(b) | | | 392,312 | | | | 965 | | |
Roivant Sciences Ltd. (a) | | | 497,313 | | | | 5,257 | | |
| | | | 6,222 | | |
Broadline Retail (5.4%) | |
Global-e Online Ltd. (Israel) (a) | | | 313,722 | | | | 11,379 | | |
MercadoLibre, Inc. (a) | | | 8,896 | | | | 14,619 | | |
| | | | 25,998 | | |
Capital Markets (2.4%) | |
Coinbase Global, Inc., Class A (a) | | | 19,255 | | | | 4,279 | | |
Intercontinental Exchange, Inc. | | | 52,849 | | | | 7,234 | | |
| | | | 11,513 | | |
Electronic Equipment, Instruments &
Components (0.0%) | |
Magic Leap, Inc., Class A (a)(c)(d)
(acquisition cost — $1,526;
acquired 12/22/15) | | | 3,138 | | | | — | | |
Entertainment (4.9%) | |
ROBLOX Corp., Class A (a) | | | 636,375 | | | | 23,679 | | |
Financial Services (8.3%) | |
Adyen NV (Netherlands) (a) | | | 14,398 | | | | 17,100 | | |
Affirm Holdings, Inc. (a) | | | 754,175 | | | | 22,784 | | |
| | | | 39,884 | | |
Ground Transportation (3.7%) | |
Uber Technologies, Inc. (a) | | | 245,797 | | | | 17,864 | | |
Health Care Providers & Services (1.6%) | |
Agilon Health, Inc. (a) | | | 1,201,613 | | | | 7,859 | | |
Health Care Technology (0.6%) | |
Doximity, Inc., Class A (a) | | | 107,299 | | | | 3,001 | | |
Hotels, Restaurants & Leisure (11.7%) | |
Airbnb, Inc., Class A (a) | | | 150,984 | | | | 22,894 | | |
DoorDash, Inc., Class A (a) | | | 310,574 | | | | 33,784 | | |
| | | | 56,678 | | |
Information Technology Services (19.1%) | |
Cloudflare, Inc., Class A (a) | | | 485,897 | | | | 40,247 | | |
Shopify, Inc., Class A (Canada) (a) | | | 438,679 | | | | 28,975 | | |
Snowflake, Inc., Class A (a) | | | 171,323 | | | | 23,144 | | |
| | | | 92,366 | | |
Leisure Products (0.3%) | |
Peloton Interactive, Inc., Class A (a) | | | 457,641 | | | | 1,547 | | |
Life Sciences Tools & Services (0.3%) | |
10X Genomics, Inc., Class A (a) | | | 72,937 | | | | 1,419 | | |
Media (7.5%) | |
Trade Desk, Inc., Class A (a) | | | 369,224 | | | | 36,062 | | |
| | | Shares | | Value
(000) | |
Pharmaceuticals (4.6%) | |
Royalty Pharma PLC, Class A | | | 838,740 | | | $ | 22,118 | | |
Software (7.8%) | |
Aurora Innovation, Inc. (a) | | | 1,754,598 | | | | 4,860 | | |
Bill Holdings, Inc. (a) | | | 128,779 | | | | 6,776 | | |
MicroStrategy, Inc., Class A (a) | | | 11,313 | | | | 15,584 | | |
Samsara, Inc., Class A (a) | | | 306,250 | | | | 10,321 | | |
| | | | 37,541 | | |
Specialized REITs (1.0%) | |
American Tower Corp. REIT | | | 24,391 | | | | 4,741 | | |
Specialty Retail (4.1%) | |
Carvana Co. (a) | | | 152,527 | | | | 19,633 | | |
Total Common Stocks (Cost $426,629) | | | 436,408 | | |
Preferred Stocks (2.5%) | |
Financial Services (0.3%) | |
Stripe, Inc., Series I (a)(c)(d)
(acquisition cost — $1,061;
acquired 3/17/23) | | | 52,681 | | | | 1,351 | | |
Software (2.2%) | |
Databricks, Inc., Series H (a)(c)(d)
(acquisition cost — $8,310;
acquired 8/31/21) | | | 113,088 | | | | 8,162 | | |
Databricks, Inc., Series I (a)(c)(d)
(acquisition cost — $2,242;
acquired 9/15/23) | | | 30,506 | | | | 2,202 | | |
Lookout, Inc., Series F (a)(c)(d)
(acquisition cost — $1,618;
acquired 6/17/14) | | | 141,612 | | | | 351 | | |
| | | | 10,715 | | |
Total Preferred Stocks (Cost $13,231) | | | 12,066 | | |
Investment Company (2.5%) | |
| iShares Bitcoin Trust (a) (Cost $13,615) | | | 351,849 | | | | 12,012 | | |
Short-Term Investments (4.7%) | |
Investment Company (4.7%) | |
Morgan Stanley Institutional Liquidity
Funds — Treasury Securities
Portfolio — Institutional Class, 5.14%
(See Note H) (Cost $22,557) | | | 22,557,354 | | | | 22,557 | | |
Securities held as Collateral on Loaned Securities (0.0%)‡ | |
Investment Company (0.0%)‡ | |
Morgan Stanley Institutional Liquidity
Funds — Treasury Securities
Portfolio — Institutional Class, 5.14%
(See Note H) | | | 5,085 | | | | 5 | | |
The accompanying notes are an integral part of the consolidated financial statements.
2
Morgan Stanley Variable Insurance Fund, Inc.
June 30, 2024 (unaudited)
Consolidated Portfolio of Investments (cont'd)
Growth Portfolio
| | | Face Amount
(000) | | Value
(000) | |
Repurchase Agreements (0.0%)‡ | |
Merrill Lynch & Co., Inc., (5.32%, dated
6/28/24, due 7/1/24; proceeds $1;
fully collateralized by a U.S. Government
obligation; 0.63% due 11/30/27;
valued at $1) | | $ | 1 | | | $ | 1 | | |
Merrill Lynch & Co., Inc., (5.25%,
dated 6/28/24, due 7/1/24;
proceeds $1; fully collateralized
by a U.S. Government obligation;
0.63% due 11/30/27; valued at $1) | | | 1 | | | | 1 | | |
| | | | 2 | | |
Total Securities held as Collateral on
Loaned Securities (Cost $7) | | | 7 | | |
Total Short-Term Investments
(Cost $22,564) | | | 22,564 | | |
Total Investments Excluding Purchased
Options (100.2%) (Cost $476,039) | | | | | 483,050 | | |
Total Purchased Options Outstanding (0.1%)
(Cost $1,487) | | | 476 | | |
Total Investments (100.3%) (Cost $477,526)
including $6 of Securities Loaned (e)(f)(g) | | | 483,526 | | |
Liabilities in Excess of Other Assets (–0.3%) | | | (1,397 | ) | |
Net Assets (100.0%) | | $ | 482,129 | | |
‡ Amount is less than 0.05%.
(a) Non-income producing security.
(b) All or a portion of this security was on loan at June 30, 2024.
(c) Security cannot be offered for public resale without first being registered under the Securities Act of 1933 and related rules ("restricted security"). Acquisition date represents the day on which an enforceable right to acquire such security is obtained and is presented along with related cost in the security description. The Fund has registration rights for certain restricted securities. Any costs related to such registration are borne by the issuer. The aggregate value of restricted securities (excluding 144A holdings) at June 30, 2024 amounts to approximately $12,066,000 and represents 2.5% of net assets.
(d) At June 30, 2024, the Fund held fair valued securities at approximately $12,066,000, representing 2.5% of net assets. These securities have been fair valued using significant unobservable inputs as determined in good faith under procedures established by and under the general supervision of the Company's (as defined herein) Directors.
(e) The approximate fair value and percentage of net assets, $17,100,000 and 3.5%, respectively, represent the securities that have been fair valued under the fair valuation policy for international investments as described in Note A-1 within the Notes to Consolidated Financial Statements.
(f) Securities are available for collateral in connection with purchased options.
(g) At June 30, 2024, the aggregate cost for federal income tax purposes approximates the aggregate cost for book purposes. The aggregate gross unrealized appreciation is approximately $101,625,000 and the aggregate gross unrealized depreciation is approximately $95,625,000, resulting in net unrealized appreciation of approximately $6,000,000.
REIT Real Estate Investment Trust.
Call Options Purchased:
The Fund had the following call options purchased open at June 30, 2024:
Counterparty | | Description | | Strike
Price | | Expiration
Date | | Number of
Contracts | | Notional
Amount
(000) | | Value
(000) | | Premiums
Paid
(000) | | Unrealized
Depreciation
(000) | |
Goldman Sachs International | | USD/CNH | | CNH | 7.68 | | | Jan-25 | | | 127,446,620 | | | $ | 127,447 | | | $ | 208 | | | $ | 482 | | | $ | (274 | ) | |
JPMorgan Chase Bank NA | | USD/CNH | | CNH | 7.78 | | | Mar-25 | | | 125,342,522 | | | | 125,343 | | | | 264 | | | | 532 | | | | (268 | ) | |
JPMorgan Chase Bank NA | | USD/CNH | | CNH | 7.79 | | | Aug-24 | | | 114,161,744 | | | | 114,162 | | | | 4 | | | | 473 | | | | (469 | ) | |
| | | | | | | | | | | | | $ | 476 | | | $ | 1,487 | | | $ | (1,011 | ) | |
CNH — Chinese Yuan Renminbi Offshore
USD — United States Dollar
The accompanying notes are an integral part of the consolidated financial statements.
3
Morgan Stanley Variable Insurance Fund, Inc.
June 30, 2024 (unaudited)
Consolidated Portfolio of Investments (cont'd)
Growth Portfolio
Portfolio Composition*
Classification | | Percentage of
Total Investments | |
Other** | | | 32.0 | % | |
Information Technology Services | | | 19.1 | | |
Hotels, Restaurants & Leisure | | | 11.7 | | |
Software | | | 10.0 | | |
Financial Services | | | 8.5 | | |
Media | | | 7.5 | | |
Automobiles | | | 5.8 | | |
Broadline Retail | | | 5.4 | | |
Total Investments | | | 100.0 | % | |
* Percentages indicated are based upon total investments (excluding Securities held as Collateral on Loaned Securities) as of June 30, 2024.
** Industries and/or investment types representing less than 5% of total investments.
The accompanying notes are an integral part of the consolidated financial statements.
4
Morgan Stanley Variable Insurance Fund, Inc.
June 30, 2024 (unaudited)
Consolidated Statement of Assets and Liabilities | | June 30, 2024
(000) | |
Assets: | |
Investments in Securities of Unaffiliated Issuers, at Value(1) (Cost $454,964) | | $ | 460,964 | | |
Investment in Security of Affiliated Issuer, at Value (Cost $22,562) | | | 22,562 | | |
Total Investments in Securities, at Value (Cost $477,526) | | | 483,526 | | |
Foreign Currency, at Value (Cost $1) | | | 1 | | |
Receivable for Investments Sold | | | 346 | | |
Receivable from Affiliate | | | 111 | | |
Receivable for Fund Shares Sold | | | 56 | | |
Dividends Receivable | | | 40 | | |
Receivable from Securities Lending Income | | | 1 | | |
Other Assets | | | 40 | | |
Total Assets | | | 484,121 | | |
Liabilities: | |
Due to Broker | | | 930 | | |
Payable for Advisory Fees | | | 338 | | |
Payable for Fund Shares Redeemed | | | 325 | | |
Payable for Servicing Fees | | | 209 | | |
Payable for Professional Fees | | | 49 | | |
Payable for Distribution Fees — Class II Shares | | | 41 | | |
Payable for Administration Fees | | | 31 | | |
Payable for Directors' Fees and Expenses | | | 10 | | |
Payable for Custodian Fees | | | 8 | | |
Collateral on Securities Loaned, at Value | | | 7 | | |
Payable for Transfer Agency Fees | | | 2 | | |
Other Liabilities | | | 42 | | |
Total Liabilities | | | 1,992 | | |
NET ASSETS | | $ | 482,129 | | |
Net Assets Consist of: | |
Paid-in-Capital | | $ | 648,269 | | |
Total Accumulated Loss | | | (166,140 | ) | |
Net Assets | | $ | 482,129 | | |
CLASS I: | |
Net Assets | | $ | 279,203 | | |
Net Asset Value, Offering and Redemption Price Per Share Applicable to 20,726,319 Outstanding
$0.001 Par Value Shares (Authorized 500,000,000 Shares) | | $ | 13.47 | | |
CLASS II: | |
Net Assets | | $ | 202,926 | | |
Net Asset Value, Offering and Redemption Price Per Share Applicable to 19,880,197 Outstanding
$0.001 Par Value Shares (Authorized 500,000,000 Shares) | | $ | 10.21 | | |
(1) Including: | |
Securities on Loan, at Value: | | $ | 6 | | |
The accompanying notes are an integral part of the consolidated financial statements.
5
Morgan Stanley Variable Insurance Fund, Inc.
June 30, 2024 (unaudited)
Consolidated Statement of Operations | | Six Months Ended
June 30, 2024
(000) | |
Investment Income: | |
Dividends from Security of Affiliated Issuer (Note H) | | $ | 382 | | |
Dividends from Securities of Unaffiliated Issuers | | | 366 | | |
Income from Securities Loaned — Net | | | 12 | | |
Total Investment Income | | | 760 | | |
Expenses: | |
Advisory Fees (Note B) | | | 1,239 | | |
Servicing Fees (Note D) | | | 342 | | |
Distribution Fees — Class II Shares (Note E) | | | 260 | | |
Administration Fees (Note C) | | | 198 | | |
Professional Fees | | | 88 | | |
Shareholder Reporting Fees | | | 15 | | |
Custodian Fees (Note G) | | | 13 | | |
Transfer Agency Fees (Note F) | | | 8 | | |
Directors' Fees and Expenses | | | 3 | | |
Pricing Fees | | | 2 | | |
Other Expenses | | | 18 | | |
Total Expenses | | | 2,186 | | |
Waiver of Advisory Fees (Note B) | | | (515 | ) | |
Rebate from Morgan Stanley Affiliate (Note H) | | | (14 | ) | |
Net Expenses | | | 1,657 | | |
Net Investment Loss | | | (897 | ) | |
Realized Gain: | |
Investments Sold | | | 8,857 | | |
Foreign Currency Translation | | | 2 | | |
Net Realized Gain | | | 8,859 | | |
Change in Unrealized Appreciation (Depreciation): | |
Investments | | | (3,911 | ) | |
Foreign Currency Translation | | | — | @ | |
Net Change in Unrealized Appreciation (Depreciation) | | | (3,911 | ) | |
Net Realized Gain and Change in Unrealized Appreciation (Depreciation) | | | 4,948 | | |
Net Increase in Net Assets Resulting from Operations | | $ | 4,051 | | |
@ Amount is less than $500.
The accompanying notes are an integral part of the consolidated financial statements.
6
Morgan Stanley Variable Insurance Fund, Inc.
June 30, 2024
Consolidated Statements of Changes in Net Assets | | Six Months Ended
June 30, 2024
(unaudited)
(000) | | Year Ended
December 31, 2023
(000) | |
Increase (Decrease) in Net Assets: | |
Operations: | |
Net Investment Loss | | $ | (897 | ) | | $ | (1,746 | ) | |
Net Realized Gain (Loss) | | | 8,859 | | | | (86,942 | ) | |
Net Change in Unrealized Appreciation (Depreciation) | | | (3,911 | ) | | | 265,794 | | |
Net Increase in Net Assets Resulting from Operations | | | 4,051 | | | | 177,106 | | |
Capital Share Transactions:(1) | |
Class I: | |
Subscribed | | | 6,442 | | | | 16,451 | | |
Redeemed | | | (26,342 | ) | | | (41,851 | ) | |
Class II: | |
Subscribed | | | 8,470 | | | | 66,212 | | |
Redeemed | | | (25,247 | ) | | | (77,778 | ) | |
Net Decrease in Net Assets Resulting from Capital Share Transactions | | | (36,677 | ) | | | (36,966 | ) | |
Total Increase (Decrease) in Net Assets | | | (32,626 | ) | | | 140,140 | | |
Net Assets: | |
Beginning of Period | | | 514,755 | | | | 374,615 | | |
End of Period | | $ | 482,129 | | | $ | 514,755 | | |
(1) Capital Share Transactions: | |
Class I: | |
Shares Subscribed | | | 477 | | | | 1,494 | | |
Shares Redeemed | | | (1,983 | ) | | | (3,791 | ) | |
Net Decrease in Class I Shares Outstanding | | | (1,506 | ) | | | (2,297 | ) | |
Class II: | |
Shares Subscribed | | | 840 | | | | 8,023 | | |
Shares Redeemed | | | (2,480 | ) | | | (9,129 | ) | |
Net Decrease in Class II Shares Outstanding | | | (1,640 | ) | | | (1,106 | ) | |
The accompanying notes are an integral part of the consolidated financial statements.
7
Morgan Stanley Variable Insurance Fund, Inc.
June 30, 2024
Consolidated Financial Highlights
Growth Portfolio
| | | Class I | |
| | | Six Months Ended
June 30, 2024 | | Year Ended December 31, | |
Selected Per Share Data and Ratios | | (unaudited) | | 2023 | | 2022 | | 2021 | | 2020(1) | | 2019(1) | |
Net Asset Value, Beginning of Period | | $ | 13.35 | | | $ | 8.98 | | | $ | 53.72 | | | $ | 70.24 | | | $ | 35.80 | | | $ | 28.62 | | |
Income (Loss) from Investment Operations: | |
Net Investment Loss(2) | | | (0.02 | ) | | | (0.03 | ) | | | (0.07 | ) | | | (0.35 | ) | | | (0.28 | ) | | | (0.14 | ) | |
Net Realized and Unrealized Gain (Loss) | | | 0.14 | | | | 4.40 | | | | (30.00 | ) | | | 2.53 | | | | 40.32 | | | | 9.23 | | |
Total from Investment Operations | | | 0.12 | | | | 4.37 | | | | (30.07 | ) | | | 2.18 | | | | 40.04 | | | | 9.09 | | |
Distributions from and/or in Excess of: | |
Net Realized Gain | | | — | | | | — | | | | (14.67 | ) | | | (18.70 | ) | | | (5.60 | ) | | | (1.91 | ) | |
Net Asset Value, End of Period | | $ | 13.47 | | | $ | 13.35 | | | $ | 8.98 | | | $ | 53.72 | | | $ | 70.24 | | | $ | 35.80 | | |
Total Return(3) | | | 0.90 | %(4) | | | 48.66 | %(5) | | | (60.07 | )% | | | 0.10 | % | | | 117.31 | % | | | 31.81 | % | |
Ratios to Average Net Assets and Supplemental Data: | |
Net Assets, End of Period (Thousands) | | $ | 279,203 | | | $ | 296,798 | | | $ | 220,167 | | | $ | 645,473 | | | $ | 737,155 | | | $ | 386,720 | | |
Ratio of Expenses Before Expense Limitation | | | 0.78 | %(6) | | | 0.78 | % | | | 0.78 | % | | | 0.74 | % | | | 0.74 | % | | | 0.78 | % | |
Ratio of Expenses After Expense Limitation | | | 0.56 | %(6)(7) | | | 0.56 | %(7) | | | 0.57 | %(7) | | | 0.57 | %(7) | | | 0.56 | %(7) | | | 0.61 | %(7)(8) | |
Ratio of Net Investment Loss | | | (0.26 | )%(6)(7) | | | (0.28 | )%(7) | | | (0.39 | )%(7) | | | (0.52 | )%(7) | | | (0.55 | )%(7) | | | (0.41 | )%(7) | |
Ratio of Rebate from Morgan Stanley Affiliates | | | 0.01 | %(6) | | | 0.01 | % | | | 0.00 | %(9) | | | 0.00 | %(9) | | | 0.01 | % | | | 0.01 | % | |
Portfolio Turnover Rate | | | 18 | %(4) | | | 33 | % | | | 41 | % | | | 59 | % | | | 55 | % | | | 95 | % | |
(1) Not consolidated.
(2) Per share amount is based on average shares outstanding.
(3) Calculated based on the net asset value as of the last business day of the period. Performance does not reflect fees and expenses imposed by your insurance company's separate account. If performance information included the effect of these additional charges, the total return would be lower.
(4) Not annualized.
(5) Reflects prior period transfer agency fees that were reimbursed in 2023. The amount of the reimbursement was immaterial on a per share basis and the impact was less than 0.005% to the total return of Class I shares.
(6) Annualized.
(7) The Ratio of Expenses After Expense Limitation and Ratio of Net Investment Loss reflect the rebate of certain Fund expenses in connection with the investments in Morgan Stanley affiliates during the period. The effect of the rebate on the ratios is disclosed in the above table as "Ratio of Rebate from Morgan Stanley Affiliates."
(8) Effective April 29, 2019, the Adviser has agreed to limit the ratio of expenses to average net assets to the maximum ratio of 0.57% for Class I shares. Prior to April 29, 2019, the maximum ratio was 0.80% for Class I shares.
(9) Amount is less than 0.005%.
The accompanying notes are an integral part of the consolidated financial statements.
8
Morgan Stanley Variable Insurance Fund, Inc.
June 30, 2024
Consolidated Financial Highlights
Growth Portfolio
| | | Class II | |
| | | Six Months Ended
June 30, 2024 | | Year Ended December 31, | |
Selected Per Share Data and Ratios | | (unaudited) | | 2023 | | 2022 | | 2021 | | 2020(1) | | 2019(1) | |
Net Asset Value, Beginning of Period | | $ | 10.13 | | | $ | 6.83 | | | $ | 48.42 | | | $ | 65.09 | | | $ | 33.51 | | | $ | 26.95 | | |
Income (Loss) from Investment Operations: | |
Net Investment Loss(2) | | | (0.03 | ) | | | (0.04 | ) | | | (0.09 | ) | | | (0.46 | ) | | | (0.38 | ) | | | (0.21 | ) | |
Net Realized and Unrealized Gain (Loss) | | | 0.11 | | | | 3.34 | | | | (26.83 | ) | | | 2.49 | | | | 37.56 | | | | 8.68 | | |
Total from Investment Operations | | | 0.08 | | | | 3.30 | | | | (26.92 | ) | | | 2.03 | | | | 37.18 | | | | 8.47 | | |
Distributions from and/or in Excess of: | |
Net Realized Gain | | | — | | | | — | | | | (14.67 | ) | | | (18.70 | ) | | | (5.60 | ) | | | (1.91 | ) | |
Net Asset Value, End of Period | | $ | 10.21 | | | $ | 10.13 | | | $ | 6.83 | | | $ | 48.42 | | | $ | 65.09 | | | $ | 33.51 | | |
Total Return(3) | | | 0.79 | %(4) | | | 48.32 | %(5) | | | (60.16 | )% | | | (0.15 | )% | | | 116.76 | % | | | 31.47 | % | |
Ratios to Average Net Assets and Supplemental Data: | |
Net Assets, End of Period (Thousands) | | $ | 202,926 | | | $ | 217,957 | | | $ | 154,448 | | | $ | 359,607 | | | $ | 388,580 | | | $ | 213,760 | | |
Ratio of Expenses Before Expense Limitation | | | 1.03 | %(6) | | | 1.03 | % | | | 1.03 | % | | | 0.99 | % | | | 0.99 | % | | | 1.03 | % | |
Ratio of Expenses After Expense Limitation | | | 0.81 | %(6)(7) | | | 0.81 | %(7) | | | 0.82 | %(7) | | | 0.82 | %(7) | | | 0.81 | %(7) | | | 0.86 | %(7)(8) | |
Ratio of Net Investment Loss | | | (0.51 | )%(6)(7) | | | (0.53 | )%(7) | | | (0.64 | )%(7) | | | (0.77 | )%(7) | | | (0.80 | )%(7) | | | (0.66 | )%(7) | |
Ratio of Rebate from Morgan Stanley Affiliates | | | 0.01 | %(6) | | | 0.01 | % | | | 0.00 | %(9) | | | 0.00 | %(9) | | | 0.01 | % | | | 0.01 | % | |
Portfolio Turnover Rate | | | 18 | %(4) | | | 33 | % | | | 41 | % | | | 59 | % | | | 55 | % | | | 95 | % | |
(1) Not consolidated.
(2) Per share amount is based on average shares outstanding.
(3) Calculated based on the net asset value as of the last business day of the period. Performance does not reflect fees and expenses imposed by your insurance company's separate account. If performance information included the effect of these additional charges, the total return would be lower.
(4) Not annualized.
(5) Reflects prior period transfer agency fees that were reimbursed in 2023. The amount of the reimbursement was immaterial on a per share basis and the impact was less than 0.005% to the total return of Class II shares.
(6) Annualized.
(7) The Ratio of Expenses After Expense Limitation and Ratio of Net Investment Loss reflect the rebate of certain Fund expenses in connection with the investments in Morgan Stanley affiliates during the period. The effect of the rebate on the ratios is disclosed in the above table as "Ratio of Rebate from Morgan Stanley Affiliates."
(8) Effective April 29, 2019, the Adviser has agreed to limit the ratio of expenses to average net assets to the maximum ratio of 0.82% for Class II shares. Prior to April 29, 2019, the maximum ratio was 1.05% for Class II shares.
(9) Amount is less than 0.005%.
The accompanying notes are an integral part of the consolidated financial statements.
9
Morgan Stanley Variable Insurance Fund, Inc.
June 30, 2024 (unaudited)
Notes to Consolidated Financial Statements
Morgan Stanley Variable Insurance Fund, Inc. (the "Company") is registered under the Investment Company Act of 1940, as amended (the "Act"), as an open-end management investment company. The Company is comprised of eight separate active, diversified and non-diversified funds (individually referred to as a "Fund," collectively as the "Funds").
The Company applies investment company accounting and reporting guidance Accounting Standards Codification ("ASC") Topic 946. In the preparation of these financial statements, management has evaluated subsequent events occurring after the date of the Fund's Consolidated Statement of Assets and Liabilities through the date that the financial statements were issued.
The accompanying consolidated financial statements relates to the Growth Portfolio. The Fund seeks long-term capital appreciation by investing primarily in growth-oriented equity securities of large capitalization companies. The Fund has issued two classes of shares — Class I and Class II. Both classes of shares have identical voting rights (except that shareholders of a Class have exclusive voting rights regarding any matter relating solely to that Class of shares), dividend, liquidation and other rights.
The Company is intended to be a funding vehicle for variable annuity contracts and variable life insurance policies offered by the separate accounts of certain life insurance companies.
A. Significant Accounting Policies: The following significant accounting policies are in conformity with U.S. generally accepted accounting principles ("GAAP"). Such policies are consistently followed by the Company in the preparation of its consolidated financial statements. GAAP may require management to make estimates and assumptions that affect the reported amounts and disclosures in the consolidated financial statements. Actual results may differ from those estimates.
The Fund may invest up to 25% of its total assets in a wholly-owned subsidiary of the Fund organized as a company under the laws of the Cayman Islands, VIF Growth Cayman Portfolio, Ltd. (the "Subsidiary"). The Subsidiary may invest in bitcoin indirectly through cash settled futures or indirectly through investments in pooled investment vehicles and exchange-traded products that invest in bitcoin ("bitcoin ETFs"). The Fund is the sole shareholder of the Subsidiary, and it is not currently expected that shares of the Subsidiary will be sold or offered to other investors. The consolidated portfolio of investments and consolidated financial statements include the positions and accounts of the Fund and the Subsidiary. All intercompany accounts and transactions of the Fund and the Subsidiary have been eliminated in consolidation and all accounting policies of the Subsidiary are consistent with those of the Fund. As of June 30, 2024, the
Subsidiary represented approximately $12,010,000 or approximately 2.49% of the net assets of the Fund.
Investments in the Subsidiary are expected to provide the Fund with exposure to bitcoin within the limitations of Subchapter M of the Code and recent Internal Revenue Service ("IRS") revenue rulings, which require that a mutual fund receive no more than ten percent of its gross income from such investments in order to receive favorable tax treatment as a regulated investment company ("RIC"). Tax treatment of the income received from the Subsidiary may potentially be affected by changes in legislation, regulations or other legally binding authority, which could affect the character, timing and amount of the Fund's taxable income and distributions. If such changes occur, the Fund may need to significantly change its investment strategy and recognize unrealized gains in order to remain qualified for taxation as a RIC, which could adversely affect the Fund.
1. Security Valuation: (1) An equity portfolio security listed or traded on an exchange is valued at its latest reported sales price (or at the exchange official closing price if such exchange reports an official closing price), and if there were no sales on a given day and if there is no official exchange closing price for that day, the security is valued at the mean between the last reported bid and asked prices if such bid and asked prices are available on the relevant exchanges. If only bid prices are available then the latest bid price may be used. Listed equity securities not traded on the valuation date with no reported bid and asked prices available on the exchange are valued at the mean between the current bid and asked prices obtained from one or more reputable brokers/dealers. In cases where a security is traded on more than one exchange, the security is valued on the exchange designated as the primary market; (2) all other equity portfolio securities for which over-the-counter ("OTC") market quotations are readily available are valued at the latest reported sales price (or at the market official closing price if such market reports an official closing price), and if there was no trading in the security on a given day and if there is no official closing price from relevant markets for that day, the security is valued at the mean between the last reported bid and asked prices if such bid and asked prices are available on the relevant markets. An unlisted equity security that does not trade on the valuation date and for which bid and asked prices from the relevant markets are unavailable is valued at the mean between the current bid and asked prices obtained from one or more reputable brokers/dealers; (3) listed options are valued at the last reported sales price on the exchange on which they are listed (or at the exchange official closing price if such exchange reports an official closing price). If
10
Morgan Stanley Variable Insurance Fund, Inc.
June 30, 2024 (unaudited)
Notes to Consolidated Financial Statements (cont'd)
an official closing price or last reported sales price is unavailable, the listed option should be fair valued at the mean between its latest bid and ask prices. Unlisted options are valued at the mean between their latest bid and ask prices from a reputable broker/dealer or valued by a pricing service/vendor; (4) fixed income securities may be valued by an outside pricing service/vendor approved by the Company's Board of Directors (the "Directors"). The pricing service/vendor may employ a pricing model that takes into account, among other things, bids, yield spreads and/or other market data and specific security characteristics. If Morgan Stanley Investment Management Inc. (the "Adviser"), a wholly-owned subsidiary of Morgan Stanley, determines that the price provided by the outside pricing service/vendor does not reflect the security's fair value or is unable to provide a price, prices from reputable brokers/dealers may also be utilized. In these circumstances, the value of the security will be the mean of bid and asked prices obtained from reputable brokers/dealers; (5) when market quotations are not readily available, as defined by Rule 2a-5 under the Act, including circumstances under which the Adviser determines that the closing price, last sale price or the mean between the last reported bid and asked prices are not reflective of a security's market value, portfolio securities are valued at their fair value as determined in good faith under procedures approved by and under the general supervision of the Directors. Each business day, the Fund uses a third-party pricing service approved by the Directors to assist with the valuation of foreign equity securities. Events occurring after the close of trading on foreign exchanges may result in adjustments to the valuation of foreign securities to reflect market trading that occurs after the close of the applicable foreign markets of comparable securities or other instruments that have a strong correlation to the fair-valued securities to more accurately reflect their fair value as of the close of regular trading on the NYSE; (6) foreign exchange transactions ("spot contracts") and foreign exchange forward contracts ("forward contracts") are valued daily using an independent pricing vendor at the spot and forward rates, respectively, as of the close of the NYSE; and (7) investments in mutual funds, including the Morgan Stanley Institutional Liquidity Funds, are valued at the net asset value ("NAV") as of the close of each business day.
In connection with Rule 2a-5 of the Act, the Directors have designated the Company's Adviser as its valuation designee. The valuation designee has responsibility for determining fair value and to make the actual calculations pursuant to the fair valuation methodologies previously approved by the Directors. Under procedures approved by the Directors, the Company's Adviser, as
valuation designee, has formed a Valuation Committee whose members are approved by the Directors. The Valuation Committee provides administration and oversight of the Company's valuation policies and procedures, which are reviewed at least annually by the Directors. These procedures allow the Company to utilize independent pricing services, quotations from securities and financial instrument dealers and other market sources to determine fair value.
2. Fair Value Measurement: Financial Accounting Standards Board ("FASB") ASC 820, "Fair Value Measurement" ("ASC 820"), defines fair value as the price that would be received to sell an asset or pay to transfer a liability in an orderly transaction between market participants at the measurement date. ASC 820 establishes a three-tier hierarchy to distinguish between (1) inputs that reflect the assumptions market participants would use in valuing an asset or liability developed based on market data obtained from sources independent of the reporting entity (observable inputs); and (2) inputs that reflect the reporting entity's own assumptions about the assumptions market participants would use in valuing an asset or liability developed based on the best information available in the circumstances (unobservable inputs) and to establish classification of fair value measurements for disclosure purposes. Various inputs are used in determining the value of the Fund's investments. The inputs are summarized in the three broad levels listed below:
• Level 1 – unadjusted quoted prices in active markets for identical investments
• Level 2 – other significant observable inputs (including quoted prices for similar investments, interest rates, prepayment speeds, credit risk, etc.)
• Level 3 – significant unobservable inputs including the Fund's own assumptions in determining the fair value of investments. Factors considered in making this determination may include, but are not limited to, information obtained by contacting the issuer, analysts, or the appropriate stock exchange (for exchange-traded securities), analysis of the issuer's financial statements or other available documents and, if necessary, available information concerning other securities in similar circumstances.
The inputs or methodology used for valuing securities are not necessarily an indication of the risk associated with investing in those securities and the determination of the significance of a particular input to the fair value measurement in its entirety requires judgment and considers factors specific to each security.
11
Morgan Stanley Variable Insurance Fund, Inc.
June 30, 2024 (unaudited)
Notes to Consolidated Financial Statements (cont'd)
The following is a summary of the inputs used to value the Fund's investments as of June 30, 2024:
Investment Type | | Level 1
Unadjusted
quoted
prices
(000) | | Level 2
Other
significant
observable
inputs
(000) | | Level 3
Significant
unobservable
inputs
(000) | | Total
(000) | |
Assets: | |
Common Stocks | |
Automobiles | | $ | 28,283 | | | $ | — | | | $ | — | | | $ | 28,283 | | |
Biotechnology | | | 6,222 | | | | — | | | | — | | | | 6,222 | | |
Broadline Retail | | | 25,998 | | | | — | | | | — | | | | 25,998 | | |
Capital Markets | | | 11,513 | | | | — | | | | — | | | | 11,513 | | |
Electronic Equipment,
Instruments &
Components | | | — | | | | — | | | | — | † | | | — | † | |
Entertainment | | | 23,679 | | | | — | | | | — | | | | 23,679 | | |
Financial Services | | | 22,784 | | | | 17,100 | | | | — | | | | 39,884 | | |
Ground Transportation | | | 17,864 | | | | — | | | | — | | | | 17,864 | | |
Health Care Providers &
Services | | | 7,859 | | | | — | | | | — | | | | 7,859 | | |
Health Care Technology | | | 3,001 | | | | — | | | | — | | | | 3,001 | | |
Hotels, Restaurants &
Leisure | | | 56,678 | | | | — | | | | — | | | | 56,678 | | |
Information Technology
Services | | | 92,366 | | | | — | | | | — | | | | 92,366 | | |
Leisure Products | | | 1,547 | | | | — | | | | — | | | | 1,547 | | |
Life Sciences Tools &
Services | | | 1,419 | | | | — | | | | — | | | | 1,419 | | |
Media | | | 36,062 | | | | — | | | | — | | | | 36,062 | | |
Pharmaceuticals | | | 22,118 | | | | — | | | | — | | | | 22,118 | | |
Software | | | 37,541 | | | | — | | | | — | | | | 37,541 | | |
Specialized REITs | | | 4,741 | | | | — | | | | — | | | | 4,741 | | |
Specialty Retail | | | 19,633 | | | | — | | | | — | | | | 19,633 | | |
Total Common Stocks | | | 419,308 | | | | 17,100 | | | | — | † | | | 436,408 | † | |
Preferred Stocks | |
Financial Services | | | — | | | | — | | | | 1,351 | | | | 1,351 | | |
Software | | | — | | | | — | | | | 10,715 | | | | 10,715 | | |
Total Preferred Stocks | | | — | | | | — | | | | 12,066 | | | | 12,066 | | |
Investment Type | | Level 1
Unadjusted
quoted
prices
(000) | | Level 2
Other
significant
observable
inputs
(000) | | Level 3
Significant
unobservable
inputs
(000) | | Total
(000) | |
Investment Company | | $ | 12,012 | | | $ | — | | | $ | — | | | $ | 12,012 | | |
Call Options Purchased | | | — | | | | 476 | | | | — | | | | 476 | | |
Short-Term Investments | |
Investment Company | | | 22,562 | | | | — | | | | — | | | | 22,562 | | |
Repurchase Agreements | | | — | | | | 2 | | | | — | | | | 2 | | |
Total Short-Term
Investments | | | 22,562 | | | | 2 | | | | — | | | | 22,564 | | |
Total Assets | | $ | 453,882 | | | $ | 17,578 | | | $ | 12,066 | † | | $ | 483,526 | † | |
† Includes one or more securities valued at zero.
Transfers between investment levels may occur as the markets fluctuate and/or the availability of data used in an investment's valuation changes.
Following is a reconciliation of investments in which significant unobservable inputs (Level 3) were used in determining fair value:
| | | Common
Stock
(000) | | Preferred
Stocks
(000) | |
Beginning Balance | | $ | — | † | | $ | 11,749 | | |
Purchases | | | — | | | | — | | |
Sales | | | — | | | | — | | |
Transfers in | | | — | | | | — | | |
Transfers out | | | — | | | | — | | |
Corporate actions | | | — | | | | — | | |
Change in unrealized appreciation
(depreciation) | | | — | | | | 317 | | |
Realized gains (losses) | | | — | | | | — | | |
Ending Balance | | $ | — | † | | $ | 12,066 | | |
Net change in unrealized appreciation
(depreciation) from investments still
held as of June 30, 2024 | | $ | — | | | $ | 317 | | |
† Includes a security valued at zero.
12
Morgan Stanley Variable Insurance Fund, Inc.
June 30, 2024 (unaudited)
Notes to Consolidated Financial Statements (cont'd)
The following table presents additional information about valuation techniques and inputs used for investments that are measured at fair value and categorized within Level 3 as of June 30, 2024. Various valuation techniques were used in the valuation of certain investments and weighted based on the level of significance. The Fund calculated the weighted averages of the unobservable inputs relative to each investment's fair value as of June 30, 2024:
| | | Fair Value at
June 30, 2024
(000) | | Valuation
Technique | | Unobservable
Input | | Amount or Range/
Weighted Average* | | Impact to
Valuation from an
Increase in Input** | |
Preferred Stocks | | $ | 12,066 | | | Market Transaction
Method | | Precedent Transaction | | $ | 26.00–$65.00/$60.50 | | | Increase | |
| | | | | Discounted Cash Flow | | Weighted Average
Cost of Capital
Perpetual Growth Rate | | |
14.0%–17.5%/15.0%
3.0%–4.0%/3.5% | | | Decrease
Increase | |
| | | | | Market Comparable
Companies | | Enterprise Value/
Revenue | | |
1.4x–21.9x/13.5x | | | Increase | |
| | | | | | | Discount for Lack of
Marketability | | |
9.0%–11.0%/10.9% | | | Decrease | |
| | | | | Comparable
Transactions | | Enterprise Value/
Revenue | | | 8.5x | | | Increase | |
* Amount is indicative of the weighted average.
** Represents the expected directional change in the fair value of the Level 3 investments that would result from an increase in the corresponding input. A decrease to the unobservable input would have the opposite effect. Significant changes in these inputs could result in significantly higher or lower fair value measurements.
3. Repurchase Agreements: The Fund may enter into repurchase agreements under which the Fund lends cash and takes possession of securities with an agreement that the counterparty will repurchase such securities. In connection with transactions in repurchase agreements, a bank as custodian for the Fund takes possession of the underlying securities which are held as collateral, with a market value at least equal to the amount of the repurchase transaction, including principal and accrued interest. To the extent that any repurchase transaction exceeds one business day, the value of the collateral is marked-to-market on a daily basis to determine that the value of the collateral does not decrease below the repurchase price plus accrued interest as earned. If such a decrease occurs, additional collateral will be requested and, when received, will be added to the account to maintain full collateralization. In the event of default on the obligation to repurchase, the Fund has the right to liquidate the collateral and apply the proceeds in satisfaction of the obligation. In the event of default or bankruptcy by the counterparty to the agreement, realization of the collateral proceeds may be subject to cost and delays. The Fund, along with other affiliated investment companies, may utilize a joint trading account for the purpose of entering into repurchase agreements.
4. Foreign Currency Translation and Foreign Investments: The books and records of the Fund are maintained in U.S. dollars. Foreign currency amounts are translated into U.S. dollars as follows:
— investments, other assets and liabilities at the prevailing rate of exchange on the valuation date;
— investment transactions and investment income at the prevailing rates of exchange on the dates of such transactions.
Although the net assets of the Fund are presented at the foreign exchange rates and market values at the close of the period, the Fund does not isolate that portion of the results of operations arising as a result of changes in the foreign exchange rates from the fluctuations arising from changes in the market prices of securities held at period end. Similarly, the Fund does not isolate the effect of changes in foreign exchange rates from the fluctuations arising from changes in the market prices of securities sold during the period. Accordingly, realized and unrealized foreign currency gains (losses) on investments in securities are included in the reported net realized and unrealized gains (losses) on investment transactions and balances. However, pursuant to U.S. federal income tax regulations, gains and losses from certain foreign currency transactions and the foreign currency portion of gains and losses realized on sales and maturities of foreign denominated debt securities are treated as ordinary income for U.S. federal income tax purposes.
13
Morgan Stanley Variable Insurance Fund, Inc.
June 30, 2024 (unaudited)
Notes to Consolidated Financial Statements (cont'd)
Net realized gains (losses) on foreign currency transactions represent net foreign exchange gains (losses) from foreign currency forward exchange contracts, disposition of foreign currencies, currency gains (losses) realized between the trade and settlement dates on securities transactions, and the difference between the amount of investment income and foreign withholding taxes recorded on the Fund's books and the U.S. dollar equivalent amounts actually received or paid. The change in unrealized currency gains (losses) on foreign currency transactions for the period is reflected in the Consolidated Statement of Operations.
Foreign security and currency transactions may involve certain considerations and risks not typically associated with those of U.S. dollar denominated transactions as a result of, among other factors, fluctuations of exchange rates in relation to the U.S. dollar, the possibility of lower levels of governmental supervision and regulation of foreign securities markets and the possibility of political or economic instability.
Governmental approval for foreign investments may be required in advance of making an investment under certain circumstances in some countries, and the extent of foreign investments in U.S. companies may be subject to limitation in other countries. Foreign ownership limitations also may be imposed by the charters of individual companies to prevent, among other concerns, violations of foreign investment limitations. As a result, an additional class of shares (identified as "Foreign" in the Consolidated Portfolio of Investments) may be created and offered for investment. The "local" and "foreign shares" market values may differ. In the absence of trading of the foreign shares in such markets, the Fund values the foreign shares at the closing exchange price of the local shares.
5. Derivatives: The Fund may, but is not required to, use derivative instruments for a variety of purposes, including hedging, risk management, portfolio management or to earn income. Derivatives are financial instruments whose value is based, in part, on the value of an underlying asset, interest rate, index or financial instrument. Prevailing interest rates and volatility levels, among other things, also affect the value of derivative instruments. A derivative instrument often has risks similar to its underlying asset and may have additional risks, including imperfect correlation between the value of the derivative and the underlying asset, risks of default by the counterparty to certain transactions, magnification of losses incurred due to changes in the market value of the securities, instruments, indices or interest rates to which the derivative
instrument relates, risks that the transactions may not be liquid, risks arising from margin and payment requirements, risks arising from mispricing or valuation complexity and operational and legal risks. The use of derivatives involves risks that are different from, and possibly greater than, the risks associated with other portfolio investments. Derivatives may involve the use of highly specialized instruments that require investment techniques and risk analyses different from those associated with other portfolio investments. All of the Fund's holdings, including derivative instruments, are marked-to-market each day with the change in value reflected in unrealized appreciation (depreciation). Upon disposition, a realized gain or loss is recognized.
Certain derivative transactions may give rise to a form of leverage. Leverage magnifies the potential for gain and the risk of loss. Leverage associated with derivative transactions may cause the Fund to liquidate portfolio positions when it may not be advantageous to do so to satisfy its obligations or may cause the Fund to be more volatile than if the Fund had not been leveraged. Although the Adviser seeks to use derivatives to further the Fund's investment objectives, there is no assurance that the use of derivatives will achieve this result.
Following is a description of the derivative instruments and techniques that the Fund used during the period and their associated risks:
Options: With respect to options, the Fund is subject to equity risk, interest rate risk and foreign currency ex-change risk in the normal course of pursuing its investment objectives. If the Fund buys an option, it buys a legal contract giving it the right to buy or sell a specific amount of the underlying instrument or foreign currency, or futures contract on the underlying instrument or foreign currency, at an agreed-upon price during a period of time or on a specified date typically in exchange for premiums paid by the Fund. The Fund may purchase and/or sell put and call options. Purchasing call options tends to increase the Fund's exposure to the underlying (or similar) instrument. Purchasing put options tends to decrease the Fund's exposure to the underlying (or similar) instrument. When entering into purchased option contracts, the Fund bears the risk of interest or exchange rates or securities prices moving unexpectedly, in which case, the Fund may not achieve the anticipated benefits of the purchased option contracts; however the risk of loss is limited to the premium paid. Purchased options are reported as part of "Total Investments in Securities" in the Consolidated Statement of Assets and Liabilities. Premiums paid for purchasing options which expired are treated as
14
Morgan Stanley Variable Insurance Fund, Inc.
June 30, 2024 (unaudited)
Notes to Consolidated Financial Statements (cont'd)
realized losses. If the Fund sells an option, it sells to another party the right to buy from or sell to the Fund a specific amount of the underlying instrument or foreign currency, or futures contract on the underlying instrument or foreign currency, at an agreed-upon price during a period of time or on a specified date typically in exchange for a premium received by the Fund. When options are purchased OTC, the Fund bears the risk that the counterparty that wrote the option will be unable or unwilling to perform its obligations under the option contract. Options may also be illiquid and the Fund may have difficulty closing out its position. A decision as to whether, when and how to use options involves the exercise of skill and judgment and even a well-conceived option transaction may be unsuccessful because of market behavior or unexpected events. The prices of options can be highly volatile and the use of options can lower total returns.
FASB ASC 815, "Derivatives and Hedging" ("ASC 815"), is intended to improve financial reporting about derivative instruments by requiring enhanced disclosures to enable investors to better understand how and why the Fund uses derivative instruments, how these derivative instruments are accounted for and their effects on the Fund's financial position and results of operations.
The following table sets forth the fair value of the Fund's derivative contracts by primary risk exposure as of June 30, 2024:
| | | Asset Derivatives
Consolidated
Statement of Assets
and Liabilities
Location | | Primary Risk
Exposure | | Value
(000) | |
Purchased Options
| | Investments, at Value
(Purchased Options) | | Currency
Risk | | $ | 476 | (a) | |
(a) Amounts are included in Investments in Securities in the Consolidated Statement of Assets and Liabilities.
The following tables set forth by primary risk exposure the Fund's realized gains (losses) and change in unrealized appreciation (depreciation) by type of derivative contract for the six months ended June 30, 2024 in accordance with ASC 815:
Realized Gain (Loss) | |
Primary Risk Exposure | | Derivative
Type | | Value
(000) | |
Currency Risk
| | Investments
(Purchased Options) | | $ | (855 | )(a) | |
(a) Amounts are included in Realized Gain (Loss) on Investments Sold in the Consolidated Statement of Operations.
Change in Unrealized Appreciation (Depreciation) | |
Primary Risk Exposure | | Derivative
Type | | Value
(000) | |
Currency Risk
| | Investments
(Purchased Options) | | $ | 78 | (a) | |
(a) Amounts are included in Change in Unrealized Appreciation (Depreciation) on Investments in the Consolidated Statement of Operations.
At June 30, 2024, the Fund's derivative assets and liabilities are as follows:
Gross Amounts of Assets and Liabilities Presented in the Consolidated Statement of Assets and Liabilities | |
Derivatives | | Assets(b)
(000) | | Liabilities(b)
(000) | |
Purchased Options | | $ | 476 | (a) | | $ | — | | |
(a) Amounts are included in Investments in Securities in the Consolidated Statement of Assets and Liabilities.
(b) Absent an event of default or early termination, OTC derivative assets and liabilities are presented gross and not offset in the Consolidated Statement of Assets and Liabilities.
The Fund typically enters into International Swaps and Derivatives Association, Inc. Master Agreements ("ISDA Master Agreements") or similar master agreements (collectively, "Master Agreements") with its contract counterparties for certain OTC derivatives in order to, among other things, reduce its credit risk to counterparties. ISDA Master Agreements include provisions for general obligations, representations, collateral and events of default or termination. Under an ISDA Master Agreement, the Fund typically may offset with the counterparty certain OTC derivative financial instruments' payables and/or receivables with collateral held and/or posted and create one single net payment (close-out netting) in the event of default, termination and/or potential deterioration in the credit quality of the counterparty. Various Master Agreements govern the terms of certain transactions with counterparties, including transactions such as swap, forward, repurchase and reverse repurchase agreements. These Master Agreements typically attempt to reduce the counterparty risk associated with such transactions by specifying credit protection mechanisms and providing standardization that improves legal certainty. Cross-termination provisions under Master Agreements typically provide that a default in connection with one transaction between the Fund and a counterparty gives the non-defaulting party the right to terminate any other transactions in place with the defaulting party to create one single net payment due to/due from the defaulting party and may be a feature in certain Master Agreements. In the event the Fund exercises its right to terminate a Master Agreement after a counterparty experiences a termination event as defined in the Master
15
Morgan Stanley Variable Insurance Fund, Inc.
June 30, 2024 (unaudited)
Notes to Consolidated Financial Statements (cont'd)
Agreement, the return of collateral with market value in excess of the Fund's net liability may be delayed or denied.
The following table presents derivative financial instruments that are subject to enforceable netting arrangements as of June 30, 2024:
Gross Amounts Not Offset in the Consolidated Statement of
Assets and Liabilities | |
Counterparty | | Gross Asset
Derivatives
Presented
in the
Consolidated
Statement of
Assets and
Liabilities(a)
(000) | | Financial
Instrument
(000) | | Collateral
Received(b)
(000) | | Net
Amount
(not less
than $0)
(000) | |
Goldman Sachs
International | | $ | 208 | | | $ | — | | | $ | (208 | ) | | $ | 0 | | |
JPMorgan
Chase Bank NA | | | 268 | | | | — | | | | (268 | ) | | | 0 | | |
Total | | $ | 476 | | | $ | — | | | $ | (476 | ) | | $ | 0 | | |
(a) Amounts are included in Investments in Securities in the Consolidated Statement of Assets and Liabilities.
(b) In some instances, the actual collateral received may be more than the amount shown here due to overcollateralization.
For the six months ended June 30, 2024, the approximate average monthly amount outstanding for each derivative type is as follows:
Purchased Options: | |
Average monthly notional amount | | | 397,897,000 | | |
6. Securities Lending: The Fund lends securities to qualified financial institutions, such as broker/dealers, to earn additional income. Any increase or decrease in the fair value of the securities loaned that might occur and any interest earned or dividends declared on those securities during the term of the loan would remain in the Fund. The Fund would receive cash or securities as collateral in an amount equal to or exceeding 100% of the current fair value of the loaned securities. The collateral is marked-to-market daily by State Street Bank and Trust Company ("State Street"), the securities lending agent, to ensure that a minimum of 100% collateral coverage is maintained.
Based on pre-established guidelines, the securities lending agent invests any cash collateral that is received in an affiliated money market portfolio and repurchase agreements. Securities lending income is generated from the earnings on the invested collateral and borrowing fees, less any rebates owed to the borrowers and compensation to the lending agent, and is recorded as "Income from Securities Loaned — Net" in the Fund's Consolidated Statement of Operations. Risks in securities lending
transactions are that a borrower may not provide additional collateral when required or return the securities when due, and that the value of the short-term investments will be less than the amount of cash collateral plus any rebate that is required to be returned to the borrower.
The Fund has the right under the securities lending agreement to recover the securities from the borrower on demand.
The following table presents financial instruments that are subject to enforceable netting arrangements as of June 30, 2024:
Gross Amount Not Offset in the Consolidated Statement of
Assets and Liabilities | |
Gross Asset
Amount
Presented
in the
Consolidated
Statement of
Assets and
Liabilities
(000) | | Financial
Instrument
(000) | | Collateral
Received
(000) | | Net Amount
(not less
than $0)
(000) | |
| $ | 6 | (a) | | $ | — | | | $ | (6 | )(b)(c) | | $ | 0 | | |
(a) Represents market value of loaned securities at period end.
(b) The Fund received cash collateral of approximately $7,000, which was subsequently invested in Repurchase Agreements and Morgan Stanley Institutional Liquidity Fund as reported in the Consolidated Portfolio of Investments.
(c) The actual collateral received is greater than the amount shown here due to overcollateralization.
FASB ASC 860, "Transfers & Servicing: Repurchase-to-Maturity Transactions, Repurchase Financings, and Disclosures", is intended to provide increased transparency about the types of collateral pledged in securities lending transactions and other similar transactions that are accounted for as secured borrowings.
The following table displays a breakdown of transactions accounted for as secured borrowings, the gross obligations by class of collateral pledged and the remaining contractual maturity of those transactions as of June 30, 2024:
Remaining Contractual Maturity of the Agreements | |
| | | Overnight and
Continuous
(000) | | <30 days
(000) | | Between
30 &
90 days
(000) | | >90 Days
(000) | | Total
(000) | |
Securities Lending
Transactions | |
Common Stocks | | $ | 7 | | | $ | — | | | $ | — | | | $ | — | | | $ | 7 | | |
Total Borrowings | | $ | 7 | | | $ | — | | | $ | — | | | $ | — | | | $ | 7 | | |
Gross amount of
recognized liabilities
for securities lending
transactions | | $ | 7 | | |
16
Morgan Stanley Variable Insurance Fund, Inc.
June 30, 2024 (unaudited)
Notes to Consolidated Financial Statements (cont'd)
7. Restricted Securities: The Fund invests in unregistered or otherwise restricted securities. The term "restricted securities" refers to securities that are unregistered or are held by control persons of the issuer and securities that are subject to contractual restrictions on their resale. As a result, restricted securities may be more difficult to value and the Fund may have difficulty disposing of such assets either in a timely manner or for a reasonable price. In order to dispose of an unregistered security, the Fund, where it has contractual rights to do so, may have to cause such security to be registered. A considerable period may elapse between the time the decision is made to sell the security and the time the security is registered so that the Fund can sell it. Contractual restrictions on the resale of securities vary in length and scope and are generally the result of a negotiation between the issuer and the acquirer of the securities. The Fund would, in either case, bear market risks during that period. Restricted securities are identified in the Consolidated Portfolio of Investments.
8. Indemnifications: The Company enters into contracts that contain a variety of indemnification clauses. The Company's maximum exposure under these arrangements is unknown as this would involve future claims that may be made against the Fund that have not yet occurred.
9. Security Transactions, Income and Expenses: Security transactions are accounted for on the trade date (date the order to buy or sell is executed). Realized gains and losses on the sale of investment securities are determined on the specific identified cost method. Dividend income and other distributions are recorded on the ex-dividend date (except for certain foreign dividends which may be recorded as soon as the Fund is informed of such dividends) net of applicable withholding taxes. Non-cash dividends received in the form of stock, if any, are recognized on the ex-dividend date and recorded as non-cash dividend income at fair value. Interest income is recognized on the accrual basis (except where collection is in doubt) net of applicable withholding taxes. Discounts are accreted and premiums are amortized over the life of the respective securities. Most expenses of the Company can be directly attributed to a particular Fund. Expenses which cannot be directly attributed are apportioned among the Funds based upon relative net assets or other appropriate methods. Income, expenses (other than class specific expenses) and realized and unrealized gains or losses are allocated to each class of shares based upon their relative net assets.
10. Dividends and Distributions to Shareholders: Dividends and distributions to shareholders are recorded on the ex-dividend date. Dividends from net investment income, if any, are declared and paid annually. Net realized capital gains, if any, are distributed at least annually.
B. Advisory Fees: The Adviser, a wholly-owned subsidiary of Morgan Stanley, provides the Fund with advisory services under the terms of an Investment Advisory Agreement, paid quarterly, at the annual rate based on the daily net assets as follows:
First $1
billion | | Next $1
billion | | Next $1
billion | | Over $3
billion | |
| | 0.50 | % | | | 0.45 | % | | | 0.40 | % | | | 0.35 | % | |
For the six months ended June 30, 2024, the advisory fee rate (net of waiver/rebate) was equivalent to an annual effective rate of 0.29% of the Fund's average daily net assets.
The Adviser has agreed to reduce its advisory fee and/or reimburse the Fund so that total annual Fund operating expenses, excluding certain investment related expenses, taxes, interest and other extraordinary expenses (including litigation), will not exceed 0.57% for Class I shares and 0.82% for Class II shares. The fee waivers and/or expense reimbursements will continue for at least one year from the date of the Fund's prospectus or until such time as the Directors act to discontinue all or a portion of such waivers and/or reimbursements when they deem such action is appropriate. For the six months ended June 30, 2024, approximately $515,000 of advisory fees were waived pursuant to this arrangement.
The Adviser provides investment advisory services to the Subsidiary pursuant to the Subsidiary Investment Management Agreement (the "Agreement"). Under the Agreement, the Subsidiary will pay the Adviser at the end of each fiscal quarter, calculated by applying a quarterly rate, based on the annual rate of 0.05%, to the average daily net assets of the Subsidiary.
The Adviser has agreed to waive its advisory fees by the amount of advisory fees it receives from the Subsidiary.
C. Administration Fees: The Adviser also serves as Administrator to the Company and provides administrative services pursuant to an Administration Agreement for an annual fee, accrued daily and paid monthly, of 0.08% of the Fund's average daily net assets.
Under a Sub-Administration Agreement between the Administrator and State Street, State Street provides certain administrative services to the Company. For such services, the Administrator pays State Street a portion of the fee the Administrator receives from the Fund.
17
Morgan Stanley Variable Insurance Fund, Inc.
June 30, 2024 (unaudited)
Notes to Consolidated Financial Statements (cont'd)
D. Servicing Fees: The Company accrues daily and pays quarterly a servicing fee of up to 0.17% of the average daily value of shares of the Fund held in an insurance company's account. Certain insurance companies have entered into a servicing agreement with the Company to provide administrative and other contract-owner related services on behalf of the Fund.
E. Distribution Fees: Morgan Stanley Distribution, Inc. ("MSDI" or the "Distributor"), a wholly-owned subsidiary of the Adviser and an indirect subsidiary of Morgan Stanley, serves as the Distributor of the Fund and provides the Fund's Class II shareholders with distribution services pursuant to a Distribution Plan (the "Plan") in accordance with Rule 12b-1 under the Act. Under the Plan, the Fund is authorized to pay the Distributor a distribution fee, which is accrued daily and paid monthly, at an annual rate of 0.25% of the Fund's average daily net assets attributable to Class II shares.
F. Dividend Disbursing and Transfer/Co-Transfer Agent: The Company's dividend disbursing and transfer agent is SS&C Global Investor & Distribution Solutions, Inc. ("SS&C GIDS"). Pursuant to a Transfer Agency Agreement, the Company pays SS&C GIDS a fee based on the number of classes, accounts and transactions relating to the Funds of the Company.
Eaton Vance Management ("EVM"), an affiliate of Morgan Stanley, provides co-transfer agency and related services to the Fund pursuant to a Co-Transfer Agency Services Agreement. For the six months ended June 30, 2024, co-transfer agency fees and expenses incurred to EVM, included in "Transfer Agency Fees" in the Consolidated Statement of Operations, amounted to less than $500.
G. Custodian Fees: State Street (the "Custodian") also serves as Custodian for the Company in accordance with a Custodian Agreement. The Custodian holds cash, securities and other assets of the Company as required by the Act. Custody fees are payable monthly based on assets held in custody, investment purchases and sales activity and account maintenance fees, plus reimbursement for certain out-of-pocket expenses.
H. Security Transactions and Transactions with Affiliates: For the six months ended June 30, 2024, purchases and sales of investment securities for the Fund, other than long-term U.S. Government securities and short-term investments were approximately $85,279,000 and $133,453,000, respectively. There were no purchases and sales of long-term U.S. Government securities for the six months ended June 30, 2024.
The Fund invests in the Institutional Class of the Morgan Stanley Institutional Liquidity Funds — Treasury Securities
Portfolio (the "Liquidity Fund"), an open-end management investment company managed by the Adviser, both directly and as a portion of the securities held as collateral on loaned securities. Advisory fees paid by the Fund are reduced by an amount equal to its pro-rata share of the advisory and administration fees paid by the Fund due to its investment in the Liquidity Fund. For the six months ended June 30, 2024, advisory fees paid were reduced by approximately $14,000 relating to the Fund's investment in the Liquidity Fund.
A summary of the Fund's transactions in shares of affiliated investments during the six months ended June 30, 2024 is as follows:
Affiliated
Investment
Company | | Value
December 31,
2023
(000) | | Purchases
at Cost
(000) | | Proceeds
from Sales
(000) | | Dividend
Income
(000) | |
Liquidity Fund | | $ | 12,335 | | | $ | 84,612 | | | $ | 74,385 | | | $ | 382 | | |
Affiliated
Investment
Company (cont'd) | | Realized
Gain (Loss)
(000) | | Change in
Unrealized
Appreciation
(Depreciation)
(000) | | Value
June 30,
2024
(000) | |
Liquidity Fund | | $ | — | | | $ | — | | | $ | 22,562 | | |
The Fund is permitted to purchase and sell securities ("cross-trade") from and to other Morgan Stanley funds as well as other funds and client accounts for which the Adviser or an affiliate of the Adviser serves as investment adviser, pursuant to procedures approved by the Directors in compliance with Rule 17a-7 under the Act (the "Rule"). Each cross-trade is executed at the current market price in compliance with provisions of the Rule. For the six months ended June 30, 2024, the Fund did not engage in any cross-trade transactions.
Each Director receives an annual retainer fee for serving as a Director of the Morgan Stanley Funds. The aggregate compensation paid to each Director is paid by the Morgan Stanley Funds, and is allocated on a pro rata basis among each of the operational funds of the Morgan Stanley Funds based on the relative net assets of each of the funds. The Company also reimburses such Directors for travel and other out-of-pocket expenses incurred by them in connection with attending such meetings.
The Fund has an unfunded Deferred Compensation Plan (the "Compensation Plan"), which allows each independent Director to defer payment of all, or a portion, of the fees he or she receives for serving on the Board of Directors. Each eligible Director generally may elect to have the deferred amounts credited with a return equal to the total return on one or more of the Morgan Stanley funds that are offered as investment options under the Compensation Plan. Appreciation/depreciation and distributions received from these
18
Morgan Stanley Variable Insurance Fund, Inc.
June 30, 2024 (unaudited)
Notes to Consolidated Financial Statements (cont'd)
investments are recorded with an offsetting increase/decrease in the deferred compensation obligation and do not affect the NAV of the Fund.
I. Federal Income Taxes: It is the Fund's intention to continue to qualify as a RIC and distribute all of its taxable and tax-exempt income. Accordingly, no provision for federal income taxes is required in the consolidated financial statements.
The Fund may be subject to taxes imposed by countries in which it invests. Such taxes are generally based on income and/or capital gains earned or repatriated. Taxes are accrued based on net investment income, net realized gains and net unrealized appreciation as such income and/or gains are earned. Taxes may also be based on transactions in foreign currency and are accrued based on the value of investments denominated in such currency.
FASB ASC 740-10, "Income Taxes — Overall", sets forth a minimum threshold for consolidated financial statement recognition of the benefit of a tax position taken or expected to be taken in a tax return. Management has concluded there are no significant uncertain tax positions that would require recognition in the consolidated financial statements. If applicable, the Fund recognizes interest accrued related to unrecognized tax benefits in "Interest Expense" and penalties in "Other Expenses" in the Consolidated Statement of Operations. The Fund files tax returns with the U.S. Internal Revenue Service, New York and various states. Generally, each of the tax years in the four-year period ended December 31, 2023 remains subject to examination by taxing authorities.
The tax character of distributions paid may differ from the character of distributions shown for GAAP purposes due to short-term capital gains being treated as ordinary income for tax purposes. The tax character of distributions paid during fiscal years 2023 and 2022 was as follows:
2023 Distributions
Paid From: | | 2022 Distributions
Paid From: | |
Ordinary
Income
(000) | | Long-Term
Capital Gain
(000) | | Ordinary
Income
(000) | | Long-Term
Capital Gain
(000) | |
| $ | — | | | $ | — | | | $ | 9,134 | | | $ | 272,400 | | |
The amount and character of income and gains to be distributed are determined in accordance with income tax regulations which may differ from GAAP. These book/tax differences are either considered temporary or permanent in nature.
Temporary differences are attributable to differing book and tax treatments for the timing of the recognition of gains (losses) on certain investment transactions and the timing of the deductibility of certain expenses.
Permanent differences, due to a net operating loss, resulted in the following reclassifications among the components of net assets at December 31, 2023:
Total
Accumulated
Loss
(000) | | Paid-in-
Capital
(000) | |
| $ | 2,707 | | | $ | (2,707 | ) | |
At December 31, 2023, the Fund had no distributable earnings on a tax basis.
At December 31, 2023, the Fund had available for federal income tax purposes unused short-term and long-term capital losses of approximately $52,382,000 and $114,871,000, respectively, that do not have an expiration date.
To the extent that capital loss carryforwards are used to offset any future capital gains realized, no capital gains tax liability will be incurred by the Fund for gains realized and not distributed. To the extent that capital gains are offset, such gains will not be distributed to the shareholders.
J. Credit Facility: The Company and other Morgan Stanley funds participated in a $500,000,000 committed, unsecured revolving line of credit facility (the "Facility") with State Street. This Facility is to be used for temporary emergency purposes or funding of shareholder redemption requests. The interest rate for any funds drawn will be based on the federal funds rate or overnight bank funding rate plus a spread. The Facility also has a commitment fee of 0.25% per annum based on the unused portion of the Facility, which is allocated among participating funds based on relative net assets. During the six months ended June 30, 2024, the Fund did not have any borrowings under the Facility.
K. Other: At June 30, 2024, the Fund had record owners of 10% or greater. Investment activities of these shareholders could have a material impact on the Fund. The aggregate percentage of such owners was 84.4%.
L. Market Risk and Risks Relating to Certain Financial Instruments:
Bitcoin: The Fund may have exposure to cryptocurrencies indirectly through cash settled futures bitcoin exposure or indirectly through bitcoin ETFs. Cryptocurrencies (also referred to as "virtual currencies" and "digital currencies") are digital assets designed to act as a medium of exchange. Although cryptocurrency is an emerging asset class, there are thousands of cryptocurrencies, the most well-known of which is bitcoin. Cryptocurrency facilitates decentralized, peer-to-peer financial exchange and value storage that is used like money, without the oversight of a central authority or banks. The value of cryptocurrency is not backed by any government, corporation, or other identified body. Similar to fiat currencies (i.e., a
19
Morgan Stanley Variable Insurance Fund, Inc.
June 30, 2024 (unaudited)
Notes to Consolidated Financial Statements (cont'd)
currency that is backed by a central bank or a national, supra-national or quasi-national organization), cryptocurrencies are susceptible to theft, loss and destruction. For example, the bitcoin held by bitcoin ETFs (and the Fund's indirect exposure to such bitcoin) is also susceptible to these risks. The value of the bitcoin ETFs investments in cryptocurrency is subject to fluctuations in the value of the cryptocurrency, which have been and may in the future be highly volatile and subject to sharp declines. The value of cryptocurrencies is determined by the supply and demand for cryptocurrency in the global market for the trading of cryptocurrency, which consists primarily of transactions on electronic exchanges. The price of bitcoin could drop precipitously (including to zero) for a variety of reasons, including, but not limited to, regulatory changes, a crisis of confidence, flaw or operational issue in the bitcoin network or a change in user preference to competing cryptocurrencies. The Bitcoin ETF exposure could result in substantial losses to the Fund.
Market: The value of an investment in the Fund is based on the values of the Fund's investments, which change due to economic and other events that affect markets generally, as well as those that affect particular regions, countries, industries, companies or governments. The risks associated with these developments may be magnified if certain social, political, economic and other conditions and events adversely interrupt the global economy and financial markets. Securities in the Fund's portfolio may underperform due to inflation (or expectations for inflation), interest rates, global demand for particular products or resources, natural disasters and extreme weather events, health emergencies (such as epidemics and pandemics), terrorism, regulatory events and governmental or quasi-governmental actions. The occurrence of global events similar to those in recent years, such as terrorist attacks around the world, natural disasters, health emergencies, social and political (including geopolitical) discord and tensions or debt crises and downgrades, among others, may result in market volatility and may have long term effects on both the U.S. and global financial markets. The occurrence of such events may be sudden and unexpected, and it is difficult to predict when similar events affecting the U.S. or global financial markets may occur, the effects that such events may have and the duration of those effects (which may last for extended periods). Any such event(s) could have a significant adverse impact on the value, liquidity and risk profile of the Fund's portfolio, as well as its ability to sell securities and/or meet redemptions. Any such event(s) or similar types of factors and
developments may also adversely affect the financial performance of the Fund's investments (and, in turn, the Fund's investment results) and/or negatively impact broad segments of businesses and populations and have a significant and rapid negative impact on the performance of the Fund's investments, and exacerbate preexisting risks to the Fund.
20
Morgan Stanley Variable Insurance Fund, Inc.
June 30, 2024 (unaudited)
Investment Advisory Agreement Approval
Nature, Extent and Quality of Services
The Board reviewed and considered the nature and extent of the investment advisory services provided by the Adviser under the advisory agreement, including portfolio management, investment research and equity and fixed income securities trading. The Board also reviewed and considered the nature and extent of the non-advisory, administrative services provided by the Administrator under the administration agreement, including accounting, operations, clerical, bookkeeping, compliance, business management and planning, legal services and the provision of supplies, office space and utilities at the Adviser's expense. The Board also considered the Adviser's investment in personnel and infrastructure that benefits the Fund. (The Adviser and Administrator together are referred to as the "Adviser" and the advisory and administration agreements together are referred to as the "Management Agreement.") The Board also considered that the Adviser serves a variety of other investment advisory clients and has experience overseeing service providers. The Board also compared the nature of the services provided by the Adviser with similar services provided by non-affiliated advisers as prepared by Broadridge Financial Solutions, Inc. ("Broadridge").
The Board reviewed and considered the qualifications of the portfolio managers, the senior administrative managers and other key personnel of the Adviser who provide the advisory and administrative services to the Fund. The Board determined that the Adviser's portfolio managers and key personnel are well qualified by education and/or training and experience to perform the services in an efficient and professional manner. The Board concluded that the nature and extent of the advisory and administrative services provided were necessary and appropriate for the conduct of the business and investment activities of the Fund and supported its decision to approve the Management Agreement.
Performance, Fees and Expenses of the Fund
The Board reviewed the performance, fees and expenses of the Fund compared to its peers, as prepared by Broadridge, and to appropriate benchmarks where applicable. The Board discussed with the Adviser the performance goals and the actual results achieved in managing the Fund. When considering a fund's performance, the Board and the Adviser place emphasis on trends and longer-term returns (focusing on one-year, three-year and five-year performance, as of December 31, 2023, or since inception, as applicable). When a fund underperforms its benchmark and/or its peer group average, the Board and the Adviser discuss the causes of such underperformance and, where necessary, they discuss specific changes to investment strategy or investment personnel. The Board noted that the Fund's performance was better than its peer group average for the one-year period and below its peer group average for the three- and five-year periods. The Board discussed with the Adviser the level of the advisory and administration fees (together, the "management fee") for this Fund relative to comparable funds and/or other accounts advised by the Adviser and/or compared to its peers as prepared by Broadridge. In addition to the management fee, the Board also reviewed the Fund's total expense ratio. The Board noted that the Fund's management fee and total expense ratio were lower than its peer group averages. After discussion, the Board concluded that the Fund's (i) performance was acceptable; and (ii) management fee and total expense ratio were competitive with its peer group averages.
Economies of Scale
The Board considered the size and growth prospects of the Fund and how that relates to the Fund's total expense ratio and particularly the Fund's management fee rate, which includes breakpoints. In conjunction with its review of the Adviser's profitability, the Board discussed with the Adviser how a change in assets can affect the efficiency or effectiveness of managing the Fund and whether the management fee level is appropriate relative to current and projected asset levels and/or whether the management fee structure reflects economies of scale as asset levels change. The Board has determined that its review of the actual and/or potential economies of scale of the Fund supports its decision to approve the Management Agreement.
Profitability of the Adviser and Affiliates
The Board considered information concerning the costs incurred and profits realized by the Adviser and its affiliates during the last year from their relationship with the Fund and during the last two years from their relationship with the Morgan Stanley Fund Complex and reviewed with the Adviser the cost allocation methodology used to determine the profitability of the Adviser and affiliates. The Board has determined that its review of the analysis of the Adviser's expenses and profitability supports its decision to approve the Management Agreement.
21
Morgan Stanley Variable Insurance Fund, Inc.
June 30, 2024 (unaudited)
Investment Advisory Agreement Approval (cont'd)
Other Benefits of the Relationship
The Board considered other direct and indirect benefits to the Adviser and/or its affiliates derived from their relationship with the Fund and other funds advised by the Adviser. These benefits may include, among other things, fees for trading, distribution and/or shareholder servicing and for transaction processing and reporting platforms used by securities lending agents, and research received by the Adviser generated from commission dollars spent on funds' portfolio trading. The Board reviewed with the Adviser these arrangements and the reasonableness of the Adviser's costs relative to the services performed. The Board has determined that its review of the other benefits received by the Adviser or its affiliates supports its decision to approve the Management Agreement.
Resources of the Adviser and Historical Relationship Between the Fund and the Adviser
The Board considered whether the Adviser is financially sound and has the resources necessary to perform its obligations under the Management Agreement. The Board also reviewed and considered the historical relationship between the Fund and the Adviser, including the organizational structure of the Adviser, the policies and procedures formulated and adopted by the Adviser for managing the Fund's operations and the Board's confidence in the competence and integrity of the senior managers and key personnel of the Adviser. The Board concluded that the Adviser has the financial resources necessary to fulfill its obligations under the Management Agreement and that it is beneficial for the Fund to continue its relationship with the Adviser.
Other Factors and Current Trends
The Board considered the controls and procedures adopted and implemented by the Adviser and monitored by the Fund's Chief Compliance Officer and concluded that the conduct of business by the Adviser indicates a good faith effort on its part to adhere to high ethical standards in the conduct of the Fund's business.
General Conclusion
After considering and weighing all of the above factors, with various written materials and verbal information presented by the Adviser, the Board concluded that it would be in the best interest of the Fund and its shareholders to approve renewal of the Management Agreement for another year. In reaching this conclusion the Board did not give particular weight to any single piece of information or factor referenced above. The Board considered these factors and information over the course of the year and in numerous meetings, some of which were in executive session with only the independent Board members and their counsel present. It is possible that individual Board members may have weighed these factors, and the information presented, differently in reaching their individual decisions to approve the Management Agreement.
22
Morgan Stanley Variable Insurance Fund, Inc.
June 30, 2024 (unaudited)
This report is not authorized for distribution to prospective investors in the Fund unless preceded or accompanied by an effective Prospectus. Read the Prospectus carefully before investing.

Morgan Stanley Variable Insurance Fund, Inc.
Semi-Annual Financial Statements and Additional Information
June 30, 2024 (unaudited)
U.S. Real Estate Portfolio
The Fund is intended to be a funding vehicle for variable annuity contracts and variable life insurance policies offered by the separate accounts of certain life insurance companies.
Morgan Stanley Variable Insurance Fund, Inc.
June 30, 2024 (unaudited)
1
Morgan Stanley Variable Insurance Fund, Inc.
June 30, 2024 (unaudited)
Portfolio of Investments
U.S. Real Estate Portfolio
| | | Shares | | Value
(000) | |
Common Stocks (98.9%) | |
Apartments (12.8%) | |
AvalonBay Communities, Inc. REIT | | | 78,129 | | | $ | 16,164 | | |
Essex Property Trust, Inc. REIT | | | 35,856 | | | | 9,760 | | |
Mid-America Apartment Communities, Inc. REIT | | | 45,674 | | | | 6,514 | | |
| | | | 32,438 | | |
Data Centers (14.2%) | |
Digital Realty Trust, Inc. REIT | | | 93,558 | | | | 14,226 | | |
Equinix, Inc. REIT | | | 28,511 | | | | 21,571 | | |
| | | | 35,797 | | |
Free Standing (4.6%) | |
Agree Realty Corp. REIT | | | 88,321 | | | | 5,471 | | |
Essential Properties Realty Trust, Inc. REIT | | | 96,243 | | | | 2,667 | | |
NETSTREIT Corp. REIT | | | 74,655 | | | | 1,202 | | |
Realty Income Corp. REIT | | | 44,950 | | | | 2,374 | | |
| | | | 11,714 | | |
Gaming (3.4%) | |
VICI Properties, Inc. REIT | | | 304,369 | | | | 8,717 | | |
Health Care (15.3%) | |
Alexandria Real Estate Equities, Inc. REIT | | | 54,080 | | | | 6,326 | | |
CareTrust REIT, Inc. | | | 225,335 | | | | 5,656 | | |
PACS Group, Inc. (a) | | | 110,015 | | | | 3,245 | | |
Ventas, Inc. REIT | | | 50,054 | | | | 2,566 | | |
Welltower, Inc. REIT | | | 201,599 | | | | 21,017 | | |
| | | | 38,810 | | |
Industrial (12.7%) | |
Americold Realty Trust, Inc. REIT | | | 103,875 | | | | 2,653 | | |
EastGroup Properties, Inc. REIT | | | 29,967 | | | | 5,098 | | |
Prologis, Inc. REIT | | | 166,788 | | | | 18,732 | | |
Rexford Industrial Realty, Inc. REIT | | | 126,963 | | | | 5,661 | | |
| | | | 32,144 | | |
Lodging/Resorts (2.5%) | |
Hilton Worldwide Holdings, Inc. | | | 11,049 | | | | 2,411 | | |
Host Hotels & Resorts, Inc. REIT | | | 221,156 | | | | 3,976 | | |
| | | | 6,387 | | |
Manufactured Homes (2.1%) | |
Sun Communities, Inc. REIT | | | 43,016 | | | | 5,176 | | |
Office (2.4%) | |
Boston Properties, Inc. REIT | | | 61,347 | | | | 3,777 | | |
Kilroy Realty Corp. REIT | | | 71,488 | | | | 2,228 | | |
| | | | 6,005 | | |
Regional Malls (4.8%) | |
Simon Property Group, Inc. REIT | | | 79,680 | | | | 12,095 | | |
Self Storage (9.3%) | |
Extra Space Storage, Inc. REIT | | | 76,058 | | | | 11,820 | | |
Public Storage REIT | | | 41,024 | | | | 11,801 | | |
| | | | 23,621 | | |
| | | Shares | | Value
(000) | |
Shopping Centers (5.3%) | |
Federal Realty Investment Trust REIT | | | 40,709 | | | $ | 4,110 | | |
Kite Realty Group Trust REIT | | | 151,703 | | | | 3,395 | | |
Tanger, Inc. REIT | | | 116,103 | | | | 3,148 | | |
Urban Edge Properties REIT | | | 155,459 | | | | 2,871 | | |
| | | | 13,524 | | |
Single Family Homes (3.9%) | |
American Homes 4 Rent Class A REIT | | | 263,085 | | | | 9,776 | | |
Specialty (5.6%) | |
Iron Mountain, Inc. REIT | | | 113,524 | | | | 10,174 | | |
Lamar Advertising Co. Class A REIT | | | 32,521 | | | | 3,887 | | |
| | | | 14,061 | | |
Total Common Stocks (Cost $214,622) | | | 250,265 | | |
Short-Term Investment (1.0%) | |
Investment Company (1.0%) | |
Morgan Stanley Institutional Liquidity Funds —
Treasury Portfolio — Institutional Class,
5.14% (See Note H) (Cost $2,458) | | | 2,457,597 | | | | 2,458 | | |
Total Investments (99.9%) (Cost $217,080) (b) | | | 252,723 | | |
Other Assets in Excess of Liabilities (0.1%) | | | 337 | | |
Net Assets (100.0%) | | $ | 253,060 | | |
(a) Non-income producing security.
(b) At June 30, 2024, the aggregate cost for federal income tax purposes approximates the aggregate cost for book purposes. The aggregate gross unrealized appreciation is approximately $41,142,000 and the aggregate gross unrealized depreciation is approximately $5,499,000, resulting in net unrealized appreciation of approximately $35,643,000.
REIT Real Estate Investment Trust.
Portfolio Composition
Classification | | Percentage of
Total Investments | |
Other* | | | 24.6 | % | |
Health Care | | | 15.4 | | |
Data Centers | | | 14.2 | | |
Apartments | | | 12.8 | | |
Industrial | | | 12.7 | | |
Self Storage | | | 9.3 | | |
Specialty | | | 5.6 | | |
Shopping Centers | | | 5.4 | | |
Total Investments | | | 100.0 | % | |
* Industries and/or investment types representing less than 5% of total investments.
The accompanying notes are an integral part of the financial statements.
2
Morgan Stanley Variable Insurance Fund, Inc.
June 30, 2024 (unaudited)
U.S. Real Estate Portfolio
Statement of Assets and Liabilities | | June 30, 2024
(000) | |
Assets: | |
Investments in Securities of Unaffiliated Issuers, at Value (Cost $214,622) | | $ | 250,265 | | |
Investment in Security of Affiliated Issuer, at Value (Cost $2,458) | | | 2,458 | | |
Total Investments in Securities, at Value (Cost $217,080) | | | 252,723 | | |
Foreign Currency, at Value (Cost —@) | | | — | @ | |
Dividends Receivable | | | 950 | | |
Receivable for Fund Shares Sold | | | 43 | | |
Receivable from Affiliate | | | 11 | | |
Receivable from Securities Lending Income | | | — | @ | |
Other Assets | | | 24 | | |
Total Assets | | | 253,751 | | |
Liabilities: | |
Payable for Advisory Fees | | | 285 | | |
Payable for Fund Shares Redeemed | | | 209 | | |
Payable for Servicing Fees | | | 86 | | |
Payable for Professional Fees | | | 44 | | |
Payable for Distribution Fees — Class II Shares | | | 23 | | |
Payable for Administration Fees | | | 16 | | |
Payable for Custodian Fees | | | 4 | | |
Payable for Transfer Agency Fees | | | 3 | | |
Other Liabilities | | | 21 | | |
Total Liabilities | | | 691 | | |
NET ASSETS | | $ | 253,060 | | |
Net Assets Consist of: | |
Paid-in-Capital | | $ | 242,512 | | |
Total Distributable Earnings | | | 10,548 | | |
| Net Assets | | $ | 253,060 | | |
CLASS I: | |
Net Assets | | $ | 139,069 | | |
Net Asset Value, Offering and Redemption Price Per Share Applicable to 9,521,302 Outstanding
$0.001 Par Value Shares (Authorized 500,000,000 Shares) | | $ | 14.61 | | |
CLASS II: | |
Net Assets | | $ | 113,991 | | |
Net Asset Value, Offering and Redemption Price Per Share Applicable to 7,868,107 Outstanding
$0.001 Par Value Shares (Authorized 500,000,000 Shares) | | $ | 14.49 | | |
@ Amount is less than $500.
The accompanying notes are an integral part of the financial statements.
3
Morgan Stanley Variable Insurance Fund, Inc.
June 30, 2024 (unaudited)
U.S. Real Estate Portfolio
Statement of Operations | | Six Months Ended
June 30, 2024
(000) | |
Investment Income: | |
Dividends from Securities of Unaffiliated Issuers | | $ | 4,573 | | |
Dividends from Security of Affiliated Issuer (Note H) | | | 65 | | |
Income from Securities Loaned — Net | | | — | @ | |
Total Investment Income | | | 4,638 | | |
Expenses: | |
Advisory Fees (Note B) | | | 682 | | |
Servicing Fees (Note D) | | | 183 | | |
Distribution Fees — Class II Shares (Note E) | | | 139 | | |
Administration Fees (Note C) | | | 99 | | |
Professional Fees | | | 72 | | |
Shareholder Reporting Fees | | | 12 | | |
Transfer Agency Fees (Note F) | | | 9 | | |
Custodian Fees (Note G) | | | 6 | | |
Directors' Fees and Expenses | | | 2 | | |
Pricing Fees | | | 1 | | |
Other Expenses | | | 10 | | |
Total Expenses | | | 1,215 | | |
Waiver of Advisory Fees (Note B) | | | (84 | ) | |
Rebate from Morgan Stanley Affiliate (Note H) | | | (2 | ) | |
Net Expenses | | | 1,129 | | |
Net Investment Income | | | 3,509 | | |
Realized Gain (Loss): | |
Investments Sold | | | (4,333 | ) | |
Foreign Currency Translation | | | — | @ | |
Net Realized Loss | | | (4,333 | ) | |
Change in Unrealized Appreciation (Depreciation): | |
Investments | | | 1,711 | | |
Foreign Currency Translation | | | (— | @) | |
Net Change in Unrealized Appreciation (Depreciation) | | | 1,711 | | |
Net Realized Loss and Change in Unrealized Appreciation (Depreciation) | | | (2,622 | ) | |
Net Increase in Net Assets Resulting from Operations | | $ | 887 | | |
@ Amount is less than $500.
The accompanying notes are an integral part of the financial statements.
4
Morgan Stanley Variable Insurance Fund, Inc.
June 30, 2024
U.S. Real Estate Portfolio
Statements of Changes in Net Assets | | Six Months Ended
June 30, 2024
(unaudited)
(000) | | Year Ended
December 31, 2023
(000) | |
Increase (Decrease) in Net Assets: | |
Operations: | |
Net Investment Income | | $ | 3,509 | | | $ | 6,961 | | |
Net Realized Loss | | | (4,333 | ) | | | (13,063 | ) | |
Net Change in Unrealized Appreciation (Depreciation) | | | 1,711 | | | | 42,459 | | |
Net Increase in Net Assets Resulting from Operations | | | 887 | | | | 36,357 | | |
Dividends and Distributions to Shareholders: | |
Class I | | | — | | | | (3,051 | ) | |
Class II | | | — | | | | (3,071 | ) | |
Total Dividends and Distributions to Shareholders | | | — | | | | (6,122 | ) | |
Capital Share Transactions:(1) | |
Class I: | |
Subscribed | | | 3,816 | | | | 7,883 | | |
Distributions Reinvested | | | — | | | | 3,051 | | |
Redeemed | | | (9,769 | ) | | | (17,846 | ) | |
Class II: | |
Subscribed | | | 3,380 | | | | 6,271 | | |
Distributions Reinvested | | | — | | | | 3,071 | | |
Redeemed | | | (6,817 | ) | | | (61,710 | ) | |
Net Decrease in Net Assets Resulting from Capital Share Transactions | | | (9,390 | ) | | | (59,280 | ) | |
Total Decrease in Net Assets | | | (8,503 | ) | | | (29,045 | ) | |
Net Assets: | |
Beginning of Period | | | 261,563 | | | | 290,608 | | |
End of Period | | $ | 253,060 | | | $ | 261,563 | | |
(1) Capital Share Transactions: | |
Class I: | |
Shares Subscribed | | | 271 | | | | 591 | | |
Shares Issued on Distributions Reinvested | | | — | | | | 223 | | |
Shares Redeemed | | | (688 | ) | | | (1,322 | ) | |
Net Decrease in Class I Shares Outstanding | | | (417 | ) | | | (508 | ) | |
Class II: | |
Shares Subscribed | | | 242 | | | | 476 | | |
Shares Issued on Distributions Reinvested | | | — | | | | 226 | | |
Shares Redeemed | | | (483 | ) | | | (4,622 | ) | |
Net Decrease in Class II Shares Outstanding | | | (241 | ) | | | (3,920 | ) | |
The accompanying notes are an integral part of the financial statements.
5
Morgan Stanley Variable Insurance Fund, Inc.
June 30, 2024
Financial Highlights
U.S. Real Estate Portfolio
| | | Class I | |
| | | Six Months Ended
June 30, 2024 | | Year Ended December 31, | |
Selected Per Share Data and Ratios | | (unaudited) | | 2023 | | 2022 | | 2021 | | 2020 | | 2019 | |
Net Asset Value, Beginning of Period | | $ | 14.54 | | | $ | 12.98 | | | $ | 23.47 | | | $ | 17.13 | | | $ | 21.93 | | | $ | 19.52 | | |
Income (Loss) from Investment Operations: | |
Net Investment Income(1) | | | 0.21 | | | | 0.35 | | | | 0.25 | | | | 0.27 | | | | 0.35 | | | | 0.51 | | |
Net Realized and Unrealized Gain (Loss) | | | (0.14 | ) | | | 1.51 | | | | (6.24 | ) | | | 6.49 | | | | (4.20 | ) | | | 3.15 | | |
Total from Investment Operations | | | 0.07 | | | | 1.86 | | | | (5.99 | ) | | | 6.76 | | | | (3.85 | ) | | | 3.66 | | |
Distributions from and/or in Excess of: | |
Net Investment Income | | | — | | | | (0.30 | ) | | | (0.24 | ) | | | (0.42 | ) | | | (0.48 | ) | | | (0.42 | ) | |
Net Realized Gain | | | — | | | | — | | | | (4.26 | ) | | | — | | | | (0.47 | ) | | | (0.83 | ) | |
Total Distributions | | | — | | | | (0.30 | ) | | | (4.50 | ) | | | (0.42 | ) | | | (0.95 | ) | | | (1.25 | ) | |
Net Asset Value, End of Period | | $ | 14.61 | | | $ | 14.54 | | | $ | 12.98 | | | $ | 23.47 | | | $ | 17.13 | | | $ | 21.93 | | |
Total Return(2) | | | 0.48 | %(3) | | | 14.52 | %(4) | | | (27.05 | )% | | | 39.80 | % | | | (16.85 | )% | | | 18.94 | % | |
Ratios to Average Net Assets and Supplemental Data: | |
Net Assets, End of Period (Thousands) | | $ | 139,069 | | | $ | 144,487 | | | $ | 135,581 | | | $ | 194,007 | | | $ | 169,291 | | | $ | 200,635 | | |
Ratio of Expenses Before Expense Limitation | | | 0.87 | %(5) | | | 1.00 | % | | | 1.01 | % | | | 0.98 | % | | | 0.99 | % | | | 0.97 | % | |
Ratio of Expenses After Expense Limitation | | | 0.80 | %(5)(6) | | | 0.81 | %(6)(7)(8) | | | 0.82 | %(6) | | | 0.82 | %(6) | | | 0.82 | %(6) | | | 0.82 | %(6) | |
Ratio of Net Investment Income | | | 2.94 | %(5)(6) | | | 2.63 | %(6)(8) | | | 1.46 | %(6) | | | 1.36 | %(6) | | | 2.07 | %(6) | | | 2.36 | %(6) | |
Ratio of Rebate from Morgan Stanley Affiliates | | | 0.00 | %(5)(9) | | | 0.00 | %(9) | | | 0.00 | %(9) | | | 0.00 | %(9) | | | 0.00 | %(9) | | | 0.00 | %(9) | |
Portfolio Turnover Rate | | | 23 | %(3) | | | 56 | % | | | 61 | % | | | 129 | % | | | 50 | % | | | 20 | % | |
(1) Per share amount is based on average shares outstanding.
(2) Calculated based on the net asset value as of the last business day of the period. Performance does not reflect fees and expenses imposed by your insurance company's separate account. If performance information included the effect of these additional charges, the total return would be lower.
(3) Not annualized.
(4) Reflects prior period transfer agency fees that were reimbursed in 2023. The amount of the reimbursement was immaterial on a per share basis and the impact was less than 0.005% to the total return of Class I shares.
(5) Annualized.
(6) The Ratio of Expenses After Expense Limitation and Ratio of Net Investment Income reflect the rebate of certain Fund expenses in connection with the investments in Morgan Stanley affiliates during the period. The effect of the rebate on the ratios is disclosed in the above table as "Ratio of Rebate from Morgan Stanley Affiliates."
(7) Effective December 11, 2023, the Adviser has agreed to limit the ratio of expenses to average net assets to the maximum ratio of 0.80% for Class I shares. Prior to December 11, 2023, the maximum ratio was 0.82% for Class I shares.
(8) If the Fund had not received the reimbursement of transfer agency fees from the Adviser, the Ratio of Expenses After Expense Limitation and Ratio of Net Investment Income, would have been as follows for Class I shares:
Period Ended | | Expense
Ratio | | Net Investment
Income Ratio | |
December 31, 2023 | | | 0.82 | % | | | 2.63 | % | |
(9) Amount is less than 0.005%.
The accompanying notes are an integral part of the financial statements.
6
Morgan Stanley Variable Insurance Fund, Inc.
June 30, 2024
Financial Highlights
U.S. Real Estate Portfolio
| | | Class II | |
| | | Six Months Ended
June 30, 2024 | | Year Ended December 31, | |
Selected Per Share Data and Ratios | | (unaudited) | | 2023 | | 2022 | | 2021 | | 2020 | | 2019 | |
Net Asset Value, Beginning of Period | | $ | 14.44 | | | $ | 12.89 | | | $ | 23.32 | | | $ | 17.03 | | | $ | 21.80 | | | $ | 19.40 | | |
Income (Loss) from Investment Operations: | |
Net Investment Income(1) | | | 0.19 | | | | 0.32 | | | | 0.20 | | | | 0.22 | | | | 0.30 | | | | 0.45 | | |
Net Realized and Unrealized Gain (Loss) | | | (0.14 | ) | | | 1.50 | | | | (6.18 | ) | | | 6.44 | | | | (4.17 | ) | | | 3.14 | | |
Total from Investment Operations | | | 0.05 | | | | 1.82 | | | | (5.98 | ) | | | 6.66 | | | | (3.87 | ) | | | 3.59 | | |
Distributions from and/or in Excess of: | |
Net Investment Income | | | — | | | | (0.27 | ) | | | (0.19 | ) | | | (0.37 | ) | | | (0.43 | ) | | | (0.36 | ) | |
Net Realized Gain | | | — | | | | — | | | | (4.26 | ) | | | — | | | | (0.47 | ) | | | (0.83 | ) | |
Total Distributions | | | — | | | | (0.27 | ) | | | (4.45 | ) | | | (0.37 | ) | | | (0.90 | ) | | | (1.19 | ) | |
Net Asset Value, End of Period | | $ | 14.49 | | | $ | 14.44 | | | $ | 12.89 | | | $ | 23.32 | | | $ | 17.03 | | | $ | 21.80 | | |
Total Return(2) | | | 0.35 | %(3) | | | 14.22 | %(4) | | | (27.22 | )% | | | 39.44 | % | | | (17.10 | )% | | | 18.68 | % | |
Ratios to Average Net Assets and Supplemental Data: | |
Net Assets, End of Period (Thousands) | | $ | 113,991 | | | $ | 117,076 | | | $ | 155,027 | | | $ | 222,388 | | | $ | 190,554 | | | $ | 228,085 | | |
Ratio of Expenses Before Expense Limitation | | | 1.12 | %(5) | | | 1.25 | % | | | 1.26 | % | | | 1.23 | % | | | 1.24 | % | | | 1.22 | % | |
Ratio of Expenses After Expense Limitation | | | 1.05 | %(5)(6) | | | 1.06 | %(6)(7)(8) | | | 1.07 | %(6) | | | 1.07 | %(6) | | | 1.07 | %(6) | | | 1.07 | %(6) | |
Ratio of Net Investment Income | | | 2.69 | %(5)(6) | | | 2.38 | %(6)(8) | | | 1.21 | %(6) | | | 1.11 | %(6) | | | 1.82 | %(6) | | | 2.11 | %(6) | |
Ratio of Rebate from Morgan Stanley Affiliates | | | 0.00 | %(5)(9) | | | 0.00 | %(9) | | | 0.00 | %(9) | | | 0.00 | %(9) | | | 0.00 | %(9) | | | 0.00 | %(9) | |
Portfolio Turnover Rate | | | 23 | %(3) | | | 56 | % | | | 61 | % | | | 129 | % | | | 50 | % | | | 20 | % | |
(1) Per share amount is based on average shares outstanding.
(2) Calculated based on the net asset value as of the last business day of the period. Performance does not reflect fees and expenses imposed by your insurance company's separate account. If performance information included the effect of these additional charges, the total return would be lower.
(3) Not annualized.
(4) Reflects prior period transfer agency fees that were reimbursed in 2023. The amount of the reimbursement was immaterial on a per share basis and the impact was less than 0.005% to the total return of Class II shares.
(5) Annualized.
(6) The Ratio of Expenses After Expense Limitation and Ratio of Net Investment Income reflect the rebate of certain Fund expenses in connection with the investments in Morgan Stanley affiliates during the period. The effect of the rebate on the ratios is disclosed in the above table as "Ratio of Rebate from Morgan Stanley Affiliates."
(7) Effective December 11, 2023, the Adviser has agreed to limit the ratio of expenses to average net assets to the maximum ratio of 1.05% for Class II shares. Prior to December 11, 2023, the maximum ratio was 1.07% for Class II shares.
(8) If the Fund had not received the reimbursement of transfer agency fees from the Adviser, the Ratio of Expenses After Expense Limitation and Ratio of Net Investment Income, would have been as follows for Class II shares:
Period Ended | | Expense
Ratio | | Net Investment
Income Ratio | |
December 31, 2023% | | | 1.07 | % | | | 2.38 | % | |
(9) Amount is less than 0.005%.
The accompanying notes are an integral part of the financial statements.
7
Morgan Stanley Variable Insurance Fund, Inc.
June 30, 2024 (unaudited)
Notes to Financial Statements
Morgan Stanley Variable Insurance Fund, Inc. (the "Company") is registered under the Investment Company Act of 1940, as amended (the "Act"), as an open-end management investment company. The Company is comprised of eight separate active, diversified and non-diversified funds (individually referred to as a "Fund," collectively as the "Funds").
The Company applies investment company accounting and reporting guidance Accounting Standards Codification ("ASC") Topic 946. In the preparation of these financial statements, management has evaluated subsequent events occurring after the date of the Fund's Statement of Assets and Liabilities through the date that the financial statements were issued.
The accompanying financial statements relates to the U.S. Real Estate Portfolio. The Fund seeks to provide above average current income and long-term capital appreciation by investing primarily in equity securities of companies in the U.S. real estate industry, including real estate investment trusts ("REITs"). The Fund has issued two classes of shares — Class I and Class II. Both classes of shares have identical voting rights (except that shareholders of a Class have exclusive voting rights regarding any matter relating solely to that Class of shares), dividend, liquidation and other rights.
The Company is intended to be a funding vehicle for variable annuity contracts and variable life insurance policies offered by the separate accounts of certain life insurance companies.
A. Significant Accounting Policies: The following significant accounting policies are in conformity with U.S. generally accepted accounting principles ("GAAP"). Such policies are consistently followed by the Company in the preparation of its financial statements. GAAP may require management to make estimates and assumptions that affect the reported amounts and disclosures in the financial statements. Actual results may differ from those estimates.
1. Security Valuation: (1) An equity portfolio security listed or traded on an exchange is valued at its latest reported sales price (or at the exchange official closing price if such exchange reports an official closing price), and if there were no sales on a given day and if there is no official exchange closing price for that day, the security is valued at the mean between the last reported bid and asked prices if such bid and asked prices are available on the relevant exchanges. If only bid prices are available then the latest bid price may be used. Listed equity securities not traded on the valuation date with no reported bid and asked prices available on the exchange are valued at the mean between the current bid and asked prices obtained from one or more reputable brokers/dealers. In cases where a security is traded on more than one exchange,
the security is valued on the exchange designated as the primary market; (2) all other equity portfolio securities for which over-the-counter ("OTC") market quotations are readily available are valued at the latest reported sales price (or at the market official closing price if such market reports an official closing price), and if there was no trading in the security on a given day and if there is no official closing price from relevant markets for that day, the security is valued at the mean between the last reported bid and asked prices if such bid and asked prices are available on the relevant markets. An unlisted equity security that does not trade on the valuation date and for which bid and asked prices from the relevant markets are unavailable is valued at the mean between the current bid and asked prices obtained from one or more reputable brokers/dealers; (3) fixed income securities may be valued by an outside pricing service/vendor approved by the Company's Board of Directors (the "Directors"). The pricing service/vendor may employ a pricing model that takes into account, among other things, bids, yield spreads and/or other market data and specific security characteristics. If Morgan Stanley Investment Management Inc. (the "Adviser"), a wholly-owned subsidiary of Morgan Stanley, determines that the price provided by the outside pricing service/vendor does not reflect the security's fair value or is unable to provide a price, prices from reputable brokers/dealers may also be utilized. In these circumstances, the value of the security will be the mean of bid and asked prices obtained from reputable brokers/dealers; (4) when market quotations are not readily available, as defined by Rule 2a-5 under the Act, including circumstances under which the Adviser determines that the closing price, last sale price or the mean between the last reported bid and asked prices are not reflective of a security's market value, portfolio securities are valued at their fair value as determined in good faith under procedures approved by and under the general supervision of the Directors. Each business day, the Fund uses a third-party pricing service approved by the Directors to assist with the valuation of foreign equity securities. Events occurring after the close of trading on foreign exchanges may result in adjustments to the valuation of foreign securities to reflect market trading that occurs after the close of the applicable foreign markets of comparable securities or other instruments that have a strong correlation to the fair-valued securities to more accurately reflect their fair value as of the close of regular trading on the NYSE; and (5) investments in mutual funds, including the Morgan Stanley Institutional Liquidity Funds, are valued at the net asset value ("NAV") as of the close of each business day.
8
Morgan Stanley Variable Insurance Fund, Inc.
June 30, 2024 (unaudited)
Notes to Financial Statements (cont'd)
In connection with Rule 2a-5 of the Act, the Directors have designated the Company's Adviser as its valuation designee. The valuation designee has responsibility for determining fair value and to make the actual calculations pursuant to the fair valuation methodologies previously approved by the Directors. Under procedures approved by the Directors, the Company's Adviser, as valuation designee, has formed a Valuation Committee whose members are approved by the Directors. The Valuation Committee provides administration and oversight of the Company's valuation policies and procedures, which are reviewed at least annually by the Directors. These procedures allow the Company to utilize independent pricing services, quotations from securities and financial instrument dealers and other market sources to determine fair value.
The Fund invests a significant portion of its assets in securities of REITs. The market's perception of prospective declines in private real estate values and other financial assets may result in increased volatility of market prices that can negatively impact the valuation of certain issuers held by the Fund.
2. Fair Value Measurement: Financial Accounting Standards Board ("FASB") ASC 820, "Fair Value Measurement" ("ASC 820"), defines fair value as the price that would be received to sell an asset or pay to transfer a liability in an orderly transaction between market participants at the measurement date. ASC 820 establishes a three-tier hierarchy to distinguish between (1) inputs that reflect the assumptions market participants would use in valuing an asset or liability developed based on market data obtained from sources independent of the reporting entity (observable inputs); and (2) inputs that reflect the reporting entity's own assumptions about the assumptions market participants would use in valuing an asset or liability developed based on the best information available in the circumstances (unobservable inputs) and to establish classification of fair value measurements for disclosure purposes. Various inputs are used in determining the value of the Fund's investments. The inputs are summarized in the three broad levels listed below:
• Level 1 – unadjusted quoted prices in active markets for identical investments
• Level 2 – other significant observable inputs (including quoted prices for similar investments, interest rates, prepayment speeds, credit risk, etc.)
• Level 3 – significant unobservable inputs including the Fund's own assumptions in determining the fair value of investments. Factors considered in making
this determination may include, but are not limited to, information obtained by contacting the issuer, analysts, or the appropriate stock exchange (for exchange-traded securities), analysis of the issuer's financial statements or other available documents and, if necessary, available information concerning other securities in similar circumstances.
The inputs or methodology used for valuing securities are not necessarily an indication of the risk associated with investing in those securities and the determination of the significance of a particular input to the fair value measurement in its entirety requires judgment and considers factors specific to each security.
The following is a summary of the inputs used to value the Fund's investments as of June 30, 2024:
Investment Type | | Level 1
Unadjusted
quoted
prices
(000) | | Level 2
Other
significant
observable
inputs
(000) | | Level 3
Significant
unobservable
inputs
(000) | | Total
(000) | |
Assets: | |
Common Stocks | | $ | 250,265 | (1) | | $ | — | | | $ | — | | | $ | 250,265 | | |
Short-Term Investment | |
Investment Company | | | 2,458 | | | | — | | | | — | | | | 2,458 | | |
Total Assets | | $ | 252,723 | | | $ | — | | | $ | — | | | $ | 252,723 | | |
(1) The level classification by major category of investments is the same as the category presentation in the Portfolio of Investments.
Transfers between investment levels may occur as the markets fluctuate and/or the availability of data used inan investment's valuation changes.
3. Foreign Currency Translation and Foreign Investments: The books and records of the Fund are maintained in U.S. dollars. Foreign currency amounts are translated into U.S. dollars as follows:
— investments, other assets and liabilities at the prevailing rate of exchange on the valuation date;
— investment transactions and investment income at the prevailing rates of exchange on the dates of such transactions.
Although the net assets of the Fund are presented at the foreign exchange rates and market values at the close of the period, the Fund does not isolate that portion of the results of operations arising as a result of changes in the foreign exchange rates from the fluctuations arising from changes in the market prices of securities held at period end. Similarly, the Fund does not isolate the effect of changes in foreign exchange rates from the fluctuations arising from changes in the market prices of securities
9
Morgan Stanley Variable Insurance Fund, Inc.
June 30, 2024 (unaudited)
Notes to Financial Statements (cont'd)
sold during the period. Accordingly, realized and unrealized foreign currency gains (losses) on investments in securities are included in the reported net realized and unrealized gains (losses) on investment transactions and balances. However, pursuant to U.S. federal income tax regulations, gains and losses from certain foreign currency transactions and the foreign currency portion of gains and losses realized on sales and maturities of foreign denominated debt securities are treated as ordinary income for U.S. federal income tax purposes.
Net realized gains (losses) on foreign currency transactions represent net foreign exchange gains (losses) from foreign currency forward exchange contracts, disposition of foreign currencies, currency gains (losses) realized between the trade and settlement dates on securities transactions, and the difference between the amount of investment income and foreign withholding taxes recorded on the Fund's books and the U.S. dollar equivalent amounts actually received or paid. The change in unrealized currency gains (losses) on foreign currency transactions for the period is reflected in the Statement of Operations.
Foreign security and currency transactions may involve certain considerations and risks not typically associated with those of U.S. dollar denominated transactions as a result of, among other factors, fluctuations of exchange rates in relation to the U.S. dollar, the possibility of lower levels of governmental supervision and regulation of foreign securities markets and the possibility of political or economic instability.
Governmental approval for foreign investments may be required in advance of making an investment under certain circumstances in some countries, and the extent of foreign investments in U.S. companies may be subject to limitation in other countries. Foreign ownership limitations also may be imposed by the charters of individual companies to prevent, among other concerns, violations of foreign investment limitations. As a result, an additional class of shares (identified as "Foreign" in the Portfolio of Investments) may be created and offered for investment. The "local" and "foreign shares" market values may differ. In the absence of trading of the foreign shares in such markets, the Fund values the foreign shares at the closing exchange price of the local shares.
4. Securities Lending: The Fund lends securities to qualified financial institutions, such as broker/dealers, to earn additional income. Any increase or decrease in the fair value of the securities loaned that might occur and any interest earned or dividends declared on those securi-
ties during the term of the loan would remain in the Fund. The Fund would receive cash or securities as collateral in an amount equal to or exceeding 100% of the current fair value of the loaned securities. The collateral is marked-to-market daily by State Street Bank and Trust Company ("State Street"), the securities lending agent, to ensure that a minimum of 100% collateral coverage is maintained.
Based on pre-established guidelines, the securities lending agent invests any cash collateral that is received in an affiliated money market portfolio and repurchase agreements. Securities lending income is generated from the earnings on the invested collateral and borrowing fees, less any rebates owed to the borrowers and compensation to the lending agent, and is recorded as "Income from Securities Loaned — Net" in the Fund's Statement of Operations. Risks in securities lending transactions are that a borrower may not provide additional collateral when required or return the securities when due, and that the value of the short-term investments will be less than the amount of cash collateral plus any rebate that is required to be returned to the borrower.
The Fund has the right under the securities lending agreement to recover the securities from the borrower on demand.
At June 30, 2024, the Fund did not have any outstanding securities on loan.
5. Indemnifications: The Company enters into contracts that contain a variety of indemnification clauses. The Company's maximum exposure under these arrangements is unknown as this would involve future claims that may be made against the Fund that have not yet occurred.
6. Security Transactions, Income and Expenses: Security transactions are accounted for on the trade date (date the order to buy or sell is executed). Realized gains and losses on the sale of investment securities are determined on the specific identified cost method. Dividend income and other distributions are recorded on the ex-dividend date (except for certain foreign dividends which may be recorded as soon as the Fund is informed of such dividends) net of applicable withholding taxes. Interest income is recognized on the accrual basis (except where collection is in doubt) net of applicable withholding taxes. Discounts are accreted and premiums are amortized over the life of the respective securities. Most expenses of the Company can be directly attributed to a particular Fund. Expenses which cannot be directly attributed are apportioned among the Funds based upon relative net assets or other appropriate methods. Income,
10
Morgan Stanley Variable Insurance Fund, Inc.
June 30, 2024 (unaudited)
Notes to Financial Statements (cont'd)
expenses (other than class specific expenses) and realized and unrealized gains or losses are allocated to each class of shares based upon their relative net assets.
The Fund owns shares of REITs which report information on the source of their distributions annually in the following calendar year. A portion of distributions received from REITs during the year is estimated to be a return of capital and is recorded as a reduction of their cost.
7. Dividends and Distributions to Shareholders: Dividends and distributions to shareholders are recorded on the ex-dividend date. Dividends from net investment income, if any, are declared and paid annually. Net realized capital gains, if any, are distributed at least annually.
B. Advisory Fees: The Adviser, a wholly-owned subsidiary of Morgan Stanley, provides the Fund with advisory services under the terms of an Investment Advisory Agreement, paid quarterly, at the annual rate based on the daily net assets as follows:
First $500
million | | Next $500
million | | Over $1
billion | |
| | 0.55 | % | | | 0.50 | % | | | 0.45 | % | |
For the six months ended June 30, 2024, the advisory fee rate (net of waiver/rebate) was equivalent to an annual effective rate of 0.48% of the Fund's average daily net assets.
The Adviser has agreed to reduce its advisory fee and/or reimburse the Fund so that total annual Fund operating expenses, excluding certain investment related expenses, taxes, interest and other extraordinary expenses (including litigation), will not exceed 0.80% for Class I shares and 1.05% for Class II shares. The fee waivers and/or expense reimbursements will continue for at least one year from the date of the Fund's prospectus or until such time as the Directors act to discontinue all or a portion of such waivers and/or reimbursements when they deem such action is appropriate. For the six months ended June 30, 2024, approximately $84,000 of advisory fees were waived pursuant to this arrangement.
C. Administration Fees: The Adviser also serves as Administrator to the Company and provides administrative services pursuant to an Administration Agreement for an annual fee, accrued daily and paid monthly, of 0.08% of the Fund's average daily net assets.
Under a Sub-Administration Agreement between the Administrator and State Street Bank and Trust Company ("State Street"), State Street provides certain administrative services to the Company. For such services, the Administrator pays State Street a portion of the fee the Administrator receives from the Fund.
D. Servicing Fees: The Company accrues daily and pays quarterly a servicing fee of up to 0.17% of the average daily value of shares of the Fund held in an insurance company's account. Certain insurance companies have entered into a servicing agreement with the Company to provide administrative and other contract-owner related services on behalf of the Fund.
E. Distribution Fees: Morgan Stanley Distribution, Inc. ("MSDI" or the "Distributor"), a wholly-owned subsidiary of the Adviser and an indirect subsidiary of Morgan Stanley, serves as the Distributor of the Fund and provides the Fund's Class II shareholders with distribution services pursuant to a Distribution Plan (the "Plan") in accordance with Rule 12b-1 under the Act. Under the Plan, the Fund is authorized to pay the Distributor a distribution fee, which is accrued daily and paid monthly, at an annual rate of 0.25% of the Fund's average daily net assets attributable to Class II shares.
F. Dividend Disbursing and Transfer/Co-Transfer Agent: The Company's dividend disbursing and transfer agent is SS&C Global Investor & Distribution Solutions, Inc. ("SS&C GIDS"). Pursuant to a Transfer Agency Agreement, the Company pays SS&C GIDS a fee based on the number of classes, accounts and transactions relating to the Funds of the Company.
Eaton Vance Management ("EVM"), an affiliate of Morgan Stanley, provides co-transfer agency and related services to the Fund pursuant to a Co-Transfer Agency Services Agreement. For the six months ended June 30, 2024, co-transfer agency fees and expenses incurred to EVM, included in "Transfer Agency Fees" in the Statement of Operations, amounted to less than $500.
G. Custodian Fees: State Street (the "Custodian") also serves as Custodian for the Company in accordance with a Custodian Agreement. The Custodian holds cash, securities and other assets of the Company as required by the Act. Custody fees are payable monthly based on assets held in custody, investment purchases and sales activity and account maintenance fees, plus reimbursement for certain out-of-pocket expenses.
H. Security Transactions and Transactions with Affiliates: For the six months ended June 30, 2024, purchases and sales of investment securities for the Fund, other than long-term U.S. Government securities and short-term investments were approximately $58,085,000 and $63,171,000, respectively. There were no purchases and sales of long-term U.S. Government securities for the six months ended June 30, 2024.
The Fund invests in the Institutional Class of the Morgan Stanley Institutional Liquidity Funds — Treasury Portfolio
11
Morgan Stanley Variable Insurance Fund, Inc.
June 30, 2024 (unaudited)
Notes to Financial Statements (cont'd)
(the "Liquidity Fund"), an open-end management investment company managed by the Adviser. Advisory fees paid by the Fund are reduced by an amount equal to its pro-rata share of the advisory and administration fees paid by the Fund due to its investment in the Liquidity Fund. For the six months ended June 30, 2024, advisory fees paid were reduced by approximately $2,000 relating to the Fund's investment in the Liquidity Fund.
A summary of the Fund's transactions in shares of affiliated investments during the six months ended June 30, 2024 is as follows:
Affiliated
Investment
Company | | Value
December 31,
2023
(000) | | Purchases
at Cost
(000) | | Proceeds
from Sales
(000) | | Dividend
Income
(000) | |
Liquidity Fund | | $ | 3,193 | | | $ | 20,420 | | | $ | 21,155 | | | $ | 65 | | |
Affiliated
Investment
Company (cont'd) | | Realized
Gain (Loss)
(000) | | Change in
Unrealized
Appreciation
(Depreciation)
(000) | | Value
June 30,
2024
(000) | |
Liquidity Fund | | $ | — | | | $ | — | | | $ | 2,458 | | |
The Fund is permitted to purchase and sell securities ("cross-trade") from and to other Morgan Stanley funds as well as other funds and client accounts for which the Adviser or an affiliate of the Adviser serves as investment adviser, pursuant to procedures approved by the Directors in compliance with Rule 17a-7 under the Act (the "Rule"). Each cross-trade is executed at the current market price in compliance with provisions of the Rule. For the six months ended June 30, 2024, the Fund did not engage in any cross-trade transactions.
Each Director receives an annual retainer fee for serving as a Director of the Morgan Stanley Funds. The aggregate compensation paid to each Director is paid by the Morgan Stanley Funds, and is allocated on a pro rata basis among each of the operational funds of the Morgan Stanley Funds based on the relative net assets of each of the funds. The Company also reimburses such Directors for travel and other out-of-pocket expenses incurred by them in connection with attending such meetings.
The Fund has an unfunded Deferred Compensation Plan (the "Compensation Plan"), which allows each independent Director to defer payment of all, or a portion, of the fees he or she receives for serving on the Board of Directors. Each eligible Director generally may elect to have the deferred amounts credited with a return equal to the total return on one or more of the Morgan Stanley funds that are offered as investment options under the Compensation Plan. Appreciation/depreciation and distributions received from these investments are recorded with an offsetting increase/decrease in the
deferred compensation obligation and do not affect the NAV of the Fund.
I. Federal Income Taxes: It is the Fund's intention to continue to qualify as a regulated investment company and distribute all of its taxable and tax-exempt income. Accordingly, no provision for federal income taxes is required in the financial statements.
The Fund may be subject to taxes imposed by countries in which it invests. Such taxes are generally based on income and/or capital gains earned or repatriated. Taxes are accrued based on net investment income, net realized gains and net unrealized appreciation as such income and/or gains are earned. Taxes may also be based on transactions in foreign currency and are accrued based on the value of investments denominated in such currency.
FASB ASC 740-10, "Income Taxes — Overall", sets forth a minimum threshold for financial statement recognition of the benefit of a tax position taken or expected to be taken in a tax return. Management has concluded there are no significant uncertain tax positions that would require recognition in the financial statements. If applicable, the Fund recognizes interest accrued related to unrecognized tax benefits in "Interest Expense" and penalties in "Other Expenses" in the Statement of Operations. The Fund files tax returns with the U.S. Internal Revenue Service, New York and various states. Generally, each of the tax years in the four-year period ended December 31, 2023 remains subject to examination by taxing authorities.
The tax character of distributions paid may differ from the character of distributions shown for GAAP purposes due to short-term capital gains being treated as ordinary income for tax purposes. The tax character of distributions paid during fiscal years 2023 and 2022 was as follows:
2022 Distributions
Paid From: | | 2021 Distributions
Paid From: | |
Ordinary
Income
(000) | | Long-Term
Capital Gain
(000) | | Ordinary
Income
(000) | | Long-Term
Capital Gain
(000) | |
| $ | 6,122 | | | $ | — | | | $ | 32,241 | | | $ | 43,523 | | |
The amount and character of income and gains to be distributed are determined in accordance with income tax regulations which may differ from GAAP. These book/tax differences are either considered temporary or permanent in nature.
Temporary differences are attributable to differing book and tax treatments for the timing of the recognition of gains (losses) on certain investment transactions and the timing of the deductibility of certain expenses.
12
Morgan Stanley Variable Insurance Fund, Inc.
June 30, 2024 (unaudited)
Notes to Financial Statements (cont'd)
The Fund had no permanent differences causing reclassifications among the components of net assets for the year ended December 31, 2023.
At December 31, 2023, the components of distributable earnings for the Fund on a tax basis were as follows:
Undistributed
Ordinary
Income
(000) | | Undistributed
Long-Term
Capital Gain
(000) | |
| $ | 6,724 | | | $ | — | | |
At December 31, 2023, the Fund had available for federal income tax purposes unused short-term and long-term capital losses of approximately $19,213,000 and $8,091,000, respectively, that do not have an expiration date.
To the extent that capital loss carryforwards are used to offset any future capital gains realized, no capital gains tax liability will be incurred by the Fund for gains realized and not distributed. To the extent that capital gains are offset, such gains will not be distributed to the shareholders.
J. Credit Facility: The Company and other Morgan Stanley funds participated in a $500,000,000 committed, unsecured revolving line of credit facility (the "Facility") with State Street. This Facility is to be used for temporary emergency purposes or funding of shareholder redemption requests. The interest rate for any funds drawn will be based on the federal funds rate or overnight bank funding rate plus a spread. The Facility also has a commitment fee of 0.25% per annum based on the unused portion of the Facility, which is allocated among participating funds based on relative net assets. During the six months ended June 30, 2024, the Fund did not have any borrowings under the Facility.
K. Other: At June 30, 2024, the Fund had record owners of 10% or greater. Investment activities of these shareholders could have a material impact on the Fund. The aggregate percentage of such owners was 72.4%.
L. Market Risk: The value of an investment in the Fund is based on the values of the Fund's investments, which change due to economic and other events that affect markets generally, as well as those that affect particular regions, countries, industries, companies or governments. The risks associated with these developments may be magnified if certain social, political, economic and other conditions and events adversely interrupt the global economy and financial markets. Securities in the Fund's portfolio may underperform due to inflation (or expectations for inflation), interest rates, global demand for particular products or resources, natural disasters and extreme weather events, health emergencies (such as epidemics and pandemics), terrorism, regulatory events and governmental or quasi-governmental actions. The occurrence of global events
similar to those in recent years, such as terrorist attacks around the world, natural disasters, health emergencies, social and political (including geopolitical) discord and tensions or debt crises and downgrades, among others, may result in market volatility and may have long term effects on both the U.S. and global financial markets. The occurrence of such events may be sudden and unexpected, and it is difficult to predict when similar events affecting the U.S. or global financial markets may occur, the effects that such events may have and the duration of those effects (which may last for extended periods). Any such event(s) could have a significant adverse impact on the value, liquidity and risk profile of the Fund's portfolio, as well as its ability to sell securities and/or meet redemptions. Any such event(s) or similar types of factors and developments may also adversely affect the financial performance of the Fund's investments (and, in turn, the Fund's investment results) and/or negatively impact broad segments of businesses and populations and have a significant and rapid negative impact on the performance of the Fund's investments, and exacerbate preexisting risks to the Fund.
13
Morgan Stanley Variable Insurance Fund, Inc.
June 30, 2024 (unaudited)
Investment Advisory Agreement Approval
Nature, Extent and Quality of Services
The Board reviewed and considered the nature and extent of the investment advisory services provided by the Adviser under the advisory agreement, including portfolio management, investment research and equity and fixed income securities trading. The Board also reviewed and considered the nature and extent of the non-advisory, administrative services provided by the Administrator under the administration agreement, including accounting, operations, clerical, bookkeeping, compliance, business management and planning, legal services and the provision of supplies, office space and utilities at the Adviser's expense. The Board also considered the Adviser's investment in personnel and infrastructure that benefits the Fund. (The Adviser and Administrator together are referred to as the "Adviser" and the advisory and administration agreements together are referred to as the "Management Agreement.") The Board also considered that the Adviser serves a variety of other investment advisory clients and has experience overseeing service providers. The Board also compared the nature of the services provided by the Adviser with similar services provided by non-affiliated advisers as prepared by Broadridge Financial Solutions, Inc. ("Broadridge").
The Board reviewed and considered the qualifications of the portfolio managers, the senior administrative managers and other key personnel of the Adviser who provide the advisory and administrative services to the Fund. The Board determined that the Adviser's portfolio managers and key personnel are well qualified by education and/or training and experience to perform the services in an efficient and professional manner. The Board concluded that the nature and extent of the advisory and administrative services provided were necessary and appropriate for the conduct of the business and investment activities of the Fund and supported its decision to approve the Management Agreement.
Performance, Fees and Expenses of the Fund
The Board reviewed the performance, fees and expenses of the Fund compared to its peers, as prepared by Broadridge, and to appropriate benchmarks where applicable. The Board discussed with the Adviser the performance goals and the actual results achieved in managing the Fund. When considering a fund's performance, the Board and the Adviser place emphasis on trends and longer-term returns (focusing on one-year, three-year and five-year performance, as of December 31, 2023, or since inception, as applicable). When a fund underperforms its benchmark and/or its peer group average, the Board and the Adviser discuss the causes of such underperformance and, where necessary, they discuss specific changes to investment strategy or investment personnel. The Board noted that the Fund's performance was better than its peer group average for the one-year period and below its peer group average for the three- and five-year periods. The Board discussed with the Adviser the level of the advisory and administration fees (together, the "management fee") for this Fund relative to comparable funds and/or other accounts advised by the Adviser and/or compared to its peers as prepared by Broadridge. In addition to the management fee, the Board also reviewed the Fund's total expense ratio. The Board noted that the Fund's management fee was lower than its peer group average and the total expense ratio was higher than but close to its peer group average. After discussion, the Board concluded that the Fund's (i) performance was acceptable; and (ii) management fee and total expense ratio were competitive with its peer group averages.
Economies of Scale
The Board considered the size and growth prospects of the Fund and how that relates to the Fund's total expense ratio and particularly the Fund's management fee rate, which includes breakpoints. In conjunction with its review of the Adviser's profitability, the Board discussed with the Adviser how a change in assets can affect the efficiency or effectiveness of managing the Fund and whether the management fee level is appropriate relative to current and projected asset levels and/or whether the management fee structure reflects economies of scale as asset levels change. The Board has determined that its review of the actual and/or potential economies of scale of the Fund supports its decision to approve the Management Agreement.
Profitability of the Adviser and Affiliates
The Board considered information concerning the costs incurred and profits realized by the Adviser and its affiliates during the last year from their relationship with the Fund and during the last two years from their relationship with the Morgan Stanley Fund Complex and reviewed with the Adviser the cost allocation methodology used to determine the profitability of the Adviser
14
Morgan Stanley Variable Insurance Fund, Inc.
June 30, 2024 (unaudited)
Investment Advisory Agreement Approval (cont'd)
and affiliates. The Board has determined that its review of the analysis of the Adviser's expenses and profitability supports its decision to approve the Management Agreement.
Other Benefits of the Relationship
The Board considered other direct and indirect benefits to the Adviser and/or its affiliates derived from their relationship with the Fund and other funds advised by the Adviser. These benefits may include, among other things, fees for trading, distribution and/or shareholder servicing and for transaction processing and reporting platforms used by securities lending agents, and research received by the Adviser generated from commission dollars spent on funds' portfolio trading. The Board reviewed with the Adviser these arrangements and the reasonableness of the Adviser's costs relative to the services performed. The Board has determined that its review of the other benefits received by the Adviser or its affiliates supports its decision to approve the Management Agreement.
Resources of the Adviser and Historical Relationship Between the Fund and the Adviser
The Board considered whether the Adviser is financially sound and has the resources necessary to perform its obligations under the Management Agreement. The Board also reviewed and considered the historical relationship between the Fund and the Adviser, including the organizational structure of the Adviser, the policies and procedures formulated and adopted by the Adviser for managing the Fund's operations and the Board's confidence in the competence and integrity of the senior managers and key personnel of the Adviser. The Board concluded that the Adviser has the financial resources necessary to fulfill its obligations under the Management Agreement and that it is beneficial for the Fund to continue its relationship with the Adviser.
Other Factors and Current Trends
The Board considered the controls and procedures adopted and implemented by the Adviser and monitored by the Fund's Chief Compliance Officer and concluded that the conduct of business by the Adviser indicates a good faith effort on its part to adhere to high ethical standards in the conduct of the Fund's business.
General Conclusion
After considering and weighing all of the above factors, with various written materials and verbal information presented by the Adviser, the Board concluded that it would be in the best interest of the Fund and its shareholders to approve renewal of the Management Agreement for another year. In reaching this conclusion the Board did not give particular weight to any single piece of information or factor referenced above. The Board considered these factors and information over the course of the year and in numerous meetings, some of which were in executive session with only the independent Board members and their counsel present. It is possible that individual Board members may have weighed these factors, and the information presented, differently in reaching their individual decisions to approve the Management Agreement.
15
Morgan Stanley Variable Insurance Fund, Inc.
June 30, 2024 (unaudited)
This report is not authorized for distribution to prospective investors in the Fund unless preceded or accompanied by an effective Prospectus. Read the Prospectus carefully before investing.

Morgan Stanley Variable Insurance Fund, Inc.
Semi-Annual Financial Statements and Additional Information
June 30, 2024 (unaudited)
Global Infrastructure Portfolio
The Fund is intended to be a funding vehicle for variable annuity contracts and variable life insurance policies offered by the separate accounts of certain life insurance companies.
Morgan Stanley Variable Insurance Fund, Inc.
June 30, 2024 (unaudited)
1
Morgan Stanley Variable Insurance Fund, Inc.
June 30, 2024 (unaudited)
Portfolio of Investments
Global Infrastructure Portfolio
| | | Shares | | Value
(000) | |
Common Stocks (98.4%) | |
Australia (0.9%) | |
Transurban Group (Units) (a) | | | 75,129 | | | $ | 620 | | |
Brazil (0.2%) | |
Rumo SA | | | 37,010 | | | | 137 | | |
Canada (19.4%) | |
Canadian National Railway Co. | | | 800 | | | | 95 | | |
Enbridge, Inc. | | | 97,269 | | | | 3,460 | | |
Fortis, Inc. | | | 8,443 | | | | 328 | | |
GFL Environmental, Inc. | | | 96,982 | | | | 3,776 | | |
Keyera Corp. | | | 35,903 | | | | 994 | | |
Pembina Pipeline Corp. | | | 69,989 | | | | 2,597 | | |
TC Energy Corp. (b) | | | 50,046 | | | | 1,897 | | |
| | | | 13,147 | | |
China (0.9%) | |
China Resources Gas Group Ltd. (c) | | | 77,800 | | | | 272 | | |
ENN Energy Holdings Ltd. (c) | | | 40,500 | | | | 334 | | |
| | | | 606 | | |
France (2.7%) | |
Getlink SE | | | 14,487 | | | | 240 | | |
Vinci SA | | | 14,892 | | | | 1,570 | | |
| | | | 1,810 | | |
Hong Kong (0.6%) | |
Power Assets Holdings Ltd. | | | 81,000 | | | | 438 | | |
Italy (2.7%) | |
Infrastrutture Wireless Italiane SpA | | | 38,238 | | | | 398 | | |
Snam SpA (b) | | | 111,523 | | | | 492 | | |
Terna — Rete Elettrica Nazionale | | | 119,048 | | | | 918 | | |
| | | | 1,808 | | |
Japan (1.3%) | |
Central Japan Railway Co. | | | 23,400 | | | | 507 | | |
Tokyo Gas Co. Ltd. | | | 16,200 | | | | 349 | | |
| | | | 856 | | |
Mexico (3.3%) | |
Grupo Aeroportuario del Pacifico SAB de CV,
Class B | | | 142,753 | | | | 2,243 | | |
Spain (7.6%) | |
Aena SME SA | | | 6,999 | | | | 1,417 | | |
Cellnex Telecom SA (d) | | | 44,836 | | | | 1,458 | | |
Ferrovial SE | | | 27,620 | | | | 1,073 | | |
Iberdrola SA | | | 55,166 | | | | 716 | | |
Redeia Corp. SA (b) | | | 28,012 | | | | 490 | | |
| | | | 5,154 | | |
Switzerland (0.9%) | |
Flughafen Zurich AG (Registered) | | | 2,861 | | | | 633 | | |
| | | Shares | | Value
(000) | |
United Kingdom (9.7%) | |
National Grid PLC | | | 467,935 | | | $ | 5,225 | | |
Pennon Group PLC | | | 16,917 | | | | 123 | | |
Severn Trent PLC | | | 29,077 | | | | 875 | | |
United Utilities Group PLC | | | 26,808 | | | | 333 | | |
| | | | 6,556 | | |
United States (48.2%) | |
American Electric Power Co., Inc. | | | 8,098 | | | | 711 | | |
American Tower Corp. REIT | | | 25,367 | | | | 4,930 | | |
American Water Works Co., Inc. | | | 6,163 | | | | 796 | | |
Atmos Energy Corp. | | | 10,246 | | | | 1,195 | | |
CenterPoint Energy, Inc. | | | 54,950 | | | | 1,702 | | |
Cheniere Energy, Inc. | | | 11,221 | | | | 1,962 | | |
CMS Energy Corp. | | | 26,668 | | | | 1,588 | | |
Crown Castle, Inc. REIT | | | 11,242 | | | | 1,098 | | |
Edison International | | | 18,927 | | | | 1,359 | | |
Equinix, Inc. REIT | | | 526 | | | | 398 | | |
Essential Utilities, Inc. | | | 8,713 | | | | 325 | | |
Eversource Energy | | | 9,467 | | | | 537 | | |
Exelon Corp. | | | 40,114 | | | | 1,388 | | |
Kinder Morgan, Inc. | | | 36,939 | | | | 734 | | |
NiSource, Inc. | | | 47,669 | | | | 1,373 | | |
ONEOK, Inc. | | | 34,037 | | | | 2,776 | | |
PG&E Corp. | | | 95,141 | | | | 1,661 | | |
PPL Corp. | | | 15,641 | | | | 433 | | |
SBA Communications Corp. REIT | | | 1,617 | | | | 318 | | |
Sempra | | | 32,631 | | | | 2,482 | | |
Southern Co. | | | 7,182 | | | | 557 | | |
Targa Resources Corp. | | | 19,251 | | | | 2,479 | | |
Williams Cos., Inc. | | | 23,296 | | | | 990 | | |
Xcel Energy, Inc. | | | 16,733 | | | | 894 | | |
| | | | 32,686 | | |
Total Common Stocks (Cost $60,594) | | | 66,694 | | |
Short-Term Investments (4.3%) | |
Investment Company (0.9%) | |
Morgan Stanley Institutional Liquidity
Funds — Treasury Portfolio —
Institutional Class, 5.14% (See Note H)
(Cost $580) | | | 579,654 | | | | 580 | | |
Securities held as Collateral on Loaned Securities (3.4%) | |
Investment Company (2.7%) | |
Morgan Stanley Institutional Liquidity
Funds — Treasury Securities Portfolio —
Institutional Class, 5.14% (See Note H) | | | 1,820,181 | | | | 1,820 | | |
The accompanying notes are an integral part of the financial statements.
2
Morgan Stanley Variable Insurance Fund, Inc.
June 30, 2024 (unaudited)
Portfolio of Investments (cont'd)
Global Infrastructure Portfolio
| | | Face Amount
(000) | | Value
(000) | |
Repurchase Agreements (0.7%) | |
Merrill Lynch & Co., Inc., (5.32%, dated
6/28/24, due 7/1/24; proceeds $347;
fully collateralized by a U.S. Government
obligation; 0.63% due 11/30/27;
valued at $354) | | $ | 347 | | | $ | 347 | | |
Merrill Lynch & Co., Inc., (5.25%, dated
6/28/24, due 7/1/24; proceeds $160;
fully collateralized by a U.S. Government
obligation; 0.63% due 11/30/27;
valued at $163) | | | 160 | | | | 160 | | |
| | | | 507 | | |
Total Securities held as Collateral on
Loaned Securities (Cost $2,327) | | | 2,327 | | |
Total Short-Term Investments (Cost $2,907) | | | 2,907 | | |
Total Investments (102.7%) (Cost $63,501)
including $2,667 of Securities Loaned (e)(f) | | | 69,601 | | |
Liabilities in Excess of Other Assets (–2.7%) | | | (1,829 | ) | |
Net Assets (100.0%) | | $ | 67,772 | | |
Country assignments and aggregations are based generally on third party vendor classifications and information, and may be different from the assignments and aggregations under the policies set forth in the Fund's prospectus and/or statement of additional information relating to geographic classifications.
(a) Consists of one or more classes of securities traded together as a unit; stocks with attached warrants.
(b) All or a portion of this security was on loan at June 30, 2024.
(c) Security trades on the Hong Kong exchange.
(d) Non-income producing security.
(e) The approximate fair value and percentage of net assets, $18,481,000 and 27.3%, respectively, represent the securities that have been fair valued under the fair valuation policy for international investments as described in Note A-1 within the Notes to Financial Statements.
(f) At June 30, 2024, the aggregate cost for federal income tax purposes approximates the aggregate cost for book purposes. The aggregate gross unrealized appreciation is approximately $8,081,000 and the aggregate gross unrealized depreciation is approximately $1,981,000, resulting in net unrealized appreciation of approximately $6,100,000.
REIT Real Estate Investment Trust.
Portfolio Composition*
Classification | | Percentage of
Total Investments | |
Oil & Gas Storage & Transportation | | | 36.2 | % | |
Electricity Transmission & Distribution | | | 17.7 | | |
Communications | | | 12.8 | | |
Others | | | 11.4 | | |
Diversified | | | 8.6 | | |
Other** | | | 6.9 | | |
Airports | | | 6.4 | | |
Total Investments | | | 100.0 | % | |
* Percentages indicated are based upon total investments (excluding Securities held as Collateral on Loaned Securities) as of June 30, 2024.
** Industries and/or investment types representing less than 5% of total investments.
The accompanying notes are an integral part of the financial statements.
3
Morgan Stanley Variable Insurance Fund, Inc.
June 30, 2024 (unaudited)
Global Infrastructure Portfolio
Statement of Assets and Liabilities | | June 30, 2024
(000) | |
Assets: | |
Investments in Securities of Unaffiliated Issuers, at Value(1) (Cost $61,101) | | $ | 67,201 | | |
Investment in Security of Affiliated Issuer, at Value (Cost $2,400) | | | 2,400 | | |
Total Investments in Securities, at Value (Cost $63,501) | | | 69,601 | | |
Foreign Currency, at Value (Cost $102) | | | 102 | | |
Cash | | | 1 | | |
Dividends Receivable | | | 396 | | |
Receivable for Investments Sold | | | 194 | | |
Tax Reclaim Receivable | | | 14 | | |
Receivable from Securities Lending Income | | | 2 | | |
Receivable for Fund Shares Sold | | | 2 | | |
Receivable from Affiliate | | | 2 | | |
Other Assets | | | 11 | | |
Total Assets | | | 70,325 | | |
Liabilities: | |
Collateral on Securities Loaned, at Value | | | 2,327 | | |
Payable for Fund Shares Redeemed | | | 62 | | |
Payable for Professional Fees | | | 54 | | |
Payable for Advisory Fees | | | 43 | | |
Payable for Servicing Fees | | | 41 | | |
Payable for Custodian Fees | | | 9 | | |
Payable for Distribution Fees — Class II Shares | | | 9 | | |
Payable for Administration Fees | | | 4 | | |
Payable for Transfer Agency Fees | | | 1 | | |
Other Liabilities | | | 3 | | |
Total Liabilities | | | 2,553 | | |
NET ASSETS | | $ | 67,772 | | |
Net Assets Consist of: | |
Paid-in-Capital | | $ | 67,160 | | |
Total Distributable Earnings | | | 612 | | |
Net Assets | | $ | 67,772 | | |
CLASS I: | |
Net Assets | | $ | 24,552 | | |
Net Asset Value, Offering and Redemption Price Per Share Applicable to 4,034,769 Outstanding
$0.001 Par Value Shares (Authorized 500,000,000 Shares) | | $ | 6.09 | | |
CLASS II: | |
Net Assets | | $ | 43,220 | | |
Net Asset Value, Offering and Redemption Price Per Share Applicable to 7,188,571 Outstanding
$0.001 Par Value Shares (Authorized 500,000,000 Shares) | | $ | 6.01 | | |
(1) Including: | |
Securities on Loan, at Value: | | $ | 2,667 | | |
The accompanying notes are an integral part of the financial statements.
4
Morgan Stanley Variable Insurance Fund, Inc.
June 30, 2024 (unaudited)
Global Infrastructure Portfolio
Statement of Operations | | Six Months Ended
June 30, 2024
(000) | |
Investment Income: | |
Dividends from Securities of Unaffiliated Issuers (Net of $79 of Foreign Taxes Withheld) | | $ | 1,406 | | |
Dividends from Security of Affiliated Issuer (Note H) | | | 31 | | |
Income from Securities Loaned — Net | | | 11 | | |
Total Investment Income | | | 1,448 | | |
Expenses: | |
Advisory Fees (Note B) | | | 291 | | |
Professional Fees | | | 81 | | |
Distribution Fees — Class II Shares (Note E) | | | 54 | | |
Servicing Fees (Note D) | | | 51 | | |
Administration Fees (Note C) | | | 27 | | |
Custodian Fees (Note G) | | | 19 | | |
Shareholder Reporting Fees | | | 10 | | |
Transfer Agency Fees (Note F) | | | 3 | | |
Pricing Fees | | | 2 | | |
Directors' Fees and Expenses | | | 1 | | |
Other Expenses | | | 6 | | |
Total Expenses | | | 545 | | |
Waiver of Advisory Fees (Note B) | | | (194 | ) | |
Rebate from Morgan Stanley Affiliate (Note H) | | | (1 | ) | |
Net Expenses | | | 350 | | |
Net Investment Income | | | 1,098 | | |
Realized Loss: | |
Investments Sold | | | (2,217 | ) | |
Foreign Currency Translation | | | (9 | ) | |
Net Realized Loss | | | (2,226 | ) | |
Change in Unrealized Appreciation (Depreciation): | |
Investments | | | 656 | | |
Foreign Currency Translation | | | (4 | ) | |
Net Change in Unrealized Appreciation (Depreciation) | | | 652 | | |
Net Realized Loss and Change in Unrealized Appreciation (Depreciation) | | | (1,574 | ) | |
Net Decrease in Net Assets Resulting from Operations | | $ | (476 | ) | |
The accompanying notes are an integral part of the financial statements.
5
Morgan Stanley Variable Insurance Fund, Inc.
June 30, 2024
Global Infrastructure Portfolio
Statements of Changes in Net Assets | | Six Months Ended
June 30, 2024
(unaudited)
(000) | | Year Ended
December 31, 2023
(000) | |
Increase (Decrease) in Net Assets: | |
Operations: | |
Net Investment Income | | $ | 1,098 | | | $ | 1,905 | | |
Net Realized Loss | | | (2,226 | ) | | | (2,029 | ) | |
Net Change in Unrealized Appreciation (Depreciation) | | | 652 | | | | 3,436 | | |
Net Increase (Decrease) in Net Assets Resulting from Operations | | | (476 | ) | | | 3,312 | | |
Dividends and Distributions to Shareholders: | |
Class I | | | — | | | | (4,695 | ) | |
Class II | | | — | | | | (7,601 | ) | |
Total Dividends and Distributions to Shareholders | | | — | | | | (12,296 | ) | |
Capital Share Transactions:(1) | |
Class I: | |
Subscribed | | | 369 | | | | 1,825 | | |
Distributions Reinvested | | | — | | | | 4,695 | | |
Redeemed | | | (3,167 | ) | | | (5,809 | ) | |
Class II: | |
Subscribed | | | 2,428 | | | | 5,947 | | |
Distributions Reinvested | | | — | | | | 7,601 | | |
Redeemed | | | (5,370 | ) | | | (11,686 | ) | |
Net Increase (Decrease) in Net Assets Resulting from Capital Share Transactions | | | (5,740 | ) | | | 2,573 | | |
Total Decrease in Net Assets | | | (6,216 | ) | | | (6,411 | ) | |
Net Assets: | |
Beginning of Period | | | 73,988 | | | | 80,399 | | |
End of Period | | $ | 67,772 | | | $ | 73,988 | | |
(1) Capital Share Transactions: | |
Class I: | |
Shares Subscribed | | | 62 | | | | 274 | | |
Shares Issued on Distributions Reinvested | | | — | | | | 786 | | |
Shares Redeemed | | | (531 | ) | | | (875 | ) | |
Net Increase (Decrease) in Class I Shares Outstanding | | | (469 | ) | | | 185 | | |
Class II: | |
Shares Subscribed | | | 410 | | | | 925 | | |
Shares Issued on Distributions Reinvested | | | — | | | | 1,286 | | |
Shares Redeemed | | | (909 | ) | | | (1,760 | ) | |
Net Increase (Decrease) in Class II Shares Outstanding | | | (499 | ) | | | 451 | | |
The accompanying notes are an integral part of the financial statements.
6
Morgan Stanley Variable Insurance Fund, Inc.
June 30, 2024
Financial Highlights
Global Infrastructure Portfolio
| | | Class I | |
| | | Six Months Ended
June 30, 2024 | | Year Ended December 31, | |
Selected Per Share Data and Ratios | | (unaudited) | | 2023 | | 2022 | | 2021 | | 2020 | | 2019 | |
Net Asset Value, Beginning of Period | | $ | 6.11 | | | $ | 7.00 | | | $ | 8.34 | | | $ | 7.76 | | | $ | 8.12 | | | $ | 6.80 | | |
Income (Loss) from Investment Operations: | |
Net Investment Income(1) | | | 0.10 | | | | 0.17 | | | | 0.18 | | | | 0.17 | | | | 0.15 | | | | 0.20 | | |
Net Realized and Unrealized Gain (Loss) | | | (0.12 | ) | | | 0.12 | | | | (0.84 | ) | | | 0.92 | | | | (0.26 | ) | | | 1.69 | | |
Total from Investment Operations | | | (0.02 | ) | | | 0.29 | | | | (0.66 | ) | | | 1.09 | | | | (0.11 | ) | | | 1.89 | | |
Distributions from and/or in Excess of: | |
Net Investment Income | | | — | | | | (0.18 | ) | | | (0.23 | ) | | | (0.21 | ) | | | (0.13 | ) | | | (0.22 | ) | |
Net Realized Gain | | | — | | | | (1.00 | ) | | | (0.45 | ) | | | (0.30 | ) | | | (0.12 | ) | | | (0.35 | ) | |
Total Distributions | | | — | | | | (1.18 | ) | | | (0.68 | ) | | | (0.51 | ) | | | (0.25 | ) | | | (0.57 | ) | |
Net Asset Value, End of Period | | $ | 6.09 | | | $ | 6.11 | | | $ | 7.00 | | | $ | 8.34 | | | $ | 7.76 | | | $ | 8.12 | | |
Total Return(2) | | | (0.33 | )%(3) | | | 4.55 | %(4) | | | (8.02 | )% | | | 14.26 | % | | | (1.15 | )% | | | 28.30 | % | |
Ratios to Average Net Assets and Supplemental Data: | |
Net Assets, End of Period (Thousands) | | $ | 24,552 | | | $ | 27,517 | | | $ | 30,227 | | | $ | 36,573 | | | $ | 35,868 | | | $ | 42,162 | | |
Ratio of Expenses Before Expense Limitation | | | 1.44 | %(5) | | | 1.40 | % | | | 1.41 | % | | | 1.38 | % | | | 1.36 | % | | | 1.33 | % | |
Ratio of Expenses After Expense Limitation | | | 0.87 | %(5)(6) | | | 0.86 | %(6)(7) | | | 0.88 | %(6)(8) | | | 0.87 | %(6) | | | 0.87 | %(6) | | | 0.87 | %(6) | |
Ratio of Expenses After Expense Limitation Excluding Interest Expenses | | | N/A | | | | N/A | | | | 0.87 | %(6) | | | N/A | | | | N/A | | | | N/A | | |
Ratio of Net Investment Income | | | 3.36 | %(5)(6) | | | 2.66 | %(6)(7) | | | 2.32 | %(6) | | | 2.11 | %(6) | | | 2.06 | %(6) | | | 2.58 | %(6) | |
Ratio of Rebate from Morgan Stanley Affiliates | | | 0.00 | %(5)(9) | | | 0.00 | %(9) | | | 0.00 | %(9) | | | 0.00 | %(9) | | | 0.00 | %(9) | | | 0.00 | %(9) | |
Portfolio Turnover Rate | | | 24 | %(3) | | | 31 | % | | | 89 | % | | | 59 | % | | | 62 | % | | | 30 | % | |
(1) Per share amount is based on average shares outstanding.
(2) Calculated based on the net asset value as of the last business day of the period. Performance does not reflect fees and expenses imposed by your insurance company's separate account. If performance information included the effect of these additional charges, the total return would be lower.
(3) Not annualized.
(4) Reflects prior period transfer agency fees that were reimbursed in 2023. The amount of the reimbursement was immaterial on a per share basis and the impact was less than 0.005% to the total return of Class I shares.
(5) Annualized.
(6) The Ratio of Expenses After Expense Limitation and Ratio of Net Investment Income reflect the rebate of certain Fund expenses in connection with the investments in Morgan Stanley affiliates during the period. The effect of the rebate on the ratios is disclosed in the above table as "Ratio of Rebate from Morgan Stanley Affiliates."
(7) If the Fund had not received the reimbursement of transfer agency fees from the Adviser, the Ratio of Expenses After Expense Limitation and Ratio of Net Investment Income, would have been as follows for Class I shares:
Period Ended | | Expense
Ratio | | Net Investment
Income Ratio | |
December 31, 2023 | | | 0.87 | % | | | 2.65 | % | |
(8) Ratio is above the expense limitation due to interest expenses, which are not included in the determination of the expense limitation. Refer to Footnote B in the Notes to Financial Statements.
(9) Amount is less than 0.005%.
The accompanying notes are an integral part of the financial statements.
7
Morgan Stanley Variable Insurance Fund, Inc.
June 30, 2024
Financial Highlights
Global Infrastructure Portfolio
| | | Class II | |
| | | Six Months Ended
June 30, 2024 | | Year Ended December 31, | |
Selected Per Share Data and Ratios | | (unaudited) | | 2023 | | 2022 | | 2021 | | 2020 | | 2019 | |
Net Asset Value, Beginning of Period | | $ | 6.04 | | | $ | 6.93 | | | $ | 8.27 | | | $ | 7.70 | | | $ | 8.06 | | | $ | 6.76 | | |
Income (Loss) from Investment Operations: | |
Net Investment Income(1) | | | 0.09 | | | | 0.16 | | | | 0.15 | | | | 0.15 | | | | 0.13 | | | | 0.18 | | |
Net Realized and Unrealized Gain (Loss) | | | (0.12 | ) | | | 0.11 | | | | (0.83 | ) | | | 0.92 | | | | (0.26 | ) | | | 1.67 | | |
Total from Investment Operations | | | (0.03 | ) | | | 0.27 | | | | (0.68 | ) | | | 1.07 | | | | (0.13 | ) | | | 1.85 | | |
Distributions from and/or in Excess of: | |
Net Investment Income | | | — | | | | (0.16 | ) | | | (0.21 | ) | | | (0.20 | ) | | | (0.11 | ) | | | (0.20 | ) | |
Net Realized Gain | | | — | | | | (1.00 | ) | | | (0.45 | ) | | | (0.30 | ) | | | (0.12 | ) | | | (0.35 | ) | |
Total Distributions | | | — | | | | (1.16 | ) | | | (0.66 | ) | | | (0.50 | ) | | | (0.23 | ) | | | (0.55 | ) | |
Net Asset Value, End of Period | | $ | 6.01 | | | $ | 6.04 | | | $ | 6.93 | | | $ | 8.27 | | | $ | 7.70 | | | $ | 8.06 | | |
Total Return(2) | | | (0.50 | )%(3) | | | 4.27 | %(4) | | | (8.32 | )% | | | 14.00 | % | | | (1.43 | )% | | | 27.87 | % | |
Ratios to Average Net Assets and Supplemental Data: | |
Net Assets, End of Period (Thousands) | | $ | 43,220 | | | $ | 46,471 | | | $ | 50,172 | | | $ | 53,857 | | | $ | 41,277 | | | $ | 46,055 | | |
Ratio of Expenses Before Expense Limitation | | | 1.69 | %(5) | | | 1.65 | % | | | 1.66 | % | | | 1.63 | % | | | 1.61 | % | | | 1.58 | % | |
Ratio of Expenses After Expense Limitation | | | 1.12 | %(5)(6) | | | 1.11 | %(6)(7) | | | 1.13 | %(6)(8) | | | 1.12 | %(6) | | | 1.12 | %(6) | | | 1.12 | %(6) | |
Ratio of Expenses After Expense Limitation Excluding Interest Expenses | | | N/A | | | | N/A | | | | 1.12 | %(6) | | | N/A | | | | N/A | | | | N/A | | |
Ratio of Net Investment Income | | | 3.11 | %(5)(6) | | | 2.41 | %(6)(7) | | | 2.07 | %(6) | | | 1.86 | %(6) | | | 1.81 | %(6) | | | 2.33 | %(6) | |
Ratio of Rebate from Morgan Stanley Affiliates | | | 0.00 | %(5)(9) | | | 0.00 | %(9) | | | 0.00 | %(9) | | | 0.00 | %(9) | | | 0.00 | %(9) | | | 0.00 | %(9) | |
Portfolio Turnover Rate | | | 24 | %(3) | | | 31 | % | | | 89 | % | | | 59 | % | | | 62 | % | | | 30 | % | |
(1) Per share amount is based on average shares outstanding.
(2) Calculated based on the net asset value as of the last business day of the period. Performance does not reflect fees and expenses imposed by your insurance company's separate account. If performance information included the effect of these additional charges, the total return would be lower.
(3) Not annualized.
(4) Reflects prior period transfer agency fees that were reimbursed in 2023. The amount of the reimbursement was immaterial on a per share basis and the impact was less than 0.005% to the total return of Class II shares.
(5) Annualized.
(6) The Ratio of Expenses After Expense Limitation and Ratio of Net Investment Income reflect the rebate of certain Fund expenses in connection with the investments in Morgan Stanley affiliates during the period. The effect of the rebate on the ratios is disclosed in the above table as "Ratio of Rebate from Morgan Stanley Affiliates."
(7) If the Fund had not received the reimbursement of transfer agency fees from the Adviser, the Ratio of Expenses After Expense Limitation and Ratio of Net Investment Income, would have been as follows for Class II shares:
Period Ended | | Expense
Ratio | | Net Investment
Income Ratio | |
December 31, 2023 | | | 1.12 | % | | | 2.40 | % | |
(8) Ratio is above the expense limitation due to interest expenses, which are not included in the determination of the expense limitation. Refer to Footnote B in the Notes to Financial Statements.
(9) Amount is less than 0.005%.
The accompanying notes are an integral part of the financial statements.
8
Morgan Stanley Variable Insurance Fund, Inc.
June 30, 2024 (unaudited)
Notes to Financial Statements
Morgan Stanley Variable Insurance Fund, Inc. (the "Company") is registered under the Investment Company Act of 1940, as amended (the "Act"), as an open-end management investment company. The Company is comprised of eight separate active, diversified and non-diversified funds (individually referred to as a "Fund," collectively as the "Funds").
The Company applies investment company accounting and reporting guidance Accounting Standards Codification ("ASC") Topic 946. In the preparation of these financial statements, management has evaluated subsequent events occurring after the date of the Fund's Statement of Assets and Liabilities through the date that the financial statements were issued.
The accompanying financial statements relates to the Global Infrastructure Portfolio. The Fund seeks both capital appreciation and current income. The Fund has issued two classes of shares — Class I and Class II. Both classes of shares have identical voting rights (except that shareholders of a Class have exclusive voting rights regarding any matter relating solely to that Class of shares), dividend, liquidation and other rights.
The Company is intended to be a funding vehicle for variable annuity contracts and variable life insurance policies offered by the separate accounts of certain life insurance companies.
A. Significant Accounting Policies: The following significant accounting policies are in conformity with U.S. generally accepted accounting principles ("GAAP"). Such policies are consistently followed by the Company in the preparation of its financial statements. GAAP may require management to make estimates and assumptions that affect the reported amounts and disclosures in the financial statements. Actual results may differ from those estimates.
1. Security Valuation: (1) An equity portfolio security listed or traded on an exchange is valued at its latest reported sales price (or at the exchange official closing price if such exchange reports an official closing price), and if there were no sales on a given day and if there is no official exchange closing price for that day, the security is valued at the mean between the last reported bid and asked prices if such bid and asked prices are available on the relevant exchanges. If only bid prices are available then the latest bid price may be used. Listed equity securities not traded on the valuation date with no reported bid and asked prices available on the exchange are valued at the mean between the current bid and asked prices obtained from one or more reputable brokers/dealers. In cases where a security is traded on more than one exchange, the security is valued on the exchange designated as the primary market; (2) all other equity portfolio securities for which over-the-counter ("OTC") market quotations are readily available are valued at the latest reported sales
price (or at the market official closing price if such market reports an official closing price), and if there was no trading in the security on a given day and if there is no official closing price from relevant markets for that day, the security is valued at the mean between the last reported bid and asked prices if such bid and asked prices are available on the relevant markets. An unlisted equity security that does not trade on the valuation date and for which bid and asked prices from the relevant markets are unavailable is valued at the mean between the current bid and asked prices obtained from one or more reputable brokers/dealers; (3) fixed income securities may be valued by an outside pricing service/vendor approved by the Company's Board of Directors (the "Directors"). The pricing service/vendor may employ a pricing model that takes into account, among other things, bids, yield spreads and/or other market data and specific security characteristics. If Morgan Stanley Investment Management Inc. (the "Adviser") a wholly-owned subsidiary of Morgan Stanley, determines that the price provided by the outside pricing service/vendor does not reflect the security's fair value or is unable to provide a price, prices from reputable brokers/dealers may also be utilized. In these circumstances, the value of the security will be the mean of bid and asked prices obtained from reputable brokers/dealers; (4) when market quotations are not readily available, as defined by Rule 2a-5 under the Act, including circumstances under which the Adviser determines that the closing price, last sale price or the mean between the last reported bid and asked prices are not reflective of a security's market value, portfolio securities are valued at their fair value as determined in good faith under procedures approved by and under the general supervision of the Directors. Each business day, the Fund uses a third-party pricing service approved by the Directors to assist with the valuation of foreign equity securities. Events occurring after the close of trading on foreign exchanges may result in adjustments to the valuation of foreign securities to reflect market trading that occurs after the close of the applicable foreign markets of comparable securities or other instruments that have a strong correlation to the fair-valued securities to more accurately reflect their fair value as of the close of regular trading on the NYSE; (5) foreign exchange transactions ("spot contracts") and foreign exchange forward contracts ("forward contracts") are valued daily using an independent pricing vendor at the spot and forward rates, respectively, as of the close of the NYSE; and (6) investments in mutual funds, including the Morgan Stanley Institutional Liquidity Funds, are valued at the net asset value ("NAV") as of the close of each business day.
9
Morgan Stanley Variable Insurance Fund, Inc.
June 30, 2024 (unaudited)
Notes to Financial Statements (cont'd)
In connection with Rule 2a-5 of the Act, the Directors have designated the Company's Adviser as its valuation designee. The valuation designee has responsibility for determining fair value and to make the actual calculations pursuant to the fair valuation methodologies previously approved by the Directors. Under procedures approved by the Directors, the Company's Adviser, as valuation designee, has formed a Valuation Committee whose members are approved by the Directors. The Valuation Committee provides administration and oversight of the Company's valuation policies and procedures, which are reviewed at least annually by the Directors. These procedures allow the Company to utilize independent pricing services, quotations from securities and financial instrument dealers and other market sources to determine fair value.
2. Fair Value Measurement: Financial Accounting Standards Board ("FASB") ASC 820, "Fair Value Measurement" ("ASC 820"), defines fair value as the price that would be received to sell an asset or pay to transfer a liability in an orderly transaction between market participants at the measurement date. ASC 820 establishes a three-tier hierarchy to distinguish between (1) inputs that reflect the assumptions market participants would use in valuing an asset or liability developed based on market data obtained from sources independent of the reporting entity (observable inputs); and (2) inputs that reflect the reporting entity's own assumptions about the assumptions market participants would use in valuing an asset or liability developed based on the best information available in the circumstances (unobservable inputs) and to establish classification of fair value measurements for disclosure purposes. Various inputs are used in determining the value of the Fund's investments. The inputs are summarized in the three broad levels listed below:
• Level 1 – unadjusted quoted prices in active markets for identical investments
• Level 2 – other significant observable inputs (including quoted prices for similar investments, interest rates, prepayment speeds, credit risk, etc.)
• Level 3 – significant unobservable inputs including the Fund's own assumptions in determining the fair value of investments. Factors considered in making this determination may include, but are not limited to, information obtained by contacting the issuer, analysts, or the appropriate stock exchange (for exchange-traded securities), analysis of the issuer's financial statements or other available documents and,
if necessary, available information concerning other securities in similar circumstances.
The inputs or methodology used for valuing securities are not necessarily an indication of the risk associated with investing in those securities and the determination of the significance of a particular input to the fair value measurement in its entirety requires judgment and considers factors specific to each security.
The following is a summary of the inputs used to value the Fund's investments as of June 30, 2024:
Investment Type | | Level 1
Unadjusted
quoted
prices
(000) | | Level 2
Other
significant
observable
inputs
(000) | | Level 3
Significant
unobservable
inputs
(000) | | Total
(000) | |
Assets: | |
Common Stocks | |
Airports | | $ | 2,243 | | | $ | 2,050 | | | $ | — | | | $ | 4,293 | | |
Communications | | | 6,744 | | | | 1,856 | | | | — | | | | 8,600 | | |
Diversified | | | 2,413 | | | | 3,359 | | | | — | | | | 5,772 | | |
Electricity Transmission &
Distribution | | | 5,273 | | | | 6,633 | | | | — | | | | 11,906 | | |
Oil & Gas Storage &
Transportation | | | 22,939 | | | | 1,447 | | | | — | | | | 24,386 | | |
Others | | | 7,248 | | | | 438 | | | | — | | | | 7,686 | | |
Railroads | | | 232 | | | | 507 | | | | — | | | | 739 | | |
Toll Roads | | | — | | | | 860 | | | | — | | | | 860 | | |
Water | | | 1,121 | | | | 1,331 | | | | — | | | | 2,452 | | |
Total Common Stocks | | | 48,213 | | | | 18,481 | | | | — | | | | 66,694 | | |
Short-Term Investments | |
Investment Company | | | 2,400 | | | | — | | | | — | | | | 2,400 | | |
Repurchase Agreements | | | — | | | | 507 | | | | — | | | | 507 | | |
Total Short-Term
Investments | | | 2,400 | | | | 507 | | | | — | | | | 2,907 | | |
Total Assets | | $ | 50,613 | | | $ | 18,988 | | | $ | — | | | $ | 69,601 | | |
Transfers between investment levels may occur as the markets fluctuate and/or the availability of data used in an investment's valuation changes.
3. Repurchase Agreements: The Fund may enter into repurchase agreements under which the Fund lends cash and takes possession of securities with an agreement that the counterparty will repurchase such securities. In connection with transactions in repurchase agreements, a bank as custodian for the Fund takes possession of the underlying securities which are held as collateral, with a market value at least equal to the amount of the repurchase transaction, including principal and accrued interest. To the extent that any repurchase transaction exceeds one business day, the value of the collateral is marked-to-market on a daily basis to determine that the value of the collateral does not decrease below the repurchase price
10
Morgan Stanley Variable Insurance Fund, Inc.
June 30, 2024 (unaudited)
Notes to Financial Statements (cont'd)
plus accrued interest as earned. If such a decrease occurs, additional collateral will be requested and, when received, will be added to the account to maintain full collateralization. In the event of default on the obligation to repurchase, the Fund has the right to liquidate the collateral and apply the proceeds in satisfaction of the obligation. In the event of default or bankruptcy by the counterparty to the agreement, realization of the collateral proceeds may be subject to cost and delays. The Fund, along with other affiliated investment companies, may utilize a joint trading account for the purpose of entering into repurchase agreements.
4. Foreign Currency Translation and Foreign Investments: The books and records of the Fund are maintained in U.S. dollars. Foreign currency amounts are translated into U.S. dollars as follows:
— investments, other assets and liabilities at the prevailing rate of exchange on the valuation date;
— investment transactions and investment income at the prevailing rates of exchange on the dates of such transactions.
Although the net assets of the Fund are presented at the foreign exchange rates and market values at the close of the period, the Fund does not isolate that portion of the results of operations arising as a result of changes in the foreign exchange rates from the fluctuations arising from changes in the market prices of securities held at period end. Similarly, the Fund does not isolate the effect of changes in foreign exchange rates from the fluctuations arising from changes in the market prices of securities sold during the period. Accordingly, realized and unrealized foreign currency gains (losses) on investments in securities are included in the reported net realized and unrealized gains (losses) on investment transactions and balances. However, pursuant to U.S. federal income tax regulations, gains and losses from certain foreign currency transactions and the foreign currency portion of gains and losses realized on sales and maturities of foreign denominated debt securities are treated as ordinary income for U.S. federal income tax purposes.
Net realized gains (losses) on foreign currency transactions represent net foreign exchange gains (losses) from foreign currency forward exchange contracts, disposition of foreign currencies, currency gains (losses) realized between the trade and settlement dates on securities transactions, and the difference between the amount of investment income and foreign withholding taxes recorded on the Fund's books and the U.S. dollar equivalent amounts actually received or paid. The change in
unrealized currency gains (losses) on foreign currency transactions for the period is reflected in the Statement of Operations.
Foreign security and currency transactions may involve certain considerations and risks not typically associated with those of U.S. dollar denominated transactions as a result of, among other factors, fluctuations of exchange rates in relation to the U.S. dollar, the possibility of lower levels of governmental supervision and regulation of foreign securities markets and the possibility of political or economic instability.
Governmental approval for foreign investments may be required in advance of making an investment under certain circumstances in some countries, and the extent of foreign investments in U.S. companies may be subject to limitation in other countries. Foreign ownership limitations also may be imposed by the charters of individual companies to prevent, among other concerns, violations of foreign investment limitations. As a result, an additional class of shares (identified as "Foreign" in the Portfolio of Investments) may be created and offered for investment. The "local" and "foreign shares" market values may differ. In the absence of trading of the foreign shares in such markets, the Fund values the foreign shares at the closing exchange price of the local shares.
5. Securities Lending: The Fund lends securities to qualified financial institutions, such as broker/dealers, to earn additional income. Any increase or decrease in the fair value of the securities loaned that might occur and any interest earned or dividends declared on those securities during the term of the loan would remain in the Fund. The Fund would receive cash or securities as collateral in an amount equal to or exceeding 100% of the current fair value of the loaned securities. The collateral is marked-to-market daily by State Street Bank and Trust Company ("State Street"), the securities lending agent, to ensure that a minimum of 100% collateral coverage is maintained.
Based on pre-established guidelines, the securities lending agent invests any cash collateral that is received in an affiliated money market portfolio and repurchase agreements. Securities lending income is generated from the earnings on the invested collateral and borrowing fees, less any rebates owed to the borrowers and compensation to the lending agent, and is recorded as "Income from Securities Loaned — Net" in the Fund's Statement of Operations. Risks in securities lending transactions are that a borrower may not provide additional collateral when required or return the securities when due, and that
11
Morgan Stanley Variable Insurance Fund, Inc.
June 30, 2024 (unaudited)
Notes to Financial Statements (cont'd)
the value of the short-term investments will be less than the amount of cash collateral plus any rebate that is required to be returned to the borrower.
The Fund has the right under the securities lending agreement to recover the securities from the borrower on demand.
The following table presents financial instruments that are subject to enforceable netting arrangements as of June 30, 2024:
Gross Amount Not Offset in the Statement of Assets and Liabilities | |
Gross Asset
Amount
Presented in
the Statement
of Assets and
Liabilities
(000) | | Financial
Instrument
(000) | | Collateral
Received
(000) | | Net Amount
(not less
than $0)
(000) | |
| $ | 2,667 | (a) | | $ | — | | | $ | (2,667 | )(b)(c) | | $ | 0 | | |
(a) Represents market value of loaned securities at period end.
(b) The Fund received cash collateral of approximately $2,327,000, which was subsequently invested in Repurchase Agreements and Morgan Stanley Institutional Liquidity Fund as reported in the Portfolio of Investments. In addition, the Fund received non-cash collateral of approximately $514,000 in the form of U.S. Government obligations, which the Fund cannot sell or repledge, and accordingly are not reflected in the Portfolio of Investments.
(c) The actual collateral received is greater than the amount shown here due to overcollateralization.
FASB ASC 860, "Transfers & Servicing: Repurchase-to-Maturity Transactions, Repurchase Financings, and Disclosures", is intended to provide increased transparency about the types of collateral pledged in securities lending transactions and other similar transactions that are accounted for as secured borrowings.
The following table displays a breakdown of transactions accounted for as secured borrowings, the gross obligations by class of collateral pledged and the remaining contractual maturity of those transactions as of June 30, 2024:
Remaining Contractual Maturity of the Agreements | |
| | | Overnight and
Continuous
(000) | | <30 days
(000) | | Between
30 &
90 days
(000) | | >90 days
(000) | | Total
(000) | |
Securities Lending
Transactions | |
Common Stocks | | $ | 2,327 | | | $ | — | | | $ | — | | | $ | — | | | $ | 2,327 | | |
Total Borrowings | | $ | 2,327 | | | $ | — | | | $ | — | | | $ | — | | | $ | 2,327 | | |
Gross amount of
recognized liabilities
for securities lending
transactions | | $ | 2,327 | | |
6. Indemnifications: The Company enters into contracts that contain a variety of indemnification clauses. The Company's maximum exposure under these arrangements is unknown as this would involve future claims that may be made against the Fund that have not yet occurred.
7. Security Transactions, Income and Expenses: Security transactions are accounted for on the trade date (date the order to buy or sell is executed). Realized gains and losses on the sale of investment securities are determined on the specific identified cost method. Dividend income and other distributions are recorded on the ex-dividend date (except for certain foreign dividends which may be recorded as soon as the Fund is informed of such dividends) net of applicable withholding taxes. Non-cash dividends received in the form of stock, if any, are recognized on the ex-dividend date and recorded as non-cash dividend income at fair value. Interest income is recognized on the accrual basis (except where collection is in doubt) net of applicable withholding taxes. Discounts are accreted and premiums are amortized over the life of the respective securities. Most expenses of the Company can be directly attributed to a particular Fund. Expenses which cannot be directly attributed are apportioned among the Funds based upon relative net assets or other appropriate methods. Income, expenses (other than class specific expenses) and realized and unrealized gains or losses are allocated to each class of shares based upon their relative net assets.
Settlement and registration of foreign securities transactions may be subject to significant risks not normally associated with investments in the United States. In certain markets, ownership of shares is defined according to entries in the issuer's share register. It is possible that a Fund holding these securities could lose its share registration through fraud, negligence or even mere oversight. In addition, shares being delivered for sales and cash being paid for purchases may be delivered before the exchange is complete. This may subject the Fund to further risk of loss in the event of a failure to complete the transaction by the counterparty.
8. Dividends and Distributions to Shareholders: Dividends and distributions to shareholders are recorded on the ex-dividend date. Dividends from net investment income, if any, are declared and paid annually. Net realized capital gains, if any, are distributed at least annually.
B. Advisory Fees: The Adviser, a wholly-owned subsidiary of Morgan Stanley, provides the Fund with advisory services under the terms of an Investment Advisory Agreement, paid quarterly, at an annual rate of 0.85% of the daily net assets of the Fund.
12
Morgan Stanley Variable Insurance Fund, Inc.
June 30, 2024 (unaudited)
Notes to Financial Statements (cont'd)
The Adviser has agreed to reduce its advisory fee and/or reimburse the Fund so that total annual Fund operating expenses, excluding certain investment related expenses, taxes, interest and other extraordinary expenses (including litigation), will not exceed 0.87% for Class I shares and 1.12% for Class II shares. The fee waivers and/or expense reimbursements will continue for at least one year from the date of the Fund's prospectus or until such time as the Directors act to discontinue all or a portion of such waivers and/or reimbursements when they deem such action is appropriate. For the six months ended June 30, 2024, approximately $194,000 of advisory fees were waived pursuant to this arrangement.
C. Administration Fees: The Adviser also serves as Administrator to the Company and provides administrative services pursuant to an Administration Agreement for an annual fee, accrued daily and paid monthly, of 0.08% of the Fund's average daily net assets.
Under a Sub-Administration Agreement between the Administrator and State Street, State Street provides certain administrative services to the Company. For such services, the Administrator pays State Street a portion of the fee the Administrator receives from the Fund.
D. Servicing Fees: The Company accrues daily and pays quarterly a servicing fee of up to 0.17% of the average daily value of shares of the Fund held in an insurance company's account. Certain insurance companies have entered into a servicing agreement with the Company to provide administrative and other contract-owner related services on behalf of the Fund.
E. Distribution Fees: Morgan Stanley Distribution, Inc. ("MSDI" or the "Distributor"), a wholly-owned subsidiary of the Adviser and an indirect subsidiary of Morgan Stanley, serves as the Distributor of the Fund and provides the Fund's Class II shareholders with distribution services pursuant to a Distribution Plan (the "Plan") in accordance with Rule 12b-1 under the Act. Under the Plan, the Fund is authorized to pay the Distributor a distribution fee, which is accrued daily and paid monthly, at an annual rate of 0.25% of the Fund's average daily net assets attributable to Class II shares.
F. Dividend Disbursing and Transfer/Co-Transfer Agent: The Company's dividend disbursing and transfer agent is SS&C Global Investor & Distribution Solutions, Inc. ("SS&C GIDS"). Pursuant to a Transfer Agency Agreement, the Company pays SS&C GIDS a fee based on the number of classes, accounts and transactions relating to the Funds of the Company.
Eaton Vance Management ("EVM"), an affiliate of Morgan Stanley, provides co-transfer agency and related services to the Fund pursuant to a Co-Transfer Agency Services Agreement.
For the six months ended June 30, 2024, co-transfer agency fees and expenses incurred to EVM, included in "Transfer Agency Fees" in the Statement of Operations, amounted to less than $500.
G. Custodian Fees: State Street (the "Custodian") also serves as Custodian for the Company in accordance with a Custodian Agreement. The Custodian holds cash, securities and other assets of the Company as required by the Act. Custody fees are payable monthly based on assets held in custody, investment purchases and sales activity and account maintenance fees, plus reimbursement for certain out-of-pocket expenses.
H. Security Transactions and Transactions with Affiliates: For the six months ended June 30, 2024, purchases and sales of investment securities for the Fund, other than long-term U.S. Government securities and short-term investments were approximately $16,161,000 and $20,324,000, respectively. There were no purchases and sales of long-term U.S. Government securities for the six months ended June 30, 2024.
The Fund invests in the Institutional Class of the Morgan Stanley Institutional Liquidity Funds (the "Liquidity Fund"), an open-end management investment company managed by the Adviser, both directly and as a portion of the securities held as collateral on loaned securities. Advisory fees paid by the Fund are reduced by an amount equal to its pro-rata share of the advisory and administration fees paid by the Fund due to its investment in the Liquidity Fund. For the six months ended June 30, 2024, advisory fees paid were reduced by approximately $1,000 relating to the Fund's investment in the Liquidity Fund.
A summary of the Fund's transactions in shares of affiliated investments during the six months ended June 30, 2024 is as follows:
Affiliated
Investment
Company | | Value
December 31,
2023
(000) | | Purchases
at Cost
(000) | | Proceeds
from Sales
(000) | | Dividend
Income
(000) | |
Liquidity Fund | | $ | 2,286 | | | $ | 12,185 | | | $ | 12,071 | | | $ | 31 | | |
Affiliated
Investment
Company (cont'd) | | Realized
Gain (Loss)
(000) | | Change in
Unrealized
Appreciation
(Depreciation)
(000) | | Value
June 30,
2024
(000) | |
Liquidity Fund | | $ | — | | | $ | — | | | $ | 2,400 | | |
The Fund is permitted to purchase and sell securities ("cross-trade") from and to other Morgan Stanley funds as well as other funds and client accounts for which the Adviser or an affiliate of the Adviser serves as investment adviser, pursuant
13
Morgan Stanley Variable Insurance Fund, Inc.
June 30, 2024 (unaudited)
Notes to Financial Statements (cont'd)
to procedures approved by the Directors in compliance with Rule 17a-7 under the Act (the "Rule"). Each cross-trade is executed at the current market price in compliance with provisions of the Rule. For the six months ended June 30, 2024, the Fund did not engage in any cross-trade transactions.
Each Director receives an annual retainer fee for serving as a Director of the Morgan Stanley Funds. The aggregate compensation paid to each Director is paid by the Morgan Stanley Funds, and is allocated on a pro rata basis among each of the operational funds of the Morgan Stanley Funds based on the relative net assets of each of the funds. The Company also reimburses such Directors for travel and other out-of-pocket expenses incurred by them in connection with attending such meetings.
The Fund has an unfunded Deferred Compensation Plan (the "Compensation Plan"), which allows each independent Director to defer payment of all, or a portion, of the fees he or she receives for serving on the Board of Directors. Each eligible Director generally may elect to have the deferred amounts credited with a return equal to the total return on one or more of the Morgan Stanley funds that are offered as investment options under the Compensation Plan. Appreciation/depreciation and distributions received from these investments are recorded with an offsetting increase/decrease in the deferred compensation obligation and do not affect the NAV of the Fund.
I. Federal Income Taxes: It is the Fund's intention to continue to qualify as a regulated investment company and distribute all of its taxable and tax-exempt income. Accordingly, no provision for federal income taxes is required in the financial statements.
The Fund may be subject to taxes imposed by countries in which it invests. Such taxes are generally based on income and/or capital gains earned or repatriated. Taxes are accrued based on net investment income, net realized gains and net unrealized appreciation as such income and/or gains are earned. Taxes may also be based on transactions in foreign currency and are accrued based on the value of investments denominated in such currency.
FASB ASC 740-10, "Income Taxes — Overall", sets forth a minimum threshold for financial statement recognition of the benefit of a tax position taken or expected to be taken in a tax return. Management has concluded there are no significant uncertain tax positions that would require recognition in the financial statements. If applicable, the Fund recognizes interest accrued related to unrecognized tax benefits in "Interest Expense" and penalties in "Other Expenses" in the Statement of Operations. The Fund files tax returns with the U.S. Internal Revenue Service, New York and various states. Generally,
each of the tax years in the four-year period ended December 31, 2023 remains subject to examination by taxing authorities.
The tax character of distributions paid may differ from the character of distributions shown for GAAP purposes due to short-term capital gains being treated as ordinary income for tax purposes. The tax character of distributions paid during fiscal years 2023 and 2022 was as follows:
2023 Distributions
Paid From: | | 2022 Distributions
Paid From: | |
Ordinary
Income
(000) | | Long-Term
Capital Gain
(000) | | Ordinary
Income
(000) | | Long-Term
Capital Gain
(000) | |
$ | 1,775 | | | $ | 10,521 | | | $ | 3,242 | | | $ | 4,066 | | |
The amount and character of income and gains to be distributed are determined in accordance with income tax regulations which may differ from GAAP. These book/tax differences are either considered temporary or permanent in nature.
Temporary differences are attributable to differing book and tax treatments for the timing of the recognition of gains (losses) on certain investment transactions and the timing of the deductibility of certain expenses.
The Fund had no permanent differences causing reclassifications among the components of net assets for the year ended December 31, 2023.
At December 31, 2023, the components of distributable earnings for the Fund on a tax basis were as follows:
Undistributed
Ordinary
Income
(000) | | Undistributed
Long-Term
Capital Gain
(000) | |
| $ | 1,896 | | | $ | — | | |
At December 31, 2023, the Fund had available for federal income tax purposes unused short-term and long-term capital losses of approximately $847,000 and $3,542,000, respectively, that do not have an expiration date.
To the extent that capital loss carryforwards are used to offset any future capital gains realized, no capital gains tax liability will be incurred by the Fund for gains realized and not distributed. To the extent that capital gains are offset, such gains will not be distributed to the shareholders.
J. Credit Facility: The Company and other Morgan Stanley funds participated in a $500,000,000 committed, unsecured revolving line of credit facility (the "Facility") with State Street. This Facility is to be used for temporary emergency purposes or funding of shareholder redemption requests. The interest rate for any funds drawn will be based on the federal
14
Morgan Stanley Variable Insurance Fund, Inc.
June 30, 2024 (unaudited)
Notes to Financial Statements (cont'd)
funds rate or overnight bank funding rate plus a spread. The Facility also has a commitment fee of 0.25% per annum based on the unused portion of the Facility, which is allocated among participating funds based on relative net assets. During the six months ended June 30, 2024, the Fund did not have any borrowings under the Facility.
K. Other: At June 30, 2024, the Fund had record owners of 10% or greater. Investment activities of these shareholders could have a material impact on the Fund. The aggregate percentage of such owners was 81.0%.
L. Market Risk: The value of an investment in the Fund is based on the values of the Fund's investments, which change due to economic and other events that affect markets generally, as well as those that affect particular regions, countries, industries, companies or governments. The risks associated with these developments may be magnified if certain social, political, economic and other conditions and events adversely interrupt the global economy and financial markets. Securities in the Fund's portfolio may underperform due to inflation (or expectations for inflation), interest rates, global demand for particular products or resources, natural disasters and extreme weather events, health emergencies (such as epidemics and pandemics), terrorism, regulatory events and governmental or quasi-governmental actions. The occurrence of global events similar to those in recent years, such as terrorist attacks around the world, natural disasters, health emergencies, social and political (including geopolitical) discord and tensions or debt crises and downgrades, among others, may result in market volatility and may have long term effects on both the U.S. and global financial markets. The occurrence of such events may be sudden and unexpected, and it is difficult to predict when similar events affecting the U.S. or global financial markets may occur, the effects that such events may have and the duration of those effects (which may last for extended periods). Any such event(s) could have a significant adverse impact on the value, liquidity and risk profile of the Fund's portfolio, as well as its ability to sell securities and/or meet redemptions. Any such event(s) or similar types of factors and developments may also adversely affect the financial performance of the Fund's investments (and, in turn, the Fund's investment results) and/or negatively impact broad segments of businesses and populations and have a significant and rapid negative impact on the performance of the Fund's investments, and exacerbate preexisting risks to the Fund.
15
Morgan Stanley Variable Insurance Fund, Inc.
June 30, 2024 (unaudited)
Investment Advisory Agreement Approval
Nature, Extent and Quality of Services
The Board reviewed and considered the nature and extent of the investment advisory services provided by the Adviser under the advisory agreement, including portfolio management, investment research and equity and fixed income securities trading. The Board also reviewed and considered the nature and extent of the non-advisory, administrative services provided by the Administrator under the administration agreement, including accounting, operations, clerical, bookkeeping, compliance, business management and planning, legal services and the provision of supplies, office space and utilities at the Adviser's expense. The Board also considered the Adviser's investment in personnel and infrastructure that benefits the Fund. (The Adviser, and Administrator together are referred to as the "Adviser" and the advisory and administration agreements together are referred to as the "Management Agreement.") The Board also considered that the Adviser serves a variety of other investment advisory clients and has experience overseeing service providers. The Board also compared the nature of the services provided by the Adviser with similar services provided by non-affiliated advisers as prepared by Broadridge Financial Solutions, Inc. ("Broadridge").
The Board reviewed and considered the qualifications of the portfolio managers, the senior administrative managers and other key personnel of the Adviser who provide the advisory and administrative services to the Fund. The Board determined that the Adviser's portfolio managers and key personnel are well qualified by education and/or training and experience to perform the services in an efficient and professional manner. The Board concluded that the nature and extent of the advisory and administrative services provided were necessary and appropriate for the conduct of the business and investment activities of the Fund and supported its decision to approve the Management Agreement.
Performance, Fees and Expenses of the Fund
The Board reviewed the performance, fees and expenses of the Fund compared to its peers, as prepared by Broadridge, and to appropriate benchmarks where applicable. The Board discussed with the Adviser the performance goals and the actual results achieved in managing the Fund. When considering a fund's performance, the Board and the Adviser place emphasis on trends and longer-term returns (focusing on one-year, three-year and five-year performance, as of December 31, 2023, or since inception, as applicable). When a fund underperforms its benchmark and/or its peer group average, the Board and the Adviser discuss the causes of such underperformance and, where necessary, they discuss specific changes to investment strategy or investment personnel. The Board noted that the Fund's performance was better than its peer group average for the one- and five-year periods but below its peer group average for the three-year period. The Board discussed with the Adviser the level of the advisory and administration fees (together, the "management fee") for this Fund relative to comparable funds and/or other accounts advised by the Adviser and/or compared to its peers as prepared by Broadridge. In addition to the management fee, the Board also reviewed the Fund's total expense ratio. When a fund's management fee and/or its total expense ratio are higher than its peers, the Board and the Adviser discuss the reasons for this and, where appropriate, they discuss possible waivers and/or caps. The Board noted that the Fund's contractual management fee was higher than its peer group average and the actual management fee and total expense ratio were lower than its peer group averages. After discussion, the Board concluded that the Fund's performance, management fee and total expense ratio were competitive with its peer group averages.
Economies of Scale
The Board considered the size and growth prospects of the Fund and how that relates to the Fund's total expense ratio and particularly the Fund's management fee rate, which does not include breakpoints. In conjunction with its review of the Adviser's profitability, the Board discussed with the Adviser how a change in assets can affect the efficiency or effectiveness of managing the Fund and whether the management fee level is appropriate relative to current and projected asset levels and/or whether the management fee structure reflects economies of scale as asset levels change. The Board has determined that its review of the actual and/or potential economies of scale of the Fund supports its decision to approve the Management Agreement.
Profitability of the Adviser and Affiliates
The Board considered information concerning the costs incurred and profits realized by the Adviser and its affiliates during the last year from their relationship with the Fund and during the last two years from their relationship with the Morgan Stanley Fund Complex and reviewed with the Adviser the cost allocation methodology used to determine the profitability of the Adviser
16
Morgan Stanley Variable Insurance Fund, Inc.
June 30, 2024 (unaudited)
Investment Advisory Agreement Approval (cont'd)
and affiliates. The Board has determined that its review of the analysis of the Adviser's expenses and profitability supports its decision to approve the Management Agreement.
Other Benefits of the Relationship
The Board considered other direct and indirect benefits to the Adviser and/or its affiliates derived from their relationship with the Fund and other funds advised by the Adviser. These benefits may include, among other things, fees for trading, distribution and/or shareholder servicing and for transaction processing and reporting platforms used by securities lending agents, and research received by the Adviser generated from commission dollars spent on funds' portfolio trading. The Board reviewed with the Adviser these arrangements and the reasonableness of the Adviser's costs relative to the services performed. The Board has determined that its review of the other benefits received by the Adviser or its affiliates supports its decision to approve the Management Agreement.
Resources of the Adviser and Historical Relationship Between the Fund and the Adviser
The Board considered whether the Adviser is financially sound and has the resources necessary to perform its obligations under the Management Agreement. The Board also reviewed and considered the historical relationship between the Fund and the Adviser, including the organizational structure of the Adviser, the policies and procedures formulated and adopted by the Adviser for managing the Fund's operations and the Board's confidence in the competence and integrity of the senior managers and key personnel of the Adviser. The Board concluded that the Adviser has the financial resources necessary to fulfill its obligations under the Management Agreement and that it is beneficial for the Fund to continue its relationship with the Adviser.
Other Factors and Current Trends
The Board considered the controls and procedures adopted and implemented by the Adviser and monitored by the Fund's Chief Compliance Officer and concluded that the conduct of business by the Adviser indicates a good faith effort on its part to adhere to high ethical standards in the conduct of the Fund's business.
General Conclusion
After considering and weighing all of the above factors, with various written materials and verbal information presented by the Adviser, the Board concluded that it would be in the best interest of the Fund and its shareholders to approve renewal of the Management Agreement for another year. In reaching this conclusion the Board did not give particular weight to any single piece of information or factor referenced above. The Board considered these factors and information over the course of the year and in numerous meetings, some of which were in executive session with only the independent Board members and their counsel present. It is possible that individual Board members may have weighed these factors, and the information presented, differently in reaching their individual decisions to approve the Management Agreement.
17
Morgan Stanley Variable Insurance Fund, Inc.
June 30, 2024 (unaudited)
This report is not authorized for distribution to prospective investors in the Fund unless preceded or accompanied by an effective Prospectus. Read the Prospectus carefully before investing.
Item 8. Changes in and Disagreements with Accountants for Open-End Management Investment Companies
Not applicable.
Item 9. Proxy Disclosures for Open-End Management Investment Companies
Not applicable.
Item 10. Remuneration Paid to Directors, Officers, and Others of Open-End Management Investment Companies
The information is disclosed as part of the Financial Statements included in Item 7 of this Form N-CSR.
Item 11. Statement Regarding Basis for Approval of Investment Advisory Contract
This information is disclosed in the Semi-Annual Financial Statements and Additional Information under Item 7 of this Form N-CSR.
Item 12. Disclosure of Proxy Voting Policies and Procedures for Closed-End Management Investment Companies
Not applicable.
Item 13. Portfolio Managers of Closed-End Management Investment Companies
Not applicable.
Item 14. Purchases of Equity Securities by Closed-End Management Investment Company and Affiliated Purchasers
Not applicable.
Item 15. Submission of Matters to a Vote of Security Holders
There have been no material changes to the procedures by which shareholders may recommend nominee to the Fund’s Board of Directors since the Fund last provided disclosure in response to this item.
Item 16. Controls and Procedures
| (a) | It is the conclusion of the registrant’s principal executive officer and principal financial officer that the effectiveness of the registrant’s current disclosure controls and procedures (such disclosure controls and procedures having been evaluated within 90 days of the date of this filing) provide reasonable assurance that the information required to be disclosed by the registrant has been recorded, processed, summarized and reported within the time period specified in the Commission’s rules and forms and that the information required to be disclosed by the registrant has been accumulated and communicated to the registrant’s principal executive officer and principal financial officer in order to allow timely decisions regarding required disclosure. |
| (b) | There have been no changes in the registrant’s internal controls over financial reporting during the period covered by this report that has materially affected, or is reasonably likely to materially affect, the registrant’s internal control over financial reporting. |
Item 17. Disclosure of Securities Lending Activities for Closed-End Management Investment Companies
Not applicable.
Item 18. Recovery of Erroneously Awarded Compensation
Not applicable.
Item 19. Exhibits
Signatures
Pursuant to the requirements of the Securities Exchange Act of 1934 and the Investment Company Act of 1940, the registrant has duly caused this report to be signed on its behalf by the undersigned, thereunto duly authorized.
Morgan Stanley Variable Insurance Fund, Inc.
| By: | /s/ John H. Gernon | |
| | John H. Gernon | |
| | Principal Executive Officer | |
| | | |
| Date: | August 20, 2024 | |
Pursuant to the requirements of the Securities Exchange Act of 1934 and the Investment Company Act of 1940, this report has been signed below by the following persons on behalf of the registrant and in the capacities and on the dates indicated.
| By: | /s/ Francis J. Smith | |
| | Francis J. Smith | |
| | Principal Financial Officer | |
| | | |
| Date: | August 20, 2024 | |
| | | |
| By: | /s/ John H. Gernon | |
| | John H. Gernon | |
| | Principal Executive Officer | |
| | | |
| Date: | August 20, 2024 | |