Use these links to rapidly review the document
TABLE OF CONTENTS
Table of Contents
UNITED STATES
SECURITIES AND EXCHANGE COMMISSION
Washington, D.C. 20549
FORM 10-K
| | |
ý |
|
ANNUAL REPORT PURSUANT TO SECTION 13 OR 15(d) OF THE SECURITIES EXCHANGE ACT OF 1934 |
For the fiscal year ended December 31, 2009 |
OR |
o |
|
TRANSITION REPORT PURSUANT TO SECTION 13 OR 15(d) OF THE SECURITIES EXCHANGE ACT OF 1934 |
For the transition period from to
|
Commission File No. 001-12907
KNOLL, INC.
(Exact name of registrant as specified in its charter)
| | |
Delaware
(State or other jurisdiction of
incorporation or organization) | | 13-3873847
(I.R.S. Employer Identification Number) |
1235 Water Street
East Greenville, PA 18041
(215) 679-7991
(Address, including zip code, and telephone number including area code of principal executive offices)
|
SECURITIES REGISTERED PURSUANT TO SECTION 12(b) OF THE ACT:
| | |
| Title of each class | | Name of exchange on which registered |
|---|
| Common Stock, par value $0.01 per share | | New York Stock Exchange |
SECURITIES REGISTERED PURSUANT TO SECTION 12(g) OF THE ACT:NONE
Indicate by check mark if the issuer is a well-known seasoned issuer (as defined in Rule 405 of the Securities Act.) Yes o No ý
Indicate by check mark if the registrant is not required to file reports pursuant to Section 13 or Section 15(d) of the Exchange Act. Yes o No ý
Indicate by check mark whether the Registrant (1) has filed all reports required to be filed by Section 13 or 15(d) of the Securities Exchange Act of 1934 during the preceding 12 months (or for such shorter period that the Registrant was required to file such reports), and (2) has been subject to such filing requirements for the past 90 days. Yes ý No o
Indicate by check mark whether the registrant has submitted electronically and posted on its corporate Website, if any, every Interactive Data File required to be submitted and posted pursuant to Rule 405 of Regulation S-T (§232.405 of this chapter) during the preceding 12 months (or for such shorter period that the registrant was required to submit and post such files). Yes o No o
Indicate by check mark if disclosure of delinquent filers pursuant to Item 405 of Regulation S-K is not contained herein, and will not be contained, to the best of registrant's knowledge, in definitive proxy or information statements incorporated by reference in Part III of this Form 10-K or any amendment to this Form 10-K.ý
Indicate by check mark whether the registrant is a large accelerated filer, an accelerated filer, a non-accelerated filer or a smaller reporting company. See the definitions of "large accelerated filer," "accelerated filer" and "smaller reporting company" in Rule 12b-2 of the Exchange Act.
| | | | | | |
| Large accelerated filer o, | | Accelerated filer ý, | | Non-accelerated filer o, | | Smaller reporting company o |
Indicate by check mark whether the registrant is a shell company (as defined in Rule 12b-2 of the Exchange Act.) Yes o No ý
As of June 30, 2009, the aggregate market value of the registrant's common stock held by non-affiliates of the registrant was approximately $291,333,000 based on the closing sale price as reported on the New York Stock Exchange.
As of February 25, 2010 there were 47,182,095 shares (including 1,383,627 shares of non-voting restricted shares) of the Registrant's common stock, par value $0.01 per share, outstanding.
DOCUMENTS INCORPORATED BY REFERENCE
Portions of the Registrant's definitive Proxy Statement for its 2010 Annual Meeting of Stockholders are incorporated by reference into Part III of this report on Form 10-K to the extent stated therein.
Table of Contents
TABLE OF CONTENTS
| | | | | | |
Item | |
| | Page | |
|---|
| | PART I | | | | |
1. | | Business | | | 1 | |
1A. | | Risk Factors | | | 12 | |
1B. | | Unresolved Staff Comments | | | 20 | |
2. | | Properties | | | 20 | |
3. | | Legal Proceedings | | | 20 | |
4. | | Reserved | | | 20 | |
| | PART II | | | | |
5. | | Market For Registrant's Common Equity, Related Stockholder Matters and Issuer Purchases of Equity Securities | | | 21 | |
6. | | Selected Financial Data | | | 23 | |
7. | | Management's Discussion and Analysis of Financial Condition and Results of Operations | | | 25 | |
7A. | | Quantitative and Qualitative Disclosures about Market Risk | | | 37 | |
8. | | Financial Statements and Supplementary Data | | | 39 | |
9. | | Changes in and Disagreements with Accountants on Accounting and Financial Disclosure | | | 74 | |
9A. | | Controls and Procedures | | | 74 | |
9B. | | Other Information | | | 76 | |
| | PART III | | | | |
10. | | Directors, Executive Officers and Corporate Governance | | | 76 | |
11. | | Executive Compensation | | | 76 | |
12. | | Security Ownership of Certain Beneficial Owners and Management and Related Stockholder Matters | | | 76 | |
13. | | Certain Relationships and Related Transactions, and Director Independence | | | 77 | |
14. | | Principal Accounting Fees and Services | | | 77 | |
| | PART IV | | | | |
15. | | Exhibits and Financial Statement Schedules | | | 77 | |
Signatures
| | |
82 | |
Table of Contents
PART I
ITEM 1. BUSINESS
General
We are a leading designer and manufacturer of workplace furnishings, textiles and fine leathers. Our commitment to innovation and modern design has yielded a comprehensive portfolio of products designed to provide enduring value and help clients shape their workplaces with imagination and vision. Our products are recognized for high quality and a sophisticated image and are targeted at the middle to upper end of the market. We sell our products primarily in North America through a direct sales force of approximately 249 professionals and a broad network of approximately 228 independent dealers. Our distinctive operating approach has driven industry leading operating income margins among our primary publicly-held competitors.
Since our founding in 1938, we have been recognized worldwide as a design leader within our industry. Our products are exhibited in major art museums worldwide, including more than 40 pieces in the permanent Design Collection of The Museum of Modern Art in New York. This legacy continues to flourish today and is embodied in an ambitious series of new products that reflect forward thinking ideas about design and workplace performance, among them the award-winningGeneration by Knoll® task chair andTemplate™Storage System. Our design excellence is complemented by a management philosophy that fosters a strong collaborative culture, client-driven processes and a lean, agile operating structure. Our employees are performance-driven and motivated by a variable incentive compensation system and broad-based equity ownership in the company. Together, these core attributes have enabled us to achieve strong financial performance.
Our management evaluates the company as one reporting segment in the office furniture industry. For further information on segment reporting, see note 17 in the accompanying financial statements.
All trademarks used in this annual report on Form 10-K that are not owned by us or our affiliates are the property of their respective owners.
Products
We offer a comprehensive and expanding portfolio of high quality office furniture, textiles and leathers across five product categories: (i) office systems, which are typically modular and moveable workspaces with functionally integrated panels, work surfaces, desk components, pedestal and other storage units, power and data systems and lighting; (ii) specialty products, including high image side chairs, sofas, desks and tables for the office and home, textiles, accessories, leathers and related products; (iii) seating; (iv) files and storage; and (v) desks, casegoods and tables. Historically, we have derived most of our revenues from office systems and from specialty products, including ourKnollStudio® collection of signature design classics furnishings,KnollTextiles® fabrics,Spinneybeck® leathers,Edelman® leathers, andKnollExtra® accessories. However, in recent years, we have significantly expanded our product offerings in seating, files and storage, casegoods and tables. Our products and knowledgeable sales force have generated strong brand recognition and loyalty among architects, designers and corporate facility managers, all of whom are key decision makers in the office furniture purchasing process. Our clients are typically Fortune 1000 companies, governmental agencies and other medium to large sized organizations in a variety of industries. We have an approximately $7.0 billion installed base of office systems, which provides a strong platform for recurring and add-on sales of products across all our categories.
1
Table of Contents
Major product categories and lines include:
Systems Furniture
We believe that office systems purchases are divided primarily between (i) architect and designer-oriented products and (ii) entry-level products with technology, ergonomic and functional support. Our office systems furniture reflects the breadth of these sectors with a variety of planning models and a corresponding depth of product features. Our systems furniture can define or adapt to virtually any office environment from collaborative spaces for team interaction to private executive offices.
Systems furniture consists principally of functionally integrated panels, work surfaces, desk components, pedestal and other storage units, power and data systems and lighting. These components are combined to create flexible, space-efficient work environments that can be moved, re-configured and re-used. Clients, often working with architects and designers, have the opportunity to select from a wide selection of laminates, paints, veneers and textiles to design workspaces appropriate to their organization's personality. Our systems furniture product development strategy aims to insure that product line enhancements can be added to clients' existing installations, maximizing the value of the clients' investments in Knoll systems products over the long-term.
Office systems furniture accounted for approximately 48.4% of our sales in 2009, 48.6% of our sales in 2008 and 53.2% of our sales in 2007.
Our systems furniture product lines include the following panel and desk-based planning models:
AutoStrada, which we began shipping in the second half of 2004, is one of the most comprehensive office concepts that we have developed.AutoStrada provides aesthetic and functional alternatives to traditional panel-based and desk-based systems furniture with four planning models that combine high-performance furniture with the look of custom millwork. TheAutoStrada spine-based, storage-based, wall-based and collaborative/open table planning models leverage a consistent design aesthetic to create a distinctively modern office environment. Whether an office requires a high performance open plan system, architectural casegoods, progressive private office furniture or a collaborative "big table" concept,AutoStrada provides a solution. In 2004, at NeoCon®, our national industry tradeshow,AutoStrada received a silverBest of NeoCon® award.
Reff is our flagship wood systems furniture platform. It combines the high performance capabilities of panel-based systems furniture and the refined elegance of wood casegoods, showcasing sophisticated all-wood construction and precisely crafted detail.Reff is available in an extensive range of veneers, durable laminates and metal options that can be used interchangeably in panel-based open areas as well as in private offices and as freestanding casegoods.Reff offers clients a variety of flexible panel types, making it easy to create virtually any type of workstation and has extensive power and data management capabilities for data and communications technology.
Our award-winning and innovativeCurrents system provides advanced power and data capabilities to organizations that require maximum space-planning freedom, advanced technology support and the mobility of freestanding furniture. The groundbreakingCurrents service wall divides space and manages technology.Currents may be used in tandem with existing systems furniture, removing the constraints imposed by conventional panel systems.Currents also integrates with competitors' systems and freestanding furniture.
2
Table of Contents
OurMorrison furniture system was introduced in 1986 and continues to be one of our most proven product offerings.Morrison meets essential power and data requirements for panel and desk-based planning and private offices, and offers one of the broadest ranges of systems performance in the industry.Morrison has been upgraded continually with interchangeable enhancements from itsMorrison Network, Morrison Access andMorrison Options lines. In addition,Morrison integrates withCurrents (described above) to provide advanced wire management capabilities, as well as with ourCalibre andSeries 2 desks, pedestals, lateral files, overhead storage cabinets and architectural towers to provide compatible, cost-effective panel and desk-based solutions.
The distinguishing feature of ourEquity product is its unique centerline modularity, which maximizes the efficient use of space for high-density workplaces with a minimal inventory of parts.Equity incorporates power and data capabilities, including desktop features, and integrates withCurrents (described above) to provide advanced wire management capabilities.Equity components also create modular freestanding desks, andEquity 120-degree planning enables clients to create sleek, hexagonal configurations that are well suited for call and data centers. For both 90- and 120-degreeEquity planning, a variety of components, including add-on screens, bi-fold doors and side-door components, accommodate clients' needs for privacy and storage.Equity continues to be an industry leader in terms of sustainable design.
Dividends Horizon™, introduced in 2007, extends theDividends portfolio of workplace solutions introduced in 1998 with new planning opportunities for the individual workstation, focusing on new materials and furniture that evolve the office landscape with a layered approach to furniture design. Focusing on exceptionally light and transparent materials and practical, personalized storage solutions,Dividends Horizon creates rich spatial environments for the contemporary workspace.Dividends Horizon received a silver 2007Best of NeoCon® award.
The system's enduring success is based on a straightforward, versatile frame-and-tile construction, featuring a universal panel frame. Removable panel inserts, which can be ordered in fabric, steel, glass or as marker boards, meet a range of clients' design and budgetary needs. TheDividends Horizon panel frame enables clients to utilize either monolithic, tiled or beltway panel type for applications throughout the workplace, and power and data access may be located virtually anywhere on the panel. The panel, in combination with the universal post, makes theDividends Horizon system easy to re-configure, and workstations do not have to be disassembled to make changes to the panel.Dividends Horizon accommodates off-module planning, encouraging workstation design flexibility as well as the placement of freestandingDividends desk components.
Seating
We continuously research and assess the general landscape of the office seating market, and tailor work chair product development initiatives to enhance our competitive position for ergonomics, aesthetics, comfort and value. We believe that the result of these efforts is an increasingly innovative, versatile seating collection consistent with the Knoll brand.
Key client criteria in work chair selection include superior ergonomics, aesthetics, comfort, quality and affordability, all of which is consistent with our strengths and reputation. We believe that we offer an excellent and fully competitive line-up of chairs at a range of price points and performance levels
3
Table of Contents
and constructed from varying materials, including mesh, plastic and upholstery. During 2009, we significantly expanded our range of task, conference, and visitor chairs with three new products:
Generation by Knoll®, our flagship task chair, reflects Knoll's commitment to materials innovation and forward thinking ergonomic research that has found there is no one right way to sit.Generation offers a new standard of unrestrained movement, supporting the range of postures and workstyles typical of today's workplace through elastic design, where the chair rearranges itself in response to the user.Generation has received a series of accolades from the national press, includingThe Wall Street Journal, Business Week, Time, Fast Company,andCBS Sunday Morning. Additionally, the chair has been honored with many awards, includingInterior Design magazine's2009 Best of Year Product Award in the contact/task seating category, theChicago Athenaeum GOOD DESIGN Award, and aBest of NeoCon Gold Award for office seating.
Spark Series™, an affordably priced collection of stacking side and lounge chairs, provides simple, high performance seating options for both interior and exterior environments.Spark received aBest of NeoCon Editors' Choice Award in 2009.
Moment™, a versatile pull up chair, brings classic Modernist form to a mid-priced seating category, further expanding Knoll's seating options to a diverse client base
Other principal seating lines are:
LIFE®. LIFE, introduced in 2002, has become an industry benchmark for ergonomic and sustainable design. Recognized for its overall lightness and agility,LIFE features intuitive adjustments that bring comfort and effortless control to a new performance level with an extensive range of supportive sitting options and responsive lumbar support.
RPM®. RPM, recognized for outstanding comfort, extraordinary performance and exceptional value, is offered with distinctive fabrics that reflect its stylish design. Engineered for durability,RPM delivers comfort and support, especially for 24-hour work environments.
Chadwick™. Chadwick, introduced in 2005, is an innovative hybrid seating design that accommodates the changing needs of today's workplace and home office.
Essentials™. Essentials, introduced in January 2006, is a traditional, tailored, practical work chair designed to offer the ergonomic comfort and traditional appeal of fully upholstered task chair at an incredible value. The two models ofEssentials Work chairs, the Pro™ and Tech™, offer a comprehensive range of three task and two side chairs suitable to any office style from the traditional to the progressive. In 2007, theSport™ model was introduced expanding theEssentials chair family. TheSport™ is a supportive, inviting work chair designed to be adaptable to any environment.
Seating accounted for approximately 11.1% of our sales in 2009, 9.8% of our sales in 2008 and 11.2% of our sales in 2007.
Files and Storage
Our files and storage products, featuring theCalibre andSeries 2 product lines, are designed with unique features to maximize storage capabilities throughout the workplace. Our core files and storage products consist of lateral files, mobile pedestals and other storage units, bookcases and overhead storage cabinets.
In 2009, we introduced theTemplate™Storage System, offering an economical approach to workplace planning. The product's compact 15 inch deep footprint consolidates storage while reducing the overall size of an individual workspace, saving clients both money and space. Template can be combined withDividends Horizon and other Knoll systems to expand its planning capabilities.
4
Table of Contents
The range of files and storage completes our product offering, allowing clients to address all of their furniture needs with us, especially in competitive bid situations where Knoll office systems, seating, tables and desks have been specified. The breadth of the product line also enables our dealers to offer the files and storage as stand alone products to businesses with smaller requirements.
Files and storage are available in an extensive array of sizes, configurations and colors, which can be integrated with other manufacturers' stand-alone furniture, thereby increasing our penetration in competitor accounts. In addition, certain elements of the product line can be configured as freestanding furniture in private offices or open-plan environments.
Files and storage accounted for approximately 8.0% of sales in 2009, and 7.7% in 2008 and 2007.
Desks, Casegoods, and Tables
We offer collections of adjustable tables as well as meeting, conference, training, dining, and café tables for large scale projects and stand-alone desks and table desks. These items are also sold as stand-alone products through our Knoll dealers to businesses with smaller requirements.
OurInteraction™ andUpstart™ product lines include adjustable, work, meeting, conference and training tables. These product lines range from independent tables to tables suitable for workstations that support individual preferences for computer and writing heights to plannable desks that can be linked together to build and reshape larger work areas. Additionally,Interaction tables are designed to be compatible withDividend Horizons,Equity,Morrison andReff office systems.
Our principal desk product lines, detailed to meet the needs of the contemporary office, offer traditional wood casegoods construction synonymous with the Knoll standard of quality. These desk product lines includeMagnusson® andThe Graham Collection® (introduced in 2007) and are designed especially to serve the day-to-day wood casegoods requirements of Knoll dealers.
Desks, Casegoods, and Tables accounted for approximately 0.9% of our sales in 2009, 1.4% of our sales in 2008 and 0.4% of our sales in 2007.
Specialty Products
OurKnollStudio®,KnollTextiles®,KnollExtra®,Spinneybeck®, andEdelman® businesses serve as a marketing and distribution umbrella for our portfolio of specialty product lines. These businesses, which represented 23.9% of our revenue in 2009, are our highest margin product lines and enhance our design and quality reputation.
KnollStudio is a renowned source for classic modern furniture and spirited new designs of unparalleled quality for the workplace, home, hotels, restaurants and government and educational institutions. TheKnollStudio portfolio includes a range of lounge seating; side, café and dining chairs; barstools; and conference, dining and occasional tables.KnollStudio has a long history of working with celebrated architects and designers from around the world, including Ludwig Mies van der Rohe, Marcel Breuer, Eero Saarinen, Isamu Noguchi, Warren Platner, Frank Gehry, Maya Lin, Jens Risom, Kazuhide Takahama, and Ross Lovegrove. In addition,KnollStudio manufactures a collection of original furniture designs by Florence Knoll. In 2006,KnollStudio collaborated with renowned New York-based architectural firm Shelton, Mindel & Associates to produce a range of elegant lounge seating, an innovative wood side chair and a series of low tables. In 2008,KnollStudio collaborated with Milanese architect Cini Boeri on an eponymous collection of lounge furnishings and with New York interior designer Joseph Paul D'Urso on a lounge collection. Both designers were renewing relationships with Knoll that had begun with signature collections decades ago. In 2009, KnollStudio introduced the Jehs & Laub Lounge Collection, sculpted seating reflecting contemporary lifestyles.
5
Table of Contents
In 2004,KnollStudio establishedKnoll Space as a formalized sales program for the retail market, making it easier for consumers to bring the best of Knoll furnishings into their home and home office. The program consists of independent specialty retailers and e-tailers nationwide that sell our iconic modern classics and selected contemporary designs as well as selected products with crossover home office appeal. Through this program we sell ourKnollStudio and selected other products through approximately 50 retailers, with an aggregate of over 120 locations.
KnollTextiles®,established in 1947 to create high-quality textiles for Knoll furniture, offers upholstery, panel fabrics, wallcoverings and drapery that harmonize color, pattern and texture. KnollTextiles® offers products for corporate, hospitality, healthcare and residential interiors. KnollTextiles® products are used in the manufacture of Knoll furniture and are sold to clients for use in other manufacturers' products. In 2008, KnollTextiles® introduced Knoll Luxe®, a new brand of fashion forward textiles created by KnollTextiles® creative director Dorothy Cosonas. In 2008, along with the ongoing contributions of designer Suzanne Tick, the division launched a Knoll Luxe® collection by the celebrated fashion designers Proenza Schouler. For each of the past six years, KnollTextiles® has received prestigious awards. In 2009, KnollTextiles received a Best of Neocongold award for Suzanne Tick's Air Rights.During 2008, KnollTextiles® received three Best of NeoCon®gold awards: Cosonas's debut collection of Knoll Luxe® in the upholstery category, Suzanne Tick's Amplifyand Bandwidthfor panel fabric; and Escala,also by Tick, for drapery. In 2007, KnollTextiles® received two Best of NeoCon® awards, one for Miraand Cyclonewhich are part of the KnollTextiles® Archival Collection, and one for Tick's new wallcovering, the Lusterware Collection.
KnollExtra offers accessories that complement Knoll office furniture products, including technology support accessories, desktop organizational tools, lighting and storage.KnollExtra integrates technology comfortably into the workplace, meeting the increased demand for flat panel monitor supports, central processing unit holders as cable management, which deliver adjustability and space savings. During 2009, KnollExtra introduced theSapper™ Monitor Arm Collection, designed by renowned industrial designer Richard Sapper. The collection provides a clean, modern solution to technology challenges in the modern workplace.
Spinneybeck Enterprises, Inc., or Spinneybeck, our wholly owned subsidiary, offers leathers and related products, including leather rugs and wall panels.Spinneybeck supplies high-quality upholstery leather for use on Knoll furniture and for sale directly to clients, including other office furniture manufacturers, upholsterers, aviation, custom coach and boating manufacturers.
Edelman Leather LLC, our wholly owned subsidiary, which we formed to acquire Teddy & Arthur Edelman, Limited in October 2007, supplies fine leathers to residential, hospitality, aviation and contract office furniture markets.
Specialty products accounted for approximately 23.9% of our sales in 2009, 22.7% of our sales in 2008 and 19.0% of our sales in 2007.
European Products
Knoll Europe has a product offering that allows clients to purchase a complete office environment from a single source. In addition, we offer certain products designed specifically for the European market. In 2006, we introduced the newWa™ desking system.Wa™ reinvents desks and storage through its design and construction in a linear and well proportioned modern vernacular. Our presence in the European market provides strategic positioning with clients that have international offices where they would like to maintain their Knoll facility standard. In addition to working with North American clients' international offices, we also have a local European client base.
6
Table of Contents
In Europe, the core product categories include: (i) desk systems, including theWa™ desking system, theKnollScope®, and thePL1™ system; (ii) KnollStudio; (iii) seating, including a comprehensive range of chairs; and (iv) storage units, which are designed to complement Knoll desk products.
Knoll Europe accounted for approximately 7.7% of our sales in 2009, 9.9% in 2008 and 8.5% in 2007.
Product Design and Development
Our design philosophy reflects our historical commitment to working with the preeminent industrial designers and architects to develop products that delight and inspire. By combining the designers' creative vision with our commitment to developing products that address changing business needs, we continue to generate strong demand for our product offerings while cultivating brand loyalty among target clients. Our enviable history of nurturing design partner relationships continues to attract the world's leading designers. In addition, these types of collaborations are consistent with our commitment to a lean organizational structure and incentive-based compensation, by utilizing a variable royalty-based fee as opposed to the fixed costs typically associated with a larger in-house design staff.
Product initiatives rely upon a New Product Commercialization Process to ensure quality and repeatability of the development process. This helps to reduce product development cycle time and improves the quality of output. We use Pro/ENGINEER® design tools and rapid prototyping technology to reduce product design and development lead times and to improve responsiveness to special requests for customized solutions. Working very closely with the designers during the early phase of development helps to ensure the most viable products that balance innovative, modern design with practical, functional style. Cross-functional teams are formed for all major development efforts with dedicated leaders to facilitate a seamless flow into manufacture and accountability on cost and schedule. Increasingly, major emphasis on total environmental impact is factored in to material selection and manufacturing process decisions.
Research and development expenses, which are expensed as incurred, were $14.4 million for 2009, $16.3 million for 2008, and $15.9 million for 2007.
Sales and Distribution
We generate sales with our direct sales force and a network of independent dealers, who jointly market and sell our products. We generally rely on these independent dealers to also provide a variety of important specification, installation and after-market services to our clients. Our dealers generally operate under one-year, non-exclusive agreements.
Our clients are typically Fortune 1000 companies, governmental agencies and other medium to large sized organizations in a variety of industries including financial, legal, accounting, education, healthcare and hospitality. Our direct sales force and independent dealers in North America work in close partnership with clients and design professionals to specify distinctive work environments. Our direct sales representatives, in conjunction with the independent dealers, sell to and call directly on key clients. Our independent dealers also call on many other medium and small sized clients to provide seamless sales support and client service. We have an over $7.0 billion installed base of office systems, which provides a strong platform for recurring and add-on sales.
Our products and knowledgeable sales force have generated strong brand recognition and loyalty among architects, designers and corporate facility managers, all of whom are key decision makers in the office furniture purchasing process. Our strong relationships with architects and design professionals help us stay abreast of key workplace trends and position us to better meet the changing needs of clients. For example, we have invested in training all of our architect and designer specialists as
7
Table of Contents
Leadership in Energy and Environmental Design ("LEED®") accredited professionals to help clients better address environmental issues that arise in the design of the workplace.
We have aligned our sales force to target strategic areas of opportunity. For example, our healthcare division was created to target healthcare related businesses. We have also placed sales representatives and technical specialists into certain dealerships to support programs such asKnoll Essentials, which is described below.
In addition to coordinating sales efforts with the sales representatives, the dealers generally handle project management, installation and maintenance for client accounts after the initial product selection and sale. Although many of these dealerships also carry products of other manufacturers, they have agreed not to act as dealers for our principal direct competitors. We have not experienced significant dealer turnover. Our dealers' substantial commitment to understanding our product lines, and their strong relationships with us, serve to discourage dealers from changing vendor affiliations. We are not significantly dependent on any one dealer, the largest of which accounted for approximately 9.2%, 6.5% and 6.8% of our North American sales in 2009, 2008 and 2007, respectively.
We provide product training for our sales force and dealer sales representatives, who make sales calls primarily to small to medium sized businesses. As part of our commitment to building relationships with our dealer sales representatives, we introduced theKnoll Essentials program in January 2004.Knoll Essentials is a catalog program developed in response to dealer requests for a consolidated, user-friendly selling tool for day-to-day systems, seating, storage and accessory products. TheKnoll Essentials program includes dealer incentives to sell our products. We also employ a dedicated team of dealer sales representatives to work with our dealerships.
Excluding sales to U.S. government agencies, no single end user or customer represented more than 3.2% of our North American sales during 2009. Sales to U.S. government entities under the GSA contracts aggregated approximately 16.0% of our consolidated sales in 2009, with no single U.S. government order accounting for more than 4.0% of consolidated sales. The U.S. government typically can terminate or modify any of its contracts with us either for its convenience or if we default by failing to perform under the terms of the applicable contract.
In Europe, we sell products in largely the same manner as in North America-through a direct sales force and a network of dealers-with the majority of sales coming from the United Kingdom, France and Italy, as well as export markets in the Middle East. We also sell products designed and manufactured in North America to the international operations of core clients.
Manufacturing and Operations
We operate manufacturing sites in North America, with plants located in East Greenville, Pennsylvania, Grand Rapids and Muskegon, Michigan, and Toronto, Canada. In addition, we have two plants in Italy: one in Foligno and one in Graffignana. We manufacture and assemble products to specific customer order and operate all facilities under a philosophy of continuous improvement, lean manufacturing and efficient asset utilization. All plants are registered under ISO 9000, an internationally developed set of quality criteria for manufacturing companies. Additionally, the North American plants are ISO 14001 certified, which reflects our commitment to environmentally responsible practices.
In 2009, our East Greenville location recertified its "Star" rating under the Occupational Safety and Health Administration's (OSHA) Voluntary Protection Program (VPP). A Star rating is the highest a company can obtain in OSHA's premier partnership program and to achieve this rating our East Greenville site had to demonstrate a comprehensive safety and health process with strong management leadership, include all employees as active participants and ensure an injury rate substantially below the average for the industry. The Star rating allows us to join an elite and exclusive group of less than 2,400 companies nationwide that have demonstrated the dedication and commitment to safety.
8
Table of Contents
The root of our continuous improvement efforts lies in the philosophy of lean manufacturing that drives operations. As part of this philosophy, we partner with suppliers who can supply our facilities efficiently, often with just-in-time deliveries, thus allowing us to reduce our raw materials inventory. We also utilize "Kaizen" work groups in the plants to develop best practices to minimize scrap, time and material waste at all stages of the manufacturing process. The involvement of employees at all levels ensures an organizational commitment to lean and efficient manufacturing operations.
In addition to the continued focus on enhancing the efficiency of the manufacturing operations, we also seek to reduce costs through our global sourcing effort. We have capitalized on raw material and component cost savings available through lower cost global suppliers. This broader view of potential sources of supply has enhanced our leverage with domestic supply sources, and we have been able to reduce cycle times by extracting improvements from all levels throughout the supply chain.
Raw Materials and Suppliers
The purchasing function in North America is centralized at the East Greenville facility. This centralization, and the close relationships with our primary suppliers, has enhanced our ability to realize purchasing economies of scale and implement "just-in-time" inventory practices. Steel, lumber, paper, paint, plastics, laminates, particleboard, veneers, glass, fabrics, leathers and upholstery filling material are used in our manufacturing process. Both domestic and overseas suppliers of these materials are selected based upon a variety of factors, with the price and quality of the materials and the supplier's ability to meet delivery requirements being primary factors in such selection. We do not generally enter into long-term supply contracts and, as a result, we can be vulnerable to fluctuations in the prices for these materials. No supplier is the only available source for a particular component or raw material. However, because of the specialization involved with some of our components, it can take a significant amount of time, money and effort to move to an alternate source.
Competition
The office furniture market is highly competitive. Office furniture companies compete on the basis of (i) product design, including performance, ergonomic and aesthetic features, (ii) product quality and durability, (iii) relationships with clients, architects and designers, (iv) strength of dealer and distributor network, (v) on-time delivery and service performance, (vi) commitment to environmental standards by offering products that help clients achieve LEED® certified facilities and minimize environment impact, and (vii) price. We estimate that we had an approximate 9.1% market share in the U.S. office furniture market in 2009.
Some of our competitors, especially those in North America, are larger and have significantly greater financial, marketing, manufacturing and technical resources than we have. Our most significant competitors in primary markets are Herman Miller, Inc., Steelcase, Inc., Haworth, Inc. and, to a lesser extent, Allsteel, Inc., an operating unit of HNI Corporation, and Teknion Corporation. These competitors have a substantial volume of furniture installed at businesses throughout North America, providing a continual source of demand for further products and enhancements. Moreover, the products of these competitors have strong acceptance in the marketplace. Although we believe that we have been able to compete successfully in the markets to date, there can be no assurance that we will be able to continue to do so in the future.
Patents and Trademarks
We consider securing and protecting our intellectual property rights to be important to the business. We own approximately 71 active U.S. utility patents on various components used in our products and systems and approximately 45 active U.S. design patents. We also own approximately 155 patents in various foreign countries. The scope and duration of our patent protection varies throughout
9
Table of Contents
the world by jurisdiction and by individual product. In particular, patents for individual products extend for varying periods of time according to the date a patent application is filed, the date a patent is granted and the term of patent protection available in the jurisdiction granting the patent (generally twenty years from the date of filing in the U.S, for example). We believe that the duration of the applicable patents we are granted is adequate relative to the expected lives of our products. We own approximately 58 trademark registrations in the U.S., including registrations to the following trademarks, as well as related stylized depictions of the Knoll word mark: Knoll®, KnollStudio®, KnollExtra®, Good Design Is Good Business®, A3®, Autostrada®, Bulldog®, Calibre®, Currents®, Dividends®, Equity®, Parachute®, Propeller®, Reff®, RPM®, Spinneybeck®, Upstart®, Generation by Knoll®, KnollTextiles®, and Knoll Luxe®. We also own approximately 163 trademarks registered in foreign countries including the LIFE® trademark which was purchased in December 2006. The scope and duration of our trademark protection varies throughout the world, with some countries protecting trademarks only as long as the mark is used, and others requiring registration of the mark and the payment of registration (generally ten years from the date of filing in the U.S., for example). In order to protect the indefinite duration, we make filings to continue registration of our trademarks.
In October 2004, we received registered trademark protection in the United States for five of our world-famous furniture designs created by Ludwig Mies van der Rohe—the Barcelona Chair, the Barcelona Stool, the Barcelona Couch, the Barcelona Table and the Flat Bar Brno Chair. This protection recognizes the renown of these designs and reflects our commitment to ensuring that when architects, furniture retailers, businesses and the public purchase a Ludwig Mies van der Rohe design, they will be purchasing the authentic product, manufactured to the designer's historic specifications. Barcelona® is a registered trademark in the U.S., Canada and European Community owned by Knoll, Inc.
Backlog
Sales backlog represents orders we have accepted but which have not yet shipped. Our sales backlog was $153.0 million at December 31, 2009, $201.7 million at December 31, 2008 and $190.7 million at December 31, 2007. We manufacture substantially all of our products to order and expect to fill substantially all outstanding unfilled orders within the next twelve months. As such, backlog is not a significant factor used to predict our long-term business prospects.
Foreign and Domestic Operations
Our principal manufacturing operations and markets are in North America, and we also have manufacturing operations and markets in Europe. Our sales to clients and net property, plant and equipment are summarized by geographic areas below. Sales to clients are attributed to the geographic areas based on the point of sale.
| | | | | | | | | | | | | |
| | United States | | Canada | | Europe | | Consolidated | |
|---|
| | (in thousands)
| |
|---|
2009 | | | | | | | | | | | | | |
Sales to clients | | $ | 688,664 | | $ | 26,831 | | $ | 64,538 | | $ | 780,033 | |
Property, plant and equipment, net | | | 83,291 | | | 33,112 | | | 18,642 | | | 135,045 | |
2008 | | | | | | | | | | | | | |
Sales to clients | | $ | 964,875 | | $ | 40,229 | | $ | 115,043 | | $ | 1,120,147 | |
Property, plant and equipment, net | | | 85,680 | | | 31,225 | | | 15,263 | | | 132,168 | |
2007 | | | | | | | | | | | | | |
Sales to clients | | $ | 926,018 | | $ | 36,739 | | $ | 93,057 | | $ | 1,055,814 | |
Property, plant and equipment, net | | | 85,824 | | | 41,394 | | | 16,425 | | | 143,643 | |
10
Table of Contents
Environmental Matters
We believe that we are substantially in compliance with all applicable laws and regulations for the protection of the environment and the health and safety of our employees based upon existing facts presently known to us. Compliance with federal, state, local and foreign environmental laws and regulations relating to the discharge of substances into the environment, the disposal of hazardous wastes and other related activities has had and will continue to have an impact on our operations, but has, since 1990, been accomplished without having a material adverse effect on our operations. There can be no assurance that such laws and regulations will not change in the future or that we will not incur significant costs as a result of such laws and regulations. We have trained staff responsible for monitoring compliance with environmental, health and safety requirements. Our goal is to reduce and, wherever possible, eliminate the creation of hazardous waste in our manufacturing processes. While it is difficult to estimate the timing and ultimate costs to be incurred due to uncertainties about the status of laws, regulations and technology, based on information currently known to management, we do not expect environmental costs or contingencies to have a material adverse effect on our consolidated financial position, results of operations or cash flows. The operation of manufacturing plants entails risks in these areas, however, and we cannot be certain that we will not incur material costs or liabilities in the future which could adversely affect our operations.
We have been identified as a potentially responsible party pursuant to the Comprehensive Environmental Response Compensation and Liability Act, or "CERCLA", for remediation costs associated with waste disposal sites previously used by us. CERCLA can impose liability for costs to investigate and remediate contamination without regard to fault or the legality of disposal and, under certain circumstances, liability may be joint and several resulting in one responsible party being held responsible for the entire obligation. Liability may also include damages for harm to natural resources. The remediation costs and our allocated share at some of these CERCLA sites are unknown. We may also be subject to claims for personal injury or contribution relating to CERCLA sites. We would reserve amounts for such matters when expenditures are probable and reasonably estimable.
Employees
As of December 31, 2009, we employed a total of 3,177 people, consisting of 2,128 hourly and 1,049 salaried employees. The Grand Rapids, Michigan plant is the only unionized plant within the U.S. and has an agreement with the Carpenters Union, Local 1615, of the United Brotherhood of Carpenters and Joiners of America, Affiliate of the Carpenters Industrial Council (the Union), covering approximately 280 hourly employees. The Collective Bargaining Agreement expires August 27, 2011. From time to time, there have been unsuccessful efforts to unionize at our other North American locations. We believe that relations with our employees are good. Nonetheless, it is possible that our employees may continue attempts to unionize. Certain workers in the facilities in Italy are also represented by unions. We have experienced brief work stoppages from time to time at our plants in Italy, none of which have exceeded eight hours. Work stoppages are relatively common occurrences at many Italian manufacturing plants and are usually related to national or local issue, not necessarily related specifically to Knoll. We had five such work stoppages in 2009, with duration of 36 hours in total. None of these work stoppages were unique to us, and these work stoppages have not materially affected our performance.
Available Information
Our annual report on Form 10-K, quarterly reports on Form 10-Q, current reports on Form 8-K and all amendments to those reports are made available free of charge through the "Investors Relations" section of our website at www.knoll.com, as soon as practicable after such material is electronically filed with or furnished to the U.S. Securities and Exchange Commission.
11
Table of Contents
ITEM 1A. RISK FACTORS
RISK FACTORS
Risks Related to our Business
Our product sales are tied to corporate spending and service-sector employment, which are outside of our control. Our sales and/or growth in sales would be adversely affected by a recessionary economy characterized by decreased corporate spending and service-sector employment.
Our sales are significantly impacted by the level of corporate spending primarily in North America, which, in turn, is a function of the general economic environment. In a recessionary economy like we have experienced in the past year, business confidence, service-sector employment, corporate cash flows and non-residential commercial construction decrease, which typically leads to a decrease in demand for office furniture. In addition, a recessionary economy may also result in saturation of the market by "just new" used office systems, leading to a decrease in demand. Sales of office systems, which have historically accounted for more than half of our revenues, represent longer term and higher cost investments for our clients. As a result, sales of office systems are more severely impacted by decreases in corporate spending than sales of seating, files and storage and casegoods, and demand for office systems typically takes longer to respond to an economic recovery. Due to the economic conditions in 2009, our sales decreased across all product categories and geographies.
Geopolitical uncertainties, terrorist attacks, acts of war, natural disasters, increases in energy and other costs or combinations of such and other factors that are outside of our control could at any time have a significant effect on the North American economy, and, therefore, our business. The occurrence of any of these or similar events in the future could result in downward pressure on the economy, which we would expect to cause demand for our products to decline and competitive pricing pressures to increase.
Continued weakness in the economy or further uncertainty in the financial markets may adversely affect our results of operations and financial condition, as well as the financial soundness of our customers and suppliers.
Over the past eighteen months, the global capital and credit markets have experienced a period of unprecedented turmoil and upheaval, characterized by the bankruptcy, failure, collapse or sale of various financial institutions. The timing and extent of any recovery is uncertain and any continued weakness in the economy may adversely affect the demand for our products and services and our margins and profitability. Further, our ability to access capital may be restricted at a time when we would like, or need, to access financial markets. In addition, interest rate fluctuations, financial market volatility or credit market disruptions may negatively affect our customers' and our suppliers' ability to obtain credit to finance their businesses on acceptable terms. As a result, our customers' needs and ability to purchase our products or services may decrease, and our suppliers may increase their prices, reduce their output or change their terms of sale. If our customers' or suppliers' operating and financial performance deteriorates, or if they are unable to make scheduled payments or obtain credit, our customers may not be able to pay, or may delay payment of, accounts receivable owed to us, and our suppliers may restrict credit or impose different payment terms on us. Any inability of customers to pay us for our products and services, or any demands by suppliers for different payment terms, may adversely affect our earnings and cash flow.
12
Table of Contents
We may have difficulty increasing or maintaining our prices as a result of price competition, which could lower our profit margins. Our competitors may develop new product designs that give them an advantage over us in making future sales.
Office furniture companies compete on the basis of, among other things, price and product design. Since our competitors offer products that are similar to ours, we face significant price competition from our competitors, which tends to intensify during an industry downturn. This price competition impacts our ability to implement price increases or, in some cases, such as during an industry downturn, maintain prices, which could lower our profit margins. Additionally, our competitors may develop new product designs that achieve a high level of customer acceptance, which could give them a competitive advantage over us in making future sales.
Our efforts to introduce new products that meet customer and workplace requirements may not be successful, which could limit our sales growth or cause our sales to decline.
To keep pace with workplace trends, such as changes in workplace design and increases in the use of technology, and with evolving regulatory and industry requirements, including environmental, health, safety and similar standards for the workplace and for product performance, we must periodically introduce new products. The introduction of new products requires the coordination of the design, manufacturing and marketing of such products, which may be affected by factors beyond our control. The design and engineering of certain of our new products can take up to a year or more, and further time may be required to achieve client acceptance. In addition, we may face difficulties in introducing new products if we cannot successfully align ourselves with independent architects and designers who are able to design, in a timely manner, high quality products consistent with our image. Accordingly, the launch of any particular product may be later or less successful than originally anticipated by us. Difficulties or delays in introducing new products or lack of customer acceptance of new products could limit our sales growth or cause our sales to decline.
We may not be able to manage our business effectively if we are unable to retain our experienced management team or recruit other key personnel.
The success of our operations is highly dependent upon our ability to attract and retain qualified employees and upon the ability of our senior management and other key employees to implement our business strategy. We believe there are only a limited number of qualified executives in the industry in which we compete. We rely substantially upon the services of Andrew B. Cogan, our Chief Executive Officer. The loss of the services of Mr. Cogan or other key members of our management team could seriously harm our efforts to successfully implement our business strategy.
While we currently maintain a key person life insurance policy with respect to Mr. Cogan this insurance may not be sufficient to compensate us for any harm to our business resulting from loss of his services. The inability to attract and retain other talented personnel could also affect our ability to successfully implement our business strategy.
We are dependent on the pricing and availability of raw materials and components, and price increases and unavailability of raw materials and components could lower sales, increase our cost of goods sold and reduce our profits and margins.
We require substantial amounts of raw materials, which we purchase from outside sources. Steel, plastics and wood related materials are the main raw materials used in the manufacturing of our products. The prices and availability of raw materials are subject to change or curtailment due to, among other things, the supply of, and demand for, such raw materials, changes in laws or regulations, including duties and tariffs, suppliers' allocations to other purchasers, interruptions in production by raw materials or component parts suppliers, changes in currency exchange rates and worldwide price levels. We can be significantly impacted by price increases in these raw materials.
13
Table of Contents
Although no supplier is the only available source for a particular component or raw material, some of our products and components are extremely specialized and, therefore, it can take a significant amount of time and money to move from one supply source to another. Any failure to obtain raw materials and components on a timely basis, or any significant delays or interruptions in the supply of raw materials or components, could prevent us from being able to manufacture products ordered by our clients in a timely fashion, which could have a negative impact on our reputation and our dealership network, and could cause our sales to decline.
We are affected by the cost of energy and increases in energy prices could reduce our margins and profits.
The profitability of our operations is sensitive to the cost of energy through our transportation costs, the cost of petroleum-based materials, like plastics, and the cost of operating our manufacturing facilities. Energy costs have been volatile in recent years due to changes in global supply and demand. Although we have been successful in countering recent energy price increases, primarily through our global sourcing initiatives and continuous improvement programs, we may not be able to continue to offset such costs at current price levels, or if these prices continue to increase. If the price of petroleum-based products, the cost of operating our manufacturing facilities or our transportation costs continue to increase, it could have a negative impact on our gross margins and profitability.
We rely upon independent furniture dealers, and a loss of a significant number of dealers could affect our business, financial condition and results of operations.
We rely on a network of independent dealers for the joint marketing of our products to small and mid-sized accounts, and to assist us in the marketing of our products to large accounts. We also rely upon these dealers to provide a variety of important specification, installation and after-market services to our clients. Our dealers operate, generally, under one-year, non-exclusive agreements. There is nothing to prevent our dealers from terminating their relationships with us. In addition, individual dealers may not continue to be viable and profitable and may suffer from the lack of available credit. While we are not significantly dependent on any single dealer, one dealer accounted for 9.2% of our North American sales in 2009. If dealers go out of business or are restructured, we may suffer losses because they may not be able to pay us for furniture previously delivered to them. The loss of a dealer relationship could also negatively affect our ability to maintain market share in the affected geographic market and to compete for and service clients in that market until a new dealer relationship is established. Establishing a viable dealer in a market can take a significant amount of time and resources. The loss or termination of a significant dealer or a significant number of dealer relationships could cause significant difficulties for us in marketing and distributing our products, resulting in a decline in our sales.
One of our largest clients currently is the U.S. government, a relationship which is subject to uncertain future funding levels and federal procurement laws and requires restrictive contract terms; any of these factors could curtail current or future business.
For the year ended December 31, 2009, we derived approximately 16.0% of our revenue from sales to various agencies and departments within the U.S. government. Our ability to compete successfully for and retain business with the U.S. government is highly dependent on cost-effective performance and compliance with complex procurement laws. Until recently, federal procurement laws required government agencies to purchase furniture products from Federal Prison Industries, Incorporated. If these or similar laws would be re-instituted, it would make it more difficult for us to sell our furniture to agencies and departments of the U.S. government. Our government business is also sensitive to changes in national and international priorities and U.S. government budgets.
The U.S. government typically can terminate or modify its contracts with us either for its convenience or if we default by failing to perform under the terms of the applicable contract. A
14
Table of Contents
termination arising out of our default could expose us to liability and impede our ability to compete in the future for contracts and orders. Furthermore, if we were found to have committed fraud or certain criminal offenses, we could be suspended or debarred from all further government contracting. Given the percentage of our revenues represented by sales to the U.S. government in 2009, any factors that would negatively impact our relationship with the U.S. government would adversely impact our sales and results of operations.
Our efforts to diversify our sources of revenue may not be effective and may expose us to new risks
Historically, the majority of our revenues were derived from the sales of office systems in North America. We have pursued a strategy to diversify our sources of revenue and reduce our dependence on North American office system sales. While we believe that this strategy enables us to better maintain and grow our sales and profitability during cyclical ups and downs in the industry, there can be no assurance that this diversification strategy will be effective in achieving these goals. Our diversification strategy involves the expansion of our specialty and complimentary businesses, which may expose us to business risks that we have not experienced. We also may incur significant costs in pursuing our diversification strategy, and those costs may not be fully offset by increased revenues associated with new business lines.
We operate with leverage, and a significant amount of cash will be required to service our indebtedness. Restrictions imposed by the terms of our indebtedness may limit our operating and financial flexibility.
As of December 31, 2009, we had total consolidated outstanding debt of approximately $295.3 million, which consisted of $295.0 million under our revolving credit facility and $0.3 million under local credit facilities maintained by our foreign subsidiaries. We also had $3.7 million in outstanding commitments under letters of credit.
Our existing revolving credit facility permits us to borrow up to $500.0 million. However, we are permitted to expand our revolving credit facility by an additional $200.0 million, subject to certain limitations and satisfaction of certain conditions, including compliance with certain financial covenants.
As of December 31, 2009, the total remaining credit available to us under our credit facility and those of our foreign subsidiaries was $211.2 million, subject to compliance with the financial covenants contained in our facility as further described on page 31. If we were to borrow the maximum available to us under our credit facility and those of our foreign subsidiaries, we would have total consolidated outstanding debt of approximately $506.5 million. The high level of our indebtedness could have important consequences to holders of our common stock, given that:
- •
- a substantial portion of our cash flow from operations must be dedicated to fund scheduled payments of principal and debt service and will not be available for other purposes;
- •
- our ability to obtain additional debt financing in the future for working capital, capital expenditures, research and development or acquisitions may be limited by the terms of our credit facility; and
- •
- the terms of our credit facility also impose other operating and financial restrictions on us, which could limit our flexibility in reacting to changes in our industry or in economic conditions generally.
Our revolving credit facility prevents us and our subsidiaries from incurring any additional indebtedness other than (i) borrowings under our existing revolving credit facility; (ii) certain types of indebtedness that may be incurred subject to aggregate dollar limitations identified in the credit facility, including, without limitation, purchase money indebtedness and capital lease obligations, indebtedness incurred in connection with a permitted acquisition, and loans obtained through an expansion of the facility, all of which cannot exceed $250.0 million at any time, and (iii) other types of indebtedness that
15
Table of Contents
are not limited to specific dollar limitations, such as indebtedness incurred in the ordinary course of business and unsecured, subordinated indebtedness. The aggregate amount of indebtedness that we may incur pursuant to these exceptions is further limited by the financial covenants in our revolving credit facility and, therefore, will depend on our future results of operations and cannot be determined at this time. Furthermore, although we may incur unlimited amounts of certain types of indebtedness, subject to compliance with these financial covenants, the amount of indebtedness that we may actually be able to incur will depend on the terms on which such types of debt financing are available to us, if available at all.
As a result of the foregoing, we may be prevented from engaging in transactions that might further our growth strategy or otherwise be considered beneficial to us. A breach of any of the covenants in our revolving credit facility could result in a default thereunder. If payments to the lenders under our revolving credit facility were to be accelerated, our assets could be insufficient to repay in full the indebtedness under our credit facility and our other liabilities. Any such acceleration could also result in a foreclosure on all or substantially all of our subsidiaries' assets, which would have a negative impact on the value of our common stock and jeopardize our ability to continue as a going concern.
We may require additional capital in the future, which may not be available or may be available only on unfavorable terms.
Our capital requirements depend on many factors, including capital improvements, tooling and new product development. To the extent that our existing capital is insufficient to meet these requirements and cover any losses, we may need to raise additional funds through financings or curtail our growth and reduce our assets. Any equity or debt financing, if available at all, may be on terms that are not favorable to us. Equity financings could result in dilution to our stockholders, and the securities may have rights, preferences and privileges that are senior to those of our common stock. If our need for capital arises because of significant losses, the occurrence of these losses may make it more difficult for us to raise the necessary capital.
An inability to protect our intellectual property could have a significant impact on our business.
We attempt to protect our intellectual property rights, both in the United States and in foreign countries, through a combination of patent, trademark, copyright and trade secret laws, as well as licensing agreements and third-party nondisclosure and assignment agreements. Because of the differences in foreign trademark, patent and other laws concerning proprietary rights, our intellectual property rights do not generally receive the same degree of protection in foreign countries as they do in the United States. In some parts of the world, we have limited protections, if any, for our intellectual property. Our ability to compete effectively with our competitors depends, to a significant extent, on our ability to maintain the proprietary nature of our intellectual property. The degree of protection offered by the claims of the various patents, trademarks and service marks may not be broad enough to provide significant proprietary protection or competitive advantages to us, and patents, trademarks or service marks may not be issued on our pending or contemplated applications. In addition, not all of our products are covered by patents. It is also possible that our patents, trademarks and service marks may be challenged, invalidated, cancelled, narrowed or circumvented.
In the past, certain of our products have been copied and sold by others. We try to enforce our intellectual property rights, but we have to make choices about where and how we pursue enforcement and where we seek and maintain patent protection. In many cases, the cost of enforcing our rights is substantial, and we may determine that the costs of enforcement outweigh the potential benefits. If we are unable to maintain the proprietary nature of our intellectual property with respect to our significant current or proposed products, our competitors may be able to sell copies of our products, which could adversely affect our ability to sell our original products and could also result in competitive pricing pressures, which may negatively affect our profitability.
16
Table of Contents
If third parties claim that we infringe upon their intellectual property rights, we may incur liability and costs and may have to redesign or discontinue an infringing product.
We face the risk of claims that we have infringed third parties' intellectual property rights. Companies operating in our industry routinely seek patent protection for their product designs, and many of our principal competitors have large patent portfolios. Prior to launching major new products in our key markets, we normally evaluate existing intellectual property rights. However, our competitors may have filed for patent protection which is not, at the time of our evaluation, a matter of public knowledge. Our efforts to identify and avoid infringing third parties' intellectual property rights may not be successful. Any claims of patent or other intellectual property infringement, even those without merit, could (i) be expensive and time consuming to defend; (ii) cause us to cease making, licensing or using products that incorporate the challenged intellectual property; (iii) require us to redesign, reengineer, or rebrand our products or packaging, if feasible; or (iv) require us to enter into royalty or licensing agreements in order to obtain the right to use a third party's intellectual property.
We could be required to incur substantial costs to comply with environmental requirements. Violations of, and liabilities under, environmental laws and regulations may increase our costs or require us to change our business practices.
Our past and present ownership and operation of manufacturing plants are subject to extensive and changing federal, state, local and foreign environmental laws and regulations, including those relating to discharges to air, water and land, the handling and disposal of solid and hazardous waste and the cleanup of properties affected by hazardous substances. As a result, we are involved from time to time in administrative and judicial proceedings and inquiries relating to environmental matters and could become subject to fines or penalties related thereto. We cannot predict what environmental legislation or regulations will be enacted in the future, how existing or future laws or regulations will be administered or interpreted or what environmental conditions may be found to exist. Compliance with more stringent laws or regulations, or stricter interpretation of existing laws, may require additional expenditures by us, some of which may be material. We have been identified as a potentially responsible party pursuant to the Comprehensive Environmental Response, Compensation and Liability Act of 1980, or CERCLA, for remediation costs associated with waste disposal sites previously used by us. In general, CERCLA can impose liability for costs to investigate and remediate contamination without regard to fault or the legality of disposal and, under certain circumstances, liability may be joint and several, resulting in one party being held responsible for the entire obligation. Liability may also include damages for harm to natural resources. The remediation costs and our allocated share at some of these CERCLA sites are unknown. We may also be subject to claims for personal injury or contribution relating to CERCLA sites. We reserve amounts for such matters when expenditures are probable and reasonably estimable.
We are subject to potential labor disruptions, which could have a significant impact on our business.
Certain of our employees located in Grand Rapids, Michigan and Italy are represented by unions. The collective bargaining agreement for our Grand Rapids location expires August 27, 2011. We have also had sporadic, to date unsuccessful, attempts to unionize our other North American manufacturing locations and have experienced a number of brief work stoppages at our facilities in Italy as a result of national and local issues. While we believe that we have good relations with our workforce, we may experience work stoppages or other labor problems in the future, and further unionization efforts may be successful. Any prolonged work stoppage could have an adverse effect on our reputation, our vendor relations and our dealership network. Moreover, because substantially all of our products are manufactured to order, we do not carry finished goods inventory that could mitigate the effects of a prolonged work stoppage.
17
Table of Contents
Product defects could adversely affect our results of operations.
Our customers may encounter product defects that could potentially arise in the course of our development of new products or due to manufacturing problems. If product defects do arise, we could incur product warranty costs, product liability costs and costs associated with recalling and repairing defective products. While we maintain a reserve for our product warranty costs based on estimates of the costs that may be incurred under the warranties on all of our products, our actual warranty costs may exceed this reserve, resulting in a need to increase the amounts accrued for warranty costs. We also maintain product liability and other insurance coverage that we believe to be generally in accordance with industry practices, but our insurance coverage does not extend to field visits to repair, retrofit or replace defective products, or to product recalls. As a result, our insurance coverage may not be adequate to protect us fully against substantial claims and costs that may arise from product defects, particularly if we have a large number of defective products that we must repair, retrofit, replace or recall. Sales of our products could be adversely affected by excessive warranty claims, product recalls and adverse perceptions of product quality. As a result of these factors, product defects could have a material adverse effect on our results of operations.
We may be vulnerable to the effects of currency exchange rate fluctuations, which could increase our expenses.
We primarily sell our products and report our financial results in U.S. dollars, but we generate some of our revenues and pay some of our expenses in other currencies. Paying our expenses in other currencies can result in a significant increase or decrease in the amount of those expenses in U.S. dollar terms, which affects our profits.
In the future, any foreign currency appreciation relative to the U.S. dollar would increase our expenses that are denominated in that currency. Additionally, as we report currency in the U.S. dollar, our financial position is affected by the strength of the currencies in countries where we have operations relative to the strength of the U.S. dollar. The principal foreign currencies in which we conduct business are the Canadian dollar and the Euro. Approximately 11.7% of our revenues in 2009 and 33.0% of our cost of goods sold in 2009 were denominated in currencies other than the U.S. dollar. From time to time we review our foreign currency exposure and evaluate whether we should enter into hedging transactions.
Pension costs or funding requirements could increase at a higher than anticipated rate.
We administer two defined benefit pension plans, which hold significant amounts of equity securities. Changes in interest rates or in the market value of plan assets could affect the funded status of our pension plans. This could cause volatility in our benefits costs which could increase future funding requirements of our pension plans and have a negative impact on our results of operations, financial condition and cash flows. Our future funding obligations also are affected by the Pension Protection Act of 2006 ("PPA"), which established certain required funding targets. Volatility in the economic environment and/or a decline in the equity markets could cause the value of investment assets held by our pension plans to decline. As a result, we may be required to increase the amount of our cash contributions to our pension plans in order to meet the funding level requirements of the PPA.
Risks Related to Our Common Stock
Our corporate documents and Delaware law contain provisions that could discourage, delay or prevent a change in control of our company.
Provisions in our amended and restated certificate of incorporation and bylaws may discourage, delay or prevent a merger or acquisition involving us that our stockholders may consider favorable. For example, our amended and restated certificate of incorporation authorizes our board of directors to
18
Table of Contents
issue up to 10,000,000 shares of "blank check" preferred stock. Without stockholder approval, the board of directors has the authority to attach special rights, including voting and dividend rights, to this preferred stock. With these rights, preferred stockholders could make it more difficult for a third party to acquire us. In addition, our amended and restated certificate of incorporation provides for a staggered board of directors, whereby directors serve for three-year terms, with approximately one third of the directors coming up for reelection each year. Having a staggered board will make it more difficult for a third party to obtain control of our board of directors through a proxy contest, which may be a necessary step in an acquisition of us that is not favored by our board of directors.
We are also subject to the anti-takeover provisions of Section 203 of the Delaware General Corporation Law. Under these provisions, if anyone becomes an "interested stockholder," we may not enter into a "business combination" with that person for three years without special approval, which could discourage a third party from making a takeover offer and could delay or prevent a change of control. For purposes of Section 203, "interested stockholder" means, generally, someone owning 15% or more of our outstanding voting stock or an affiliate of ours that owned 15% or more of our outstanding voting stock during the past three years, subject to certain exceptions as described in Section 203. Upon any change in control, the lenders under our revolving credit facility would have the right to require us to repay all of our outstanding obligations under the facility.
Our stock price may be volatile, and your investment in our common stock could suffer a decline in value.
There has been significant volatility in the market price and trading volume of equity securities, which may be unrelated to the financial performance of the companies issuing the securities. These broad market fluctuations may negatively affect the market price of our common stock. You may not be able to resell your shares at or above the price at which you purchased them due to fluctuations in the market price of our common stock caused by changes in our operating performance or prospects and other factors. Some specific factors that may have a significant effect on our common stock market price include:
- •
- actual or anticipated fluctuations in our operating results or future prospects, including actual or perceived fluctuations in the demand for our products;
- •
- our announcements or our competitors' announcements of new products;
- •
- the public's reaction to our press releases, our other public announcements and our filings with the SEC;
- •
- strategic actions by us or our competitors, such as acquisitions or restructurings;
- •
- new laws or regulations or new interpretations of existing laws or regulations applicable to our business;
- •
- changes in accounting standards, policies, guidance, interpretations or principles;
- •
- changes in our growth rates or our competitors' growth rates;
- •
- our inability to raise additional capital;
- •
- conditions of the office furniture industry as a result of changes in financial markets or general economic conditions, including those resulting from war, incidents of terrorism and responses to such events;
- •
- sales of common stock by us or members of our management team; and
- •
- changes in stock market analyst recommendations or earnings estimates regarding our common stock, other comparable companies or the office furniture industry generally.
19
Table of Contents
ITEM 1B. UNRESOLVED STAFF COMMENTS
ITEM 2. PROPERTIES
We operate over 3,006,000 square feet of facilities, including manufacturing plants, warehouses and sales offices. Of these facilities, we own approximately 2,236,000 square feet and lease approximately 770,000 square feet. Our manufacturing plants are located in East Greenville, Pennsylvania, Grand Rapids and Muskegon, Michigan, Toronto, Canada, and Foligno and Graffignana, Italy. The location, square footage, and use of the facilities as of December 31, 2009 are shown below.
| | | | | |
Owned Locations | | Square Footage | | Use |
|---|
East Greenville, Pennsylvania | | | 547,000 | (1) | Corporate Headquarters, Manufacturing, Warehouses, and Administration |
Grand Rapids, Michigan | | | 545,000 | (1) | Manufacturing and Administration |
Muskegon, Michigan | | | 368,000 | (1) | Manufacturing and Administration |
Toronto, Canada | | | 408,000 | | Manufacturing, Distribution, Warehouses, and Administration |
Foligno, Italy | | | 258,000 | | Manufacturing, Distribution, Warehouses, and Administration |
Graffignana, Italy | | | 110,000 | | Manufacturing, Distribution, Warehouses, and Administration |
| | | | | |
Leased Locations | | Square Footage | | Use |
|---|
East Greenville, Pennsylvania | | | 142,000 | (2) | Warehouses, Distribution |
Muskegon, Michigan | | | 105,000 | | Manufacturing |
Toronto, Canada | | | 170,000 | | Manufacturing, Warehouses, and Administration |
Knoll, Europe | | | 44,000 | | Administration, Warehouses |
Edelman Leather, Connecticut | | | 55,000 | | Manufacturing and Administration |
Spinneybeck, New York | | | 31,000 | | Manufacturing and Administration |
Miscellaneous Showrooms | | | 223,000 | | Sales Offices |
- (1)
- Facilities are encumbered by mortgages securing indebtedness under our revolving credit facility.
- (2)
- These are three warehouses that have been subleased to a third party logistics provider and serves as our northeast distribution center.
We believe that our plants and other facilities are sufficient for our needs for the foreseeable future.
ITEM 3. LEGAL PROCEEDINGS
From time to time we are subject to litigation or other legal proceedings arising in the ordinary course of business. Based upon information currently known to us, we believe the outcome of such proceedings will not have, individually or in the aggregate, a material adverse effect on our business, financial condition or results of operations.
ITEM 4. RESERVED
20
Table of Contents
PART II
ITEM 5. MARKET FOR REGISTRANT'S COMMON EQUITY, RELATED STOCKHOLDER MATTERS AND ISSUER PURCHASES OF EQUITY SECURITIES
Market Information and Dividend Policy
Our common stock has been listed on the New York Stock Exchange ("NYSE") since December 14, 2004, the date of our initial public offering, under the symbol "KNL." As of February 25, 2010, there were approximately 90 stockholders of record of our common stock.
The following table sets forth, for the periods indicated, high and low sales prices for the common stock as reported by the NYSE.
| | | | | | | |
| | High | | Low | |
|---|
Fiscal year ended December 31, 2009 | | | | | | | |
First quarter | | $ | 9.42 | | $ | 5.33 | |
Second quarter | | $ | 7.91 | | $ | 5.87 | |
Third quarter | | $ | 11.00 | | $ | 7.15 | |
Fourth quarter | | $ | 11.00 | | $ | 9.09 | |
| | | | | | | |
| | High | | Low | |
|---|
Fiscal year ended December 31, 2008 | | | | | | | |
First quarter | | $ | 16.38 | | $ | 11.42 | |
Second quarter | | $ | 15.78 | | $ | 10.85 | |
Third quarter | | $ | 18.68 | | $ | 12.01 | |
Fourth quarter | | $ | 15.05 | | $ | 7.89 | |
We declared and paid cash dividends of $0.18 per share and $0.48 per share during the years ended December 31, 2009 and 2008, respectively. On February 3, 2010, our board of directors declared a cash dividend of $0.02 per share on our common stock payable on March 31, 2010 to shareholders of record on March 15, 2010. The declaration and payment of future dividends is subject to the discretion of our board of directors and depends on various factors, including our net income, financial condition, cash requirements and future prospects and other factors deemed relevant by our board of directors. Our revolving credit facility imposes restrictions on our ability to pay dividends, and thus our ability to pay dividends on our common stock will depend upon, among other things, our level of indebtedness at the time of the proposed dividend and whether we are in default under any of our debt obligations. Our ability to pay dividends will also depend on the requirements of any future financing agreements to which we may be a party. Our board of directors intends to evaluate our dividend policy quarterly in reference to these factors.
21
Table of Contents
Performance Graph
The following line graph compares the cumulative total stockholder return on our common stock with the cumulative total return of the Standard & Poors' 500 Stock Index and with the cumulative total return on a peer group of companies selected by us for the period commencing on December 31, 2004 and ending on December 31, 2009. Our share price at the beginning of the measurement period is $17.50 per share. The graph and table assume that $100 was invested on December 31, 2004 in each of our common stock, the stock of our peer group, and the S&P 500 Index, and that all dividends were reinvested. Cumulative total stockholder returns for our common stock, the S&P 500 Index, and the stock of our peer group are based on our fiscal year. Our peer group is made up of two publicly-held manufacturers of office furniture, Herman Miller, Inc. and Steelcase, Inc. The stock performance on the graph below does not necessarily indicate future price performance.
COMPARISON OF 5 YEAR CUMULATIVE TOTAL RETURN*
Among Knoll, Inc., The S&P 500 Index
And A Peer Group
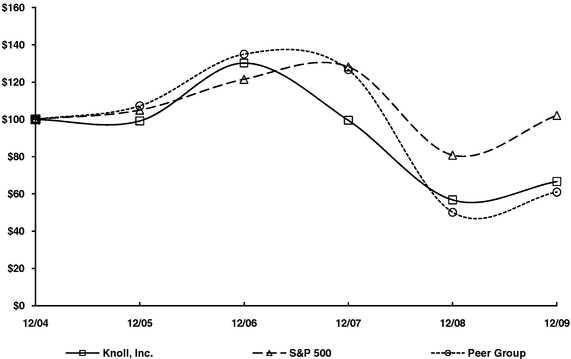
| | | | | | | | | | | | | | | | | | | |
| | 12/04 | | 12/05 | | 12/06 | | 12/07 | | 12/08 | | 12/09 | |
|---|
Knoll, Inc. | | | 100.00 | | | 99.16 | | | 130.22 | | | 99.49 | | | 56.77 | | | 66.65 | |
S&P 500 | | | 100.00 | | | 104.91 | | | 121.48 | | | 128.16 | | | 80.74 | | | 102.11 | |
Peer Group | | | 100.00 | | | 107.22 | | | 134.97 | | | 126.66 | | | 50.13 | | | 60.96 | |
- *
- The performance graph should not be deemed filed or incorporated by reference into any of our filings under the Securities Act of 1933 or the Securities Exchange Act of 1934, unless we specifically incorporate the performance graph by reference therein.
22
Table of Contents
Issuer Purchases of Equity Securities
The following is a summary of share repurchase activity during the three months ended December 31, 2009.
On August 17, 2005, our board of directors approved a stock repurchase program (the "Options Proceeds Program"), whereby they authorized us to purchase shares of our common stock in the open market using the cash proceeds received by us upon exercise of outstanding options.
On February 2, 2006, our board of directors approved an additional stock repurchase program, pursuant to which we are authorized to purchase up to $50.0 million of our common stock in the open market, through privately negotiated transactions, or otherwise. On February 4, 2008, our board of directors expanded this previously authorized $50.0 million stock repurchase program by an additional $50.0 million.
| | | | | | | | | | | | | |
Period | | Total Number
of Shares
Purchased | | Average Price
Paid per Share | | Total Number of
Shares
Purchased as
part of publicly
Announced
Plans or
Programs | | Maximum
Dollar Value of
Shares that may
yet be
Purchased
Under the Plans
or Programs(1) | |
|---|
October 1, 2009 - October 31, 2009 | | | 79,421 | (2) | $ | 10.19 | | | — | | | 32,352,413 | |
November 1, 2009 - November 30, 2009 | | |
— | | |
— | | |
— | | |
32,352,413 | |
December 1, 2009 - December 31, 2009 | | |
— | | |
— | | |
— | | |
32,352,413 | |
| | | | | | | | | | | | |
Total | | | 79,421 | | | | | | — | | | | |
| | | | | | | | | | | | |
- (1)
- There is no limit on the number or value of shares that may be purchased by us under the Options Proceeds Program. Under our $50.0 million stock repurchase program, which was expanded by an additional $50.0 million in February of 2008, we are only authorized to spend an aggregate of $100.0 million on stock repurchases. Amounts in this column represent the amounts that remain available under the $100.0 million stock repurchase program as of the end of the period indicated. There is no scheduled expiration date for the Option Proceeds Program or the $100.0 million stock repurchase program, but our board of directors may terminate either program in the future.
- (2)
- On October 21, 2009, 160,000 shares of outstanding restricted stock vested. Concurrently with this vesting, 61,865 shares were forfeited by holders of the vested restricted shares to cover applicable taxes paid on their behalf by the Company. On October 22, 2009, 46,099 shares of outstanding restricted stock vested. Concurrently with this vesting, 17,556 shares were forfeited by holders of the vested restricted shares to cover applicable taxes paid on their behalf by the Company.
ITEM 6. SELECTED FINANCIAL DATA
The following selected consolidated financial data should be read in conjunction with "Management's Discussion and Analysis of Financial Condition and Results of Operations" and our audited consolidated financial statements and the related notes included elsewhere in this Form 10-K. The selected consolidated financial data for the years ended December 31, 2007, 2008 and 2009 and as of December 31, 2008 and 2009 are derived from our audited financial statements included elsewhere in this Form 10-K. The selected consolidated financial data for the years ended December 31, 2005 and
23
Table of Contents
2006 and as of December 31, 2005, 2006 and 2007 are derived from our audited financial statements not included in this Form 10-K.
| | | | | | | | | | | | | | | | | |
| | Years Ended December 31, | |
|---|
| | 2005 | | 2006 | | 2007 | | 2008 | | 2009 | |
|---|
| | (dollars in thousands, except shares and per share data)
| |
|---|
Consolidated Statement of Operations Data: | | | | | | | | | | | | | | | | |
Sales | | $ | 807,960 | | $ | 982,152 | | $ | 1,055,814 | | $ | 1,120,147 | | $ | 780,033 | |
Cost of sales | | | 535,904 | | | 663,115 | | | 690,689 | | | 725,078 | | | 510,590 | |
| | | | | | | | | | | | |
Gross profit | | | 272,056 | | | 319,037 | | | 365,125 | | | 395,069 | | | 269,443 | |
Selling, general and administrative expenses | | | 179,217 | | | 202,097 | | | 222,937 | | | 245,032 | | | 193,995 | |
Restructuring and other changes | | | — | | | — | | | — | | | 4,625 | | | 11,959 | |
| | | | | | | | | | | | |
Operating income | | | 92,839 | | | 116,940 | | | 142,188 | | | 145,412 | | | 63,489 | |
Interest Expense | | | 23,684 | | | 23,717 | | | 24,598 | | | 16,289 | | | 13,862 | |
Other (expense) income, net | | | (5,355 | ) | | 741 | | | (4,651 | ) | | 3,679 | | | (5,832 | ) |
| | | | | | | | | | | | |
Income before income tax expense | | | 63,800 | | | 93,964 | | | 112,939 | | | 132,802 | | | 43,795 | |
Income tax expense | | | 27,891 | | | 35,331 | | | 41,496 | | | 47,890 | | | 16,442 | |
| | | | | | | | | | | | |
Net income | | $ | 35,909 | | $ | 58,633 | | $ | 71,443 | | $ | 84,912 | | $ | 27,353 | |
| | | | | | | | | | | | |
Per Share Data: | | | | | | | | | | | | | | | | |
Earnings per share: | | | | | | | | | | | | | | | | |
| | Basic | | $ | 0.70 | | $ | 1.18 | | $ | 1.48 | | $ | 1.82 | | $ | 0.60 | |
| | Diluted | | $ | 0.68 | | $ | 1.14 | | $ | 1.45 | | $ | 1.82 | | $ | 0.60 | |
Cash dividends declared per share: | | $ | 0.25 | | $ | 0.41 | | $ | 0.45 | | $ | 0.48 | | $ | 0.18 | |
Weighted average shares outstanding | | | | | | | | | | | | | | | | |
| | Basic | | | 51,219,123 | | | 49,606,677 | | | 48,239,189 | | | 46,570,272 | | | 45,403,401 | |
| | Diluted | | | 52,919,388 | | | 51,238,088 | | | 49,248,902 | | | 46,694,340 | | | 45,413,770 | |
| | | | | | | | | | | | | | | | |
| | As of December 31, | |
|---|
| | 2005 | | 2006 | | 2007 | | 2008 | | 2009 | |
|---|
| | (in thousands)
| |
|---|
Consolidated Balance Sheet Data: | | | | | | | | | | | | | | | | |
Working capital | | $ | 63,993 | | $ | 77,170 | | $ | 86,453 | | $ | 65,228 | | $ | 60,613 | |
Total assets | | | 582,546 | | | 632,137 | | | 717,442 | | | 697,660 | | | 655,620 | |
Total long-term debt, including current portion | | | 316,038 | | | 350,316 | | | 368,576 | | | 337,379 | | | 295,305 | |
Total liabilities | | | 544,830 | | | 627,753 | | | 642,721 | | | 653,041 | | | 566,058 | |
Stockholders' equity | | | 37,716 | | | 4,384 | | | 74,721 | | | 44,619 | | | 89,562 | |
24
Table of Contents
ITEM 7. MANAGEMENT'S DISCUSSION AND ANALYSIS OF FINANCIAL CONDITION AND RESULTS OF OPERATIONS
Management's discussion and analysis of financial condition and results of operations provides an account of our financial performance and financial condition that should be read in conjunction with the accompanying audited consolidated financial statements.
Forward-looking Statements
This annual report on Form 10-K contains forward-looking statements, principally in the sections entitled "Quantitative and Qualitative Disclosures About Market Risk," "Management's Discussion and Analysis of Financial Condition and Results of Operations," "Risk Factors" and "Business." Statements and financial discussion and analysis contained in this annual report on Form 10-K that are not historical facts are forward-looking statements. These statements discuss goals, intentions and expectations as to future trends, plans, events, results of operations or financial condition, or state other information relating to us, based on our current beliefs as well as assumptions made by us and information currently available to us. Forward-looking statements generally will be accompanied by words such as "anticipate," "believe," "could," "estimate," "expect," "forecast," "intend," "may," "possible," "potential," "predict," "project," or other similar words, phrases or expressions. Although we believe these forward-looking statements are reasonable, they are based upon a number of assumptions concerning future conditions, any or all of which may ultimately prove to be inaccurate. Important factors that could cause actual results to differ materially from the forward-looking statements include, without limitation: the risks described under Item 1A and in Item 7A of this annual report on Form 10-K; changes in the economy or financial stability of our clients resulting in decreased corporate spending and service sector employment; changes in relationships with clients; the mix of products sold and of clients purchasing our products; the success of new technology initiatives; changes in business strategies and decisions; competition from our competitors; our ability to recruit and retain an experienced management team; changes in raw material prices and availability; restrictions on government spending resulting in fewer sales to one of our largest customers; our debt restrictions on spending; our ability to protect our patents, copyrights and trademarks; our reliance on furniture dealers to produce sales; lawsuits arising from patents, copyrights and trademark infringements; violations of environment laws and regulations; potential labor disruptions; the financial strength and stability of our suppliers, customers and dealers; adequacy of our insurance policies; the availability of future capital and strength of the credit markets; and currency rate fluctuations. The factors identified above are believed to be important factors (but not necessarily all of the important factors) that could cause actual results to differ materially from those expressed in any forward-looking statement. Unpredictable or unknown factors could also have material adverse effects on us. All forward-looking statements included in this annual report on Form 10-K are expressly qualified in their entirety by the foregoing cautionary statements. Except as required under the Federal securities laws and the rules and regulations of the Securities and Exchange Commission, we undertake no obligation to update, amend, or clarify forward-looking statements, whether as a result of new information, future events, or otherwise.
Overview
We are a designer and manufacturer of furnishings and accessories, textiles and fine leathers for the workplace and home. Our commitment to innovation and modern design has yielded a comprehensive portfolio of products and a brand recognized for high quality and a sophisticated image. Our products are targeted at the middle to upper end of the market and are sold primarily in North America through a direct sales force and a broad network of independent dealers.
Our business structure and operating approach continue to deliver industry leading operating income margins among our primary publicly-held competitors. We operate under a management
25
Table of Contents
philosophy that incorporates a collaborative culture, client-driven processes and a lean, agile operating structure. Our employees are performance-driven and motivated by a variable incentive compensation system and broad-based equity ownership in the company.
Fiscal year 2009 proved to be a very difficult year for us and our industry as a whole. We experienced unprecedented declines in sales across the industry as the global economy continued to deteriorate. As an industry, we saw the declines begin in the fourth quarter of 2008 and continue through 2009. In 2009, our industry trade organization, the Business and Institutional Furniture Manufacturers Association, or BIFMA, reported sales declined 29.7% when compared to 2008. We were not immune to this decline as our 2009 sales declined 30.4% when compared to the prior year. Our sales decreased across all product categories and geographies with the largest declines occurring in offices systems and in Europe. Our specialty and complimentary products fared better than office systems but both experienced double digit declines. In 2009, operating income decreased 56.3% and earnings per share fell 67.0% when compared with 2008.
During 2009, as the industry continued to deteriorate we took actions to protect our industry leading profit margins. We incurred approximately $12.0 million of restructuring charges in 2009 which included job eliminations, showroom closings, and the discontinuation of certain product lines. These actions along with previously implemented restructuring plans have allowed us to remain profitable through these extraordinary times.
In response to the difficult economic environment we continued to aggressively manage our balance sheet. We tightened our accounts receivable collection policies and reduced our inventory to bring it more in line with the lower demand levels. We used free cash in 2009 to pay down $42.0 million of debt bringing our total debt outstanding to below $300.0 million for the first time this decade. We remain in compliance with all bank covenants and our revolving credit facility extends until June 2013. In addition, during the year ended December 31, 2009 we used free cash to pay dividends to our shareholders totaling $8.2 million and invested $13.7 million in capital expenditures.
Despite the difficult economic environment, in 2009 we had one of the most successful product launches in our company's history as we introduced the Generation by Knoll® chair. This chair has received many accolades including winning the Best of NeoCon® 2009 Gold Award for Office Seating. It has had one of the fastest ramp ups in terms of market acceptance and demand of any chair in our history and helped during the fourth quarter of 2009 to contribute to our first sequential increase in backlog in six quarters. Backlog of unfilled orders at December 31, 2009 increased $31.3 million, or 25.7%, when compared to September 30, 2009 backlog of unfilled orders of $121.7 million. We believe this chair will have a major impact on our seating revenue in the future and ultimately help us gain the market share we desire in that category. Our strategy continues to be diversifying our sales away from a primary dependence on North American office systems to higher margin products such as seating and our specialty businesses.
In 2010, we will continue to push our growth internationally and our focus on our high design, high margin specialty businesses. We will continue to aggressively monitor our spending and invest in new products. All these things will better position us to succeed when the recovery in our industry occurs.
26
Table of Contents
Results of Operations
Years ended December 31, 2008 and 2009
| | | | | | | | | | | | | | | | | | | | | | | | | | | | | | | |
| | Three Months Ended | |
| | Three Months Ended | |
| |
|---|
| | Twelve
Months Ended
December 31,
2008 | | Twelve
Months Ended
December 31,
2009 | |
|---|
| | March 31,
2008 | | June 30,
2008 | | September 30,
2008 | | December 31,
2008 | | March 31,
2009 | | June 30,
2009 | | September 30,
2009 | | December 31,
2009 | |
|---|
| | (in thousands, except statistical data)
(unaudited)
| |
|---|
Consolidated Statement of Operations Data: | | | | | | | | | | | | | | | | | | | | | | | | | | | | | | | |
Sales | | $ | 267,808 | | $ | 292,536 | | $ | 283,517 | | $ | 276,286 | | $ | 1,120,147 | | $ | 212,609 | | $ | 202,197 | | $ | 181,282 | | $ | 183,945 | | $ | 780,033 | |
Gross profit | | | 90,323 | | | 101,087 | | | 104,198 | | | 99,461 | | | 395,069 | | | 74,767 | | | 70,729 | | | 61,273 | | | 62,674 | | | 269,443 | |
Operating income | | | 31,901 | | | 35,098 | | | 41,089 | | | 37,324 | | | 145,412 | | | 16,765 | | | 18,514 | | | 16,797 | | | 11,413 | | | 63,489 | |
Interest expense | | | 4,934 | | | 3,963 | | | 3,766 | | | 3,626 | | | 16,289 | | | 2,771 | | | 2,856 | | | 4,054 | | | 4,181 | | | 13,862 | |
Other (expense) income, net | | | (195 | ) | | (64 | ) | | 2,137 | | | 1,801 | | | 3,679 | | | 1,324 | | | (2,747 | ) | | (3,112 | ) | | (1,297 | ) | | (5,832 | ) |
Income tax expense | | | 9,494 | | | 10,154 | | | 15,398 | | | 12,844 | | | 47,890 | | | 5,793 | | | 4,837 | | | 3,905 | | | 1,907 | | | 16,442 | |
| | | | | | | | | | | | | | | | | | | | | | |
Net income | | $ | 17,278 | | $ | 20,917 | | $ | 24,062 | | $ | 22,655 | | $ | 84,912 | | $ | 9,525 | | $ | 8,074 | | $ | 5,726 | | $ | 4,028 | | $ | 27,353 | |
| | | | | | | | | | | | | | | | | | | | | | |
Statistical and Other Data: | | | | | | | | | | | | | | | | | | | | | | | | | | | | | | | |
Sales growth from comparable prior year | | | 8.0 | % | | 7.5 | % | | 11.6 | % | | -2.0 | % | | 6.1 | % | | -20.6 | % | | -30.9 | % | | -36.1 | % | | -33.4 | % | | -30.4 | % |
Gross profit margin | | | 33.7 | % | | 34.6 | % | | 36.8 | % | | 36.0 | % | | 35.3 | % | | 35.2 | % | | 35.0 | % | | 33.8 | % | | 34.1 | % | | 34.5 | % |
Backlog | | $ | 204,403 | | $ | 191,036 | | $ | 203,077 | | $ | 201,694 | | $ | 201,694 | | $ | 163,768 | | $ | 134,136 | | $ | 121,741 | | $ | 153,037 | | $ | 153,037 | |
Sales for 2009 were $780.0 million, a decrease of $340.1 million, or 30.4%, from sales of $1.12 billion for 2008. For the year ended December 31, 2009, we experienced double digit declines across all product categories and geographies when compared to the prior year. At December 31, 2009, sales backlog was $153.0 million, a decrease of $48.7 million, or 24.1%, from sales backlog of $201.7 million as of December 31, 2008.
In 2009, the global recession greatly impacted the office furniture industry. A widespread lack of business confidence and growing unemployment levels increased office vacancy rates and lowered the demand for our products, especially office systems. Office systems as a product category were impacted the most by the decline in demand with sales declining 30.6% when compared to 2008. Although we have diversified our sales over recent years by growing our seating and specialty businesses to make us less dependent on the office systems category, office systems still represent a significant portion of our sales.
Sales to the U.S. government remained strong in 2009 and became a larger portion of our overall revenue in 2009. Approximately 16.0% of our 2009 sales were to the U.S. government and related agencies.
Although the recent recession has been worldwide, geographically our European sales declined at a greater pace than North America.
The substantial reduction in industry demand has resulted in a very competitive pricing environment as our industry competes for a smaller pool of business. This pricing pressure had a significant impact on 2009 sales, but we believe we managed to stay competitive and offset some of this pricing pressure through our cost reduction activities.
Gross profit for 2009 was $269.4 million, a decrease of $125.7 million, or 31.8%, from gross profit of $395.1 million for 2008. Operating income for 2009 was $63.5 million, a decrease of $81.9 million, or
27
Table of Contents
56.3%, from operating income of $145.4 million for 2008. We are relatively pleased with the profit levels we reported in 2009 given the significant deterioration in industry demand and a reduction of $340.1 million in our sales from 2008.
As a percentage of sales, gross profit decreased from 35.3% for 2008 to 34.5% for 2009. The decrease in gross margin during 2009 was primarily due to price deterioration and lower absorption of our fixed costs as a result of our lower sales volumes. Operating income as a percentage of sales decreased from 13.0% in 2008 to 8.1% in 2009. Operating profit for 2009 includes restructuring charges of $12.0 million compared to $4.6 million in 2008.
Operating expenses for 2009, excluding restructuring charges, were $194.0 million, or 24.9% of sales, compared to $245.0 million, or 21.9% of sales, for 2008. The decrease in operating expenses during 2009 was in large part due to decreased spending in conjunction with our lower sales volumes. Decreased sales and incentive compensation accounted for $23.5 million of the reduction. In addition, decreased bad debt expense and previously implemented cost reduction measures added to the decrease.
Interest expense for 2009 was $13.9 million, a decrease of $2.4 million from interest expense of $16.3 million for 2008. The decrease in interest expense was largely due to lower borrowing rates. Two interest rate swap agreements that we entered into during 2008 went into effect during the second quarter of 2009 and resulted in an increased rate for the second half of 2009. For the year ended December 31, 2009, additional interest expense of $5.2 million was incurred as a result of these swap agreements. See Note 11 of our consolidated financial statements contained in this annual report on Form 10-K for further information regarding the interest rate swaps. Taking into account the effect of the interest rate swap payments, the weighted average interest rate for 2009 was 3.9%. The weighted average interest rate for the same period in 2008 was 4.3%.
Other (Expense) Income, Net
Other expense for 2009 was $5.8 million, comprised primarily of a $6.6 million loss due to foreign currency translation and $0.8 million of miscellaneous income. Other income for 2008 was $3.7 million, comprised primarily of a $3.0 million gain due to foreign currency translation and a $0.7 million of miscellaneous income.
The mix of pretax income and the varying effective tax rates in the countries in which we operate directly affects our consolidated effective tax rate. The effective tax rate was 37.5% for 2009 compared to 36.1% for 2008.
Years ended December 31, 2007 and 2008
Sales for 2008 were $1.12 billion, an increase of $64.3 million, or 6.1%, from sales of $1.06 billion for 2007. The increase was mainly attributable to increased sales in our specialty and complimentary businesses. Incremental sales from our Edelman leather business, acquired during the fourth quarter of 2007, also added to the increase. In addition, 2008 net sales benefited from previously implemented price increases. Approximately $14.4 million of the increase for total 2008 net sales, or approximately 22.4%, was attributable to additional revenues realized from price increases. At December 31, 2008, sales backlog was $201.7 million, an increase of $11.0 million, or 5.8%, from sales backlog of $190.7 million as of December 31, 2007.
28
Table of Contents
The slowing world economy began to impact demand in our industry in the fourth quarter of 2008. Our industry saw a decline of 2.3% in 2008 according to BIFMA. Our sales during the fourth quarter of 2008 declined 2.0% when compared to the prior year. This was our first quarter decline in sales on a year-over-year basis in 18 consecutive quarters.
Gross profit for 2008 was $395.1 million, an increase of $30.0 million, or 8.2%, from gross profit of $365.1 million for 2007. Operating profit for 2008 was $145.4 million, an increase of $3.2 million, or 2.3%, from operating income of $142.2 million for 2007.
As a percentage of sales, gross profit increased from 34.6% for 2007 to 35.3% for 2008. Gross margin increased in spite of inflationary pressures and foreign exchange pressures early in the year from a weakening US dollar relative to the Canadian dollar and Euro. Additional volume, better pricing, favorable product mix and our global sourcing initiatives contributed to the increase. Operating income as a percentage of sales decreased from 13.5% to 13.0% over the same period. Operating income for 2008 includes restructuring charges of $4.6 million.
Operating expenses for 2008, excluding restructuring charges, were $245.0 million, or 21.9% of sales, compared to $222.9 million, or 21.1% of sales, for 2007. The increase in operating expenses during 2008 was in large part due to the inclusion of operating expenses associated with our Edelman leather business, which we acquired in the fourth quarter of 2007, and increased bad debt expense.
Interest expense for 2008 was $16.3 million, a decrease of $8.3 million from interest expense of $24.6 million for 2007. The decrease in interest expense was largely due to lower borrowing rates.
The weighted average interest rate for 2008 was approximately 4.3%. The weighted average interest rate for 2007 was approximately 7.0%.
Other Income (Expense), Net
Other income for 2008 was $3.7 million, comprised primarily of a $3.0 million gain due to foreign currency translation and a $0.7 million of miscellaneous income. Other expense for 2007 was $4.7 million and comprised primarily of a $4.2 million loss due to foreign currency translation and a $1.2 million loss related to the write-off of deferred financing fees. These losses were offset partially by $0.7 million of miscellaneous income.
The mix of pretax income and the varying effective tax rates in the countries in which we operate directly affects our consolidated effective tax rate. The effective tax rate was 36.1% for 2008 compared to 36.7% for 2007. During 2008, we benefited from the usage of $1.7 million of European net operating losses.
29
Table of Contents
Liquidity and Capital Resources
The following table highlights certain key cash flows and capital information pertinent to the discussion that follows:
| | | | | | | | | | |
| | 2009 | | 2008 | | 2007 | |
|---|
| | (in thousands)
| |
|---|
Cash provided by operating activities | | $ | 52,853 | | $ | 112,224 | | $ | 102,155 | |
Capital expenditures | | | 13,706 | | | 18,530 | | | 16,292 | |
Net cash used in investing activities | | | 14,519 | | | 18,530 | | | 86,910 | |
Purchase of common stock | | | 1,587 | | | 40,871 | | | 48,134 | |
Net (repayment of) proceeds from debt | | | (42,131 | ) | | (31,129 | ) | | 18,194 | |
Payment of dividends | | | 8,171 | | | 22,380 | | | 21,690 | |
Net proceeds from issuance of stock | | | 111 | | | 1,796 | | | 29,015 | |
Net cash used for financing activities | | | 51,778 | | | 92,381 | | | 16,675 | |
Historically, we have carried significant amounts of debt, and cash generated by operating activities has been used to fund working capital, capital expenditures, repurchase shares and scheduled payments of principal and interest under our debt. Our capital expenditures are typically for new product tooling and manufacturing equipment. These capital expenditures support new products and continuous improvements in our manufacturing processes.
Net cash provided by operating activities was $52.9 million in 2009, $112.2 million in 2008 and $102.2 million in 2007. For the year ended December 31, 2009, net cash provided by operating activities consisted of $62.3 million from net income, plus non-cash amortizations, offset by $9.4 million of unfavorable changes in working capital. For the year ended December 31, 2008, net cash provided by operating activities consisted of $103.8 million from net income, plus non-cash amortizations, plus $8.4 million of favorable changes in working capital.
For the year ended December 31, 2009, we used available cash, including the $52.9 million of net cash from operating activities to repay $42.1 million of debt, fund $13.7 million in capital expenditures, fund dividend payments to shareholders totaling $8.2 million, and to fund working capital. In 2008, we used available cash, including the $112.2 million of net cash from operating activities and $1.8 million of proceeds from the issuance of common stock, to repay $31.1 million of debt, fund $18.5 million in capital expenditures, repurchase $40.9 million of common stock for treasury, fund dividend payments to shareholders totaling $22.4 million, and to fund working capital.
On October 1, 2007, we completed the acquisition of Teddy & Arthur Edelman, Limited. Cash expenditures for the transaction totaled $70.8 million, net of cash acquired. Cash from financing activities in 2007 also included the payment of fees on the refinanced credit facility.
We use our existing secured $500 million revolving credit facility in the ordinary course of business to fund our working capital needs, and at times make significant borrowings and repayments under the facility depending on our cash needs and availability at such time. This facility matures in June 2013 and provides us with the option to increase the size of the facility by up to an additional $200 million, subject to the satisfaction of certain terms and conditions. As of December 31, 2009, there was approximately $295 million outstanding under the facility, compared to $337 million outstanding under the facility as of December 31, 2008. Borrowings under the revolving credit facility may be repaid at any time, but no later than June 2013.
30
Table of Contents
Our revolving credit facility requires that we comply with two financial covenants: (i) our consolidated leverage ratio, defined as the ratio of total indebtedness to consolidated EBITDA (as defined in our credit agreement) for a period of four fiscal quarters, cannot exceed 4 to 1, and (ii) our consolidated interest coverage ratio, defined as the ratio of our consolidated EBITDA (as defined in our credit agreement) for a period of four fiscal quarters to our consolidated interest expense, must be a minimum of 3 to 1. We are also required to comply with various other affirmative and negative covenants, including without limitation, covenants that prevent or restrict our ability to pay dividends, engage in certain mergers or acquisitions, make certain investments or loans, incur future indebtedness, make significant capital expenditures, engage in sale-leaseback transactions, alter our capital structure or line of business, prepay subordinated indebtedness, engage in certain transactions with affiliates and sell stock or assets.
We are currently in compliance with all of the covenants and conditions under our credit facility. We believe that existing cash balances and internally generated cash flows, together with borrowings available under our revolving credit facility, will be sufficient to fund normal working capital needs, capital spending requirements, debt service requirements and dividend payments for at least the next twelve months. However, because of the financial covenants mentioned above, our capacity under our revolving credit facility could be reduced if our trailing consolidated EBITDA (as defined by our credit agreement) continues to decline due to deteriorating market conditions. Future principal debt payments may be paid out of cash flows from operations, from future refinancing of our debt or from equity issuances. However, our ability to make scheduled payments of principal, to pay interest on or to refinance our indebtedness, to satisfy our other debt obligations and to pay dividends to stockholders will depend upon our future operating performance, which will be affected by general economic, financial, competitive, legislative, regulatory, business and other factors beyond our control.
Contractual Obligations
The following table summarizes our fixed long-term contractual cash obligations as of December 31, 2009 (in thousands):
| | | | | | | | | | | | | | | | |
| | Payments due by period | |
|---|
| | Less than
1 year | | 1 to 3
years | | 3 to 5
years | | More than
5 years | | Total | |
|---|
Long-term debt | | $ | 4,604 | | $ | 9,077 | | $ | 297,209 | | $ | — | | $ | 310,890 | |
Operating leases | | | 13,166 | | | 19,944 | | | 13,001 | | | 25,381 | | | 71,492 | |
Purchase commitments | | | 295 | | | — | | | — | | | — | | | 295 | |
Pension plan contributions | | | 10,000 | | | — | | | — | | | — | | | 10,000 | |
Postretirement benefit plan obligations | | | 1,652 | | | — | | | — | | | — | | | 1,652 | |
| | | | | | | | | | | | |
Total | | $ | 29,717 | | $ | 29,021 | | $ | 310,210 | | $ | 25,381 | | $ | 394,329 | |
Contractual obligations for long-term debt include principal and interest payments. Interest has been included at either the fixed rate or the variable rate in effect as of December 31, 2009, as applicable.
Environmental Matters
Our past and present business operations and the past and present ownership and operation of manufacturing plants on real property are subject to extensive and changing federal, state, local and foreign environmental laws and regulations, including those relating to discharges to air, water and land, the handling and disposal of solid and hazardous waste and the cleanup of properties affected by hazardous substances. As a result, we are involved from time-to-time in administrative and judicial proceedings and inquiries relating to environmental matters and could become subject to fines or penalties related thereto. We cannot predict what environmental legislation or regulations will be
31
Table of Contents
enacted in the future, how existing or future laws or regulations will be administered or interpreted or what environmental conditions may be found to exist. Compliance with more stringent laws or regulations, or stricter interpretation of existing laws, may require additional expenditures by us, some of which may be material. We have been identified as a potentially responsible party pursuant to the Comprehensive Environmental Response, Compensation and Liability Act of 1980 ("CERCLA") for remediation costs associated with waste disposal sites that we previously used. The remediation costs and our allocated share at some of these CERCLA sites are unknown. We may also be subject to claims for personal injury or contribution relating to CERCLA sites. We reserve amounts for such matters when expenditures are probable and reasonably estimable.
Off-Balance Sheet Arrangements
We do not currently have any relationships with unconsolidated entities or financial partnerships, such as entities often referred to as structured finance or special purpose entities, which would have been established for the purpose of facilitating off-balance sheet arrangements or other contractually narrow or limited purposes. In addition, we do not engage in trading activities involving non-exchange traded contracts. As a result, we are not materially exposed to any financing, liquidity, market or credit risk that could arise if we had engaged in these relationships.
Critical Accounting Policies
The preparation of our consolidated financial statements in conformity with accounting principles generally accepted in the U.S. ("GAAP") requires us to make estimates and assumptions that affect the reported amounts of certain assets, liabilities, revenues and expenses and the disclosure of certain contingent assets and liabilities. Actual results may differ from such estimates. We believe that the critical accounting policies that follow are those policies that require the most judgment, estimation and assumption in preparing our consolidated financial statements.
Allowance for Doubtful Accounts
We maintain allowances for doubtful accounts for estimated losses resulting from the inability of our clients and dealers to make required payments. The allowance is determined through an analysis of the aging of accounts receivable and assessments of risk that are based on historical trends and an evaluation of the impact of current and projected economic conditions. We evaluate the past-due status of our trade receivables based on contractual terms of sale. If the financial condition of our clients and dealers were to deteriorate, additional allowances may be required. Accounts receivable are charged off against the allowance for doubtful accounts when we determine that recovery is unlikely.
Inventory
Inventories are valued at the lower of cost or market. Cost is determined using the first-in, first-out method. We write down inventory that, in our judgment, is impaired or obsolete. Obsolescence may be caused by the discontinuance of a product line, changes in product material specifications, replacement products in the marketplace and other competitive influences.
Goodwill and Other Intangible Assets
Intangible assets consist of goodwill, trademarks and deferred financing fees. Goodwill is recorded at the amount by which cost exceeds the net assets of acquired businesses, and all other intangible assets are recorded at cost. Goodwill and other intangible assets are tested for impairment annually unless indicators of impairment exist earlier.
32
Table of Contents
Financing costs that are incurred by us in connection with the issuance of debt are deferred and amortized to interest expense over the life of the underlying indebtedness. The period of these costs may be shortened if the underlying indebtedness is modified or retired.
Product Warranty
We provide for the estimated cost of product warranties at the time revenue is recognized. While we engage in product quality programs and processes, our warranty obligation is affected by product failure rates and by material usage and service costs incurred in correcting a product failure. Cost estimates are based on historical product failure rates and identified one-time fixes for each specific product category. Warranty cost generally varies in direct relation to sales volume, as such costs tend to be a consistent percentage of revenue. Should actual costs differ from original estimates, revisions to the estimated warranty liability would be required.
Employee Benefits
We are partially self-insured for our employee health benefits. We accrue for employee health benefit obligations based on an actuarial valuation. The actuarial valuation is based upon historical claims as well as a number of assumptions, including rates of inflation for medical costs, and benefit plan changes. Actual results could be materially different from the estimates used.
Pension and Other Postretirement Benefits
We sponsor two defined benefit pension plans and two other postretirement benefit plans that cover substantially all of our U.S. employees. Several statistical and other factors, which attempt to anticipate future events, are used in calculating the expense and liability related to the plans. Key factors include assumptions about the expected rates of return on plan assets, discount rates, and health care cost trend rates, as determined by us, within certain guidelines. We consider market conditions, including changes in investment returns and interest rates, in making these assumptions.
We determine the expected long-term rate of return on plan assets based on aggregating the expected rates of return for each component of the plan's asset mix. We use historic plan asset returns combined with current market conditions to estimate the rate of return. The expected rate of return on plan assets is a long-term assumption and generally does not change annually. The discount rate reflects the market rate for high-quality fixed income debt instruments as of our annual measurement date and is subject to change each year. Holding all other assumptions constant, a one percentage point increase or decrease in the assumed rate of return on plan assets would decrease or increase 2009 net periodic pension expense by approximately $1.3 million. Likewise, a one percentage point increase or decrease in the discount rate would decrease or increase 2009 net periodic pension expense by approximately $1.8 million or $4.2 million, respectively.
Unrecognized actuarial gains and losses are recognized over the expected remaining service life of the employee group. Unrecognized actuarial gains and losses arise from several factors, including experience and assumption changes with respect to the obligations and from the difference between expected returns and actual returns on plan assets. These unrecognized gain and losses are systematically recognized as a change in future net periodic pension expense in accordance with the appropriate accounting guidance relating to defined benefit pension and other postretirement plans.
Key assumptions we use in determining the amount of the obligation and expense recorded for postretirement benefits other than pensions ("OPEB"), under the appropriate accounting guidance, include the assumed discount rate and the assumed rate of increases in future health care costs. The discount rate we use to determine the obligation for these benefits matches the discount rate used in determining our pension obligations in each year presented. In estimating the health care cost trend rate, we consider actual health care cost experience, future benefit structures, industry trends and
33
Table of Contents
advice from our actuaries. We assume that the relative increase in health care costs will generally trend downward over the next several years, reflecting assumed increases in efficiency in the health care system and industry-wide cost containment initiatives. At December 31, 2009, the expected rate of increase in future health care costs was 8.00% in determining the benefit obligation for 2010 and 7.25% in determining the net periodic benefit cost for 2009. The rate was then assumed to decrease to an ultimate rate of 5% for 2016 and thereafter for the benefit obligation. Increasing the assumed health care cost trend by one percentage point in each year would increase the benefit obligation as of December 31, 2009, by $0.6 million and increase the aggregate of the service and interest cost components of net periodic benefit cost for 2009 by approximately $0.3 million. Decreasing the assumed health care cost trend rate by one percentage point in each year would decrease the benefit obligation as of December 31, 2009 by approximately $0.7 million and decrease the aggregate of the service and interest cost components of net periodic benefit cost for 2009 by approximately $0.2 million.
In accordance with the appropriate accounting guidance, we recognize in our statement of financial position the funded status (i.e. the difference between the fair value of plan assets and the projected benefit obligation) of our defined benefit pension and postretirement benefit plans. To record the unfunded status of our plans we recorded an additional liability and an adjustment to accumulated other comprehensive income, net of tax.
The actuarial assumptions we use in determining our pension and OPEB retirement benefits may differ materially from actual results due to changing market and economic conditions, higher or lower withdrawal rates, or longer or shorter life spans of participants. While we believe that the assumptions used are appropriate, differences in actual experience or changes in assumptions may materially affect our financial position or results of operations.
Commitments and Contingencies
We establish reserves for the estimated cost of environmental and legal contingencies when such expenditures are probable and reasonably estimable. A significant amount of judgment and use of estimates is required to quantify our ultimate exposure in these matters. We engage outside experts as deemed necessary or appropriate to assist in the evaluation of exposure. From time to time, as information becomes available regarding changes in circumstances for ongoing issues as well as information regarding emerging issues, our potential liability is reassessed and reserve balances are adjusted as necessary. Revisions to our estimates of potential liability, and actual expenditures related to environmental and legal contingencies, could have a material impact on our results of operations or financial position.
Taxes
We account for income taxes in accordance with the appropriate accounting guidance relating to income taxes, which requires that deferred tax assets and liabilities be recognized using enacted tax rates for the effect of temporary differences between book and tax bases of recorded assets and liabilities. The appropriate accounting guidance also requires that deferred tax assets be reduced by a valuation allowance if it is more likely than not that some portion or all of the deferred tax assets will not be recognized.
At December 31, 2009, deferred tax liabilities of $87.0 million exceeded deferred tax assets of $55.0 million by $32.0 million. At December 31, 2008, our deferred tax liabilities of $80.1 million exceeded deferred tax assets of $55.8 million by $24.3 million. Our deferred tax assets at December 31, 2009 and 2008 of $55.0 million and $55.8 million, respectively, are net of valuation allowances of $8.9 million and $9.2 million, respectively. We have recorded the above valuation allowance primarily for net operating loss carryforwards in foreign tax jurisdictions where we have incurred historical tax
34
Table of Contents
losses from operations or acquired tax losses through acquisition, and have determined that it is more likely than not that these deferred tax assets will not be realized.
We evaluate on a quarterly basis the realizability of our deferred tax assets and adjust the amount of the allowance, if necessary. The factors used to assess the likelihood of realization include our forecast of future taxable income and our assessment of available tax planning strategies that could be implemented to realize the net deferred tax assets.
We account for uncertain tax positions in accordance the applicable accounting guidance relating to uncertainty in income taxes. Accordingly, we report a liability for unrecognized tax benefits resulting from uncertain tax positions taken, or expected to be taken, in an income tax return. We recognize interest and penalties, if any, related to unrecognized tax benefits in income tax expense.
Interest Rate Swap Agreements
On May 21, 2008, we entered into four interest rate swap agreements for purposes of managing our risk in interest rate fluctuations. These agreements each hedge a notional amount of $150.0 million of our borrowings under the revolving credit facility. Two of the agreements were effective June 9, 2009 and expire on June 9, 2010. On these two agreements, we pay a fixed rate of 3.51% and receive a variable rate of interest equal to three-month London Interbank Offered Rate (LIBOR), as determined on the last day of each quarterly settlement period. The other two agreements are effective on June 9, 2010 and expire on June 9, 2011. We pay a fixed rate of 4.10% on these two agreements and receive a variable rate of interest equal to three-month LIBOR.
The Company has elected to apply hedge accounting to these swap agreements. Changes in the fair value of these interest rate swap agreements are recorded as a component of accumulated other comprehensive income (loss) in the equity section of the balance sheet. The net amount paid or received upon quarterly settlements is recorded as an adjustment to interest expense, with a corresponding reduction in other comprehensive income (loss).
Recent Accounting Pronouncements
In June 2009, the Financial Accounting Standards Board ("FASB") issued new accounting guidance entitled, "TheFASB Accounting Standards CodificationTM and theHierarchy of Generally Accepted Accounting Principles—a replacement of FASB Statement No. 162", which identifies the sources of accounting principles and the framework for selecting the principles used in the preparation of financial statements of nongovernmental entities that are presented in conformity with GAAP in the United States. This new guidance establishes theFASB Accounting Standards CodificationTM as the source of authoritative accounting principles recognized by the FASB to be applied by nongovernmental entities in the preparation of financial statements in conformity with GAAP. This new guidance is effective for most financial statements issued for interim and annual periods ending after September 15, 2009. We adopted this guidance as of September 30, 2009. This adoption did not have a material impact our consolidated financial statements.
In May 2009, the FASB issued new accounting guidance on subsequent events which establishes general standards of accounting for and disclosure of events that occur after the balance sheet date but before financial statements are issued or are available to be issued. It does not apply to subsequent events or transactions that are within the scope of other applicable GAAP that provide different guidance on the accounting treatment for subsequent events or transactions. This new guidance is effective for interim or annual financial periods ending after June 15, 2009, and shall be applied prospectively. We adopted this new guidance as of June 30, 2009, as required. The adoption did not have a material impact on our consolidated financial statements.
35
Table of Contents
On January 1, 2009, we adopted changes issued by the FASB to fair value accounting and reporting as it relates to nonfinancial assets and nonfinancial liabilities that are not recognized or disclosed at fair value in the financial statements on at least an annual basis. These changes define fair value, establish a framework for measuring fair value in GAAP, and expand disclosures about fair value measurements. This guidance applies to other GAAP that require or permit fair value measurements and is to be applied prospectively with limited exceptions. The adoption of these changes, as it relates to nonfinancial assets and nonfinancial liabilities, had no impact on our financial statements. These provisions will be applied at such time a fair value measurement of a nonfinancial asset or nonfinancial liability is required, which may result in a fair value that is materially different than would have been calculated prior to the adoption of these changes.
In November 2008, the FASB issued new accounting guidance on accounting for defensive intangible assets. This guidance clarifies how to account for acquired defensive intangible assets subsequent to initial measurement that the company does not intend to actively use but does intend to hold to prevent others from obtaining access to the asset. This new accounting guidance is effective for fiscal years beginning after December 15, 2008. Our adoption of the new guidance did not have a material impact on our consolidated results of operations, financial position or cash flows.
In April 2008, the FASB issued new accounting guidance which amends the factors that should be considered in developing renewal or extension assumptions used to determine the useful life of a recognized intangible asset. The intent of this new guidance is to improve the consistency between the useful life of a recognized intangible asset and the period of expected cash flows used to measure the fair value of the assets. This new guidance is effective for financial statements issued for fiscal years and interim periods beginning after December 15, 2008. We adopted the new guidance as of January 1, 2009, as required. Our adoption of this guidance did not have a material impact on our consolidated financial statements.
In March 2008, the FASB issued new accounting guidance which requires enhanced disclosures about an entity's derivative and hedging activities. Specifically, entities are required to provide enhanced disclosures about: a) how and why an entity uses derivative instruments; b) how derivative instruments and related hedged items are accounted for; and c) how derivative instruments and related hedged items affect an entity's financial position, financial performance and cash flows. The new guidance is effective for financial statements issued for fiscal years and interim periods beginning after November 15, 2008, with early application encouraged. The new guidance encourages, but does not require, comparative disclosures for earlier periods at initial adoption. We adopted the new guidance as of January 1, 2009, as required. Our adoption did not have a material impact on our consolidated financial statements.
In December 2007, the FASB issued new accounting guidance which is intended to improve reporting by creating greater consistency in the accounting and financial reporting of business combinations. The new guidance requires that the acquiring entity in a business combination recognize all (and only) the assets and liabilities assumed in the transaction, establishes the acquisition-date fair value as the measurement objective for all assets acquired and liabilities assumed, and requires the acquirer to disclose to investors and other users all of the information that they need to evaluate and understand the nature and financial effect of the business combination. In addition, the new guidance modifies the accounting for transaction and restructuring costs. It is effective for business combinations for which the acquisition date is on or after the beginning of the first annual reporting period beginning on or after December 15, 2008. We adopted the new guidance as of January 1, 2009, as required. The application of the new guidance could have an impact on our consolidated financial statements if we consummate business combinations in the future.
36
Table of Contents
ITEM 7A. QUANTITATIVE AND QUALITATIVE DISCLOSURES ABOUT MARKET RISK
During the normal course of business, we are routinely subjected to market risk associated with interest rate movements and foreign currency exchange rate movements. Interest rate risk arises from our debt obligations and related interest rate swap agreements. Foreign currency exchange rate risk arises from our non-U.S. operations and purchases of inventory from foreign suppliers.
We have risk in our exposure to certain material and transportation costs. Steel, leather, wood products and plastics are all used in the manufacture of our products. For the year ended December 31, 2009, material deflation was approximately $900 thousand and transportation deflation was approximately $4.1 million. During 2008, material inflation was approximately $11.6 million and transportation inflation was approximately $3.9 million. We continue to work to offset price increases in raw materials and transportation through our global sourcing initiatives, cost improvements and price increases to our products.
Interest Rate Risk
We have variable rate debt obligations that are denominated in U.S. dollars. A change in interest rates impacts the interest incurred and cash paid on the variable-rate debt.
We use interest rate swap agreements for other than trading purposes in order to manage our exposure to fluctuations in interest rates on our variable-rate debt. In May of 2008, we entered into four interest rate swap agreements in order to manage our interest rate risk. Each agreement hedges a notional amount of $150.0 million. Two of the agreements are effective from June 9, 2009 through June 9, 2010 and the other two are effective from June 9, 2010 through June 9, 2011. Fluctuations in LIBOR affect both our net financial instrument position and the amount of cash to be paid or received by us, if any, under these agreements. See Note 11 of the consolidated financial statements included in this annual report for further information regarding the interest rate swap agreements.
Taking into account payments on the above noted interest rate swap agreements, our weighted average rate for 2009 was 3.9%. The weighted average rate for the same period of 2008 was 4.3%.
The following table summarizes our market risks associated with our debt obligations and interest rate hedge agreements as of December 31, 2009. For debt obligations, the table presents principal cash flows and related weighted average interest rates by year of maturity. Variable interest rates presented for variable-rate debt represent the weighted average interest rates on our credit facility borrowings as of December 31, 2009. For interest rate swaps, the table presents the notional amounts and related weighted average interest rates by year of maturity.
| | | | | | | | | | | | | | | | | | | | | | | | | |
| | 2010 | | 2011 | | 2012 | | 2013 | | 2014 | | Thereafter | | Total | | Fair Value | |
|---|
| | (dollars in thousands)
| |
|---|
Rate Sensitive Liabilities | | | | | | | | | | | | | | | | | | | | | | | | | |
Long-term Debt: | | | | | | | | | | | | | | | | | | | | | | | | | |
Fixed Rate | | $ | 149 | | $ | 156 | | $ | — | | $ | — | | $ | — | | $ | — | | $ | 305 | | $ | 305 | |
Fixed Interest Rate | | | 4.11 | % | | 4.11 | % | | — | | | — | | | — | | | — | | | — | | | — | |
Variable Rate | | $ | — | | $ | — | | $ | — | | $ | 295,000 | | $ | — | | $ | — | | $ | 295,000 | | $ | 295,000 | |
Average Interest Rate | | | — | | | — | | | — | | | 1.51 | % | | — | | | — | | | — | | | — | |
Rate Sensitive Derivative Financial Instruments | | | | | | | | | | | | | | | | | | | | | | | | | |
Interest Rate swaps: | | | | | | | | | | | | | | | | | | | | | | | | | |
Notional Amount | | $ | 300,000 | | $ | 300,000 | | $ | — | | $ | — | | $ | — | | $ | — | | $ | 600,000 | | $ | (12,789 | ) |
Pay Fixed Interest Rate | | | 3.51 | % | | 4.10 | % | | — | | | — | | | — | | | — | | | | | | | |
Receive Variable Interest Rate | | | 0.26 | % | | 0.26 | % | | — | | | — | | | — | | | — | | | | | | | |
37
Table of Contents
The ineffective portion of the above noted swap agreements was deemed immaterial as of December 31, 2009.
An increase in our effective interest rate of 1% would increase annual interest expense by approximately $3.0 million. We will continue to review our exposure to interest rate fluctuations and evaluate whether we should manage such exposures through derivative transactions.
Foreign Currency Exchange Rate Risk
We manufacture our products in the United States, Canada and Italy, and sell our products primarily in those markets as well as in other European countries. Our foreign sales and certain expenses are transacted in foreign currencies. Our production costs, profit margins and competitive position are affected by the strength of the currencies in countries where we manufacture or purchase goods relative to the strength of the currencies in countries where our products are sold. Additionally, as our reporting currency is the U.S. dollar, our financial position is affected by the strength of the currencies in countries where we have operations relative to the strength of the U.S. dollar. The principal foreign currencies in which we conduct business are the Canadian dollar and the Euro. Approximately 11.7% and 13.9% of our revenues in 2009 and 2008, respectively, and 33.0% and 37.7% of our cost of goods sold in 2009 and 2008, respectively, were denominated in currencies other than the U.S. dollar. Foreign currency exchange rate fluctuations resulted in a $6.6 million translation loss in 2009 and a $2.9 million translation gain in 2008. The translation gains/losses do not reflect the impact of the translation of our operating results which are transacted in foreign countries.
From time to time, we enter into foreign currency forward exchange contracts and foreign currency option contracts for other than trading purposes in order to manage our exposure to foreign exchange rates associated with short-term operating receivables of a Canadian subsidiary that are payable by our U.S. operations. The terms of these contracts are generally less than a year. Changes in the fair value of such contracts are reported in earnings in the period the value of the contract changes. The net gain or loss upon settlement and the change in fair value of outstanding contracts is recorded as a component of other income (expense). As of December 31, 2009, we had no outstanding foreign currency contracts. During 2009, the Company did not enter into any outstanding foreign currency contracts. We had no outstanding foreign currency contracts at December 31, 2008. During 2008, we recognized a net loss of $7.8 million related to various foreign currency option contracts initiated and settled during 2008. We had no outstanding foreign currency contracts at December 31, 2007. During 2007, we recognized a net gain of $1.2 million related to various foreign currency option contracts initiated and settled during 2007.
38
Table of Contents
ITEM 8. FINANCIAL STATEMENTS AND SUPPLEMENTARY DATA
Report of Independent Registered Public Accounting Firm
The Board of Directors and Stockholders
Knoll, Inc.
We have audited the accompanying consolidated balance sheets of Knoll, Inc. as of December 31, 2009 and 2008, and the related consolidated statements of operations, stockholders' equity, and cash flows for each of the three years in the period ended December 31, 2009. Our audits also included the financial statement schedule listed in the Index at Item 15(a). These financial statements and schedule are the responsibility of the Company's management. Our responsibility is to express an opinion on these financial statements and schedule based on our audits.
We conducted our audits in accordance with the standards of the Public Company Accounting Oversight Board (United States). Those standards require that we plan and perform the audit to obtain reasonable assurance about whether the financial statements are free of material misstatement. An audit includes examining, on a test basis, evidence supporting the amounts and disclosures in the financial statements. An audit also includes assessing the accounting principles used and significant estimates made by management, as well as evaluating the overall financial statement presentation. We believe that our audits provide a reasonable basis for our opinion.
In our opinion, the financial statements referred to above present fairly, in all material respects, the consolidated financial position of Knoll, Inc. at December 31, 2009 and 2008, and the consolidated results of its operations and its cash flows for each of the three years in the period ended December 31, 2009, in conformity with U.S. generally accepted accounting principles. Also, in our opinion, the related financial statement schedule, when considered in relation to the basic financial statements taken as a whole, presents fairly, in all material respects, the information set forth therein.
We also have audited, in accordance with the standards of the Public Company Accounting Oversight Board (United States), Knoll, Inc.'s internal control over financial reporting as of December 31, 2009, based on criteria established in Internal Control—Integrated Framework issued by the Committee of Sponsoring Organizations of the Treadway Commission and our report dated March 1, 2010 expressed an unqualified opinion thereon.
/s/ Ernst and Young LLP
Philadelphia, Pennsylvania
March 1, 2010
39
Table of Contents
KNOLL, INC.
CONSOLIDATED BALANCE SHEETS
DECEMBER 31, 2009 AND 2008
(in thousands, except share and per share data)
| | | | | | | | |
| | December 31,
2009 | | December 31,
2008 | |
|---|
ASSETS | | | | | | | |
Current assets: | | | | | | | |
| | Cash and cash equivalents | | $ | 5,961 | | $ | 14,903 | |
| | Customer receivables, net | | | 113,652 | | | 126,051 | |
| | Inventories | | | 79,964 | | | 100,225 | |
| | Deferred income taxes | | | 4,994 | | | 10,899 | |
| | Prepaid and other current assets | | | 9,306 | | | 8,170 | |
| | | | | | |
Total current assets | | | 213,877 | | | 260,248 | |
Property, plant, and equipment, net | | | 135,045 | | | 132,168 | |
Goodwill, net | | | 75,612 | | | 74,301 | |
Intangible assets, net | | | 223,550 | | | 224,819 | |
Other non-trade receivables | | | 5,605 | | | 3,740 | |
Other noncurrent assets | | | 1,931 | | | 2,384 | |
| | | | | | |
Total Assets | | $ | 655,620 | | $ | 697,660 | |
| | | | | | |
LIABILITIES AND STOCKHOLDERS' EQUITY | | | | | | | |
Current liabilities: | | | | | | | |
| | Current maturities of long-term debt | | $ | 149 | | $ | 121 | |
| | Accounts payable | | | 74,687 | | | 78,442 | |
| | Income taxes payable | | | — | | | 13,328 | |
| | Other current liabilities | | | 78,428 | | | 103,129 | |
| | | | | | |
Total current liabilities | | | 153,264 | | | 195,020 | |
Long-term debt | | |
295,156 | | |
337,258 | |
Deferred income taxes | | | 36,997 | | | 35,245 | |
Postretirement benefits other than pensions | | | 23,435 | | | 23,111 | |
Pension liability | | | 41,046 | | | 46,031 | |
International retirement obligation | | | 4,444 | | | 3,891 | |
Other noncurrent liabilities | | | 11,716 | | | 12,485 | |
| | | | | | |
Total liabilities | | | 566,058 | | | 653,041 | |
| | | | | | |
Stockholders' equity: | | | | | | | |
Common stock, $0.01 par value; 200,000,000 shares authorized; 46,934,683 issued and outstanding (net of 12,425,927 treasury shares) at December 31, 2009 and 47,126,403 shares issued and outstanding (net of 12,179,358 treasury shares) at December 31, 2008 | | | 470 | | | 471 | |
Additional paid-in-capital | | | 6,736 | | | — | |
Retained earnings | | | 92,583 | | | 73,595 | |
Accumulated other comprehensive loss | | | (10,227 | ) | | (29,447 | ) |
| | | | | | |
Total stockholders' equity | | | 89,562 | | | 44,619 | |
| | | | | | |
Total Liabilities and Stockholders' Equity | | $ | 655,620 | | $ | 697,660 | |
| | | | | | |
See accompanying notes to the consolidated financial statements
40
Table of Contents
KNOLL, INC.
CONSOLIDATED STATEMENTS OF OPERATIONS
YEARS ENDED DECEMBER 31, 2009, 2008, AND 2007
(dollars in thousands, except share and per share data)
| | | | | | | | | | | |
| | 2009 | | 2008 | | 2007 | |
|---|
Sales | | $ | 780,033 | | $ | 1,120,147 | | $ | 1,055,814 | |
Cost of sales | | | 510,590 | | | 725,078 | | | 690,689 | |
| | | | | | | | |
Gross profit | | | 269,443 | | | 395,069 | | | 365,125 | |
Selling, general, and admistrative expenses | | | 193,995 | | | 245,032 | | | 222,937 | |
Restructuring and other charges | | | 11,959 | | | 4,625 | | | — | |
| | | | | | | | |
Operating Income | | | 63,489 | | | 145,412 | | | 142,188 | |
Interest expense | | | 13,862 | | | 16,289 | | | 24,598 | |
Other (expense) income, net | | | (5,832 | ) | | 3,679 | | | (4,651 | ) |
| | | | | | | | |
Income before income tax expense | | | 43,795 | | | 132,802 | | | 112,939 | |
Income tax expense | | | 16,442 | | | 47,890 | | | 41,496 | |
| | | | | | | | |
Net Income | | $ | 27,353 | | $ | 84,912 | | $ | 71,443 | |
| | | | | | | | |
Net earnings per share | | | | | | | | | | |
| | Basic | | $ | 0.60 | | $ | 1.82 | | $ | 1.48 | |
| | Diluted | | $ | 0.60 | | $ | 1.82 | | $ | 1.45 | |
Weighted-average shares outstanding: | | | | | | | | | | |
| | Basic | | | 45,403,401 | | | 46,570,272 | | | 48,239,189 | |
| | Diluted | | | 45,413,770 | | | 46,694,340 | | | 49,248,902 | |
See accompanying notes to the consolidated financial statements
41
Table of Contents
KNOLL, INC.
CONSOLIDATED STATEMENTS OF STOCKHOLDERS' EQUITY
YEARS ENDED DECEMBER 31, 2009, 2008, AND 2007
(dollars in thousands, except share and per share data)
| | | | | | | | | | | | | | | | | |
| | Common
Stock | | Additional
Paid-In
Capital | | Retained
Earnings
(Deficit) | | Accumulated
Other
Comprehensive
Income (Loss) | | Total
Stockholder's
Equity | |
|---|
Balance at January 1, 2007 | | $ | 490 | | $ | 4,409 | | $ | (2,726 | ) | $ | 2,211 | | $ | 4,384 | |
Net income | | | — | | | — | | | 71,443 | | | — | | | 71,443 | |
Foreign currency translation adjustment | | | — | | | — | | | — | | | 15,772 | | | 15,772 | |
Pension and other post-retirement liabilities (net of income tax effect of $7,161) | | | — | | | — | | | — | | | 10,990 | | | 10,990 | |
| | | | | | | | | | | | | | | | |
Total comprehensive income | | | | | | | | | | | | | | | 98,205 | |
| | | | | | | | | | | | | | | | |
Shares issued for consideration: | | | | | | | | | | | | | | | | |
| | Exercise of stock options, including tax benefit of $8,564 (2,225,033 shares) | | | 23 | | | 36,557 | | | — | | | — | | | 36,580 | |
| | Shares issued under stock incentive plan (514,654 shares) | | | 5 | | | (5 | ) | | — | | | — | | | — | |
| | Shares issued under employee stock purchase plan (3,637 shares) | | | — | | | 69 | | | — | | | — | | | 69 | |
Stock-based compensation, net of forfeitures (133,333 shares) | | | (1 | ) | | 5,904 | | | — | | | — | | | 5,903 | |
Cash dividend ($.45 per share) | | | — | | | — | | | (22,286 | ) | | — | | | (22,286 | ) |
Purchase of common stock (2,360,607 shares) | | | (24 | ) | | (46,934 | ) | | (1,176 | ) | | — | | | (48,134 | ) |
| | | | | | | | | | | | |
Balance at December 31, 2007 | | $ | 493 | | $ | — | | $ | 45,255 | | $ | 28,973 | | $ | 74,721 | |
Net income | | | — | | | — | | | 84,912 | | | — | | | 84,912 | |
Foreign currency translation adjustment | | | — | | | — | | | — | | | (27,030 | ) | | (27,030 | ) |
Unrealized loss on derivatives (net of income tax effect of $5,065) | | | | | | | | | | | | (7,774 | ) | | (7,774 | ) |
Pension and other post-retirement liabilities (net of income tax effect of $15,386) | | | — | | | — | | | — | | | (23,616 | ) | | (23,616 | ) |
| | | | | | | | | | | | | | | | |
Total comprehensive income | | | | | | | | | | | | | | | 26,492 | |
| | | | | | | | | | | | | | | | |
Shares issued for consideration: | | | | | | | | | | | | | | | | |
| | Exercise of stock options, including tax benefit of $203 (107,290 shares) | | | 1 | | | 1,399 | | | — | | | — | | | 1,400 | |
| | Shares issued under stock incentive plan (992,117 shares) | | | 10 | | | (10 | ) | | — | | | | | | — | |
| | Shares issued under employee stock purchase plan (5,841 shares) | | | — | | | 65 | | | — | | | — | | | 65 | |
| | Shares issued to Board of Directors in lieu of cash (5,465 shares) | | | | | | 79 | | | | | | | | | 79 | |
Stock-based compensation, net of forfeitures (183,462 shares) | | | (2 | ) | | 7,211 | | | — | | | — | | | 7,209 | |
Cash dividend ($.48 per share) | | | — | | | — | | | (22,845 | ) | | — | | | (22,845 | ) |
Purchase of common stock (3,089,191 shares) | | | (31 | ) | | (8,744 | ) | | (32,096 | ) | | — | | | (40,871 | ) |
Adjustment to apply new pension accounting guidance (net of tax of $998) | | | — | | | — | | | (1,631 | ) | | — | | | (1,631 | ) |
| | | | | | | | | | | | |
Balance at December 31, 2008 | | $ | 471 | | $ | — | | $ | 73,595 | | $ | (29,447 | ) | $ | 44,619 | |
Net income | | | — | | | — | | | 27,353 | | | — | | | 27,353 | |
Foreign currency translation adjustment | | | — | | | — | | | — | | | 18,709 | | | 18,709 | |
Change in the fair value of interest rate swap contracts (net of income tax effect of $20) | | | | | | | | | | | | 30 | | | 30 | |
Pension and other post-retirement liabilities (net of income tax effect of $305) | | | — | | | — | | | — | | | 481 | | | 481 | |
| | | | | | | | | | | | | | | | |
Total comprehensive income | | | | | | | | | | | | | | | 46,573 | |
| | | | | | | | | | | | | | | | |
Shares issued for consideration: | | | | | | | | | | | | | | | | |
| | Shares issued under stock incentive plan (40,818 shares) | | | — | | | — | | | — | | | — | | | — | |
| | Shares issued under employee stock purchase plan (6,716 shares) | | | — | | | 52 | | | — | | | — | | | 52 | |
| | Shares issued to Board of Directors in lieu of cash (7,314 shares) | | | — | | | 60 | | | — | | | — | | | 60 | |
Stock-based compensation, net of forfeitures (65,735 shares) | | | — | | | 8,210 | | | — | | | — | | | 8,210 | |
Cash dividend ($.18 per share) | | | — | | | — | | | (8,365 | ) | | — | | | (8,365 | ) |
Purchase of common stock (180,833 shares) | | | (1 | ) | | (1,586 | ) | | — | | | — | | | (1,587 | ) |
| | | | | | | | | | | | |
Balance at December 31, 2009 | | $ | 470 | | $ | 6,736 | | $ | 92,583 | | $ | (10,227 | ) | $ | 89,562 | |
| | | | | | | | | | | | |
See accompanying notes to the consolidated financial statements
42
Table of Contents
KNOLL, INC.
CONSOLIDATED STATEMENTS OF CASH FLOWS
YEARS ENDED DECEMBER 31, 2009, 2008, AND 2007
(in thousands)
| | | | | | | | | | |
| | 2009 | | 2008 | | 2007 | |
|---|
CASH FLOWS FROM OPERATING ACTIVITES | | | | | | | | | | |
Net income | | $ | 27,353 | | $ | 84,912 | | $ | 71,443 | |
Adustments to reconcile net income to cash provided by operating activities: | | | | | | | | | | |
Depreciation | | | 18,497 | | | 19,220 | | | 19,749 | |
Amortization of intangible assets | | | 2,082 | | | 2,246 | | | 1,573 | |
Write-off of deferred financing fees | | | — | | | — | | | 1,195 | |
Unrealized foreign currency loss (gain) | | | 5,517 | | | (11,013 | ) | | 4,831 | |
Stock based compensation | | | 8,209 | | | 7,208 | | | 5,903 | |
Other non-cash items | | | 636 | | | 1,262 | | | 157 | |
Changes in assets and liabilites: | | | | | | | | | | |
Customer receivables | | | 14,807 | | | 5,971 | | | 1,644 | |
Inventories | | | 23,112 | | | (11,520 | ) | | (2,795 | ) |
Accounts payable | | | (6,327 | ) | | (582 | ) | | 1,030 | |
Current and deferred income taxes | | | (9,583 | ) | | (6,680 | ) | | 281 | |
Other current assets | | | 2,470 | | | (9,596 | ) | | 2,072 | |
Other current liabilities | | | (28,707 | ) | | 16,588 | | | 6,380 | |
Other noncurrent assets and liabilities | | | (5,213 | ) | | 14,208 | | | (11,308 | ) |
| | | | | | | | |
Cash provided by operating activities | | | 52,853 | | | 112,224 | | | 102,155 | |
| | | | | | | | |
CASH FLOWS FOR INVESTING ACTIVITIES | | | | | | | | | | |
Capital expenditures | | | (13,706 | ) | | (18,530 | ) | | (16,292 | ) |
Purchase of a business, net of cash acquired | | | — | | | — | | | (70,777 | ) |
Purchase of intangibles | | | (813 | ) | | — | | | — | |
Proceeds from the sale of assets | | | — | | | — | | | 159 | |
| | | | | | | | |
Cash used in investing activites | | | (14,519 | ) | | (18,530 | ) | | (86,910 | ) |
| | | | | | | | |
CASH FLOWS FOR FINANCING ACTIVITIES | | | | | | | | | | |
(Repayment) proceeds from revolving credit facilites, net | | | (42,000 | ) | | (31,000 | ) | | 273,000 | |
Repayment of long-term debt | | | (131 | ) | | (129 | ) | | (254,806 | ) |
Deferred financing fees | | | — | | | — | | | (2,624 | ) |
Payment of dividends | | | (8,171 | ) | | (22,380 | ) | | (21,690 | ) |
Proceeds from the issuance of common stock | | | 111 | | | 1,796 | | | 29,015 | |
Purchase of common stock for treasury | | | (1,587 | ) | | (40,871 | ) | | (48,134 | ) |
Tax benefit from the exercise of stock options | | | — | | | 203 | | | 8,564 | |
| | | | | | | | |
Cash used in financing activites | | | (51,778 | ) | | (92,381 | ) | | (16,675 | ) |
| | | | | | | | |
Effect of exchange rate changes on cash and cash equivalents | | |
4,502 | | |
(4,385 |
) | |
3,367 | |
| | | | | | | | |
(Decrease) Increase in cash and cash equivalents | | |
(8,942 |
) | |
(3,072 |
) | |
1,937 | |
Cash and cash equivalents at beginning of period | | |
14,903 | | |
17,975 | | |
16,038 | |
| | | | | | | | |
Cash and cash equivalents at end of period | |
$ |
5,961 | |
$ |
14,903 | |
$ |
17,975 | |
| | | | | | | | |
See accompanying notes to the consolidated financial statements
43
Table of Contents
KNOLL, INC.
NOTES TO THE CONSOLIDATED FINANCIAL STATEMENTS
DECEMBER 31, 2009
1. NATURE OF OPERATIONS
Knoll, Inc. and its subsidiaries (the "Company" or "Knoll") are engaged in the design, manufacture and sale of office furniture products and accessories, focusing on the middle to high-end segments of the contract furniture market. The Company has operations in the United States ("U.S."), Canada and Europe and sells its products primarily through its direct sales representatives and independent dealers.
2. SUMMARY OF SIGNIFICANT ACCOUNTING POLICIES
Principles of Consolidation
The consolidated financial statements of the Company include the accounts of Knoll, Inc. and its wholly owned subsidiaries. Intercompany transactions and balances have been eliminated in consolidation.
The results of the European subsidiaries are reported and included in the consolidated financial statements on a one-month lag to allow for the timely preparation of consolidated information. The effect of this presentation is not material to the financial statements.
Cash and Cash Equivalents
Cash and cash equivalents include cash on hand and highly liquid investments with maturities of three months or less at the date of purchase.
Revenue Recognition and Accounts Receivable
Revenue from the sale of products is recognized upon transfer of title to the client, which primarily occurs at the time of shipment.
The Company maintains allowances for doubtful accounts for estimated losses resulting from the inability of its clients and dealers to make required payments. The allowance is determined through an analysis of the aging of accounts receivable and assessments of risk that are based on historical trends and an evaluation of the impact of current and projected economic conditions. The Company evaluates the past-due status of its trade receivables based on the contractual terms of sale. If the financial condition of the Company's clients and dealers were to deteriorate, resulting in an impairment of their ability to make payments, additional allowances may be required. Accounts receivable are charged off against the allowance for doubtful accounts when the Company determines that recovery is unlikely. Losses have been consistent with the Company's expectations.
Inventories
Inventories are stated at the lower of cost or market. Cost is determined using the first-in, first-out method.
Property, Plant, Equipment and Depreciation
Property, plant, and equipment are stated at cost, less accumulated depreciation. Depreciation is computed using the straight-line method over the estimated useful lives of the assets. The useful lives are as follows: 45 years for buildings and 2 to 12 years for machinery and equipment.
44
Table of Contents
KNOLL, INC.
NOTES TO THE CONSOLIDATED FINANCIAL STATEMENTS (Continued)
DECEMBER 31, 2009
2. SUMMARY OF SIGNIFICANT ACCOUNTING POLICIES (Continued)
Intangible Assets
The Company accounts for its intangible assets in accordance with the applicable accounting guidance for intangible assets. Intangible assets mainly consist of goodwill, trademarks and deferred financing fees. Goodwill is recorded at the amount by which cost exceeds the net assets of acquired businesses, and all other intangible assets are recorded at cost.
Goodwill and trademarks are tested for impairment annually or earlier if indicators of impairment exist. The Company has determined that there has been no impairment in these assets.
Deferred financing costs that are incurred by the Company in connection with the issuance of debt are deferred and amortized to interest expense over the life of the underlying indebtedness.
Shipping and Handling
Amounts billed to clients for shipping and handling of products are classified as sales in the consolidated statements of operations. Costs incurred by the Company for shipping and handling are classified as cost of sales.
Research and Development Costs
Research and development expenses, which are expensed as incurred and included as a component of selling, general, and administrative expenses on the statement of operations, were $14.4 million for 2009, $16.3 million for 2008, and $15.9 million for 2007.
Income Taxes
Deferred tax assets and liabilities are recognized for the future income tax consequences attributable to temporary differences between the financial statement carrying amounts of existing assets and liabilities and their respective tax bases and are measured using enacted tax rates expected to apply to taxable income in the years in which the temporary differences are expected to reverse.
The Company accounts for uncertain tax positions in accordance with the applicable accounting guidance for income taxes. Accordingly, the Company reports a liability for unrecognized tax benefits resulting from uncertain tax positions taken, or expected to be taken, in an income tax return. The Company recognizes interest and penalties, if any, related to unrecognized tax benefits in income tax expense.
Fair Value of Financial Instruments
The fair values of cash and cash equivalents, accounts receivable, and accounts payable, approximate their carrying amounts due to their immediate or short-term periods to maturity. The stated interest rates on the Company's long-term debt approximate market rates for debt instruments with similar terms and maturities, and accordingly, the fair value of the Company's long-term debt, described in Note 9, approximates its carrying amount.
45
Table of Contents
KNOLL, INC.
NOTES TO THE CONSOLIDATED FINANCIAL STATEMENTS (Continued)
DECEMBER 31, 2009
2. SUMMARY OF SIGNIFICANT ACCOUNTING POLICIES (Continued)
Derivative Financial Instruments
On May 21, 2008, the Company entered into four interest rate swap agreements for purposes of managing its risk in interest rate fluctuations. These agreements each hedge a notional amount of $150.0 million of the Company's borrowings under the revolving credit facility. Two of the agreements were effective June 9, 2009 and expire on June 9, 2010. On these two agreements, the Company pays a fixed rate of 3.51% and receives a variable rate of interest equal to three-month London Interbank Offered Rate (LIBOR), as determined on the last day of each quarterly settlement period. The other two agreements are effective on June 9, 2010 and expire on June 9, 2011. The Company pays a fixed rate of 4.10% on these two agreements and receives a variable rate of interest equal to three-month LIBOR.
The Company has elected to apply hedge accounting to these swap agreements. Changes in the fair value of these interest rate swap agreements are recorded as a component of accumulated other comprehensive income (loss) in the equity section of the balance sheet. The net amount paid or received upon quarterly settlements is recorded as an adjustment to interest expense, with a corresponding reduction in other comprehensive income (loss). See Note 11 of the consolidated financial statements included in this annual report for further information regarding the interest rate swap agreements.
Foreign Currency Translation
Results of foreign operations are translated into U.S. dollars using average exchange rates during the period, while assets and liabilities are translated into U.S. dollars using exchange rates in effect at the balance sheet date. The resulting translation adjustments are recorded in accumulated other comprehensive income. As of December 31, 2009 and 2008, the accumulated foreign currency translation adjustments included in other comprehensive income amounted to $21.9 million and $3.2 million, respectively. Transaction gains and losses resulting from exchange rate changes on transactions denominated in currencies other than the functional currency are included in income in the period in which the change occurs.
Stock-Based Compensation
The Company accounts for stock-based compensation according to applicable accounting guidance, which requires the Company to expense the cost of employee services received in exchange for an award of equity instruments based on the grant-date fair value of the award. This expense is recognized ratably over the requisite service period following the date of grant.
The fair value for stock options was estimated at the date of grant using a lattice option-pricing model, which requires management to make certain assumptions. The risk-free interest rate was based on the U.S. Treasury spot rate with a remaining term equal to the expected life assumed at the date of grant. Expected volatility at December 31, 2009 was estimated based on the historical volatility of the Company's stock price. The model takes into consideration the historical dividends paid on common stock. The weighted-average expected life was based on the contractual term of the stock option and expected employee exercise dates, which was based on the historical exercise behavior of the Company's employees. Forfeitures are estimated at the date of grant based on historical experience.
46
Table of Contents
KNOLL, INC.
NOTES TO THE CONSOLIDATED FINANCIAL STATEMENTS (Continued)
DECEMBER 31, 2009
2. SUMMARY OF SIGNIFICANT ACCOUNTING POLICIES (Continued)
The following are the weighted-average assumptions used in the lattice option-pricing model at December 31, 2009, 2008 and 2007:
| | | | | | | | | | |
| | 2009 | | 2008 | | 2007 | |
|---|
Expected volatility | | | 44 | % | | 31 | % | | 28 | % |
Expected dividend yield | | | 0.78 | % | | 3.61 | % | | 2.02 | % |
Expected Term (in years) | | | 6 | | | 8 | | | 7 | |
Risk-free rate | | | 3.34 | % | | 3.66 | % | | 4.88 | % |
Forfeiture Rate | | | 5.00 | % | | 4.00 | % | | 3.00 | % |
Accumulated Other Comprehensive (Loss) Income
The components of accumulated other comprehensive income (loss), net of tax, if applicable, are as follows (in thousands):
| | | | | | | | | | | | | | | | |
| | Beginning
Balance | | Before-Tax
Amount | | Tax Benefit
(Expense) | | Net-of-Tax
Amount | | Ending
Balance | |
|---|
December 31, 2007 | | | | | | | | | | | | | | | | |
Pension Adjustment | | $ | (12,275 | ) | $ | 18,151 | | $ | (7,161 | ) | $ | 10,990 | | $ | (1,285 | ) |
Foreign currency translation adjustment | | | 14,486 | | | 15,772 | | | — | | | 15,772 | | | 30,258 | |
| | | | | | | | | | | | |
Accumulated other comprehensive income | | $ | 2,211 | | $ | 33,923 | | $ | (7,161 | ) | $ | 26,762 | | $ | 28,973 | |
| | | | | | | | | | | | |
December 31, 2008 | | | | | | | | | | | | | | | | |
Pension Adjustment | | $ | (1,285 | ) | $ | (39,002 | ) | $ | 15,386 | | $ | (23,616 | ) | $ | (24,901 | ) |
Foreign currency translation adjustment | | | 30,258 | | | (27,030 | ) | | — | | | (27,030 | ) | | 3,228 | |
Unrealized loss on derivatives | | | — | | | (12,839 | ) | | 5,065 | | | (7,774 | ) | | (7,774 | ) |
| | | | | | | | | | | | |
Accumulated other comprehensive loss | | $ | 28,973 | | $ | (78,871 | ) | $ | 20,451 | | $ | (58,420 | ) | $ | (29,447 | ) |
| | | | | | | | | | | | |
December 31, 2009 | | | | | | | | | | | | | | | | |
Pension Adjustment | | $ | (24,901 | ) | $ | 786 | | $ | (305 | ) | | 481 | | $ | (24,420 | ) |
Foreign currency translation adjustment | | | 3,228 | | | 18,709 | | | — | | | 18,709 | | | 21,937 | |
Unrealized loss on derivatives | | | (7,774 | ) | | 50 | | | (20 | ) | | 30 | | | (7,744 | ) |
| | | | | | | | | | | | |
Accumulated other comprehensive loss | | $ | (29,447 | ) | $ | 19,545 | | $ | (325 | ) | $ | 19,220 | | $ | (10,227 | ) |
| | | | | | | | | | | | |
Earnings per Share
Basic earnings per share excludes the dilutive effect of (i) common shares that could potentially be issued due to the exercise of stock options, and (ii) unvested restricted shares and is computed by dividing net income by the weighted-average number of common shares outstanding for the period.
47
Table of Contents
KNOLL, INC.
NOTES TO THE CONSOLIDATED FINANCIAL STATEMENTS (Continued)
DECEMBER 31, 2009
2. SUMMARY OF SIGNIFICANT ACCOUNTING POLICIES (Continued)
Diluted earnings per share includes the effect of shares and potential shares issued under the stock incentive plans.
| | | | | | | | | | |
| | Twelve Months Ended
December 31, | |
|---|
| | 2009 | | 2008 | | 2007 | |
|---|
| | (in thousands)
| |
|---|
Weighted average shares of common stock outstanding—basic | | | 45,403 | | | 46,570 | | | 48,239 | |
Potentially dilutive shares resulting from stock plans | | | 10 | | | 124 | | | 1,010 | |
| | | | | | | | |
Weighted average common shares—diluted | | | 45,413 | | | 46,694 | | | 49,249 | |
Antidilutive options not included in the weighted average common shares-diluted calculation | | |
3,408 | | |
2,225 | | |
892 | |
| | | | | | | | |
Use of Estimates
The preparation of the consolidated financial statements in conformity with United States generally accepted accounting principles requires management to make estimates and assumptions that affect the reported amounts of certain assets, liabilities, revenues and expenses and the disclosure of certain contingent assets and liabilities. Actual results may differ from such estimates.
New Accounting Pronouncements
In June 2009, the Financial Accounting Standards Board ("FASB") issued new accounting guidance entitled, "TheFASB Accounting Standards CodificationTM and theHierarchy of Generally Accepted Accounting Principles—a replacement of FASB Statement No. 162", which identifies the sources of accounting principles and the framework for selecting the principles used in the preparation of financial statements of nongovernmental entities that are presented in conformity with GAAP in the United States. This new guidance establishes theFASB Accounting Standards CodificationTM as the source of authoritative accounting principles recognized by the FASB to be applied by nongovernmental entities in the preparation of financial statements in conformity with GAAP. This new guidance is effective for most financial statements issued for interim and annual periods ending after September 15, 2009. The Company has adopted this guidance as of September 30, 2009, as required. The adoption did not have a material impact on the Company's consolidated financial statements.
In May 2009, the FASB issued new accounting guidance on subsequent events which establishes general standards of accounting for and disclosure of events that occur after the balance sheet date but before financial statements are issued or are available to be issued. It does not apply to subsequent events or transactions that are within the scope of other applicable GAAP that provide different guidance on the accounting treatment for subsequent events or transactions. This new guidance is effective for interim or annual financial periods ending after June 15, 2009, and shall be applied prospectively. The Company adopted this new guidance as of June 30, 2009, as required. The adoption did not have a material impact on the Company's consolidated financial statements.
48
Table of Contents
KNOLL, INC.
NOTES TO THE CONSOLIDATED FINANCIAL STATEMENTS (Continued)
DECEMBER 31, 2009
2. SUMMARY OF SIGNIFICANT ACCOUNTING POLICIES (Continued)
On January 1, 2009, the Company adopted changes issued by the FASB to fair value accounting and reporting as it relates to nonfinancial assets and nonfinancial liabilities that are not recognized or disclosed at fair value in the financial statements on at least an annual basis. These changes define fair value, establish a framework for measuring fair value in GAAP, and expand disclosures about fair value measurements. This guidance applies to other GAAP that require or permit fair value measurements and is to be applied prospectively with limited exceptions. The adoption of these changes, as it relates to nonfinancial assets and nonfinancial liabilities, had no impact on the Company's financial statements. These provisions will be applied at such time a fair value measurement of a nonfinancial asset or nonfinancial liability is required, which may result in a fair value that is materially different than would have been calculated prior to the adoption of these changes.
In November 2008, the FASB issued new accounting guidance on accounting for defensive intangible assets. This guidance clarifies how to account for acquired defensive intangible assets subsequent to initial measurement that the Company does not intend to actively use but does intend to hold to prevent others from obtaining access to the asset. This new accounting guidance is effective for fiscal years beginning after December 15, 2008. The Company's adoption of the new guidance did not have a material impact on its consolidated results of operations, financial position or cash flows.
In April 2008, the FASB issued new accounting guidance which amends the factors that should be considered in developing renewal or extension assumptions used to determine the useful life of a recognized intangible asset. The intent of this new guidance is to improve the consistency between the useful life of a recognized intangible asset and the period of expected cash flows used to measure the fair value of the assets. This new guidance is effective for financial statements issued for fiscal years and interim periods beginning after December 15, 2008. The Company adopted the new guidance as of January 1, 2009, as required. The Company's adoption of this guidance did not have a material impact on its consolidated financial statements.
In March 2008, the FASB issued new accounting guidance which requires enhanced disclosures about an entity's derivative and hedging activities. Specifically, entities are required to provide enhanced disclosures about: a) how and why an entity uses derivative instruments; b) how derivative instruments and related hedged items are accounted for; and c) how derivative instruments and related hedged items affect an entity's financial position, financial performance and cash flows. The new guidance is effective for financial statements issued for fiscal years and interim periods beginning after November 15, 2008, with early application encouraged. The new guidance encourages, but does not require, comparative disclosures for earlier periods at initial adoption. The Company adopted the new guidance as of January 1, 2009, as required. The Company's adoption did not have a material impact on its consolidated financial statements.
In December 2007, the FASB issued new accounting guidance which is intended to improve reporting by creating greater consistency in the accounting and financial reporting of business combinations. The new guidance requires that the acquiring entity in a business combination recognize all (and only) the assets and liabilities assumed in the transaction, establishes the acquisition-date fair value as the measurement objective for all assets acquired and liabilities assumed, and requires the acquirer to disclose to investors and other users all of the information that they need to evaluate and understand the nature and financial effect of the business combination. In addition, the new guidance modifies the accounting for transaction and restructuring costs. It is effective for business combinations
49
Table of Contents
KNOLL, INC.
NOTES TO THE CONSOLIDATED FINANCIAL STATEMENTS (Continued)
DECEMBER 31, 2009
2. SUMMARY OF SIGNIFICANT ACCOUNTING POLICIES (Continued)
for which the acquisition date is on or after the beginning of the first annual reporting period beginning on or after December 15, 2008. The Company adopted the new guidance as of January 1, 2009, as required. The application of the new guidance could have an impact on the Company's consolidated financial statements if the Company consummates business combinations in the future.
3. ACQUISTIONS
On October 1, 2007, the Company acquired Teddy & Arthur Edelman, Limited. Edelman Leather, LLC supplies fine leathers to residential, hospitality, aviation and contract office furniture markets. The closing cash purchase price was approximately $70.8 million and was primarily financed using the Company's revolving credit facility described in Note 9. The final purchase price was contingent upon Edelman Leather, LLC's earnings in both 2008 and 2009. See Note 7 for the 2008 portion of the earn out. The 2009 contingent consideration was not earned. This acquisition has been accounted for as a purchase and resulted in the recognition of $30.6 million of goodwill in the Company's financial statements.
4. CUSTOMER RECEIVABLES
Customer receivables are presented net of an allowance for doubtful accounts of $5.1 million and $9.2 million at December 31, 2009 and 2008, respectively. Management performs ongoing credit evaluations of its clients and generally does not require collateral. As of December 31, 2009 and 2008, the U.S. government and agencies thereof, represented approximately 28.8% and 18.9%, respectively, of gross customer receivables.
5. INVENTORIES
| | | | | | | |
| | 2009 | | 2008 | |
|---|
| | (in thousands)
| |
|---|
Raw materials | | $ | 39,112 | | $ | 48,138 | |
Work in process | | | 6,447 | | | 7,423 | |
Finished goods | | | 34,405 | | | 44,664 | |
| | | | | | |
Inventories | | $ | 79,964 | | $ | 100,225 | |
| | | | | | |
Inventory reserves for obsolescence and other estimated losses were $8.4 million and $6.8 million at December 31, 2009 and 2008, respectively.
50
Table of Contents
KNOLL, INC.
NOTES TO THE CONSOLIDATED FINANCIAL STATEMENTS (Continued)
DECEMBER 31, 2009
6. PROPERTY, PLANT, AND EQUIPMENT
| | | | | | | |
| | 2009 | | 2008 | |
|---|
| | (in thousands)
| |
|---|
Land and buildings | | $ | 105,937 | | $ | 93,840 | |
Machinery and equipment | | | 265,397 | | | 274,265 | |
Construction in progress | | | 1,566 | | | 7,173 | |
| | | | | | |
Property, plant and equipment | | | 372,900 | | | 375,278 | |
Accumulated depreciation | | | (237,855 | ) | | (243,110 | ) |
| | | | | | |
Property, plant and equipment, net | | $ | 135,045 | | $ | 132,168 | |
| | | | | | |
7. INTANGIBLE ASSETS
Information regarding the Company's goodwill and other intangible assets follows (in thousands):
| | | | | | | | | | | | | | | | | | | |
| | 2009 | | 2008 | |
|---|
| | Gross
Amount | | Accumulated
Amortization | | Net
Amount | | Gross
Amount | | Accumulated
Amortization | | Net
Amount | |
|---|
Unamortizable intangible assets: | | | | | | | | | | | | | | | | | | | |
Goodwill | | $ | 84,024 | | $ | (8,412 | ) | $ | 75,612 | | $ | 82,713 | | $ | (8,412 | ) | $ | 74,301 | |
Trademarks | | | 219,900 | | | (32,069 | ) | | 187,831 | | | 219,900 | | | (32,069 | ) | | 187,831 | |
Edelman Trade Name | | | 26,050 | | | — | | | 26,050 | | | 26,050 | | | — | | | 26,050 | |
Amortizable intangible assets: | | | | | | | | | | | | | | | | | | | |
Deferred financing fees | | | 4,241 | | | (2,100 | ) | | 2,141 | | | 4,241 | | | (1,488 | ) | | 2,753 | |
Trademarks | | | 3,000 | | | (1,772 | ) | | 1,228 | | | 3,000 | | | (1,315 | ) | | 1,685 | |
Other | | | 8,569 | | | (2,269 | ) | | 6,300 | | | 7,755 | | | (1,255 | ) | | 6,500 | |
| | | | | | | | | | | | | | |
| | $ | 345,784 | | $ | (46,622 | ) | $ | 299,162 | | $ | 343,659 | | $ | (44,539 | ) | $ | 299,120 | |
| | | | | | | | | | | | | | |
On October 1, 2007, in combination with the acquisition of Teddy & Arthur Edelman, Limited, the Company acquired certain intangible assets related to a trade name, non-compete agreement, customer relationships and goodwill. The trade name was valued at $26.1 million and is tested annually for impairment. The non-compete agreement and customer relationships intangibles were valued at $0.7 million and $6.4 million, respectively. These were assigned definite useful lives and as such amortization is recorded over the economic life of the intangibles in accordance with the applicable accounting guidance for intangible assets. Goodwill for the acquisition of Teddy & Arthur Edelman, Limited was recorded at $30.6 million and is tested for impairment annually.
The Company will evaluate annually whether the estimated useful life of the trademarks warrant revisions and any such changes will be applied prospectively.
51
Table of Contents
KNOLL, INC.
NOTES TO THE CONSOLIDATED FINANCIAL STATEMENTS (Continued)
DECEMBER 31, 2009
7. INTANGIBLE ASSETS (Continued)
The changes in the carrying amount of goodwill are as follows:
| | | | | | | |
| | 2009 | | 2008 | |
|---|
| | (in thousands)
| |
|---|
Balance at beginning of year | | $ | 74,301 | | $ | 75,590 | |
Edelman Leather Acquisition | | | — | | | 1,492 | |
Income tax adjustment for European NOLs | | | — | | | 846 | |
Foreign currency transaction gain (loss) | | | 1,311 | | | (3,627 | ) |
| | | | | | |
Balance at end of year | | $ | 75,612 | | $ | 74,301 | |
| | | | | | |
During 2008, in combination with the acquisition of Teddy and Arthur Edelman, Limited, incremental consideration of $1.7 million was earned by the former owners and was paid out during the first quarter of 2009. This amount was partially offset by $0.2 million of working capital adjustments in 2008. In accordance with the appropriate accounting guidance, the incremental consideration was added to goodwill.
On June 29, 2007, the Company completed the refinancing of its existing credit facility with a new $500 million revolving credit facility. As a result of this transaction, approximately $1.2 million of deferred financing fees, net of accumulated amortization were written-off and approximately $2.6 million of new deferred financing fees were recorded.
The Company recorded amortization of deferred financing fees of approximately $612,000, $611,000, and $637,000 for the years ended December 31, 2009, 2008 and 2007, respectively. This amortization was recorded as a component of interest expense.
Estimated amortization expense for the deferred financing fees and other intangibles for each of the five succeeding years is as follows (in thousands):
| | | | |
2010 | | $ | 2,468 | |
2011 | | | 2,334 | |
2012 | | | 1,832 | |
2013 | | | 832 | |
2014 | | | 470 | |
8. OTHER CURRENT LIABILITIES
| | | | | | | |
| | 2009 | | 2008 | |
|---|
| | (in thousands)
| |
|---|
Accrued employee compensation | | $ | 25,202 | | $ | 44,841 | |
Accrued pension costs | | | 10,000 | | | 9,870 | |
Customer deposits | | | 5,925 | | | 6,639 | |
Derivatives | | | 9,025 | | | 6,576 | |
Accrued warranty | | | 9,773 | | | 11,528 | |
Other | | | 18,503 | | | 23,675 | |
| | | | | | |
Other current liabilities | | $ | 78,428 | | $ | 103,129 | |
| | | | | | |
52
Table of Contents
KNOLL, INC.
NOTES TO THE CONSOLIDATED FINANCIAL STATEMENTS (Continued)
DECEMBER 31, 2009
9. INDEBTEDNESS
The Company's long-term debt is summarized as follows:
| | | | | | | |
| | 2009 | | 2008 | |
|---|
| | (in thousands)
| |
|---|
Revolving loans, variable rate (1.51% at December 31, 2009 and 3.04% at December 31, 2008) | | $ | 295,000 | | $ | 337,000 | |
Other | | | 305 | | | 379 | |
| | | | | | |
Total | | | 295,305 | | | 337,379 | |
Less current maturities | | | (149 | ) | | (121 | ) |
| | | | | | |
Long-term debt | | $ | 295,156 | | $ | 337,258 | |
| | | | | | |
Term and Revolving Loans
On June 29, 2007, the Company completed the refinancing of its existing credit facility with a $500.0 million revolving credit facility maturing in June 2013. The Company may use its revolving line of credit for general corporate purposes, including strategic acquisitions, stock buy backs and cash dividends. Under the Company's credit agreement, the Company can increase its revolving credit facility by up to $200.0 million subject to certain limitations and satisfaction of certain conditions, including compliance with certain financial covenants.
Loans made pursuant to the revolving credit facility may be borrowed, repaid and reborrowed from time to time until June 2013, subject to satisfaction of certain conditions on the date of any such borrowing. Obligations under the credit facility are secured by a first priority security interest in (i) the capital stock of each present and future subsidiary (with limitations on foreign subsidiaries) and (ii) all present and future property and assets of the Company (with various limitations and exceptions). Borrowings under the credit agreement bear interest at a floating rate based, at the Company's option, upon (i) the LIBOR rate plus an applicable percentage or (ii) the greater of the federal funds rate plus 0.50% or the prime rate as announced by the revolving credit facility's administrative agent, plus an applicable percentage.
The senior credit agreement contains a letter of credit subfacility that allows for the issuance of letters of credit and swing-line loans. The sum of the outstanding revolver balance plus any outstanding letters of credit and swing-line loans cannot exceed $500.0 million subject to the ability to increase the credit facility by up to $200.0 million as mentioned above. The amount available for borrowing under the revolving credit facility is reduced by the total outstanding letters of credit and swing-line loans.
The Company is required to pay a commitment fee equal to a rate per annum calculated as the product of the applicable rate based upon the Company's leverage ratio as set forth in the credit agreement times the unused portion of the revolving credit facility. In addition, the Company is required to pay a letter of credit fee equal to the applicable rate as set forth in the credit agreement times the daily maximum amount available to be drawn under such letter of credit.
In addition, the credit agreement also contains various affirmative and negative covenants that among other things, limit, subject to certain exceptions, the incurrence of additional indebtedness and
53
Table of Contents
KNOLL, INC.
NOTES TO THE CONSOLIDATED FINANCIAL STATEMENTS (Continued)
DECEMBER 31, 2009
9. INDEBTEDNESS (Continued)
capital expenditures in excess of a specified amount in any fiscal year. The Company was in compliance with the credit agreement covenants at December 31, 2009.
The Company also has several revolving credit agreements with various European financial institutions. These credit agreements provide credit primarily for overdraft and working capital purposes. As of December 31, 2009, total credit available under such agreements was approximately $9,853,000. There is currently no expiration date on these agreements. The interest rates on borrowings are variable and are based on the monetary market rate that is linked to each country's prime rate. As of December 31, 2009, the Company had no outstanding borrowings under the European credit facilities.
Interest Paid
During 2009, 2008 and 2007, the Company made interest payments including amounts related to the Company's interest rate collar swap and cap agreements totaling $12.8 million, $16.6 million and $22.9 million respectively.
Maturities
Aggregate maturities of the Company's indebtedness as of December 31, 2009 are as follows (in thousands):
| | | | |
2010 | | $ | 149 | |
2011 | | | 156 | |
2012 | | | — | |
2013 | | | 295,000 | |
2014 | | | — | |
| | | | |
| | $ | 295,305 | |
| | | | |
10. PREFERRED STOCK
The Company's Certificate of Incorporation authorizes the issuance of 10,000,000 shares of preferred stock with a par value of $1.00 per share. Subject to applicable laws, the Board of Directors is authorized to provide for the issuance of preferred shares in one or more series, for such consideration and with designations, powers, preferences and relative, participating, optional or other special rights and the qualifications, limitations or restrictions thereof, as shall be determined by the Board of Directors. There was no Preferred Stock outstanding as of December 31, 2009 and 2008.
11. DERIVATIVE FINANCIAL INSTRUMENTS
Interest Rate Swap
On May 21, 2008, the Company entered into four interest rate swap agreements for purposes of managing its risk in interest rate fluctuations. These agreements each hedge a notional amount of $150.0 million of the Company's borrowings under the revolving credit facility. Two of the agreements were effective June 9, 2009 and expire on June 9, 2010. On these two agreements, the Company pays a
54
Table of Contents
KNOLL, INC.
NOTES TO THE CONSOLIDATED FINANCIAL STATEMENTS (Continued)
DECEMBER 31, 2009
11. DERIVATIVE FINANCIAL INSTRUMENTS (Continued)
fixed rate of 3.51% and receives a variable rate of interest equal to three-month London Interbank Offered Rate (LIBOR), as determined on the last day of each quarterly settlement period. The other two agreements are effective on June 9, 2010 and expire on June 9, 2011. The Company pays a fixed rate of 4.10% on these two agreements and receives a variable rate of interest equal to three-month LIBOR. Our agreements are with major financial institutions, and because our position at December 31, 2009 are in a net liability position, we believe the risk of nonperformance by the counterparties is not significant.
The Company has elected to apply hedge accounting to these swap agreements. Changes in the fair value of these interest rate swap agreements are recorded as a component of accumulated other comprehensive income (loss) in the equity section of the balance sheet. The net amount paid or received upon quarterly settlements is recorded as an adjustment to interest expense, with a corresponding reduction in other comprehensive income (loss).
The effect of derivative instruments on the consolidated statement of income for the twelve months ended December 31, 2009 was as follows (in thousands):
| | | | | | | | | | | | | | |
Derivatives in
Cash Flow
Hedge
Relationship | | Before-Tax
Gain (Loss)
Recognized in
OCI on Derivative
(Effective Portion) | | Locations of
Gain (Loss)
Reclassified from
AOCI into Income
(Effective Portion) | | Before-Tax
Gain (Loss)
Reclassified from
AOCI into Income
(Effective Portion) | | Locations of
Gain (Loss)
Recognized in
Income on
Derivative
(Ineffective Portion) | | Gain (Loss)
Recognized in
Income on
Derivative
(Ineffective Portion) | |
|---|
Interest rate swap contracts | | $ | (5,176 | ) | Interest Expense | | $ | (5,226 | ) | None | | $ | — | |
| | | | | | | | | | | | |
Total | | $ | (5,176 | ) | | | $ | (5,226 | ) | | | $ | — | |
| | | | | | | | | | | | |
The effect of derivative instruments on the consolidated statement of income for the twelve months ended December 31, 2008 was as follows (in thousands):
| | | | | | | | | | | | | | |
Derivatives in
Cash Flow
Hedge
Relationship | | Before-Tax
Gain (Loss)
Recognized in
OCI on Derivative
(Effective Portion) | | Locations of
Gain (Loss)
Reclassified from
AOCI into Income
(Effective Portion) | | Before-Tax
Gain (Loss)
Reclassified from
AOCI into Income
(Effective Portion) | | Locations of
Gain (Loss)
Recognized in
Income on
Derivative
(Ineffective Portion) | | Gain (Loss)
Recognized in
Income on
Derivative
(Ineffective Portion) | |
|---|
Interest rate swap contracts | | $ | (12,839 | ) | Interest Expense | | $ | — | | None | | $ | — | |
| | | | | | | | | | | | |
Total | | $ | (12,839 | ) | | | $ | — | | | | $ | — | |
| | | | | | | | | | | | |
Assuming interest rates stay at current levels, in the coming twelve months, the Company anticipates that approximately $9.0 million will be reclassified from other comprehensive income (loss), to interest expense in connection with quarterly settlements of the above-referenced swap agreements.
55
Table of Contents
KNOLL, INC.
NOTES TO THE CONSOLIDATED FINANCIAL STATEMENTS (Continued)
DECEMBER 31, 2009
11. DERIVATIVE FINANCIAL INSTRUMENTS (Continued)
The following table sets forth the fair value of the interest rate swap contract liabilities included in current and non-current liabilities within the consolidated balance sheets at December 31, 2009 and December 31, 2008:
| | | | | | | |
| | December 31,
2009 | | December 31,
2008 | |
|---|
| | (in thousands)
| |
|---|
Interest rate swap agreements | | $ | (12,789 | ) | $ | (12,839 | ) |
The fair value of the Company's derivative instruments included in current liabilities was $9.0 million at December 31, 2009. The fair value of the Company's derivative instruments included in non-current liabilities was $3.8 million at December 31, 2009. The fair value of the Company's derivative instruments included in current liabilities was $6.6 million at December 31, 2008. The fair value of the Company's derivative instruments included in non-current liabilities was $6.2 million at December 31, 2008.
The Company will continue to review its exposure to interest rate fluctuations and evaluate whether it should manage such exposure through derivative transactions.
Foreign Currency Contracts
From time to time, the Company enters into foreign currency forward exchange contracts and foreign currency option contracts to manage its exposure to foreign exchange rates associated with short-term operating receivables of a Canadian subsidiary that are payable by the U.S. operations. The terms of these contracts are generally less than a year. Changes in the fair value of such contracts are reported in earnings in the period the value of the contract changes. The net gain or loss upon settlement and the remaining change in fair value is recorded as a component of other income (expense).
During 2009, the Company did not enter into any foreign currency contracts.
The Company had no outstanding foreign currency contracts at December 31, 2008. During 2008, the Company recognized a net loss of $7.8 million related to various foreign currency option contracts initiated and settled during 2008, which was recorded in other (expense) income.
The Company had no outstanding foreign currency contracts at December 31, 2007. During 2007, the Company recognized a net gain of $1.2 million related to various foreign currency option contracts initiated and settled during 2007, which was recorded in other (expense) income.
12. CONTINGENT LIABILITIES AND COMMITMENTS
The Company is currently involved in claims and matters of litigation, including environmental contingencies, arising in the ordinary course of business. The Company accrues for such matters when expenditures are probable and reasonably estimatable. Based upon information presently known, management is of the opinion that such litigation, either individually or in the aggregate, will not have a material adverse effect on the Company's consolidated financial position, results of operations, or cash flows.
56
Table of Contents
KNOLL, INC.
NOTES TO THE CONSOLIDATED FINANCIAL STATEMENTS (Continued)
DECEMBER 31, 2009
12. CONTINGENT LIABILITIES AND COMMITMENTS (Continued)
The Company offers a warranty for all of its products. The specific terms and conditions of those warranties vary depending upon the product sold. The Company estimates the costs that may be incurred under its warranties and records a liability in the amount of such costs at the time product revenue is recognized. Factors that affect the Company's liability include historical product-failure experience and estimated repair costs for identified matters for each specific product category. The Company periodically assesses the adequacy of its recorded warranty liabilities and adjusts the amounts as necessary. Adjustments to recorded reserves for pre-existing warranties are not material for each period presented.
Changes in the Company's warranty reserve during the years ended December 31, 2009, 2008, and 2007 were as follows:
| | | | | | | | | | |
| | 2009 | | 2008 | | 2007 | |
|---|
| | (in thousands)
| |
|---|
Balance, beginning of the year | | $ | 11,528 | | $ | 10,078 | | $ | 7,436 | |
Provision for warranty claims | | | 5,295 | | | 11,007 | | | 11,637 | |
Warranty claims paid | | | (7,260 | ) | | (9,327 | ) | | (9,135 | ) |
Exchange rate impact | | | 210 | | | (230 | ) | | 140 | |
| | | | | | | | |
Balance, end of the year | | $ | 9,773 | | $ | 11,528 | | $ | 10,078 | |
| | | | | | | | |
At December 31, 2009, the Company employed a total of 3,177 people. The 2009 restructuring plans reduced headcount by approximately 17.2% when compared to the prior year. Approximately 15.0% of the employees were represented by unions at December 31, 2009. The Grand Rapids, Michigan plant is the only unionized plant within the U.S. and has an agreement with the Carpenters Union, Local 1615, of the United Brotherhood of Carpenters and Joiners of America, Affiliate of the Carpenters Industrial Council (the Union), covering approximately 280 hourly employees. The Collective Bargaining Agreement expires August 27, 2011. Certain workers in the facilities in Italy are also represented by unions.
13. INCOME TAXES
Income before income tax expense consists of the following:
| | | | | | | | | | |
| | 2009 | | 2008 | | 2007 | |
|---|
| | (in thousands)
| |
|---|
U.S. operations | | $ | 44,199 | | $ | 101,566 | | $ | 94,664 | |
Foreign operations | | | (404 | ) | | 31,236 | | | 18,275 | |
| | | | | | | | |
| | $ | 43,795 | | $ | 132,802 | | $ | 112,939 | |
| | | | | | | | |
57
Table of Contents
KNOLL, INC.
NOTES TO THE CONSOLIDATED FINANCIAL STATEMENTS (Continued)
DECEMBER 31, 2009
13. INCOME TAXES (Continued)
Income tax expense is comprised of the following:
| | | | | | | | | | |
| | 2009 | | 2008 | | 2007 | |
|---|
| | (in thousands)
| |
|---|
Current: | | | | | | | | | | |
Federal | | $ | 9,151 | | $ | 30,140 | | $ | 23,699 | |
State | | | 1,822 | | | 6,110 | | | 5,160 | |
Foreign | | | 244 | | | 8,205 | | | 6,367 | |
| | | | | | | | |
Total current | | | 11,217 | | | 44,455 | | | 35,226 | |
| | | | | | | | |
Deferred: | | | | | | | | | | |
Federal | | $ | 5,593 | | $ | 2,385 | | $ | 5,920 | |
State | | | 775 | | | 465 | | | 824 | |
Foreign | | | (1,143 | ) | | 585 | | | (474 | ) |
| | | | | | | | |
Total deferred | | | 5,225 | | | 3,435 | | | 6,270 | |
| | | | | | | | |
Income tax expense | | $ | 16,442 | | $ | 47,890 | | $ | 41,496 | |
| | | | | | | | |
The following table sets forth the tax effects of temporary differences that give rise to the deferred tax assets and liabilities:
| | | | | | | |
| | 2009 | | 2008 | |
|---|
| | (in thousands)
| |
|---|
Deferred tax assets: | | | | | | | |
Accounts receivable, principally due to allowance for doubtful accounts | | $ | 1,295 | | $ | 3,589 | |
Inventories | | | 3,189 | | | 2,906 | |
Net operating loss carryforwards | | | 10,190 | | | 10,074 | |
Accrued pension | | | 17,956 | | | 18,771 | |
Stock-based compensation | | | 4,556 | | | 2,918 | |
Compensation-related accruals | | | 3,052 | | | 3,732 | |
Warranty | | | 3,469 | | | 4,216 | |
Obligation for postretirement benefits other than pension | | | 9,682 | | | 8,308 | |
Interest Rate Swap Agreement | | | 4,974 | | | 5,065 | |
Accrued liabilities and other items | | | 5,512 | | | 5,459 | |
| | | | | | |
Gross deferred tax assets | | | 63,875 | | | 65,038 | |
Valuation allowance | | | (8,890 | ) | | (9,241 | ) |
| | | | | | |
Net deferred tax assets | | | 54,985 | | | 55,797 | |
| | | | | | |
Deferred tax liabilities: | | | | | | | |
Intangibles | | | 73,703 | | | 65,928 | |
Plant and equipment | | | 13,285 | | | 14,215 | |
| | | | | | |
Gross deferred tax liabilities | | | 86,988 | | | 80,143 | |
| | | | | | |
Net deferred tax liabilities | | $ | (32,003 | ) | $ | (24,346 | ) |
| | | | | | |
58
Table of Contents
KNOLL, INC.
NOTES TO THE CONSOLIDATED FINANCIAL STATEMENTS (Continued)
DECEMBER 31, 2009
13. INCOME TAXES (Continued)
Income taxes paid, net of refunds received, by the Company during 2009, 2008, and 2007 totaled $27,121,000, $30,547,000, and $35,710,000 respectively.
As of December 31, 2009, the Company had net operating loss carryforwards totaling approximately $38,397,000 in various foreign tax jurisdictions which may be carried forward between five years and an unlimited time. The Company provides a valuation allowance against certain net foreign deferred tax assets (principally the net operating loss carryforwards) due to the uncertainty that they can be realized. Changes to this valuation allowance in any future period will be recorded as an income tax benefit in our statement of operations.
During 2009 the Company reduced the valuation allowance by $467,000 to recognize the benefits associated with net operating loss carry forwards that the Company concluded would be realized. This entire amount was reflected as a foreign deferred income tax benefit in our statement of operations for the current year.
The foreign deferred income tax benefit for the current year includes a $625,000 benefit associated with a current year net operating loss in Italy.
The following table sets forth a reconciliation of the statutory federal income tax rate to the effective income tax rate:
| | | | | | | | | | |
| | 2009 | | 2008 | | 2007 | |
|---|
Federal statutory tax rate | | | 35.0 | % | | 35.0 | % | | 35.0 | % |
Increase in the tax rate resulting from: | | | | | | | | | | |
State taxes, net of federal effect | | | 3.8 | | | 3.2 | | | 3.4 | |
Effect of tax rates of other countries | | | (1.6 | ) | | (1.5 | ) | | (0.7 | ) |
Non-deductible IPO expense | | | — | | | — | | | — | |
Section 199 deduction | | | (0.7 | ) | | (1.0 | ) | | (1.4 | ) |
Other | | | 1.2 | | | 0.4 | | | 0.4 | |
| | | | | | | | |
Effective tax rate | | | 37.7 | % | | 36.1 | % | | 36.7 | % |
| | | | | | | | |
The Company has not made provisions for U.S. federal and state income taxes as of December 31, 2009 on $89.5 million of foreign earnings that are expected to be reinvested indefinitely. Upon distribution of those earnings in the form of dividends or otherwise, the Company would be subject to U.S. federal and state income taxes (subject to an adjustment for foreign tax credits) and withholding taxes payable to the various foreign countries. The Company is currently unable to determine the amount of unrecognized deferred tax liability.
The Company adopted new accounting guidance relating to income taxes, on January 1, 2007, the beginning of the Company's fiscal year. As of January 1, 2007, the Company had unrecognized tax benefits of $2.8 million. The Company was not required to record any cumulative effect adjustment to retained earnings as a result of adopting the new guidance. As of December 31, 2009, the Company had unrecognized tax benefits of approximately $1.8 million. The entire amount of the unrecognized tax benefits would reduce the effective tax rate if recognized.
59
Table of Contents
KNOLL, INC.
NOTES TO THE CONSOLIDATED FINANCIAL STATEMENTS (Continued)
DECEMBER 31, 2009
13. INCOME TAXES (Continued)
The following table summarizes the activity related to our unrecognized tax benefits during 2009 and 2008:
| | | | | | | | |
| | 2009 | | 2008 | |
|---|
| | (in thousands)
| |
|---|
Balance, beginning of the year | | $ | 1,673 | | $ | 2,255 | |
Additions for tax positions related to the current year | | | 106 | | | 96 | |
Additions for tax positions related to the prior year | | | 79 | | | 2 | |
Prior year reductions | | | | | | | |
| | Settlements with taxing authorities | | | (17 | ) | | (311 | ) |
| | Lapse of statute of limitations | | | (120 | ) | | (274 | ) |
| | Change in exchange rate | | | 100 | | | (95 | ) |
| | | | | | |
Balance, end of the year | | $ | 1,821 | | $ | 1,673 | |
| | | | | | |
Interest and penalties, if any, related to unrecognized tax benefits are recorded in income tax expense. For the potential payment of interest and penalties, the Company had accrued $0.5 million at December 31, 2009 and $0.5 million at December 31, 2008.
As of December 31, 2009, the Company is subject to U.S. Federal Income Tax examination for the tax years 2006 through 2009, and to non-U.S. income tax examination for the tax years 2001 to 2009. In addition, the Company is subject to state and local income tax examinations for the tax years 2004 through 2009.
There are no tax positions included in unrecognized tax benefits at December 31, 2009 for which it is reasonably possible that the total amounts could significantly change during the next twelve months.
14. LEASES
The Company has commitments under operating leases for certain machinery and equipment as well as manufacturing, warehousing, showroom and other facilities used in its operations. Some of the leases contain renewal provisions and generally require the Company to pay certain operating expenses, including utilities, insurance and taxes, which are subject to escalation. At times the Company enters into lease agreements which contain a provision for cash abatements related to certain leasehold improvements. These abatements are recognized on a straight-line basis as a reduction to rent expense over the lease term. The unamortized portions as of December 31, 2009 and 2008 were $5,555,000 and $3,603,000, respectively. Total rental expense for 2009, 2008, and 2007 was $15,146,000, $15,303,000 and
60
Table of Contents
KNOLL, INC.
NOTES TO THE CONSOLIDATED FINANCIAL STATEMENTS (Continued)
DECEMBER 31, 2009
14. LEASES (Continued)
$13,953,000, respectively. Future minimum rental payments required under those operating leases that have a remaining non-cancelable lease term in excess of one year are as follows (in thousands):
| | | | |
2010 | | $ | 13,166 | |
2011 | | | 11,155 | |
2012 | | | 8,789 | |
2013 | | | 7,011 | |
2014 | | | 5,990 | |
Subsequent years | | | 25,381 | |
| | | | |
Total minimum rental payments | | $ | 71,492 | |
| | | | |
15. PENSION AND OTHER POSTRETIREMENT BENEFITS
The Company has two domestic defined benefit pension plans and two plans providing for other postretirement benefits, including medical and life insurance coverage. One of the pension plans and one of the other postretirement benefits plans cover eligible U.S. nonunion employees while the other pension plan and other postretirement benefits plan cover eligible U.S. union employees. According to applicable accounting guidance, the Company uses a December 31 measurement date for both of their plans.
The year-end status of these plans was as follows (in thousands):
| | | | | | | | | | | | | |
| | Pension Benefits | | Other Benefits | |
|---|
| | 2009 | | 2008 | | 2009 | | 2008 | |
|---|
Change in projected benefit obligation: | | | | | | | | | | | | | |
Projected benefit obligation at January 1 | | $ | 151,144 | | $ | 130,561 | | $ | 25,275 | | $ | 23,615 | |
Service cost | | | 10,053 | | | 12,041 | | | 429 | | | 512 | |
Interest cost | | | 9,981 | | | 10,536 | | | 1,477 | | | 1,835 | |
Participant contributions | | | 170 | | | 359 | | | — | | | — | |
Actuarial loss (gain) | | | 10,759 | | | 231 | | | (162 | ) | | 719 | |
Benefits paid | | | (2,451 | ) | | (2,584 | ) | | (954 | ) | | (1,406 | ) |
Liability (gain) due to Curtailment | | | (799 | ) | | — | | | (978 | ) | | — | |
| | | | | | | | | | |
Projected benefit obligation at December 31 | | $ | 178,857 | | $ | 151,144 | | $ | 25,087 | | $ | 25,275 | |
| | | | | | | | | | |
Accumulated benefit obligation, December 31 | | $ | 161,940 | | $ | 134,457 | | $ | — | | $ | — | |
Change in plan assets: | | | | | | | | | | | | | |
Fair value of plan assets at January 1 | | $ | 95,601 | | $ | 111,421 | | $ | — | | $ | — | |
Actual return on plan assets | | | 21,641 | | | (26,291 | ) | | — | | | — | |
Employer contributions | | | 13,371 | | | 12,696 | | | 954 | | | 1,406 | |
Participant contributions | | | 170 | | | 359 | | | — | | | — | |
Benefits paid | | | (2,451 | ) | | (2,584 | ) | | (954 | ) | | (1,406 | ) |
| | | | | | | | | | |
Fair value of plan assets at December 31 | | $ | 128,332 | | $ | 95,601 | | $ | — | | $ | — | |
| | | | | | | | | | |
Funded status | | $ | (50,525 | ) | $ | (55,543 | ) | $ | (25,087 | ) | $ | (25,275 | ) |
| | | | | | | | | | |
61
Table of Contents
KNOLL, INC.
NOTES TO THE CONSOLIDATED FINANCIAL STATEMENTS (Continued)
DECEMBER 31, 2009
15. PENSION AND OTHER POSTRETIREMENT BENEFITS (Continued)
The following table presents Knoll Inc's pension plan investments measured at fair value.
| | | | | | | | | | | | | | |
| | Level 1 | | Level 2 | | Level 3 | | Total | |
|---|
Equity Securities | | | | | | | | | | | | | |
| | U.S. equity securities | | $ | 65,886 | | $ | — | | $ | — | | $ | 65,886 | |
| | Non-U.S. equity securities | | | 12,862 | | | — | | | — | | | 12,862 | |
Debt Securities | | | | | | | | | | | | | |
| | Fixed income funds and cash investment funds | | | 49,584 | | | — | | | — | | | 49,584 | |
| | | | | | | | | | |
Total | | $ | 128,332 | | $ | — | | $ | — | | $ | 128,332 | |
See Note 21 of the consolidated financial statements for the description of the levels of the fair value hierarchy.
| | | | | | | | | | | | | |
| | Pension Benefits | | Other Benefits | |
|---|
| | 2009 | | 2008 | | 2009 | | 2008 | |
|---|
Amounts recognized in the consolidated balance sheet consist of: | | | | | | | | | | | | | |
Current liabilities | | $ | (10,000 | ) | $ | (9,870 | ) | $ | (1,652 | ) | $ | (2,164 | ) |
Noncurrent liabilities | | | (40,525 | ) | | (45,673 | ) | | (23,435 | ) | | (23,111 | ) |
| | | | | | | | | | |
Net amount recognized | | $ | (50,525 | ) | $ | (55,543 | ) | $ | (25,087 | ) | $ | (25,275 | ) |
| | | | | | | | | | |
| | | | | | | | | | | | | |
| | Pension Benefits | | Other Benefits | |
|---|
| | 2009 | | 2008 | | 2009 | | 2008 | |
|---|
Amounts recognized in accumulated other comprehensive income: | | | | | | | | | | | | | |
before taxes: | | | | | | | | | | | | | |
Net actuarial loss | | $ | 40,684 | | $ | 42,071 | | $ | 7,463 | | $ | 9,000 | |
Prior service cost (benefit) | | | 201 | | | 303 | | | (8,013 | ) | | (10,252 | ) |
| | | | | | | | | | |
Net amount recognized | | $ | 40,885 | | $ | 42,374 | | $ | (550 | ) | $ | (1,252 | ) |
| | | | | | | | | | |
Effective January 1, 2007, the Company amended its post retirement Health Care Plan to share costs equally for retirees with 90 points (age plus years of service). Retirees with less than 90 points will pay the full cost of insurance.
The estimated net actuarial loss, and prior service cost, for the defined benefit pension plans included in accumulated other comprehensive income and expected to be recognized in net periodic pension cost during the fiscal year ended December 31, 2010 is $1,058,000 and $61,000 respectively.
62
Table of Contents
KNOLL, INC.
NOTES TO THE CONSOLIDATED FINANCIAL STATEMENTS (Continued)
DECEMBER 31, 2009
15. PENSION AND OTHER POSTRETIREMENT BENEFITS (Continued)
The following table sets forth the components of the net periodic benefit cost for the Company's pension and other postretirement benefits plans (in thousands):
| | | | | | | | | | | | | | | | | | | |
| | Pension Benefits | | Other Benefits | |
|---|
| | 2009 | | 2008 | | 2007 | | 2009 | | 2008 | | 2007 | |
|---|
Service cost | | $ | 10,053 | | $ | 9,633 | | $ | 10,179 | | $ | 429 | | $ | 410 | | $ | 646 | |
Interest cost | | | 9,981 | | | 8,429 | | | 7,262 | | | 1,477 | | | 1,468 | | | 1,667 | |
Expected return on plan assets | | | (10,644 | ) | | (8,835 | ) | | (7,103 | ) | | — | | | — | | | — | |
Amortization of prior service cost | | | 74 | | | 77 | | | 77 | | | (1,295 | ) | | (1,343 | ) | | (1,343 | ) |
Recognized actuarial loss | | | 351 | | | 12 | | | 694 | | | 542 | | | 681 | | | 1,054 | |
Curtailment Expense | | | 27 | | | — | | | — | | | (1,090 | ) | | — | | | — | |
| | | | | | | | | | | | | | |
Net periodic benefit cost | | $ | 9,842 | | $ | 9,316 | | $ | 11,109 | | $ | 63 | | $ | 1,216 | | $ | 2,024 | |
| | | | | | | | | | | | | | |
Weighted-average assumptions used to determine net periodic benefit cost for the years ended December 31, 2009 and 2008 were as follows:
| | | | | | | | | | | | | |
| | Pension
Benefits | | Other
Benefits | |
|---|
| | 2009 | | 2008 | | 2009 | | 2008 | |
|---|
Discount rate | | | 6.10 | % | | 6.50 | % | | 6.10 | % | | 6.50 | % |
Expected return on plan assets | | | 8.15 | | | 8.25 | | | N/A | | | N/A | |
Rate of compensation increase | | | 4.00 | | | 4.00 | | | 4.00 | | | 4.00 | |
The expected long-term rate of return on assets is based on management's expectations of long-term average rates of return to be earned on the investment portfolio. In establishing this assumption, management considers historical and expected returns for the asset classes in which the plan assets are invested.
For purposes of measuring the benefit obligation as of and for the year ended December 31, 2009, associated with the Company's other postretirement benefit plans, an 8.00% annual rate of increase in the per capital cost of covered health care benefits was assumed for 2010. The rate was then assumed to decrease to an ultimate rate of 5% for 2016 and thereafter. For purposes of measuring the net periodic benefit cost as of and for the year ended December 31, 2009 associated with the Company's other postretirement benefits plans, a 7.25% annual rate of increase in the per capita cost of covered health care benefits was assumed for 2009. Increasing the assumed health care cost trend rate by 1.0% would increase the benefit obligation as of December 31, 2009 by $647,000 and increase the aggregate of the service and interest cost components of net periodic benefit cost for 2009 by $297,000. Decreasing the assumed health care cost trend rate by 1.0% would decrease the benefit obligation as of December 31, 2009 by $676,000 and decrease the aggregate of the service and interest cost components of net periodic benefit cost for 2009 by $239,000.
63
Table of Contents
KNOLL, INC.
NOTES TO THE CONSOLIDATED FINANCIAL STATEMENTS (Continued)
DECEMBER 31, 2009
15. PENSION AND OTHER POSTRETIREMENT BENEFITS (Continued)
The Company's pension plans' weighted-average asset allocations as of December 31, 2009 and 2008, by asset category were as follows:
| | | | | | | |
| | Plan Assets
at December 31 | |
|---|
Asset Category | | 2009 | | 2008 | |
|---|
Temporary Investment Funds | | | 5 | % | | 4 | % |
Equity Investment Funds | | | 61 | | | 50 | |
Fixed Income Funds | | | 34 | | | 46 | |
| | | | | | |
Total | | | 100 | % | | 100 | % |
| | | | | | |
The Company's pension plans' investment policy includes an asset mix based on the Company's risk posture. The investment policy states a target allocation of 60% equity funds and 40% fixed income funds. Inclusion of the fixed income funds is to provide growth through income and these funds should primarily invest in fixed income instruments of the U.S. Treasury and government agencies and investment-grade corporate bonds. The equity fund investments can consist of a broadly diversified domestic equity fund, an actively managed domestic equity fund and an actively managed international equity fund. The purpose of these funds is to provide the opportunity for capital appreciation, income, and the ability to diversify investments outside the U.S. equity market. Mutual funds are used as the plans' investment vehicle since they have clearly stated investment objectives and guidelines, offer a high degree of investment flexibility, offer competitive long-term results, and are cost effective for small asset balances.
The Company expects to contribute $10,000,000 to its pension plans and $1,652,000 to its other postretirement benefit plans in 2010. Estimated future benefit payments under our pension and other postretirement plans are as follows:
| | | | | | | |
| | Pension Benefits | | Other Benefits | |
|---|
| | (in thousands)
| |
|---|
2010 | | $ | 3,311 | | $ | 1,652 | |
2011 | | | 4,031 | | | 1,639 | |
2012 | | | 4,885 | | | 1,695 | |
2013 | | | 5,885 | | | 1,882 | |
2014 | | | 6,928 | | | 2,127 | |
2015 - 2019 | | | 55,873 | | | 11,114 | |
Employees of the Canadian, Belgium and United Kingdom operations participate in defined contribution pension plans sponsored by the Company. The Company's expense related to these plans for 2009, 2008, and 2007 was $1,041,000, $1,501,000, and $1,338,000 respectively.
64
Table of Contents
KNOLL, INC.
NOTES TO THE CONSOLIDATED FINANCIAL STATEMENTS (Continued)
DECEMBER 31, 2009
15. PENSION AND OTHER POSTRETIREMENT BENEFITS (Continued)
The Company also sponsors a 401(k) retirement savings plan for all U.S. employees. Under this plan, participants may defer a portion of their earnings up to the annual contribution limits established by the Internal Revenue Service. The Company matches 40.0% of participant contributions up to the first 6.0% of compensation for nonunion employees and matches 50.0% of participant contributions up to the first 6.0% of compensation for union employees. Effective January 1, 2010 the Company suspended the fixed matched contribution noted above for both union and nonunion employees. For participants who are nonunion employees, the plan provides for discretionary employer matching based on the Company's profits, as determined by our board of directors. The plan also provides that the Company may make discretionary contributions of common stock to participant accounts on behalf of all actively employed U.S. participants. Company contributions generally vest ratably over a five-year period. A Knoll common stock fund consisting of 1,000,000 shares of common stock into which participants may invest the compensation they elect to defer was established on December 14, 2004. Participant contributions into the Knoll common stock fund will be limited to no more than 10% of their total account balance in the plan. Participant contributions in the Knoll common stock fund may be transferred into other investment alternatives or distributed in the form of shares of Knoll common stock if so invested at the time of distribution.
The Company's total expense under the 401(k) plan was $3,257,000, $3,374,000, and $3,443,000 for 2009, 2008 and 2007, respectively.
16. STOCK PLANS
Stock Incentive Plans
As of December 31, 2009, the Company sponsored two stock incentive plans under which awards denominated or payable in shares or options to purchase shares of Knoll common stock may be granted to officers, certain other employees, directors and consultants of the Company. On February 28, 2007, one of the Company's two stock incentive plans expired reducing the number of shares available to grant under the plans by approximately 8,000. In May 2007, the Company approved the 2007 Stock Incentive Plan which authorized the issuance of 2,000,000 shares of common stock. As of December 31, 2009, 771,748 shares remained available for issuance under the plans. A Stock Option Committee currently consisting of the Compensation Committee of the Company's Board of Directors ("Stock Option Committee") has sole discretion concerning administration of the plans, including selection of individuals to receive awards, types of awards, the terms and conditions of the awards and the time at which awards will be granted. Options that are granted have a maximum contractual life of seven to ten years. Grants to employees generally become partially vested one year from the date of the award agreement. On such date for the majority of options granted, 30% of the shares covered by the options become available for exercise. An additional 20% vest and become available on the second and third anniversaries and an additional 30% on the fourth anniversary. For some of the options granted, 25% vest each year over a four year period. In addition, the options generally have accelerated vesting provisions upon a change of control of the Company. The Company is recognizing compensation expense using the graded vesting attribution method which treats each option grant as multiple grants each with its own requisite service period.
In 2004 and 2005 under the Amended and Restated 1999 Stock Incentive Plan, the Company granted performance-based restricted stock awards to certain key employees aggregating 1,650,000
65
Table of Contents
KNOLL, INC.
NOTES TO THE CONSOLIDATED FINANCIAL STATEMENTS (Continued)
DECEMBER 31, 2009
16. STOCK PLANS (Continued)
shares of common stock. These awards provide for the delivery of shares of common stock to award recipients upon the satisfaction of certain vesting requirements. The restricted stock awards will vest as to one-sixth of the shares underlying each award to the extent that the average Knoll operating profit for any two-year period is equal to $100.0 million. An additional one-sixth will vest based on additional increments to operating profit of $15.0 million over such a period, with full vesting upon the achievement of $175.0 million in average operating profit over such a period. In any event, the awards will fully vest on the sixth anniversary of the date of the grant and will be subject to pro rata vesting upon a change of control of the Company, if earlier, regardless of whether the operating profit targets are met. The Company determined the fair value of the shares on the date of grant and is recognizing compensation expense ratably over the vesting period.
In 2007, under the 2007 Stock Incentive Plan and the Amended and Restated 1999 Stock Incentive Plan, the Company granted restricted stock awards to certain key employees aggregating 514,654 shares of common stock. These awards provide for the delivery of shares of common stock to award recipients upon the satisfaction of certain vesting requirements. 360,000 of these shares will vest as to one-fifth of the shares underlying each award to the extent that Knoll operating profit for a calendar year is equal to $141.0 million. An additional one-fifth will vest based on additional increments to operating profit of $15.0 million with full vesting upon the achievement of $201.0 million in operating profit. In any event, the awards will fully vest on the fifth anniversary of the date of the grant and will be subject to pro rata vesting upon a change of control of the Company, if earlier, regardless of whether the operating profit targets are met. 154,654 of these shares granted in 2007 vest one-third over three years, without regard to operating profit targets. The Company determined the fair value of the shares on the date of grant and is recognizing compensation expense ratably over the vesting period.
In 2008, under the 2007 Stock Incentive Plan and the Amended and Restated 1999 Stock Incentive Plan, the Company granted restricted stock awards to certain key employees aggregating 992,117 shares of common stock. These awards provide for the delivery of shares of common stock to award recipients upon the satisfaction of certain vesting requirements. 66,000 of these shares will vest as to one-fifth of the restricted shares underlying each award to the extent that Knoll operating profit for the period is equal to $156.0 million. An additional one-fifth will vest based on additional increments to operating profit of $15.0 million with full vesting upon the achievement of $216.0 million in operating profit. In any event, the awards will fully vest on the fifth anniversary of the date of the grant and will be subject to pro rata vesting upon a change of control of the Company, if earlier, regardless of whether the operating profit targets are met. 900,000 of these shares will vest as to one-fifth of the shares underlying each award on each grant date anniversary, without regard to operating profit targets. 26,117 of these shares granted in 2008 vest one-third over each of the next three years, without regard to operating profit targets. The Company determined the fair value of the shares on the date of grant and is recognizing compensation expense ratably over the vesting period.
In 2009, under the 2007 Stock Incentive Plan, the Company granted restricted stock awards to the Company's Board of Directors aggregating 40,818 shares of common stock. These shares vest one-third over each of the next three years, without regard to operating profit targets. The Company determined the fair value of the shares on the date of grant and is recognizing compensation expense ratably over the vesting period.
66
Table of Contents
KNOLL, INC.
NOTES TO THE CONSOLIDATED FINANCIAL STATEMENTS (Continued)
DECEMBER 31, 2009
16. STOCK PLANS (Continued)
The following table summarizes the Company's restricted stock activity during the year:
| | | | | | | |
| | 2009 | |
|---|
| | Number of
Restricted
Shares Granted | | Weighted
Average
Fair Value | |
|---|
Outstanding at the beginning of the year | | | 1,912,760 | | $ | 15.23 | |
Granted | | | 40,818 | | | 7.35 | |
Forfeited | | | (65,735 | ) | | 15.34 | |
Vested | | | (497,845 | ) | | 15.56 | |
| | | | | | | |
Outstanding at the end of the year | | | 1,389,998 | | | 14.87 | |
| | | | | | | |
The following table summarizes the Company's stock option activity during the year:
| | | | | | | | | | | | | |
| | Number of
Options | | Weighted
Average
Exercise
Price | | Weighted
Average
Remaining
Contractual
Term | | Aggregate
Intrinsic
Value | |
|---|
| |
| |
| |
| | (in thousands)
| |
|---|
Balance at December 31, 2008 | | | 2,758,979 | | $ | 15.20 | | | | | $ | — | |
Exercised | | | — | | | — | | | | | | — | |
Granted | | | 935,000 | | | 10.24 | | | | | | — | |
Expired | | | — | | | — | | | | | | — | |
Forfeited | | | (286,218 | ) | | 16.25 | | | | | | — | |
| | | | | | | | | | | | |
Balance at December 31, 2009 | | | 3,407,761 | | $ | 13.75 | | | 4.38 | | $ | — | |
| | | | | | | | | | |
Exercisable at end of year | | | 2,245,511 | | $ | 14.86 | | | 3.02 | | $ | — | |
| | | | | | | | | | |
The following table summarizes information regarding stock options outstanding and exercisable at December 31, 2009:
| | | | | | | | | | | | | | | | |
| | Options Outstanding | | Options Exercisable | |
|---|
Range of Exercise Prices | | Number
of Options | | Weighted
Average
Remaining
Contractual
Life | | Weighted
Average
Exercise
Price | | Number
of Options | | Weighted
Average
Exercise
Price | |
|---|
$10.24 - $15.00 | | | 2,281,179 | | | 4.74 years | | $ | 11.82 | | | 1,212,679 | | $ | 12.88 | |
$15.01 - $18.77 | | | 926,582 | | | 2.90 | | | 16.59 | | | 926,582 | | | 16.59 | |
$18.78 - $23.47 | | | 200,000 | | | 7.17 | | | 22.62 | | | 106,250 | | | 22.47 | |
| | | | | | | | | | | | | | | |
$10.24 - $23.47 | | | 3,407,761 | | | 4.38 | | $ | 13.75 | | | 2,245,511 | | $ | 14.86 | |
| | | | | | | | | | | | | | | |
The weighted-average grant-date fair value of options granted during the years 2009, 2008, and 2007 was $4.32, $3.74 and $7.70 respectively. There were no options exercised during 2009. During the years 2008 and 2007, the total intrinsic value of options exercised were $0.5 million, and $24.1 million,
67
Table of Contents
KNOLL, INC.
NOTES TO THE CONSOLIDATED FINANCIAL STATEMENTS (Continued)
DECEMBER 31, 2009
16. STOCK PLANS (Continued)
respectively. The total fair value of shares vested during the years 2009, 2008, and 2007 was $1.1 million, $0.9 million, and $1.3 million, respectively.
A summary of the status of the Company's non-vested options as of December 31, 2009, and changes during the year ended December 31, 2009, is presented below.
| | | | | | | |
| | Number of
Options | | Weighted
Average
Grant-Date
Fair Value | |
|---|
Nonvested at January 1, 2009 | | | 550,500 | | $ | 5.05 | |
Granted | | | 935,000 | | | 4.32 | |
Vested | | | (222,250 | ) | | 5.02 | |
Forfeited | | | (101,000 | ) | | 4.53 | |
| | | | | | | |
Nonvested at December 31, 2009 | | | 1,162,250 | | $ | 4.51 | |
| | | | | | | |
Compensation costs related to stock-based compensation for the years ended December 31, 2009, 2008, and 2007 totaled $8.2 million pre-tax ($5.0 million after-tax), or $0.11 per diluted share, $7.2 million pre-tax ($4.4 million after-tax), or $0.09 per diluted share, and $5.9 million pretax ($3.6 million after-tax), or $0.07 per diluted share, respectively, and are included in the consolidated statements of income under selling, general, and administrative expenses.
At December 31, 2009 and December 31, 2008, the total compensation cost related to nonvested awards not yet recognized equaled $19.8 million and $25.4 million, respectively, including $3.7 million and $1.1 million for stock options, respectively, and $16.1 million and $24.3 for restricted stock respectively. This cost is expected to be recognized over the remaining vesting periods, which will not exceed five years.
Other Stock-Based Compensation Plans
The Company maintains an Employee Stock Purchase Plan (ESPP) whereby employees of the Company may purchase shares of Knoll common stock at a discounted rate. The discount rate is 5% off the average of the high and low sale price per share on the last trading day of the purchase period. Employees may contribute 1-10% of their eligible gross pay up to a $25,000 annual stock value limit. In 2009, 2008, and 2007 employees purchased 6,716, 5,841, and 3,637 shares, respectively in accordance with the terms of the ESPP.
17. SEGMENT AND GEOGRAPHIC REGION INFORMATION
In accordance with the appropriate accounting guidance for disclosures about segments of an enterprise and related information, management evaluates the Company as one reporting segment in the office furniture industry. The Company is engaged worldwide in the design, manufacture and sale of office furniture products and accessories through its wholly owned subsidiaries. Throughout the world, the product offerings, the production processes, the methods of distribution, and the customers serviced are similar. The Company's product offerings consist primarily of office furniture systems,
68
Table of Contents
KNOLL, INC.
NOTES TO THE CONSOLIDATED FINANCIAL STATEMENTS (Continued)
DECEMBER 31, 2009
17. SEGMENT AND GEOGRAPHIC REGION INFORMATION (Continued)
seating, files and storage, and other specialty products. These product offerings are marketed, distributed, and managed primarily as a group of similar products on an overall portfolio basis.
The Company's net sales by product category were as follows:
| | | | | | | | | | |
| | Year Ended December 31, | |
|---|
| | 2009 | | 2008 | | 2007 | |
|---|
| | (in thousands)
| |
|---|
Office Systems | | $ | 377,601 | | $ | 543,853 | | $ | 561,956 | |
Specialty Products | | | 186,060 | | | 254,525 | | | 200,103 | |
Seating | | | 86,966 | | | 109,222 | | | 118,364 | |
Files and Storage | | | 62,153 | | | 86,138 | | | 81,022 | |
European Products | | | 60,345 | | | 110,576 | | | 89,677 | |
Other | | | 6,908 | | | 15,833 | | | 4,692 | |
| | | | | | | | |
| | $ | 780,033 | | $ | 1,120,147 | | $ | 1,055,814 | |
| | | | | | | | |
The Company markets its products in the United States and internationally, with its principal international markets being Canada and Europe. The table below contains information about the geographical areas in which the Company operates. Sales to clients are attributed to the geographic areas based on the origin of sale.
| | | | | | | | | | | | | |
| | United
States | | Canada | | Europe | | Consolidated | |
|---|
| | (in thousands)
| |
|---|
2009 | | | | | | | | | | | | | |
Sales to clients | | $ | 688,664 | | $ | 26,831 | | $ | 64,538 | | $ | 780,033 | |
Property, plant and equipment, net | | | 83,291 | | | 33,112 | | | 18,642 | | | 135,045 | |
2008 | | | | | | | | | | | | | |
Sales to clients | | $ | 964,875 | | $ | 40,229 | | $ | 115,043 | | $ | 1,120,147 | |
Property, plant and equipment, net | | | 85,680 | | | 31,225 | | | 15,263 | | | 132,168 | |
2007 | | | | | | | | | | | | | |
Sales to clients | | $ | 926,018 | | $ | 36,739 | | $ | 93,057 | | $ | 1,055,814 | |
Property, plant and equipment, net | | | 85,824 | | | 41,394 | | | 16,425 | | | 143,643 | |
A number of U.S. government agencies purchase the Company's products through multiple contracts with the General Services Administration ("GSA"). Sales under GSA contracts amounted to $125,000,000 in 2009, $98,492,000 in 2008, and $99,167,000 in 2007.
69
Table of Contents
KNOLL, INC.
NOTES TO THE CONSOLIDATED FINANCIAL STATEMENTS (Continued)
DECEMBER 31, 2009
18. OTHER (EXPENSE) INCOME
The components of other (expense) income are as follows:
| | | | | | | | | | |
| | December 31 | |
|---|
| | 2009 | | 2008 | | 2007 | |
|---|
| | (in thousands)
| |
|---|
Foreign exchange transaction (loss) gain | | $ | (6,598 | ) | $ | 2,944 | | $ | (4,203 | ) |
Unrealized loss on derivatives | | | — | | | — | | | (71 | ) |
Write-off of deferred financing fees | | | — | | | — | | | (1,195 | ) |
Other | | | 766 | | | 735 | | | 818 | |
| | | | | | | | |
Other (expense) income, net | | $ | (5,832 | ) | $ | 3,679 | | $ | (4,651 | ) |
| | | | | | | | |
19. RESTRUCTURING CHARGES
On April 3, 2008 the Company initiated a restructuring plan in order to reduce costs. Additional reductions were announced December 4, 2008, and February 3, 2009. The Company based its accounting and disclosures on the applicable accounting guidance. As a result, charges to operations were made in the periods in which restructuring plan liabilities were incurred. In connection with the above plans the Company incurred $12.0 million of restructuring charges during the twelve months ended December 31, 2009. These restructuring charges included $10.6 million of employee termination costs, $0.6 million of costs associated with exiting three leased showrooms, and $0.8 million of costs associated with the discontinuation of certain product lines. During the twelve months ended December 31, 2008 the Company incurred restructuring charges of $4.6 million. These restructuring charges included $3.3 million of employee termination costs and $1.3 million of costs associated with the discontinuation of certain product lines. A reserve was recorded on the balance sheet for employee termination costs and showroom lease payments that have not been paid as of December 31, 2009.
Below is the summary of the restructuring reserve balance as of December 31, 2009 and 2008:
| | | | | | | | |
Restructuring Reserve | | 2009 | | 2008 | |
|---|
Reserve balance as of January 1, | | $ | 1,445 | | $ | — | |
| | Additions | | | 11,186 | | | 3,284 | |
| | Payments | | | (10,857 | ) | | (1,630 | ) |
| | Adjustments | | | — | | | (209 | ) |
| | | | | | |
Ending Reserve balance as of December 31, | | $ | 1,774 | | $ | 1,445 | |
| | | | | | |
Cost associated with the discontinuation of certain product lines were recorded as a direct reduction of the asset which had no further net realizable value.
70
Table of Contents
KNOLL, INC.
NOTES TO THE CONSOLIDATED FINANCIAL STATEMENTS (Continued)
DECEMBER 31, 2009
20. FAIR VALUE OF FINANCIAL INSTRUMENTS
The following methods and assumptions are used to estimate the fair value of each class of financial instruments for which it is practicable to estimate:
Cash and Cash Equivalents
The fair value of the Company's cash and cash equivalents approximates the carrying value of the Company's cash and cash equivalents, due to the short maturity of the cash equivalents.
Debt
The fair value of the Company's $295.3 million revolving credit facility approximates its carrying value, as it is variable-rate debt. The fair value of the Company's other long-term obligations approximates its carrying value.
Interest Rate Swap Contracts
The fair value of the Company's interest rate swap contracts is measured as the present value of all expected future cash flows based on the LIBOR-based swap yield curve as of the date of the valuation.
The estimated fair values of the Company's financial instruments are as follows (in thousands):
| | | | | | | | | | | | | | | |
| | December 31, 2009 | | December 31, 2008 | |
|---|
| | Carrying
Amount | | Fair
Value | | Carrying
Amount | | Fair
Value | |
|---|
Financial Assets: | | | | | | | | | | | | | |
| | Cash and cash equivalents | | $ | 5,961 | | $ | 5,961 | | $ | 14,903 | | $ | 14,903 | |
Financial Liabilities: | | | | | | | | | | | | | |
| | Long-term debt | | | | | | | | | | | | | |
| | | Senior credit facility | | | 295,305 | | | 295,305 | | | 337,379 | | | 337,379 | |
| | | Interest swap contracts | | | 12,789 | | | 12,789 | | | 12,839 | | | 12,839 | |
21. FAIR VALUE MEASUREMENTS
On January 1, 2008, the Company adopted new accounting guidance, which among other things requires enhanced disclosures about assets and liabilities measured at fair value. The guidance establishes a hierarchy that prioritizes fair value measurements based on types of inputs used for the various valuation techniques (market approach, income approach, and cost approach). The levels of the hierarchy are described below:
- •
- Level 1: Observable inputs such as quoted prices in active markets for identical assets or liabilities
- •
- Level 2: Inputs other than quoted prices that are observable for the asset or liability, either directly or indirectly; these include quoted prices for similar assets or liabilities in active markets and quoted prices for identical or similar assets or liabilities in markets that are not active
- •
- Level 3: Unobservable inputs that reflect the reporting entity's own assumptions
71
Table of Contents
KNOLL, INC.
NOTES TO THE CONSOLIDATED FINANCIAL STATEMENTS (Continued)
DECEMBER 31, 2009
21. FAIR VALUE MEASUREMENTS (Continued)
The Company's assessment of the significance of a particular input to the fair value measurement requires judgment, and may affect the valuation of assets and liabilities and their placement within the fair value hierarchy. The following table sets forth the assets and liabilities measured at fair value on a recurring basis, by input level, in the consolidated balance sheet at December 31, 2009 and 2008 (in thousands):
| | | | | | | | | | | | | | |
| | Quoted Prices in
Active Markets for
Identical Assets or
Liabilities (Level 1) | | Significant Other
Observable Inputs
(Level 2) | | Significant
Unobservable Inputs
(Level 3) | | Total | |
|---|
Liabilities: | | | | | | | | | | | | | |
| | Interest rate swaps | | $ | — | | $ | 12,789 | | $ | — | | $ | 12,789 | |
| | | | | | | | | | |
Total | | $ | — | | $ | 12,789 | | $ | — | | $ | 12,789 | |
| | | | | | | | | | |
| | | | | | | | | | | | | | |
| | Quoted Prices in
Active Markets for
Identical Assets or
Liabilities (Level 1) | | Significant Other
Observable Inputs
(Level 2) | | Significant
Unobservable Inputs
(Level 3) | | Total | |
|---|
Liabilities: | | | | | | | | | | | | | |
| | Interest rate swaps | | $ | — | | $ | 12,839 | | $ | — | | $ | 12,839 | |
| | | | | | | | | | |
Total | | $ | — | | $ | 12,839 | | $ | — | | $ | 12,839 | |
The interest rate swaps referred to above in Note 11 are included in current and non-current liabilities within the consolidated balance sheet at December 31, 2009 and 2008.
22. QUARTERLY RESULTS (UNAUDITED)
The following tables contain selected unaudited Consolidated Statements of Operations data for each quarter for the years ended December 31, 2009 and 2008. The operating results for any quarter are not necessarily indicative of results for any future period.
| | | | | | | | | | | | | | | | |
| | First
Quarter | | Second
Quarter | | Third
Quarter | | Fourth
Quarter | | Fiscal
Year | |
|---|
| | (in thousands, except per share data)
| |
|---|
2009 | | | | | | | | | | | | | | | | |
Sales | | $ | 212,609 | | $ | 202,197 | | $ | 181,282 | | $ | 183,945 | | $ | 780,033 | |
Gross profit | | | 74,767 | | | 70,729 | | | 61,273 | | | 62,674 | | | 269,443 | |
Net income | | | 9,525 | | | 8,074 | | | 5,726 | | | 4,028 | | | 27,353 | |
Earnings per share—basic | | $ | .21 | | $ | .18 | | $ | .13 | | $ | .09 | | $ | .60 | |
Earnings per share—diluted | | $ | .21 | | $ | .18 | | $ | .13 | | $ | .09 | | $ | .60 | |
2008 | | | | | | | | | | | | | | | | |
Sales | | $ | 267,808 | | $ | 292,536 | | $ | 283,517 | | $ | 276,286 | | $ | 1,120,147 | |
Gross profit | | | 90,323 | | | 101,087 | | | 104,198 | | | 99,461 | | | 395,069 | |
Net income | | | 17,278 | | | 20,917 | | | 24,062 | | | 22,655 | | | 84,912 | |
Earnings per share—basic | | $ | .36 | | $ | .44 | | $ | .52 | | $ | .50 | | $ | 1.82 | |
Earnings per share—diluted | | $ | .36 | | $ | .44 | | $ | .52 | | $ | .50 | | $ | 1.82 | |
72
Table of Contents
KNOLL, INC.
NOTES TO THE CONSOLIDATED FINANCIAL STATEMENTS (Continued)
DECEMBER 31, 2009
23. SUBSEQUENT EVENT
The Company evaluated all subsequent events through the date that the consolidated financial statements were issued. No material subsequent events have occurred since December 31, 2009 that required recognition or disclosure in the consolidated financial statements.
73
Table of Contents
ITEM 9. CHANGES IN AND DISAGREEMENTS WITH ACCOUNTANTS ON ACCOUNTING AND FINANCIAL DISCLOSURES
None
ITEM 9A. CONTROLS AND PROCEDURES
Evaluation of disclosure controls and procedures. We, under the supervision and with the participation of our management, including our principal executive officer and principal financial officer, evaluated the effectiveness of the design and operation of our disclosure controls and procedures, as defined in Rule 13a-15(e) of the Securities Exchange Act of 1934 as of the end of the period covered by this report (December 31, 2009) ("Disclosure Controls"). Based upon the Disclosure Controls evaluation, our principal executive officer and principal financial officer have concluded that the Disclosure Controls are effective in reaching a reasonable level of assurance that (i) information required to be disclosed by us in the reports that we file or submit under the Securities Exchange Act of 1934 is recorded, processed, summarized and reported within the time periods specified in the Securities and Exchange Commission's rules and forms and (ii) information required to be disclosed by us in the reports that we file or submit under the Securities Exchange Act of 1934 is accumulated and communicated to our management, including our principal executive and principal financial officers, or persons performing similar functions, as appropriate to allow timely decisions regarding required disclosure.
INTERNAL CONTROL OVER FINANCIAL REPORTING
Management's annual report on internal control over financial reporting. Our management is responsible for establishing and maintaining adequate internal control over financial reporting as defined in Rule 13a-15(f) under the Securities Exchange Act of 1934, as amended, for the Company. Internal control over financial reporting is a process to provide reasonable assurance regarding the reliability of our financial reporting for external purposes in accordance with accounting principles generally accepted in the United States of America. Internal control over financial reporting includes without limitation, maintaining records that in reasonable detail accurately and fairly reflect our transactions, providing reasonable assurance that transactions are recorded as necessary for preparation of our financial statements, providing reasonable assurance that receipts and expenditures of company assets are made in accordance with management authorization, and providing reasonable assurance that unauthorized acquisition, use or disposition of company assets that could have a material effect on our financial statements would be prevented or detected on a timely basis. Because of its inherent limitations, internal control over financial reporting is not intended to provide absolute assurance that a misstatement of our financial statements would be prevented or detected.
Our management assessed the effectiveness of our internal control over financial reporting based on the framework in Internal Control—Integrated Framework issued by the Committee of Sponsoring Organizations of the Treadway Commission. Based on this assessment, management concluded that the Company's internal control over financial reporting was effective as of December 31, 2009. Our independent registered public accounting firm, Ernst & Young LLP, has audited the effectiveness of our internal control over financial reporting as of December 31, 2009; their report is included on page 75.
Changes in internal control over financial reporting. There has been no change in our internal control over financial reporting during the period covered by this report that has materially affected, or is reasonably likely to materially affect, our internal control over financial reporting.
74
Table of Contents
Report of Independent Registered Public Accounting Firm
The Board of Directors and Stockholders of Knoll, Inc.
We have audited Knoll Inc.'s internal control over financial reporting as of December 31, 2009, based on criteria established in Internal Control—Integrated Framework issued by the Committee of Sponsoring Organizations of the Treadway Commission (the COSO criteria). Knoll Inc.'s management is responsible for maintaining effective internal control over financial reporting, and for its assessment of the effectiveness of internal control over financial reporting included in the accompanyingManagement's Annual Report on Internal Control Over Financial Reporting. Our responsibility is to express an opinion on the company's internal control over financial reporting based on our audit.
We conducted our audit in accordance with the standards of the Public Company Accounting Oversight Board (United States). Those standards require that we plan and perform the audit to obtain reasonable assurance about whether effective internal control over financial reporting was maintained in all material respects. Our audit included obtaining an understanding of internal control over financial reporting, assessing the risk that a material weakness exists, testing and evaluating the design and operating effectiveness of internal control based on the assessed risk, and performing such other procedures as we considered necessary in the circumstances. We believe that our audit provides a reasonable basis for our opinion.
A company's internal control over financial reporting is a process designed to provide reasonable assurance regarding the reliability of financial reporting and the preparation of financial statements for external purposes in accordance with generally accepted accounting principles. A company's internal control over financial reporting includes those policies and procedures that (1) pertain to the maintenance of records that, in reasonable detail, accurately and fairly reflect the transactions and dispositions of the assets of the company; (2) provide reasonable assurance that transactions are recorded as necessary to permit preparation of financial statements in accordance with generally accepted accounting principles, and that receipts and expenditures of the company are being made only in accordance with authorizations of management and directors of the company; and (3) provide reasonable assurance regarding prevention or timely detection of unauthorized acquisition, use or disposition of the company's assets that could have a material effect on the financial statements.
Because of its inherent limitations, internal control over financial reporting may not prevent or detect misstatements. Also, projections of any evaluation of effectiveness to future periods are subject to the risk that controls may become inadequate because of changes in conditions, or that the degree of compliance with the policies or procedures may deteriorate.
In our opinion, Knoll, Inc. maintained, in all material respects, effective internal control over financial reporting as of December 31, 2009, based on the COSO criteria.
We also have audited, in accordance with the standards of the Public Company Accounting Oversight Board (United States), the consolidated balance sheets of Knoll, Inc. as of December 31, 2009 and 2008, and the related consolidated statements of operations, stockholders' equity, and cash flows for each of the three years in the period ended December 31, 2009 of Knoll, Inc. and our report dated March 1, 2010 expressed an unqualified opinion thereon.
| | |
| |
|
|---|
| /s/ Ernst and Young LLP | | |
Philadelphia, Pennsylvania
March 1, 2010 |
|
|
75
Table of Contents
ITEM 9B. OTHER INFORMATION
None.
PART III
ITEM 10. DIRECTORS, EXECUTIVE OFFICERS AND CORPORATE GOVERNANCE
The information required by Item 10 relating to directors, director nominees and executive officers of the registrant is incorporated by reference from the information under the captions "Board of Directors," "Election of Directors," "Executive Officers," "Board Meetings and Committees," "Code of Ethics," and "Section 16(a) Beneficial Ownership Reporting Compliance" contained in our Proxy Statement for our 2010 Annual Meeting of Stockholders (the "Proxy Statement").
The information relating to the identification of the audit committee, audit committee financial expert and director nomination procedures of the registrant is incorporated by reference from the information under the caption "Board Meetings and Committees" contained in our Proxy Statement.
Our Board of Directors has adopted a code of ethics for all employees. This code is made available free of charge on our website at www.knoll.com. For further information see subsection "Code of Ethics" in our Proxy Statement.
ITEM 11. EXECUTIVE COMPENSATION
The information required by Item 11 is hereby incorporated by reference from the information under the caption "Executive Compensation" contained in our Proxy Statement.
ITEM 12. SECURITY OWNERSHIP OF CERTAIN BENEFICIAL OWNERS AND MANAGEMENT AND RELATED STOCKHOLDER MATTERS
Securities Authorized for Issuance Under Equity Compensation Plans
| | | | | | | | | | |
| | Equity Compensation Plan Information
As of December 31, 2009 | |
|---|
Plan Category | | Number of Securities
to be Issued upon
Exercise of
Outstanding Options
(a) | | Weighted-Average
Exercise Price of
Outstanding Options
(b) | | Number of Shares Remaining for
Future Issuance Under Equity
Compensation Plans (Excluding
Securities Reflected in Column (a))
(c) | |
|---|
Equity compensation plans approved by security holders | | | 3,407,761 | | $ | 13.75 | | | 771,748 | |
Equity compensation plans not approved by security holders | | | — | | | — | | | — | |
| | | | | | | | | |
Total | | | 3,407,761 | | | | | | 771,748 | |
If there is an expiration, termination, or cancellation of any benefit granted under the plans without the issuance of shares, the shares subject to or reserved for that benefit may again be used for new stock options, rights, or awards of any type authorized under the plans.
All other information required by Item 12 is hereby incorporated by reference from the information under the caption "Security Ownership of Certain Beneficial Owners and Management" contained in our Proxy Statement.
76
Table of Contents
ITEM 13. CERTAIN RELATIONSHIPS AND RELATED TRANSACTIONS, AND DIRECTOR INDEPENDENCE
The information required by Item 13 is hereby incorporated by reference from the information under the captions "Transactions with Related Persons" and "Director Independence" contained in our Proxy Statement.
ITEM 14. PRINCIPAL ACCOUNTING FEES AND SERVICES
The information required by Item 14 is hereby incorporated by reference from the information under the caption "Independent Registered Public Accounting Firm" contained in our Proxy Statement.
PART IV
ITEM 15. EXHIBITS AND FINANCIAL STATEMENT SCHEDULES
- (a)
- Documents filed as part of this Form 10-K:
- (1)
- CONSOLIDATED FINANCIAL STATEMENTS (ITEM 8)
- •
- Consolidated Balance Sheets as of December 31, 2009 and 2008
- •
- Consolidated Statements of Operations for the Years Ended December 31, 2009, 2008, and 2007.
- •
- Consolidated Statements of Stockholders' Equity for the Years Ended December 31, 2009, 2008, and 2007.
- •
- Consolidated Statements of Cash Flows for the Years Ended December 31, 2009, 2008, and 2007.
- •
- Notes to the Consolidated Financial Statements.
- •
- Report of Independent Registered Public Accounting Firm on Consolidated Financial Statements and Schedule.
- (2)
- FINANCIAL STATEMENT SCHEDULES
- •
- Financial Statement Schedule II—Valuation and Qualifying Accounts is filed with this Form 10-K on page S-1 of this Form 10-K. All other schedules for which provision is made in the applicable regulation of the Commission are not required under the related instructions or are inapplicable and therefore have been omitted.
- (3)
- EXHIBITS
| | | |
Exhibit
Number | | Description |
|---|
| | 3.1 | (a) | Amended and Restated Certificate of Incorporation of Knoll, Inc. |
| | | | |
| | 3.2 | (r) | Amended and Restated By-Laws of Knoll, Inc. |
| | | | |
| | 4.1 | (a) | Form of Stock Certificate. |
| | | | |
| | 10.1 | (b) | Amended and Restated Credit Agreement, dated as of June 29, 2007, by and among Knoll, Inc., the domestic subsidiaries of Knoll, Inc., Bank of America, N.A., as Administrative Agent, Swing Line Lender, and L/C Issuer, Banc of America Securities LLC, as sole Lead Arranger and sole Book Manager, HSBC Bank USA, National Association, as Syndication Agent, Citizens Bank, as Documentation Agent, and the other lenders party thereto. |
| |
| | |
77
Table of Contents
| | | |
Exhibit
Number | | Description |
|---|
| | 10.2 | (g)* | Amended and Restated Employment Agreement, executed March 14, 2006, effective as of January 1, 2006, between Knoll, Inc. and Burton B. Staniar. |
| | | | |
| | 10.3 | (t) | Amendment to Amended and Restated Employment Agreement, dated as of May 4, 2009, between Knoll, Inc. and Burton B. Staniar. |
| | | | |
| | 10.4 | (d)* | Employment Agreement, dated as of March 23, 2001, between Knoll, Inc. and Andrew B. Cogan. |
| | | | |
| | 10.5 | (a)* | Amendment No. 1 to Employment Agreement, dated as of August 25, 2004, between Knoll, Inc. and Andrew B. Cogan. |
| | | | |
| | 10.6 | (g)* | Amendment No. 2 to Employment Agreement, dated as of March 14, 2006, between Knoll, Inc. and Andrew B. Cogan. |
| | | | |
| | 10.7 | (i) * | Amendment No. 3 to Employment Agreement, dated as of December 11, 2006, between Knoll, Inc. and Andrew B. Cogan. |
| | | | |
| | 10.8 | (l)* | Amendment No. 4 to Employment Agreement, dated as of December 10, 2007, between Knoll, Inc. and Andrew B. Cogan. |
| | | | |
| | 10.9 | (q)* | Employment Agreement, dated as of March 3, 2008, between Knoll, Inc. and Lynn M. Utter. |
| | | | |
| | 10.10 | * | Summary of Barry L. McCabe 2010 Compensation. |
| | | | |
| | 10.11 | (a)* | Offer Letter, dated July 30, 1999, from Knoll, Inc. to Arthur C. Graves. |
| | | | |
| | 10.12 | * | Summary of Arthur C. Graves 2010 Compensation. |
| | | | |
| | 10.13 | (c)* | Amended and Restated Knoll, Inc. 1996 Stock Incentive Plan. |
| | | | |
| | 10.14 | (c)* | Amended and Restated Knoll, Inc. 1997 Stock Incentive Plan. |
| | | | |
| | 10.15 | (a)* | Amended and Restated Knoll, Inc. 1999 Stock Incentive Plan. |
| | | | |
| | 10.16 | (m)* | Amended and Restated Knoll, Inc. 2007 Stock Incentive Plan. |
| | | | |
| | 10.17 | (n)* | Knoll, Inc. Non-Employee Director Compensation Plan. |
| | | | |
| | 10.18 | (e)* | Form of Non-Qualified Stock Option Agreement under the Amended and Restated Knoll, Inc. 1996 Stock Incentive Plan, entered into by Knoll, Inc. and certain executive officers. |
| | | | |
| | 10.19 | (e)* | Form of Non-Qualified Stock Option Agreement under the Amended and Restated Knoll, Inc. 1997 Stock Incentive Plan, entered into by Knoll, Inc. and certain executive officers. |
| | | | |
| | 10.20 | (c)* | Form of Non-Qualified Stock Option Agreement under the Amended and Restated Knoll, Inc. 1999 Stock Incentive Plan, entered into by Knoll, Inc. and certain executive officers. |
| | | | |
| | 10.21 | (p)* | Form of Non-Qualified Stock Option Agreement under the 2007 Stock Incentive Plan, entered into by Knoll, Inc. and certain executive officers. |
| | | | |
| | 10.22 | (a)* | Form of Restricted Share Agreement under the Amended and Restated Knoll, Inc. 1999 Stock Incentive Plan (time vesting with accelerated performance vesting). |
| | | | |
| | 10.23 | (g)* | Form of Amendment to Restricted Share Agreement under the Amended and Restated Knoll, Inc. 1999 Stock Incentive Plan (time vesting with accelerated performance vesting). |
78
Table of Contents
| | | |
Exhibit
Number | | Description |
|---|
| | 10.24 | (p)* | Form of Restricted Share Agreement under the 1999 Stock Incentive Plan (time vesting). |
| | | | |
| | 10.25 | (p)* | Form of Restricted Share Agreement under the 2007 Stock Incentive Plan (time vesting with accelerated performance vesting). |
| | | | |
| | 10.26 | (p)* | Form of Restricted Share Agreement under the 2007 Stock Incentive Plan (time vesting). |
| | | | |
| | 10.27 | (p)* | Form of Restricted Share Agreement under the Non-Employee Director Compensation Plan (time vesting). |
| | | | |
| | 10.28 | (o) | Asset Purchase Agreement, dated September 13, 2007, among El Leather Acquisition LLC, Teddy & Arthur Edelman, Limited, John Edelman, The Edelman Family Grantor Retained Annuity Trust and John McPhee. |
| | | | |
| | 10.29 | (k) | Agreement between Knoll, Inc. Grand Rapids and United Brotherhood of Carpenters and Joiners of America Carpenters Industrial Council Local 1615, dated August 27, 2006. |
| | | | |
| | 10.30 | (u) | Letter of Agreement, dated October 8, 2009, between Knoll, Inc. Grand Rapids and United Brotherhood of Carpenters and Joiners of America Carpenters Industrial Council Local 1615. |
| | | | |
| | 10.31 | (a)* | Form of Director and Officer Indemnification Agreement. |
| | | | |
| | 10.32 | (a)* | Offer Letter, dated October 6, 2004, from Knoll, Inc. to John F. Maypole. |
| | | | |
| | 10.33 | (a)* | Form of Knoll Employee Stock Purchase Plan. |
| | | | |
| | 10.34 | (f)* | Offer Letter, dated November 23, 2005, from Knoll, Inc. to Stephen F. Fisher. |
| | | | |
| | 10.35 | (g)* | Summary of Informal Healthcare Severance Policy. |
| | | | |
| | 10.36 | (h) | Stock Purchase Agreement, dated August 1, 2006, between Knoll, Inc. and Warburg Pincus Ventures, L.P. |
| | | | |
| | 10.37 | (j)* | Offer Letter, dated September 25, 2006, from Knoll, Inc. to Sarah E. Nash. |
| | | | |
| | 10.38 | (s)* | Andrew B. Cogan 2010 Incentive Compensation Letter, dated December 1, 2009. |
| | �� | | |
| | 10.39 | (s)* | Lynn M. Utter 2010 Incentive Compensation Letter, dated December 1, 2009. |
| | | | |
| | 10.40 | (s)* | Barry L. McCabe 2010 Incentive Compensation Letter, dated December 1, 2009. |
| | | | |
| | 10.41 | (s)* | Arthur C. Graves 2010 Incentive Compensation Letter, dated December 1, 2009. |
| | | | |
| | 21 | | Subsidiaries of Knoll, Inc. |
| | | | |
| | 23.1 | | Consent of Independent Registered Public Accounting Firm. |
| | | | |
| | 24.1 | | Power of Attorney [(included on signature page)]. |
| | | | |
| | 31.1 | | Certification for Chief Executive Officer pursuant to Rule 13a-14(a) of the Securities Exchange Act of 1934, as amended. |
| | | | |
| | 31.2 | | Certification for Chief Financial Officer pursuant to Rule 13a-14(a) of the Securities Exchange Act of 1934, as amended. |
| | | | |
| | 32.1 | | Certification for Chief Executive Officer pursuant to Rule 13a-14(b) of the Securities Exchange Act of 1934, as amended, and 18 U.S.C. Section 1350, as adopted pursuant to Section 906 of the Sarbanes-Oxley Act of 2002. |
| |
| | |
79
Table of Contents
| | | |
Exhibit
Number | | Description |
|---|
| | 32.2 | | Certification for Chief Financial Officer pursuant to Rule 13a-14(b) of the Securities Exchange Act of 1934, as amended, and 18 U.S.C. Section 1350, as adopted pursuant to Section 906 of the Sarbanes-Oxley Act of 2002. |
- (a)
- Incorporated by reference to Knoll, Inc.'s Registration Statement on Form S-1 (File No. 333-118901), which was declared effective by the Commission on December 13, 2004.
- (b)
- Incorporated by reference to Knoll, Inc.'s Current Report on Form 8-K, which was filed with the Commission on June 29, 2007.
- (c)
- Incorporated by reference to Knoll, Inc.'s Annual Report on Form 10-K for the year ended December 31, 1999.
- (d)
- Incorporated by reference to Knoll, Inc.'s Annual Report on Form 10-K for the year ended December 31, 2000.
- (e)
- See Exhibit 10.20. Exhibit is substantially identical to Exhibit 10.21.
- (f)
- Incorporated by reference to Knoll, Inc.'s Current Report on Form 8-K filed with the Commission on December 7, 2005.
- (g)
- Incorporated by reference to Knoll, Inc.'s Annual Report on Form 10-K for the year ended December 31, 2005.
- (h)
- Incorporated by reference to Knoll, Inc.'s Current Report on Form 8-K filed with the Commission on August 3, 2006.
- (i)
- Incorporated by reference to Knoll, Inc.'s Current Report on Form 8-K filed with the Commission on December 11, 2006.
- (j)
- Incorporated by reference to Knoll, Inc.'s Current Report on Form 8-K filed with the Commission on September 27, 2006.
- (k)
- Incorporated by reference to Knoll, Inc.'s Current Report on Form 8-K filed with the Commission on August 28, 2006.
- (l)
- Incorporated by reference to Knoll, Inc.'s Current Report on Form 8-K filed with the Commission on December 10, 2007.
- (m)
- Incorporated by reference to Knoll, Inc.'s Quarterly Report on Form 10-Q filed with the Commission on August 9, 2007.
- (n)
- Incorporated by reference to Knoll, Inc.'s Quarterly Report on Form 10-Q filed with the Commission on November 9, 2007.
- (o)
- Incorporated by reference to Knoll, Inc.'s Current Report on Form 8-K filed with the Commission on September 14, 2007.
- (p)
- Incorporated by reference to Knoll, Inc.'s Annual Report on Form 10-K for the year ended December 31, 2007.
- (q)
- Incorporated by reference to Knoll, Inc.'s Quarterly Report on Form 10-Q filed with the Commission on May 12, 2008.
- (r)
- Incorporated by reference to Knoll, Inc.'s Current Report on Form 8-K filed with the Commission on September 25, 2008.
80
Table of Contents
- (s)
- Incorporated by reference to Knoll, Inc.'s Current Report on Form 8-K filed with the Commission on December 7, 2009.
- (t)
- Incorporated by reference to Knoll, Inc.'s Quarterly Report on Form 10-Q filed with the Commission on May 11, 2009.
- (u)
- Incorporated by reference to Knoll, Inc.'s Quarterly Report on Form 10-Q filed with the Commission on November 9, 2009.
- *
- Management Contract or Compensatory Plan or Arrangement required to be identified by Item 15(a) (3) of Form 10-K.
81
Table of Contents
SIGNATURES
Pursuant to the requirements of Section 13 or 15(d) of the Securities Exchange Act of 1934, the Registrant has duly caused this report on Form 10-K to be signed on its behalf by the undersigned, thereunto duly authorized, on this 1st day of March 2010.
| | | | |
| |
| |
|
|---|
| | | KNOLL, INC. |
|
|
By: |
|
/s/ ANDREW B. COGAN
Andrew B. Cogan
Chief Executive Officer |
KNOW ALL PERSONS BY THESE PRESENTS, that each individual whose signature appears below constitutes and appoints Andrew B. Cogan and Barry L. McCabe, and each of them, his true and lawful attorneys-in-fact and agents with full power of substitution, for him and in his name, place and stead, in any and all capacities, to sign any and all amendments to this Form 10-K, and to file the same, with all exhibits thereto and all documents in connection therewith, with the Securities and Exchange Commission, granting unto said attorneys-in-fact and agents, and each of them, full power and authority to do and perform each and every act and thing requisite and necessary to be done in and about the premises, as fully to all intents and purposes as he might or could do in person, hereby ratifying and confirming all that said attorneys-in-fact and agents or any of them, or his or their substitute or substitutes, may lawfully do or cause to be done by virtue hereof.
Pursuant to the requirements of the Securities Exchange Act of 1934, this report on Form 10-K has been signed by the following persons on behalf of the Registrant and in the capacities and on the date indicated.
| | | | |
| |
| |
|
|---|
/s/ BURTON B. STANIAR
Burton B. Staniar | | Chairman of the Board | | March 1, 2010 |
/s/ ANDREW B. COGAN
Andrew B. Cogan |
|
Chief Executive Officer,
Knoll, Inc. and Director |
|
March 1, 2010 |
/s/ BARRY L. MCCABE
Barry L. McCabe |
|
Chief Financial Officer |
|
March 1, 2010 |
/s/ JEFFREY A. HARRIS
Jeffrey A. Harris |
|
Director |
|
March 1, 2010 |
/s/ SIDNEY LAPIDUS
Sidney Lapidus |
|
Director |
|
March 1, 2010 |
/s/ KATHLEEN G. BRADLEY
Kathleen G. Bradley |
|
Director |
|
March 1, 2010 |
/s/ JOHN F. MAYPOLE
John F. Maypole |
|
Director |
|
March 1, 2010 |
/s/ SARAH E. NASH
Sarah E. Nash |
|
Director |
|
March 1, 2010 |
/s/ STEPHEN F. FISHER
Stephen F. Fisher |
|
Director |
|
March 1, 2010 |
82
Table of Contents
SCHEDULE II
KNOLL, INC.
VALUATION AND QUALIFYING ACCOUNTS
(In Thousands)
| | | | | | | | | | | | | | | | | |
Description | | Balance at
Beginning
of Year | | Additions
Charged to
Expenses | | Charge-Offs | | Other(1) | | Balance at
End of Year | |
|---|
Allowance for doubtful accounts: | | | | | | | | | | | | | | | | |
| | Year ended December 31, 2007 | | | 3,337 | | | 1,560 | | | 710 | | | (2 | ) | | 4,185 | |
| | Year ended December 31, 2008 | | | 4,185 | | | 6,011 | | | 983 | | | 4 | | | 9,217 | |
| | Year ended December 31, 2009 | | | 9,217 | | | 1,737 | | | 5,849 | | | (11 | ) | | 5,094 | |
Allowance for other non-trade receivables: | | | | | | | | | | | | | | | | |
| | Year ended December 31, 2007 | | | 1,377 | | | — | | | 335 | | | — | | | 1,042 | |
| | Year ended December 31, 2008 | | | 1,042 | | | — | | | 425 | | | — | | | 617 | |
| | Year ended December 31, 2009 | | | 617 | | | — | | | 499 | | | — | | | 118 | |
Reserve for inventory valuation: | | | | | | | | | | | | | | | | |
| | Year ended December 31, 2007 | | | 6,462 | | | 2,638 | | | 2,250 | | | 59 | | | 6,909 | |
| | Year ended December 31, 2008 | | | 6,909 | | | 1,620 | | | 1,273 | | | (422 | ) | | 6,834 | |
| | Year ended December 31, 2009 | | | 6,834 | | | 3,030 | | | 1,981 | | | 554 | | | 8,437 | |
Valuation allowance for deferred income tax assets: | | | | | | | | | | | | | | | | |
| | Year ended December 31, 2007 | | | 17,879 | | | 1 | | | 2,533 | | | 1,700 | | | 17,047 | |
| | Year ended December 31, 2008 | | | 17,047 | | | (1,679 | ) | | 846 | | | (5,281 | ) | | 9,241 | |
| | Year ended December 31, 2009 | | | 9,241 | | | (467 | ) | | — | | | 116 | | | 8,890 | |
Reserve for warranty claims: | | | | | | | | | | | | | | | | |
| | Year ended December 31, 2007 | | | 7,436 | | | 11,637 | | | 9,135 | | | 140 | | | 10,078 | |
| | Year ended December 31, 2008 | | | 10,078 | | | 11,007 | | | 9,327 | | | (230 | ) | | 11,528 | |
| | Year ended December 31, 2009 | | | 11,528 | | | 5,295 | | | 7,260 | | | 210 | | | 9,773 | |
- (1)
- Primarily the impact of currency changes
S-1