 Barclays Industrial Select Conference Company Overview Lori Chaitman, Vice President, Investor Relations Ph: 201-703-4161 Email: lori.chaitman@sealedair.com Exhibit 99.1 |
2 Safe Harbor and Regulation G Statement This presentation contains “forward-looking statements” within the meaning of the safe harbor provisions of the Private Securities Litigation Reform Act of 1995 concerning our business, consolidated financial condition and results of operations. Forward-looking statements are subject to risks and uncertainties, many of which are outside our control, which could cause actual results to differ materially from these statements. Therefore, you should not rely on any of these forward-looking statements. Forward-looking statements can be identified by such words as “anticipates,” “believes,” “plan,” “assumes,” “could,” “estimates,” “expects,” “intends,” “may,” “plans to,” “will” and similar references to future periods. All statements other than statements of historical facts included in this presentation regarding our strategies, prospects, financial condition, operations, costs, plans and objectives are forward-looking statements. The following are important factors that we believe could cause actual results to differ materially from those in our forward-looking statements: the expected cash tax benefits associated with the Settlement agreement (as defined in our 2013 Annual Report on Form 10-K), global economic and political conditions, changes in our credit ratings, changes in raw material pricing and availability, changes in energy costs, competitive conditions, success of our restructuring activities, currency translation and devaluation effects, the success of our financial growth, profitability, cash generation and manufacturing strategies and our cost reduction and productivity efforts, the effects of animal and food-related health issues, pandemics, consumer preferences, environmental matters, regulatory actions and legal matters, and the other information referenced in the “Risk Factors” section appearing in our most recent Annual Report on Form 10-K, as filed with the Securities and Exchange Commission, and as revised and updated by our Quarterly Reports on Form 10-Q and Current Reports on Form 8-K. Any forward-looking statement made by us are based only on information currently available to us and speaks only as of the date on which it is made. We undertake no obligation to publicly update any forward-looking statement, whether written or oral, that may be made from time to time, whether as a result of new information, future developments or otherwise. Our management uses non-U.S. GAAP financial measures to evaluate the Company’s performance, which exclude items we consider unusual or special items. We believe the use of such financial measures and information may be useful to investors. We believe that the use of non-U.S. GAAP measures helps investors to gain a better understanding of core operating results and future prospects, consistent with how management measures and forecasts the Company's performance, especially when comparing such results to previous periods or forecasts. Please see Sealed Air’s February 10, 2015 earnings press release for important information about the use of non-U.S. GAAP financial measures relevant to this presentation, including applicable reconciliations to U.S. GAAP financial measures. Information reconciling forward-looking non-U.S. GAAP measures to U.S. GAAP measures is not available without unreasonable effort. Website Information We routinely post important information for investors on our website, www.sealedair.com, in the "Investor Relations" section. We use this website as a means of disclosing material, non-public information and for complying with our disclosure obligations under Regulation FD. Accordingly, investors should monitor the Investor Relations section of our website, in addition to following our press releases, SEC filings, public conference calls, presentations and webcasts. The information contained on, or that may be accessed through, our website is not incorporated by reference into, and is not a part of, this document. |
 VISION: To create a better way for life MISSION: We Re-imagine™ the industries we serve to create a world that feels, tastes and works better. 2014 FINANCIALS Total Sales $ 7.8B Adj. EBITDA $ 1.12B Adj. EBITDA Margin 14.4% Free Cash Flow $ 612M |
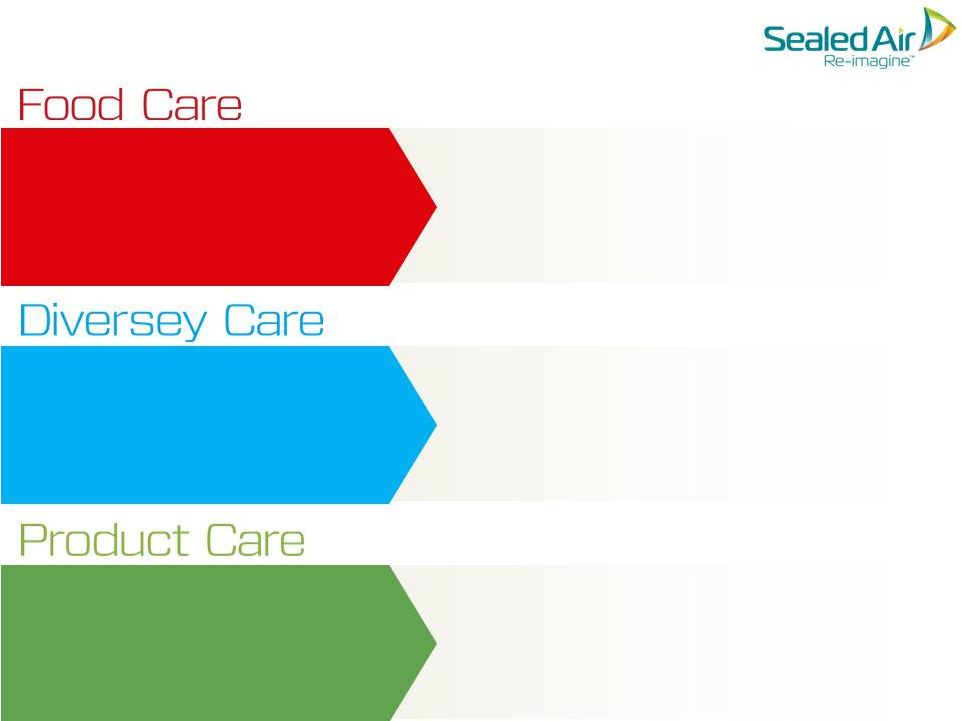 • Engineered & Packaging Solutions driving Damage Control and Cube Optimization • Packaging Design & Testing • Lean Six Sigma Expertise 2014 Sales: $1.7B 26% of 2014 Adj. EBITDA • Building & Kitchen Care Services • Infection Prevention • Fabric Care • Consulting Services & Consumer Brands 2014 Sales: $2.2B 22% of 2014 Adj. EBITDA • Packaging/Hygiene Solutions • Engineering Plant Designs • Full Range of Equipment/Systems • Manage Water, Energy 2014 Sales: $3.8B 60% of 2014 Adj. EBITDA How We Deliver Value 4 |
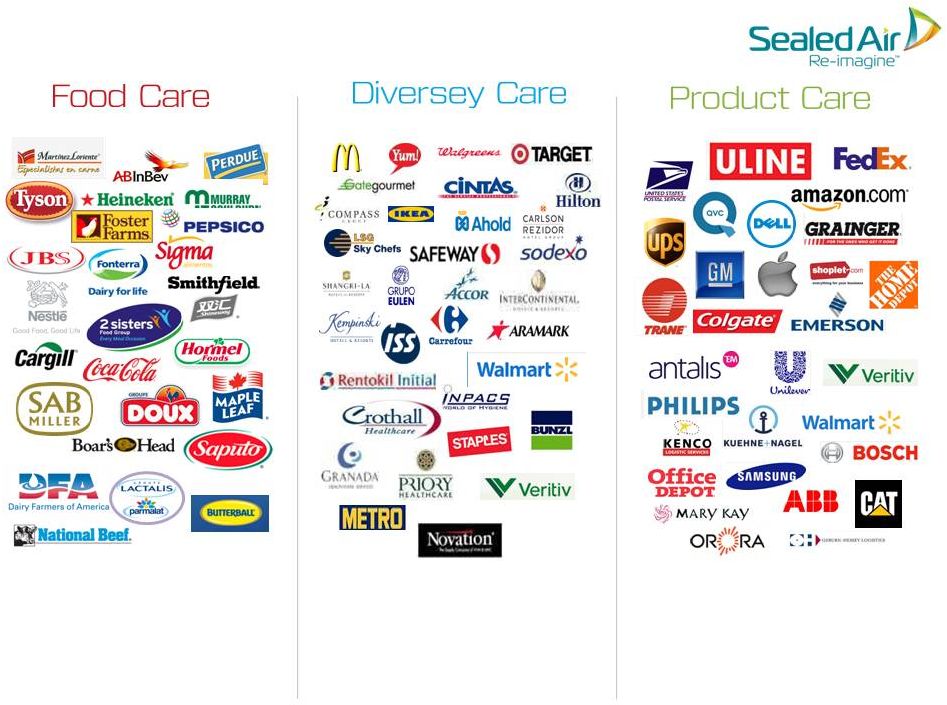 Who We Serve TOP 20 CUSTOMERS ACCOUNT FOR ~ 25% OF SALES 5 TOP 20 CUSTOMERS ACCOUNT FOR ~ 20% OF SALES DISTRIBUTION ACCOUNTS FOR ~ 35% OF SALES DISTRIBUTION ACCOUNTS FOR ~ 65% OF SALES |
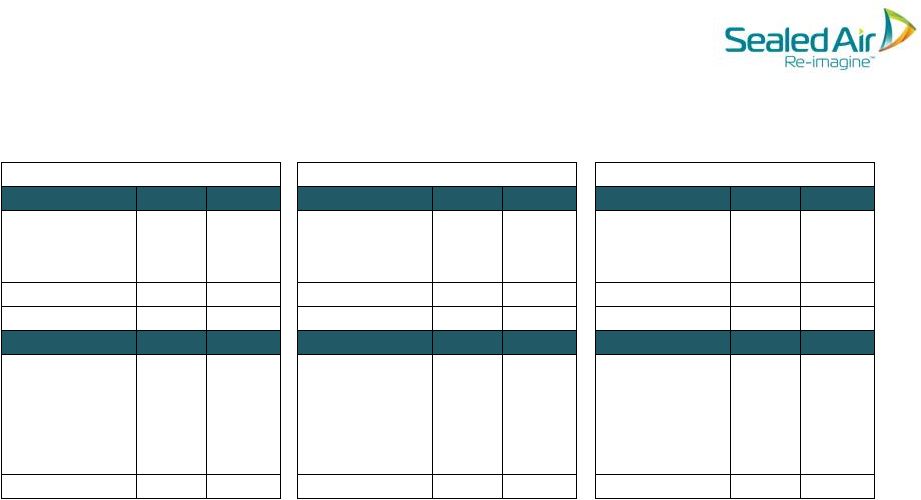
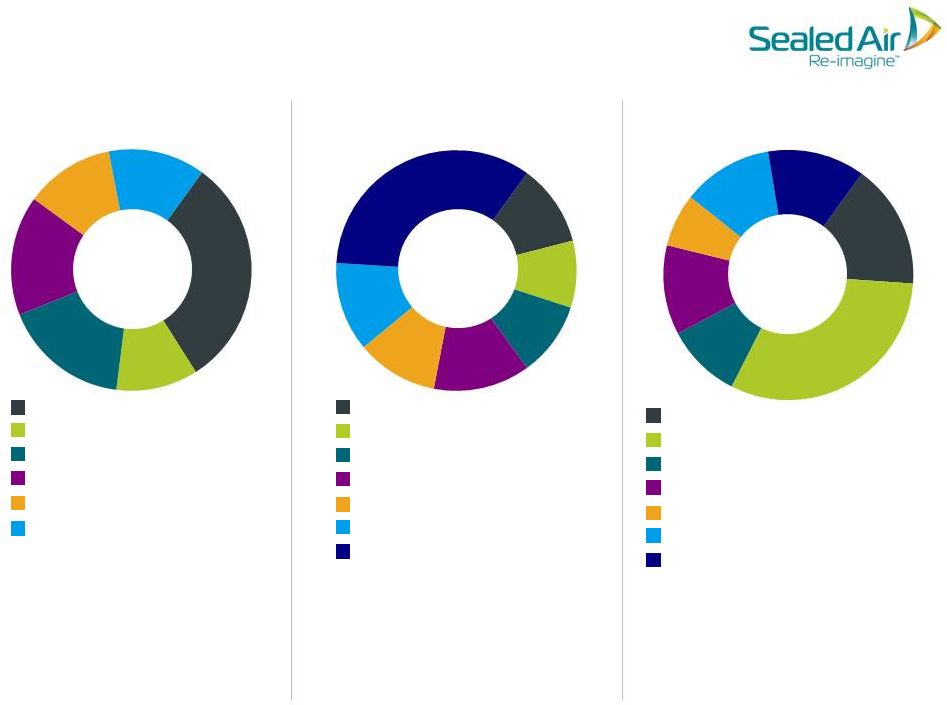 DIVERSEY CARE FOOD CARE 31% Fresh Red Meat Dairy Solids Other Food Smoked & Processed Poultry Beverages 11% 18% 15% 11% 13% 9% 12% 11% 11% 35% 12% Building Service Contractors Health Care Other Food Service Retail Hospitality Distribution 10% GLOBAL ADDRESSABLE MARKET: APPROX. $5B ESTIMATED GLOBAL MARKET SHARE: 32% GLOBAL ADDRESSABLE MARKET: APPROX. $29B ESTIMATED GLOBAL MARKET SHARE: 8% GLOBAL ADDRESSABLE MARKET: APPROX. $20B ESTIMATED GLOBAL MARKET SHARE: 19% Source: Sealed Air Estimates 2014 Net Sales by End Market 6 PRODUCT CARE 12% 10% 12% 7% 13% 16% 31% Consumer Applications General Manufacturing 3PL/Fulfillment E-Commerce Automotive Electronics General Protection |
 DIVERSEY CARE PRODUCT CARE FOOD CARE SEALED AIR 2014 Net Sales by Region 8% 7 * AMAT: Asia, Middle East, Africa & Turkey ** ANZ: Australia & New Zealand North America 11% 32% 10% 40% 7% 27% 14% 41% 10% 4% 24% 59% 8% 5% 19% 44% 9% 25% 3% Japan/ANZ** AMAT* Latin America Europe |
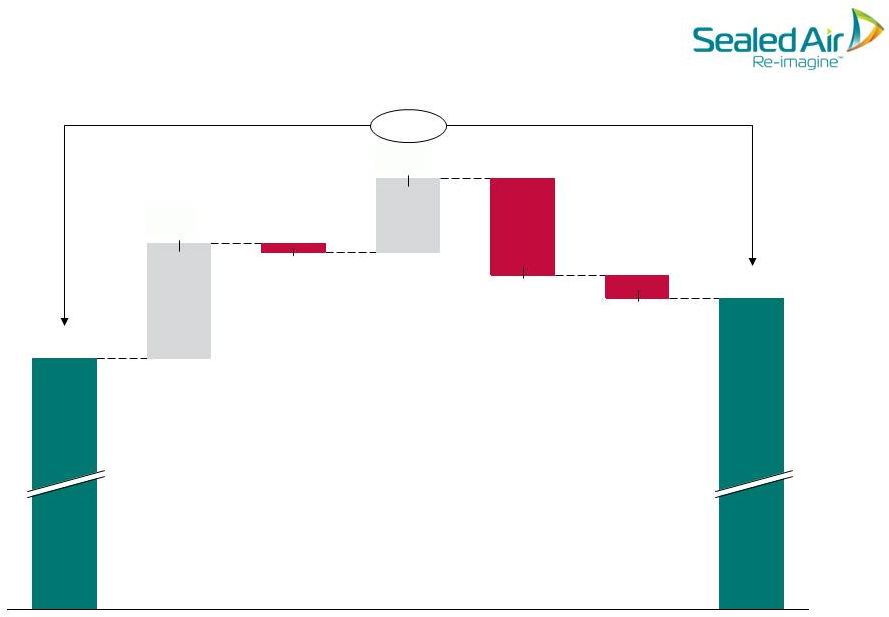
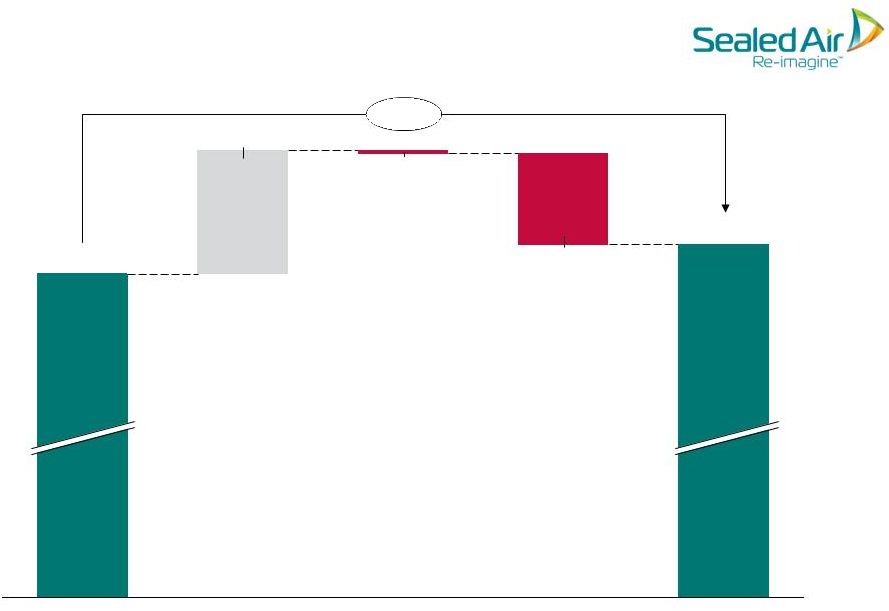 8 2014 Net Sales Bridge +0.8% 7,751 Foreign Exchange -183 Volume -6 Price/Mix +249 7,691 Constant Currency Sales Growth: 3.2% ($Millions) 2013 Net Sales 2014 Net Sales |
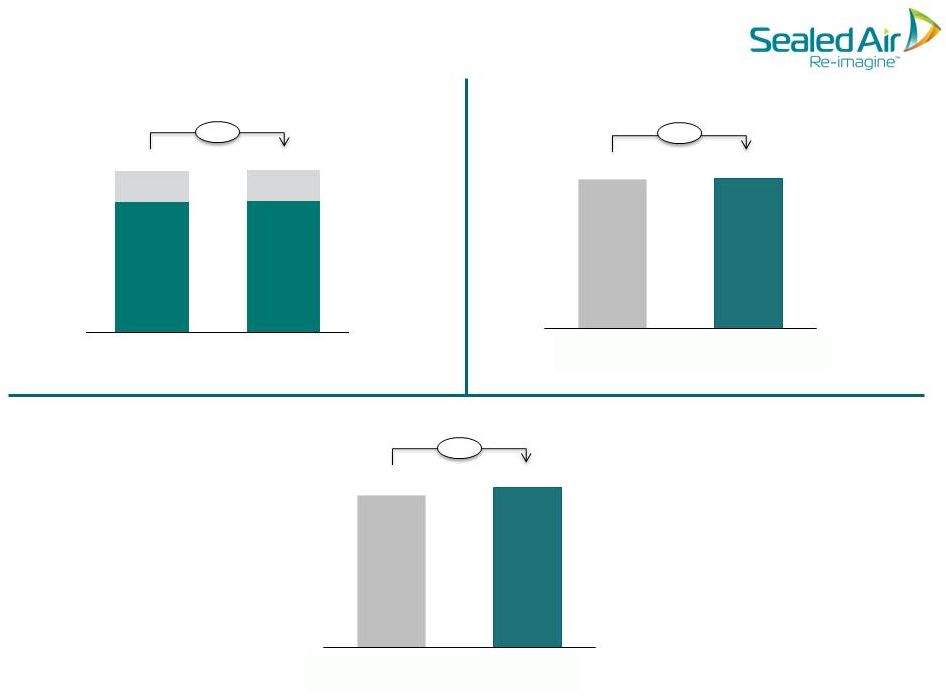 FOOD CARE 2014 Net Sales by Division 9 Packaging Hygiene 3,110 3,132 705 703 3,814 3,835 2013 2014 Constant Currency Net Sales Growth: 3.6% DIVERSEY CARE PRODUCT CARE ($Millions) Constant Currency Net Sales Growth: 3.7% Constant Currency Net Sales Growth: 3.0% 2,161 2,173 2013 2014 +0.6% +0.6% 1,610 1,655 2013 2014 +2.8% |
 10 YoY Price/Mix & Volume Trends 2014 delivered constant currency sales growth with favorable Price/Mix in every division and every region. YEAR-END 2014 RESULTS By Division 2013 2014 Food Care 1.6% 4.0% Diversey Care 1.5% 1.7% Product Care (0.2%) 3.5% Total Company 1.2% 3.2% By Region 2013 2014 North America 1.5% 3.3% Europe (0.2%) 0.8% Latin America 5.1% 11.5% AMAT 2.0% 2.6% JANZ (0.6%) 2.1% Total Company 1.2% 3.2% Product Price/Mix (% Change) By Division 2013 2014 Food Care 1.7% (0.4%) Diversey Care 0.5% 1.3% Product Care 2.6% 0.2% Total Company 1.5% 0.0% By Region 2013 2014 North America 0.6% (0.5%) Europe (0.1%) (0.1%) Latin America 4.6% (3.1%) AMAT 6.8% 4.3% JANZ 1.1% (0.2%) Total Company 1.5% 0.0% Volume (% Change) By Division 2013 2014 Food Care 3.3% 3.6% Diversey Care 2.0% 3.0% Product Care 2.4% 3.7% Total Company 2.7% 3.2% By Region 2013 2014 North America 2.1% 2.8% Europe (0.3%) 0.7% Latin America 9.7% 8.4% AMAT 8.8% 6.9% JANZ 0.5% 1.9% Total Company 2.7% 3.2% Constant Currency Sales (% Change) |
 11 2014 Adjusted EBITDA Bridge Volume +7.5% 2014 Foreign Exchange -30 -127 2013 -12 1,041 1,118 Cost Synergies Adjusted EBITDA Margin: 2014: 14.4% 2013: 13.5% ($Millions) Mix & Price/ Cost Spread SG&A/ Other 97 150 |
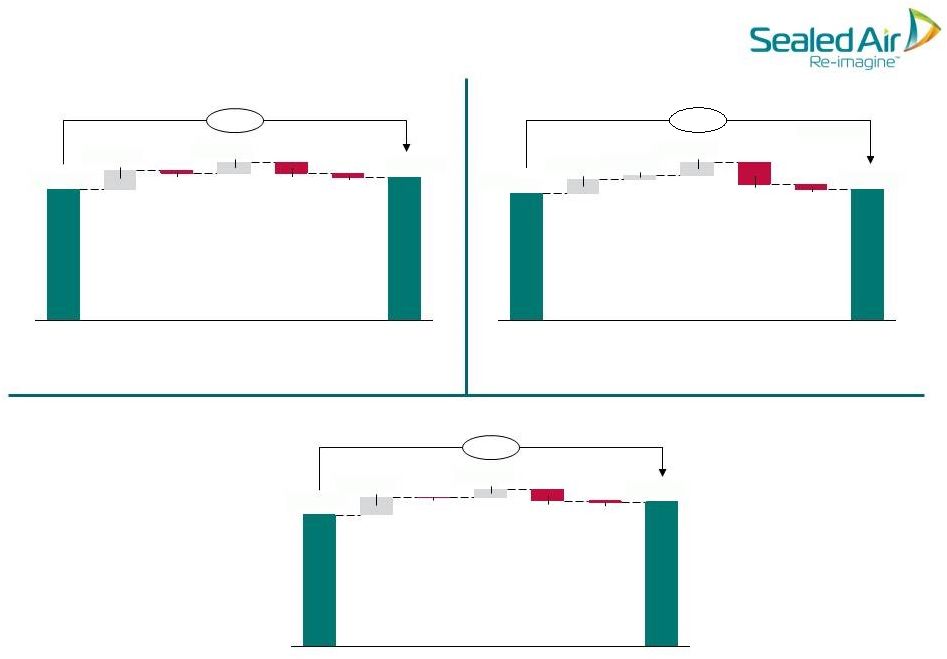 FOOD CARE 2014 Adjusted EBITDA by Division 12 DIVERSEY CARE PRODUCT CARE ($Millions) 2013 2014 +9.0% Foreign Exchange Volume -51 Mix & Price/Cost Spread Cost Synergies Adj. EBITDA Margin: 2014: 17.5% 2013: 16.1% -40 Cost Synergies Foreign Exchange 2014 Volume Mix & Price/Cost Spread 2013 Adj. EBITDA Margin: 2014: 11.3% 2013: 11.0% 2013 Mix & Price/Cost Spread +9.9% 2014 Foreign Exchange Cost Synergies Volume Adj. EBITDA Margin: 2014: 17.7% 2013: 16.5% 293 266 -2 -24 17 -2 37 245 26 237 23 9 -10 670 87 615 -12 -20 SG&A/ Other SG&A/ Other SG&A/ Other +3.2% 51 |
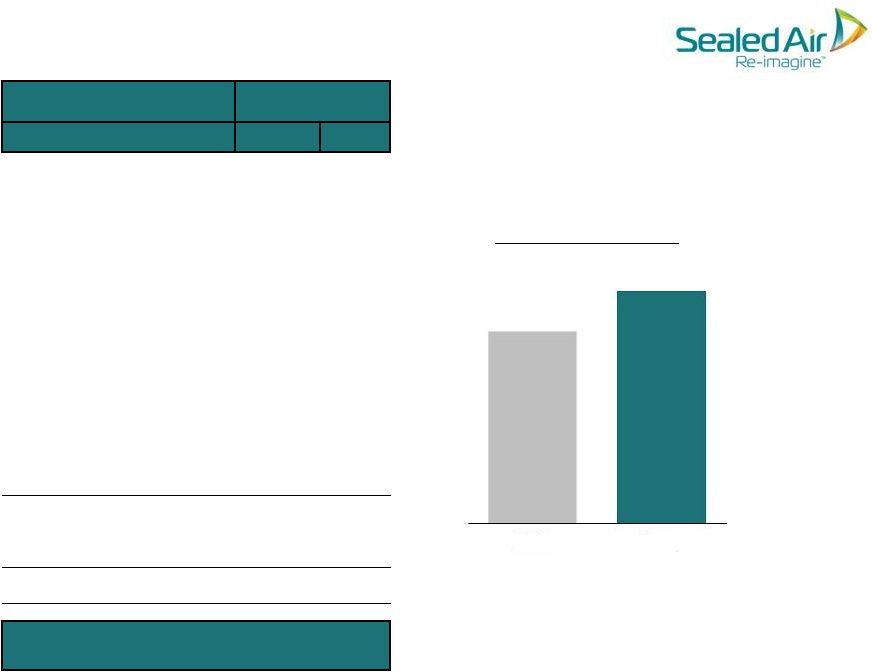 13 ($ in millions) Free Cash Flow Before Settlement Payment Year Ended December 31 Free Cash Flow * Includes changes in trade receivables, net, inventories and accounts payable. ($ in millions) Free Cash Flow 2013 2014 Adjusted Net Earnings 299 399 Depreciation and Amortization 308 321 Interest Payments, excluding Settlement Agreement interest (290) (293) Settlement Agreement, Related Interest (Payment) - (967) Restructuring Payments (107) (108) Tax Payments (115) (89) SARs Payments (46) (21) Net Change in Working Capital * 94 90 Other Assets/Liabilities and Other 482 467 Cash Flow Used in Operations 625 (202) Capital Expenditures (116) (154) Free Cash Flow 509 (356) Free Cash Flow Before Settlement Payment 509 612 Year Ended December 31 509 612 2013 2014 |
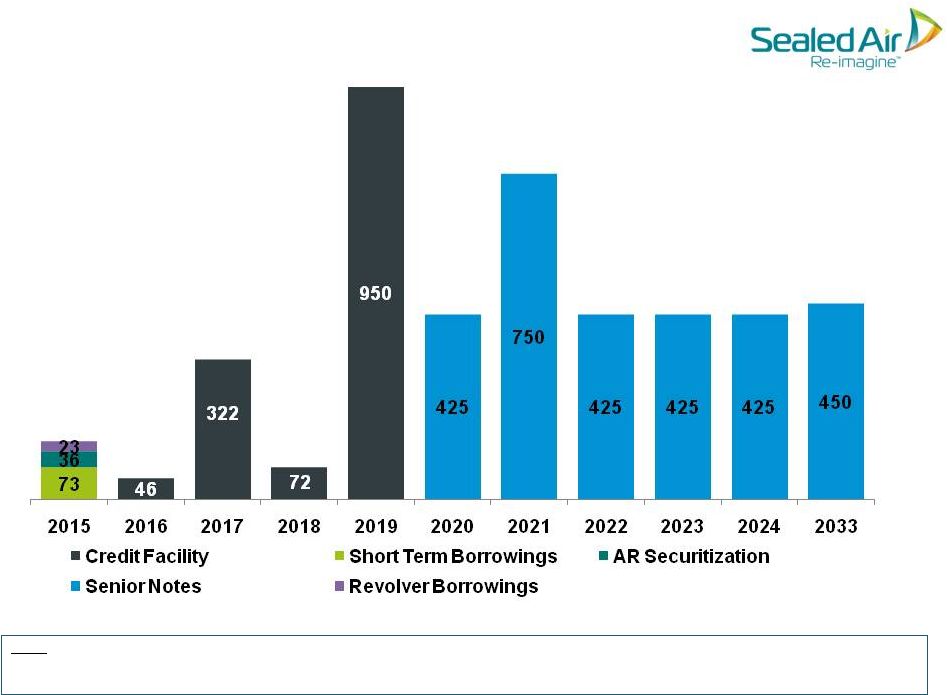 Debt Maturity Schedule 14 2014 • Refinanced credit facility on July 25, 2014. Please see Form 8-K filed on July 30, 2014 for more details. • Refinanced 8.125% Notes due 2019 with $425M of Notes due 2022 and $425M of Notes due 2024. 6.5% 5.25% 6.875% 4.875% 5.125% 8.375% |
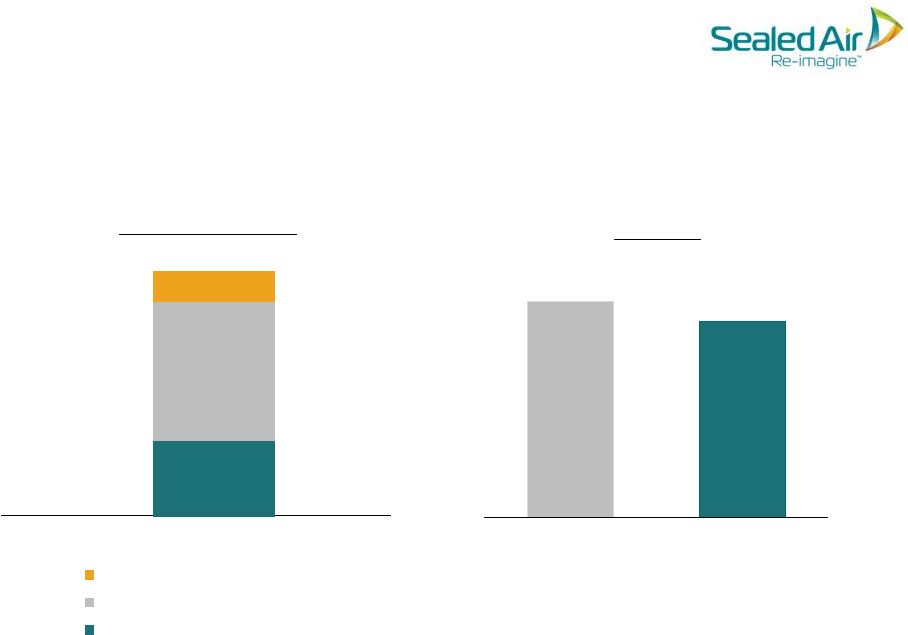 Liquidity & Net Debt 15 Liquidity Position December 31, 2014 A/R Securitization Net Debt 4,332 4,092 December 31, 2013 December 31, 2014 1,155 155 677 323 Revolving Credit Facility Cash & Cash Equivalents ($ in millions) |
  2015 Financial Outlook Note: Adjusted EBITDA, Adjusted EPS, Free Cash Flow, D&A and Tax Rate guidance excludes the impact of special items. 16 Outlook 2015 Net Sales Approx. $7.40B (Unfavorable) FX Impact Approx. (7%) Constant Currency Growth Approx. 2.5% Adjusted EBITDA $1.15 - $1.18B (Unfavorable) FX Impact Approx. ($80M) Interest Expense $255M D&A $310M Anticipated Tax Rate 25% Adjusted EPS $2.08 - $2.18 Free Cash Flow Approx. $600M Capex $180M Restructuring Costs $120M Interest Payments $255M 2015 Outlook PROVIDED ON FEB. 10, 2015 Q4 2014 EARNINGS CALL |