|
Exhibit 99.2 
|
Exhibit 99.2
Fourth Quarter & Year-End 2015
February 10, 2016
Earnings Conference Call Supplement (Unaudited Results)
Jerome A. Peribere – President & CEO Carol P. Lowe – Senior Vice President & CFO
Safe Harbor and Regulation G Statement
This presentation contains “forward-looking statements” within the meaning of the safe harbor provisions of the Private Securities Litigation Reform Act of 1995 concerning our business, consolidated financial condition and results of operations. Forward-looking statements are subject to risks and uncertainties, many of which are outside our control, which could cause actual results to differ materially from these statements. Therefore, you should not rely on any of these forward-looking statements. Forward-looking statements can be identified by such words as “anticipates,” “believes,” “plan,” “assumes,” “could,” “should,” “estimates,” “expects,” “intends,” “potential,” “seek,” “predict,” “may,” “will” and similar references to future periods. All statements other than statements of historical facts included in this press release regarding our strategies, prospects, financial condition, operations, costs, plans and objectives are forward-looking statements. Examples of forward-looking statements include, among others, statements we make regarding expected future operating results, expectations regarding the results of restructuring and other programs, anticipated levels of capital expenditures and expectations of the effect on our financial condition of claims, litigation, environmental costs, contingent liabilities and governmental and regulatory investigations and proceedings. The following are important factors that we believe could cause actual results to differ materially from those in our forward-looking statements: the tax benefits associated with the Settlement agreement (as defined in our 2015 Annual Report on Form 10-K), global economic and political conditions, changes in our credit ratings, changes in raw material pricing and availability, changes in energy costs, competitive conditions, success of our restructuring activities, currency translation and devaluation effects, the success of our financial growth, profitability, cash generation and manufacturing strategies and our cost reduction and productivity efforts, the effects of animal and food-related health issues, pandemics, consumer preferences, environmental matters, regulatory actions and legal matters, and the other information referenced in the “Risk Factors” section appearing in our most recent Annual Report on Form 10-K, as filed with the Securities and Exchange Commission, and as revised and updated by our Quarterly Reports on Form 10-Q and Current Reports on Form 8-K. Any forward-looking statement made by us is based only on information currently available to us and speaks only as of the date on which it is made. We undertake no obligation to publicly update any forward-looking statement, whether written or oral, that may be made from time to time, whether as a result of new information, future developments or otherwise.
Our management uses non-U.S. GAAP financial measures to evaluate the Company’s performance, which exclude items we consider unusual or special items. We believe the use of such financial measures and information may be useful to investors. We believe that the use of non-U.S. GAAP measures helps investors to gain a better understanding of core operating results and future prospects, consistent with how management measures and forecasts the Company’s performance, especially when comparing such results to previous periods or forecasts. Please see Sealed Air’s February 10, 2016 earnings press release for important information about the use of non-U.S. GAAP financial measures relevant to this presentation, including applicable reconciliations to U.S. GAAP financial measures. Information reconciling forward-looking non-U.S. GAAP measures to U.S. GAAP measures is not available without unreasonable effort.
Website Information
We routinely post important information for investors on our website, www.sealedair.com, in the “Investor Relations” section. We use this website as a means of disclosing material, non-public information and for complying with our disclosure obligations under Regulation FD. Accordingly, investors should monitor the Investor Relations section of our website, in addition to following our press releases, SEC filings, public conference calls, presentations and webcasts. The information contained on, or that may be accessed through, our website is not incorporated by reference into, and is not a part of, this document.
2
FOURTH QUARTER & YEAR-END 2015
Key Takeaways
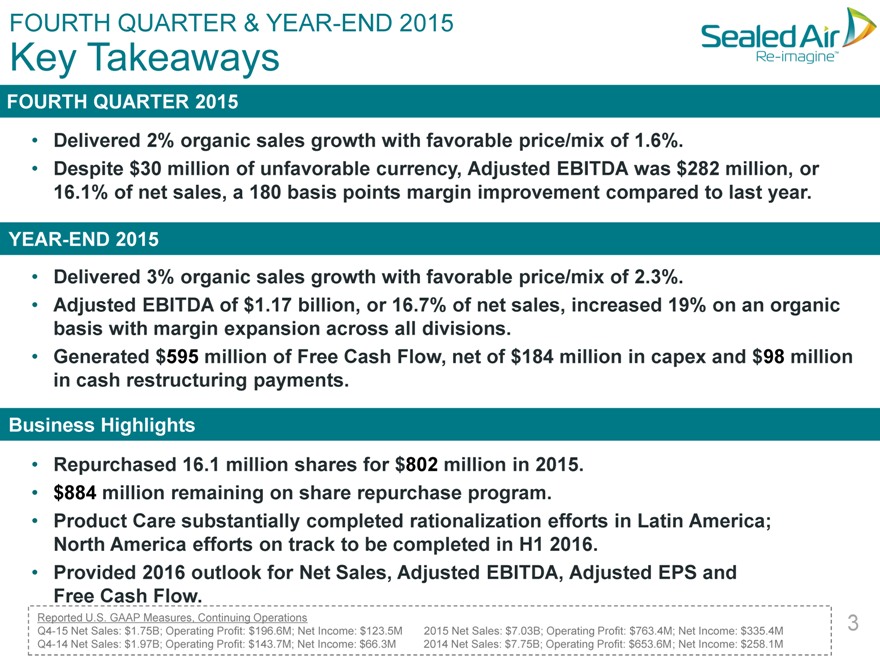
FOURTH QUARTER 2015
Delivered 2% organic sales growth with favorable price/mix of 1.6%.
Despite $30 million of unfavorable currency, Adjusted EBITDA was $282 million, or
16.1% of net sales, a 180 basis points margin improvement compared to last year.
YEAR-END 2015
Delivered 3% organic sales growth with favorable price/mix of 2.3%.
Adjusted EBITDA of $1.17 billion, or 16.7% of net sales, increased 19% on an organic
basis with margin expansion across all divisions.
Generated $595 million of Free Cash Flow, net of $184 million in capex and $98 million
in cash restructuring payments.
Business Highlights
Repurchased 16.1 million shares for $802 million in 2015.
$884 million remaining on share repurchase program.
Product Care substantially completed rationalization efforts in Latin America; North
America efforts on track to be completed in H1 2016.
Provided 2016 outlook for Net Sales, Adjusted EBITDA, Adjusted EPS and Free Cash
Flow.
Reported U.S. GAAP Measures, Continuing Operations
Q4-15 Net Sales: $1.75B; Operating Profit: $196.6M; Net Income: $123.5M 2015 Net Sales: $7.03B; Operating Profit: $763.4M; Net Income: $335.4M Q4-14 Net Sales: $1.97B; Operating Profit: $143.7M; Net Income: $66.3M 2014 Net Sales: $7.75B; Operating Profit: $653.6M; Net Income: $258.1M
3
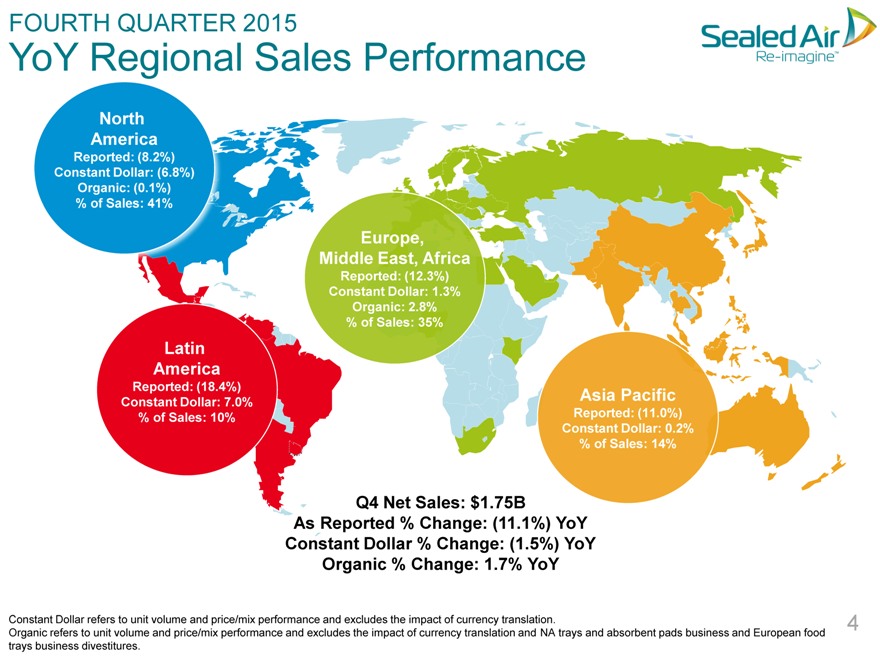
FOURTH QUARTER 2015 YoY Regional Sales Performance North America Reported: (8.2%) Constant Dollar: (6.8%) Organic: (0.1%) % of Sales: 41% Europe, Middle East, Africa Reported: (12.3%) Constant Dollar: 1.3% Organic: 2.8% % of Sales: 35% Latin America Reported: (18.4%) Constant Dollar: 7.0% Asia Pacific % of Sales: 10% Reported: (11.0%) Constant Dollar: 0.2% % of Sales: 14% Q4 Net Sales: $1.75B As Reported % Change: (11.1%) YoY Constant Dollar % Change: (1.5%) YoY Organic % Change: 1.7% YoY Constant Dollar refers to unit volume and price/mix performance and excludes the impact of currency translation. 1 Organic refers to unit volume and price/mix performance and excludes the impact of currency translation and NA trays and absorbent pads business and European food trays business divestitures.
|
|
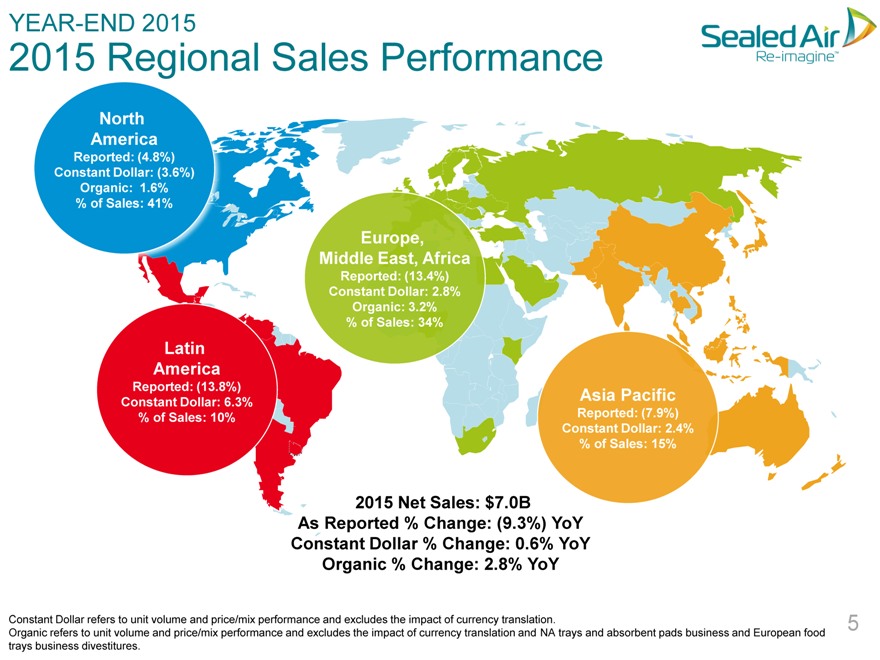
YEAR-END 2015 2015 Regional Sales Performance North America Reported: (4.8%) Constant Dollar: (3.6%) Organic: 1.6% % of Sales: 41% Europe, Middle East, Africa Reported: (13.4%) Constant Dollar: 2.8% Organic: 3.2% % of Sales: 34% Latin America Reported: (13.8%) Constant Dollar: 6.3% Asia Pacific % of Sales: 10% Reported: (7.9%) Constant Dollar: 2.4% % of Sales: 15% 2015 Net Sales: $7.0B As Reported % Change: (9.3%) YoY Constant Dollar % Change: 0.6% YoY Organic % Change: 2.8% YoY Constant Dollar refers to unit volume and price/mix performance and excludes the impact of currency translation. 2 Organic refers to unit volume and price/mix performance and excludes the impact of currency translation and NA trays and absorbent pads business and European food trays business divestitures.
FOURTH QUARTER & YEAR-END 2015
YoY Price/Mix & Volume Trends
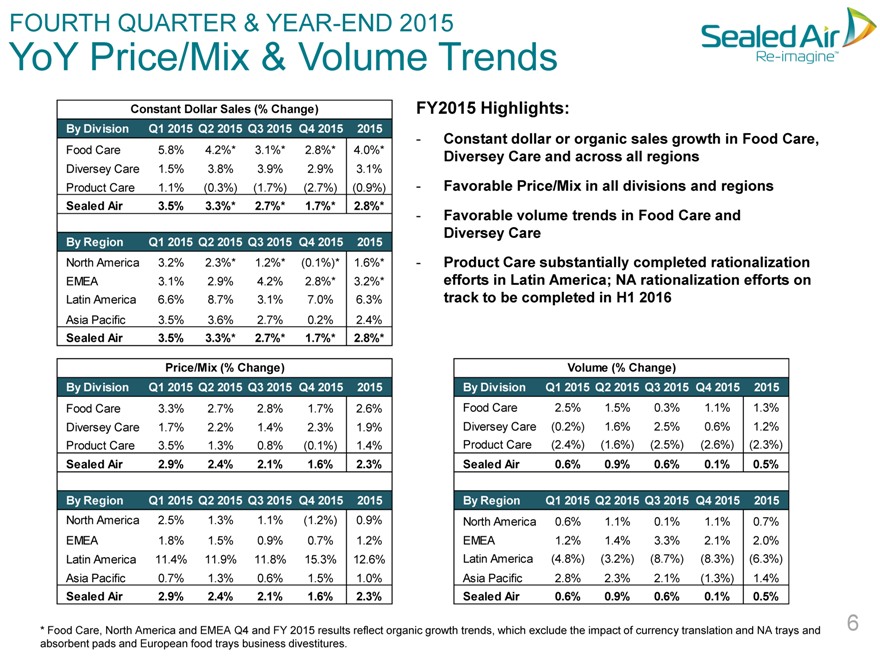
Constant Dollar Sales (% Change)
By Division Q1 2015 Q2 2015 Q3 2015 Q4 2015 2015
Food Care 5.8% 4.2%* 3.1%* 2.8%* 4.0%*
Diversey Care 1.5% 3.8% 3.9% 2.9% 3.1%
Product Care 1.1%(0.3%)(1.7%)(2.7%)(0.9%)
Sealed Air 3.5% 3.3%* 2.7%* 1.7%* 2.8%*
By Region Q1 2015 Q2 2015 Q3 2015 Q4 2015 2015
North America 3.2% 2.3%* 1.2%*(0.1%)* 1.6%*
EMEA 3.1% 2.9% 4.2% 2.8%* 3.2%*
Latin America 6.6% 8.7% 3.1% 7.0% 6.3%
Asia Pacific 3.5% 3.6% 2.7% 0.2% 2.4%
Sealed Air 3.5% 3.3%* 2.7%* 1.7%* 2.8%*
Price/Mix (% Change)
By Division Q1 2015 Q2 2015 Q3 2015 Q4 2015 2015
Food Care 3.3% 2.7% 2.8% 1.7% 2.6%
Diversey Care 1.7% 2.2% 1.4% 2.3% 1.9%
Product Care 3.5% 1.3% 0.8%(0.1%) 1.4%
Sealed Air 2.9% 2.4% 2.1% 1.6% 2.3%
By Region Q1 2015 Q2 2015 Q3 2015 Q4 2015 2015
North America 2.5% 1.3% 1.1%(1.2%) 0.9%
EMEA 1.8% 1.5% 0.9% 0.7% 1.2%
Latin America 11.4% 11.9% 11.8% 15.3% 12.6%
Asia Pacific 0.7% 1.3% 0.6% 1.5% 1.0%
Sealed Air 2.9% 2.4% 2.1% 1.6% 2.3%
FY2015 Highlights:
- Constant dollar or organic sales growth in Food Care, Diversey Care and across all regions
- Favorable Price/Mix in all divisions and regions
- Favorable volume trends in Food Care and Diversey Care
- Product Care completed rationalization efforts in Latin America; NA rationalization efforts on track to be completed in H1 2016
Volume (% Change)
By Division Q1 2015 Q2 2015 Q3 2015 Q4 2015 2015
Food Care 2.5% 1.5% 0.3% 1.1% 1.3%
Diversey Care(0.2%) 1.6% 2.5% 0.6% 1.2%
Product Care(2.4%)(1.6%)(2.5%)(2.6%)(2.3%)
Sealed Air 0.6% 0.9% 0.6% 0.1% 0.5%
By Region Q1 2015 Q2 2015 Q3 2015 Q4 2015 2015
North America 0.6% 1.1% 0.1% 1.1% 0.7%
EMEA 1.2% 1.4% 3.3% 2.1% 2.0%
Latin America(4.8%)(3.2%)(8.7%)(8.3%)(6.3%)
Asia Pacific 2.8% 2.3% 2.1%(1.3%) 1.4%
Sealed Air 0.6% 0.9% 0.6% 0.1% 0.5%
* Food Care, North America and EMEA Q4 and FY 2015 results reflect organic growth trends, which exclude the impact of currency translation and NA trays and absorbent pads and European food trays business divestitures.
6
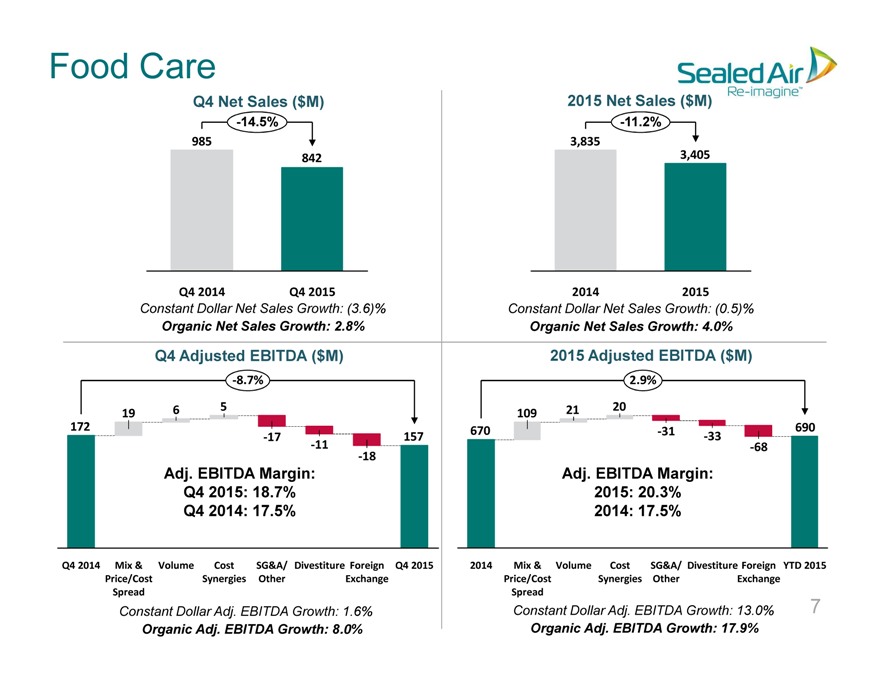
Food Care
Q4 Net Sales ($M)
-14.5%
985
842
Q4 2014
Q4 2015
Constant Dollar Net Sales Growth: (3.6)%
Organic Net Sales Growth: 2.8%
2015 Net Sales ($M)
-11.2%
3,835
3,405
2014
2015
Constant Dollar Net Sales Growth: (0.5)%
Organic Net Sales Growth: 4.0%
Q4 Adjusted EBITDA ($M)
-8.7%
19
172
-17
157
-11
-18
Adj. EBITDA Margin:
Q4 2015: 18.7%
Q4 2014: 17.5%
Q4 2014
Mix &
Volume
Cost
SG&A/ Divestiture Foreign
Q4 2015
Price/Cost
Synergies Other
Exchange
Spread
Constant Dollar Adj. EBITDA Growth: 1.6%
Organic Adj. EBITDA Growth: 8.0%
2015 Adjusted EBITDA ($M)
2.9%
109
21
20
670
-31
690
-33
-68
Adj. EBITDA Margin:
2015: 20.3%
2014: 17.5%
2014
Mix &
Volume
Cost
SG&A/ Divestiture Foreign YTD 2015
Price/Cost
Synergies Other
Exchange
Spread
Constant Dollar Adj. EBITDA Growth: 13.0%
Organic Adj. EBITDA Growth: 17.9%
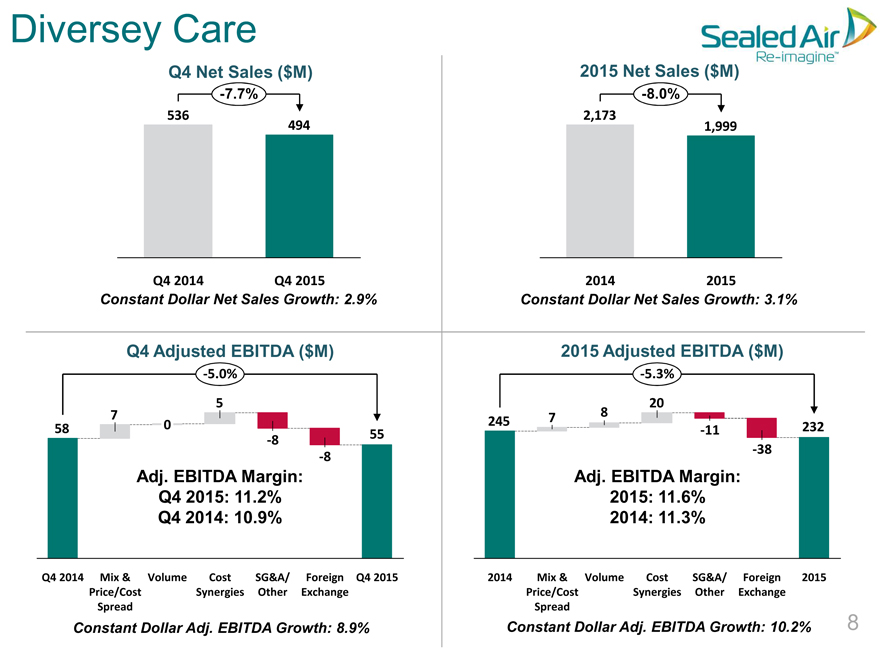
Diversey Care
Q4 Net Sales ($M)
-7.7%
536
494
Q4 2014 Q4 2015
Constant Dollar Net Sales Growth: 2.9%
2015 Net Sales ($M)
-8.0%
2,173
1,999
2014 2015
Constant Dollar Net Sales Growth: 3.1%
Q4 Adjusted EBITDA ($M)
-5.0%
-8 55
-8
Adj. EBITDA Margin:
Q4 2015: 11.2%
Q4 2014: 10.9%
Q4 2014 Mix & Volume Cost SG&A/ Foreign Q4 2015
Price/Cost Synergies Other Exchange
Spread
Constant Dollar Adj. EBITDA Growth: 8.9%
2015 Adjusted EBITDA ($M)
-5.3%
245 7 8
-11 232
-38
Adj. EBITDA Margin:
2015: 11.6%
2014: 11.3%
2014 Mix & Volume Cost SG&A/ Foreign 2015
Price/Cost Synergies Other Exchange
Spread
Constant Dollar Adj. EBITDA Growth: 10.2%
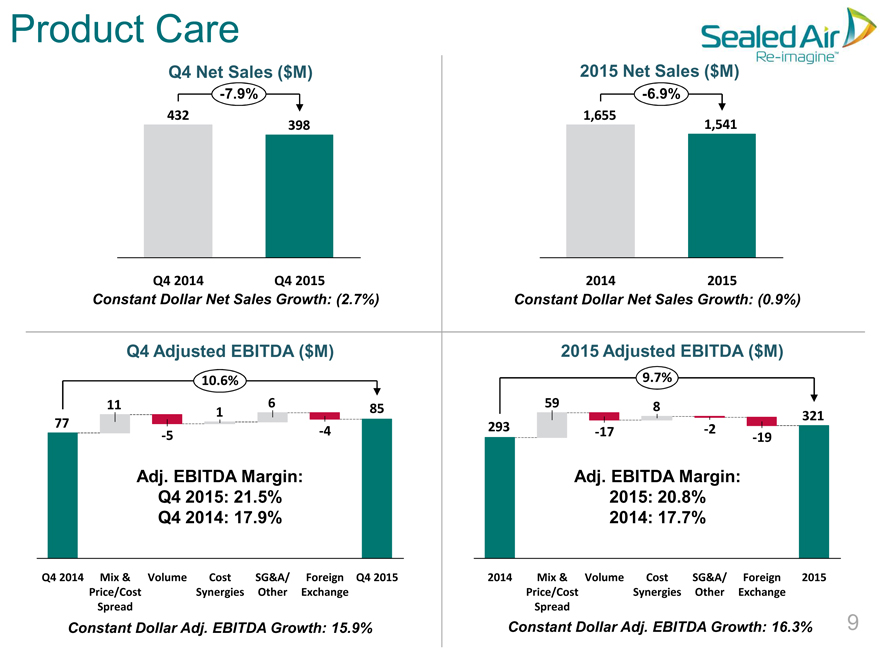
Product Care
Q4 Net Sales ($M)
-7.9%
432
398
Q4 2014 Q4 2015
Constant Dollar Net Sales Growth: (2.7%)
2015 Net Sales ($M)
-6.9%
1,655
1,541
2014 2015
Constant Dollar Net Sales Growth: (0.9%)
Q4 Adjusted EBITDA ($M)
10.6%
11 1 6 85
77
-5 -4
Adj. EBITDA Margin:
Q4 2015: 21.5%
Q4 2014: 17.9%
Q4 2014 Mix & Volume Cost SG&A/ Foreign Q4 2015
Price/Cost Synergies Other Exchange
Spread
Constant Dollar Adj. EBITDA Growth: 15.9%
2015 Adjusted EBITDA ($M)
9.7%
59 8
321
293 -17 -2 -19
Adj. EBITDA Margin:
2015: 20.8%
2014: 17.7%
2014 Mix & Volume Cost SG&A/ Foreign 2015
Price/Cost Synergies Other Exchange
Spread
Constant Dollar Adj. EBITDA Growth: 16.3%
9
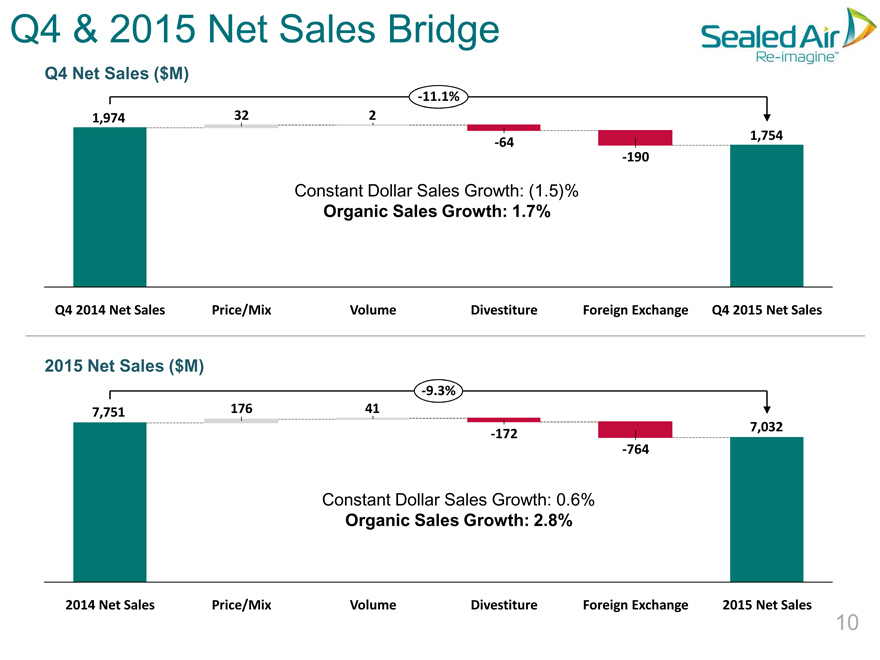
Q4 & 2015 Net Sales Bridge
Q4 Net Sales ($M)
-11.1%
1,974 32 2
-64 1,754
-190
Constant Dollar Sales Growth: (1.5)%
Organic Sales Growth: 1.7%
Q4 2014 Net Sales Price/Mix Volume Divestiture Foreign Exchange Q4 2015 Net Sales
2015 Net Sales ($M)
-9.3%
7,751 176 41
-172 7,032
-764
Constant Dollar Sales Growth: 0.6%
Organic Sales Growth: 2.8%
2014 Net Sales Price/Mix Volume Divestiture Foreign Exchange 2015 Net Sales
10
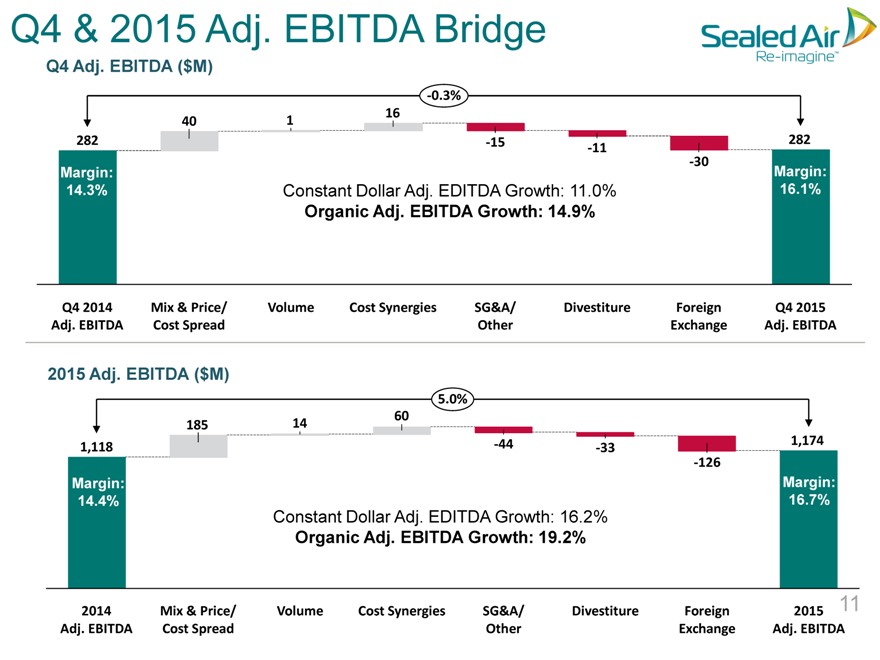
Q4 & 2015 Adj. EBITDA Bridge
Q4 Adj. EBITDA ($M)
-0.3%
40 1 16
282 -15 282
-11
-30
Margin: Margin:
14.3% Constant Dollar Adj. EDITDA Growth: 11.0% 16.1%
Organic Adj. EBITDA Growth: 14.9%
Q4 2014 Mix & Price/ Volume Cost Synergies SG&A/ Divestiture Foreign Q4 2015
Adj. EBITDA Cost Spread Other Exchange Adj. EBITDA
2015 Adj. EBITDA ($M)
5.0%
185 14 60
1,118 -44 -33 1,174
-126
Margin: Margin:
14.4% 16.7%
Constant Dollar Adj. EDITDA Growth: 16.2%
Organic Adj. EBITDA Growth: 19.2%
2014 Mix & Price/ Volume Cost Synergies SG&A/ Divestiture Foreign 2015
Adj. EBITDA Cost Spread Other Exchange Adj. EBITDA
11
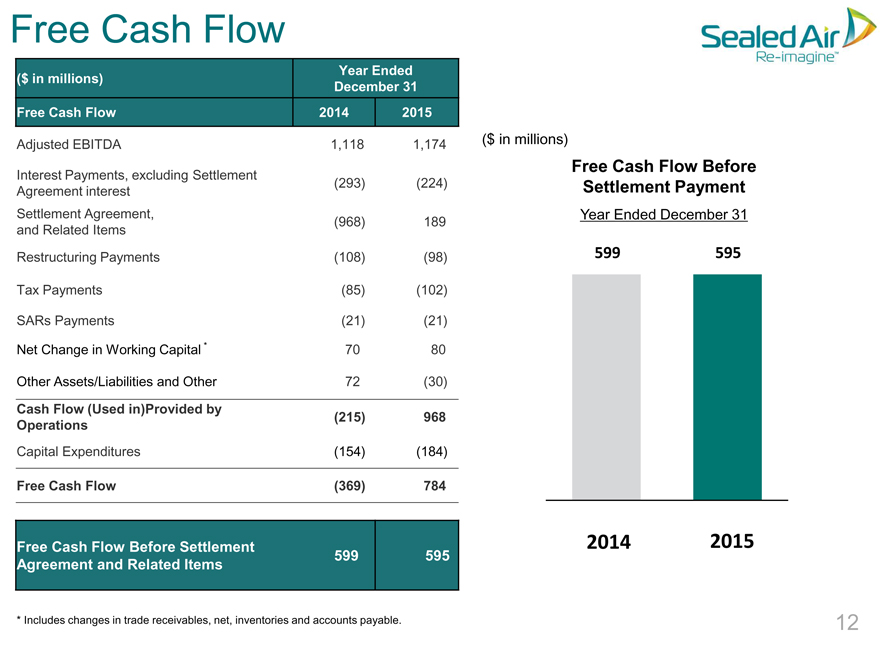
Free Cash Flow
Year Ended
($ in millions)
December 31
Free Cash Flow 2014 2015
Adjusted EBITDA 1,118 1,174
Interest Payments, excluding Settlement
(293)(224)
Agreement interest
Settlement Agreement,
(968) 189
and Related Items
Restructuring Payments(108)(98)
Tax Payments(85)(102)
SARs Payments(21)(21)
Net Change in Working Capital * 70 80
Other Assets/Liabilities and Other 72(30)
Cash Flow (Used in)Provided by
(215) 968
Operations
Capital Expenditures(154)(184)
Free Cash Flow(369) 784
Free Cash Flow Before Settlement
599 595
Agreement and Related Items
* Includes changes in trade receivables, net, inventories and accounts payable.
($ in millions)
Free Cash Flow Before
Settlement Payment
Year Ended December 31
599 595
2014 2015
12
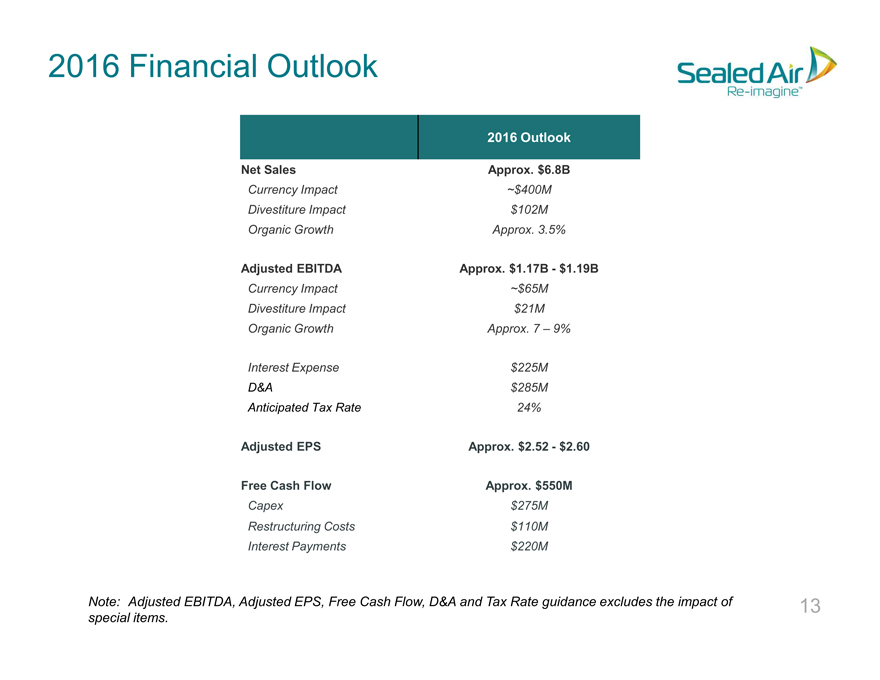
2016 Financial Outlook
2016 Outlook
Net Sales Approx. $6.8B
Currency Impact ~$400M
Divestiture Impact $102M
Organic Growth Approx. 3.5%
Adjusted EBITDA Approx. $1.17B - $1.19B
Currency Impact ~$65M
Divestiture Impact $21M
Organic Growth Approx. 7 – 9%
Interest Expense $225M
D&A $285M
Anticipated Tax Rate 24%
Adjusted EPS Approx. $2.52 - $2.60
Free Cash Flow Approx. $550M
Capex $275M
Restructuring Costs $110M
Interest Payments $220M
Note: Adjusted EBITDA, Adjusted EPS, Free Cash Flow, D&A and Tax Rate guidance excludes the impact of 13 special items.
Q&A
Earnings Conference Call Fourth Quarter & Year-End 2015