Exhibit 99.2
| ? Senior Notes Offering January 2005 |
| This presentation may contain statements about future events and Energy Transfer Partners, L.P.'s ("Energy Transfer", the "Partnership" or "ETP") outlook and expectations, which are forward-looking statements. Any statement in this presentation that is not a historical fact may be deemed to be a forward-looking statement. These forward-looking statements rely on a number of assumptions concerning future events and are subject to a number of uncertainties and factors, many of which are outside Energy Transfer's control, and which could cause Energy Transfer's actual results, performance or achievements to be materially different. While Energy Transfer believes that the assumptions concerning future events are reasonable, it cautions that there are inherent difficulties in predicting certain important factors that could impact the future performance or results of its business. These risks and uncertainties are discussed in more detail in Energy Transfer's filings with the Securities and Exchange Commission, copies of which are available to the public. Energy Transfer expressly disclaims any intention or obligation to revise or update any forward-looking statements whether as a result of new information, future events, or otherwise. Legal Disclaimer |

| Key Credit Highlights One of the ten largest publicly traded MLPs in the U.S. with $2.6 billion in market capitalization as of December 31, 2004 Midstream and Transportation Operation - Approximately 7,750 miles of strategically located, long lived natural gas gathering and transportation pipelines linking high- growth production areas to multiple markets Stable cash flow and earnings - fee-based margin represented approximately 76% of Midstream OLP's operation's total gross margin for the year ended August 31, 2004 Propane Operation - We believe we are the 4th largest retail marketer of propane in the U.S. with a nationwide propane distribution system known as Heritage Operating, L.P. Strong financial position - Total Adjusted Net Debt to projected EBITDA of approximately 3.1x for adjusted FYE August 31, 2004 Management - highly experienced management team, with interest closely aligned with unit holder; committed to maintaining investment grade ratings and financial metrics Favorable, long-term customer relationships Strong market fundamentals - demand increasing for natural gas, NGLs and propane; numerous opportunities for growth through organic expansion and acquisitions Limited direct commodity price exposure |
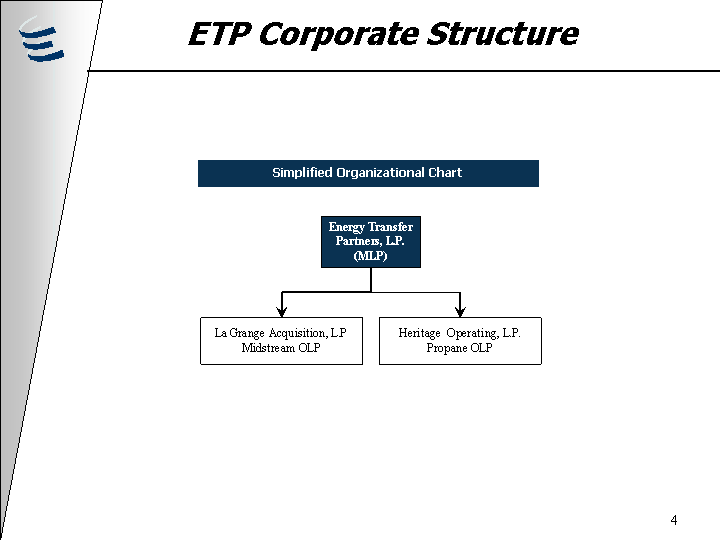
| ETP Corporate Structure Simplified Organizational Chart |
| ETP Overview A Diversified Energy MLP Large operator of natural gas midstream and propane assets Top 10 MLP with a market capitalization of $2.6 billion, with total enterprise value of $3.8 billion as of December 31, 2004 Natural Gas Midstream Operations Approximately 7,750 miles of natural gas gathering and transportation pipelines Propane Marketer 4th largest retail marketer of propane in the U.S. operated through Heritage Operating, L.P. ("Heritage" or the "Propane OLP") Experienced and successful management team Management, Directors and Affiliates of our General Partner own approximately 38% of the MLP-common units Common unit interests at the MLP closely aligned through ETP's strong financial profile Today we are... |
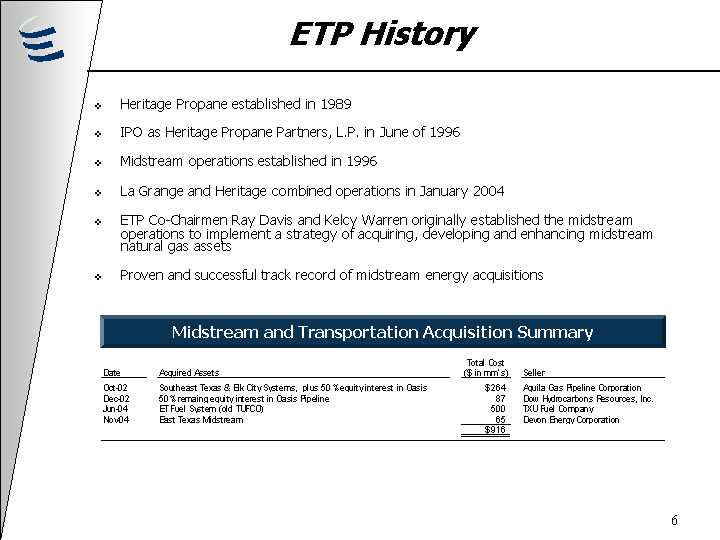
| Heritage Propane established in 1989 IPO as Heritage Propane Partners, L.P. in June of 1996 Midstream operations established in 1996 La Grange and Heritage combined operations in January 2004 ETP Co-Chairmen Ray Davis and Kelcy Warren originally established the midstream operations to implement a strategy of acquiring, developing and enhancing midstream natural gas assets Proven and successful track record of midstream energy acquisitions ETP History Midstream and Transportation Acquisition Summary |
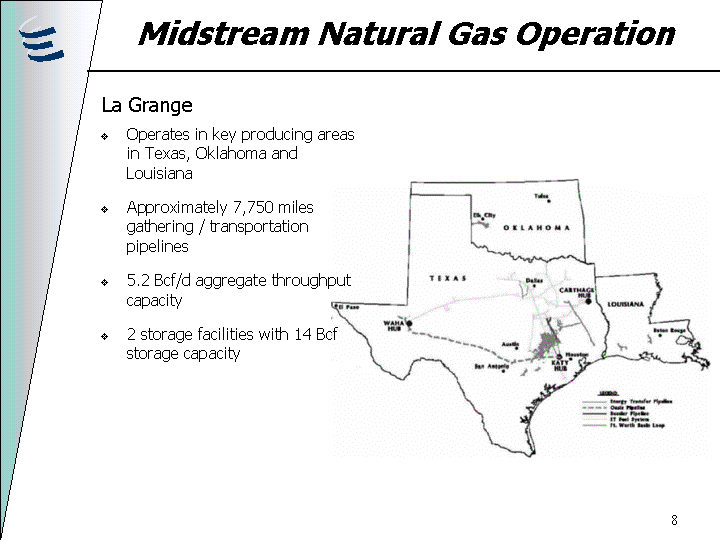
| Midstream Natural Gas Operation La Grange Operates in key producing areas in Texas, Oklahoma and Louisiana Approximately 7,750 miles gathering / transportation pipelines 5.2 Bcf/d aggregate throughput capacity 2 storage facilities with 14 Bcf storage capacity |
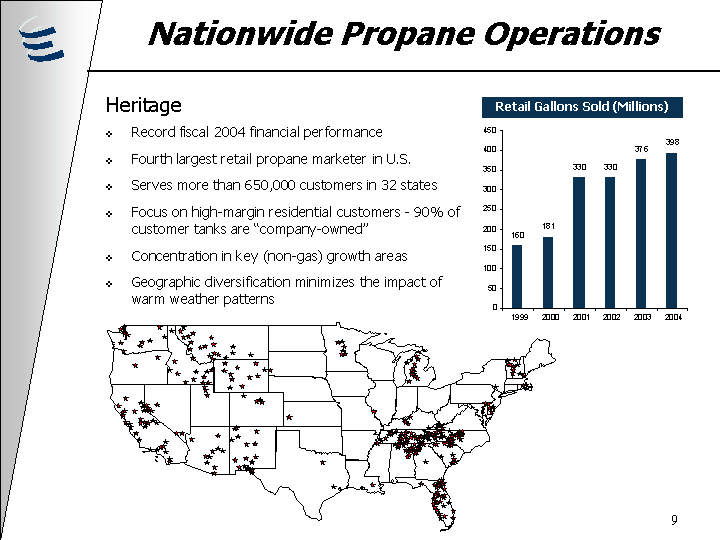
| Record fiscal 2004 financial performance Fourth largest retail propane marketer in U.S. Serves more than 650,000 customers in 32 states Focus on high-margin residential customers - 90% of customer tanks are "company-owned" Concentration in key (non-gas) growth areas Geographic diversification minimizes the impact of warm weather patterns Nationwide Propane Operations Heritage Retail Gallons Sold (Millions) 160 181 330 330 376 398 0 50 100 150 200 250 300 350 400 450 1999 2000 2001 2002 2003 2004 |
| ETP Highlights Diversified operations provide stable cash flows and limited exposure to commodity risk Significant presence in most major producing basins in Texas gas markets Heritage targets quality acquisitions in high growth areas Actual Combined EBITDA of approximately $250 million in fiscal 2004 (projected 2004 $331 million) Strong executive and operating management team Well-capitalized MLP with proven access to additional equity Raised $559 million through issuance of new common units in January and July of 2004 |
| Midstream OLP Highlights Midstream OLP Actual EBITDA approximately $143 million in fiscal 2004 Projected fiscal 2004 EBITDA of $216 million (includes full year of Bossier Pipeline and ET Fuel Systems) Projected 2005 EBITDA of $250 million Flexibility to gather, process and deliver gas from major producing areas in Texas, Oklahoma and Louisiana to Waha, Carthage and Katy market hubs Emphasizes expanding fee-based businesses (76% of gross margins) Numerous internal growth projects as a result of assets previously acquired |
| Heritage Propane Actual EBITDA approximately $115 million in fiscal 2004 Projected 2005 EBITDA of $120 million Emphasis on high growth areas of United States Continued focus on acquisitions at attractive multiples Track record of consistent growth Propane OLP Highlights |
| Midstream & Propane Business Strategies ETP's primary focus going forward will be the Midstream natural gas business Midstream OLP Strategies Growth through acquisitions Enhance profitability of existing assets Develop expansion opportunities Increase fee-based free cash flow Propane OLP Strategies Growth through complementary acquisitions Maintain low-cost, decentralized operations Pursue internal growth opportunities |
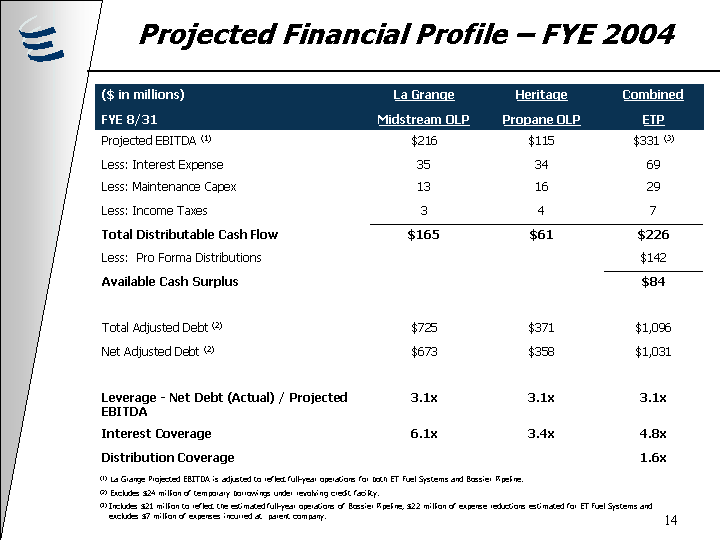
| ($ in millions) FYE 8/31 La Grange Midstream OLP Heritage Propane OLP Combined ETP Projected EBITDA (1) $216 $115 $331 (3) Less: Interest Expense 35 34 69 Less: Maintenance Capex 13 16 29 Less: Income Taxes 3 4 7 Total Distributable Cash Flow $165 $61 $226 Less: Pro Forma Distributions $142 Available Cash Surplus $84 Total Adjusted Debt (2) $725 $371 $1,096 Net Adjusted Debt (2) $673 $358 $1,031 Leverage - Net Debt (Actual) / Projected EBITDA 3.1x 3.1x 3.1x Interest Coverage 6.1x 3.4x 4.8x Distribution Coverage 1.6x Projected Financial Profile - FYE 2004 (1) La Grange Projected EBITDA is adjusted to reflect full-year operations for both ET Fuel Systems and Bossier Pipeline. (2) Excludes $24 million of temporary borrowings under revolving credit facility. (3) Includes $21 million to reflect the estimated full-year operations of Bossier Pipeline, $22 million of expense reductions estimated for ET Fuel Systems and excludes $7 million of expenses incurred at parent company. |
| ETP Management Overview Strong Management Team Ray Davis and Kelcy Warren have over 50 years of combined experience in the midstream natural gas business Since 2002, management has acquired and integrated over $900 million in midstream natural gas assets Strong technical team with extensive knowledge and experience in existing areas of operation |

| La Grange / Midstream OLP Business Overview |

| La Grange / Midstream OLP Overview La Grange's midstream and transportation operations are primarily located in major natural gas producing regions of Texas, Oklahoma and Louisiana |
| La Grange / Midstream OLP Overview La Grange's midstream and transportation operations consist of the following: Gathering of natural gas from approximately 2,500 producing wells; Compression of natural gas from producing wells; Treating and blending of natural gas to meet pipeline quality specifications; Processing of natural gas to extract natural gas liquids; Sale of pipeline quality natural gas and natural gas liquids; Transportation of natural gas on the Oasis Pipeline, the East Texas Pipeline System, and ET Fuel System to industrial end-users, independent power plants, utilities and other pipelines; and Purchase for resale of natural gas from producers connected to ETP's systems and from other third parties |
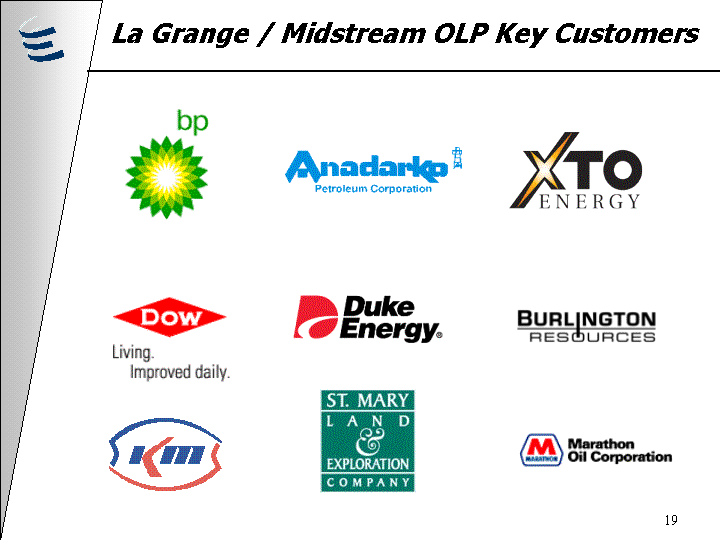
| La Grange / Midstream OLP Key Customers |
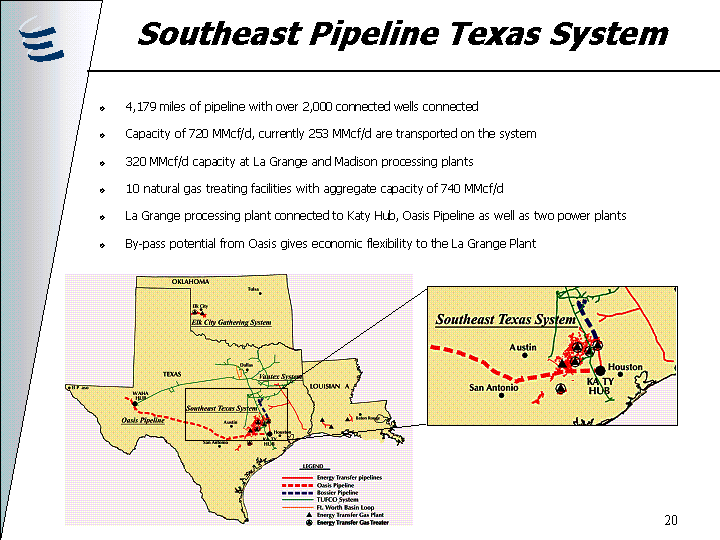
| 4,179 miles of pipeline with over 2,000 connected wells connected Capacity of 720 MMcf/d, currently 253 MMcf/d are transported on the system 320 MMcf/d capacity at La Grange and Madison processing plants 10 natural gas treating facilities with aggregate capacity of 740 MMcf/d La Grange processing plant connected to Katy Hub, Oasis Pipeline as well as two power plants By-pass potential from Oasis gives economic flexibility to the La Grange Plant Southeast Pipeline Texas System |
| SETPS - Key Customers Key Customers Anadarko Marathon Devon Duke Long-Term Contracts Generally 3 to 5 years; extendable to life of reserves Contract Mix 20% keep-whole 80% percentage of proceeds |
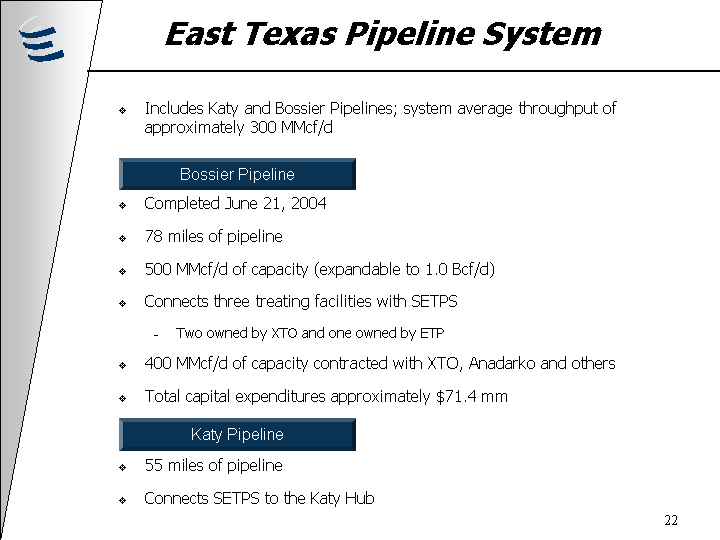
| East Texas Pipeline System Completed June 21, 2004 78 miles of pipeline 500 MMcf/d of capacity (expandable to 1.0 Bcf/d) Connects three treating facilities with SETPS Two owned by XTO and one owned by ETP 400 MMcf/d of capacity contracted with XTO, Anadarko and others Total capital expenditures approximately $71.4 mm 55 miles of pipeline Connects SETPS to the Katy Hub Includes Katy and Bossier Pipelines; system average throughput of approximately 300 MMcf/d Bossier Pipeline Katy Pipeline |
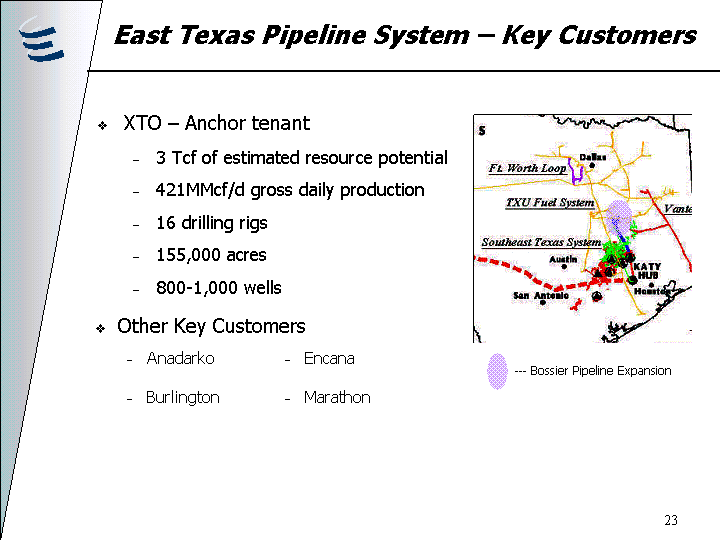
| Other Key Customers Other Key Customers Anadarko Burlington Encana Marathon East Texas Pipeline System - Key Customers XTO - Anchor tenant 3 Tcf of estimated resource potential 421MMcf/d gross daily production 16 drilling rigs 155,000 acres 800-1,000 wells - --- Bossier Pipeline Expansion |
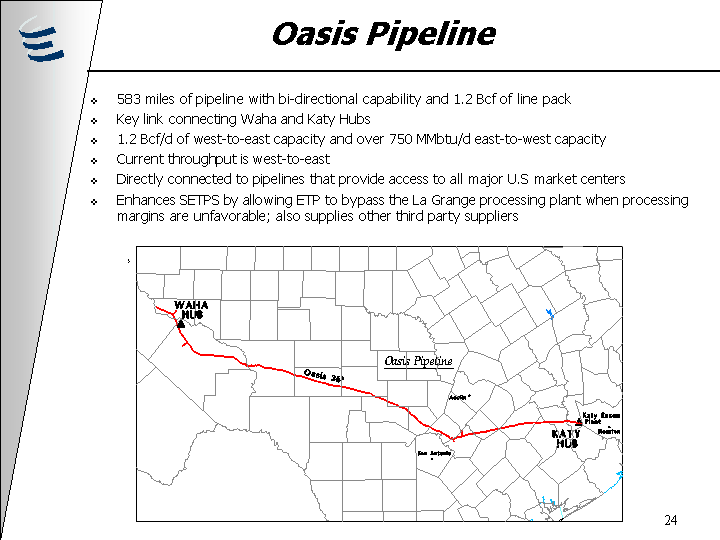
| 583 miles of pipeline with bi-directional capability and 1.2 Bcf of line pack Key link connecting Waha and Katy Hubs 1.2 Bcf/d of west-to-east capacity and over 750 MMbtu/d east-to-west capacity Current throughput is west-to-east Directly connected to pipelines that provide access to all major U.S market centers Enhances SETPS by allowing ETP to bypass the La Grange processing plant when processing margins are unfavorable; also supplies other third party suppliers Oasis Pipeline |

| Key Customers Independent power plants Other major pipelines Gas marketers / producers Industrial end-users and utilities Contracted Revenues: 680 MMcf/d (57% of Oasis capacity) Oasis Pipeline - Key Customers |
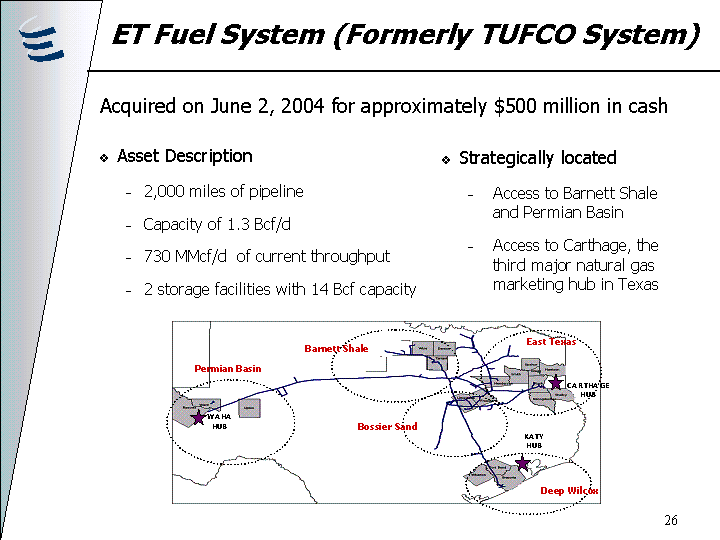
| ET Fuel System (Formerly TUFCO System) Asset Description 2,000 miles of pipeline Capacity of 1.3 Bcf/d 730 MMcf/d of current throughput 2 storage facilities with 14 Bcf capacity Acquired on June 2, 2004 for approximately $500 million in cash Strategically located Access to Barnett Shale and Permian Basin Access to Carthage, the third major natural gas marketing hub in Texas |
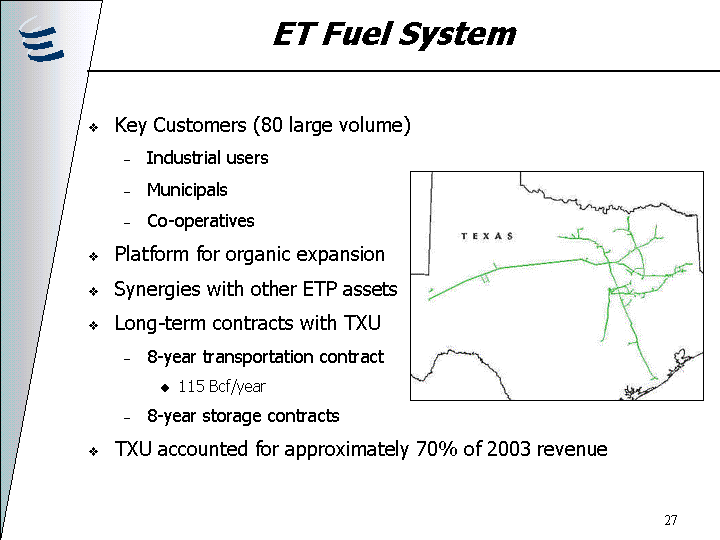
| ET Fuel System Key Customers (80 large volume) Industrial users Municipals Co-operatives Platform for organic expansion Synergies with other ETP assets Long-term contracts with TXU 8-year transportation contract 115 Bcf/year 8-year storage contracts TXU accounted for approximately 70% of 2003 revenue |
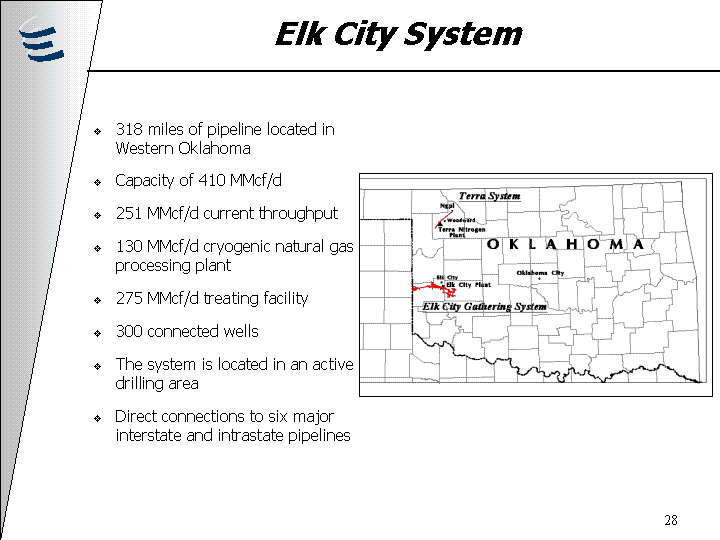
| 318 miles of pipeline located in Western Oklahoma Capacity of 410 MMcf/d 251 MMcf/d current throughput 130 MMcf/d cryogenic natural gas processing plant 275 MMcf/d treating facility 300 connected wells The system is located in an active drilling area Direct connections to six major interstate and intrastate pipelines Elk City System |
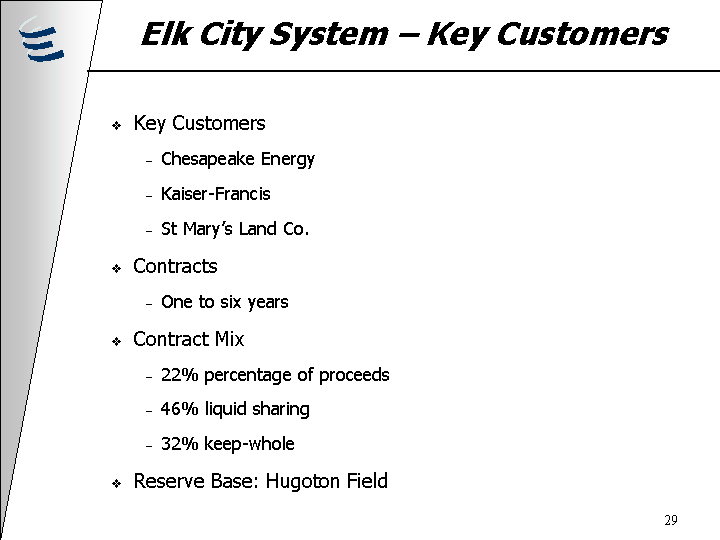
| Elk City System - Key Customers Key Customers Chesapeake Energy Kaiser-Francis St Mary's Land Co. Contracts One to six years Contract Mix 22% percentage of proceeds 46% liquid sharing 32% keep-whole Reserve Base: Hugoton Field |
| La Grange / Midstream OLP Financial Overview |
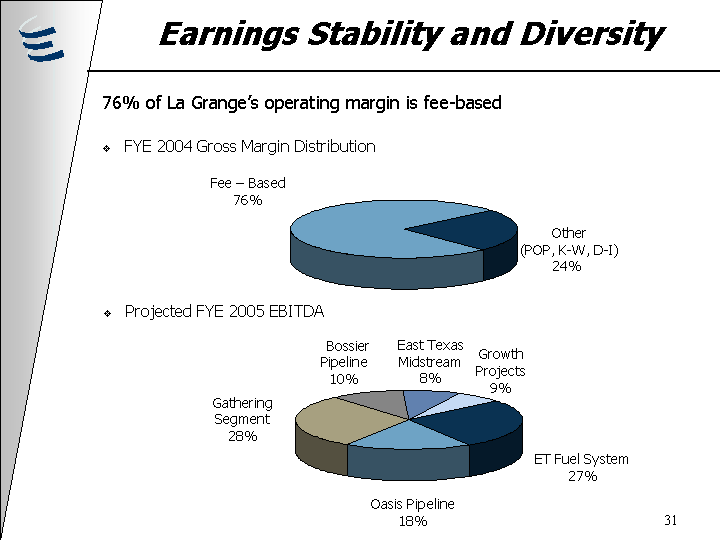
| Earnings Stability and Diversity 76% of La Grange's operating margin is fee-based Gathering Segment 28% Bossier Pipeline 10% ET Fuel System 27% Oasis Pipeline 18% East Texas Midstream 8% Growth Projects 9% Projected FYE 2005 EBITDA Fee - Based 76% Other (POP, K-W, D-I) 24% FYE 2004 Gross Margin Distribution |
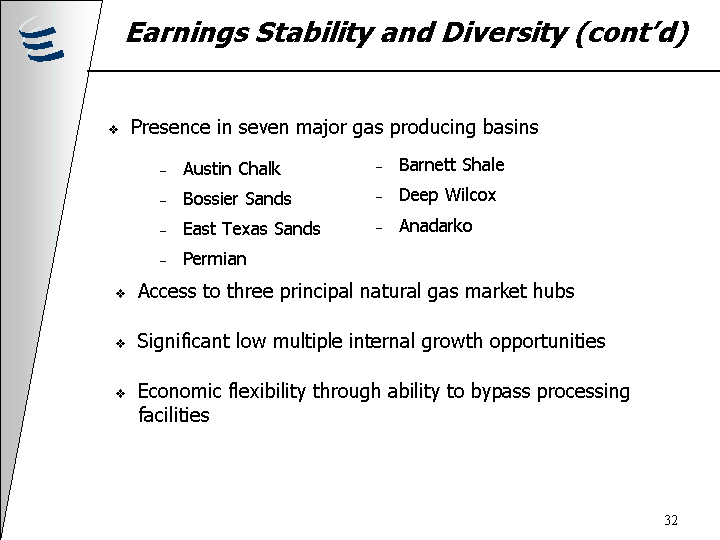
| Austin Chalk Bossier Sands East Texas Sands Permian Access to three principal natural gas market hubs Significant low multiple internal growth opportunities Economic flexibility through ability to bypass processing facilities Barnett Shale Deep Wilcox Anadarko Presence in seven major gas producing basins Earnings Stability and Diversity (cont'd) |
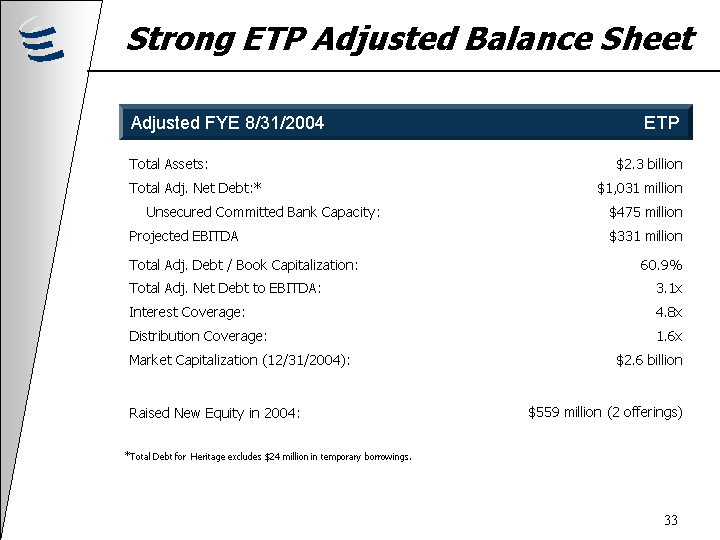
| Total Assets: $2.3 billion Total Adj. Net Debt:* $1,031 million Unsecured Committed Bank Capacity: $475 million Projected EBITDA Total Adj. Debt / Book Capitalization: $331 million 60.9% Total Adj. Net Debt to EBITDA: 3.1x Interest Coverage: 4.8x Distribution Coverage: 1.6x Market Capitalization (12/31/2004): $2.6 billion Raised New Equity in 2004: $559 million (2 offerings) Strong ETP Adjusted Balance Sheet Adjusted FYE 8/31/2004 ETP *Total Debt for Heritage excludes $24 million in temporary borrowings. |
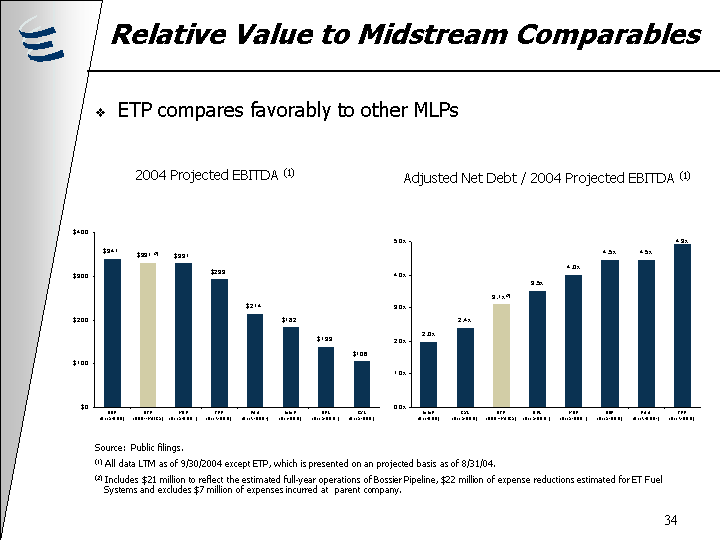
| Relative Value to Midstream Comparables ETP compares favorably to other MLPs 2004 Projected EBITDA (1) Adjusted Net Debt / 2004 Projected EBITDA (1) Source: Public filings. (1) All data LTM as of 9/30/2004 except ETP, which is presented on an projected basis as of 8/31/04. (2) Includes $21 million to reflect the estimated full-year operations of Bossier Pipeline, $22 million of expense reductions estimated for ET Fuel Systems and excludes $7 million of expenses incurred at parent company. |
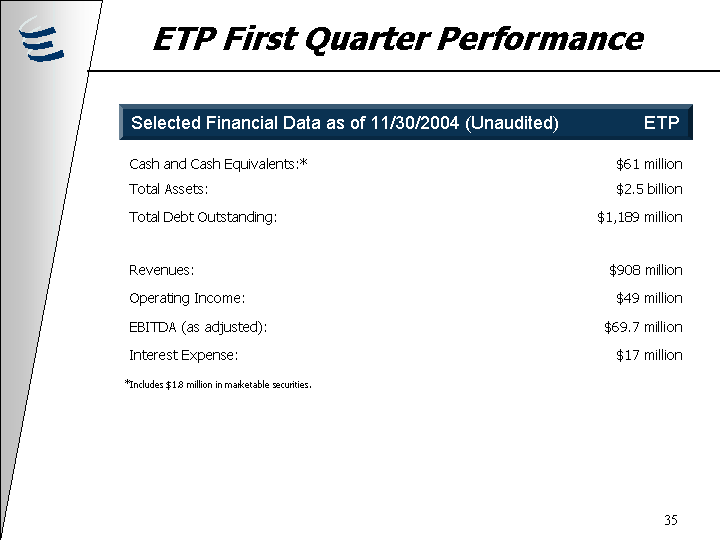
| Cash and Cash Equivalents:* $61 million Total Assets: Total Debt Outstanding: $2.5 billion $1,189 million Revenues: Operating Income: EBITDA (as adjusted): Interest Expense: $908 million $49 million $69.7 million $17 million ETP First Quarter Performance Selected Financial Data as of 11/30/2004 (Unaudited) ETP *Includes $1.8 million in marketable securities. |

| ETP Projected Combined 2005 EBITDA + = La Grange / Midstream OLP Balanced Partnership Heritage / Propane OLP ($ in millions) Projected 2005 EBITDA Total Adj. Debt* Security Collateral Credit Statistics: Adj. Debt* / Projected EBITDA Interest Coverage Total Adj. Debt* / Book Capitalization $250 $775 Unsecured None 3.1x 5.7x 67.6% $120 $371 Secured Propane Assets 3.1x 3.6x 50.9% $370 $1,146 3.1x 4.8x 60.5% *Total debt for La Grange is adjusted for proposed refinancing, which includes an additional $50 million in revolver borrowings. Total Debt for Heritage excludes $24 million in temporary borrowings. |
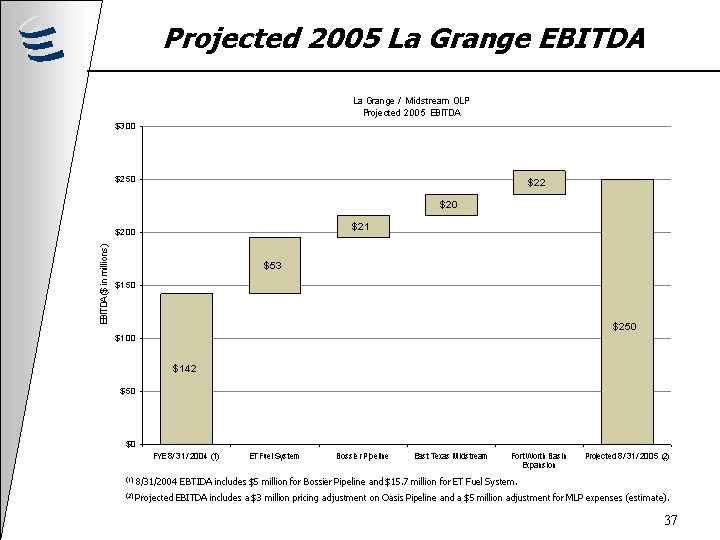
| Projected 2005 La Grange EBITDA (1) 8/31/2004 EBTIDA includes $5 million for Bossier Pipeline and $15.7 million for ET Fuel System. (2) Projected EBITDA includes a $3 million pricing adjustment on Oasis Pipeline and a $5 million adjustment for MLP expenses (estimate). |
| Key Credit Highlights One of the ten largest publicly traded MLPs in the U.S. with $2.6 billion in market capitalization as of December 31, 2004 Midstream and Transportation Operation - Approximately 7,750 miles of strategically located, long lived natural gas gathering and transportation pipelines linking high- growth production areas to multiple markets Stable cash flow and earnings - fee-based margin represented approximately 76% of Midstream OLP's operation's total gross margin for the year ended August 31, 2004 Propane Operation - We believe we are the 4th largest retail marketer of propane in the U.S. with a nationwide propane distribution system known as Heritage Operating, L.P. Strong financial position - Total Adjusted Net Debt to projected EBITDA of approximately 3.1x for adjusted FYE August 31, 2004 Management - highly experienced management team, with interest closely aligned with unit holder; committed to maintaining investment grade ratings and financial metrics Favorable, long-term customer relationships Strong market fundamentals - demand increasing for natural gas, NGLs and propane; numerous opportunities for growth through organic expansion and acquisitions Limited direct commodity price exposure |

Reconciliation of
Pro Form EBITDA for Fiscal Year Ended August 31, 2004
to
Projected EBITDA for Fiscal Year Ended August 31, 2004
(In thousands)
| | | | | | | | | |
| | | Projected 2004 Incremental | | Projected 2004 Incremental | | Exclusion of Expenses | | |
| Pro Forma EBITDA | | EBITDA Attributed to | | EBITDA Attributed to ET | | Incurred at Parent | | Total Projected 2004 EBITDA |
| for Fiscal Year Ended | | Bossier Pipeline Expansion | | Fuel System Acquisition | | Company | | for Fiscal Year Ended |
| August 31, 2004 | | (1) | | (2) | | (3) | | August 31, 2004 |
| |
| $280,000 | | $21,000 | | $23,000 | | $7,000 | | $331,000 |
(1) Incremental EBITDA attributed to Bossier Pipeline System expansion assuming full year operation from September 1, 2003.
(2) Incremental EBITDA attributed to expense reductions and operating synergies related to ET Fuel System acquisition assuming acquisition was completed on September 1, 2003.
(3) Excludes expenses incurred by the parent company for matters unrelated to the operating subsidiaries.