 Filed by Energy Transfer Partners, L.P. pursuant to Rule 425 under the Securities Act of 1933 and deemed filed pursuant to Rule 14a-12 under the Securities Exchange Act of 1934 Subject Company: Sunoco, Inc. Commission File No.: 1-06841 Energy Transfer Partners, L.P. Presentation to Fixed Income Investors June 5, 2012 Michael Doss Vice President - Finance |
 2 Legal Disclaimer SAFE HARBOR FOR FORWARD-LOOKING STATEMENTS Statements in this document regarding the proposed transaction between Energy Transfer Partners, L.P. (“ETP”) and Sunoco, Inc. (“Sunoco”), the expected timetable for completing the proposed transaction, future financial and operating results, benefits and synergies of the proposed transaction, future opportunities for the combined company, and any other statements about ETP, Energy Transfer Equity, L.P. (“ETE”), Sunoco Logistics Partners, L.P. (“SXL”) or Sunoco managements’ future expectations, beliefs, goals, plans or prospects constitute forward looking statements within the meaning of the Private Securities Litigation Reform Act of 1995. Any statements that are not statements of historical fact (including statements containing the words “believes,” “plans,” “anticipates,” “expects,” estimates and similar expressions) should also be considered to be forward looking statements. There are a number of important factors that could cause actual results or events to differ materially from those indicated by such forward looking statements, including: the ability to consummate the proposed transaction; the ability to obtain the requisite regulatory approvals, Sunoco shareholder approval and the satisfaction of other conditions to consummation of the transaction; the ability of ETP to successfully integrate Sunoco’s operations and employees; the ability to realize anticipated synergies and cost savings; the potential impact of announcement of the transaction or consummation of the transaction on relationships, including with employee suppliers, customers and competitors; the ability to achieve revenue growth; national, international, regional and local economic, competitive and regulatory conditions and developments; technological developments; capital and credit markets conditions; inflation rates; interest rates; the political and economic stability of oil producing nations; energy markets, including changes in the price of certain commodities; weather conditions; environmental conditions; business and regulatory or legal decisions; the pace of deregulation of retail natural gas and electricity and certain agricultural products; the timing and success of business development efforts; terrorism; and the other factors described in the Annual Reports on Form 10-K for the year ended December 31, 2011 filed with the SEC by ETP, ETE, SXL and Sunoco. ETP, ETE, SXL and Sunoco disclaim any intention or obligation to update any forward looking statements as a result of developments occurring after the date of this document. |
 3 ETP Overview • Energy Transfer Partners, L.P. (“ETP”) is one of the largest publicly traded MLPs – Adjusted EBITDA of $1.74 billion in 2011 and $536 million in Q1 2012 – Equity market capitalization of approximately $9.8 billion ¹ and an enterprise value of $18.5 billion 1,2 – More than $17.4 billion of total assets • ETP has a diversified portfolio of strategically positions natural gas and NGL assets – Approximately 23,500 miles of intrastate and interstate natural gas pipelines, including JVs – 74 Bcf of working natural gas storage capacity – More than 1,500 miles of NGL pipeline – NGL storage and fractionation facilities • ETP has transformed itself over the last eighteen months as we: – Entered the NGL business through our Lone Star joint venture and its acquisition of LDH Energy – Announced more than $3.0 billion of organic growth opportunities with a focus on liquids-rich opportunities – Contributed our Propane business to AmeriGas – Closed the acquisition of Southern Union’s 50% interest in Citrus (which owns FGT) – Announced the proposed acquisition of Sunoco, Inc. (“SUN”) • Throughout this transformation, we have continued to demonstrate our commitment to investment grade ratings by: – Focusing on long-term, fee-based contracts – Significantly improving our business profile – Managing commodity exposure through the use of hedges – Applying cash proceeds from the Propane Contribution to reduce indebtedness – Issuing more than $3.5 billion in equity over the past three years to fund growth 1 As of June 1, 2012. Excludes the value of incentive distribution rights (IDRs) held by ETE. 2 Includes net debt as of March 31, 2012 |
 4 Proposed Acquisition of SUN • ETP has announced the acquisition of 100% of SUN’s outstanding common stock for $5.3 billion • Creates a “best in class” natural gas, crude oil, NGLs and refined product logistics platform – Provides customers with a full suite of capabilities in key geographic locations – Diversifies ETP’s existing assets into crude oil and refined products transportation, terminalling and logistics – Provides a growth engine for ETP through ownership of interests in Sunoco Logistics Partners L.P. (“SXL”) – Dramatically expands scale, operational diversity and geographic footprint of SUN and SXL, enabling businesses to fully deliver on potential • Accretive to ETP cash flow while providing SUN shareholders increased value now and into the future • Key SUN and SXL management will remain and continue to run businesses |
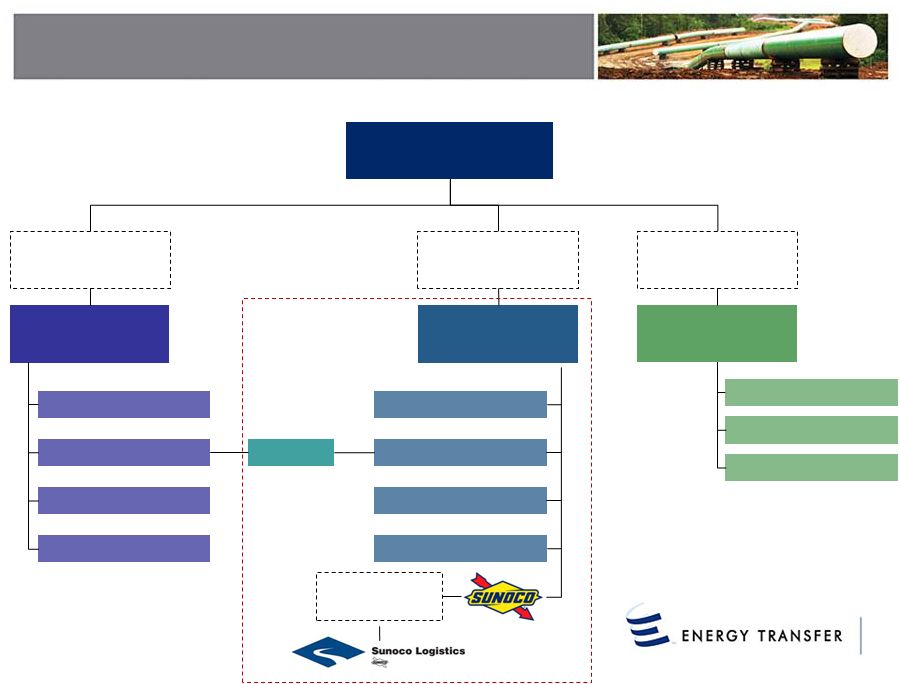 5 Pro Forma Organizational Structure 70% 30% Energy Transfer Equity, L.P. (NYSE: ETE) Ownership in RGP 100% RGP IDRs 1.6% General Partner Interest 26.3mm LP units (15.4% of total) Ownership in ETP 100% ETP IDRs 1.5% General Partner Interest 52.5mm LP units (22.9% of total) Ownership in SUG 100% SUG Shares Regency Energy Partners LP (NYSE: RGP) Energy Transfer Partners, L.P. (NYSE: ETP) Southern Union Co. Gathering & Processing Joint Ventures Contract Treating Contract Compression Lone Star NGL Midstream NGL Intrastate Transportation & Storage Interstate Transportation SUGS Panhandle Companies LDCs Ownership in SXL 100% SXL IDRs 2% GP Interest 32.4% LP Interest |
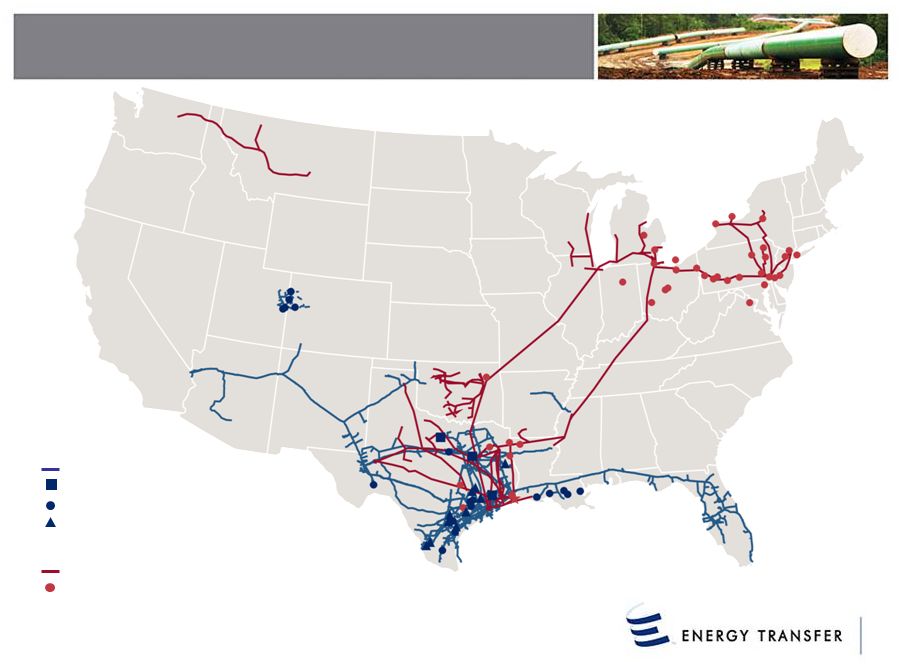 6 ETP Pro Forma Asset Overview Pipelines ETP SXL Processing Treating Pipelines Terminals Storage Note: Excludes SUN’s retail marketing locations |
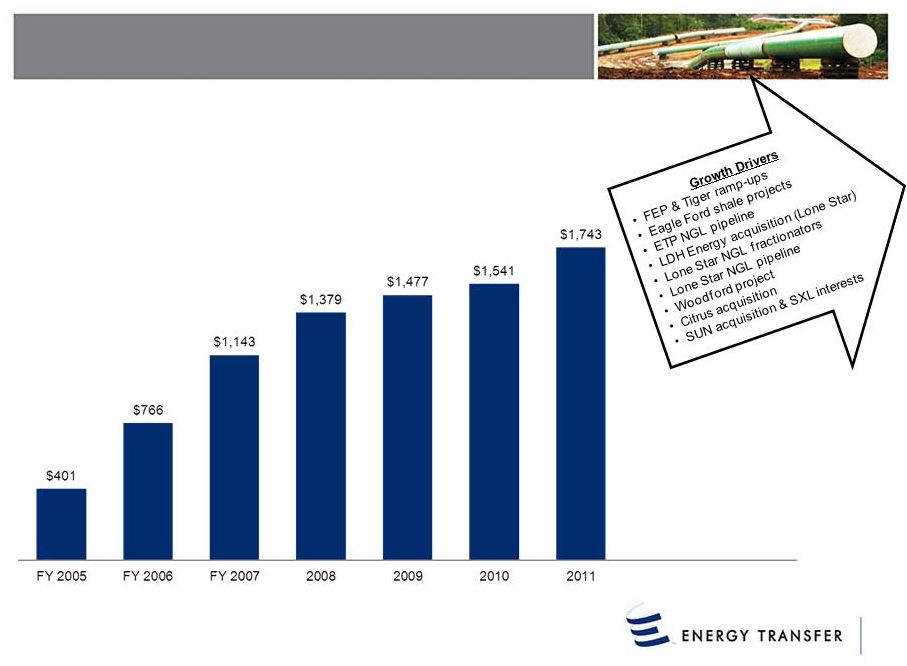 7 Adjusted EBITDA in $ millions. Since Q4 2010, ETP has announced more than $3.0 billion of organic growth projects and $8.6 billion of strategic acquisitions Adjusted EBITDA Expected to Grow |
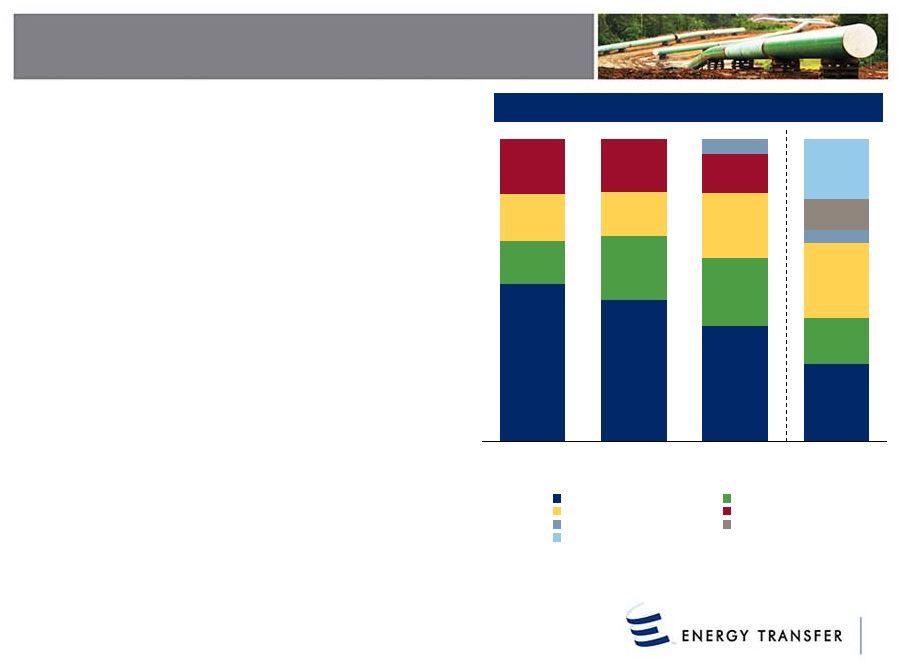 52% 47% 38% 26% 14% 21% 22% 15% 16% 14% 21% 25% 18% 18% 13% 5% 4% 10% 20% 2009 2010 2011 2011 pro forma Intrastate Midstream Interstate Propane NGL Retail Crude & Refined Products Increasingly Diversified Sources of Cash Flow (1) 2011 ETP pro forma for contribution of propane to AmeriGas Partners, L.P. and Citrus acquisition. Excludes distributions from AmeriGas Partners, L.P. Consolidation of SXL assumed. • SUN acquisition will increase ETP’s fee-based services provided to producers while balancing its sources of cash flows • Inventory of attractive NGL and crude oil projects at SXL augments ETP’s growth projects and provides visibility to meaningful EBITDA growth – Pro forma combined 2012 growth capex of ~$2.2 billion with the vast majority allocated to NGLs, midstream and crude oil projects • Retail business provides an additional stable segment to ETP's overall business mix (1) 8 ETP Adjusted EBITDA |
 9 Robust Portfolio of Growth Projects Project Description Capacity Expected Completion Estimated Cost ($ mm) Midstream Dos Hermanas Pipeline 50-mile, 24-inch pipeline originating in northwest Webb County and extending to ETP's existing Houston Pipeline rich gas gathering system in eastern Webb County 400 MMcf/d In-service Q4 2010 $43 Chisholm Pipeline 83 mile, 20-inch pipeline extending from DeWitt County to ETP's La Grange Processing Plant in Fayette County 100 MMcf/d, expandable to 300 MMcf/d In-service Q2 2011 $68 REM Phase I 160-mile, 30-inch pipeline originating in Dimmitt County and extending to the Chisholm Pipeline for ultimate delivery to ETP’s processing plants 400 MMcf/d, expandable to 800 MMcf/d In-service Q4 2011 $230 Chisholm Plant Natural gas processing plant located adjacent to ETP's existing La Grange Plant in Fayette County 120 MMcf/d Q1 2012 $70 REM Phase II 70 mile, 42-inch pipeline expansion, which will extend from the Chisholm Pipeline in DeWitt County east into Jackson County 800 MMcf/d Q4 2012 $170 400 MMcf/d, Phase I Q1 2013 $400 200 MMcf/d, Phase II Q1 2014 200 MMcf/d, Phase III Q1 2014 Red River Gathering Pipeline & Godley 117-mile, 24- and 30-inch pipeline from Carter County, Oklahoma to ETP's Godley Plant in Johnson County, Texas 450 MMcf/d, expandable to 550 MMcf/d Q4 2012 $360 Godley Plant Expansion Cryogenic processing plant to be constructed at the Godley processing facility in Johnson County, Texas 200 MMcf/d Q3 2013 Karnes County Processing Plant Natural gas processing plant located in Karnes County 200 MMcf/d Q4 2012 $210 REM Expansion 37 miles, 30-inch pipeline expansion - Q4 2013 Sub-total $1,551 NGL (ETP) Freedom Pipeline 43-mile, 8-inch NGL pipeline connecting the Liberty pipeline to ETP's La Grange & Chisholm plants 40 Mbpd In-service Q3 2011 $30 Liberty Pipeline 93-mile, 12-inch NGL pipeline owned through a 50/50 JV with Copano. Connects the Freedom pipeline to the Formosa plant 90 Mbpd In-service Q3 2011 $26 Justice Pipeline 130-mile, 20-inch NGL pipeline from the Jackson Plant to Mont Belvieu 340 Mpbd Q3 2012 $300 Sub-total $356 NGL (70% interest in Lone Star) West Texas Gateway 570-mile NGL pipeline originating in Winkler County and terminating in Jackson County 200 Mbpd Q1 2013 $642 Frac I Mont Belvieu NGL fractionator 100 Mbpd Q1 2013 $273 Frac II Mont Belvieu NGL fractionator 100 Mbpd Q1 2014 $245 Sub-total $1,160 Total announced ETP growth projects since Q4 2010 (including 70% of Lone Star) $3,067 Jackson Plant Natural gas processing plant located in Jackson County |
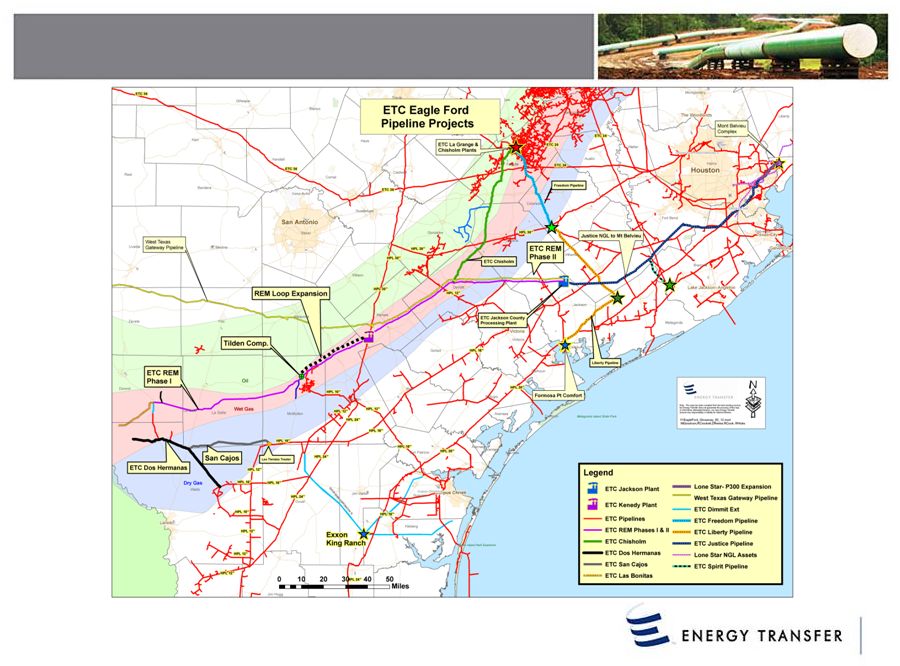 Eagle Ford Shale Projects 10 |
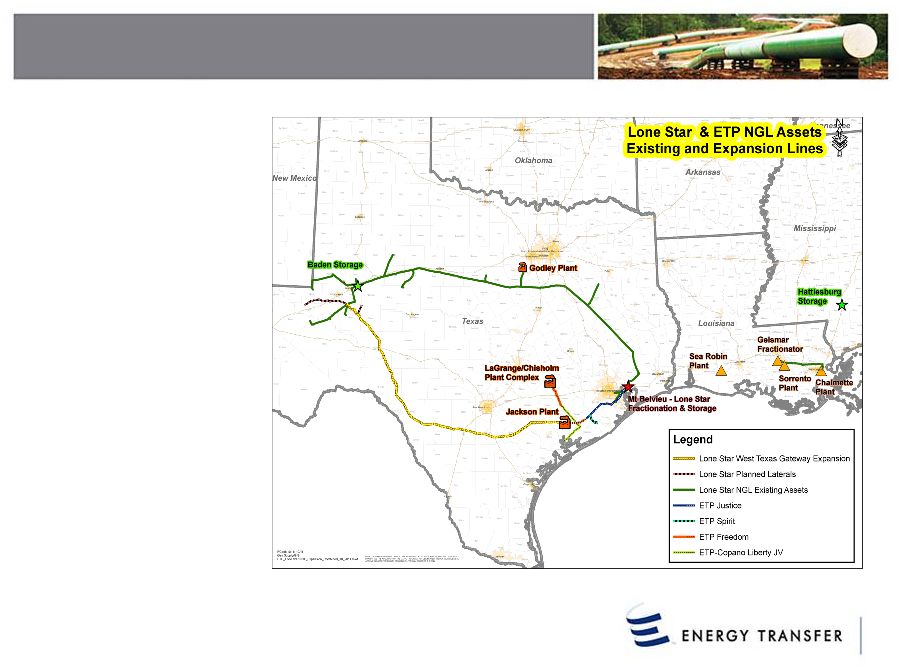
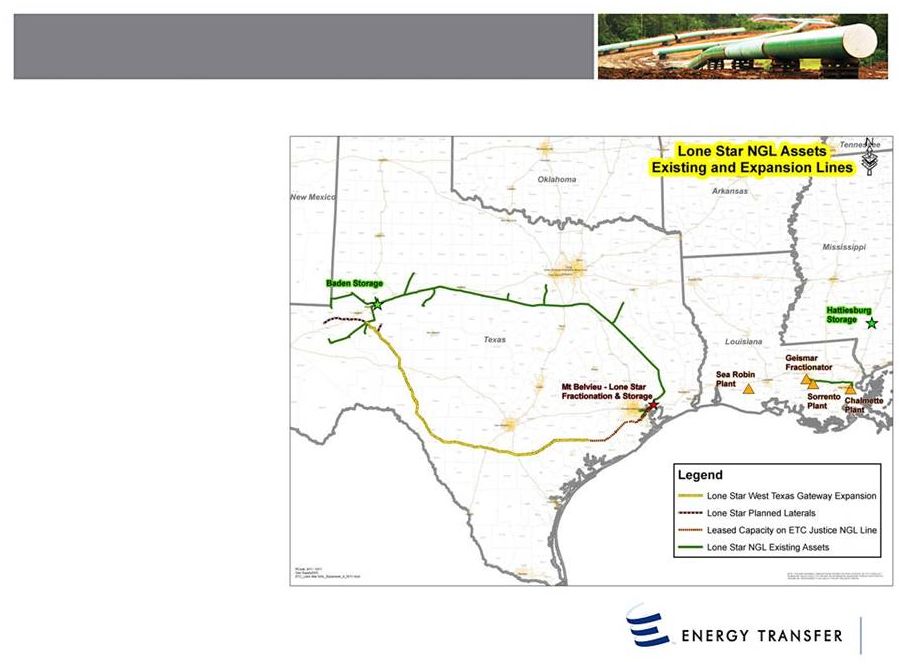 11 West Texas Gateway Project (NGL) Pipeline Lone Star Projects (70% ETP) • Approximately 570 miles of 16-inch pipe with an initial capacity of 200,000 Bbl/d • Originating in Winkler County and terminating in Jackson County, Texas • Lone Star has secured capacity through ETP’s Justice NGL pipeline from Jackson County to Mont Belvieu • Expected in-service Q1 2013 Mont Belvieu Fractionator I & II • • Two 100,000 Bbl/d NGL fractionators to be constructed at Mont Belvieu A substantial amount of the fractionation capacity will be utilized for NGLs from ETP’s Justice Pipeline • Expected in-service: Frac I - Q1 2013 Frac II - Q1 2014 |
 Freedom Pipeline NGL Pipeline Projects (100% ETP) 12 • 43 mile 8-inch NGL pipeline • 40,000 Bbl/d design capacity • In-service September 2011 Liberty Pipeline • 93 mile 12-inch NGL pipeline • 90,000 Bbl/d design capacity • 50/50 JV with Copano • In-service September 2011 Justice Pipeline • 130 mile 20-inch NGL pipeline • 340,000 Bbl/d design capacity • Expected in-service Q3 2012 |
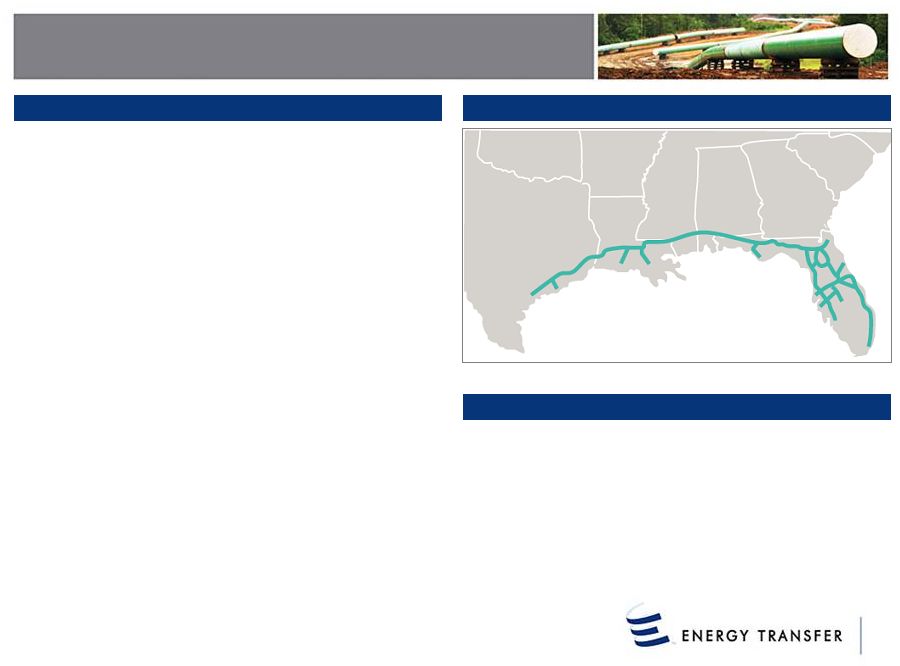 Citrus Overview (50% ETP) 13 Florida Gas Transmission System Map • Florida Gas Transmission (“FGT”) is 100% owned by Citrus Corp. (“Citrus”), – Owned 50% by ETP and 50% by El Paso Corp., which was recently acquired by Kinder Morgan, Inc. – Approximately 5,400 miles of pipe and mainline system capacity of 3.1 Bcf/d – Delivered ~63% of the natural gas consumed in Florida in 2010 – Largely demand driven with 30,000+ MW of gas-fired generation connected to FGT – Over 240 delivery points and 50 interconnects with interstate and intrastate pipelines – Gulfstream is currently the only competitor for gas supply into Florida, with 1.26 Bcf/d capacity • 2011 revenue and EBITDA were $694 million and $531 million, respectively FGT Phase VIII Expansion • Phase VIII, an 820,000 MMBtu/d expansion from Mississippi to South / Central Florida, was placed in service on April 1, 2011 with a total project cost of $2.5 billion • Expansion capacity is currently 78% contracted on a firm basis for a tenure of up to 25 years Overview |
 14 Managed Commodity Exposure • Intrastate Segment – We manage our open transportation capacity (approximately 1.0 Bcf/d) between points across Texas through the use of buy/sale transactions and commodity derivatives – 100% of net retained fuel volumes (approximately 60 MMcf/d) hedged at an average price of $3.78/MMBtu in 2012 and $3.72/MMBtu in 2013 – As of March 31st, we had 54 Bcf in the ground managed for our own account that we now expect to withdraw in late 2012 / early 2013 at average spreads of $0.95/MMBtu. • Midstream Segment – Approximately 16,700 Bbl/d of equity NGL volumes • Interstate Segment – Nearly all revenues are demand charges – Minimal direct exposure to natural gas prices • NGL Segment – Nearly all gross margin is fee-based – Lone Star (of which we own 70%) has approximately 3,500 Bbl/d equity NGL volumes |
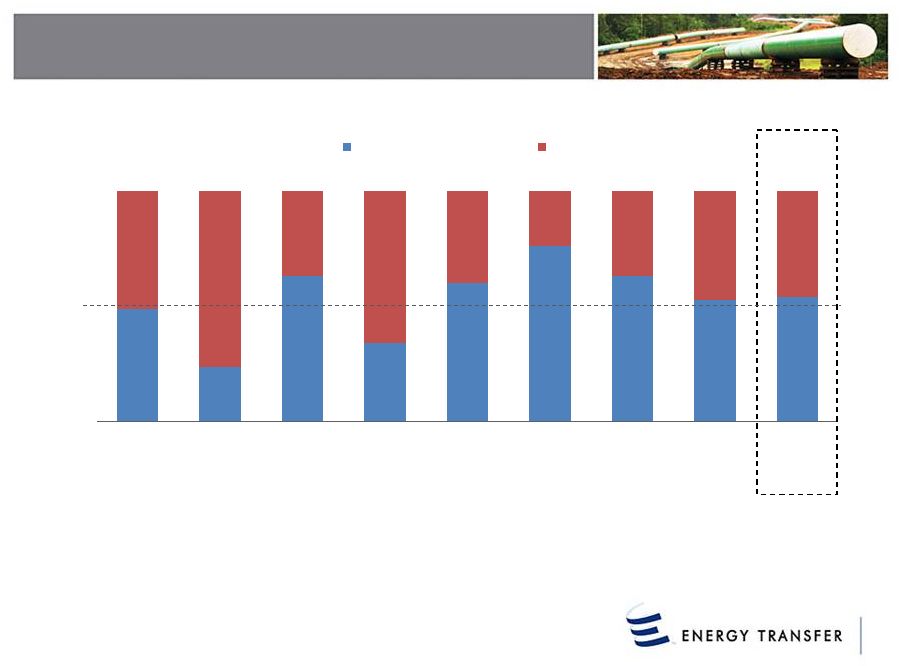 15 Balanced Approach To Funding Growth 49% 24% 63% 34% 60% 76% 63% 53% 54% 51% 76% 37% 66% 40% 24% 37% 47% 46% FY 2005 FY 2006 16 Mo. Ended 12/31/07 2008 2009 2010 2011 2012E Cumulative Equity + Excess Cash Flow Debt Total Capital Deployed ¹ ($ mm): $1,292 $1,204 $3,062 $1,896 $1,328 $834 $3,428 $18,511 2 3 $5,468 1 2 3 ETP changed from a fiscal year end of August 31 to a calendar year end at the end of 2007. st Excludes capital contributions to joint ventures other than Lone Star. Includes cash paid for acquisitions and proceeds from the sale of assets. Equity includes net proceeds from issuance of common units plus capital contributions from general partner, capital contributions from non-controlling interest, and common units issued in connection with acquisitions. Excess Cash Flow includes net cash provided by operating activities less maintenance capital expenditures and distributions paid plus proceeds from sale of assets and discontinued operations. |
 16 Debt Capitalization ($ million) 3/31/2012 12/31/2011 Revolving Credit Facility ($2,500) 190 $ 314 $ Senior Notes: 5.65% due 2012 108 400 6.00% due 2013 350 350 8.50% due 2014 292 350 5.95% due 2015 750 750 6.13% due 2017 400 400 6.70% due 2018 600 600 9.70% due 2019 400 600 9.00% due 2019 450 650 4.65% due 2021 800 800 5.20% due 2022 1,000 - 6.63% due 2036 400 400 7.50% due 2038 550 550 6.05% due 2041 700 700 6.50% due 2042 1,000 - Total Senior Notes 7,800 6,550 Other Long-Term Debt: Transwestern Senior Notes 870 870 Other 1 82 Total Other Long-Term Debt 871 952 Total Debt 8,861 $ 7,816 $ |
 17 Ratings Summary Moody's S&P Fitch Rating Outlook Rating Outlook Rating Outlook ETP Senior Unsecured Baa3 Negative BBB- Stable BBB- Negative SUN Senior Unsecured Ba2 Developing BB+ CW Positive BB+ Stable SXL Senior Unsecured Baa2 Review Down BBB Negative BBB Stable |
 18 • ETP is one of the largest publicly traded MLPs with an equity market capitalization of approximately $9.8 billion¹ and an enterprise value of $18.5 billion 1,2 • Owns and operates more than 23,500 miles of intrastate and interstate pipelines and 1,500 miles of NGL pipeline • Connects prolific natural gas producing areas with multiple end markets Key Considerations Large Diversified Asset Base Strong Balance Sheet Stable Asset Base & Cash Flow Profile Well Managed Growth Profile • Committed to maintaining a strong balance sheet and investment credit grade metrics • Track record of maintaining a strong liquidity position • Proven ability to raise equity including more than $3.5 billion in net proceeds from equity offerings over the past three years • Significant fee-based operating income and long-lived assets • High-quality customer base with strong credit profile • Hedge positions provide for further cash flow stability in commodity price sensitive areas • Low-risk, high-return projects supported by long-term customer contracts • Demonstrated ability to construct and place into service pipelines on-time / on-budget • Balanced approach to funding 1 As of June 1, 2012. Excludes the value of incentive distribution rights (IDRs) held by ETE. 2 Includes net debt as of March 31, 2012 |
 19 Adjusted EBITDA Reconciliation (ETP) Years Ended December 31, ($ millions) 2008 2009 2010 2011 Net income 866.0 $ 791.5 $ 617.2 $ 697.2 $ Interest expense, net of interest capitalized 265.7 394.3 412.6 474.1 Income tax expense 6.7 12.8 15.5 18.8 Depreciation and amortization 262.2 312.8 343.0 430.9 Non-cash compensation expense 23.5 24.0 27.2 37.5 (Gains) losses on disposals of assets 1.3 1.6 5.0 3.2 Gains on non-hedged interest rate derivatives 51.0 (39.2) (4.6) 77.4 Unrealized (gains) losses on commodity risk management activities (35.5) (30.0) 78.3 11.4 Goodwill impairment loss 11.4 - - - Impairment of investment in affiliate - - 52.6 5.4 Proportionate share of unconsolidated affiliates' interest, depreciation and allowance for equity funds used during construction - 22.3 22.5 30.0 Adjusted EBITDA attributable to non-controlling interest - - - (37.8) Other, net (includes allowance for equity funds used during construction) (73.3) (12.7) (28.5) (5.4) Adjusted EBITDA 1,378.9 $ 1,477.4 $ 1,540.9 $ 1,742.6 $ Adjusted EBITDA is a non-GAAP financial measure. Management believes Adjusted EBITDA provides useful information to investors as measure of comparison with peer companies, including companies that may have different financing and capital structures. The presentation of Adjusted EBITDA also allows investors to view our performance in a manner similar to the methods used by management and provides additional insight to our operating results. There are material limitations to using measures such as Adjusted EBITDA, including the difficulty associated with using it as the sole measure to compare the results of one company to another, and the inability to analyze certain significant items that directly affect a company’s net income or loss or cash flows. In addition, our calculation of Adjusted EBITDA may not be consistent with similarly titled measures of other companies and should be viewed in conjunction with measurements that are computed in accordance with GAAP, such as gross margin, operating income, net income, and cash flow from operating activities. Definition of Adjusted EBITDA ETP defines Adjusted EBITDA as total partnership earnings before interest, taxes, depreciation, amortization, and other non-cash items, such as non-cash compensation expense, gains and losses on disposals of assets, the allowance for equity funds used during construction, unrealized gains and losses on commodity risk management activities, non-cash impairment charges, and other non-operating income or expense items. Unrealized gains and losses on commodity risk management activities includes unrealized gains and losses on commodity derivatives and inventory fair value adjustments (excluding lower of cost or market adjustments). |