UNITED STATES
SECURITIES AND EXCHANGE COMMISSION
Washington, D.C. 20549
FORM N-CSR
CERTIFIED SHAREHOLDER REPORT OF REGISTERED
MANAGEMENT INVESTMENT COMPANIES
Investment Company Act File Number: 811-07605
| T. Rowe Price Mid-Cap Value Fund, Inc. |
|
| (Exact name of registrant as specified in charter) |
| |
| 100 East Pratt Street, Baltimore, MD 21202 |
|
| (Address of principal executive offices) |
| |
| David Oestreicher |
| 100 East Pratt Street, Baltimore, MD 21202 |
|
| (Name and address of agent for service) |
Registrant’s telephone number, including area code: (410) 345-2000
Date of fiscal year end: December 31
Date of reporting period: December 31, 2011
Item 1. Report to Shareholders
| Mid-Cap Value Fund | December 31, 2011 |
The views and opinions in this report were current as of December 31, 2011. They are not guarantees of performance or investment results and should not be taken as investment advice. Investment decisions reflect a variety of factors, and the managers reserve the right to change their views about individual stocks, sectors, and the markets at any time. As a result, the views expressed should not be relied upon as a forecast of the fund’s future investment intent. The report is certified under the Sarbanes-Oxley Act, which requires mutual funds and other public companies to affirm that, to the best of their knowledge, the information in their financial reports is fairly and accurately stated in all material respects.
REPORTS ON THE WEB
Sign up for our E-mail Program, and you can begin to receive updated fund reports and prospectuses online rather than through the mail. Log in to your account at troweprice.com for more information.
Manager’s Letter
Fellow Shareholders
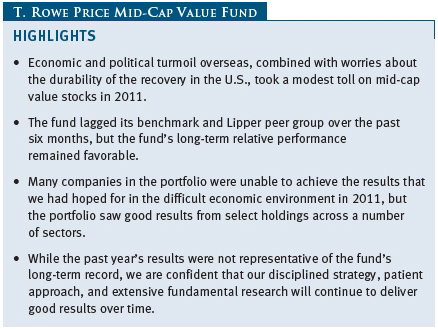
Stock markets wavered in the last half of 2011, as a deepening financial crisis in Europe and signs of a faltering recovery in the U.S. erased gains earlier in the year. Wrangling in Washington over the debt ceiling and unrest in the Middle East also drained investor confidence. By the end of the year, market prospects were brightening somewhat, as the U.S. economy appeared to be proving resilient in the face of Europe’s problems, and corporate profits remained strong. Still, our fund recorded a modest loss following two calendar years of very strong gains.
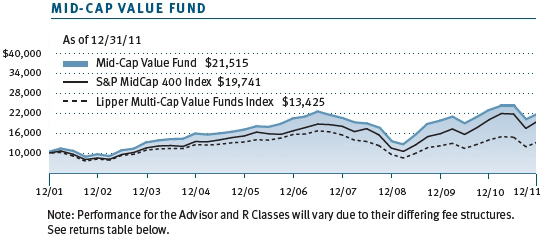
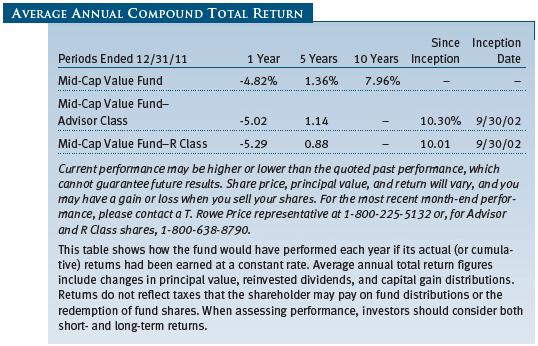
The Mid-Cap Value Fund returned -10.02% for the six months ended December 31, 2011, and -4.82% for the year. As shown in the Performance Comparison table, the fund lagged its benchmarks in both periods. Returns for the fund’s Advisor and R Class shares were slightly lower due to their different cost structures.

Despite lagging its benchmarks recently, the fund’s long-term performance remains favorable, in relative terms, as recognized by Morningstar’s overall four-star rating, as well as its rank among competitive funds as tracked by Lipper over longer time periods. The Mid-Cap Value Fund received an Overall Morningstar Rating™ of four stars for its risk-adjusted performance. This rating is derived from a weighted average of the performance figures associated with a fund’s 3-, 5-, and 10-year (if applicable) Morningstar Rating™ metrics. The fund was rated among 354, 354, 307, and 145 mid-cap value funds for the overall rating and the 3-, 5-, and 10-year periods ended December 31, 2011, respectively. (Please refer to page 9 for additional information about Morningstar ratings.) Based on cumulative total return, Lipper ranked the Mid-Cap Value Fund 191 of 309, 38 of 263, 17 of 219, and 11 of 114 multi-cap value funds for the 1-, 3-, 5-, and 10-year periods ended December 31, 2011, respectively. Results will vary for other periods. Past performance cannot guarantee future results.
MARKET ENVIRONMENT
U.S. investors kept much of their attention focused overseas in 2011. Early in the year, popular uprisings began in Tunisia and then spread to Egypt, Libya, and other nations in North Africa and the Middle East, sparking a sharp rise in oil prices. In March, the earthquake and tsunami in Japan, followed by the threat of a nuclear catastrophe at a disabled plant north of Tokyo, also unsettled markets. The European debt crisis appeared to intensify throughout the year, and U.S. stocks fluctuated wildly in response to setbacks or progress in attempts to prop up heavily indebted governments and protect the European banking system. By the end of the year, it appeared that at least some European countries had slipped back into recession.
For much of the year, it appeared a distinct possibility that the fragile and slow U.S. economic recovery might be undermined as well. Most economic indicators weakened in the late spring. High oil prices resulting from the previously mentioned turmoil were partly to blame, as were disruptions to global supply chains from the disaster in Japan. Payroll growth slowed sharply and nearly ground to a halt in the early summer, although stable jobless claims provided hope that the labor market was not on the verge of collapsing as it had in late 2008. New home construction fell to its slowest annual pace on record, even as home prices showed some signs of bottoming. Not surprisingly, consumer confidence indexes remained at very low levels, and a showdown over raising the federal debt limit, followed by a downgrade of the U.S. government’s long-term credit rating, further weighed on Americans’ mood.
Even as many braced for a double-dip recession, however, the U.S. economy appeared to gather a second wind as the year came to a close. While hiring remained generally subdued, unemployment fell, and weekly jobless claims reached their lowest level in nearly two years. The manufacturing and service sectors picked up speed again after showing signs of losing momentum in the summer. Consumer sentiment bounced back, and a good start to the holiday shopping season augured well for increased consumer spending. New housing construction began rebounding, with the strongest gains coming in the multifamily rental sector—an indication of the troubles many Americans still faced in obtaining a mortgage. Nevertheless, existing home sales reached their highest level in nearly two years, raising hopes that 2012 might finally see a sustained turnaround in the housing market.

Mid-cap value stocks declined somewhat less than their growth counter-parts during the past six months and fared slightly better over the year as a whole. Mid-cap value stocks fared significantly better than small-cap value stocks but lagged larger shares. Large-cap growth stocks performed best of all in the year, as reflected in the modest positive return of the S&P 500 Index.
PORTFOLIO AND STRATEGY REVIEW
As our longtime investors are aware, our value approach generally focuses on good companies whose shares may have fallen out of favor due to problems, either real or perceived, that we deem to be solvable and shorter term in nature. We use the analytical firepower and broad capabilities of T. Rowe Price’s investment staff to study and understand industry and company fundamentals and to assess risk. We seek to measure the upside potential of any investment idea and, at the same time, understand the risk our investors will bear in an adverse scenario. Our emphasis is on businesses with an established franchise, strong market position, seasoned management team, healthy financial position, room for improved financial performance, and assets that are not being appropriately valued by the market. We are intensely focused on identifying stocks that are trading below their intrinsic value. We are patient investors, as we are willing to endure a period of frustration before a company’s strengths are realized in its stock price. This approach has served our investors well over the past 15 years.
Unfortunately, the year was not a period in which patience was in ample supply—or much rewarded. With many investors worried that another global financial crisis was just around the corner, companies that did not meet earnings expectations or suffered other setbacks were quickly punished. Several of our holdings—particularly in the financials, industrials, and energy sectors—experienced meaningful price declines. Some were within the bounds of what we might expect given the risks we had identified, but some were due to changes in the fundamental outlook that we had not anticipated. Importantly, however, in the majority of the cases, we do not believe there has been erosion in the long-term value of the business, and consistent with our approach, we added to many of these positions. We would have been pleased with better overall performance from the fund, but we are convinced we are on the right path with the approach that has served us well for over a decade.
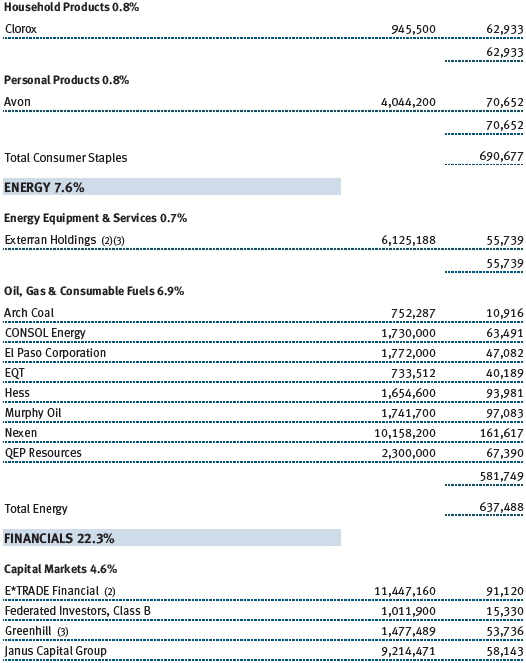
Holdings in the capital markets sector included some our largest detractors as weaker conditions in the equity markets and strains in the fixed income markets affected this sector. Greenhill, an independent investment bank focused on providing financial advice on mergers, acquisitions, and restructurings, saw its earnings hampered by costs associated with its expansion of its investment banking franchise, which caused recent earnings to fall below analyst expectations. The firm’s new hires should generate good returns as investment banking activity grows more robust. Importantly, many of Greenhill’s competitors, particularly the large firms that offer lending and underwriting as well as advisory services, are scaling back and withdrawing capacity from the investment banking industry. As demand recovers and as corporations continue the trend toward seeking unbiased advice, Greenhill should be well poised to benefit. Meanwhile, the company’s recent repurchases of its own shares reflect the good value inherent in its shares. Asset manager Janus Capital Group is also undergoing a transition. Under new management, it has evolved from a pure “growth investing” firm to a more diversified manager of value-oriented, international, and quantitative funds. However, the company is still stabilizing its traditional franchise, which is focused on growth stock investing, a style that generally has underperformed the markets in the past several years. The difficult economic environment was no help to Janus during the year, and its financial results came under pressure. Though the performance of its stock was disappointing, we think that the franchise is intact and that the stock trades below its intrinsic value. Its strong balance sheet offers it financial flexibility, its funds boast a strong five-year record, and it is levered to an eventual recovery in growth stock investing. Finally, E*TRADE Financial, which provides online brokerage and related products and services to individual retail investors, experienced headwinds as investors expressed disappointment in the firm’s announcement that it would remain independent following a strategic review. In addition, low interest rates diminished its earnings from customer deposits. E*TRADE has come a long way in the past three years, having dramatically shrunk its higher-risk loan portfolio, hired new management, reduced its financial leverage, grown customer accounts, and improved its brand recognition though advertising. We believe this stock trades at a substantial premium to the value of this franchise and have added to our position. (Please refer to the fund’s portfolio of investments for a complete list of holdings and the amount each represents in the portfolio.)
Several industrial holdings in the portfolio had tough years as the global economy wavered and domestic growth remained sluggish. Like most of its competitors, Southwest Airlines struggled in 2011 from volatile fuel prices, soft demand, and a modest increase in industry capacity early in the year that crimped pricing power. We have confidence that recent reductions in supply, the contribution from Southwest’s recent acquisition of Airtran Holdings, a series of revenue initiatives, and prudent use of its ample financial resources will prove favorable for this low-cost airline, and the stock remains a large holding of the fund. ManpowerGroup is the third-largest global temporary staffing and recruiting company. As the firm generates over half of its revenue from Europe, the eurozone debt crisis had a significant impact on its profitability outlook and share price. However, Manpower has invested astutely in growing its brand outside its traditional markets in the U.S. and Europe, it is a key beneficiary of the long-term trend toward temporary staffing, its financial position is strong, and its long-term profitability prospects are excellent. Its shares are trading at attractive valuation relative to its earnings potential, and we have confidence in the firm’s long-term prospects.
The fund’s energy holdings were generally weak over the past six months, partially in response to a slowing global economy. Nexen, an independent, Canada-based global energy company, experienced its share of bad luck, but some of its problems were self-inflicted. The ongoing civil war in Yemen affected its operations there, and a moratorium on Gulf of Mexico drilling slowed progress on its high-impact well exploration program. The firm continued to struggle on its Long Lake oil sands project, which continued to operate below its design rate, and execution problems at its key North Sea offshore production platform impaired its earnings. This company boasts a unique collection of oil and assets in the North Sea, Nigeria, the Gulf of Mexico, and Canada, which are significantly undervalued by the market, in our view. At the beginning of 2012, Nexen announced a change of management, and we believe the company is committed to taking the steps necessary to unlock the inherent value in its shares. Exterran Holdings is the market leader in natural gas compression, a service necessary as gas fields age and require additional pressure to maintain production levels. Its shares underperformed as gas production from traditional fields in the U.S., which require higher compression, was replaced by new production for gas-bearing shale formations, where compression needs are low in the well’s initial production stages. Exterran has undergone a significant restructuring over the past year, which has included sales of assets, a reduction in debt, and a recent management change, which should augur well for future results. In addition, it is a natural beneficiary as production of newer shale gas wells matures and as the use of natural gas continues to expand in this country.
Nervous investors were drawn to the utilities sector, a traditionally defensive sector that benefits from more predictable revenues, in the second half of 2011. Overall, we saw good results from our utilities holdings. FirstEnergy benefited from tight cost controls and improved profits from its acquisition of Allegheny Energy earlier in the year. Constellation Energy rose as investors grew more confident that it would overcome regulatory obstacles to close its acquisition by Exelon Corporation. NiSource, a longstanding holding with operations in electric and gas transmission and distribution, gained traction from a host of initiatives that management has put in place over the year on the financial, regulatory, and operational front, as well as from its presence in the burgeoning new Utica natural gas field in eastern Ohio. Some of the fund’s independent power producers, such as GenOn Energy, on the other hand, performed poorly as a long-awaited turn in the merchant power cycle was slow to materialize. We think GenOn has the staying power to be a good contributor, and we are encouraged by the recently announced closures of competing coal-fired generating plants in its operating area.
Our health care holdings had mixed results in 2011 as the sector faltered somewhat under the uncertainty associated with budget pressures and the outlook for Medicare and Medicaid funding. Kindred Healthcare, which operates nursing homes and other post-acute care facilities, saw its shares decline on the news of steep reimbursement cuts proposed by the government. Though such cuts would affect Kindred’s profitability, the company should benefit from recent acquisitions and market share gains as the industry rationalizes. Kindred’s executives are well versed in dealing with regulatory uncertainty and cost pressures, and we think it will manage well through this period. The fund saw good performance from two health care companies that were subject to takeovers: biotechnology company Cephalon, which was bought by Israel’s Teva Pharmaceuticals, and medical instrument maker Beckman Coulter, which was acquired by Danaher Corporation. We would not be surprised to see more merger and acquisition activity in the sector as managements take steps to offset the impact of reimbursement pressures.
Our information technology holdings provided an overall boost to results. As the use of mobile phones has exploded over the past decade and devices have become more sophisticated, the value of the intellectual property associated with such technology has risen dramatically. As a result of its long history of innovative research and engineering, Motorola Mobility has accumulated 17,000 patents, which are worth many billions of dollars. Its shares had been depressed by a still struggling handset division and heavy research spending, which hid the value of its intellectual property. As a result of its own relative dearth of patents and in order to help protect the expansion of Android from litigation pressures, Google announced in August that it planned to acquire the firm at a significant premium.
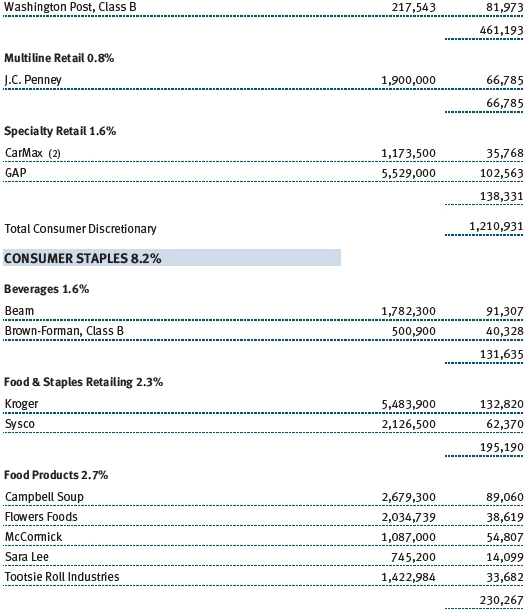
Even as consumers continued to struggle with housing losses and the poor job market, several consumer discretionary holdings performed very well for the fund. Our top contributor over the past year was Weight Watchers, which the fund has owned since 2005. This well-established franchise company has capably managed through a series of challenges over the years, such as competing diet plans and overall consumer weakness, yet still compounded its earnings at an impressive rate and built value for its owners. In the past year, investors took notice of recent operational improvements and became increasingly aware of Weight Watchers’ potential as a low-cost, mass-market solution for weight loss and lowering the overall cost of health care. A notable consumer-oriented laggard in the fund was Career Education, a for-profit education firm that offers education to a diverse student population in a variety of career-oriented disciplines. The entire for-profit education industry has been under intense scrutiny by legislators over claims that their service does not lead to employment opportunities commensurate with the cost incurred. Shares of the firm were hit particularly hard, however, on news that the CEO would be leaving amid regulatory compliance errors. We try to avoid surprises and understand in advance the risks associated with every company in which we invest, but this news caught us off guard, and we chose to reduce our position after the announcement.
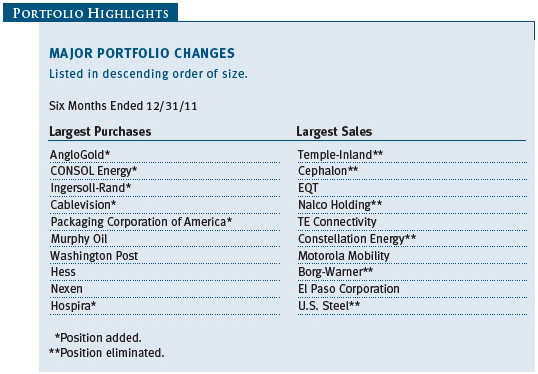
As mentioned in previous letters, if we do our work effectively and identify good franchises that are trading below their inherent value, the fund, over time, ought to benefit from mergers and takeovers as corporate buyers recognize the opportunity. 2011 was a good year in this light, with the aforementioned takeovers of Cephalon, Motorola Mobility, Beckman Coulter, and others. One area where our patience particularly paid off was in the materials sector. Here, the fund harvested profits in several longtime, larger holdings as a result of their acquisition by larger firms. Water chemical manufacturer Nalco Holding, a seven-year holding for the fund, was acquired by Ecolab, a diversified service company. Temple-Inland, a manufacturer of corrugated packaging and building products, announced during the third quarter that it had agreed to an unsolicited proposal from International Paper to acquire the firm at a substantial premium. Our mining holdings’ results were somewhat less favorable, as AngloGold, one of the world’s largest gold producers, lagged on weakness in bullion prices. This company’s appeal lies is its geographically diverse portfolio, its strong balance sheet, attractive exploration portfolio, and a valuation that does not reflect the sum of its parts.
IN CLOSING
Our strategy does not always produce the results we would like to see in any given year, and we wish the last were more representative of the fund’s long-term record. But we have faith in our strategy, and it has worked well for our investors in the past. As usual, we do not claim to have any special foresight in how the world’s economic crosscurrents will play out in terms of overall economic growth or market performance in the coming year. However, with the intellectual resources of T. Rowe Price’s extensive team of industry analysts, an intent focus on buying good companies at attractive prices, and the patience to allow the market to recognize that value, we are confident that our investment approach will continue to deliver good results over time.
We appreciate your investment and look forward to reporting to you again in six months.

David J. Wallack
President of the fund and chairman of its Investment Advisory Committee

Heather M. McPherson
Executive vice president of the fund
January 25, 2012
The committee chairman has day-to-day responsibility for managing the portfolio and works with committee members in developing and executing the fund’s investment program.
IMPORTANT INFORMATION ABOUT MORNINGSTAR RATINGS
For funds with at least a 3-year history, a Morningstar Rating™ is based on a risk-adjusted return measure (including the effects of sales charges, loads, and redemption fees) with emphasis on downward variations and consistent performance. The top 10% of funds in each category receive 5 stars, the next 22.5% 4 stars, the next 35% 3 stars, the next 22.5% 2 stars, and the bottom 10% 1 star. Each share class is counted as a fraction of 1 fund within this scale and rated separately. The Morningstar Rating™ is for the retail share class only; other classes may have different performance characteristics. The fund received 4 stars for the 3-, 5-, and 10-year periods as of December 31, 2011.
©2012 Morningstar, Inc. All Rights Reserved. The information contained herein: (1) is proprietary to Morningstar and/or its content providers; (2) may not be copied or distributed; and (3) is not warranted to be accurate, complete, or timely. Neither Morningstar nor its content providers are responsible for any damages or losses arising from any use of this information.
RISKS OF INVESTING
The fund’s share price can fall because of weakness in the stock or bond markets, a particular industry, or specific holdings. Stock markets can decline for many reasons, including adverse political or economic developments, changes in investor psychology, or heavy institutional selling. The prospects for an industry or company may deteriorate because of a variety of factors, including disappointing earnings or changes in the competitive environment. In addition, the investment manager’s assessment of companies held in a fund may prove incorrect, resulting in losses or poor performance even in rising markets.
Mid-caps typically offer greater return potential than larger established firms and involve less risk than small-caps. Value investors seek to invest in companies whose stock prices are low in relation to their real worth or future prospects. By identifying companies whose stocks are currently out of favor or misunderstood, value investors hope to realize significant appreciation as other investors recognize the stock’s intrinsic value and the price rises accordingly. The value approach carries the risk that the market will not recognize a security’s intrinsic value for a long time or that a stock judged to be undervalued may actually be appropriately priced.
GLOSSARY
Lipper indexes: Fund benchmarks that consist of a small number of the largest mutual funds in a particular category as tracked by Lipper Inc.
Russell 1000 Index: An index that tracks the performance of the 1,000 largest companies in the Russell 3000 Index.
Russell 2000 Index: An unmanaged index that tracks the stocks of 2,000 small U.S. companies.
Russell Midcap Growth Index: An index that tracks the performance of mid-cap stocks with higher price-to-book ratios and higher forecast growth values.
Russell Midcap Value Index: An index that tracks the performance of mid-cap stocks with lower price-to-book ratios and lower forecast growth values.
S&P MidCap 400 Index: An unmanaged index that tracks the stocks of 400 U.S. mid-size companies.
Performance and Expenses
This chart shows the value of a hypothetical $10,000 investment in the fund over the past 10 fiscal year periods or since inception (for funds lacking 10-year records). The result is compared with benchmarks, which may include a broad-based market index and a peer group average or index. Market indexes do not include expenses, which are deducted from fund returns as well as mutual fund averages and indexes.
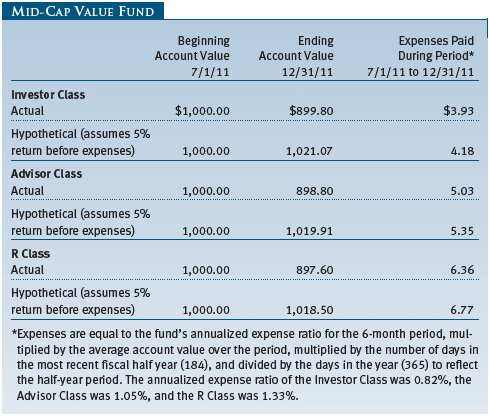
As a mutual fund shareholder, you may incur two types of costs: (1) transaction costs, such as redemption fees or sales loads, and (2) ongoing costs, including management fees, distribution and service (12b-1) fees, and other fund expenses. The following example is intended to help you understand your ongoing costs (in dollars) of investing in the fund and to compare these costs with the ongoing costs of investing in other mutual funds. The example is based on an investment of $1,000 invested at the beginning of the most recent six-month period and held for the entire period.
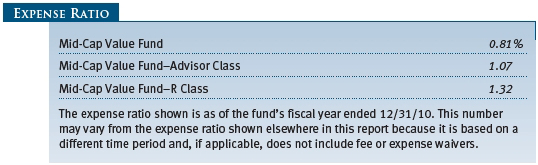
Please note that the fund has three share classes: The original share class (“Investor Class”) charges no distribution and service (12b-1) fee, Advisor Class shares are offered only through unaffiliated brokers and other financial intermediaries and charge a 0.25% 12b-1 fee, and R Class shares are available to retirement plans serviced by intermediaries and charge a 0.50% 12b-1 fee. Each share class is presented separately in the table.
Actual Expenses
The first line of the following table (“Actual”) provides information about actual account values and expenses based on the fund’s actual returns. You may use the information on this line, together with your account balance, to estimate the expenses that you paid over the period. Simply divide your account value by $1,000 (for example, an $8,600 account value divided by $1,000 = 8.6), then multiply the result by the number on the first line under the heading “Expenses Paid During Period” to estimate the expenses you paid on your account during this period.
Hypothetical Example for Comparison Purposes
The information on the second line of the table (“Hypothetical”) is based on hypothetical account values and expenses derived from the fund’s actual expense ratio and an assumed 5% per year rate of return before expenses (not the fund’s actual return). You may compare the ongoing costs of investing in the fund with other funds by contrasting this 5% hypothetical example and the 5% hypothetical examples that appear in the shareholder reports of the other funds. The hypothetical account values and expenses may not be used to estimate the actual ending account balance or expenses you paid for the period.
Note: T. Rowe Price charges an annual account service fee of $20, generally for accounts with less than $10,000 ($1,000 for UGMA/UTMA). The fee is waived for any investor whose T. Rowe Price mutual fund accounts total $50,000 or more; accounts employing automatic investing; accounts electing to receive electronic delivery of account statements, transaction confirmations, prospectuses, and shareholder reports; accounts of an investor who is a T. Rowe Price Preferred Services, Personal Services, or Enhanced Personal Services client (enrollment in these programs generally requires T. Rowe Price assets of at least $100,000); and IRAs and other retirement plan accounts that utilize a prototype plan sponsored by T. Rowe Price (although a separate custodial or administrative fee may apply to such accounts). This fee is not included in the accompanying table. If you are subject to the fee, keep it in mind when you are estimating the ongoing expenses of investing in the fund and when comparing the expenses of this fund with other funds.
You should also be aware that the expenses shown in the table highlight only your ongoing costs and do not reflect any transaction costs, such as redemption fees or sales loads. Therefore, the second line of the table is useful in comparing ongoing costs only and will not help you determine the relative total costs of owning different funds. To the extent a fund charges transaction costs, however, the total cost of owning that fund is higher.
The accompanying notes are an integral part of these financial statements.
The accompanying notes are an integral part of these financial statements.

The accompanying notes are an integral part of these financial statements.


The accompanying notes are an integral part of these financial statements.
The accompanying notes are an integral part of these financial statements.
The accompanying notes are an integral part of these financial statements.

The accompanying notes are an integral part of these financial statements.
| Notes to Financial Statements |
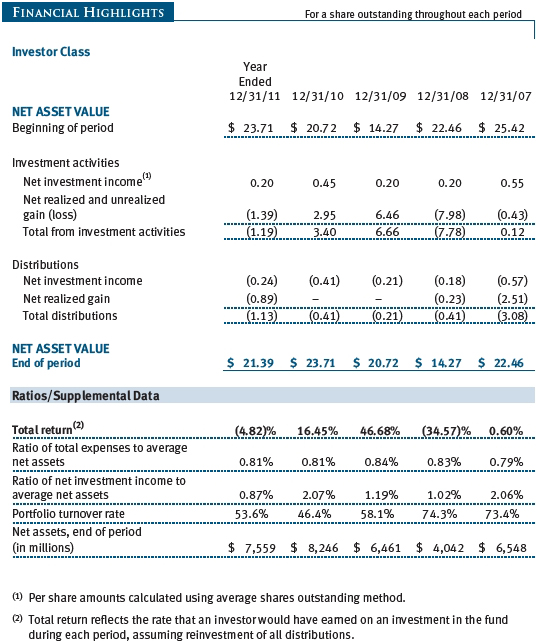
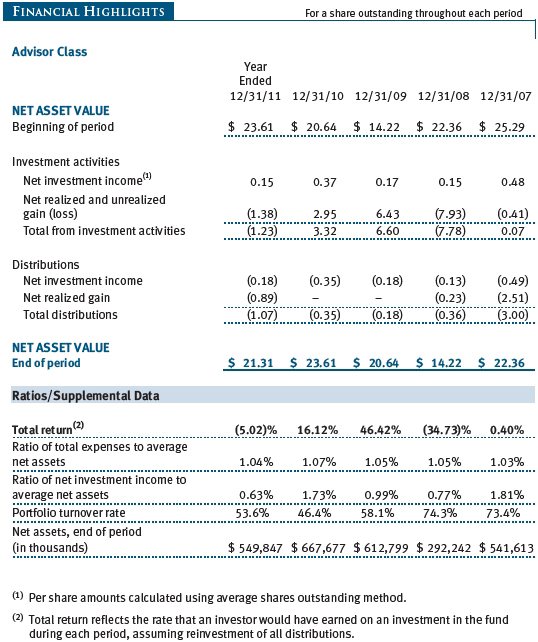
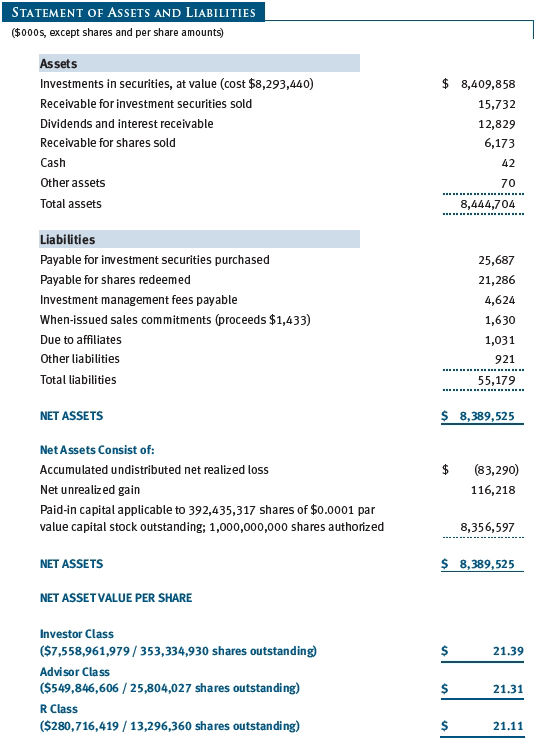
T. Rowe Price Mid-Cap Value Fund, Inc. (the fund), is registered under the Investment Company Act of 1940 (the 1940 Act) as a diversified, open-end management investment company. The fund seeks to provide long-term capital appreciation by investing primarily in mid-sized companies that appear to be undervalued. The fund has three classes of shares: the Mid-Cap Value Fund original share class, referred to in this report as the Investor Class, offered since June 28, 1996; the Mid-Cap Value Fund–Advisor Class (Advisor Class), offered since September 30, 2002; and the Mid-Cap Value Fund–R Class (R Class), offered since September 30, 2002. Advisor Class shares are sold only through unaffiliated brokers and other unaffiliated financial intermediaries, and R Class shares are available to retirement plans serviced by intermediaries. The Advisor Class and R Class each operate under separate Board-approved Rule 12b-1 plans, pursuant to which each class compensates financial intermediaries for distribution, shareholder servicing, and/or certain administrative services. Each class has exclusive voting rights on matters related solely to that class; separate voting rights on matters that relate to all classes; and, in all other respects, the same rights and obligations as the other classes.
NOTE 1 - SIGNIFICANT ACCOUNTING POLICIES
Basis of Preparation The accompanying financial statements were prepared in accordance with accounting principles generally accepted in the United States of America (GAAP), which require the use of estimates made by management. Management believes that estimates and valuations are appropriate; however, actual results may differ from those estimates, and the valuations reflected in the accompanying financial statements may differ from the value ultimately realized upon sale or maturity.
Investment Transactions, Investment Income, and Distributions Income and expenses are recorded on the accrual basis. Premiums and discounts on debt securities are amortized for financial reporting purposes. Dividends received from mutual fund investments are reflected as dividend income; capital gain distributions are reflected as realized gain/loss. Dividend income and capital gain distributions are recorded on the ex-dividend date. Income tax-related interest and penalties, if incurred, would be recorded as income tax expense. Investment transactions are accounted for on the trade date. Realized gains and losses are reported on the identified cost basis. Distributions to shareholders are recorded on the ex-dividend date. Income distributions are declared and paid by each class annually. Capital gain distributions, if any, are generally declared and paid by the fund annually.
Currency Translation Assets, including investments, and liabilities denominated in foreign currencies are translated into U.S. dollar values each day at the prevailing exchange rate, using the mean of the bid and asked prices of such currencies against U.S. dollars as quoted by a major bank. Purchases and sales of securities, income, and expenses are translated into U.S. dollars at the prevailing exchange rate on the date of the transaction. The effect of changes in foreign currency exchange rates on realized and unrealized security gains and losses is reflected as a component of security gains and losses.
Class Accounting The Advisor Class and R Class each pay distribution, shareholder servicing, and/or certain administrative expenses in the form of Rule 12b-1 fees, in an amount not exceeding 0.25% and 0.50%, respectively, of the class’s average daily net assets. Shareholder servicing, prospectus, and shareholder report expenses incurred by each class are charged directly to the class to which they relate. Expenses common to all classes, investment income, and realized and unrealized gains and losses are allocated to the classes based upon the relative daily net assets of each class.
Rebates and Credits Subject to best execution, the fund may direct certain security trades to brokers who have agreed to rebate a portion of the related brokerage commission to the fund in cash. Commission rebates are reflected as realized gain on securities in the accompanying financial statements and totaled $353,000 for the year ended December 31, 2011. Additionally, the fund earns credits on temporarily uninvested cash balances held at the custodian, which reduce the fund’s custody charges. Custody expense in the accompanying financial statements is presented before reduction for credits, which are reflected as expenses paid indirectly.
New Accounting Pronouncements In December 2011, the Financial Accounting Standards Board issued amended guidance to enhance disclosure for offsetting assets and liabilities. The guidance is effective for fiscal years and interim periods beginning on or after January 1, 2013; adoption will have no effect on the fund’s net assets or results of operations.
NOTE 2 - VALUATION
The fund’s financial instruments are reported at fair value as defined by GAAP. The fund determines the values of its assets and liabilities and computes each class’s net asset value per share at the close of the New York Stock Exchange (NYSE), normally 4 p.m. ET, each day that the NYSE is open for business. Values in the accompanying Portfolio of Investments are as of December 30, 2011, the last business day in the fund’s fiscal year ended December 31, 2011. Some foreign markets were open between December 30 and the close of the fund’s reporting period on December 31, but any differences in values and foreign exchange rates subsequent to December 30 through December 31 were immaterial to the fund’s financial statements.
Valuation Methods Equity securities listed or regularly traded on a securities exchange or in the over-the-counter (OTC) market are valued at the last quoted sale price or, for certain markets, the official closing price at the time the valuations are made, except for OTC Bulletin Board securities, which are valued at the mean of the latest bid and asked prices. A security that is listed or traded on more than one exchange is valued at the quotation on the exchange determined to be the primary market for such security. Listed securities not traded on a particular day are valued at the mean of the latest bid and asked prices for domestic securities and the last quoted sale price for international securities.
Debt securities are generally traded in the OTC market. Securities with remaining maturities of one year or more at the time of acquisition are valued at prices furnished by dealers who make markets in such securities or by an independent pricing service, which considers the yield or price of bonds of comparable quality, coupon, maturity, and type, as well as prices quoted by dealers who make markets in such securities. Securities with remaining maturities of less than one year at the time of acquisition generally use amortized cost in local currency to approximate fair value. However, if amortized cost is deemed not to reflect fair value or the fund holds a significant amount of such securities with remaining maturities of more than 60 days, the securities are valued at prices furnished by dealers who make markets in such securities or by an independent pricing service.
Investments in mutual funds are valued at the mutual fund’s closing net asset value per share on the day of valuation.
Other investments, including restricted securities and private placements, and those financial instruments for which the above valuation procedures are inappropriate or are deemed not to reflect fair value, are stated at fair value as determined in good faith by the T. Rowe Price Valuation Committee, established by the fund’s Board of Directors (the Board). Subject to oversight by the Board, the Valuation Committee develops pricing-related policies and procedures and approves all fair-value determinations. The Valuation Committee regularly makes good faith judgments, using a wide variety of sources and information, to establish and adjust valuations of certain securities as events occur and circumstances warrant. For instance, in determining the fair value of private-equity instruments, the Valuation Committee considers a variety of factors, including the company’s business prospects, its financial performance, strategic events impacting the company, relevant valuations of similar companies, new rounds of financing, and any negotiated transactions of significant size between other investors in the company. Because any fair-value determination involves a significant amount of judgment, there is a degree of subjectivity inherent in such pricing decisions.
For valuation purposes, the last quoted prices of non-U.S. equity securities may be adjusted under the circumstances described below. If the fund determines that developments between the close of a foreign market and the close of the NYSE will, in its judgment, materially affect the value of some or all of its portfolio securities, the fund will adjust the previous closing prices to reflect what it believes to be the fair value of the securities as of the close of the NYSE. In deciding whether it is necessary to adjust closing prices to reflect fair value, the fund reviews a variety of factors, including developments in foreign markets, the performance of U.S. securities markets, and the performance of instruments trading in U.S. markets that represent foreign securities and baskets of foreign securities. A fund may also fair value securities in other situations, such as when a particular foreign market is closed but the fund is open. The fund uses outside pricing services to provide it with closing prices and information to evaluate and/or adjust those prices. The fund cannot predict how often it will use closing prices and how often it will determine it necessary to adjust those prices to reflect fair value. As a means of evaluating its security valuation process, the fund routinely compares closing prices, the next day’s opening prices in the same markets, and adjusted prices. Additionally, trading in the underlying securities of the fund may take place in various foreign markets on certain days when the fund is not open for business and does not calculate a net asset value. As a result, net asset values may be significantly affected on days when shareholders cannot make transactions.
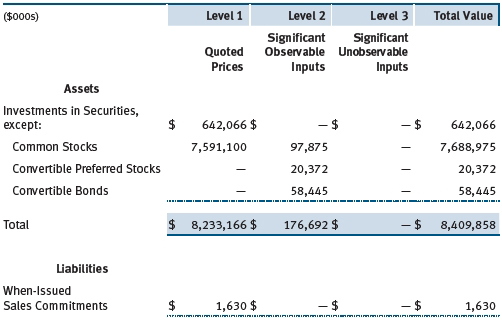
Valuation Inputs Various inputs are used to determine the value of the fund’s financial instruments. These inputs are summarized in the three broad levels listed below:
Level 1 – quoted prices in active markets for identical financial instruments
Level 2 – observable inputs other than Level 1 quoted prices (including, but not limited to, quoted prices for similar financial instruments, interest rates, prepayment speeds, and credit risk)
Level 3 – unobservable inputs
Observable inputs are those based on market data obtained from sources independent of the fund, and unobservable inputs reflect the fund’s own assumptions based on the best information available. The input levels are not necessarily an indication of the risk or liquidity associated with financial instruments at that level. For example, non-U.S. equity securities actively traded in foreign markets generally are reflected in Level 2 despite the availability of closing prices because the fund evaluates and determines whether those closing prices reflect fair value at the close of the NYSE or require adjustment, as described above. The following table summarizes the fund’s financial instruments, based on the inputs used to determine their values on December 31, 2011:
NOTE 3 - OTHER INVESTMENT TRANSACTIONS
Consistent with its investment objective, the fund engages in the following practices to manage exposure to certain risks and/or to enhance performance. The investment objective, policies, program, and risk factors of the fund are described more fully in the fund’s prospectus and Statement of Additional Information.
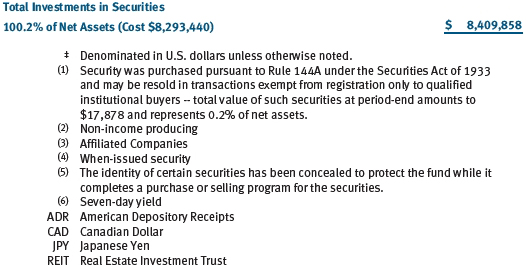
Restricted Securities The fund may invest in securities that are subject to legal or contractual restrictions on resale. Prompt sale of such securities at an acceptable price may be difficult and may involve substantial delays and additional costs.
Securities Lending The fund lends its securities to approved brokers to earn additional income. It receives as collateral cash and U.S. government securities valued at 102% to 105% of the value of the securities on loan. Cash collateral is invested by the fund’s lending agent(s) in accordance with investment guidelines approved by management. Although risk is mitigated by the collateral, the fund could experience a delay in recovering its securities and a possible loss of income or value if the borrower fails to return the securities or if collateral investments decline in value. Securities lending revenue recognized by the fund consists of earnings on invested collateral and borrowing fees, net of any rebates to the borrower and compensation to the lending agent. In accordance with GAAP, investments made with cash collateral are reflected in the accompanying financial statements, but collateral received in the form of securities are not. At December 31, 2011, there were no securities on loan.
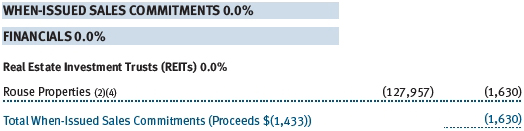
When-Issued Securities The fund may enter into when-issued purchases and/or sales commitments, pursuant to which it agrees to purchase or sell, respectively, the underlying security for a fixed unit price, with payment and delivery at a scheduled future date generally beyond the customary settlement period for such securities. When-issued refers to securities that have not yet been issued but will be issued in the future and may include new securities or securities obtained through a corporate action on a current holding. The fund normally purchases when-issued securities with the intention of taking possession but may enter into a separate agreement to sell the securities before the settlement date. Until settlement, the fund maintains cash reserves and liquid assets sufficient to settle its when-issued commitments. Amounts realized on when-issued transactions are included with realized gain/loss on securities in the accompanying financial statements.
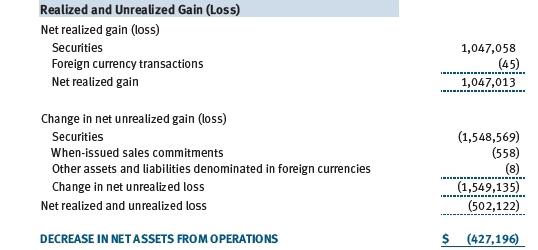
Other Purchases and sales of portfolio securities other than short-term securities aggregated $4,547,380,000 and $4,753,955,000, respectively, for the year ended December 31, 2011.
NOTE 4 - FEDERAL INCOME TAXES
No provision for federal income taxes is required since the fund intends to continue to qualify as a regulated investment company under Subchapter M of the Internal Revenue Code and distribute to shareholders all of its taxable income and gains. Distributions determined in accordance with federal income tax regulations may differ in amount or character from net investment income and realized gains for financial reporting purposes. Financial reporting records are adjusted for permanent book/tax differences to reflect tax character but are not adjusted for temporary differences.
The fund files U.S. federal, state, and local tax returns as required. The fund’s tax returns are subject to examination by the relevant tax authorities until expiration of the applicable statute of limitations, which is generally three years after the filing of the tax return but which can be extended to six years in certain circumstances. Tax returns for open years have incorporated no uncertain tax positions that require a provision for income taxes.
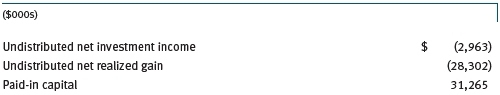
Reclassifications to paid-in capital relate primarily to a tax practice that treats a portion of the proceeds from each redemption of capital shares as a distribution of taxable net investment income and/or realized capital gain. For the year ended December 31, 2011, the following reclassifications were recorded to reflect tax character (there was no impact on results of operations or net assets):
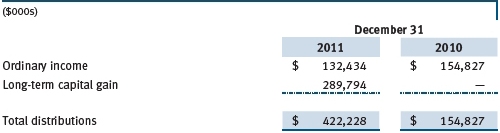
Distributions during the years ended December 31, 2011 and December 31, 2010, were characterized for tax purposes as follows:
At December 31, 2011, the tax-basis cost of investments and components of net assets were as follows:
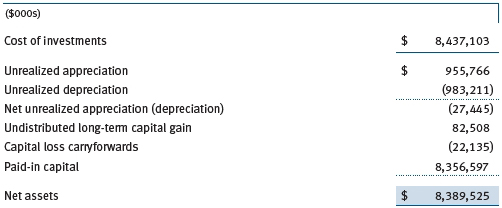
The difference between book-basis and tax-basis net unrealized appreciation (depreciation) is attributable to the deferral of losses from wash sales and the realization of gains/losses on passive foreign investment companies for tax purposes. Net realized capital losses may be carried forward indefinitely to offset future realized capital gains. All or a portion of the capital loss carryforwards may be from losses realized between November 1 and the fund’s fiscal year-end, which are deferred for tax purposes until the subsequent year but recognized for financial reporting purposes in the year realized. The fund intends to retain realized gains to the extent of available capital loss carryforwards. During the year ended December 31, 2011, the fund utilized $648,379,000 of capital loss carryforwards. The fund’s available capital loss carryforwards as of December 31, 2011, have no expiration.
NOTE 5 - RELATED PARTY TRANSACTIONS
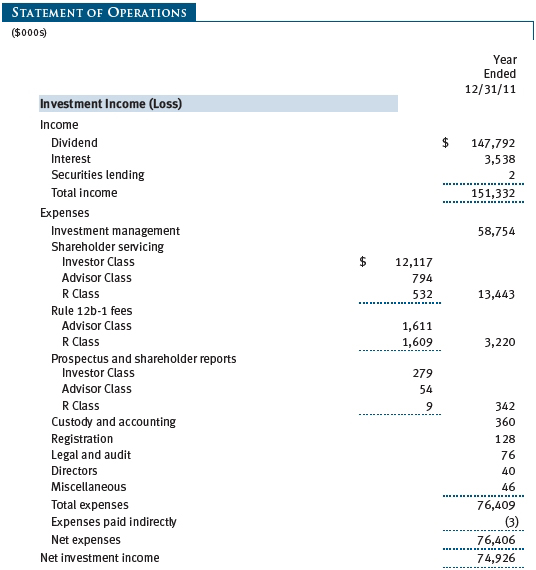
The fund is managed by T. Rowe Price Associates, Inc. (Price Associates), a wholly owned subsidiary of T. Rowe Price Group, Inc. (Price Group). The investment management agreement between the fund and Price Associates provides for an annual investment management fee, which is computed daily and paid monthly. The fee consists of an individual fund fee, equal to 0.35% of the fund’s average daily net assets, and a group fee. The group fee rate is calculated based on the combined net assets of certain mutual funds sponsored by Price Associates (the group) applied to a graduated fee schedule, with rates ranging from 0.48% for the first $1 billion of assets to 0.28% for assets in excess of $300 billion. The fund’s group fee is determined by applying the group fee rate to the fund’s average daily net assets. At December 31, 2011, the effective annual group fee rate was 0.30%.
In addition, the fund has entered into service agreements with Price Associates and two wholly owned subsidiaries of Price Associates (collectively, Price). Price Associates computes the daily share prices and provides certain other administrative services to the fund. T. Rowe Price Services, Inc., provides shareholder and administrative services in its capacity as the fund’s transfer and dividend disbursing agent. T. Rowe Price Retirement Plan Services, Inc., provides subaccounting and recordkeeping services for certain retirement accounts invested in the Investor Class and R Class. For the year ended December 31, 2011, expenses incurred pursuant to these service agreements were $124,000 for Price Associates; $1,925,000 for T. Rowe Price Services, Inc.; and $1,648,000 for T. Rowe Price Retirement Plan Services, Inc. The total amount payable at period-end pursuant to these service agreements is reflected as Due to Affiliates in the accompanying financial statements.
Additionally, the fund is one of several mutual funds in which certain college savings plans managed by Price Associates may invest. As approved by the fund’s Board of Directors, shareholder servicing costs associated with each college savings plan are borne by the fund in proportion to the average daily value of its shares owned by the college savings plan. For the year ended December 31, 2011, the fund was charged $436,000 for shareholder servicing costs related to the college savings plans, of which $325,000 was for services provided by Price. The amount payable at period-end pursuant to this agreement is reflected as Due to Affiliates in the accompanying financial statements. At December 31, 2011, approximately 3% of the outstanding shares of the Investor Class were held by college savings plans.
The fund is also one of several mutual funds sponsored by Price Associates (underlying Price funds) in which the T. Rowe Price Spectrum Funds (Spectrum Funds) and T. Rowe Price Retirement Funds (Retirement Funds) may invest. Neither the Spectrum Funds nor the Retirement Funds invest in the underlying Price funds for the purpose of exercising management or control. Pursuant to separate special servicing agreements, expenses associated with the operation of the Spectrum and Retirement Funds are borne by each underlying Price fund to the extent of estimated savings to it and in proportion to the average daily value of its shares owned by the Spectrum and Retirement Funds, respectively. Expenses allocated under these agreements are reflected as shareholder servicing expenses in the accompanying financial statements. For the year ended December 31, 2011, the fund was allocated $156,000 of Spectrum Funds’ expenses and $3,820,000 of Retirement Funds’ expenses. Of these amounts, $2,282,000 related to services provided by Price. The amount payable at period-end pursuant to this agreement is reflected as Due to Affiliates in the accompanying financial statements. At December 31, 2011, approximately 1% of the outstanding shares of the Investor Class were held by the Spectrum Funds and 24% were held by the Retirement Funds.
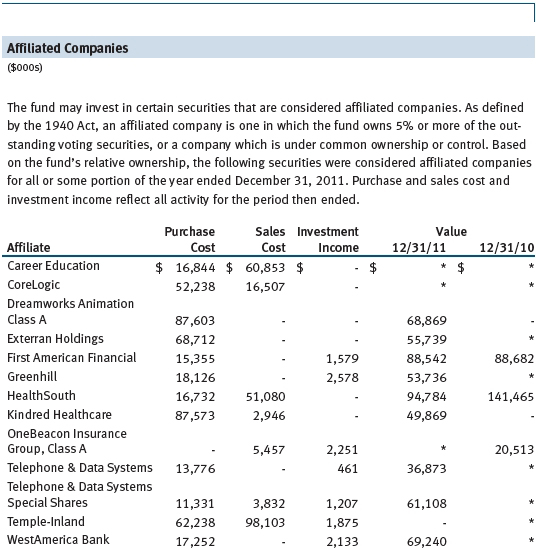
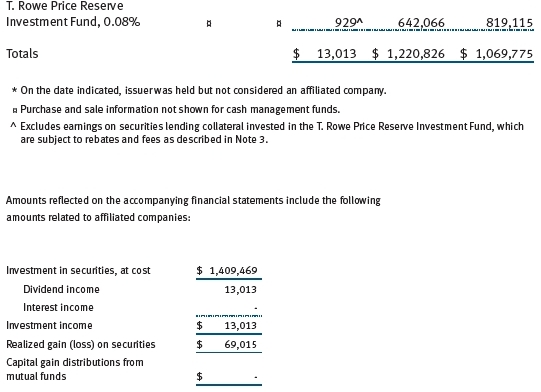
The fund may invest in the T. Rowe Price Reserve Investment Fund and the T. Rowe Price Government Reserve Investment Fund (collectively, the T. Rowe Price Reserve Investment Funds), open-end management investment companies managed by Price Associates and considered affiliates of the fund. The T. Rowe Price Reserve Investment Funds are offered as cash management options to mutual funds, trusts, and other accounts managed by Price Associates and/or its affiliates and are not available for direct purchase by members of the public. The T. Rowe Price Reserve Investment Funds pay no investment management fees.
NOTE 6 - LITIGATION
The fund expects to be included as a named defendant or in a class of defendants in a lawsuit that the Unsecured Creditors Committee (the Committee) of the Tribune Company has filed in Delaware bankruptcy court. The Committee is seeking to recover all payments made to beneficial owners of common stock in connection with a leveraged buyout of Tribune, including those made in connection with a 2007 tender offer in which the fund participated. The fund also is named as a defendant or included in a class of defendants in parallel litigation asserting state law constructive fraudulent transfer claims to recover stock redemption payments made to shareholders. The complaints allege no misconduct by the fund, and management intends to vigorously defend the lawsuits. The value of the proceeds received by the fund is $70,070,000 (0.84% of net assets) and the fund will incur legal expenses. Management is currently assessing the case and has not yet determined the effect, if any, on the fund’s net assets and results of operations.
| Report of Independent Registered Public Accounting Firm |
To the Board of Directors and Shareholders of
T. Rowe Price Mid-Cap Value Fund, Inc.
In our opinion, the accompanying statement of assets and liabilities, including the portfolio of investments, and the related statements of operations and of changes in net assets and the financial highlights present fairly, in all material respects, the financial position of T. Rowe Price Mid-Cap Value Fund, Inc. (the “Fund”) at December 31, 2011, and the results of its operations, the changes in its net assets and the financial highlights for each of the periods indicated therein, in conformity with accounting principles generally accepted in the United States of America. These financial statements and financial highlights (hereafter referred to as “financial statements”) are the responsibility of the Fund’s management; our responsibility is to express an opinion on these financial statements based on our audits. We conducted our audits of these financial statements in accordance with the standards of the Public Company Accounting Oversight Board (United States). Those standards require that we plan and perform the audit to obtain reasonable assurance about whether the financial statements are free of material misstatement. An audit includes examining, on a test basis, evidence supporting the amounts and disclosures in the financial statements, assessing the accounting principles used and significant estimates made by management, and evaluating the overall financial statement presentation. We believe that our audits, which included confirmation of securities at December 31, 2011 by correspondence with the custodian and brokers, and confirmation of the underlying funds by correspondence with the transfer agent, provide a reasonable basis for our opinion.
PricewaterhouseCoopers LLP
Baltimore, Maryland
February 17, 2012
| Tax Information (Unaudited) for the Tax Year Ended 12/31/11 |
We are providing this information as required by the Internal Revenue Code. The amounts shown may differ from those elsewhere in this report because of differences between tax and financial reporting requirements.
The fund’s distributions to shareholders included:
- $46,079,000 from short-term capital gains,
- $317,179,000 from long-term capital gains, subject to the 15% rate gains category.
For taxable non-corporate shareholders, $87,371,000 of the fund’s income represents qualified dividend income subject to the 15% rate category.
For corporate shareholders, $87,371,000 of the fund’s income qualifies for the dividends-received deduction.
| Information on Proxy Voting Policies, Procedures, and Records |
A description of the policies and procedures used by T. Rowe Price funds and portfolios to determine how to vote proxies relating to portfolio securities is available in each fund’s Statement of Additional Information, which you may request by calling 1-800-225-5132 or by accessing the SEC’s website, sec.gov. The description of our proxy voting policies and procedures is also available on our website, troweprice.com. To access it, click on the words “Our Company” at the top of our corporate homepage. Then, when the next page appears, click on the words “Proxy Voting Policies” on the left side of the page.
Each fund’s most recent annual proxy voting record is available on our website and through the SEC’s website. To access it through our website, follow the directions above, then click on the words “Proxy Voting Records” on the right side of the Proxy Voting Policies page.
| How to Obtain Quarterly Portfolio Holdings |
The fund files a complete schedule of portfolio holdings with the Securities and Exchange Commission for the first and third quarters of each fiscal year on Form N-Q. The fund’s Form N-Q is available electronically on the SEC’s website (sec.gov); hard copies may be reviewed and copied at the SEC’s Public Reference Room, 450 Fifth St. N.W., Washington, DC 20549. For more information on the Public Reference Room, call 1-800-SEC-0330.
| About the Fund’s Directors and Officers |
Your fund is overseen by a Board of Directors (Board) that meets regularly to review a wide variety of matters affecting the fund, including performance, investment programs, compliance matters, advisory fees and expenses, service providers, and other business affairs. The Board elects the fund’s officers, who are listed in the final table. At least 75% of the Board’s members are independent of T. Rowe Price Associates, Inc. (T. Rowe Price), and its affiliates; “inside” or “interested” directors are employees or officers of T. Rowe Price. The business address of each director and officer is 100 East Pratt Street, Baltimore, Maryland 21202. The Statement of Additional Information includes additional information about the fund directors and is available without charge by calling a T. Rowe Price representative at 1-800-638-5660.
Independent Directors | | |
| | | |
| Name | | |
| (Year of Birth) | | Principal Occupation(s) and Directorships of Public Companies and |
| Year Elected* | | Other Investment Companies During the Past Five Years |
| | |
| William R. Brody, M.D., Ph.D. | | President and Trustee, Salk Institute for Biological Studies (2009 |
| (1944) | | to present); Director, Novartis, Inc. (2009 to present); Director, IBM |
| 2009 | | (2007 to present); President and Trustee, Johns Hopkins University |
| | (1996 to 2009); Chairman of Executive Committee and Trustee, |
| | Johns Hopkins Health System (1996 to 2009) |
| | |
| Jeremiah E. Casey | | Retired |
| (1940) | | |
| 2005 | | |
| | |
| Anthony W. Deering | | Chairman, Exeter Capital, LLC, a private investment firm (2004 |
| (1945) | | to present); Director, Under Armour (2008 to present); Director, |
| 2001 | | Vornado Real Estate Investment Trust (2004 to present); Director, |
| | Mercantile Bankshares (2002 to 2007); Director and Member of the |
| | Advisory Board, Deutsche Bank North America (2004 to present) |
| | |
| Donald W. Dick, Jr. | | Principal, EuroCapital Partners, LLC, an acquisition and management |
| (1943) | | advisory firm (1995 to present) |
| 1996 | | |
| | |
| Karen N. Horn | | Senior Managing Director, Brock Capital Group, an advisory and |
| (1943) | | investment banking firm (2004 to present); Director, Eli Lilly and |
| 2003 | | Company (1987 to present); Director, Simon Property Group (2004 |
| | to present); Director, Norfolk Southern (2008 to present); Director, |
| | Fannie Mae (2006 to 2008) |
| | | |
| Theo C. Rodgers | | President, A&R Development Corporation (1977 to present) |
| (1941) | | |
| 2005 | | |
| | |
| John G. Schreiber | | Owner/President, Centaur Capital Partners, Inc., a real estate |
| (1946) | | investment company (1991 to present); Cofounder and Partner, |
| 2001 | | Blackstone Real Estate Advisors, L.P. (1992 to present); Director, |
| | General Growth Properties, Inc. (2010 to present) |
| | |
| Mark R. Tercek | | President and Chief Executive Officer, The Nature Conservancy (2008 |
| (1957) | | to present); Managing Director, The Goldman Sachs Group, Inc. |
| 2009 | | (1984 to 2008) |
| | |
*Each independent director oversees 130 T. Rowe Price portfolios and serves until retirement, resignation, or election of a successor. |
Inside Directors | | |
| | | |
| Name | | |
| (Year of Birth) | | |
| Year Elected* | | |
| [Number of T. Rowe Price | | Principal Occupation(s) and Directorships of Public Companies and |
| Portfolios Overseen] | | Other Investment Companies During the Past Five Years |
| | |
| Edward C. Bernard | | Director and Vice President, T. Rowe Price; Vice Chairman of the |
| (1956) | | Board, Director, and Vice President, T. Rowe Price Group, Inc.; |
| 2006 | | Chairman of the Board, Director, and President, T. Rowe Price |
| [130] | | Investment Services, Inc.; Chairman of the Board and Director, |
| | T. Rowe Price Retirement Plan Services, Inc., T. Rowe Price Savings |
| | Bank, and T. Rowe Price Services, Inc.; Chairman of the Board, Chief |
| | Executive Officer, and Director, T. Rowe Price International; Chief |
| | Executive Officer, Chairman of the Board, Director, and President, |
| | T. Rowe Price Trust Company; Chairman of the Board, all funds |
| | |
| Brian C. Rogers, CFA, CIC | | Chief Investment Officer, Director, and Vice President, T. Rowe Price; |
| (1955) | | Chairman of the Board, Chief Investment Officer, Director, and Vice |
| 2006 | | President, T. Rowe Price Group, Inc.; Vice President, T. Rowe Price |
| [74] | | Trust Company |
| | |
*Each inside director serves until retirement, resignation, or election of a successor. |
Officers | | |
| | | |
| Name (Year of Birth) | | |
| Position Held With Mid-Cap Value Fund | | Principal Occupation(s) |
| | | |
| Peter J. Bates, CFA (1974) | | Vice President, T. Rowe Price and T. Rowe Price |
| Vice President | | Group, Inc. |
| | | |
| Christopher W. Carlson (1967) | | Vice President, T. Rowe Price and T. Rowe Price |
| Vice President | | Group, Inc. |
| | | |
| Jonathan Chou (1980) | | Vice President, T. Rowe Price and T. Rowe Price |
| Vice President | | Group, Inc.; formerly student, Darden Graduate |
| | School of Business Administration, University |
| | of Virginia (to 2008); Principal, Gladstone |
| | Management Corporation (to 2006) |
| | | |
| Andrew S. Davis (1978) | | Employee, T. Rowe Price; Intern, Franklin |
| Vice President | | Templeton Investments (to 2009); Manager, |
| | Deloitte Financial Advisory Services (to 2008) |
| | | |
| Henry M. Ellenbogen (1973) | | Vice President, T. Rowe Price, T. Rowe Price |
| Vice President | | Group, Inc., and T. Rowe Price Trust Company |
| | | |
| Roger L. Fiery III, CPA (1959) | | Vice President, Price Hong Kong, Price |
| Vice President | | Singapore, T. Rowe Price, T. Rowe Price Group, |
| | Inc., T. Rowe Price International, and T. Rowe |
| | Price Trust Company |
| | | |
| Mark S. Finn, CFA, CPA (1963) | | Vice President, T. Rowe Price and T. Rowe Price |
| Vice President | | Group, Inc. |
| | | |
| John R. Gilner (1961) | | Chief Compliance Officer and Vice President, |
| Chief Compliance Officer | | T. Rowe Price; Vice President, T. Rowe Price |
| | Group, Inc., and T. Rowe Price Investment |
| | Services, Inc. |
| | | |
| Gregory S. Golczewski (1966) | | Vice President, T. Rowe Price and T. Rowe Price |
| Vice President | | Trust Company |
| | | |
| Gregory K. Hinkle, CPA (1958) | | Vice President, T. Rowe Price, T. Rowe Price |
| Treasurer | | Group, Inc., and T. Rowe Price Trust Company; |
| | formerly Partner, PricewaterhouseCoopers LLP |
| | (to 2007) |
| | | |
| Patricia B. Lippert (1953) | | Assistant Vice President, T. Rowe Price and |
| Secretary | | T. Rowe Price Investment Services, Inc. |
| | | |
| Gregory A. McCrickard, CFA (1958) | | Vice President, T. Rowe Price, T. Rowe Price |
| Vice President | | Group, Inc., and T. Rowe Price Trust Company |
| | | |
| Ian C. McDonald (1971) | | Vice President, T. Rowe Price and T. Rowe Price |
| Vice President | | Group, Inc.; formerly Insurance Correspondent, |
| | The Wall Street Journal (to 2007) |
| | | |
| Joseph M. Milano, CFA (1972) | | Vice President, T. Rowe Price and T. Rowe Price |
| Vice President | | Group, Inc. |
| | | |
| David Oestreicher (1967) | | Director and Vice President, T. Rowe Price |
| Vice President | | Investment Services, Inc., T. Rowe Price |
| | Retirement Plan Services, Inc., T. Rowe Price |
| | Services, Inc., and T. Rowe Price Trust |
| | Company; Vice President, Price Hong Kong, |
| | Price Singapore, T. Rowe Price, T. Rowe Price |
| | Group, Inc., and T. Rowe Price International |
| | | |
| Deborah D. Seidel (1962) | | Vice President, T. Rowe Price, T. Rowe Price |
| Vice President | | Group, Inc., and T. Rowe Price Investment |
| | Services, Inc.; Assistant Treasurer and Vice |
| | President, T. Rowe Price Services, Inc. |
| | | |
| J. David Wagner, CFA (1974) | | Vice President, T. Rowe Price and T. Rowe Price |
| Vice President | | Group, Inc. |
| | | |
| David J. Wallack (1960) | | Vice President, T. Rowe Price, T. Rowe Price |
| President | | Group, Inc., and T. Rowe Price Trust Company |
| | | |
| Julie L. Waples (1970) | | Vice President, T. Rowe Price |
| Vice President | | |
| | | |
| John M. Williams (1982) | | Employee, T. Rowe Price; formerly Summer |
| Vice President | | Analyst, The Capital Group Companies, Inc. |
| | (to 2009) |
| | |
Unless otherwise noted, officers have been employees of T. Rowe Price or T. Rowe Price International for at least 5 years. |
Item 2. Code of Ethics.
The registrant has adopted a code of ethics, as defined in Item 2 of Form N-CSR, applicable to its principal executive officer, principal financial officer, principal accounting officer or controller, or persons performing similar functions. A copy of this code of ethics is filed as an exhibit to this Form N-CSR. No substantive amendments were approved or waivers were granted to this code of ethics during the period covered by this report.
Item 3. Audit Committee Financial Expert.
The registrant’s Board of Directors/Trustees has determined that Mr. Anthony W. Deering qualifies as an audit committee financial expert, as defined in Item 3 of Form N-CSR. Mr. Deering is considered independent for purposes of Item 3 of Form N-CSR.
Item 4. Principal Accountant Fees and Services.
(a) – (d) Aggregate fees billed to the registrant for the last two fiscal years for professional services rendered by the registrant’s principal accountant were as follows:

Audit fees include amounts related to the audit of the registrant’s annual financial statements and services normally provided by the accountant in connection with statutory and regulatory filings. Audit-related fees include amounts reasonably related to the performance of the audit of the registrant’s financial statements and specifically include the issuance of a report on internal controls and, if applicable, agreed-upon procedures related to fund acquisitions. Tax fees include amounts related to services for tax compliance, tax planning, and tax advice. The nature of these services specifically includes the review of distribution calculations and the preparation of Federal, state, and excise tax returns. All other fees include the registrant’s pro-rata share of amounts for agreed-upon procedures in conjunction with service contract approvals by the registrant’s Board of Directors/Trustees.
(e)(1) The registrant’s audit committee has adopted a policy whereby audit and non-audit services performed by the registrant’s principal accountant for the registrant, its investment adviser, and any entity controlling, controlled by, or under common control with the investment adviser that provides ongoing services to the registrant require pre-approval in advance at regularly scheduled audit committee meetings. If such a service is required between regularly scheduled audit committee meetings, pre-approval may be authorized by one audit committee member with ratification at the next scheduled audit committee meeting. Waiver of pre-approval for audit or non-audit services requiring fees of a de minimis amount is not permitted.
(2) No services included in (b) – (d) above were approved pursuant to paragraph (c)(7)(i)(C) of Rule 2-01 of Regulation S-X.
(f) Less than 50 percent of the hours expended on the principal accountant’s engagement to audit the registrant’s financial statements for the most recent fiscal year were attributed to work performed by persons other than the principal accountant’s full-time, permanent employees.
(g) The aggregate fees billed for the most recent fiscal year and the preceding fiscal year by the registrant’s principal accountant for non-audit services rendered to the registrant, its investment adviser, and any entity controlling, controlled by, or under common control with the investment adviser that provides ongoing services to the registrant were $1,764,000 and $1,417,000, respectively.
(h) All non-audit services rendered in (g) above were pre-approved by the registrant’s audit committee. Accordingly, these services were considered by the registrant’s audit committee in maintaining the principal accountant’s independence.
Item 5. Audit Committee of Listed Registrants.
Not applicable.
Item 6. Investments.
(a) Not applicable. The complete schedule of investments is included in Item 1 of this Form N-CSR.
(b) Not applicable.
Item 7. Disclosure of Proxy Voting Policies and Procedures for Closed-End Management Investment Companies.
Not applicable.
Item 8. Portfolio Managers of Closed-End Management Investment Companies.
Not applicable.
Item 9. Purchases of Equity Securities by Closed-End Management Investment Company and Affiliated Purchasers.
Not applicable.
Item 10. Submission of Matters to a Vote of Security Holders.
Not applicable.
Item 11. Controls and Procedures.
(a) The registrant’s principal executive officer and principal financial officer have evaluated the registrant’s disclosure controls and procedures within 90 days of this filing and have concluded that the registrant’s disclosure controls and procedures were effective, as of that date, in ensuring that information required to be disclosed by the registrant in this Form N-CSR was recorded, processed, summarized, and reported timely.
(b) The registrant’s principal executive officer and principal financial officer are aware of no change in the registrant’s internal control over financial reporting that occurred during the registrant’s second fiscal quarter covered by this report that has materially affected, or is reasonably likely to materially affect, the registrant’s internal control over financial reporting.
Item 12. Exhibits.
(a)(1) The registrant’s code of ethics pursuant to Item 2 of Form N-CSR is attached.
(2) Separate certifications by the registrant's principal executive officer and principal financial officer, pursuant to Section 302 of the Sarbanes-Oxley Act of 2002 and required by Rule 30a-2(a) under the Investment Company Act of 1940, are attached.
(3) Written solicitation to repurchase securities issued by closed-end companies: not applicable.
(b) A certification by the registrant's principal executive officer and principal financial officer, pursuant to Section 906 of the Sarbanes-Oxley Act of 2002 and required by Rule 30a-2(b) under the Investment Company Act of 1940, is attached.
SIGNATURES
Pursuant to the requirements of the Securities Exchange Act of 1934 and the Investment Company Act of 1940, the registrant has duly caused this report to be signed on its behalf by the undersigned, thereunto duly authorized.
T. Rowe Price Mid-Cap Value Fund, Inc.
| | By | /s/ Edward C. Bernard |
| | Edward C. Bernard |
| | Principal Executive Officer |
| |
| Date February 17, 2012 | | |
Pursuant to the requirements of the Securities Exchange Act of 1934 and the Investment Company Act of 1940, this report has been signed below by the following persons on behalf of the registrant and in the capacities and on the dates indicated.
| | By | /s/ Edward C. Bernard |
| | Edward C. Bernard |
| | Principal Executive Officer |
| |
| Date February 17, 2012 | | |
| |
| |
| By | /s/ Gregory K. Hinkle |
| | Gregory K. Hinkle |
| | Principal Financial Officer |
| |
| Date February 17, 2012 | | |