 FBL Financial Group, Inc. Second Quarter 2008 Update
 Safe Harbor Statement under The Private Securities Litigation Reform Act of 1995 All forward looking information or statements in this presentation are based on management’s current knowledge of factors and are subject to a number of important risks and uncertainties that could cause actual results to differ materially. These risks and uncertainties include but are not limited to the risk factors outlined in the Company’s SEC filings. Non-GAAP Measures Comments during this presentation include certain non-GAAP financial measures. These items are reconciled to GAAP in our SEC filings and quarterly financial supplements, both of which may be found on our website. Safe Harbor Statement and Non-GAAP Measures
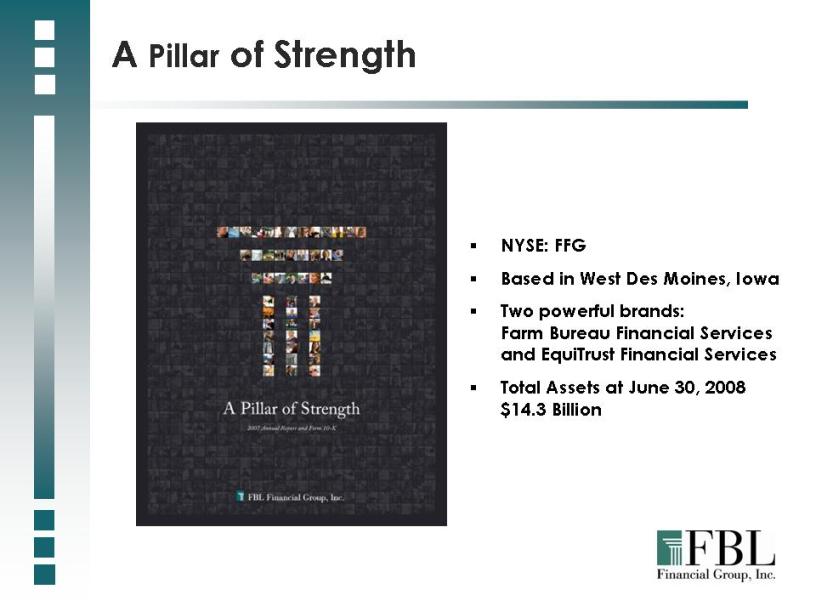 NYSE: FFG Based in West Des Moines, Iowa Two powerful brands: Farm Bureau Financial Services and EquiTrust Financial Services Total Assets at June 30, 2008 $14.3 Billion A Pillar of Strength
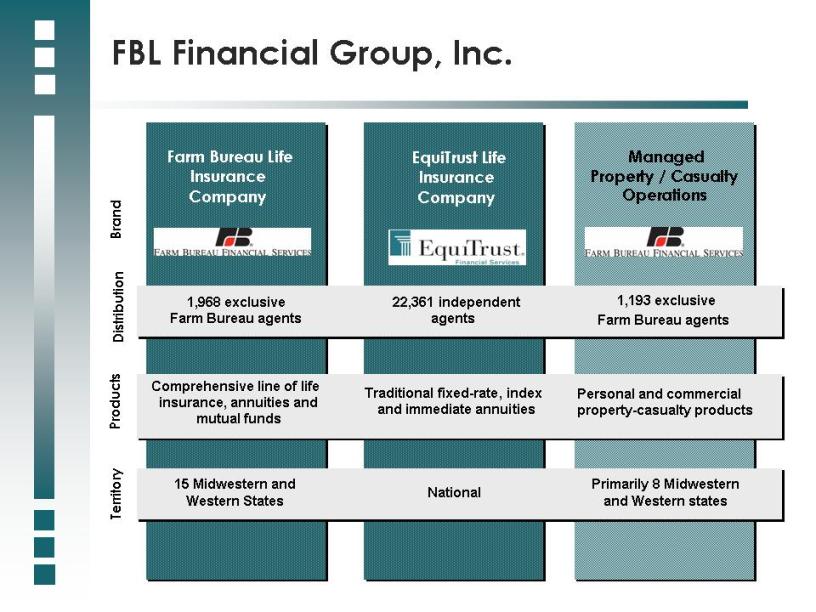 Farm Bureau Life Insurance Company EquiTrust Life Insurance Company Managed Property / Casualty Operations Distribution Brand Products Territory 1,968 exclusive Farm Bureau agents 22,361 independent agents 1,193 exclusive Farm Bureau agents Comprehensive line of life insurance, annuities and mutual funds Traditional fixed-rate, index and immediate annuities Personal and commercial property-casualty products 15 Midwestern and Western States National Primarily 8 Midwestern and Western states FBL Financial Group, Inc.
 FBL has Exclusive Farm Bureau Franchise in 15 States Largest farm and ranch organization 6.2 million member families in the U.S. Use of name and logo Enhanced prestige and brand awareness Stable customer base
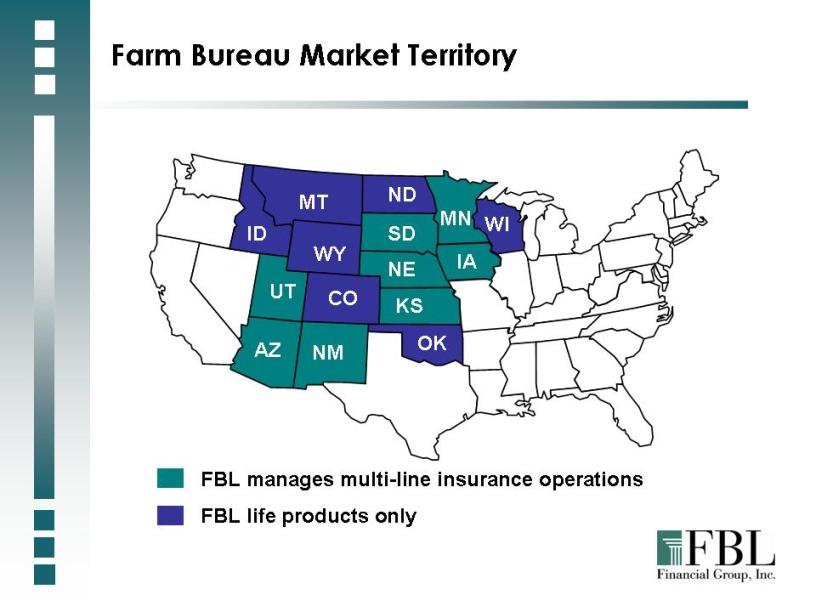 Farm Bureau Market Territory MT ID WY MN ND SD IA WI NE UT AZ CO NM KS OK FBL manages multi-line insurance operations FBL life products only
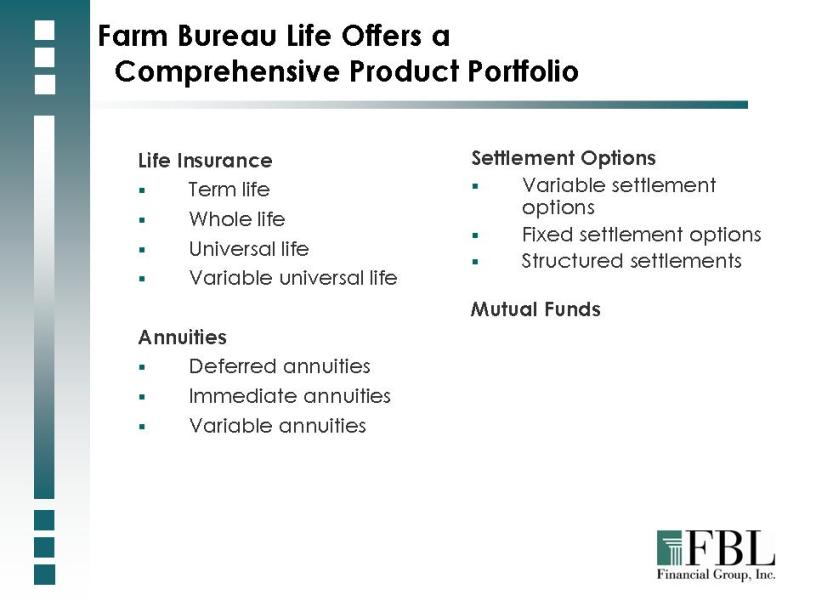 Farm Bureau Life Offers a Comprehensive Product Portfolio Life Insurance Term life Whole life Universal life Variable universal life Annuities Deferred annuities Immediate annuities Variable annuities Settlement Options Variable settlement options Fixed settlement options Structured settlements Mutual Funds
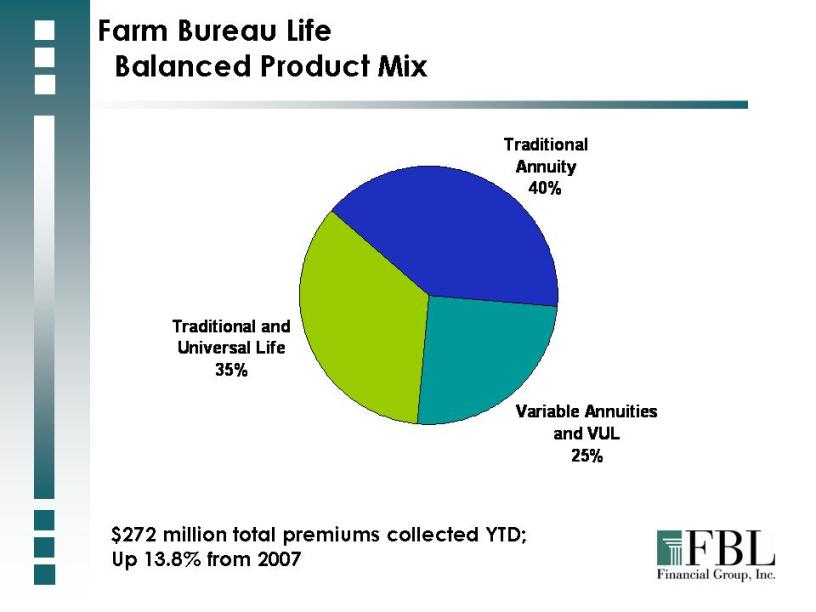 Farm Bureau Life Balanced Product Mix $272 million total premiums collected YTD; Up 13.8% from 2007 Traditional and Universal Life 35% Traditional Annuity 40% Variable Annuities and VUL 25%
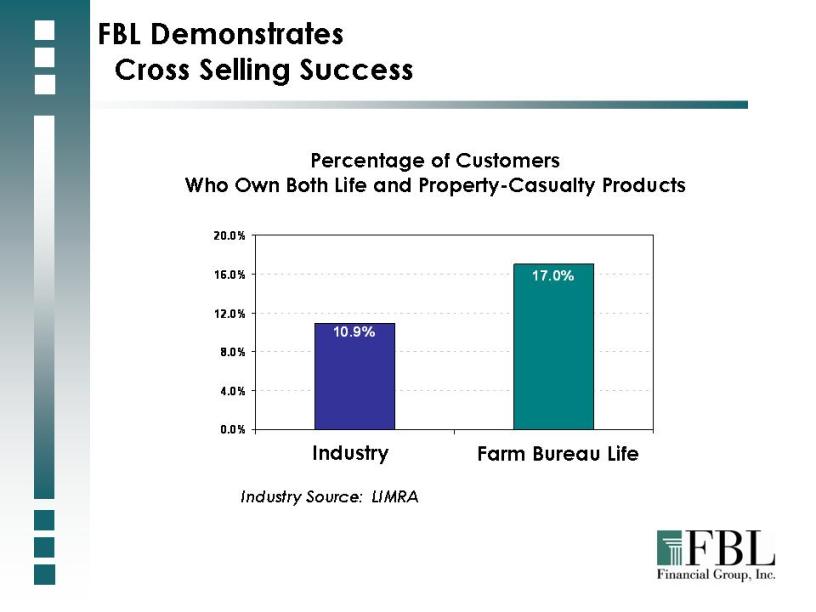 Industry 10.9% Percentage of Customers Who Own Both Life and Property-Casualty Products Industry Source: LIMRA Farm Bureau Life 17.0% FBL Demonstrates Cross Selling Success 0.0% 4.0% 8.0% 12.0% 16.0% 20.0%
 Farm Bureau Life Growth Opportunities and Initiatives Transforming sales model to more entrepreneurial, retail delivery strategy Growing opportunities with emerging ag wealth Focus on decreasing expenses and streamlining operations
 Ten Farm Bureau consolidations in the last 23 years Grown from a three-state to a 15-state Farm Bureau marketing territory Believe there should be further consolidation among Farm Bureau insurance companies Open to other consolidation opportunities FBL – A Leader in Consolidating Farm Bureau Operations
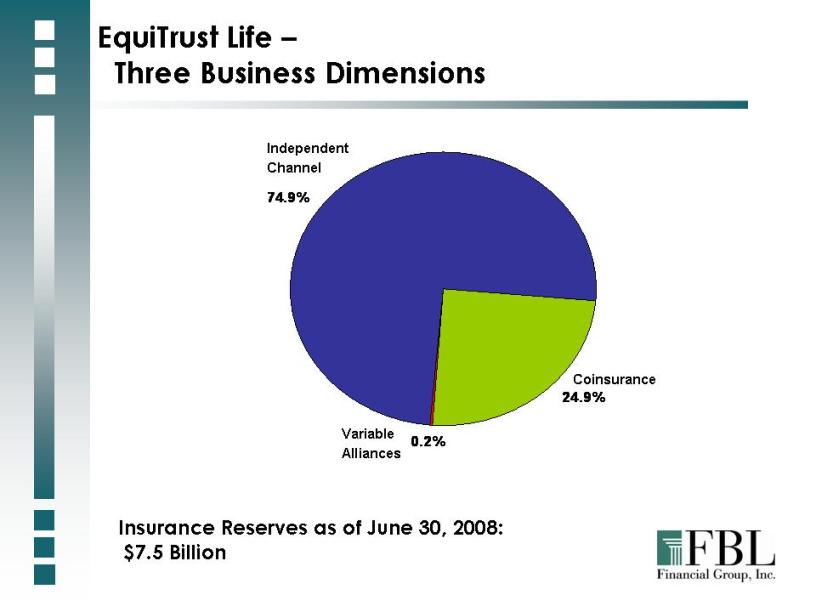 Independent Channel 74.9% Coinsurance 24.9% Variable Alliances 0.2% EquiTrust Life – Three Business Dimensions Insurance Reserves as of June 30, 2008: $7.5 Billion
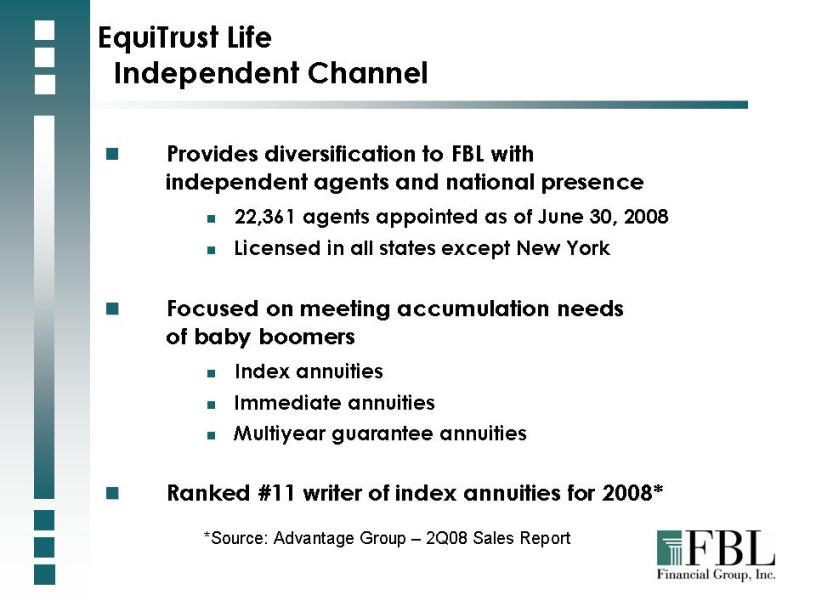 EquiTrust Life Independent Channel Provides diversification to FBL with independent agents and national presence 22,361 agents appointed as of June 30, 2008 Licensed in all states except New York Focused on meeting accumulation needs of baby boomers Index annuities Immediate annuities Multiyear guarantee annuities Ranked #11 writer of index annuities for 2008* *Source: Advantage Group – 2Q08 Sales Report
 Oppose rule due to lack of risk transfer State insurance department initiatives address SEC concerns Commitment to suitability and maintaining high ethical standards Confident in ability to transition to SEC regulated environment Plans in process Variable experience Active broker/dealer, EquiTrust Marketing Services Opposition to SEC Proposed Rule 151A
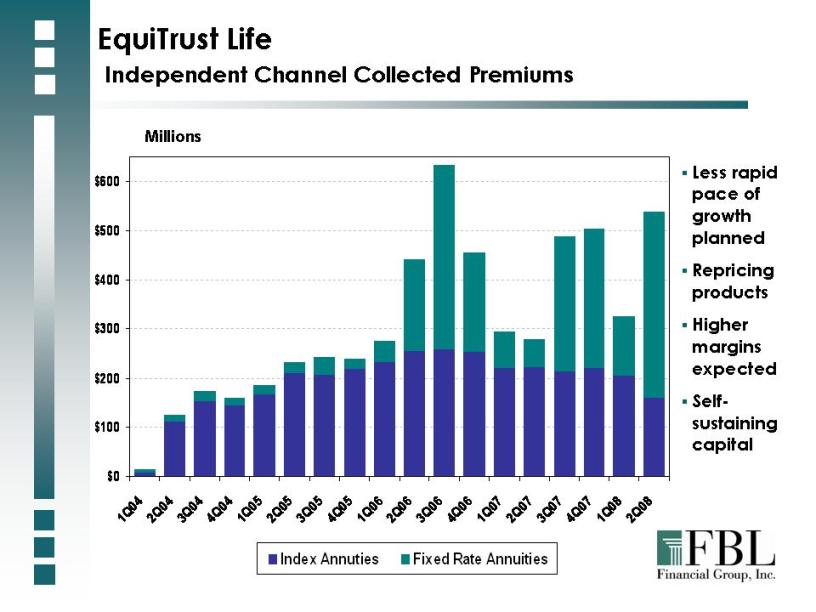 Millions EquiTrust Life Independent Channel Collected Premiums Less rapid pace of growth planned Repricing products Higher margins expected Self-sustaining capital Index Annuities Fixed Rate Annuities $600 $500 $400 $300 $200 $100 $0 1Q04 2Q04 3Q04 4Q04 1Q05 2Q05 3Q05 4Q05 1Q06 2Q06 3Q06 4Q06 1Q07 2Q07 3Q07 4Q07 1Q08 2Q08
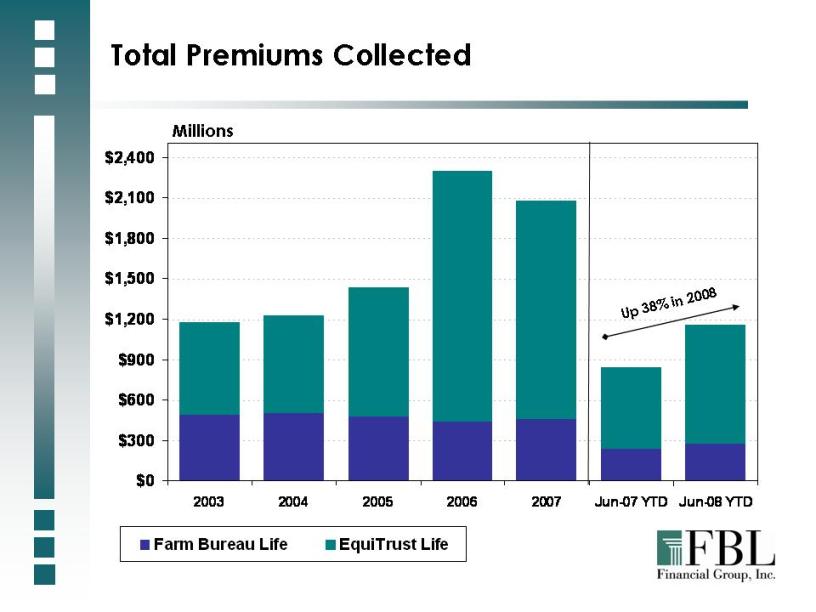 Total Premiums Collected Millions Up 38% in 2008 $2,400 $2,100 $1,800 $1,500 $1,200 $900 $600 $300 $0 2003 2004 2005 2006 2007 Jun-07 YTD Jun-08 YTD Farm Bureau Life EquiTrust Life
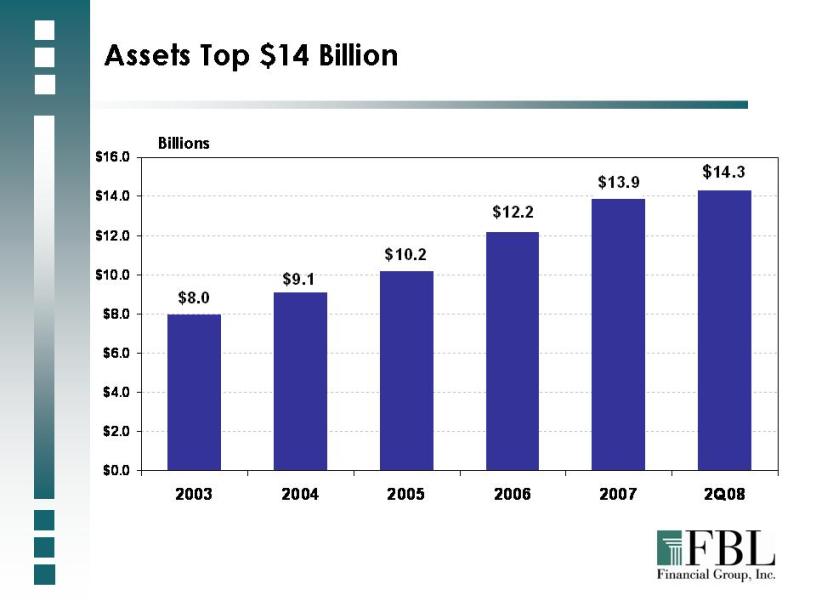 Billions Assets Top $14 Billion $16.0 $14.0 $12.0 $10.0 $8.0 $6.0 $4.0 $2.0 $0.0 2003 2004 2005 2006 2007 2Q08 $8.0 $9.1 $10.2 $12.2 $13.9 $14.3
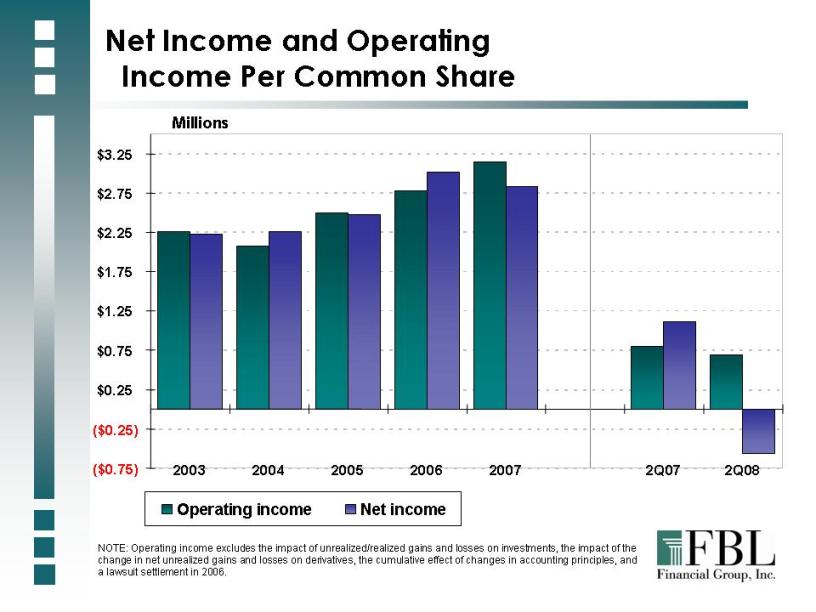 Millions NOTE: Operating income excludes the impact of unrealized/realized gains and losses on investments, the impact of the change in net unrealized gains and losses on derivatives, the cumulative effect of changes in accounting principles, and a lawsuit settlement in 2006. ($0.75) ($0.25) $0.25 $0.75 $1.25 $1.75 $2.25 $2.75 $3.25 2003 2004 2005 2006 2007 2Q07 2Q08 Operating income Net income Net Income and Operating Income Per Common Share
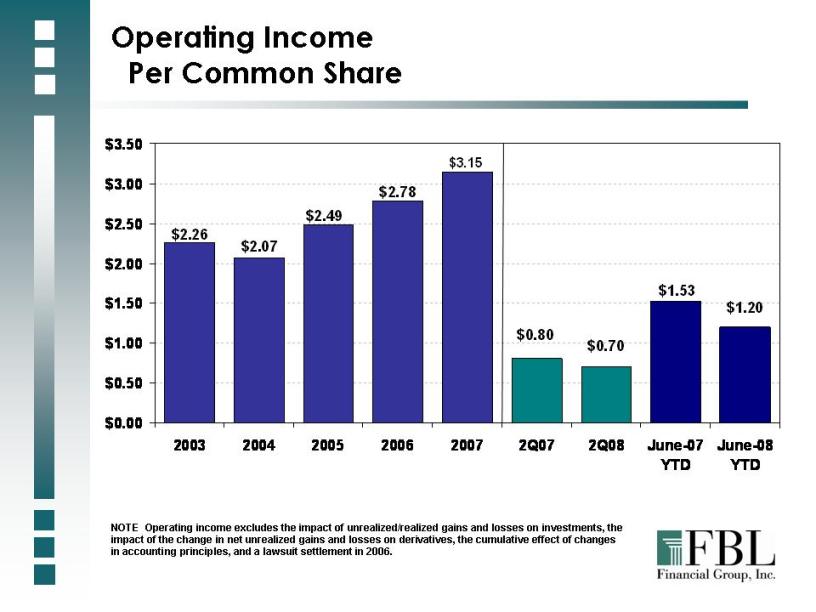 Operating Income Per Common Share NOTE: Operating income excludes the impact of unrealized/realized gains and losses on investments, the impact of the change in net unrealized gains and losses on derivatives, the cumulative effect of changes in accounting principles, and a lawsuit settlement in 2006. $3.50 $3.00 $2.50 $2.00 $1.50 $1.00 $0.50 $0.00 2003 2004 2005 2006 2007 2Q07 2Q08 June-07 YTD June-08 YTD $2.26 $2.07 $2.49 $2.78 $3.15 $0.80 $0.70 $1.53 $1.20

Pre-Tax Operating Earnings Six Months ended June 30, 2008 Millions Traditional Annuity Exclusive Traditional Annuity Independent Traditional & Universal Life Insurance Variable Corporate & Other $30 $20 $10 $0 ($10) $14.9 $16.7 $23.8 $2.8 -$4.6
 Commitment to Spread Management Focused on achieving target spreads Flexibility to adjust crediting rates Farm Bureau Life – portfolio crediting strategy EquiTrust Life – new money crediting strategy
 Comprehensive Enterprise Risk Management Plan in Place Detailed policies and procedures in place Best practices hedging program Static hedging program Hedge exposure at policy issue Documented risk management parameters Counterparty risks monitored High quality investment portfolio Focused on asset liability management
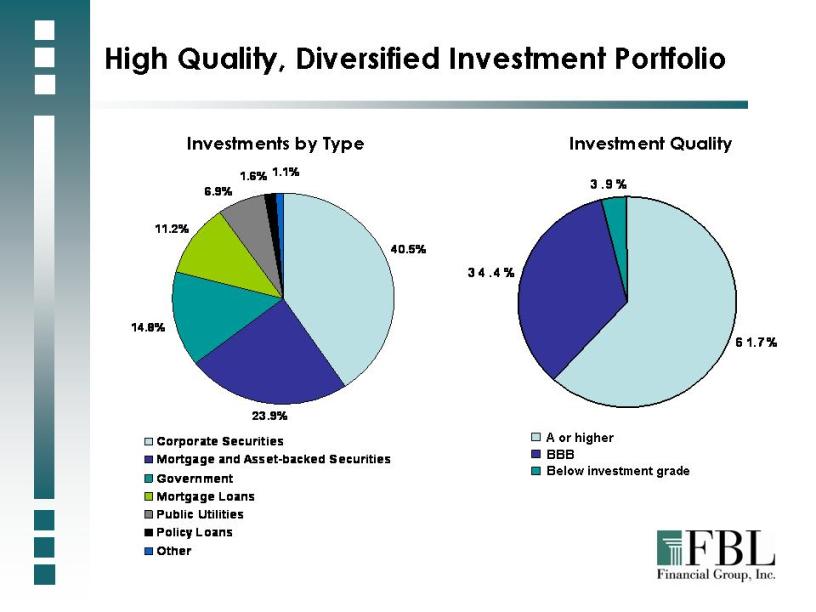 Investments by Type Investment Quality A or higher BBB Below investment grade High Quality, Diversified Investment Portfolio Corporate Securities Mortgage and Asset-backed Securities Government Mortgage Loans Public Utilities Policy Loans Other 34.4% 3.9% 61.7% 23.9% 40.5% 1.1% 1.6% 6.9% 11.2% 14.8%
 Other-Than-Temporary Impairments $635 million gross unrealized losses on investments at June 30, 2008 Diligent other-than-temporary impairment process External auditors and Audit Committee of Board involved Watch List includes all securities with a market price < 85% of book value Majority due to spread widening and level of interest rates Impairments of $107.4 million in 2008
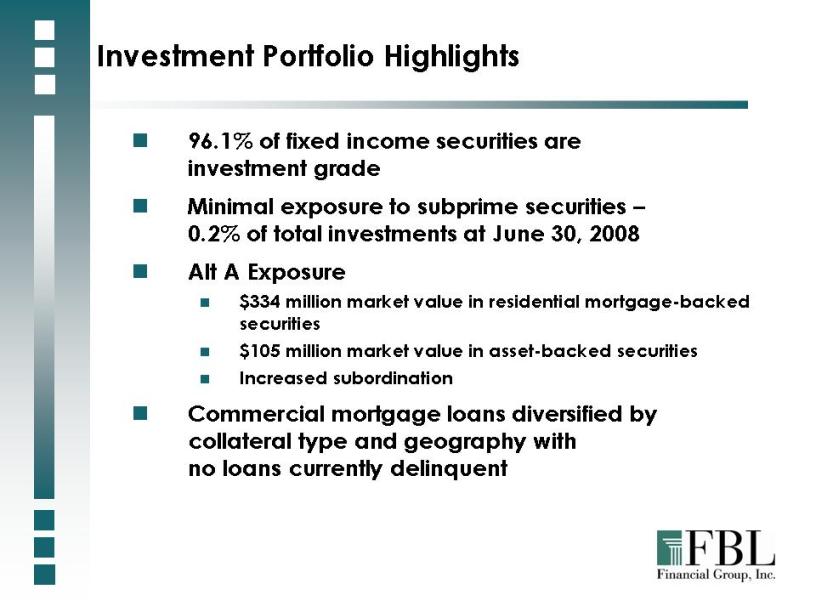 Investment Portfolio Highlights 96.1% of fixed income securities are investment grade Minimal exposure to subprime securities – 0.2% of total investments at June 30, 2008 Alt A Exposure $334 million market value in residential mortgage-backed securities $105 million market value in asset-backed securities Increased subordination Commercial mortgage loans diversified by collateral type and geography with no loans currently delinquent
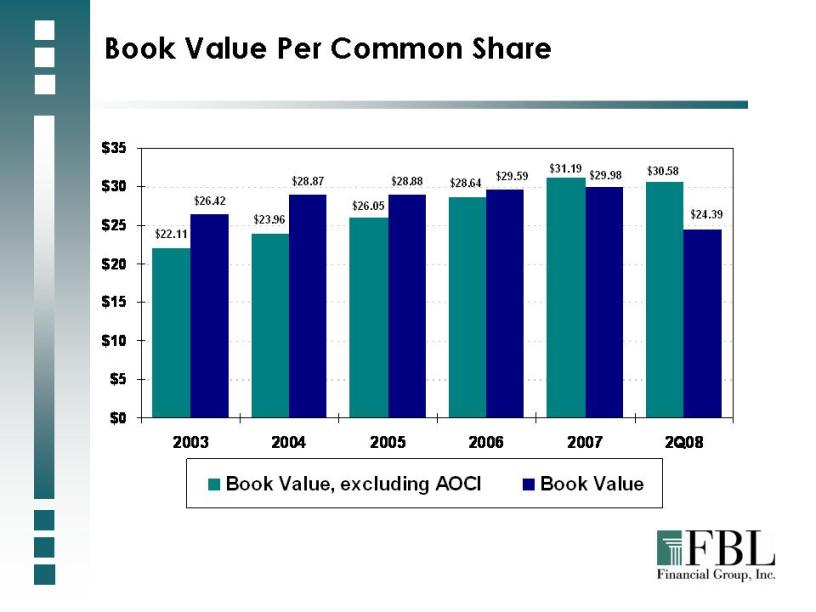 Book Value Per Common Share Book Value, excluding AOCI Book Value 2003 2004 2005 2006 2007 2Q08 $35 $30 $25 $20 $15 $10 $5 $0 $22.11 $26.42 $23.96 $28.87 $26.05 $28.88 $28.64 $29.59 $31.19 $29.98 $30.58 $24.39
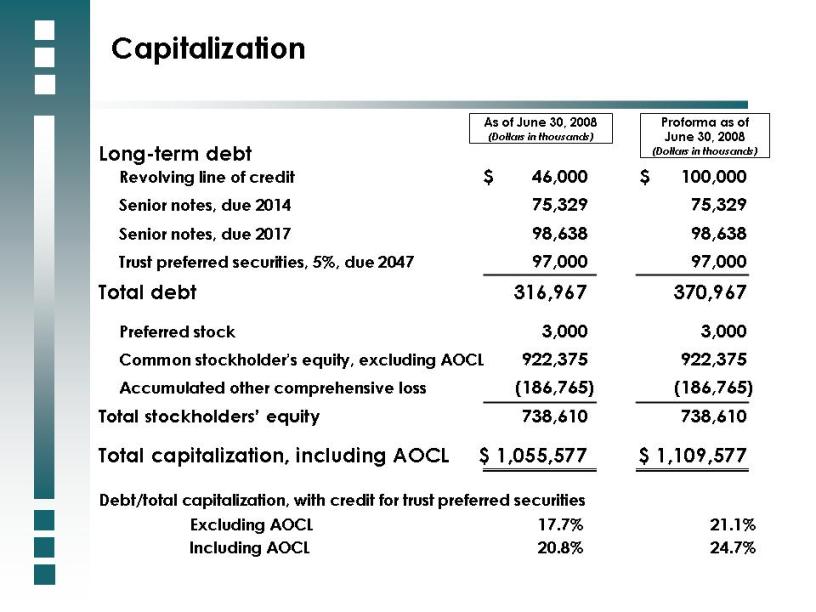 Capitalization Long-term debt Revolving line of credit $ 46,000 $ 100,000 Senior notes, due 2014 75,329 75,329 Senior notes, due 2017 98,638 98,638 Trust preferred securities, 5%, due 2047 97,000 97,000 Total debt 316,967 370,967 Preferred stock 3,000 3,000 Common stockholder’s equity, excluding AOCL 922,375 922,375 Accumulated other comprehensive loss (186,765) (186,765) Total stockholders’ equity 738,610 738,610 Total capitalization, including AOCL $ 1,055,577 $ 1,109,577 As of June 30, 2008 (Dollars in thousands) Proforma as of June 30, 2008 (Dollars in thousands) Debt/total capitalization, with credit for trust preferred securities Excluding AOCL 17.7% 21.1% Including AOCL 20.8% 24.7%
 FBL Financial Group is Well Positioned Commitment to compliance Strong corporate governance Proven growth strategies Solid balance sheet Experienced management team
 FBL Financial Group, Inc. www.fblfinancial.com